IFM-GEOMAR Report No. 50 - OceanRep
239
GEOMAR REPORT Berichte aus dem GEOMAR Helmholtz-Zentrum für Ozeanforschung Kiel Nr. 13 (N. Ser.) Dezember 2013 KIEL276 Time Series Data from Moored Current Meters Madeira Abyssal Plain 33°N, 22°W, 5285 m water depth March 1980 – April 2011 Background Information and Data Compilation Thomas J. Müller (1) and Joanna J. Waniek (2) (1) GEOMAR Helmholtz-Zentrum für Ozeanforschung Kiel, Kiel, Germany (2) Leibniz-Institut für Ostseeforschung, Rostock-Warnemünde, Germany
-
Upload
khangminh22 -
Category
Documents
-
view
2 -
download
0
Transcript of IFM-GEOMAR Report No. 50 - OceanRep

GEO
MA
R R
EPO
RT
Berichte aus dem GEOMARHelmholtz-Zentrum für Ozeanforschung Kiel
Nr. 13 (N. Ser.)Dezember 2013
KIEL276Time Series Data from Moored Current Meters
Madeira Abyssal Plain
33°N, 22°W, 5285 m water depth
March 1980 – April 2011
Background Information and Data Compilation
Thomas J. Müller(1) and Joanna J. Waniek(2)
(1) GEOMAR Helmholtz-Zentrum für Ozeanforschung Kiel, Kiel, Germany(2) Leibniz-Institut für Ostseeforschung, Rostock-Warnemünde, Germany


ISSN Nr.: 2193-8113
Nr. 13 (N. Ser.)Dezember 2013
Berichte aus dem GEOMARHelmholtz-Zentrum für Ozeanforschung Kiel
KIEL276Time Series Data from Moored Current Meters
Madeira Abyssal Plain
33°N, 22°W, 5285 m water depth
March 1980 – April 2011
Background Information and Data Compilation
Thomas J. Müller(1) and Joanna J. Waniek(2)
(1) GEOMAR Helmholtz-Zentrum für Ozeanforschung Kiel, Germany(2) Leibniz-Institut für Ostseeforschung, Rostock-Warnemünde, Germany

Herausgeber / Editor:Thomas J. Müller and Joanna J. Waniek
GEOMAR ReportISSN Nr.: 2193-8113, DOI 10.3289/GEOMAR_REP_NS_13_2013
Helmholtz-Zentrum für Ozeanforschung Kiel / Helmholtz Centre for Ocean Research KielGEOMAR Dienstgebäude Westufer / West Shore BuildingDüsternbrooker Weg 20D-24105 KielGermany
GEOMAR Dienstgebäude Ostufer / East Shore BuildingWischhofstr. 1-3D-24148 KielGermany
Tel.: +49 431 600-0Fax: +49 431 600-2805www.geomar.de
Das GEOMAR Helmholtz-Zentrum für Ozeanforschung Kiel ist Mitglied der Helmholtz-Gemeinschaft
Deutscher Forschungszentren e.V.
The GEOMAR Helmholtz Centre for Ocean Research Kielis a member of the Helmholtz Association of
German Research Centres
Helmholtz-Zentrum für Ozeanforschung Kiel / Helmholtz Centre for Ocean Research Kiel

KIEL276 time series data from moored current meters, Madeira Abyssal Plain, 1980 - 2011
Summary
This report is thought as a user’s guide containing back ground information of the 31 years
long physical data record from mooring site KIEL276 in the Madeira Abyssal Plain, nominal
location 33°N, 022°W at 5285 m water depth. It comprises meta and physical data for all 28
individual moorings deployed from 1980 to 2011, processing methods, and steps for the
physical data, namely current speed and direction, and temperature collected at significant
depths all over the water column. Spikes are removed, and data are checked for consistency
and quality. Some corrections were applied as compared to earlier versions, in particular to
instrument depths; however, these corrections do not affect scientific results published earlier
in the literature. Nevertheless, for the reason of future consistency we recommend to use the
present data and meta data set for further analysis.
By publishing this report, the data set at highest available data rate and the essential meta
data along with this report will be submitted to international data centres for open and public
access and use, in particular to the new World Data System’s (WDS) centre PANGAEA and
the Ocean Sites data centre (CORIOLIS). In addition, the data set along with further
associated meta data like, e.g., log sheets of mooring deployments has been electronically
archived at the GEOMAR Helmholtz Centre for Ocean Research Kiel, Kiel, Germany, where
it can be accessed through the institute’s data centre (see www.geomar.de; contact
Zusammenfassung
Mit diesem Bericht wird Hintergrundinformation zu den physikalischen Daten der 31 Jahre
langen Zeitreihe von 1980 bis 2011 auf der Verankerungsposition KIEL276 im Madeira
Becken auf nominell 33°N, 22°W bei 5285 m Wassertiefe, vorgelegt. Für jede der 28
einzelnen Verankerungen werden die Metadaten sowie Einzelheiten zur Aufbereitung und
Archivierung der gemessenen physikalischen Daten (Strömung, Temperatur, Druck,
Salzgehalt), gegeben, die durch verankerte Geräte an signifikanten Tiefen der gesamten
Wassersäule gewonnen wurden. Die gemessenen Daten wurden in physikalische Einheiten
überführt, Fehler beseitigt, und alle Daten auf Konsistenz und Qualität überprüft. Im
Vergleich zu früheren Versionen wurden einige Korrekturen angewendet, insbesondere
hinsichtlich der Einsatztiefen von Geräten. Jedoch haben diese Korrekturen keinen Einfluß
auf früher veröffentlichte wissenschaftliche Ergebnisse. Wir raten allerdings, aus Gründen
künftiger Konsistenz diese hier vorliegende Version bei weiteren Analysen zu benutzen.
Mit der Veröffentlichung dieses Berichts wird der Datensatz zusammen mit den wichtigsten
Metadaten an internationale Datenzentren gegeben zur freien öffentlichen Nutzung:
PANGAEA des neuen Welt Daten Systems (WDS) und CORIOLIS für ‚Ocean Sites’. Der
Datensatz sowie alle relevanten und zusätzlich vorhandenen Metadaten, wie z.B. Protokolle
von Verankerungsauslegungen, sind in elektronischer Form (PDF) am GEOMAR Helmholtz-
Zentrum für Ozeanforschung Kiel in Kiel archiviert und über das Datenzentrum des Instituts
zugänglich (s. www.geomar.de; Kontakt [email protected]).
3

KIEL276 time series data from moored current meters, Madeira Abyssal Plain, 1980 - 2011
Contents Page
Summary / Zusammenfassung
1. Introduction 5
1.1 Project summary 5
1.2 Data summary 7
2. KIEL276 moorings 12
2.1 Overview 12
2.2 Mooring design 14
2.3 Logs 15
2.4 Instrument depths 16
3 KIEL276 CTD data 26
4 KIEL276 moored instruments 30
4.1 Instrumentation, processing and archiving 30
4.2 Aanderaa current meters RCM4/5 and RCM7/8 30
4.3 Other Aanderaa instruments 38
4.4 Acoustic current meters 38
4.5 Particle traps 38
Acknowledgements 40
References 41
Glossary 44
Appendices
A01 KIEL276 mooring inventory
A02 KIEL276 data information
A03 KIEL276 mooring cruise reports
A04 KIEL276 RCM instrument depths
A05 KIEL276 RCM processing, archiving & data submission
A06 KIEL276 detailed meta data & data presentation
4

KIEL276 time series data from moored current meters, Madeira Abyssal Plain, 1980 - 2011
1. Introduction
1.1 Project summary
Background
A mooring site at 33°N, 022°W at 5285 m water depth in the Madeira abyssal plain – later
known as KIEL276 (Fig. 1.1) - was first occupied as part of the North East Atlantic Dynamic
Studies (NEADS, see Dickson et al., 1985) in 1977 for almost one year. The major goal of
NEADS was to measure and compare the ocean’s meso-scale activity in several regions of
the North East Atlantic far away from coasts and at key depth levels of the water column (see
Dickson et al., 1985). After some mooring losses in these early years of long-term moorings
at this and other sites, the site was re-occupied 2 1/2 years later in March 1980 and operated
as part and later as adjoined project of the German long-term research programme Warm-
water-sphere (SFB133) dealing with the thermocline circulation and associated processes in
the North Atlantic (see Krauß, 1996a, 1986b) funded by the German Research Foundation
(DFG). Away from direct surface influences, current meters were distributed over the water
column to cover the cores of the major water masses: North Atlantic Central Water between
nominal 200 m and 700 m; Mediterranean outflow water around 1000 m; upper North Atlantic
Deep Water around 1500 m; North Atlantic Deep Water around 3000 m; near bottom water
about 50 m above the bottom. Some early publications deal with the regional mean
circulation and its variability in the deep (> 2000 m) ocean and on scales up to two years
(Dickson et al., 1985), within the whole water column on scales up to ten years (Müller and
Siedler, 1992), with the variability in the Mediterranean water tongue (Zenk and Müller, 1988;
Siedler et al., 2005), and with the variability in the main thermocline on time scales up to
almost 30 years (Fründt et al., 2013).
After completion of the SFB133 programme, the mooring was maintained as part of the
German contribution to the then new international Joint Global Ocean Flux Study (JGOFS)
and funded by the German ministry for science, BMBF. Particle traps (Kremling et al., 1996)
were added from 1993 on, and thus the mooring became interdisciplinary. The main aim was
to measure and to understand vertical fluxes of biogenic material of oceanic origin and its
variability on annual and longer time scales (e.g. Waniek et al., 2005). However, not only
particles that origin from oceanic processes, but also lithogenic material was detected at
depths of 2000 m, and despite the large distance fro the African coast its origin was
determined within the Sahara desert (Chavanac et al., 2007; Brust and Waniek, 2010; Brust
et al., 2011).
The combined physical and bio-geo-chemical measurements at KIEL276 are now on-going
as part of the long-term measurements within the international and multidisciplinary Ocean
Sites programme. It presently is funded by the German Research Foundation (DFG) and
operated under the responsibility of the Leibniz-Institut für Ostseeforschung in Rostock-
Warnemünde, (IOW), Germany. Table 1.1 overviews past and present responsibilities.
5

KIEL276 time series data from moored current meters, Madeira Abyssal Plain, 1980 - 2011
Table 1.1: Overview on KIEL276 major time periods, principal
investigators, and responsible institute for mooring techniques
and data; for abbreviations see glossary.
Mooring ID Time period Responsible for
from / to from / to Science (PI) Mooring & Data
V264-01 1980
1980
T.J. Müller IfM
V276-01
V276-13
1980
1993
T.J. Müller IfM
V276-14
V276-20
1993
2000
J.J. Waniek &
T.J. Müller
IfM
V276-21
V276-24
2001
2005
J.J. Waniek &
T.J. Müller
IOW
V276-25
V276-27
2005
2011 & on-going
J.J. Waniek IOW
Goal of this report
After 31 years of sampling and analyzing data from KIEL276, we feel it worth to summarize
the available 31 year physical data set. This report therefore is designed as a user’s source
of information and guide to the measurement and processing of the physical data obtained
between 1980 and 2011 at site KIEL276, 33°N, 022°W, 5285 m water depth, and to the
processed data itself. In particular, we summarize the
key meta data for all moorings and hydrographic casts taken close to mooring sites
during mooring deployment and / or recovery cruises
physical data from moored current meters at highest data rate available
hydrographic data close to mooring locations during deployment / recovery cruises
interpolated to same vertical scales
Methods and processing of particle trap (Kremling et al., 1996) data are dealt with in the
scientific literature (e.g. Waniek et al., 2005; Brust et al., 2011).
As a result of consistency checks, some information as given in earlier papers, is slightly
improved. In particular, instrumental depths were reviewed taking into account that future
analysis may need best estimates of absolute temperature depth relations (see Sec. 2.4).
Improvements of instrument depths, however, do not affect earlier scientific results as all of
those were related to currents and to temperature variability, and these do not rely
significantly on vertical scale changes of less than 50 m.
6

KIEL276 time series data from moored current meters, Madeira Abyssal Plain, 1980 - 2011
1.2 Data summary
Overview
This section aims at providing the user a quick overview of
what kind of data do exist
where can data be accessed
which kind of original meta data like handwritten logs do exist in electronic form
(PDF), and where can they be accessed
which are the relevant reports, and where can they be accessed
Data Sets
The data set stems from
Moored current meter data, 1980 – 2011
CTD casts, one Nansen cast, and two XBT drops close to mooring site during
deployment / recovery cruises
Moored particle trap data, 1993 – 2011
In this report, the physical data from current meters and hydrographic casts at the mooring
site during mooring deployment / recovery cruises are described (Tab. 1.2). Particle trap data
were dealt with in a number of publications (e.g., Waniek et al., 2005; Brust et al., 2011) and
are available at the World Data System’s centre PANGAEA (www.pangaea.de )
Moored current meter data, Aanderaa RCM (1980 – 2011)
The following current meter sets are the basic input data (Fig 1.2; Tab. 1.2) for checking and
re-processing as described in section 4 of this report; delivery of result to data centres as
ASCII data files for each current meter:
V264-01, V276-01 through V276-09: for these moorings, raw data are lost; processed
data at sampling interval in MK4 ASCII format are available (MK4 level); data sets
checked and re-processed as described in section 4;
V276-13, V276-14: only processed low pass filtered (36 h half power period) daily
averages are available in MK4 ASCII format (MK4 level); data checked and re-
processed as described in section 4.
V276-10 to V276-12 and from V276-15 on: for these moorings raw data are available;
converted and processed as described section 4.
V276-20: mooring deployment failed; no data
Moored 50 m thermistor cable data (1980-1994)
The cables were 50 m long and equipped with 11 thermistors at equal distances. Cable and
recorder were attached to the mooring line within the main thermocline. Data recording often
completely failed, and in many other cases data quality is poor. After conversion of raw data
to physical units and de-spiking, these data are stored only at the GEOMAR data centre and
available there on request.
7

KIEL276 time series data from moored current meters, Madeira Abyssal Plain, 1980 - 2011
Fig. 1.1: Upper panel: North East Atlantic with the KIEL276 mooring site
location, 1980 – 2011, in the Madeira Abyssal Plain 240 nm west of
Madeira Island; nominal location is 33°N, 022°W (red star) at nominal
water depth 5285 m (corrected for depth averaged sound velocity); coast
lines (green) and 5000 m depth contour (purple) after GEBCO included);
Lower panel: detailed locations of 28 mooring (red) and CTD casts during
mooring cruises (blue).
8

KIEL276 time series data from moored current meters, Madeira Abyssal Plain, 1980 - 2011
Moored Acoustic Doppler Profiling Current meter (ADCP, 2001/2002)
On a single occasion (mooring V276-21, 2001-2002) an RDI 150 kHz upward looking ADCP
was moored in the top buoy at designed 163 m depth. Deployment file and raw data are
available the GEOMAR data centre.
Hydrographic casts (1980 – 2011)
CTD casts were taken whenever possible during deployment cruises close to deployment /
recovery of moorings. In some few early cases, no reliable CTD data is available or data are
lost; in one of these cases, a Nansen bottle cast and in two other cases XBT drops replace
the CTD data. All data are part of the K276 data set and as such delivered to data centres;
they are also part of complete hydrographic cruise data sets and as such also available at
data centres along with other casts from the cruise.
Particle trap data (1993 – 2011)
All data available will be delivered in 2014 to the World Data System’s centre PANGAEA
(www.pangaea.de ).
Fig. 1.2: KIEL276, overview of current meter data, 1980-2011; pressure (green), current vector (blue), temperature (red).
9

KIEL276 time series data from moored current meters, Madeira Abyssal Plain, 1980 - 2011
Table 1.2: Overview of K276 moored Aanderaa current meter (RCM4/5/7/8),Aanderaa thermistor
cable TR4/5/7/8), and trap data; all physical data are re-processed from highest available resolution
and lowest available pre-processing level, and then delivered to data centres (trap data in 2014).
KIEL276
Mooring ID Aanderaa RCM4/5/7/8 and TR4/5/7/8 data Particle
traps
Available input
for checking & processing
Dissemination to data centres
V264-01
V276-01 to
V276-09
processed at
sampling interval
checked,
sampling interval
n/a
V276-10 to
V276-12
raw processed,
sampling interval
n/a
V276-13 processed low-
pass filtered
daily averages
checked,
low-pass filtered
daily averages
n/a
V276-14 processed low-
pass filtered
daily averages
checked,
low-pass filtered
daily averages
yes,
separate
mooring L1
V276-15 to
V276-17
raw processed,
sampling interval
yes
V276-18 raw processed,
sampling interval
n/a
V276-19 raw processed,
sampling interval
yes
V276-20 Mooring deployment failure, no data
V276-21 to
V276-27
raw processed,
sampling interval
yes
Data access
After processing, consistency and quality check of physical data from moored current meters,
and on completion of this report, the physical data set along with hydrographic casts taken
close to the mooring site during mooring cruises, and along with this report will be submitted
to international data centres (Tab. 1.2).
10

KIEL276 time series data from moored current meters, Madeira Abyssal Plain, 1980 - 2011
The above processed physical data set along with additional meta information (Tab. 1.2,
Appendix A1, Appendix A2) from the moorings is also archived at
GEOMAR Physical Oceanography Research Unit: All meta data in digitized
form (PDF); all measured data, both, raw and processed; access through the
institute’s data centre ([email protected]). The set consists of:
o relevant data and cruise reports
o mooring design input and design sketches corrected for deployment &
recovery logs
o mooring sketch with nominal depths, re-drawn as from logs and static mooring
model
o instrumental start and stop logs
o bridge logs
o calibration information
o raw data as copied from tapes or data storage units (DSU)
o calibrated and processed data sets, at sampling rate if available
o this report
Table 1.2: KIEL276 data as submitted to international data centres after publishing this report; physical and trap data as from moored instruments; CTD casts close to the mooring site during mooring cruises; electronic versions (PDF) of deployment / recovery logs and of and RCM start / stop logs also at Geomar Physical Oceanography data bank.
World Data
System
PANGAEA
Ocean
Sites
GEOMAR
Physical Oceanography
data bank
This report Yes Yes Yes
Mooring cruise reports No No Yes
Mooring design information No No Yes
Aanderaa Recording Current
Meter (RCM) data
Yes Yes Yes
ADCP data
(solely V276-21, raw data)
No No Yes
Aanderaa 50 m Thermistor cable
data
No No Yes
Particle trap data Yes
(complete 2014)
No No
CTD Mooring site data Yes Yes Yes
Mooring deployment logs No No Yes
RCM start/stop logs No No Yes
Cruise reports (Appendix 3)
All cruise reports associated with KIEL276 mooring deployment and / or recovery are
available either on-line at the publishing institute or on request at the GEOMAR Physical
Oceanography data bank.
11

KIEL276 time series data from moored current meters, Madeira Abyssal Plain, 1980 - 2011
2 KIEL276 moorings
2.1 Overview
Mooring information (Appendix A01)
All basic information for individual moorings is summarized in Appendix A01; it contains
information from cruise logs on
Mooring codes
Position (decimal, positive to North and East); early deployments used transit
satellites with a single fix every 3 to 4 hours at that latitude (33°N); later GPS, once
the codes were free for non-military use
Water depth measured by single beam echo sounder (RVs METEOR II, POSEIDON)
or central beam of multi-beam systems (RVs METEOR III, MARIA S. MERIAN);
depths corrected for by vertically integrated sound velocity as determined from CTD
(Fig. 2.1)
Magnetic anomaly at the mooring position for deployment time as from sea charts
Date, ship and cruise of deployment / recovery
Existence and electronic (PDF) availability of bridge and deck logs during launching /
recovery
CTD cast files taken close to the mooring site during the mooring cruises
Data information from moored instruments (Appendix A02)
All sources for archived physical data from moored Aanderaa current meters RCM4/5 and
RCM7/8, are listed in Appendix A02; it contains information on
Existence and status of each mooring’s meta information in a text file
Existence of static mooring model results, in particular a final sketch with nominal
depths, taking into account information from deployment and recovery logs, and from
static mooring model; note, instrument nominal depths need further checks to get
instrument depth (Sec. 2.4)
Existence and electronic availability (PDF) of start & stop logs of instruments
Existence of raw data as mirrored from recording media (tape or data storage unit) to
processing computers
Status of processed data (see Sec. 4).
Also, Appendix A02 shows a column with the number of particle traps within each mooring.
Moored instruments & sensors (Appendix A05)
Current meters: Initially, the basic instrumentation consisted of Aanderaa RCM4/5 current
meters which nominally were placed in the upper thermocline at about 250 m and 500 m
depth, the Mediterranean water tongue around 1000 m, upper North Atlantic Deep water
(1500 m), North Atlantic Deep Water (3000 m) and 50 m above the bottom (from V276-01
on). From 1989 on, RCM4/5 were replaced by RCM7/8, completing this process in 1993.
These current meters measured a quasi-vector-average of current speed and direction.
12

KIEL276 time series data from moored current meters, Madeira Abyssal Plain, 1980 - 2011
Only in 2001/2002, V276-21, carried an upward looking ADCP which was implemented to the
upper buoyancy.
Temperature sensors were standard for all current meters. Until 1994, up to two Aanderaa
50 m thermistor cables (TR4/5 and TR7/8) were attached to the mooring line within the
thermocline.
Conductivity sensors were attached to some RCM within the Mediterranean Water level
during the initial phase adding information on salinity.
Pressure sensors on the top instruments were implemented whenever sensors were
available; they helped estimating actual instrument depths (see sec. 2.4) and vertical
mooring motion.
Particle traps were added from 1993 on; up to four particle traps were added with changing
number and depths depending on resources and scientific objectives being addressed.
Relevant cruise and data reports (Appendix A03)
All relevant reports from mooring cruises, both, internal und public is given in Appendix A03;
they can be accessed through the addresses listed in A03. Some of them also present first
results from recovered KIEL276 instrumentation.
Fig 2.1: KIEL276 corrections to sounding depths with 1500 m/s assumed average sound velocity
based on a POSEIDON cruise POS321 CTD cast.
13

KIEL276 time series data from moored current meters, Madeira Abyssal Plain, 1980 - 2011
2.2 Mooring design
Mooring components
Mooring components used in KIEL276 changed only slightly over the years. The major
buoyancy, wire and rope components are
Top buoyancy, pressure rated up to 300 dbar; at the end of this range, it starts
loosing buoyancy due to non-elastic compression.
Deep sea buoyancy made of two half spheres of glass balls, sheltered by plastic caps
(Benthos, later also Nautilus); this type of buoyancy is stable until rated pressure
(6000 dbar); may implode by shock.
Steel wire, 8 mm, coated, upper thermocline, withstands fish-biting.
Stainless low torsion steel wire, 8 mm, coated, upper thermocline, can be re-used;
withstands fish-biting.
Kevlar low torsion rope, 11 mm, coated, deeper parts of the thermocline, can be re-
used.
Nylon ropes, 11mm diameter, 2700 kp breaking load, jacket, low weight, also known
as METEOR rope, for depths larger than about 1500 m (low risk of fish-biting); about
10% stretching under forces given by KIEL276 mooring design, re-use not
recommended.
Shackles and rings are made of zinced steel with high (3200 kp) breaking load; thus they
function as an anode to protect other metal ends of connected components from corrosion
without becoming too weak themselves over a 2-year period.
For all components, their form, dimensions and weight in water is known and used to design
the mooring. The effect of stretching of steel wire and Kevlar rope is small (although not
zero) and neglected when compared to the much larger effect on nylon ropes, the latter
being about 10% of length under given forces of more than 300 kp (Zenk, 1981; Schröder,
1982).
Mooring design basics
Mooring design is static, although since 1982 the computer programme also allows to
estimate the effect of horizontal non-zero current profiles on depths, elongations and
horizontal displacements of mooring components. The design uses the Physical
Oceanography Research Unit’s computer programme Integrated Mooring Package (IMP)
which was developed over many years and in several steps, starting with the transfer of the
original Woods Hole Oceanographic Buoy Groups programme package for static single point
moorings (Moller, 1976) to metric units and to non-zero current profiles (Schröder, 1982).
Kiel mooring components were implemented, e.g. the above mentioned METEOR nylon rope
and its elongation under stretching forces (Engelmann, 1972; Zenk, 1981; Schröder, 1982).
Finke and Siedler (1986) estimated drag coefficients of some Kiel mooring components. The
programme package was transferred for the use with MATLAB® by Helmbrecht (2001). It
14

KIEL276 time series data from moored current meters, Madeira Abyssal Plain, 1980 - 2011
also allows for simulating a mooring’s motions under the time series of measured currents
(Helmbrecht, 2002).
In the 1980’s and 1990’s, the FORTRAN® model results (Schröder, 1982) were transferred to
mooring sketches manually. With the invention of the MATLAB® based version (Helmbrecht,
2001), the mooring sketch is created by the computer programme.
2.3 Logs
Formatted logs with handwritten notes were kept while preparing and switching the RCM on
and off, and during mooring deployment and recovery. These logs are digitized (PDF copies)
and are available as noted in Appendices A01 and A02 in at the GEOMAR data base.
RCM
These logs contain information on
Type of instrument
Sensors attached and their settings, e.g. temperature and pressure range chosen
Battery type and voltage (under 100 Ω resistance) before deployment and after
recovery
Recording interval set
Date and (external) time (UTC) of switching on, begin of first and last record taken;
this information is used to correct for clock drifts, usually of the order of some minutes
over a year
Times of deployment (into water) and recovery (on deck)
Mooring launch & recovery
A bridge log was kept by the watch officer, and a detailed mooring log on deck on the
mooring design sketch. Any design changes were noted and together with the actual
corrected water depth transferred to the input for the mooring design programme to result in
the final design sketch showing ‘nominal depths as from logs and static mooring programme’.
15

KIEL276 time series data from moored current meters, Madeira Abyssal Plain, 1980 - 2011
2.4 Instrument depths
Terminology
Instrument depths are estimated in several steps. When using pressure records, these are
converted to depths and vice versa (UNESCO, 1983) for consistent comparison. The
following terminology is used:
Designed depths are the depths in mooring designs before deployment and before
corrections for actual water depths and finally used mooring components.
Nominal depths are estimated from the mooring design including relevant information
from the mooring’s deployment and recovery logs, in particular changes during the
deployment process. They are predicted by the static mooring programme IMP (see
sec. 2.2)
o using corrected best estimated water depth at the estimated mooring location
o assuming zero currents throughout the water column, i.e. no tilt and stretching
of the mooring line due to currents ,
o using mooring components as logged in the deck launch and recovery logs.
To keep track, nominal depths are kept and are denoted as such in meta files and
comment lines of data files.
Instrument depths, after further statistical and heuristic inspection from initial
temperature and pressure differences to deployment CTD casts, are finally
determined (see Sec. 2.4 below); they reflect best estimates at the start of a record,
they are filed and recommended for scientific use with the data. They do not reflect
any changes of instrument depths during the mission period, be it temporal diving of
the mooring due to strong current events or permanent non-elastic elongation of
nylon ropes after strong stretching forces or buoyancy loss on top of the mooring (see
below). Such changes need special treatment, may include subjective aspects, and
therefore are left to the user.
Error sources in estimating depths
Systematic errors in depth estimates mostly result from errors in lengths of ropes and wires,
and in buoyancy other than assumed or logged. Such errors are singular for a certain
mooring, and only they are dealt with here.
Stretching of wires and ropes: Within a KIEL276 mooring, typically about 3500 m of nylon
rope were used between the bottom and about 1500 m depth (low risk of fish-biting), and
steel wire or Kevlar above (higher risk of fish-biting). Although not zero, the elongation of
steel wires and Kevlar ropes under stretching forces is low as compared to that of nylon
ropes, and so is the error in stretching. Therefore, under the given stretching forces and
overall lengths any stretching of steel wires and Kevlar ropes is (ca. 1300 m total) neglected
as compared to that of the nylon ropes (ca. 3000 m total). For the type of nylon rope used in
KIEL276 moorings (METEOR rope), the elongations under stretching forces were measured
ashore experimentally with a short and dry length by Engelmann (1972, see Schröder, 1982)
and later with a 100 m wet length by Zenk (1981, see Schröder, 1982). They both used a
16

KIEL276 time series data from moored current meters, Madeira Abyssal Plain, 1980 - 2011
power law which gave similar coefficients at forces larger than 200 kp, with Engelmann’s
coefficients leading to about 1% higher stretch (35 m) less depths in the thermocline for
typical KIEL276 lengths (Fig. 2.2). It was not noted in the designs which coefficients of the
two models were used. We therefore re-calculated all mooring designs using Zenk’s (1981)
more reasonable coefficients for wet ropes and added a linear interpolation to zero below
200 kp stretching force to end up with consistent nominal instrument depths according to
design, deployment logs and modelling. However, a systematic error of 1% in the elongation
estimate of used nylon (METEOR) rope may remain. Note also, that stretching may be non-
elastic under strong forces, leading to permanently higher elongations, e.g. after strong
current events.
Lengths of wires and ropes: Steel wires and Kevlar ropes were used at individual lengths up
to 200 m. Lengths of steel wires and Kevlar ropes are metered once they are configured,
either by the manufacturer or in the institute. They are coiled individually in portion lengths of
10 m, 20 m, 30 m, 50 m, 100 m and 200 m. From individual length differences and individual
coiling, it is rather unlikely that large errors in lengths of up to 200 m will not be detected by
the handling personnel, either in the laboratory while preparing a mooring or at sea during
deployment. The situation is similar for short nylon ropes, but different for long nylon lengths
(300 m, 500 m, 1000 m). Such long lengths are not metered but configured and delivered by
the manufacturer based on a weight to length relation for dry rope. A 1% error in this relation
corresponds to 35 m length error plus roughly 10% stretching under given forces, i.e.
nominal depths maybe estimated 30 m too low or 40 m too high.
Buoyancy: Glass ball buoyancy is rated to 6000 m depth. Except by implosion, its buoyancy
is stable over time once it is determined. However, the major buoyancy on top of the mooring
which is rated to depths of 300 m only, may loose buoyancy by non-elastic compression, e.g.
through a mooring’s diving during strong current events. Each buoy’s buoyancy was
calibrated before it’s first deployment. Any later buoyancy loss is unknown and may lead to
systematic and unknown errors, i.e. stretching forces being too low as compared to the
assumed in the design programme. The most significant effect of this error will be too high
estimates of the elongation of the nylon rope. For KIEL276 moorings, the top buoyancy force
ranges between 300 kp and 800 kp. In this range we estimate about 0.008% less elongation
by kp less buoyancy on top (Figure 2.2). A 10% (35 kp) loss of buoyancy on top and 3500 m
long nylon rope would then result to 10 m larger instrument depths above the nylon rope,
decreasing to 0 m at its lower end.
17

KIEL276 time series data from moored current meters, Madeira Abyssal Plain, 1980 - 2011
Fig. 2.2, Elongation of 11 mm nylon (METEOR) rope under stretching force: 100 m
wet rope (Zenk, 1981) with linear Interpolation below 200 kp load (upper panel, blue); Engelmann (1972) model for dry rope at Zenk’s (1981) data points (upper panel, red); elongation of typical 3500 m length in KIEL276 mooring lines after
Zenk’s (1981) model with interpolation below 200 kp load (lower panel).
Estimating instrument depths
As noted above, significant systematic errors in depth estimates of order 10 m and more may
most likely result from length errors in long (>300 m) pieces of nylon rope, and / or from loss
of buoyancy of the top buoyancy element. Long nylon ropes in KIEL276 moorings usually
(with few exceptions) are used at nominal depths larger than a depth zn, where zn=2000 m is
typical (low risk of fish biting at larger depths) at the KIEL276 mooring site. The method to
best estimate instrument depths, assumes:
RCM temperature and pressure records at depths less zn a-priori do not have an
offset error as wire and Kevlar have almost zero elongation, pieces are short (less
200 m) and therefore large errors in lengths can easily be detected by eye-inspection
during cruise preparation and mooring deployment. Therefore the risk of systematic
errors is expected to be small.
Current meters at depths less zn are arranged a-priori as logged during deployment
with depth differences between them fixed (wire and Kevlar pieces less 200 m).
RCM temperature and pressure record median values of the first 25 hours
characterize the ocean‘s internal state on a time scale (< 3 days) close to the date
and time of deployment.
18

KIEL276 time series data from moored current meters, Madeira Abyssal Plain, 1980 - 2011
From the above, RCM pressure and temperature first 25 h median values at depths
less zn maybe compared with the CTD deployment cast, thereby also enabling to
detect singular offset errors in RCM records or in logged lengths of wires above zn.
Temperature and pressure differences between RCM first 25 h median and CTD
maybe be combined to a single average through normalization based on the RCM
sensor’s measurement range.
Starting close to the surface, the minimum of the sum of normalized absolute
differences (after ignoring outliers in a 2nd run) at depths less zn defines the optimal
instrument depths. Instrument depths larger than zn are adjusted by linear
interpolation between the bottom and the uppermost depth of nylon rope larger zn.
Reasonable results were achieved with he following parameters:
o 2000 m upper ocean depth zn, which is the maximum depth to assume
sufficient accurate RCM temperature measurements in sufficient large vertical
temperature gradients
o According to the mooring design and logs, a deep (long nylon rope) array with
linear stretch correction between the bottom and the upper nylon end, and an
upper fixed array with non-stretchable mooring components where depth
correction is constant.
o half range temperature (12°C) and full range pressure (6000 dbar) values for
normalization
o 0.45°C and 50 dbar error bounds to flag (and ignore) outliers in temperature
and pressure differences for the 2nd run.
For each mooring, the result is output in figures and tables. Nominal depths, corrections and
(best estimates of) instrument depths are tabulated in Appendix A04 for each mooring and
instrument. Overall statistics for the upper ocean based on (27 individual) mooring statistics
are summarized in Figure 2.3 and in Table 2.1.
The final temperature differences of pre-deployment CTD to the first 25 h RCM median
(mean) is 0.01 °C, i.e. less than resolution (0.02 °C) on average (Tab. 2.1, Fig. 2.3) with
standard deviation less 0.1 °C and absolute differences less 0.5 °C. There are 6 outliers of
which three (mooring numbers 19, 21, 22) are due to a single RCM (S/N 10550); the other
three stem from different instruments. These corresponding six temperature records were
offset corrected to match the record start to the pre-deployment CTD cast.
19

KIEL276 time series data from moored current meters, Madeira Abyssal Plain, 1980 - 2011
Fig. 2.3: For each mooring’s depth adjustments, the upper ocean (<2000 m) residuals of pre-
deployment CTD cast values v/s RCM first 25 h temperature (upper panel) and pressure (lower
panel) medians: medians (blue circles), maxima (red dots), minima (margenta dots), blue stars are
outliers identified in the first run and not used for the fit in the second (final) run.
For pressure, the median (mean) is close to zero for moorings number 0 (V264-01) to 6
(V276-06) and from 10 to 13 (V276-10 to V276-13). Moorings V276-07 and V276-08 had no
pressure sensor. For mooring V276-09, the record of the uppermost RCM is lost with the top
buoy and the top RCM. From mooring V276-18 on, the median increases to an overall value
of ~10 dbar, probably due to uncertain linear range calibrations of sensors from mooring
number V276-18 on. However, the low corresponding residuals in temperature provide
confidence in the result of depth corrections for these moorings. The pressure sensor outlier
in mooring V276-01 is due to (non-linear) adaption of the sensor in (nominal) 700 m to in-situ
pressure within the first 600 records (25 d). These first 600 pressure records are set dummy.
All pressure records were offset corrected to match the record start to the best estimate of
instrument depth.
The basic depth correction parameter now is a stretch correction factor applied to nominal
bottom distances; this results in zero correction at the bottom and maximum correction at the
upper (long) nylon rope end. This maximum correction is then applied as constant towards
the surface (Fig. 2.4; App. A04). The maximum – and exceptional large - RCM depth
corrections of more than 200 m towards the surface were applied to mooring V264-01, the
reason being errors in nylon rope lengths due to a failure of the length meter used (see App.
20

KIEL276 time series data from moored current meters, Madeira Abyssal Plain, 1980 - 2011
05, V264-01 for details). Note, that nearly all corrections are positive towards the surface, i.e.
less instrument depths, and only two are slightly negative, indicating a systematic problem in
the exact determination of nominal lengths of the nylon rope.
Fig. 2.4: For each mooring’s depth adjustments, the upper ocean fixed array correction constant (upper panel) and (long) nylon rope stretch correction/(%), both relative to the bottom.
Note
All depth corrections to achieve best estimate of instrument depth as from log
sheets and from static mooring model, and from RCM first day statistics
against deployment CTD. All pressure and temperature corrections made are
noted in comment lines of data header lines.
Comparison with instrument depths published earlier
Re-investigation of mooring design and deployment logs and the method described above to
estimate actual initial instrument depths coherently throughout all moorings, results in
differences to depth estimates published earlier. However, as discussed below these
differences are sufficient small not to change the scientific results published so far.
Barotropic tides: A single paper (Siedler and Paul, 1991) deals with high frequency variability
in the subtropical North East Atlantic, namely barotropic tides. As barotropic tides do not
depend on depth, changes (or errors) in instrument depth estimates will not change the
results.
21

KIEL276 time series data from moored current meters, Madeira Abyssal Plain, 1980 - 2011
Tab. 2.1: RCM best depth estimates; overall upper ocean z<=2000 m statistics as derived from
individual mooring statistics.
P, T : best pressure estimate for RCM; CTD pre deployment cast temperatuere at P
PRCM : RCM first 25 h median pressure
TRCM : RCM first 25 h median temperature measurement
Corr_off: offset/m correction applied to (nominal) bottom distance of RCM
Corr_str: stretch factor coefficient applied to (nominal) bottom distance of RCM
(T-TRCM)/K (P-PRCM)/dbar Corr_off Corr_str
median 0.01 10.0 56 1.013
mean 0.01 9.2 62 1.016
std 0.07 15.3 55 0.015
std*2 0.14 30.5 110 0.029
min -0.37 -27.0 -11 0.997
max 0.43 39.0 244 1.061
Low-frequency variability: All other papers published so far treat low-frequency (<1/2 d-1)
variability, i.e. on quasi-geostrophic time-scales in the region.
Published instrument depths: Siedler et al. (2005) listed instrument depths (their Tab. 1).
Their list encompasses moorings V264-01 to V276-19 and RCMs at all depth levels that
provided data. For an analysis of upper thermocline fluctuations, Fründt et al. (2013) used
one to two RCM records from the upper thermocline from each mooring until mooring V276-
26 and tabled instrument depths from this level (their Tab. 1). Their depths are identical to
the respective ones of Siedler et al. (2005) until V276-19. The combined set of instrument
depths used by Siedler at al. (2005) and by Fründt et al. (2013) is the most complete one
published so far. These depths therefore are treated as being typical and representative.
They are listed along with instrument depths as recommended in this report in Appendix A04,
and for each mooring, differences of recommended instrument depths (this report) to those
published by Siedler et al. (2005) and Fründt et al. (2013) are displayed in Figure 2.5.
Overall, instrument depth differences are less +/- 70 m (Fig. 2.5), and only deep ocean
differences (stars, >2900 m) exceed +/- 45 m. Inspection of logs shows, that the major
reason for the observed differences is subjective adjustment of instrument depths. Neither a
systematic nor a coherent method of adjustment covering all moorings has been used so far.
However as discussed below, the depth differences are sufficient small to not affect the
scientific results in earlier papers with respect to both, temperature and current records.
Temperature records: No temperature records from the deep (>2900 m) ocean have been
analyzed scientifically so far. Temperature records from the upper ocean were used in the
22

KIEL276 time series data from moored current meters, Madeira Abyssal Plain, 1980 - 2011
papers by Siedler et al. (2005) and Fründt et al. (2013). Here, the authors have adjusted the
temperature records directly to depths of investigation by linear corrections to CTD casts
taken close to mooring deployment and / or recovery. This individual sensor approach
creates coherent links between records in terms of averages, and as variances do not
change much with small depth changes of less 70 m, the papers’ scientific results do not
depend on this adjustment.
Current records: Daily averages of low pass filtered current measurements from all or from
part of then available depths of moorings V264-01 through V276-19 were used by Zenk and
Müller (1988), by Müller and Siedler (1992), Waniek et al. (2000), Waniek et al. (2005),
Siedler et al. (2005) and Fründt et al. (2013). Müller and Siedler (1992) interpolated
measured currents to depths of investigation using a 3 mode quasi-geostrophic or a 2 mode
Empirical Orthogonal Function (EOF) decomposition into time and depth dependant parts at
KIEL276 and other sites of the subtropical eastern North Atlantic. At all sites, such a
decomposition explains about 90% of record variances and therefore was accepted to
represent each record. The barotropic mode (Fig. 2.6 for KIEL276) is constant with depth
and therefore insensitive to changes (or errors) in depths (Fig. 2.6, left panel). The 1st and 2nd
baroclinic modes changes over 50 m steps at a given depth sum up to less than 1%
amplitude change (Fig. 2.6, right panel) in currents at all depths. We conclude that changes
of less than 100 m by depth adjustments would result in a change of current amplitude of
less than 2% and therefore would not change the scientific results in the above papers.
23

KIEL276 time series data from moored current meters, Madeira Abyssal Plain, 1980 - 2011
Fig. 2.5: KIEL276 instrument depth differences recommended in this report to those used by Siedler et al. (2005) for all RCMs until mooring V276-19 (blue) and Fründt et al. (2013) for upper ocean RCMs in moorings V276-21 to V276-26 (red). Stars for deep (>2900 m), circles for uppermost and dots for all other instruments used.
24

KIEL276 time series data from moored current meters, Madeira Abyssal Plain, 1980 - 2011
Fig. 2.6: KIEL276: vertical normal modes from stratification (left panel) and their vertical gradients in 50 m steps (right); barotropic mode M0 (blue), 1st baroclinic M1 (green) and 2nd baroclinic M2 (red).
25

KIEL276 time series data from moored current meters, Madeira Abyssal Plain, 1980 - 2011
3 KIEL276 CTD data
Casts
During all mooring cruises, hydrographic (mostly CTD) casts were obtained close to the
nominal mooring location (see map in Fig. 1.1, summary in Tab. 3.1) in order to acquire
vertical profile data for comparison with data from moored instruments. The CTD’s used
onboard were of type Kiel Multisonde until 1981 and in 1985, Neil Brown’s MKIIIB, Falmouth
Scientific’s ICTD, and Sea Bird’s 911. Table 3.1: Summary of CTD cast at KIEL276; No corresponds to setting of mooring; M2T is R/V METEOR II, MSM is R/V MARIA S MERIAN. K276 No Remark 00 CTD conductivity bad, no salinity, M2T053 01 CTD conductivity bad, no salinity, M2T056 02 Nansen cast replaced bad CTD during M2T057 03 M2T060 CTD casts lost; replaced at KIEL276 by XBT file 072, drop 067 04 to 28 CTD casts for V276-04 (M2T064) to V276-28 (MSM018) deployments
Calibration
All CTD temperature and pressure sensors were checked and eventually corrected for
calibration of temperature and pressure sensors in the laboratory at IfM Kiel (now GEOMAR);
for electrical conductivity (salinity) sensors the manufacturer’s calibration were used during
the cast. Generally, in-situ samples were taken, to measure in-situ salinity in a Guildline
AUTOSAL salinometer which was then used for in-situ calibration of the CTD’s conductivity
cell and finally salinity. During some cruises, however, no samples were taken; in these
cases, salinity was offset-calibrated against the stable relation of potential temperature and
salinity in the deep North East Atlantic Ocean (Saunders, 1986); such adaption is marked in
the files.
Processing
In a first step, raw data of all casts from a cruise (usually taken at 16 Hz rate, ca. 16 data
cycles / m) were converted from binary code to ASCII applying the basic (manufacturer’s)
calibration. Next, the following processing steps were performed (see Müller, 1999) using
UNESCO (1988) computational formulas:
spikes were removed
data were reduced to lowering parts of the cast
a time constant shift was applied where necessary
the basic calibration for temperature and pressure sensors was corrected using the
laboratory calibration, and for the conductivity cell’s using the in-situ calibration with
Standard Sea Water (SSW)
a low pass filter was applied with a ca. 2 dbar response
low-pass cosine filter over 10 dbar
interpolation to appropriate pressure scale relative to sampling, nominally 2 dbar
check of static stability using potential density
salinity was recalculated
26

KIEL276 time series data from moored current meters, Madeira Abyssal Plain, 1980 - 2011
check of calibration using Saunders (1986) relation of potential temperature and
salinity for the deep (< 3°C) North East Atlantic.
For each deployment cruise, the single deep cast which is closest in space and time to the
mooring was extracted, processed as above and transferred to MATLAB and ASCII files
K276_hydro_iii.ext, 000<=iii<=028, with ext=MAT and ext=CTD, respectively. The casts are
‘smooth’ and statically stable. Only cast 28 is slightly instable in the deep sea. The deep
salinity of all casts fit to Saunders (1986) relation better than 0.005 (Fig. 3.1.1). For more
details see the cruise reports and comments in the file headers.
We recommend this set of CTD data shall be used for comparison with the current meter
data set. Summary plots of casts in Figures 3.1 and relations of potential temperature and
salinity in Fig. 3.2. For each cast, note the comments in the files.
Tab. 3.2: KIEL276 CTD casts during mooring cruises: nominal location 33° 00.0’N, 022° 00.0‘ W. CTD casts processed. Quality of calibration checked with Saunders’ (1986) relation and found acceptable (error less 0.005); for some casts salinity was offset calibrated to meet the relation (see cruise reports). Quality of profiles checked with static stability of potential density anomaly. Casts 0 and 1 have no salinity, cast 3 was replaced by a Nansen cast; cast 4 is lost and replaced by a near-by XBT drop (no 67). Cast 28 processed with manufacturer’s (Sea Bird) software to 1 dbar basket averages; cast 28 is slightly statically instable in the deep sea. List of CTD-data at KIEL276 during mooring deployment cruises. Directory: 2_k276_mooring_cruises_hydro_data/3_k276_mooring_cruises_CTD_XBT/k276/ Files: k276_hydro_ File no: 000 to 028 File numbers correspond to mooring deployments V264-01 (000) and V276-01 (001) to V276-28 (028). Ship codes: M2T: METEOR II; MET: METEOR III; POS: POSEIDON; MSM: MARIA S MERIAN Pmax is maximum pressure of cast File Stat Cast Date Hour Min Latitude Longitude Depth Pmax Cruise Remark YYYY MM DD hh mm North East m dbar 0 180 3 1980 3 31 12 0 32.1017 -21.8483 5280 500 M2T53-D no salinity 1 5 1 1980 10 17 17 48 32.1183 -21.8033 5280 3494 M2T56-1 no salinity 2 542 1 1981 7 26 20 42 33.1500 -21.9167 5280 2533 M2T57-1 Nansen cast 3 067 67 1982 3 4 1 5 33.0700 -21.8950 5280 807 M2T60-3 XBT file 72 4 315 1 1983 4 17 2 45 33.1600 -21.8200 5280 5332 M2T64-6 5 731 1 1983 10 20 12 45 33.1533 -21.9100 5280 5000 POS104-C 6 229 3 1984 10 26 13 50 33.1217 -21.8917 5280 5368 M2T69-5 7 529 21 1985 11 16 18 30 33.1567 -21.9600 5280 5269 POS124 8 296 6 1986 10 31 21 51 33.1435 -21.9587 5280 4998 MET04-2 9 803 5 1987 11 5 23 26 33.1470 -21.8738 5280 5320 MET06-1 10 59 50 1989 1 14 3 2 33.0980 -21.9108 5280 5288 MET09-2 11 911 3 1989 10 27 18 25 33.0667 -21.9050 5280 5360 MET11-2 12 615 5 1990 9 25 18 5 33.1563 -21.9098 5280 5368 MET14-1 13 37 14 1992 1 27 21 25 32.9150 -22.1267 5280 5320 POS189-1 14 501 9 1993 7 12 19 6 32.9983 -22.0467 5280 5352 POS200-8 15 764 4 1994 9 18 12 50 32.9236 -22.0330 5280 3998 POS202 16 884 98 1995 10 15 12 23 33.0393 -21.9650 5280 4576 POS212-4 17 178 3 1996 6 25 2 36 33.0050 -22.0167 5280 5286 MET36-2 18 482 3 1997 8 7 0 44 33.0167 -21.9633 5280 3980 POS231-3 19 10 7 1999 1 24 20 25 33.0010 -21.9995 5280 5360 POS247-2 20 57 15 2000 4 12 16 45 32.9781 -21.9329 5280 5358 POS259-1 21 66 3 2001 2 1 15 2 32.9983 -22.0000 5280 5352 POS268 22 17 19 2002 2 19 17 20 32.9247 -22.0219 5280 5372 POS283-2 23 71 13 2003 4 20 11 56 32.8530 -22.0183 5280 4958 POS297 24 10 13 2004 3 16 18 19 33.0058 -22.0107 5280 1008 POS308 25 187 7 2005 5 8 17 49 33.0007 -21.9814 5280 5358 POS321 26 254 5 2007 4 10 5 28 32.9999 -22.0005 5280 3636 POS349 27 007 7 2009 4 26 15 54 33.1655 -21.9951 5280 4414 POS383 28 004 4 2011 4 21 17 8 33.0246 -22.0393 5280 5301 MSM18-1
27

KIEL276 time series data from moored current meters, Madeira Abyssal Plain, 1980 - 2011
Fig. 3.1: CTD summary casts (upper panel) and statistics (lower panel) at KIEL276 during deployment cruises; note salinity is missing for casts 0 and 1(bad salinity) and 3 (XBT); here, average salinity was assumed to calculate potential temperature.
28

KIEL276 time series data from moored current meters, Madeira Abyssal Plain, 1980 - 2011
Fig. 3.2: As Fig. 3.1, but summary of potential temperature and salinity. Note that in the deep sea the relation of θ and S of all casts merge, and all coincide well with the one given by Saunders (1985) for the deep Northeast Atlantic (red line below 3°C).
29

KIEL276 time series data from moored current meters, Madeira Abyssal Plain, 1980 - 2011
4 KIEL276 moored instruments
4.1 Instrumentation, processing and archiving
Instrumentation of moorings differed for each setting. It depended on availability of
instruments and sensors, specific scientific questions, and sometimes on deployment
conditions. Also, different instruments need different processing steps, and over 30 years
computers and formats and even methods changed. Some earlier processing of physical
data is documented in cruise reports (see App. 03) or in data reports (Müller, 1981; Müller
and Zenk, 1983; Müller, 1984; Müller et al., 1987; Müller et al. 1990). We here aim at providing
a homogenous set of physical data from KIEL276 by harmonizing the meta data information and partly
re-processing necessary steps. For a quick overview see data sources, processing and
submission to data centres see Table 4.1 and Appendix A05; for details see this section.
In 1980 the series started solely with Aanderaa RCM4/5 current meters (Aanderaa, 1978). In
the main thermocline these were supplemented from the second deployment (V276-01) in
late 1980 to 1995 (V276-15) by Aanderaa thermistor cables of 50 m length. Replacement of
the RCM4/5 by quasi-vector-averaging RCM7/8 (Aanderaa, 1987) started in 1989 (V276-10)
and was completed in 1993 (V276-15). Only for a single setting (V276-21), a 150 kHz
upward looking ADCP was mounted on the top buoy.
From 1994 (V276-14) on, particle traps made by Howaldt Werke Deutsche Werft (HDW) and
Salzgitter Elektronik (SE) were added; first in a separate mooring (L1) close to V276-14, and
then implemented into KIEL276 moorings as standard from 1994 (V276-15) on.
Detailed information on instrumentation, instrument depths and data return for each mooring
is available in Appendix A02 and on the cover pages for each mooring in Appendix 06.
4.2 Aanderaa current meters RCM4/5 and RCM7/8
Sensors
Standard sensors provide time information, temperature, current direction and speed sensor.
Additionally, a conductivity and pressure sensor, both with different ranges can be mounted.
Time basis: for the RCM4/5, the time basis is taken from the recording interval as set
by the user and the number of records between the instrument’s start and stop; for
the RCM7/8 it is taken from the instrument’s internal clock which stores date and time
once a day before each day’s first record, and from the recording interval as set
internally.
Temperature is measured at the instrument’s housing. Mostly, the Low Range option
(-2.1°C to 21°C) was chosen. From the 3000 m depth level on and deeper, the Arctic
Range (-2.1°C to 5.6°C) option was chosen and archived where available; in these
cases no pressure sensor could be mounted. For temperature calibration, Aanderaa
claims the second and third order coefficients, (C and D in Tab. 4.2), to be the same
30

KIEL276 time series data from moored current meters, Madeira Abyssal Plain, 1980 - 2011
for a chosen range for all sensors while offset and slope define range and resolution.
At the institute, early calibrations were tabulated for computational reasons. Range
end point calibrations correspond to raw values N=0 and N=1023 and were filed in
headers of MK4 data files. With the 2nd and 3rd order coefficients, C and D, being
known and constant, the complete set of coefficients has been recovered and were
used where needed. Files created later, have the complete set of coefficients in their
header’s comment part.
Temperature sensor stability: inspection shows: (i) calibrated temperature records
in the deep sea differ by less 0.2 K to all other records in the deep sea, and (ii)
temperature calibration stability within a record of up to two years length is better than
2 mK/a for all record lengths available; any drift within a record therefore is much less
than the sensor resolution, 20 mK and 7.5 mK, for the low and arctic ranges,
respectively; therefore no drift correction with respect to CTD casts is needed and is
not applied
Conductivity measurements together with temperature and pressure (or the
instrument’s depth) provide salinity; some conductivity calibrations are just by Range
as logged in the respective instrument’s start logs. Derived salinity often shows strong
and non-linear drift; salinity therefore is archived, but no further processing attempt
was made.
Pressure sensors were used in the upper ocean to monitor instrument depth and
mooring motion. Lack of funding limited availability of sensors. Lack of time and
personnel limited laboratory calibration from about 1999 on, and therefore many
conversions of raw data to physical units just could use linear-range-calibrations as
logged in the respective instrument’s start logs; if so, it is noted in the mooring’s
detailed meta data (Appendix 06), and these records - without further adjustments to
offset and range - only give estimates of events in mooring motion. Few pressure
records show non-linear adaption to environmental pressure which however is
obvious in the pressure record plots
Current direction & Speed: direction is measured by a magnetic compass at the end
of each measuring interval while speed is measured as an integral counting
revolutions of the rotor over the same measuring interval. For the RCM4/5, the
measuring interval is the recording interval as set by the user. For the RCM7/8, each
recording interval consists of several measuring intervals to deliver quasi-vector-
averaged values of direction and speed. In KIEL276 moorings, the recording interval
was set to 2 h, and initially (from 1989, V276-10 on) an average of 100 individual
measurements (1 in 72 s) was taken over the recording interval (Aanderaa, 1987).
Due to problems with battery power, this rate was reduced to 50 individual
measurements (one in 144 s) from 1991, V276-12, on. Bio-fouling at KIEL276 is
significant only in the ocean’s upper 150 m and decreases very quickly downwards; it
affects mostly the rotor, but only in few cases bio-fouling led to cut the record. The
(average) direction needs correction for earth’s horizontal magnetic anomaly
component as noted in bridge logs taken from sea charts. In some cases, anomalies
31

KIEL276 time series data from moored current meters, Madeira Abyssal Plain, 1980 - 2011
were not noted in the logs; these were interpolated between mooring deployments
(Appendx 01).
Data sources for archiving & file formats
For an overview see Table 4.1 below. Data sources for further inspection and processing to
files for archiving are:
V264-01 and V276-01 through V276-09: For these first settings, raw data as
mirrored from the storage medium to ASCII computer files, are lost; processed data at
recording interval on the MK4 level are available as ASCII files (internal MK4 format
of the then IfM Kiel). For consistency with later data sets, these were transferred to
ASCII files (internal PH3 format) with the following adjustments (Pre1-level):
o Meta information in header adjusted w/r to position; water depth; nominal
depths as from mooring logs and static mooring model (see sec. 2.4).
Deviations from older values are small and are not significant for scientific
results already published (see discussion in sec. 2.4).
o East and North components of currents were re-transferred to measured
current direction and speed.
o Any temperature corrections in MK4 reverted in PH3 (Tab. 4.3 below).
V276-10 through V276-12, V276-15 through V276-19, V276-21 through V276-27:
raw data are available and processed (re-processed) to create ASCII (internal PH3
format) data files at sampling interval (Pre1-level).
V276-13 and V276-14: For data of these two settings, only low pass (49 h filter
length, 36 h half power response) filtered daily averages are available. Data sources
are internal MK4 ASCII formatted files which were transferred to PH3 formatted ASCII
data for consistency, with adaption of meta information in the header (Pre1-level).
Processing
Processing used ‘home-made’ institutional FORTRANR and MATLABR software written for
data processing of moored Annderaa RCM and TR. The result is stored in computer
dependent binary coded files and in ASCII files (Tab. 4.1). Processing steps include
creation of an ASCII meta information file V276ii.txt where ii is the KIEL276
deployment number. This file contains data on
o deployment and recovery times, and cruises
o mooring position and water depth
o instrumentation with nominal depths as from mooring logs and static model
o information on eventual problems with the mooring
o information on problems with data
MK4 level data: source were raw data which now are lost; detailed steps below
Pre1-level data: source is either MK4 data or raw data; detailed steps as below;
output to PH3 formatted ASCII and MAT files
Pre2-level data: source is pre1-level data; some additional adaption and corrections
are made; nominal depth replaced by best estimate of instrument depth (Sec. 2.4)
32

KIEL276 time series data from moored current meters, Madeira Abyssal Plain, 1980 - 2011
MK4-level
Input: on this level, all raw data are from RCM4/5 as mirrored from data storage tape
to ASCII computer files
Raw data conversion : Conversion of raw data to physical units of temperature,,
conductivity, pressure, current direction and speed used
o the calibration instructions of the manufacturer (Aanderaa, 1978, 1987)
o the calibration sheets accompanying each new instrument (see Tab. 4.2)
o any re-calibration of sensors at the institute’s calibration lab
o linear range calibrations if no better information is available
Time basis: start time (instrument’s switch on) as from log; stop time from start time,
sampling interval and number of records; control as from instrument’s switch off time
if available; time offset correction from start time; time drift correction from start and
stop time if controlled externally; final start time, stop time and sampling interval to
header information; time basis for records created linearly between start and stop
time using number of records.
Speed & direction: replace zero speed readings by 1/2 of the offset calibration
coefficient; decompose to East and North components
Spikes: detect spikes using a running median filter over typically 9 records with
typically 0.05K, 5 cm/s ; replace spikes by associated median
Temperature: corrections as in Table 4.3
Salinity: replaces conductivity if measured
Edit suspicious data and header information as necessary
Dummy values were set where data are bad or not measured
Output to MK4 binary and ASCII formatted files at sampling interval
o Header information as from logs and processing steps including dates and
times of start and stop of the time series along with the time interval of storage
o Records with pressure, current East- and North components, temperature,
salinity
33

KIEL276 time series data from moored current meters, Madeira Abyssal Plain, 1980 - 2011
Pre1-level
Input: either MK4 or raw data
Processing
From start and stop time, for each record create decimal day referred to a reference
year, i.e. day 0.0 refers to 1st January, 00:00 UTC of the reference year
o MK4 input
Add missing information for PH3 output
Current direction and speed re-calculated from components
Revert temperature corrections applied for MK4 (Tab. 4.3)
o Raw data input
Create header information from logs; nominal depth as from logs and
static mooring model
Data processed as for MK4-level
o MK4 and raw data input
Choose arctic range temperature if available for deep sea records
Check correct speed conversion factor within a mooring line for
consistency by comparing standard deviations of fluctuations around
the M2 tidal signal in band-pass filtered speed data; fluctuations
decrease slightly with depth reflecting higher oceanic variability in the
thermocline; standard deviations differ less than a factor 2 from depth
average standard deviations. The spectral peaks are all within the
frequency band of the M2 tide at highest spectral resolution.
Output to PH3 formatted ASCII and MAT files at sampling interval
o Header information as from logs and processing steps
o Records with reference year, decimal day, pressure, current direction, current
speed, temperature, salinity
34

KIEL276 time series data from moored current meters, Madeira Abyssal Plain, 1980 - 2011
Pre2-level
Input: PH3 formatted pre1-level data files
Processing
o Depth: instrument depth set to ‘best estimate’ as from logs, static mooring
model and first day’s data statistics compared to deployment CTD casts
(Sec. 2.4); ‘nominal depth’ kept as comment in header
o Pressure: all records adapted such that first day’s median matches
instrument ‘best- depth-estimates’ (Sec. 2.4, App. 04).
o Temperature: thermocline temperature records which first day’s median
differ more than +/- 0.45 K from deployment CTD were offset-adapted to
match deployment CTD (Sec. 2.4); deep sea temperature records
corrected such that first day’s median matches pre-deployment CTD casts
if available (Sec. 2.4, App. 04); all corrections commented
o Speed: speed values at zero or 1/2 offset calibration value are set to
dummy and interpolated in time; interpolation keeps trailing dummies.
Output: PH3 formatted ASCII and MAT files
o Header information as from logs and processing steps with instrument’s
‘best depth estimate’ in header and ‘nominal depth’ in comment
o Records with reference year, decimal day, pressure, current direction,
current speed, temperature, salinity
Table 4.1: RCM4/8 and RCM7/8 data sources, processing steps and data formats; raw data as
mirrored from tape or data storage unit (DSU).
KIEL276 Mooring
Data
Raw data
ASCII
MK4 level Pre1 level Pre2 level Archived ***
Format matrix MK4 PH3 PH3 RODB
From To
V264-01 - No Yes Yes Yes Yes
V276-01 V276-09 No Yes Yes Yes Yes
V276-10 V276-12 Yes Yes Yes Yes
V276-13* V276-14* No Yes Yes Yes Yes
V276-15 V276-19 Yes Yes Yes Yes
V276-20** - - - - -
V276-21 V276-27 Yes Yes Yes Yes
(*) for data from moorings V276-13 and V276-14 ,only low pass filtered daily averages available
(**) mooring failed, no data
(***) Data initially are archived at GEOMAR data centre and submitted to the World Data
System’s centre PANGAEA and to Ocean Sites’ data centre at CORIOIS.
(Appendix A05)
35

KIEL276 time series data from moored current meters, Madeira Abyssal Plain, 1980 - 2011
Table 4.2: RCM4/5 and RCM7/8 polynomial calibration coefficients used in KIEL276 moorings:
P=A+B*N+C*N2+D*N3 with N as the 10-bit recorded raw value, and P the physical value; note that
speed calibration of the RCM4/5 depends on the setting of R (rotor revolutions per count) and on the
sampling interval, t/s.
Unit A B C D
Speed Cm/s RCM4/5 1.5 42*R/t 0 0
RCM7/8 1.1 0.2906 0 0
Direction °N RCM4/5 1.5 0.3490 0 0
RCM7/8 1 0.3500 0 0
Temperature °C Arctic range Sensor
dependent
Sensor
dependent
-1.601e-007 7.911e-011
Low range Sensor
dependent
Sensor
dependent
-1.344e-006 1.937e-009
Conductivity mS/cm Sensor
dependent
Sensor
dependent
0 0
Pressure dbar Sensor
dependent
Sensor
dependent
Sensor
dependent
Sensor
dependent
36

KIEL276 time series data from moored current meters, Madeira Abyssal Plain, 1980 - 2011
Table 4.3: Individual temperature corrections as of 22-SEP-1993 and copied from printed log.
Corrections were reverted for this report to create consistent data sets throughout the whole KIEL276
data set, e.g. for estimating instrument depths from temperature and pressure measurements.
Mooring ID Instrument ID Temperature
corrections as of
22-SEP-1993
Temperature
corrections
reverted
V264-01 V264-01_007 0.13 Y
V264-01_008 0.19 Y
V276-01 V276-01_005 0.14 Y
V276-01_009 0.43 Y
V276-02 V276-02_003 1.28 Y
V276-02_004, No. 7 0.09 Y
V276-02_004, No. 11 -0.04 Y
V276-02_008 0.23 Y
V276-03 V276-03_005 0.50 Y
V276-04 V276-04_005 -0.11 Y
V276-04_008 0.45 Y
V276-04_009 0.11 Y
V276-04_010 0.20 Y
V276-05 V276-05_006 0.30 Y
V276-05_008 0.25 Y
V276-05_009 0.06 Y
V276-05_010 0.02 Y
V276-06 V276-06_004 -0.30 Y
V276-06_005, No. 1 0.85 Y
V276-06_005, No. 2-9 0.80 Y
V276-06_007 0.15 Y
V276-06_008 0.15 Y
V276-06_009 0.10 Y
V276-06_010 0.03 Y
37

KIEL276 time series data from moored current meters, Madeira Abyssal Plain, 1980 - 2011
4.3 Other Aanderaa instruments
Thermistor cables TR4/5, TR7/8
Aandeaa thermistor cables of 50 m length were used from V276-01 until V276-15 in the main
thermocline. Data sources, raw data conversion, calibration and processing as for Aanderaa
RCM (see sec. 4.2) pre1-level; data kept on pre1-level for archiving at GEOMAR data centre.
Pressure recorders and inclinometers
Some early moorings carried pressure recorders and/or inclinometers on the mooring’s top
with high sampling rates (30 s) in order to monitor the mooring’s deployment phase. These
data are not archived and lost.
4.4 Acoustic current meters
Early single beam Acoustic vector averaging current meters
Proto types made by NBIS were implemented in moorings V276-02 and V276-04 to V276-06.
Data return was poor. Those data that could be read from storages clearly showed that the
internal algorithm that changed current components from instrument coordinates to earth
coordinates was wrong. As the instrument did not store the original measurements they
could not be reverted from the wrongly transformed data. Data were not used nor archived,
and now are lost.
Acoustic Doppler Current Profiler
In a single deployment, V276-21, 2001 to 2002, an upward looking ADCP, 150 kHz, made by
RDI was mounted in the top buoy at nominal 163 m depth. ADCP ping data as stored
internally by the instrument are available in the archive together with the deployment and
recovery log. These data are singular in the whole set and have therefore not been
processed yet.
4.5 Particle traps
Particle traps were added in 1993, starting with 4 traps in a separate mooring (L1) close to
the existing V276-14 (1993/1994). From 1994 (V276-15) on, traps were merged with the
current meter mooring. Lack of funding left a data gap from end of 1997 to early 1999 (V276-
18).
All particle trap data were evaluated by the institute’s JGOFS group and later at the Leibniz-
Institut für Ostseeforschung, Warnemünde (IOW); they are documented and archived at the
IOW and available at the World Data System’s centre PANGAEA. In this report, we only
adjust the estimates of measurement depths to the level nominal depths as from logs and
static mooring model. These are used in the meta data and in the mooring sketches
(Appendix A05). Deviations from trap depth estimates used earlier are small and do not
affect scientific results already published (see Section 2.4).
38

KIEL276 time series data from moored current meters, Madeira Abyssal Plain, 1980 - 2011
39

KIEL276 time series data from moored current meters, Madeira Abyssal Plain, 1980 - 2011
Acknowledgements
The KIEL276 mooring site for more than 30 years could only be run with the support by
numerous institutions and persons: The former Institut für Meereskunde in Kiel (now
GEOMAR) and later the Leibniz-Institut für Ostseeforschung in Warnemünde (IOW) provided
support through personnel and basic funding sources, the Deutsche
Forschungsgemeinschaft (DFG) and the Bundesministerium für Forschung (BMBF) through
project funding and ship time. From 2001 to 2005, part of the scientific analysis and of the
planning processes was performed while one of the authors (JJW) was affiliated at the
National Oceanography Centre, Southampton, UK. We thank Gerold Siedler and Detlef
Schulz-Bull for their scientific guidance and advise over many years. In particular, we thank
the technicians involved in the two institutes, and the ship crews for their work at sea.
40

KIEL276 time series data from moored current meters, Madeira Abyssal Plain, 1980 - 2011
References AANDERAA Instruments (1978): Operating manual for the recording current meter model 4. Techn. Descr. 119, Bergen, 1978. AANDERAA Instruments (1987): Operating Manual, Recording Current Meter, Models 7 & 8, Techn. Descr. No. 159, Dec. 1987. BRUST, J., D.E. SCHULZ-BULL, T. LEIPE, V. CHAVAGNAC, J.J. WANIEK, J.J. (2011): Descending particles: from the atmosphere to the deep ocean: A time series study in the subtropical NE Atlantic, Geophys. Res. Lett., 38, L06603, doi:10.1029/2010GL045399. BRUST, J., WANIEK, J. J. (2010): Atmospheric dust contribution to deep-sea particle fluxes in the subtropical Northeast Atlantic, Deep Sea Research, Part I, 57, 988-998. CHAVAGNAC, V., WANIEK, J.J., ATKIN, D., MILTON, J.A., LEIPE, T., GREEN, D.R., BAHLO; R., HAYES, T.E.F., SCHULZ-BULL, D.E. (2007), Anti-Atlas Moroccan Chain as the source of lithogenic-derived micronutrient fluxes to the deep Northeast Atlantic Ocean, Geophys. Res. Lett., 34, L21604, doi: 10.1029/2007GL030985. DICKSON, R.R., W:J: GOULD, T.J. MÜLLER, C. MAILLARD (1985): Estimates of the mean circulation in the deep (>2000 m) layer of the eastern North Atlantic. Progr. Oceanogr., 14, 103-127. ENGELMANN, H. (1972): Untersuchungen an Komponenten für Tiefwasserverankerungssysteme. Kieler Meeresf. XXVIII/2, 119-129. FINKE, M., and G. SIEDLER, 1986: Drag Coefficients of Oceanographic Mooring Components. J. Atmos. Oceanic Technol., 3, 255–264. doi: http://dx.doi.org/10.1175/1520-0426(1986)003<0255:DCOOMC>2.0.CO;2 FRÜNDT, B, T.J. MÜLLER, D.E. SCHULZ-BULL, J.J. WANIEK (2013): Long-term changes in the thermocline of the subtropical Northeast Atlantic (33°N, 22°W), Progress in Oceanography, Volume 116, September 2013, Pages 246-260, ISSN 0079-6611, http://dx.doi.org/10.1016/j.pocean.2013.07.004. (http://www.sciencedirect.com/science/article/pii/S0079661113001109) HINZ, K, L. HASSE, F. SCHOTT (1991): Subtropischer Tropischer Atlantik, Reise Nr. 14/1-3, Maritime Meteorologie und Physikalische Ozeanographie, 17.September – 30. Dezember 1990, Meteor-Berichte 91-3, 58 S. HELMBRECHT, L. (2001): IMP Integrated Mooring Package, Vers. 1.0, Dec. 2001. Int. Ber., Inst. Meeskd. Univ. Kiel, , unpublished manuscript, 48 pp. HELMBRECHT, L. (2002) Entwicklung einer Verankerungssimulation als Designhilfe und zur Verbesserung der Datenanalyse (Diplomarbeit), Christian-Albrechts-Universität, Kiel, Germany, 118 pp KNOLL, M., T.J. MÜLLER, G. SIEDLER (1998): ESTOC/CANIGO cruises with FS Poseidon cruise 202/1, 212, 233, 237/3. . Ber. Institut für Meereskunde, Univ. Kiel, Nr. 302, 78 S. KREMLING, K., U. LENTZ, B. ZEITSCHEL, D.E. SCHULZ-BULL, J.C. DUINKER, J.C. (1996): New type of time series sediment trap for the reliable collection of inorganic and organic trace chemical substances. Rev. Sc. Instr. 67 (12), 4360-4363. KRAUß, W. (1996a) The Warmwatersphere of the North Atlantic Ocean Gebr. Bornträger, Berlin, Stuttgart, 446 pp.
41

KIEL276 time series data from moored current meters, Madeira Abyssal Plain, 1980 - 2011
KRAUß, W. (1996b) Comments on the development of our knowledge of the gerenal circulation of the North Atlantic Ocean The Warmwatersphere of the North Atlantic Ocean. Bornträger, Berlin, Stuttgart, pp. 1-31. MEINCKE, J., E. MITTELSTAEDT (KOORDINATOREN), K. KREMLING, W. ZENK, P. KOSKE (1985): Forschungsschiff Meteor, Reise 69, Nordostatlantik 84, NOAMP III, Berichte der wissenschaftlichen Leiter, Techn. Ber. 1-85, Inst. Meereskunde Univ. Hamburg. MIENERT, J., G. GRAF, C. HEMLEBEN, K. KREMLING, O. PFANNKUCHE, D. SCHULZ-BULL (1998): Nordatlantik 1996, Cruise No. 36, 6 June – 4 November 1996, Meteor Berichte 98-2, 320 pp. MOLLER, D.A. (1976): A Computer Program for the Design and Static Analysis of Single Point Subsurface Mooring Systems. W.H.O.I. Techn. Rep. Ref. No. 76-59. MÜLLER, T.J. (1981): Current and temperature measurements in the North-East Atlantic during NEADS, Ber. Inst. f. Meereskunde Kiel, Nr. 90, 100 S. MÜLLER, T.J. and ZENK, W. (1983): Some Eulerian current measurements and XBTsections from the North East Atlantic October 1980 - March 1982 - A Data Report - Ber. Inst. f. Meereskunde Kiel, Nr. 114, 145 S. MÜLLER, T.J. (1984): Eulerian current measurements from the North East Atlantic, March 1982 - October 1983, A Data Report. Ber. Inst. f. Meereskunde Kiel, Nr. 127, 98 S. MÜLLER, T. J., M. FINKE, W. DASCH, R.R. WITTSTOCK (1987) Hydrographic and current measurements in the North-East Atlantic Ocean : data report F. S. Meteor cruises 69/5 and 69/6, October to November 1984 Berichte aus dem Institut für Meereskunde an der Christian-Albrechts-Universität Kiel, 166. Institut für Meereskunde, Kiel, Germany, 99 pp. DOI 10.3289/IFM_BER_166. MÜLLER, T.J., G. SIEDLER, W. ZENK (1988): Forschungsschiff „METEOR“, Reise Nr. 6. ATLANTIK 87/88 - Fahrtabschnitte Nr. 1 - 3, Oktober - Dezember 1987. Berichte der wissenschaftlichen Leiter. Ber. Inst. f. Meereskunde, Nr. 184, 77 S. MÜLLER, T.J. and G. SIEDLER (1992): Multi-year current time series in the eastern North Atlantic Ocean. J. Mar. Res., 50, 63-98. MÜLLER T.J. (1999): Determination of Salinity. In: Grasshoff, K., K. Kremling and M. Ehrhardt (Eds.): Methods of seawater analysis, 3rd completely rev. and extended ed., Weinheim: New York, Chester, Brisbane, Singapore, Toronto, Wiley-VCH, Ch. 3, 41-73. MÜLLER, T.J., J. XU, O. LLINAS, E. PEREUZ-MARTELL (1990): Hydrographic and Current Observations in the North-East Atlantic Ocean - Data Report F.S. POLARSTERN Cruise ANT IV/1b, F.S. POSEIDON Cruise 124, B.O. TALIARTE Cruise XIV, September to December 1985. Ber. Inst. f. Meereskunde Kiel, Nr. 202, 105 S. ROETHER, W., M. SARNTHEIM, T.J. MÜLLER, W. NELLEN, D. SAHRHAGE (1990): Südatlantik-Zirkumpolarstrom, Reise Nr. 11, 3. Oktober 1989 - 11. März 1990. METEOR-Berichte, Universität Hamburg, 90-2, 169 S. SAUNDERS, P.M (1986): The Accuracy of Measurement of Salinity, Oxygen and Temperature in the Deep Ocean. Journ. Phys. Oceanogr. 16, 1, 189-195,1986. SCHRÖDER, M., (1982): Das statische Verhalten von Einpunktverankerungen bei Anströmung. Ber. Inst. Meereskd. 108.
42

KIEL276 time series data from moored current meters, Madeira Abyssal Plain, 1980 - 2011
SIEDLER, G. (Koordinator), H. PETERS, D. SCHNACK, H. WEIKERT (1983): Forschungsschiff „METEOR“, Reise Nr. 64, Ostatlantik – Biozirkel, Ostatlantik – Warmwassersphäre, Januar – Mai 1983. Berichte der wissenschaftlichen Leiter, Inst. Meereskd. an der Univ. Kiel, 106 S. SIEDLER, G., H. SCHMICKLER, T.J. MÜLLER, H.-W. SCHENKE, W. ZENK (1987): Forschungsschiff "
METEOR", Reise Nr. 4, Berichte der wissenschaftlichen Leiter. Inst. f. Meereskunde Kiel, Nr. 173, 123 S. SIEDLER, G. UND PAUL, U. (1991) Barotropic and Baroclinic Tidal Currents in the Eastern Basins of the North Atlantic Journal of Geophysical Research, 96 (C12). pp. 22259-22271. DOI 10.1029/91JC02319 SIEDLER, G., L. ARMI, T.J. MÜLLER. (2005): Meddies and decadal changes at the Azores Front from 1980 to 2000. Deep-Sea Research II, 52 (3-4), 583-604. UNESCO (1983): Algorithms for computation of fundamental properties of seawater, UNESCO technical papers in marine science, 44, 1983. WANIEK J., W. KOEVE AND R. PRIEN (2000): Trajectories of sinking particles and the catchment areas above sediment traps in the northeast Atlantic, J. Marine Res., 58:6, p. 983-1006. WANIEK, J.J., SCHULZ-BULL, D.E., BLANZ, T., PRIEN, R., OSCHLIES, A., MÜLLER, T. (2005): Interannual variability of deep water particle flux in relation to production and lateral sources in the northeast Altantic. Deep-Sea Res. I, 52(1), pp. 33-50. WANIEK, J.J. (2011): RV MARIA S. MERIAN, Cruise Report MSM18/L1 Particle dynamics in the subtropical and tropical Northeast Atlantic 2011, 59 pp., DFG Senatskommission für Ozeanographie. ZENK, W. (1981): Dehnungsversuche an Polyamidseilen (11 mm “Meteor-Leine”). Techn. Ber., Inst. Meereskd., unpublished manuscript, 13 pp. ZENK, W. and T.J. MÜLLER (1988): Seven-year current meter record in the eastern North Atlantic. Deep-Sea Res., 35,(8), 1259-1268. ZENK W., T.J. MÜLLER, G. WEFER (1989): BARLAVENTO-Expedition, Reise Nr. 9, 29. Dez. 1988 - 17. März 1989. METEOR-Berichte, Universität Hamburg, 89-2, 238 S.
43

KIEL276 time series data from moored current meters, Madeira Abyssal Plain, 1980 - 2011
Glossary Institutions
BMBF: Bundesministerium für Forschung DFG: Deutsche Forschungsgemeinschaft IfM: Institut für Meereskunde, Kiel, Germany, until 2002 IFM-GEOMAR: Leibniz-Institut für Meereswissenschaften, Kiel, Germany, 2003 -
2011 GEOMAR Helmholtz-Zentrum für Ozeanforschung, Kiel, Germany, since 2012 NOCS: National Oceanography Centre, Southampton, UK
Mooring identifications
V26401 and V27601 through V27627: identification for a mooring; ‘V’ stands for the German word for ‘mooring’ (Verankerung); a 3-digit number identifies a mooring site; if a site is occupied several times, a 2-digit running number is attached. In the case of KIEL276, the second setting received a new number (V27601 instead V26402) which was kept against this rule. In texts, for easier reading sometimes, e.g. V27601, is replaced by V276-01.
K276 instead KIEL276 sometimes is used in graphics. KIEL276 numbers, 0, 1, 2, .... 27, sometimes are used in graphics or tables for
moorings V264-01, V276-01, V276-02,….V276-27, respectively. Instrumentation
RCM: Recording Current Meter, made by Aanderaa, Norway ADCP: Acoustic Doppler Profiler, made by RD Instruments, USA .
Physical measures
SPD: current speed/(cm/s) DIR: current direction/degree relative to North, counted clockwise from North UC, VC: current components, positive towards East and North T: temperature/°C; for CTD casts, the scale, IPTS68 or ITS90 is given in the cast
headers; for RCM measurements, accuracy is not sufficient to distinguish the scales P: pressure/dbar relative to the sea surface; S: practical salinity, IPSS78
44

KIEL276 time series data from moored current meters, Madeira Abyssal Plain, 1980 - 2011
45

KIEL276 time series data from moored current meters, Madeira Abyssal Plain, 1980 - 2011
46

KIEL276 time series data from moored current meters, Madeira Abyssal Plain, 1980 - 2011
47

KIEL276 time series data from moored current meters, Madeira Abyssal Plain, 1980 - 2011
48


KIEL276 time series data from moored current meters, Madeira Abyssal Plain, 1980 - 2011
KIEL276
KIEL276 Time Series Data
Madeira Abyssal Plain
33°N, 022°W, 5280 m water depth
March 1980 – April 2011
Appendix A01: Mooring Inventory KIEL276, NE Atlantic current meter moorings, 1980 to 2011, with particle traps since 1992; nominal location is 33.0° N, 022.0°W, Madeira Abyssal Plain (240 nm west of Madeira), nominal water depth is 5285 m Remark 1: All dates and locations after bridge logs. All water depths corrected for sound velocity(1). Remark 2: KPO is Kiel Physical Oceanography mooring ID, introduced in 2011and assigned also to earlier moorings Status: 23-OCT-2012
50

KIEL276 time series data from moored current meters, Madeira Abyssal Plain, 1980 - 2011
KIEL276 Mooring information
Code Navigation (bridge log) Launching Recovery
Traditional KPO Position Water Mag. Date Ship Bridge Deck CTD Date Ship
(bridge log) Depth(1) Dev. Cruise log(3) log(3) file Cruise
Latitude (m) °E (master) (scientist)
Longitude status status
V264-01 629 33° 06.1’ N 021° 50.9’ W
5280 not logged 31.03.1980 Meteor II M2T053-D
3 3 M2T53_D_180 (no Salinity)
17.10.1980 Meteor II M2T056-1
V276-01 630 33° 09.9’N 021° 50.9’W
5295 -14 MK4 files
17.10.1980 Meteor II M2T056/1
3 3 M2T056_1_005(no Salinity)
27.07.1981 Meteor II M2T057-1
V276-02 632 33° 04.75’N 021° 53.05’W
5290 -13 MK4 files
27.07.1981 Meteor II M2T057/1
hard to read, no copy
3 M2T057_1_542 02.03.1982 Meteor II M2T060-3
V276-03 633 33° 11.67’N 021° 53.88’W
5288 -12.3 05.03.1982 Meteor II M2T060/3
3 3 M2T060_3_4_072(XBT T7, 760 m)
17.04.1983 Meteor II M2T064/6
33° 10.6’N V276-04 635 021 55.0’W
5288 -12.3 19.04.1983 Meteor II M2T064/6
3 3 M2T064_6_7_001 19.10.1983 Poseidon POS104-c
V276-05 636 33° 10.8’N 021° 55.4’W
5285 -13.5 20.10.1983 Poseidon POS104-c
3 3 POS104_731 25.10.1984 Meteor II M2T69-5
V276-06 642 33° 09.5’N 021° 57.3’W
5290 (deck log)
-11.7 MK4 files
26.10.1984 Meteor II M2T69-5
3 3 M2T069_5_6_003 16.11.1985 Poseidon POS124
V276-07 658 33° 08.5’N 021° 57.6’W
5288 -11.7 MK4 files
17.11.1985 Poseidon POS124
3 3 POS124_049 31.10.1986 Meteor III MET004-2
V276-08 660 33° 06.7’N 021° 55.1’W
5276 -11.7 01.11.1986 Meteor III MET004-2
3 3 MET004_006 06.11.1987 Meteor III MET006
V276-09 666 33° 05.4’N 021° 52.5’W
5287 -12 06.11.1987 Meteor III MET006
3 3 MET006_005 14.01.1989 Meteor III MET009-2
V276-10 671 33° 06.4’N 021° 53.8’W
5281 (HS)
-12 (interp.)
14.01.1989 Meteor III MET009-2
3 3 MET009_050 27.10.1989 Meteor III MET011-2
51

KIEL276 time series data from moored current meters, Madeira Abyssal Plain, 1980 - 2011
KIEL276 Mooring information
Code Navigation (bridge log) Launching Recovery Traditional KPO Position Water Mag. Date Ship Bridge Deck CTD Date Ship
(bridge log) Depth(1) Dev. Cruise log(3) log(3) file Cruise Latitude (m) °E (master) (scientist) Longitude status status
V276-11 678 33° 06.2’N 021 54.3’W
5272 -11 (interp.)
27.10.1989 Meteor III MET011-2
3 3 MET011_2_003 25.09.1990 Meteor III MET014-1
V276-12 685 33° 08.95’N 021° 53.25’W
5335 (HS)
-11 25.09.1990 Meteor III MET014-1
3 3 MET014_1_005 27.01.1992 Poseidon POS189-1
V276-13 719 32° 55.30’N 022° 08.17’W
5279 -10.6 28.01.1992 Poseidon POS189-1
3 3 POS189_003 11.07.1993 Poseidon POS200-8
V276-14 & L1
739 32° 59.63’N 022° 00.10’W
5282 -11.7 01.07.1993 Poseidon POS200-8
3 3 POS200_8_009 17.09.1994 Poseidon POS202
V276-15 757 32° 57.41’N 022° 01.30’W
5277 -10.5 18.09.1994 Poseidon POS202
3 3 POS202_004 14.10.1995 Poseidon POS212/4
V276-16 775 33° 00.14’N 021° 57.85’W
5274 -10.3 15.10.1995 Poseidon POS212/4
3 3 POS212_098 24.06.1996 Meteor III MET036-2
V276-17 781 33°00.0’N 022° 00.0’W
5294 -10 28.06.1996 Meteor III MET036-2
3 3 MET036_2_003 06.08.1997 Poseidon POS231-3
V276-18 826 32° 59.5’N 021° 59.9’W
5277 -10 07.08.1997 Poseidon POS231-3
3 3 POS231_002 24.01.1999 Poseidon POS247-2
V276-19 855 32° 58.1’N 022° 00.5’W
5271 -9.5 25.01.1999 Poseidon POS247-2
3 3 POS247_007 13.04.2000 Poseidon POS259-1
V276-20 856 Mooring line broke during launch; lower part lost;not redeployed
14.04.2000 Poseidon POS259-1
0 3 POS259_015 14.04.2000 Poseidon POS259-1
V276-21 912 32° 55.5’N 022° 01.5’W
5272 -10 02.02.2001 Poseidon POS268
3 3 POS268_003 19.02.2002 Poseidon POS283-2
52

KIEL276 time series data from moored current meters, Madeira Abyssal Plain, 1980 - 2011
53
KIEL276 Mooring information Code Navigation (bridge log) Launching Recovery
Traditional KPO Position Water Mag. Date Ship Bridge Deck CTD Date Ship (bridge log) Depth(1) Dev. Cruise log(3) log(3) file Cruise Latitude (m) °E (master) (scientist) Longitude status status
V276-22 938 32° 52.10’N 022° 01.75’W
5275 -9 (interp.)
22.02.2002 Poseidon POS283-2
3 3 POS283_019 20.04.2003 Poseidon POS297
V276-23 957 32° 49.65’N 022° 00.20’W
5264 -7.3 22.04.2003 Poseidon POS297
3 3 POS297_013 16.03.2004 Poseidon POS308
V276-24 1083 32° 49.1’N 022° 00.0’W
5270 -9.0 17.03.2004 Poseidon POS308
3 3 POS308_012 06.05.2005 Poseidon POS321
V276-25 1084 33° 00.0’N 021° 59.9’W
5273 -8.6 08.05.2005 Poseidon POS321
3 3 POS321_007 10.04.2007 Poseidon POS349
V276-26 1085 33° 00.01’N 021° 59.98’W
5271 -9.5 17.04.2007 Poseidon POS349
3 3 POS349_005 27.04.2009 Poseidon POS383
V276-27 1086 32°57.55'N 021°59.55'W
5276 -9 (as 2007)
28.04.2009 Poseidon POS383
3 3 POS383_007 21.04.2011 Merian MSM018-1
V276-28 33°05.58'N 021°58.90'W
5244 24.04.2011 Merian MSM018-1
MSM018_1_004
Remarks (1) Water depth estimated from measured sounding depth assuming average 1500 m/s sound velocity plus 55 m local correction estimate from Matthew Tables and CTD cast 007 during Poseidon cruise POS321 in 2005. HS is HYDROSWEEP (multibeam) corrected depth on R/V METEOR. (2) Nominal depths are from static model results, using deployment & recovery log information (3) Log status index: (0) unknown; (1) GEOMAR buoy group, (2) with TJM; (3) scanned or other digital form

KIEL276 Time Series Data
Madeira Abyssal Plain
33°N, 022°W, 5280 m water depth
March 1980 – April 2011
Appendix A02: KIEL276 data information Remark: KPO is Kiel Physical Oceanography mooring ID, introduced in 2011and assigned also to earlier moorings
Status: 23-OCT-2012
KIEL276 data information
Mooring Code
Current meters(1) RCM4/5/7/8/9/11 Traps
Traditional KPO start/stop /proc logs(2)
raw data from tape/DSU
processed data
available
V264-01 629 3 Lost at sampling interval
none
V276-01 630 3 partly lost
Lost at sampling interval
none
V276-02 632 3 Lost at sampling interval none
V276-03 633 3 Lost at sampling interval
none
V276-04 635 3 Lost at sampling interval
none
V276-05 636 3 Lost at sampling interval
none
V276-06 642 3 Lost at sampling interval
none
V276-07 658 3 Lost at sampling interval
none
V276-08 660 3 Lost at sampling interval
none
V276-09 666 3 Lost at sampling interval
none
V276-10 671 3 Y at sampling interval
none
V276-11 678 3 Y at sampling interval
none
V276-12 685 3 Y at sampling interval
none
V276-13 719 3 Lost daily averages none
V276-14 & L1
739 3 Lost daily averages traps moored
separately

KIEL276 time series data from moored current meters, Madeira Abyssal Plain, 1980 - 2011
KIEL276 data information
Mooring Code
Current meters(1) RCM4/5/7/8/9/11 Traps
Traditional KPO start/stop /proc logs(2)
raw data from tape/DSU
processed data
available
V276-15 757 3 Y at sampling interval
4 traps
V276-16 775 3 Y at sampling interval
4 traps
V276-17 781 3 start only
Y at sampling interval
3 traps
V276-18 826 3 Y at sampling interval
none
V276-19 855 3 Y at sampling interval
2 traps
V276-20 856
no data from V276-20, April 2000 to February 2001 V276-21 912 3 Y at sampling
interval 1x2 traps
1 trap
V276-22 938 3 Y at sampling interval
1x2 traps 1 trap
V276-23 957 3 Y at sampling interval
1x2 traps 1 trap
V276-24 1083 3 Y at sampling interval
2 traps
V276-25 1084 3 start only
Y at sampling interval
2 traps
V276-26 1085 not logged
Y at sampling interval
2 traps
V276-27 1086 not logged
Y at sampling interval
2 traps
1) ADCP: solely V276-21 had an upward looking 150 kHz ADCP on the top buoy; data not processed, but set-up & raw data available (2) Log status index: (0) unknown; (1) GEOMAR buoy group, (2) with TJM; (3) scanned or other digital form
55

KIEL276 time series data from moored current meters, Madeira Abyssal Plain, 1980 - 2011
KIEL276 Time Series Data
Madeira Abyssal Plain
33°N, 022°W, 5280 m water depth
March 1980 – April 2011
Appendix A03: KIEL276 mooring cruise reports Table A03: KIEL276 deployment cruise reports; internal reports are available through the GEOMAR data centre; public reports are available at the publishing institution and/or on-line at GEOMAR’s library (www.geomar.de ) or at the Senatskommssion für Ozeanographie der Deutschen Forschungsgemeinschaft (SkfOz, http://www.dfg-ozean.de; PS is the cruise’s Principal Scientist.
KIEL276 deployment cruise reports
No Mooring Deployment cruise Public report
ID Ship ID PS
Internal report at
GEOMAR data centre Reference on-line at
0 V264-01 Meteor II M2T053-D Werner M2T53_C_D_report.pdf
1 V276-01 Meteor II M2T056-1 Seiler M2T56_1_report.pdf
2 V276-02 Meteor II M2T057-1 Zenk M2T57_1_report.pdf
3 V276-03 Meteor II M2T060-3 Siedler M2T60_3_report.pdf
4 V276-04 Meteor II M2T064/6 Siedler Siedler et al. (1983) GEOMAR
5 V276-05 Poseidon POS104-c Zenk POS104_C_D_report.pdf
6 V276-06 Meteor II M2T69-5 Zenk M2T69_5_report.pdf Meincke et al. (1985)
7 V276-07 Poseidon POS124 Müller POS124_report.pdf GEOMAR
8 V276-08 Meteor III MET004-2 Müller MET04_report.pdf Siedler et al. (1987) SKfOz
9 V276-09 Meteor III MET006 Siedler MET06_1_report.pdf Müller et al. (1988) SKfOz
10 V276-10 Meteor III MET009-2 Müller MET09_2_3_report.pdf Zenk et al. (1989) SKfOz
11 V276-11 Meteor III MET011-2 Müller MET11_2_report.pdf Roether et al. (1990) SKfOz
12 V276-12 Meteor III MET014-1 Hasse MET14_1_report.pdf Hinz et al. (1991) SKfOz
13 V276-13 Poseidon POS189-1 Müller POS189_1_report.pdf
14 V276-14 Poseidon POS200-8 Müller POS200_8_report.pdf
15 V276-15 Poseidon POS202 Müller POS202_report.pdf Knoll et al. (1998) GEOMAR
16 V276-16 Poseidon POS212-4 Müller POS212_report.pdf Knoll et al. (1998) GEOMAR
17 V276-17 Meteor III MET036-2 Kremling Mienert et al. (1998) SKfOz
18 V276-18 Poseidon POS231-3 Waniek POS231_3_report.pdf
19 V276-19 Poseidon POS247-2 Müller POS247_2_report.pdf
20 V276-20 Poseidon POS259-1 Müller POS259_1_report.pdf
21 V276-21 Poseidon POS268 Schulz-Bull lost
22 V276-22 Poseidon POS283-2 Schuz-Bull POS283_report.pdf
23 V276-23 Poseidon POS297 Blanz POS297_report.pdf
24 V276-24 Poseidon POS308 Schiebel POS308_report.pdf
25 V276-25 Poseidon POS321 Müller POS321_report.pdf
26 V276-26 Poseidon POS349 Waniek POS349_report.pdf
27 V276-27 Poseidon POS383 Waniek POS383_report.pdf.
28 V276-28 Merian MSM018-1 Waniek Waniek (2011) SKfOz
56

KIEL276 time series data from moored current meters, Madeira Abyssal Plain, 1980 - 2011
57

KIEL276 time series data from moored current meters, Madeira Abyssal Plain, 1980 - 2011
KIEL276 Time Series Data Madeira Abyssal Plain
33°N, 022°W, 5280 m water depth
March 1980 – April 2011
Appendix A04: RCM Instrument depths Tab. A04.1: RCM best depth estimates result (see section 2.4 for method). Normalization factors used were the pressure approximate maximum range, p_norm= 6000 dbar and the low temperature half range, t_norm=12 °C. For a second run, residuals P-PRCM and T-TRCM between pre-deployment CTD cast and first 25 h RCM records larger 50 dbar and 0.45°C, respectively, were flagged 1 and not used in a second run. Note, residuals after the second run maybe smaller. Dummies are -9999. KIEL276 RCM depth info; all depths rounded and in m RCM_z : corrected (best) depth estimate for RCM RCM_ID : instrument identification within mooring (from top) Nom_z : nominal depths as from design & deployment log C_z : depth correction applied (relative to surface) C_off : offset/m correction applied to (nominal) bottom distance of RCM C_str : stretch factor coefficient applied to (nominal) bottom distance of RCM P, T : best pressure estimate for RCM; CTD pre deployment cast temperatuere at P PRCM : RCM first 25 h median pressure TRCM : RCM first 25 h median temperature measurement P_flag =1 if PRCM is not used for RCM best depth estimate (spike or deep sea) T_flag =1 if TRCM is not used for RCM best depth estimate (spike or deep sea) Z_S_F : instrument depths as in Siedler et al. (2005, V27601 to V27619) and Fründt et al. (2013, V27621 to V27626) RCM_z RCM_ID S/N Nom_z C_z C_off C_str P-PRCM P_flag T-TRCM T_flag z_S_F v26401 24 2640101 1407 266 -242 244 1.000 -9.3 0 0.026 0 -9999 128 2640102 2025 370 -242 244 1.000 -9999 0 -0.064 0 124 381 2640103 1409 623 -242 244 1.000 -9999 0 -0.231 0 376 636 2640104 4030 877 -241 244 1.000 31.8 0 -0.060 0 627 942 2640105 4570 1183 -241 244 1.000 -9999 0 0.044 0 926 3025 2640107 4563 3156 -131 0 1.061 -9999 1 0.167 1 2966 4812 2640108 4564 4839 -27 0 1.061 -9999 1 0.179 1 4770 v27601 190 2760103 2104 320 -130 132 1.000 -11.8 0 0.049 0 195 495 2760105 2105 625 -130 132 1.000 -9999 0 0.191 0 499 702 2760108 3827 832 -130 132 1.000 -66.1 1 0.293 0 697 1004 2760109 2320 1134 -130 132 1.000 -9999 0 0.426 0 995 1107 2760110 1626 1237 -130 132 1.000 -9999 0 0.150 0 1095 1611 2760111 2712 1740 -129 0 1.036 -9999 0 0.173 0 1591 v27602 255 2760201 1409 260 -5 5 1.000 9.5 0 0.004 0 243 560 2760203 2527 565 -5 5 1.000 -9999 0 1.382 1 550 766 2760205 2528 771 -5 5 1.000 1.8 0 -0.023 0 748 1170 2760206 673 1175 -5 5 1.000 -9999 0 0.184 0 1149 3034 2760208 4562 3037 -3 0 1.001 -9999 1 -9999 1 3020 v27603 210 2760301 94 199 11 -11 1.000 17.2 0 -0.048 0 194 446 2760303 1484 435 11 -11 1.000 -9999 0 -0.012 0 428 651 2760304 1485 639 12 -11 1.000 -9999 0 -0.176 0 629 1057 2760305 131 1045 12 -11 1.000 -9999 0 -9999 0 1032 1564 2760306 2317 1552 12 0 0.997 -9999 0 -9999 0 1535 v27604 239 2760402 776 361 -122 123 1.000 -13.6 0 0.008 0 243 473 2760404 1407 595 -122 123 1.000 -9999 0 0.227 0 475 677 2760405 1409 798 -121 123 1.000 -9999 0 -0.074 0 675 1081 2760406 2025 1202 -121 123 1.000 -9999 0 -0.158 0 1075 1587 2760408 4352 1708 -121 0 1.034 -9999 0 0.159 0 1575 3013 2760409 4565 3087 -74 0 1.034 -9999 1 0.074 1 2980 5237 2760410 5327 5239 -2 0 1.034 -9999 1 -9999 1 5185
58

KIEL276 time series data from moored current meters, Madeira Abyssal Plain, 1980 - 2011
RCM_z RCM_ID S/N Nom_z Corr_z Corr_off Corr_str P-PRCM P_flag T-TRCM T_flag z_S_F v27605 332 2760502 776 364 -32 32 1.000 -0.6 0 0.006 0 327 566 2760504 6051 598 -32 32 1.000 -9999 0 -0.020 0 560 770 2760505 5882 801 -31 32 1.000 -9999 0 -0.044 0 760 1176 2760506 6682 1207 -31 32 1.000 -9999 0 0.280 0 1160 1679 2760508 6161 1710 -31 0 1.009 -9999 0 0.298 0 1660 3068 2760509 5881 3087 -19 0 1.009 -9999 1 -9999 1 3050 5236 2760510 6160 5236 0 0 1.009 -9999 1 -9999 1 5340 v27606 332 2760602 673 409 -77 77 1.000 -0.3 0 0.013 0 327 566 2760603 2528 642 -76 77 1.000 -9999 0 0.067 0 562 769 2760604 7330 845 -76 77 1.000 -9999 0 -0.494 1 764 1177 2760607 7343 1253 -76 77 1.000 -9999 0 0.003 0 1168 1680 2760608 6681 1756 -76 0 1.021 -9999 0 0.178 0 1670 3092 2760609 6678 3138 -46 0 1.021 -9999 1 0.061 1 3080 5241 2760610 6160 5242 -1 0 1.021 -9999 1 -9999 1 -9999 v27607 322 2760701 6158 402 -80 80 1.000 -9999 0 -9999 0 300 557 2760702 7656 636 -79 80 1.000 -9999 0 0.218 0 534 761 2760703 7927 840 -79 80 1.000 -9999 0 0.045 0 736 1065 2760705 7654 1144 -79 80 1.000 -9999 0 -0.355 0 1040 1168 2760706 7928 1247 -79 80 1.000 -9999 0 -9999 1 1142 1672 2760707 7929 1751 -79 0 1.022 -9999 0 -0.048 0 1644 3085 2760708 4565 3133 -48 0 1.022 -9999 1 0.863 1 3047 5237 2760709 6161 5238 -1 0 1.022 -9999 1 -9999 1 5235 v27608 332 2760801 6679 352 -20 20 1.000 -9999 0 -0.256 0 330 565 2760802 131 585 -20 20 1.000 -9999 0 0.195 0 560 770 2760803 7330 789 -19 20 1.000 -9999 0 -0.210 0 760 1074 2760805 4354 1093 -19 20 1.000 -9999 0 0.042 0 1060 1177 2760806 4564 1196 -19 20 1.000 -9999 0 0.083 0 1160 1680 2760807 5881 1699 -19 0 1.005 -9999 0 0.098 0 1670 3070 2760808 6121 3082 -12 0 1.005 -9999 1 0.026 1 3070 5231 2760809 4563 5231 0 0 1.005 -9999 1 -9999 1 -9999 v27609a 441 2760902 7924 516 -75 75 1.000 -9999 0 -0.173 0 450 645 2760903 7624 719 -74 75 1.000 -9999 0 0.025 0 650 950 2760905 5252 1024 -74 75 1.000 -9999 0 0.089 0 950 1051 2760906 2317 1125 -74 75 1.000 -9999 0 0.119 0 1050 1555 2760907 6159 1629 -74 0 1.020 -9999 0 -0.069 0 1550 2966 2760908 7656 3012 -46 0 1.020 -9999 1 0.022 1 3000 5239 2760909 6160 5240 -1 0 1.020 -9999 1 -9999 1 -9999 v27609b 633 2760902 7924 773 -140 142 1.000 -9999 0 0.044 0 650 837 2760903 7624 977 -140 142 1.000 -9999 0 -0.036 0 850 1141 2760905 5252 1281 -140 142 1.000 -9999 0 -9999 0 1150 1244 2760906 2317 1384 -140 142 1.000 -9999 0 0.136 0 1250 1747 2760907 6159 1887 -140 0 1.041 -9999 0 -0.159 0 1750 3084 2760908 7656 3171 -87 0 1.041 -9999 1 -9999 1 3050 5238 2760909 6160 5240 -2 0 1.041 -9999 1 -9999 1 -9999 v27610 379 2761001 8412 391 -12 12 1.000 15.9 0 -0.043 0 367 612 2761002 2528 624 -12 12 1.000 4.1 0 0.010 0 595 815 2761003 7343 827 -12 12 1.000 -9999 0 0.154 0 800 1120 2761005 7928 1132 -12 12 1.000 -9999 0 -9999 0 1100 1222 2761006 8295 1234 -12 12 1.000 -9999 0 0.206 0 1200 1726 2761007 7927 1738 -12 0 1.003 -9999 0 0.117 0 1700 3116 2761008 4570 3123 -7 0 1.003 -9999 1 0.109 1 3050 5231 2761009 9310 5231 0 0 1.003 -9999 1 -9999 1 5185 v27611 328 2761101 9726 394 -66 66 1.000 4.1 0 -0.039 0 320 562 2761102 7330 627 -65 66 1.000 13.8 0 0.011 0 555 765 2761103 6051 830 -65 66 1.000 -9999 0 0.213 0 755 1070 2761105 7924 1135 -65 66 1.000 -9999 0 0.055 0 1055 1173 2761106 9727 1238 -65 66 1.000 -9999 0 0.206 0 1155 1676 2761107 7925 1741 -65 0 1.018 -9999 0 -0.256 0 1655
59

KIEL276 time series data from moored current meters, Madeira Abyssal Plain, 1980 - 2011
RCM_z RCM_ID S/N Nom_z Corr_z Corr_off Corr_str P-PRCM P_flag T-TRCM T_flag z_S_F 3086 2761108 6160 3126 -40 0 1.018 -9999 1 0.020 1 3045 5266 2761109 9728 5267 -1 0 1.018 -9999 1 -9999 1 5190 v27612 199 2761201 9313 294 -95 95 1.000 -9999 0 -0.033 0 215 433 2761202 2528 527 -94 95 1.000 -22.6 0 0.078 0 455 636 2761203 7343 730 -94 95 1.000 -9999 0 0.104 0 645 941 2761205 6681 1035 -94 95 1.000 -9999 0 -0.369 0 -9999 1044 2761206 9323 1138 -94 95 1.000 -17.5 0 -0.001 0 1065 1547 2761207 7927 1641 -94 0 1.025 -9999 0 0.408 0 1565 2967 2761208 4570 3025 -58 0 1.025 -9999 1 0.122 1 3000 v27613 285 2761301 131 294 -9 9 1.000 10.0 0 -0.035 0 270 1026 2761305 7928 1035 -9 9 1.000 -9999 0 -0.224 0 1000 1129 2761306 9311 1138 -9 9 1.000 -9999 0 -0.168 0 1100 3019 2761308 2317 3025 -6 0 1.003 -9999 1 0.024 1 3000 5229 2761309 9345 5229 0 0 1.003 -9999 1 -9999 1 5185 v27614 713 2761403 10659 795 -82 83 1.000 -9999 0 0.228 0 750 1018 2761405 9820 1100 -82 83 1.000 -9999 0 -0.064 0 1050 1121 2761406 9727 1203 -82 83 1.000 -9999 0 -0.084 0 1150 1624 2761407 10662 1706 -82 0 1.023 -9999 0 -0.068 0 1650 3037 2761408 10660 3087 -50 0 1.023 -9999 1 -0.002 1 3050 v27615 217 2761501 9813 270 -53 53 1.000 27.9 0 -0.034 0 240 457 2761503 9816 510 -53 53 1.000 25.1 0 -0.068 0 470 663 2761504 9833 715 -52 53 1.000 -9999 0 -0.115 0 670 969 2761506 9821 1021 -52 53 1.000 -9999 0 0.120 0 970 1075 2761508 10658 1127 -52 53 1.000 -67.9 1 -0.091 0 1120 3002 2761511 9344 3034 -32 0 1.014 -9999 1 0.010 1 3030 5226 2761513 9312 5227 -1 0 1.014 -9999 1 -9999 1 5320 v27616 249 2761601 10501 265 -16 16 1.000 -27.0 0 -0.051 0 270 489 2761603 9726 505 -16 16 1.000 0.6 0 0.083 0 500 996 2761604 10659 1012 -16 16 1.000 -9999 0 -0.070 0 1000 1603 2761604 10504 1619 -16 0 1.004 -9999 0 0.200 0 1600 3012 2761607 11576 3022 -10 0 1.004 -9999 1 0.008 1 3000 5213 2761709 10502 5213 0 0 1.004 -9999 1 -9999 1 5185 v27617 269 2761701 11348 318 -49 50 1.000 32.9 0 -0.071 0 270 510 2761703 11442 559 -49 50 1.000 -9999 0 -0.038 0 500 1019 2761705 9833 1068 -49 50 1.000 -9999 0 -0.564 1 1000 1624 2761706 9821 1673 -49 0 1.013 -9999 0 -0.110 0 1600 3045 2761708 9345 3075 -30 0 1.013 -9999 1 0.013 1 3000 5232 2761709 9312 5233 -1 0 1.013 -9999 1 -9999 1 5185 v27618 281 2761801 10501 393 -112 113 1.000 24.3 0 -0.126 0 270 1020 2761803 10578 1132 -112 113 1.000 15.9 0 0.054 0 1000 1625 2761804 10577 1736 -111 0 1.031 72.4 1 0.179 0 1600 3052 2761805 11576 3120 -68 0 1.031 -9999 1 0.019 1 3000 5225 2761806 10502 5227 -2 0 1.031 -9999 1 -9999 1 5185 v27619 281 2761901 10551 303 -22 22 1.000 28.0 0 -0.144 0 270 516 2761902 10577 538 -22 22 1.000 -9999 0 0.128 0 500 1020 2761903 10578 1042 -22 22 1.000 48.5 0 0.002 0 1000 1624 2761904 10550 1646 -22 22 1.000 -9999 0 0.853 1 1600 3025 2761906 10555 3040 -15 0 1.007 -9999 1 0.041 1 3000 v27621 263 2762102 10554 279 -16 16 1.000 6.6 0 0.006 0 270 498 2762103 10577 514 -16 16 1.000 -9999 0 0.051 0 500 999 2762104 10578 1014 -15 0 1.003 -9999 0 -0.135 0 -9999 1608 2762105 10550 1621 -13 0 1.003 -9999 0 0.495 1 -9999 3016 2762107 10555 3024 -8 0 1.003 -9999 1 0.078 1 -9999 5222 2762109 10581 5222 0 0 1.003 -9999 1 0.092 1 -9999 v27622 223 2762202 10554 281 -58 58 1.000 22.0 0 -0.032 0 270 458 2762203 10577 516 -58 58 1.000 -9999 0 -0.177 0 500
60

KIEL276 time series data from moored current meters, Madeira Abyssal Plain, 1980 - 2011
RCM_z RCM_ID S/N Nom_z Corr_z Corr_off Corr_str P-PRCM P_flag T-TRCM T_flag z_S_F 930 2762204 10578 984 -54 0 1.013 -9999 0 0.373 0 -9999 1548 2762205 10550 1594 -46 0 1.013 -9999 0 1.419 1 -9999 2992 2762207 10555 3020 -28 0 1.013 -9999 1 0.049 1 -9999 5223 2762209 10558 5224 -1 0 1.013 -26.4 1 0.010 1 -9999 v27623 243 2762301 10554 244 -1 1 1.000 29.7 0 -0.062 0 270 979 2762303 10578 980 -1 0 1.000 -9999 0 -0.210 0 -9999 1588 2762304 10550 1589 -1 0 1.000 -9999 0 0.075 0 -9999 3013 2762306 10555 3013 0 0 1.000 -9999 1 0.026 1 -9999 5214 2762308 10558 5214 0 0 1.000 -54.6 1 -9999 1 -9999 v27624 229 2762401 10554 227 2 -2 1.000 40.3 0 -0.100 0 217 534 2762402 10581 532 2 -2 1.000 -9999 0 -0.375 0 523 1049 2762403 10578 1047 2 -2 1.000 -9999 0 -9999 0 -9999 1600 2762404 10558 1598 2 0 0.999 30.5 0 -9999 0 -9999 2996 2762406 10555 2995 1 0 0.999 -9999 1 -9999 1 -9999 5220 2762408 10550 5220 0 0 0.999 -9999 1 -9999 1 -9999 v27625 162 2762501 10554 220 -58 59 1.000 15.4 0 -0.129 0 194 983 2762503 8411 1041 -58 0 1.014 57.4 1 -0.057 0 -9999 1542 2762504 10558 1592 -50 0 1.014 39.0 0 -0.001 0 -9999 2957 2762506 10555 2988 -31 0 1.014 -9999 1 0.033 1 -9999 5211 2762508 9812 5212 -1 0 1.014 -9999 1 0.002 1 -9999 v27626 130 2762601 10554 212 -82 83 1.000 -4.3 0 0.011 0 201 385 2762602 10558 467 -82 83 1.000 129.9 1 0.052 0 456 943 2762603 8411 1024 -81 83 1.000 34.7 1 0.191 0 -9999 1506 2762604 9344 1577 -71 0 1.019 -9999 0 0.003 0 -9999 2933 2762606 10555 2977 -44 0 1.019 -9999 1 0.044 1 -9999 v27627 168 2762701 9349 216 -48 49 1.000 39.7 1 0.138 0 -9999 474 2762702 5881 522 -48 49 1.000 -9999 0 -0.263 0 -9999 989 2762703 4562 1037 -48 0 1.011 -9999 0 0.129 0 -9999 1546 2762704 9932 1588 -42 0 1.011 45.8 1 -0.013 0 -9999 2958 2762706 9832 2984 -26 0 1.011 -9999 1 -0.034 1 -9999 5209 2762708 10578 5210 -1 0 1.011 -9999 1 -9999 1 -9999
A-priori corrections of instrument depths Z_S_F according to Siedler et al. (2005):
V26401, 2640108: 4770 from 4707 (typo in Siedler et al., 2005)) V27615, 2761513: 5230 corrected from 5275 (water depth)
61

KIEL276 time series data from moored current meters, Madeira Abyssal Plain, 1980 - 2011
KIEL276 Time Series Data
Madeira Abyssal Plain
33°N, 022°W, 5280 m water depth
March 1980 – April 2011
Appendix A05: RCM processing, archiving &data submission Raw data:
sampling on magnetic tape (RCM4/5) or data storage units (RCM7/8) as 10- bit integers valued from 0 to 1023
mirrored to computer ASCII files for further processing using reading units. Processed data
create and up-date meta file in ASCII with general information on mooring: V276ii.txt, where ii denotes K276 mooring number
transfer raw data to physical units using calibrations as provided either by the manufacturer or by the institute or by an instrument’s log
compare and adapt instrument start and stop times to external times by linear interpolation
apply running median filter over typical 9 records allowing for deviations from the median of 5 dbar, 0.05 K, 5 cm/s.
edit any suspicious data like remaining spikes and early sensor malfunctions like stops (rotor)
include meta information to files: o deployment & recovery dates, times, cruises o mooring position, water depth, earth’s local magnetic anomaly at deployment
time o record start & stop date / time, recording interval o sensors & and their calibrations and physical units o instrument’s best depth estimate from logs, static mooring model and first
day’s data statistics against deployment CTD cast; keep nominal depth as from logs and static mooring model in comment line
store / copy results as ASCII files *.dat and MATLAB file *.mat by mooring and instrument in files under /pre1/, /pre2/ and /final/ level subdirectories.
Data archiving & submission
archive data and any relevant meta information at the GEOMAR data centre [email protected]
submit best estimate data and meta data to international data centres for free use in basic science
o World Data System’s centre PANGAEA, www.pangaea.de o Ocean Sites’ data centre at CORIOLIS, www.oceansites.org
62

KIEL276 time series data from moored current meters, Madeira Abyssal Plain, 1980 - 2011
63

KIEL276 time series data from moored current meters, Madeira Abyssal Plain, 1980 - 2011
KIEL276 Time Series Data
Madeira Abyssal Plain
33°N, 022°W, 5280 m water depth
March 1980 – April 2011
Appendix A06: KIEL276 meta data and data presentation The following presentations for each by moorings shows on 5 pages:
General information on: o Mooring ID o Dates and cruises of deployment & recovery; o Mooring location, water depth, earth’s local magnetic anomaly at deployment
time o Project and Principal Investigator (PI) o Depths used in this part and in mooring sketch o Remarks on mooring o Remarks on data
Mooring sketch o all components and depths nominal as from logs and static mooring model
Instrument and sensor information o Nominal depths as from logs and static mooring model o Serial numbers o File Identification o Sampling rate o Sensor quality
Low pass (49 h filter length, 36 h half power response) daily averages o Time series plots of
Pressure Upper ocean and deep ocean temperature Current vector
o Statistics
64

KIEL276 time series data from moored current meters, Madeira Abyssal Plain, 1980 - 2011
65

KIEL276 Time Series Data from Moored Current Meters, V264-01
KIEL276 Time Series Data
Madeira Abyssal Plain
33°N, 022°W, 5280 m water depth
V264-01
31-MAR-1980 - 17-OCT-1980
Mooring information ******************* General Mooring ID : V264-01/KPO 0629 Deployed : Date: 31-MAR-1980 Ship / Cruise: Meteor II, M53/D Recovered : Date: 17-OCT-1980 Ship / Cruise: Meteor II, M56/1 Latitude N : 33.102 Longitude E : -021.848 Water depth : 5280 m (sounding 5225 m at 1500 m/s + 55 m correction) Magn. Anom. : -14 (as Oct 1980 for V27601); MK4 files were not corrected for. PI : T.J. Mueller Data origin : IfM Kiel Depths : nominal as of logs and IMP static model Remarks --------------- Mooring: Immediately after deployment, the top of the mooring surfaced, with the radio transmitter on the top buoy in air. As the mooring could not be sighted, it was released. The radio transmitter became clearer, the mooring was sighted and recovery started from the bottom part until RCM5 04563 (3000 m designed depth). It was re-deployed the same day with 155 m less nylon rope according to the deck log (145 m according to the master's log). The stretch for the nylon part is estimated in the model from buoyancy forces and averages to 9.66% of (un-stretched) length. Instrumental nominal depths as modelled from logged mooring components (deck log with 155 m less nylon for the 2nd deployment) and (corrected) water depth, disagree with two pressure records of ca. 24 dbar at 228 m nominal depth and 633 dbar at 839 m nominal depth. The difference is 204 m for the upper and 211 m for the other instrument with only steel components between both. With all components as logged, a strecth of 15.34% for the nylon part is needed to match pressure and temperature records in the upper ocean, much too high or an extra nylon length of ca 175 m (unstretched) would be needed. It was reported after recovery (see Schröder, 1982, p. 50), that length the meter that was used to determine rope lengths before deployment showed slip, which may explain the observed too large lengths. As also the two deep ocean temperature records are too low by more than 0.15 K as compared to the CTD they give no hint where to implement such an extra (not logged) length. Therefore, an extra stretch of 6.1% was accepted and distributed equally over all long nylon lengths to match the RCM upper ocean records (see Müller & Waniek, 2013, sec. 2.4). Data: Raw data are lost. Data sources are MK4 ASCII files with pre1-level processed data at sampling rate with 'Magnetic Anomaly as in mooring V184' (position as KIEL276) noted a handwritten processing log. However, from instrument v264102, three handwritten raw data with calculated DIR are available for a check of the calibration formula for the direction measurement. Comparison with MK4 files shows that direction is indeed not compensated for magnetic anomaly in 264102. Comparision of directions of all records at sampling rate, shows high vertical directional coherence top to bottom between day 150 and 200 during a strong current event. It is therefore concluded that in all MK4 files direction is not yet corrected for magnetic anomaly (which is supported by some inconsistent comment lines throughout these files concerning rotation of the coordinate system). Taking -14° as local magnetic anomaly from October 1980 (V276-01), correction of +14° was applied to the input from MK4 files when transferring data to PH3. Compiled by: T.J. Mueller Date: 08-FEB-2013

KIEL276 Time Series Data from Moored Current Meters, V264-01
V264-01: Mooring sketch with nominal depths as from logs and mooring model (see sec. 2.4).

KIEL276 Time Series Data from Moored Current Meters, V264-01
Instruments All depths are nominal as from logs and mooring model (see sec. 2.4.) Depth Moor_ID Type S/N Sampling Sensor Remarks ------------------------------------------------------------------------- 266 2640101 RCM4 01407 3600 s strong bio-fouling, vane broken REF T_LR ok, after record 3200 partly out of range (T > 21.47 °C) PRES ok, median 34 dbar, minimum 24 dbar DIR no data SPD no data 370 2640102 RCM4 02025 3600 s REF T_LR ok COND ok DIR ok SPD ok 623 2640103 RCM4 01409 3600 s REF T_LR ok COND ok DIR ok SPD ok 877 2640104 RCM4 04030 3600 s REF T_LR ok COND ok PRES ok, median 633 dbar, minimum 613 dabr DIR ok SPD ok 1183 2640105 RCM4 04570 3600 s REF T_LR ok COND ok DIR ok SPD ok 1752 2640106 RCM5 04029 3600 s no data 3156 2640107 RCM5 04563 3600 s REF T_LR ok DIR ok SPD ok 4839 2640108 RCM5 04564 3600 s REF T_LR ok DIR ok SPD rotor stuck after 90 d, ok else

KIEL276 Time Series Data from Moored Current Meters, V264-01
V264-01: Pressure and temperature (upper panel)and vector time series (lower) of low pass filtered daily averages; instrument depths are best estimates (see sec. 4).

KIEL276 Time Series Data from Moored Current Meters, V264-01
Mooring V264-01: statistics from low pass filtered daily averages
v26401 Depth Days Mean Mean Time Scale Fluxes Stand.-Dev. its Momentum Temperature -------------- ----------------- ---------- -------- ----------- SPD DIR STAB U V T u v t <uv> <dm> <ut> <vt> 24 138 NaN NaN NaN NaN NaN 19.4 NaN NaN NaN NaN NaN NaN NaN NaN NaN 1.1 128 197 9.5 212 0.72 -5.0 -8.0 17.1 13 17 28 34 38 -0.4 0.3 6.7 7.9 0.7 381 197 6.7 209 0.80 -3.2 -5.9 13.3 14 17 31 14 34 -0.2 -0.1 3.8 5.1 0.4 636 197 5.0 212 0.78 -2.7 -4.2 11.0 14 18 28 9 40 0.1 0.2 3.2 3.7 0.2 942 197 3.4 186 0.75 -0.3 -3.4 9.1 11 17 19 2 13 0.1 0.1 1.4 3.3 0.3 3025 197 2.0 167 0.69 0.4 -1.9 2.8 17 16 31 -2 -38 -0.0 0.0 1.5 1.8 0.0 4812 197 2.1 144 0.75 1.2 -1.7 2.4 12 14 20 -1 -30 0.0 0.0 1.5 1.9 0.0 Legend: Depth : best estimate of instrument depth as from logs, mooring model and measured data Days : length of record SPD, DIR: mean speed/(cm/s) and direction s : directional stability of flow (mean vector speed / mean scalar speed) U, V : mean East and North component of flow, cm/s T : mean temperature its : integral time scale (first zero crossing of autocorrelation function) u, v, t :deviations from average <uv>d : momentum flux <md> : direction of momentum flux

KIEL276 Time Series Data from Moored Current Meters, V264-01

KIEL276 Time Series Data from Moored Current Meters, V276-01
KIEL276 Time Series Data
Madeira Abyssal Plain
33°N, 022°W, 5280 m water depth
V276-01
17-OCT-1980 - 27-JUL-1981
Mooring information ******************* General Mooring information ******************* General ------- Mooring ID : V276-01/KPO 630 Deployed : Date: 17-OCT-1980 Ship / Cruise: Meteor II, M56/1 Recovered : Date: 27-JUL-1981 Ship / Cruise: Meteor II, M57/1 Latitude N : 33.165 Longitude E : -021.848 Water depth : 5292 m (corrected) Magn. Anom. : -14 (according to MK4 files) Project : KIEL276 time series station PI : T.J. Mueller Data origin :IfM Kiel Depths : nominal as of logs and IMP static model Remarks 1) Mooring Release failed during recovery trial on 27-JUL-1981 during Meteor II, cruise M57/1. Uppermost part recovered with steel buoy imploded and uppermost RCM damaged. Middle part with 8 instruments from 200 m designed depth down to 1100 m dredged and recovered the same day. Lower part with RCM 2712 at 1600 m with data until December 1981 dredged in March 1982 (MT2, M60/3); this later part of data (part B) is double to those from the follow-up mooring V276-02. Three Instruments at larger depths (3000 m, 4700 m, 5250 m) and the release are lost. As the two pressure records both show no sudden increase and also less depth than designed or nominal, it is most likely that the steel buoy imploded during the first dredging exercise. Recovery deck log is missing; only recovery information from reports of cruises Meteor II, M57/1 and Meteor II, M60/3. All depths are nominal as from logs and static mooring model. 2) Data Raw data and data at sampling rate are lost. Data sources are MK4 ASCII files at sampling rate and pre1-level processed data. RCM data, both at pre1-level and pre2-level processed and at sampling rates in V27601_iii.dat. Compiled by: T.J. Mueller Date: 27-FEB-2012

KIEL276 Time Series Data from Moored Current Meters, V276-01
V276-01: Mooring sketch with nominal depths as from logs and mooring model (see sec. 2.4).

KIEL276 Time Series Data from Moored Current Meters, V276-01
Instruments All depths are nominal as from logs and mooring model (see sec. 2.4.) Depth Moor_ID Type S/N Sampling Sensor Remarks ----------------------------------------------------------------------------- 215 2760101 RCM4 01627 3600 s lost due to implosion of steel buoy 319 2760102 DLI 61 3600 s inclinometer, data lost 320 2760103 RCM4 02104 3600 s REF T_LR ok COND ok PRES ok, [med max min]=[197 194 210] dbar DIR ok SPD ok 322 2760104 TK50 181&174 7200 s recorder with 11 thermistors equally distributed 50 m downwards REF 11xT_LR ok 625 2760105 RCM4 02105 3600 s REF T_LR ok COND ok DIR ok SPD ok 627 2760106 TK50 441&528 7200 s recorder with 11 thermistors equally distributed 50 m downwards REF 11xT_LR 830 2760107 DLI 62 3600 s inclinometer data lost 832 2760108 RCM4 03827 3600 s REF T_LR ok PRES ok, 600 records (25 d) adaption time DIR ok SPD ok 1134 2760109 RCM4 02320 3600 s REF T_LR ok DIR ok SPD ok 1237 2760110 RCM5 01626 3600 s REF T_LR ok DIR ok SPD ok 1740 2760111 RCM5 02712 3600 s instrument dredged in March 1982; data until Dec 1981; data used until 1st dredge in July 1981 REF T_LR ok DIR ok SPD ok 3075 2760112 RCM5 02318 3600 s instrument lost 4727 2760113 RCM5 03801 3600 s instrument lost 5242 2760114 RCM5 03802 3600 s instrument lost

KIEL276 Time Series Data from Moored Current Meters, V276-01
V276-01: Pressure and temperature (upper panel)and vector time series (lower) of low pass filtered daily averages; instrument depths are best estimates (see sec. 4).

KIEL276 Time Series Data from Moored Current Meters, V276-01
Mooring V276-01: statistics from low pass filtered daily averages v27601 Depth Days Mean Mean Time Scale Fluxes Stand.-Dev. its Momentum Temperature -------------- ----------------- ---------- -------- ----------- SPD DIR STAB U V T u v t <uv> <dm> <ut> <vt> 190 280 2.2 77 0.23 2.2 0.5 16.3 18 13 29 -19 -24 -1.0 1.8 6.4 8.6 0.9 495 280 1.5 60 0.23 1.3 0.7 11.9 16 15 33 -5 -14 -0.1 0.6 4.2 6.0 0.2 702 280 1.3 48 0.26 1.0 0.9 10.6 24 17 25 -0 -1 -0.1 0.2 3.2 4.6 0.1 1004 280 1.4 7 0.33 0.2 1.3 9.0 24 15 9 4 14 0.2 0.6 2.6 4.7 0.4 1107 280 1.2 357 0.34 -0.1 1.2 8.6 24 15 10 2 9 -0.0 0.2 2.0 3.7 0.4 1611 280 0.6 299 0.23 -0.6 0.3 5.7 21 14 20 -1 -23 -0.2 0.1 1.9 2.3 0.2 Legend: Depth : best estimate of instrument depth as from logs, mooring model and measured data Days : length of record SPD, DIR: mean speed/(cm/s) and direction s : directional stability of flow (mean vector speed / mean scalar speed) U, V : mean East and North component of flow, cm/s T : mean temperature its : integral time scale (first zero crossing of autocorrelation function) u, v, t :deviations from average <uv>d : momentum flux <md> : direction of momentum flux

KIEL276 Time Series Data from Moored Current Meters, V276-01

KIEL276 Time Series Data from Moored Current Meters, V276-02
KIEL276 Time Series Data
Madeira Abyssal Plain
33°N, 022°W, 5280 m water depth
V276-02
27-JUL-1981 - 02-MAR-1982
Mooring information ******************* General Mooring ID : V276-02/KPO 632 Deployed : Date: 27-JUL-1981 Ship / Cruise: Meteor II, M57/1 Recovered : Date: 02-MAR-1982 Ship / Cruise: Meteor II, M60/3 Latitude N : 33.075 Longitude E : -021.884 Water depth : 5290 m (corrected) Magn. Anom. : -12.3 (bridge log, hard to identify, -13 according to MK4 files) Project : KIEL276 time series station PI : T.J. Mueller Data origin : IfM Kiel Depths : nominal as of logs and IMP static model Remarks 1) Mooring All depths are nominal as from logs and static mooring model. 2) Data Raw data are lost. Data sources are MK4 ASCII files at pre1-processing level and at sampling rate. RCM data, both at pre1-level and pre2-level, processed and at sampling rates in V27602_iii.dat. Compiled by: T.J. Mueller Date: 27-FEB-2012

KIEL276 Time Series Data from Moored Current Meters, V276-02
V276-02: Mooring sketch with nominal depths as from logs and mooring model (see sec. 2.4).

KIEL276 Time Series Data from Moored Current Meters, V276-02
Instruments All depths are nominal as from logs and mooring model (see sec. 2.4.) Depth Moor_ID Type S/N Sampling Sensor Remarks ----------------------------------------------------------------------------- 260 2760201 RCM4 01409 3600 s REF T_LR ok COND ok PRES ok DIR ok SPD ok 262 2760202 TK50 485&647 7200 s recorder with 11 thermistors equally distributed 50 m downwards REF 11xT_LR ok 565 2760203 RCM4 02527 3600 s REF stop after 1600 cycles T_LR ok COND ok DIR ok SPD ok 567 2760204 TK50 486&648 7200 s recorder with 11 thermistors equally distributed 50 m downwards REF 11xT_LR ok 771 2760205 RCM4 02528 3600 s REF stop after 4785 cycles T_LR ok COND bad, replaced by dummies PRES ok DIR ok SPD ok 1175 2760206 RCM4 00673 3600 s REF T_LR ok DIR ok SPD ok 1678 2760247 ACM 18 -9999 s FSI Acoustic Current Meter, S/N NB18; data not usable due to systematic hardware error in rotating instrumental orientation to earth coordinates; current rotated by additional 26 degree, but not consistent with Aanderaa RCM 3037 2760208 RCM5 04562 3600 s REF T_LR ok DIR ok SPD ok

KIEL276 Time Series Data from Moored Current Meters, V276-02
V276-02: Pressure and temperature (upper panel)and vector time series (lower) of low pass filtered daily averages; instrument depths are best estimates (see sec. 4).

KIEL276 Time Series Data from Moored Current Meters, V276-02
Mooring V276-02: statistics from low pass filtered daily averages v27602 Depth Days Mean Mean Time Scale Fluxes Stand.-Dev. its Momentum Temperature -------------- ----------------- ---------- -------- ----------- SPD DIR STAB U V T u v t <uv> <dm> <ut> <vt> 255 215 6.0 113 0.75 5.5 -2.3 15.4 17 20 20 -8 -22 -0.7 2.0 4.4 6.0 0.7 560 27 18.9 157 0.96 7.5 -17.4 11.4 6 5 4 4 25 -0.3 0.8 5.0 5.6 0.2 766 188 4.2 141 0.67 2.6 -3.3 10.3 8 18 13 -12 -12 0.5 -3.4 4.2 8.5 0.5 1170 215 1.7 135 0.50 1.2 -1.2 8.4 8 17 20 -5 -17 0.5 -1.9 2.7 4.7 0.5 3034 215 0.1 46 0.05 0.1 0.1 2.6 19 16 20 -1 -68 -0.0 -0.0 1.9 1.5 0.0 Legend: Depth : best estimate of instrument depth as from logs, mooring model and measured data Days : length of record SPD, DIR: mean speed/(cm/s) and direction s : directional stability of flow (mean vector speed / mean scalar speed) U, V : mean East and North component of flow, cm/s T : mean temperature its : integral time scale (first zero crossing of autocorrelation function) u, v, t :deviations from average <uv>d : momentum flux <md> : direction of momentum flux

KIEL276 Time Series Data from Moored Current Meters, V276-02

KIEL276 Time Series Data from Moored Current Meters, V276-03
KIEL276 Time Series Data
Madeira Abyssal Plain
33°N, 022°W, 5280 m water depth
V276-03
05-MAR-1982- 17-APR-1983
Mooring information ******************* General Mooring ID : V276-03/KPO 633 Deployed : Date: 05-MAR-1982 Ship / Cruise: Meteor II, M60/3 Recovered : Date: 17-APR-1983 Ship / Cruise: Meteor II, M64/6 Latitude N : 33.195 Longitude E : -021.898 Water depth : 5288 m (corrected) Magn. Anom. : -12.3 Project : KIEL276 time series station PI : T.J. Mueller Data origin : IfM Kiel Depths : nominal as of logs and IMP static model Remarks 1) Mooring After a first deployment on 04-MAR-1982, the release was called for testing; it failed and released the mooring which was recovered immediately. On 05-MAR-1982, the mooring was launched a second time. All depths are nominal as from logs and static mooring model. 2) Data Raw data are lost. Data sources are MK4 ASCII files at sampling rate and pre1-processing level. RCM data, both at pre1-level and pre2-level, processed and at sampling rates in V27603_iii.dat. Compiled by: T.J. Mueller Date: 08-MAR-2012

KIEL276 Time Series Data from Moored Current Meters, V276-03
V276-03: Mooring sketch with nominal depths as from logs and mooring model (see sec. 2.4).

KIEL276 Time Series Data from Moored Current Meters, V276-03
Instruments All depths are nominal as from logs and mooring model (see sec. 2.4.) Depth Moor_ID Type S/N Sampling Sensor Remarks ----------------------------------------------------------------------------- 199 2760301 RCM4 0094 3600 s REF T_LR ok PRES 700 dbar range, ok DIR ok SPD rotor lost after 10 d 200 2760302 TK50 181 & 174 7200 s recorder with 11 thermistors equally distributed 50 m downwards REF 11xT_LR ok 435 2760303 RCM4 01484 3600 s last good record 30-OCT-1982 REF T_LR ok COND ok DIR ok SPD ok 639 2760304 RCM4 01485 3600 s REF T_LR ok COND ok DIR ok SPD ok 1045 2760305 RCM4 00131 3600 s REF T_LR ok COND ok DIR ok SPD ok 1552 2760306 RCM5 02317 3600 s REF T_LR many spikes, ok DIR ok SPD ok 2954 2760307 RCM5 05881 3600 s housing flooded, no data 5238 2760308 RCM5 05882 3600 s housing flooded, no data

KIEL276 Time Series Data from Moored Current Meters, V276-03
V276-03: Pressure and temperature (upper panel)and vector time series (lower) of low pass filtered daily averages; instrument depths are best estimates (see sec. 4).

KIEL276 Time Series Data from Moored Current Meters, V276-03
Mooring V276-03: statistics from low pass filtered daily averages v27603 Depth Days Mean Mean Time Scale Fluxes Stand.-Dev. its Momentum Temperature -------------- ----------------- ---------- -------- ----------- SPD DIR STAB U V T u v t <uv> <dm> <ut> <vt> 210 12 17.8 80 0.99 17.6 3.0 16.2 2 2 2 3 45 -0.1 -0.0 2.4 2.4 0.2 446 241 5.7 98 0.75 5.6 -0.7 12.6 13 24 26 1 2 -0.5 -0.3 2.7 5.7 0.3 651 405 3.5 113 0.68 3.3 -1.4 11.0 15 28 32 0 2 -0.3 0.1 2.3 4.5 0.2 1057 405 1.6 112 0.57 1.5 -0.6 8.1 27 28 12 1 5 0.1 0.1 1.2 2.8 0.2 1564 405 0.4 150 0.18 0.2 -0.4 5.4 7 20 27 0 0 0.0 0.0 1.4 2.2 0.2 Legend: Depth : best estimate of instrument depth as from logs, mooring model and measured data Days : length of record SPD, DIR: mean speed/(cm/s) and direction s : directional stability of flow (mean vector speed / mean scalar speed) U, V : mean East and North component of flow, cm/s T : mean temperature its : integral time scale (first zero crossing of autocorrelation function) u, v, t :deviations from average <uv>d : momentum flux <md> : direction of momentum flux

KIEL276 Time Series Data from Moored Current Meters, V276-03

KIEL276 Time Series Data from Moored Current Meters, V276-04
KIEL276 Time Series Data
Madeira Abyssal Plain
33°N, 022°W, 5280 m water depth
V276-04
19-APR-1983 - 19-OCT-1983
Mooring information ******************* General Mooring ID : V276-04/KPO 635 Deployed : Date: 19-APR-1983 Ship / Cruise: Meteor II, M64/6 Recovered : Date: 19-OCT-1983 Ship / Cruise: Poseidon, POS104 Latitude N : 33.177 Longitude E : -021.917 Water depth : 5288 m (corrected) Magn. Anom. : -12.3 Project : KIEL276 time series station PI : T.J. Mueller Data origin : IfM Kiel Depths : nominal as of logs and IMP static model
Remarks 1) Mooring Buoyancy of top element not noted in launch log. Topb buoys with 450 kp buoyancy had the maximum buoyancy available at that time in the mooring group. With such buoy and mooring components according to log of launch, all instrument nominal depths in static model from top to 1721 m are ca. 80 m deeper than in MK4 files and 50 m deeper than designed. 2) Data Raw data are lost. Data sources are MK4 ASCII files at sampling rate and pre1-processing level. Data of uppermost T/P recorder S/N 778 were high resolution in time (300 s) to measure the mooring's adjustment to depth after the launch phase; data are lost. RCM data, both at pre1-level and pre2-level, processed and at sampling rates in V27604_iii.dat. Compiled by: T.J. Mueller Date: 11-MAR-2012

KIEL276 Time Series Data from Moored Current Meters, V276-04
V276-04: Mooring sketch with nominal depths as from logs and mooring model (see sec. 2.4).

KIEL276 Time Series Data from Moored Current Meters, V276-04
Instruments All depths are nominal as from logs and mooring model (see sec. 2.4.) Depth Moor_ID Type S/N Sampling Sensor Remarks ----------------------------------------------------------------------------- 308 2760401 DLTP 0778 300 s TP recorder; high resolution in time; used for launch phase only; data lost 361 2760402 RCM4 00776 3600 s REF T_LR ok COND ok PRES ok DIR ok SPD ok 362 2760403 TK50 441&528 7200 s recorder with 11 thermistors equally distributed 50 m downwards REF 11xT_LR ok 595 2760404 RCM4 01407 3600 s REF T_LR ok COND ok DIR ok SPD ok 798 2760405 RCM4 01409 3600 s REF T_LR ok COND ok DIR ok SPD ok 1202 2760406 RCM4 02025 3600 s REF T_LR ok COND ok DIR ok SPD ok 1706 2760407 ACM 74 instrument with wrong conversion of instrument's to earth's coordinates; data not used and lost 1708 2760408 RCM5 04352 3600 s REF T_LR ok DIR ok SPD ok 3087 2760409 RCM5 04565 3600 s REF T_LR ok DIR ok SPD ok 5239 2760410 RCM5 05327 3600 s REF T_LR ok DIR bad, not used SPD bad, not used

KIEL276 Time Series Data from Moored Current Meters, V276-04
V276-04: Pressure and temperature (upper panel)and vector time series (lower) of low pass filtered daily averages; instrument depths are best estimates (see sec. 4).

KIEL276 Time Series Data from Moored Current Meters, V276-04
Mooring V276-04: statistics from low pass filtered daily averages v27604 Depth Days Mean Mean Time Scale Fluxes Stand.-Dev. its Momentum Temperature -------------- ----------------- ---------- -------- ----------- SPD DIR STAB U V T u v t <uv> <dm> <ut> <vt> 239 180 7.1 146 0.78 4.0 -5.8 15.3 9 11 28 -3 -18 -0.2 -2.0 4.5 5.3 0.7 473 180 4.6 152 0.79 2.2 -4.0 12.3 12 17 30 0 2 -0.3 -0.7 2.7 3.3 0.4 677 180 3.1 140 0.72 2.0 -2.4 10.7 12 20 22 -1 -13 0.0 -0.4 2.2 2.7 0.2 1081 180 0.8 179 0.47 0.0 -0.8 8.4 14 18 8 -0 -24 -0.0 -0.0 1.1 1.4 0.2 1587 180 0.7 233 0.36 -0.5 -0.4 4.9 16 13 16 -0 -33 -0.0 -0.0 1.2 1.3 0.1 3013 180 0.8 236 0.44 -0.6 -0.4 2.8 18 15 27 -1 -62 -0.0 0.0 1.4 1.1 0.0 5237 58 1.5 242 0.68 -1.3 -0.7 2.3 4 8 4 0 4 -0.0 0.0 0.7 1.6 0.0 Legend: Depth : best estimate of instrument depth as from logs, mooring model and measured data Days : length of record SPD, DIR: mean speed/(cm/s) and direction s : directional stability of flow (mean vector speed / mean scalar speed) U, V : mean East and North component of flow, cm/s T : mean temperature its : integral time scale (first zero crossing of autocorrelation function) u, v, t :deviations from average <uv> : momentum flux d
<md> : direction of momentum flux

KIEL276 Time Series Data from Moored Current Meters, V276-04

KIEL276 Time Series Data from Moored Current Meters, V276-05
KIEL276 Time Series Data
Madeira Abyssal Plain
33°N, 022°W, 5280 m water depth
V276-05
20-OCT-1983 - 25-OCT-1984
Mooring information ******************* General Mooring ID : V276-05/ KPO 636 Deployed : Date: 20-OCT-1983 Ship / Cruise: Poseidon, POS104 Recovered : Date: 25-OCT-1984 Ship / Cruise: Meteor II, M69/5 Latitude N : 33.180 Longitude E : -021.923 Water depth : 5285 m (corrected) Magn. Anom. : -13.5 Project : KIEL276 time series station PI : T.J. Mueller Data origin : IfM Kiel Depths : nominal as of logs and IMP static model Remarks General remarks --------------- 1) Mooring All mooring components according to log of launch; all instrument depths nominal as from logs and static model. 2) Data Raw data are lost. Data sources are MK4 ASCII files at sampling rate and pre1-processing level. Data of uppermost T/P recorder S/N 778 were high resolution in time (300 s) to measure launch phase. RCM data, both at pre1-level and pre2-level, processed and at sampling rates in V27605_iii.dat. Compiled by: T.J. Mueller Date: 11-MAR-2012

KIEL276 Time Series Data from Moored Current Meters, V276-05
V276-05: Mooring sketch with nominal depths as from logs and mooring model (see sec. 2.4).

KIEL276 Time Series Data from Moored Current Meters, V276-05
Instruments All depths are nominal as from logs and mooring model (see sec. 2.4.) Depth Moor_ID Type S/N Sampling Sensor Remarks ----------------------------------------------------------------------------- 310 2760501 DLTP 0778 30 s TP recorder; high resolution in time; used for launch phase only 364 2760502 RCM4 00776 3600 s REF T_LR ok COND ok PRES ok DIR ok SPD ok, rotor bad after 30-JUN-1984 365 2760503 TK50 181&530 7200 s recorder with 11 thermistors equally distributed 50 m downwards REF 11xT_LR ok 598 2760504 RCM4 06051 3600 s REF T_LR ok DIR ok SPD ok 801 2760505 RCM4 05882 3600 s REF T_LR ok DIR ok SPD ok 1104 2760507 ACM 74 position in line changed before launching; instrument with wrong conversion of instrument's to earth's coordinates; data not used and lost 1207 2760506 RCM4 06682 3600 s REF T_LR ok COND ok DIR ok SPD ok 1710 2760508 RCM5 06161 3600 s REF T_LR ok DIR ok SPD ok 3087 2760509 RCM5 05881 3600 s REF T_LR ok DIR ok SPD ok 5236 2760510 RCM5 06160 3600 s record stops 23-AUG-1984 REF T_LR ok DIR ok SPD ok

KIEL276 Time Series Data from Moored Current Meters, V276-05
V276-05: Pressure and temperature (upper panel)and vector time series (lower) of low pass filtered daily averages; instrument depths are best estimates (see sec. 4).

KIEL276 Time Series Data from Moored Current Meters, V276-05
Mooring V276-05: statistics from low pass filtered daily averages v27605 Depth Days Mean Mean Time Scale Fluxes Stand.-Dev. its Momentum Temperature -------------- ----------------- ---------- -------- ----------- SPD DIR STAB U V T u v t <uv> <dm> <ut> <vt> 332 252 1.6 185 0.19 -0.2 -1.6 13.7 10 17 17 -2 -2 -0.3 -0.8 4.9 8.6 0.5 566 368 0.9 219 0.13 -0.5 -0.7 11.4 37 19 31 3 13 -0.4 -0.3 4.8 5.8 0.3 770 368 0.7 302 0.12 -0.6 0.4 10.0 25 16 33 8 37 0.3 0.5 4.8 5.3 0.3 1176 368 1.8 324 0.41 -1.0 1.4 7.9 16 13 31 4 44 0.4 0.5 3.5 3.5 0.5 1679 367 2.5 314 0.51 -1.8 1.8 4.7 20 14 30 -5 -62 0.2 -0.8 4.6 3.7 0.4 3068 368 1.5 298 0.63 -1.3 0.7 NaN 17 14 NaN -1 -45 NaN NaN 1.6 1.5 NaN 5236 309 2.0 290 0.64 -1.9 0.7 NaN 13 11 NaN -1 -51 NaN NaN 2.1 1.9 NaN Legend: Depth : best estimate of instrument depth as from logs, mooring model and measured data Days : length of record SPD, DIR: mean speed/(cm/s) and direction s : directional stability of flow (mean vector speed / mean scalar speed) U, V : mean East and North component of flow, cm/s T : mean temperature its : integral time scale (first zero crossing of autocorrelation function) u, v, t :deviations from average <uv>d : momentum flux <md> : direction of momentum flux

KIEL276 Time Series Data from Moored Current Meters, V276-05

KIEL276 Time Series Data from Moored Current Meters, V276-06
KIEL276 Time Series Data
Madeira Abyssal Plain
33°N, 022°W, 5280 m water depth
V276-06
26-OCT-1984 - 16-NOV-1985
Mooring information ******************* General Mooring ID : V276-06/KPO 642 Deployed : Date: 26-OCT-1984 Ship / Cruise: Meteor II, M69/5 Recovered : Date: 16-NOV-1985 Ship / Cruise: Poseidon, P124 Latitude N : 33.158 Longitude E : -021.955 Water depth : 5290 m (corrected, deck log) Magn. Anom. : -11.7 (Mk4 files) Project : KIEL276 time series station PI : T.J. Mueller Data origin : IfM Kiel Depths : nominal as of logs and IMP static model Compiled by: T.J. Mueller Date: 12-MAR-2012 Remarks 1) Mooring Uppermost T/P recorder was cancelled before deployment. All mooring components according to log of launch; all instrument depths nominal as from logs and static model. 2) Data Raw data are lost. Data sources are MK4 ASCII files at sampling rate and pre1-processing level. RCM data, both at pre1-level and pre2-level, processed and at sampling rates in V27606_iii.dat.

KIEL276 Time Series Data from Moored Current Meters, V276-06
V276-06: Mooring sketch with nominal depths as from logs and mooring model (see sec. 2.4).

KIEL276 Time Series Data from Moored Current Meters, V276-06
Instruments All depths are nominal as from logs and mooring model (see sec. 2.4.) Depth Moor_ID Type S/N Sampling Sensor Remarks ----------------------------------------------------------------------------- 409 2760602 RCM4 00673 3600 s REF T_LR ok PRES ok DIR ok, SPD blocked by bio-fouling 642 2760603 RCM4 02528 3600 s REF T_LR ok COND ok DIR ok SPD ok 845 2760604 RCM4 07330 3600 s REF T_LR ok COND ok DIR ok SPD ok 847 2760605 TK50 486&530 7200 s recorder with 11 thermistors equally distributed 50 m downwards stop 03-SEP-1985 REF 10xT_LR ok, sensor 11 bad; to be set to dummy 1150 2760606 ACM 18 data not used and lost due to instrument with wrong conversion of instrument's to earth's coordinates; 1253 2760607 RCM4 07343 3600 s REF T_LR ok COND ok DIR ok SPD ok 1756 2760608 RCM5 06681 3600 s REF T_LR ok COND ok DIR ok SPD ok 3138 2760609 RCM5 06678 3600 s REF T_LR ok DIR ok SPD ok 5242 2760610 RCM5 06160 3600 s stop 19-JUL-1985 REF T_LR ok, spikes wth T<2.38 °c set to NaN DIR bad, not used SPD bad, not used

KIEL276 Time Series Data from Moored Current Meters, V276-06
V276-06: Pressure and temperature (upper panel)and vector time series (lower) of low pass filtered daily averages; instrument depths are best estimates (see sec. 4).

KIEL276 Time Series Data from Moored Current Meters, V276-06
Mooring V276-06: statistics from low pass filtered daily averages v27606 Depth Days Mean Mean Time Scale Fluxes Stand.-Dev. its Momentum Temperature -------------- ----------------- ---------- -------- ----------- SPD DIR STAB U V T u v t <uv> <dm> <ut> <vt> 332 383 NaN NaN NaN NaN NaN 14.4 NaN NaN NaN NaN NaN NaN NaN NaN NaN 0.4 566 383 1.1 254 0.21 -1.0 -0.3 11.7 17 24 20 -2 -8 0.2 -0.5 2.8 4.8 0.2 769 383 0.6 249 0.16 -0.6 -0.2 10.1 16 25 28 -1 -8 -0.1 -0.2 2.3 3.9 0.1 1177 383 0.4 269 0.20 -0.4 -0.0 8.2 12 21 43 -0 -14 -0.2 0.2 1.4 1.9 0.3 1680 383 0.9 272 0.41 -0.9 0.0 5.1 11 15 40 -0 -66 -0.1 0.0 1.6 1.5 0.2 3092 383 0.5 274 0.31 -0.5 0.0 2.8 17 11 37 0 72 -0.0 -0.0 1.4 1.0 0.0 5241 151 NaN NaN NaN NaN NaN 2.4 NaN NaN NaN NaN NaN NaN NaN NaN NaN 0.0 Legend: Depth : best estimate of instrument depth as from logs, mooring model and measured data Days : length of record SPD, DIR: mean speed/(cm/s) and direction s : directional stability of flow (mean vector speed / mean scalar speed) U, V : mean East and North component of flow, cm/s T : mean temperature its : integral time scale (first zero crossing of autocorrelation function) u, v, t :deviations from average <uv>d : momentum flux <md> : direction of momentum flux

KIEL276 Time Series Data from Moored Current Meters, V276-06

KIEL276 Time Series Data from Moored Current Meters, V2764-07
KIEL276 Time Series Data
Madeira Abyssal Plain
33°N, 022°W, 5280 m water depth
V276-07
17-NOV-1985 - 31-OCT-1986
Mooring information ******************* General Mooring ID : V276-07/KPO 658 Deployed : Date: 17-NOV-1985 Ship / Cruise: Poseidon, P124 Recovered : Date: 31-OCT-1986 Ship / Cruise: Meteor, M04/2 Latitude N : 33.142 Longitude E : -021.960 Water depth : 5288 m (corrected) Magn. Anom. : -11.7 (Mk4 files) Project : KIEL276 time series station PI : T.J. Mueller Data origin : IfM Kiel Depths : nominal as of logs and IMP static model Remarks 1) Mooring All mooring components according to log of launch; all instrument depths nominal as from static model; S/N 4665 at 3000 m designed depth changed to S/N 4565 (probably a misprint in the edited deck log) 2) Data Raw data are lost. Data sources are MK4 ASCII files at sampling rate and at pre1-processing level. RCM data, both at pre1-level and pre2-level, processed and at sampling rates in V27607_iii.dat. Compiled by: T.J. Mueller Date: 12-MAR-2012

KIEL276 Time Series Data from Moored Current Meters, V2764-07
V276-07: Mooring sketch with nominal depths as from logs and mooring model (see sec. 2.4).

KIEL276 Time Series Data from Moored Current Meters, V2764-07
Instruments All depths are nominal as from logs and mooring model (see sec. 2.4.) Depth Moor_ID Type S/N Sampling Sensor Remarks ----------------------------------------------------------------------------- 402 2760701 RCM5 06158 3600 s REF T_LR ok COND ok DIR ok SPD ok 636 2760702 RCM5 07656 3600 s REF T_LR ok DIR ok SPD ok 840 2760703 RCM4 07927 3600 s REF T_LR ok DIR ok SPD ok 841 2760704 TK50 181&648 7200 s recorder with 11 thermistors equally distributed 50 m downwards stop 03-SEP-1986 REF T_LR: 01 and 02 bad; 03-11 ok 1144 2760705 RCM4 07654 3600 s REF T_LR ok DIR ok SPD ok 1247 2760706 RCM4 07928 3600 s REF T_LR ok DIR ok SPD ok 1751 2760707 RCM5 07929 3600 s REF T_LR ok DIR ok SPD ok 3133 2760708 RCM5 04565 3600 s REF T_LR few days bad, all other ok DIR ok SPD ok 5238 2760709 RCM5 06161 3600 s REF T_LR ok DIR ok SPD ok

KIEL276 Time Series Data from Moored Current Meters, V2764-07
V276-07: Pressure and temperature (upper panel)and vector time series (lower) of low pass filtered daily averages; instrument depths are best estimates (see sec. 4).

KIEL276 Time Series Data from Moored Current Meters, V2764-07
Mooring V276-07: statistics from low pass filtered daily averages v27607 Depth Days Mean Mean Time Scale Fluxes Stand.-Dev. its Momentum Temperature -------------- ----------------- ---------- -------- ----------- SPD DIR STAB U V T u v t <uv> <dm> <ut> <vt> 322 303 1.0 161 0.16 0.3 -0.9 14.4 14 17 20 8 14 -0.5 -0.6 2.9 6.2 0.6 557 345 0.9 299 0.18 -0.8 0.4 11.7 19 20 21 -1 -5 0.0 -0.2 3.0 5.0 0.3 761 345 1.2 296 0.30 -1.1 0.5 10.3 20 20 22 -1 -6 0.1 -0.1 2.2 3.8 0.2 1065 345 3.2 319 0.61 -2.1 2.4 9.1 17 15 27 -1 -33 -0.2 -0.2 3.3 3.4 0.3 1168 248 0.8 306 0.35 -0.7 0.5 8.8 15 18 28 -0 -5 0.1 0.1 1.3 2.0 0.2 1672 267 1.0 279 0.40 -1.0 0.2 5.6 14 15 21 -1 -49 0.1 0.1 1.8 1.7 0.3 3085 345 0.6 252 0.28 -0.6 -0.2 NaN 17 23 NaN -1 -73 NaN NaN 2.0 1.5 NaN 5237 209 1.2 308 0.50 -0.9 0.7 2.5 17 16 12 -1 -65 -0.0 0.0 2.0 1.4 0.0 Legend: Depth : best estimate of instrument depth as from logs, mooring model and measured data Days : length of record SPD, DIR: mean speed/(cm/s) and direction s : directional stability of flow (mean vector speed / mean scalar speed) U, V : mean East and North component of flow, cm/s T : mean temperature its : integral time scale (first zero crossing of autocorrelation function) u, v, t :deviations from average <uv>d : momentum flux <md> : direction of momentum flux

KIEL276 Time Series Data from Moored Current Meters, V2764-07

KIEL276 Time Series Data from Moored Current Meters, V276-08
KIEL276 Time Series Data
Madeira Abyssal Plain
33°N, 022°W, 5280 m water depth
V276-08
01-NOV-1986 - 06-NOV-1987
Mooring information ******************* General Mooring ID : V276-08/KPO 660 Deployed : Date: 01-NOV-1986 Ship / Cruise: Meteor, M04/2 Recovered : Date: 06-NOV-1987 Ship / Cruise: Meteor, M06/1 Latitude N : 33.112 Longitude E : -021.918 Water depth : 5281 m (corrected) Magn. Anom. : -11.7 (bridge log) Project : KIEL276 time series station PI : T.J. Mueller Data origin : IfM Kiel Depths : nominal as of logs and IMP static model Remarks 1) Mooring All mooring components according to log of launch; all instrument depths nominal as from static model; 2) Data Raw data are lost. Data sources are MK4 ASCII files at sampling rate and at pre1-processing level. S/N 4564 showed bad direction measurements. S/N 4563 had the instrumental revolutions/count set wrongly. RCM data, both at pre1-level and pre2-level, processed and at sampling rates in V27608_iii.dat. Compiled by: T.J. Mueller Date: 12-MAR-2012
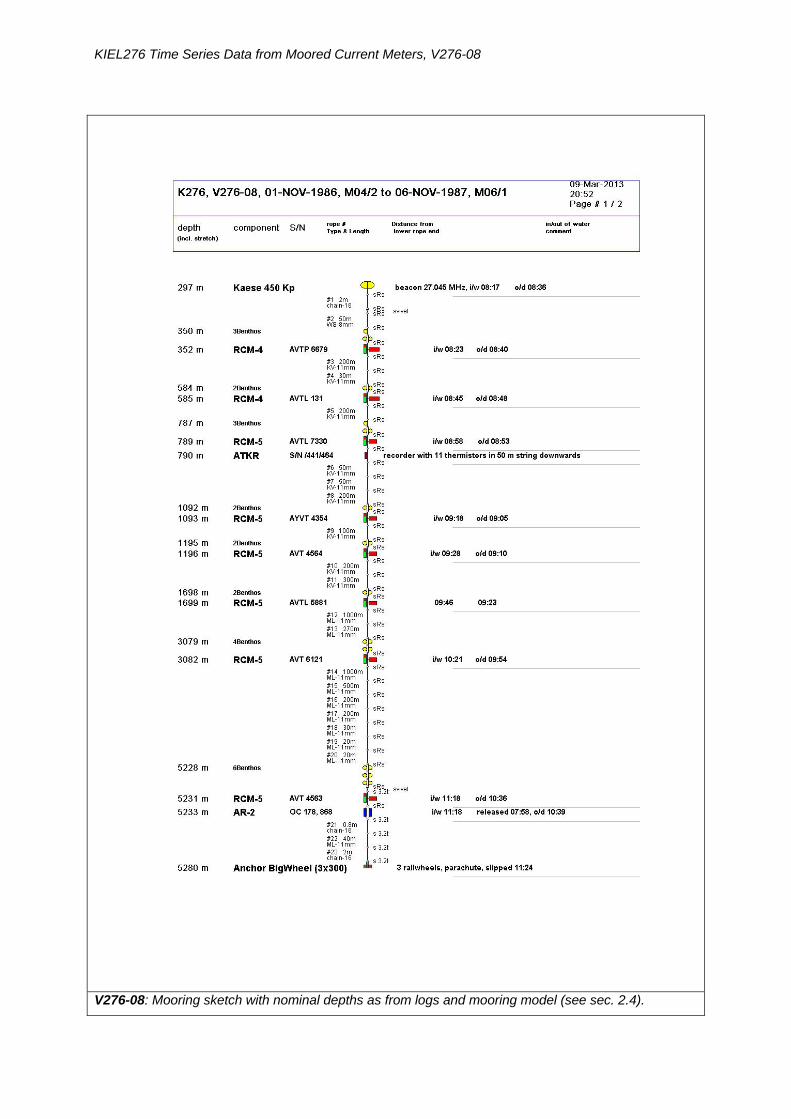
KIEL276 Time Series Data from Moored Current Meters, V276-08
V276-08: Mooring sketch with nominal depths as from logs and mooring model (see sec. 2.4).

KIEL276 Time Series Data from Moored Current Meters, V276-08
Instruments: All depths are nominal as from logs and mooring model (see sec. 2.4.) Depth Moor_ID Type S/N Sampling Sensor Remarks ----------------------------------------------------------------------------- 352 2760801 RCM5 06679 3600 s REF PRES no data (sensor bad) T_LR ok DIR ok until 11-MAY-1987 SPD ok until 11-MAY-1987 585 2760802 RCM4 00131 3600 s REF T_LR ok COND ok DIR ok SPD ok until 27-APR-1987 789 2760803 RCM4 07330 3600 s REF T_LR ok COND ok DIR ok SPD ok 790 2760804 TK50 441 & 464 7200 s recorder with 11 thermistors equally distributed 50 m downwards REF T_LR, 11x ok 1093 2760805 RCM4 04354 3600 s REF T_LR ok DIR ok SPD ok 1196 2760806 RCM4 04564 3600 s REF T_LR ok DIR bad SPD no data 1699 2760807 RCM5 05881 3600 s REF T_LR ok DIR ok SPD ok 3082 2760808 RCM5 06121 3600 s REF T_AR ok DIR ok SPD ok 5231 2760809 RCM5 04563 3600 s REF T_AR ok DIR ok SPD bad (setting of rev/count wrong)

KIEL276 Time Series Data from Moored Current Meters, V276-08
V276-08: Pressure and temperature (upper panel)and vector time series (lower) of low pass filtered daily averages; instrument depths are best estimates (see sec. 4).

KIEL276 Time Series Data from Moored Current Meters, V276-08
Mooring V276-08: statistics from low pass filtered daily averages v27608 Depth Days Mean Mean Time Scale Fluxes Stand.-Dev. its Momentum Temperature -------------- ----------------- ---------- -------- ----------- SPD DIR STAB U V T u v t <uv> <dm> <ut> <vt> 332 195 4.7 263 0.60 -4.7 -0.6 14.0 15 18 19 -5 -20 -0.3 0.1 4.7 5.9 0.4 565 121 4.8 239 0.71 -4.1 -2.5 11.3 16 9 18 -8 -36 -0.1 -0.1 3.4 4.0 0.2 770 367 2.4 201 0.46 -0.9 -2.2 10.5 35 25 37 -6 -40 -0.5 0.3 3.6 3.8 0.2 1074 367 2.4 213 0.58 -1.3 -2.0 8.8 33 22 45 -1 -72 -0.6 0.2 3.0 2.5 0.3 1177 367 NaN NaN NaN NaN NaN 8.4 NaN NaN NaN NaN NaN NaN NaN NaN NaN 0.3 1680 367 1.6 225 0.57 -1.1 -1.1 5.0 28 16 23 -0 -77 -0.2 0.0 2.0 1.6 0.2 3070 366 0.9 215 0.45 -0.5 -0.8 2.8 24 12 62 0 85 -0.0 0.0 1.8 1.1 0.0 5231 367 NaN NaN NaN NaN NaN 2.3 NaN NaN NaN NaN NaN NaN NaN NaN NaN 0.0 Legend: Depth : best estimate of instrument depth as from logs, mooring model and measured data Days : length of record SPD, DIR: mean speed/(cm/s) and direction s : directional stability of flow (mean vector speed / mean scalar speed) U, V : mean East and North component of flow, cm/s T : mean temperature its : integral time scale (first zero crossing of autocorrelation function) u, v, t :deviations from average <uv> : momentum flux d
<md> : direction of momentum flux

KIEL276 Time Series Data from Moored Current Meters, V276-08

KIEL276 Time Series Data from Moored Current Meters, V276-09a & V276-09b
KIEL276 Time Series Data
Madeira Abyssal Plain
33°N, 022°W, 5280 m water depth
V276-09a and V276-09b
06-NOV-1987 - 14-JAN-1989
Mooring information ******************* General Mooring ID : V276-09/ KPO 666 Deployed : Date: 06-NOV-1987 Ship / Cruise: Meteor, M06/1 top buoy lost: DATE: ca. 24-SEP-1988 Recovered : Date: 14-JAN-1989 Ship / Cruise: Meteor, M09/2 Latitude N : 33.090 Longitude E : -021.875 Water depth : 5287 m (corrected) Magn. Anom. : -12 (bridge log) Project : KIEL276 time series station PI : T.J. Mueller Data origin : IfM Kiel Depths : nominal as of logs and IMP static model Remarks 1) Mooring Mooring lost top buoy and top instrument on 24-SEP-1988, probably due to fish biting in KEVLAR rope. Because now stretching of nylon rope was much less, remaining mooring components dropped to larger depths from then on: 326 m above S/N 6159 and less below. Periods before loss of buoyancy: V276-09a, after loss V276-09b. All mooring components according to log of launch; all instrument depths nominal as from logs and static model for both periods, before and after loss of the top buoy; 2) Data Raw data are lost. Data sources are MK4 ASCII files at sampling rate and at pre1-processing level. RCM data, both at pre1-level and pre2-level, processed and at sampling rates in V27609a_iii.dat and V27609b_iii.dat. Compiled by: T.J. Mueller Date: 12-MAR-2012

KIEL276 Time Series Data from Moored Current Meters, V276-09a & V276-09b
V276-09a: Mooring sketch with nominal depths as from logs and mooring model (see sec. 2.4).

KIEL276 Time Series Data from Moored Current Meters, V276-09a & V276-09b
V276-09b: Mooring sketch with nominal depths as from logs and mooring model (see sec. 2.4).

KIEL276 Time Series Data from Moored Current Meters, V276-09a & V276-09b
Instruments: All depths are nominal as from logs and mooring model (see sec. 2.4.) Depth Moor_ID Type S/N Sampling Sensor Remarks a b ----------------------------------------------------------------------------- 283 2760901 RCM5 06074 7200 s lost with top buoy 516 2760902 RCM4 07924 7200 s REF 773 T_LR ok DIR ok SPD ok 719 2760903 RCM4 07624 7200 s REF 977 T_LR ok DIR ok SPD ok 721 2760904 TK50 441&464 7200 s recorder with 11 thermistors equally 978 distributed 50 m downwards REF T_LR 11x ok until 08-JAN-1989 1024 2760905 RCM4 05252 7200 s stop 15-NOV-1988 1281 REF T_LR ok DIR ok SPD ok 1125 2760906 RCM4 02317 7200 s REF 1384 T_LR ok, DIR ok SPD ok until 28-NOV-1988 1629 2760907 RCM5 06159 7200 s REF 1887 T_LR ok DIR ok SPD ok 3012 2760908 RCM5 07656 7200 s stop 11-DEC-1988 (water, tape readable) 3171 REF T_LR ok DIR ok with DIR=DIR+180 SPD ok 5240 2760909 RCM5 06160 7200 s REF T_AR ok DIR ok SPD ok

KIEL276 Time Series Data from Moored Current Meters, V276-09a & V276-09b
V276-09a: Pressure and temperature (upper panel)and vector time series (lower) of low pass filtered daily averages; instrument depths are best estimates (see sec. 4).

KIEL276 Time Series Data from Moored Current Meters, V276-09a & V276-09b
V276-09b: Pressure and temperature (upper panel)and vector time series (lower) of low pass filtered daily averages; instrument depths are best estimates (see sec. 4).

KIEL276 Time Series Data from Moored Current Meters, V276-09a & V276-09b

KIEL276 Time Series Data from Moored Current Meters, V276-09a & V276-09b
Mooring V276-09a: statistics from low pass filtered daily averages v27609a Depth Days Mean Mean Time Scale Fluxes Stand.-Dev. its Momentum Temperature -------------- ----------------- ---------- -------- ----------- SPD DIR STAB U V T u v t <uv> <dm> <ut> <vt> 441 320 0.6 130 0.13 0.5 -0.4 13.0 10 15 19 1 4 0.3 -0.5 3.3 4.6 0.3 645 320 0.5 101 0.10 0.5 -0.1 11.0 10 15 20 0 2 0.0 -0.1 3.0 4.5 0.1 950 320 0.2 111 0.06 0.2 -0.1 9.1 13 17 12 1 10 0.1 0.2 2.0 3.0 0.3 1051 320 0.3 196 0.09 -0.1 -0.3 8.7 11 18 10 1 5 0.1 0.2 1.9 3.0 0.3 1555 320 0.6 246 0.24 -0.6 -0.3 5.8 15 16 18 1 14 -0.0 -0.1 1.7 2.2 0.2 2966 320 0.9 259 0.42 -0.8 -0.2 2.8 12 16 19 -0 -79 0.0 -0.0 1.5 1.4 0.0 5239 320 0.6 338 0.22 -0.2 0.5 2.4 12 15 6 1 39 0.0 0.0 2.0 2.0 0.0 Legend: Depth : best estimate of instrument depth as from logs, mooring model and measured data Days : length of record SPD, DIR: mean speed/(cm/s) and direction s : directional stability of flow (mean vector speed / mean scalar speed) U, V : mean East and North component of flow, cm/s T : mean temperature its : integral time scale (first zero crossing of autocorrelation function) u, v, t :deviations from average <uv>d : momentum flux <md> : direction of momentum flux Mooring V276-09b: statistics from low pass filtered daily averages v27609b Depth Days Mean Mean Time Scale Fluxes Stand.-Dev. its Momentum Temperature -------------- ----------------- ---------- -------- ----------- SPD DIR STAB U V T u v t <uv> <dm> <ut> <vt> 633 109 2.3 257 0.50 -2.2 -0.5 11.0 19 12 21 -1 -85 1.5 0.1 4.3 2.2 0.4 837 109 1.8 249 0.53 -1.7 -0.7 9.8 19 10 15 0 86 0.5 0.1 2.9 1.9 0.2 1141 48 0.4 249 0.26 -0.4 -0.1 8.4 4 9 6 0 12 0.0 0.3 0.7 1.5 0.3 1244 92 1.6 244 0.67 -1.5 -0.7 7.6 12 11 12 0 73 0.2 0.4 1.7 1.5 0.4 1747 109 1.4 245 0.64 -1.3 -0.6 4.9 7 13 15 0 4 0.0 0.1 1.2 1.6 0.1 3084 76 0.7 194 0.37 -0.2 -0.7 2.7 8 15 14 -1 -14 -0.0 0.0 0.7 1.8 0.0 5238 109 1.4 90 0.53 1.4 0.0 2.4 7 11 6 0 35 -0.0 0.0 1.8 1.8 0.0 Legend: Depth : best estimate of instrument depth as from logs, mooring model and measured data Days : length of record SPD, DIR: mean speed/(cm/s) and direction s : directional stability of flow (mean vector speed / mean scalar speed) U, V : mean East and North component of flow, cm/s T : mean temperature its : integral time scale (first zero crossing of autocorrelation function) u, v, t :deviations from average <uv>d : momentum flux <md> : direction of momentum flux

KIEL276 Time Series Data from Moored Current Meters, V276-09a & V276-09b

KIEL276 Time Series Data from Moored Current Meters, V276-10
KIEL276 Time Series Data
Madeira Abyssal Plain
33°N, 022°W, 5280 m water depth
V276-10
14-JAN-1989 - 27-OCT-1989
Mooring information ******************* General Mooring ID : V276-10/ KPO 671 Deployed : Date: 14-JAN-1989 Ship / Cruise: Meteor, M09/2 Recovered : Date: 27-OCT-1989 Ship / Cruise: Meteor, M11/2 Latitude N : 33.107 Longitude E : -021.897 Water depth : 5281 m (HS corrected) Magn. Anom. : -12 (interpolated) Project : KIEL276 time series station PI : T.J. Mueller Data origin : IfM Kiel Depths : nominal as of logs and IMP static model Remarks 1) Mooring Top buoy was shrunk at recovery, i.e. had less buoyancy than when launched. Pressure records of top two RCM both slowly increased from 334 dbar to 354 dbar (600 dbar to 618 dbar). No sudden event. All mooring components according to log of launch; all instrument depths nominal as from logs and static model. Note: this mooring had 90 m less nylon rope than V276-09; therefore, instrument S/N 07927 at 1705 and all others at less depths are 100 m deeper than the comparable in V27609. 2) Data Raw data in 27610ii.RAW, 1<=i<=9, files restored from 5 1/4 '' disk, March 2012. Files 27610ii.RAW edited and stored to RCM*.EDT. Data re-processed in May 2012. CALAAN.M, ok CHECK_ROTOR_CAL.M applied for M2 tide, ok. RCM data pre1-level processed and at sampling rates in RCM*.dat. RCM data at pre2-level processed and at sampling rate in V27610_iii.dat. Compiled by: T.J. Mueller Date: 31-MAY-2012

KIEL276 Time Series Data from Moored Current Meters, V276-10
V276-10: Mooring sketch with nominal depths as from logs and mooring model (see sec. 2.4).

KIEL276 Time Series Data from Moored Current Meters, V276-10
Instruments: All depths are nominal as from logs and mooring model (see sec. 2.4.) Depth Moor_ID Type S/N Sampling Sensor Remarks ----------------------------------------------------------------------------- 391 2761001 RCM8 08412 7200 s REF ok, 164 T_LR ok COND ok, last 6 values set to NaN, PRES ok, see remark below DIR ok SPD ok 624 2761002 RCM4 02528 7200 s REF ok, 371 T_LR ok COND ok, few spikes replaced by dummy PRES ok, see remark below DIR ok SPD ok, rotor 'slow' by factor ca. 0.5 between day 165 and day 212 to be edited: multiply with factor 2 827 2761003 RCM4 07343 7200 s REF ok, 292 T_LR ok COND ok, S with strong nonlinear trend; DIR ok SPD ok 829 2761004 TK50 486 7200 s no data, raw values all 512 1132 2761005 RCM5 07928 7200 s REF 596 (nominal), median 512 read T_LR often reads T_raw=0; set to dummy COND often reads C_raw=0; set to dummy DIR ok SPD ok 1234 2761006 RCM8 08295 7200 s REF ok, 149, at the end often half range T_LR ok C_WR no data DIR ok SPD ok 1738 2761007 RCM5 07927 7200 s REF ok, 606 T_LR ok DIR ok SPD ok 3123 2761008 RCM5 04570 7200 s REF T_LR ok, not stored T_AR ok, stored DIR ok SPD ok 5231 2761009 RCM8 09310 7200 s REF T_LR ok, not stored T_AR ok, stored DIR ok SPD ok

KIEL276 Time Series Data from Moored Current Meters, V276-10
V276-10: Pressure and temperature (upper panel)and vector time series (lower) of low pass filtered daily averages; instrument depths are best estimates (see sec. 4).

KIEL276 Time Series Data from Moored Current Meters, V276-10
Mooring V276-10: statistics from low pass filtered daily averages
v27610 Depth Days Mean Mean Time Scale Fluxes Stand.-Dev. its Momentum Temperature -------------- ----------------- ---------- -------- ----------- SPD DIR STAB U V T u v t <uv> <dm> <ut> <vt> 379 283 0.3 135 0.07 0.2 -0.2 13.8 13 19 23 0 5 0.1 -0.3 2.6 3.4 0.2 612 283 0.5 202 0.15 -0.2 -0.5 11.4 16 22 24 1 16 0.1 -0.2 2.4 3.2 0.1 815 283 0.4 161 0.11 0.1 -0.3 9.9 18 22 9 2 29 0.0 0.1 2.3 2.8 0.1 1120 283 0.3 248 0.12 -0.3 -0.1 NaN 22 22 NaN 2 32 NaN NaN 1.7 2.1 NaN 1222 283 0.2 236 0.13 -0.2 -0.1 7.7 20 20 11 1 24 0.0 0.0 1.0 1.6 0.1 1726 283 0.6 221 0.36 -0.4 -0.5 4.9 14 21 11 0 2 -0.0 0.0 1.2 1.6 0.1 3116 283 0.5 130 0.25 0.3 -0.3 2.7 13 16 11 -0 -15 -0.0 0.0 1.2 1.6 0.0 5231 283 0.1 118 0.08 0.1 -0.1 2.4 10 11 11 0 80 -0.0 0.0 1.7 1.4 0.0 Legend: Depth : best estimate of instrument depth as from logs, mooring model and measured data Days : length of record SPD, DIR: mean speed/(cm/s) and direction s : directional stability of flow (mean vector speed / mean scalar speed) U, V : mean East and North component of flow, cm/s T : mean temperature its : integral time scale (first zero crossing of autocorrelation function) u, v, t :deviations from average <uv>d : momentum flux <md> : direction of momentum flux

KIEL276 Time Series Data from Moored Current Meters, V276-10

KIEL276 Time Series Data from Moored Current Meters, V276-11
KIEL276 Time Series Data
Madeira Abyssal Plain
33°N, 022°W, 5280 m water depth
V276-11
27-OCT-1989 - 25-SEP-1990
Mooring information ******************* General Mooring ID : V276-11/ KPO 678 Deployed : Date: 27-OCT-1989 Ship / Cruise: Meteor M11/2 Recovered : Date: 25-SEP-1990 Ship / Cruise: Meteor M14/1 Latitude N : 33.103 Longitude E : -021.905 Water depth : 5317 m (PN, corrected) Magn. Anom. : -11 (interpolated) Project : KIEL276 time series station PI : T.J. Mueller Data origin : IfM Kiel Depths : nominal as of logs and IMP static model Remarks 1) Mooring All mooring components according to log of launch and all depths nominal as from logs and from static model. Note: this mooring had (designed) 90 m less nylon rope than V27609; 30 m were added during launch because of larger water depth. 2) Data Raw data available as V27611*.RAW with * as instrument counter top to bottom in mooring line; copied to corresponding RCM*.RAW and edited to get RCM*.EDT with * as S/N of RCM. CALAAN.M applied RCM 06160 has corrupted raw data file: nominal 6 columns, but also 774 rows with 12 columns and one row with more than 18 (23) columns. When sorted to 6 column array, the time basis gets ok as compared to the instrument's start/stop log. Data in the beginning are ok until ca. record 1000; later noisy; arctic TEMP graphically edited and interpolated; SPD is noisy and partly somewhat too low; standard deviation in band pass SPD around M2 tide lower (<=40%) than in all other instruments. Data however kept finally. CHECK_ROTOR_CA ok with vertically averaged standard deviation of SPD around M2 tide 0.4 cm/s +/- 0.08 cm/s (including RCM06160). RCM data pre1-level processed and at sampling rates in RCM*.dat. RCM data at pre2-level processd and at sampling rate in V27611_iii.dat. Compiled by: T.J. Mueller Date: 13-FEB-2011

KIEL276 Time Series Data from Moored Current Meters, V276-11
V276-11: Mooring sketch with nominal depths as from logs and mooring model (see sec. 2.4).

KIEL276 Time Series Data from Moored Current Meters, V276-11
Instruments: All depths are nominal as from logs and mooring model (see sec. 2.4.) Depth Moor_ID Type S/N Sampling Sensor Remarks ----------------------------------------------------------------------------- 394 2761101 RCM8 09726 7200 s e-board S/N 1107, DSU S/N 2215; short record, stops 16-APR-1990, due to data overflow in early DSU's REF 232 T_LR ok PRES ok, initially 327 dbar, median 314 dbar DIR ok SPD ok 627 2761102 RCM4 07330 7200 s REF ok, 235 T_LR ok COND ok PRES ok, initially 554 dbar, median 544 dbar DIR ok SPD ok, 8 rev/count with rev=8 revolutions/count 830 2761103 RCM4 06051 7200 s REF ok, 381 T_LR ok DIR ok SPD ok, 8 rev/count 832 2761104 TK50 006 7200 s no data recorder with 11 thermistors equally distributed 50 m downwards 1135 2761105 RCM5 07924 7200 s REF 646 T_LR COND ok, SAL too low, 0-77 mS/cm DIR ok SPD 8 rev/count 1238 2761106 RCM8 09727 7200 s stop 22-APR-1990, low voltage on main battery REF 700 T_LR ok COND ok, SAL too low DIR ok SPD ok 1741 2761107 RCM5 07925 7200 s REF 285 T_LR ok DIR ok SPD ok, 4 rev/count 3126 2761108 RCM5 06160 7200 s stop 02-FEB-1990 REF 160 T_AR ok DIR ok SPD ok, 4 rev/count 5267 2761109 RCM8 09728 7200 s REF 470, jump to REF=512 at record ca. 2250 T_AR ok until record ca. 3500, 30-AUG-1990 DIR ok SPD ok

KIEL276 Time Series Data from Moored Current Meters, V276-11
V276-11: Pressure and temperature (upper panel)and vector time series (lower) of low pass filtered daily averages; instrument depths are best estimates (see sec. 4).

KIEL276 Time Series Data from Moored Current Meters, V276-11
Mooring V276-11: statistics from low pass filtered daily averages
v27611 Depth Days Mean Mean Time Scale Fluxes Stand.-Dev. its Momentum Temperature -------------- ----------------- ---------- -------- ----------- SPD DIR STAB U V T u v t <uv> <dm> <ut> <vt> 328 168 4.7 178 0.54 0.1 -4.7 14.4 17 19 19 26 58 -0.4 -0.0 7.2 5.0 0.4 562 330 0.5 162 0.08 0.2 -0.5 11.8 18 31 24 2 12 -0.0 -0.4 4.3 5.1 0.2 765 330 0.6 209 0.12 -0.3 -0.5 10.1 18 31 19 0 2 0.0 -0.1 3.2 3.9 0.1 1070 330 0.9 251 0.28 -0.8 -0.3 8.6 16 27 22 -1 -19 0.0 0.0 2.1 2.9 0.2 1173 168 1.2 250 0.66 -1.2 -0.4 8.0 14 9 18 0 85 0.4 0.1 1.6 1.1 0.3 1676 330 1.6 268 0.70 -1.6 -0.1 5.0 16 19 15 -0 -74 -0.0 0.0 1.6 1.4 0.2 3086 330 1.0 333 0.65 -0.5 0.9 NaN 27 16 NaN 0 90 NaN NaN 1.3 0.8 NaN 5266 330 1.3 282 0.60 -1.2 0.3 NaN 17 28 NaN -0 -83 NaN NaN 1.8 1.4 NaN Legend: Depth : best estimate of instrument depth as from logs, mooring model and measured data Days : length of record SPD, DIR: mean speed/(cm/s) and direction s : directional stability of flow (mean vector speed / mean scalar speed) U, V : mean East and North component of flow, cm/s T : mean temperature its : integral time scale (first zero crossing of autocorrelation function) u, v, t :deviations from average <uv> : momentum flux d
<md> : direction of momentum flux

KIEL276 Time Series Data from Moored Current Meters, V276-11

KIEL276 Time Series Data from Moored Current Meters, V276-12
KIEL276 Time Series Data
Madeira Abyssal Plain
33°N, 022°W, 5280 m water depth
V276-12
25-SEP-1990 - 27-JAN-1992
Mooring information ******************* General Mooring ID : V276-12/ KPO 685 Deployed : Date: 25-SEP-1990 Ship / Cruise: Meteor M14/1 Recovered : Date: 27-JAN-1992 Ship / Cruise: Poseidon P189/1 Latitude N : 33.149 Longitude E : -021.888 Water depth : 5335 m (HS corrected, during recovery 5250+55=5305 m) Magn. Anom. : -11 (bridge) Project : KIEL276 time series station PI : T.J. Mueller Data origin : IfM Kiel Depths : nominal as of logs and IMP static model Remarks 1) Mooring All mooring components and all instrument depths nominal as from logs and static model. 2) Data Raw data available. Raw data copied from V27612*.raw => RCMiiiii.raw; Reference checked against nominal reference. RCMiiiii.raw edited to RCMiiiii.edt, then processed with CALAAN.M to get pre1_ph3/RCMiiiii.dat. Result checked for rotor calibration with CECK_ROTOR_CAL.M; ok within error bounds, i.e. all standard deviations of band pass filtered (around M2) SPD are within 15% limits averaged standard deviation. Systematic decrease with depth probably due to other variability around M2 which could not be filtered out due to too coarse resolution in time. RCM data pre1-level processed and at sampling rates in RCM*.dat. RCM data at pre2-level processed and at sampling rate in V27612_iii.dat. Compiled by: T.J. Mueller Date: 25-MAR-2012

KIEL276 Time Series Data from Moored Current Meters, V276-12
V276-12: Mooring sketch with nominal depths as from logs and mooring model (see sec. 2.4).

KIEL276 Time Series Data from Moored Current Meters, V276-12
Instruments: All depths are nominal as from logs and mooring model (see sec. 2.4.) Depth Moor_ID Type S/N Sampling Sensor Remarks ----------------------------------------------------------------------------- 294 2761201 RCM8 09313 7200 s clock 2 h ahead; clock corrected REF ok, 452 T_LR ok C_WR ok, offset in SAL PRES constant N=1023 reading, not converted DIR ok SPD ok 527 2761202 RCM4 02528 7200 s REF ok, 370 T_LR ok PRES ok, initially 455 dbar DIR ok SPD ok 730 2761203 RCM4 07343 7200 s REF ok, 292 (except first few records) T_LR ok COND ok, nonlinear drift in SAL DIR ok SPD ok, 8 rev/count 732 2761204 TK50 01525 7200 s bad data, not processed; 1035 2761205 RCM5 06681 7200 s Short record; tape stopped after 1785 records and restarted by shock at release of mooring; confirmed by launch & release records, and pronounced peak in spectrum of SPD at M2 tide. => processed data stored for further use. REF ok, with errors T_LR ok C_HR ok, but offset in SAL DIR ok SPD ok 1138 2761206 RCM8 09323 7200 s Date set too late by 304 d, corrected REF ok, 839 T_LR ok COND ok PRES ok, initially 107, median 1062 dbar DIR ok SPD ok 1641 2761207 RCM5 07927 7200 s REF ok T_LR ok DIR ok SPD ok, 4 rev/count 3025 2761208 RCM5 04570 7200 s REF bad, nominally 545 T_LR ok, not stored T_AR ok DIR ok SPD ok, 4 rev/count 5287 2761209 RCM8 09344 7200 s flooded, bottom cap lost, no data

KIEL276 Time Series Data from Moored Current Meters, V276-12
V276-12: Pressure and temperature (upper panel)and vector time series (lower) of low pass filtered daily averages; instrument depths are best estimates (see sec. 4).

KIEL276 Time Series Data from Moored Current Meters, V276-12
Mooring V276-12: statistics from low pass filtered daily averages
v27612 Depth Days Mean Mean Time Scale Fluxes Stand.-Dev. its Momentum Temperature -------------- ----------------- ---------- -------- ----------- SPD DIR STAB U V T u v t <uv> <dm> <ut> <vt> 199 486 4.5 117 0.31 4.0 -2.0 16.1 32 18 13 -6 -63 -1.8 0.3 11.1 10.7 0.4 433 486 1.9 119 0.25 1.6 -0.9 12.9 37 20 20 -1 -80 -0.7 0.1 5.8 5.5 0.3 636 486 1.3 102 0.20 1.2 -0.3 10.9 39 22 30 2 22 -0.7 0.1 4.6 5.0 0.2 941 146 1.2 335 0.33 -0.5 1.1 9.8 10 23 16 0 2 -0.0 0.3 1.5 3.7 0.1 1044 486 0.6 252 0.20 -0.6 -0.2 8.7 35 24 32 2 24 -0.3 0.1 2.3 2.8 0.2 1547 486 0.7 235 0.29 -0.6 -0.4 5.5 18 18 43 0 4 -0.1 0.3 1.6 2.2 0.3 2967 486 0.2 167 0.13 0.1 -0.2 2.8 23 18 34 -0 -39 -0.0 0.0 1.3 1.4 0.0 Legend: Depth : best estimate of instrument depth as from logs, mooring model and measured data Days : length of record SPD, DIR: mean speed/(cm/s) and direction s : directional stability of flow (mean vector speed / mean scalar speed) U, V : mean East and North component of flow, cm/s T : mean temperature its : integral time scale (first zero crossing of autocorrelation function) u, v, t :deviations from average <uv> : momentum flux d
<md> : direction of momentum flux

KIEL276 Time Series Data from Moored Current Meters, V276-12
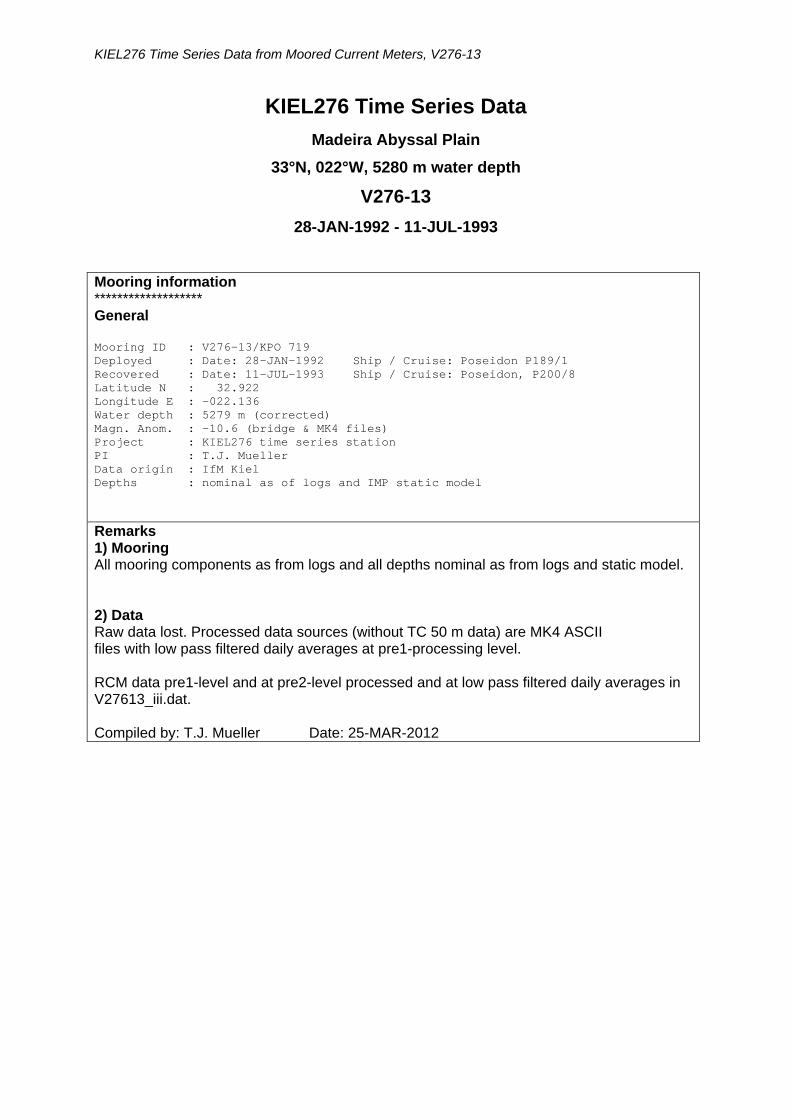
KIEL276 Time Series Data from Moored Current Meters, V276-13
KIEL276 Time Series Data
Madeira Abyssal Plain
33°N, 022°W, 5280 m water depth
V276-13
28-JAN-1992 - 11-JUL-1993
Mooring information ******************* General Mooring ID : V276-13/KPO 719 Deployed : Date: 28-JAN-1992 Ship / Cruise: Poseidon P189/1 Recovered : Date: 11-JUL-1993 Ship / Cruise: Poseidon, P200/8 Latitude N : 32.922 Longitude E : -022.136 Water depth : 5279 m (corrected) Magn. Anom. : -10.6 (bridge & MK4 files) Project : KIEL276 time series station PI : T.J. Mueller Data origin : IfM Kiel Depths : nominal as of logs and IMP static model
Remarks 1) Mooring All mooring components as from logs and all depths nominal as from logs and static model. 2) Data Raw data lost. Processed data sources (without TC 50 m data) are MK4 ASCII files with low pass filtered daily averages at pre1-processing level. RCM data pre1-level and at pre2-level processed and at low pass filtered daily averages in V27613_iii.dat. Compiled by: T.J. Mueller Date: 25-MAR-2012

KIEL276 Time Series Data from Moored Current Meters, V276-13
V276-13: Mooring sketch with nominal depths as from logs and mooring model (see sec. 2.4).

KIEL276 Time Series Data from Moored Current Meters, V276-13
Instruments: All depths are nominal as from logs and mooring model (see sec. 2.4.) Depth Moor_ID Type S/N Sampling Sensor Remarks ----------------------------------------------------------------------------- 294 2761301 RCM7 00131 7200 s REF T_LR ok COND ok PRES ok, starts with 282 dbar, after first event 270 dbar after second event 265 dbar DIR ok SPD ok until first current event, 16-JUN-1992 527 2761302 RCM5 02712 7200 s no MK4 data 731 2761303 RCM5 06051 7200 s no MK4 data 732 2761304 TK50 6 & 1520 7200 s stop 13-MAR-1993; thermistors no. 7 & 8 ok until then 1035 2761305 RCM5 07928 7200 s REF T_LR ok COND ok DIR ok SPD ok, 8 rev/count 1138 2761306 RCM8 09311 7200 s REF T_LR ok COND ok DIR ok SPD ok 1642 2761307 RCM5 05252 7200 s flooded, no data 3025 2761308 RCM5 02317 7200 s REF T_AR ok DIR ok SPD ok, 4 rev/count 5229 2761309 RCM8 09345 7200 s REF T_AR ok DIR ok SPD ok, 4 rev/count

KIEL276 Time Series Data from Moored Current Meters, V276-13
V276-13: Pressure and temperature (upper panel)and vector time series (lower) of low pass filtered daily averages; instrument depths are best estimates (see sec. 4).

KIEL276 Time Series Data from Moored Current Meters, V276-13
Mooring V276-13: statistics from low pass filtered daily averages
v27613 Depth Days Mean Mean Time Scale Fluxes Stand.-Dev. its Momentum Temperature -------------- ----------------- ---------- -------- ----------- SPD DIR STAB U V T u v t <uv> <dm> <ut> <vt> 285 131 1.9 115 0.17 1.7 -0.8 14.2 6 17 16 29 17 0.5 2.2 5.6 10.9 0.7 1026 522 1.3 174 0.26 0.1 -1.3 9.1 16 31 27 2 24 0.4 0.9 4.2 4.6 0.4 1129 522 1.0 171 0.22 0.2 -1.0 8.6 16 26 17 1 26 0.5 0.8 4.1 4.4 0.3 3019 522 0.9 247 0.35 -0.8 -0.4 2.8 19 20 26 -2 -64 -0.0 0.0 2.3 1.7 0.0 5229 522 0.5 166 0.19 0.1 -0.5 2.5 21 16 27 -2 -75 -0.0 0.0 3.4 1.8 0.0 Legend: Depth : best estimate of instrument depth as from logs, mooring model and measured data Days : length of record SPD, DIR: mean speed/(cm/s) and direction s : directional stability of flow (mean vector speed / mean scalar speed) U, V : mean East and North component of flow, cm/s T : mean temperature its : integral time scale (first zero crossing of autocorrelation function) u, v, t :deviations from average <uv> : momentum flux d
<md> : direction of momentum flux

KIEL276 Time Series Data from Moored Current Meters, V276-13

KIEL276 Time Series Data from Moored Current Meters, V276-14
KIEL276 Time Series Data
Madeira Abyssal Plain
33°N, 022°W, 5280 m water depth
V276-14
11-JUL-1993 - 17-SEP-1994
Mooring information ******************* General Mooring ID : V276-14/KPO 739 Deployed : Date: 11-JUL-1993 Ship / Cruise: Poseidon, P200/8 Recovered : Date: 17-SEP-1994 Ship / Cruise: Poseidon, P202 Latitude N : 32.994 Longitude E : -022.002 Water depth : 5282 m (corrected) Magn. Anom. : -11.7 (bridge & MK4 files) Project : KIEL276 time series station PI : J.J. Waniek & T.J. Mueller Data origin : IfM Kiel Depths : nominal as of logs and IMP static model Remarks 1) Mooring On recovery, the top buoy turned out to be squeezed; it had no buoyancy at all, but weight in the mooring line as it did not surface on its own. The reason probably was a strong current event in the Mediterranean water level, a 'super MEDDY' which forced the top buoy to much larger depth than its rating (400 dbar), damaged it and then forced the mooring's top down to the bottom due to lack of buoyancy. As the two top instruments had pressure sensors which were rated to 2000 dbar only, these two instruments were flooded. The deepest instrument (5200 m designed) was flooded, now known due to bad bottom caps in early RCM8s. Only the 3000 m designed instrument was not affected. All mooring components and all instrument depths nominal as from logs and from static model until loss of top buoyancy. 2) Data Raw data lost. Processed data sources are MK4 ASCII files with low pass filtered daily averages at pe1-processing level in V27614_iii.dat. After the event, the instruments from deeper than 700 m were turned top down and gave no reasonable current data although they were 6000 dbar depth rated; the MK4 data processing cut these data. Only the instrument at 3000 m designed depth with almost full record. RCM data pre1-level and at pre2-level processed and at low pass filtered daily averages in V27613_iii.dat. Compiled by: T.J. Mueller Date: 26-MAR-2012

KIEL276 Time Series Data from Moored Current Meters, V276-14
V276-14: Mooring sketch with nominal depths as from logs and mooring model (see sec. 2.4)

KIEL276 Time Series Data from Moored Current Meters, V276-14
Instruments: All depths are nominal as from logs and mooring model (see sec. 2.4.) Depth Moor_ID Type S/N Sampling Sensor Remarks ----------------------------------------------------------------------------- 324 2761401 RCM8 00094 7200 s flooded, no data 592 2761402 RCM8 09818 7200 s flooded, no data 795 2761403 RCM8 10659 7200 s data (daily averaged) as MK4 until 29-OCT-1993 REF T_LR ok COND ok DIR ok SPD ok 797 2761404 TK50 1525 7200 s recorder with 11 thermistors equally distributed 50 m downwards data (daily averaged) as MK4 until 29-OCT-1993; 8 out of 11 thermistors. 1100 2761405 RCM8 09820 7200 s data (daily averaged) as MK4 until 29-OCT-1993 REF T_LR ok COND ok DIR ok SPD ok 1203 2761406 RCM8 09727 7200 s data (daily averaged) as MK4 until 29-OCT-1993 REF T_LR ok COND ok DIR ok SPD ok 1706 2761407 RCM8 10662 7200 s data (daily averaged) as MK4 until 29-OCT-1993 REF T_LR ok COND ok DIR ok SPD ok 3087 2761408 RCM8 10660 7200 s REF T_AR ok DIR ok until 05-AUG-1994 SPD ok until 05-AUG-1994 5232 2761409 RCM8 10500 7200 s flooded, no data

KIEL276 Time Series Data from Moored Current Meters, V276-14
V276-14: Pressure and temperature (upper panel)and vector time series (lower) of low pass filtered daily averages; instrument depths are best estimates (see sec. 4)

KIEL276 Time Series Data from Moored Current Meters, V276-14
Mooring V276-14: statistics from low pass filtered daily averages
v27614 Depth Days Mean Mean Time Scale Fluxes Stand.-Dev. its Momentum Temperature -------------- ----------------- ---------- -------- ----------- SPD DIR STAB U V T u v t <uv> <dm> <ut> <vt> 713 104 6.7 184 0.71 -0.5 -6.7 10.3 12 10 8 -19 -45 -0.0 0.5 5.6 5.6 0.2 1018 104 5.5 193 0.74 -1.3 -5.3 9.3 8 9 7 -13 -20 -0.8 -0.6 4.1 7.0 0.5 1121 104 4.7 195 0.75 -1.2 -4.6 8.8 7 8 6 -9 -16 -0.4 -0.7 3.5 6.5 0.5 1624 104 2.9 214 0.93 -1.6 -2.4 5.1 7 11 14 -0 -5 -0.1 0.3 1.0 1.4 0.3 3037 386 0.8 292 0.35 -0.7 0.3 2.7 14 14 54 -1 -75 -0.0 -0.0 2.1 1.4 0.0 Legend: Depth : best estimate of instrument depth as from logs, mooring model and measured data Days : length of record SPD, DIR: mean speed/(cm/s) and direction s : directional stability of flow (mean vector speed / mean scalar speed) U, V : mean East and North component of flow, cm/s T : mean temperature its : integral time scale (first zero crossing of autocorrelation function) u, v, t :deviations from average <uv> : momentum flux d
<md> : direction of momentum flux

KIEL276 Time Series Data from Moored Current Meters, V276-14

KIEL276 Time Series Data from Moored Current Meters, V276-15
KIEL276 Time Series Data
Madeira Abyssal Plain
33°N, 022°W, 5280 m water depth
V276-15
18-Sep-1994 - 14-Oct-1995
Mooring information ******************* General Mooring ID : V276-15/KPO 757 Deployed : Date: 18-Sep-1994 Ship / Cruise: POSEIDON 202 Recovered : Date: 14-Oct-1995 Ship / Cruise: POSEIDON 212/4 Latitude N : 32.957 Longitude E : -022.022 Water depth : 5277 (corrected) Magn. Anom. : -10.5° (bridge) Project : KIEL276 time series PI : J.J. Waniek & T.J. Mueller Data origin : IfM Kiel Depths : nominal as of logs and IMP static model Remarks 1) Mooring All mooring components and all instrument depths nominal as from logs and static model. 2) RCM data All current meters are Aanderaa RCM7/8. All records at 7200 s sampling interval. All RCM logs: stop is noted with wrong date (16.10.1995); correct stop date is 15.10.1995 - Processed data available (J. Reppin) in specially formatted files (RCM) at sampling interval; there, non-existing pressure and conductivity data are at offset value or zero. - Re-processing by TJM V27615i.raw copied to RCMiiiii.raw checking reference where IIIII is the instrument's S/N. RCMiiiii.raw edited with launch/recovery comments => RCMiiiii.edt. RCMiiiii.edt processed with CALAAN.M => RCMiiiii.dat; see RCMiiiii.log for details. Check rotor cal is ok, mean standard deviation 0.5 cm/s +/- 0.02 cm/s RCM data pre1-level processed and at sampling rates in RCM*.dat. RCM data at pre2-level processd and at sampling rate in V27615_iii.dat. 3) TRAP data at IOW Compiled by: T.J. Mueller, IFMK Date: 24-JUN-2012

KIEL276 Time Series Data from Moored Current Meters, V276-15
V276-15: Mooring sketch with nominal depths as from logs and mooring model (see sec. 2.4)

KIEL276 Time Series Data from Moored Current Meters, V276-15
Instruments: All depths are nominal as from logs and mooring model (see sec. 2.4.) Depth Moor_ID Type S/N Sensors Remarks ----------------------------------------------------------------------------- 270 2761501 RCM8 09813 REF ok, 318 T_LR ok C_HR ok; S with offset PRES ok, initially 190 dbar, median 180 dbar DIR ok SPD ok 455 2761502 TRAP 56 data at IOW 510 2761503 RCM8 09816 REF ok, 303 T_LR ok COND ok, S ok; maybe offset PRES ok, initially 435 dbar, median 434 dbar DIR ok SPD ok 715 2761504 RCM8 09833 short record: 329 d (26430 words, nominally 30804); records bad & cut at the end; no time end mark; check M2 tide ok; REF ok, 452 T_LR ok COND ok, S maybe offset; S interpolated DIR ok SPD ok 716 2761505 TK50 01294 raw data bad with large jumps and not processed; 50 m thermistor cable; no cal info; 1021 2761506 RCM8 09821 REF ok, 355 T_LR ok COND S ok; maybe offset DIR ok SPD ok 1073 2761507 TRAP 57 with inclinometer, data at IOW 1127 2761508 RCM8 10658 T_LR ok COND ok, S maybe offset PRES ok, initially 1042 dbar, median 1147 dbar DIR ok SPD ok 1630 2761509 RCM8 09345 no data (DSU bad) 2037 2761510 TRAP 58 data at IOW 3034 2761511 RCM8 09344 REF ok, 235 T_LR ok, low resolution; not stored T_AR ok DIR ok SPD ok 4193 2761512 TRAP 59 data at IOW 5227 2761513 RCM8 09312 REF ok, 239 T_LR ok T_AR ok DIR ok SPD ok

KIEL276 Time Series Data from Moored Current Meters, V276-15
V276-15: Pressure and temperature (upper panel)and vector time series (lower) of low pass filtered daily averages; instrument depths are best estimates (see sec. 4)

KIEL276 Time Series Data from Moored Current Meters, V276-15
Mooring V276-15: statistics from low pass filtered daily averages
v27615 Depth Days Mean Mean Time Scale Fluxes Stand.-Dev. its Momentum Temperature -------------- ----------------- ---------- -------- ----------- SPD DIR STAB U V T u v t <uv> <dm> <ut> <vt> 217 388 3.3 170 0.18 0.5 -3.2 15.8 44 27 33 -61 -60 -6.1 -0.1 15.5 13.1 1.1 457 388 2.5 192 0.19 -0.5 -2.4 12.6 45 27 36 -28 -55 -2.6 -0.3 10.6 9.6 0.6 663 327 2.8 213 0.26 -1.5 -2.3 10.8 52 30 31 -23 -52 -1.4 -0.3 8.2 7.4 0.4 969 388 1.9 214 0.29 -1.0 -1.5 9.3 41 28 15 -5 -54 -0.5 -0.2 4.9 4.5 0.3 1075 388 1.8 204 0.39 -0.7 -1.6 8.8 39 27 33 -2 -52 -0.6 -0.1 3.4 3.3 0.3 3002 388 1.1 229 0.43 -0.9 -0.7 2.8 14 19 37 0 83 -0.0 0.0 2.0 1.8 0.0 5226 388 1.2 243 0.33 -1.1 -0.5 2.4 12 13 25 -1 -58 -0.0 -0.0 3.5 3.3 0.0 Legend: Depth : best estimate of instrument depth as from logs, mooring model and measured data Days : length of record SPD, DIR: mean speed/(cm/s) and direction s : directional stability of flow (mean vector speed / mean scalar speed) U, V : mean East and North component of flow, cm/s T : mean temperature its : integral time scale (first zero crossing of autocorrelation function) u, v, t :deviations from average <uv> : momentum flux d
<md> : direction of momentum flux

KIEL276 Time Series Data from Moored Current Meters, V276-15

KIEL276 Time Series Data from Moored Current Meters, V276-16
KIEL276 Time Series Data
Madeira Abyssal Plain
33°N, 022°W, 5280 m water depth
V276-16
15-Oct-1995- 24-Jun-1996
Mooring information ******************* General Mooring ID : V276_16/KPO 775 Deployed : Date: 15-Oct-1995 Ship / Cruise: POSEIDON 212/4 Recovered : Date: 24-Jun-1996 Ship / Cruise: METEOR 36/2 Latitude N : 33.002 Longitude E : -021.964 Water depth : 5274 (corrected) Magn. Anom. : -10.3 Project : KIEL276 time series PI : J.J. Waniek & T.J. Mueller Data origin : IfM Kiel Depths : nominal as of logs and IMP static model Remarks 1) Mooring All mooring components according to log of launch; top buoyancy with nominal 450 kp assumed 30 kp less for design, namely 420 kp. All instrument depths nominal as from static model. 2) RCM data All current meters are Aanderaa RCM7/8. All records at 7200 s sampling interval. - Processed data available (J. Reppin) in specially formatted files (RCM) at sampling interval; there, non-existing pressure and conductivity data are at offset value or zero. - Re-processing by TJM RCMiiiii copied to RCMiiiii.raw checking reference where IIIII is the instrument's S/N. RCMiiiii.raw edited with launch/recovery comments => RCMiiiii.edt. RCMiiiii.edt processed with CALAAN.M => RCMiiiii.dat; see RCMiiiii.log for details. RCM data pre1-level processed and at sampling rates in RCM*.dat. RCM data at pre2-level processed and at sampling rate in V27616_iii.dat. 3) TRAP data: info at IOW. Compiled by: T.J. Mueller, IFMK Date: 17-Oct-2003

KIEL276 Time Series Data from Moored Current Meters, V276-16
V276-16: Mooring sketch with nominal depths as from logs and mooring model (see sec. 2.4)

KIEL276 Time Series Data from Moored Current Meters, V276-16
Instruments: All depths are nominal as from logs and mooring model (see sec. 2.4.) Depth Moor_ID Type S/N Sensors Remarks ----------------------------------------------------------------------------- 265 2761601 RCM8 10501 T_LR ok, PRES initially 295 dbar, median 277 dbar DIR ok SPD ok, spectrum at inert. period ok, at M2 tide much less pronounced than usual 450 2761602 TRAP 49 inclinometer 1111, data at IOW 505 2761603 RCM8 09726 record only until 08-JAN-1996, then stop; record restart on day of recovery; clock ok REF ok, 323 T_LR ok PRES ok, linar range calibration, intially 490 dbar, median 471 dbar DIR ok SPD ok 1012 2761604 RCM8 10659 REF ok, 312 T_LR ok COND ok, SAL at starts nonlinearly DIR ok SPD ok 1063 2761605 TRAP 62 inclinometer 1112, data info at IOW 1619 2761606 RCM8 10504 REF ok, 579 T_LR ok DIR ok SPD ok until record 1225 (day 91) 2026 2761607 TRAP 60 data info at IOW 3022 2761608 RCM8 11576 T_AR ok DIR ok SPD ok 4179 2761609 TRAP 48 data info at IOW 5213 2761610 RCM8 10502 T_AR ok DIR ok SPD rotor ok until record 123 (day 10); imploding glass buoyancy destroyed rotor counter

KIEL276 Time Series Data from Moored Current Meters, V276-16
V276-16: Pressure and temperature (upper panel)and vector time series (lower) of low pass filtered daily averages; instrument depths are best estimates (see sec. 4)

KIEL276 Time Series Data from Moored Current Meters, V276-16
Mooring V276-16: statistics from low pass filtered daily averages
v27616 Depth Days Mean Mean Time Scale Fluxes Stand.-Dev. its Momentum Temperature -------------- ----------------- ---------- -------- ----------- SPD DIR STAB U V T u v t <uv> <dm> <ut> <vt> 249 250 8.8 64 0.62 7.9 3.9 15.2 14 19 39 -22 -33 -1.3 -2.5 8.9 9.9 0.9 489 82 9.9 65 0.91 9.0 4.2 11.6 12 8 10 -1 -88 0.7 0.0 6.0 4.5 0.2 996 250 2.6 61 0.59 2.2 1.2 9.1 19 27 18 -3 -33 -0.2 0.1 2.9 3.3 0.2 1603 100 2.5 43 0.83 1.7 1.8 5.2 10 7 10 -0 -78 -0.1 0.1 1.8 1.1 0.1 3012 250 0.6 47 0.37 0.5 0.4 2.8 15 30 38 0 24 -0.0 -0.0 1.1 1.4 0.0 5213 10 2.0 62 0.73 1.7 0.9 2.4 3 3 2 -1 -28 -0.0 0.0 1.1 1.7 0.0 Legend: Depth : best estimate of instrument depth as from logs, mooring model and measured data Days : length of record SPD, DIR: mean speed/(cm/s) and direction s : directional stability of flow (mean vector speed / mean scalar speed) U, V : mean East and North component of flow, cm/s T : mean temperature its : integral time scale (first zero crossing of autocorrelation function) u, v, t :deviations from average <uv>d : momentum flux <md> : direction of momentum flux

KIEL276 Time Series Data from Moored Current Meters, V276-16

KIEL276 Time Series Data from Moored Current Meters, V276-17
KIEL276 Time Series Data
Madeira Abyssal Plain
33°N, 022°W, 5280 m water depth
V276-17
28-FEB-1996 - 06-AUG-1997
Mooring information ******************* General Mooring ID : V276_17/KPO 781 Deployed : Date: 28-FEB-1996 Ship / Cruise: METEOR 36/2 Recovered : Date: 06-AUG-1997 Ship / Cruise: POSEIDON 231 Latitude N : 33.000 Longitude E : -022.000 Water depth : 5294 m (HYDROSWEEP+55 m) Magn. Anom. : -10 Project : KIEL276 time series PI : J.J. Waniek & T.J. Mueller Data origin : IfM Kiel Depths : nominal as of logs and IMP static model Remarks 1) Mooring All mooring components according to log of launch; top buoyancy with nominal 450 kp assumed 30 kp less for design, namely 420 kp. All instrument depths nominal as from logs and static model. 2) RCM data Raw data available. All current meters are Aanderaa RCM7/8. All records at 7200 s sampling interval. - Processed data available (J. Reppin) in specially formatted files (RCM) at sampling interval; there, non-existing pressure and conductivity data are at offset value or zero. - Re-processing by TJM RCMiiiii renamed to RCMiiiii.raw checking reference where IIIII is the instrument's S/N. RCMiiiii.raw edited with launch/recovery comments => RCMiiiii.edt. RCMiiiii.edt processed with CALAAN.M => RCMiiiii.dat; see RCMiiiii.log for details. No stop times taken => just offset clock correction from start time & no correction for drift, RCM data pre1-level processed and at sampling rates in RCM*.dat. RCM data at pre2-level processed and at sampling rate in V27617_iii.dat. 3) TRAP data Info at IOW. Compiled by: T.J. Mueller, IFMK Date: 17-Oct-2003; revised August 2013

KIEL276 Time Series Data from Moored Current Meters, V276-17
V276-17: Mooring sketch with nominal depths as from logs and mooring model (see sec. 2.4)

KIEL276 Time Series Data from Moored Current Meters, V276-17
Instruments: All depths are nominal as from logs and mooring model (see sec. 2.4.) Depth Moor_ID Type S/N Sensors Remarks ----------------------------------------------------------------------------- 318 2761701 RCM8 11348 REF ok, 398 T_HR ok PRES ok, initially 238 dbar, median 233 dbar DIR ok SPD ok 504 2761702 TRAP 56 inclinometer 1111; data info at IOW 559 2761703 RCM8 11442 REF ok, 251 T_LR ok COND ok, S maybe offset PRES sensor faied, data not stored DIR ok SPD ok 1014 2761704 TRAP 57 inclinometer 1112; data info at IOW 1068 2761705 RCM8 09833 REF ok, 452 T_LR ok COND ok, S maybe offset DIR ok SPD ok 1673 2761706 RCM8 09821 REF ok, 355 T_LR ok C_HR ok, S maybe offset DIR ok SPD ok 2079 2761707 TRAP 58 data info at IOW 3075 2761708 RCM8 09345 from deck log, time correction of -360 s estimated & applied REF ok, 952 T_LR ok, not stored T_AR ok, overwrites T_LR DIR ok SPD ok 5233 2761709 RCM8 09312 REF ok, 323 (corr., wrongly 239 in RCM log) T_LR ok, not stored T_AR ok, overwrites T_LR DIR ok SPD ok

KIEL276 Time Series Data from Moored Current Meters, V276-17
V276-17: Pressure and temperature (upper panel)and vector time series (lower) of low pass filtered daily averages; instrument depths are best estimates (see sec. 4)

KIEL276 Time Series Data from Moored Current Meters, V276-17
Mooring V276-17: statistics from low pass filtered daily averages
v27617 Depth Days Mean Mean Time Scale Fluxes Stand.-Dev. its Momentum Temperature -------------- ----------------- ---------- -------- ----------- SPD DIR STAB U V T u v t <uv> <dm> <ut> <vt> 269 401 9.0 98 0.71 8.9 -1.3 15.5 25 18 27 -3 -26 -2.1 -0.1 7.9 8.1 0.6 510 401 5.7 104 0.72 5.5 -1.4 12.5 24 23 34 -2 -65 -0.9 -0.2 5.3 4.9 0.4 1019 401 1.4 105 0.55 1.4 -0.4 8.5 22 22 14 -1 -40 -0.2 -0.0 1.8 1.9 0.3 1624 401 0.3 187 0.22 -0.0 -0.3 5.5 24 16 29 0 18 -0.1 0.1 1.1 1.2 0.2 3045 401 0.6 274 0.34 -0.6 0.0 2.8 21 18 44 -1 -40 -0.0 0.0 1.3 1.4 0.0 5232 401 2.2 305 0.67 -1.8 1.3 2.4 18 23 35 -6 -51 -0.0 0.0 3.2 2.8 0.0 Legend: Depth : best estimate of instrument depth as from logs, mooring model and measured data Days : length of record SPD, DIR: mean speed/(cm/s) and direction s : directional stability of flow (mean vector speed / mean scalar speed) U, V : mean East and North component of flow, cm/s T : mean temperature its : integral time scale (first zero crossing of autocorrelation function) u, v, t :deviations from average <uv>d : momentum flux <md> : direction of momentum flux

KIEL276 Time Series Data from Moored Current Meters, V276-17

KIEL276 Time Series Data from Moored Current Meters, V276-18
KIEL276 Time Series Data
Madeira Abyssal Plain
33°N, 022°W, 5280 m water depth
V276-18
07-AUG-1997 - 24-JAN-1999
Mooring information ******************* General Mooring ID : V276_18/KPO 826 Deployed : Date: 07-AUG-1997 Ship / Cruise: POSEIDON 231/3 Recovered : Date: 24-JAN-1999 Ship / Cruise: POSEIDON 247/2 Latitude N : 32.992 Longitude E : -021.998 Water depth : 5277 m (corrected) Magn. Anom. : -10 Project : KIEL276 time series PI : J.J. Waniek & T.J. Mueller Data origin : IfM Kiel Depths : nominal as of logs and IMP static model Remarks 1) Mooring All mooring components according to log of launch. According to the original draft, there maybe two mistakes in the deployment log: - 100 m instead of 70 m above RCM11576 (3000 m level) - 100 m instead of 30 m above RCM10502 (5185 m level) But all depths are nominal as from logs & static model. 2) Data All RCM records at 7200 s sampling interval. Processed data sources are PH3 formatted files at sampling interval; RCM10578: P sensor, with corrected coefficients recalibrated; Meteor lengths 30 m corrected to 100 m; length 70 m corrected to 100 m as in original draft to meet best pressure measurements at RCM 10501, RCM 10578 and RCM 10577. RCM data pre1-level processed and at sampling rates in RCM*.dat. RCM data at pre2-level processed and at sampling rate in V27618_iii.dat. 3) Trap data No traps deployed; info at IOW. Compiled by: T.J. Mueller, IFMK Date: 07-Jan-2001, revised Oct 2012 TJM 07.05.2008

KIEL276 Time Series Data from Moored Current Meters, V276-18
V276-18: Mooring sketch with nominal depths as from logs and mooring model (see sec. 2.4)

KIEL276 Time Series Data from Moored Current Meters, V276-18
Instruments: All depths are nominal as from logs and mooring model (see sec. 2.4.) Depth Moor_ID Type S/N Sensors Remarks ----------------------------------------------------------------------------- 393 2761801 RCM8 10501 T_LR ok PRES ok, linear range calibration, initially 258 dbar, median 259 dbar DIR ok SPD ok 628 2761802 RCM8 10559 no data (bad battery) 1132 2761803 RCM8 10578 last good record 18-Dec-1998 T_LR ok PRES ok, linear range calibration initially 1012 dbar, median 1005 dbar DIR ok SPD ok 1736 2761804 RCM8 10577 last good record 14-Dec-1998 T_LR ok PRES ok, linear range calibration, initially 1568 dbar , median 1563 dbar DIR ok SPD ok 3120 2761805 RCM8 11576 T_AR ok DIR ok SPD ok 5227 2761806 RCM8 10502 T_AR ok DIR ok SPD ok

KIEL276 Time Series Data from Moored Current Meters, V276-18
V276-18: Pressure and temperature (upper panel)and vector time series (lower) of low pass filtered daily averages; instrument depths are best estimates (see sec. 4)

KIEL276 Time Series Data from Moored Current Meters, V276-18
Mooring V276-18: statistics from low pass filtered daily averages
v27618 Depth Days Mean Mean Time Scale Fluxes Stand.-Dev. its Momentum Temperature -------------- ----------------- ---------- -------- ----------- SPD DIR STAB U V T u v t <uv> <dm> <ut> <vt> 281 532 5.8 124 0.51 4.8 -3.2 14.9 37 24 30 -16 -47 -3.4 1.7 8.7 8.6 0.6 1020 496 1.0 163 0.31 0.3 -1.0 8.7 32 28 27 -4 -48 -0.7 0.3 2.7 2.6 0.4 1625 492 1.2 214 0.50 -0.7 -1.0 5.2 21 22 33 -2 -57 -0.3 0.3 2.3 1.8 0.3 3052 532 0.7 231 0.36 -0.6 -0.5 2.8 20 12 21 0 79 -0.0 -0.0 1.9 1.2 0.0 5225 532 0.5 217 0.26 -0.3 -0.4 2.4 19 27 21 -1 -78 -0.0 0.0 2.1 1.1 0.0 Legend: Depth : best estimate of instrument depth as from logs, mooring model and measured data Days : length of record SPD, DIR: mean speed/(cm/s) and direction s : directional stability of flow (mean vector speed / mean scalar speed) U, V : mean East and North component of flow, cm/s T : mean temperature its : integral time scale (first zero crossing of autocorrelation function) u, v, t :deviations from average <uv> : momentum flux d
<md> : direction of momentum flux

KIEL276 Time Series Data from Moored Current Meters, V276-18

KIEL276 Time Series Data from Moored Current Meters, V276-19
KIEL276 Time Series Data
Madeira Abyssal Plain
33°N, 022°W, 5280 m water depth
V276-19
25-Jan-1999 - 13-Apr-2000
Mooring information ******************* General Mooring ID : V276-19/KPO 855 Deployed : Date: 25-Jan-1999 Ship / Cruise: Poseidon 247/2 Recovered : Date: 13-Apr-2000 Ship / Cruise: Poseidon 259/1 Latitude N : 32.9683 Longitude E : -022.0083 Water depth : 5271 m (corrected) Magn. Anom. : - 9.5 deg Project : KIEL276 time series station PI : J.J. Waniek & T.J. Mueller Data origin : IfM Kiel Depths : nominal as of logs and IMP static model Remarks 1) Mooring All mooring components according to log of launch; top buoyancy with nominal 450 kp assumed 30kp less for design, namely 420 kp. All instrument depths nominal as from logs and static model. 2) RCM data All RCM records at 7200 s sampling interval. Processed data sources are PH3 formatted files at sampling interval; RCM10578: P sensor, with corrected coefficients recalibrated; RCM data pre1-level processed and at sampling rates in RCM*.dat. RCM data at pre2-level processed and at sampling rate in V27619_iii.dat. 3) TRAP data Info at IOW. Compiled by: T.J. Mueller Date: 07-Jan-2001, revised 16.10.2003 and Feb. 2012:

KIEL276 Time Series Data from Moored Current Meters, V276-19
V276-19: Mooring sketch with nominal depths as from logs and mooring model (see sec. 2.4)

KIEL276 Time Series Data from Moored Current Meters, V276-19
Instruments: All depths are nominal as from logs and mooring model (see sec. 2.4.) Depth Moor_ID Type S/N Sampling Sensor Remarks ----------------------------------------------------------------------------- 303 2761901 RCM8 10551 7200 s T_LR ok PRES ok, initially 250 dbar, median 246 dbar DIR ok SPD ok 538 2761902 RCM8 10577 7200 s T_LR ok PRES no record DIR ok SPD ok 1042 2761903 RCM8 10578 7200 s T_LR ok PRES ok, initially 980 dbar, median 973 dbar DIR ok SPD ok 1646 2761904 RCM8 10550 7200 s T_LR ok DIR ok SPD ok 2052 2761905 TRAP 46 1 month data info at IOW 3040 2761906 RCM8 10555 7200 s T_LR ok DIR ok SPD ok 3113 2761907 TRAP 62 1 month data info at IOW 5221 2761908 RCM8 10579 7200 s flooded, no data
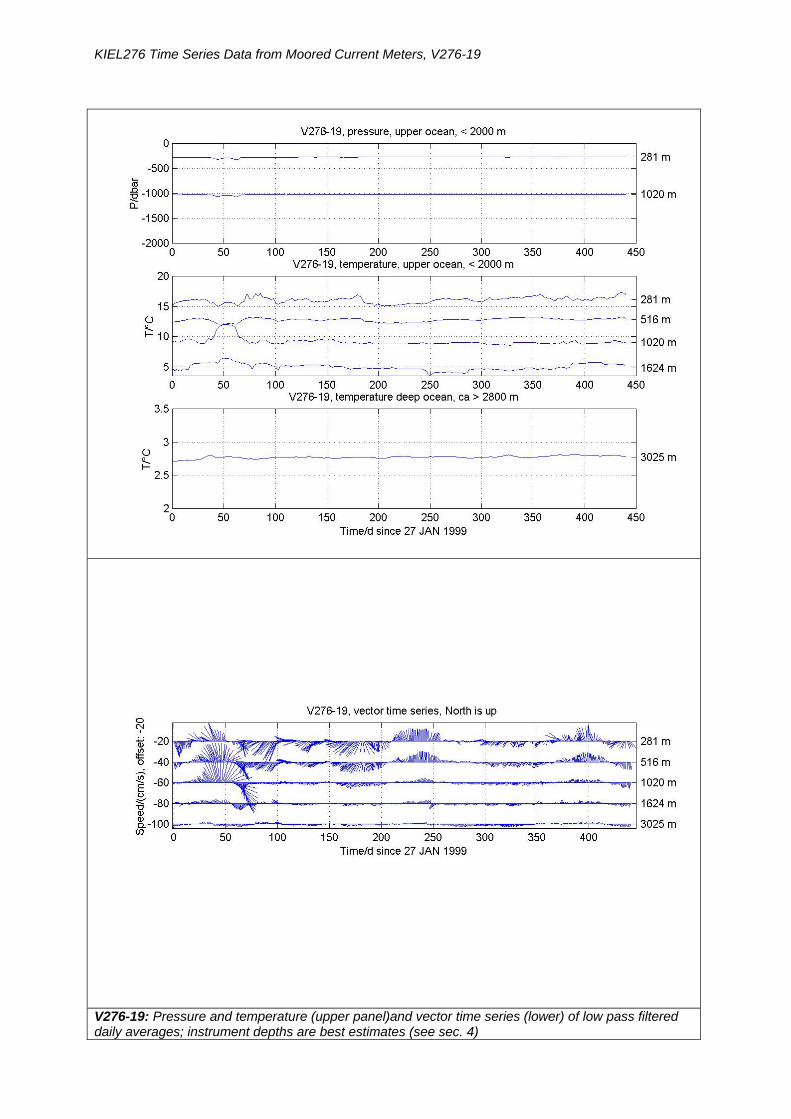
KIEL276 Time Series Data from Moored Current Meters, V276-19
V276-19: Pressure and temperature (upper panel)and vector time series (lower) of low pass filtered daily averages; instrument depths are best estimates (see sec. 4)

KIEL276 Time Series Data from Moored Current Meters, V276-19
Mooring V276-19: statistics from low pass filtered daily averages
v27619 Depth Days Mean Mean Time Scale Fluxes Stand.-Dev. its Momentum Temperature -------------- ----------------- ---------- -------- ----------- SPD DIR STAB U V T u v t <uv> <dm> <ut> <vt> 281 441 3.6 246 0.42 -3.3 -1.5 16.0 23 14 21 6 18 -0.7 -0.9 5.7 7.1 0.5 516 441 2.2 247 0.35 -2.0 -0.9 12.8 11 13 19 0 1 -0.5 -0.5 4.1 6.0 0.3 1020 441 1.0 260 0.20 -0.9 -0.2 9.2 9 9 24 -7 -17 1.9 0.7 4.5 6.4 0.6 1624 441 1.5 257 0.58 -1.4 -0.3 5.8 13 10 38 0 63 0.1 0.2 2.0 1.8 0.5 3025 441 1.5 250 0.69 -1.4 -0.5 2.8 23 12 34 0 75 0.0 0.0 1.7 1.2 0.0
Legend: Depth : best estimate of instrument depth as from logs, mooring model and measured data Days : length of record SPD, DIR: mean speed/(cm/s) and direction s : directional stability of flow (mean vector speed / mean scalar speed) U, V : mean East and North component of flow, cm/s T : mean temperature its : integral time scale (first zero crossing of autocorrelation function) u, v, t :deviations from average <uv> : momentum flux d
<md> : direction of momentum flux

KIEL276 Time Series Data from Moored Current Meters, V276-19

KIEL276 Time Series Data from Moored Current Meters, V276-20
KIEL276 Time Series Data
Madeira Abyssal Plain
33°N, 022°W, 5280 m water depth
V276-20
14-Apr-2000 - 14-Apr-2000
Mooring information ******************* General Mooring ID : V276-20/KPO 856 Deployed : Date: 14-Apr-2000 Ship / Cruise: Poseidon 259/1 Recovered : Date: 14-Apr-2000 Ship / Cruise: Poseidon 259/1 Latitude N : 32.9683 Longitude E : -021.986 Water depth : 5266 m (corrected) Magn. Anom. : - 9.5 deg Project : KIEL276 time series station PI : J.J. Waniek & T.J. Mueller Data origin :: IfM Kiel Remarks Mooring line broke during launching in Kevlar termination above TRAP at 3050 m designed depth. Upper part recovered including RCM10555 at 3000 m designed depth, lower part of mooring including TRAP 52, RCM10551 and two releases lost because of lack of backup buoyancy (ca. -60 kp at TRAP 52). Data no data Compiled by: T.J. Mueller Date: 29-Jun-2002

KIEL276 Time Series Data from Moored Current Meters, V276-20
V276-20: mooring line broke while launching; bottom part lost; mooring not re-deployed; no data

KIEL276 Time Series Data from Moored Current Meters, V276-20

KIEL276 Time Series Data from Moored Current Meters, V276-20

KIEL276 Time Series Data from Moored Current Meters, V276-21
KIEL276 Time Series Data
Madeira Abyssal Plain
33°N, 022°W, 5280 m water depth
V276-21
02-Feb-2001 - 19-Feb-2002
Mooring information ******************* General Mooring ID : V276-21/KPO 912 Deployed : Date: 02-Feb-2001 Ship / Cruise: Poseidon 268 Recovered : Date: 19-Feb-2002 Ship / Cruise: Poseidon 283/2 Latitude N : 32.9250 Longitude E : -022.0250 Water depth : 5272 m (corrected) Magn. Anom. : -10 deg Project : KIEL276 time series station PI : J.J. Waniek & T.J. Mueller Data origin : IOW Depths : nominal as of logs and IMP static model Remarks 1) Mooring Upward 150 kHz ADCP on top buoy. Pair of sediment TRAPs designed at 2000 m. Single TRAP at 3050 m. All instrument depths as from static mooring model with components as in deck log. 2) RCM & ADCP data ADCP data still to be processed. RCM data pre1-level processed and at sampling rates in RCM*.dat. RCM data at pre2-level processd and at sampling rate in V27621_iii.dat. 3) TRAP data Info at IOW. Compiled by: T.J. Mueller Date: 12-Aug-2002, revised Oct 2013

KIEL276 Time Series Data from Moored Current Meters, V276-21
V276-21: Mooring sketch with nominal depths as from logs and mooring model (see sec. 2.4)

KIEL276 Time Series Data from Moored Current Meters, V276-21
Instruments: All depths are nominal as from logs and mooring model (see sec. 2.4.) Depth Moor_ID Type S/N Sampling Sensor Remarks ----------------------------------------------------------------------------- 203 2762101 ADCP 559 3200 60 pings, 30 bins, 20 bins available, 16 m each 279 2762102 RCM8 10554 7200 s T_LR ok PRES ok, linear range calibration initially 255 dbar, median 246 dbar DIR ok SPD ok 514 2762103 RCM8 10577 7200 s Raw data file partially corrupt from 03-SEP-2001 on. Bad parts are of order of some days. Bad parts eliminated from raw data. Result stored in RCM10577.EDT for processing. Missing parts interpolated linearly in time. T_LR ok PRES sensor encapsulated; slow adjustment to environmental pressure; no reliable data. DIR ok SPD ok 1014 2762104 RCM8 10578 7200 s T_LR ok DIR ok SPD ok 1621 2762105 RCM8 10550 7200 s T_LR ok DIR ok SPD ok 2028 2762106 TRAP 47 53 two TRAPs, 2X12 bottles inclinometer 1112 data info at IOW 3024 2762107 RCM8 10555 7200 s T_LR ok DIR ok SPD ok 3090 2762108 TRAP 55 data info at IOW 5222 2762109 RCM8 10581 7200 s T_LR ok, no arctic range avaiable DIR ok SPD rotor lost during deployment; data set to dummy.

KIEL276 Time Series Data from Moored Current Meters, V276-21
V276-21: Pressure and temperature (upper panel)and vector time series (lower) of low pass filtered daily averages; instrument depths are best estimates (see sec. 4)

KIEL276 Time Series Data from Moored Current Meters, V276-21
Mooring V276-21: statistics from low pass filtered daily averages
v27621 Depth Days Mean Mean Time Scale Fluxes Stand.-Dev. its Momentum Temperature -------------- ----------------- ---------- -------- ----------- SPD DIR STAB U V T u v t <uv> <dm> <ut> <vt> 263 379 5.5 227 0.52 -4.0 -3.7 15.7 14 17 36 18 40 0.8 0.1 7.2 7.7 0.5 498 379 3.9 234 0.59 -3.2 -2.3 12.6 14 14 22 10 38 0.4 -0.1 4.8 5.3 0.3 999 379 2.4 250 0.51 -2.2 -0.8 9.2 11 9 11 7 24 -1.1 0.3 3.6 5.0 0.5 1608 379 2.3 250 0.72 -2.2 -0.8 5.5 11 11 20 1 46 -0.2 0.1 2.0 2.0 0.4 3016 379 1.7 237 0.70 -1.4 -0.9 2.8 14 13 19 1 68 -0.0 0.0 1.9 1.2 0.0 5222 379 NaN NaN NaN NaN NaN 2.5 NaN NaN NaN NaN NaN NaN NaN NaN NaN 0.0 Legend: Depth : best estimate of instrument depth as from logs, mooring model and measured data Days : length of record SPD, DIR: mean speed/(cm/s) and direction s : directional stability of flow (mean vector speed / mean scalar speed) U, V : mean East and North component of flow, cm/s T : mean temperature its : integral time scale (first zero crossing of autocorrelation function) u, v, t :deviations from average <uv>d : momentum flux <md> : direction of momentum flux

KIEL276 Time Series Data from Moored Current Meters, V276-21

KIEL276 Time Series Data from Moored Current Meters, V276-22
KIEL276 Time Series Data
Madeira Abyssal Plain
33°N, 022°W, 5280 m water depth
V276-22
22-Feb-2002 - 20-APR-2003
Mooring information ******************* General Mooring ID : V276-22/KPO 938 Deployed : Date: 22-Feb-2002 Ship / Cruise: Poseidon 283-2 Recovered : Date: 20-APR-2003 Ship / Cruise: Poseidon 297 Latitude N : 32.868 Longitude E : -022.029 Water depth : 5275 m (corrected) Magn. Anom. : -9 (interpolated between V276-21 and V276-23) Project : KIEL276 time series station PI : J.J. Waniek & T.J. Mueller Data origin : IOW Depths : nominal as of logs and IMP static model Compiled by: T.J. Mueller Date: 22-Aug-2004 Remarks 1) Mooring Upward 150 kHz ADCP on top buoy not deployed (P283 cruise report, Ch. 5, Tab. 1). ADCP Buoy without ADCP has 450 kp buoyancy; replaced by 'normal' buoy with 450 kp for static model. Pair of parallel sediment TRAPs at 2000 m designed depth. Single TRAP at 3050 m designed depth. All instrument depths nominal from static mooring model with components as in deck log. 2) RCM data RCM data pre1-level processed and at sampling rates in RCM*.dat. RCM data at pre2-level processed and at sampling rate in V27622_iii.dat. 3) TRAP data Info at IOW.

KIEL276 Time Series Data from Moored Current Meters, V276-22
V276-22: Mooring sketch with nominal depths as from logs and mooring model (see sec. 2.4)

KIEL276 Time Series Data from Moored Current Meters, V276-22
Instruments: All depths are nominal as from logs and mooring model (see sec. 2.4.) Depth Moor_ID Type S/N Sampling Sensor Remarks ----------------------------------------------------------------------------- 204 2762201 ADCP -9999 ADCP not deployed, See cruise reports POS283 and POS297 281 2762202 RCM8 10554 7200 s REF 344, e-board 2595, DSU 3690 time base correction by 20 h T_LR ok PRES ok, 6300 dbar linear range calibration, initially 200 dbar, median 188 dbar DIR ok SPD ok 516 2762203 RCM8 10577 7200 s Raw data file corrupt from 28-Nov-2002 on, file hand edited in RCM10577.EDT to keep good parts. REF 342, e-board 2626, DSU 6717 T_LR ok PRES nonlinear trend from initially 400 dbar to 300 dbar at day 200, then stable; sensor probably encapsulated; data not taken. DIR ok SPD ok 984 2762204 RCM8 10578 7200 s REF 318, e-board 2624, DSU 3644 T_LR ok DIR ok SPD ok 1594 2762205 RCM8 10550 7200 s REF 271, e-board 2590, DSU 5937 T_LR ok DIR ok SPD ok 2019 2762206 TRAP 47 & 53 two particle TRAPs parallel, inclination meter 1112. Info at IOW. 3020 2762207 RCM8 10555 7200 s REF 414, e-board 2601, DSU 3392 T_LR ok, no arctic range DIR ok SPD ok 3089 2762208 TRAP 55 particle TRAP 5224 2762209 RCM8 10558 7200 s clock has 18 h offset REF 258, e-board 2589, DSU 3689 T_LR ok, no arctic range PRES ok, 6300 dbar range calibration; initially & median 5352 dbar (5249 m) DIR ok SPD ok until 24-MAY-2002 rotor stuck and set to dummy thereafter

KIEL276 Time Series Data from Moored Current Meters, V276-22
V276-22: Pressure and temperature (upper panel)and vector time series (lower) of low pass filtered daily averages; instrument depths are best estimates (see sec. 4)

KIEL276 Time Series Data from Moored Current Meters, V276-22
Mooring V276-22: statistics from low pass filtered daily averages
v27622 Depth Days Mean Mean Time Scale Fluxes Stand.-Dev. its Momentum Temperature -------------- ----------------- ---------- -------- ----------- SPD DIR STAB U V T u v t <uv> <dm> <ut> <vt> 223 419 1.2 269 0.12 -1.2 -0.0 16.4 34 17 19 22 72 0.5 -1.0 10.5 7.0 0.5 458 419 0.2 9 0.03 0.0 0.2 13.1 36 15 21 7 78 1.1 -0.5 7.7 5.2 0.3 930 419 0.2 360 0.06 -0.0 0.2 9.2 30 14 23 3 73 -0.4 -0.1 4.1 3.0 0.2 1548 419 0.5 271 0.24 -0.5 0.0 6.7 15 12 29 1 66 0.0 -0.0 2.0 1.6 0.5 2992 419 0.6 274 0.26 -0.6 0.0 2.8 12 13 17 -0 -83 -0.0 0.0 2.0 1.7 0.0 5223 88 1.8 168 0.49 0.4 -1.7 2.5 12 15 12 -2 -26 0.0 0.0 2.5 3.0 0.0 Legend: Depth : best estimate of instrument depth as from logs, mooring model and measured data Days : length of record SPD, DIR: mean speed/(cm/s) and direction s : directional stability of flow (mean vector speed / mean scalar speed) U, V : mean East and North component of flow, cm/s T : mean temperature its : integral time scale (first zero crossing of autocorrelation function) u, v, t :deviations from average <uv>d : momentum flux <md> : direction of momentum flux

KIEL276 Time Series Data from Moored Current Meters, V276-22

KIEL276 Time Series Data from Moored Current Meters, V276-23
KIEL276 Time Series Data
Madeira Abyssal Plain
33°N, 022°W, 5280 m water depth
V276-23
22-APR-2003 - 16-MAR-2004
Mooring information ******************* General Mooring ID : V276-23/KPO 1083 Deployed : Date: 22-APR-2003 Ship / Cruise: Poseidon 297 Recovered : Date: 16-MAR-2004 Ship / Cruise: Poseidon 308 Latitude N : 32.828 Longitude E : -022.003 Water depth : 5264 m (corrected) Magn. Anom. : -7.3 deg (W) Project : KIEL276 time series station PI : J.J. Waniek & T.J. Mueller Data origin : IOW Depths : nominal as of logs and IMP static model Remarks 1) Mooring ADCP Buoy designed on top replaced by 'normal' buoy with 450 kp. Pair of parallel sediment TRAPs at 2000 m designed depth. Single TRAP at 3050 m designed depth. All instrument depths nominal from static mooring model with components as in deck log. 2) RCM data RCM data pre1-level processed and at sampling rates in RCM*.dat. RCM data at pre2-level processd and at sampling rate in V27623_iii.dat. 3)TRAP data Info at IOW. Compiled by: T.J. Mueller Date: 22-Aug-2004, rev. Sep 2013

KIEL276 Time Series Data from Moored Current Meters, V276-23
V276-23: Mooring sketch with nominal depths as from logs and mooring model (see sec. 2.4)

KIEL276 Time Series Data from Moored Current Meters, V276-23
Instruments: All depths are nominal as from logs and mooring model (see sec. 2.4.) Depth Moor_ID Type S/N Sampling Sensor Remarks ----------------------------------------------------------------------------- 244 2762301 RCM8 10554 7200 s REF 344, e-board 2595, DSU 3690 T_LR ok PRES ok, 6300 dbar linear range calibration, initially 215 dbar, median 203 dbar DIR ok SPD ok 479 2762302 RCM8 10577 7200 s battery leakage, no record 980 2762303 RCM8 10578 7200 s REF 318, e-board 2624, DSU 3644 T_LR ok DIR ok SPD ok 1589 2762304 RCM8 10550 7200 s REF 271, e-board 2590, DSU 5937 T_LR ok DIR ok SPD ok 2014 2762305 TRAP -9999 -9999 two particle TRAPs, inclinometer 1112 data info at IOW 3013 2762306 RCM8 10555 7200 s REF 414, e-board 2601, DSU 3392 T_LR ok, no arctic range DIR ok SPD stuck between day 40 and 300, set to dummy there ok elsewhere 3082 2762307 TRAP -9999 particle TRAP data info at IOW 5214 2762308 RCM8 10558 7200 s REF 258, e-board 2589, DSU 3689 T_LR ok, no arctic range PRES ok, 6300 dbar range calibration, median 5383 dbar (5279 m at 33°N) DIR ok SPD ok

KIEL276 Time Series Data from Moored Current Meters, V276-23
V276-23: Pressure and temperature (upper panel)and vector time series (lower) of low pass filtered daily averages; instrument depths are best estimates (see sec. 4)

KIEL276 Time Series Data from Moored Current Meters, V276-23
Mooring V276-23: statistics from low pass filtered daily averages
v27623 Depth Days Mean Mean Time Scale Fluxes Stand.-Dev. its Momentum Temperature -------------- ----------------- ---------- -------- ----------- SPD DIR STAB U V T u v t <uv> <dm> <ut> <vt> 243 326 4.1 220 0.47 -2.6 -3.1 15.9 19 15 16 -9 -47 1.7 0.8 6.7 6.6 0.5 979 326 3.7 236 0.60 -3.1 -2.1 9.4 19 9 14 6 49 -2.8 -1.3 6.1 6.0 0.5 1588 326 2.0 242 0.71 -1.8 -1.0 5.7 36 16 16 0 69 0.0 0.1 2.1 1.9 0.2 3013 68 0.3 102 0.14 0.3 -0.1 2.8 10 13 8 1 64 -0.0 0.0 1.7 1.0 0.0 5214 326 1.4 238 0.53 -1.2 -0.8 2.5 18 19 8 0 82 0.0 0.0 2.3 1.3 0.0
Legend: Depth : best estimate of instrument depth as from logs, mooring model and measured data Days : length of record SPD, DIR: mean speed/(cm/s) and direction s : directional stability of flow (mean vector speed / mean scalar speed) U, V : mean East and North component of flow, cm/s T : mean temperature its : integral time scale (first zero crossing of autocorrelation function) u, v, t :deviations from average <uv> : momentum flux d
<md> : direction of momentum flux

KIEL276 Time Series Data from Moored Current Meters, V276-23

KIEL276 Time Series Data from Moored Current Meters, V276-24
KIEL276 Time Series Data
Madeira Abyssal Plain
33°N, 022°W, 5280 m water depth
V276-24
17-MAR-2004 - 06-MAY-2005
Mooring information ************************* General Mooring ID : V276-24/KPO 1084 Deployed : Date: 17-MAR-2004 Ship / Cruise: Poseidon 308 Recovered : Date: 06-MAY-2005 Ship / Cruise: Poseidon 321 Latitude N : 32.818 Longitude E : -022.000 Water depth : 5270 m (corrected) Magn. Anom. : -09 deg (W) Project : KIEL276 time series station PI : J.J. Waniek & T.J. Mueller Data origin : IOW Depths : nominal as of logs and IMP static model Remarks 1) Mooring Top buoy with with reduced buoyancy, 420 kp. TRAPs at 2000 m and at 3050 m designed depth. All instrument depths nominal as from static mooring model with components as in deck log. 2) RCM data RCM data pre1-level processed and at sampling rates in RCM*.dat. RCM data at pre2-level processed and at sampling rate in V27624_iii.dat. 3) TRAP data Info at IOW. Compiled by: T.J. Mueller Date: 12-SEP-2005

KIEL276 Time Series Data from Moored Current Meters, V276-24
V276-24: Mooring sketch with nominal depths as from logs and mooring model (see sec. 2.4)

KIEL276 Time Series Data from Moored Current Meters, V276-24
Instruments: All depths are nominal as from logs and mooring model (see sec. 2.4.) Depth Moor_ID Type S/N Sampling Sensor Remarks ----------------------------------------------------------------------------- 227 2762401 RCM8 10554 7200 s REF 344, e-board 2595, DSU 3690 T_LR ok PRES ok, 6300 dbar linear range calibration initially 185 dbar, median 172 dbar DIR ok SPD ok 532 2762402 RCM8 10581 7200 s REF 301, e-board 2592, DSU 7097 T_LR ok DIR ok SPD ok 1047 2762403 RCM8 10578 7200 s short record of 61 d only; self check DSU ok REF 342, e-board 2624, DSU 3644 T_LR ok DIR ok SPD ok 1598 2762404 RCM8 10558 7200 s REF 257, e-board 2589, DSU 3689 T_LR ok PRES ok 6300 dbar linear range calibration initially 1580, median 1581 dbar DIR ok SPD ok 2000 2762405 TRAP 001 SE particle TRAP with DL 1112 inclination meter REF 711 ch 2 inclination (no calibration sheet accessable) ch 3 constant 2995 2762406 RCM8 10555 7200 s REF 414, e-board 2601, DSU 3392 T_LR ok, no arctic range DIR ok SPD ok 3063 2762407 TRAP 002 particle TRAP 5220 2762408 RCM8 10550 7200 s REF 258, e-board 2590, DSU 5937 T_LR ok, no arctic range DIR ok SPD ok

KIEL276 Time Series Data from Moored Current Meters, V276-24
V276-24: Pressure and temperature (upper panel)and vector time series (lower) of low pass filtered daily averages; instrument depths are best estimates (see sec. 4)

KIEL276 Time Series Data from Moored Current Meters, V276-24
Mooring V276-24: statistics from low pass filtered daily averages
v27624 Depth Days Mean Mean Time Scale Fluxes Stand.-Dev. its Momentum Temperature -------------- ----------------- ---------- -------- ----------- SPD DIR STAB U V T u v t <uv> <dm> <ut> <vt> 229 412 3.3 248 0.38 -3.1 -1.2 16.5 9 21 35 6 7 0.5 0.1 5.0 8.3 0.7 534 412 2.5 255 0.40 -2.4 -0.6 12.6 16 24 25 0 1 0.2 0.1 3.1 5.5 0.3 1049 61 2.0 317 0.54 -1.3 1.5 9.0 9 8 7 3 38 0.0 0.4 2.2 2.6 0.3 1600 412 1.0 255 0.36 -1.0 -0.3 5.8 14 13 25 -1 -51 0.2 0.1 2.3 2.1 0.3 2996 412 0.8 272 0.33 -0.8 0.0 2.8 15 15 23 -1 -63 -0.0 -0.0 2.0 1.6 0.0 5220 412 0.6 289 0.24 -0.6 0.2 2.3 15 16 48 -1 -72 0.0 0.0 2.4 1.7 0.0 Legend: Depth : best estimate of instrument depth as from logs, mooring model and measured data Days : length of record SPD, DIR: mean speed/(cm/s) and direction s : directional stability of flow (mean vector speed / mean scalar speed) U, V : mean East and North component of flow, cm/s T : mean temperature its : integral time scale (first zero crossing of autocorrelation function) u, v, t :deviations from average <uv>d : momentum flux <md> : direction of momentum flux

KIEL276 Time Series Data from Moored Current Meters, V276-24

KIEL276 Time Series Data from Moored Current Meters, V276-25
KIEL276 Time Series Data
Madeira Abyssal Plain
33°N, 022°W, 5280 m water depth
V276-25
08-MAY-2005 - 10-APR-2007
Mooring information ******************* General Mooring ID : V276-25/KPO 1084 Deployed : Date: 08-MAY-2005 Ship / Cruise: Poseidon 321 Recovered : Date: 10-APR-2007 Ship / Cruise: Poseidon 349 Latitude N : 33.000 Longitude E : -021.998 Water depth : 5273 m (corrected) Magn. Anom. : -8.6 deg (W) Project : KIEL276 time series station PI : J.J. Waniek Data origin : IOW Depths : nominal as of logs and IMP static model Remarks 1) Mooring Sounding depth at 1500 m/s is 5218 m. Longlines - destroying coating of stainless steel wire - in mooring parts on recovery. Top buoy modelled with reduced buoyancy, 420 kp. TRAPs at 2000 m and at 3050 m designed depth. All instrument depths nominal as from static mooring model with components as in deck log. 2) RCM data All raw data in RCM*.ASC; non-relevant records skipped in *.ASC. RCM clocks in DSUs were set prior to launching. No stop logs for RCMs => drift correction in time estimated from deck log and final recorded times. RCM pressure sensors have no in-situ calibration (bad weather). RCM data pre1-level processed and at sampling rates in RCM*.dat. RCM data at pre2-level processed and at sampling rate in V27625_iii.dat. 3) TRAP data Info at IOW. Compiled by: T.J. Mueller Date: 01-MAR-2009

KIEL276 Time Series Data from Moored Current Meters, V276-25
V276-25: Mooring sketch with nominal depths as from logs and mooring model (see sec. 2.4)

KIEL276 Time Series Data from Moored Current Meters, V276-25
Instruments: All depths are nominal as from logs and mooring model (see sec. 2.4.) Depth Moor_ID Type S/N Sampling Sensor Remarks ----------------------------------------------------------------------------- 220 2762501 RCM8 10554 7200 s REF 344, e-board 2595, DSU 3690, from V2762401 T_LR ok PRES ok, 6300 dbar linear range calibration initially 140 dbar, median 135 dbar DIR ok SPD ok until day 254, rotor off then and data set to dummy 526 2762502 RCM8 10581 7200 s REF no data; RCM failed 1041 2762503 RCM8 08411 7200 s REF 325, e-board 6030, DSU 4831 T_LR ok PRES ok, 6300 dbar linear range calibration, initially 935 dbar, median 935 dbar DIR ok SPD ok 1592 2762504 RCM8 10558 7200 s REF 257, e-board 2589, DSU 3689, from V2762404 T_LR ok PRES ok, 6300 dbar linear range calibration, initially 1528 dbar, median 1531 dbar DIR ok SPD ok 1993 2762505 TRAP 001 SE particle TRAP with DL 1112, inclination meter REF 711, ch 2 ok, inclination, raw data stored ch 3 constant, not stored 2988 2762506 RCM8 10555 7200 s REF 414, e-board 2601, DSU 3392, from V2762406 T_LR ok, no arctic range DIR ok SPD ok 3056 2762507 TRAP 002 SE particle TRAP 5212 2762508 RCM8 09812 7200 s REF 686 T_LR ok, not stored T_AR ok, stored DIR ok SPD ok, rotor stuck from day 400 on, data set to dummy

KIEL276 Time Series Data from Moored Current Meters, V276-25
V276-25: Pressure and temperature (upper panel)and vector time series (lower) of low pass filtered daily averages; instrument depths are best estimates (see sec. 4)

KIEL276 Time Series Data from Moored Current Meters, V276-25
Mooring V276-25: statistics from low pass filtered daily averages
v27625 Depth Days Mean Mean Time Scale Fluxes Stand.-Dev. its Momentum Temperature -------------- ----------------- ---------- -------- ----------- SPD DIR STAB U V T u v t <uv> <dm> <ut> <vt> 162 289 6.3 241 0.47 -5.5 -3.0 17.0 15 16 14 -11 -51 2.5 0.3 10.2 10.0 0.5 983 699 1.8 219 0.26 -1.1 -1.4 9.5 28 29 27 -2 -85 0.6 -1.3 7.4 5.3 0.6 1542 699 1.3 251 0.41 -1.2 -0.4 5.9 24 19 22 0 90 0.1 0.0 3.0 2.1 0.3 2957 699 0.7 274 0.38 -0.7 0.1 2.8 15 44 36 -0 -90 -0.0 -0.0 1.7 1.2 0.0 5211 352 1.3 318 0.55 -0.9 0.9 2.5 16 11 16 -1 -83 -0.0 -0.0 2.8 1.1 0.0
Legend: Depth : best estimate of instrument depth as from logs, mooring model and measured data Days : length of record SPD, DIR: mean speed/(cm/s) and direction s : directional stability of flow (mean vector speed / mean scalar speed) U, V : mean East and North component of flow, cm/s T : mean temperature its : integral time scale (first zero crossing of autocorrelation function) u, v, t :deviations from average <uv> : momentum flux d
<md> : direction of momentum flux

KIEL276 Time Series Data from Moored Current Meters, V276-25

KIEL276 Time Series Data from Moored Current Meters, V276-26
KIEL276 Time Series Data
Madeira Abyssal Plain
33°N, 022°W, 5280 m water depth
V276-26
17-APR-2007 - 27-APR-2009
Mooring information ******************* General Mooring ID : V276-26/KPO 1085 Deployed : Date: 17-APR-2007 Ship / Cruise: Poseidon 349 Recovered : Date: 27-APR-2009 Ship / Cruise: Poseidon 383 Latitude N : 33.000 Longitude E : -022.000 Water depth : 5270 m (corrected) Magn. Anom. : -9.5 deg (W) Project : KIEL276 time series station PI : J.J. Waniek Data origin : IOW Depths : nominal as of logs and IMP static model Remarks 1) Mooring Sounding depth at 1500 m/s is 5215 m. Long-lines destroyed coating of some stainless steel wire. Top buoy modelled with reduced buoyancy, 420 kp. TRAPs at 2000 m and at 3050 m designed depth. All instrument depths nominal as from static mooring model with components as in deck log. 2) RCM data In-situ RCM pressure calibration was cancelled due to bad weather before deployment. All raw data in RCM*.RAW with leading columns for [record DD.MM.YYYY hh:mm:ss]; separators '.' and ':' removed by editing; non-relevant rows skipped; result inn *.EDT. RCM clocks were not set before deployment. Last setting of re-used RCM in May 2005 prior to deployment of V27625. No start and no stop logs for RCMs => no drift correction in time. Times in data compare with launch & release times of deck & bridge logs. RCM pressure sensors have no in-situ calibration (no calibration cast due to bad weather). RCM data pre1-level processed and at sampling rates in RCM*.dat. RCM data at pre2-level processd and at sampling rate in V27626_iii.dat. 3) TRAP data Info at IOW. Compiled by: T.J. Mueller Date: 01-MAR-2009

KIEL276 Time Series Data from Moored Current Meters, V276-26
V276-26: Mooring sketch with nominal depths as from logs and mooring model (see sec. 2.4)

KIEL276 Time Series Data from Moored Current Meters, V276-26
Instruments: All depths are nominal as from logs and mooring model (see sec. 2.4.) Depth Moor_ID Type S/N Sampling Sensor Remarks ----------------------------------------------------------------------------- 212 2762601 RCM8 10554 7200 s clock change +2*60 s over 2 years compared to recording interval REF 344 T_LR ok PRES ok, 6300 dbar linear range calibration initially 125 dbar, median 117 dbar DIR ok SPD ok until 07-MAY-2008; thereafter, rotor probably damaged by long-lines 467 2762602 RCM8 10558 7200 s clock change -18*60 s over 2 years compared to recording interval REF 257 T_LR ok PRES much too low under 6300 dbar linear range calibration; initially 265 dbar, median 265 dbar DIR ok SPD ok 1024 2762603 RCM8 08411 7200 s clock change -6*60 s over 2 years compared to recording interval REF 325 T_LR ok PRES ok, 6300 dbar linear range calibration, initially 915 dbar, median 910 dbar DIR ok SPD ok 1577 2762604 RCM8 09344 7200 s clock change 6*60 s over 2 years compared to recording interval REF 257 T_LR ok DIR ok SPD ok 1979 2762605 TRAP 001 SE particle TRAP wih DL 1112, inclination meter REF 711, ch 2 ok, inclination, raw data stored ch 3 constant, not stored 2977 2762606 RCM8 10555 7200 s clock change 5*60 s over 2 years compared to recording interval REF 411 T_LR ok DIR ok SPD ok until 21-NOV-2008, rotor stuck later 3046 2762607 TRAP 002 SE particle TRAP 5208 2762608 RCM8 09812 7200 s flooded, no data

KIEL276 Time Series Data from Moored Current Meters, V276-26
V276-26: Pressure and temperature (upper panel)and vector time series (lower) of low pass filtered daily averages; instrument depths are best estimates (see sec. 4)

KIEL276 Time Series Data from Moored Current Meters, V276-26
Mooring V276-26: statistics from low pass filtered daily averages
v27626 Depth Days Mean Mean Time Scale Fluxes Stand.-Dev. its Momentum Temperature -------------- ----------------- ---------- -------- ----------- SPD DIR STAB U V T u v t <uv> <dm> <ut> <vt> 130 384 6.9 81 0.67 6.8 1.0 17.9 20 15 36 10 83 -3.3 1.2 10.8 6.5 0.8 385 738 3.8 89 0.53 3.8 0.0 13.9 28 18 38 8 76 -0.8 0.0 7.1 4.5 0.4 943 738 1.2 94 0.31 1.2 -0.1 9.4 27 16 18 3 76 -0.2 -0.2 4.0 2.3 0.3 1506 738 0.6 235 0.28 -0.5 -0.3 6.0 22 11 28 0 83 -0.1 0.1 2.1 1.2 0.3 2933 582 0.9 247 0.47 -0.8 -0.3 2.8 13 13 28 0 86 -0.0 -0.0 1.8 0.9 0.0 Legend: Depth : best estimate of instrument depth as from logs, mooring model and measured data Days : length of record SPD, DIR: mean speed/(cm/s) and direction s : directional stability of flow (mean vector speed / mean scalar speed) U, V : mean East and North component of flow, cm/s T : mean temperature its : integral time scale (first zero crossing of autocorrelation function) u, v, t :deviations from average <uv> : momentum flux d
<md> : direction of momentum flux

KIEL276 Time Series Data from Moored Current Meters, V276-26

KIEL276 Time Series Data from Moored Current Meters, V276-27
KIEL276 Time Series Data
Madeira Abyssal Plain
33°N, 022°W, 5280 m water depth
V276-27
28-APR-2009 - 21-APR-2011
Mooring information ******************* General Mooring ID : V276-27/KPO 1086 Deployed : Date: 28-APR-2009 Ship / Cruise: Poseidon 383 Recovered : Date: 21-APR-2011 Ship / Cruise: Merian MSM018/1 Latitude N : 32.959 Longitude E : -021.993 Water depth : 5276 m (corrected) Magn. Anom. : -9 deg (W, from 2007) Project : KIEL276 time series station PI : J.J. Waniek Data origin : IOW Depths : nominal as of logs and IMP static model Remarks 1) Mooring On recovery, mooring broke at 3000 m; second part found and also recovered. Top buoy modelled with reduced buoyancy, 420 kp. TRAPs at 2000 m and at 3050 m designed depth. All instrument depths nominal as from static mooring model with components as in deck log. 2) RCM data No in-situ or lab RCM pressure calibration available. Standard calibrations for temperature and linear range calibration for pressure sensors used. All raw data in RCM*.ASC; non-relevant rows skipped in *.EDT. No setting of RCM clocks prior to launching logged. All times of launching and of release fit with times of associated temperature and pressure changes in data. No start and no stop logs for RCMs => no drift correction in time. RCM data pre1-level processed and at sampling rates in RCM*.dat. RCM data at pre2-level processd and at sampling rate in V27627_iii.dat. 3) TRAP data Info at IOW. Compiled by: T.J. Mueller Date: 23-APR-2012

KIEL276 Time Series Data from Moored Current Meters, V276-27
V276-27: Mooring sketch with nominal depths as from logs and mooring model (see sec. 2.4)

KIEL276 Time Series Data from Moored Current Meters, V276-27
Instruments: All depths are nominal as from logs and mooring model (see sec. 2.4.) Depth Moor_ID Type S/N Sampling Sensor Remarks ----------------------------------------------------------------------------- 216 2762701 RCM8 09349 7200 s REF 511 T_LR ok PRES ok, 6300 dbar linear range calibration initially 120 dbar, median 117 dbar DIR ok SPD ok until 21-MAR-2011, 22:08 522 2762702 RCM8 05881 7200 s REF ok, 392 T_LR ok DIR ok SPD ok until 04-APR-2011, 10:00 1037 2762703 RCM8 04562 7200 s REF ok, 280 T_LR ok DIR ok SPD ok 1588 2762704 RCM8 09932 7200 s REF ok, 615 T_LR ok PRES ok, initially 1512dbar, median 1511dbar DIR ok SPD ok 1989 2762705 TRAP 001 SE particle TRAP and tilt sensor 1112; data at IOW 2984 2762706 RCM8 09832 7200 s REF ok, 433 T_AR ok DIR ok SPD ok until 03-JUL-2009 3053 2762707 TRAP -9999 SE particle TRAP 5210 2762708 RCM8 10578 7200 s REF ok, 318 T_LR ok DIR ok SPD ok

KIEL276 Time Series Data from Moored Current Meters, V276-27
V276-27: Pressure and temperature (upper panel)and vector time series (lower) of low pass filtered daily averages; instrument depths are best estimates (see sec. 4)

KIEL276 Time Series Data from Moored Current Meters, V276-27
Mooring V276-27: statistics from low pass filtered daily averages
v27627 Depth Days Mean Mean Time Scale Fluxes Stand.-Dev. its Momentum Temperature -------------- ----------------- ---------- -------- ----------- SPD DIR STAB U V T u v t <uv> <dm> <ut> <vt> 168 720 1.3 269 0.13 -1.3 -0.0 17.8 24 11 25 8 84 -1.2 -0.3 11.0 6.7 0.7 474 703 1.8 276 0.21 -1.8 0.2 13.3 28 16 25 -3 -86 -0.1 -0.6 8.6 5.8 0.4 989 720 1.5 270 0.36 -1.5 0.0 9.3 38 17 62 -1 -83 -0.3 -0.0 3.8 2.7 0.3 1546 720 1.2 244 0.56 -1.1 -0.5 5.8 20 16 37 1 66 -0.2 0.1 1.7 1.3 0.3 2958 56 0.3 141 0.36 0.2 -0.3 2.8 7 7 11 0 77 -0.0 -0.0 0.9 0.4 0.0 5209 720 0.7 211 0.28 -0.3 -0.6 2.4 20 12 3 1 82 -0.0 -0.0 2.5 1.4 0.0 Legend: Depth : best estimate of instrument depth as from logs, mooring model and measured data Days : length of record SPD, DIR: mean speed/(cm/s) and direction s : directional stability of flow (mean vector speed / mean scalar speed) U, V : mean East and North component of flow, cm/s T : mean temperature its : integral time scale (first zero crossing of autocorrelation function) u, v, t :deviations from average <uv>d : momentum flux <md> : direction of momentum flux

KIEL276 Time Series Data from Moored Current Meters, V276-27

GEOMAR Reports No. Title
1 FS POSEIDON Fahrtbericht / Cruise Report POS421, 08. – 18.11.2011, Kiel - Las Palmas, Ed.: T.J. Müller, 26 pp, DOI: 10.3289/GEOMAR_REP_NS_1_2012
2 Nitrous Oxide Time Series Measurements off Peru – A Collaboration between SFB 754 and IMARPE –, Annual Report 2011, Eds.: Baustian, T., M. Graco, H.W. Bange, G. Flores, J. Ledesma, M. Sarmiento, V. Leon, C. Robles, O. Moron, 20 pp, DOI: 10.3289/GEOMAR_REP_NS_2_2012
3 FS POSEIDON Fahrtbericht / Cruise Report POS427 – Fluid emissions from mud volcanoes, cold seeps and fluid circulation at the Don-_Kuban deep sea fan (Kerch peninsula, Crimea, Black Sea) – 23.02. – 19.03.2012, Burgas, Bulgaria - Heraklion, Greece, Ed.: J. Bialas, 32 pp, DOI: 10.3289/GEOMAR_REP_NS_3_2012
4 RV CELTIC EXPLORER EUROFLEETS Cruise Report, CE12010 – ECO2@NorthSea, 20.07. – 06.08.2012, Bremerhaven – Hamburg, Eds.: P. Linke et al., 65 pp, DOI: 10.3289/GEOMAR_REP_NS_4_2012
5 RV PELAGIA Fahrtbericht / Cruise Report 64PE350/64PE351 – JEDDAH-TRANSECT -, 08.03. – 05.04.2012, Jeddah – Jeddah, 06.04 - 22.04.2012, Jeddah – Duba, Eds.: M. Schmidt, R. Al-Farawati, A. Al-Aidaroos, B. Ku rten and the shipboard scientific party, 154 pp, DOI: 10.3289/GEOMAR_REP_NS_5_2013
6 RV SONNE Fahrtbericht / Cruise Report SO225 - MANIHIKI II Leg 2 The Manihiki Plateau - Origin, Structure and Effects of Oceanic Plateaus and Pleistocene Dynamic of the West Pacific Warm Water Pool, 19.11.2012 - 06.01.2013 Suva / Fiji – Auckland / New Zealand, Eds.: R. Werner, D. Nürnberg, and F. Hauff and the shipboard scientific party, 176 pp, DOI: 10.3289/GEOMAR_REP_NS_6_2013
7 RV SONNE Fahrtbericht / Cruise Report SO226 – CHRIMP CHatham RIse Methane Pockmarks, 07.01. - 06.02.2013 / Auckland – Lyttleton & 07.02. – 01.03.2013 / Lyttleton – Wellington, Eds.: Jörg Bialas / Ingo Klaucke / Jasmin Mögeltönder, 126 pp, DOI: 10.3289/GEOMAR_REP_NS_7_2013
8 The SUGAR Toolbox - A library of numerical algorithms and data for modelling of gas hydrate systems and marine environments, Eds.: Elke Kossel, Nikolaus Bigalke, Elena Piñero, Matthias Haeckel, 168 pp, DOI: 10.3289/GEOMAR_REP_NS_8_2013
9 RV ALKOR Fahrtbericht / Cruise Report AL412, 22.03.-08.04.2013, Kiel – Kiel. Eds: Peter Linke and the shipboard scientific party, 38 pp, DOI: 10.3289/GEOMAR_REP_NS_9_2013
10 Literaturrecherche, Aus- und Bewertung der Datenbasis zur Meerforelle (Salmo trutta trutta L.) Grundlage für ein Projekt zur Optimierung des Meerforellenmanagements in Schleswig-Holstein. Eds.: Christoph Petereit, Thorsten Reusch, Jan Dierking, Albrecht Hahn, 158 pp, DOI: 10.3289/GEOMAR_REP_NS_10_2013
11 RV SONNE Fahrtbericht / Cruise Report SO227 TAIFLUX, 02.04. – 02.05.2013, Kaohsiung – Kaohsiung (Taiwan), Christian Berndt, 105 pp, DOI: 10.3289/GEOMAR_REP_NS_11_2013

No. Title
12 RV SONNE Fahrtbericht / Cruise Report SO218 SHIVA (Stratospheric Ozone: Halogens in a Varying Atmosphere), 15.-29.11.2011, Singapore - Manila, Philippines, Part 1: SO218- SHIVA Summary Report (in German), Part 2: SO218- SHIVA English reports of participating groups, Eds.: Birgit Quack & Kirstin Krüger, 119 pp, DOI: 10.3289/GEOMAR_REP_NS_12_2013
For GEOMAR Reports, please visit: https://oceanrep.geomar.de/view/series/GEOMAR_Report.html Reports of the former IFM-GEOMAR series can be found under: https://oceanrep.geomar.de/view/series/IFM-GEOMAR_Report.html

Helmholtz-Zentrum für Ozeanforschung Kiel / Helmholtz Centre for Ocean Research KielGEOMAR Dienstgebäude Westufer / West Shore BuildingDüsternbrooker Weg 20D-24105 KielGermany
GEOMAR Dienstgebäude Ostufer / East Shore BuildingWischhofstr. 1-3D-24148 KielGermany
Tel.: +49 431 600-0Fax: +49 431 600-2805www.geomar.de
Das GEOMAR Helmholtz-Zentrum für Ozeanforschung Kielist Mitglied der Helmholtz-Gemeinschaft
Deutscher Forschungszentren e.V.
The GEOMAR Helmholtz Centre for Ocean Research Kielis a member of the Helmholtz Association of
German Research Centres
Helmholtz-Zentrum für Ozeanforschung Kiel / Helmholtz Centre for Ocean Research Kiel