Identifying High-Risk Occurrence Chains in Helicopter Operations from Accident Data
14
1 American Institute of Aeronautics and Astronautics Identifying High-Risk Occurrence Chains in Helicopter Operations from Accident Data Arjun H. Rao 1 and Karen Marais 2 Purdue University, West Lafayette, IN, 47907 In this paper, we present a method to identify high-risk occurrence chains using historical accident data. The National Transpiration Safety Board (NTSB) defines an occurrence as a distinct major event of relative significance that leads to an accident or incident. We analyzed 5051 helicopter accidents between 1982 and 2008, and obtained the high-risk occurrence chains. We rank occurrence chains based on (1) frequentist approach—that is, how often a chain resulted in accidents, and (2) impact model, which accounts for the level of injury and damage, and the frequency of occurrence chains that resulted in accidents. Between 1982 and 2008, we identified 366 different occurrence chains. The loss of control (LOC) occurrence chain resulted in 13.1% of the helicopter accidents, and had a 13.8% probability of resulting in a fatal accident—the highest probability among all occurrence chains. Three of the top-five occurrence chains resulting in serious accidents involved engine failure. The impact model demonstrates that a high-frequency occurrence chain need not translate to a high-impact chain by, for example, relegating “200S: Hard landing” from sixth to 13 th position while “240: inflight encounter with weather”, ranked 13 th based on frequency, moved to fourth position. Similarly, considering only fatal accidents when seeking risk reduction strategies may lead to missing potentially effective strategies. For example, “250-220: loss of control-inflight followed by inflight collision with object” is ranked 30 th when only fatal accidents are considered; however, the impact model ranks this chain at 19 th . Nomenclature ASIAS = Aviation Safety Information Analysis and Sharing FAA = Federal Aviation Administration HAAT = Helicopter Accident Analysis Team NTSB = National Transportation Safety Board R-ASIAS = Rotorcraft ASIAS U.S. JHSAT = United States Joint Helicopter Safety and Analysis Team I. Introduction HE 2014 Most Wanted List published by the National Transportation Safety Board (NTSB) highlights the unacceptably high frequency of helicopter accidents. 1 Compared to fixed-wing aircraft, helicopters have a higher accident rate, and helicopter pilots are at higher risk for fatal injuries. 2 The NTSB suggests that the high accident rate is a result of operating conditions (such as weather and proximity to obstacles) and the often time- critical nature of missions (e.g., medical transport, or search and rescue). Here, we describe research that is carried out as part of the Rotorcraft ASIAS (R-ASIAS) project, which is one of the projects under the Partnership to Enhance General Aviation (GA) Safety, Accessibility, and Sustainability (PEGASAS)—a Federal Aviation Administration (FAA) Center of Excellence for GA. The mission of PEGASAS is to enhance GA safety, accessibility, and sustainability by partnering the FAA with a national network of researchers, educators, and industry leaders. Research efforts to further fixed-wing GA safety are discussed in companion papers. 3, 4 1 Graduate Research Assistant, School of Aeronautics and Astronautics, 701 W. Stadium Ave., Student Member. 2 Assistant Professor, School of Aeronautics and Astronautics, 701 W. Stadium Ave., Senior Member. T Downloaded by PURDUE UNIVERSITY on August 16, 2015 | http://arc.aiaa.org | DOI: 10.2514/6.2015-2848 15th AIAA Aviation Technology, Integration, and Operations Conference 22-26 June 2015, Dallas, TX AIAA 2015-2848 Copyright © 2015 by Arjun H. Rao and Karen Marais. Published by the American Institute of Aeronautics and Astronautics, Inc., with permission. AIAA Aviation
Transcript of Identifying High-Risk Occurrence Chains in Helicopter Operations from Accident Data
1 American Institute of Aeronautics and Astronautics
Identifying High-Risk Occurrence Chains in Helicopter Operations from Accident Data
Arjun H. Rao1 and Karen Marais2 Purdue University, West Lafayette, IN, 47907
In this paper, we present a method to identify high-risk occurrence chains using historical accident data. The National Transpiration Safety Board (NTSB) defines an occurrence as a distinct major event of relative significance that leads to an accident or incident. We analyzed 5051 helicopter accidents between 1982 and 2008, and obtained the high-risk occurrence chains. We rank occurrence chains based on (1) frequentist approach—that is, how often a chain resulted in accidents, and (2) impact model, which accounts for the level of injury and damage, and the frequency of occurrence chains that resulted in accidents. Between 1982 and 2008, we identified 366 different occurrence chains. The loss of control (LOC) occurrence chain resulted in 13.1% of the helicopter accidents, and had a 13.8% probability of resulting in a fatal accident—the highest probability among all occurrence chains. Three of the top-five occurrence chains resulting in serious accidents involved engine failure. The impact model demonstrates that a high-frequency occurrence chain need not translate to a high-impact chain by, for example, relegating “200S: Hard landing” from sixth to 13th position while “240: inflight encounter with weather”, ranked 13th based on frequency, moved to fourth position. Similarly, considering only fatal accidents when seeking risk reduction strategies may lead to missing potentially effective strategies. For example, “250-220: loss of control-inflight followed by inflight collision with object” is ranked 30th when only fatal accidents are considered; however, the impact model ranks this chain at 19th.
Nomenclature ASIAS = Aviation Safety Information Analysis and Sharing FAA = Federal Aviation Administration HAAT = Helicopter Accident Analysis Team NTSB = National Transportation Safety Board R-ASIAS = Rotorcraft ASIAS U.S. JHSAT = United States Joint Helicopter Safety and Analysis Team
I. Introduction HE 2014 Most Wanted List published by the National Transportation Safety Board (NTSB) highlights the unacceptably high frequency of helicopter accidents.1 Compared to fixed-wing aircraft, helicopters have a
higher accident rate, and helicopter pilots are at higher risk for fatal injuries. 2 The NTSB suggests that the high accident rate is a result of operating conditions (such as weather and proximity to obstacles) and the often time-critical nature of missions (e.g., medical transport, or search and rescue).
Here, we describe research that is carried out as part of the Rotorcraft ASIAS (R-ASIAS) project, which is one of the projects under the Partnership to Enhance General Aviation (GA) Safety, Accessibility, and Sustainability (PEGASAS)—a Federal Aviation Administration (FAA) Center of Excellence for GA. The mission of PEGASAS is to enhance GA safety, accessibility, and sustainability by partnering the FAA with a national network of researchers, educators, and industry leaders. Research efforts to further fixed-wing GA safety are discussed in companion papers.3, 4
1 Graduate Research Assistant, School of Aeronautics and Astronautics, 701 W. Stadium Ave., Student Member. 2 Assistant Professor, School of Aeronautics and Astronautics, 701 W. Stadium Ave., Senior Member.
T Dow
nloa
ded
by P
UR
DU
E U
NIV
ER
SIT
Y o
n A
ugus
t 16,
201
5 | h
ttp://
arc.
aiaa
.org
| D
OI:
10.
2514
/6.2
015-
2848
15th AIAA Aviation Technology, Integration, and Operations Conference
22-26 June 2015, Dallas, TX
AIAA 2015-2848
Copyright © 2015 by Arjun H. Rao and Karen Marais. Published by the American Institute of Aeronautics and Astronautics, Inc., with permission.
AIAA Aviation
2 American Institute of Aeronautics and Astronautics
The NTSB defines an occurrence as a distinct major event of relative significance that leads to an accident or incident.5 We use helicopter accident data to identify sequence of occurrences (or occurrence chains) that are the most frequent precursors to accidents, have a high cost impact, or a combination of the two. Section II of the paper describes previous research on rotorcraft risk assessment. Details of our approach are shown in Section III. We present the results from our historical accident analysis, and high-risk occurrence chains in helicopter operations, in Section IV. Section V presents the conclusions and direction for future work.
II. Previous work on Rotorcraft Risk Assessment Risk can be defined as the likelihood and consequences of an accident occurring in a system. Risk arises from
the uncertainty in the behavior of a system over given period of time.6 In technical systems, risk is related to the probability of failure of components or an entire system causing exposure to hazard and related consequences.7 Safety is defined as the freedom from unacceptable risk.8
Several historical analyses of helicopter accidents have been carried out to assess helicopter risk arising from different sources such as pilot behavior, mechanical systems, and operations (e.g., See Refs 9–14).
Helicopters are used for various operations, such as forestry and fire fighting, often categorized as external load operations, as well as operations at low altitude in confined areas such as crop-spraying.15 Since they can operate in remote and unusual terrain, helicopter operations often impose demanding requirements on both the pilots and the aircraft.9 Baker et al.16 reported that between 1983 and 2009, 38% of the 178 accidents during offshore oil and gas missions were due to helicopter part malfunctions. While helicopter operations play a key role in the offshore oil and gas industry, it is a major concern that helicopters are the largest contributors to the overall risk of fatal accidents in offshore operations.17,18
Some research has been conducted to explore the role of occurrences in aviation accidents. However, most research considers fixed-wing aircraft, or does not explicitly highlight the role of occurrence chains (or sequences of occurrences) in helicopter accidents.19 The U.S. Joint Helicopter Safety and Analysis Team (U.S. JHSAT) analyzed 523 helicopter accidents for 2000, 2001, and 2006. They found that loss of control (41% of the accidents), autorotations during practice and emergency (28% of the accidents), and system component failure (28% of the accidents) were the top three occurrences in helicopter accidents in these years.13 Harris et al.20 reviewed over 8000 helicopter accidents from 1963 to 1997. They categorized the accidents based on the 21 first-event categories used by the NTSB, and identified loss of engine power, inflight collision with object, and loss of control as the top-three first-events. In 1997, the Helicopter Accident Analysis Team (HAAT) was tasked with establishing the chain of events that led to a sample of 34 fatal helicopter accidents (between 1989 and 1996), and to propose interventions that might have eliminated one or more links, thus preventing the accident.21 The number of events identified for each accident ranged from 5 to 33, with an average of 16 events per accident. While these studies have contributed to our understanding of causes for helicopter accidents, they do not measure the risk associated with these chains of events.
III. Approach In this section, we present our approach to identify high-risk occurrence chains. We used the NTSB
accident/incident database22 to analyze the 5051 helicopter accidents that occurred in the U.S. between 1982 and 2008—the current results are described in Section IV.§
A. Definitions In March 1996, an MD-369E suffered a non-mechanical engine failure while replacing power lines in
Manhattan, Kansas. The pilot was forced to perform an emergency descent and attempted a power-off autorotation, resulting in a hard landing. The pilot sustained serious injuries and the other occupant suffered no injuries (NTSB ID: CHI96FA099).
Table 1 shows the definitions of the different terms used in this paper, using the above accident as an illustration. The first column shows the terms used, the second column shows the defining body/organization, and column three presents the definition. Three of the five terms are defined in the NTSB’s coding manual, while R-ASIAS team defined the term exceedance. In column four, we use the MD-369E accident to illustrate each of the terms. We identified the possible exceedances based on the narrative and factual data in the accident report.
§ The NTSB implemented a new coding system in 2008; to ensure consistency we do not consider the differently coded accidents of the past six years
Dow
nloa
ded
by P
UR
DU
E U
NIV
ER
SIT
Y o
n A
ugus
t 16,
201
5 | h
ttp://
arc.
aiaa
.org
| D
OI:
10.
2514
/6.2
015-
2848
3 American Institute of Aeronautics and Astronautics
Table 1: Definitions of Terms
Term Defined by Definition Example Source
Accident NTSB
An occurrence associated with the operation of an aircraft that takes place between the time any person board the aircraft with the intention of flight and all such person have disembarked, and in which any person suffers death, or serious injury, or in which the aircraft receives substantial damage.
Serious accident NTSB
Occurrence NTSB A distinct major event of relative significance that leads to an accident or incident.
1. Loss of engine power (non-mechanical) [353]
2. Forced landing [180]
3. Hard landing [200]
NTSB
Exceedance R-ASIAS
A deviation in a flight parameter beyond an established bound/limit (upper or lower), which can result in an accident.
1. Low fuel level 2. High rate of descent Analysis
Occurrence Chain This paper
Sequence of occurrences recorded by the NTSB, where the last node in the chain is considered the accident
353–180 (see Section B) NTSB/Analysis
B. Occurrence Chains We define high-risk occurrence chains as a sequence of occurrences that result in many accidents, accidents with
significant loss of life or property, or a combination of the two. We identify these high-risk occurrence chains by (1) using a frequentist approach and counting the number of times each chain result in accidents; (2) counting the number of times each chain results in accidents of a particular severity (e.g., fatal accidents); and (3) by summing the overall direct cost of accidents resulting from each chain.
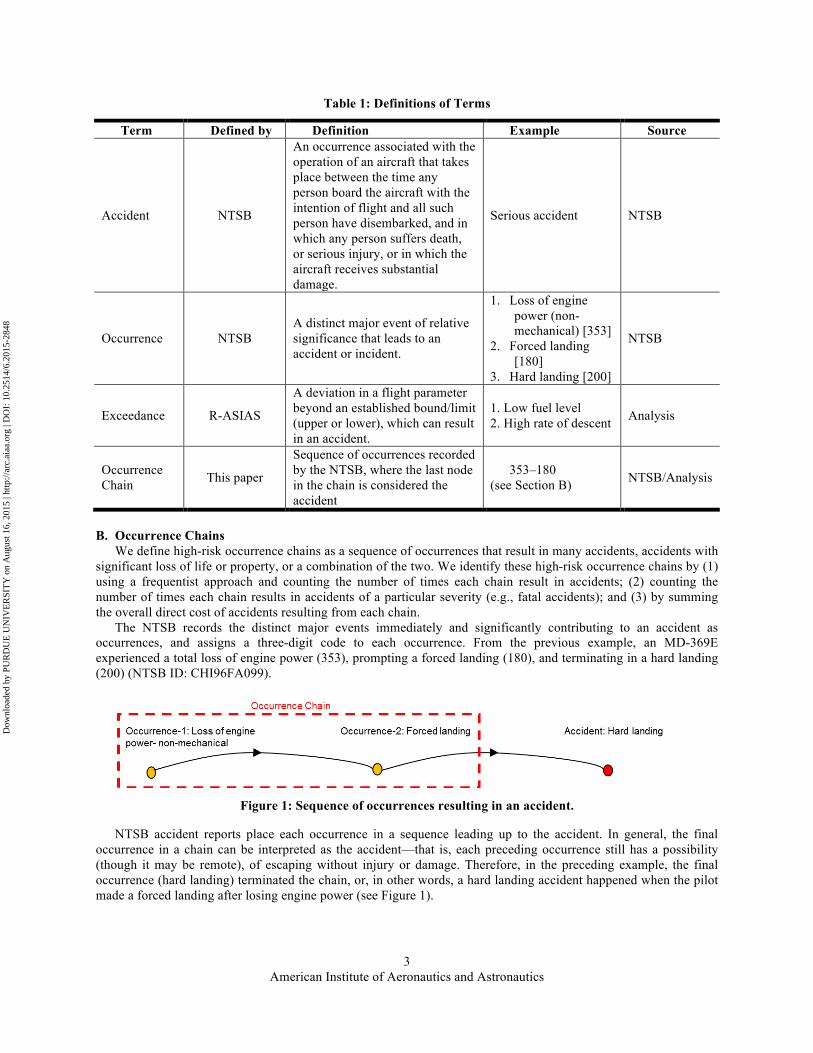
The NTSB records the distinct major events immediately and significantly contributing to an accident as occurrences, and assigns a three-digit code to each occurrence. From the previous example, an MD-369E experienced a total loss of engine power (353), prompting a forced landing (180), and terminating in a hard landing (200) (NTSB ID: CHI96FA099).
Figure 1: Sequence of occurrences resulting in an accident.
NTSB accident reports place each occurrence in a sequence leading up to the accident. In general, the final occurrence in a chain can be interpreted as the accident—that is, each preceding occurrence still has a possibility (though it may be remote), of escaping without injury or damage. Therefore, in the preceding example, the final occurrence (hard landing) terminated the chain, or, in other words, a hard landing accident happened when the pilot made a forced landing after losing engine power (see Figure 1).
Dow
nloa
ded
by P
UR
DU
E U
NIV
ER
SIT
Y o
n A
ugus
t 16,
201
5 | h
ttp://
arc.
aiaa
.org
| D
OI:
10.
2514
/6.2
015-
2848
4 American Institute of Aeronautics and Astronautics
C. Link between Occurrence Chains and Accidents We identify the links between occurrence chains and accidents based on NTSB data. The occurrence chain to
accident link strength is given by the conditional probability shown in Eq. 1. The link strength is based on the number of times a particular type of accident results from a particular occurrence chain, where accident type is based either on severity (fatal to none), or on what specifically happened (e.g., collision with terrain or in-flight breakup). The accident node strength is based on the accident frequency or the losses associated with the accident. Then, the importance of each occurrence chain can be calculated from several perspectives (e.g., total expected losses, or total number of expected accidents).
We begin with the link strength between occurrence chains and accidents. The conditional probability expressed in Eq. 1 gives the probability of accidents that are caused by particular occurrence chains. This calculation requires the total number of chains, including those chains that did not result in accidents:
𝑝 𝐴𝑐𝑐𝑖𝑑𝑒𝑛𝑡|𝑂𝑐𝑐𝑢𝑟𝑟𝑒𝑛𝑐𝑒 𝐶ℎ𝑎𝑖𝑛! =𝑁𝑜. 𝑜𝑓 𝑎𝑐𝑐𝑖𝑑𝑒𝑛𝑡𝑠 𝑤𝑖𝑡ℎ 𝑂𝑐𝑐𝑢𝑟𝑟𝑒𝑛𝑐𝑒 𝐶ℎ𝑎𝑖𝑛!
𝑁𝑜. 𝑜𝑓 𝑂𝑐𝑐𝑢𝑟𝑟𝑒𝑛𝑐𝑒 𝐶ℎ𝑎𝑖𝑛!
(1)
Where 𝑗 represents each occurrence chain. By definition, occurrence chains mentioned in the NTSB database have led to accidents—that is, the NTSB
database does not count chains that did not result in accidents. The probability that a particular occurrence chain happened, given that there was an accident is:
𝑝 𝑂𝑐𝑐𝑢𝑟𝑟𝑒𝑛𝑐𝑒 𝐶ℎ𝑎𝑖𝑛!|𝐴𝑐𝑐𝑖𝑑𝑒𝑛𝑡 =𝑁𝑜. 𝑜𝑓 𝑎𝑐𝑐𝑖𝑑𝑒𝑛𝑡𝑠 𝑤𝑖𝑡ℎ 𝑂𝑐𝑐𝑢𝑟𝑟𝑒𝑛𝑐𝑒 𝐶ℎ𝑎𝑖𝑛!
𝑇𝑜𝑡𝑎𝑙 𝑛𝑜. 𝑜𝑓 𝑎𝑐𝑐𝑖𝑑𝑒𝑛𝑡𝑠
(2)
The conditional probability that an occurrence chain resulted in an accident of given severity is:
𝑝 𝑂𝑐𝑐𝑢𝑟𝑟𝑒𝑛𝑐𝑒 𝐶ℎ𝑎𝑖𝑛!|𝐴𝑐𝑐𝑖𝑑𝑒𝑛𝑡 𝑆𝑒𝑣𝑒𝑟𝑖𝑡𝑦! =𝑁𝑜. 𝑜𝑓 𝑎𝑐𝑐𝑖𝑑𝑒𝑛𝑡𝑠 𝑤𝑖𝑡ℎ 𝑆𝑒𝑣𝑒𝑟𝑖𝑡𝑦! 𝑤𝑖𝑡ℎ 𝑂𝑐𝑐𝑢𝑟𝑟𝑒𝑛𝑐𝑒 𝐶ℎ𝑎𝑖𝑛!
𝑇𝑜𝑡𝑎𝑙 𝑛𝑜. 𝑜𝑓 𝑎𝑐𝑐𝑖𝑑𝑒𝑛𝑡𝑠 𝑤𝑖𝑡ℎ 𝑆𝑒𝑣𝑒𝑟𝑖𝑡𝑦!
(3)
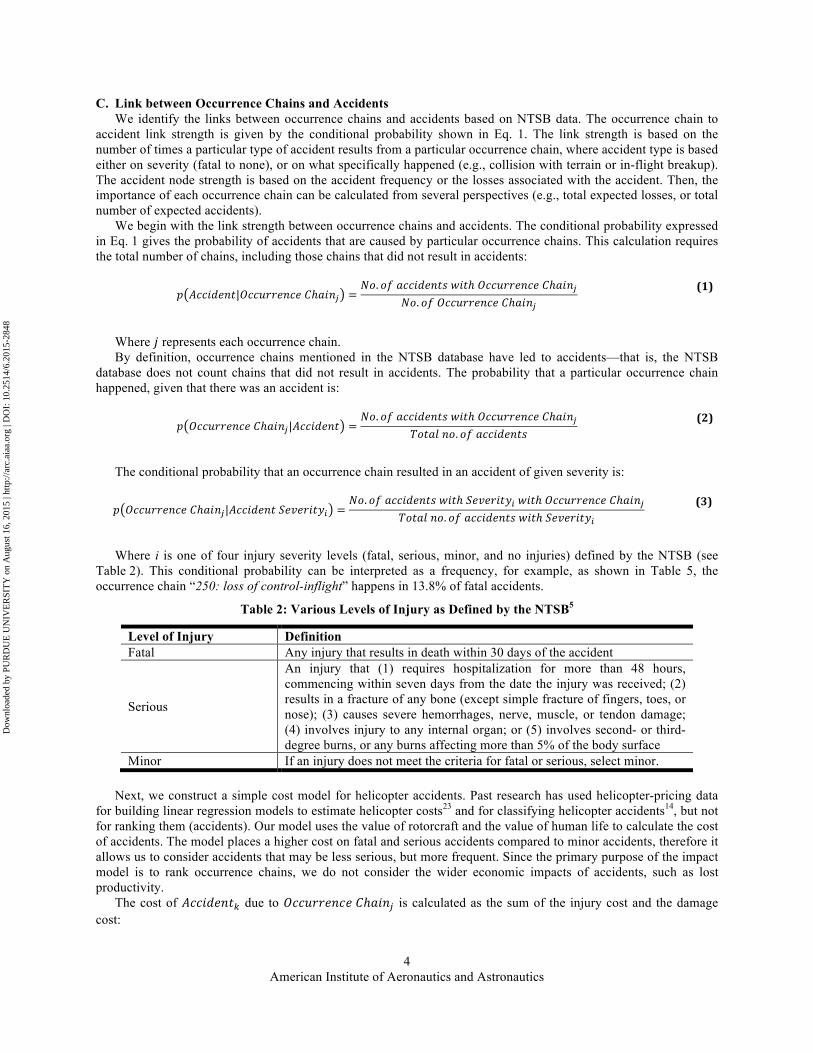
Where i is one of four injury severity levels (fatal, serious, minor, and no injuries) defined by the NTSB (see Table 2). This conditional probability can be interpreted as a frequency, for example, as shown in Table 5, the occurrence chain “250: loss of control-inflight” happens in 13.8% of fatal accidents.
Table 2: Various Levels of Injury as Defined by the NTSB5
Level of Injury Definition Fatal Any injury that results in death within 30 days of the accident
Serious
An injury that (1) requires hospitalization for more than 48 hours, commencing within seven days from the date the injury was received; (2) results in a fracture of any bone (except simple fracture of fingers, toes, or nose); (3) causes severe hemorrhages, nerve, muscle, or tendon damage; (4) involves injury to any internal organ; or (5) involves second- or third-degree burns, or any burns affecting more than 5% of the body surface
Minor If an injury does not meet the criteria for fatal or serious, select minor. Next, we construct a simple cost model for helicopter accidents. Past research has used helicopter-pricing data
for building linear regression models to estimate helicopter costs23 and for classifying helicopter accidents14, but not for ranking them (accidents). Our model uses the value of rotorcraft and the value of human life to calculate the cost of accidents. The model places a higher cost on fatal and serious accidents compared to minor accidents, therefore it allows us to consider accidents that may be less serious, but more frequent. Since the primary purpose of the impact model is to rank occurrence chains, we do not consider the wider economic impacts of accidents, such as lost productivity.
The cost of 𝐴𝑐𝑐𝑖𝑑𝑒𝑛𝑡! due to 𝑂𝑐𝑐𝑢𝑟𝑟𝑒𝑛𝑐𝑒 𝐶ℎ𝑎𝑖𝑛! is calculated as the sum of the injury cost and the damage cost:
Dow
nloa
ded
by P
UR
DU
E U
NIV
ER
SIT
Y o
n A
ugus
t 16,
201
5 | h
ttp://
arc.
aiaa
.org
| D
OI:
10.
2514
/6.2
015-
2848
5 American Institute of Aeronautics and Astronautics
𝐶𝑜𝑠𝑡 𝐴𝑐𝑐𝑖𝑑𝑒𝑛𝑡! 𝑑𝑢𝑒 𝑡𝑜 𝑂𝑐𝑐𝑢𝑟𝑟𝑒𝑛𝑐𝑒 𝐶ℎ𝑎𝑖𝑛!
= 𝐶𝑜𝑠𝑡 𝑜𝑓 𝐼𝑛𝑗𝑢𝑟𝑦 𝑡𝑦𝑝𝑒 𝑡𝑜 𝑃𝐴𝑋!
!!
!!! !
+ (𝐷𝑎𝑚𝑎𝑔𝑒 𝑐𝑜𝑠𝑡 𝑜𝑓 𝑅𝑜𝑡𝑜𝑟𝑐𝑟𝑎𝑓𝑡)!
!!
!!! ! !
(4)
where 𝑚 = 1 𝑡𝑜 𝑛! is the number of occupants on board the rotorcraft, and 𝑙 = 1 𝑡𝑜 𝑞! is the number of rotorcraft involved in the accident (e.g., mid-air collisions).
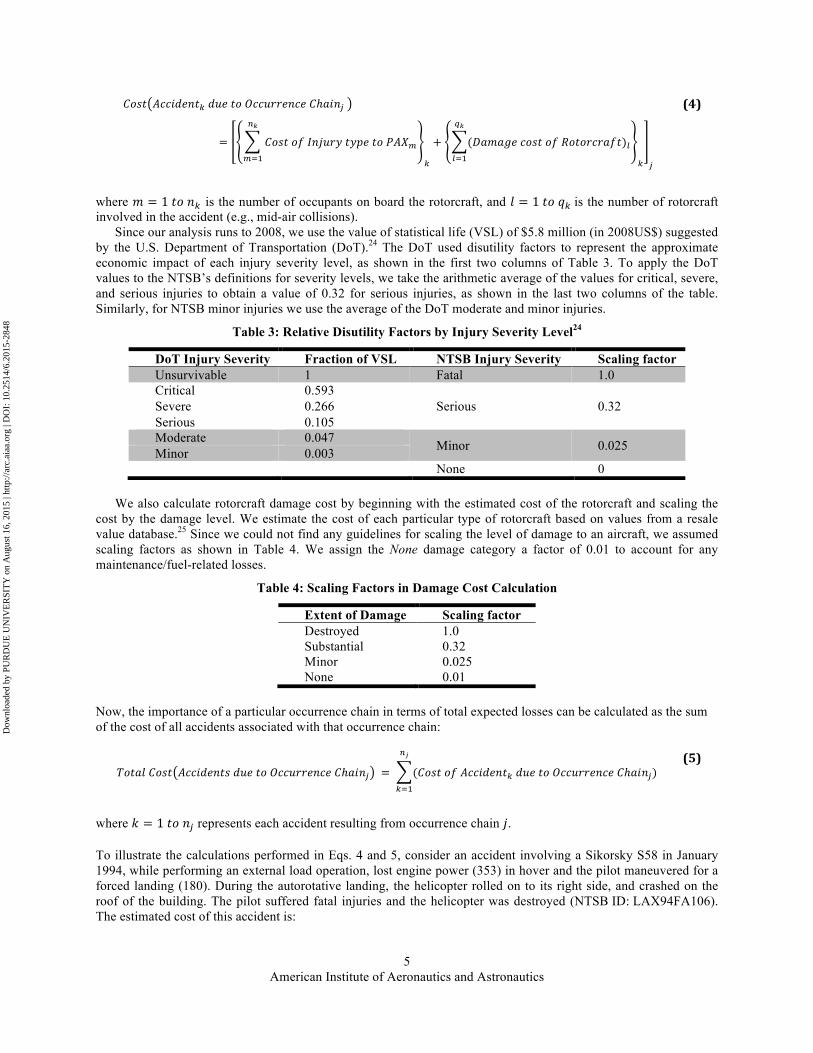
Since our analysis runs to 2008, we use the value of statistical life (VSL) of $5.8 million (in 2008US$) suggested by the U.S. Department of Transportation (DoT).24 The DoT used disutility factors to represent the approximate economic impact of each injury severity level, as shown in the first two columns of Table 3. To apply the DoT values to the NTSB’s definitions for severity levels, we take the arithmetic average of the values for critical, severe, and serious injuries to obtain a value of 0.32 for serious injuries, as shown in the last two columns of the table. Similarly, for NTSB minor injuries we use the average of the DoT moderate and minor injuries.
Table 3: Relative Disutility Factors by Injury Severity Level24
DoT Injury Severity Fraction of VSL NTSB Injury Severity Scaling factor Unsurvivable 1 Fatal 1.0 Critical 0.593
Serious 0.32 Severe 0.266 Serious 0.105 Moderate 0.047 Minor 0.025 Minor 0.003 None 0
We also calculate rotorcraft damage cost by beginning with the estimated cost of the rotorcraft and scaling the
cost by the damage level. We estimate the cost of each particular type of rotorcraft based on values from a resale value database.25 Since we could not find any guidelines for scaling the level of damage to an aircraft, we assumed scaling factors as shown in Table 4. We assign the None damage category a factor of 0.01 to account for any maintenance/fuel-related losses.
Table 4: Scaling Factors in Damage Cost Calculation
Extent of Damage Scaling factor Destroyed 1.0 Substantial 0.32 Minor 0.025 None 0.01
Now, the importance of a particular occurrence chain in terms of total expected losses can be calculated as the sum of the cost of all accidents associated with that occurrence chain:
𝑇𝑜𝑡𝑎𝑙 𝐶𝑜𝑠𝑡 𝐴𝑐𝑐𝑖𝑑𝑒𝑛𝑡𝑠 𝑑𝑢𝑒 𝑡𝑜 𝑂𝑐𝑐𝑢𝑟𝑟𝑒𝑛𝑐𝑒 𝐶ℎ𝑎𝑖𝑛! = (𝐶𝑜𝑠𝑡 𝑜𝑓 𝐴𝑐𝑐𝑖𝑑𝑒𝑛𝑡! 𝑑𝑢𝑒 𝑡𝑜 𝑂𝑐𝑐𝑢𝑟𝑟𝑒𝑛𝑐𝑒 𝐶ℎ𝑎𝑖𝑛!)
!!
!!!
(5)
where 𝑘 = 1 𝑡𝑜 𝑛! represents each accident resulting from occurrence chain 𝑗.
To illustrate the calculations performed in Eqs. 4 and 5, consider an accident involving a Sikorsky S58 in January 1994, while performing an external load operation, lost engine power (353) in hover and the pilot maneuvered for a forced landing (180). During the autorotative landing, the helicopter rolled on to its right side, and crashed on the roof of the building. The pilot suffered fatal injuries and the helicopter was destroyed (NTSB ID: LAX94FA106). The estimated cost of this accident is:
Dow
nloa
ded
by P
UR
DU
E U
NIV
ER
SIT
Y o
n A
ugus
t 16,
201
5 | h
ttp://
arc.
aiaa
.org
| D
OI:
10.
2514
/6.2
015-
2848
6 American Institute of Aeronautics and Astronautics
𝐶𝑜𝑠𝑡 𝐴𝑐𝑐𝑖𝑑𝑒𝑛𝑡! 𝑑𝑢𝑒 𝑡𝑜 𝑂𝑐𝑐𝑢𝑟𝑟𝑒𝑛𝑐𝑒 𝐶ℎ𝑎𝑖𝑛 𝟑𝟓𝟑 − 𝟏𝟖𝟎 = 5.8×1 ×10! + 183,777×1 = $5.98 𝑚𝑖𝑙𝑙𝑖𝑜𝑛 (6)
And the total cost due to the accidents associated with this occurrence chain is:
𝑇𝑜𝑡𝑎𝑙 𝐶𝑜𝑠𝑡 𝐴𝑐𝑐𝑖𝑑𝑒𝑛𝑡𝑠 𝑑𝑢𝑒 𝑡𝑜 𝑂𝑐𝑐𝑢𝑟𝑟𝑒𝑛𝑐𝑒 𝐶ℎ𝑎𝑖𝑛 𝟑𝟓𝟑 − 𝟏𝟖𝟎
= 𝐴𝑐𝑐𝑖𝑑𝑒𝑛𝑡 𝐶𝑜𝑠𝑡 𝑜𝑓 𝑂𝑐𝑐𝑢𝑟𝑟𝑒𝑛𝑐𝑒 𝐶ℎ𝑎𝑖𝑛 𝟑𝟓𝟑 − 𝟏𝟖𝟎 !
!"#
!!!
= $299.38 𝑚𝑖𝑙𝑙𝑖𝑜𝑛
(7)
where k = 1 to 269, the frequency of the occurrence chain in helicopter accidents between 1982 and 2008.
IV. Results Between 1982 and 2008 there were 5051 helicopter accidents, with each accident having between one and five
occurrence codes. 56.3% of the accidents had only one occurrence, 36.0% of the accidents had two occurrences, and 7.7% of the accidents had three or more occurrences.
Section A describes occurrence and occurrence chain statistics. We identify the top occurrence chains for different accident categories based on how often they appear in these accidents. Section B shows the occurrence chain rankings based on injury severity, while rankings based on the type of operation are presented in Section C. Section D addresses “No-Recovery” occurrences—where the pilot has little or no chance of recovery after an occurrence is triggered. The impact of each occurrence chain is calculated and presented in Section E.
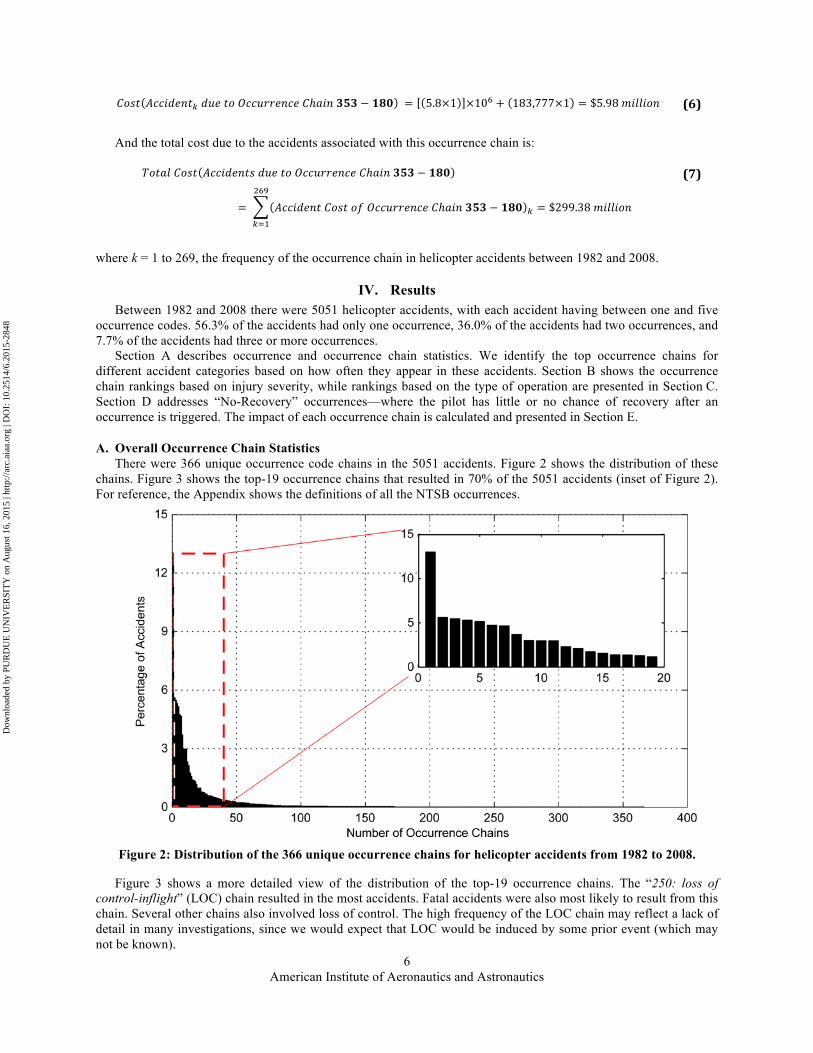
A. Overall Occurrence Chain Statistics There were 366 unique occurrence code chains in the 5051 accidents. Figure 2 shows the distribution of these
chains. Figure 3 shows the top-19 occurrence chains that resulted in 70% of the 5051 accidents (inset of Figure 2). For reference, the Appendix shows the definitions of all the NTSB occurrences.
Figure 2: Distribution of the 366 unique occurrence chains for helicopter accidents from 1982 to 2008.
Figure 3 shows a more detailed view of the distribution of the top-19 occurrence chains. The “250: loss of control-inflight” (LOC) chain resulted in the most accidents. Fatal accidents were also most likely to result from this chain. Several other chains also involved loss of control. The high frequency of the LOC chain may reflect a lack of detail in many investigations, since we would expect that LOC would be induced by some prior event (which may not be known).
Dow
nloa
ded
by P
UR
DU
E U
NIV
ER
SIT
Y o
n A
ugus
t 16,
201
5 | h
ttp://
arc.
aiaa
.org
| D
OI:
10.
2514
/6.2
015-
2848

7 American Institute of Aeronautics and Astronautics
Figure 3: Distribution of 19 most frequent occurrence chains for helicopter accidents from 1982 to 2008.
Table 5: Link Strengths for the Top-Five Occurrence Chains in All Accidents
Occurrence Chain Percentage of Accidents First Occurrence Second Occurrence Fatal Serious Minor None Loss of control-inflight (250) - 13.8% 14.1% 15.9% 11.4%
Inflight collision with object (220) - 10.8% 8.0% 4.9% 3.8%
Loss of engine power (350) Forced landing (180) 2.0% 6.1% 5.3% 6.5%
Loss of engine power-non-mechanical (353) Forced landing (180) 2.1% 6.7% 4.1% 6.5%
Inflight collision with terrain/water (230S) - 8.8% 4.1% 4.1% 4.7%
Table 5 shows a subset of our results for the link strengths between occurrence chains and accidents. Here, we
rank the top five occurrence chains by frequency and show the proportion of accidents associated with each chain. This proportion is the probability given by Eq. 3.
Note the occurrence chain “230S: Inflight collision with terrain/water”, where the ‘S’ signifies that this chain was the sole recorded occurrence in the accident. 5.2% of accidents result from this chain, but unfortunately, the NTSB reports do not indicate what happened before the collision. Again, as with LOC, we assume that in each accident there must have been some instigating factor that was not captured by the investigation. We term these chains as “no recovery” occurrence chains, and present them in Section D.
Dow
nloa
ded
by P
UR
DU
E U
NIV
ER
SIT
Y o
n A
ugus
t 16,
201
5 | h
ttp://
arc.
aiaa
.org
| D
OI:
10.
2514
/6.2
015-
2848
8 American Institute of Aeronautics and Astronautics
B. Injury-Specific Occurrence Chain Statistics In this section we present occurrence chain statistics for the fatal and (or) serious injuries that were sustained
during helicopter operations, between 1982 and 2008. An accident is fatal if any injury sustained results in death within 30 days of the accident.5 An accident is serious if it results in an injury that (1) requires hospitalization for more than 48 hours, commencing within seven days from the date the injury was received; (2) results in a fracture of any bone (except simple fracture of fingers, toes, or nose); (3) causes severe hemorrhages, nerve, muscle, or tendon damage; (4) involves injury to any internal organ; or (5) involves second- or third-degree burns, or any burns affecting more than 5% of the body surface.5
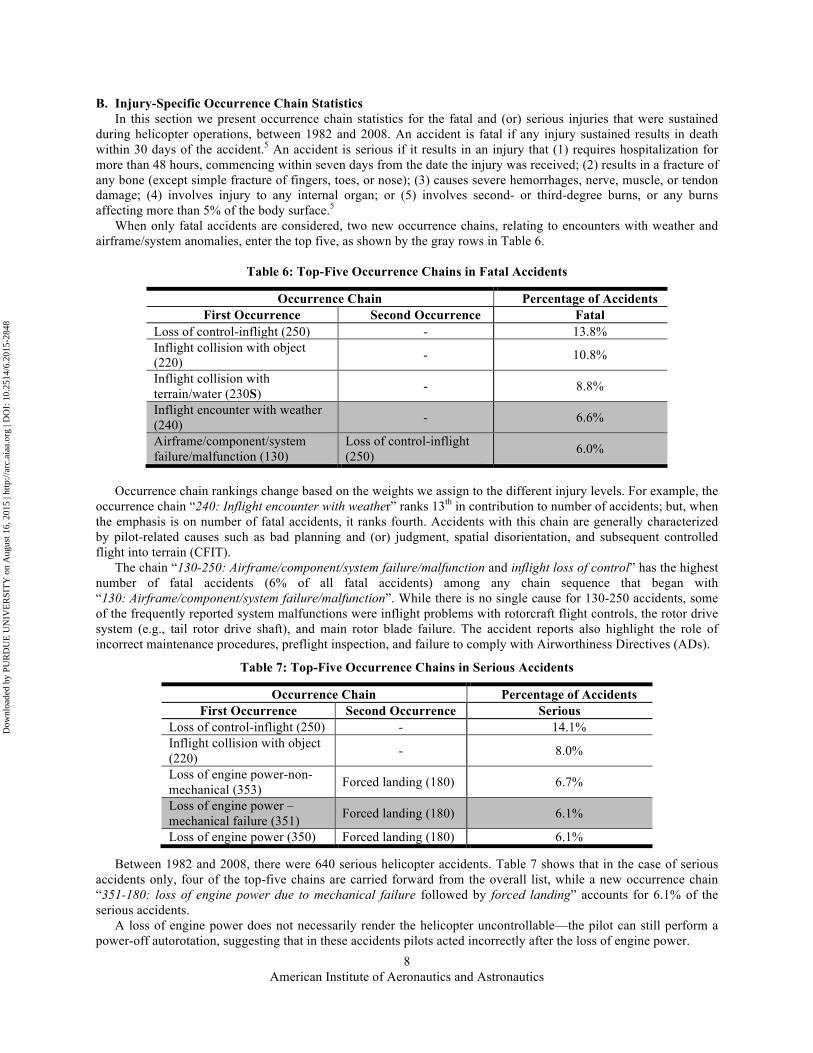
When only fatal accidents are considered, two new occurrence chains, relating to encounters with weather and airframe/system anomalies, enter the top five, as shown by the gray rows in Table 6.
Table 6: Top-Five Occurrence Chains in Fatal Accidents
Occurrence Chain Percentage of Accidents First Occurrence Second Occurrence Fatal
Loss of control-inflight (250) - 13.8% Inflight collision with object (220) - 10.8%
Inflight collision with terrain/water (230S) - 8.8%
Inflight encounter with weather (240) - 6.6%
Airframe/component/system failure/malfunction (130)
Loss of control-inflight (250) 6.0%
Occurrence chain rankings change based on the weights we assign to the different injury levels. For example, the
occurrence chain “240: Inflight encounter with weather” ranks 13th in contribution to number of accidents; but, when the emphasis is on number of fatal accidents, it ranks fourth. Accidents with this chain are generally characterized by pilot-related causes such as bad planning and (or) judgment, spatial disorientation, and subsequent controlled flight into terrain (CFIT).
The chain “130-250: Airframe/component/system failure/malfunction and inflight loss of control” has the highest number of fatal accidents (6% of all fatal accidents) among any chain sequence that began with “130: Airframe/component/system failure/malfunction”. While there is no single cause for 130-250 accidents, some of the frequently reported system malfunctions were inflight problems with rotorcraft flight controls, the rotor drive system (e.g., tail rotor drive shaft), and main rotor blade failure. The accident reports also highlight the role of incorrect maintenance procedures, preflight inspection, and failure to comply with Airworthiness Directives (ADs).
Table 7: Top-Five Occurrence Chains in Serious Accidents
Occurrence Chain Percentage of Accidents First Occurrence Second Occurrence Serious
Loss of control-inflight (250) - 14.1% Inflight collision with object (220) - 8.0%
Loss of engine power-non-mechanical (353) Forced landing (180) 6.7%
Loss of engine power –mechanical failure (351) Forced landing (180) 6.1%
Loss of engine power (350) Forced landing (180) 6.1%
Between 1982 and 2008, there were 640 serious helicopter accidents. Table 7 shows that in the case of serious accidents only, four of the top-five chains are carried forward from the overall list, while a new occurrence chain “351-180: loss of engine power due to mechanical failure followed by forced landing” accounts for 6.1% of the serious accidents.
A loss of engine power does not necessarily render the helicopter uncontrollable—the pilot can still perform a power-off autorotation, suggesting that in these accidents pilots acted incorrectly after the loss of engine power.
Dow
nloa
ded
by P
UR
DU
E U
NIV
ER
SIT
Y o
n A
ugus
t 16,
201
5 | h
ttp://
arc.
aiaa
.org
| D
OI:
10.
2514
/6.2
015-
2848
9 American Institute of Aeronautics and Astronautics
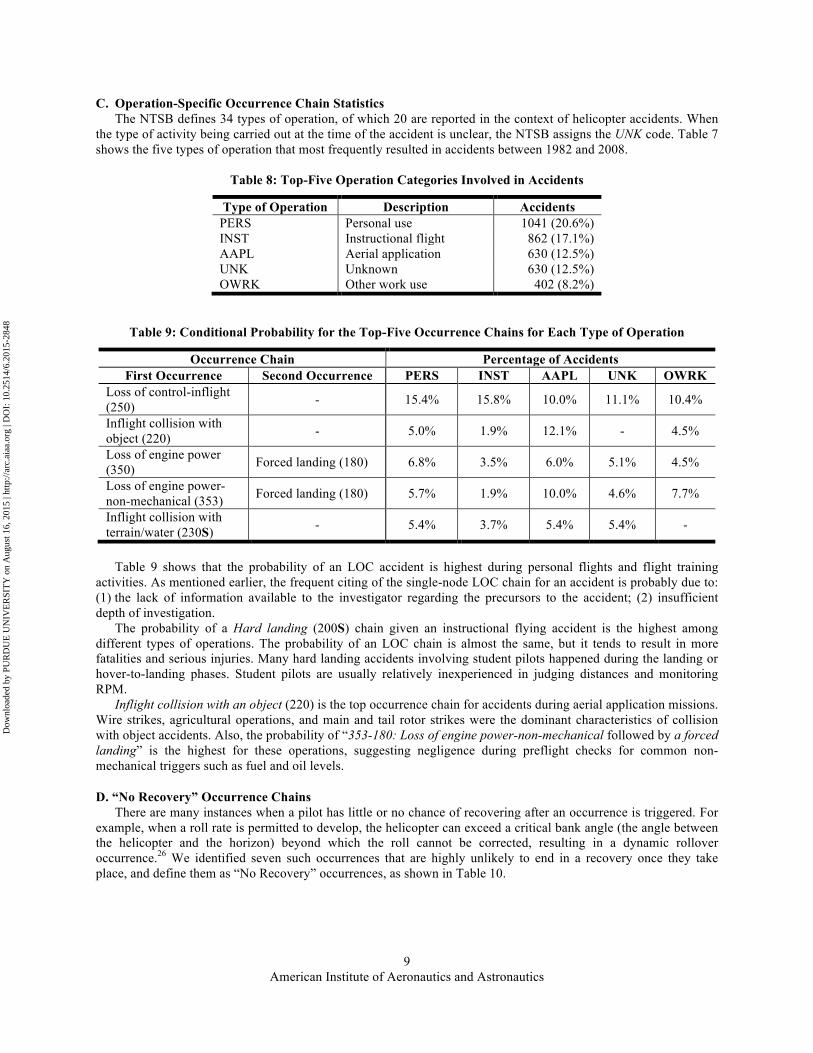
C. Operation-Specific Occurrence Chain Statistics The NTSB defines 34 types of operation, of which 20 are reported in the context of helicopter accidents. When
the type of activity being carried out at the time of the accident is unclear, the NTSB assigns the UNK code. Table 7 shows the five types of operation that most frequently resulted in accidents between 1982 and 2008.
Table 8: Top-Five Operation Categories Involved in Accidents
Type of Operation Description Accidents PERS Personal use 1041 (20.6%) INST Instructional flight 862 (17.1%) AAPL Aerial application 630 (12.5%) UNK Unknown 630 (12.5%) OWRK Other work use 402 (8.2%)
Table 9: Conditional Probability for the Top-Five Occurrence Chains for Each Type of Operation
Occurrence Chain Percentage of Accidents First Occurrence Second Occurrence PERS INST AAPL UNK OWRK
Loss of control-inflight (250) - 15.4% 15.8% 10.0% 11.1% 10.4%
Inflight collision with object (220) - 5.0% 1.9% 12.1% - 4.5%
Loss of engine power (350) Forced landing (180) 6.8% 3.5% 6.0% 5.1% 4.5%
Loss of engine power-non-mechanical (353) Forced landing (180) 5.7% 1.9% 10.0% 4.6% 7.7%
Inflight collision with terrain/water (230S) - 5.4% 3.7% 5.4% 5.4% -
Table 9 shows that the probability of an LOC accident is highest during personal flights and flight training
activities. As mentioned earlier, the frequent citing of the single-node LOC chain for an accident is probably due to: (1) the lack of information available to the investigator regarding the precursors to the accident; (2) insufficient depth of investigation.
The probability of a Hard landing (200S) chain given an instructional flying accident is the highest among different types of operations. The probability of an LOC chain is almost the same, but it tends to result in more fatalities and serious injuries. Many hard landing accidents involving student pilots happened during the landing or hover-to-landing phases. Student pilots are usually relatively inexperienced in judging distances and monitoring RPM.
Inflight collision with an object (220) is the top occurrence chain for accidents during aerial application missions. Wire strikes, agricultural operations, and main and tail rotor strikes were the dominant characteristics of collision with object accidents. Also, the probability of “353-180: Loss of engine power-non-mechanical followed by a forced landing” is the highest for these operations, suggesting negligence during preflight checks for common non-mechanical triggers such as fuel and oil levels.
D. “No Recovery” Occurrence Chains There are many instances when a pilot has little or no chance of recovering after an occurrence is triggered. For
example, when a roll rate is permitted to develop, the helicopter can exceed a critical bank angle (the angle between the helicopter and the horizon) beyond which the roll cannot be corrected, resulting in a dynamic rollover occurrence.26 We identified seven such occurrences that are highly unlikely to end in a recovery once they take place, and define them as “No Recovery” occurrences, as shown in Table 10.
Dow
nloa
ded
by P
UR
DU
E U
NIV
ER
SIT
Y o
n A
ugus
t 16,
201
5 | h
ttp://
arc.
aiaa
.org
| D
OI:
10.
2514
/6.2
015-
2848
10 American Institute of Aeronautics and Astronautics
Table 10: Tabulation of "No Recovery" Occurrences
Occurrence Code Description 150 Ditching 230 Inflight collision with terrain/water 300 Nose over 320 On ground collision with terrain/water 360 Propeller blast or jet exhaust/suction 370 Propeller/rotor contact to person 380 Roll over
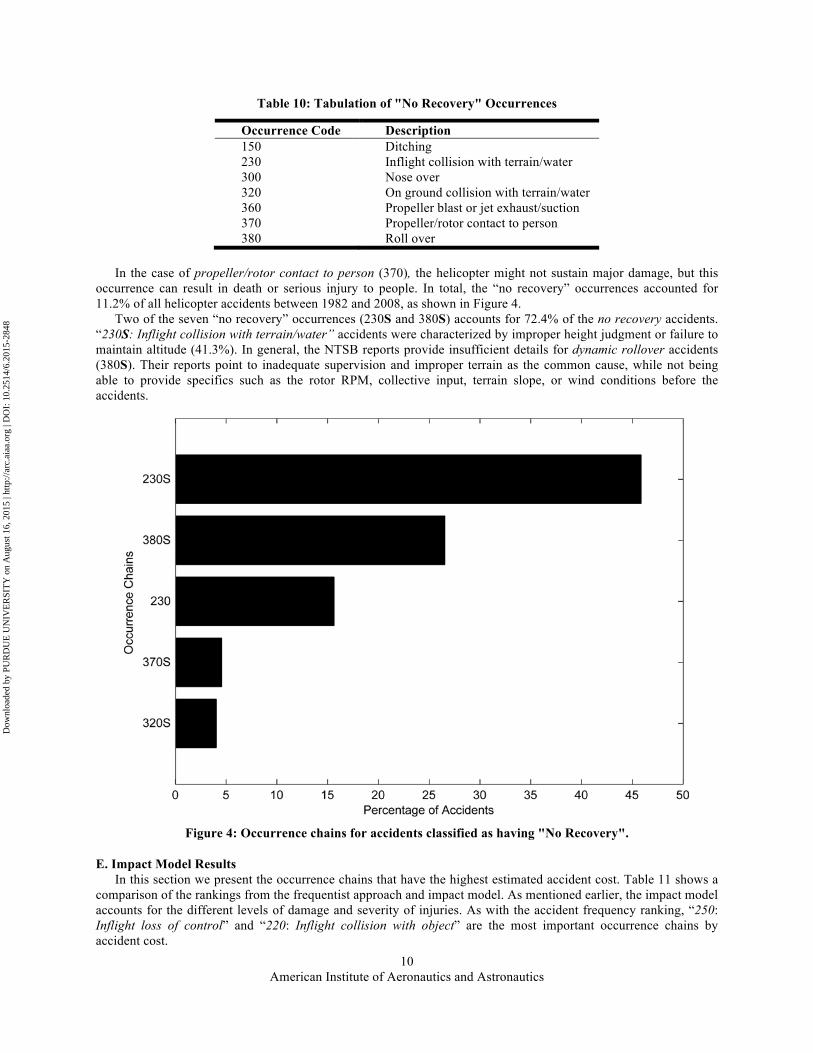
In the case of propeller/rotor contact to person (370), the helicopter might not sustain major damage, but this
occurrence can result in death or serious injury to people. In total, the “no recovery” occurrences accounted for 11.2% of all helicopter accidents between 1982 and 2008, as shown in Figure 4.
Two of the seven “no recovery” occurrences (230S and 380S) accounts for 72.4% of the no recovery accidents. “230S: Inflight collision with terrain/water” accidents were characterized by improper height judgment or failure to maintain altitude (41.3%). In general, the NTSB reports provide insufficient details for dynamic rollover accidents (380S). Their reports point to inadequate supervision and improper terrain as the common cause, while not being able to provide specifics such as the rotor RPM, collective input, terrain slope, or wind conditions before the accidents.
Figure 4: Occurrence chains for accidents classified as having "No Recovery".
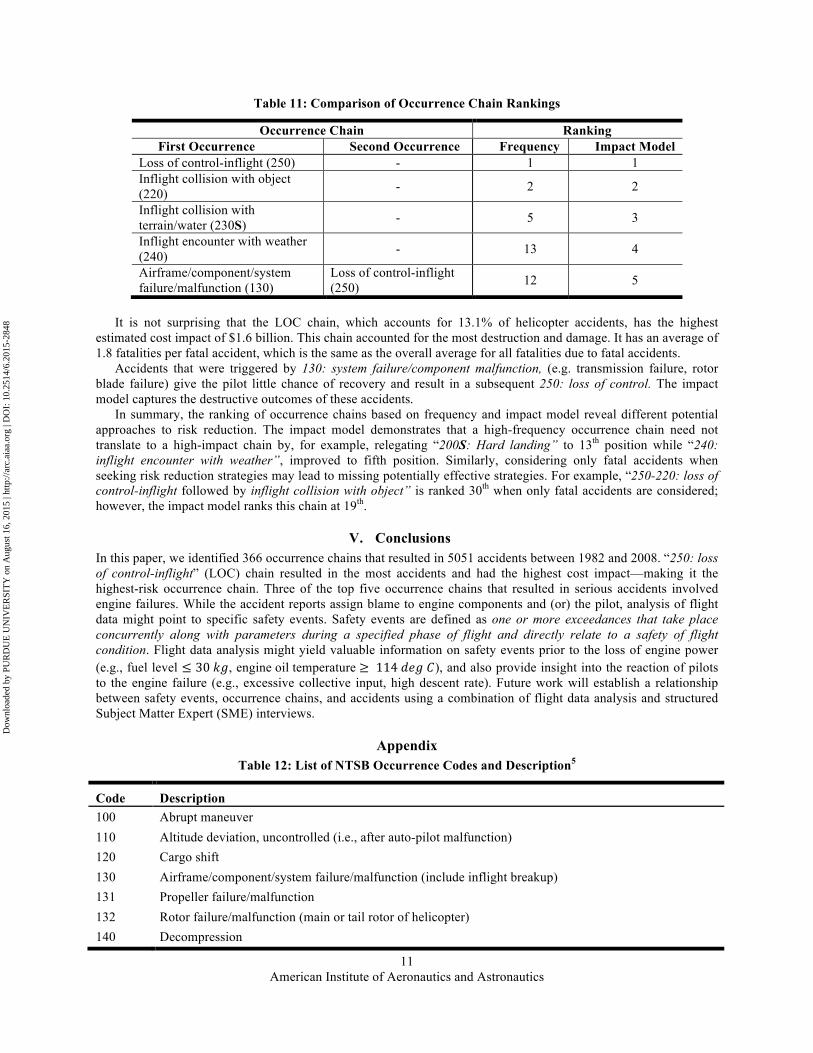
E. Impact Model Results In this section we present the occurrence chains that have the highest estimated accident cost. Table 11 shows a
comparison of the rankings from the frequentist approach and impact model. As mentioned earlier, the impact model accounts for the different levels of damage and severity of injuries. As with the accident frequency ranking, “250: Inflight loss of control” and “220: Inflight collision with object” are the most important occurrence chains by accident cost.
Dow
nloa
ded
by P
UR
DU
E U
NIV
ER
SIT
Y o
n A
ugus
t 16,
201
5 | h
ttp://
arc.
aiaa
.org
| D
OI:
10.
2514
/6.2
015-
2848
11 American Institute of Aeronautics and Astronautics
Table 11: Comparison of Occurrence Chain Rankings
Occurrence Chain Ranking First Occurrence Second Occurrence Frequency Impact Model
Loss of control-inflight (250) - 1 1 Inflight collision with object (220) - 2 2
Inflight collision with terrain/water (230S) - 5 3
Inflight encounter with weather (240) - 13 4
Airframe/component/system failure/malfunction (130)
Loss of control-inflight (250) 12 5
It is not surprising that the LOC chain, which accounts for 13.1% of helicopter accidents, has the highest
estimated cost impact of $1.6 billion. This chain accounted for the most destruction and damage. It has an average of 1.8 fatalities per fatal accident, which is the same as the overall average for all fatalities due to fatal accidents.
Accidents that were triggered by 130: system failure/component malfunction, (e.g. transmission failure, rotor blade failure) give the pilot little chance of recovery and result in a subsequent 250: loss of control. The impact model captures the destructive outcomes of these accidents.
In summary, the ranking of occurrence chains based on frequency and impact model reveal different potential approaches to risk reduction. The impact model demonstrates that a high-frequency occurrence chain need not translate to a high-impact chain by, for example, relegating “200S: Hard landing” to 13th position while “240: inflight encounter with weather”, improved to fifth position. Similarly, considering only fatal accidents when seeking risk reduction strategies may lead to missing potentially effective strategies. For example, “250-220: loss of control-inflight followed by inflight collision with object” is ranked 30th when only fatal accidents are considered; however, the impact model ranks this chain at 19th.
V. Conclusions In this paper, we identified 366 occurrence chains that resulted in 5051 accidents between 1982 and 2008. “250: loss of control-inflight” (LOC) chain resulted in the most accidents and had the highest cost impact—making it the highest-risk occurrence chain. Three of the top five occurrence chains that resulted in serious accidents involved engine failures. While the accident reports assign blame to engine components and (or) the pilot, analysis of flight data might point to specific safety events. Safety events are defined as one or more exceedances that take place concurrently along with parameters during a specified phase of flight and directly relate to a safety of flight condition. Flight data analysis might yield valuable information on safety events prior to the loss of engine power (e.g., fuel level ≤ 30 𝑘𝑔, engine oil temperature ≥ 114 𝑑𝑒𝑔 𝐶), and also provide insight into the reaction of pilots to the engine failure (e.g., excessive collective input, high descent rate). Future work will establish a relationship between safety events, occurrence chains, and accidents using a combination of flight data analysis and structured Subject Matter Expert (SME) interviews.
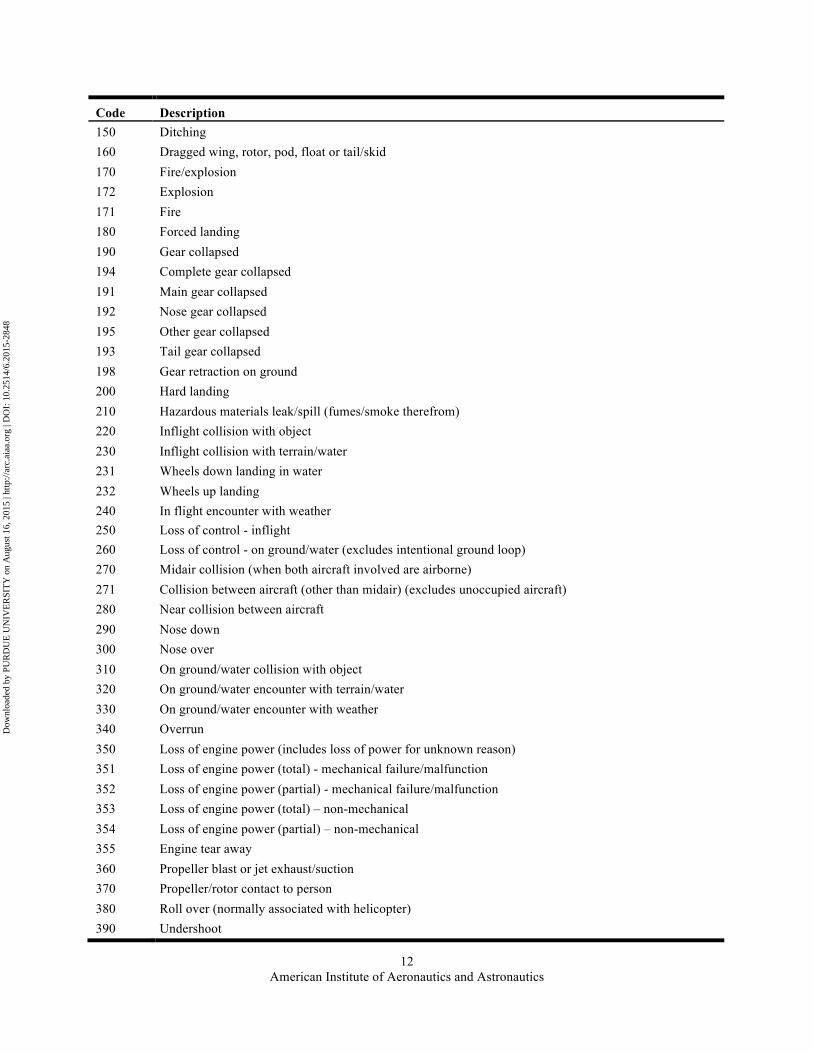
Appendix Table 12: List of NTSB Occurrence Codes and Description5
Code Description 100 Abrupt maneuver 110 Altitude deviation, uncontrolled (i.e., after auto-pilot malfunction) 120 Cargo shift 130 Airframe/component/system failure/malfunction (include inflight breakup) 131 Propeller failure/malfunction 132 Rotor failure/malfunction (main or tail rotor of helicopter) 140 Decompression
Dow
nloa
ded
by P
UR
DU
E U
NIV
ER
SIT
Y o
n A
ugus
t 16,
201
5 | h
ttp://
arc.
aiaa
.org
| D
OI:
10.
2514
/6.2
015-
2848
12 American Institute of Aeronautics and Astronautics
Code Description 150 Ditching 160 Dragged wing, rotor, pod, float or tail/skid 170 Fire/explosion 172 Explosion 171 Fire 180 Forced landing 190 Gear collapsed 194 Complete gear collapsed 191 Main gear collapsed 192 Nose gear collapsed 195 Other gear collapsed 193 Tail gear collapsed 198 Gear retraction on ground 200 Hard landing 210 Hazardous materials leak/spill (fumes/smoke therefrom) 220 Inflight collision with object 230 Inflight collision with terrain/water 231 Wheels down landing in water 232 Wheels up landing 240 In flight encounter with weather 250 Loss of control - inflight 260 Loss of control - on ground/water (excludes intentional ground loop) 270 Midair collision (when both aircraft involved are airborne) 271 Collision between aircraft (other than midair) (excludes unoccupied aircraft) 280 Near collision between aircraft 290 Nose down 300 Nose over 310 On ground/water collision with object 320 On ground/water encounter with terrain/water 330 On ground/water encounter with weather 340 Overrun 350 Loss of engine power (includes loss of power for unknown reason) 351 Loss of engine power (total) - mechanical failure/malfunction 352 Loss of engine power (partial) - mechanical failure/malfunction 353 Loss of engine power (total) – non-mechanical 354 Loss of engine power (partial) – non-mechanical 355 Engine tear away 360 Propeller blast or jet exhaust/suction 370 Propeller/rotor contact to person 380 Roll over (normally associated with helicopter) 390 Undershoot
Dow
nloa
ded
by P
UR
DU
E U
NIV
ER
SIT
Y o
n A
ugus
t 16,
201
5 | h
ttp://
arc.
aiaa
.org
| D
OI:
10.
2514
/6.2
015-
2848
13 American Institute of Aeronautics and Astronautics
Code Description 400 Undetermined 410 Vortex turbulence encountered 420 Missing aircraft 430 Miscellaneous/other
Acknowledgments This research was partially funded by US Department of Transportation/Federal Aviation Administration PEGASAS Center of Excellence under grant #123660. The technical monitor is Charles “Cliff” Johnson. We acknowledge Jason Kmiecik from HeliValue$ Inc. for his valuable feedback on helicopter cost data. The views expressed in this paper are those of the authors and do not necessarily reflect those of the FAA. The information in this research does not constitute FAA Flight Standards or FAA Aircraft Certification policy.
References 1National Transportation Safety Board, “NTSB Most Wanted List”, http://www.ntsb.gov/safety/mwl/Pages/mwl1_2014.aspx,
Accessed April 2015. 2Conroy, C., Russel, J. C., Crouse, W. E., Bender, T. R., and Holl, J. A., “Fatal Occupational Injury Related to Helicopters in
the United States”, Aviation, Space and Environmental Medicine, Vol. 63, No. 1, 1992, pp. 67–71. 3Harrison, E., Min, S., Jimenez, H. and Mavris, D. N., “Implementation and Validation of an Internal Combustion Engine and
Propeller Model for General Aviation Aircraft Performance Studies”, Aviation 2015, AIAA, Dallas, TX. 4Min, S., Harrison, E., Jimenez, H. and Mavris, D. N., “Development of Aerodynamic Modeling and Calibration Methods for
General Aviation Aircraft Performance Analysis - a Survey and Comparison of Models”, Aviation 2015, AIAA, Dallas, TX. 5National Transportation Safety Board, “Aviation Coding Manual”, Washington DC, National Transportation Safety Board,
1998. 6Marais, K., “A New Approach to Risk Analysis with a Focus on Organizational Risk Factors”, Ph.D. Thesis, Department of
Aeronautics and Astronautics. Massachusetts Institute of Technology, Cambridge, MA, 2005. 7Netjasov, F., and Janic, M. “A review of research on risk and safety modeling in civil aviation”, Journal of Air
Transportation Management, Vol. 14, No. 4, 2008, pp. 213–220. 8International Organization for Standardization, “Safety aspects–guidelines for their inclusion in standards”, International
Organization for Standardization, Geneva, Switzerland, 1999. 9Manwaring, J. C., Conway, G. A., and Garrett, L. C., “Epidemiology and Prevention of Helicopter External Load
Accidents”, Journal of Safety Research, Vol. 29, No. 2, 1998, pp. 107-121. 10DeVoogt, A. J., Uitdewilligen, S., and Ermenko, N., “Safety in high-risk helicopter operations: The role of additional crew
in accident prevention”, Safety Science, Vol. 47, 2009, pp. 717-721. 11Dempsey, P. J., Lewicki, D. G., and Le, D. D., “Investigation of Current Methods to Identify Helicopter Gear Health”,
NASA/TM—2007-214664, 2007. 12Atkinson, B., and Irving, P., “An analysis of accidents involving UK civil registered helicopters during the period 1976-
1993”, CAA/913 V/14. 95, 1995. 13U.S. Joint Helicopter Safety Analysis Team, “The Compendium Report: The U.S. JHSAT Baseline of Helicopter
Analysis”, International Helicopter Safety Team, Fairfax, VA, 2011. 14Iseler, L., and De Maio, J., “An Analysis of U.S. Civil Rotorcraft Accidents by Cost and Injury (1990–1996)”,
NASA/TM—2002-209615, 2002. 15De Voogt, A., “Fatalities in General Aviation: From Balloons to Helicopters”, Forensic Pathology Reviews, Edited by
E. E. Turk, Vol. 6, New York, NY, Springer Science and Business Media, pp. 169–179. 16Baker, S. P., Shanahan, D. F., Haaland, W., Brady, J. E., and Li, G, “Helicopter crashes related to oil and gas operations in
the Gulf of Mexico”, Aviation, Space, and Environmental Medicine, Vol. 82, No. 9, 2011, pp. 885–889. 17International Association of Oil & Gas Producers, “Safety Performance of Helicopter Operations in the Oil & Gas
Industry—2007 Data”, Report No. 424, 2009. 18Nascimento, F. A., Majumdar, A., and Ochieng, W. Y., “Helicopter Accident Analysis”, The Journal of Navigation,
Vol. 67, pp. 145–161. 19Houston, S. J., Walton, R. O., and Conway, B. A., “Analysis of General Aviation Instructional Loss of Control Accidents”,
The Journal of Aviation/Aerospace Education and Research, Vol. 22, No.1, 2012, pp. 35–49. 20Harris, F. D., Kasper, E. E., and Iseler, L. E., “U.S. Civil Rotorcraft Accidents, 1963 to 1997”, NASA/TM—2000-209597,
2000. 21Aviation Safety and Security Program, “The Final Report of the Helicopter Accident Analysis Team”,
http://www.ihst.org/portals/54/industry_reports/HAAT-FinalReport.pdf, Accessed April 2015.
Dow
nloa
ded
by P
UR
DU
E U
NIV
ER
SIT
Y o
n A
ugus
t 16,
201
5 | h
ttp://
arc.
aiaa
.org
| D
OI:
10.
2514
/6.2
015-
2848
14 American Institute of Aeronautics and Astronautics
22National Transportation Safety Board, “Aviation Accident Database & Synopses”, http://www.ntsb.gov/_layouts/ntsb.aviation/index.aspx, Accessed April 2015.
23Harris, F. D., and Scully, M. P., “Rotorcraft Cost Too Much”, Journal of the American Helicopter Society, Vol. 43, No. 1, 1998, pp. 3–13.
24U.S. Department of Transportation, “Guidance on Treatment of Economic Value of a Statistical Life in U.S. Department of Transportation Analyses”, Washington, DC: U.S. Department of Transportation, 2013.
25HeliValue$, Inc., “Perspectives: A Helicopter Resale History™”, HeliValue$, Inc., Wauconda, IL, 2015. 26Federal Aviation Administration, “Helicopter Dynamic Rollover”, Washington DC, Federal Aviation Administration, 1986.
Dow
nloa
ded
by P
UR
DU
E U
NIV
ER
SIT
Y o
n A
ugus
t 16,
201
5 | h
ttp://
arc.
aiaa
.org
| D
OI:
10.
2514
/6.2
015-
2848