
Normalization of correlations for atmospheric species with chemical loss
Upload
independentCategory
view
1download
0
RESEARCH ARTICLE
Identification of Optimal Reference Genesfor Gene Expression Normalization in aWide Cohort of Endometrioid EndometrialCarcinoma TissuesChiara Romani1*, Stefano Calza2,3, Paola Todeschini1, Renata A. Tassi1,Laura Zanotti1, Elisabetta Bandiera1, Enrico Sartori1, Sergio Pecorelli1,Antonella Ravaggi1, Alessandro D. Santin4, Eliana Bignotti1
1. ‘‘Angelo Nocivelli’’ Institute of Molecular Medicine, Division of Gynecologic Oncology, University of Brescia,Brescia, Italy, 2. Department of Molecular and Translational Medicine, University of Brescia, Brescia, Italy, 3.Department of Medical Epidemiology and Biostatistics, Karolinska Institutet, Stockholm, Sweden, 4.Department of Obstetrics, Gynecology & Reproductive Sciences, Yale University School of Medicine, NewHaven, Connecticut, United States of America
Abstract
Accurate normalization is a primary component of a reliable gene expression
analysis based on qRT-PCR technique. While the use of one or more reference
genes as internal controls is commonly accepted as the most appropriate
normalization strategy, many qPCR-based published studies still contain data
poorly normalized and reference genes arbitrarily chosen irrespective of the
particular tissue and the specific experimental design. To date, no validated
reference genes have been identified for endometrial cancer tissues. In this study,
10 normalization genes (GAPDH, B2M, ACTB, POLR2A, UBC, PPIA, HPRT1,
GUSB, TBP, H3F3A) belonging to different functional and abundance classes in
various tissues and used in different studies, were analyzed to determine their
applicability. In total, 100 endometrioid endometrial cancer samples, which were
carefully balanced according to their tumor grade, and 29 normal endometrial
tissues were examined using SYBR Green Real-Time RT-PCR. The expression
stability of candidate reference genes was determined and compared by means of
geNorm and NormFinder softwares. Both algorithms were in agreement in
identifying GAPDH, H3F3A, PPIA, and HPRT1 as the most stably expressed
genes, only differing in their ranking order. Analysis performed on the expression
levels of all candidate genes confirm HPRT1 and PPIA as the most stably
expressed in the study groups regardless of sample type, to be used alone or better
in combination. As the stable expression of HPRT1 and PPIA between normal and
OPEN ACCESS
Citation: Romani C, Calza S, Todeschini P, TassiRA, Zanotti L, et al. (2014) Identification of OptimalReference Genes for Gene ExpressionNormalization in a Wide Cohort of EndometrioidEndometrial Carcinoma Tissues. PLoS ONE 9(12):e113781. doi:10.1371/journal.pone.0113781
Editor: Yuan-Soon Ho, Taipei Medical University,Taiwan
Received: August 7, 2014
Accepted: October 29, 2014
Published: December 4, 2014
Copyright: � 2014 Romani et al. This is an open-access article distributed under the terms of theCreative Commons Attribution License, whichpermits unrestricted use, distribution, and repro-duction in any medium, provided the original authorand source are credited.
Data Availability: The authors confirm that all dataunderlying the findings are fully available withoutrestriction. All relevant data are within the paper.
Funding: This work was supported in part bygrants from the Istituto Superiore di Sanita’(Programma Italia-USA Oncoproteomica 527/B4/4), Rome, Italy, to SP and in part by R01CA154460-01 and U01 CA176067-01A1 grantsfrom the National Institutes of Health, theHonorable Tina Brozman Foundation, the DeborahBunn Alley Ovarian Cancer Research Foundation,and the Guido Berlucchi Research Foundation toADS. The funders had no role in study design, datacollection and analysis, decision to publish, orpreparation of the manuscript.
Competing Interests: The authors have declaredthat no competing interests exist.
PLOS ONE | DOI:10.1371/journal.pone.0113781 December 4, 2014 1 / 16
tumor endometrial samples fulfill the basic requirement of a reference gene to be
used for normalization purposes, HPRT1 expression showed significant differences
between samples from low-grade and high-grade tumors. In conclusion, our results
recommend the use of PPIA as a single reference gene to be considered for
improved reliability of normalization in gene expression studies involving
endometrial tumor samples at different tumor degrees.
Introduction
Endometrial carcinoma (EC) is the most common gynecologic malignancy in the
Western world, with 52,630 new cases and 8590 deaths expected in the United
States alone in 2014 [1]. EC may be broadly divided into two classes, type I and
type II, with distinct histopathology, clinical behavior and underlying molecular
pathogenesis [2]. Most EC patients have oestrogen-related tumours, well-
differentiated, endometrioid in histology and, consequently, with good prognosis
(Type I EECs) [3, 4]. In contrast, Type II ECs include serous, clear cell or grade 3
endometrioid histology, which being typified by an aggressive clinical course with
a distinct pattern of metastasis, often recur despite aggressive clinical interventions
[5, 6].
Gene expression studies have extensively been conducted in cancer research,
with the aim of discovering new potential diagnostic and prognostic biomarkers.
Quantitative real-time reverse transcription PCR (qRT-PCR) is one of the most
powerful and sensitive techniques available for gene expression analysis, with
relative quantification as a commonly used strategy for interpreting obtained
results. In relative quantification, changes in gene expression in a given sample are
expressed relative to another reference sample, after normalization using a stably
expressed reference gene simultaneously determined. In this kind of gene
expression study, selecting a valid reference gene to correct for differences in RNA
sampling is critical to avoid misinterpretation of results [7, 8].
An mRNA used as a valid reference for qRT-PCR experiments should have the
following properties [9–12]: constitutive and constant expression in all samples
analyzed and similar expression compared to the gene of interest. Moreover,
particular attention should be paid to the primer design, since the amplification of
the reference gene sequence has to be mRNA specific, without contamination of
DNA and pseudogenes.
A reference gene often adopted from the literature in relative gene expression
studies is glyceraldehyde-3-phosphate dehydrogenase (GAPDH), a common
metabolic enzyme that has many functions besides being the most well known
involved in the glycolytic pathway. Its levels are not constant and vary more than
for other genes across different tissues. Other frequently used reference genes are
ribosomal RNAs (28S or 18S), that generally are not an optimal choice, thanks to
Endometrial Cancer and Reference Gene Expression
PLOS ONE | DOI:10.1371/journal.pone.0113781 December 4, 2014 2 / 16

the combination of (i) high abundance and (ii) different transcription and
degradation characteristics compared to mRNAs.
With the aim of finding suitable reference genes for gene expression studies in
EC tissue samples, we carried out a Medline search using the MeSH terms
‘‘endometrial cancer’’ and ‘‘real-time PCR’’. We critically evaluated 327 papers
published from May 2000 to February 2014 (see Text S1). We identified a total
102 articles based on the use of Real-Time PCR in gene expression studies on
endometrial cancer tissues. Within these reports, we removed papers evaluating
microRNA expression and genotyping studies as well as gene expression studies
performed on cell cultures or Formalin-Fixed Paraffin Embedded (FFPE) tissues.
Twelve additional articles were excluded from analysis because full text was not
available in the English language. The remaining 90 articles focusing on gene
expression studies in fresh frozen tissues were used in the final analysis. These
articles used the following reference genes for data normalization, alone or in
combination of two or three genes used in the final data analysis: Glyceraldehyde-
3-phosphate dehydrogenase (GAPDH) (39 times), Beta-actin (ACTB) (23 times),
18S-rRNA (22 times), hypoxanthine-guanine phosphoribosyltransferase (HPRT1)
(6 times), peptidylprolyl isomerase A (PPIA) (5 times), DNA-directed RNA
polymerase II subunit RPB1 (POLR2A) and b-glucuronidase (GUSB) (3 times
each), ribosomal protein large P0 (RPLPO), ribosomal protein L19 (L19), and b2-
microglobulin (B2M) (2 times each), TATA box binding protein (TBP),
ribosomal protein S17 (RPS17), delta-aminolevulinate synthase 1 (ALAS1), HLA-
DR antigens-associated invariant chain (CD74), RNase P, cytokeratin 18 (CK18),
ubiquitin C (UBC), hydroxymethylbilane synthase (HMBS), importin 8 (IPO8),
phosphoglycerate kinase 1 (PGK1), tyrosine 3-monooxygenase/tryptophan 5-
monooxygenase activation protein, zeta polypeptide (YWHAZ) and H3 histone,
family 3A (H3F3A) (1 time each).
This search highlights that (i) a wide-accepted single or combination of
reference genes for endometrial cancer gene expression studies does not currently
exist; (ii) ACTB and GAPDH are the most frequently used reference genes for
normalization in endometrial cancer research, mostly used as single gene, even if
their use for this purpose is controversial; (iii) recently, the Minimum
Information for Publication of Quantitative Real-Time PCR Experiments (MIQE)
guidelines has shown the importance of using a combination of reference genes
for reliable analysis of gene expression data [13] and (iv) a study investigating the
most suitable reference genes for endometrial cancer research on a wide cohort of
fresh frozen tissues has not been performed until now.
To fill this gap of knowledge, our aim was to extrapolate the most suitable
combination of reference genes for qRT-PCR studies from a panel of 10 genes
frequently used in the literature in a wide and well-characterized cohort of
endometrioid EC and normal endometrium tissue samples.
Endometrial Cancer and Reference Gene Expression
PLOS ONE | DOI:10.1371/journal.pone.0113781 December 4, 2014 3 / 16
Materials and Methods
Patients and samples
Endometrial cancer tissue samples were obtained from 100 patients (mean age 66
years, range 41–92 years) undergoing total abdominal hysterectomy at the
Division of Gynecologic Oncology, University of Brescia. Normal endometrial
tissue samples were obtained from 29 patients (mean age 53 years, range 37–79
years) undergoing hysterectomy for benign pathologies (Table 1). The study was
performed following the Declaration of Helsinki set of principles and approved by
the Research Review Board- the Ethic Committee- of the Spedali Civili, Brescia,
Italy (study reference number: 527/B4/4). Written informed consent was obtained
from all patients enrolled.
All neoplastic specimens were reviewed in our institution and histological
classification was performed according to WHO criteria, while pathological stage
was determined according to the International Federation of Gynecologists and
Obstetricians (FIGO) standards. All tumors were endometrioid in histology, with
different grades of differentiation: 30 out of the 100 tumors were classified as
grade G1 (well-differentiated), 33 as G2 (moderately-differentiated), and 37 as G3
(poorly-differentiated) (Table 1).
Specimens were snap-frozen in liquid nitrogen within 30 minutes after surgical
removal, and stored at 280 C̊ until further processing.
Only samples containing at least 70% of tumor epithelial cells as assessed by a
staff pathologist were used for total RNA extraction. All the normal endometrial
samples were verified to be free of any neoplastic pathology before using for total
RNA extraction.
RNA extraction and cDNA synthesis
Total RNA was isolated from tissue samples using TRIZOL reagent (Life
Technologies, Inc., Carlsbad, CA) and then further purified using RNeasy Min-
elute Clean-up Columns (Qiagen, Valencia, CA), according to the manufacturer’s
instructions. RNA concentration and 260/280 absorbance ratio (A260/280) were
measured with Infinite M200 spectrophotometer (Tecan). RNA integrity was
assessed with RNA 6000 Nano LabChip kit using the Agilent 2100 Bioanalyzer
(Agilent Technologies, Palo Alto, CA, USA) and the RNA integrity number (RIN)
generated with Agilent 2100 Expert software [14]. One microgram of total RNA
was reverse transcribed using random hexamers in a final volume of 20 ml,
according to the SuperScript TM II Reverse Transcriptase protocol (Invitrogen
Life Technologies, Carlsbad, CA, USA). All cDNA samples were diluted to 5 ng/ml,
dispensed in a 96wells plates and stored at 220 C̊ until use.
Real-time quantitative PCR (qPCR)
With the aim of identifying the most stable reference genes useful for
normalization in qPCR studies on endometrioid endometrial cancer, ten reference
genes belonging to different functional classes were evaluated in this study:
Endometrial Cancer and Reference Gene Expression
PLOS ONE | DOI:10.1371/journal.pone.0113781 December 4, 2014 4 / 16

GAPDH, B2M, ACTB, POLR2A, UBC, PPIA, HPRT1, GUSB, TBP, H3F3A
(Table 2). All primer sequences were designed with Beacon Designer software
(Premier Biosoft, Palo Alto, CA, USA) and spanned an exon-exon boundary to
control for genomic contamination in RNA samples.
A standard curve of five serial dilution points of a representative cDNA sample,
ranging from 15 ng to 24 pg, was generated for each assay to determine PCR
efficiency according to Rasmussen [15]. The PCR efficiency and correlation
coefficients (R2) of each primer pair set were generated using the slope of the
standard curves and efficiency was calculated by the formula: efficiency
(%)5(10(21/slope)21)6100.
SYBR green real-time PCR was performed with CFX96 Real-Time system and
iTaq Universal SYBR Green Supermix (BIO-RAD Laboratories, Hercules, CA,
USA). Amplification mixture (20 ml) contained 15 ng of template cDNA, 26 Mix
and 400 nM forward and reverse primers optimized to give maximum
amplification efficiency while minimizing nonspecific amplification, with the
exception of GUSB whose primers final concentration in reaction was 250 nM.
The cycle conditions were set as follow: 98 C̊ for 30 s, (95 C̊ for 5 s, 60 C̊ for
20 s)640 cycles. All reactions were run in triplicate and no template controls (no
cDNA in PCR) were included in each assay run for each gene. A melting curve was
constructed for each primer pair to confirm amplification product specificity.
An inter-run calibration sample was used in all plates to correct for the
technical variance between the different runs and to compare results from
different plates.
For the quantitative comparison of investigated candidate reference gene
amplification rates, Cq (quantification cycle) values were used, according to the
RDML (Real-Time PCR Data Markup Language) data standard [16].
Table 1. Clinical and pathologic characteristics of 100 EC and 29 NE patients.
Characteristics EEC NE
n 100 29
FIGO stage (%)
I 70
II 11
III 17
IV 2
Histological Grade (%)
G1 30
G2 33
G3 37
Age at diagnosis (mean years, range) 66 (41–92) 53 (37–79)
doi:10.1371/journal.pone.0113781.t001
Endometrial Cancer and Reference Gene Expression
PLOS ONE | DOI:10.1371/journal.pone.0113781 December 4, 2014 5 / 16

Statistical analysis
Stability of candidate reference genes was calculated with freely available geNorm
[11] and NormFinder [17] softwares. Both algorithms identify the most stable
control gene in a given set of tissue samples and determine the optimal number of
reference genes required for reliable normalization of qPCR data. Differences in
Table 2. Candidate reference genes selected for evaluation of expression stability.
Genesymbol
GeneBankAccession No. Gene name Molecular function Primer sequence 59R39
ampliconsize (bp)
PCRefficiency %
GAPDH NM_002046 Glyceraldehyde-3-phosphatedehydrogenase
glycolitic enzyme Forward: cccttcattgacctcaacta-catg
115 97.65
Reverse: tgggatttccattgatga-caagc
B2M NM_004048 Beta-2-microglobulin component of theclass I MHC
Forward: cattcctgaagctgacag-cattc
136 99.25
Reverse: tgctggatgacgtgag-taaacc
ACTB NM_001101 Beta-actin cytoskeletal struc-tural protein
Forward: cgccgccagctcaccatg 120 93.91
Reverse: cacgatggaggggaa-gacgg
POLR2A NM_000937 Polymerase (RNA) II (DNA-directed) polypeptide A 220 kDa
DNA-dependentRNA polymerasecomponent
Forward: gagagtccagttcggagtc 84 103.81
Reverse: gtcgtctctgggtatttgatg
UBC NM_021009 Ubiquitin C involved in DNArepair, proteindegradation, cellcycle regulation
Forward: tcgtcacttgacaatgca 120 95.86
Reverse: atgccttccttatcttggatc
PPIA NM_021130 Peptidylprolyl isomerase A(Cyclophilin A)
cyclosporin binding-protein
Forward: gaggaaaaccgtgtac-tattagc
113 101.03
Reverse: gggaccttgtctgcaaac
HPRT1 NM_000194 Hypoxanthine phosphoribosyl-transferase 1
involved in the gen-eration of purinenucleotides throughthe purine salvagepathway
Forward: ctggaaagaatgtctt-gattgtg
104 102.1
Reverse: gaccttgaccatctttg-gatta
GUSB NM_000181 Glucuronidase beta catalyze breakdownof complex carbo-hydrates
Forward: atcgccatcaacaacaca 84 102.36
Reverse: cttgggatacttggaggtg
TBP NM_003194 TATA box binding protein general transcrip-tion factor
Forward: ctccactgtatccctccc 118 88.07
Reverse: ccaagattcactgtggata-caata
H3F3A NM_002107 H3 histone, family 3A nuclear protein Forward: tgctcaggactttaaaa-caga
108 105.67
Reverse: cacaggttggtgtcttcaa
doi:10.1371/journal.pone.0113781.t002
Endometrial Cancer and Reference Gene Expression
PLOS ONE | DOI:10.1371/journal.pone.0113781 December 4, 2014 6 / 16

gene expression between groups were tested using linear models on log10
transformed gene expression values, with p-values and confidence intervals
estimation based on ‘‘White-Huber’’ heteroscedasticity corrected covariance
matrices [18]. To account for the presence of potential outliers we fitted weighted
least squares with weights computed by M-estimation [19]. To test non-difference
of gene expression among groups we used the Two-One-Sided Test (TOST)
approach, a type of intersection union test [20]. Briefly an ‘‘equivalence range’’
[eL,eU] is defined. The null hypothesis is set up so that if the 90% confidence
interval for the parameter of interest (e.g. the difference among group means) falls
completely within the equivalence range, the null hypothesis can be rejected. Two
one-sided tests were conducted for both boundaries of the range. The overall null
hypothesis is rejected at level a if the associated p-value for each of the individual
hypotheses is less than a (a50.05 in our analysis). When the test analysed more
than two groups we considered all possible pairwise contrasts confidence intervals.
In such cases the null of no equivalence was not rejected if at least one of them
didn’t fall within the equivalence range. All models included age as a covariate.
To conduct an equivalence test, one must choose, prior to conducting the test,
an equivalence range i.e., the range in which we can consider the parameter of
interest in the two groups to be substantively equal. While no fixed objective rules
exist to guide the choice of the equivalence range because such choice may depend
on substantive considerations, Wellek [21] suggested a strict tolerance value for a
two sample t-test of ¡0.36. In contrast, the Food and Drug Administration
(FDA) requires a ¡20% rule: (i.e., bioequivalence is accepted if the mean
bioavailability of the test formulation is within ¡20% of the mean of the
reference formulation) [22]. However, for a logarithmic transformation of the
responses, the FDA guidance requests that to claim average bioequivalence, the
ratio of the two groups averages on the original scale be within the range [0.8–
1.25] (¡0.2231 on log scale). Because gene expression is routinely analysed on log
scale we adopted this latest criteria in our data analysis.
Statistical analysis were performed using R [23] with addititional package
robustbase [24] (Text S2).
Results
RNA quality
RNA samples isolated from 100 malignant and 29 normal endometrial specimens
were examined for concentration, purity and integrity. RNA samples A260/280
ratio ranged from 1.77 to 2.16 (mean 1.98¡ SD 0.09), reflecting pure and
protein-free isolated RNA. The integrity was assessed by RIN values using the
Agilent 2100 Bioanalyzer. Four RNAs from normal endometrial and 8 from EC
tissues were excluded from further gene expression studies due to their high
degradation (RIN,5). Mean RIN values of remaining malignant and non-
malignant samples were acceptable and not significantly different (7.36¡1.54 and
7.55¡1.09 respectively, p50.59).
Endometrial Cancer and Reference Gene Expression
PLOS ONE | DOI:10.1371/journal.pone.0113781 December 4, 2014 7 / 16

Expression levels of candidate reference genes
The Cq (quantification cycle) values of 10 candidate reference genes were
converted to CNRQ (calibrated normalized relative quantities) values using qBase
software (http://medgen.ugent.be/qBase), according to Hellemans et al [25]. This
normalization procedure removes the variation resulting from the use of different
cDNA concentration and correct for run-to-run variation using an internal
control gene.
Data on non-malignant and malignant samples are separately shown as box
plot in Fig. 1. All reference genes showed a substantial higher spread in malignant
samples compared to non-malignant ones. The genes showing the higher
Interquatile-range (IQR) were B2M (IQR50.402) and ACTB (IQR50.295) while
PPIA, POLR2A and HPRT1 show the smallest IQR (0.153, 0.187 and 0.197
respectively).
Applying the TOST method equates at computing (1–2a)% confidence interval
(90% when a50.05) for the contrast of interest (D5difference between group
means) and comparing it to the [eL,eU] range, if the Confidence Interval (CI)
intersects the equivalence range on either side the null hypothesis of non
equivalence can be rejected. Table 3 shows 90% confidence intervals for all the
contrasts of interests and the ANOVA p-values as well as an indicator of null
hypothesis rejection based on an estimate of e50.015. Considering the difference
in gene expression between malignant and non-malignant samples, all genes were
substantially varying but for GUSB, HPRT1 and PPIA (Table 3).
Among malignant samples, the expression of reference genes was substantially
equivalent among tumor grade groups for ACTB, PPIA and TBP. Considering
groups based on tumor stage the average expression of all genes except for
GAPDH was substantially stable (Table 3).
Expression stability of candidate reference genes
From the theoretical point of view, genes whose expression are equivalent between
malignant and non malignant tissue samples are all suitable reference for relative
quantification of target genes in gene profiling studies. Thus, according to the
statistical analysis performed on the expression level of the 10 selected reference
genes, GUSB, HPRT1 and PPIA were the best candidate for normalization
purposes in gene expression studies in endometrial cancer versus normal tissue.
To validate and confirm this result, all 10 reference genes including the best
performing GUSB, HPRT1 and PPIA were included in the program geNorm
which calculated the gene expression stability measure M of one gene based on the
average pairwise variation between all studied genes. The lowest M value
characterized the gene with the most stable expression. As shown in Fig. 2A, all
genes studied achieved medium expression stability with M values ranging from
1.09 for B2M to 0.82 for GAPDH (average geNorm M#1.0), which is typically
seen when evaluating candidate reference targets on heterogeneous samples, like
cancer biopsies or samples from different tissues. GAPDH, H3F3A, PPIA and
HPRT1 were identified as the most stable genes, followed by UBC as the fifth most
Endometrial Cancer and Reference Gene Expression
PLOS ONE | DOI:10.1371/journal.pone.0113781 December 4, 2014 8 / 16

stable gene. Furthermore, in addition to the generated M stability value, the
geNorm program calculates a normalization factor, based on the variable V as the
pairwise variation between two sequential normalization, to assess the optimal
number of genes required for a reliable normalization of qPCR data. As shown in
fig. 2B, taking 0.15 as a cut-off value below which the inclusion of an additional
control gene is not required [11], the optimal number of reference targets was 4.
As such, based on geNorm analysis, in our experimental situation the optimal
normalization factor could be calculated as the geometric mean of reference
targets HPRT1, PPIA, H3F3A and GAPDH. Additionally, we compared and
validated the results generated from geNorm using the NormFinder program, that
selected UBC and PPIA with a stability value of 0.365 and 0.370 respectively as the
most stable genes, followed by HPRT1, H3F3A and GAPDH closely behind (
Table 4). GeNorm and Normfinder results are in considerably closer agreement in
the identification of B2M, ACTB and POLR2A as the least stable genes in our
cohort of samples.
Discussion
Selection of appropriate reference genes is a critical aspect to be considered for
interpretation of qPCR data [13]. Normalization is a primary component of a
reliable gene expression analysis, because this process controls for biological and
analytical variation characterized by the natural variability of mRNA levels in
different tissues and individuals, as well as differences in RNA quality, extraction
protocols and PCR efficiency [26]. The use of reference genes as internal controls
Figure 1. Expression levels of candidate reference genes in malignant (hatched boxes) and non-malignat (open boxes) endometrial samples. Values are given as calibrated normalized relative quantities(CNRQ). Boxes indicate IQR for the data of unmatched samples in each group.
doi:10.1371/journal.pone.0113781.g001
Endometrial Cancer and Reference Gene Expression
PLOS ONE | DOI:10.1371/journal.pone.0113781 December 4, 2014 9 / 16

is currently the widely used method for normalizing mRNA data and correcting
them for cellular and experimental variability. Furthermore, it has become well-
estabilished that the use of more than one reference gene increases the accuracy of
the measurement compared to a single reference gene, with the mean expression
value as the best normalization strategy [13].
Nevertheless, the vast majority of qPCR-based published studies reveals an
insufficient and inadequate validation of endogenous control genes, often
arbitrarily chosen among those most commonly published and almost always used
as single reference gene and not in combination [27].
To the best of our knowledge, no validated reference genes have been identified
for EC tissues. A comprehensive MEDLINE search of gene expression studies
published between 2000 and the beginning of 2014 showed that there was no
uniform opinion on which reference gene should be used for reliable normal-
ization in EC samples. Only one article about reference gene evaluation in EC
tissue samples is reported by Hevir N et al [28]. In that investigation 38
endometrial tumors and associated normal specimens were examined using
qPCR, followed by GeNorm and NormFinder algorithms, that found HPRT1,
POLR2A and PPIA as the most stable reference genes. However, that study was
performed using RNA samples obtained from a small cohort of tumor and normal
endometrial tissues. Furthermore, tumor histological type was not specified and
the percentage of tumor cells in the samples was not addressed.
According to our literature analysis, GAPDH, 18S rRNA and ACTB were the
most frequently reported control genes, although their usefulness as normalizers
was not always strictly evaluated. Moreover, 18S rRNA have already been
Table 3. Fold changes in reference gene expression between malignant and non-malignant endometrial samples and among malignant samples groupedaccording to tumor grade and stage (90% confidence intevals, Lower and Upper bounderies; $ p-value for one-way ANOVA; R5* null hypothesis of nonequivalence rejected; [eL,eU]5[0.8,1.25]).
EC vs NE GRADE STAGE
G2 vs G1 G3 vs G1 G3 vs G2 III–IV vs I–II
Gene Lower Upper Rp-value$ Lower Upper Lower Upper Lower Upper R
p-value$ Lower Upper R
p-value$
ACTB 0.50 0.65 ,0.001 0.86 1.16 0.97 1.59 0.99 1.55 0.273 0.48 1.56 0.677
GAPDH 1.83 2.49 ,0.001 0.71 1.02 0.71 0.96 0.84 1.11 0.099 1.03 1.49 0.057
GUSB 0.75 1.15 0.560 0.61 0.87 0.60 0.88 0.84 1.19 0.007 0.79 1.26 0.973
PPIA 0.99 1.25 0.137 0.95 1.14 1.01 1.24 0.97 1.19 * 0.188 0.85 1.14 * 0.880
HPRT1 0.83 1.09 * 0.530 1.28 1.69 1.34 1.79 0.91 1.22 ,0.001 0.98 1.49 0.147
H3F3A 1.48 1.85 ,0.001 1.07 1.45 0.98 1.32 0.77 1.09 0.057 0.81 1.13 * 0.675
POLR2A 0.51 0.69 ,0.001 0.78 0.95 0.92 1.15 1.08 1.34 0.007 0.94 1.18 * 0.485
TBP 0.40 0.50 ,0.001 1.01 1.26 0.92 1.18 0.81 1.05 0.167 0.98 1.39 0.142
UBC 0.73 0.93 0.012 1.11 1.54 1.07 1.48 0.84 1.12 0.019 0.92 1.28 0.402
B2M 1.22 1.87 0.002 0.52 0.94 0.62 1.05 0.84 1.59 0.114 0.71 1.40 0.996
Models adjusted for age.
doi:10.1371/journal.pone.0113781.t003
Endometrial Cancer and Reference Gene Expression
PLOS ONE | DOI:10.1371/journal.pone.0113781 December 4, 2014 10 / 16
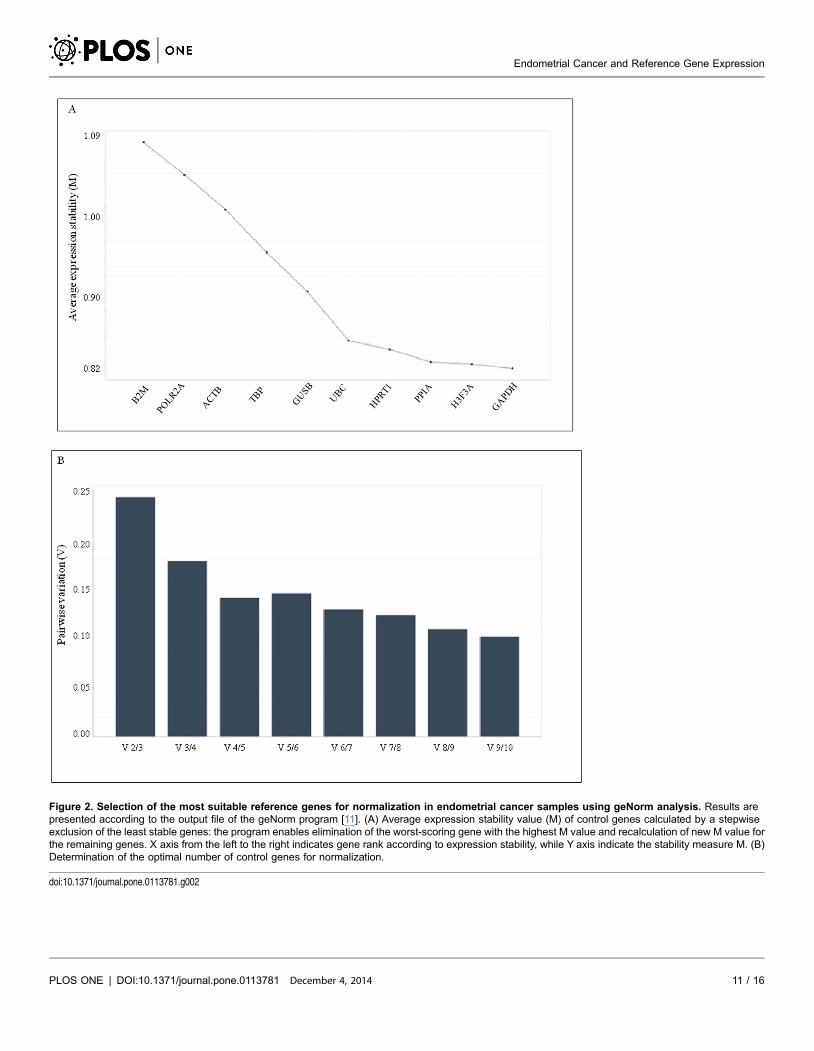
Figure 2. Selection of the most suitable reference genes for normalization in endometrial cancer samples using geNorm analysis. Results arepresented according to the output file of the geNorm program [11]. (A) Average expression stability value (M) of control genes calculated by a stepwiseexclusion of the least stable genes: the program enables elimination of the worst-scoring gene with the highest M value and recalculation of new M value forthe remaining genes. X axis from the left to the right indicates gene rank according to expression stability, while Y axis indicate the stability measure M. (B)Determination of the optimal number of control genes for normalization.
doi:10.1371/journal.pone.0113781.g002
Endometrial Cancer and Reference Gene Expression
PLOS ONE | DOI:10.1371/journal.pone.0113781 December 4, 2014 11 / 16

described as a poor choice for use as a reference gene, since its transcription is
significantly regulated in various experimental settings and variable in different
tissues. Indeed, the regulation of ribosomal RNA synthesis is independent from
mRNA synthesis, resulting in a different expression pattern compared to mRNA
[12].
The current study offers a systematic evaluation of 10 potential reference genes
in a large set of endometrioid EC samples and normal endometrial tissues, to
determine the most reliable one for accurate normalization of RT-qPCR data. We
examined, in addition to GAPDH and ACTB, eight other genes (GUSB, H3F3A,
HPRT1, POLR2A, PPIA, TBP, UBC, B2M) that have been evaluated as reference
genes in previously published EC gene expression studies.
The particular design of our study has been characterized by several features,
including 1) wide cohort of malignant and non-malignant endometrial samples,
belonging to a single institution, 2) tumor tissue samples of endometrioid
histological type, the most frequent EC type, and number well balanced with
respect to tumor grade, 3) stringent quality control of isolated total RNA, 4)
careful selection of reference genes, avoiding rRNA and genes whose proteins
belong to similar functional classes, to reduce gene coregulation, 5) optimal
primer set design of selected reference genes, each one validated with a
dissociation curve of the amplicon, 6) qPCR performed with SYBR green
technology, that is cost-effective and easy to apply in every laboratory setting, 7)
use of an inter-run calibration sample, that showed an optimal correlation in gene
expression among all plates, 8) experiments performed in triplicate for every gene
and every sample.
In particular, choosing optimal primer set is an essential starting point to
obtain accurate results. We adopted primer sets generating amplicons with length
around 100 base pair, in order to obtain the maximum amplification efficiency,
independent of RNA quality, as previously reported [29]. Moreover, all primer
sets were required to span at least two neighboring exons, to avoid amplified
Table 4. Candidate reference genes for normalization listed according to their expression stability calculated by the NormFinder program.
Ranking order Gene name Stability value
1 UBC 0.365
2 PPIA 0.370
3 HPRT1 0.436
4 H3F3A 0.473
5 GAPDH 0.480
6 TBP 0.566
7 GUSB 0.586
8 POLR2A 0.653
9 ACTB 0.657
10 B2M 0.682
High expression stability is indicated by a low stability value as an estimation of both the intra- and the intergroup variation of individual gene, according tothe model-based approach developed by Andersen et al. [17].
doi:10.1371/journal.pone.0113781.t004
Endometrial Cancer and Reference Gene Expression
PLOS ONE | DOI:10.1371/journal.pone.0113781 December 4, 2014 12 / 16

products from contaminating genomic DNA eventually present, that can also
affect amplification efficiency [30]. To determine the best reference genes, we
analyzed our results under the suggested published rules [31]. First, considering
amplification efficiency, all primer sets are acceptable because they show a
performance close to 100% (Table 2). Then, we calculated the best performing
reference genes using geNorm and NormFinder softwares, based on two distinct
statistical models and often used in other studies to identify suitable reference
genes from a set of candidates [11, 17]. While geNorm indicated GAPDH, H3F3A,
PPIA and HPRT1 as the four most stably expressed reference genes, NormFinder
identified UBC and PPIA, strictly followed by HPRT1 and H3F3A, as the four
genes with the best stability. However, our previously performed statistical
analysis on gene expression of our cohort of samples, revealed that only GUSB,
HPRT1 and PPIA did not differ significantly in their expression in malignant
versus non-malignant endometrial tissues. Conversely, GAPDH and ACTB, the
two most commonly reported normalization genes, did not fulfill the criteria of
constant expression between normal and tumor samples, as already described by
several authors for other malignancies [25, 32].
A potential limitation of this study is represented by the discrepancy in the
number of cases (#100) analyzed when compared to healthy controls (#29). The
study is however characterized by a powerful parametric approach which partially
corrects for this unbalance. In this context, it is not advisable to blindly accept the
best combination suggested by geNorm and NormFinder, as both algorithms
included genes like GAPDH and H3F3A showing differences in expression level
between normal and tumor endometrial tissues. Actually, combining the results
from the powerful statistical analysis and the expression stability performed on the
expression level of 10 candidate reference genes, HPRT1 and PPIA consistently
emerged as the most stable expressed genes, regardless of sample type, to be used
as normalizer for relative gene quantification in endometrioid EC samples versus
normal controls. These results, common to geNorm and NormFinder, are in
concordance with previously published data on a smaller cohort of EC samples
[26]. Moreover HPRT1 has previously been recommended as a universal reference
gene for differential expression studies in cancer research [33].
However, considering that the expression of reference genes can be influenced
not only by the tissue type, but also by other clinico-pathological characteristics
like tumor grade or stage, to prove whether a gene is suitable for normalization it
is necessary to carefully define the problem to be investigated. It must be decided,
for instance, whether gene expression only between normal and tumor samples, or
also among different tumor grades and/or stages has to be compared, taking into
account that the basic requirement of a reference gene to be used for
normalization purposes is that its expression does not show significant difference
between the study groups. The results of our analysis proved that the expression of
reference genes in our cohort of patients, including only endometrioid histotype
and carefully selected and balanced according to their tumor grade, was
dependent on tumor grade for B2M, GAPDH, H3F3A, GUSB, HPRT1, POLR2A
and UBC. Among the remaining genes, PPIA resulted as the best performing
Endometrial Cancer and Reference Gene Expression
PLOS ONE | DOI:10.1371/journal.pone.0113781 December 4, 2014 13 / 16
reference gene to be used for normalization of endometrial carcinomas at different
degrees of differentiation. This result was first achieved using a powerful
parametric statistical approach, followed by a validation using geNorm and
NormFinder softwares.
Differently, expression of all genes except for GAPDH shows to remain stable
among tumor stages, but the extreme imbalance in the number of patients per
group has to be considered in the evaluation of those results.
In summary, careful selection of appropriate endogenous control genes plays a
crucial role in expression studies. The current investigation reports the first
evaluation of a panel of putative reference genes in endometrioid EC tissue
samples, the most frequent EC histotype. Taking our findings together, we
recommend HPRT1 and PPIA as the best reference genes for relative
quantification in gene expression studies comparing normal and tumor
endometrial tissues. They can be used as single reference genes depending on the
expression level of the target gene, or better in combination to achieve a more
reliable normalization strategy. Finally, this is the first study exploring reference
gene expression in endometrioid EC tissues among the different tumor degrees of
differentiation, where PPIA has emerged as the most appropriate single reference
gene for accurate data normalization.
Supporting Information
Text S1. Complete list of references (i.e., 327 papers) cited in the Background
section of the manuscript. The 90 articles based on the use of one or more
reference genes in endometrial cancer expression studies and used in our
statistical analysis are highlighted in bold. Twelve articles (highlighted in italics in
the text) were excluded from analysys because not available in the English
language.
doi:10.1371/journal.pone.0113781.s001 (DOC)
Text S2. Algorithm for testing equivalence and R code examples.
doi:10.1371/journal.pone.0113781.s002 (DOC)
Acknowledgments
We would like to thank all the nurses working in the OR and in the Division of
Obstetrics and Gynecology, Spedali Civili di Brescia, Italy for the essential
contribution in the collection of tissue samples. We are also grateful to Dr Marco
Bianchi for helping in data analysis.
Author ContributionsConceived and designed the experiments: CR EB. Performed the experiments: CR
PT RAT. Analyzed the data: SC. Contributed reagents/materials/analysis tools: LZ
EB. Wrote the paper: CR EB AR ADS. Crititically reviewed the manuscript: ES SP.
Endometrial Cancer and Reference Gene Expression
PLOS ONE | DOI:10.1371/journal.pone.0113781 December 4, 2014 14 / 16

References
1. Siegel R, Naishadham D, Jemal A (2014) Cancer statistics. CA Cancer J Clin Jan-Feb 64(1): 9–29.
2. Bohkman JV (1983) Two pathogenetic types of endometrial carcinoma. Gynecol Oncol 15(1):10–17.
3. Amant F, Moerman P, Neven P, Timmerman D, Van Limbergen E, et al. (2005) Endometrial cancer.Lancet 366:491–505.
4. Felix AS, Weissfeld JL, Stone RA, Bowser R, Chivukula M, et al. (2010) Factors associated with TypeI and Type II endometrial cancer. Cancer Causes Control 21:1851–1856.
5. Goff BA, Kato D, Schmidt RA, Ek M, Ferry JA, et al. (1994) Uterine papillary serous carcinoma:pattern of metastatic spread. Gynecol Oncol 54:264–268.
6. Creasman W, Kohler M, Odicino, Maisonneuve P, Boyle P (2004) Prognosis of papillary serous, clearcell, and grade 3 stage I carcinoma of the endometrium. Gynecol Oncol 95: 593–596.
7. Tricarico C, Pinzani P, Bianchi S, Paglierani M, Distante V, et al. (2002) Quantitative realtime reversetranscription polymerase chain reaction: normalization to rRNA or single housekeeping genes isinappropriate for human tissue biopsies. Anal Biochem 309:293–300.
8. Dheda K, Huggett JF, Bustin SA, Johnson MA, Rook G, et al. (2004) Validation of housekeepinggenes for normalizing RNA expression in real-time PCR. Biotechniques 37:112–119.
9. Bustin SA (2000) Absolute quantification of mRNA using realtimereverse transcription polymerasechain reaction assays. J Mol Endocrinol 25:169–193.
10. Thellin O, Zorzi W, Lakaye B, De Borman BB, Coumans B, et al. (1999) Housekeeping genes asinternal standards: use and limits. J Biotechnol 75:291–295.
11. Vandesompele J, De Preter K, Pattyn F, Poppe B, Van Roy N, et al. (2002) Accurate normalization ofreal-time quantitative RT-PCR data by geometric averaging of multiple internal control genes. GenomeBiol 3:research0034.1–research0034.11.
12. Radonic A, Thulke S, Mackay IM, Landt O, Siegert W, et al. (2004) Guideline to reference geneselection for quantitative real-time PCR. Biochem Biophys Res Commun 313:856–862.
13. Bustin SA, Benes V, Garson JA, Hellemans J, Huggett J, et al. (2009) The MIQE guidelines:minimum information for publication of quantitative real-time PCR experiments. Clin ChemApr;55(4):611–22.
14. Mueller O, Lightfoot S, Schroeder A (2004) RNA integrity number (RIN)-standardization of RNA qualitycontrol. Agilent Technologies, Palo Alto.
15. Rasmussen R. (2001) Quantification on the LightCycler instrument. Rapid Cycle Real-time PCR:Methods and Applications, Springer, Hidelberg.
16. Lefever S, Hellemans J, Pattyn F, Przybylski DR, Taylor C, et al. (2009) RDML: structured languageand reporting guidelines for real-time quantitative PCR data. Nucleic Acids Res. Forthcoming.
17. Andersen CL, Jensen JL, Orntoft TF (2004) Normalization of real-time quantitative reversetranscription-PCR data: a model-based variance estimation approach to identify genes suited fornormalization, applied to bladder and colon cancer data sets. Cancer Res 64:5245–5250.
18. Long JS and Ervin LH (2000) Using heteroscedasity consistent standard errors in the linear regressionmodel. The American Statistician 54, 217–22
19. Huber, Peter J (2009) Robust Statistics (2nd ed.). Hoboken, NJ: John Wiley & Sons Inc.
20. Schuirmann DL (1981) On hypothesis testing to determine if the mean of a normal distribution iscontained in a known interval. Biometrics 37 617.
21. Wellek S (2003) Testing statistical hypotheses of equivalence. Chapman and Hall/CRC.
22. US Food and Drug Administration (FDA) (1992) Guidance on Statistical Procedures forBioequivalence Using a Standard Two-treatment Crossover Design. Division of Bioequivalence, Officeof Generic Drugs, Center for Drug Evaluation and research, US Food and Drug Administration,Rockville, MD.
23. R Core Team (2014) R: A language and environment for statistical computing. R Foundation forStatistical Computing, Vienna, Austria.
Endometrial Cancer and Reference Gene Expression
PLOS ONE | DOI:10.1371/journal.pone.0113781 December 4, 2014 15 / 16

24. Wang J, Zamar R, Marazzi A, Yohai V, Salibian Barrera M, et al. (2014) Robust Library R packageversion 0.4–16.
25. Hellemans J, Mortier G, De Paepe A, Speleman F and Vandesompele J (2007) qBase relativequantification framework and software for management and automated analysis of real-time quantitativePCR data. Genome Biology, 8:R19.
26. Caradec J, Sirab N, Keumeugni C, Moutereau S, Chimingqi M, et al. (2010) ‘Desperate housegenes’: the dramatic example of hypoxia. British Journal of Cancer 102:1037–1043.
27. Dijkstra JR, van Kempen LC, Nagtegaal ID, Bustin SA (2014) Critical appraisal of quantitative PCRresults in colorectal cancer research: can we rely on published qPCR results? Mol Oncol Jan 2.
28. Hevir N, Sinkovec J, Lanisnik Rizner T (2011) Disturbed expression of phase I and phase II estrogen-metabolizing enzymes in endometrial cancer: lower levels of CYP1B1 and increased expression of S-COMT. Molecular and Cellular Endocrinology 331:158–167.
29. Piyamongkol W, Bermudez MG, Harper JC, Wells D (2003) Detailed investigation of factorsinfluencing amplification efficiency and allele drop out in single cell PCR: implications for preimplantationgenetic diagnosis. Mol Hum Reprod 9: 411–420.
30. Fleige F, Pfaffl MW (2006) RNA integrity and the effect on the real-time qRT- PCR performance. MolAspects Med 27:126–139.
31. Mahoney DJ, Carey K, Fu MH, Snow R, Cameron-Smith D, et al. (2004) Real-time RT-PCR analysisof housekeeping genes in human skeletal muscle following acute exercise. Physiol Genomics 18: 226–231.
32. Greer S, Honeywell R, Geletu M, Arulanandam R, Raptis L (2010) Housekeeping genes: expressionlevels may change with density of cultured cells. J Immunol Methods 335:76–79.
33. Bustin SA (2002) Quantification of mRNA using real-time reverse transcription PCR (RT-PCR): trendsand problems. J Mol Endocrinol 29: 23–39.
Endometrial Cancer and Reference Gene Expression
PLOS ONE | DOI:10.1371/journal.pone.0113781 December 4, 2014 16 / 16
Copyright © 2022 FDOKUMEN