Handwritten digit recognition: investigation of normalization and feature extraction techniques
15
Pattern Recognition 37 (2004) 265 – 279 www.elsevier.com/locate/patcog Handwritten digit recognition: investigation of normalization and feature extraction techniques Cheng-Lin Liu ∗ , Kazuki Nakashima, Hiroshi Sako, Hiromichi Fujisawa Central Research Laboratory, Hitachi Ltd., 1-280 Higashi-koigakubo, Kokubunji-shi, Tokyo 185-8601, Japan Received 13 November 2002; accepted 14 June 2003 Abstract The performance evaluation of various techniques is important to select the correct options in developing character recog- nition systems. In our previous works, we have proposed aspect ratio adaptive normalization (ARAN) and have evaluated the performance of state-of-the-art feature extraction and classication techniques. For this time, we will propose some im- proved normalization functions and direction feature extraction strategies and will compare their performance with existing techniques. We compare ten normalization functions (seven based on dimensions and three based on moments) and eight feature vectors on three distinct data sources. The normalization functions and feature vectors are combined to produce eighty classication accuracies to each dataset. The comparison of normalization functions shows that moment-based functions out- perform the dimension-based ones and the aspect ratio mapping is inuential. The comparison of feature vectors shows that the improved feature extraction strategies outperform their baseline counterparts. The gradient feature from gray-scale image mostly yields the best performance and the improved NCFE (normalization-cooperated feature extraction) features also per- form well. The combined eects of normalization, feature extraction, and classication have yielded very high accuracies on well-known datasets. ? 2003 Pattern Recognition Society. Published by Elsevier Ltd. All rights reserved. Keywords: Handwritten digit recognition; Normalization; Aspect ratio mapping; Direction feature; NCFE; Gradient feature 1. Introduction In developing optical character recognition (OCR) sys- tems, every module or step has multiple options of algo- rithmic implementation. Generally, a character recognizer involves three tasks: pre-processing, feature extraction, and classication. The options of pre-processing include the size and aspect ratio of normalized image, the interpolation technique of pixel values, etc. For feature extraction, a large variety of feature types and extraction techniques are avail- able. In addition, a large number of classiers are available for classication: parametric and nonparametric statisti- cal classiers, neural networks, support vector machines ∗ Corresponding author. Tel: +81-42-323-1111; fax: +81-42-327-7778. E-mail address: [email protected] (C.-L. Liu). (SVMs), hybrid classiers, etc. To select the correct op- tion for each task, the available algorithms and feasible parameters should be evaluated in an environment relevant to practical application. To avoid exhaustive comparison, we may pre-select a subset of algorithms according to the requirements of application, the general characteristics of algorithms, and the previous evaluation results. In pattern recognition community, numerous works have been contributed to the evaluation of classication algorithms. While in character recognition, a number of evaluation works have been accomplished to pre-processing and feature extraction as well. Our previous results of evalu- ation of feature extraction and classication techniques have provided some practical insights [1,2]. We have shown that some features and classiers generally yield high perfor- mance at low complexity while some others are not prefer- able for practical applications due to the low performance or high complexity. For pre-processing, we have shown that 0031-3203/$30.00 ? 2003 Pattern Recognition Society. Published by Elsevier Ltd. All rights reserved. doi:10.1016/S0031-3203(03)00224-3
Transcript of Handwritten digit recognition: investigation of normalization and feature extraction techniques

Pattern Recognition 37 (2004) 265–279www.elsevier.com/locate/patcog
Handwritten digit recognition: investigation of normalizationand feature extraction techniques
Cheng-Lin Liu∗, Kazuki Nakashima, Hiroshi Sako, Hiromichi FujisawaCentral Research Laboratory, Hitachi Ltd., 1-280 Higashi-koigakubo, Kokubunji-shi, Tokyo 185-8601, Japan
Received 13 November 2002; accepted 14 June 2003
Abstract
The performance evaluation of various techniques is important to select the correct options in developing character recog-nition systems. In our previous works, we have proposed aspect ratio adaptive normalization (ARAN) and have evaluatedthe performance of state-of-the-art feature extraction and classi:cation techniques. For this time, we will propose some im-proved normalization functions and direction feature extraction strategies and will compare their performance with existingtechniques. We compare ten normalization functions (seven based on dimensions and three based on moments) and eightfeature vectors on three distinct data sources. The normalization functions and feature vectors are combined to produce eightyclassi:cation accuracies to each dataset. The comparison of normalization functions shows that moment-based functions out-perform the dimension-based ones and the aspect ratio mapping is in<uential. The comparison of feature vectors shows thatthe improved feature extraction strategies outperform their baseline counterparts. The gradient feature from gray-scale imagemostly yields the best performance and the improved NCFE (normalization-cooperated feature extraction) features also per-form well. The combined e>ects of normalization, feature extraction, and classi:cation have yielded very high accuracies onwell-known datasets.? 2003 Pattern Recognition Society. Published by Elsevier Ltd. All rights reserved.
Keywords: Handwritten digit recognition; Normalization; Aspect ratio mapping; Direction feature; NCFE; Gradient feature
1. Introduction
In developing optical character recognition (OCR) sys-tems, every module or step has multiple options of algo-rithmic implementation. Generally, a character recognizerinvolves three tasks: pre-processing, feature extraction, andclassi:cation. The options of pre-processing include thesize and aspect ratio of normalized image, the interpolationtechnique of pixel values, etc. For feature extraction, a largevariety of feature types and extraction techniques are avail-able. In addition, a large number of classi:ers are availablefor classi:cation: parametric and nonparametric statisti-cal classi:ers, neural networks, support vector machines
∗ Corresponding author. Tel: +81-42-323-1111;fax: +81-42-327-7778.
E-mail address: [email protected] (C.-L. Liu).
(SVMs), hybrid classi:ers, etc. To select the correct op-tion for each task, the available algorithms and feasibleparameters should be evaluated in an environment relevantto practical application. To avoid exhaustive comparison,we may pre-select a subset of algorithms according to therequirements of application, the general characteristics ofalgorithms, and the previous evaluation results.
In pattern recognition community, numerous workshave been contributed to the evaluation of classi:cationalgorithms. While in character recognition, a number ofevaluation works have been accomplished to pre-processingand feature extraction as well. Our previous results of evalu-ation of feature extraction and classi:cation techniques haveprovided some practical insights [1,2]. We have shown thatsome features and classi:ers generally yield high perfor-mance at low complexity while some others are not prefer-able for practical applications due to the low performanceor high complexity. For pre-processing, we have shown that
0031-3203/$30.00 ? 2003 Pattern Recognition Society. Published by Elsevier Ltd. All rights reserved.doi:10.1016/S0031-3203(03)00224-3

266 C.-L. Liu et al. / Pattern Recognition 37 (2004) 265–279
the normalization of character images is in<uential to therecognition performance and have proposed an aspect ra-tio adaptive normalization (ARAN) strategy to improve theperformance [3].
This paper proposes some improved normalization andfeature extraction strategies and will evaluate their perfor-mance with comparison to existing techniques. We focuson the diversity of implementation for ARAN and directionfeature extraction. The performance of ARAN depends onthe aspect ratio mapping function. The direction feature ismost popularly used in character recognition and the per-formance largely depends on the representation of featureand the extraction technique. In this paper, we will giveten normalization functions (seven based on dimensionsand three based on moments) and eight feature vectors(six existing ones and two new ones) for comparison to:nd out the good choices. The feature vectors represent thedirection distributions of chaincodes or gradients. The newfeature vectors are aimed to upgrade the performance ofNCFE (normalization-cooperated feature extraction) [4].Some related previous works are brie<y reviewed asfollows.
Normalization is considered to be the most importantpre-processing factor for character recognition [5]. Nor-mally, the character image is linearly mapped onto astandard plane by interpolation/extrapolation. The size andposition of character is controlled such that the x=y dimen-sions of normalized plane are :lled. The implementation ofinterpolation/extrapolation is in<uential to the recognitionperformance [6,7]. By linear mapping, the character shapeis not deformed except the aspect ratio changes. Somestrategies were proposed to deform the character shape withaim to reduce the within-class variation. The perspectivetransformation attempts to correct the imbalance of charac-ter width [8], the moment normalization attempts to rectifythe rotation or slant [9], and the nonlinear normalizationaims to equalize the line density [10,11]. For slant normal-ization, the slant can also be estimated from character :eldcontext instead of moments [12].
Feature extraction is at the core of character recognitionand a large variety of feature types and extraction strate-gies have been proposed [13]. The distribution of localstroke direction (direction feature) is most popularly useddue to the high performance and the ease of implemen-tation. The local stroke direction can be measured fromskeleton [14], chaincode [15,16], or gradient [17–19]. Thechaincode feature is widely adopted, whereas the gradi-ent feature is applicable to gray-scale images as well asbinary images. Some complementary features were pro-posed to enhance the discriminating power of directionfeature, such as the structural and concavity features [17],pro:le shape feature [20], and curvature feature [21]. Onthe other hand, the so-called normalization-cooperatedfeature extraction (NCFE) method extracts direction fea-ture from the original image other than the normalizedimage [4].
We have evaluated previously a number of statistical andneural classi:ers in handwritten character recognition [1,2]and have found out that some classi:ers give high accu-racies at low complexity. On the other hand, the supportvector machine (SVM) [21,22] is superior in classi:cationaccuracy but very computationally expensive. In this paper,for testing the performance of normalization and feature ex-traction techniques, we use three classi:ers that give highaccuracies: the polynomial classi:er [23,24], the discrim-inative learning quadratic discriminant function (DLQDF)[25], and the support vector classi:er with radial basis func-tion kernel (SVC-rbf).
Among the ten normalization functions that we test, thebasic strategies, namely, linear normalization, nonlinear nor-malization, and moment normalization, have been long usedin character recognition. Our contribution is to diversifythe aspect ratio mapping to improve the recognition perfor-mance. Among the eight feature vectors, the basic featuretypes (chaincode feature, pro:le shape feature, NCFE fea-ture, and gradient feature) were proposed previously andhave been evaluated in our previous works. This paper pro-poses two improved versions to the NCFE: the enhancedNCFE with pro:le shape feature and the continuous NCFE.The improved versions of chaincode feature and gradientfeature were proposed in our previous works [2] and will befurther evaluated in this study.
We test the performance of handwritten digit recognitionon three databases: CENPARMI [26], NIST [27], and Hi-tachi. The databases have di>erent characteristics and henceshow di>erent tendencies of performance. The digit imagesof CENPARMI database were collected from live mailimages of USPS, the NIST database was collected fromspecially designed forms :lled by US Census Bureauemployees and high school students. The Hitachi databasecontains a huge number of digit images collected fromsampling sheets and real form images and is divided intoseveral subsets of varying qualities. From each of threedatabases, a dataset is speci:ed for training classi:ers, andthe other dataset(s) are tested with the trained classi:ers. Ona test dataset, a speci:c classi:er gives eighty classi:cationaccuracies based on the combination of ten normalizationfunctions and eight feature vectors. Further, each featurevector has two variations depending on the resolution of di-rection: 4-orientation and 8-direction, which are evaluatedseparately.
The rest of this paper is organized as follows. Section 2 de-scribes the normalization strategies; Section 3 describes thefeature extraction techniques. Section 4 presents the experi-mental results and Section 5 provides concluding remarks.
2. Normalization techniques
2.1. Implementation of normalization
For ease of feature extraction and classi:cation, the x=ydimension (size) of normalized image plane (standard

C.-L. Liu et al. / Pattern Recognition 37 (2004) 265–279 267
plane) is :xed. In aspect ratio adaptive normalization(ARAN), however, the dimensions of the standard planeare not necessarily :lled [3]. Depending on the aspect ratio,the normalized image is centered in the plane with one di-mension :lled. Assume the standard plane is square and theside length is denoted by L. Denote the width and height ofthe normalized character image as W2 and H2, the aspectratio is de:ned by
R2 =
{W2=H2; if W2¡H2;
H2=W2; otherwise:(1)
If the normalized image :lls one dimension, thenmax(W2; H2) = L. In moment-based normalization with thecentroid of character image aligned to the center of standardplane, however, the normalized image does not necessarily:ll one dimension and may go beyond the plane. In thiscase, W2 and H2 are not decided by L, and the image partoutside the standard plane is cut o>.
In the implementation of ARAN, the normalized characterimage is :lled into another plane of <exible size W2 × H2,and then this <exible plane is shifted to overlap the standardplane by aligning boundaries or centroid. In the following,we will illustrate the transformation of a character image ofsize W1 ×H1 into a normalized image of size W2 ×H2. Thetransformation can be accomplished by forward mappingor backward mapping. Denote the original image and thenormalized image as f(x; y) and g(x′; y′), respectively, thenormalized image is generated by g(x′; y′) = f(x; y) basedon coordinate mapping. The forward mapping and backwardmapping are given by
x′ = x′(x; y);
y′ = y′(x; y);
and
x = x(x′; y′);
y = y(x′; y′);
respectively. In the following, we :rst describe the coordi-nate mapping of various normalization methods, and thenaddress the interpolation of pixels.
The forward mapping and backward mapping of linearnormalization, moment normalization, slant normalization,and nonlinear normalization are tabulated in Table 1. In thetable, and � denote the ratios of transformation, given by
=W2=W1;
� = H2=H1:
While for nonlinear normalization, hx and hy denote thenormalized accumulated line density histograms [10,11].
In our experiments, the moment normalization refers tolinear transformation without rotation, with the center andsize of normalized image determined by moments. (xc; yc)
Table 1Coordinate mapping of various normalization methods
Method Forward mapping Backward mapping
Linear x′ = x x = x′= y′ = �y y = y′=�
Moment x′ = (x − xc) + x′c x = (x′ − x′c)=� + xcy′ = �(y − yc) + y′c y = (y′ − y′c)=� + yc
Slant x′ = x − (y − yc)tan � x = x′ + (y − yc)tan �y′ = y y = y′
Nonlinear x′ =W2hx(x) x = h−1x (x′=W2)
y′ = H2hy(y) y = h−1y (y′=H2)
denotes the center of gravity (centroid) of the original image,given by
xc = m10=m00;
yc = m01=m00;
where mpq denotes the geometric moments:
mpq =∑x
∑y
xpyqf(x; y);
and (x′c; y′c) denotes the geometric center of the normalized
plane, given by
x′c =W2=2;
y′c = H2=2:
While in slant normalization based on moments, the angleof slant is calculated from second-order moments:
tan � =�11�02;
where
�pq =∑x
∑y
(x − xc)p(y − yc)qf(x; y):
In forward mapping, x and y are discrete but x′(x; y)and y′(x; y) are not necessarily discrete; while in backwardmapping, x′ and y′ are discrete but x(x′; y′) and y(x′; y′) arenot necessarily discrete. Further, in forward mapping, themapped coordinates (x′; y′) do not necessarily :ll all pixelsin the normalized plane. Therefore, coordinate discretizationor pixel interpolation is needed in the implementation ofnormalization.
In our experiments, all the (original) character imageshave binary gray levels. We use coordinate discretizationto generate binary normalized images and use pixel in-terpolation to generate gray-scale normalized images. Bydiscretization, the mapped coordinates (x′; y′) or (x; y) areapproximated with the closest integer numbers, ([x′]; [y′])or ([x]; [y]). In the discretization of backward mapping, thediscrete coordinates (x′; y′) scan the pixels of the normalized

268 C.-L. Liu et al. / Pattern Recognition 37 (2004) 265–279
Fig. 1. Forward mapping of unit square pixel.
plane and the gray level f([x]; [y]) is assigned to g(x′; y′).In the discretization of forward mapping, the discrete coor-dinates (x; y) scan the pixels of the original image and thegray level f(x; y) is assigned to all the pixels ranged from([x′(x)]; [y′(y)]) to ([x′(x + 1)]; [y′(y + 1)]).
In the interpolation of backward mapping for generat-ing gray-scale image, the mapped position (x; y) is sur-rounded with four discrete pixels. The gray level g(x′; y′)is a weighted combination of the four pixel values. In theinterpolation of forward mapping for generating gray-scaleimage, each pixel in the original image and the normalizedimage is viewed as a square of unit area. By coordinatemapping, the unit square of original image is mapped to arectangle in the normalized plane. As illustrated in Fig. 1,in the normalized plane, each unit square overlapped withthe rectangle is given a gray level proportional to the over-lapping area.
2.2. Aspect ratio mapping
To implement the normalization, the width and height ofthe normalized image,W2 and H2, are to be determined. Weset max(W2; H2) equal to the side length L of the standardplane, while min(W2; H2) is determined by the aspect ratioaccording to Eq. (1). The aspect ratio of the normalizedimage is adaptable to that of the original image. Hence theaspect ratio mapping function determines the size and shapeof the normalized image. In the following, we will give tennormalization functions with varying aspect ratio mapping,among which seven are based on image dimensions andthree are based on moments.
For dimension-based normalization, the actual imagewidth and height are taken as the dimensions. While formoment-based normalization, the original image is viewedto be centered at the centroid and the boundaries are re-setto [xc− 2
√�20; xc +2
√�20] and [yc− 2
√�02; yc +2
√�02 ].
Accordingly, the dimensions are re-set to W1 = 4√�20 and
H1 = 4√�02. The image plane is expanded or trimmed so
as to :t this range. The aspect ratio of the original image isthen calculated by
R1 =
{W1=H1; if W1¡H1;
H1=W1; otherwise:
Varying the normalization strategy and the aspect rationmapping function, the ten normalization functions are listedas follows.
• F0: linear normalization with :xed aspect ratio,
R2 = 1:
• F1: linear normalization with aspect ratio preserved,
R2 = R1:
• F2: linear normalization with square root of aspect ratio,
R2 =√R1:
• F3: linear normalization with cubic root of aspect ratio,
R2 = 3√R1:
• F4: linear normalization with piecewise linear aspectratio,
R2 =
{0:25 + 1:5R1; if R1¡ 0:5
1; otherwise
• F5: linear normalization with square root of sine of aspectratio,
R2 =
√sin
(�2R1
):
• F6: nonlinear normalization with aspect ratio mappingF5. The line density histograms are calculated using themethod of [10].
• F7: moment normalization with aspect ratio preserved.• F8: moment normalization with square root of aspect
ratio.• F9: moment normalization with cubic root of aspect ratio.
The aspect ratio mapping functions F0–F5 are plotted inFig. 2. Among the functions, F0, F4 and F5 have been testedin [3], wherein F4 and F5 were shown to outperform F0.
Fig. 2. Curves of aspect ratio mapping functions.

C.-L. Liu et al. / Pattern Recognition 37 (2004) 265–279 269
Fig. 3. Normalized binary images of 10 normalization functions.
Fig. 4. Normalized gray-scale images of 10 normalization functions.
In our experiments, all the normalization functions areimplemented by forward mapping. Figs. 3 and 4 show thenormalized binary images and gray-scale images of the sameoriginal image corresponding to 10 normalization func-tions, respectively. The size of standard normalized plane is35 × 35. We can see that when the aspect ratio of normal-ized image deviates much from the original aspect ratio(e.g., F0 and F5), the deformation of character shape isalso considerable. For moment-based normalization (F7, F8and F9), the normalized image is centered at the centroid andneither dimension of the standard plane is :lled.
3. Feature extraction techniques
We extract three types of direction features: chaincodefeature, NCFE feature, and gradient feature. The chain-code feature has two variations depending on whetherslant normalization is applied or not. For chaincode featureand gradient feature extraction, the normalized image isdecomposed into four orientation planes or eight directionplanes. While in NCFE, the edge pixels of the original imageare directly mapped to 4-orientation or 8-direction planes.For feature measuring, each feature plane is partitioned intouniform zones and the intensity of each zone is accumulatedas a measurement, or blurring masks are convolved withthe plane to give measurements. The convolution with blur-ring masks is equivalent to low-pass :ltering and sampling.Usually, a Gaussian mask is used:
h(x; y) =1
2��2xexp
(− x
2 + y2
2�2x
):
Fig. 5. Eight directions of chaincodes.
The variance parameter �x is related to the interval be-tween blurring masks, which can be viewed as the samplinginterval and is the reciprocal of sampling frequency. Anempirical formula was given in Ref. [20]:
�x =
√2tx�;
where tx is the interval between blurring masks in x-axis andy-axis. At the center (x0; y0) of blurring mask, the convolu-tion gives a measurement
F(x0; y0) =∑x
∑y
f(x; y)h(x − x0; y − y0):
In chaincode feature extraction, the contour pixels of thenormalized image are assigned 8-direction codes (Fig. 5)and the contour pixels of each direction are assigned tothe corresponding direction plane. The assignment of chain-codes can be accomplished in a raster scan of the imagewithout contour tracing [20]. In this procedure, a pixel ofmultiple connectivity can be assigned multiple chaincodes.If 4-orientation feature is to be extracted, the direction planesof each pair of opposite directions are merged into onefeature plane, and blurring is performed on four planes.
For NCFE, each chaincode in the original image is viewedas a line segment, which is mapped to another line segmentin a standard direction plane. In the direction plane, eachgrid cell crossed by the line segment in the main (x or y)direction is given a unit of direction contribution. Since thecoverage of line segment to the grid cells is not discrete,we hereby propose an improved NCFE method based oncontinuous feature plane. In the continuous plane, a pixel isviewed as a unit square and the strength of direction is pro-portional to the length of line segment falling in this square.An example is illustrated in Fig. 6, where a line segmentmapped from a chaincode covers four grid cells A, B, C andD. By discrete NCFE, the cells A and C are assigned a di-rection unit, whereas by continuous NCFE, all the four cellsare assigned direction strengths proportional to the in-cellline segment length. Note that for NCFE, sometime smooth-ing the character image is necessary so that the chaincodesbetter account for stroke direction.

270 C.-L. Liu et al. / Pattern Recognition 37 (2004) 265–279
Fig. 6. NCFE on continuous feature plane.
Fig. 7. Sobel masks for gradient.
For gradient feature extraction, we use the Sobel operatorto compute the x=y components of gradient and the gradientimage is decomposed into four orientation planes or eightdirection planes. The Sobel operator has been used by otherresearchers [17,18], and some researchers have also used theRoberts operator [19] and Kirsh operator [28].
The Sobel operator has two masks to compute the gradientcomponents in two axes. The masks are shown in Fig. 7 andthe gradient g(x; y)=[gx; gy]T at location (x; y) is computedby
gx(x; y) = f(x+1; y−1)+2f(x+1; y)+f(x+1; y+1)
−f(x − 1; y − 1)− 2f(x − 1; y)
−f(x − 1; y + 1);
gy(x; y) = f(x−1; y+1)+2f(x; y+1)+f(x+1; y+1)
−f(x − 1; y − 1)− 2f(x; y − 1)
−f(x + 1; y − 1):
The gradient strength and direction can be computed fromthe vector [gx; gy]T. For character feature extraction, thegradient of every pixel on the normalized image is com-puted. The range of gradient direction is partitioned into anumber (say, eight or sixteen) of regions and each regioncorresponds to a direction plane. Each pixel is assigned toa direction region and the gradient strength contributes tothe intensity of the corresponding plane. This strategy hasbeen adopted in previous works [17,19]. In our experiments,however, we adopt another strategy, which decomposes eachgradient vector into components in standard directions. Thisstrategy was previously used in feature extraction of on-line
Fig. 8. Decomposition of gradient direction.
character recognition [29]. We decompose the gradient vec-tors into eight chaincode directions. If a gradient directionlies between two standard direction, it is decomposed intotwo components in the two standard directions, as shown inFig. 8.
The gradient feature can be extracted from either bi-nary or gray-scale normalized image. From a binary char-acter image, the gray-scale normalized image is generatedby forward binary-to-gray pixel mapping as illustrated inSection 2. We also call the gray-scale image generated thisway as pseudo-gray image [2]. The gradient feature frompseudo-gray image is an improved version of the gradientfeature from binary image.
To enhance the discriminating power of direction feature,we have used structural and pro:le shape features as com-plementary features. The structural feature is represented asthe horizontal crossing counts while the pro:le shape featureis represented as the distances between the outmost edgeand the convex hull [20]. The sequences of crossing countsand pro:le distances are also blurred by 1D Gaussian masksto give feature measurements. The length of sequences is35 since the normalized plane is set to 35 × 35 pixels. Weextract 11 blurred horizontal crossing counts and 22 (left andright) pro:le shape measurements. These measurements areadded to the blurred chaincode feature to form an enhancedfeature vector.
The NCFE feature can also be enhanced with comple-mentary features. In the manner of NCFE, we calculate thecrossing counts and pro:le shape distances from the originalimage and map them into the standard plane. They are thenblurred to give 11 + 22 measurements to add to the NCFEdirection feature. The enhanced NCFE feature as well as thecontinuous NCFE feature can be viewed as improvementsto the existing NCFE method.
In our experiments, we test eight direction featuresor enhanced feature vectors. Each feature vector has a4-orientation version and an 8-direction version. The featurevectors are listed in the following.
• Feature vector blr: blurred chaincode feature, 100D for4-orientation and 200D for 8-direction. On each featureplane, 5×5 Gaussian masks are uniformly placed to com-pute 25 measurements.

C.-L. Liu et al. / Pattern Recognition 37 (2004) 265–279 271
• Feature vector des: deslant chaincode feature, 100D for4-orientation and 200D for 8-direction. The original im-age is deslanted and then normalized to extract chaincodefeature.
• Feature vector mul: enhanced chaincode feature withcomplementary features, 133D for 4-orientation and233D for 8-direction.
• Feature vector ncf: discrete NCFE direction feature, 100Dfor 4-orientation and 200D for 8-direction.
• Feature vector ncf-p: discrete NCFE direction feature pluscomplementary features. 133D for 4-orientation and 233Dfor 8-direction.
• Feature vector ncf-c: continuous NCFE direction feature,100D for 4-orientation and 200D for 8-direction.
• Feature vector grd: gradient feature from binary images,100D for 4-orientation and 200D for 8-direction.
• Feature vector grd-g: gradient feature from pseudogray-scale images, 100D for 4-orientation and 200D for8-direction.
To modify the feature distribution for improving the clas-si:cation performance, all the measurements in the featurevectors are transformed by variable transformation y = xp
[30]. This transformation is also well known as Box-Coxtransformation [31]. For ease of calculation, the power pa-rameter is not optimized in our experiments but set top=0:5.
4. Experimental results
4.1. Results on CENPARMI database
The handwritten digit database of CENPARMI (Concor-dia University, Canada) contains 6000 digit images (600images from each of 10 classes) collected from live mails ofUSPS, scanned at 166DPI. In the database, 4000 images arespeci:ed for training and the remaining 2000 images are fortesting. Some images of the test dataset are shown in Fig. 9.
We use two classi:ers in the recognition of CEPARMIdatabase: the polynomial classi:er (PC) and the supportvector classi:er with radial basis function kernel (SVC-rbf).In our previous experiments, the SVC-rbf were shown toperform best while the PC is the best among non-SV classi-:ers [2]. The SVC-rbf is far more expensive than the PC intraining and classi:cation, but since the CENPARMI datasetis small, the computation for testing various normalizationfunctions and features is allowable. More details of the clas-si:ers can be found in Ref. [2]. The PC uses 60 principalcomponents of the pattern space and their binomial expan-sions as the inputs of learnable layer. In the implementationof SVC-rbf, the variance parameter of the kernel is propor-tional to the estimated sample variance and the upper boundof coeNcient is set to 10.
After training the classi:ers on the training dataset,each classi:er is used to classify the test dataset. Theclassi:cation error rates of 4-orientation features and
Fig. 9. Sample images of CENPARMI database.
8-direction features by two classi:ers are listed in Table 2.For the results of each classi:er, the lowest error rate ofeach feature vector among ten normalization functions ishighlighted. The average error rate of each feature vector iscalculated over the normalization functions while the aver-age error rate of each normalization function is calculatedover the feature vectors. The normalization functions andfeatures can be rank ordered according to the average er-ror rates. To better account for the con:dence of di>erenceof performance, we calculate a relative performance mea-sure (RPM). Among the normalization functions or featurevectors, set the RPM of the method with minimum averageerror rate to 100, the RPM of other methods is calculated by
RPM =100AERmin(AER)
; (2)
where AER denotes the average error rate. The RPM is in-sensitive to the abstract error rates and hence serves as agood measure of performance relative to the best method.It provides more information than the rank order in that thedi>erence of RPM between neighboring rank positions isvariable.
The reciprocal of RPM corresponds to the ratio of errorrate between the best method and an alternative method.When the ratio of error rate is greater than 0.9 (correspond-ingly, the RPM is less than 111.1), we consider that theperformance of the alternative method is competitive to thebest one. Otherwise, if the ratio is greater than 0.8 (the RPMis less than 125), we consider that the performance of thealternative method is good. The ratio between 0.7 and 0.8(RPM between 125 and 142.9) indicates that the alternativemethod is fair, and the ratio less than 0.7 (RPM greater than142.9) signi:es poor performance of the alternative method.
On the results of CENPARMI database, we compare theperformances of normalization functions and feature vec-tors in respect of the average error rates. Comparing the
272 C.-L. Liu et al. / Pattern Recognition 37 (2004) 265–279
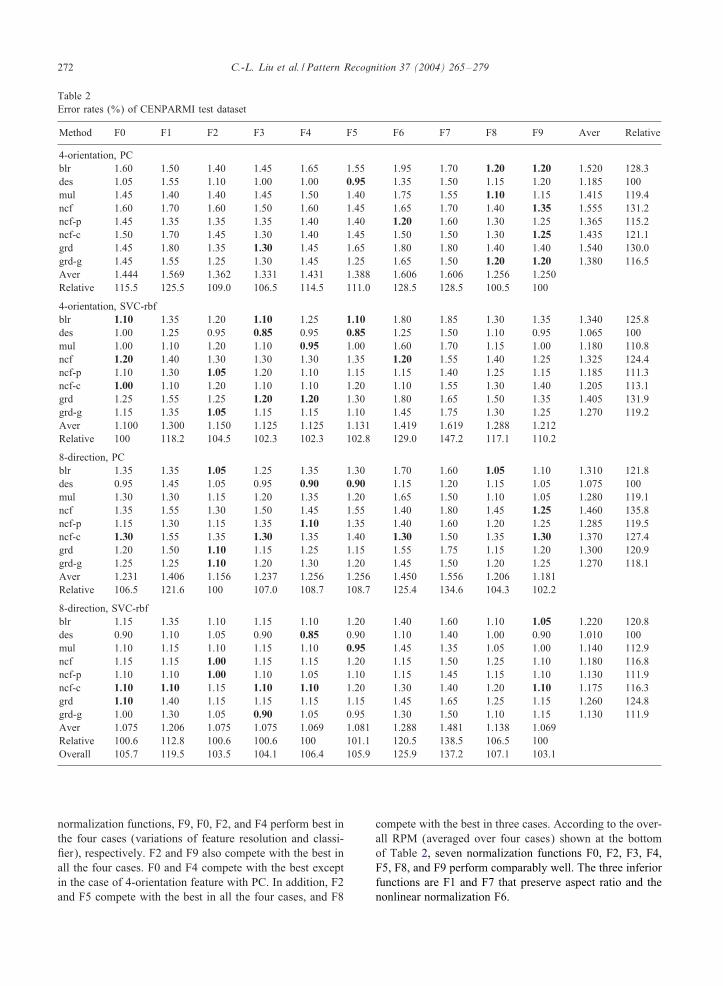
Table 2Error rates (%) of CENPARMI test dataset
Method F0 F1 F2 F3 F4 F5 F6 F7 F8 F9 Aver Relative
4-orientation, PCblr 1.60 1.50 1.40 1.45 1.65 1.55 1.95 1.70 1.20 1.20 1.520 128.3des 1.05 1.55 1.10 1.00 1.00 0.95 1.35 1.50 1.15 1.20 1.185 100mul 1.45 1.40 1.40 1.45 1.50 1.40 1.75 1.55 1.10 1.15 1.415 119.4ncf 1.60 1.70 1.60 1.50 1.60 1.45 1.65 1.70 1.40 1.35 1.555 131.2ncf-p 1.45 1.35 1.35 1.35 1.40 1.40 1.20 1.60 1.30 1.25 1.365 115.2ncf-c 1.50 1.70 1.45 1.30 1.40 1.45 1.50 1.50 1.30 1.25 1.435 121.1grd 1.45 1.80 1.35 1.30 1.45 1.65 1.80 1.80 1.40 1.40 1.540 130.0grd-g 1.45 1.55 1.25 1.30 1.45 1.25 1.65 1.50 1.20 1.20 1.380 116.5Aver 1.444 1.569 1.362 1.331 1.431 1.388 1.606 1.606 1.256 1.250Relative 115.5 125.5 109.0 106.5 114.5 111.0 128.5 128.5 100.5 100
4-orientation, SVC-rbfblr 1.10 1.35 1.20 1.10 1.25 1.10 1.80 1.85 1.30 1.35 1.340 125.8des 1.00 1.25 0.95 0.85 0.95 0.85 1.25 1.50 1.10 0.95 1.065 100mul 1.00 1.10 1.20 1.10 0.95 1.00 1.60 1.70 1.15 1.00 1.180 110.8ncf 1.20 1.40 1.30 1.30 1.30 1.35 1.20 1.55 1.40 1.25 1.325 124.4ncf-p 1.10 1.30 1.05 1.20 1.10 1.15 1.15 1.40 1.25 1.15 1.185 111.3ncf-c 1.00 1.10 1.20 1.10 1.10 1.20 1.10 1.55 1.30 1.40 1.205 113.1grd 1.25 1.55 1.25 1.20 1.20 1.30 1.80 1.65 1.50 1.35 1.405 131.9grd-g 1.15 1.35 1.05 1.15 1.15 1.10 1.45 1.75 1.30 1.25 1.270 119.2Aver 1.100 1.300 1.150 1.125 1.125 1.131 1.419 1.619 1.288 1.212Relative 100 118.2 104.5 102.3 102.3 102.8 129.0 147.2 117.1 110.2
8-direction, PCblr 1.35 1.35 1.05 1.25 1.35 1.30 1.70 1.60 1.05 1.10 1.310 121.8des 0.95 1.45 1.05 0.95 0.90 0.90 1.15 1.20 1.15 1.05 1.075 100mul 1.30 1.30 1.15 1.20 1.35 1.20 1.65 1.50 1.10 1.05 1.280 119.1ncf 1.35 1.55 1.30 1.50 1.45 1.55 1.40 1.80 1.45 1.25 1.460 135.8ncf-p 1.15 1.30 1.15 1.35 1.10 1.35 1.40 1.60 1.20 1.25 1.285 119.5ncf-c 1.30 1.55 1.35 1.30 1.35 1.40 1.30 1.50 1.35 1.30 1.370 127.4grd 1.20 1.50 1.10 1.15 1.25 1.15 1.55 1.75 1.15 1.20 1.300 120.9grd-g 1.25 1.25 1.10 1.20 1.30 1.20 1.45 1.50 1.20 1.25 1.270 118.1Aver 1.231 1.406 1.156 1.237 1.256 1.256 1.450 1.556 1.206 1.181Relative 106.5 121.6 100 107.0 108.7 108.7 125.4 134.6 104.3 102.2
8-direction, SVC-rbfblr 1.15 1.35 1.10 1.15 1.10 1.20 1.40 1.60 1.10 1.05 1.220 120.8des 0.90 1.10 1.05 0.90 0.85 0.90 1.10 1.40 1.00 0.90 1.010 100mul 1.10 1.15 1.10 1.15 1.10 0.95 1.45 1.35 1.05 1.00 1.140 112.9ncf 1.15 1.15 1.00 1.15 1.15 1.20 1.15 1.50 1.25 1.10 1.180 116.8ncf-p 1.10 1.10 1.00 1.10 1.05 1.10 1.15 1.45 1.15 1.10 1.130 111.9ncf-c 1.10 1.10 1.15 1.10 1.10 1.20 1.30 1.40 1.20 1.10 1.175 116.3grd 1.10 1.40 1.15 1.15 1.15 1.15 1.45 1.65 1.25 1.15 1.260 124.8grd-g 1.00 1.30 1.05 0.90 1.05 0.95 1.30 1.50 1.10 1.15 1.130 111.9Aver 1.075 1.206 1.075 1.075 1.069 1.081 1.288 1.481 1.138 1.069Relative 100.6 112.8 100.6 100.6 100 101.1 120.5 138.5 106.5 100Overall 105.7 119.5 103.5 104.1 106.4 105.9 125.9 137.2 107.1 103.1
normalization functions, F9, F0, F2, and F4 perform best inthe four cases (variations of feature resolution and classi-:er), respectively. F2 and F9 also compete with the best inall the four cases. F0 and F4 compete with the best exceptin the case of 4-orientation feature with PC. In addition, F2and F5 compete with the best in all the four cases, and F8
compete with the best in three cases. According to the over-all RPM (averaged over four cases) shown at the bottomof Table 2, seven normalization functions F0, F2, F3, F4,F5, F8, and F9 perform comparably well. The three inferiorfunctions are F1 and F7 that preserve aspect ratio and thenonlinear normalization F6.

C.-L. Liu et al. / Pattern Recognition 37 (2004) 265–279 273
Comparing the feature vectors, the deslant chaincode fea-ture (des) performs best in all the four cases. This is due tothe fact that the slant of the digit samples is signi:cant andslant normalization can largely reduce the within-class shapevariation. In respect of the RPM, no other features competewith the deslant feature except that the enhanced chaincodefeature (mul), the enhanced NCFE feature (ncf-p), the con-tinuous NCFE feature (ncf-c) and the gray-scale gradientfeature (grd-g) perform fairly well. It is evident that theenhanced chaincode feature (mul) outperforms the baselinechaincode feature (blr), the improved NCFE features (ncf-pand ncf-c) outperform the baseline NCFE feature (ncf), andthe gray-scale gradient feature outperforms the binary gra-dient feature (grd).
Comparing the 4-orientation features and 8-directionfeatures, it is clear that the performance of 8-directionfeatures is superior, at the cost of higher dimension-ality. It is also meaningful to compare the resultson CENPARMI dataset with those reported in theliterature. A number of high accuracies were col-lected in [2], wherein a record of high accuracy,98.90% was reported. In this study, by varying nor-malization and feature extraction, we achieve a newrecord of 99.15% on the test dataset of CEPARMIdatabase.
4.2. Results on NIST database
As introduced in Ref. [1], we have made an experimentdatabase from the CD of NIST Special Database 19 (SD19).The training dataset is composed of the digit samples of600 writers (no.0–399 and no.2100–2299), and the testdataset is composed of the digit samples of 400 writers (no.500–699 and no.2400–2599). The total numbers of sam-ples in the training dataset and test dataset are 66,274 and45,398, respectively. The images were scanned at 300DPI.Some samples of the test data are shown in Fig. 10.
The character images of NIST database have lot of con-tour noises, so smoothing is necessary for NCFE. Twoclassi:ers are used in the recognition of NIST database: PCand discriminative learning quadratic discriminant function(DLQDF). The DLQDF is isomorphic to the MQDF2 ofKimura et al. [15] but the parameters are adjusted withaim to minimize the classi:cation error [25]. The PCuses 70 principal components of the pattern space. TheDLQDF uses 40 principal eigenvectors for each class andin discriminative training, the parameters are regularizedby a penalty of quadratic distances of within-class sam-ples. The DLQDF was shown to perform comparably wellto PC.
On training the classi:ers, the error rates on the test datasetare listed in Table 3. The table has four blocks correspond-ing to the combination of two classi:ers and two resolutionsof direction feature. The average error rates of normaliza-tion functions and feature vectors are calculated and the rel-ative performance measures (RPMs) are given. Comparing
Fig. 10. Sample images of NIST database.
the normalization functions, we can see that the momentnormalization F9 performs best in all the four cases in re-spect of the RPM and the performance of F8 is competitive.For each feature vector, the highest classi:cation accuracyis given by either F8 or F9. Except F0 and F1, the other nor-malization functions perform fairly well in respect of eitherthe case-speci:c RPM or the overall RPM.
Comparing the feature vectors, the deslant chaincode fea-ture (des) and the gray-scale gradient feature (grd-g) per-form best in two of the four cases, respectively. They alsocompete with the best in all the four cases of four blocks.The superiority of gray-scale gradient feature is due to thereliable computation and decomposition of gradient whilethat of deslant feature is due to the correction of image slant.Among other feature vectors, the advantage of improvedNCFE features (ncf-p and ncf-c) over their baseline counter-part (ncf) is evident. The continuous NCFE feature (ncf-c)competes with the best in three of four cases in the sensethat the RPM is less than 111.1. In the case of 4-orientationfeature with DLQDF classi:cation, the enhanced chaincodefeature (mul) and the enhanced NCFE feature (ncf-p) alsocompete with the best.
To clarify the improvements of normalization functionsand features, let us take the chaincode feature (blr) withnormalization function F5 as a baseline. This baseline fea-ture vector was used in our previous evaluation of variousclassi:ers [1]. The accuracies of 4-orientation baseline fea-ture given by PC and DLQDF are 99.11% and 99.14%,respectively, and those of 8-direction baseline feature are99.27% and 99.28%, respectively. From Table 3, we cansee that by varying the normalization function only, theaccuracies of 4-orientation feature and 8-direction featureare promoted to 99.29% and 99.34%, respectively. On theother hand, the globally highest accuracies of 4-orientationfeature and 8-direction feature are 99.36% and 99.47%,respectively.

274 C.-L. Liu et al. / Pattern Recognition 37 (2004) 265–279
Table 3Error rates (%) of NIST test dataset
Method F0 F1 F2 F3 F4 F5 F6 F7 F8 F9 Aver Relative
4-orientation, PCblr 0.97 0.94 0.90 0.90 0.91 0.89 0.87 0.90 0.76 0.71 0.875 118.7des 0.77 0.86 0.70 0.69 0.74 0.73 0.74 0.82 0.64 0.68 0.737 100mul 0.91 0.87 0.82 0.83 0.89 0.82 0.79 0.83 0.74 0.71 0.821 111.4ncf 1.01 0.99 0.99 0.98 0.97 0.90 0.93 0.85 0.83 0.78 0.923 125.2ncf-p 0.91 0.89 0.88 0.89 0.87 0.87 0.84 0.81 0.75 0.70 0.841 114.1ncf-c 0.92 0.91 0.87 0.87 0.91 0.88 0.88 0.76 0.70 0.68 0.838 113.7grd 0.99 0.92 0.89 0.92 0.91 0.87 0.88 0.83 0.75 0.76 0.872 118.3grd-g 0.85 0.83 0.79 0.81 0.82 0.80 0.79 0.74 0.67 0.68 0.778 105.6Aver 0.916 0.901 0.855 0.861 0.878 0.845 0.840 0.818 0.730 0.712Relative 128.7 126.5 120.1 121 123.3 118.7 118.0 114.9 102.5 100
4-orientation, DLQDFblr 0.91 1.03 0.89 0.87 0.85 0.86 0.94 0.97 0.78 0.78 0.888 116.7des 0.81 0.99 0.76 0.71 0.72 0.74 0.76 1.00 0.68 0.68 0.785 103.1mul 0.86 0.92 0.85 0.84 0.80 0.80 0.85 0.91 0.75 0.73 0.831 109.2ncf 0.96 1.13 0.94 0.95 0.92 0.93 0.92 0.96 0.81 0.80 0.932 122.5ncf-p 0.85 0.97 0.84 0.87 0.85 0.85 0.82 0.84 0.73 0.74 0.836 109.9ncf-c 0.85 0.96 0.85 0.83 0.85 0.83 0.82 0.83 0.73 0.68 0.823 108.1grd 0.90 0.97 0.87 0.85 0.82 0.81 0.92 0.92 0.76 0.75 0.857 112.6grd-g 0.76 0.90 0.76 0.74 0.76 0.72 0.83 0.76 0.70 0.68 0.761 100Aver 0.862 0.984 0.845 0.833 0.821 0.818 0.858 0.899 0.743 0.730Relative 118.1 134.8 115.8 114.1 112.5 112.1 117.5 123.2 101.8 100
8-direction, PCblr 0.84 0.81 0.76 0.73 0.76 0.73 0.79 0.75 0.68 0.66 0.751 117.2des 0.67 0.74 0.61 0.60 0.63 0.61 0.61 0.71 0.59 0.64 0.641 100mul 0.83 0.76 0.78 0.73 0.72 0.70 0.78 0.72 0.66 0.66 0.734 114.5ncf 0.81 0.82 0.77 0.77 0.79 0.76 0.73 0.75 0.71 0.67 0.758 118.3ncf-p 0.74 0.77 0.75 0.74 0.74 0.71 0.72 0.69 0.66 0.62 0.714 111.4ncf-c 0.78 0.76 0.72 0.71 0.77 0.72 0.70 0.66 0.64 0.63 0.709 110.6grd 0.78 0.77 0.74 0.70 0.73 0.72 0.78 0.72 0.64 0.66 0.724 112.9grd-g 0.70 0.74 0.67 0.69 0.67 0.69 0.67 0.62 0.55 0.55 0.655 102.2Aver 0.769 0.771 0.725 0.709 0.726 0.705 0.723 0.702 0.641 0.636Relative 120.9 121.2 114.0 111.5 114.2 110.8 113.7 110.4 100.8 100
8-direction, DLQDFblr 0.79 0.92 0.76 0.69 0.71 0.72 0.78 0.89 0.67 0.68 0.761 119.7des 0.66 0.89 0.64 0.60 0.62 0.63 0.65 0.87 0.63 0.61 0.680 106.9mul 0.78 0.85 0.72 0.69 0.75 0.71 0.74 0.82 0.65 0.68 0.739 116.2ncf 0.74 0.92 0.76 0.72 0.72 0.73 0.77 0.79 0.69 0.65 0.749 117.8ncf-p 0.72 0.87 0.74 0.70 0.73 0.67 0.70 0.74 0.66 0.64 0.717 112.7ncf-c 0.70 0.79 0.70 0.67 0.71 0.68 0.69 0.72 0.66 0.64 0.696 109.4grd 0.75 0.87 0.74 0.68 0.69 0.70 0.77 0.81 0.64 0.62 0.727 114.3grd-g 0.69 0.74 0.64 0.62 0.65 0.64 0.69 0.62 0.53 0.54 0.636 100Aver 0.729 0.856 0.713 0.671 0.698 0.685 0.724 0.783 0.641 0.633Relative 115.2 135.2 112.6 106.0 110.3 108.2 114.4 123.7 101.3 100Overall 120.7 129.4 115.6 113.1 115.1 112.5 115.9 118.1 101.6 100
4.3. Results on Hitachi database
To test the recognition performance on Japanese writingstyles, we use a database collected by Hitachi, Ltd. Thesamples were collected from sampling sheets and real form(insurance application, bank transaction, etc.) images and
were scanned at 200DPI. The training dataset contains 164,158 samples, which we use to train a PC with 80 principalcomponents. From the test dataset, somemis-tagged sampleswere removed and some ambiguous samples are singled outfor separate testing. The rest clean samples form a datasetTest-1, while the ambiguous samples form another dataset

C.-L. Liu et al. / Pattern Recognition 37 (2004) 265–279 275
Fig. 11. Sample images of Hitachi dataset Test-2.
Test-2. The numbers of samples of Test-1 and Test-2 are163,223 and 2,801, respectively. Some samples of Test-2are shown in Fig. 11.For NCFE on Hitachi database, smoothing was not per-
formed. Since most character images have thin strokes,smoothing may damage the character structure. The er-ror rates of 4-orientation features and 8-direction featureson two test datasets are listed in Table 4. In the resultsof dataset Test-1, the globally lowest error rate is high-lighted, whereas for Test-2, the lowest error rate of eachfeature vector is highlighted. As for CENPARMI and NISTdatabases, the average error rates of normalization functionsand feature vectors are calculate and the RPMs are given.
On either Test-1 or Test-2, the comparison of normal-ization functions manifests the superiority of momentnormalization functions F8 and F9. On Test-1, the linearnormalization functions F2, F3, and F5 also give competi-tive performance to the best. In comparing the feature vec-tors, it is shown that the gray-scale gradient feature (grd-g)performs best in three of four cases and competes with thebest in another case. The improved NCFE features ncf-pand ncf-c compete with the best in three of four cases. Itis noteworthy that on Hitachi database, the performance ofdeslant chaincode feature (des) is inferior while for CEN-PARMI and NIST databases, its performance is the best.This is because in Japanese writing style, the slant of digitimages is not considerable. In this case, the deformationby slant normalization enlarges the within-class shape vari-ation since the slant is estimated individually rather thanfrom :eld context.
A noteworthy observation is that on Test-2 of Hi-tachi database, the accuracies of 4-orientation fea-tures and 8-direction features are comparable, while forother datasets, the accuracies of 8-direction features are
signi:cantly higher. Overall, 8-direction features outper-form 4-orientation features in most cases and the perfor-mance is comparable in rare case.
To get an overview of performance, the overall RPMsof normalization functions and feature vectors on threedatabases are shown in Tables 5 and 6, respectively. We cansee that the comparison of methods shows di>erent tenden-cies for di>erent styles of data. Regarding the normalizationfunctions, the moment normalization functions F8 and F9perform best for all the three databases, while for CEN-PARMI data, the linear normalization functions F0, F2, F3,F4, and F5 also compete with the best. F2, F3, F4, and F5also perform fairly well for NIST and Hitachi databases.The aspect ratio preserving normalization functions F1 andF7 give inferior performance for all the three databases.
Comparing the feature vectors, the deslant chaincode fea-ture (des) perform best for CENPARMI and NIST databaseswhile the gray-scale gradient feature (grd-g) perform bestfor NIST and Hitachi databases. grd-g performs fairly wellon CEPARMI data while the performance of des on Hitachidata is poor. The improved NCFE features ncf-p and ncf-ccompete with the best on Hitachi data and perform fairlywell on CENPARMI and NIST data. Considering that slantnormalization is a general strategy for shape recovery andis applicable to NCFE and gradient feature as well, we canconclude that the gray-scale gradient feature is the best forall the three databases. The slant normalization is optionalto use, and the slant is estimated either from individual char-acter or from :eld context.
4.4. Speed of feature extraction
The computation time of feature extraction is a concern inpractical recognition systems. Particularly, in integrated seg-mentation and recognition of character strings, not only thecorrectly segmented character patterns are recognized, butalso many noncharacter patterns generated in trial segmen-tation are processed through the recognizer. For real-timeapplication, the computation time of both feature extractionand classi:cation should be considered.
We measured the CPU time of feature extraction (includ-ing normalization) on the NIST test dataset. The experi-ments were implemented on personal computer with CPUPentium-4-1:7 GHz. The average CPU times of eight featurevectors combined with ten normalization functions are plot-ted in Fig. 12. The two :gures show similar tendency exceptthat 8-direction features cost more time than 4-orientationfeatures because for 8-direction feature extraction, blurringis performed eight times other than four times.
To extract the same feature vector, the CPU time variesaccording to the normalization function. This is becausethe actual size (occupied area in the standard plane) ofnormalized image depends on normalization. For example,F0 :lls both the two dimensions of standard plane whilemoment normalization rarely :lls a dimension. The compu-tation time of blurring depends on the number of nonzero

276 C.-L. Liu et al. / Pattern Recognition 37 (2004) 265–279
Table 4Error rates (%) of Hitachi datasets (classi:er: PC)
Method F0 F1 F2 F3 F4 F5 F6 F7 F8 F9 Aver Relative
Test1, 4-orientationblr 0.16 0.19 0.13 0.13 0.15 0.13 0.18 0.18 0.12 0.13 0.150 119.0des 0.18 0.22 0.17 0.16 0.18 0.17 0.19 0.21 0.15 0.16 0.179 142.1mul 0.14 0.18 0.13 0.13 0.14 0.13 0.16 0.16 0.12 0.12 0.141 112.0ncf 0.14 0.16 0.13 0.13 0.15 0.14 0.17 0.14 0.14 0.13 0.143 113.6ncf-p 0.13 0.15 0.13 0.12 0.13 0.13 0.14 0.13 0.13 0.12 0.131 104.0ncf-c 0.13 0.14 0.12 0.12 0.13 0.12 0.15 0.14 0.12 0.12 0.129 102.4grd 0.16 0.18 0.13 0.14 0.15 0.13 0.18 0.17 0.13 0.13 0.150 119.0grd-g 0.13 0.15 0.12 0.11 0.12 0.12 0.16 0.14 0.10 0.11 0.126 100Aver 0.146 0.171 0.133 0.130 0.144 0.134 0.166 0.159 0.126 0.128Relative 115.9 135.7 105.6 103.2 114.3 106.3 131.7 126.2 100 101.6
Test1, 8-directionblr 0.12 0.15 0.11 0.10 0.11 0.10 0.14 0.15 0.10 0.11 0.119 132.2des 0.15 0.18 0.14 0.13 0.14 0.13 0.15 0.17 0.13 0.14 0.146 162.2mul 0.11 0.14 0.11 0.10 0.10 0.09 0.14 0.14 0.10 0.10 0.113 125.6ncf 0.12 0.13 0.11 0.11 0.12 0.11 0.12 0.12 0.10 0.10 0.114 126.7ncf-p 0.11 0.13 0.10 0.10 0.10 0.10 0.12 0.12 0.09 0.09 0.106 117.8ncf-c 0.10 0.12 0.10 0.10 0.10 0.10 0.11 0.11 0.09 0.09 0.102 113.3grd 0.11 0.13 0.10 0.09 0.10 0.10 0.13 0.15 0.10 0.10 0.111 123.3grd-g 0.09 0.11 0.09 0.08 0.08 0.08 0.11 0.10 0.08 0.08 0.090 100Aver 0.114 0.136 0.107 0.101 0.106 0.101 0.128 0.133 0.099 0.101Relative 115.2 137.4 108.1 102.0 107.1 102.0 129.3 134.3 100 102.0
Test2, 4-orientationblr 26.17 27.20 25.53 25.28 25.28 25.28 24.13 24.13 22.38 22.13 24.751 107.0des 25.74 28.63 26.13 25.81 26.67 26.31 25.60 26.81 23.13 23.06 25.789 111.5mul 24.78 26.31 25.06 24.85 24.35 24.74 23.35 23.53 22.17 21.64 24.078 104.1ncf 24.63 25.21 24.88 24.42 24.35 25.03 22.67 23.35 21.10 20.96 23.660 102.3ncf-p 24.38 24.31 23.78 23.99 24.24 24.67 21.96 22.78 20.92 20.39 23.142 100.0ncf-c 23.92 24.81 24.46 23.53 23.92 23.92 22.56 22.56 21.03 20.71 23.147 100.0grd 25.38 26.70 24.96 24.81 25.10 24.92 24.13 24.38 21.60 21.03 24.301 105.0grd-g 25.24 25.74 23.71 23.60 24.21 23.46 22.85 22.35 19.99 20.24 23.139 100Aver 25.030 26.114 24.814 24.536 24.636 24.791 23.406 23.736 21.540 21.270Relative 117.7 122.8 116.7 115.4 115.8 116.6 110.0 111.6 101.3 100
Test2, 8-directionblr 27.13 26.78 25.63 24.88 25.96 25.35 23.56 23.10 22.38 21.96 24.673 106.6des 26.31 27.70 25.71 26.70 26.88 25.78 24.92 24.88 23.24 23.35 25.547 110.3mul 25.85 25.60 24.85 24.60 24.67 24.78 22.85 22.78 21.78 21.53 23.929 103.3ncf 24.92 25.28 24.71 24.49 25.31 24.63 22.13 23.21 20.89 20.60 23.617 102.0ncf-p 24.88 24.63 24.21 24.42 24.53 24.17 21.78 22.81 20.14 19.99 23.156 100ncf-c 24.63 24.85 23.99 23.88 24.46 24.31 21.67 22.31 20.89 20.64 23.163 100.0grd 26.10 25.85 25.03 24.56 25.28 24.81 22.85 22.88 21.71 21.60 24.067 103.9grd-g 25.53 25.63 24.06 23.85 24.92 24.42 22.63 21.71 19.96 20.17 23.288 100.6Aver 25.669 25.790 24.774 24.672 25.251 24.781 22.799 22.960 21.374 21.230Relative 120.9 121.5 116.7 116.2 118.9 116.7 107.4 108.1 100.7 100Overall 117.6 128.9 111.2 109.5 115.8 111.5 120.2 118.0 100.5 100.8
Table 5Overall relative performance measures of normalization functions
F0 F1 F2 F3 F4 F5 F6 F7 F8 F9
CENPAR 105.7 119.5 103.5 104.1 106.4 105.9 125.9 137.2 107.1 103.1NIST 120.7 129.4 115.6 113.1 115.1 112.5 115.9 118.1 101.6 100Hitachi 117.6 128.9 111.2 109.5 115.8 111.5 120.2 118.0 100.5 100.8

C.-L. Liu et al. / Pattern Recognition 37 (2004) 265–279 277
elements on the feature plane. Generally, the feature planesof larger image have more nonzero elements. In nonlin-ear normalization (F6), the computation of line density his-tograms costs some time.
In comparing the CPU times of feature vectors, we cansee that the gradient feature is the most time-consumingwhile the NCFE feature is the most time eNcient. In NCFE,the time of generating normalized image is saved. The CPUtime of gradient feature is mainly consumed in gradient com-putation and decomposition. It is reasonable that extractinggradient feature from gray-scale image is more expensivethan from binary image due to the generation of pseudo-graynormalized image. Similarly, the enhanced NCFE feature(ncf-p) and the continuous NCFE feature (ncf-c) are morecomputationally expensive than the discrete NCFE feature.The CPU time of chaincode feature (blr) is intermediate,
Table 6Overall relative performance measures of feature vectors
CENPAR NIST Hitachi
blr 124.2 118.1 116.2des 100 102.5 131.5mul 115.6 112.8 111.3ncf 127.1 121.0 111.1ncf-p 114.5 112.0 105.5ncf-c 119.5 110.5 103.9grd 126.9 114.5 112.8grd-g 116.4 102.0 100.2
Fig. 12. CPU time (ms) of feature extraction on NIST test dataset.
and the enhanced feature (mul) and deslant feature (des) aremore expensive than it.
5. Conclusion
We compared the performances of ten normalizationfunctions and eight feature vectors in handwritten digitrecognition on large databases of distinct sources. Thenormalization functions implement dimension-based lin-ear/nonlinear normalization and moment-based normaliza-tion with varying aspect ratio mapping. The recognitionresults show that the moment normalization function F8and F9 mostly yield highest classi:cation accuracies. Theaspect ratio mapping is in<uential to the recognition per-formance for both dimension-based and moment-basednormalization. Either preserving the aspect ratio or forcingthe aspect ratio to one is not a good choice. Comparing thefeature vectors, the deslant chaincode feature performs bestfor CENPARMI and NIST data while the gradient featurefrom (pseudo) gray-scale normalized image performs bestfor NIST and Hitachi data. The improved NCFE features(enhanced NCFE and continuous NCFE) mostly performwell. The NCFE is very time eNcient, while the superiorperformance of gradient feature is traded o> by the inten-sive computation. However, the gradient feature is directlyapplicable to gray-scale images whereas other features arerestricted to binary images. The reported results provideuseful insights for selecting right implementation optionsin developing recognition systems.

278 C.-L. Liu et al. / Pattern Recognition 37 (2004) 265–279
References
[1] C.-L. Liu, H. Sako, H. Fujisawa, Performance evaluation ofpattern classi:ers for handwritten character recognition, Int.J. Document Anal. Recognition 4 (3) (2002) 191–204.
[2] C.-L. Liu, K. Nakashima, H. Sako, H. Fujisawa, Handwrittendigit recognition: benchmarking of state-of-the-art techniques,Pattern Recognition, 36 (10) (2003) 2271–2285.
[3] C.-L. Liu, M. Koga, H. Sako, H. Fujisawa, Aspect ratioadaptive normalization for handwritten character recognition,in: T. Tan, Y. Shi, W. Gao (Eds.), Advances in MultimodalInterfaces—ICMI 2000, Lecture Notes in Computer Science,Vol. 1948, Springer, Berlin, 2000, pp. 418–425.
[4] M. Hamanaka, K. Yamada, J. Tsukumo, Normalization-cooperated feature extraction method for handprinted Kanjicharacter recognition, Proceedings of the Third InternationalWorkshop on Frontiers of Handwriting Recognition, Bu>alo,NY, 1993, pp. 343–348.
[5] A. Gudessen, Quantitative analysis of preprocessingtechniques for the recognition of handprinted characters,Pattern Recognition 8 (1976) 219–227.
[6] G. Srikantan, D.-S. Lee, J.T. Favata, Comparison ofnormalization methods for character recognition, Proceedingsof the Third International Conference Document Analysis andRecognition, Montreal, Canada, 1995, pp. 719–722.
[7] J.J. de Oliveira Jr., L.R. Veloso, J.M. de Carvalho,Interpolation/decimation scheme applied to size normalizationof characters images, Proceedings of the 15th InternationalConference Pattern Recognition, Barcelona, Spain, Vol. 2,2000, pp. 577–580.
[8] G. Nagy, N. Tuong, Normalization techniques for handprintednumerals, Commun. ACM 13 (8) (1970) 475–481.
[9] R.G. Casey, Moment normalization of handprinted character,IBM J. Res. Dev. 14 (1970) 548–557.
[10] J. Tsukumo, H. Tanaka, Classi:cation of handprinted Chinesecharacters using nonlinear normalization and correlationmethods, Proceedings of the Ninth International Conferenceon Pattern Recognition, Rome, Italy, 1988, pp. 168–171.
[11] H. Yamada, K. Yamamoto, T. Saito, A nonlinearnormalization method for handprinted Kanji characterrecognition—line density equalization, Pattern Recognition 23(9) (1990) 1023–1029.
[12] A. de S. Britto Jr., et al., Improvement in handwritten numeralstring recognition by slant normalization and contextualinformation, Proceedings of the Seventh InternationalWorkshop on Frontiers of Handwriting Recognition,Amsterdam, The Netherlands, 2000, pp. 323–332.
[13] O.D. Trier, A.K. Jain, T. Taxt, Feature extraction methods forcharacter recognition—a survey, Pattern Recognition 29 (4)(1996) 641–662.
[14] M. Yasuda, H. Fujisawa, An improvement of correlationmethod for character recognition, Trans. IEICE Japan J62-D(3) (1979) 217–224.
[15] F. Kimura, K. Takashina, S. Tsuruoka, Y. Miyake, Modi:edquadratic discriminant functions and the application toChinese character recognition, IEEE Trans. Pattern Anal.Mach. Intell. 9 (1) (1987) 149–153.
[16] S. Tsuruoka, et al., Handwritten Kanji and hiragana characterrecognition using weighted direction index histogram method,Trans. IEICE Japan J70-D (7) (1987) 1390–1397.
[17] J.T. Favata, G. Srikantan, S.N. Srihari, Handprintedcharacter/digit recognition using a multiple feature/resolutionphilosophy, Proceedings of the Fourth International Workshopon Frontiers of Handwriting Recognition, Taipei, 1994, pp.57–66.
[18] G. Srikantan, S.W. Lam, S.N. Srihari, Gradient-based contourencoder for character recognition, Pattern Recognition 29 (7)(1996) 1147–1160.
[19] M. Shi, Y. Fujisawa, T. Wakabayashi, F. Kimura, Handwrittennumeral recognition using gradient and curvature of gray scaleimage, Pattern Recognition 35 (10) (2002) 2051–2059.
[20] C.-L. Liu, Y-J. Liu, R-W. Dai, Preprocessing andstatistical/structural feature extraction for handwritten numeralrecognition, in: A.C. Downton, S. Impedovo (Eds.), Progressof Handwriting Recognition, World Scienti:c, Singapore,1997, pp. 161–168.
[21] V. Vapnik, The Nature of Statistical Learning Theory,Springer, New Work, 1995.
[22] C.J.C. Burges, A tutorial on support vector machines forpattern recognition, Knowledge Discovery Data Mining 2 (2)(1998) 1–43.
[23] J. SchRurmann, Pattern Classi:cation: A Uni:ed View ofStatistical and Neural Approaches, Wiley Interscience, NewYork, 1996.
[24] U. KreSel, J. SchRurmann, Pattern classi:cation techniquesbased on function approximation, in: H. Bunke, P.S.P. Wang(Eds.), Handbook of Character Recognition and DocumentImageAnalysis,World Scienti:c, Singapore, 1997, pp. 49–78.
[25] C.-L. Liu, H. Sako, H. Fujisawa, Learning quadraticdiscriminant function for handwritten character recognition,Proceedings of the 16th International Conference PatternRecognition, Quebec, Canada, Vol.4, 2002, pp. 44–47.
[26] C.Y. Suen, et al., Computer recognition of unconstrainedhandwritten numerals, Proc. IEEE 80 (7) (1992)1162–1180.
[27] P.J. Grother, NIST special database 19: handprinted formsand characters database, Technical report and CDROM,1995.
[28] S.-W. Lee, Multilayer cluster neural network for totallyunconstrained handwritten numeral recognition, NeuralNetworks 8 (5) (1995) 783–792.
[29] A. Kawamura, et al., On-line recognition of freely handwrittenJapanese characters using directional feature densities,Proceedings of the 11th International Conference on PatternRecognition, The Hague, Vol. 2, 1992, pp. 183–186.
[30] T. Wakabayashi, S. Tsuruoka, F. Kimura, Y. Miyake,On the size and variable transformation of feature vectorfor handwritten character recognition, Trans. IEICE JapanJ76-D-II (12) (1993) 2495–2503.
[31] R.V.D. Heiden, F.C.A. Gren, The Box-Cox metric for nearestneighbor classi:cation improvement, Pattern Recognition 30(2) (1997) 273–279.
About the Author—CHENG-LIN LIU received the B.S. degree in electronic engineering from Wuhan University, the M.E. degree inelectronic engineering from Beijing Polytechnic University, the Ph.D. degree in pattern recognition and arti:cial intelligence from the Institute

C.-L. Liu et al. / Pattern Recognition 37 (2004) 265–279 279
of Automation, Chinese Academy of Sciences, in 1989, 1992 and 1995, respectively. He was a postdoctor fellow in Korea Advanced Instituteof Science and Technology (KAIST) and later in Tokyo University of Agriculture and Technology from March 1996 to March 1999. Sincethen, he has been a research sta> and later a senior researcher at the Central Research Laboratory, Hitachi, Ltd. His current work is mainlyin developing classi:cation algorithms for OCR applications. His research interests include pattern recognition, arti:cial intelligence, imageprocessing, neural networks, machine learning, and especially the applications to character recognition and document analysis.
About the Author—KAZUKI NAKASHIMA received the B.E. degree from Nagoya Institute of Technology, Japan, in 1989, and theM.E. degree in Information Engineering from Nagoya University, Japan, in 1991. Since 1991, he has been working for Central ResearchLaboratory, Hitachi, Ltd., Japan. He has been working in research and development on pattern recognition and image processing. He is amember of the Institute of Electronics, Information and Communication Engineers (IEICE) of Japan.
About the Author—HIROSHI SAKO received the B.E. and M.E. degrees in mechanical engineering from Waseda University, Tokyo,Japan, in 1975 and 1977, respectively. In 1992, he received the Dr. Eng. degree in computer science from the University of Tokyo. From1977 to 1991, he worked in the :eld of industrial machine vision at the Central Research Laboratory of Hitachi, Ltd., Tokyo, Japan (HCRL).From 1992 to 1995, he was a senior research scientist at Hitachi Dublin Laboratory, Ireland, where he did research in facial and hand gesturerecognition. Since 1996, he has been with the HCRL, where he directs a research group of image recognition and character recognition.Currently, he is a chief researcher there. As concurrent posts, he has been a visiting professor at Japan Advanced Institute of Science andTechnology, Hokuriku (Postgraduate University) since 1998, and a visiting lecturer at Hosei University since 2003, and from 1998 to 2003,he was a visiting lecturer at Nihon University. Dr. Sako was a recipient of the 1988 Best Paper Award from the Institute of Electronics,Information, and Communication Engineers (IEICE) of Japan , and one of the recipients of the Industrial Paper Awards from the 12th ICPR,Jerusalem, Israel, 1994. He is a senior member of the IEEE, and a member of IEICE, JSAI (the Japanese Society of Arti:cial Intelligence)and IPSJ (the Information Processing Society of Japan).
About the Author—HIROMICHI FUJISAWA received the B.E., M.E. and Doctor of Engineering degrees in Electrical Engineering fromWaseda University, Tokyo, in 1969, 1971, and 1975, respectively. He joined Central Research Laboratory, Hitachi, Ltd. in 1974. He hasengaged in research and development work on character recognition, document understanding including mailpiece address recognition andforms processing, and document retrieval. Currently, he is a Senior Chief Researcher at Central Research Laboratory. From 1980 through1981, he was a visiting scientist at Computer Science Department of Carnegie Mellon University, Pittsburgh. Besides working at Hitachi, hehas been a visiting lecturer at Waseda University (1985 to 1997) and at Kogakuin University, Tokyo (1998-present). He is an IAPR Fellow,IEEE Fellow, and a member of ACM, AAAI, Information Processing Society of Japan (IPSJ), and Institute for Electronics, Informationand Communication Engineers (IEICE), Japan.