Identification of IgE Binding to Api g 1-Derived Peptides
11
DOI: 10.1002/cbic.201000322 Identification of IgE Binding to Api g 1-Derived Peptides Elvira Ruppel , [b] Bernhard Ay ¨, [a] Prisca Boisguerin, [a] Sabine Dçlle, [b] Margitta Worm, [b] and Rudolf Volkmer* [a] Introduction Food allergies have emerged as an important public health problem. Approximately 3–4 % of the population, and up to 5 % of young children are affected by immunoglobulin E (IgE)- mediated food allergies. [1–4] Symptoms range from mild oral pruritus to possible life-threatening conditions. Pollen-related food allergies are the most frequent form of food allergies in adults and are mediated by allergen specific IgE (sIgE). Among these allergies, celery is a frequent elicitor. It has major clinical relevance due to its wide presence in many convenience foods and spices. The major allergen of celery is the protein Api g 1.0101 (Apium graveolens), which is a Betv1 (Betula verrucosa) homologue. It belongs to the family of pathogenesis-related plant proteins PR-10. [5–7] Various studies have described a prevalence of IgE binding to Api g 1.0101 in the range of 59 to 80%. [7–9] Sensitization to celery is frequently associated with, for example, birch and mugwort pollinosis. This association is due to cross-reactive IgE antibodies directed against homologous epitopes displayed on the surface of birch pollen and birch pollen-related food allergens, which are associated to the PR-10 protein family. [10–12] An allergy to celery could induce severe allergic reactions with cutaneous, gastro- intestinal, respiratory, and systemic symptoms. [13, 14] Food allergies are currently diagnosed by clinical history and in vivo or in vitro tests. [3] For the in vivo diagnosis, the patient is brought into direct contact with the allergenic substance by using different techniques (e.g., prick or challenge tests). Inves- tigations of the diagnostic value of the skin prick test (SPT), histamine release, and determination of allergen specific IgE (Pharmacia CAP system (CAP) immunoassay for IgE) show a discrepancy between sensitization and the probability of a clin- ical reaction in patients sensitized to different pollen. [15] There- fore, the double-blind, placebo-controlled food challenge (DBPCFC) remains the gold standard in the diagnosis of food allergies. [16–19] However, the procedure is time consuming, cost intensive, and is of high risk for the patient. One has to consid- er that although allergen-specific IgE is necessary for allergic reactions, additional variables determine clinical reactivity and sensitivity, such as the relationship between the specific IgE and the total IgE (sIgE/tIgE). A positive relationship between the quantity of IgE and the likelihood of clinical allergy has been demonstrated. [20] Unfortunately, the relationship between current IgE testing and the patients’ clinical sensitivity—de- fined as one or a combination of reaction severity and the dose of allergen required to provoke a reaction—is weak. Additionally, it has to be considered that in contrast to other antibody isotypes (IgM, IgA, and IgG), IgE does not circulate freely in the blood serum, but is receptor bound on effector cells, such as mast cells and basophils. Concentrations of IgE [a] Dr. B. Ay ¨, + Dr. P. Boisguerin, Dr. R. Volkmer Institut fɒr Medizinische Immunologie, AG Molekulare Bibliotheken CharitȖ-UniversitȨtsmedizin Berlin Hessische Strasse 3–4, 10115 Berlin (Germany) Fax: (+ 49) 30-4505-24942 E-mail : [email protected] [b] E. Ruppel , + S. Dçlle, Prof. Dr. M. Worm Allergie-Centrum-CharitȖ, Klinik fɒr Dermatologie und Allergologie CharitȖ-UniversitȨtsmedizin Berlin CharitȖplatz 1, 10117 Berlin (Germany) [ + ] These authors contributed equally to this work. Supporting information for this article is available on the WWW under http ://dx.doi.org/10.1002/cbic.201000322. Celery is a frequent cause of food allergy in pollen-sensitized patients and can induce severe allergic reactions. Clinical symptoms cannot be predicted by skin prick tests (SPTs) or by determining allergen-specific immunoglobulin E (IgE). Our aim was to identify specific IgE binding peptides by using an array technique. For our study, the sera of 21 patients with positive double-blind, placebo-controlled food challenge (DBPCFC) to celery, as well as the sera of 17 healthy patients were used. Ad- ditionally, all patients underwent skin tests along with determi- nations of specific IgE binding. The major allergen of celery Api g 1.0101 (Apium graveolens) was synthesized as an array of overlapping peptides and probed with the patients’ sera. We developed an improved immunoassay protocol by investigat- ing peptide lengths, peptide densities, incubation parameters, and readout systems, which could influence IgE binding. Sera of celery-allergic patients showed binding to three distinct re- gions of Api g 1.0101. The region including amino acids 100 to 126 of Api g 1.0101 is the most important region for IgE bind- ing. This region caused a fivefold higher binding of IgE from the sera of celery-allergic patients compared to those of healthy individuals. In particular, one peptide (VLVPTADGGSIC) was recognized by all sera of celery-allergic patients. In con- trast, no binding to this peptide was detected in sera of the healthy controls. Our improved assay strategy allows us to dis- tinguish between celery-allergic and healthy individuals, but needs to be explored in a larger cohort of well-defined patients. ChemBioChem 2010, 11, 2283 – 2293 # 2010 Wiley-VCH Verlag GmbH & Co. KGaA, Weinheim 2283
-
Upload
charite-de -
Category
Documents
-
view
0 -
download
0
Transcript of Identification of IgE Binding to Api g 1-Derived Peptides

DOI: 10.1002/cbic.201000322
Identification of IgE Binding to Api g 1-Derived PeptidesElvira Ruppel ,[b] Bernhard Ay,[a] Prisca Boisguerin,[a] Sabine Dçlle,[b] Margitta Worm,[b] andRudolf Volkmer*[a]
Introduction
Food allergies have emerged as an important public healthproblem. Approximately 3–4 % of the population, and up to5 % of young children are affected by immunoglobulin E (IgE)-mediated food allergies.[1–4] Symptoms range from mild oralpruritus to possible life-threatening conditions.
Pollen-related food allergies are the most frequent form offood allergies in adults and are mediated by allergen specificIgE (sIgE). Among these allergies, celery is a frequent elicitor. Ithas major clinical relevance due to its wide presence in manyconvenience foods and spices. The major allergen of celery isthe protein Api g 1.0101 (Apium graveolens), which is a Bet v 1(Betula verrucosa) homologue. It belongs to the family ofpathogenesis-related plant proteins PR-10.[5–7] Various studieshave described a prevalence of IgE binding to Api g 1.0101 inthe range of 59 to 80 %.[7–9] Sensitization to celery is frequentlyassociated with, for example, birch and mugwort pollinosis.This association is due to cross-reactive IgE antibodies directedagainst homologous epitopes displayed on the surface ofbirch pollen and birch pollen-related food allergens, which areassociated to the PR-10 protein family.[10–12] An allergy to celerycould induce severe allergic reactions with cutaneous, gastro-intestinal, respiratory, and systemic symptoms.[13, 14]
Food allergies are currently diagnosed by clinical history andin vivo or in vitro tests.[3] For the in vivo diagnosis, the patientis brought into direct contact with the allergenic substance byusing different techniques (e.g. , prick or challenge tests). Inves-tigations of the diagnostic value of the skin prick test (SPT),histamine release, and determination of allergen specific IgE(Pharmacia CAP system (CAP) immunoassay for IgE) show adiscrepancy between sensitization and the probability of a clin-
ical reaction in patients sensitized to different pollen.[15] There-fore, the double-blind, placebo-controlled food challenge(DBPCFC) remains the gold standard in the diagnosis of foodallergies.[16–19] However, the procedure is time consuming, costintensive, and is of high risk for the patient. One has to consid-er that although allergen-specific IgE is necessary for allergicreactions, additional variables determine clinical reactivity andsensitivity, such as the relationship between the specific IgEand the total IgE (sIgE/tIgE). A positive relationship betweenthe quantity of IgE and the likelihood of clinical allergy hasbeen demonstrated.[20] Unfortunately, the relationship betweencurrent IgE testing and the patients’ clinical sensitivity—de-fined as one or a combination of reaction severity and thedose of allergen required to provoke a reaction—is weak.
Additionally, it has to be considered that in contrast to otherantibody isotypes (IgM, IgA, and IgG), IgE does not circulatefreely in the blood serum, but is receptor bound on effectorcells, such as mast cells and basophils. Concentrations of IgE
[a] Dr. B. Ay,+ Dr. P. Boisguerin, Dr. R. VolkmerInstitut f�r Medizinische Immunologie, AG Molekulare BibliothekenCharit�-Universit�tsmedizin BerlinHessische Strasse 3–4, 10115 Berlin (Germany)Fax: (+ 49) 30-4505-24942E-mail : [email protected]
[b] E. Ruppel ,+ S. Dçlle, Prof. Dr. M. WormAllergie-Centrum-Charit�, Klinik f�r Dermatologie und AllergologieCharit�-Universit�tsmedizin BerlinCharit�platz 1, 10117 Berlin (Germany)
[+] These authors contributed equally to this work.
Supporting information for this article is available on the WWW underhttp ://dx.doi.org/10.1002/cbic.201000322.
Celery is a frequent cause of food allergy in pollen-sensitizedpatients and can induce severe allergic reactions. Clinicalsymptoms cannot be predicted by skin prick tests (SPTs) or bydetermining allergen-specific immunoglobulin E (IgE). Our aimwas to identify specific IgE binding peptides by using an arraytechnique. For our study, the sera of 21 patients with positivedouble-blind, placebo-controlled food challenge (DBPCFC) tocelery, as well as the sera of 17 healthy patients were used. Ad-ditionally, all patients underwent skin tests along with determi-nations of specific IgE binding. The major allergen of celeryApi g 1.0101 (Apium graveolens) was synthesized as an array ofoverlapping peptides and probed with the patients’ sera. Wedeveloped an improved immunoassay protocol by investigat-ing peptide lengths, peptide densities, incubation parameters,
and readout systems, which could influence IgE binding. Seraof celery-allergic patients showed binding to three distinct re-gions of Api g 1.0101. The region including amino acids 100 to126 of Api g 1.0101 is the most important region for IgE bind-ing. This region caused a fivefold higher binding of IgE fromthe sera of celery-allergic patients compared to those ofhealthy individuals. In particular, one peptide (VLVPTADGGSIC)was recognized by all sera of celery-allergic patients. In con-trast, no binding to this peptide was detected in sera of thehealthy controls. Our improved assay strategy allows us to dis-tinguish between celery-allergic and healthy individuals, butneeds to be explored in a larger cohort of well-definedpatients.
ChemBioChem 2010, 11, 2283 – 2293 � 2010 Wiley-VCH Verlag GmbH & Co. KGaA, Weinheim 2283

circulating in the blood are very low (0.00005 mg mL�1) be-cause mast cells have a very high affinity for IgE (1010 mol L�1)through their e-heavy-chain Fc receptors (FceR).[21] Further-more, soluble IgE antibodies have a short half-life in serum(less than a day), but have a markedly prolonged half-life (upto 14 days) when bound to Fc receptors. IgE binding to mastcells “sensitizes” the mast cells to degranulate when multiva-lent antigens cross-link FceR-bound IgE, and leads to immedi-ate release of inflammatory mediators, for example, histamine,arachidonic acid, and its metabolites. All of these facts showthe difficulties in establishing a reliable assay based on free cir-culating IgE antibodies to discriminate between allergic andhealthy patients.
Recent studies have shown that allergen-specific IgE epitoperecognition correlates well with clinical reactivity to food aller-gens. Patients with a persistent allergy to milk,[22–24]
peanut,[25, 26] and egg[27, 28] were found to recognize a largernumber of IgE epitopes. Therefore, IgE epitope mapping couldprovide additional information for allergy diagnosis and predic-tion. It is also worth noting that the characterization of aller-genic epitopes is of fundamental importance for understand-ing the mechanisms of food allergies, and for the constructionof safe immunotherapeutics.[29–31]
Based on a well-described cohort of subjects, our rationalapproach was to probe peptide arrays, derived from thecelery-allergic protein Api g 1.0101 with sera from healthy andcelery-allergic patients. Our aim was to identify IgE bindingpeptides. Moreover, we addressed the question of whethersuch IgE binding peptides are suitable diagnostic tools, at leastto distinguish between healthy and celery-allergic patients.
Results and Discussion
Strategy, challenge, and outline of the study
Peptide-microarray and peptide-macroarray technologies[32] arewell suited for epitope mapping. To design the peptide arrays,we dissected the protein sequence of the major allergen incelery Api g 1.0101 (UniprotKB/Swissprot entry P49372) intosets of overlapping peptides (pepscan). Subsequently, these se-quences were synthesized as peptide arrays on cellulose mem-branes, according to SPOT technology[33] (for a recent reviewsee ref. [34]).
Our aim was to focus strictly on IgE antibody/peptide recog-nition, so as to minimize the interaction with other classes ofimmunoglobulins. For detection, a highly specific secondaryanti-human IgE antibody with minimum cross-reactivity to-wards cellulose-membrane-bound peptides is essential, andthe visualization method should not interfere with the arraypeptides. Therefore, we first had to establish the optimal ex-perimental conditions, including synthesis quality, peptidelength, membrane type, peptide density, detection and visualization, the blocking reagent, and incubation parameters.
Once all conditions were optimized, synthetic arrays wereprobed with sera randomly chosen from a well-describedcohort of subjects, including 21 patients with a defined allergicreaction to celery and 17 healthy individuals. Captured human
IgE antibodies were detected with a horse radish peroxidase(HRP)-labeled secondary antibody, and binding was visualizedby using chemiluminescence.
Clinical profiles of the celery allergic and healthy subjects
Sera from 21 patients, who tested positive for native celeryroot with a SPT were used for this study. These patients hadelevated levels of specific IgE antibodies to celery and a rele-vant reaction to celery (proven by DBPCFC). Sera from 17healthy individuals who tested negative for native celery root,birch, grass, and mugwort pollen, and showed no adverse re-actions to celery were used as a control. The main clinical char-acteristics of both groups are listed in Table S1 in the Support-ing Information. All celery-allergic patients were additionallysensitized to birch pollen, and in some cases to other pollen al-lergens. We found that 18 of the 21 (88 %) subjects were sensi-tized to grass pollen and 12 out of 21 (57 %) to mugwortpollen. Patients with concomitant rhinitis had lower levels ofIgE than patients suffering from both rhinitis and asthma. Ingeneral, patients with atopic dermatitis (AD) had significantlyhigher levels of IgE (total and celery specific) than patientswithout AD (7/21 (33 %) versus 14/21 (67 %), P = 0.001).
Quality of membrane-bound peptides
To monitor SPOT-peptide synthesis quality, we randomly chosea set of heptamer, 12-mer, and 24-mer Api g 1.0101-derived se-quences. Overall, 31 peptides were SPOT synthesized on a b-alanine membrane, subsequently cleaved from the membraneby dry-state ammonolysis,[35, 36] and analyzed by HPLC and ESImass spectrometry. In further tests (see below), we noticedthat N-modified cellulose-amino-hydroxypropyl ether (N-CAPE)membranes[37] are more suitable for probing IgE antibodybinding. Thus, peptide quality control was repeated with atotal of 155 peptides synthesized on such membranes. Toguarantee peptide cleavage from the N-CAPE membrane, weused the acid-labile Fmoc-Rink linker. Peptides were releasedas amides from the N-CAPE membranes by using a two-stepcleavage protocol.
The analytical results are presented in detail in Figure S1, Ta-bles S2, and S3. Briefly, all molecular weights were consistentwith the expected values, and peptide purity was in the rangeof 70–90 %. The determined quality and purity of the SPOT-synthesized peptides are adequate for a reliable screeningstudy.[34, 38, 39]
Importance of peptide length
Antibody epitopes usually do not exceed about 15 aminoacids in length. However, by using synthetic peptides as anti-genic probes, it has been shown that linear peptide epitopesare constructed by two to five critical residues, usually locatedwithin a sequence between five and eight amino acids inlength.[40, 41] A later study, mapping 68 linear antibody epitopes,revealed a longer average epitope length of eight amino acidresidues.[42] This slight difference can be attributed to the dif-
2284 www.chembiochem.org � 2010 Wiley-VCH Verlag GmbH & Co. KGaA, Weinheim ChemBioChem 2010, 11, 2283 – 2293
R. Volkmer et al.

ferent lengths of synthetic peptides used for epitope identifica-tion and characterization studies. As even weakly binding pep-tides can be identified by using peptide arrays prepared bySPOT synthesis, it can be assumed that binding motifs withonly two or three critical residues are detected if they appearwith the proper spacing. IgE antibody binding peptides havebeen reported to be as short as five or seven amino acids.[43–45]
Other studies have described IgE binding peptides withlengths between 10 and 21 amino acids.[46–50] Therefore, we de-cided to probe several lengths of overlapping peptides fromthe Api g 1.0101 sequence (hepta-, 12- and 24-meric peptides).Peptide arrays were probed with the secondary antibody as anegative control and finally with sera of healthy and celery-al-lergic subjects. Figure 1 shows the influence of peptide lengthon IgE binding. The data indicate that a reduction in peptidelength induces an increase in binding interaction, but unfortu-nately correlates with an increase in secondary antibody cross-reactivity (false positives) to the membrane-bound peptides inthe same manner. Elongation of peptide length completely
abolishes the IgE-peptide interaction. The optimal ratio of serasignal to false positives was observed by using arrays of 12-meric peptides.
Cellulose membrane type and peptide density
It has been shown previously that membrane types and mem-brane functionality both influence the quality of bindingassays.[34, 39, 51–54] A further pretest was needed to determine theoptimal kind of membrane and loading functionality. Arrays of12-meric peptides, covering the Api g 1.0101 sequence, weresynthesized on two kinds of membranes: an ester-type (b-ala-nine)[33] and an ether-type (N-CAPE)[37] membrane of the sameloading (300 nmol cm�2). These peptide arrays were probed forhuman IgE antibody binding by using the same serum (SH-12;SH = subject recruited) and revealed that the N-CAPE mem-brane seems to be more advantageous for human IgE anti-body sera screening (Figure 2 A, B). Compared to the b-alanine
Figure 1. Influence of peptide length on IgE binding. Overlapping peptides of Api g 1.0101 were synthesized on N-CAPE membranes, and A) incubated withpatients’ sera, or B) with detection antibody only. IgE binding was detected by using an HRP-labeled anti-IgE antibody. Incubation results with heptamer, 12-mer, and 24-mer peptides are shown.
Figure 2. Influence of membrane type and peptide density on IgE binding. Dodecameric peptides of Api g 1.0101 were synthesized A) on a b-alanine mem-brane and B) on a N-CAPE membrane (both with 300 nmol cm�2), and incubated with patients’ sera (SH-12). C) Additionally, 12-meric peptides were synthe-sized on N-CAPE membranes with different loadings and incubated with the patients’ sera (SH-24). Visualization was performed by using an HRP-labeled antiIgE-antibody with chemiluminescence.
ChemBioChem 2010, 11, 2283 – 2293 � 2010 Wiley-VCH Verlag GmbH & Co. KGaA, Weinheim www.chembiochem.org 2285
IgE Binding Pattern of Celery Allergen

membrane, background levels with N-CAPE membranes werelower, and signals showed higher signal-to-noise-ratios (SNRs).
The quality of a screening assay further depends on the pep-tide density. Various suitable peptide spot densities can beachieved by adjusting the depletion of the amino functionalityon a cellulose membrane. In this study, we used N-CAPE mem-branes with an amino functionality in the range of 30 to800 nmol cm�2, incubated with the same serum (SH-24). Seethe Supporting Information for details about adjusting mem-brane functionality, and the Experimental Section for function-alization of the cellulose membrane. Analyses of 12-mericpepscans over the Api g 1.0101 sequence, synthesized on N-CAPE membranes with different loadings (30, 175, and700 nmol cm�2) show the same binding patterns to the signalintensities (SIs; data not shown), which are nevertheless diffi-cult to discriminate, by looking only at the pictures (Figure 2 C).A reduction in membrane loading led to a dramatic loss insignal intensity (SI) and worse SNR. In contrast, the optimum isgiven with a membrane loading of approximately 640–760 nmol cm�2.
At first glance, this result seems to be in conflict with ourpreviously reported results : cellulose membranes with very lowloadings (20–40 nmol cm�2) were successfully applied for pro-teomic peptide arrays,[52, 55] and cellulose membranes with stan-dard loading (480 nmol cm�2) were successfully used for IgGscreening assays.[56, 57] However, the IgE antibody fraction repre-sents the lowest fraction of antibodies in human serum sam-ples, at approximately 0.005 % of the complete immunoglo-bulin fraction.[21, 58] We determined the mean tIgE concentrationof celery-allergic individuals to be 1.9 mg mL�1 (= 805.95 kUper L tIgE) and the celery sIgE to be about 0.009 mg mL�1
(=3.88 kU per L sIgE; 1 kU per L = 2.4 mg L�1 see Table S1 A). Inour study, the applied sera have been diluted 1:5 (in the ap-propriate blocking reagent), prior to array incubation; this re-sulted in a tIgE concentration of approximately 0.4 mg mL�1
and a sIgE concentration below 0.0018 mg mL�1.Due to the fact that in serum both allergen-specific IgE and
IgG are present, and the concentration of the IgG is up to1000 times higher, both immunoglobulins compete for bindingto the same peptide. Cross-reactivities between IgE and IgGare known for peanuts[25] or milk[22] epitopes. Therefore, IgGbinding can hinder detection of IgE. On the other hand, IgEmost likely has a higher affinity in comparison to IgG.[59] There-fore, membranes with high loading and extended incubationtimes at low temperatures help to avoid such competitioneffects.
However, despite all the limitations of the assay, we have es-tablished a reproducible and significant diagnostic tool byusing our improved synthesis and incubation conditions; thisallows celery sIgE detection up to a mean serum concentrationof 0.0018 mg mL�1.
The detection and visualization system
Different anti-IgE antibodies were used to detect sIgE: 1) twodifferent secondary anti-IgE antibodies, labeled with a moietyfor visualization (the more suitable and popular being the
enzyme HRP (P 0295, Dako, and A 9667, Sigma–Aldrich)) ; 2) asecondary biotin-labeled anti-human IgE antibody (BA-3040,Vector laboratories) in combination with a streptavidin–HRP(S 5512, Sigma–Aldrich) adduct; 3) a sandwich system compris-ing a mouse anti-human IgE antibody (IgG type, I 6510,Sigma–Aldrich), and a HRP-labeled anti-mouse IgG antibody(A 5906, Sigma–Aldrich). To exclude false positives, secondaryantibodies or the streptavidin–HRP moiety should not interactwith cellulose-membrane-bound peptides.
To determine the optimal detection/visualization system,sets of overlapping peptides (12-mers) covering theApi g 1.0101 sequence were synthesized on N-CAPE mem-branes with high loading, and subsequently probed with sera(diluted 1:5 in the appropriate blocking reagent). Detection/vis-ualization were performed by using one of the systems de-scribed above (Figure S3). The biotin–streptavidin–HRP detec-tion method was not suitable due to false-positive detection(>25 %) of the synthesized peptides, most likely through un-specific binding of streptavidin–HRP (Figure S3 A–C). The sand-wich system of mouse anti-human IgE antibody and HRP-la-beled anti-mouse IgG antibody was also not applicable (Fig-ure S3 D–G). Although both antibodies show negligible cross-reactivity with membrane-bound peptides, we could show ahigh cross-reactivity, predominantly with the HRP-labeled anti-mouse IgG antibody, after serum incubation (Figure S3 G). Posi-tive spots obtained after probing the array are most likely acombination of IgE and/or IgG binding.
The best results were obtained with two polyclonal, HRP-la-beled anti-human IgE antibodies (from Dako or Sigma–Aldrich)that are highly specific for the e-heavy chain. These antibodiesshow low cross-reactivity with membrane-bound peptides, andexcellent human IgE specificity. Due to improved SIs, we chosethe anti-human IgE (A 9667 from Sigma–Aldrich) for the subse-quent analyses.
Blocking reagent and incubation parameters
Recently, several laboratories have reported the influence ofblocking reagents on the quality of screening experiments per-formed on cellulose-membrane-bound peptide arrays.[60–62]
With a view to identifying the optimal conditions for IgEscreening, we investigated the influence of five blocking re-agents on the readout quality of the assay: bovine serum albu-min (BSA), Tween 20, polymer, or milk powder-based blockingbuffers and Sigma–Genosys blocking buffer concentrate inTris-buffered saline (TBS) with sucrose (5 %, w/v). The capacityof these five blocking reagent mixtures to suppress unspecificbinding was tested on a synthetic 12-meric pepscan over theApi g 1.0101 sequence prepared on a N-CAPE membrane withhigh loading (as above). Each membrane was preincubatedwith one of the blocking buffers for 2 h at room temperature,or for 16 h at 4 8C (described in detail in the Experimental Sec-tion). Subsequently, the peptide arrays were probed withserum (diluted 1:5 in the corresponding blocking buffer), fol-lowed by addition of HRP-labeled anti-human IgE antibody(also diluted in the corresponding blocking buffer; Figure 3).
2286 www.chembiochem.org � 2010 Wiley-VCH Verlag GmbH & Co. KGaA, Weinheim ChemBioChem 2010, 11, 2283 – 2293
R. Volkmer et al.

Neither BSA- nor Tween 20-based blocking buffers were suf-ficient to reduce unspecific binding of the HRP-labeled anti-human IgE antibody with array peptides (Figure 3 D and E).Blocking reagents based on either a polymer or milk powderwere more potent, but still insufficient (Figure 3 B and C). Thebest results were obtained with blocking buffer (Sigma–Geno-sys) in TBS with 5 % sucrose (w/v ; Figure 3 A). The effect of theblocking parameters is only marginal, with blocking efficiencysomewhat better if the preblocking procedure was performedfor 2 h at room temperature.
Finally, we reinvestigated the influence of serum dilution,and the duration or temperature of serum incubation in pre-tests performed on similar synthetic peptide arrays. Patients’sera were diluted from 1:1 to 1:20 with blocking buffer(Sigma–Genosys) in TBS with 5 % sucrose (w/v), while durationand temperature of incubation were varied as follows: 1 h atroom temperature, 1 h at 37 8C, 16 h at 37 8C, and 16 h at 4 8C.The optimal readout for our screening study was obtainedwith a serum dilution of 1:5 and serum incubation for 16 h at4 8C (data not shown).
Identification of human IgE antibody binding peptides
The optimal conditions for screening the sera of 21 celery-aller-gic patients and 17 healthy controls are as follows: 1) replicaof a 12-meric pepscan with a shift of three amino acids cover-ing the Api g 1.0101 sequence synthesized on N-CAPE mem-branes with high loading (640–760 nmol cm�2) ; 2) prior totreatment with sera, membranes were blocked with theSigma–Genosys blocking buffer for 2 h at room temperature;3) arrays were probed for 16 h at 4 8C with diluted serum (1:5)for IgE antibody binding; 4) the captured human IgE antibod-ies were detected with the HRP-labeled anti-human IgE anti-body (A 9667, Sigma–Aldrich) and visualized by chemilumines-cence; 5) spot signal intensities (SIs) were measured on a Lumi-Imager and processed with the LumiAnalyst software. To checkthe reproducibility of our screening procedure, three differentpeptide arrays were incubated and evaluated for each person(allergic and healthy).
The readout quality of the 38 analyzed human IgE bindingpatterns was found to be heterogeneous, despite careful appli-cation of the optimized conditions (shown in Figure S4). Somearray patterns had low background and good SNR, however,others had very high background levels with diminished SNR.We assume that different background levels are probably dueto the serum-extraction procedure. During this process, differ-ent amounts of erythrocyte-based peroxidases, which arestimulated during final membrane incubation with the chemi-luminescence agent, could be released.
Nevertheless, serum binding patterns could be reproducedin repeated incubation experiments. Specifically, we found thatSIs deviate by a factor of 11 when comparing two identicalarrays synthesized on different membranes, despite using thesame serum and the same experimental conditions. However,although intermembrane absolute SIs differ significantly, therelative differences between SIs were nearly the same. This en-abled us to compare SIs from different membranes by apply-ing an additional normalization procedure.[54] We defined anIgE antibody binding spot as positive if its normalized signalintensity (SInorm) was higher than the calculated cut-off value ofthe appropriate membrane (see the Experimental Section).
Results obtained in our comprehensive serum-screeningstudy are presented in Figure 4. An interaction of serumhuman IgE antibodies with a peptide derived from theApi g 1.0101 sequence is depicted as a black square, with IgEantibody binding patterns shown for each individual recruitedfor the study. The binding patterns clearly demonstrate thatthere are many more IgE-antibody binding events in serumfrom celery-allergic patients than from healthy subjects. Thecelery-allergic cohort revealed 136 positive IgE antibody bind-ing spots, whereas only 36 positive IgE binding spots werefound in the healthy control group. The sum of positive IgE an-tibody responses showed significant differences betweencelery-allergic and healthy individuals; these values range from1 to 18 positive spots per subject in the allergic group, andfrom 0 to 8 in the control group (Wilcoxon, P<0.001). We cal-culated an arithmetic mean of 2.1 positive IgE antibody bind-ing spots for healthy individuals and 6.5 positive responses for
Figure 3. Influence of blocking reagents upon assay quality. Arrays of randomly chosen 12-mer peptides (taken from the Api g 1.0101 sequence) were probedwith the HRP-labeled anti-human IgE detection antibody (A 9667, Sigma). Prior to incubation, the blocking procedure was performed for 2 h at room temper-ature (upper row) or for 16 h at 4 8C (lower row). The following blocking reagents were used: A) diluted Sigma–Genosys blocking buffer concentrate in TBSwith sucrose (5 %, w/v), B) Roti-ImmunoBlock, C) milk powder-based blocking buffer, D) BSA-based blocking buffer, and E) Tween 20 in TBS buffer. Gray andblack spots denote unwanted interactions of the antibody with cellulose-membrane-bound peptides.
ChemBioChem 2010, 11, 2283 – 2293 � 2010 Wiley-VCH Verlag GmbH & Co. KGaA, Weinheim www.chembiochem.org 2287
IgE Binding Pattern of Celery Allergen
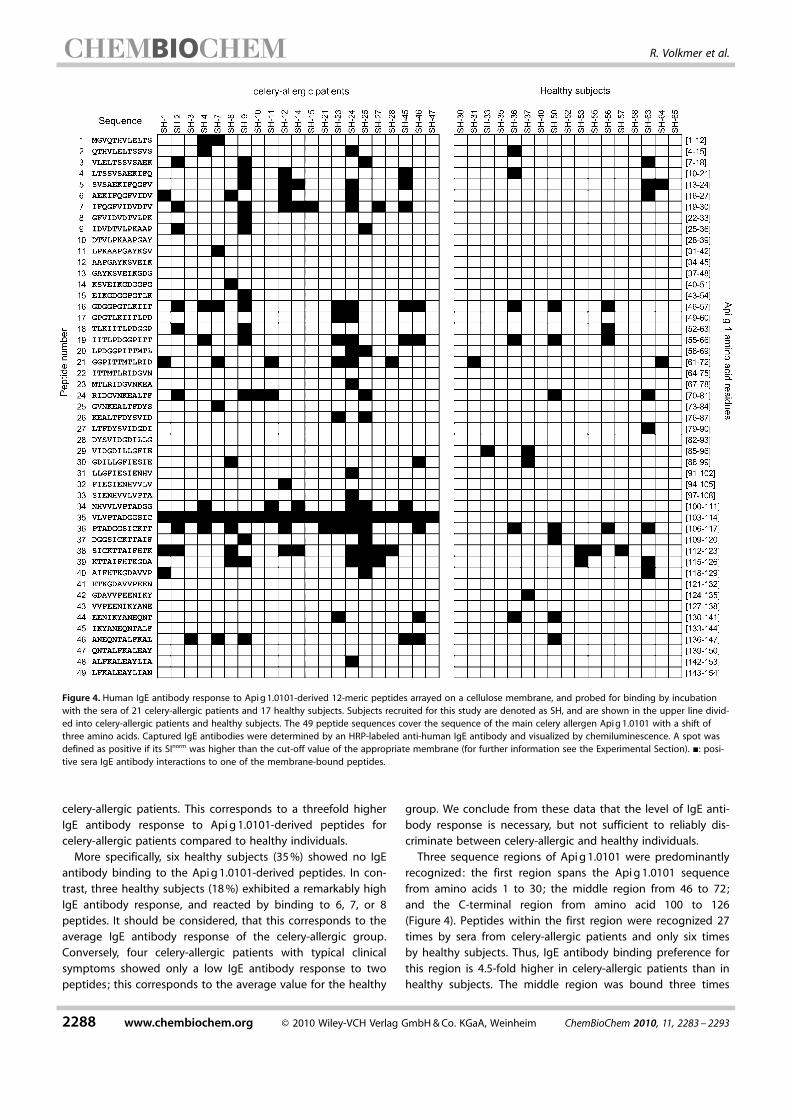
celery-allergic patients. This corresponds to a threefold higherIgE antibody response to Api g 1.0101-derived peptides forcelery-allergic patients compared to healthy individuals.
More specifically, six healthy subjects (35 %) showed no IgEantibody binding to the Api g 1.0101-derived peptides. In con-trast, three healthy subjects (18 %) exhibited a remarkably highIgE antibody response, and reacted by binding to 6, 7, or 8peptides. It should be considered, that this corresponds to theaverage IgE antibody response of the celery-allergic group.Conversely, four celery-allergic patients with typical clinicalsymptoms showed only a low IgE antibody response to twopeptides; this corresponds to the average value for the healthy
group. We conclude from these data that the level of IgE anti-body response is necessary, but not sufficient to reliably dis-criminate between celery-allergic and healthy individuals.
Three sequence regions of Api g 1.0101 were predominantlyrecognized: the first region spans the Api g 1.0101 sequencefrom amino acids 1 to 30; the middle region from 46 to 72;and the C-terminal region from amino acid 100 to 126(Figure 4). Peptides within the first region were recognized 27times by sera from celery-allergic patients and only six timesby healthy subjects. Thus, IgE antibody binding preference forthis region is 4.5-fold higher in celery-allergic patients than inhealthy subjects. The middle region was bound three times
Figure 4. Human IgE antibody response to Api g 1.0101-derived 12-meric peptides arrayed on a cellulose membrane, and probed for binding by incubationwith the sera of 21 celery-allergic patients and 17 healthy subjects. Subjects recruited for this study are denoted as SH, and are shown in the upper line divid-ed into celery-allergic patients and healthy subjects. The 49 peptide sequences cover the sequence of the main celery allergen Api g 1.0101 with a shift ofthree amino acids. Captured IgE antibodies were determined by an HRP-labeled anti-human IgE antibody and visualized by chemiluminescence. A spot wasdefined as positive if its SInorm was higher than the cut-off value of the appropriate membrane (for further information see the Experimental Section). &: posi-tive sera IgE antibody interactions to one of the membrane-bound peptides.
2288 www.chembiochem.org � 2010 Wiley-VCH Verlag GmbH & Co. KGaA, Weinheim ChemBioChem 2010, 11, 2283 – 2293
R. Volkmer et al.

more frequently by the IgE antibody from allergic patients,while the highest IgE antibody binding preference was foundfor the C-terminal region, which was recognized five timesmore often by allergic than by healthy individuals. We there-fore conclude that the most allergenic regions of theApi g 1.0101 protein are located in the regions between aminoacids 1–30 and 100–126.
As described above, six IgE-antibody binding events are theaverage for the celery-allergic group. We further searched forthose sequences recognized by at least 25 % of the celery-aller-gic group. In total, eight distinct peptides of Api g 1.0101 wererecognized by at least 25 % of the celery-allergic individuals. Indetail, 29 % responded to peptides 19, 21, and 34; 38 % reactedwith peptides 7 and 16; 43 % responded to peptides 36 and38; and finally 100 % reacted with peptide 35 (peptide sequen-ces are shown on the left in Figure 4). We then applied thismodus operandi to all peptide arrays, in addition to measuringthe average SI in terms of biomedical light units (BLU;Figure 5). Confirming the data in Figure 4, the same three aller-genic regions of the Api g 1.0101 protein appear in Figure 5:the N-terminal region comprising peptides 1–7, the middle
region peptides 16–21, and the C-terminal region containingpeptides 34–39. However, the SIs highlight differences be-tween these regions. Interestingly, the highest SIs were mea-sured for peptides located in the C-terminal region ofApi g 1.0101 (peptides 34–39), identified above as the most al-lergenic region. In contrast, peptides belonging to the middleallergenic region of Api g 1.0101 (peptides 16–21) and notablythe second most allergenic region in the N terminus (pep-tides 1–7) show lower SIs.
Finally, we searched for sequences that bind the serum IgEantibodies of at least six celery-allergic patients, but do notreact with any serum IgE antibodies from the healthy subjectsrecruited in this study. Only three sequences were identified:1) a peptide with the sequence IFQGFVIDVDTV (peptide 7 inFigure 4) belonging to the N-terminal region of Api g 1.0101,
and 2) two peptides located in the C-terminal region with thesequences NHVVLVPTADGG (peptide 34) and VLVPTADGGSIC(peptide 35). The latter is the only peptide recognized by thesera from all of the celery-allergic patients. Even more striking,this peptide had the highest measured SI.
Our results led us to conclude that the major allergenicregion of Api g 1.0101 is located in the C-terminal regionaround the sequence VLVPTADGGSIC. Furthermore, we suggestthat the allergenic effect of this region is supported by the N-terminal region of Api g 1.0101. This assumption is borne outby the positive correlation between the number of recognizedpeptides in the N-terminal region (peptides 1–7) and the C-ter-minal region (peptides 34–39) in the sera of celery-allergic pa-tients (Spearman rank correlation, r = 0.476, P = 0.025). The al-lergenic effect of the middle Api g 1.0101 region seems to beless distinct.
Interestingly, the three IgE binding regions of Api g 1.0101revealed here are in accordance with the T-cell stimulating re-gions of Api g 1.0101, as previously described by Bohle et al.[11]
Particularly, the major allergenic region located C-terminallyaround the sequence VLVPTADGGSIC was primarily describedas the immunodominant T-cell activating region of Api g 1.0101at the T-cell level.[11] Furthermore, these identified regions alsoshow high similarity to the previously described T-cell activat-ing regions of Bet v 1.[12]
During the sensitization phase, the IgE-mediated immuneresponse is initiated by the first contact between the immunesystem and the allergen. After processing by antigen-present-ing cells, the resulting peptides were presented to naive CD4 +
cells, and this led to T-cell activation and differentiation intoTH2 cells. Signaling molecules of TH2 cells activate B-cells toproliferate and differentiate to IgE-secreting plasma cells. Thefact, that our IgE binding patterns are nearly identical with theT-cell epitopes previously described by Bohle et al.[11, 63] clearlyindicates the strong interaction between T- and B-cell specific-ity.
Conclusions
Taken together, human-serum profiling for IgE antibody bind-ing to cellulose-membrane-bound peptides needs a carefullyadjusted experimental protocol. By applying our improved im-munoassay protocol, we could demonstrate that IgE antibodiesfrom the sera of celery-allergic patients mainly interact withthree distinct regions of the Api g 1.0101 sequence. Our datapoint out that the Api g 1.0101 region of amino acids 100–126is the most important IgE binding region. Peptides derivedfrom the C-terminal region caused a fivefold higher serum-re-sponse among celery-allergic patients than among healthy in-dividuals. We detected three peptides exclusively recognizedby the serum IgE antibodies of celery-allergic patients. Ofthese peptides, the peptide VLVPTADGGSIC was recognized bysera from all the celery-allergic patients recruited for this study.The data gathered from the sera-profiling study are a goodstarting point to develop new strategies for discriminatingbetween healthy and celery-allergic subjects.
Figure 5. Comparison between measured SIs (black bars given in mean BLU)and IgE antibody response to Api g 1.0101-derived 12-meric peptides arrayedon a cellulose membrane (curve given in percentage of celery-allergic pa-tients).
ChemBioChem 2010, 11, 2283 – 2293 � 2010 Wiley-VCH Verlag GmbH & Co. KGaA, Weinheim www.chembiochem.org 2289
IgE Binding Pattern of Celery Allergen
Experimental Section
General : The amino acids and b-alanine were purchased from No-vabiochem or from Bachem (Bubendorf, Swizerland). Sodiummethoxide and triisobutyl silane were obtained from Fluka. N,N-di-methylformamide (DMF), N-methyl-2-pyrrolidinone (NMP), dioxane,epibromohydrin, perchloric acid, and 2-ethoxy-1-ethoxycarbonyl-1,2-dihydroquinoline (EEDQ) were purchased from Sigma–Aldrich,and diethyl ether was purchased from J. T. Baker (Deventer, TheNetherlands). Ethanol was obtained from Herbeta Arzeimittel(Berlin, Germany), acetonitrile from Biosolve (Valkenswaard, TheNetherlands), and DCM and methanol from Geyer (Chemsolute,Renningen, Germany). Milk powder and NaOH were obtained fromRoth (Karlsruhe, Germany). All other chemicals or solvents were ob-tained from Merck Bioscience.
Subjects : Twenty-one adult patients aged between 20 and 49years with a history of birch or mugwort pollen allergies and of ad-verse reactions to celery were recruited from the Allergy-Centre-Charit� at the Department of Dermatology and Allergology, Char-it�. Patients were investigated according to the European Academyof Allergy and Clinical Immunology (EAACI) guidelines by using athorough medical history combined with in vitro and in vivo test-ing.[17, 18] Exclusion criteria for further analysis were a concomitantsevere disease, pregnancy, lactation, or the use of antihistamines,b-blockers, ACE inhibitors, neuroleptics, oral steroids, or immuno-suppressive drugs. The study was approved by the local ethicscommittee, and all participants gave written informed consentbefore participating in the study. A group of skin healthy, nonaller-gic volunteers (n = 17) served as a control group. To exclude anyseasonal effects, such as priming or boosting by inhaled pollen al-lergens, all clinical examinations were performed outside thepollen season.
Skin prick test and immunoglobulin E (IgE) determination : Par-ticipants received a SPT with native celery root (prick to prick) andcommercially available allergens of birch, grass, and mugwortpollen (ALK Scherax, Hamburg, Germany). SPTs were performedwith a 1 mm lancet (ALK-Abell�, Hørsholm, Denmark) on the volarsurface of the forearm. Histamine dihydrochloride (10 mg mL�1)and NaCl (0.9 %, ALK Scherax) were used as positive and negativecontrols, respectively. The reactions were documented after15 min. The wheal size was measured by using the formula (D + d)/2, where D is the maximum diameter and d is its perpendicular di-ameter. SPTs were considered positive if the diameter of the whealwas �3 mm.[64] Serum samples were obtained from all participantsat the beginning of the study and were kept at �20 8C until use.Specific sensitization to celery was confirmed by the determinationof total IgE and specific IgE (celery) using the Phadia CAP System(Uppsala, Sweden).
Double-blind, placebo-controlled food challenge : DBPCFC wasperformed with each patient according to the recommendationsof the EAACI and German position papers.[17, 18] Verum and placebochallenges were identical regarding taste, looks, smell, viscosity,texture, structure, and volume. For the verum provocation, fresh,finely ground celery root (50.0 g) was divided into dose steps of5.0–10.0–15.0–20.0 g. The DBPCFCs were titrated with a time inter-val of 15 min between each provocation dose. Before the adminis-tration of the next highest provocation dose, vital parameters suchas blood pressure and heart frequency were measured. Monitoringof pulmonary function was performed by measuring the forced ex-piratory volume in the first second (FEV1) at the beginning of thestudy, before and after each provocation. Patients with highly un-stable conditions (FEV1 below 80 % of predicted or the patients’
best immediately before the provocation) were excluded from theDBPCFC because of the higher risk for the patient and the en-hanced likelihood of false-positive responses.[65] Changes in theskin status of patients with AD were assessed by using the SeverityScoring of Atopic Dermatitis (SCORAD).[66]
Functionalization of the cellulose membrane : According to thestandard conditions for preparing a b-alanine-functionalized mem-brane,[36, 67] a sheet of cellulose (20.3 � 28.5 cm; Whatman 50, Maid-stone, UK) was incubated with Fmoc-b-alanine-OH activated withdiisopropylcarbodiimide (DIC) and 1-methylimidazole (NMI) in DMF(>3 h). After some washing steps with DMF (5 � 3 min), Fmoc-de-protection was performed by using 20 % piperidine in DMF (1 �20 min). Thereafter, the membrane was washed with DMF (5 �3 min), ethanol (3 � 3 min), and diethyl ether (2 � 3 min) followedby air-drying.
According to the improved conditions for preparing a N-CAPEmembrane, a sheet of cellulose (20.3 � 28.5 cm; Whatman 50) waswashed with water (50 mL) containing perchloric acid (2 mL, 70 %in water; 10 min), ethanol (4 � 3 min), and diethyl ether (2 � 3 min).After being air-dried for 4 h, the mixture was treated with a solu-tion of epibromohydrin (3 mL) and perchloric acid (1200 mL, 70 %in water) in dioxane (55.8 mL) for 1 h, washed with methanol(50 mL; 1 � 30 min), ethanol (50 mL; 2 � 3 min), DMF (50 mL; 3 �3 min), and incubated with a 75 % solution of 1,3-diaminopropanein DMF (60 mL) overnight. After being washed with DMF (2 �3 min), ethanol (2 � 3 min), water (2 � 3 min), ethanol (2 � 3 min),and diethyl ether (2 � 3 min), the membrane was air-dried, andtreated with a solution of sodium methoxide (50 mL, 5.4 m) inmethanol (30 %) for 20 min. After further washing with methanol(3 � 3 min), water (4 � 3 min), ethanol (3 � 3 min), and diethyl ether(2 � 3 min), the membrane was air-dried. All functionalization stepswere performed at room temperature. To prepare N-CAPE mem-branes with various loadings, each step of the standard protocol[37]
was systematically modified as shown in Table S4.
To determine membrane loading, several spots at the edge of eachmembrane were defined by pipetting a solution of Fmoc-b-Ala-Opfp (1 mL, 0.3 m) in DMF (double coupling, 15 min reaction each),punched out (spot area: 0.25 cm2), and treated with piperidine(1 mL, 20 % in DMF) each for 20 min. Coupling yields were deter-mined by measuring the UV absorbance of the released Fmocgroup and were given as the mean loading of 1 cm2 (c[nmol cm�2] = OD301/e d 0.25 cm2, with eFmoc = 7800 L mol�1, d = 1 cmand spot diameter = 0.25 cm2).
Analysis of SPOT-synthesized peptides : For synthesis quality con-trol, randomly chosen hepta-, 12- and 24-meric sequences ofApi g 1.0101 were synthesized on each membrane, as control pep-tides to verify the coupling efficiency, purity, and identity of thesynthesized peptides.
The first control peptides, synthesized on a b-alanine membranewere cleaved with NaOH (0.125 m) for 3 h. The solution was subse-quently neutralized with HCl (0.3 m) and shaken again for 3 h. Thepeptides were desalted by using ZipTip-C18 pipette tips (Millipore,Billerica, USA) for the mass spectrometric measurements, accordingto the supplier’s instructions. Due to the complex working proto-col, we also chose to cleave the peptides from the cellulose sup-port with ammonia vapor in the dry state.[35] The resulting peptideamides were then each eluted from the support with acetonitrile/water (100 mL, 1:1, v/v). For comparison of the results, achievedwith both of these methods, see Table S3).
2290 www.chembiochem.org � 2010 Wiley-VCH Verlag GmbH & Co. KGaA, Weinheim ChemBioChem 2010, 11, 2283 – 2293
R. Volkmer et al.

For synthesis of control peptides on N-CAPE membranes, Fmoc-Rink amide linker (0.3 m ; Iris Biotech, Markredwitz, Germany) inDMF activated with EEDQ (1.1 equiv, Sigma–Aldrich) was used toenable cleavage of the peptides for further analysis. The peptideswere released as amides from the N-CAPE membrane by using ourstandard two-step cleavage protocol for peptides synthesized oncellulose-bound linkers as reported previously.[38, 68] The peptideswere each dissolved in acetonitrile/water (1:1, 100 mL).
HPLC analysis (Waters, Eschborn, Germany) was performed byusing a linear gradient of solvents: A, TFA (0.05 % in water), and BTFA (0.05 % in acetonitrile) ; gradient 5–60 % B over 30 min. HPLCconditions: UV detector 214 nm, RP-18 column (Vydac C18, GE Bio-sciences, Munich, Germany). The identity of the peptides was vali-dated by ESI MS (Q-TofMicro, Micromass).
Peptide array synthesis : Overlapping peptide sequences (hepta-,12- and 24-mer with a shift of three amino acids) of Api g 1.0101were prepared by a MultiPep SPOT robot (Intavis Bioanalytical In-struments AG, Cologne, Germany). Array design was performedwith the aid of the in-house software LISA 1.83. Amino acids wereused as Fmoc-protected Opfp-esters with the following side-chainprotection groups: tert-butyl ester (OtBu) for E and D, tert-butylether (tBu) for S, T, and Y, tert-butoxycarbonyl (Boc) for K and W, tri-phenylmethyl (Trt) for C, N, Q, and H, and 2,2,4,6,7-pentamethyldi-hydrobenzofuran-5-sulfonyl (Pbf) for R. For standard SPOT synthe-sis,[36] double couplings of solutions of amino acids (0.3 m) in NMP(Fluka) were applied. After the final Fmoc-deprotection step andwashing procedure, cleavage of the side-chain protecting groupswas performed according to our standard two-step deprotectionprotocol.[36, 67, 69]
Human IgE antibody binding studies: The spotted peptide arrayswere prewashed with ethanol (1 � 10 min), washed with TBS(pH 8.0; 3 � 10 min), and blocked for 2 h at room temperature withblocking buffer. The membranes were incubated with the patients’sera in blocking buffer (dilution 1:5) overnight at 4 8C, washed withTBS, and then followed by a second incubation with anti-humanIgE antibody (e-chain specific) conjugated with HRP (A 9667,Sigma–Aldrich) in blocking buffer for 2 h at room temperature. Toremove excess antibody, the membrane was washed with TBS (3 �10 min). Detection was performed with a Uptilight HRP blot chemi-luminescent substrate (Uptima, MontluÅon, France) with an expo-sure time of 2 min. The SIs were recorded in BLU by using a Lumi-Imager (Boehringer Mannheim) with the LumiAnalyst software.
To evaluate the best assay parameters, various blocking reagents,antibodies, and incubation parameters were investigated. For ex-periments verifying different blocking buffer solutions, the follow-ing blocking reagents were used: 1) blocking buffer (blocking con-centrate Sigma–Genosys, Cambridge, UK) in TBS (dilution 1:10,pH 8.0), containing sucrose (5 %, w/v), 2) Roti-ImmunoBlock (block-ing concentrate, made on a polymer basis without detergent(Roth) was prepared according to the manufacturer’s instructions) ;3) milk-based blocking buffer (2.5 %, w/v skimmed dry milk in TBS(pH 8.0), containing Tween 20 (0.05 %, v/v) and sucrose (5 %, w/v) ;4) BSA-based blocking buffer (5 %, w/v), BSA (A 2153, Sigma–Al-drich) in TBS (pH 8.0) containing Tween 20 (0.05 %, v/v) ; 5) Tween20 buffer, TBS (pH 8.0), containing Tween 20 (0.2 %, v/v), for block-ing procedure), or Tween 20 (0.05 %, v/v), for antibody incubation).The blocking procedure was performed for 2 h at room tempera-ture or for 16 h at 4 8C. To evaluate the most suitable system fordetecting peptide-bound IgE antibodies, direct and indirect detec-tion methods were performed. For the direct method, two differ-ent polyclonal anti-human IgE antibodies, both specific for the e-
heavy chain and labeled with HRP, were used (P 0295; Dako,Glostrup, Denmark and A 9667, Sigma–Aldrich). For the indirectmethod, either a monoclonal, unlabeled mouse anti-human IgE an-tibody (I 6510, Sigma–Aldrich) recognized by a HRP-labeled anti-mouse IgG antibody (A 5906, Sigma–Aldrich) or a biotinylated anti-human IgE antibody, specific for the e-heavy chain (BA-3040,Vector laboratories, Burlingame, USA), and recognized by streptavi-din-HRP (S 5512, Sigma–Aldrich) were used. At first, various peptidearrays were incubated with detection antibodies only (with andwithout blocking reagent) to identify cross-reactivity between de-tection antibodies and cellulose-bound peptides. Additionally, pep-tide arrays were incubated with unbound and streptavidin-boundHRP to identify false-positive signals caused by binding of HRP tothe peptides. For comparison, peptide arrays were incubated withthe sera of celery allergic and healthy patients by using the above-mentioned detection systems. For optimal signal detection, serumincubations were performed with different serum dilutions (1:1,1:5, 1:10, and 1:20 in the appropriate buffer), various incubationtimes (1 h, 2 h, and overnight), and temperatures (room tempera-ture, 4, and 37 8C).
Measurement of spot signal intensities : SIs were analyzed andmeasured with the LumiAnalyst software, version 3.1 (BoehringerMannheim). The spot signal was calculated from a circular regionaround the spot center detected on the image. To guarantee uni-form spot signal assessment, and reduce signal variations causedby the background, we choose the background correction methodin the LumiAnalyst software. This method allows local backgroundcorrection when calculating the BLU of each spot. The backgroundvalues of each spot were determined from BLU values around thespot, with a safety margin, and normalized to the area of the spot.By comparing replicas of several membranes, incubated underidentical conditions, we found signal intensity deviations of afactor of 11. However, the relation of the signals was constant forall peptides. Therefore, to enable comparison of SIs from differentmembranes, SIs were first normalized by using Equation (1), as pre-viously described.[54]
SInorm ¼ SImeasured�SImin
SImax�SIminð1Þ
An IgE antibody binding spot was defined as positive if its normal-ized signal intensity (SInorm) was higher than the calculated cut-offvalue of the appropriate membrane. For calculation of the cut-offvalue of each membrane, the mean signal intensity of all spots onthis membrane was used (SImean) and fitted into Equation (2):
Cut-off value ¼ SImean�SImin
SImax�SIminð2Þ
Statistical analysis : Loading values from the modification steps ofpreparing the N-CAPE membrane and differences in IgE levels be-tween the groups were evaluated by applying the Mann–Whitney-U test (MWW). The Spearman rank test was used to calculate corre-lations between the number of recognized peptides in the N-ter-minal region and the C-terminal region in the sera of celery-allergicpatients. The Wilcoxon test was used to compare specific IgE bind-ing to Api g 1.0101-derived peptides between celery-allergic andhealthy patients. All statistical tests were two-sided, and P values�0.05 were considered statistically significant. Calculations wereperformed with SPSS 16.0 (SPSS Inc. , Chicago, IL, USA).
ChemBioChem 2010, 11, 2283 – 2293 � 2010 Wiley-VCH Verlag GmbH & Co. KGaA, Weinheim www.chembiochem.org 2291
IgE Binding Pattern of Celery Allergen

Acknowledgements
The authors thank Ines Kretzschmar for her excellent technicalassistance. This work was financially supported by the DeutscheForschungsgemeinschaft SFB 449.
Keywords: antibodies · Api g 1 · immunology · microarrays ·peptides · SPOT technology
[1] T. Zuberbier, G. Edenharter, M. Worm, I. Ehlers, S. Reimann, T. Hantke,C. C. Roehr, K. E. Bergmann, B. Niggemann, Allergy 2004, 59, 338.
[2] C. C. Roehr, G. Edenharter, S. Reimann, I. Ehlers, M. Worm, T. Zuberbier,B. Niggemann, Clin. Exp. Allergy 2004, 34, 1534.
[3] S. H. Sicherer, H. A. Sampson, J. Allergy Clin. Immunol. 2010, 125, 116.[4] M. Osterballe, T. K. Hansen, C. G. Mortz, A. Host, C. Bindslev-Jensen, Pe-
diatr. Allergy Immunol. 2005, 16, 567.[5] K. Hoffmann-Sommergruber, P. Demoly, R. Crameri, H. Breiteneder, C.
Ebner, M. Laimer Da Camara Machado, K. Blaser, C. Ismail, O. Scheiner, J.Bousquet, G. Menz, J. Allergy Clin. Immunol. 1999, 104, 478.
[6] H. Breiteneder, K. Hoffmann-Sommergruber, G. O’Riordain, M. Susani, H.Ahorn, C. Ebner, D. Kraft, O. Scheiner, Eur. J. Biochem. 1995, 233, 484.
[7] D. L�ttkopf, B. K. Ballmer-Weber, B. W�thrich, S. Vieths, J. Allergy Clin.Immunol. 2000, 106, 390.
[8] L. Bauer, C. Ebner, R. Hirschwehr, B. W�thrich, C. Pichler, R. Fritsch, O.Scheiner, D. Kraft, Clin. Exp. Allergy 1996, 26, 1161.
[9] A. Jankiewicz, H. Aulepp, W. Baltes, K. W. Bogl, L. I. Dehne, T. Zuberbier,S. Vieths, Int. Arch. Allergy Immunol. 1996, 111, 268.
[10] B. W�thrich, J. Stager, S. G. Johansson, Allergy 1990, 45, 566.[11] B. Bohle, A. Radakovics, B. Jahn-Schmid, K. Hoffmann-Sommergruber,
G. F. Fischer, C. Ebner, Eur. J. Immunol. 2003, 33, 3303.[12] B. Jahn-Schmid, A. Radakovics, D. L�ttkopf, S. Scheurer, S. Vieths, C.
Ebner, B. Bohle, J. Allergy Clin. Immunol. 2005, 116, 213.[13] B. K. Ballmer-Weber, A. Hoffmann, B. W�thrich, D. L�ttkopf, C. Pompei,
A. Wangorsch, M. Kastner, S. Vieths, Allergy 2002, 57, 228.[14] B. K. Ballmer-Weber, S. Vieths, D. L�ttkopf, P. Heuschmann, B. W�thrich,
J. Allergy Clin. Immunol. 2000, 106, 373.[15] M. Osterballe, T. K. Hansen, C. G. Mortz, C. Bindslev-Jensen, Allergy 2005,
60, 218.[16] H. A. Sampson, J. Allergy Clin. Immunol. 2004, 113, 805.[17] C. Bindslev-Jensen, B. K. Ballmer-Weber, U. Bengtsson, C. Blanco, C.
Ebner, J. Hourihane, A. C. Knulst, D. A. Moneret-Vautrin, K. Nekam, B.Niggemann, M. Osterballe, C. Ortolani, J. Ring, C. Schnopp, T. Werfel, Al-lergy 2004, 59, 690.
[18] B. Niggemann, S. Erdmann, L. J�ger, J. Kleine-Tebbe, M. Raithel, J.Saloga, I. Vieluf, S. Vieths, T. Werfel, Allergo J. 2006, 15, 262.
[19] B. Niggemann, K. Beyer, Allergy 2007, 62, 729.[20] H. A. Sampson, J. Allergy Clin. Immunol. 2001, 107, 891.[21] W. E. Winter, N. S. Hardt, S. Fuhrman, Arch. Pathol. Lab. Med. 2000, 124,
1382.[22] I. Cerecedo, J. Zamora, W. G. Shreffler, J. Lin, L. Bardina, M. C. Dieguez, J.
Wang, A. Muriel, B. de La Hoz, H. A. Sampson, J. Allergy Clin. Immunol.2008, 122, 589.
[23] P. Chatchatee, K. M. J�rvinen, L. Bardina, K. Beyer, H. A. Sampson, J. Aller-gy Clin. Immunol. 2001, 107, 379.
[24] P. Chatchatee, K. M. J�rvinen, L. Bardina, L. Vila, K. Beyer, H. A. Sampson,Clin. Exp. Allergy 2001, 31, 1256.
[25] A. E. Flinterman, E. F. Knol, D. A. Lencer, L. Bardina, C. F. den HartogJager, J. Lin, S. G. Pasmans, C. A. Bruijnzeel-Koomen, H. A. Sampson, E.van Hoffen, W. G. Shreffler, J. Allergy Clin. Immunol. 2008, 121, 737.
[26] W. G. Shreffler, K. Beyer, T. H. Chu, A. W. Burks, H. A. Sampson, J. AllergyClin. Immunol. 2004, 113, 776.
[27] K. M. J�rvinen, K. Beyer, L. Vila, L. Bardina, M. Mishoe, H. A. Sampson, Al-lergy 2007, 62, 758.
[28] S. K. Cooke, H. A. Sampson, J. Immunol. 1997, 159, 2026.[29] R. Valenta, V. Niederberger, J. Allergy Clin. Immunol. 2007, 119, 826.[30] G. A. Bannon, G. Cockrell, C. Connaughton, C. M. West, R. Helm, J. S.
Stanley, N. King, P. Rabjohn, H. A. Sampson, A. W. Burks, Int. Arch. AllergyImmunol. 2001, 124, 70.
[31] X. M. Li, K. Srivastava, A. Grishin, C. K. Huang, B. Schofield, W. Burks,H. A. Sampson, J. Allergy Clin. Immunol. 2003, 112, 159.
[32] U. Reimer, U. Reineke, J. Schneider-Mergener, Curr. Opin. Biotechnol.2002, 13, 315.
[33] R. Frank, Tetrahedron 1992, 48, 9217.[34] R. Volkmer, ChemBioChem 2009, 10, 1431.[35] A. M. Bray, N. J. Maeji, A. G. Jhingran, R. M. Valerio, Tetrahedron Lett.
1991, 32, 6163.[36] H. Wenschuh, H. Gausepohl, L. Germeroth, M. Ulbricht, H. Matuschew-
ski, A. Kramer, R. Volkmer-Engert, N. Heine, T. Ast, D. Scharn, J. Schneid-er-Mergener in Combinatorial Chemistry: A Practical Approach (Ed. : H.Fenniri), Oxford University Press, Oxford, 2000, p. 95.
[37] K. Licha, S. Bhargava, C. Rheinl�nder, A. Becker, J. Schneider-Mergener,R. Volkmer-Engert, Tetrahedron Lett. 2000, 41, 1711.
[38] V. Tapia, B. Ay, J. Triebus, E. Wolter, P. Boisguerin, R. Volkmer, J. Pept. Sci.2008, 14, 1309.
[39] H. Wenschuh, R. Volkmer-Engert, M. Schmidt, M. Schulz, J. Schneider-Mergener, U. Reineke, Biopolymers 2000, 55, 188.
[40] M. H. V. van Regenmortel in Immunochemistry (Eds. : C. J. van Oss,M. H. V. van Regenmortel), Marcel Dekker, New York, 1994, p. 277.
[41] C. Pinilla, J. R. Appel, R. A. Houghten, Mol. Immunol. 1993, 30, 577.[42] L. Dong, J. Schneider-Mergener, A. Kramer in Peptides 1998: Proceedings
of the Twenty-Fifth European Peptide Symposium (Eds. : S. Bajusz, F.Hudecz), Akademiai Kiado, Budapest, 1999, p. 530.
[43] S. Tanabe, J. Nutr. Sci. Vitaminol. 2004, 50, 367.[44] F. Battais, T. Mothes, D. A. Moneret-Vautrin, F. Pineau, G. Kanny, Y. Popi-
neau, M. Bodinier, S. Denery-Papini, Allergy 2005, 60, 815.[45] B. Banerjee, P. A. Greenberger, J. N. Fink, V. P. Kurup, Infect. Immun.
1999, 67, 2284.[46] K. Beyer, L. Ellman-Grunther, K. M. J�rvinen, R. A. Wood, J. Hourihane,
H. A. Sampson, J. Allergy Clin. Immunol. 2003, 112, 202.[47] K. Beyer, K. M. J�rvinen, L. Bardina, M. Mishoe, K. Turjanmaa, B. Nigge-
mann, S. Ahlstedt, L. Venemalm, H. A. Sampson, J. Allergy Clin. Immunol.2005, 116, 704.
[48] K. M. J�rvinen, P. Chatchatee, L. Bardina, K. Beyer, H. A. Sampson, Int.Arch. Allergy Immunol. 2001, 126, 111.
[49] O. Y. B�ssler, J. Weiss, S. Wienkoop, K. Lehmann, C. Scheler, S. Dçlle, D.Schwarz, P. Franken, E. George, M. Worm, W. Weckwerth, J. ProteomeRes. 2009, 8, 1111.
[50] G. A. Bannon, T. Ogawa, Mol. Nutr. Food Res. 2006, 50, 638.[51] N. Zander, Mol. Diversity 2004, 8, 189.[52] R. Tonikian, X. Xin, C. P. Toret, D. Gfeller, C. Landgraf, S. Panni, S. Paoluzi,
L. Castagnoli, B. Currell, S. Seshagiri, H. Yu, B. Winsor, M. Vidal, M. B. Ger-stein, G. D. Bader, R. Volkmer, G. Cesareni, D. G. Drubin, P. M. Kim, S. S.Sidhu, C. Boone, PLoS Biol. 2009, 7, e1000218.
[53] R. Frank, H. Overwin, Methods Mol. Biol. 1996, 66, 149.[54] A. A. Weiser, M. Or-Guil, V. Tapia, A. Leichsenring, J. Schuchhardt, C.
Frommel, R. Volkmer-Engert, Anal. Biochem. 2005, 342, 300.[55] C. Landgraf, S. Panni, L. Montecchi-Palazzi, L. Castagnoli, J. Schneider-
Mergener, R. Volkmer-Engert, G. Cesareni, PLoS Biol. 2004, 2, e14.[56] A. Kramer, U. Reineke, L. Dong, B. Hoffmann, U. Hoffmuller, D. Winkler,
R. Volkmer-Engert, J. Schneider-Mergener, J. Pept. Res. 1999, 54, 319.[57] U. Reineke, R. Sabat, Methods Mol. Biol. 2009, 524, 145.[58] http://www.imd-berlin.de/index.php?id = 268.[59] B. Hantusch, I. Scholl, C. Harwanegg, S. Krieger, W. M. Becker, S. Spitza-
uer, G. Boltz-Nitulescu, E. Jensen-Jarolim, Immunol. Lett. 2005, 97, 81.[60] M. Br�uning, M. Mahler, B. H�gle-Dçrr, M. Bl�thner, J. Koch, G. Petersen
in Peptide Arrays on Membrane Supports: Synthesis and Applications (Ed. :J. Koch, M. Mahler), Springer, Heidelberg, 2002, p. 153.
[61] A. Durauer, E. Kopecky, E. Berger, M. Seifert, R. Hahn, A. Jungbauer, J.Biochem. Biophys. Methods 2006, 66, 45.
[62] U. Beutling, K. Stading, T. Stradal, R. Frank, Adv. Biochem. Eng. Biotechnol.2008, 110, 115.
[63] B. Bohle, B. Zwçlfer, A. Heratizadeh, B. Jahn-Schmid, Y. D. Antonia, M.Alter, W. Keller, L. Zuidmeer, R. van Ree, T. Werfel, C. Ebner, J. AllergyClin. Immunol. 2006, 118, 242.
[64] L. Heinzerling, A. J. Frew, C. Bindslev-Jensen, S. Bonini, J. Bousquet, M.Bresciani, K. H. Carlsen, P. van Cauwenberge, U. Darsow, W. J. Fokkens, T.Haahtela, H. van Hoecke, B. Jessberger, M. L. Kowalski, T. Kopp, C. N.Lahoz, K. C. Lodrup Carlsen, N. G. Papadopoulos, J. Ring, P. Schmid-
2292 www.chembiochem.org � 2010 Wiley-VCH Verlag GmbH & Co. KGaA, Weinheim ChemBioChem 2010, 11, 2283 – 2293
R. Volkmer et al.

Grendelmeier, A. M. Vignola, S. Wohrl, T. Zuberbier, Allergy 2005, 60,1287.
[65] S. L. Taylor, S. L. Hefle, C. Bindslev-Jensen, F. M. Atkins, C. Andre, C.Bruijnzeel-Koomen, A. W. Burks, R. K. Bush, M. Ebisawa, P. A. Eigenmann,A. Host, J. O. Hourihane, E. Isolauri, D. J. Hill, A. Knulst, G. Lack, H. A.Sampson, D. A. Moneret-Vautrin, F. Rance, P. A. Vadas, J. W. Yunginger,R. S. Zeiger, J. W. Salminen, C. Madsen, P. Abbott, Clin. Exp. Allergy 2004,34, 689.
[66] J. Schmitt, S. Langan, H. C. Williams, J. Allergy Clin. Immunol. 2007, 120,1389.
[67] http://immunologie.charite.de/arbeitsgruppen/ag-volkmer.[68] B. Ay, M. Streitz, P. Boisguerin, A. Schlosser, C. C. Mahrenholz, S. D.
Schuck, F. Kern, R. Volkmer, Biopolymers 2007, 88, 64.[69] K. Hilpert, D. F. Winkler, R. E. Hancock, Nat. Protoc. 2007, 2, 1333.
Received: June 3, 2010
Published online on September 24, 2010
ChemBioChem 2010, 11, 2283 – 2293 � 2010 Wiley-VCH Verlag GmbH & Co. KGaA, Weinheim www.chembiochem.org 2293
IgE Binding Pattern of Celery Allergen