
Identification of Candidate IgG Biomarkers for Alzheimer's Disease via Combinatorial Library...
11
Resource Identification of Candidate IgG Biomarkers for Alzheimer’s Disease via Combinatorial Library Screening M. Muralidhar Reddy, 1,2 Rosemary Wilson, 1 Johnnie Wilson, 1 Steven Connell, 3 Anne Gocke, 3 Linda Hynan, 4 Dwight German, 5 and Thomas Kodadek 2, * 1 Opko Health Laboratories, 130 Scripps Way, Jupiter, FL 33458, USA 2 Departments of Chemistry & Cancer Biology, The Scripps Research Institute, Scripps Florida, 130 Scripps Way, #3A2, Jupiter, FL 33458, USA 3 Division of Translational Research, Department of Internal Medicine 4 Department of Clinical Sciences 5 Department of Psychiatry University of Texas Southwestern Medical Center, 5323 Harry Hines Boulevard, Dallas, TX 75390, USA *Correspondence: [email protected] DOI 10.1016/j.cell.2010.11.054 SUMMARY The adaptive immune system is thought to be a rich source of protein biomarkers, but diagnostically useful antibodies remain unknown for a large number of diseases. This is, in part, because the antigens that trigger an immune response in many diseases remain unknown. We present here a general and unbiased approach to the identification of diagnostically useful antibodies that avoids the requirement for antigen identification. This method involves the comparative screening of combinatorial libraries of unnatural, synthetic molecules against serum samples ob- tained from cases and controls. Molecules that retain far more IgG antibodies from the case samples than the controls are identified and subsequently tested as capture agents for diagnostically useful anti- bodies. The utility of this method is demonstrated using a mouse model for multiple sclerosis and via the identification of two candidate IgG biomarkers for Alzheimer’s disease. INTRODUCTION There is great interest in the discovery of disease-specific protein biomarkers in easily accessible biological fluids such as serum. A particularly interesting subproteome in this regard is the IgG antibody population (Anderson and LaBaer, 2005). The adaptive immune system is known to react specifically to many different disease states, in part through the amplification of particular antibodies that recognize disease-specific antigens. Thus, it should be possible to devise diagnostic tests for many different diseases based on the measurement of the levels of these antibodies in serum. However, this has proven difficult. Because antibodies are highly specific receptors for their cognate antigens, the general thinking is that a diagnostic test designed to monitor the level of a disease-specific antibody would require immobilized antigen as a ‘‘capture agent.’’ Unfor- tunately, there are many pathogenic conditions, including auto- immune diseases, neurological conditions, and cancers, for which the antigens that trigger the primary immune response are unknown, and thus, a definitive blood test is not available. To address this problem powerful proteomics technologies have been employed to screen large collections of expressed proteins, peptides, or other biomolecules in an attempt to discover native antigens recognized by disease-specific anti- bodies. Some notable successes have been achieved (Fath- man et al., 2005; Frulloni et al., 2009; Gibson et al., 2010; Hudson et al., 2007; Kanter et al., 2006; Lueking et al., 2003; Robinson et al., 2002b; Steller et al., 2005; Wang et al., 2005). However, none of these techniques appears to represent a general route to the rapid discovery of antibody biomarkers of real diagnostic utility. It is reasonable to suspect that a limitation of screens that employ collections of unmodified peptides, proteins, or lipids is that they are unlikely to contain the primary autoantigens that trigger the earliest and most disease-specific autoimmune response. It seems more likely that these primary antigens are biomolecules that are chemically modified in unusual ways due to the pathogenic chemistry involved in that particular disease state. In other words, it may be that collections of unmodified biomolecules represent the wrong region of ‘‘chemical space’’ in which to be looking for autoantigens or mimics thereof. With this hypothesis in mind, we were interested in testing a fundamentally different approach in which a combinatorial library of unnatural synthetic molecules is screened for ligands that bind antibodies abundant in the serum of animals or patients with a particular disease, but not healthy controls. The idea behind this approach is that unnatural molecules will simply represent a ‘‘shape library’’ that occupies regions of chemical space outside of that represented by unmodified biomolecules. A few of these molecules might, by chance, recognize the antigen-binding pocket of disease-specific antibodies well 132 Cell 144, 132–142, January 7, 2011 ª2011 Elsevier Inc.
-
Upload
independent -
Category
Documents
-
view
4 -
download
0
Transcript of Identification of Candidate IgG Biomarkers for Alzheimer's Disease via Combinatorial Library...

Resource
Identification of Candidate IgGBiomarkers for Alzheimer’s Diseasevia Combinatorial Library ScreeningM. Muralidhar Reddy,1,2 Rosemary Wilson,1 Johnnie Wilson,1 Steven Connell,3 Anne Gocke,3 Linda Hynan,4
Dwight German,5 and Thomas Kodadek2,*1Opko Health Laboratories, 130 Scripps Way, Jupiter, FL 33458, USA2Departments of Chemistry & Cancer Biology, The Scripps Research Institute, Scripps Florida, 130 Scripps Way, #3A2, Jupiter,
FL 33458, USA3Division of Translational Research, Department of Internal Medicine4Department of Clinical Sciences5Department of PsychiatryUniversity of Texas Southwestern Medical Center, 5323 Harry Hines Boulevard, Dallas, TX 75390, USA
*Correspondence: [email protected]
DOI 10.1016/j.cell.2010.11.054
SUMMARY
The adaptive immune system is thought to be a richsource of protein biomarkers, but diagnosticallyuseful antibodies remain unknown for a large numberof diseases. This is, in part, because the antigens thattrigger an immune response inmany diseases remainunknown. We present here a general and unbiasedapproach to the identification of diagnostically usefulantibodies that avoids the requirement for antigenidentification. This method involves the comparativescreening of combinatorial libraries of unnatural,synthetic molecules against serum samples ob-tained from cases and controls. Molecules that retainfar more IgG antibodies from the case samples thanthe controls are identified and subsequently testedas capture agents for diagnostically useful anti-bodies. The utility of this method is demonstratedusing a mouse model for multiple sclerosis and viathe identification of two candidate IgG biomarkersfor Alzheimer’s disease.
INTRODUCTION
There is great interest in the discovery of disease-specific
protein biomarkers in easily accessible biological fluids such
as serum. A particularly interesting subproteome in this regard
is the IgG antibody population (Anderson and LaBaer, 2005).
The adaptive immune system is known to react specifically to
many different disease states, in part through the amplification
of particular antibodies that recognize disease-specific antigens.
Thus, it should be possible to devise diagnostic tests for many
different diseases based on the measurement of the levels of
these antibodies in serum. However, this has proven difficult.
Because antibodies are highly specific receptors for their
132 Cell 144, 132–142, January 7, 2011 ª2011 Elsevier Inc.
cognate antigens, the general thinking is that a diagnostic test
designed to monitor the level of a disease-specific antibody
would require immobilized antigen as a ‘‘capture agent.’’ Unfor-
tunately, there are many pathogenic conditions, including auto-
immune diseases, neurological conditions, and cancers, for
which the antigens that trigger the primary immune response
are unknown, and thus, a definitive blood test is not available.
To address this problem powerful proteomics technologies
have been employed to screen large collections of expressed
proteins, peptides, or other biomolecules in an attempt to
discover native antigens recognized by disease-specific anti-
bodies. Some notable successes have been achieved (Fath-
man et al., 2005; Frulloni et al., 2009; Gibson et al., 2010; Hudson
et al., 2007; Kanter et al., 2006; Lueking et al., 2003; Robinson
et al., 2002b; Steller et al., 2005; Wang et al., 2005). However,
none of these techniques appears to represent a general route
to the rapid discovery of antibody biomarkers of real diagnostic
utility. It is reasonable to suspect that a limitation of screens that
employ collections of unmodified peptides, proteins, or lipids is
that they are unlikely to contain the primary autoantigens that
trigger the earliest and most disease-specific autoimmune
response. It seems more likely that these primary antigens are
biomolecules that are chemically modified in unusual ways due
to the pathogenic chemistry involved in that particular disease
state. In other words, it may be that collections of unmodified
biomolecules represent the wrong region of ‘‘chemical space’’
in which to be looking for autoantigens or mimics thereof.
With this hypothesis in mind, we were interested in testing
a fundamentally different approach in which a combinatorial
library of unnatural synthetic molecules is screened for ligands
that bind antibodies abundant in the serum of animals or patients
with a particular disease, but not healthy controls. The idea
behind this approach is that unnatural molecules will simply
represent a ‘‘shape library’’ that occupies regions of chemical
space outside of that represented by unmodified biomolecules.
A few of these molecules might, by chance, recognize
the antigen-binding pocket of disease-specific antibodies well

Figure 1. Schematic Representation of the Strategy Employed to
Identify Synthetic Molecules that Capture Antibody Biomarkers
The Y-shaped figures represent IgG antibodies. The figure depicts hypothet-
ical binding of an antibody present at high levels in an autoimmune serum
sample, but not in a healthy serum sample, binding to two compounds on
amicroarray. After subsequent probing with a fluorescently labeled secondary
antibody, this would produce amuch higher intensity at these two spots on the
enough to retain them from the blood, though they would almost
certainly not bind as well as the (unknown) native antigens. This
is the thinking behind almost any high-throughput screen of
synthetic molecule libraries or collections against protein drug
targets of pharmaceutical interest. Moreover, whereas anti-
bodies are generally not considered drug targets, it is known
that antibody ligands with structures quite different from that of
the native antigen can be isolated through library screening.
For example, peptide libraries have been screened successfully
for ‘‘mimotopes’’ that bind to carbohydrate-binding antibodies,
and these peptides can even be used as vaccines to raise anti-
bodies against the native carbohydrate antigen (Knittelfelder
et al., 2009). However, to the best of our knowledge, all such
mimotope screens have employed a single, well-defined anti-
body target and have not been utilized in de novo searches for
diagnostically useful antibody biomarkers.
We demonstrate here that microarrays displaying thousands
of peptoids (N-substituted oligoglycines; Simon et al., 1992)
can be used along with a differential screening strategy for the
simultaneous isolation of candidate IgG antibody biomarkers
and selective peptoid ligands able to pull them out of the blood.
In two mouse models it is shown that these peptoids are antigen
surrogates in the sense that they bind selectively to the anti-
bodies raised against the antigen employed to trigger the dis-
ease state. This methodology provides an unbiased approach
to the discovery of IgG serum biomarkers that does not require
prior knowledge of native antigens. In this report we describe
the development of this technology and its application to a
mouse model for multiple sclerosis. We also demonstrate that
the approach is applicable to the discovery of potentially useful
diagnostic biomarkers in humans through the discovery of
compounds that bind antibodies that are present at high levels
in the serum of patients with Alzheimer’s disease (AD).
RESULTS
Identification of Synthetic Ligands for EAE-SpecificAntibodies in MiceOur strategy for the unbiased isolation of synthetic molecule-
antibody complexes of diagnostic utility is depicted in Figure 1.
We hypothesized that if one exposed crude serum containing
the entire complement of circulating antibodies to a large library
of synthetic molecules immobilized on a microscope slide, each
antibody would, by chance, bind specifically to a few molecules
in the library with sufficient affinity and specificity to be retained
on the slide. This is the philosophy behind any protein-targeted
combinatorial library screening experiment. IgG antibody bind-
ing to the array could be visualized by subsequent addition of
a fluorescently labeled secondary antibody. Thus, the fluores-
cence intensity at each feature on the microarray would reflect
the amount of antibody retained by each compound. Because
the adaptive immune response results in the amplification of
B cells that recognize ‘‘foreign’’ antigens, the antibodies they
produce will be present at much higher levels in the blood of
array (indicated in red scale) after exposure to the autoimmune serum sample
than the healthy serum sample.
Cell 144, 132–142, January 7, 2011 ª2011 Elsevier Inc. 133

animals exposed to a particular antigen or with a particular
disease than in the blood of matched control animals. Therefore,
the features on the array to which they bind should ‘‘light up’’ to
a far greater extent than would be the casewhen serum obtained
from a control animal is hybridized to the array. If so, this would
allow the unbiased identification of synthetic ligands for anti-
bodies that are amplified in a particular immunological state.
This approach does not require any foreknowledge of the nature
of the antigens that drive the immune response. Note that this
strategy is not an attempt to obtain a ‘‘fingerprint’’ or ‘‘signature’’
of a disease state. Rather it is an unbiased high throughput
screen for a few specific antigen surrogates of diagnostic utility
in a large synthetic combinatorial library.
To explore this idea we employed microarrays comprised of
two copies each of 4608 octameric peptoids along with various
markers and control spots. The peptoid library (see Figure S1
available online) was synthesized using the split and pool
method (Alluri et al., 2003; Figliozzi et al., 1996). Methods em-
ployed to construct the peptoid microarrays have been reported
previously (Reddy and Kodadek, 2005). Although these mole-
cules share the a-amino acid backbone of peptides, they are
quite different otherwise, in that the side chains protrude from
the main chain nitrogen (sp2 hybridized) rather than the a carbon
(sp3 hybridized), giving them a completely different shape. More-
over, we employed a library of peptoids in which many of the
side chains did not resemble any of the 20 naturally occurring
amino acids (Figure S1). Therefore, the peptoid library repre-
sents a collection of molecular shapes that could not possibly
have been ‘‘seen’’ by the immune system in vivo and could not
mimic a native antigen closely.
Two C57BL/6 mice were immunized with complete Freund’s
adjuvant (CFA) and a peptide derived from myelin oligodendro-
cyte glycoprotein (Mog), whereas two additional mice were
injected with CFA alone as a control. The Mog-immunized ani-
mals develop a syndrome called experimental autoimmune
encephalomyelitis (EAE) that resembles human multiple scle-
rosis in some respects and is one of the most commonly used
animal models for this disease (Hauser, 2008; McFarland and
Martin, 2007). Serum samples were collected from the mice
36 days following immunization. They were then diluted several
thousand-fold to provide a final total serum protein concentra-
tion of 15 mg/ml and hybridized to the peptoid microarray. After
incubation and washing, the IgG-binding pattern was visualized
by subsequent incubation with an Alexa 647-labeled secondary
antibody. As a control, the secondary antibody alone was
exposed to the array, and any features that bound significant
amounts of the labeled secondary antibody were ignored in
subsequent analyses.
Figure 2A shows raw data from such an experiment. As ex-
pected, theMog peptide employed as the antigen, when spotted
onto the array as a positive control, captures large amounts of
IgG antibodies from the serum collected from Mog/CFA-immu-
nized mice, but not mice immunized with CFA alone. Several
peptoids were identified that were reproducibly (n = 3 arrays)
much brighter when exposed to theMog/CFA-immunized serum
than the CFA-immunized serum (an intensity of >40,000 versus
<10,000 at this particular serum protein concentration at these
instrument settings). One of these is highlighted in Figure 2A.
134 Cell 144, 132–142, January 7, 2011 ª2011 Elsevier Inc.
The peptoids, named anti-Mog antibody-binding peptoids 1–3
(AMogP1–3), that provided the highest level of discrimination
were sequenced by tandem mass spectrometry using soluble
peptoid from the well storing the solution used to spot onto the
glass slide. Their structures bear no obvious resemblance to
that of the peptide antigen (Figure 2 and Figure S2) and, in
fact, could not have because many of the building blocks em-
ployed to construct the peptoid library were not analogs of
natural amino acids (Figure S1).
Validation of AMogP1–3 as Specific DiagnosticBiomarkers for EAEA critical issue in any biomarker discovery effort is to test the
putative marker in a blinded fashion on subjects that were not
employed in the ‘‘training set’’ used to discover the marker in
the first place (Ransohoff, 2005). Therefore, the ability of pep-
toids AMogP1–3 to distinguish seven other Mog/CFA-immu-
nizedmice from seven other CFA-injected animals was analyzed
in a series of blinded experiments. None of these mice had been
used in the training set. As shown in Figure 3, all three peptoids
performed perfectly in distinguishing the Mog peptide-immu-
nized mice from the control mice. Figure 3A shows the quantifi-
cation of data obtained in three independent experiments
using ‘‘subarrays’’ (Figure 3B) that display AMogP1–3, the Mog
peptide antigen, and a negative control peptide using serum
obtained from mice 36 days following immunization with CFA
or CFA+Mog peptide (EAE). The negative control peptide, which
was used in all subsequent experiments, represents residues
1–11 of mouse myelin basic protein (MBP) (ASQKRPSQRSK).
This peptide was chosen as a control for antigen-specific cap-
ture of antibodies because immunization of mice with it can
also lead to EAE but through the production of different anti-
bodies and T cells (Hauser, 2008).
To test the selectivity of these peptoids for antibodies ampli-
fied in the Mog peptide-immunized mice, animals of the same
genetic background were immunized with CFA and a peptide
antigen derived from Ovalbumin (Ova; see Figure S2 for the
peptide sequence). Serum collected from these mice 36 days
after immunization displayed strong reactivity with the Ova
peptide antigen (Figure 3C). However, only background levels
of IgG antibody were captured by AMogP1–3 from this serum
sample (Figure 3C). To further test their selectivity, serum was
collected from B6 mice with systemic lupus erythematosus
(SLE) (Liu and Wakeland, 2001) and exposed to these peptoids.
Again, only background levels of antibodies were retained (Fig-
ure 3C). These data argue that the AMogP1–3 peptoids are
selective capture agents for antibodies produced in Mog/CFA-
immunized mice.
We next asked if the peptoids were capable of tracking the
development of the adaptive immune response that leads to
EAE. Serum samples were collected from a Mog peptide/CFA-
immunized mouse at various time points following antigen injec-
tion, and these serum samples were analyzed on a small subar-
ray displaying peptoids AMogP1–3, the Mog peptide antigen,
and the MBP-derived control peptide. As shown in Figure 4A,
little or no signal above background was observed on any
of the peptoids from the serum samples collected immedi-
ately prior to injection or 7 days later. However, by 14 days

Figure 2. Identification and Characterization of Peptoids that
Capture Antibodies Present at High Levels in Mog Peptide-Immu-
nized Mice
(A) Raw images of peptoid arrays hybridized with serum obtained fromCFA- or
CFA +Mog peptide-immunizedmice. About half of two arrays are shown at the
top. The sections of the arrays boxed in blue are blown up to highlight a region
displaying one of the peptoids (AMogP3) that clearly distinguished the CFA-
and CFA + Mog peptide-immunized mice. Images were obtained by incu-
bating serum from immunized mice with the array followed by addition of
fluorescently labeled (Alexa 647) Goat-anti Mouse IgG antibody. The intensity
of the fluorescence at each spot is displayed in a false-colored red scale in
postinjection, significant signal was seen on the peptoid fea-
tures, and by 21 days all three EAE-specific peptoids evinced
a strong signal (note that an intensity of 60,000–65,000 U repre-
sents saturation of the detector at these instrument settings).
This time course is in line with the expected kinetics of the devel-
opment of an adaptive immune response. The behavior of the
peptoids as ligands for the EAE-specific antibodies was similar
to that of the Mog peptide antigen, whereas the control peptoid
did not capture significant amounts of antibody at any time point.
We conclude that peptoids AMogP1–3 are capable ofmonitoring
the development of an adaptive immune response over time.
Characterization of the Peptoid-Binding AntibodiesGiven that the antibodies captured by the AMogP1–3 peptoids
arise over a time frame of 2–3 weeks following immunization
with the Mog peptide, it seems likely that they indeed capture
anti-Mog peptide antibodies, rather than antibodies directed
against some other antigen that might arise as a secondary
response to the developing autoimmune disease. To determine
if this is indeed the case, serum from Mog/CFA-immunized
mice was passed over an excess of Mog peptide coupled to
sepharose or a control peptide column. These sera were then
hybridized to a subarray that included AMogP1–3, Mog peptide,
and the control peptide. As shown in Figure 4B, depletion of the
anti-Mog antibodies from the serum of the Mog/CFA-immunized
mice abolished IgG antibody binding to the immobilized pep-
toids, whereas passage of the serum over the control column
resulted in strong binding of IgG antibody to the peptoids. As ex-
pected, the same result was observed when the level of anti-
bodies captured by theMog peptidewas analyzed.We conclude
that these peptoids bind to anti-Mog IgG antibodies.
Identification of Selective Ligands for Anti-Ova PeptideAntibodiesTo determine if this approach is useful to identify antibodies and
cognate peptoid ligands unique to other immunological states,
or if the EAE mice somehow represent a special case, we turned
to the Ova peptide/CFA-immunized mice. These mice are
healthy and are not afflicted with an autoimmune inflammatory
disease, as is the case in EAE. Using exactly the same methods
described above for the analysis of the Mog/CFA-immunized
mice, we identified three peptoids that captured much higher
levels of IgG antibodies from the serum of two Ova/CFA-
immunized animals than from two CFA-immunized controls
(Figure S3). These peptoids, called anti-Ova antibody-binding
which a white spot means the intensity is beyond the linear range of the
detector. The structure of AMogP3, the compound that is highlighted in
the pink box, is shown as its free form. Themolecule was tethered covalently to
the array via the cysteine sulfur that is included in all of the molecules in the
library.
(B) Quantitation of the fluorescence intensity measured at each of the three
peptoid (AMogP1–3) features on the array that discriminate CFA + Mog
peptide- from CFA-immunized mice. The error bars indicate the standard
deviation from the mean for three independent experiments. The general
structure of the library employed to make the array is shown in Figure S1. The
structures of the other two peptoids, AMogP2 and AMogP3, that distinguish
control and EAE mice are shown in Figure S2.
Cell 144, 132–142, January 7, 2011 ª2011 Elsevier Inc. 135

Figure 3. Validation of Peptoids AMogP1–3
as Capture Agents for EAE-Specific Anti-
bodies
(A) ‘‘Subarrays’’ containing only AMogP1–3, the
Mog peptide, and a MBP-derived negative control
peptide were created. Serum from seven Mog/
CFA-immunized and seven CFA-injected mice not
used in the previous experiments were analyzed
in a blinded fashion. The fluorescence intensity
observed at each feature is shown after unblinding
the sample identities. Shown is the mean ± stan-
dard deviation (SD) for samples run in triplicate.
(B) Raw images of subarrays containing the
AMogP1–3, control peptide, andMog peptide that
were incubated with serum from a Mog + CFA-
immunized mouse (left) or a CFA-immunized
mouse (right).
(C) Selectivity of peptoids for antibodies present in
Mog peptide-immunized mice. Subarrays con-
taining the AMogP1–3 peptoids, the Mog peptide,
the Ova peptide, and a control peptide were
exposed to serum from threemice immunized with
Ova peptide (Ova1–3) or three mice with SLE
(SLE1–3), followed by a fluorescently labeled
secondary antibody. The fluorescence intensities
at each feature are shown.
Mean ± SD for samples run in triplicate is shown.
Figure S2 displays the peptide sequences and
peptoid structures.
peptoids 1–3 (AOvaP1–3), were sequenced by tandem mass
spectrometry. Their structures are shown in Figure S2.
To further explore the utility of these putative biomarkers for
Ova peptide immunoreactivity, subarrays containing AOvaP1–3,
the Ova peptide antigen, and the control peptide were employed
in blinded experiments using serum obtained from eight OVA/
CFA-immunized and eight CFA-immunized mice not employed
in the training set 21 days after immunization. As shown in
Figures 5A and 5B, all three peptoids exhibited much higher
signals when exposed to serum collected from the OVA/CFA-
immunized mice than when exposed to serum for the CFA-
immunized mice.
The selectivity of the peptoids was tested by exposing them to
serum derived from Mog peptide-immunized animals or mice
with SLE. As shown in Figure 5C, very little cross-reactivity
136 Cell 144, 132–142, January 7, 2011 ª2011 Elsevier Inc.
between peptoids AOvaP1–3 and IgGs
in these serum samples was observed.
A time course experiment using serum
samples collected 0, 7, 14, or 21 days
after immunization with Ova peptide +
CFA or CFA alone was conducted. This
showed a buildup of antibodies that
recognize both the peptoids and the
Ova peptide over time. In this case
21dayswere required to observe a robust
response (Figure S4A). Finally, as shown
in Figure S4B, depletion of the anti-Ova
peptide antibodies from the serum
of the Ova/CFA-immunized mice by
passage over immobilized Ova peptide
largely abolished IgG antibody binding to the peptoids, whereas
passage of the serum over an immobilized control peptide did
not. This argues that the peptoids recognize anti-Ova peptide
antibodies.
Discovery of Candidate IgG Biomarkers for Alzheimer’sDiseaseIt was important to determine if the protocol described above is
capable of identifying potentially useful diagnostic antibody-
peptoid pairs for a human disease state. To address this point
we undertook an effort to search for IgG antibodies that are en-
riched in the serum of patients with AD. AD is the most common
form of dementia and is a rapidly growing problem in the devel-
oped world due to the aging of the population. Although careful
clinical examination conducted by an expert, combined with

Figure 4. Peptoids AMogP1–3 Capture Anti-Mog Peptide Antibodies
Resulting from an Adaptive Immune Response
(A) Level of IgG antibody captured by the peptoids as a function of time after
immunization. Subarrays displaying the molecules indicated were incubated
with serum collected from mice at the indicated times after immunization with
Mog peptide + CFA, followed by fluorescently labeled secondary antibody.
The amount of fluorescence captured at each feature is shown.
(B) Effect of depletion of anti-Mog peptide antibodies on the amount of IgG
antibodies captured by the peptoids. Serum from Mog peptide + CFA-
immunized mice was passed over columns displaying either excess Mog
peptide or a control peptide. These Mog-depleted or mock-depleted serum
samples were then hybridized to a subarray displaying AMogP1–3, Mog
peptide, and a control molecule. After subsequent hybridization with labeled
secondary antibody, the signal intensities were recorded and plotted. Mean ±
SD for samples run in triplicate is shown.
radiological scans, is a reasonably effective method with which
to diagnose the disease, the only unequivocal protocol for the
diagnosis of AD is a postmortem autopsy of the brain (Hampel
et al., 2010). To our knowledge, no blood test for this disease
has yet been reported (Blennow et al., 2010), though an increase
in the serum protein clusterin has recently been reported to
accompany AD (Thambisetty et al., 2010).
Using the same procedure described above for the EAE mice,
serum samples from six patients with AD (McKhann et al., 1984)
(three of which were autopsy confirmed; see Table S1 for clinical
parameters) were analyzed using peptoidmicroarrays displaying
approximately 15,000 peptoids. Each sample was analyzed in
triplicate. The same procedure was carried out with serum
samples obtained from six age-matched, nondemented control
individuals (NC23-28, see Table S1). To attempt to ensure spec-
ificity for AD, we also analyzed six serum samples obtained from
patients with Parkinson’s disease (PD) (Gelb et al., 1999) as well.
After measuring the signal level on each spot of each array, three
peptoids were chosen that best distinguished the patients with
AD from the controls. These peptoids captured at least 3-fold
more IgG antibody from all six of the patients with AD than any
of the control subjects (Figure 6) or patients with PD (Figure 7A).
The structures of the three peptoids were deduced by tandem
mass spectrometry and are shown in Figure 6. They were named
AD peptoids (ADP) 1–3.
To further test these three peptoids as potential capture
agents for AD-specific antibodies, subarrays displaying resyn-
thesized and HPLC-purified ADPs1–3 as well as controls were
employed to analyze serum samples obtained from 16 different
patients with AD, 16 new controls, and samples from six patients
with lupus. These experiments were conducted in a blinded
fashion. When the samples were unblinded, the data showed
that peptoids ADP1–3 captured much more IgG antibodies
from the patients with AD than 14 of the control individuals (Fig-
ure 6) or the six patients with lupus (Figure 7A). Two of the control
individuals (NC31 and NC41) displayed an unusually high level of
antibodies that cross-react with each of the three ADPs. This
level was comparable to that found in the serum of patient 15
with AD, who exhibited the lowest levels of peptoid-reactive anti-
bodies from the AD set. Overall, for the AD versus NC subjects,
the sensitivity was 93.7% for each of the peptoids, and speci-
ficity was from 93.7% to 100%. The positive and negative
predictive values were greater than 93% for each of the pep-
toids, and the accuracy ranged from 93% to 96%. Finally, the
area under the curve for each of the three peptoids was 0.99 ±
0.01 (see Figure S5, and Table S2, Table S3, Table S4, Table
S5, and Table S6 for a full statistical analysis).
The fluorescent intensities of the ADP1–3 spots on the subar-
rays employed for these experiments were at or near the satura-
tion point for the detector. To ensure that we were close to the
linear range, measurements were redone at different serum
protein concentrations. As shown in Figure S6A, the sample
from a patient with AD demonstrated concentration-dependent
signals that saturated at a total serum protein concentration of
15 mg/ml, the concentration employed for all of the experiments
whose results are shown in Figure 6 and Figure 7. The intensity of
the signal was also linear at different photomultiplier tube gains
on the scanner (Figure S6B). We conclude that the ratios of the
peptoid-binding antibodies in case and control samples pre-
sented in Figure 6 represent a valid quantitative comparison.
To determine if peptoids ADP1, 2, and 3 bind the same anti-
bodies, serum from one of the patients with autopsy-confirmed
AD was passed repeatedly over a column containing immobi-
lized ADP1 in order to completely deplete the sample of anti-
bodies that bind to this peptoid. As a control, the same proce-
dure was done using a column displaying a control peptide
(MBP Ac1-11; see Figure S2 for sequence). The serum was
then exposed to a subarray displaying ADP1–3, and the level
of IgG antibodies captured by each peptoid from the ADP1-
depleted andmock-depleted samples wasmeasured. As shown
in Figure 7B, immobilized ADP1 bound high levels of antibody
from the mock-depleted AD sample, but almost no IgG was
captured from the ADP1-depleted sample, as expected. Deple-
tion of the ADP1-binding antibodies also reduced the amount of
IgG captured by ADP3 to background levels, arguing that these
Cell 144, 132–142, January 7, 2011 ª2011 Elsevier Inc. 137
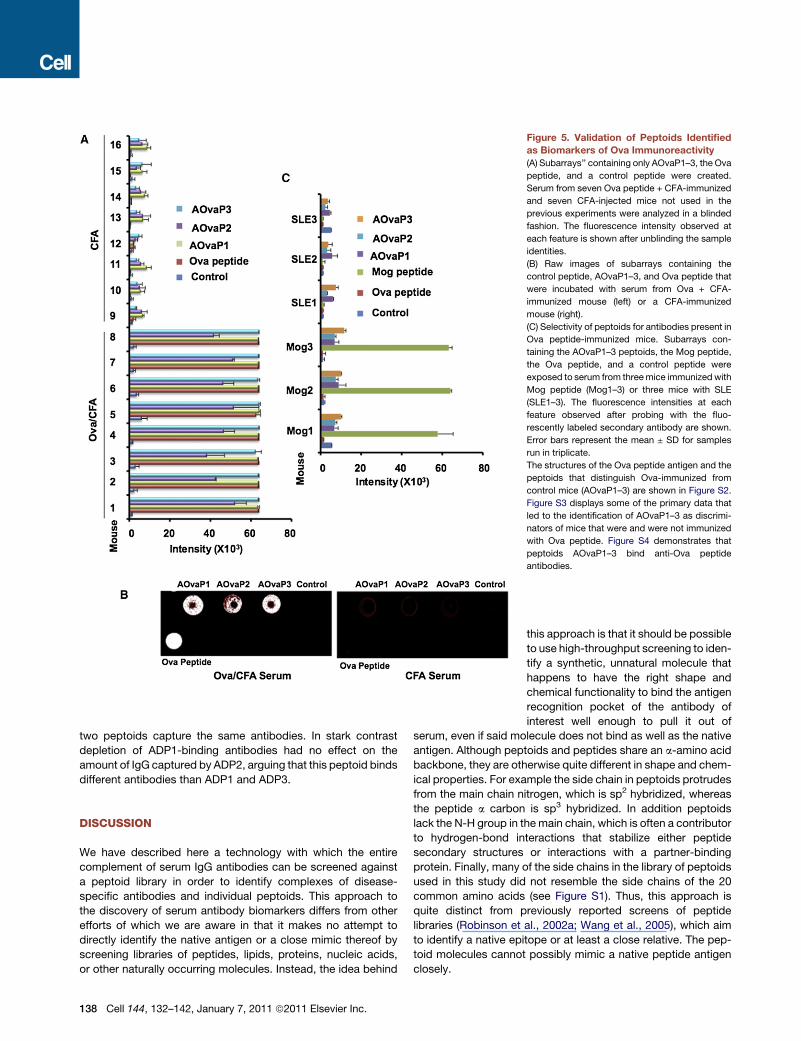
Figure 5. Validation of Peptoids Identified
as Biomarkers of Ova Immunoreactivity
(A) Subarrays’’ containing only AOvaP1–3, the Ova
peptide, and a control peptide were created.
Serum from seven Ova peptide + CFA-immunized
and seven CFA-injected mice not used in the
previous experiments were analyzed in a blinded
fashion. The fluorescence intensity observed at
each feature is shown after unblinding the sample
identities.
(B) Raw images of subarrays containing the
control peptide, AOvaP1–3, and Ova peptide that
were incubated with serum from Ova + CFA-
immunized mouse (left) or a CFA-immunized
mouse (right).
(C) Selectivity of peptoids for antibodies present in
Ova peptide-immunized mice. Subarrays con-
taining the AOvaP1–3 peptoids, the Mog peptide,
the Ova peptide, and a control peptide were
exposed to serum from threemice immunized with
Mog peptide (Mog1–3) or three mice with SLE
(SLE1–3). The fluorescence intensities at each
feature observed after probing with the fluo-
rescently labeled secondary antibody are shown.
Error bars represent the mean ± SD for samples
run in triplicate.
The structures of the Ova peptide antigen and the
peptoids that distinguish Ova-immunized from
control mice (AOvaP1–3) are shown in Figure S2.
Figure S3 displays some of the primary data that
led to the identification of AOvaP1–3 as discrimi-
nators of mice that were and were not immunized
with Ova peptide. Figure S4 demonstrates that
peptoids AOvaP1–3 bind anti-Ova peptide
antibodies.
two peptoids capture the same antibodies. In stark contrast
depletion of ADP1-binding antibodies had no effect on the
amount of IgG captured by ADP2, arguing that this peptoid binds
different antibodies than ADP1 and ADP3.
DISCUSSION
We have described here a technology with which the entire
complement of serum IgG antibodies can be screened against
a peptoid library in order to identify complexes of disease-
specific antibodies and individual peptoids. This approach to
the discovery of serum antibody biomarkers differs from other
efforts of which we are aware in that it makes no attempt to
directly identify the native antigen or a close mimic thereof by
screening libraries of peptides, lipids, proteins, nucleic acids,
or other naturally occurring molecules. Instead, the idea behind
138 Cell 144, 132–142, January 7, 2011 ª2011 Elsevier Inc.
this approach is that it should be possible
to use high-throughput screening to iden-
tify a synthetic, unnatural molecule that
happens to have the right shape and
chemical functionality to bind the antigen
recognition pocket of the antibody of
interest well enough to pull it out of
serum, even if said molecule does not bind as well as the native
antigen. Although peptoids and peptides share an a-amino acid
backbone, they are otherwise quite different in shape and chem-
ical properties. For example the side chain in peptoids protrudes
from the main chain nitrogen, which is sp2 hybridized, whereas
the peptide a carbon is sp3 hybridized. In addition peptoids
lack the N-H group in themain chain, which is often a contributor
to hydrogen-bond interactions that stabilize either peptide
secondary structures or interactions with a partner-binding
protein. Finally, many of the side chains in the library of peptoids
used in this study did not resemble the side chains of the 20
common amino acids (see Figure S1). Thus, this approach is
quite distinct from previously reported screens of peptide
libraries (Robinson et al., 2002a; Wang et al., 2005), which aim
to identify a native epitope or at least a close relative. The pep-
toid molecules cannot possibly mimic a native peptide antigen
closely.

Figure 6. Peptoids that Retain Antibodies from the Serum of Patients with Alzheimer’s Disease
A peptoid library was screened for ligands to AD-specific IgG antibodies. The structures of the three best peptoids that were found to discriminate age-matched
controls and patients with AD are shown in the top right. The levels of antibodies retained from the indicated serum samples in subsequent subarray experiments
are shown on the left. The numbers indicate a patient identifier (e.g., AD1 or NC9; only every other number is shown). The samples employed in the training
sets are labeled as such (AD Train and NC Train), as are the samples employed in blinded test studies. NC, normal control. The error bars indicate the mean ± SD
for samples run in triplicate. See text for details. Table S2, Table S3, Table S4, Table S5, and Table S6, and Figure S5 present a detailed statistical analysis of
these data as well as those shown in Figure 7A. Figure S6 demonstrates that the intensities shown in this figure represent the high end of the linear range of the
assay.
As shown schematically in Figure 1, this type of screening was
done using a microarray format that allowed comparison of the
binding of antibodies from case and control serum samples to
thousands of peptoids. Molecules that retained far more IgG
antibody from the case samples were considered candidate
capture agents for IgG antibodies highly enriched in the disease
Cell 144, 132–142, January 7, 2011 ª2011 Elsevier Inc. 139

Figure 7. Peptoids ADP1–3 Bind Two Different Antibodies that Are
Present in the Serum of Patients with Alzheimer’s Disease, but NotPatients with PD or Lupus (SLE)
(A) Comparison of levels of IgG antibodies captured by peptoids ADP1–3 from
serum samples collected from a patient with AD (individual 1), a normal control
(individual 23), or patients with PD or lupus (SLE).
(B) Serum from a patient with autopsy-confirmed AD was passed repeatedly
over immobilized ADP1 or, as a control, an irrelevant peptide. The serum
samples were then diluted and hybridized to subarrays displaying peptoids
ADP1–3. The amount of antibody captured by each peptoid was measured.
Shown is the mean ± SD for samples run in triplicate. Table S2, Table S3,
Table S4, Table S5, and Table S6, and Figure S5 present a detailed statistical
analysis of these data as well as those shown in Figure 6.
state of interest. This protocol was first employed to test if pep-
toids could be identified that capture antibodies that distinguish
between healthy mice and animals with EAE. The same analysis
was applied tomice immunized with a peptide derived fromOva.
In each case three peptoids, called AMogP1–3 and AOvaP1–3,
respectively, were identified that captured high levels of IgG anti-
body from the serum of the immunized animals, but not the con-
trol animals. As must have been the case (see above), the pep-
toids bear no obvious resemblance to the Mog and Ova
peptide antigens, respectively (Figure S2), even though it was
demonstrated that these molecules indeed bind the antibodies
raised against the peptide antigens (Figure 4 and Figure S4).
Subsequent validation studies with samples obtained from mice
not used in the training set validated these peptoids as excellent
capture agents for antibodies unique to theEAEandOvapeptide-
immunized mice, respectively (Figure 3 and Figure 5).
140 Cell 144, 132–142, January 7, 2011 ª2011 Elsevier Inc.
Of course the more important question is whether this
approach is relevant to the discovery of peptoid-antibody
complexes that might be of utility in medical diagnostics.
Although the mouse work was encouraging and proved the
principle of using libraries of unnatural molecules to search for
autoantibody ligands, this study employed relatively homoge-
neous laboratory mice and simple, single-antigen immunization
models. The greater immunological diversity between different
people than between different laboratory mice might complicate
the application of this technology to the discovery of biomarkers
for human disease. To address this important question, we
carried out a preliminary study of serum samples collected
from patients with AD. It has been reported that patients with
AD have lower levels of serum anti-amyloid antibodies than
healthy individuals (Weksler et al., 2002). Although this difference
is not sufficient to act as the basis of a diagnostic test, it does
suggest the possibility of finding more useful antibody markers
of the disease. Peptoid libraries were screened using serum
samples from six patients with AD (three autopsy confirmed),
six matched control individuals, and six patients with PD. Three
peptoids were identified that captured at least 3-fold higher
levels of IgG antibodies from all six of the patients with AD
than any of the controls or patients with PD (Figure 6 and Fig-
ure 7). The structures of these peptoids are shown in Figure 6.
Depletion of ADP1-binding antibodies from the serum of AD
samples demonstrated that ADP1 and ADP3 bind the same
IgG antibodies, whereas ADP2 binds different antibodies (Fig-
ure 7B). Thus, we have discovered at least two candidate auto-
antibody biomarkers for AD.
Subsequent blinded studies were conducted using samples
frommore patients with AD, controls (see Table S1), and patients
with a different disease (lupus) to test the utility of the peptoids
identified in the original screen. These ‘‘validation samples’’
were not employed in the training set and, thus, constitute
a fair and critical test of the utility of the peptoid-antibody
complexes as biomarkers (Ransohoff, 2005). Once unblinded,
the data (Figure 6 and Figure 7) showed that these peptoid anti-
body complexes are indeed highly promising biomarkers for the
diagnosis of AD (see Figure S5 and Table S2, Table S3, Table S4,
Table S5, and Table S6 for the results of a comprehensive statis-
tical analysis).
Two of the control individuals displayed a relatively high level
of the AD antibodies (NC31 and 41), similar to that seen in the
patient with AD with the lowest levels of antibodies (AD15) (Fig-
ure 6). The individual fromwhom the NC31 sample was collected
is a 75-year-old female with a mini-mental state examination
(MMSE) score (McKhann et al., 1984) of 29 out of a possible 30
and without obvious clinical signs of AD (Table S1). The NC41
sample was from a 65-year-old female with the same MMSE
score. These may represent examples of false positives, for
example due to the cross-reaction of non-AD associated anti-
bodies with these peptoids, or could represent presymptomatic
detection of developing disease. Because these samples con-
tained high levels of antibodies that bind to ADP2 as well as anti-
bodies that bind to ADP1 and ADP3, we favor the latter hypoth-
esis, but this cannot be concluded with certainty.
The development of a simple blood test for AD is an important
unrealized goal (Blennow et al., 2010). This preliminary study is

promising in that it represents a high level of diagnostic sensi-
tivity and specificity (Saah and Hoover, 1997), at least within
the relatively limited range of samples analyzed. However, it is
important to point out that more work will be required before it
is clear whether the peptoids ADP1–3 will be useful reagents
for the clinical diagnosis of AD. First, the analysis of a larger
number of patient samples derived from a more diverse popula-
tion will be required. Second, it will be important to test samples
collected from patients with mild cognitive impairment (MCI)
that subsequently progressed to AD because early detection
of developing disease is an important clinical goal. Third, all of
the measurements done in this study were conducted on a mi-
croarray platform that may not be easily employed in a clinical
setting, so optimized conditions for using the peptoids on other
analytical platforms will have to be developed. Fourth, if these
biomarkers are indeed validated, then it will be of great interest
to identify the native antigens that they recognize. Studies to
address all of these issues are in progress. The experiments in
this paper were designed solely to address the issue of whether
this technology is applicable to the discovery of biomarker
candidates for human disease. We conclude that this is indeed
the case.
In summary, we have developed and validated a technology
based on parallel screens of synthetic combinatorial libraries
for the discovery of IgG biomarkers and simple, synthetic
capture agents capable of retaining them from serum. We
believe that this technology will have a significant impact on
the development of diagnostic tests for a variety of important
diseases.
EXPERIMENTAL PROCEDURES
General Remarks
All chemicals and solvents were purchased from commercial suppliers and
used without further purification. Secondary antibodies were obtained from
Molecular Probes (Goat anti-mouse IgG—Alexa 647) and Goat anti-mouse-
RPE (Invitrogen). The slides were scanned using GenePix Autoloader
4200AL scanner (Molecular Devices, Sunnyvale, CA, USA) at 10 mm resolution
using 635 nm laser at 100% power and 650 photomultiplier tube gain. All the
scanned images were analyzed by the GenePix Pro 6.0 software (Axon Instru-
ments, Union City, CA, USA).
Peptoid Library Synthesis and Microarray Construction
General protocols for the creation of peptoid libraries and peptoid-displaying
microarrays have been published previously (Alluri et al., 2003; Figliozzi et al.,
1996; Olivos et al., 2002; Reddy and Kodadek, 2005). A detailed protocol for
the creation of the particular libraries and arrays used in this study is provided
in the Extended Experimental Procedures.
Animal Experiments
C57BL/6 mice were purchased from Jackson Laboratory (Bar Harbor, ME,
USA) and bred and maintained in a federally approved animal facility at the
University of Texas Southwestern Medical Center (Dallas, TX, USA) in accor-
dancewith the regulations of the Institutional Animal Care andUseCommittee.
All mice were between 7 and 10 weeks of age when the experiments were
initiated.
For actively induced EAE and OVA immunizations, 30 female C57BL/6 mice
were injected subcutaneously (s.c.) at four sites over the flanks and shoulders
with 200 mg MOG 35–55 peptide (MEVGWYRSPFSRVVHLYRNGK) (CS Bio,
Menlo Park, CA, USA) or OVA 323–339 peptide (ISQAVHAAHAEINEAGR)
(University of Texas Southwestern Medical Center, Dallas, TX, USA) in an
emulsion with CFA (Difco, Detroit, MI, USA). For control experiments, mice
were injected with CFA alone. Pertussis toxin (200 ng/mouse) (List Biological
Laboratories) was injected i.p. at the time of immunization and 48 hr later to
enhance the upregulation of adhesion molecules and to facilitate blood brain
barrier breakdown. Mice were scored on a scale of 0–6: 0, no clinical disease;
1, limp/flaccid tail; 2, moderate hind limb weakness; 3, severe hind limb weak-
ness; 4, complete hind limb paralysis; 5, quadriplegia or premoribund state; 6,
death.
Retro-orbital bleeds were performed every 7 days following immunization,
starting at day 0 and continuing to day 50 post-immunization on mice in all
groups (OVA, MOG, and CFA). Serum was collected by centrifugation and
frozen at �20�C until used.
Array Analysis of Serum Samples
Peptoid slides were covered with a hybridization chamber and equilibrated
with TBST (50 mM Tris [pH 8.0], 150 mM NaCl, 0.1% Tween 20) for 15 min.
The slides were then blocked with 1 ml of blocking buffer for 1 hr at 4�C.The blocking buffer was removed, and the slides were incubated with 1 ml
of serum (adjusted to 15 mg/ml of total protein) for 18 hr at 4�C with gentle
shaking. Microarrays were then washed three times with TBST and hybridized
with Alexa 647-labeled Goat anti-mouse antibody (1:400 dilution) for 2 hr on an
orbital shaker at 4�C. The chamber cassettes were removed from the microar-
ray slides and washed with TBST (3 3 15 ml), followed by 0.13 TBST (1 3
10 ml). The slides were then dried on a centrifuge (5 min at 1500 rpm) and
scanned on a microarray scanner (GenePix Autoloader 4200 from TeleChem
International, Inc., Sunnyvale, CA, USA) by using the 635 nm laser at 100%
power and a 650 photomultiplier tube gain. All the scanned images were
analyzed using GenePix Pro 6.0 (Axon Instruments, Union City, CA, USA)
and GeneSpring software (Silicon Genetics, Redwood City, CA, USA).
The experiments were done in triplicate, and each group of three included
slides printed in different batches to avoid bias due to batch-to-batch differ-
ences in the slides. TheGenePix Results (GPRs) were generated by usingGen-
ePix Pro 6.0 software. Local background subtracted median (F635 Median-
B635) spot intensities were used for further analysis. These signal intensities
were used for downstream analysis using GeneSpring software. All the
GPRs were loaded onto the GeneSpring, and only features that gave greater
than 40,000 signal intensity in immunized mice and less than 10,000 in control
mice were selected and saved to the results’ folder. These results were trans-
ferred to the Excel, and peptoids with the highest signal intensity differential
and reproducibility in all of the experiments were selected for further testing.
The same criteria were used to analyze all the test experiments on a subarray.
Analysis of Human Serum Samples
The human serum samples were analyzed in exactly the same way as
described for the mouse serum samples, except that the serum was diluted
to a total protein concentration of 15 mg/ml prior to hybridization to the array.
Amouse anti-human secondary antibody was employed tomonitor the level of
human IgG captured on a spot.
Depletion of Mog Peptide-Binding Antibodies from the Serum
All the reagents were allowed to equilibrate to room temperature. The resin
from the SulfoLink immobilization kit for peptides (Thermo Scientific Inc.;
44999) was suspended by rocking and then the column was placed in
a 15 ml tube and centrifuged at 1000 rpm for 1 min to remove the storage
buffer. The column was equilibrated by adding 2ml of coupling buffer followed
by centrifugation. Peptide (1 mg) was dissolved in 2 ml of coupling buffer and
added to the column. The top and bottom caps were replaced, and the resin
was mixed by rotating the column end over end at room temperature for
15 min. The column was placed upright and incubated for 30 min at room
temperature without mixing. The top and bottom caps were removed, and
the column was placed into a new 15 ml tube and centrifuged at 1000 rpm
for 1 min to collect the nonbound peptide. The column was washed by adding
2ml of wash solution, followed by centrifugation. This step was repeated three
times for a total of four washes. The column was washed again by adding 2 ml
of coupling buffer, and the column was then centrifuged. This was repeated
once for a total of two washes. L-cysteine-HCL (15.8 mg) was dissolved in
2 ml of coupling buffer (50 mM cysteine), and the solution was added to the
column. The resin was mixed for 15 min at room temperature, then incubated
Cell 144, 132–142, January 7, 2011 ª2011 Elsevier Inc. 141

for 30 min without mixing. The top cap was removed first and then the bottom
cap to allow the column to drain. The column was centrifuged at 1000 rpm for
1 min to remove the nonbound cysteine. The column was washed with 2 ml of
13 TBST, and serum sample was added to the column. After the serum
sample entered the resin bed, the top and bottom caps were replaced, and
the columnwas incubated for 60min at room temperature. The top and bottom
caps were removed, and the column was centrifuged to collect the flow-
through serum. Finally, the resin was washed by adding 2 ml of binding/
wash buffer.
SUPPLEMENTAL INFORMATION
Supplemental Information includes Extended Experimental Procedures, six
figures, and six tables and can be found with this article online at doi:10.
1016/j.cell.2010.11.054.
ACKNOWLEDGMENTS
We thank Drs. Mike Racke, Amy Lovett-Racke, and Ward Wakeland for
contributing EAE and SLE samples in the early phase of this project. We thank
Kristin Martin-Cook of the UT Southwestern Medical Center’s Alzheimer’s
Disease Center for selecting the normal and AD serum samples for analysis
and Dr. Padraig O’Suilleabhain for diagnosis and collection of the PD serum
samples. This work was supported by an NIH Director Pioneer Award to T.K.
(DP1OD000663) and the NHLBI Proteomics Initiative of the National Heart,
Lung & Blood Institute, National Institutes of Health (contract No. NO1-HV-
28185). Human serum sample collection was supported by grant NIH grant
AG12300.
Received: February 25, 2010
Revised: August 4, 2010
Accepted: November 19, 2010
Published: January 6, 2011
REFERENCES
Alluri, P.G., Reddy, M.M., Bacchawat-Sikder, K., Olivos, H.J., and Kodadek, T.
(2003). Isolation of protein ligands from large peptoid libraries. J. Am. Chem.
Soc. 125, 13995–14004.
Anderson, K.S., and LaBaer, J. (2005). The sentinel within: exploiting the
immune system for cancer biomarkers. J. Proteome Res. 4, 1123–1133.
Blennow, K., Hampel, H., Weiner, M., and Zetterberg, H. (2010). Cerebrospinal
fluid and plasma biomarkers in Alzheimer disease. Nat. Rev. Neurol. 6,
131–144.
Fathman, C.G., Soares, L., Chan, S.M., and Utz, P.J. (2005). An array of possi-
bilities for the study of autoimmunity. Nature 435, 605–611.
Figliozzi, G.M., Goldsmith, R., Ng, S.C., Banville, S.C., and Zuckermann, R.N.
(1996). Synthesis of N-substituted glycine peptoid libraries. Methods Enzymol.
267, 437–447.
Frulloni, L., Lunardi, C., Simone, R., Dolcino, M., Scattolini, C., Falconi, M.,
Benini, L., Vantini, I., Corrocher, R., and Puccetti, A. (2009). Identification of
a novel antibody associated with autoimmune pancreatitis. N. Engl. J. Med.
361, 2135–2142.
Gelb, D.J., Oliver, E., and Gilman, S. (1999). Diagnostic criteria for Parkinson
disease. Arch. Neurol. 56, 33–39.
Gibson, D.S., Banha, J., Penque, D., Costa, L., Conrads, T.P., Cahill, D.J.,
O’Brien, J.K., and Rooney, M.E. (2010). Diagnostic and prognostic biomarker
discovery strategies for autoimmune disorders. J. Proteomics 73, 1045–1060.
Hampel, H., Frank, R., Broich, K., Teipel, S.J., Katz, R.G., Hardy, J., Herholz,
K., Bokde, A.L., Jessen, F., Hoessler, Y.C., et al. (2010). Biomarkers for Alz-
heimer’s disease: academic, industry and regulatory perspectives. Nat. Rev.
Drug Discov. 9, 560–574.
142 Cell 144, 132–142, January 7, 2011 ª2011 Elsevier Inc.
Hauser, S.L. (2008). Multiple lessons for multiple sclerosis. N. Engl. J. Med.
359, 1838–1841.
Hudson, M.E., Pozdnyakova, I., Haines, K., Mor, G., and Snyder, M. (2007).
Identification of differentially expressed proteins in ovarian cancer using
high-density protein microarrays. Proc. Natl. Acad. Sci. USA 104, 17494–
17499.
Kanter, J.L., Narayana, S., Ho, P.P., Catz, I., Warren, K.G., Sobel, R.A., Stein-
man, L., and Robinson, W.H. (2006). Lipid microarrays identify key mediators
of autoimmune brain inflammation. Nat. Med. 12, 138–143.
Knittelfelder, R., Riemer, A.B., and Jensen-Jarolim, E. (2009). Mimotope vacci-
nation—from allergy to cancer. Expert Opin. Biol. Ther. 9, 493–506.
Liu, K., andWakeland, E.K. (2001). Delineation of the pathogenesis of systemic
lupus erythematosus by using murine models. Adv. Exp. Med. Biol. 490, 1–6.
Lueking, A., Possling, A., Huber, O., Beveridge, A., Horn, M., Eickoff, H., Schu-
chardt, J., Lehrach, H., and Cahill, D.J. (2003). A non-redundant human protein
chip for antibody screening and serumprofiling. Mol. Cell. Proteomics 2, 1342–
1349.
McFarland, H.F., and Martin, R. (2007). Multiple sclerosis: a complicated
picture of autoimmunity. Nat. Immunol. 8, 913–919.
McKhann, G., Drachman, D., Folstein, M., Katzman, R., Price, D., and Stadlan,
E.M. (1984). Clinical diagnosis of Alzheimer’s disease: report of the NINCDS-
ADRDA Work Group under the auspices of Department of Health and Human
Services Task Force on Alzheimer’s Disease. Neurology 34, 939–944.
Olivos, H.J., Alluri, P.G., Reddy, M.M., Saloney, D., and Kodadek, T. (2002).
Microwave-assisted solid phase synthesis of peptoids. Org. Lett. 4, 4057–
4059.
Ransohoff, D.F. (2005). Lessons from controversy: ovarian cancer screening
and serum proteomics. J. Natl. Cancer Inst. 97, 315–319.
Reddy, M.M., and Kodadek, T. (2005). Protein ‘‘fingerprinting’’ in complex
mixtures with peptoid microarrays. Proc. Natl. Acad. Sci. USA 102, 12672–
12677.
Robinson, W.H., Steinman, L., and Utz, P.J. (2002a). Protein and peptide array
analysis of autoimmune disease. Biotechniques, 66–69.
Robinson, W.H., DiGennaro, C., Hueber, W., Haab, B., Kamachi, M., Dean, E.,
Fournel, S., Fong, D., Genovese, M.C., de Vegvar, H., et al. (2002b). Antigen
arrays for multiplex characterization of autoantibody responses. Nat. Med.
8, 295–301.
Saah, A.J., and Hoover, D.R. (1997). ‘‘Sensitivity’’ and ‘‘specificity’’ reconsid-
ered: the meaning of these terms in analytical and diagnostic settings. Ann.
Intern. Med. 126, 91–94.
Simon, R.J., Kania, R.S., Zuckermann, R.N., Huebner, V.D., Jewell, D.A., Ban-
ville, S., Ng, S.,Wang, L., Rosenberg, S., Marlowe, C.K., et al. (1992). Peptoids:
a modular approach to drug discovery. Proc. Natl. Acad. Sci. USA 89, 9367–
9371.
Steller, S., Angenendt, P., Cahill, D.J., Heuberger, S., Lehrach, H., and Kreutz-
berger, J. (2005). Bacterial protein microarrays for identification of new poten-
tial diagnostic markers for Neisseria meningitidis infections. Proteomics 5,
2048–2055.
Thambisetty, M., Simmons, A., Velayudhan, L., Hye, A., Campbell, J., Zhang,
Y., Wahlund, L.O., Westman, E., Kinsey, A., Guntert, A., et al. (2010). Associ-
ation of plasma clusterin concentration with severity, pathology, and progres-
sion in Alzheimer disease. Arch. Gen. Psychiatry 67, 739–748.
Wang, X., Yu, J., Sreekumar, A., Varambally, S., Shen, R., Giachero, D., Mehra,
R., Montie, J.E., Pienta, K.J., Sanda, M.G., et al. (2005). Autoantibody signa-
tures in prostate cancer. N. Engl. J. Med. 353, 1224–1235.
Weksler, M.E., Relkin, N., Turkenich, R., LaRusse, S., Zhou, L., and Szabo, P.
(2002). Patients with Alzheimer disease have lower levels of serum anti-
amyloid peptide antibodies than healthy elderly individuals. Exp. Gerontol.
37, 943–948.