
IDEAL-Q: An automated tool for label-free quantitation analysis using an efficient peptide alignment...
14
IDEAL-Q, an Automated Tool for Label-free Quantitation Analysis Using an Efficient Peptide Alignment Approach and Spectral Data Validation* □ S Chih-Chiang Tsou‡, Chia-Feng Tsai§, Ying-Hao Tsui‡, Putty-Reddy Sudhir¶, Yi-Ting Wang§, Yu-Ju Chen§, Jeou-Yuan Chen¶, Ting-Yi Sung‡, and Wen-Lian Hsu‡** In this study, we present a fully automated tool, called IDEAL-Q, for label-free quantitation analysis. It accepts raw data in the standard mzXML format as well as search results from major search engines, including Mascot, SE- QUEST, and X!Tandem, as input data. To quantify as many identified peptides as possible, IDEAL-Q uses an efficient algorithm to predict the elution time of a peptide uniden- tified in a specific LC-MS/MS run but identified in other runs. Then, the predicted elution time is used to detect peak clusters of the assigned peptide. Detected peptide peaks are processed by statistical and computational methods and further validated by signal-to-noise ratio, charge state, and isotopic distribution criteria (SCI valida- tion) to filter out noisy data. The performance of IDEAL-Q has been evaluated by several experiments. First, a seri- ally diluted protein mixed with Escherichia coli lysate showed a high correlation with expected ratios and dem- onstrated good linearity (R 2 0.996). Second, in a biolog- ical replicate experiment on the THP-1 cell lysate, IDE- AL-Q quantified 87% (1,672 peptides) of all identified peptides, surpassing the 45.7% (909 peptides) achieved by the conventional identity-based approach, which only quantifies peptides identified in all LC-MS/MS runs. Man- ual validation on all 11,940 peptide ions in six replicate LC-MS/MS runs revealed that 97.8% of the peptide ions were correctly aligned, and 93.3% were correctly vali- dated by SCI. Thus, the mean of the protein ratio, 1.00 0.05, demonstrates the high accuracy of IDEAL-Q without human intervention. Finally, IDEAL-Q was applied again to the biological replicate experiment but with an additional SDS-PAGE step to show its compatibility for label-free experiments with fractionation. For flexible workflow de- sign, IDEAL-Q supports different fractionation strategies and various normalization schemes, including multiple spiked internal standards. User-friendly interfaces are provided to facilitate convenient inspection, validation, and modification of quantitation results. In summary, IDEAL-Q is an efficient, user-friendly, and robust quanti- tation tool. It is available for download. Molecular & Cellular Proteomics 9:131–144, 2010. Quantitative analysis of protein expression promises to pro- vide fundamental understanding of the biological changes or biomarker discoveries in clinical applications. In recent years, various stable isotope labeling techniques, e.g. ICAT (1), en- zymatic labeling using 18 O/ 16 O (2, 3), stable isotope labeling by amino acids in cell culture (4), and isobaric tagging for relative and absolute quantitation (2, 5), coupled with LC- MS/MS have been widely used for large scale quantitative proteomics. However, several factors, such as the limited number of samples, the complexity of procedures in isotopic labeling experiments, and the high cost of reagents, limit the applicability of isotopic labeling techniques to high through- put analysis. Unlike the labeling approaches, the label-free quantitation approach quantifies protein expression across multiple LC-MS/MS analyses directly without using any label- ing technique (7–9). Thus, it is particularly useful for analyzing clinical specimens in highly multiplexed quantitation (10, 11); theoretically, it can be used to compare any number of sam- ples. Despite these significant advantages, data analysis in label-free experiments is an intractable problem because of the experimental procedures. First, although high reproduc- ibility in LC is considered a critical prerequisite, variations, including the aging of separation columns, changes in sample buffers, and fluctuations in temperature, will cause a chro- matographic shift in retention time for analytes in different LC-MS/MS runs and thus complicate the analysis. In addition, under the label-free approach, many technical replicate anal- yses across a large number of samples are often acquired; however, comparing a large number of data files further com- plicates data analysis and renders lower quantitation accu- racy than that derived by labeling methods. Hence, an ac- curate, automated computation tool is required to effectively solve the problem of chromatographic shift, an- alyze a large amount of experimental data, and provide convenient user interfaces for manual validation of quanti- tation results. From the Institutes of ‡Information Science, §Chemistry, and ¶Bio- medical Sciences, Academia Sinica, Taipei 11529, Taiwan Author’s Choice—Final version full access. Received, April 6, 2009, and in revised form, July 28, 2009 Published, MCP Papers in Press, September 13, 2009, DOI 10.1074/mcp.M900177-MCP200 Research Author’s Choice © 2010 by The American Society for Biochemistry and Molecular Biology, Inc. Molecular & Cellular Proteomics 9.1 131 This paper is available on line at http://www.mcponline.org
-
Upload
independent -
Category
Documents
-
view
3 -
download
0
Transcript of IDEAL-Q: An automated tool for label-free quantitation analysis using an efficient peptide alignment...

IDEAL-Q, an Automated Tool for Label-freeQuantitation Analysis Using an EfficientPeptide Alignment Approach and SpectralData Validation*□S
Chih-Chiang Tsou‡, Chia-Feng Tsai§, Ying-Hao Tsui‡, Putty-Reddy Sudhir¶,Yi-Ting Wang§, Yu-Ju Chen§, Jeou-Yuan Chen¶, Ting-Yi Sung‡�, and Wen-Lian Hsu‡**
In this study, we present a fully automated tool, calledIDEAL-Q, for label-free quantitation analysis. It acceptsraw data in the standard mzXML format as well as searchresults from major search engines, including Mascot, SE-QUEST, and X!Tandem, as input data. To quantify as manyidentified peptides as possible, IDEAL-Q uses an efficientalgorithm to predict the elution time of a peptide uniden-tified in a specific LC-MS/MS run but identified in otherruns. Then, the predicted elution time is used to detectpeak clusters of the assigned peptide. Detected peptidepeaks are processed by statistical and computationalmethods and further validated by signal-to-noise ratio,charge state, and isotopic distribution criteria (SCI valida-tion) to filter out noisy data. The performance of IDEAL-Qhas been evaluated by several experiments. First, a seri-ally diluted protein mixed with Escherichia coli lysateshowed a high correlation with expected ratios and dem-onstrated good linearity (R2 � 0.996). Second, in a biolog-ical replicate experiment on the THP-1 cell lysate, IDE-AL-Q quantified 87% (1,672 peptides) of all identifiedpeptides, surpassing the 45.7% (909 peptides) achievedby the conventional identity-based approach, which onlyquantifies peptides identified in all LC-MS/MS runs. Man-ual validation on all 11,940 peptide ions in six replicateLC-MS/MS runs revealed that 97.8% of the peptide ionswere correctly aligned, and 93.3% were correctly vali-dated by SCI. Thus, the mean of the protein ratio, 1.00 �0.05, demonstrates the high accuracy of IDEAL-Q withouthuman intervention. Finally, IDEAL-Q was applied again tothe biological replicate experiment but with an additionalSDS-PAGE step to show its compatibility for label-freeexperiments with fractionation. For flexible workflow de-sign, IDEAL-Q supports different fractionation strategiesand various normalization schemes, including multiplespiked internal standards. User-friendly interfaces areprovided to facilitate convenient inspection, validation,and modification of quantitation results. In summary,
IDEAL-Q is an efficient, user-friendly, and robust quanti-tation tool. It is available for download. Molecular &Cellular Proteomics 9:131–144, 2010.
Quantitative analysis of protein expression promises to pro-vide fundamental understanding of the biological changes orbiomarker discoveries in clinical applications. In recent years,various stable isotope labeling techniques, e.g. ICAT (1), en-zymatic labeling using 18O/16O (2, 3), stable isotope labelingby amino acids in cell culture (4), and isobaric tagging forrelative and absolute quantitation (2, 5), coupled with LC-MS/MS have been widely used for large scale quantitativeproteomics. However, several factors, such as the limitednumber of samples, the complexity of procedures in isotopiclabeling experiments, and the high cost of reagents, limit theapplicability of isotopic labeling techniques to high through-put analysis. Unlike the labeling approaches, the label-freequantitation approach quantifies protein expression acrossmultiple LC-MS/MS analyses directly without using any label-ing technique (7–9). Thus, it is particularly useful for analyzingclinical specimens in highly multiplexed quantitation (10, 11);theoretically, it can be used to compare any number of sam-ples. Despite these significant advantages, data analysis inlabel-free experiments is an intractable problem because ofthe experimental procedures. First, although high reproduc-ibility in LC is considered a critical prerequisite, variations,including the aging of separation columns, changes in samplebuffers, and fluctuations in temperature, will cause a chro-matographic shift in retention time for analytes in differentLC-MS/MS runs and thus complicate the analysis. In addition,under the label-free approach, many technical replicate anal-yses across a large number of samples are often acquired;however, comparing a large number of data files further com-plicates data analysis and renders lower quantitation accu-racy than that derived by labeling methods. Hence, an ac-curate, automated computation tool is required toeffectively solve the problem of chromatographic shift, an-alyze a large amount of experimental data, and provideconvenient user interfaces for manual validation of quanti-tation results.
From the Institutes of ‡Information Science, §Chemistry, and ¶Bio-medical Sciences, Academia Sinica, Taipei 11529, Taiwan
Author’s Choice—Final version full access.Received, April 6, 2009, and in revised form, July 28, 2009Published, MCP Papers in Press, September 13, 2009, DOI
10.1074/mcp.M900177-MCP200
Research
Author’s Choice
© 2010 by The American Society for Biochemistry and Molecular Biology, Inc. Molecular & Cellular Proteomics 9.1 131This paper is available on line at http://www.mcponline.org

The rapid emergence of new label-free techniques for bio-marker discovery has inspired the development of a numberof bioinformatics tools in recent years. For example, Scaffold(Proteome Software) and Census (12) process PepXMLsearch results to quantify relative protein expression based onspectral counting (13–15), which uses the number of MS/MSspectra assigned to a protein to determine the relative proteinamount. Spectral counting has demonstrated a high correla-tion with protein abundance; however, to achieve good quan-titation accuracy with the technique, high speed MS/MS dataacquisition is required. Moreover, manipulations of the exclu-sion/inclusion strategy also affect the accuracy of spectralcounting significantly. Because peptide level quantitation isalso important for post-translational modification studies, theaccuracy of spectral counting on peptide level quantitationdeserves further study.
Another type of quantitation analysis determines peptideabundance by MS1 peak signals. According to some studies,MS1 peak signals across different LC-MS/MS runs can behighly reproducible and correlate well with protein abundancein complex biological samples (7–9). Quantitation analysismethods based on MS1 peak signals can be classified intothree categories: identity-based, pattern-based, and hybrid-based methods (16). Identity-based methods (7–9) depend onthe results of MS/MS sequencing to identify and detect peptidesignals in MS1 data. However, because the data acquisitionspeed of MS scanning is insufficient, a considerable number oflow abundance peptides may not be selected for limitedMS/MS sequencing. Only a few peptides can be repetitivelyidentified in all LC-MS/MS runs and subsequently quantified;thus, only a small fraction of identified peptides are quantified,resulting in a small number of quantifiable peptides/proteins.
In contrast to identity-based methods, pattern-based meth-ods (17–23), including the publicly available MSight (20),MZmine (21, 22), and msInspect (23), tend to quantify allpeptide peaks in MS1 data to increase the number of quan-tifiable peptides. These methods first detect all peaks in eachMS1 data and then align the detected peaks across differentLC-MS/MS runs. However, in pattern-based methods, effi-cient detection and alignment of the peaks between each pairof LC-MS/MS runs are a major challenge. To align the peaks,several methods based on dynamic programming or imagepattern recognition have been proposed (24–26). The algo-rithms applied in these methods require intensive computa-tion, and their computation time increases dramatically as thenumber of compared samples increases because all the LC-MS/MS runs must be processed. Therefore, pattern-basedapproaches are infeasible for processing a large number ofsamples. Furthermore, pattern recognition algorithms may failon data containing noise or overlapping peptide signal (i.e.co-eluting peptides). The hybrid-based quantitation approach(16, 27–30) combines a pattern recognition algorithm with pep-tide identification results to align shifted peptides for quantita-tion. The pioneering accurate mass and time tag strategy (27)
takes advantage of very sensitive, highly accurate mass meas-urement instruments with a wide dynamic range, e.g.FTICR-MS and TOF-MS, for quantitation analysis. PEPPeR (16)and SuperHirn (28) apply pattern recognition algorithms to alignpeaks and use the peptide identification results as landmarks toimprove the alignment. However, because these methods stillalign all peaks in MS1 data, they suffer the same computationtime problem as pattern-based methods.
To resolve the computation-intensive problem in the hybridapproach, we present a fully automated software system,called IDEAL-Q, for label-free quantitation including differen-tial protein expression and protein modification analysis. In-stead of using computation-intensive pattern recognitionmethods, IDEAL-Q uses a computation-efficient fragmentalregression method for identity-based alignment of all confi-dently identified peptides in a local elution time domain. Itthen performs peptide cross-assignment by mapping pre-dicted elution time profiles across multiple LC-MS experi-ments. To improve the quantitation accuracy, IDEAL-Q ap-plies three validation criteria to the detected peptide peakclusters to filter out noisy signals, false peptide peak clusters,and co-eluting peaks. Because of the above key features, i.e.fragmental regression and stringent validation, IDEAL-Q cansubstantially increase the number of quantifiable proteins aswell as the quantitation accuracy compared with other ex-tracted ion chromatogram (XIC)1-based tools. Notably, to ac-commodate different designs, IDEAL-Q supports variousbuilt-in normalization procedures, including normalizationbased on multiple internal standards, to eliminate systematicbiases. It also adapts to different fractionation strategies forin-depth proteomics profiling.
We evaluated the performance of IDEAL-Q on three levels:1) quantitation of a standard protein mixture, 2) large scaleproteome quantitation using replicate cell lysate, and 3) pro-teome scale quantitative analysis of protein expression thatincorporates an additional fractionation step. We demon-strated that IDEAL-Q can quantify up to 89% of identifiedproteins (703 proteins) in the replicate THP-1 cell lysate.Moreover, by manual validation of the entire 11,940 peptideions corresponding to 1,990 identified peptides, 93% of pep-tide ions were accurately quantified. In another experiment onreplicate data containing huge chromatographic shifts ob-tained from two independent LC-MS/MS instruments,IDEAL-Q demonstrated its robust quantitation and its abilityto rectify such shifts. Finally, we applied IDEAL-Q to theTHP-1 replicate experiment with an additional SDS-PAGEfractionation step. Equipped with user-friendly visualization
1 The abbreviations used are: XIC, extracted ion chromatogram;IDEAL, Identity-based elution time prediction by fragmental regres-sion; CV, coefficient of variation; SCI, signal-to-noise ratio, chargestate, and isotope pattern (it represents a three-dimensional peptidevalidation procedure); S/N, signal-to-noise ratio; TEABC, triethylam-monium bicarbonate; FA, formic acid; ID, identity.
IDEAL-Q for Automated Label-free Quantitation Analysis
132 Molecular & Cellular Proteomics 9.1

interfaces and convenient data output for publication, IDE-AL-Q represents a generic, robust, and comprehensive toolfor label-free quantitative proteomics.
EXPERIMENTAL PROCEDURES
Sample Preparation
Materials
Triethylammonium bicarbonate (TEABC) was purchased from Sig-ma-Aldrich. The BCATM protein assay reagent kit was obtained fromPierce. Ammonium persulfate and N,N,N�,N�-tetramethylenediaminewere purchased from Amersham Biosciences. TFA, formic acid (FA),and HPLC grade ACN were purchased from Sigma-Aldrich. Modified,sequencing grade trypsin was purchased from Promega (Madison,WI). Standard protein mixture 1 (25 fmol/�l glycogen phosphorylase,serum albumin precursor, enolase 1, and alcohol dehydrogenase 1)and mixture 2 (12.5 fmol/�l glycogen phosphorylase, 200 fmol/�lserum albumin precursor, 50 fmol/�l enolase 1, and 25 fmol/�l alco-hol dehydrogenase 1) were purchased from Waters Corp.; 0.4 fmol/�lEscherichia coli was also purchased from Waters Corp.
Cell Culture
THP-1 (human acute monocytic leukemia, The American TypeCulture Collection) cell lines were grown in RPMI 1640 medium sup-plemented with 10% fetal bovine serum and 1% penicillin G at 37 °Cin a 5% CO2 atmosphere. Cell lines were harvested, washed threetimes with PBS, and lysed in lysis buffer (0.25 M Tris-HCl, pH 6.8, 1%SDS).
Preparative SDS-PAGE Separation
The protein concentrations in cell lysate were determined by BCAassay (Pierce) before tryptic digestion. For large scale identification ofthe THP-1 cell line, 70 �g of cell lysate was separated by 10%SDS-PAGE (31) (0.5 cm � 4.0 cm � 0.75 mm). The remaining gel wasthen excised into five gel slices based on molecular weight. Each slicewas cut into pieces, washed with Milli-Q water, and destained twicewith 25 mM TEABC, pH 8 in 50% (v/v) ACN for 15 min after which theslices were dehydrated with 100% ACN and dried for 10 min undervacuum. Next, the dry gel pieces were rehydrated in 25 mM TEABC,pH 8 containing an additional �-casein as the internal standard priorto in-gel digestion (in this study, we used �-casein as an internalstandard to normalize XIC area readings of endogenous peptides).Following the addition of trypsin (10 ng/�l), the gel pieces wereincubated at 37 °C overnight. The tryptic peptides were then ex-tracted twice with 5% (v/v) FA in 50% (v/v) ACN for 30 min, driedcompletely under vacuum, and stored at �30 °C.
LC-MS/MS and Protein Identification
Samples were reconstituted in 4 �l of buffer A (0.1% FA in H2O)and analyzed by LC-MS/MS (Waters Q-TOFTM Premier from WatersCorp.). Samples were injected into a 2-cm � 180-�m capillary trapcolumn and separated by a 25-cm � 75-�m nanoACQUITYTM 1.7-�mBridged Ethyl Hybrid C18 column using the nanoACQUITY Ultra Per-formance LCTM system (Waters Corp.). The column was maintained at35 °C, and bound peptides were eluted with a linear gradient of0–80% buffer B (buffer A, 0.1% FA in H2O; buffer B, 0.1% FA in ACN)for 120 min. The MS system was operated in ESI positive V mode witha resolving power of 10,000. The NanoLockSpray source was usedfor accurate mass measurement, and the lock mass channel wassampled every 30 s. The mass spectrometer was calibrated with asynthetic human [Glu1]-fibrinopeptide B solution (1 pmol/�l; fromSigma-Aldrich) delivered through the NanoLockSpray source. Data
were acquired via data-directed analysis. The method included a fullsequential MS scan (m/z 400–1600, 0.6 s) and three MS/MS scans(m/z 100–1990, 1.2 s per scan) on the three most intense ions presentin the full-scan mass spectrum.
Raw MS/MS data were converted into peak lists using Distiller(Matrix Science, London, UK; version 2.0) with the default parame-ters. All MS/MS samples were analyzed using Mascot (Matrix Sci-ence; version 2.2.1). Mascot was set up to search the ipi_HU-MAN_3.29 database (version 3.29; 68,161 entries) for the THP-1 cellline and the Swisssprot_Metazoa_Animals database (version 54.2;17,170 entries) for standard proteins, assuming trypsin as the diges-tion enzyme. Mascot was set up to search with a fragment ion masstolerance of 0.1 Da and a parent ion tolerance of 0.1 Da. Two missedcleavages were allowed during trypsin digestion. Oxidation (Met) wasselected as a variable modification. To determine the false discoveryrate of protein identification, we repeated the search using identicalsearch parameters and validation criteria on a randomized decoydatabase created by Mascot. We accepted identified peptides withMascot scores above the statistically significant threshold (p � 0.05).The unique MS/MS spectra and assignment of identified peptides areshown in the supplemental figures.
Protein Quantitation by IDEAL-Q
IDEAL-Q quantifies label-free experiments with multiple LC-MS/MS runs and different fractionation strategies, such as strongcation exchange and SDS-PAGE. The numbers of samples, fractions,and runs are unrestricted. As shown in Fig. 1, the workflow involvesfour steps: 1) data preparation and construction of the ID database; 2)processing of data from each LC-MS/MS run, 3) peptide level proc-essing, and 4) protein level processing.
Data Preparation and Construction of ID Database
IDEAL-Q accepts spectral data in the mzXML format and peptideand protein identification results from different pipelines, namely Mas-cot, SEQUEST, and X!Tandem followed by PeptideProphet and Pro-teinProphet. It also provides two filtering criteria as user options: 1) aconfidence score threshold to filter out low confidence identificationresults and 2) an elution time range to determine the range of peptidesthat should be included.
Confidently identified peptides in the search results are then usedto construct an ID database of the identification results from allLC-MS/MS runs. The identified peptide ions are deemed to be thesame entry in the database if their following attributes are the same:1) sequence, 2) precursor m/z value (tolerance range, �0.2 Da), 3)charge state, 4) modification, and 5) modification site. Note that, inthis study, we treat a peptide with different charge states as differentpeptides. The protein list and associated peptide lists are constructedin the database. If a peptide is only identified in some of the LC-MS/MS runs, information about the peptide will be assigned to theLC-MS/MS runs in which the peptide is not identified. The failure toidentify a peptide in some runs is probably because of a low identi-fication score or because the precursor m/z was not selected forMS/MS sequencing. In such runs, the peptide is denoted as anunidentified peptide. Therefore, each LC-MS/MS run contains iden-tified and unidentified peptides. Note that the peptides cannot bequantified by IDEAL-Q if they were not identified by MS/MS in any ofthe MS runs.
Processing of Each LC-MS/MS Run Data
In each LC-MS/MS run, IDEAL-Q sequentially processes all pep-tides, both identified and unidentified, to quantify as many peptidesas possible. For an identified peptide, IDEAL-Q uses the identified
IDEAL-Q for Automated Label-free Quantitation Analysis
Molecular & Cellular Proteomics 9.1 133

retention time to detect the peak cluster. However, for an unidentifiedpeptide, IDEAL-Q uses the proposed ID-based elution time predictionby fragmental regression (IDEAL) algorithm (described under “IDEALAlgorithm”) to predict the retention time of the peptide in the currentrun after which it detects the peak cluster based on the predictedtime. A detected peak cluster of an unidentified peptide is called anassigned peptide. The detected peak clusters of both identified andassigned peptides are validated by the SCI criteria (described under“SCI: Three-dimensional Peptide Cluster Validation”). A peak clusterthat passes SCI validation is used to construct the XIC for quantifyingpeptide abundance in the current run. IDEAL-Q automatically detectsthe retention time and m/z ranges to construct the XIC. Variousnormalization procedures are provided in IDEAL-Q (described under“Peptide Abundance Determination and Normalization at LC-MS/MSRun Level”). Users can decide whether or not to performnormalization.
IDEAL Algorithm for Peptide Elution Time Prediction—Reproduci-ble LC separation is a crucial prerequisite in most XIC-based label-free strategies. However, because of variations in LC, a peptide rarelyelutes at the same time in replicate experiments, which could lead toconstruction of an incorrect XIC and thereby render an incorrectquantitation result. To quantify an unidentified peptide, its elution timeneeds to be accurately predicted from experimental data containingchromatographic shifts caused by possible variations in LC. TheIDEAL algorithm tries to accurately predict the elution time of eachunidentified peptide.
The algorithm consists of two parts: a linear regression functionand a fragmental refining function. For any two LC-MS/MS runs, alinear regression model is constructed by only using peptides identi-fied in both runs. Let xi and yi represent the identified elution time ofpeptide i in the two LC-MS/MS runs, respectively. The linear regres-sion model is defined as
y � f�x� � ax � b (Eq. 1)
where b � y� � ax� and a � ((xi � x�)(yi � y�))/(xi � x�)2. The constructedregression model, which represents the correlation of the peptideelution time in both LC-MS/MS runs, is used to estimate the elutiontime of an unidentified peptide in one run given the elution time of thepeptide identified in the other run.
However, in some cases, the elution time predicted by the regres-sion model may deviate from the actual elution time beyond a certaintolerance range. Therefore, to rectify the prediction error of f(x), weintroduce a fragmental refining function F(x) given that x representsthe elution time of the peptide identified in one run. F(x) is determinedby the deviations between yi (the actual elution time) and f(xi) (thepredicted elution time) with all xi in the range of [x � 2, x 2] asdefined in Equation 2,
F�x� �
�x�2�xi�x2
k
yi � f�xi�
k(Eq. 2)
where k is the number of (xi, yi) pairs in the range. Given the identifiedelution time, x, of a peptide in a reference LC-MS/MS run, the IDEALalgorithm takes f(x) F(x) as the predicted elution time of the uni-dentified peptide in a specific run.
Because an unidentified peptide generally has multiple referenceLC-MS/MS runs in label-free experiments, i.e. it is unidentified in thecurrent run but identified in several other runs, IDEAL-Q uses theweighted average of all predictions derived by different reference runsto determine the final prediction of the elution time as
y � �i�1
N
� f�xi� � F�xi�� �R�i�S
(Eq. 3)
where S � i � 1N R(i). We use the R2 value of the prediction model as
the weight factor R(i), i.e. the more accurate the prediction model, thehigher the assigned weight will be.
For example, when processing a peptide in the ID database, giventhat the peptide is identified in some LC-MS/MS runs, say, {X1, X2, …,XN} at elution time {x1, x2, …, xN} and unidentified in a specificLC-MS/MS run r, we construct N prediction models (f(x) F(x)) for runr versus each run of Xi (Equations 1 and 2) to calculate the predictedelution time y of the peptide by Equation 3.
SCI: Three-dimensional Peptide Peak Cluster Validation—Whenquantifying a specific peptide in an LC-MS/MS run, i.e. given theelution time (predicted by IDEAL for an unidentified peptide or derivedfrom the search results for an identified peptide) and m/z, IDEAL-Qfirst extracts the MS1 data within the range of the elution time �3 minand the precursor m/z � 3.5 Da. (Note that the range of the elutiontime can be adjusted for different instruments.) Next, peak clusterdetection is performed on the extracted MS1 data after which thedetected peak cluster, which contains three isotopic peaks, will bevalidated by the SCI process. SCI stands for the three criteria used forpeptide validation: 1) signal-to-noise (S/N) ratio, 2) charge state, and3) isotope pattern. These three criteria are checked sequentially un-less violation of a criterion is detected.
The S/N criterion checks whether the precursor peak, i.e. themonoisotopic peak, has a valid S/N ratio (�2). The charge statecriterion is used to eliminate peak clusters that have an incorrectcharge state by examining whether the distance between adjacentpeaks is equal to 1/z. Finally, the isotope pattern criterion examinesthe correlation between the isotopic distribution of the observed peakintensities and the theoretical isotopic distribution (32) of the peptide.The correlation is evaluated by the �2 goodness of fit test. Any peptidethat does not satisfy this criterion is eliminated because of the occur-rence of possible co-eluting peptides with close m/z values.
Peptide Abundance Determination and Normalization at LC-MS/MS Run Level—For each peptide in an LC-MS/MS run thatpasses SCI validation, we construct the XIC of the selected peakcluster by summing the MS signals within the m/z width and elutiontime range of the precursor peak. (Both the m/z width and elution timerange are determined by peak detection.) Then, we use the B-splinealgorithm (33) for curve smoothing. The area under the XIC curve isused to determine the peptide abundance in the LC-MS/MS run,called the peptide run abundance. Note that when a peptide fails SCIvalidation it is regarded as absent from the LC-MS/MS run. In thiscase, the peptide run abundance is reported as zero, so it will not beinvolved in the subsequent normalization and peptide ratio calculationprocedures.
After determining all peptide run abundances in the LC-MS/MSrun, we normalize them to eliminate systematic errors. IDEAL-Q sup-ports four normalization strategies in an LC-MS/MS run: 1) the XICareas of spiked internal standard proteins used to support both singleand multiple spiked internal standards, 2) the median of all peptiderun abundances in the LC-MS/MS run, 3) the mean of all peptide runabundances in the LC-MS/MS run, and 4) a user-defined normaliza-tion factor.
Determination of Peptide Ratios and Protein Ratios at SampleLevel—In addition to peptide run abundance, based on differentexperiment designs, IDEAL-Q defines the following levels of peptideabundance: peptide abundance in the fraction level (called peptidefraction abundance) and peptide abundance in the sample level(called peptide sample abundance). A number of fractionation strat-egies, such as strong cation exchange and SDS-PAGE, have been
IDEAL-Q for Automated Label-free Quantitation Analysis
134 Molecular & Cellular Proteomics 9.1

proposed to reduce the complexity of a sample mixture before LC-MS/MS analysis. If a prefractionation strategy is not adopted, thepeptide sample abundance is retrieved directly from the peptidefraction abundance. For experiments with multiple fractions andwhere each fraction is used to conduct multiple LC-MS/MS runs,peptide fraction abundance is defined as the average of the peptiderun abundances of the LC-MS/MS runs in the fraction. Then, thepeptide abundances in all the fractions are summed to represent thepeptide sample abundance. After determining peptide sample abun-dances, the peptide ratio of any two samples can be calculated.
Before determining the protein ratio, IDEAL-Q supports the followingmechanisms to normalize the peptide ratios of sample i versus samplej: central tendency normalization, linear regression normalization, andquantile normalization (34), which can be used to further reduce sys-tematic biases. For protein ratios, IDEAL-Q provides the flexibility tocalculate each ratio by only the non-degenerate peptides of the protein(the default setting) or by all detected peptides. It is noted that thedegeneracy of peptide/protein identification was based on the databasesearch results. It also provides an option to further eliminate the outlierpeptide ratios of a protein by using Dixon’s Q-test (35). The protein ratioRi,j of sample i to sample j is determined by a weighted average of thepeptide ratios where the weight of each peptide ratio is determined bythe corresponding peptide sample abundance.
RESULTS AND DISCUSSION
We conducted four experiments to evaluate the perform-ance of IDEAL-Q in terms of the accuracy of elution timeprediction, quantitation coverage (i.e. the percentages ofquantified peptides/proteins in all identified peptides/pro-teins), and quantitation accuracy. In the first experiment, theworkflow and the quantitation performance of IDEAL-Q weredemonstrated on a serially diluted standard protein mixturespiked into E. coli cell lysate. The quantitation coverage andaccuracy on the proteome scale were demonstrated on thebiological replicates of THP-1 cell lysate. In this experiment,we also manually validated all the quantified peptide ions in alarge scale data set for unbiased evaluation of the true quan-titation accuracy. To demonstrate the features of robust pep-tide elution time prediction for alignment and stringent pep-tide quantitation assurance for unreproducible LC-MS/MS,we generated a special data set from the biological replicateexperiment of THP-1 cell lysate using different LC-MS/MSinstruments. In the data set, dramatic chromatographic shiftsappeared between different LC-MS/MS runs.
For comprehensive quantitation of a proteome profile, anadditional fractionation step, such as SDS-PAGE, is usuallyincorporated to increase the number of identified/quantifiedpeptides. However, label-free quantitation experiments fre-quently suffer from low resolution and variations in fraction-ation reproducibility because a peptide or a protein usuallyappears in two or more consecutive fractions. Therefore, pep-tide abundance in only one fraction does not necessarilyrepresent the actual peptide expression and could lead toinaccurate peptide ratios. To improve the quantitation accu-racy, IDEAL-Q is designed to be compatible with label-freequantitation experiments using different fractionation strate-gies. The quantitation accuracy is demonstrated by a biolog-ical replicate of the THP-1 cell lysate with an additional SDS-
PAGE fractionation followed by the shotgun approach. Thecomplete quantitation results are shown in the supplementalfigures.
Workflow of IDEAL-Q
As shown in Fig. 1, quantitation under IDEAL-Q involvesfour steps. 1) For data preparation, IDEAL-Q is designed toaccept search results from major search engines and data inthe common mzXML format, which can be converted easilyfrom spectral data files generated by different mass spec-trometers. After loading the database search results andmzXML files, an ID database containing the identified pep-tides and proteins in all LC-MS/MS runs is constructed. 2) Forpeptide cross-assignment and SCI validation in each LC-MS/MS run, we process all peptides in the ID database andclassify them as identified or unidentified. To quantify anidentified peptide, i.e. a confidently matched peptide gener-ated by the database search engine, in an LC-MS/MS run, theelution time and precursor m/z of the identified MS/MS spec-trum are acquired to extract the spectral data of the peptidethat will be processed by SCI validation. Meanwhile, to quan-tify an unidentified peptide, we first detect the peptide peaksby using the IDEAL algorithm to predict the elution time of thepeptide for peptide alignment. Then, we use the predictedelution time and precursor m/z to extract local LC-MS/MSdata for detecting the peptide peak cluster; this procedure iscalled peptide cross-assignment. The detected peptide peakcluster, i.e. the assigned peptide, is processed by SCI valida-tion (described under “Experimental Procedures”). If an iden-tified peptide or an assigned peptide passes SCI validation,its peak cluster is used to construct the XIC to determinepeptide abundance; otherwise, it is regarded as unquantifi-able. 3) For peptide ratio determination, first, we construct theXIC of the selected peak cluster by summing the MS signalswithin the m/z width and elution time range of the precursorpeak and perform curve smoothing using the B-spline algo-rithm. Then, the peptide abundance is determined by the XICarea. To correct systematic errors, IDEAL-Q supports fourstrategies, described under “Peptide Abundance Determina-tion and Normalization at LC-MS/MS Run Level”, to normalizepeptide abundance in each LC-MS/MS run. Then, the peptideratio is calculated accordingly. 4) For protein ratio determina-tion, the protein abundance ratio is determined by theweighted average of non-degenerate peptides. Prior to pro-tein ratio determination, IDEAL-Q allows further normalizationbased on the peptide ratio distribution. It also provides theoption to further eliminate outlier peptide ratios of a protein byusing Dixon’s Q-test.
Quantitation Performance Evaluation of IDEAL-Q
Highly Accurate Quantitation Evidenced by Standard Pro-tein Mixture—To demonstrate the performance of IDEAL-Q,different concentrations of four standard proteins (glycogen
IDEAL-Q for Automated Label-free Quantitation Analysis
Molecular & Cellular Proteomics 9.1 135

phosphorylase, serum albumin precursor, enolase 1, and al-cohol dehydrogenase 1) were spiked into E. coli cell lysateand analyzed by LC-MS/MS. A total of 51 proteins was iden-tified by Mascot and quantified by IDEAL-Q. The protein ratiosof 47 E. coli proteins that were unchanged had a mean of1.05 � 0.17, as shown in Fig. 2A. The ratios of the other fourspiked proteins were consistent with the expected ratio withsmall deviations (2.9–19.9%), as shown in Table I. Furthermore,the calculated protein ratios for serially diluted BSA (1, 5, 10, 25,and 50 fmol) were highly correlated with the expected ratios anddemonstrated good linearity (R2 � 0.996), as shown in Fig. 2B.These results demonstrate that IDEAL-Q can calculate proteinexpression ratios with high accuracy and precision.
Substantially Increased Quantitation Coverage on ProteomeScale with High Quantitation Accuracy—Achieving high quan-titation coverage in terms of the percentages of quantifiedpeptides/proteins in all identified peptides/proteins is a chal-lenge in label-free quantitative proteomics. Normally, a pep-tide is quantified only if it can be identified in all LC-MS/MSruns. Here, we demonstrate the ability of IDEAL-Q to increasethe quantitation coverage by cross-assignment of confidentlyidentified peptides in all LC-MS/MS runs. To evaluate the per-formance of IDEAL-Q on a complex sample, we conducted anexperiment on biological duplicate of the THP-1 cell lysate andperformed triplicate LC-MS/MS analysis. A total of 1,990 pep-tides corresponding to 703 proteins was identified (score, 39;false discovery rate, 0.05–2.3%). The elution times of any twoLC-MS/MS runs from the two samples exhibited a high corre-
lation; for example, in Fig. 3, there is a high correlation betweenthe first runs of the two samples.
In the data set, 1,990 peptides were confidently identified inat least one of the six LC-MS/MS runs in the two biologicalreplicates. Among these peptides, 1,596, 1,289, and 1,107peptides were identified in at least one, two, and three LC-MS/MS runs for both biological replicates, respectively. Theabove four peptide sets represent increasingly reliable pep-tide sets. We use N(m, n) to denote the set of peptidesidentified in at least m LC-MS/MS runs of one biologicalreplicate and at least n LC-MS/MS runs of the other replicate.Denoting �N(m, n)� as the number of peptides in N(m, n), wehave �N(0, 1) U N(1, 0)� � 1,990, �N(1, 1)� � 1,596, �N(2, 2)� �
1,289, and �N(3, 3)� � 1,107. Many identity-based quantitationmethods only quantify peptides that are identified in all LC-MS/MS runs; for example, they quantify peptides in the peptideset N(3, 3), which only accounts for 55% of all identified pep-tides. In contrast, IDEAL-Q tries to quantify all identified pep-tides, i.e. peptides identified in at least one LC-MS/MS run, bypeptide cross-assignment using the predicted elution time.
Although we focused on comparing the quantitation strat-egies of the conventional identity-based approach and IDE-AL-Q, we also used IDEAL-Q to quantify the above four pep-tide sets to evaluate its performance in terms of thequantitation coverage and quantitation accuracy. In this sub-section, we examine how the quantitation coverage is af-fected by quantifying different peptide sets represented bythe above N(m,n) and assess the accuracy based on the
FIG. 1. Workflow of IDEAL-Q.
IDEAL-Q for Automated Label-free Quantitation Analysis
136 Molecular & Cellular Proteomics 9.1

coefficients of variation (CVs) of protein ratios. The quantita-tion accuracy was further examined by manual validation. (Wediscuss this aspect in the next subsection.) The conventionalidentity-based approach quantified peptides in N(3, 3).Among them, only 909 peptides corresponded to 353 pro-teins, i.e. 45.7% of all identified peptides and 50.2% of allidentified proteins were quantified. IDEAL-Q quantified N(0, 1)U N(1, 0) by peptide cross-assignment. Among them, 1,672
peptides corresponded to 626 proteins, i.e. 84% of all iden-tified peptides and 89% of all identified proteins were quan-tified. The protein and peptide quantitation coverage rates fordifferent peptide sets are shown in Fig. 4. The results showthat peptide cross-assignment can achieve a substantial im-provement in the quantitation coverage.
Next, we investigated whether using peptide cross-assign-ment to increase the quantitation coverage affects the quan-
FIG. 2. Validation of protein quanti-tation by IDEAL-Q. Serially diluted pro-teins mixed with E. coli cell lysate werequantified by IDEAL-Q. A, the proteinratios of the 20 proteins in E. coli celllysate. The result is close to the ex-pected ratio 1. B, given concentrationsof BSA quantified by IDEAL-Q show thegood linearity of the quantitation andgood sensitivity in a highly dynamicrange (The error bars indicate the stand-ard deviation of the quantified BSA pro-tein ratio).
IDEAL-Q for Automated Label-free Quantitation Analysis
Molecular & Cellular Proteomics 9.1 137

titation accuracy. The average CVs of the protein ratios cal-culated for the four peptide sets are shown in Fig. 4A. The CVof the protein ratios in the peptide set N(0, 1) U N(1, 0) is 3.4%,which is comparable to 2.6% in N(3, 3). In addition, as shownin Fig. 4B, the protein ratio distributions in log2 scale of thefour peptide sets are all close to 0 (i.e. close to 1 in non-logscale) with standard deviations of 7–11%. The narrow log2
ratio distributions of the four sets of data revealed that theimproved quantitation coverage did not reduce the quantita-tion accuracy.
Large Scale Manual Validation Demonstrates Highly ReliableQuantitation Performance of IDEAL-Q—We also manually vali-dated all the quantitation results to evaluate the overall perform-ance of IDEAL-Q. The quantitation result of a manually validatedpeptide ion is considered correct if the following three condi-tions are satisfied. 1) The detected peptide peak cluster has thecorrect m/z as the assigned peptide, i.e. correct peptide align-ment. 2) The peptide peak cluster does not contain noise orco-eluting peptides and can be quantified, i.e. correct SCI val-idation. 3) The ratios determined by IDEAL-Q and manual in-spection are consistent, i.e. correct ratio determination.
Of 11,940 peptide ions detected by IDEAL-Q in all sixLC-MS/MS runs from the two biological replicates, 8,806peptide ions (1,990 peptides) were identified by the Mascotsearch. For those peptide ions, we only needed to check
condition (2) for manual validation, and as high as 95% ofthem were correctly quantified by IDEAL-Q, as shown in Fig.5B. Of the remaining 3,134 unidentified peptide ions, whichwere assigned by IDEAL-Q, 90% were properly aligned andcorrectly quantified, 2% were misaligned, and 8% were cor-
FIG. 3. Correlation of peptide elution times of THP-1 cell linebiological replicate. The elution times of commonly identified pep-tides in the first runs of two replicate samples are used to show thecorrelation. The R2 value of 0.9999 and the slope of 1.011 demon-strate that the LC system is stable and reproducible.
FIG. 4. Comparison of results derived by conventional ID-basedstrategy and IDEAL-Q in THP-1 cell line biological replicate exper-iment. A, the number of quantifiable peptides, the CVs of peptidesample abundance, and the CVs of the protein ratios on the four peptidesets, two of which correspond to the ID-based strategy and two ofwhich correspond to IDEAL-Q quantitation strategy. B, the peptide ratiodistributions on the four peptide sets. Compared with the identity-basedquantitation strategy, IDEAL-Q achieves high quantitation accuracy andincreases the number of quantifiable peptides substantially.
TABLE IQuantitation results of four proteins with different concentrations
Protein name Molecularmass
No. ofidentifiedpeptides
No. ofquantifiedpeptides
Ratio QuantitationerrorIDEAL-Q Expected
Da %
Glycogen phosphorylase 97,228 19 19 0.53 0.5 6Serum albumin precursor 69,248 13 11 6.40 8 �19.9Enolase 1 46,773 7 5 1.80 2 �9.7Alcohol dehydrogenase 1 36,800 11 10 0.97 1 �2.9
IDEAL-Q for Automated Label-free Quantitation Analysis
138 Molecular & Cellular Proteomics 9.1

rectly aligned, but SCI validated them incorrectly, as shown inFig. 5B. After manual validation, the overall accuracy for all thepeptide ions was 93.3%, demonstrating the effectiveness ofthe data processing capability of IDEAL-Q. In addition, thelarge scale manual validation results revealed that 1,240 pep-tide ions had poor spectral quality, which was mainly becauseof peptide co-elution. However, SCI validation successfullydetected and filtered out 1,114 (89.8%) of them. The resultsdemonstrate that the high accuracy achieved by IDEAL-Q canbe attributed to correct peptide alignment and the SCI vali-dation process used to filter out noisy unquantifiable data.Thus, fully automated quantitation can be performed withouttime-consuming manual inspection.
Using IDEAL Elution Time Prediction and SCI Validation toRectify Chromatographic Shift—In addition to the demon-strated quantitation coverage and accuracy, IDEAL-Q pro-vides a unique fragmental elution time prediction method (see“Experimental Procedures” for details) that enables robustquantitation of data sets with inconsistent elution profiles. Thus,we conducted a biological replicate experiment on the THP-1cell line with triplicate LC-MS/MS analysis on two different LCsystems to derive huge chromatographic shifts. Fig. 6 com-pares the elution time prediction results of IDEAL with those of
two other prediction methods, namely, the ID-time method andthe linear regression method. Under the ID-time method, theelution time of an unidentified peptide was determined by theexperimental elution time of the same peptide identifiedin the other LC-MS/MS run. In the linear regression method, theelution time was predicted by Equation 1.
We used 699 commonly identified peptides from the firstLC-MS/MS run of each LC system to compare the predictioncurves of IDEAL, linear regression (y � 0.76x � 16.7), andID-time (y � x). As shown in Fig. 6, the ID-time predictiondeviated significantly from the actual elution times of thepeptides. IDEAL achieved the highest R2 score of 0.998 fol-lowed by 0.982 for the linear regression method. The resultsdemonstrate that IDEAL-Q is capable of robust quantitationcompatible with huge chromatographic shifts, which are notunusual in practice.
Next, we used the entire data sets of the two LC systems tocompare IDEAL with the other two methods on a large scaleby performing k-fold cross-validation (6), which is widely usedfor performance evaluation in machine learning. We used adata set consisting of all identified peptides in any two of sixLC-MS/MS runs to perform a k-fold cross-validation test andrepeated it 15 times (the number of combinations of choosingtwo from six). On average, 693 peptides were identified in anytwo of the six LC-MS/MS runs. In a k-fold cross-validationtest, the data set is randomly divided into k partitions of ap-proximately equal size. One of the k partitions is used as the testset, and the remaining k � 1 partitions are used as the trainingdata set, i.e. to produce corresponding IDEAL prediction mod-els for predicting the elution time of peptides in the test set. Ineach iteration, the average prediction error is used to evaluatethe performance as shown in Equation 4.
FIG. 5. Manually validated results of THP-1 cell line biologicalreplicate experiment. A total of 11,940 peptide ion quantitationswere manually validated. The results demonstrate the high accuracyrates achieved by SCI validation and peptide alignment. A, 11,940peptide ions detected by IDEAL-Q in all six LC-MS/MS runs from thetwo biological replicates. 8,806 peptide ions (1,990 peptides) wereidentified by the Mascot search, and there were 3,134 unidentifiedpeptide ions. B, Of 8,806 identified peptide ions, SCI correctly vali-dated 8,339 peptide ions and failed on 467 identified peptide ions. C,Of all unidentified peptide ions, 69 were misaligned, 2,808 werecorrectly validated by SCI, and SCI failed on 257 unidentified peptideions.
FIG. 6. Correlation of peptide elution times in heterogeneous LCsystem experiment. The commonly identified peptides are plotted asgray circles based on the identified elution times of the first runs of thetwo biological replicates obtained from two different LC systems. Thefigure shows the prediction curves of three methods. The correlations(R2) between the plotted points and the prediction curves show thatthe IDEAL curve has the best data fit; therefore, it can predict themost accurate peptide elution times.
IDEAL-Q for Automated Label-free Quantitation Analysis
Molecular & Cellular Proteomics 9.1 139
Prediction error � �Predicted time � actual time� (Eq. 4)
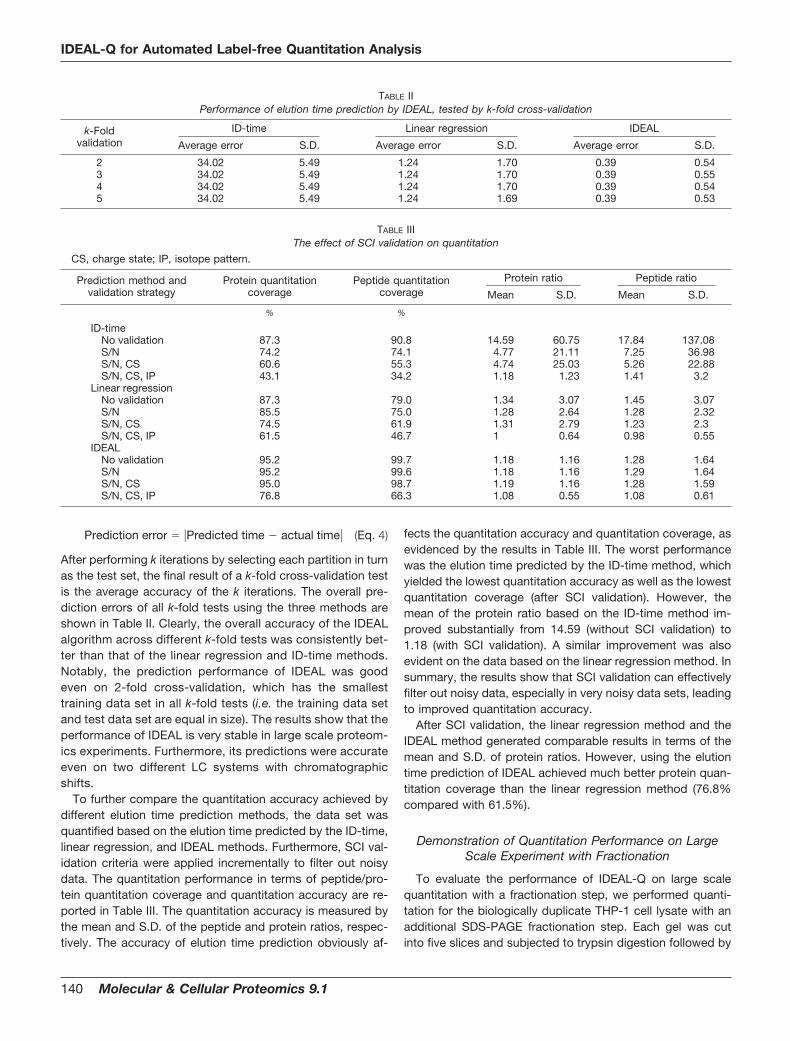
After performing k iterations by selecting each partition in turnas the test set, the final result of a k-fold cross-validation testis the average accuracy of the k iterations. The overall pre-diction errors of all k-fold tests using the three methods areshown in Table II. Clearly, the overall accuracy of the IDEALalgorithm across different k-fold tests was consistently bet-ter than that of the linear regression and ID-time methods.Notably, the prediction performance of IDEAL was goodeven on 2-fold cross-validation, which has the smallesttraining data set in all k-fold tests (i.e. the training data setand test data set are equal in size). The results show that theperformance of IDEAL is very stable in large scale proteom-ics experiments. Furthermore, its predictions were accurateeven on two different LC systems with chromatographicshifts.
To further compare the quantitation accuracy achieved bydifferent elution time prediction methods, the data set wasquantified based on the elution time predicted by the ID-time,linear regression, and IDEAL methods. Furthermore, SCI val-idation criteria were applied incrementally to filter out noisydata. The quantitation performance in terms of peptide/pro-tein quantitation coverage and quantitation accuracy are re-ported in Table III. The quantitation accuracy is measured bythe mean and S.D. of the peptide and protein ratios, respec-tively. The accuracy of elution time prediction obviously af-
fects the quantitation accuracy and quantitation coverage, asevidenced by the results in Table III. The worst performancewas the elution time predicted by the ID-time method, whichyielded the lowest quantitation accuracy as well as the lowestquantitation coverage (after SCI validation). However, themean of the protein ratio based on the ID-time method im-proved substantially from 14.59 (without SCI validation) to1.18 (with SCI validation). A similar improvement was alsoevident on the data based on the linear regression method. Insummary, the results show that SCI validation can effectivelyfilter out noisy data, especially in very noisy data sets, leadingto improved quantitation accuracy.
After SCI validation, the linear regression method and theIDEAL method generated comparable results in terms of themean and S.D. of protein ratios. However, using the elutiontime prediction of IDEAL achieved much better protein quan-titation coverage than the linear regression method (76.8%compared with 61.5%).
Demonstration of Quantitation Performance on LargeScale Experiment with Fractionation
To evaluate the performance of IDEAL-Q on large scalequantitation with a fractionation step, we performed quanti-tation for the biologically duplicate THP-1 cell lysate with anadditional SDS-PAGE fractionation step. Each gel was cutinto five slices and subjected to trypsin digestion followed by
TABLE IIPerformance of elution time prediction by IDEAL, tested by k-fold cross-validation
k-Foldvalidation
ID-time Linear regression IDEAL
Average error S.D. Average error S.D. Average error S.D.
2 34.02 5.49 1.24 1.70 0.39 0.543 34.02 5.49 1.24 1.70 0.39 0.554 34.02 5.49 1.24 1.70 0.39 0.545 34.02 5.49 1.24 1.69 0.39 0.53
TABLE IIIThe effect of SCI validation on quantitation
CS, charge state; IP, isotope pattern.
Prediction method andvalidation strategy
Protein quantitationcoverage
Peptide quantitationcoverage
Protein ratio Peptide ratio
Mean S.D. Mean S.D.
% %
ID-timeNo validation 87.3 90.8 14.59 60.75 17.84 137.08S/N 74.2 74.1 4.77 21.11 7.25 36.98S/N, CS 60.6 55.3 4.74 25.03 5.26 22.88S/N, CS, IP 43.1 34.2 1.18 1.23 1.41 3.2
Linear regressionNo validation 87.3 79.0 1.34 3.07 1.45 3.07S/N 85.5 75.0 1.28 2.64 1.28 2.32S/N, CS 74.5 61.9 1.31 2.79 1.23 2.3S/N, CS, IP 61.5 46.7 1 0.64 0.98 0.55
IDEALNo validation 95.2 99.7 1.18 1.16 1.28 1.64S/N 95.2 99.6 1.18 1.16 1.29 1.64S/N, CS 95.0 98.7 1.19 1.16 1.28 1.59S/N, CS, IP 76.8 66.3 1.08 0.55 1.08 0.61
IDEAL-Q for Automated Label-free Quantitation Analysis
140 Molecular & Cellular Proteomics 9.1

LC-MS/MS analysis. Using the Mascot search engine (score, 32; false discovery rate, 1.5% by decoy database search),five fractions in the two SDS-PAGEs generated 1,438 proteinswith 7,247 peptides. Because of the low resolution of SDS-PAGE separation, many proteins inevitably migrate to two ormore consecutive fractions. For example, as shown in Fig.7, the identified peptide DDPSKPVHLTAFLGYK corre-sponding to the 60 S ribosomal protein L3 was only identi-fied in fraction 1 of both biological replicates. However,IDEAL-Q identified the peptide in fraction 2 of both biolog-ical replicates by peptide cross-assignment in addition tothat in fraction 1. The conventional strategy only quantifiesthe peptide that is commonly identified in fraction 1 of thetwo biological replicates, and the resulting peptide ratiogiven by peptide abundance in SDS-PAGE A over that inSDS-PAGE B is 0.65 � 338.1/519.2. In contrast, IDEAL-Qdetects and quantifies all peptides unidentified in otherfractions. By summing the peptide fraction abundances inall fractions, IDEAL-Q calculated the corrected peptide ratioas 1.006 � (338.1 593)/(519.2 406.2), which correctsthe biased ratio calculated by the conventional approach.
Among the 7,247 identified peptides corresponding to 1,438proteins, 6,829 peptides corresponding to 1,391 proteins werequantified (see supplemental data for further details). The mean
and S.D. of the protein ratios (SDS-PAGE A/SDS-PAGE B) is1.04 � 0.39, showing the quantitation compatibility of IDEAL-Qon a label-free approach with a fractionation step.
Robust Functionality of IDEAL-Q
Label-free quantitation analysis inevitably involves process-ing a large number of input files; thus, efficient data analysis ischallenging. The most computation-intensive part is the peakalignment procedure. In contrast to pattern-matching align-ment algorithms, our fragmental regression algorithm, IDEAL,uses the experimentally identified elution time to predict theelution time of unidentified peptides for peptide cross-assign-ment. It rectifies the chromatographic shift successfully andalso reduces the computation time substantially. In the abovefour experiments, the input mzXML files were 5, 10.9, 12.8,and 76.5 GB, respectively. IDEAL-Q took 5, 49, 71, and 1,440min, respectively, to quantify the data sets on a MicrosoftWindows Server 2003 R2 (x64 edition service pack 2 with a64-bit AMD Opteron Processor 2210 CPU 1.8-GHz proces-sors, SATA hard disk (7200 rpm, 500 GB), and 8 GB RAM). Itis noteworthy that IDEAL-Q can be executed on a personalcomputer with the Windows platform. Depending on the us-er’s experiment design, IDEAL-Q provides flexible quantita-
FIG. 7. Example of inaccurate pro-tein quantitation in fractionation ex-periment. The figure shows a typicalproblem that arises in quantitation withthe fractionation strategy. A protein isseparated into two consecutive frac-tions, leading to quantitation inaccuracyunder the conventional quantitativestrategy.
IDEAL-Q for Automated Label-free Quantitation Analysis
Molecular & Cellular Proteomics 9.1 141

tion mechanisms, including support for various normalizationschemes and fractionation strategies. Specifically, IDEAL-Qsupports central tendency normalization, linear regressionnormalization, and quantile normalization (34).
IDEAL-Q also provides a handy user interface for outputvisualization, validation, and quantitation results, as shown bythe screen shot in Fig. 8. This output interface displays proteinand peptide lists with the calculated ratios and all identifica-tion information, annotated MS/MS spectra, visualization ofquantified peptide peaks, and other statistical charts. It alsofacilitates fast requantitation after the selection or removal ofuser-selected peptide ions. To enable users to prepare sup-plemental data from their quantitation results, several outputformats, including pdf, csv, and html formats, are supportedby IDEAL-Q.
Conclusion
In this study, we present a robust, generic data analysisplatform, called IDEAL-Q, for XIC-based label-free quanti-tative proteomics. It is compatible with different databasesearch engines and mass spectrometers. To avoid the time-
consuming computation required to align shifted peptidepeaks, we use the fragmental regression method to predictthe potential chromatographic shift and use signal process-ing techniques to detect unidentified peptides in all LC-MS/MS runs for peptide cross-assignment. Because of ac-curate elution time prediction, peptide/protein quantitationcoverage is increased substantially over that achieved bythe conventional identity-based approach. Furthermore, ap-plying rigorous SCI validation on detected peptide peakclusters can filter out overlapping peaks or noisy data toensure high quantitation accuracy. We demonstrated thequantitation performance of IDEAL-Q on a standard proteinmixture and a proteome scale by a replicate experiment onthe THP-1 cell line and manually validated results to furtherverify the performance of IDEAL-Q.
The results of triplicate LC-MS/MS analysis of the THP-1 cellson two different instruments show that IDEAL can accuratelypredict the elution time even when chromatographic shifts oc-cur, and SCI validation can effectively differentiate betweengood and poor spectral data quality. Because IDEAL-Q is ca-pable of rectifying huge chromatographic shifts and reducingsystematic errors via normalization techniques, it could be ap-plied to label-free comparative proteomics across instruments
FIG. 8. User interfaces of IDEAL-Q. A, the protein table, peptide table, and corresponding quantitation results. B, the visualization interfaceused to inspect data. C, the annotated MS/MS spectra show the status of peptide identification. D, the interface that displays statistical plots.E, comprehensive output results in different formats.
IDEAL-Q for Automated Label-free Quantitation Analysis
142 Molecular & Cellular Proteomics 9.1

or even laboratories. It would boost the applicability of label-freeproteomics significantly and reduce the cost of repetitive dataanalysis on different instruments. In addition, the robust align-ment approach significantly increases the quantitation cover-age. In summary, IDEAL-Q is an efficient and robust tool foraccurate label-free quantitation of protein expression andcompatible for label-free experiments with fractionationsteps. It is executable on the Windows platform and availablefor download.
* This work was supported in part by the thematic program ofAcademia Sinica under Grants AS94B003 and AS95ASIA02 and bythe National Science Council of Taiwan under Grants NSC 95-3114-P-002-005-Y, 97-2221-E-001-016-MY2, and 97-3112-B-001-011.
□S The on-line version of this article (available at http://www.mcponline.org) contains supplemental data, including all quantitationresults and annotated MS/MS spectra of the experiments describedin the paper.
� To whom correspondence may be addressed. Tel.: 886-2-2788-3799 (ext. 1711); Fax: 886-2-2782-4814; E-mail: [email protected].
** To whom correspondence may be addressed. Tel.: 886-2-2788-3799 (ext. 1804); Fax: 886-2-2782-4814; E-mail: [email protected].
REFERENCES
1. Gygi, S. P., Rist, B., Gerber, S. A., Turecek, F., Gelb, M. H., and Aebersold,R. (1999) Quantitative analysis of complex protein mixtures using iso-tope-coded affinity tags. Nat. Biotechnol. 17, 994–999
2. Ross, P. L., Huang, Y. N., Marchese, J. N., Williamson, B., Parker, K.,Hattan, S., Khainovski, N., Pillai, S., Dey, S., Daniels, S., Purkayastha, S.,Juhasz, P., Martin, S., Bartlet-Jones, M., He, F., Jacobson, A., andPappin, D. J. (2004) Multiplexed protein quantitation in Saccharomycescerevisiae using amine-reactive isobaric tagging reagents. Mol. Cell.Proteomics 3, 1154–1169
3. Yao, X., Freas, A., Ramirez, J., Demirev, P. A., and Fenselau, C. (2001)Proteolytic 18O labeling for comparative proteomics: model studies withtwo serotypes of adenovirus. Anal. Chem. 73, 2836–2842
4. Ong, S. E., Blagoev, B., Kratchmarova, I., Kristensen, D. B., Steen, H.,Pandey, A., and Mann, M. (2002) Stable isotope labeling by amino acidsin cell culture, SILAC, as a simple and accurate approach to expressionproteomics. Mol. Cell. Proteomics. 1, 376–386
5. Ong, S. E., and Mann, M. (2005) Mass spectrometry-based proteomicsturns quantitative. Nat. Chem. Biol. 1, 252–262
6. Stone, M. (1974) Cross-validatory choice and assessment of statisticalpredictions. J. R. Stat. Soc. Series B Stat. Methodol. 36, 111–147
7. Chelius, D., and Bondarenko, P. V. (2002) Quantitative profiling of proteinsin complex mixtures using liquid chromatography and mass spectrom-etry. J. Proteome Res. 1, 317–323
8. Bondarenko, P. V., Chelius, D., and Shaler, T. A. (2002) Identification andrelative quantitation of protein mixtures by enzymatic digestion followedby capillary reversed-phase liquid chromatography-tandem mass spec-trometry. Anal. Chem. 74, 4741–4749
9. Wang, W., Zhou, H., Lin, H., Roy, S., Shaler, T. A., Hill, L. R., Norton, S.,Kumar, P., Anderle, M., and Becker, C. H. (2003) Quantification of pro-teins and metabolites by mass spectrometry without isotopic labeling orspiked standards. Anal. Chem. 75, 4818–4826
10. Cutillas, P. R., Geering, B., Waterfield, M. D., and Vanhaesebroeck, B.(2005) Quantification of gel-separated proteins and their phosphorylationsites by LC-MS/MS using unlabeled internal standards: analysis of phos-phoprotein dynamics in a B cell lymphoma cell line. Mol. Cell. Proteomics4, 1038–1051
11. Cutillas, P. R., and Vanhaesebroeck, B. (2007) Quantitative profile of fivemurine core proteomes using label-free functional proteomics. Mol. Cell.Proteomics 6, 1560–1573
12. Park, S. K., Venable, J. D., Xu, T., and Yates, J. R., 3rd (2008) A quantitativeanalysis software tool for mass spectrometry-based proteomics. Nat.Methods 5, 319–322
13. Liu, H., Sadygov, R. G., and Yates, J. R., 3rd (2004) A model for randomsampling and estimation of relative protein abundance in shotgun pro-teomics. Anal. Chem. 76, 4193–4201
14. Washburn, M. P., Wolters, D., and Yates, J. R., 3rd (2001) Large-scaleanalysis of the yeast proteome by multidimensional protein identificationtechnology. Nat. Biotechnol. 19, 242–247
15. Old, W. M., Meyer-Arendt, K., Aveline-Wolf, L., Pierce, K. G., Mendoza, A.,Sevinsky, J. R., Resing, K. A., and Ahn, N. G. (2005) Comparison oflabel-free methods for quantifying human proteins by shotgun proteom-ics. Mol. Cell. Proteomics 4, 1487–1502
16. Jaffe, J. D., Mani, D. R., Leptos, K. C., Church, G. M., Gillette, M. A., andCarr, S. A. (2006) PEPPeR, a platform for experimental proteomic patternrecognition. Mol. Cell. Proteomics 5, 1927–1941
17. Radulovic, D., Jelveh, S., Ryu, S., Hamilton, T. G., Foss, E., Mao, Y., andEmili, A. (2004) Informatics platform for global proteomic profiling andbiomarker discovery using liquid chromatography-tandem mass spec-trometry. Mol. Cell. Proteomics 3, 984–997
18. Ono, M., Shitashige, M., Honda, K., Isobe, T., Kuwabara, H., Matsuzuki, H.,Hirohashi, S., and Yamada, T. (2006) Label-free quantitative proteomicsusing large peptide datasets generated by nanoflow liquid chromatog-raphy and mass spectrometry. Mol. Cell. Proteomics 5, 1338–1347
19. Li, X. J., Yi, E. C., Kemp, C. J., Zhang, H., and Aebersold, R. (2005) Asoftware suite for the generation and comparison of peptide arrays fromsets of data collected by liquid chromatography-mass spectrometry.Mol. Cell. Proteomics 4, 1328–1340
20. Palagi, P. M., Walther, D., Quadroni, M., Catherinet, S., Burgess, J., Zim-mermann-Ivol, C. G., Sanchez, J. C., Binz, P. A., Hochstrasser, D. F., andAppel, R. D. (2005) MSight: an image analysis software for liquid chro-matography-mass spectrometry. Proteomics 5, 2381–2384
21. Katajamaa, M., and Oresic, M. (2005) Processing methods for differentialanalysis of LC/MS profile data. BMC Bioinformatics 6, 179
22. Katajamaa, M., Miettinen, J., and Oresic, M. (2006) MZmine: toolbox forprocessing and visualization of mass spectrometry based molecularprofile data. Bioinformatics 22, 634–636
23. Bellew, M., Coram, M., Fitzgibbon, M., Igra, M., Randolph, T., Wang, P.,May, D., Eng, J., Fang, R., Lin, C., Chen, J., Goodlett, D., Whiteaker, J.,Paulovich, A., and McIntosh, M. (2006) A suite of algorithms for thecomprehensive analysis of complex protein mixtures using high-resolu-tion LC-MS. Bioinformatics 22, 1902–1909
24. Sadygov, R. G., Maroto, F. M., and Huhmer, A. F. (2006) ChromAlign: atwo-step algorithmic procedure for time alignment of three-dimensionalLC-MS/MS chromatographic surfaces. Anal. Chem. 78, 8207–8217
25. Prince, J. T., and Marcotte, E. M. (2006) Chromatographic alignment ofESI-LC-MS/MS proteomics data sets by ordered bijective interpolatedwarping. Anal. Chem. 78, 6140–6152
26. Prakash, A., Mallick, P., Whiteaker, J., Zhang, H., Paulovich, A., Flory, M.,Lee, H., Aebersold, R., and Schwikowski, B. (2006) Signal maps for massspectrometry-based comparative proteomics. Mol. Cell. Proteomics 5,423–432
27. Zimmer, J. S., Monroe, M. E., Qian, W. J., and Smith, R. D. (2006) Advancesin proteomics data analysis and display using an accurate mass and timetag approach. Mass Spectrom. Rev. 25, 450–482
28. Mueller, L. N., Rinner, O., Schmidt, A., Letarte, S., Bodenmiller, B.,Brusniak, M. Y., Vitek, O., Aebersold, R., and Muller, M. (2007) Super-Hirn—a novel tool for high resolution LC-MS-based peptide/protein pro-filing. Proteomics 7, 3470–3480
29. Andreev, V. P., Li, L., Cao, L., Gu, Y., Rejtar, T., Wu, S. L., and Karger, B. L.(2007) A New Algorithm Using Cross-Assignment for Label-Free Quan-titation with LC/LTQ-FT MS. J. Proteome Res. 6, 2186–2194
30. Ryu, S., Gallis, B., Goo, Y. A., Shaffer, S. A., Radulovic, D., and Goodlett,D. R. (2008) Comparison of a label-free quantitative proteomic methodbased on peptide ion current area to the isotope coded affinity tagmethod. Cancer Inform. 6, 243–255
31. Beausoleil, S. A., Jedrychowski, M., Schwartz, D., Elias, J. E., Villen, J., Li,J., Cohn, M. A., Cantley, L. C., and Gygi, S. P. (2004) Large-scalecharacterization of HeLa cell nuclear phosphoproteins. Proc. Natl. Acad.Sci. U.S.A. 101, 12130–12135
IDEAL-Q for Automated Label-free Quantitation Analysis
Molecular & Cellular Proteomics 9.1 143

32. Kubinyi, H. (1991) Calculation of isotope distributions in mass spectrome-try—a trivial solution for a nontrivial problem. Anal. Chim. Acta 247,107–119
33. De Boor, C. (1978) A Practical Guide to Splines, 1st Ed., pp. 114–115,Springer Verlag, New York
34. Callister, S. J., Barry, R. C., Adkins, J. N., Johnson, E. T., Qian, W. J.,
Webb-Robertson, B. J., Smith, R. D., and Lipton, M. S. (2006) Normal-ization approaches for removing systematic biases associated with massspectrometry and label-free proteomics. J. Proteome Res. 5, 277–286
35. Rorabacher, D. B. (1991) Statistical treatment for rejection of deviant val-ues: critical values of Dixon’s “Q” parameter and related subrange ratiosat the 95% confidence level. Anal. Chem. 63, 139–146
IDEAL-Q for Automated Label-free Quantitation Analysis
144 Molecular & Cellular Proteomics 9.1