ICT learning experience and research orientation as predictors of ICTskills and the ICTuse of...
45
ICT learning experience and research orientation as predictors of ICT skills and the ICT use of university students The final publication is available at http://link.springer.com/article/10.1007/s10639-014-9310-3 Verhoeven Jef C., Heerwegh Dirk & De Wit Kurt (2014) "ICT learning experience and research orientation as predictors of ICT skills and the ICT use of university students", Education and Information Technologies. 21 (1), 71-103. doi: 10.1007/s10639-014-9310-3 Jef C. Verhoeven, Dirk Heerwegh, Kurt De Wit CENTRE FOR SOCIOLOGICAL RESEARCH
Transcript of ICT learning experience and research orientation as predictors of ICTskills and the ICTuse of...
ICT learning experienceand research orientation aspredictors of ICT skills andthe ICT use of universitystudents
The final publication is available at http://link.springer.com/article/10.1007/s10639-014-9310-3
Verhoeven Jef C., Heerwegh Dirk & De Wit Kurt (2014) "ICT learning experience and research orientation as
predictors of ICT skills and the ICT use of university students", Education and Information Technologies. 21 (1),
71-103. doi: 10.1007/s10639-014-9310-3
Jef C. Verhoeven, Dirk Heerwegh, Kurt De Wit
CENTRE FOR SOCIOLOGICAL RESEARCH

3
The final publication is available at http://link.springer.com
ICT learning experience and research orientation as predictors of ICT skills and the ICT use ofuniversity students
Jef C. Verhoeven, Dirk Heerwegh, Kurt De Wit1
Abstract
Since our first studies of information and communications technology (ICT) skills and ICT use atuniversities in 2004, ICT and its use by students has changed greatly. In order to obtain a more detailedpicture of ICT skills, we first construct a new instrument to measure the self-perception of ICT skills (49items) and of ICT use (53 items) by students. This allows us to find some patterns for ICT skills and ICTuse. In order to explain these patterns, two basic hypotheses are formulated. The first suggests thatpositive ICT learning experiences at home, in school, and with peers could contribute to mastering ahigher level of ICT skills and more frequent use of ICT among bachelor’s students, a hypothesis thataligns with Dewey’s learning theory. The second hypothesis suggests that there is a similarity between thecharacteristics of information systems and scientific research, and that students who identify more withscientific research would be more likely to have greater ICT skills and a higher frequency of ICT use.
1 J. C. Verhoeven (*)
Centre for Sociological Research, University of Leuven, Parkstraat 45 bus 3601, 3000 Leuven,
Belgium
e-mail: [email protected]
D. Heerwegh
Leuven Statistic Research Centre, University of Leuven, Celestijnenlaan 200b bus 5307, 3001 Leuven
e-mail: [email protected]
K. De Wit
Office for Educational Policy, University of Leuven, Krakenstraat 3 bus 5200, 3000 Leuven, Belgium
e-mail: [email protected]
4
Both hypotheses are tested among bachelor’s students, using some important contextual variables (gender,domain of study, ICT course in secondary school or at university, and education level of parents). It can beconcluded that there is a relationship between the ICT learning experience and the research-orientedidentity commitment of bachelor’ students on the one hand, and their command of ICT skills and thefrequency of use of computers, ICT instruments, and ICT programs on the other.
1. Introduction
In spite of the ever-increasing number of applications for information and communications technology
(ICT) in modern society, numerous studies show that people still vary greatly with regard to their level of
ICT skills and how often they use ICT. Many reasons have been suggested to explain these differences,
such as gender, age, education, access to ICT, family culture, wealth, computer anxiety, belief in the
usefulness of computers, the difference between rural and urban areas, etc. (see for example, Broos 2005;
Becker 2006; Colley and Comber 2003; Wang et al. 2009; Carlsson et al. 2006; Chatzoglou et al. 2009;
Cho et al. 2009; Lee 2008; Lee 2010; Lee et al. 2009; Teo et al. 2009; Wu et al. 2007; Hargittai 2010;
Salajan et al. 2010).
Even when focusing on more homogeneous populations comprising higher education students, the
members of which are commonly referred to as ‘digital natives’, ICT skills and the use of ICT are found
to be far from equally distributed. Interestingly, ICT capacities do not necessarily improve over time (as
commonly assumed), but may actually diminish between first and senior year at the university (Kaminski
et al. 2009) or between first and 5th year in medical school (Strømsø et al. 2004), and it is not certain that
current cohorts are as skillful as those of some years ago (De Wit et al. 2012).
The ‘digital differentiation approach’ considers these differences to be the consequence of a process of
definition made by people using ICT (Peter and Valkenburg 2006; van Dijk 2006). According to this
perspective, some basic skills are required in order to make use of information technology, but what
people actually do with the technology depends on what they consider to be meaningful to themselves and
others. This explains why people who have had comparable access to computers and the Internet, may use
these instruments differently, which in turn may explain the existence of a gap between groups with regard
to their level of ICT skills and use of ICT equipment.
At the level of secondary and primary education, previous studies described below have shown a positive
association between certain types of ICT uses or skills and achievement in the fields of science and
mathematics, and negative associations between other types of ICT use and achievement in these fields.
Based on data collected among German and American secondary school students in 2000 for the
assessment PISA project by the OECD, Papanastasiou et al. (2005) found that students who used a PC at
5
home to produce papers attained higher achievements in science (see also Luu and Freeman 2011).
Kubiatko and Vlckova (2010) found a positive relationship between the science knowledge test and the
ICT familiarity test taken by secondary school students in the Czech Republic. Luu and Freeman (2011)
found that Internet browsing was positively related to scientific literacy. Similarly, Chen and Fu (2009)
observed that eighth-grade students in Taiwan who practiced online searching achieved better results in
the entrance exams for high school. Demir et al. (2010) found that Turkish secondary school students who
were more confident in using computers tended to have better scores for mathematics than those who were
less confident.
According to McMahon (2009), the use of ICT in classrooms can affect more general ‘higher order
thinking skills’. Based on a study among ninth-grade girls in Australia, he concluded that an ICT rich
environment is significantly correlated with the development of students’ critical thinking skills.
Moreover, students with better computer programming skills also scored higher for critical thinking.
However, some studies have shown a negative association between ICT skills and achievements in science
and/or mathematics. Luu and Freeman (2011) found that use of productivity and entertainment software
was negatively associated with scientific literacy. Akyol et al. (2010) made the observation that among
Turkish elementary school students, those who had a computer, or a computer with an Internet connection,
were more likely to get a lower score in science achievement. This was also observed by Won and Han
(2010). They used data collected within the TIMSS (Trends in Mathematics and Science Studies)
framework in 2003 among American and Korean secondary school students. Achievement was found to
be negatively associated with playing games on a computer after controlling for the number of books at
home and the education level of the parents (see also Eow et al. 2009). Chen and Fu (2009) studied the
effects of ICT use on high school entry exam results. They found that when students used the Internet for
socializing and game playing, the results tended to be lower. Papanastasiou et al. (2005) found that
students who had access to a computer at school, and who frequently used this for programming, had
lower levels of achievement in science.
Former studies have shown that at least ICT use might be positively related with achievement in science
subjects and improved critical thinking among young students, but have not investigated this link at the
level of university education. Accepting that the study of science familiarizes students with the
procedures of scientific research, we can hypothesize that students interested in scientific research will
also be interested in the knowledge and application of ICT. In this current research, based on theoretical
considerations presented in the next section we expect to find an association between the level of
command of ICT skills and ICT use, and the degree to which university students are research oriented. As
explained in the methodology section, on the basis of a questionnaire filled out by 1,232 bachelor’s
students, we investigate the association between ICT use and skills, and research orientation, taking into
account the ICT learning experiences of the students and some important contextual variables such as
6
gender, the education level of the parents, and the domain of study. Section 4 presents a short overview of
students’ access to PCs and the internet, their learning experiences, and their attitudes toward scientific
research. In Sections 5 and 6, both the learning experience model and the identity commitment model are
tested as predictors of, respectively, ICT skills and the frequency of ICT use. In the final sections, we
discuss the results, draw some conclusions, and refer to some implications.
2. Theory
2.1. The role of experiential learning
Learning is not limited to formal learning organizations such as schools, but takes place in all kinds of
situations where people meet each other (Cox 2012). From a very young age, children experience pleasure
when they are capable of doing what others do. They feel they belong to a particular group because they
can act like the other group members, whether family members or playmates (Dewey 1933: 206, 257).
Unmistakably, John Dewey (1933: 258; 1938: 236; Kolb and Kolb 2005) stressed the power of experience
in this learning process. He emphasized the advantage of belonging to a group where the objective of
learning is highly appreciated (Dewey 1933: 38; Dewey 1938: 25) and he underlined the capacity of this
to stimulate the motivation to learn more about what people need in order to function in a group. These
opinions are shared by other researchers. Jeffrey et al. (2011) refer to several other researchers in stressing
the importance of the personal relevance of the learning content for a successful learning process. This
also partly explains success in learning ICT. Although in many countries ICT is formally taught in
schools, an important part of ICT knowledge is gained at home or among friends. In Western societies,
ICT is widespread and computers and the Internet have a place in many families. Parents and siblings play
an important role in making this technology accepted. Children discover how much fun it is to play games
on the computer and, more importantly, feel that learning how to work with ICT instruments is also highly
appreciated by parents and siblings.
Research has shown that the ICT experience of children at home is very important, certainly for their ICT
skills in primary school (Anastasiades et al. 2008; Aslanidou and Menexes 2008; Barron et al. 2010;
Vekiri, 2010a; Zhao et al. 2010). Because of this, Dewey would probably not use the term digital natives,
as ICT activities are not native, but learned in interaction with others. Nevertheless, this does not mean
that all children take advantage of the presence of computers at home or in the possession of friends to the
same extent. In the above-mentioned research, differences are observed between urban and rural areas,
and between middle-class and other families, with urban and middle-class families showing more open
access to a computer and the Internet, and a higher command of ICT skills and the ability to work with the
Internet than other families. One of the reasons is that in more modernized areas and in middle-class
families, the necessary equipment is more prevalent and gives children more opportunities to experience
using a PC and the Internet. Children whose parents work with a computer for their job also seem to
7
benefit from this (Barron et al. 2010). Boys seem to have more positive experiences with ICT than girls
do, as they have more opportunities to experiment with a computer (Vekiri 2010b; Volman and Van Eck,
2001). Vekiri and Chronaki (2008) suggest that the stereotypes parents share about boys and girls have
contributed to the gender gap in using a computer or the Internet. Parents socialize their sons and
daughters differently and this has consequences with regard to the gender gap in ICT skills.
Vekiri and Chronaki (2008; Vekiri 2010a) mention research where the link between the socio-economic
position of the parents of the students and ICT use is supported in elementary schools and in secondary
and higher education. However, using regression analysis, they came to the conclusion that home
computer access, frequency of use, variety of activity, and perceived parental and peer support were not or
were just marginally related to students’ self-efficacy and value beliefs. Similar critical observations were
made by Verhoeven et al. (2010) and De Wit et al. (2012). In a regression model where in addition to
social background (the socio-economic position and education level of the parents of the students), the
variables of usefulness and control of the computer, computer anxiety, and Internet competence were
included in explaining the frequency of use of computers for study, chatting, and games by secondary
school students, no substantial relationship was found with social background. The only relationship found
was a lower frequency of computer use for recreation by working-class students compared with other
students. The same phenomenon was observed by these authors among university freshmen. The socio-
economic position of the students in combination with other variables showed a minor influence on the
ICT skills and the frequency of ICT use of university freshmen. This indicates that influences experienced
at a very young age do not always have apparent consequences in secondary school and university.
Moreover, De Wit et al. (2012) also found that the effect of influence might change over years. For
example, they found that in 2005, students whose father or mother had completed higher education were
less capable of installing a computer than other students were, but that this relationship was the opposite in
2009. In addition, in 2005 students whose father had completed higher education chatted more online than
other students, and those whose mother had completed higher education chatted less. In 2009 both
relationships were reversed. In other words, situational developments might change previous relationships.
Peers also play a role in learning about ICT and the Internet. Vekiri (2010a) found support in relevant
literature for the hypothesis that lower-class children take even more advantage of their peers than other
children do, because peers could compensate for what they could not find at home. This has been
confirmed in our own research among university freshmen (Verhoeven et al. 2010). Students mention
friends as the second most important source of instruction about ICT (mean score = 3.29 on a scale of 1 to
5). Nevertheless, students overwhelmingly consider themselves as the most important instructors of ICT
for themselves (mean score = 4.02), thereby offering a good example of what J. Dewey would call agents,
not simple receptors (Dewey 1917; Evans 2000).
8
This leads to the hypothesis that students whose families, peers, and teachers more intensely support
contact with and instruction about ICT, will possess more developed ICT skills and will use ICT more
often than students who did not grow up in such an ICT-oriented environment. Nevertheless, based on
relevant literature, this relationship is not expected to be very strong.
2.2. The role of students’ identity commitment
Earlier research has indicated that the vocational orientation of university students significantly influences
the use of ICT and the command of ICT skills (Verhoeven et al. 2010; De Wit et al. 2012). Vocational
orientation could be called a form of commitment, as defined by Burke and Reitzes (1991) in the
following way: “(it) refers to the sum of the forces, pressures, or drives that influence people to maintain
congruity between their identity setting and the input of reflected appraisals from the social setting”. The
identity setting of a university student is, among other things, composed of a belief in his or her academic
competence, a vocational orientation (studying for a particular profession), and an orientation toward
becoming a scientific researcher or another professional. Interactions with others may support or blur this
identity and can influence a student to pursue or abandon these intentions. If the identity commitment is
strong, a student will adhere to the expectations of the group that link him or her to a particular identity
setting. A student who benefits significantly from living close to this student setting will very probably be
more committed to that identity than other students. Burke and Reitzes (1991) discerned two bases of
commitment. First, cognitive bases refer to positive rewards coming from interacting with people as a
result of maintaining the expected identity. Assuming that a student has an elementary knowledge of ICT,
stimulating the appraisal of other students might motivate a student to work harder toward mastering ICT
skills. Second, socio-emotional bases refer to ties between people who share the same position and
experience the recognition of others as supportive confirmation of the adequacy of their behavior. When a
student experiences the acceptance of other students, he or she will most likely try to maintain interactions
with these positive, rewarding colleagues.
A stronger commitment to a professional career in research or in another area, and a belief that ICT will
be a necessary or inevitable component of a future career, might lead students to have a stronger
commitment to using ICT and using it more frequently. Moreover, using ICT involves taking a number of
steps that are also part of carrying out scientific research. This similarity might add (albeit not at a
conscious level) to a stronger link between training in scientific research as a part of an identity setting,
and knowledge of ICT skills and the use of ICT.
Scientific research has characteristics similar to that of an information system, which Zwass (2012)
defined as: “an integrated set of components for collecting, storing, and processing data and for delivering
information, knowledge, and digital products”. Scientific research starts with the question of why a
particular phenomenon is what it is or why it functions in the way that it does. Researchers start with some
9
hypothetical explanations and collect data in order to test whether a hypothesis is proven or found to be
incorrect. Observations, methodologies, and interpretations are stored, because there should always be an
opportunity to check and recheck the research data and results. It is also important to have an instrument
in order to rapidly retrieve any data that researchers might be interested in. The process of scientific
research does not stop there. Results should be made available to colleagues and a wider audience; they
should be publically displayed. Research is also expected to be useful (See also Pole and Lampard, 2002).
This all takes place in collaboration and in discussion with the wider scientific community. Researchers
collaborate locally but also internationally. Datasets are transmitted from one continent to another,
discussed by researchers who live far away from each other, but jointly publish in journals that are read
throughout the world. They meet at international seminars and conferences, teach each other’s students,
engage in common projects, etc. In other words, scientific research shares many characteristics of
information systems as described by O’Brien and Marakas (2009: 4): “An information system can be any
organized combination of people, hardware, software, communications networks, data resources, and
policies and procedures that stores, retrieves, transforms, and disseminates information in an
organization”. Each information system comprises some basic activities. In order to obtain information
that has to be processed, a worker needs instruments to capture this information (for instance, a keyboard
or a scanner). This captured information has to be transmitted or processed to another device (for instance,
another PC in a network) in order to work with it later. Therefore, it has to be stored (for instance, on a
hard disk or a USB stick). When needed in a later process, this information needs to be retrieved. This
procedure takes the results of the storage process and uses them to elaborate the information. The old
information (output information products) is used to create new information, to reorganize the
information, to recalculate what has been retrieved, or similar operations. At the end of this process, the
results are shown to an observer who might be interested in the results of analyzing the information. At the
end of the input, processing, output, and storage, a control of the system performance should be
established.
This brings us to the hypothesis that students who are interested in scientific research and/or want to
become researchers will be more open to mastering ICT skills and/or will make greater use of computers
and the Internet for their studies than other students will. Indeed, ICT offers them useful instruments for
attaining the targets that researchers have in mind and helps them to be rewarded for showing a
commitment to their identity setting.
3. Methodology
Data for this project was gathered through an online questionnaire filled out by bachelor’s students at the
University of Leuven (KU Leuven), which is one of the largest Belgian universities. It is a comprehensive
university with a wide range of scientific disciplines and domains of study. Although the university
buildings are spread across the town, the university has a well-developed intranet system offering
10
broadband Internet access to all students, even those in private rented accommodation. In 2012, the
university was attended by 40,257 students, among whom 45% were studying at bachelor’s level, 31% at
master’s level, and 11% were working for a PhD. In this project, we focus on bachelor’s students who had
passed their first-year exams and would not take their final bachelor’s exam in 2013. This is a population
comprising 3,609 students. Most of them had been at the university for at least a year and were supposed
to be familiar with the ICT equipment of the university and the expectations of the staff concerning ICT
use in and outside classes. Some 1,232 students answered an online questionnaire between 13 November
2012 and 18 December 2012. Students received up to two e-mail reminders after an initial e-mail
invitation to participate in the survey. The analysis used here involves 1,180 students who responded to at
least 75% of the questions and fell within the age range of up to 25. Because the multivariate sample
distribution for gender, age, and faculty deviated to some extent from the population distribution, a
weighting factor was calculated by iterative proportional fitting.
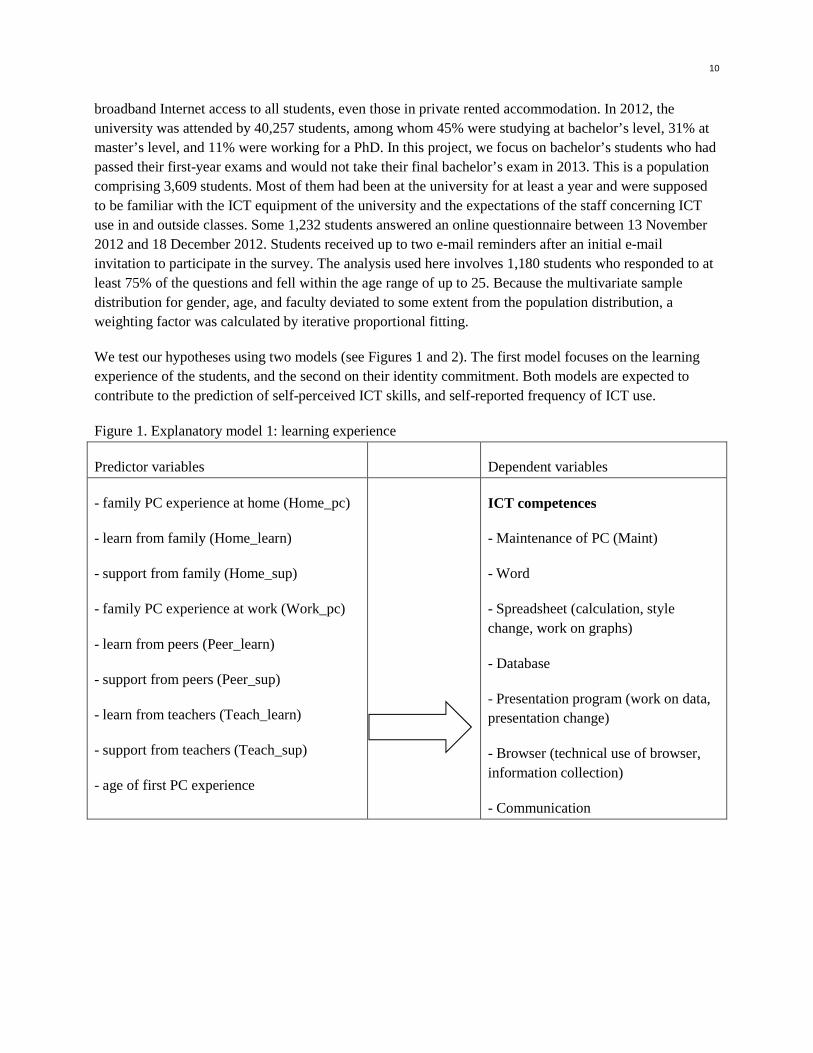
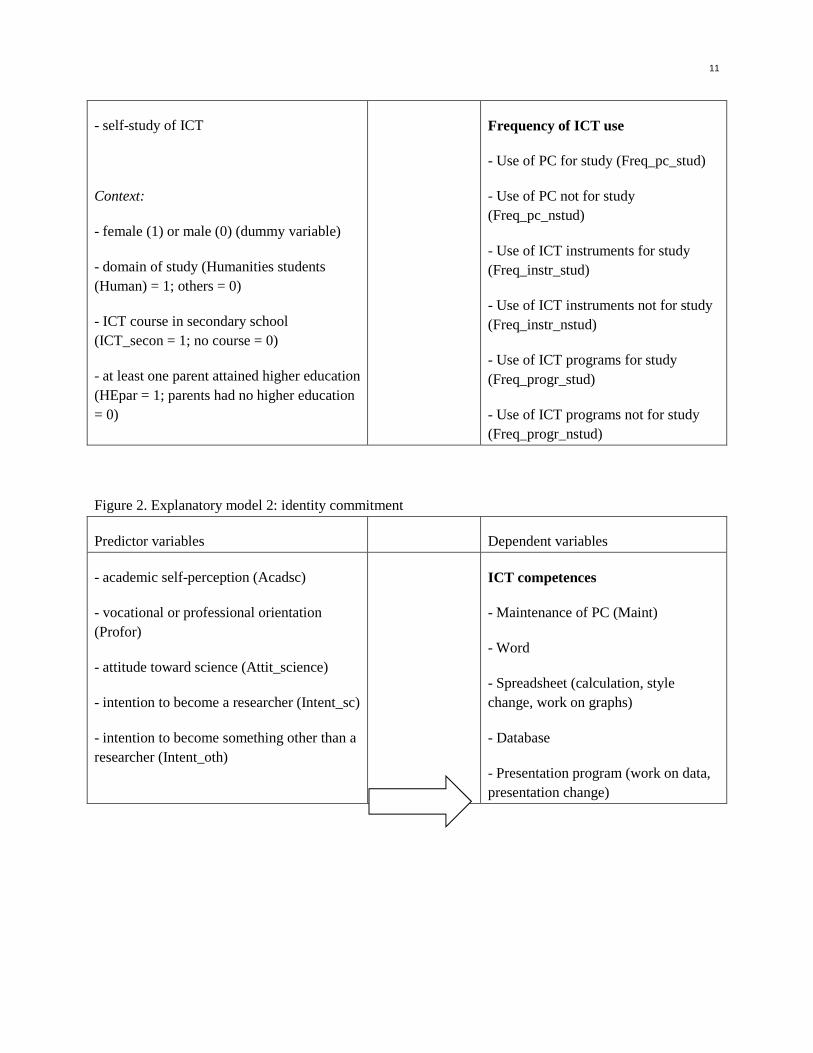
We test our hypotheses using two models (see Figures 1 and 2). The first model focuses on the learning
experience of the students, and the second on their identity commitment. Both models are expected to
contribute to the prediction of self-perceived ICT skills, and self-reported frequency of ICT use.
Figure 1. Explanatory model 1: learning experience
Predictor variables Dependent variables
- family PC experience at home (Home_pc)
- learn from family (Home_learn)
- support from family (Home_sup)
- family PC experience at work (Work_pc)
- learn from peers (Peer_learn)
- support from peers (Peer_sup)
- learn from teachers (Teach_learn)
- support from teachers (Teach_sup)
- age of first PC experience
ICT competences
- Maintenance of PC (Maint)
- Word
- Spreadsheet (calculation, style
change, work on graphs)
- Database
- Presentation program (work on data,
presentation change)
- Browser (technical use of browser,
information collection)
- Communication
11
- self-study of ICT
Context:
- female (1) or male (0) (dummy variable)
- domain of study (Humanities students
(Human) = 1; others = 0)
- ICT course in secondary school
(ICT_secon = 1; no course = 0)
- at least one parent attained higher education
(HEpar = 1; parents had no higher education
= 0)
Frequency of ICT use
- Use of PC for study (Freq_pc_stud)
- Use of PC not for study
(Freq_pc_nstud)
- Use of ICT instruments for study
(Freq_instr_stud)
- Use of ICT instruments not for study
(Freq_instr_nstud)
- Use of ICT programs for study
(Freq_progr_stud)
- Use of ICT programs not for study
(Freq_progr_nstud)
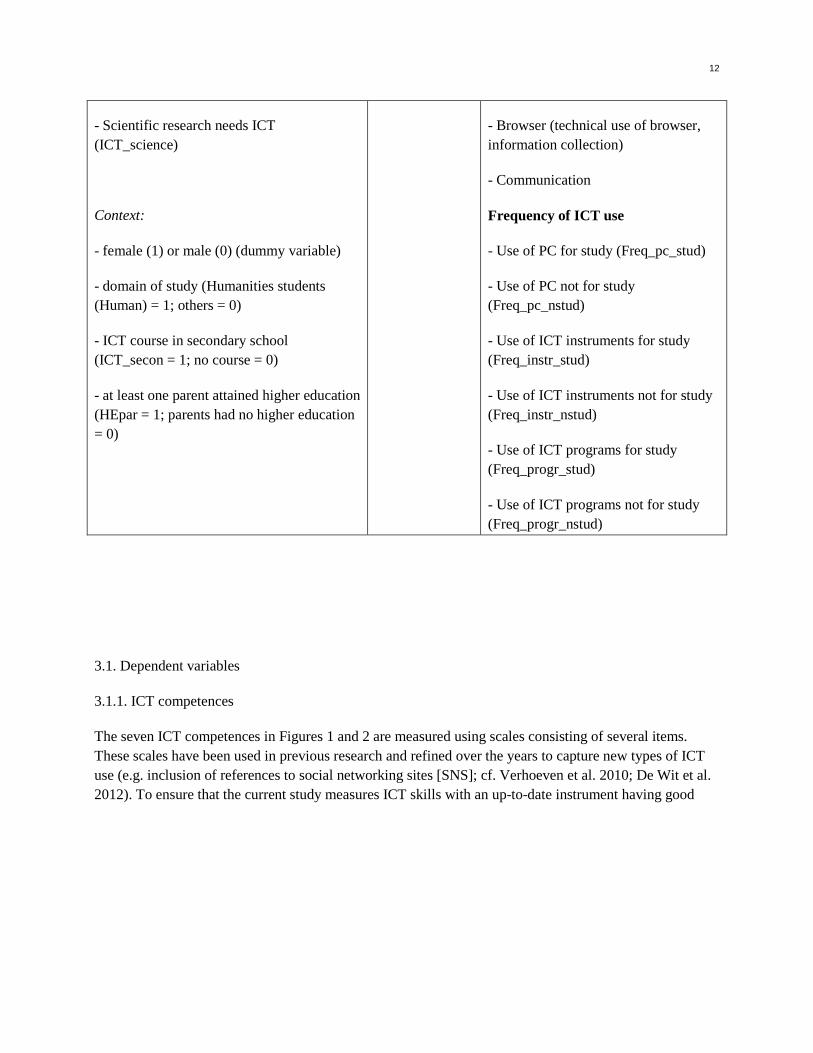
Figure 2. Explanatory model 2: identity commitment
Predictor variables Dependent variables
- academic self-perception (Acadsc)
- vocational or professional orientation
(Profor)
- attitude toward science (Attit_science)
- intention to become a researcher (Intent_sc)
- intention to become something other than a
researcher (Intent_oth)
ICT competences
- Maintenance of PC (Maint)
- Word
- Spreadsheet (calculation, style
change, work on graphs)
- Database
- Presentation program (work on data,
presentation change)
12
- Scientific research needs ICT
(ICT_science)
Context:
- female (1) or male (0) (dummy variable)
- domain of study (Humanities students
(Human) = 1; others = 0)
- ICT course in secondary school
(ICT_secon = 1; no course = 0)
- at least one parent attained higher education
(HEpar = 1; parents had no higher education
= 0)
- Browser (technical use of browser,
information collection)
- Communication
Frequency of ICT use
- Use of PC for study (Freq_pc_stud)
- Use of PC not for study
(Freq_pc_nstud)
- Use of ICT instruments for study
(Freq_instr_stud)
- Use of ICT instruments not for study
(Freq_instr_nstud)
- Use of ICT programs for study
(Freq_progr_stud)
- Use of ICT programs not for study
(Freq_progr_nstud)
3.1. Dependent variables
3.1.1. ICT competences
The seven ICT competences in Figures 1 and 2 are measured using scales consisting of several items.
These scales have been used in previous research and refined over the years to capture new types of ICT
use (e.g. inclusion of references to social networking sites [SNS]; cf. Verhoeven et al. 2010; De Wit et al.
2012). To ensure that the current study measures ICT skills with an up-to-date instrument having good
13
measurement properties, new items were added to our existing scales and the complete measurement
instrument was subjected to a pilot test.
Based on a review of several instruments, in particular ECDL Syllabus 5.0 (ECDL 2010), new items were
developed. A paper questionnaire containing the existing and new items (a total of 123 items: 19 for
maintenance of a PC; 19 for word processing; 24 for spreadsheets; 20 for databases; 17 for presentation
software; 13 for browsers; and 11 for communication) was tested in a non-random sample of 85 university
students. The response format for all items was identical (a five-point Likert-type rating scale ranging
from ‘totally not true for me’ to ‘totally true for me’ with the midpoint ‘more or less true for me’).
The resulting data was analyzed using exploratory factor analysis (EFA) and confirmatory factor analysis
(CFA) in Mplus version 4.0. The EFA was used to identify appropriate items and the CFA was conducted
primarily to assess goodness of fit. The selection of the final items was based on the results of the factor
analyses and an evaluation of the distribution of the individual items (items with strong ceiling or floor
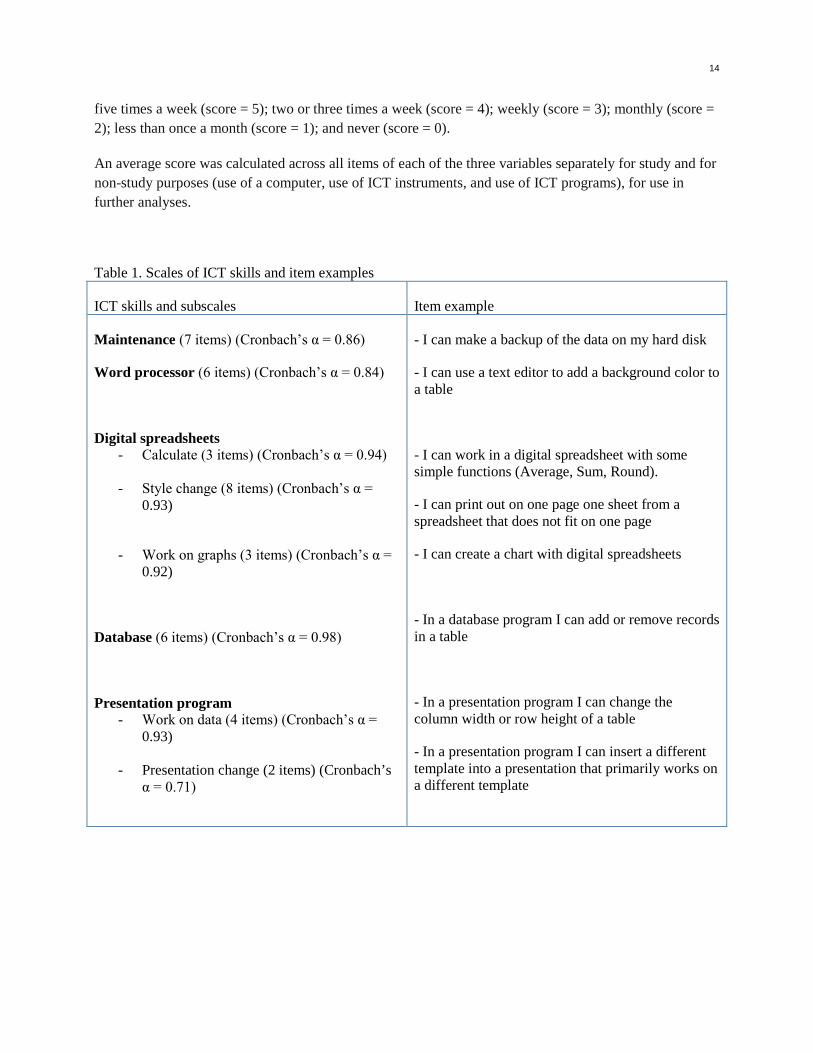
effects were deleted). In total, 49 items were included in the final questionnaire. The items were
distributed over the seven ICT skill domains as follows: 7 for maintenance of the PC; 6 for word
processing; 14 for spreadsheets; 6 for databases; 6 for presentation software; 7 for browsers; and 3 for
communication (see Table 1).
The data obtained from the main survey (1,180 students) was subjected to confirmatory factor analysis
(CFA) in Mplus version 4.0. The model tested the theoretically expected structure and proved to fit the
data well (CFI (comparative fit index) = 0.95; TLI (Tucker Lewis Index) = 0.95; RMSEA (root mean
square of error approximation) = 0.030; SRMR (standardized root mean square residual) = 0.040). This
model includes three substantively defensible error covariances. Regression-based factor scores were
calculated with SAS PROC FACTOR (for each scale separately) and are used in further analyses
(DiStefano et al. 2009).
3.1.2. Frequency of ICT use
The frequency with which students use a computer, ICT instruments (hardware), and ICT programs
(software) was measured separately for study purposes and for all other purposes. Students were asked
how frequently they engaged in specific behavior (surfing the Internet, e-mailing, chatting, goal-oriented
online searching, downloading movies or music, participating in newsgroups, writing blogs or wikis, and
playing games – the last item was not asked when gauging ICT use for study purposes), how often they
used ICT hardware (use of a PC or laptop, Internet, mobile, iPad or tablet, iPod, iPhone or smartphone,
digital camera, and e-reader), and how often they used specific software (word processing, spreadsheets,
databases, SNS, Twitter, virtual learning environments, drawing software, statistical programs, qualitative
data analysis programs, and specialized software). The response options were: daily (score = 6); four to
14
five times a week (score = 5); two or three times a week (score = 4); weekly (score = 3); monthly (score =
2); less than once a month (score = 1); and never (score = 0).
An average score was calculated across all items of each of the three variables separately for study and for
non-study purposes (use of a computer, use of ICT instruments, and use of ICT programs), for use in
further analyses.
Table 1. Scales of ICT skills and item examples
ICT skills and subscales Item example
Maintenance (7 items) (Cronbach’s α = 0.86)
Word processor (6 items) (Cronbach’s α = 0.84)
Digital spreadsheets- Calculate (3 items) (Cronbach’s α = 0.94)
- Style change (8 items) (Cronbach’s α = 0.93)
- Work on graphs (3 items) (Cronbach’s α = 0.92)
Database (6 items) (Cronbach’s α = 0.98)
Presentation program- Work on data (4 items) (Cronbach’s α =
0.93)
- Presentation change (2 items) (Cronbach’sα = 0.71)
- I can make a backup of the data on my hard disk
- I can use a text editor to add a background color toa table
- I can work in a digital spreadsheet with somesimple functions (Average, Sum, Round).
- I can print out on one page one sheet from aspreadsheet that does not fit on one page
- I can create a chart with digital spreadsheets
- In a database program I can add or remove recordsin a table
- In a presentation program I can change thecolumn width or row height of a table
- In a presentation program I can insert a differenttemplate into a presentation that primarily works ona different template
15
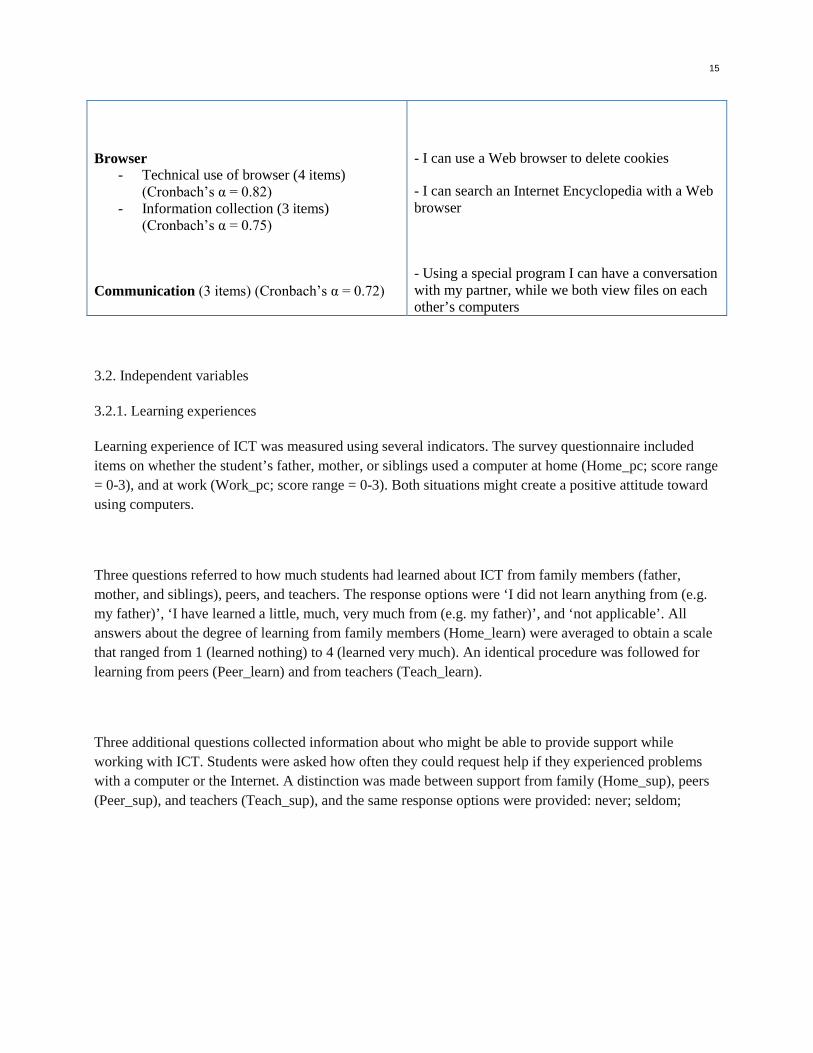
Browser- Technical use of browser (4 items)
(Cronbach’s α = 0.82) - Information collection (3 items)
(Cronbach’s α = 0.75)
Communication (3 items) (Cronbach’s α = 0.72)
- I can use a Web browser to delete cookies
- I can search an Internet Encyclopedia with a Webbrowser
- Using a special program I can have a conversationwith my partner, while we both view files on eachother’s computers
3.2. Independent variables
3.2.1. Learning experiences
Learning experience of ICT was measured using several indicators. The survey questionnaire included
items on whether the student’s father, mother, or siblings used a computer at home (Home_pc; score range
= 0-3), and at work (Work_pc; score range = 0-3). Both situations might create a positive attitude toward
using computers.
Three questions referred to how much students had learned about ICT from family members (father,
mother, and siblings), peers, and teachers. The response options were ‘I did not learn anything from (e.g.
my father)’, ‘I have learned a little, much, very much from (e.g. my father)’, and ‘not applicable’. All
answers about the degree of learning from family members (Home_learn) were averaged to obtain a scale
that ranged from 1 (learned nothing) to 4 (learned very much). An identical procedure was followed for
learning from peers (Peer_learn) and from teachers (Teach_learn).
Three additional questions collected information about who might be able to provide support while
working with ICT. Students were asked how often they could request help if they experienced problems
with a computer or the Internet. A distinction was made between support from family (Home_sup), peers
(Peer_sup), and teachers (Teach_sup), and the same response options were provided: never; seldom;
16
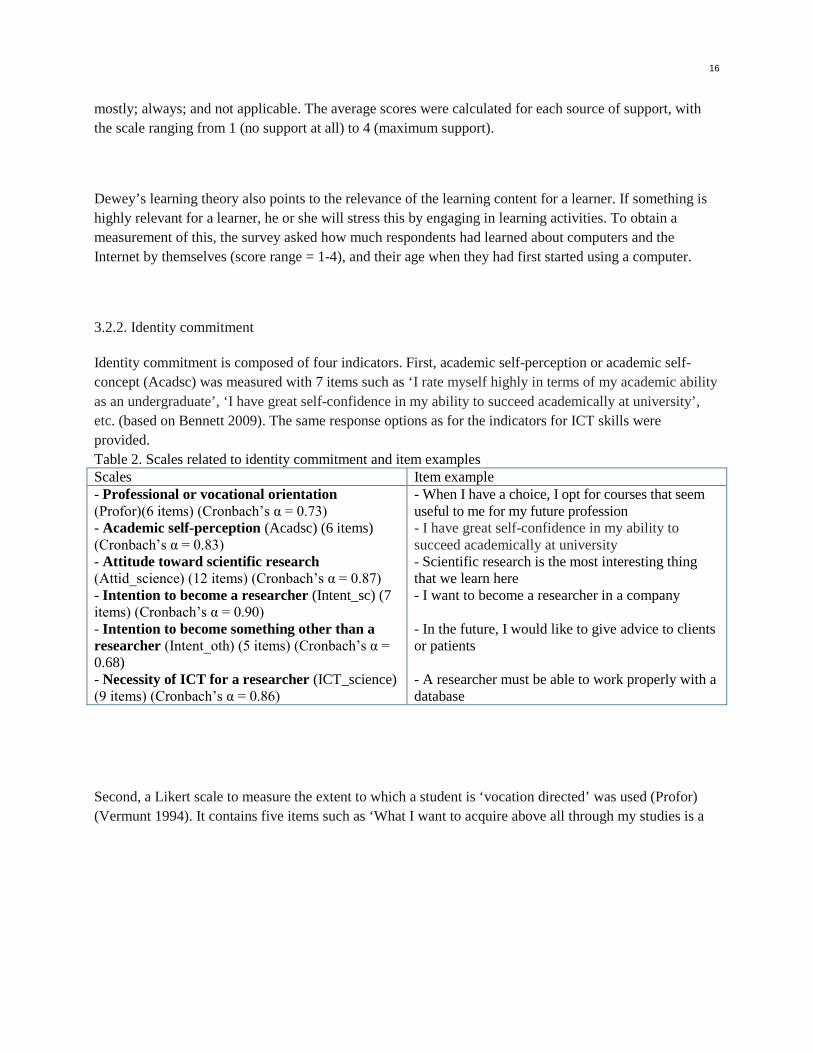
mostly; always; and not applicable. The average scores were calculated for each source of support, with
the scale ranging from 1 (no support at all) to 4 (maximum support).
Dewey’s learning theory also points to the relevance of the learning content for a learner. If something is
highly relevant for a learner, he or she will stress this by engaging in learning activities. To obtain a
measurement of this, the survey asked how much respondents had learned about computers and the
Internet by themselves (score range = 1-4), and their age when they had first started using a computer.
3.2.2. Identity commitment
Identity commitment is composed of four indicators. First, academic self-perception or academic self-
concept (Acadsc) was measured with 7 items such as ‘I rate myself highly in terms of my academic ability
as an undergraduate’, ‘I have great self-confidence in my ability to succeed academically at university’,
etc. (based on Bennett 2009). The same response options as for the indicators for ICT skills were
provided.
Table 2. Scales related to identity commitment and item examplesScales Item example- Professional or vocational orientation(Profor)(6 items) (Cronbach’s α = 0.73) - Academic self-perception (Acadsc) (6 items)(Cronbach’s α = 0.83) - Attitude toward scientific research(Attid_science) (12 items) (Cronbach’s α = 0.87) - Intention to become a researcher (Intent_sc) (7items) (Cronbach’s α = 0.90) - Intention to become something other than aresearcher (Intent_oth) (5 items) (Cronbach’s α = 0.68)- Necessity of ICT for a researcher (ICT_science)(9 items) (Cronbach’s α = 0.86)
- When I have a choice, I opt for courses that seemuseful to me for my future profession- I have great self-confidence in my ability tosucceed academically at university- Scientific research is the most interesting thingthat we learn here- I want to become a researcher in a company
- In the future, I would like to give advice to clientsor patients
- A researcher must be able to work properly with adatabase
Second, a Likert scale to measure the extent to which a student is ‘vocation directed’ was used (Profor)
(Vermunt 1994). It contains five items such as ‘What I want to acquire above all through my studies is a
17
professional skill’, ‘the main goal I pursue in my studies is to prepare myself for a profession’, etc. and
could be answered with the same response options as the academic self-perception scale.
A CFA was conducted on the items intended to measure academic self-perception and being vocation
directed. There was one item that loaded on both factors and in addition had low standardized factor
loadings (<0.40), it was therefore removed from the CFA analysis. Two error covariances were allowed in
the final model (CFI = 0.97; TLI = 0.96; RMSEA = 0.047; SRMR = 0.044). With regard to the ICT skills
scales, SAS PROC FACTOR was used to calculate regression based factor scores for use in further
analyses.
Third, in order to measure the attitude toward scientific research, a Likert scale was developed with 12
items, such as: ‘Scientific research is fun’, ‘I would enjoy school more if they did not bother us with
scientific research’, etc. The list of scales for appraising science or some disciplines is very varied (see for
example Wareing 1982; Wareing 1990; Germann 1988; McCleary and Brown 2003; Tuan et al. 2005;
George 2006; Kind et al. 2007; McCloskey 2008; Bennett and Hogarth 2009). We followed a scale used
by Cheung (2009) concerning the appraisal of chemistry by secondary school students, but adapted the
items for the appraisal of scientific research (attit_science). This scale also differs from Cheung’s scale by
including negatively worded items. EFA using SAS PROC FACTOR shows that the 12 items form a good
scale, and the regression-based factor scores are used in further analyses (see Table 2).
Fourth, 13 survey items were included that gauged the students’ intentions regarding their later
professional life. Example items include: ‘In my professional life I want to conduct scientific research’,
‘In my professional life I want to teach’, and ‘In my professional life I would prefer to work with people’.
EFA with SAS PROC FACTOR shows that two dimensions exist in these items: one refers to the
intention of a student to become a researcher (Intent_sc; 7 items), the second to the intention to pursue a
career other than research (Intent_oth; 5 items). One survey item did not load well on either dimension
and was left out of the analysis. Regression based factor scores were calculated with PROC FACTOR and
are used in subsequent analyses.
Our hypothesis was that students who are more research oriented will also have a higher level of ICT
skills and use ICT more often than other students. We took into account that this relationship might not be
18
equally strong for all study disciplines, and therefore included items to measure the extent to which
students themselves are convinced that ICT is necessary for a scientific researcher. This information was
collected with nine items such as: ‘Today a scientific researcher cannot work properly without a
computer’, ‘A scientific researcher should be capable of working properly with database software’, etc.
(ICT_science). EFA using SAS PROC FACTOR supports our expectation that these nine items form a
good scale and also provides regression-based factor scores for use in further analyses.
3.2.3. Contextual variables
Research has shown that there are still factors that might create inequality of opportunities for some
categories of the population (see Section 1). Former research indicates the importance of gender, domain
of study, taking an ICT course in secondary school, attending classes at the university where a computer is
used, and the education level of parents for the development of ICT skills and the frequency of ICT use by
students (Verhoeven et al. 2010; De Wit et al. 2012).
Gender is included as dummy variable (female = 1, male = 0). With regard to the domain of study, we
expect that science and bio-medical students (score = 0 for the dummy Human) will be more skilled in and
more engaged in ICT activities than humanities students (score = 1 for the dummy Human). Having
attended classes dedicated to ICT in secondary school and at university might also stimulate students’ ICT
skills and frequency of ICT use. Two dummy variables (one for secondary school and one for university)
are included in the models (0 = did not attend at least one ICT class, 1 = did attend at least one ICT class).
At university, this dummy refers to attending classes where a computer is used by the students.
Similar to many other opportunities in life, living in a well-to-do family creates more opportunities for
easy and comprehensive access to ICT at home. Belonging to a particular social class creates or
diminishes opportunities. While it is recognized that social class is a complex concept, we opt for the
education level of the parents as a crude indicator of social class. Students with at least one parent with a
college or university degree were coded 1 on the dummy variable HEpar, while 0 refers to other students.
3.2.4. Inspection of the distribution of dependent variables
19
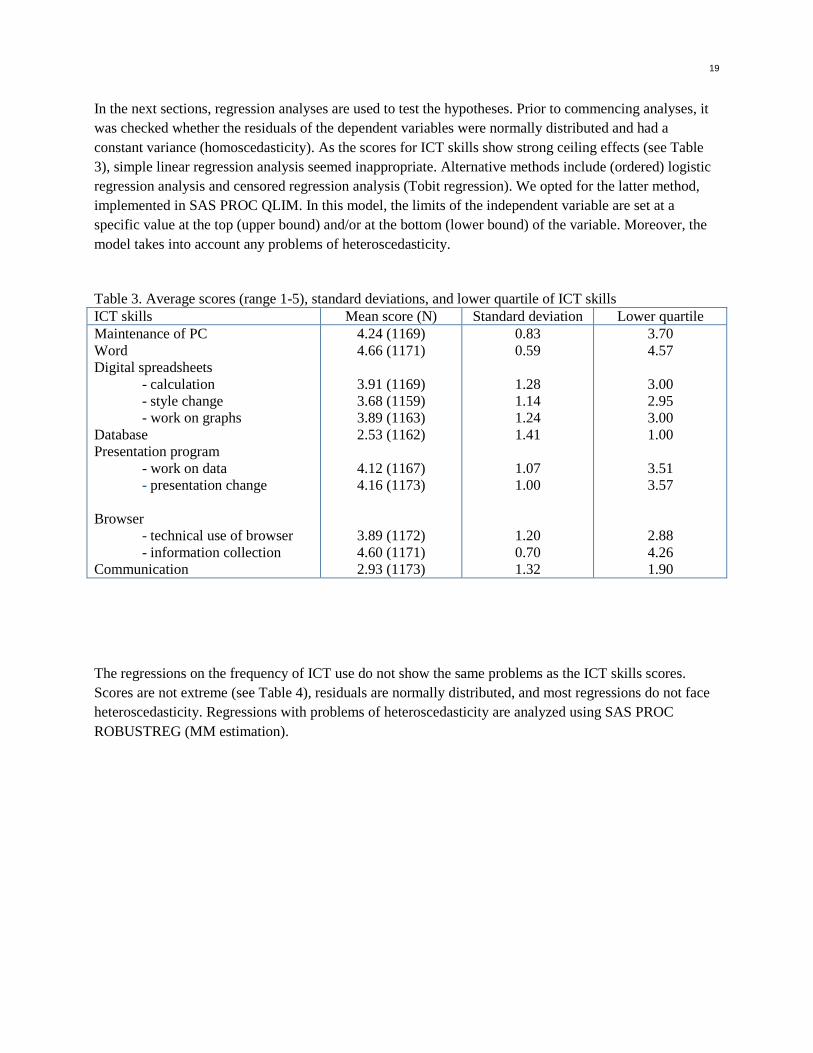
In the next sections, regression analyses are used to test the hypotheses. Prior to commencing analyses, it
was checked whether the residuals of the dependent variables were normally distributed and had a
constant variance (homoscedasticity). As the scores for ICT skills show strong ceiling effects (see Table
3), simple linear regression analysis seemed inappropriate. Alternative methods include (ordered) logistic
regression analysis and censored regression analysis (Tobit regression). We opted for the latter method,
implemented in SAS PROC QLIM. In this model, the limits of the independent variable are set at a
specific value at the top (upper bound) and/or at the bottom (lower bound) of the variable. Moreover, the
model takes into account any problems of heteroscedasticity.
Table 3. Average scores (range 1-5), standard deviations, and lower quartile of ICT skillsICT skills Mean score (N) Standard deviation Lower quartileMaintenance of PCWordDigital spreadsheets
- calculation- style change- work on graphs
DatabasePresentation program
- work on data- presentation change
Browser- technical use of browser- information collection
Communication
4.24 (1169)4.66 (1171)
3.91 (1169)3.68 (1159)3.89 (1163)2.53 (1162)
4.12 (1167)4.16 (1173)
3.89 (1172)4.60 (1171)2.93 (1173)
0.830.59
1.281.141.241.41
1.071.00
1.200.701.32
3.704.57
3.002.953.001.00
3.513.57
2.884.261.90
The regressions on the frequency of ICT use do not show the same problems as the ICT skills scores.
Scores are not extreme (see Table 4), residuals are normally distributed, and most regressions do not face
heteroscedasticity. Regressions with problems of heteroscedasticity are analyzed using SAS PROC
ROBUSTREG (MM estimation).
20
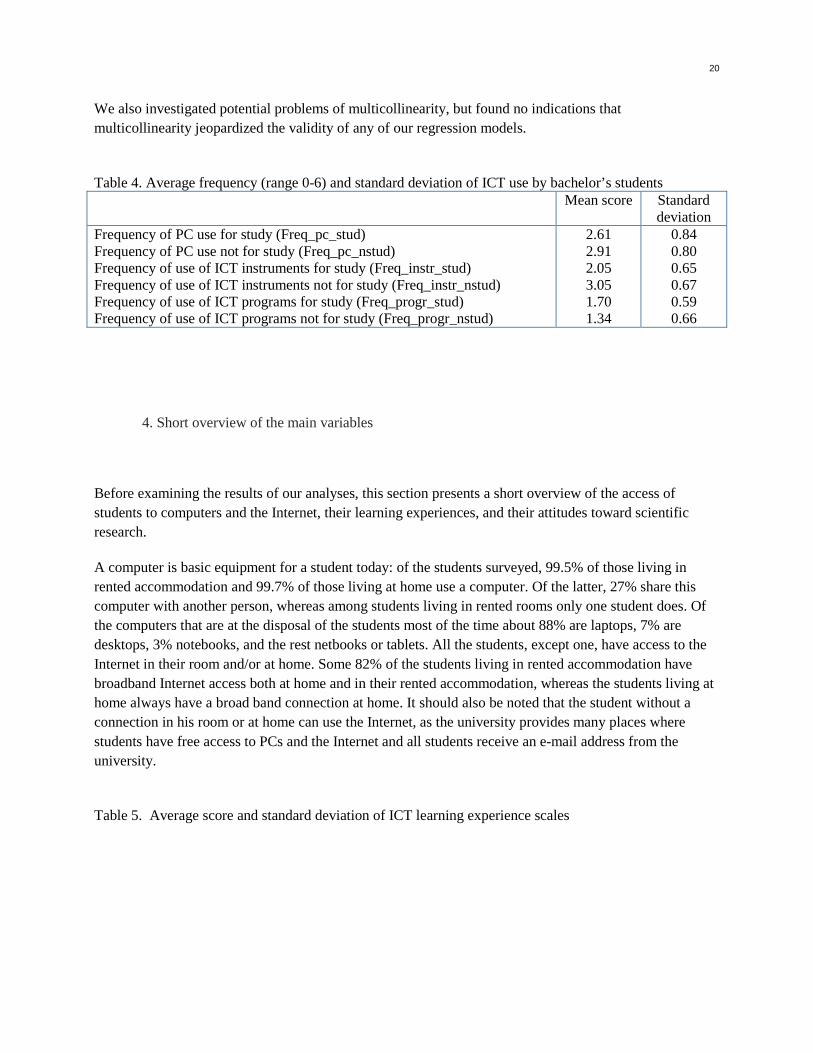
We also investigated potential problems of multicollinearity, but found no indications that
multicollinearity jeopardized the validity of any of our regression models.
Table 4. Average frequency (range 0-6) and standard deviation of ICT use by bachelor’s studentsMean score Standard
deviationFrequency of PC use for study (Freq_pc_stud)Frequency of PC use not for study (Freq_pc_nstud)Frequency of use of ICT instruments for study (Freq_instr_stud)Frequency of use of ICT instruments not for study (Freq_instr_nstud)Frequency of use of ICT programs for study (Freq_progr_stud)Frequency of use of ICT programs not for study (Freq_progr_nstud)
2.612.912.053.051.701.34
0.840.800.650.670.590.66
4. Short overview of the main variables
Before examining the results of our analyses, this section presents a short overview of the access of
students to computers and the Internet, their learning experiences, and their attitudes toward scientific
research.
A computer is basic equipment for a student today: of the students surveyed, 99.5% of those living in
rented accommodation and 99.7% of those living at home use a computer. Of the latter, 27% share this
computer with another person, whereas among students living in rented rooms only one student does. Of
the computers that are at the disposal of the students most of the time about 88% are laptops, 7% are
desktops, 3% notebooks, and the rest netbooks or tablets. All the students, except one, have access to the
Internet in their room and/or at home. Some 82% of the students living in rented accommodation have
broadband Internet access both at home and in their rented accommodation, whereas the students living at
home always have a broad band connection at home. It should also be noted that the student without a
connection in his room or at home can use the Internet, as the university provides many places where
students have free access to PCs and the Internet and all students receive an e-mail address from the
university.
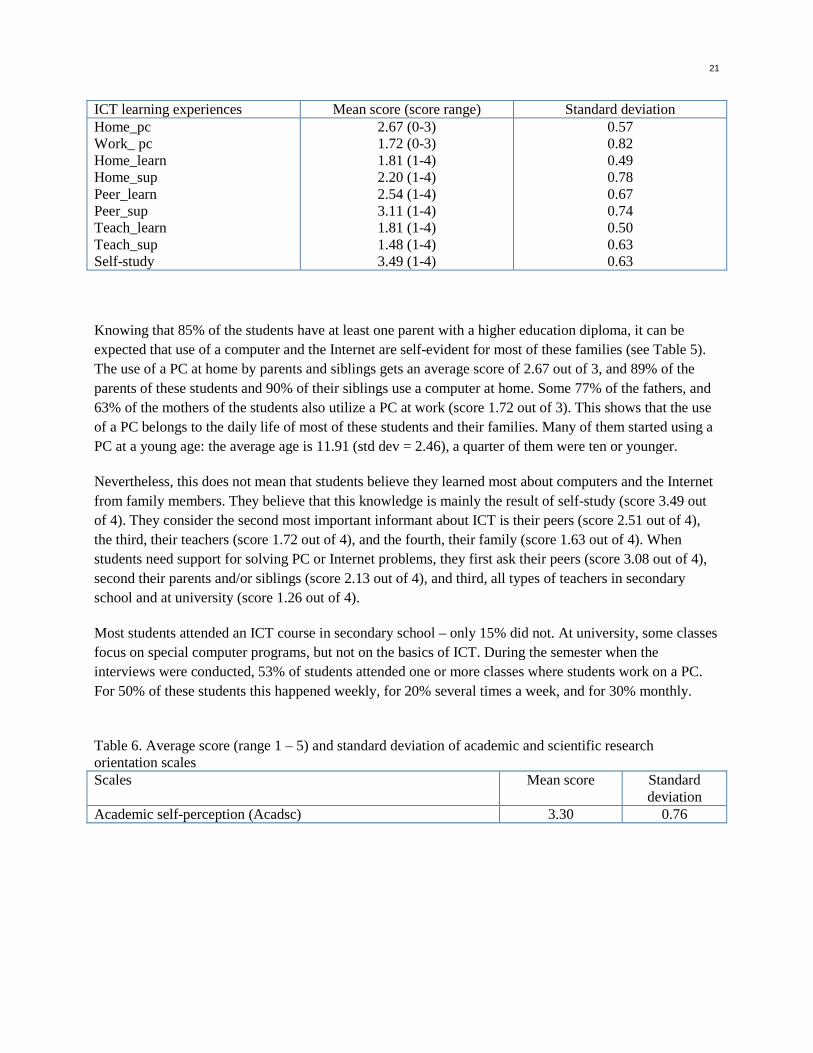
Table 5. Average score and standard deviation of ICT learning experience scales
21
ICT learning experiences Mean score (score range) Standard deviationHome_pcWork_ pcHome_learnHome_supPeer_learnPeer_supTeach_learnTeach_supSelf-study
2.67 (0-3)1.72 (0-3)1.81 (1-4)2.20 (1-4)2.54 (1-4)3.11 (1-4)1.81 (1-4)1.48 (1-4)3.49 (1-4)
0.570.820.490.780.670.740.500.630.63
Knowing that 85% of the students have at least one parent with a higher education diploma, it can be
expected that use of a computer and the Internet are self-evident for most of these families (see Table 5).
The use of a PC at home by parents and siblings gets an average score of 2.67 out of 3, and 89% of the
parents of these students and 90% of their siblings use a computer at home. Some 77% of the fathers, and
63% of the mothers of the students also utilize a PC at work (score 1.72 out of 3). This shows that the use
of a PC belongs to the daily life of most of these students and their families. Many of them started using a
PC at a young age: the average age is 11.91 (std dev = 2.46), a quarter of them were ten or younger.
Nevertheless, this does not mean that students believe they learned most about computers and the Internet
from family members. They believe that this knowledge is mainly the result of self-study (score 3.49 out
of 4). They consider the second most important informant about ICT is their peers (score 2.51 out of 4),
the third, their teachers (score 1.72 out of 4), and the fourth, their family (score 1.63 out of 4). When
students need support for solving PC or Internet problems, they first ask their peers (score 3.08 out of 4),
second their parents and/or siblings (score 2.13 out of 4), and third, all types of teachers in secondary
school and at university (score 1.26 out of 4).
Most students attended an ICT course in secondary school – only 15% did not. At university, some classes
focus on special computer programs, but not on the basics of ICT. During the semester when the
interviews were conducted, 53% of students attended one or more classes where students work on a PC.
For 50% of these students this happened weekly, for 20% several times a week, and for 30% monthly.
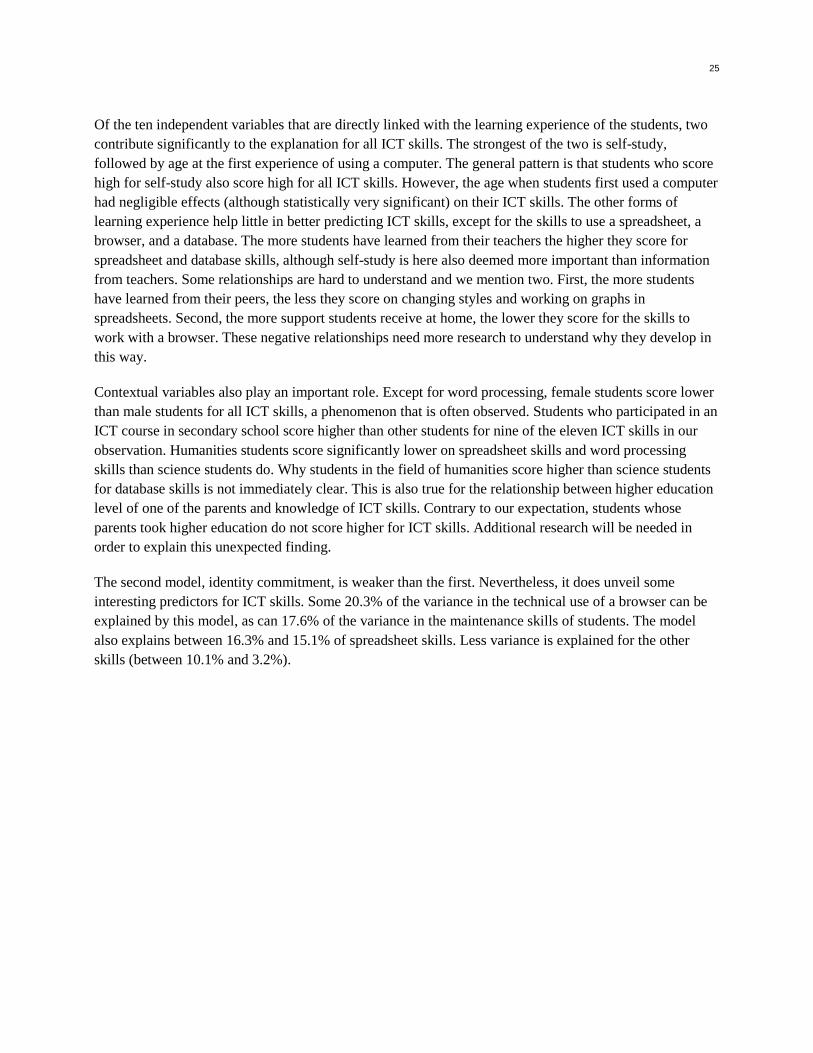
Table 6. Average score (range 1 – 5) and standard deviation of academic and scientific researchorientation scalesScales Mean score Standard
deviationAcademic self-perception (Acadsc) 3.30 0.76

22
Vocational or professional orientation (Profor)Attitude toward scientific research (Attit_science)Intention to become a researcher (Intent_sc)Intention to become something other than a researcher (Intent_oth)ICT, a requisite for a researcher (ICT_science)
3.603.272.563.174.02
0.840.670.880.710.58
Scientific research is a positive factor, though a score of 3.27 out of 5 is not very high (see Table 6). To
become a scientific researcher is not a priority for many students (score 2.56 out of 5). This might be the
result of the knowledge among students that in order to become a researcher at the university a candidate
should achieve higher than average. Moreover, at this stage of their education students do not always have
a clear picture of what a researcher is supposed to do. They are more interested in becoming a consultant,
a teacher, a manager, or something else other than a scientific researcher (score 3.17 out of 5).
Nevertheless, most students are convinced that a scientific researcher cannot function properly without
sufficient knowledge of the basic ICT skills (score 4.02 out of 5).
5. Learning experience and identity commitment as predictors for ICT skills
It would seem safe to suppose that (at least some) ICT skills are widespread among students. After all,
PCs are present in primary and secondary schools and most students have already had to carry out tasks
using a computer and the Internet at home. Writing papers, searching the Internet for a purpose, and
making presentations are daily practice in secondary schools. Therefore, it is expected that most students
at university would be convinced that they could work with a word processor, search the Internet, and
make a presentation. Table 3 confirms this expectation. It is clear that most students know how to work
with a word processor (score 4.66 out of 5) and are convinced that they can do a search on the Internet
(4.6 out of 5). A large proportion of the students are certain that they can maintain a computer (score 4.24
out of 5), change the style of presentations (score 4.16 out of 5), or work on the data of a presentation
(score 4.12 out of 5). However, they feel they are less capable of making use of the technicalities of a
browser (score 3.89 out of 5) or working with digital spreadsheets. With regard to the latter, they believe
that they are better at making calculations (score 3.91 out of 5) or working on graphs (score 3.89 out of 5)
than making style changes (score 3.68 out of 5) in spreadsheets. In comparison with the former skills,
most students are less familiar with the more special types of communication (score 2.93 out of 5). It
should be stressed that communication skills are not about chatting or participating in SNS, because only
4% of the students did not chat on the Internet this academic year and only 8% did not use a SNS (see
Table 1 for an item example). The students are the least familiar with databases. Most students have only
some vague knowledge of this subject and 25% of them do not know anything at all about it.

23
Can learning experience and identity commitment explain some of the knowledge level of these eleven
ICT skills? Neither model is very strong, but both show many significant predictors for ICT skills. First,
we look at the learning experience model. Learning experience can explain 29% of the variance in the
computer maintenance skills of students and 25% of the variance in the skills to use the technicalities of a
browser (see Table 7). However, learning experience explains only 19% or less of the variance in all other
ICT skills, with the contribution being the weakest for word processing skills (6.2%) and the two skills
linked with presentation programs (5.4% and 5.6%). These skills are widespread among the students (see
Table 3).

24
Table 7. Learning experience as predictor of ICT skills (censored regression model [Proc Qlim Tobit specification]).Predictors Maint Word Digital Spreadsheet Database Presentation program Browser Communication
XLS1calculation
XLS2Style
change
XLS3Work ongraphs
PPT1Work on
data
PPT2Presentation
change
BROWS1technical
use ofbrowser
BROWS2Informationcollection
InterceptHome_pcHome_learnHome_supWork_pcPeer_learnPeer_supTeach_learnTeach_supAge at first PCexperienceSelf-studyFemaleHumanICT_seconHEPar
-0.572---------.078***
0.624***-.844***-0.276**-
0.149---------0.065**
0.466***--0.490***0.317*-0.450**
0.129------0.357***--0.064***
0.305***-0.495***-0.817***0.390**-
-0.611-----0.129*-0.208**--0.043***
0.326***-0.339***-0.391***0.371***-0.233**
-0.085-----0.163*-0.257**--0.062***
0.351***-0.345***-0.700***0.390**-0.263*
-1.896------0.287**--0.059**
0.294***-0.397***0.510***0.388**-
-0.499---------0.065**
0.515***-0.254*-0.261*-
-0.419---------0.061***
0.404***-0.255**-0.225*-0.259*
0.312---0.171**------0.069***
0.521***-1.004***-0.197*-
0.402---------0.115***
0.795***-0.903***---
-0.541---------0.060***
0.385***-0.397***---
R² 0.292 0.062 0.190 0.162 0.190 0.080 0.054 0.056 0.251 0.097 0.120*p<0.05** p<0.01*** p<0.001
25
Of the ten independent variables that are directly linked with the learning experience of the students, two
contribute significantly to the explanation for all ICT skills. The strongest of the two is self-study,
followed by age at the first experience of using a computer. The general pattern is that students who score
high for self-study also score high for all ICT skills. However, the age when students first used a computer
had negligible effects (although statistically very significant) on their ICT skills. The other forms of
learning experience help little in better predicting ICT skills, except for the skills to use a spreadsheet, a
browser, and a database. The more students have learned from their teachers the higher they score for
spreadsheet and database skills, although self-study is here also deemed more important than information
from teachers. Some relationships are hard to understand and we mention two. First, the more students
have learned from their peers, the less they score on changing styles and working on graphs in
spreadsheets. Second, the more support students receive at home, the lower they score for the skills to
work with a browser. These negative relationships need more research to understand why they develop in
this way.
Contextual variables also play an important role. Except for word processing, female students score lower
than male students for all ICT skills, a phenomenon that is often observed. Students who participated in an
ICT course in secondary school score higher than other students for nine of the eleven ICT skills in our
observation. Humanities students score significantly lower on spreadsheet skills and word processing
skills than science students do. Why students in the field of humanities score higher than science students
for database skills is not immediately clear. This is also true for the relationship between higher education
level of one of the parents and knowledge of ICT skills. Contrary to our expectation, students whose
parents took higher education do not score higher for ICT skills. Additional research will be needed in
order to explain this unexpected finding.
The second model, identity commitment, is weaker than the first. Nevertheless, it does unveil some
interesting predictors for ICT skills. Some 20.3% of the variance in the technical use of a browser can be
explained by this model, as can 17.6% of the variance in the maintenance skills of students. The model
also explains between 16.3% and 15.1% of spreadsheet skills. Less variance is explained for the other
skills (between 10.1% and 3.2%).

26
Table 8. Identity commitment as predictor of ICT skills (censored regression model [Proc Qlim Tobit specification]).Predictors Maint Word Digital Spreadsheet Database Presentation program Browser Communication
XLS1calculation
XLS2Style
change
XLS3Work ongraphs
PPT1Work on
data
PPT2Presentation
change
BROWS1technical
use ofbrowser
BROWS2Informationcollection
InterceptAcadscProforAttit_scienceIntent_othIntent_scICT_scienceFemaleHumanICT_seconHEPar
0.625--0.219***--0.210***-0.979***-0.347***-
0.6860.189**-0.256**--0.368***--0.239*0.393**-
0.9170.123*----0.232***-0.547***-0.678***0.421***-
0.330-0.099**--0.100*0.191***-0.435***-0.271***0.384***-
0.6790.098*-0.128*--0.201***-0.411***-0.575***0.435**-
-0.762-0.117*---0.146**-0.431***0.593***0.442**-
0.391-0.136*0.247**0.136*-0.295***-0.389***-0.377**-
0.452-0.146**0.191**--0.286***-0.308***-0.335**-
0.884--0.135*--0.142***-1.191***-0.242*-0.205*
1.3020.199**-0219*--0.344***-1.012***---
0.309--0.112*0.146***-0.125***-0.542***---
R² 0.176 0.092 0.163 0.152 0.151 0.058 0.055 0.073 0.203 0.032 0.101
*p<0.05** p<0.01*** p<0.001
27
Table 8 shows that the more students believe that a scientific researcher needs a good knowledge of ICT skills, the more they
know about the different ICT skills. This is also true for students who place a high value on scientific research, but not for all ICT
skills; notably style changes in and calculation skills with spreadsheets, and working with databases. Contrary to our expectations,
the intention to become a researcher only positively predicts competence with style changes in spreadsheets, and the intention to
become something other than a researcher only predicts the ability to work on data in a presentation program and in
communications. The predictive power of these variables is below our expectations.
We also expected that a positive academic self-perception and a high vocational orientation would contribute to a better
knowledge of ICT skills, because ICT might be helpful for study and research. This is shown to be only partly true. The higher the
academic self-perception of students the better knowledge they have of the skills to work with a word processor, to do
calculations or work on graphs in spreadsheets, and to collect information with the help of a browser. When students are more
vocationally orientated they think they are more capable of making style changes in spreadsheets, or working with databases, or
with presentation programs.
Again, similar to Model 1, contextual variables provide important predictors for the ICT skills of students. Gender is the strongest
predictor of all the variables in this model, except for word processing. Female students are less acquainted with ICT skills than
male students. Students who attended an ICT course in secondary school score higher for ICT skills (except for information
collection and communication) than other students. Humanities students seem to know less about working with spreadsheets or a
word processor than science students, but have a better understanding of databases. For other ICT skills, there is no difference
between the two groups.
Students whose parents did not graduate in higher education believe they have a better knowledge of how to handle some of the
technical aspects of a browser than other students do, but this is the only skill where a difference between these two groups can be
found. The ICT head start that students of the more privileged families might have had, does not show at university. In addition,
no differences are found with regard to the knowledge of ICT skills for students who did or did not attend an ICT course at the
university during the semester when the survey was conducted (not included in Tables 7 or 8).
6. Learning experience and identity commitment as predictors for the frequency of ICT use
Turning to the frequency of ICT use instead of ICT skills, we again test both models as predictors. Table 4 has already shown that
computers are more frequently used for purposes other than study (score 2.91 out of 6) than for study (score 2.61 out of 6). This is
also true with regard to the use of ICT instruments (respectively scores of 3.05 and 2.05). However, students do use ICT
presentation programs more frequently for study (score 1.7 out of 6) than for non-study purposes (score 1.34 out of 6).
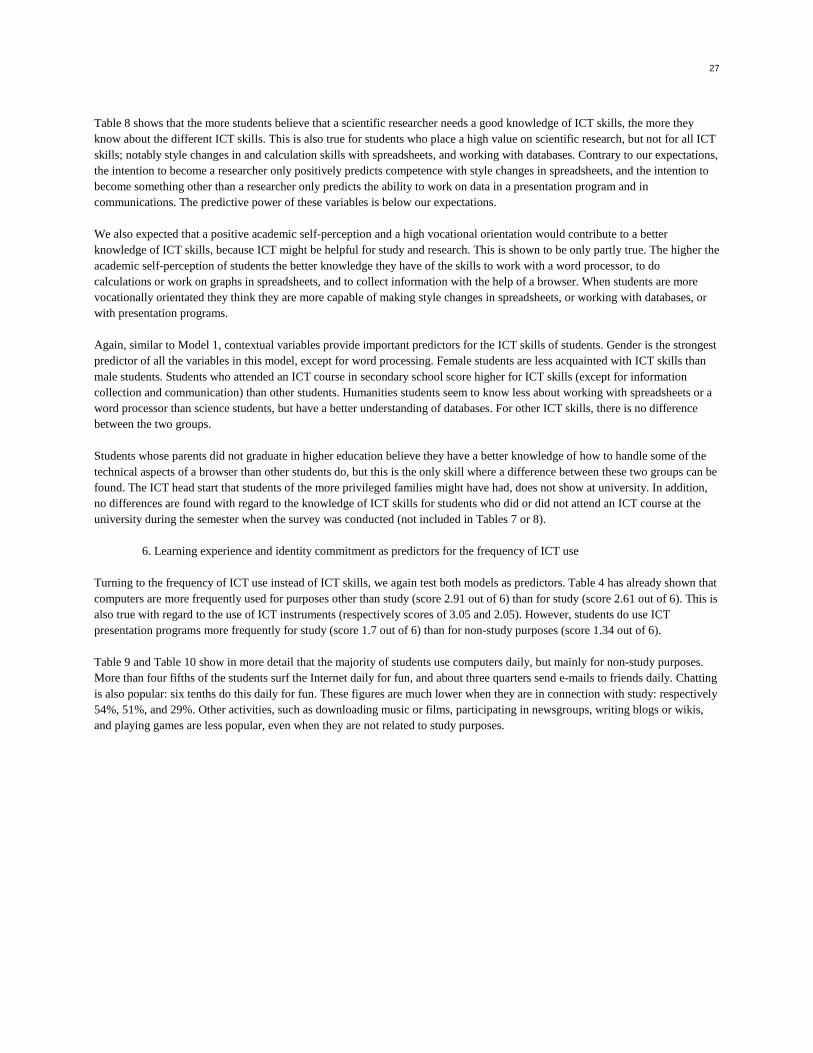
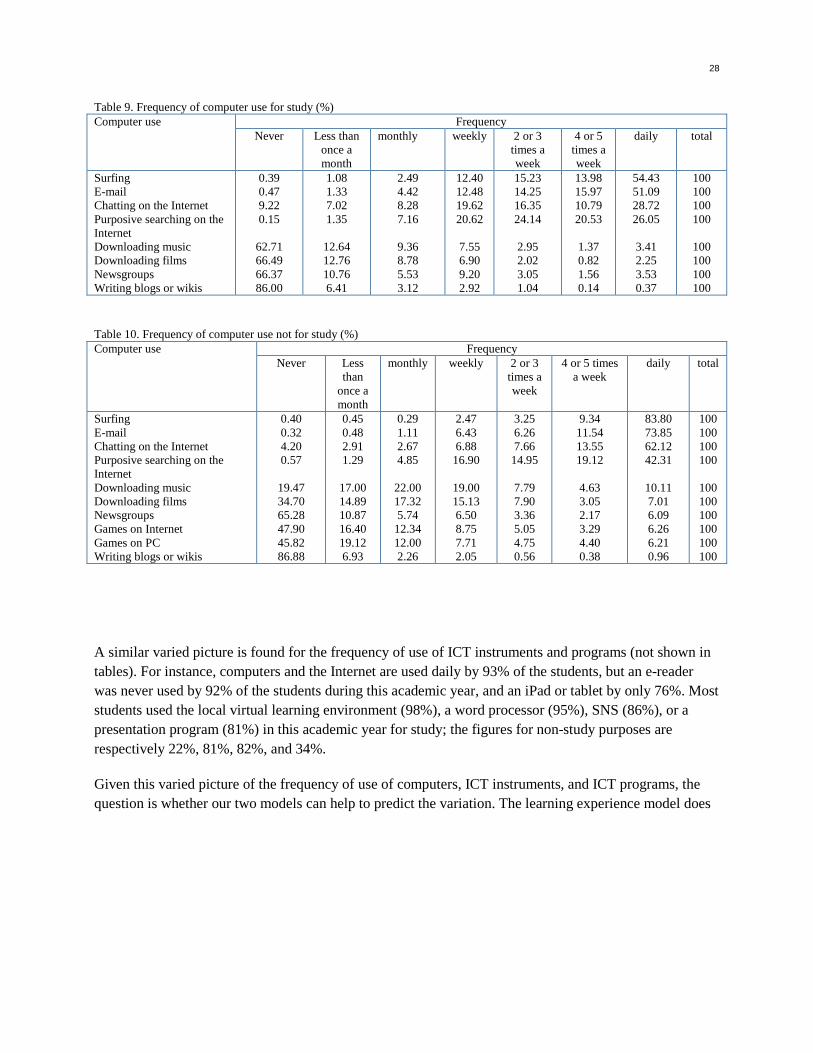
Table 9 and Table 10 show in more detail that the majority of students use computers daily, but mainly for non-study purposes.
More than four fifths of the students surf the Internet daily for fun, and about three quarters send e-mails to friends daily. Chatting
is also popular: six tenths do this daily for fun. These figures are much lower when they are in connection with study: respectively
54%, 51%, and 29%. Other activities, such as downloading music or films, participating in newsgroups, writing blogs or wikis,
and playing games are less popular, even when they are not related to study purposes.
28
Table 9. Frequency of computer use for study (%)Computer use Frequency
Never Less thanonce amonth
monthly weekly 2 or 3times aweek
4 or 5times aweek
daily total
SurfingE-mailChatting on the InternetPurposive searching on theInternetDownloading musicDownloading filmsNewsgroupsWriting blogs or wikis
0.390.479.220.15
62.7166.4966.3786.00
1.081.337.021.35
12.6412.7610.766.41
2.494.428.287.16
9.368.785.533.12
12.4012.4819.6220.62
7.556.909.202.92
15.2314.2516.3524.14
2.952.023.051.04
13.9815.9710.7920.53
1.370.821.560.14
54.4351.0928.7226.05
3.412.253.530.37
100100100100
100100100100
Table 10. Frequency of computer use not for study (%)Computer use Frequency
Never Lessthan
once amonth
monthly weekly 2 or 3times aweek
4 or 5 timesa week
daily total
SurfingE-mailChatting on the InternetPurposive searching on theInternetDownloading musicDownloading filmsNewsgroupsGames on InternetGames on PCWriting blogs or wikis
0.400.324.200.57
19.4734.7065.2847.9045.8286.88
0.450.482.911.29
17.0014.8910.8716.4019.126.93
0.291.112.674.85
22.0017.325.74
12.3412.002.26
2.476.436.88
16.90
19.0015.136.508.757.712.05
3.256.267.66
14.95
7.797.903.365.054.750.56
9.3411.5413.5519.12
4.633.052.173.294.400.38
83.8073.8562.1242.31
10.117.016.096.266.210.96
100100100100
100100100100100100
A similar varied picture is found for the frequency of use of ICT instruments and programs (not shown in
tables). For instance, computers and the Internet are used daily by 93% of the students, but an e-reader
was never used by 92% of the students during this academic year, and an iPad or tablet by only 76%. Most
students used the local virtual learning environment (98%), a word processor (95%), SNS (86%), or a
presentation program (81%) in this academic year for study; the figures for non-study purposes are
respectively 22%, 81%, 82%, and 34%.
Given this varied picture of the frequency of use of computers, ICT instruments, and ICT programs, the
question is whether our two models can help to predict the variation. The learning experience model does

29
not explain a large proportion of the variance of the frequency of use, but as was the case with ICT skills,
it provides some significant variables that allow a better prediction of the dependent variable, namely PC
use for non-study purposes (17.5%) and the use of ICT programs for study (11.5%). For all other
dependent variables, the proportion of explained variance is 6.3% or lower.
30
Table 11. Learning experience as predictor of frequency of use of a PC, ICT instruments, or ICT programs (linear regression analysis)Predictors Freq_pc_studb Freq_pc_nstudb Freq_instrum_studb Freq_instrum_nstuda Freq_progr_studb Freq_progr_nstudb
InterceptHome_pcHome_learnHome_supWork_pcPeer_learnPeer_supTeach_learnTeach_supAge at first PCexperienceSelf-studyFemaleHumanICT_seconHEPar
0----0.094**0.087*---
--0.090**0.126***--
0-----0.107**---0.179***
0.133***-0.286***0.144***--
0----0.085*----0.117***
-----
2.310-----0.062*---0.018*
0.135***-0.115**--
0----0.109**0.076*0.170***--0.097**
0.068*-0.065*-0.096**--
0---0.092*0.090**-0.121***---0.111***
0.106***-0.066*--
Adj. R²F
0.0394.05***
0.17516.87***
0.0263.00***
0.032 0.11510.59***
0.0636.01***
*p<0.05** p<0.01*** p<0.001
a Calculated using Proc Robustreg of SASb Standardized regression coefficients
31
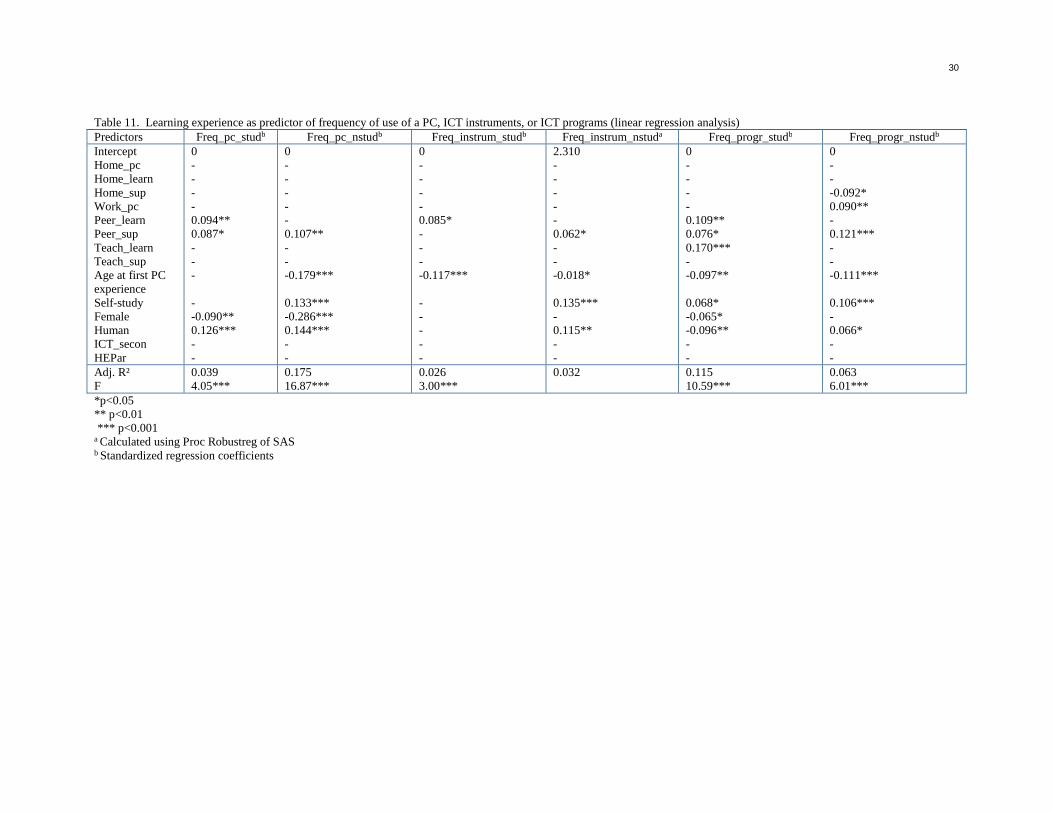
With regard to the frequency of PC use, it is remarkable that the age at the time of first using a computer
and self-study are significant predictors for frequency of use for non-study purposes, but not for study (see
Table 11). The younger students were when they started using a computer or the more they invested in
self-study, the more they use a PC for non-study purposes. Peers also play an important role, both for
study and for non-study purposes: when students learned from peers and/or are supported by peers they
spend more time on a PC. Two of the contextual factors have some meaning for computer use (both for
study and non-study purposes): women use a PC less than men do, and humanities students use a PC more
frequently than science students do. ICT courses in secondary school and the education level of parents,
however, do not contribute to a better prediction of PC use.
The prediction of the frequency of using ICT instruments for both study and non-study purposes can be
significantly improved by two variables (see Table 11). Again, these are the starting age of computer use
and peer learning. For non-study purposes, the domain of study and peer support can be added: students in
the humanities and those who enjoy more support from peers have a higher chance of more frequently
using ICT instruments for non-study purposes. Other variables do not seem to have a significant meaning
for the frequency of use of different ICT instruments.
The frequency of use of ICT programs for study and non-study purposes is more sensitive to the variables
of the learning experience model. A young age of first using a PC, support from peers, and self-study
allow better predictions for the frequency of use of ICT programs. In addition, the domain of study of the
student creates better predictions: ICT programs will be used more by science students than by humanities
students for study purposes, but for non-study purposes the reverse is true. Table 11 also shows that
women use ICT programs less frequently for study than men do, and that students who learned more from
teachers and peers about ICT will use ICT programs for study more often. Although attending university
courses in which a computer is used does not explain significantly the mastering of ICT skills (see section
5), this variable is a significant predictor (standardized estimate = 0.161; p<0.0001) (figure not included in
Table 11) of the frequency of the use of ICT programs for study. Moreover, Table 11 shows that it lets the
difference between male and female students disappear, which implies that the study situation contributes
to a more frequent and more gender-equal use of ICT programs.
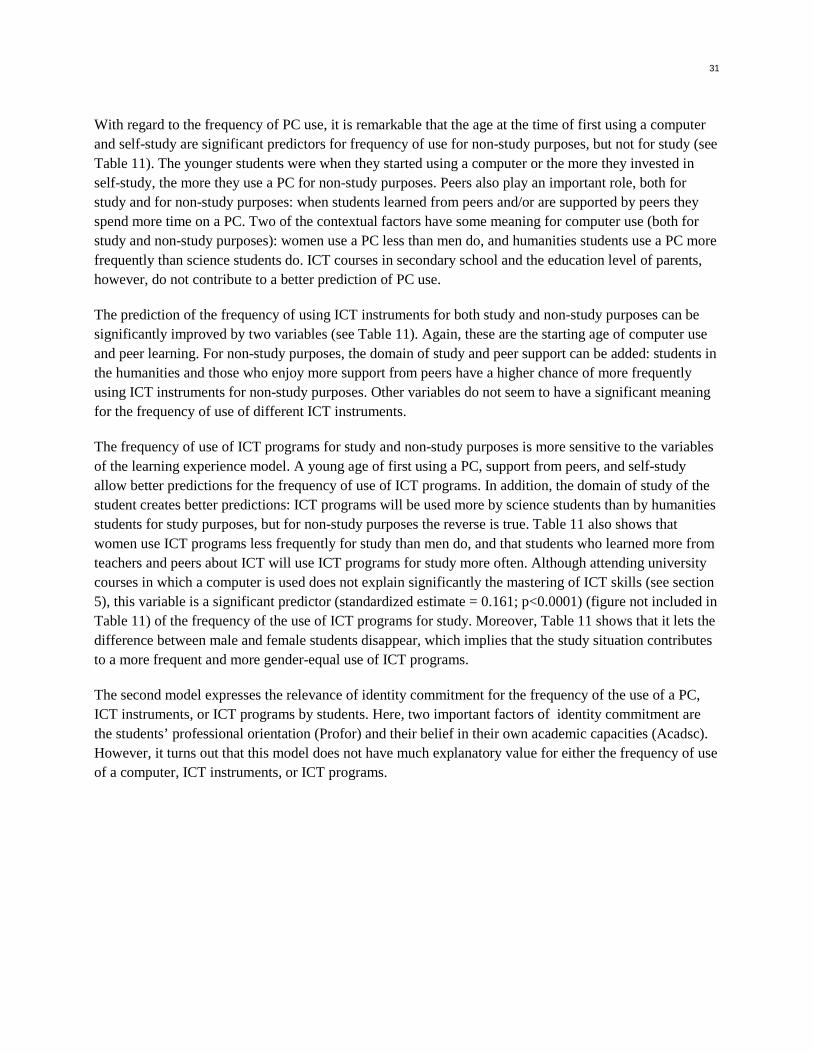
The second model expresses the relevance of identity commitment for the frequency of the use of a PC,
ICT instruments, or ICT programs by students. Here, two important factors of identity commitment are
the students’ professional orientation (Profor) and their belief in their own academic capacities (Acadsc).
However, it turns out that this model does not have much explanatory value for either the frequency of use
of a computer, ICT instruments, or ICT programs.
32
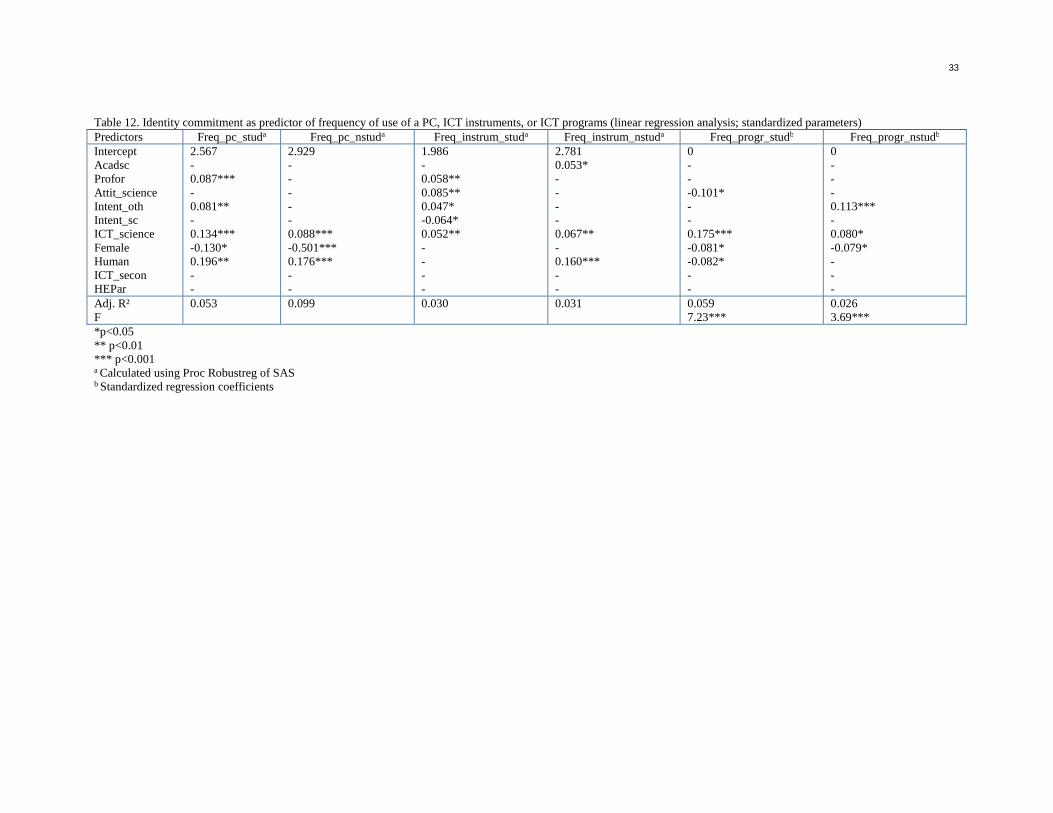
The identity commitment model explains 5.3% of the variance in frequency of PC use for study and 10%
for non-study purposes (see Table 12). All other R² values in Table 12 are smaller or almost equal to zero.
33
Table 12. Identity commitment as predictor of frequency of use of a PC, ICT instruments, or ICT programs (linear regression analysis; standardized parameters)Predictors Freq_pc_studa Freq_pc_nstuda Freq_instrum_studa Freq_instrum_nstuda Freq_progr_studb Freq_progr_nstudb
InterceptAcadscProforAttit_scienceIntent_othIntent_scICT_scienceFemaleHumanICT_seconHEPar
2.567-0.087***-0.081**-0.134***-0.130*0.196**--
2.929-----0.088***-0.501***0.176***--
1.986-0.058**0.085**0.047*-0.064*0.052**----
2.7810.053*----0.067**-0.160***--
0---0.101*--0.175***-0.081*-0.082*--
0---0.113***-0.080*-0.079*---
Adj. R²F
0.053 0.099 0.030 0.031 0.0597.23***
0.0263.69***
*p<0.05** p<0.01*** p<0.001a Calculated using Proc Robustreg of SASb Standardized regression coefficients

44
In the identity commitment model, the best predictor for the frequency of use of a PC is the conviction
of students that a researcher needs sufficient ICT knowledge (see Table 12). The more they believe
this, the more frequently PCs are used, both for study and non-study purposes. Frequent use of a PC for
study is also supported – and this is not what was expected – by a stronger intention of the student to
become something other than a researcher, and by a stronger orientation toward a profession. Frequent
use of a PC for non-study purposes, in turn, is supported by the belief of a student that ICT is needed to
carry out scientific research. In addition, the contextual factors are good predictors for PC use. Female
students spend less time on a PC than men, and science students less time than humanities students.
Students who think that researchers need appropriate ICT knowledge will use all kinds of ICT
instruments more often for both non-study and study purposes than those who do not hold this opinion
as strongly (see Table 12). This is also true for students (as far as they need the instruments for study
purposes) who are more vocationally orientated. Moreover, students with a positive attitude toward
research will more frequently use these ICT instruments for study than other students will. However,
unexpectedly, students who are more inclined toward becoming a researcher will use all these ICT
instruments less often. With regard to non-study purposes, the more positive students are about their
academic capabilities the more they use ICT instruments; humanities students will use ICT instruments
more frequently than science students. It should be noted that gender and having attended an ICT
course in secondary school are not adequate predictors here.
The use of ICT programs for both study and non-study purposes can be predicted by ICT_science and
gender (see Table 12). Students who believe that researchers need a good knowledge of ICT will use
ICT programs more than other students will. When programs are used for study or non-study purposes,
the scores for male students are higher than for female students. Students who are aiming for an
occupation other than a researcher also use ICT programs more frequently for non-study tasks than
other students. It should be noted that ICT course experience in secondary school and the education
level of the parents do not contribute to making better predictions for the frequency of using ICT
programs.
7. Discussion
To begin with, an important limitation of our research must be pointed out. It should be noted that this
attempt to link ICT learning experience and identity commitment to ICT use covers only second and
third year bachelor’s students at one university. To extrapolate the conclusions, a replication of the
research in other universities and countries would be needed. Nevertheless, it is reasonable to assume
that similar results would be found for universities and countries where ICT holds a similar position in
the education system and in society.
At a university, it is often taken for granted that all students are familiar with basic ICT skills. Indeed,
most students will have grown up in families where a computer was present, and in primary and
secondary education PCs are a normal part of school life. To a certain extent, our observations confirm
this picture: most students know a lot about working with a word processor, they know how to prepare
presentations using a program, how to maintain a computer, and are also familiar with using an Internet
browser. This is, however, less true for working with spreadsheets and databases and new forms of
communication. In order to see these differences among students we constructed a new observation
instrument. First, 123 items covering the ICT skills a student was supposed to have, were presented to
44
a sample of students. Based on this test, we then reduced the instrument to 49 items. We are aware that
this approach relies on self-observation by the students, and that accordingly a discrepancy is possible
between data obtained by the observation of actual skills by an independent observer and data collected
based on self-perception. Nevertheless, by making the questions very specific we were able to obtain a
diversified picture of ICT skills as perceived by the students. The frequency of ICT use was
approached the same way: students described how often they used a PC for a particular purpose, how
often they used different ICT instruments, and how often they applied specific ICT programs. Working
with 53 items, students were asked to think more carefully about the frequency of use of many basic
characteristics of ICT. Again, this might differ from an external observation (for instance automated
tracking), but produces a reliable picture of what students think with regard to how often they use basic
parts of ICT.
Research has shown that ICT learning experience at home has positive effects on mastering ICT skills
in primary and secondary education (Anastasiades et al. 2008; Aslanidou and Menexes 2008; Barron et
al. 2010; Vekiri 2010a; Zhao et al. 2010). However, among bachelor’s students we did not find that PC
use by parents and siblings at home (Home_pc) or at work (Work_pc), and the amount of ICT skills the
students learned at home (Home_learn) were significant predictors for mastering ICT skills or for the
frequency of ICT use. It is possible that a more in-depth analysis of what parents and siblings actually
do together with their children on a PC and the Internet could confirm the importance of the first
learning experience of these youngsters.
It was hypothesized that students who look to pursuing a career as a scientific researcher would master
more ICT skills and use ICT more, because these can be perceived as a necessary part of carrying out
research and because some structural characteristics of an information system resemble scientific
research. This hypothesis is only partially confirmed by our data. This may be the result of bachelor’s
students having a somewhat vague idea of their future profession, or of their perception of the job of a
scientific researcher. Therefore, it would be interesting to test this hypothesis among master’s and PhD
students.
Students who attended university courses where a PC is used regularly in class did not show better
results than other students for ICT skills or the frequency of ICT use. This is no surprise, since these
courses are not intended to teach basic ICT skills. The position is totally different for ICT courses
attended in secondary school (ICT_secon), which seems to be a good predictor for mastering ICT
skills.
An unexpected relationship is also found between the education level of the parents and mastering ICT
skills. In the learning experience model, four relationships are found where students from families
whose parents graduated in higher education were less capable than other students of applying some
ICT skills, whereas research has shown that in primary or secondary schools, students of higher
educated parents do better or are better supported by their parents (Aslanidou & Menexes 2008; Barron
et al. 2010; Zhao et al. 2010). More in-depth research should provide an explanation.
8. Conclusion
In this article, we present two hypotheses regarding the ICT skills and the frequency of ICT use by
university students. In line with Dewey’s learning theory, the first hypothesis is that a positive ICT
learning experience at home, in school, and with peers will contribute to a higher level of mastering
44
ICT skills and a more frequent use of ICT among bachelor’s students (the learning experience
hypothesis). The second hypothesis is based on the use of ICT in research and the similarity between
the structure of information systems and scientific research. From this, we hypothesize that students
who strive for an identity commitment that is directed toward scientific research will be more inclined
to learn ICT skills and show a higher frequency of ICT use. Both hypotheses are tested with the
inclusion of some important contextual variables: gender, domain of study, ICT course in secondary
school or at the university, and the education level of parents.
The explanation of different levels of ICT skills provided by the learning experience model is
confirmed, but not very strongly overall, and not equally for all types of ICT skills. The model can
explain the largest proportion of the variance in maintenance of a computer and the technical use of a
browser. In descending proportion of explained variance, these two skills are followed by the three of
working with a spreadsheet, communication skills, information collection with a browser, working
with databases, two forms of working with a presentation program, and working with a word processor.
The best predictors for most of the skills is the age of the students when they first started using a PC
(the lower the age, the higher the scores), self-study, gender (men score higher than women), and
having attended an ICT course in secondary school. Instruction from teachers is important for working
with spreadsheets and databases. It is also noteworthy here, that the use of a PC at home and at work by
parents and siblings, what the student learned of ICT at home, and the support of peers and teachers
does not play a significant role, although research has shown that these factors are important in primary
and secondary schools (Vekiri 2010a; Aslanidou and Menexes 2008; Barron et al. 2010; Zhao et al.
2010 ).
The learning experience model also explains some of the variance in the frequency of ICT use. It
explains 17.5% of the variance in the frequency of PC use for non-study oriented tasks, but for all other
frequency-related dependent variables the proportion of explained variance is much smaller.
Predictions of the frequency of ICT use can be improved taking into account the age when students
started to use a PC (the lower the age, the higher the use), self-study (only for non-study purposes),
domain of study (humanities students mostly score higher than science students), and gender (women
score lower than men). Peer support is a significant predictor for the frequency of computer use and of
ICT programs, and this applies to both study and non-study purposes. What had been learned at home
is not recognized as a factor that could predict the frequency of ICT use by the students. This is the
same for ICT courses attended in secondary school and at the university, or the education level of the
parents.
The identity commitment model can also explain parts of the variance in the ICT skills of students. The
explained proportion of the variance, however, is very different for each of the ICT skills. This model
can explain two fifths of the variance in the technical use of a browser, but for all other ICT skills the
results are lower, sometimes substantially so. The most important predictors of this model are the belief
of students that researchers need an appropriate knowledge of ICT, a positive attitude toward scientific
research, gender (lower scores for women than for men), and having attended an ICT course in
secondary school. The other explanatory variables have very diversified impacts. Each of them helps to
improve a prediction, but for very different ICT skills. The reasons these differences occur are unclear
and require more research. It should also be mentioned that the intention to become a researcher is not
44
a strong predictor: only the skill to perform style changes in spreadsheets seems to be better developed
among research-oriented students.
The identity commitment model is less successful in explaining the frequency of ICT use. Only one
explanatory factor plays a significant role in the explanation of the six dependent variables, i.e. the
belief of the students that researchers need ICT. The more students think that a researcher needs a good
knowledge of ICT, the more frequently they use a PC, ICT instruments, and ICT programs – and this
applies to both study and non-study purposes. The other factors do not have the same predictive value
and their value differs for each of the dependent variables. In other words, our hypothesis that students
who want to become a researcher will score higher for using ICT is not supported by the data. On the
contrary, students who want to become a researcher do not show more frequent use of a computer or
ICT programs, and they actually use ICT instruments for study less frequently than other students do.
In short, the learning experience hypothesis and the identity commitment hypothesis are both only
partially confirmed by our research. We can, however, conclude in general that a relationship does
exist between the ICT learning experience, the research-oriented identity commitment of bachelor’s
students, and their command of ICT skills on the one hand and the frequency of use of a computer, ICT
instruments, and ICT programs on the other. However, at the same time we must acknowledge that this
is a very diversified relationship, which is not always equally strong for all aspects of ICT skills and
ICT use. In order to better understand these differences, future research will have to dig deeper into the
particularities of divergent ICT skills and ICT uses.
9. Implications
This study shows that bachelor’s students attain a rather high proficiency in some ICT skills, At the
same time, however, it documents that this is not the case for all ICT skills. In particular many students
are not very familiar with, and experience problems when working with databases, spreadsheets, and
modern communication systems. Our data shows that ICT training in secondary school improves
having command of ICT skills. It would therefore be wise to invest more in ICT training in secondary
school. For those students who still need more support, universities should provide this. And this
would be fruitful for all students, as students who are trained to become researchers or other
professionals will experience difficulties in their professional life without an adequate knowledge of
basic ICT skills.
It is perhaps not a surprise that students in our research score higher on word processing than on
working with digital spreadsheets or databases. For study, word processing is used more frequently
than any other ICT program. This makes students more familiar with this program: about 48% of the
students applied word processing more than twice or three times a week. Only the local virtual learning
environment was applied more frequently by more students (95%). The figures for the use of digital
spreadsheets (9%) and databases (5%) are much lower. More frequent application of these programs,
where meaningful, may make students more familiar with these programs.
Table 7 has shown that self-study is an important variable for the explanation of the level of mastering
ICT skills. This self-study implies the use of the PC and the Internet to become more acquainted with
ICT. In a similar vein, learning of other subjects may also take advantage of the help of the PC and the
Internet. This learning may take the form of blended learning, where classroom teaching is supported
by computer-mediated activities, and offers the student the means to improve knowledge by self-study.
44
A lot of research (for instance: Alshumaimeri 2011; Morley 2012; Bidaki et al. 2013; Martin and
Ertzberger 2013) has shown that blended learning has advantages over other forms of learning. At the
university in our research, blended learning appears to be not widely spread. During last semester only
53% of the students used a PC during classes, and for only 50% of these students this happened weekly
and for only 20% several times a week. The frequent use of the local virtual learning environment
could give the impression that blended learning is part of the culture in this university. Former research
(Bruneel et al. 2011) denies this. Most students use the virtual learning platform as “a place to gather
information”. The low frequencies of use of ICT programs for study (Table 4) also let us surmise that
blended learning is not yet widely spread in this university. This means that there is still a lot of work
to do in order to use all the advantages of blended learning.
Although universities are supposed to prepare students for conducting research, the bachelor’s students
in our study scored no more than 2.56 on a scale of 1 to 5 measuring their intention to become a
researcher. They do not seem very enthusiastic about becoming researchers. If universities, though,
want to fulfill their mission in the future they need motivated researchers. It will be a challenge for
them to find ways to motivate their students to become researchers. Explaining them how ICT can
support research might be one way to achieve that.
44
References
Akyol, G., Sungur, S., & Tekkaya, C. (2010). The contribution of cognitive and metacognitive strategy
use to students’ science achievement. Educational Research and Evaluation, doi:
10.1080/1380361100367234816
Alshumaimeri, Y. (2011). The effects of wikis on foreign language students writing performance.
Procedia - Social and Behavioral Sciences, doi:10.1016/j.sbspro.2011.11.139
Anastasiades, P. S., Vitalaki, E., & Gertzakis, N. (2008). Collaborative learning activities at a distance
via interactive videoconferencing in elementary schools: Parents’ attitudes. Computers & Education,
doi:10.1016/j.compedu.2007.02.003
Aslanidou, S. & Menexes, G. (2008). Youth and the Internet: Uses and practices in the home.
Computers & Education, doi:10.1016/j.compedu.2007.12.003
Barron, B., Walter, S. E., Martin, C. K., & Schatz, C. (2010). Predictors of creative computing
participation and profiles of experience in two Silicon Valley middle schools. Computers & Education,
doi:10.1016/j.compedu.2009.07.017
Becker, J. D. (2006). Digital equity in education: A multilevel examination of diffrences in and
relationships between computer access, computer use, and state-level technology policies. Education
Policies Archives Analysis, 15 (3), http://epaa.asu.edu/epaa/v15n3/. Accessed 15 July 2013.
Bennett, J. , & Hogarth, S. (2009). Would you want to talk to a scientist at a party? High school
students’ attitudes to school science and to science. International Journal of Science Education, doi:
10.1080/09500690802425581
Bennett, R. (2009). Academic self-concept among business students in a recruiting university:
definition, measurement and potential effects. Journal of Further and Higher Education, doi:
10.1080/03098770902856678
Bidaki, M. Z., Sanati, A. R., & Ghannad, F. R. (2013). Producing and introducing mobile books, as a
new model of providing learning content in medical sciences. Procedia - Social and Behavioral
Sciences, doi: 10.1016/j.sbspro.2013.06.019
Broos, A. (2005). Gender and information and communication technologies (ICT) anxiety: male self-
assurance and female hesitation. CyberPsycholgy & Behavior, 8 (1), 21-31.
Bruneel, S., Elen, J., De Wit, K., & Verhoeven, J. C. (2011). Study and non-study related technologies
use of Flemish students in higher education. In K. Moyle, & G. Wijngaard, Student reactions to
learning with technologies: Perceptions and outcomes. (pp. 227-248). Hershey (PA) IGI Global.
44
Burke, P. J., & Reitzes, D. C. (1991). An identity theory approach to commitment. Social Psychology
Quarterly, 54 (3), 239-251.
Carlsson, C., Carlsson, J., Hyvönen, K., Puhaikanen, P., & Walden, P. (2006). Adoption of Mobile
Devices/Services – Searching for Answers with the UTAUT. Proceedings of the 39th Hawai
International Conference on sytem sciences.
http://www2.computer.org/plugins/dl/pdf/proceedings/hicss/2006/2507/06/250760132a.pdf?template=
1&loginState=1&userData=anonymous-IP%253A%253A127.0.0.1). Accessed 15 July 2013.
Chatzoglou, P. D., Sarigiannidis, L., Vraimaki, E., & Diamantidis, A. (2009). Investigating Greek
employees’ intention to use web-based training. Computers & Education,
doi:10.1016/j.compedu.2009.05.007
Chen, S. Y., & Fu, Y. C. (2009). Internet use and academic achievement: gender differences in early
adolescence. Adolescence, 44 (176), 797-842.
Cheung, D. (2009). Developing a scale to measure students’ attitudes toward chemistry lessons.
International Journal of Science Education, doi: 10.1080/09500690802189799
Cho, V., Cheng, T. C., & Lai, W. M. (2009). The role of perceived user-interface design in continued
usage intention of self-paced e-learning tools. Computers & Education,
doi:10.1016/j.compedu.2009.01.014
Colley, A., & Comber, C. (2003). Age and gender differences in computer use and attitudes among
secondary school students: what has changed? Educational Research, doi:
10.1080/0013188032000103235
Cox, M. (2013). Formal to informal learning with IT: resaerch challenges and issues for e-learning.
Journal of Computer Assisted Learning, doi: 10.1111/j.1365-2729.2012.00483.x (in press).
De Wit, K., Heerwegh, D., & Verhoeven, J.C. (2012). Changes in the basic ICT skills of freshmen
between 2005 and 2009: Who’s catching up and who’s still behind? Education and Information
Technologies, doi: 10.1007/s10639-011-9154-z
Demir, I., Kiliç, S., & Ünal, H. (2010). Effects of students' and schools' characteristics on mathematics
achievement: findings from PISA 2006. Procedia Social and Behavioral Sciences, doi:
10.1016/j.sbspro.2010.03.472
44
Dewey, J. (1938). Education and experience. http://www.schoolofeducators.com/wp-
content/uploads/2011/12/EXPERIENCE-EDUCATION-JOHN-DEWEY.pdf. Accessed 14 March
2013.
Dewey, J. (1933 (1960)). How we think. Lexington, Massachusetts: D.C. Heath and Company.
Dewey, J. (1917). The Need for A Recovery of Philosophy. In J. Dewey (Ed.), Creative Intelligence:
Essays in the Pragmatic Attitude (pp. 3-69). New York: Holt.
DiStefano, C., Zhu, M., & Mîndrilă, D. (2009). Understanding and using factor scores: Considerations
for the applied researcher. Practical Assessment, Research & Evaluation , 14 (20), 1-11.
http://pareonline.net/pdf/v14n20.pdf . Accessed 27 September 2013.
ECDL. (2010). ECDL syllabus 5.0. Utrecht: ECDL Nederland NV.
Eow, Y. L., bte Wan Ali, W. Z., bt. Mahmud, R., & Baki, R. (2009). Form one students’ engagement
with computer games and its effect on their academic achievement in a Malaysian secondary school.
Computers & Education, doi:10.1016/j.compedu.2009.05.013
Evans, K. G. (2000). Reclaiming John Dewey: democary, inquiry, pragmatism, and public
management. Administration & Sociey, doi: 10.1177/00953990022019452
George, R. (2006). A cross-domain analysis of change in students’ attitudes toward science and
attitudes about the utility of science. International Journal of Science Education, doi:
10.1080/09500690500338755
Germann, P. J. (1988). Development of the attitude toward science in school assessment and its use to
investigate the relationship between science achievement and attitude toward science in school.
Journal of Research in Science Teaching, 25 (8), 689-703.
Hargittai, E. (2010). Digital na(t)ives. Variation in Internet skills and uses among members of the ‘‘Net
Generation’’. Sociological Inquiry, doi: 10.1111/j.1475-682X.2009.00317.x
Jeffrey, L., Hegarty, B., Kelly, O., Penman, M., Coburn, D., & McDonald, J. (2011). Developing
digital information literacy in higher education: obstacles and supports. Journal of Information
Technology Education, 10, 383-413.
Kaminski, K., Switzer, J., & Gloeckner, G. (2009). Workforce readiness: a study of university students'
fluency with information technology. Computers & Education, doi:10.1016/j.compedu.2009.01.017
Kind, J., Jones, P., & Barmby, P. (2007). Developing Attitudes towards Science Measures.
International Journal of Science Education, doi: 10.1080/09500690600909091
44
Kolb, A. Y., & Kolb, D. A. (2005). Learning styles and learning spaces: enhancing experiential
learning in higher education. Academy of Management Learning & Education, 4 (2), 193-212.
Kubiatko, M., & Vlckova, K. (2010). The relationship between ICT use and science knowledge for
Czech students: a secondary analysis of PISA. International Journal of Science and Mathematics
Education, 8 (3), 523-543.
Lee, B. C., Yoon, J. O., & Lee, I. (2009). Learners’ acceptance of e-learning in South Korea: Theories
and results. Computers & Education, doi:10.1016/j.compedu.2009.06.014
Lee, M. C. (2010). Explaining and predicting users’ continuance intention toward e-learning: An
extension of the expectation–confirmation model. Computers & Education,
doi:10.1016/j.compedu.2009.09.002
Lee, Y. C. (2008). The role of perceived resources in online learning adoption. Computers &
Education, doi:10.1016/j.compedu.2007.01.001
Luu, K., & Freeman, J. G. (2011). An analysis of the relationship between information and
communication technology (ICT) and scientific literacy in Canada and Australia. Computers &
Education, doi:10.1016/j.compedu.2010.11.008
Martin, F., & Ertzberger, J. (2013). Here and now mobile learning: an experimental study on the use of
mobile technology. Computers & Education, doi: 10.1016/j.compedu.2013.04.021
McCleary, L., & Brown, G. T. (2003). Association between nurses’ education about research and their
research use. Nurse Education Today, doi:10.1016/S0260-6917(03)00084-4
McCloskey, D. J. (2008). Nurses’ perceptions of research utilization in a corporate health care system.
Journal of Nursing Scholarship, 40 (1), 39–45.
McMahon, G. (2009). Critical thinking and ICT integration in a Western Australian secondary school.
Educational Technology & Society, 12 (4), 269-281.
Morley, D. A. (2012). Enhancing networking and proactive learning skills in the first year university
experience through the use of wikis. Nurse Education Today, doi:10.1016/j.nedt.2011.03.007
O’Brian, J. A., & Marakas, G. M. (2009) Management Information Systems (Ninth Edition). Boston,
Burr Ridge (IL), Dubuque (IA), New York, San Francisco: McGraw Hill Irwin.
Papanastasiou, E. C., Zembylas, M., & Vrasidas, C. (2005). An examination of the Pisa Database to
explore the relationship between computer use and science achievement. Educational Research and
Evaluation, doi: 10.1080/13803610500254824
44
Peter, J., & Valkenburg, P. (2006). Adolescents' Internet use: Testing the "disappearing digital divide"
versus the "emerging digital differentiation" approach. Poetics, doi:10.1016/j.poetic.2006.05.005
Pole, C., & Lampard, R. (2002). Practical Social Investigation. Qualitative and Quantitative Methods
in Social Research. Harlow: Prentice Hall.
Salajan, F. D., Schönwetter, D. J., & Cleghorn, B. M. (2010). Student and faculty inter-generational
digital divide: fact or fiction. Computers & Education, doi: 10.1016/j.compedu2010.06.017
Strømsø, H. I., Grottum, P., & Lycke, K. H. (2004). Changes in student approaches to learning with the
introduction of computer-supported problem-based learning. Medical Education, doi:10.1046/j.1365-
2923.2004.01786.x
Teo, T., Lee, C. B., Chai, C. S., & Wong, S. L. (2009). Assessing the intention to use technology
among pre-service teachers in Singapore and Malaysia: A multigroup invariance analysis of the
Technology Acceptance Model (TAM). Computers & Education, doi:10.1016/j.compedu.2009.05.017
Tuan, H., Chin, C. C., & Shieh, S. H. (2005). The development of a questionnaire to measure students’
motivation towards science learning. International Journal of Science Education, doi:
10.1080/0950069042000323737
van Dijk, J. A. (2006). Digital divide research, achievements and shortcomings. Poetics,
doi:10.1016/j.poetic.2006.05.004
Vekiri, I. (2010a). Socioeconomic differences in elementary students’ ICT beliefs and out-of-school
experiences. Computers & Education, doi:10.1016/j.compedu.2009.09.029
Vekiri, I. (2010b). Boys’ and girls’ ICT beliefs: Do teachers matter? Computers & Education,
doi:10.1016/j.compedu.2009.11.013
Vekiri, I. & Chronaki, A. (2008). Gender issues in technology use: Perceived social support, computer
self-efficacy and value beliefs, and computer use beyond school. Computers & Education,
doi:10.1016/j.compedu.2008.01.003
Verhoeven, J.C., Heerwegh, D., & De Wit, K. (2010). Information and communication technologies in
the life of university freshmen: An Analysis of change. Computers & Education, doi:
10.1016/j.compedu.2009.12.002
Vermunt, J. (1994). Scoring key for the inventory of learning styles (ILS) in higher education. Tilburg:
Tilburg University.
44
Volman, M, & van Eck, E. (2001). Gender equity and information technology in education: the second
decade. Review of Educational Research, 71 (4), 613-634.
Wang, Y., Wu, M., & Wang, H. (2009). Investigating the determinants and age and gender differences
in the acceptance of mobile learning. British Journal of Educational Technology, doi:10.1111/j.1467-
8535.2007.00809.x
Wareing, C. (1982). Developing the WASP:Wareing attitudes toward science protocol. Journal of
Research in Science Teaching, 19 (8), 639-645.
Wareing, C. (1990). A survey of antecedents of attitudes toward science. Journal of Research in
Science Teaching, 27 (4), 371-386.
Won, S. J., & Han, S. (2010). Out-of-School activities and achievement among middle school students
in the USA and South Korea. Journal of Advanced Academics, 21 (4), 628-661.
Wu, Y., Tao, Y., & Yang, P. (2007). Using UTAUT to explore the behavior of 3G mobile
communication users. Proceedings of the 2007 IEEE IEEM, (pp. 199-203).
http://ieeexplore.ieee.org/ielx5/4419130/4419131/04419179.pdf?arnumber=4419179. Accessed 4 July
2012.
Zhao, L., Lu, Y., Huang, W., & Wang, Q. (2010). Internet inequality: The relationship between high
school students’ Internet. Computers & Education, doi:10.1016/j.compedu.2010.05.010
Zwass, V. (2012). Information system. Encyclopedia Britannica Online.
http://www.britannica.com/EBchecked/topic/287895/information-system. Accessed 15 July 2013.