
I Volume 2, Number 1 all pages 23 cop (1)
105
I Advances in Computer Science and Information Technology (ACSIT) Print ISSN: 2393-9907 Online ISSN: 2393-9915 Editor-In-Chief: Mohamed M. Elammari, Ph. D. Faculty of Information Technology, University of Benghazi, Libya Associate Editor: Rabindra Kumar Jena, Ph. D. Information Technology Management Department IMT, Nagpur-440013, India Editorial Board Members: M. R. Tripathy, Ph. D. Department of Electronics & Communication Engineering, Amity School of Engineering and Technology Amity University Campus, Sector-125, Noida (U.P.) – 201303, India Shishir K. Shandilya, Ph. D. Dean (Academics) & Head –Department of Computer Science & Engineering BANSAL Institute of Research & Technology, Bhopal, M. P., India Basant Kumar, Ph. D. Computer Science and Mathematics Department Modern College of Business & Sc (Affiliated with University of Missouri, St.Louis, USA & Franklin University, Ohio, USA), Muscat, Sultanate of Oman Amit Choudhary, Ph. D. Department of Computer Science Maharaja Surajmal Institute (an affiliate of G.G.S. Indraprastha University, Delhi, India) Moirangthem Marjit Singh Department of Computer Science & Engineering North Eastern Regional Institute of Science & Technology (NERIST), (Deemed University under MHRD, Govt. of India), Nirjuli-791109, Arunachal Pradesh Published by: Krishi Sanskriti Publications E-47, Rajpur Khurd Extn., Post Office – I.G.N.O.U. (Maidangarhi) New Delhi-110068, INDIA Contact No. +91-8527006560; Website: http://www.krishisanskriti.org/acsit.html
Transcript of I Volume 2, Number 1 all pages 23 cop (1)

I
Advances in Computer Science and Information Technology
(ACSIT)
Print ISSN: 2393-9907
Online ISSN: 2393-9915
Editor-In-Chief:
Mohamed M. Elammari, Ph. D. Faculty of Information Technology,
University of Benghazi, Libya
Associate Editor:
Rabindra Kumar Jena, Ph. D. Information Technology Management Department
IMT, Nagpur-440013, India
Editorial Board Members:
M. R. Tripathy, Ph. D. Department of Electronics & Communication Engineering,
Amity School of Engineering and Technology Amity University Campus, Sector-125, Noida (U.P.) – 201303, India
Shishir K. Shandilya, Ph. D. Dean (Academics) & Head –Department of Computer Science & Engineering
BANSAL Institute of Research & Technology, Bhopal, M. P., India
Basant Kumar, Ph. D. Computer Science and Mathematics Department
Modern College of Business & Sc (Affiliated with University of Missouri, St.Louis, USA
& Franklin University, Ohio, USA), Muscat, Sultanate of Oman
Amit Choudhary, Ph. D. Department of Computer Science
Maharaja Surajmal Institute (an affiliate of G.G.S. Indraprastha University, Delhi, India)
Moirangthem Marjit Singh Department of Computer Science & Engineering
North Eastern Regional Institute of Science & Technology (NERIST), (Deemed University under MHRD, Govt. of India), Nirjuli-791109, Arunachal Pradesh
Published by:
Krishi Sanskriti Publications E-47, Rajpur Khurd Extn., Post Office – I.G.N.O.U. (Maidangarhi)
New Delhi-110068, INDIA Contact No. +91-8527006560; Website: http://www.krishisanskriti.org/acsit.html

II
Advances in Computer Science and Information Technology (ACSIT)
Website: http://www.krishisanskriti.org/acsit.html
Aims and Scope:
Advances in Computer Science and Information Technology (ACSIT) (Print ISSN: 2393-9907; Online ISSN: 2393-9915) is a quarterly international open access journal of the Krishi Sanskriti (http://www.krishisanskriti.org), a non-governmental organization (NGO) registered under society registration act 1860 which is engaged in academic and economic development of the society with special emphasis on integrating industry and academia. The journal ACSIT is devoted to publication of original research on various aspects of computer science and information technology including the scientific leads in the formative stage which has a promise for a pragmatic application. The scopes of the journal include, but are not limited to, the following fields Programming Languages; Software Development; Graphics for Science and Engineering; Solid, Surface and Wireframe Modelling; Animation; Data Management and Display; Image Processing; Flight Simulation; VLSI Design; Process Simulation; Neural Networks and their Applications; Fuzzy Systems Theory and Applications; Fault-Tolerant Systems; Visual Interactive Modelling; Supercomputing; Optical Computing; Soft Computing; Computer Architecture Data Structures and Network Algorithms; Genetic Algorithms and Evolutional Systems; Very Large Scale Scientific Computing; Molecular Modelling; Scientific Computing in Emerging Critical Technologies; Computational Learning and Cognition; Computational Methods in Geosciences-Oceanographic and Atmospheric Systems; Computational Medicine; Artificial Intelligence; Cybernetics; Computer Security Issues; Information Security, Evolutionary and Innovative Computing, Information Theory, Mathematical Linguistics, Automata Theory, Cognitive Science, Theories of Qualitative Behaviour, Intelligent Systems, Genetic Algorithms and Modelling, Fuzzy Logic and Approximate Reasoning, Artificial Neural Networks, Expert and Decision Support Systems, Learning and Evolutionary Computing, Expert and Decision Support Systems, Learning and Evolutionary Computing, Biometrics, Moleculoid Nanocomputing, Self-adaptation and Self-organisational Systems, Data Engineering, Data Fusion, Information and Knowledge, applications of information science and so on. Publication is open to all researchers
from all over the world. Manuscripts to be submitted to the Journal must represent original research reports and has not been submitted elsewhere prior to or after submission to this journal for publication. All the manuscripts
submitted for consideration in ACSIT is subject to peer-review for taking up final decision on acceptance for publication, and decision of the editorial team will be final. All papers will be reviewed by at least two referees who are peers in their field of research and by an Editor of the Journal or as appointed by the Editor-in-Chief to be responsible for editing the manuscript. The authors agree to automatically transfer the copyright to the publisher (Krishi Sanskriti Publications), if and when the manuscript is accepted for publication. © 2014 Krishi Sanskriti Publications, India Printed in India No part of this publication may be reproduced or transmitted in any form by any means, electronic or mechanical, including photocopy, recording, or any information storage and retrieval system, without permission in writing from the copyright owners. DISCLAIMER The authors are solely responsible for the contents of the papers compiled in this volume. The publishers or editors do not take any responsibility for the same in any manner. Errors, if any, are purely unintentional and readers are requested to communicate such errors to the editors or publishers to avoid discrepancies in future. The journal may publish supplements to the journal in the form of monographs etc. also, but all costs related to the production of supplements are to be paid by the orderer/author. The contacts in this regard may be made prior with the Editor-in-Chief or the editorial office. Supplements will be treated in the same way as other submissions.

III
Submission of Manuscripts Please visit the journal’s home pages at http://www.krishisanskriti.org/acsit.html for details of aims and scope, readership, instruction to authors and publishing procedure and table of contents. Use website to order a subscription, reprints and individual articles. Authors are requested to submit their papers electronically to [email protected] and mention journal title (ACSIT) in subject line. Publication Fee: The publication fee for this journal is $300 (International authors) and INR 3500 (India, Pakistan, Nepal and Bangladesh), including taxes.
Subscription Information Subscription orders may be directed to the publisher or contact your preferred subscription agents. Regular Subscription price for the Journal US$380/Libraries and US$360/Individual (Outside India) Rs. 3500/Libraries and Rs. 1800/ Individual (Inside India) The Bank details for subscription/publication payment through NEFT/Online Transfer/ DD:
Beneficiary Name : Krishi Sanskriti Bank Name : Canara Bank Bank Address : Jeet Singh Marg, New Delhi Account No. : 1484101026988 Account Type : Savings IFSC Code : CNRB0001484 Swift Code : CNRBINBBBID
Frequency of Publication Quarterly (depending on the number of literature being accepted for publication, the volume will be split in numbers as required). All business correspondence enquires and subscription orders should be addressed to:
Editor-in-Chief
Editorial Office,
Advances in Computer Science and Information Technology (ACSIT), Krishi Sanskriti Publications E-47, Rajpur Khurd Extn. Post Office- I.G.N.O.U. (Maidangarhi), New Delhi -110 068, India E-Mail: [email protected]

IV
Author Guidelines Please follow the Guide for Authors instructions carefully to ensure that the review and publication of your paper is swift and efficient. A manuscript may be returned for revision prior to final acceptance, the revised version must be submitted as soon as possible after the author's receipt of the referee's reports. Revised manuscripts returned after the expiry of stipulated time (as quoted during such a request) will be considered as new submissions subject to full re-review. Paper categories:- Contributions falling into the following categories will be considered for publication: • Original high-quality research papers (preferably no more than 10 pages double-line-spaced manuscript, in
double column including tables and illustrations) • Short communications or case studies for rapid publication (no more than 5 double-line-spaced manuscript, in
double column pages including tables and figures) • Mini-Review on subjects of cutting-edge scientific developments, theories, hypotheses and concepts, which
could be of importance to the scientific community world-wide. Ethics in publishing Ethics in publishing and Ethical guidelines for journal publication, a standard operating procedure (SOP) can be followed as applied to other publication systems. For reference, online versions of the same can be freely accessed and information on the same may be sought by the publishing author(s). Conflict of interest Disclosure of actual or potential conflict of interest including financial by all the authors is mandatory for final appearance of their article in the journal. The standard procedure of operation (SOP) in this regard will be as followed by other publishing house and/or the laws governing such practices. Submission declaration Submission of an article implies that the work described has neither been published elsewhere (except in the form of an abstract or as part of a published lecture or academic thesis or as an electronic preprint), nor is under consideration for publication with other publishing house. Results submitted for publication should refer to their previous findings in the same way as they would refer to results from a different group. This applies not only to figures or tables, or parts of them, but has to be understood in a wider sense. Acknowledgements The acknowledgement section should list (a) other contributors for whom authorship is not justified, e.g. technical help; (b) financial and material support. Changes to authorship This policy concerns the addition, deletion, or rearrangement of author names in the authorship of accepted manuscripts:
Before the publication of the accepted manuscript, requests to add or remove an author, or to rearrange the author names, must be sent to the Journal Editorial Office through email from the corresponding author of the accepted manuscript and must include: (a) the reason the name should be added or removed, or the author names rearranged and (b) written confirmation (e-mail the scanned letter of consent or fax) from all authors that they agree with the addition, removal or rearrangement. In the case of addition or removal of authors, this includes confirmation from the author being added or removed. Requests that are not sent by the corresponding author will be forwarded by the Editorial Office to the corresponding author, who must follow the procedure as described above. Note that the publication of the accepted manuscript will be suspended or kept in abeyance until authorship has been agreed.
After the accepted manuscript is published, any request to add, delete, or rearrange author names in an article published in any issue will follow the same policies as noted above and result in a corrigendum.

V
Copyright This journal offers authors a choice in publishing their research Open Access. For Open access articles please mention the role of the funding source or agency. You are requested to identify who provided financial support for the conduct of the research and/or preparation of the article and to briefly describe the role of the sponsor(s), if any, in study design; in the collection, analysis and interpretation of data; in the writing of the report; and in the decision to submit the article for publication. If the funding source(s) had no such involvement then this should be stated.
Informed consent and patient details Studies on patients or volunteers require ethics committee approval and informed consent, which should be documented in the paper. Appropriate consents, permissions and releases must be obtained where an author wishes to include case details or other personal information or images of patients and any other individuals. Unless a written permission from the patient (or, where applicable, the next of kin), the personal details of any patient included in any part of the article and in any supplementary materials (including all illustrations) is obtained while making submission of such an article, no article or manuscript of such type would be accepted for publication in this journal.
Submission Submission to this journal proceeds totally online and you will be guided stepwise through the creation and uploading of your files. The system automatically converts source files to a single PDF file of the article, which is used in the peer-review process. All correspondence, including notification of the Editor's decision and requests for revision, will be effected by e-mail, thus removing the need for a paper trail.
Referees
Authors are requested to submit a minimum of four suitable potential reviewers (please provide their name, email addresses, and institutional affiliation). When compiling this list of potential reviewers please consider the following important criteria: they must be knowledgeable about the manuscript subject area; must not be from your own institution; at least two of the suggested reviewers must be from another country than the authors'; and they should, not have recent (less than four years) joint publications with any of the authors. However, the final choice of reviewers is at the editors' discretion.
PREPARATION OF MANUSCRIPT Use of word processing software: It is important that the file be saved in the native format of the word processor used. The text should be in double column format. Keep the layout of the text as simple as possible. Most formatting codes will be removed and replaced on processing the article. However, do use bold face, italics, subscripts, superscripts etc. When preparing tables, if you are using a table grid, use only one grid for each individual table and not a grid for each row. If no grid is used, use tabs, not spaces, to align columns.
Note that source files of figures, tables and text graphics will be required whether or not you embed your figures in the text. To avoid unnecessary errors you are strongly advised to use the 'spell-check' and 'grammar-check' functions of your word processor.
Article Structure Authors should arrange their contribution in the following order: 1. The paper title should be short, specific and informative. All author's names and affiliations should be clearly
indicated. Please also indicate the author for correspondence and supply full postal address, telephone and fax numbers, and e-mail address of such an author.
2. An abstract of approximately 250 words, outlining in a single paragraph the aims, scope and conclusions of the paper.
3. Four keywords, for indexing purposes; 4. The text suitably divided under headings. Subdivision - numbered sections
Divide your article into clearly defined and numbered sections. Subsections should be numbered 1.1 (then 1.1.1, 1.1.2, ...), 1.2, etc. (the abstract is not included in section numbering). Any subsection may be given a brief heading. Each heading should appear on its own separate line.
5. Acknowledgments (if any).

VI
6. References (double spaced, and following the Oxford style). 7. Appendices (if any). 8. Tables (each on a separate sheet). 9. Captions to illustrations (grouped on a separate sheet or sheets). 10. Illustrations, each on a separate sheet containing no text, and clearly labeled with the journal title, author's name and illustration number.
Essential title page information • Title. Concise and informative. Titles are often used in information-retrieval systems. Avoid abbreviations and
formulae where possible. • Author names and affiliations. Where the family name may be ambiguous (e.g., a double name), please indicate
this clearly. Present the authors' affiliation addresses (where the actual work was done) below the names. Indicate all affiliations with a lower-case superscript letter immediately after the author's name and in front of the appropriate address. Provide the full postal address of each affiliation, including the country name and, if available, the e-mail address of each author.
• Corresponding author. Clearly indicate who will handle correspondence at all stages of refereeing and publication, also post-publication. Ensure that phone numbers (with country and area code) are provided in addition to the e-mail address and the complete postal address.
Contact details must be kept up to date by the corresponding author.
• Present/permanent address. If an author has moved since the work described in the article was done, or was visiting at the time, a 'Present address' (or 'Permanent address') may be indicated as a footnote to that author's name. The address at which the author actually did the work must be retained as the main, affiliation address.
Superscript Arabic numerals are used for such footnotes.
Submission checklist Please ensure that the following items are present, while submitting the article for consideration: One author has been designated as the corresponding author with contact details: • E-mail address • Full • Postal address • Phone numbers
All necessary files have been uploaded, and contain: • Keywords • All figure captions • All tables (including title, description, footnotes) • Manuscript has been 'spell-checked' and 'grammar-checked' • References are in the correct format for this journal • All references mentioned in the Reference list are cited in the text, and vice versa • Permission has been obtained for use of copyrighted material from other sources (including the Web)
After Acceptance Use of the Digital Object Identifier The Digital Object Identifier (DOI) may be used to cite and link to electronic documents. The DOI will be assigned as per standard protocol to the 'Articles in press'. For reference about the given DOI (in URL format; see here an article in the journal Physics Letters B): http://dx.doi.org/10.1016/j.physletb.2010.09.059, is cited for your perusal.
Online proof correction
Corresponding authors will receive an e-mail with a link to our Submission System, which would allow them to annotate and do correction of proofs online. In addition to editing text, the authors can also comment on figures/tables and answer questions from the Copy Editor.
All instructions for proofing will be given in the e-mail to be sent to authors, we will ensure from our side to get your article published quickly and accurately if all of your corrections are uploaded within two days and also, that all corrections are performed in one session. Please check carefully before replying, as inclusion of any subsequent corrections cannot be guaranteed. Proofreading is solely author’s responsibility. Note that publisher team may proceed with the publication of your article if no response is received.

Advances in Computer Science and Information Technology (ACSIT)
Volume 2, Number 1; January-March, 2015
Contents
Design of Expert System for Fault Diagnosis of an Automobile 1-6 Aijaz ul Haq, N.A. Najar and Ovais Gulzar Recommendation Techniques for Adaptive E-learning 7-12 Devanshu Jain, Ashish Kedia, RakshitSingla
and Sameer Sonawane
Emerging Application of Wireless Sensor Network (WSN) (Underwater Wireless Sensor Network) 13-17 Ambika Sharma and Devershi Pallavi Bhatt Speech Feature Extraction and Classification Techniques 18-20 Kamakshi and Sumanlata Gautam Revolution of E-learning (Current and Future Trends in E-learning, Distance Learning and Online 21-26 Teaching Learning Methodologies) Akash Ahmad Bhat and Qamar Parvez Rana Sentimental Analysis Using Social Media and Big data 27-29 Arpita Gupta and Anand Singh Rajawat Lossless Image Compression of Medical Images Using Golomb Rice Coding Technique 30-34 Girish Gangwar, Maitreyee Dutta
and Gaurav Gupta
The Distributed Computing Paradigm: Cloud Computing 35-38 Prabha Sharma Data Quality and the Performance of the Data Mining Tools 39-42 Mrs. Rekha Arun and J. Jebamalar Tamilselvi Secure Message Transmission with Watermarking using Image Processing 43-47 Shivi Garg and Manoj Kumar Risks Involved in E-banking and their Management 48-52 Syed Masaid Zaman and Qamar Parvez Rana Towards a Hybrid System with Cellular Automata and Data Mining for Forecasting Severe Weather 53-55 Patterns Pokkuluri Kiran Sree and SSSN Usha Devi N A Survey of Software Project Management Tool Analysis 57-60 Alka Srivastava

Contents
Security Analysis of Web Application using Genetic Algorithms in Test Augmentation Technique 61-63 Keertika Singh and Garima Singh Automatic Face Recognition in Digital World 64-70 Radhey Shyam and Yogendra Narain Singh Cyber Security: A Challenge for India 71-76 Ms. Shuchi Shukla Effect of Slots on Operating Frequency Band of Octagon Microstrip Antenna 77-80 Simran Singh, Manpreet Kaur
and Jagtar Singh
Scalability Issues in Software Defined Network (SDN): A Survey 81-85 Smriti Bhandarkar, Gyanamudra Behera
and Kotla Amjath Khan
Impact of E-learning in Higher Education with Reference to Jammu & Kashmir State 86-89 Wasim Akram Zargar
and Jagbir Ahlawat
Role of Genetic Algorithm in Network Optimization 90-94 Shweta Tewari and Amandeep Kaur Lossless Image Compression with Arithmetic Encoding 95-97 Thalesh P. Kalmegh, A.V. Deorankar and Abdul Kalam

Advances in Computer Science and Information Technology (ACSIT) Print ISSN: 2393-9907; Online ISSN: 2393-9915; Volume 2, Number 1; January-March, 2015 pp. 1-6 © Krishi Sanskriti Publications http://www.krishisanskriti.org/acsit.html
Design of Expert System for Fault Diagnosis of an Automobile
Aijaz ul Haq1, N.A. Najar2 and Ovais Gulzar3 1Student, Department of Computer Sciences Satya College of Engineering and Technology
72 KM Stone NH-2 Delhi Mathura Road, Palwal, Haryana 121105 2Associate Member, Mechanical Engineering Division The Institution of Engineers (India)
J&K State Centre, Sonawar Srinagar J&K 190001 3Department of Mechanical Engineering Satya College of Engineering and Technology
72 KM Stone NH-2 Delhi Mathura Road, Palwal, Haryana 121105 E-mail: [email protected], [email protected], [email protected]
Abstract—This paper presents a design and implementation of Expert System for Fault Diagnosis of an automobile using mix of many knowledge representation forms. The scheme for knowledge representation uses both procedural and declarative knowledge representation formalisms through the application of relational database. So the rule base, case base and frame base formats have been converted into tables. The scheme facilitates combination of forward and backward chaining reasoning, using the problem reduction method for solving problem, and the heuristic search technique. All the editing facilities of system; inserting, deleting and updating of a rule, case, and frame are present. In this paper, visual studio 2008 (VB.Net) have been used for the implementation of the system and suitable user interface design. The implementation is an application for the system in the domain vehicle fault diagnosis
1. INTRODUCTION
Expert systems (ES) are a branch of artificial intelligence (AI), and were developed by the AI community in the mid-1960s. An expert system can be defined as "an intelligent computer program that uses knowledge and inference procedures to solve problems that are difficult enough to require significant human expertise for their solutions [1]". We can infer from this definition that expertise can be transferred from a human to a computer and then stored in the computer in a suitable form that users can call upon the computer for specific advice as needed. Then the system can make inferences and arrive at a specific conclusion to give advices and explains, if necessary, the logic behind the advice. ES provide powerful and flexible means for obtaining solutions to a variety of problems that often cannot be dealt with by other, more traditional and orthodox methods [2]. The terms expert system and knowledge-based system (KBS) are often used synonymously. The four main components of KBS are: a knowledge base, an inference engine, a knowledge engineering tool, and a specific user interface. Some of KBS important applications include the following: medical
treatment, engineering failure analysis, decision support, knowledge representation, climate forecasting, decision making and learning, and chemical process controlling [2].Previous work has shown that systems concerned with car fault detection were very limited. Jeff Pepper [3] has described a proposed expert system for car fault diagnosis called SBDS, the Service Bay Diagnostic System. SBDS is being developed by a joint project team at Ford Motor Company, the Carnegie Group, an Hewlett Packard. SBDS's knowledge base will contain the expertise of Ford's top diagnosticians, and it will make their diagnostic skills available to mechanics in every Ford dealership in North America. This system will guide a human technician through the entire service process, from the initial customer interview at the service desk to the diagnosis and repair of the car in the garage [3]. There are a lot of related expert systems in the literature concerned with diagnostic problems. Daoliang et al. [4] presents a web-based expert system for fish disease diagnosis. The system is now is use by fish farmers in the North China region. Yu Qian et al. [5] proposed an expert system for real time failure diagnosis of complex chemical processes. Other diagnosis systems are described in [6-9].
2. EXPERT SYSTEM DESIGN
The brain was the first processor humans used from the beginning to solve their problems, through creating new ideas or imitating the ways nature or animals used to live. The mid-twentieth century witnessed the invention of the computer, to form a turning point for humans life and the revolution of information. This invention opened the way for the scientists to allow machinists to mimic the actions and thinking of human beings themselves and thereby create a new science known as artificial intelligence. Owaied, Abu-A'ra & Farhan [10] said that "Most people know the term artificial intelligence concerning about how to build an intelligent

Aijaz ul Haq, N.A. Najar and Ovais Gulzar
Advances in Computer Science and Information Technology (ACSIT) Print ISSN: 2393-9907; Online ISSN: 2393-9915; Volume 2, Number 1; January-March, 2015
2
machine. This machine should have certain capabilities such as: behaves like a human being, smart, problem solver of unstructured and complex problems as human does, understands languages, learner, and able to reason and analyze data and information, and so on". Knowledge-based system is an artificial intelligence application that uses the knowledge about a specific and narrow domain. The structure of knowledge based system depends on the proposed functional model of human system, which was constructed according to the direction of arrow in the left of Fig. 1 from top to bottom [11].
Fig. 1: Functional Model of Human system
While the design and implementation of knowledge based system will be according to the direction of arrow in the left of Fig. 2 from bottom to top as mimic the human functional model. Therefore, the implementation starts from the knowledge base and then proposing an inference engine and a user interface which are suitable to the knowledge base representation forms.
Fig. 2: Structure of Knowledge-Based System
The most important phase in building knowledge based system is building the knowledge base. The implementation of knowledge base depends on the representation forms of the knowledge and usually there are many forms (Rule base, Case base, Frame base, Semantic nets, Logic forms and so on) used by human which may be applied. Parsaye, et al [12] defined intelligent databases as "databases that manage information in a natural way, making that information easy to store, access and use."
The intelligent databases have as general purpose the generated and the discovery of information and knowledge. Among these types of databases we include the active, deductive, knowledge and fuzzy databases. In general the IDB are the natural evolution of the traditional databases, not only because they allow the manipulation of the data, also of the cognitive elements in form of facts and rules. One essential aspect of these databases is the possibilities of using techniques to discover knowledge, such as data mining techniques; all this permits learning patterns and data analysis strategies, as well as making classification and recognition, among others. The IDB systems are characterized by using an artificial intelligent technique that supports different reasoning mechanisms, they have a similar architecture to the expert systems that consist of a fact base, a rule base and must have persistence of the fact base [13].
2.1 Design of The Proposed Intelligent Database System Fig. 3 presents the Proposed Knowledge-based Expert System. The proposed model consists of four modules, which are; user interface, inference engine, knowledge base, and editing facilities for knowledge bases. Most of the existing systems use one or two knowledge representation forms, the proposed system which uses three types of knowledge representation forms.
Fig. 3: Architecture of the Proposed Intelligent Database System
The following subsections are detailed descriptions of the Design of Expert System for Fault Diagnosis of Automobiles, a new hybrid scheme of knowledge representation using relational database as integrating of three different knowledge representation formats.
2.2 User Interface The user interface simulates the communications with the environment unit of the functional model of human system. The communication between the user and the system is simplified by providing most of the facilities for the user to interact with the system.[11] The user interface consists of

Design of Expert System for Fault Diagnosis of an Automobile 3
Advances in Computer Science and Information Technology (ACSIT) Print ISSN: 2393-9907; Online ISSN: 2393-9915; Volume 2, Number 1; January-March, 2015
three components:• Main Menu: consists of several buttons. Each button represents a form; when the system starts this menu it will be displayed in order to allow the user to select one of the forms. Data Grid: A grid view or a data grid is a graphical user
interface element that presents a tabular view of data. A typical grid view also supports the following:
Dragging column headers to change their size and their order.In-place editing of viewed data.
Row and column separation, and alternating row background colors.
Buttons: They are the controls which we click on to perform some action. Buttons are used mostly for handling events in code
2.3 Inference Engine Implementation of the Inference Engine depends on the representation of knowledge in the knowledge bases of the proposed system. The implementation of inference engine will be regarded as a combination of problem solving method, reasoning agent and search technique.
The reasoning agent is responsible to accept sophisticated queries concerning some specific problems to execute appropriate knowledge. The use of case base format will facilitate the analogical reasoning, the use of frame base format will facilitate the induction, the use of rule base format will facilitate the deduction. So the inference engine uses combination of forward and backward chains reasoning according to problem reduction method for solving problem, and the heuristic search technique.
2.4 Knowledge Bases This thesis uses procedural and declarative knowledge representation formalisms. So the Rule, Case and Frame bases formats are used and converted into database tables through the application of relational data base. In the following subsections are descriptions of the three formats.
2.4.1 Case Base Case base is a technique to solve problems by searching for a similar case from previous experience and then adapted to solve the problem. The Case-base has the following activities [14] :
Retrieve the most similar case or cases. Reuse the knowledge in that case to solve the problem Revise the proposed solution. Retain the solution as part of the new case.
The proposed method to organize the cases will be in three tables; the first table consists of two columns: column one presents the case number and column two presents the case name. The second table consists of two columns: column one presents condition number and column two presents condition
name. The third table consists of three columns which present case number, condition number and condition Priority.
2.4.2 Rule Base The rule base is a set of rules and the syntax of a rule is IF <conditions> THEN <actions> format and usually called clausal form. The general clausal form is [15]
A1, A2, A3... An C1, C2, C3... Cm
In this paper, the relational database will be used to represent the rule as table as seen in Table 4.1. The rules will be stored in a table format with the maximum number of column is k, for instance, k=5, then (Col-1, Col-2 … Col-5). The first column represents the left-hand-side of the rule, which is the conclusion of a rule usually called action (A) and from column-2 to column-4 are used to represent the conditions of the rule (C1, C2… C5), and the last column is the same action so this rule will be as Horn clause presented as follows:
A1 C1, C2, C3, C4, C5 A2 C1, C2, C3
Table 2.1: Layout of a Rule in the Table
2.4.3 Frame Base Frame base is a knowledge representation that uses frames, as their primary means to represent domain knowledge. A frame is a structure for representing a concept or situation, frame consists of slots which can be filled by value, or procedures for calculating values [16]
In this paper the relational database will be used to represent the frame as table as shown in table 2.2
Table 2.2: Layout of Frame in the Table.
2.4 Editing Facilities for Knowledge Bases This component is used to manage the facilities: inserting, deleting and updating processes for knowledge base. All these facilities are applied according to the given request by the end user.

Aijaz ul Haq, N.A. Najar and Ovais Gulzar
Advances in Computer Science and Information Technology (ACSIT) Print ISSN: 2393-9907; Online ISSN: 2393-9915; Volume 2, Number 1; January-March, 2015
4
Implementation of ES In this paper, mix of knowledge representation formats and the knowledge about the automobile diagnosis have been acquired from vehicle’s mechanics. By using two methods to elicit knowledge from human, these are interviewing and observing. Using both methods for collection of knowledge related to vehicle systems and malfunctions that occur for automobiles and the reasons for the malfunctions. This knowledge is included in the Expert System for Fault Diagnosis of Automobiles.
3.1 Knowledge Base Schemes Since the knowledge bases, Rule base, Case base, and Frame, are converted into tables and usually the Databases are built in relational database systems. Therefore, relational database systems have been used for the implementation of knowledge bases schemes for the Expert System for Fault Diagnosis of Automobiles.
The implementation consists of twelve tables, and they are: case table, condition table, case and condition table, seven tables for frames, rules table, and condition –frame.
3.1.1. Case Base for Automobile Diagnosis The proposed Scheme to organize the cases will be in three tables which are Cases table, Conditions table and Case-Condition table. While the case is a malfunction and condition is a cause of the malfunction. Cases table contains two columns, the first column labeled by Case-No, while the second columns labeled by Case-Name, a set of cases were stored in the Case-Name columns shown in Fig. 4.
Fig. 4: Cases Table
The Column Case-Number is assigned as primary key. Conditions table contains two columns, the first column labeled by Condition- No while the second column labeled by Condition-Name, a set of conditions were stored in the Condition-Name column as shown in Fig. 5. The Column Condition-Number is assigned as primary key Case-Condition table contains three columns, the first column labels by case number. The second column labeled by condition number and the third column labels by condition priority as shown in Fig. 6. The columns (case number, condition number) are Primary key. The column (case number) and the column (Condition number) are foreign key.
Fig. 5: Conditions Table
Fig. 6: Case-Conditions Table
Design of Expert System for Fault Diagnosis of an Automobile 5
Advances in Computer Science and Information Technology (ACSIT) Print ISSN: 2393-9907; Online ISSN: 2393-9915; Volume 2, Number 1; January-March, 2015
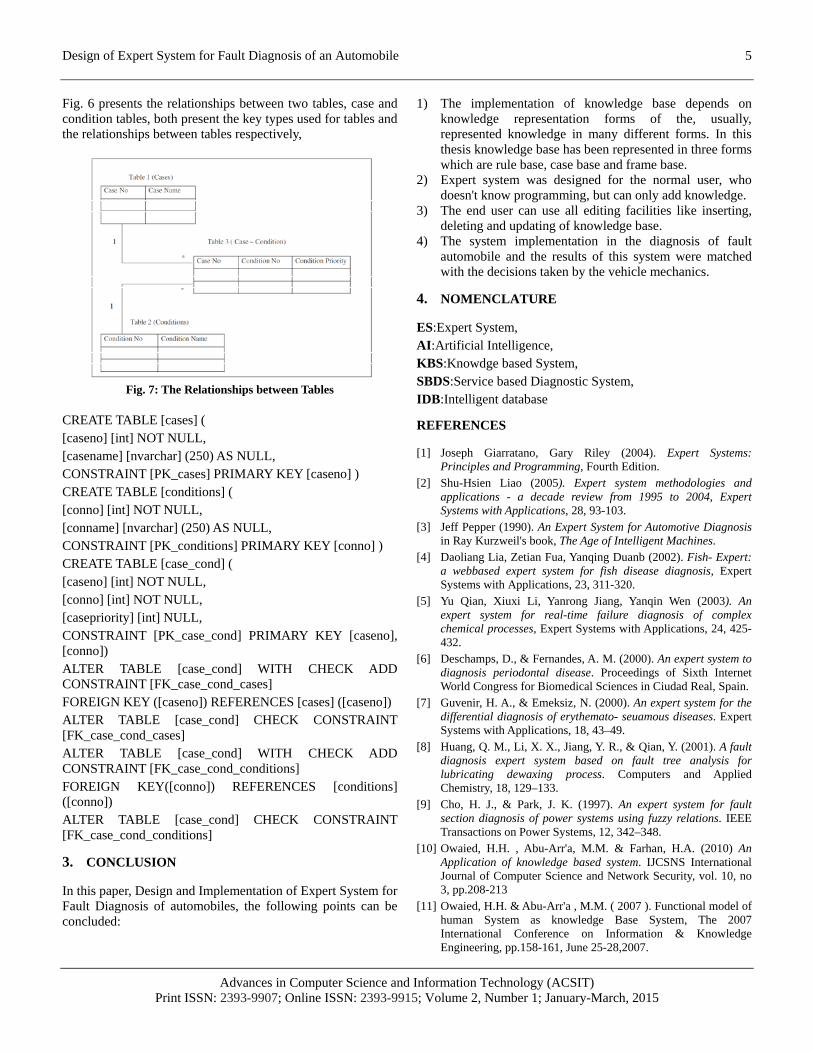
Fig. 6 presents the relationships between two tables, case and condition tables, both present the key types used for tables and the relationships between tables respectively,
Fig. 7: The Relationships between Tables
CREATE TABLE [cases] ( [caseno] [int] NOT NULL, [casename] [nvarchar] (250) AS NULL, CONSTRAINT [PK_cases] PRIMARY KEY [caseno] ) CREATE TABLE [conditions] ( [conno] [int] NOT NULL, [conname] [nvarchar] (250) AS NULL, CONSTRAINT [PK_conditions] PRIMARY KEY [conno] ) CREATE TABLE [case_cond] ( [caseno] [int] NOT NULL, [conno] [int] NOT NULL, [casepriority] [int] NULL, CONSTRAINT [PK_case_cond] PRIMARY KEY [caseno], [conno]) ALTER TABLE [case_cond] WITH CHECK ADD CONSTRAINT [FK_case_cond_cases] FOREIGN KEY ([caseno]) REFERENCES [cases] ([caseno]) ALTER TABLE [case_cond] CHECK CONSTRAINT [FK_case_cond_cases] ALTER TABLE [case_cond] WITH CHECK ADD CONSTRAINT [FK_case_cond_conditions] FOREIGN KEY([conno]) REFERENCES [conditions] ([conno]) ALTER TABLE [case_cond] CHECK CONSTRAINT [FK_case_cond_conditions]
3. CONCLUSION
In this paper, Design and Implementation of Expert System for Fault Diagnosis of automobiles, the following points can be concluded:
1) The implementation of knowledge base depends on knowledge representation forms of the, usually, represented knowledge in many different forms. In this thesis knowledge base has been represented in three forms which are rule base, case base and frame base.
2) Expert system was designed for the normal user, who doesn't know programming, but can only add knowledge.
3) The end user can use all editing facilities like inserting, deleting and updating of knowledge base.
4) The system implementation in the diagnosis of fault automobile and the results of this system were matched with the decisions taken by the vehicle mechanics.
4. NOMENCLATURE
ES:Expert System, AI:Artificial Intelligence, KBS:Knowdge based System, SBDS:Service based Diagnostic System, IDB:Intelligent database
REFERENCES
[1] Joseph Giarratano, Gary Riley (2004). Expert Systems: Principles and Programming, Fourth Edition.
[2] Shu-Hsien Liao (2005). Expert system methodologies and applications - a decade review from 1995 to 2004, Expert Systems with Applications, 28, 93-103.
[3] Jeff Pepper (1990). An Expert System for Automotive Diagnosis in Ray Kurzweil's book, The Age of Intelligent Machines.
[4] Daoliang Lia, Zetian Fua, Yanqing Duanb (2002). Fish- Expert: a webbased expert system for fish disease diagnosis, Expert Systems with Applications, 23, 311-320.
[5] Yu Qian, Xiuxi Li, Yanrong Jiang, Yanqin Wen (2003). An expert system for real-time failure diagnosis of complex chemical processes, Expert Systems with Applications, 24, 425-432.
[6] Deschamps, D., & Fernandes, A. M. (2000). An expert system to diagnosis periodontal disease. Proceedings of Sixth Internet World Congress for Biomedical Sciences in Ciudad Real, Spain.
[7] Guvenir, H. A., & Emeksiz, N. (2000). An expert system for the differential diagnosis of erythemato- seuamous diseases. Expert Systems with Applications, 18, 43–49.
[8] Huang, Q. M., Li, X. X., Jiang, Y. R., & Qian, Y. (2001). A fault diagnosis expert system based on fault tree analysis for lubricating dewaxing process. Computers and Applied Chemistry, 18, 129–133.
[9] Cho, H. J., & Park, J. K. (1997). An expert system for fault section diagnosis of power systems using fuzzy relations. IEEE Transactions on Power Systems, 12, 342–348.
[10] Owaied, H.H. , Abu-Arr'a, M.M. & Farhan, H.A. (2010) An Application of knowledge based system. IJCSNS International Journal of Computer Science and Network Security, vol. 10, no 3, pp.208-213
[11] Owaied, H.H. & Abu-Arr'a , M.M. ( 2007 ). Functional model of human System as knowledge Base System, The 2007 International Conference on Information & Knowledge Engineering, pp.158-161, June 25-28,2007.

Aijaz ul Haq, N.A. Najar and Ovais Gulzar
Advances in Computer Science and Information Technology (ACSIT) Print ISSN: 2393-9907; Online ISSN: 2393-9915; Volume 2, Number 1; January-March, 2015
6
[12] Parsaye, K. , Chignell, M. , Khoshafian, S. & Wong, H., (1989). Intelligent databases: object- oriented, deductive hypermedia technologies, New York, John Wiley & Sons, 1989.
[13] Ana, M. & Jose, A. (2007). A General ontology for intelligent database, International Journal of Computers, vol. 1, no 3, pp.102-108.
[14] Reisbeck, C.K., & Schank, R.C. (1989). Inside Case-Based Reasoning. Lawrence Erlbaum Associates, Hillsdale, NJ, US.pp.423
[15] Coenen, F. (1998). Verification and validation issues in expert and database systems: the expert systems perspective, Database and Expert Systems Applications, Liverpool, England.
[16] Chen, T. , Wu, J.K. & Takagi, M. (1991). Frame representation of ecological models in forestry planning, pp. 816-820, University of Tokyo, Japan.

Advances in Computer Science and Information Technology (ACSIT) Print ISSN: 2393-9907; Online ISSN: 2393-9915; Volume 2, Number 1; January-March, 2015 pp. 7-12 © Krishi Sanskriti Publications http://www.krishisanskriti.org/acsit.html
R ecommendation T echniques for A daptive E -lear ning
Devanshu J ain1, Ashish K edia2, R akshitSingla3 and Sameer Sonawane4 1Dept. of ICT DA-IICT Gandhinagar, Gujarat, India
2Dept. of IT NIT-Karnataka Surathkal, Karnataka, India 3Dept. of CSE IIT-Hyderabad Hyderabad, Andhra Pradesh, India
4
E-mail: Dept. of CSE VNIT-Nagpur Nagpur, Maharashtra, India
1 , [email protected] 2 , [email protected] , [email protected] 4
Abstract—Personalization of learning is the need of the hour. Technology can play an important role in achieving this personalization of learning. While today's Learning Management Systems (LMSs) do facilitate the instructor to make the content available on Internet, yet they don't have any functionality to personalize the learning of the user. The adaptive e-learning technology extends this traditional classroom environment to make the guidance, a one to one mechanism, i.e. single machine guiding a single user through the course material. This paper proposes recommendation techniques to offer courses to the user.
1. I NT R ODUC T I ON Traditional classroom training method is no longer viable as it requires large budgets, extensive planning and logistics. That's why many are shifting their attention to e-learning as a technological solution to this problem. 98% of companies, nowadays, use technological infrastructure (on line learning) to control the delivery and management of training to its employees.[1] Using technology in the learning assists in changing the process from one based on rote to one based on comprehension. [2]
The true power of this educational technology is not just to deliver content. Adaptive e-learning intends to improve the user experience by capturing details about the user like his learning style, his cognitive abilities, knowledge level, interests, personal traits, etc. and provides the user a personalized learning path based on the information captured. As opposed to traditional classroom ideology of one size fits all, adaptive e-learning makes learning personal so that the user can trace the best learning curve. The system identifies user characteristics and provides him instructions accordingly. In other words, the goal of the system is to provide the right content to the right person at the right time.
The major part of our work is to come up with recommendation techniques to provide the next best favourable content to the user.
2. R E L A T E D W OR K DONE
There are three major components of an adaptive e-learning system, namely,Content Modelling, User Modelling and Adaptive Engine.
Content Model is used for domain level representation of the knowledge structure. Chrysafiadi and Virvou[3] suggests an approach for representing the domain knowledge by using Fuzzy Cognitive Maps. The domain knowledge is divided into concepts and there are interdependencies between these concepts. The structure takes the form of a directed graph, where each node represents a concept and arcs between these nodes represent the level of interdependencies among concepts.
F ig. 1: F uzzy C ognitive M aps[3]
Content model also describes the forms in which the content is available for its users, for example: e-book, slide shows, videos, animations, etc. This helps in providing the right type of content to the user i.e. the content which is suitable to his cognitive needs and personal preferences.Concept map (FCM) plays an important role as it helps in student assessment, recommendation and remediation. A major challenge in constructing a concept map is to find the relationship between concepts, automatically. It is tedious for an instructor to

Devanshu Jain, Ashish Kedia, RakshitSingla and Sameer Sonawane
Advances in Computer Science and Information Technology (ACSIT) Print ISSN: 2393-9907; Online ISSN: 2393-9915; Volume 2, Number 1; January-March, 2015
8
provide all the relationships, manually which may also be inaccurate. Shih-Ming Bai and Shyi-Ming Chen[4] provides a method to semi-automatize this construction of concept mapping which has further been improved by Shyi-Ming Chen and Po-Jui Sue[5]. The construction requires two types of information namely, how much grade does a student score in every question, denoted by Grade - matrix and how much does a question test the user on a particular concept, denoted by Question Concept - matrix.
1) First, we calculate the similarity between questions' responses by the students, i.e. the counter values on the basis of G (Grade) matrix.Only the pairs of questions, for which the count value is greater than threshold value: n * 40%, are considered for next step. Here n is the number of students. Consider for example the following grade matrix:
So similarity between Q1 and Q2 is 0 0+ 0 0+ 0 0+ 1 0+ 1 1=1+ 1+ 1+ 0+ 1=4, which is greater than cut-off, 5 * 0.4=2. Hence this pair, Q1 and Q2 moves to second step.
2) Then the item-set support relationship is calculated. Item set is of four types: 1-item-set for right and wrong support and 2-item-set for right and wrong support.
Table 1: 1-question item set suppor t table 1-Question Item Set Right Support
Q1 Q2 Q3 Q4 Q5
2 1 0 2 3
It represents that 2 people have got Q1 right 1 has got Q2 right and so on. It denotes the support for right attempts of each question. Similarly, the support for wrong attempts are also found out. Then, a two item set support table is constructed, as follows:
Table 2: 2-question item set suppor t table 2-Question Item Set Right Support
Q1 & Q2 1 Q2 & Q3 0 Q3 & Q4 0 Q4 & Q5 2 Q5 & Q1 0
It represents that for Q1 and Q2, only 1 has got both of the questions right. It denotes the 2-item set support for right
attempts. Similarly, the 2-itemset support for wrong attempts are also found out. Now, we use the following formula to calculate the confidence between questions.
𝐶𝐶𝐶𝐶𝐶𝐶𝐶𝐶𝐶𝐶𝐶𝐶𝐶𝐶𝐶𝐶𝐶𝐶𝐶𝐶(𝑄𝑄𝑄𝑄 → 𝑄𝑄𝑄𝑄) =𝑆𝑆𝑆𝑆𝑆𝑆𝑆𝑆𝐶𝐶𝑆𝑆𝑆𝑆(𝑄𝑄𝑄𝑄,𝑄𝑄𝑄𝑄)𝑆𝑆𝑆𝑆𝑆𝑆𝑆𝑆𝐶𝐶𝑆𝑆𝑆𝑆(𝑄𝑄𝑄𝑄)
Through this, the confidence level between the questions is established. Confidence levels for two kinds of association rules are found out: one for the correctly attempted and second for the wrongly attempted, as mentioned above. In layman words, the confidence(Q1 Q2)right
3) Now a new Question-Concept matrix is created (QC'),based on below two rules:
represents that if the student attempts Q1, correctly then what is the probability by which he attempts Q2, correctly. Association rules with confidence level greater than 75% are considered in future steps.
For example,
𝐶𝐶𝐶𝐶𝐶𝐶𝐶𝐶𝐶𝐶𝐶𝐶𝐶𝐶𝐶𝐶𝐶𝐶𝐶𝐶(𝑄𝑄1 → 𝑄𝑄2)right =𝑆𝑆𝑆𝑆𝑆𝑆𝑆𝑆𝐶𝐶𝑆𝑆𝑆𝑆(𝑄𝑄1,𝑄𝑄2)𝑆𝑆𝑆𝑆𝑆𝑆𝑆𝑆𝐶𝐶𝑆𝑆𝑆𝑆(𝑄𝑄1) =
12
a. If there are two or more nonzero values in column Ct of the questions-concepts matrix QC, then the degree of relevance of question Qx with respect to concept Ct
𝑞𝑞𝑆𝑆′𝑆𝑆𝑆𝑆 = 𝑞𝑞𝐶𝐶𝑄𝑄𝑆𝑆∑ 𝑞𝑞𝐶𝐶𝑆𝑆𝑆𝑆𝑚𝑚𝑆𝑆=1
Where m is the number of questions
in the constructed questions-concepts matrix QC' is calculated as follows:
b. If there is only one nonzero value in column Ct of the questions-concepts matrix QC, then the degree of relevance of question Qx with respect to concept Ct
𝑞𝑞𝐶𝐶′𝑄𝑄𝑆𝑆 = 𝑞𝑞𝐶𝐶𝑄𝑄𝑆𝑆
So, if QC matrix was:
𝑄𝑄𝐶𝐶 =
⎣⎢⎢⎢⎢⎡ 𝐶𝐶1 𝐶𝐶2 𝐶𝐶3 𝐶𝐶4 𝐶𝐶5𝑄𝑄1 1 0 0 0 0𝑄𝑄2 0 1 0.5 0 0𝑄𝑄3 0.5 0 0.5 0 0𝑄𝑄4 0.3 0.4 0 0.3 0𝑄𝑄5 0 0 0 0 1 ⎦
⎥⎥⎥⎥⎤
Thenew matrix will be:
𝑄𝑄𝐶𝐶′ =
⎣⎢⎢⎢⎢⎡ 𝐶𝐶1 𝐶𝐶2 𝐶𝐶3 𝐶𝐶4 𝐶𝐶5𝑄𝑄1 0.555 0 0 0 0𝑄𝑄2 0 0.714 0.5 0 0𝑄𝑄3 0.278 0 0.5 0 0𝑄𝑄4 0.167 0.286 0 0.3 0𝑄𝑄5 0 0 0 0 1 ⎦
⎥⎥⎥⎥⎤
in the constructed questions-concepts matrix QC' is calculated as follows:

Recommendation Techniques for Adaptive E-learning 9
Advances in Computer Science and Information Technology (ACSIT) Print ISSN: 2393-9907; Online ISSN: 2393-9915; Volume 2, Number 1; January-March, 2015
4) Based on the associative rule Qx Qy, the relevance between concept Ci Cj
𝑆𝑆𝐶𝐶𝑟𝑟�𝐶𝐶𝐶𝐶 , 𝐶𝐶𝑗𝑗 �𝑄𝑄𝑄𝑄→𝑄𝑄𝑄𝑄
= 𝑞𝑞𝐶𝐶𝑄𝑄𝐶𝐶 ∗ 𝑞𝑞𝐶𝐶′ 𝑄𝑄𝑗𝑗 ∗ 𝐶𝐶𝐶𝐶𝐶𝐶𝐶𝐶𝐶𝐶𝐶𝐶𝐶𝐶𝐶𝐶𝐶𝐶𝐶𝐶(𝑄𝑄𝑄𝑄 → 𝑄𝑄𝑄𝑄)
, is calculated:
Here, Ci denotes a concept in question Qx and Cjdenotes a concept in question Qy, qcxi denotes the degree of relevance of question Qx with respect to concept Ci in the questions-concepts matrix QC, qcyj denotes the degree of relevance of question Qy with respect to concept Cj
So, relevance between concept C
in the questions-concepts matrix QC. Confidence represents the confidence of the association rule QxQy.
1 and C2
= 1*0.714*0.5=0.357
, on the basis of association rule Q1Q2 will be:
𝑆𝑆𝐶𝐶𝑟𝑟(𝐶𝐶1, 𝐶𝐶2)𝑄𝑄1→𝑄𝑄2 = 𝑞𝑞𝐶𝐶11 ∗ 𝑞𝑞𝐶𝐶′22 ∗ 𝐶𝐶𝐶𝐶𝐶𝐶𝐶𝐶𝐶𝐶𝐶𝐶𝐶𝐶𝐶𝐶𝐶𝐶𝐶𝐶(𝑄𝑄1 → 𝑄𝑄2)𝑆𝑆𝐶𝐶𝑟𝑟ℎ𝑆𝑆
5) Calculate a threshold value of the relevance degree µ=MIN(qcxt
6) If rev(C
), where 1 ≤ x ≤ m and 1 ≤ t ≤ p, m is the number of questions and p is the number of concepts.
i,Cj)QxQy< µ, then calculate €ij= Ni+ Nj, where Ni
If € is the number of questions related to concept i.
ij
7) Now, in some cases, there are two relevance degree between same pair of concepts - one for the associative rule (correctly learned to correctly learned) and second for incorrectly learned to incorrectly learned. The one with maximum value is chosen.
> m*50%, then the relevance relation is retained.
Student Model refers to the method of representing a user in the virtual world. Student Model is used to collect and store user's information like knowledge, misconception, goals, emotional state, etc. This information is then used by the system to determine user's need and adapt itself accordingly. There are two types of information collected [2] - Domain related (related to the context of the course like knowledge about different concepts, misconceptions, etc.) and Domain unrelated (personal traits of the user, i.e. cognitive abilities, learning style, age, sex, etc.). Much of the information stored in a student model is static in nature i.e., it remains constant throughout the learning phase such as age, sex, mother tongue etc. Such information is usually collected via questionnaires. All other information is dynamic in nature i.e., it changes during the learning phase like knowledge level, performance etc. Such information is available directly via the student's interaction with the system and is constantly updated. Chrysafiadi and Virvou have presented a nice literature of the popular student modelling techniques used in the past decade [6].
We suggest representation of domain related information to be done using an overlay model [7], i.e. the user's knowledge is expressed as a subset of the knowledge domain, which represents the expert knowledge in that domain.
F ig. 2: Over lay M odel [8]
User's knowledge, instead of being represented in concrete terms, is represented in an abstract (fuzzy) way, which is more close to human understanding and results in better interpretation. The knowledge is categorized in four fuzzy sets: Unknown (Un), Unsatisfactorily Known (UK), Known (K) and Learned(L). Membership function of each set is described using simple equations as mentioned in [8].
Domain unrelated information can be modelled using Felder-Silverman Learning Style Model (FSLSM)[9]. It distinguishes the user's preferences on four dimensions.
1) Way of Learning - Active learners are the ones who like to apply the learned material and work in groups, communicating their ideas. Reflective workers try to work alone, think about what they have learned.
2) Intuitive and Sensory preferences - Sensing learning style like concrete learning material and like to solve problems using standard approaches. Intuitive learners like totally rely on abstract theories and their underlying meanings.
3) Visual and Verbal preferences - Visual learners are the ones, who prefer learning from what they have seen. They have less memory retaining capacity. Verbal learners are the ones who prefer textual representation (written/spoken).
4) Process of Understanding - Sequential learners learn in small steps and their learning graph is linear. They are more interested in details. Global learners, on the other hand, are more interested in overviews and a broad knowledge.
On the basis of these four dimensions, the user is characterized and an appropriate kind of learning object, which suits his learning style is presented to him. There are two kinds of recommendations, one to offer the way the study material is presented to the user and other, to offer the next concepts to the user. Next section describes four recommendation techniques to offer next concepts to the user.
Devanshu Jain, Ashish Kedia, RakshitSingla and Sameer Sonawane
Advances in Computer Science and Information Technology (ACSIT) Print ISSN: 2393-9907; Online ISSN: 2393-9915; Volume 2, Number 1; January-March, 2015
10
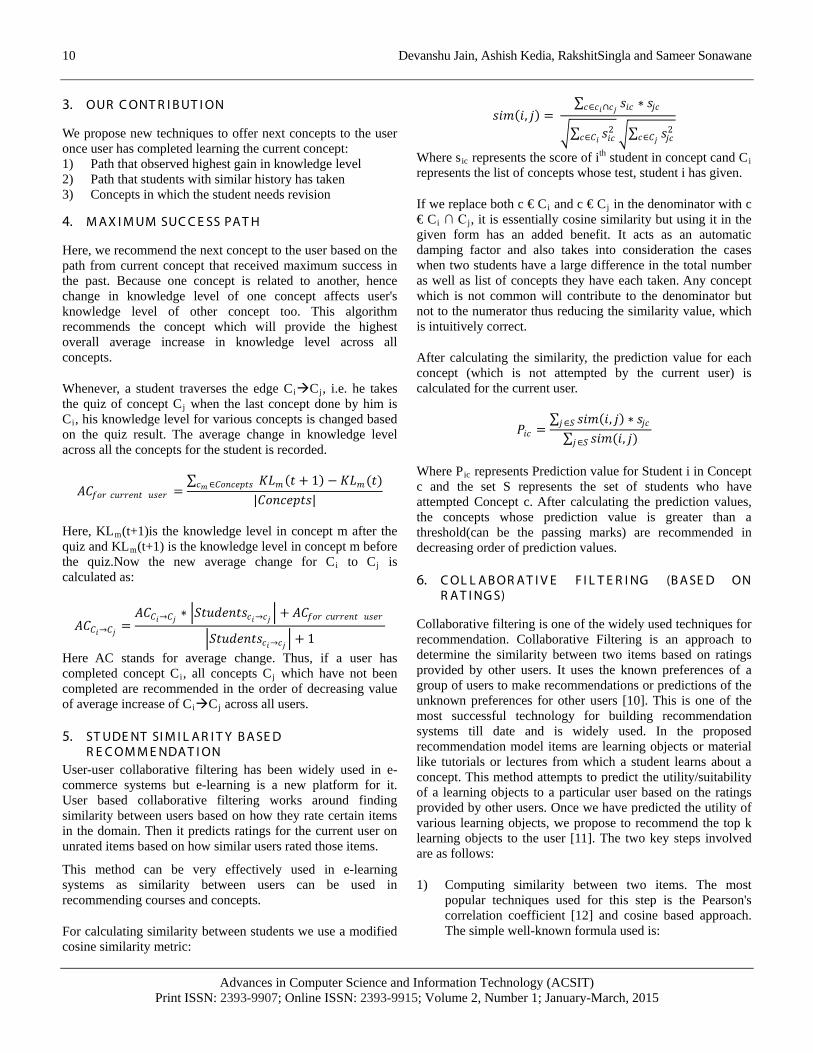
3. OUR C ONT R I B UT I ON
We propose new techniques to offer next concepts to the user once user has completed learning the current concept: 1) Path that observed highest gain in knowledge level 2) Path that students with similar history has taken 3) Concepts in which the student needs revision
4. M AX I M UM SUC C E SS PA T H
Here, we recommend the next concept to the user based on the path from current concept that received maximum success in the past. Because one concept is related to another, hence change in knowledge level of one concept affects user's knowledge level of other concept too. This algorithm recommends the concept which will provide the highest overall average increase in knowledge level across all concepts.
Whenever, a student traverses the edge CiCj, i.e. he takes the quiz of concept Cj when the last concept done by him is Ci, his knowledge level for various concepts is changed based on the quiz result. The average change in knowledge level across all the concepts for the student is recorded.
𝐴𝐴𝐶𝐶𝐶𝐶𝐶𝐶𝑆𝑆 𝐶𝐶𝑆𝑆𝑆𝑆𝑆𝑆𝐶𝐶𝐶𝐶𝑆𝑆 𝑆𝑆𝑢𝑢𝐶𝐶𝑆𝑆 =∑ 𝐾𝐾𝐾𝐾𝑚𝑚(𝑆𝑆 + 1) − 𝐾𝐾𝐾𝐾𝑚𝑚(𝑆𝑆)𝐶𝐶𝑚𝑚 ∈𝐶𝐶𝐶𝐶𝐶𝐶𝐶𝐶𝐶𝐶𝑆𝑆𝑆𝑆𝑢𝑢
|𝐶𝐶𝐶𝐶𝐶𝐶𝐶𝐶𝐶𝐶𝑆𝑆𝑆𝑆𝑢𝑢|
Here, KLm(t+1)is the knowledge level in concept m after the quiz and KLm(t+1) is the knowledge level in concept m before the quiz.Now the new average change for Ci to Cj is calculated as:
𝐴𝐴𝐶𝐶𝐶𝐶𝐶𝐶→𝐶𝐶𝑗𝑗 =𝐴𝐴𝐶𝐶𝐶𝐶𝐶𝐶→𝐶𝐶𝑗𝑗 ∗ �𝑆𝑆𝑆𝑆𝑆𝑆𝐶𝐶𝐶𝐶𝐶𝐶𝑆𝑆𝑢𝑢𝐶𝐶𝐶𝐶→𝐶𝐶𝑗𝑗 � + 𝐴𝐴𝐶𝐶𝐶𝐶𝐶𝐶𝑆𝑆 𝐶𝐶𝑆𝑆𝑆𝑆𝑆𝑆𝐶𝐶𝐶𝐶𝑆𝑆 𝑆𝑆𝑢𝑢𝐶𝐶𝑆𝑆
�𝑆𝑆𝑆𝑆𝑆𝑆𝐶𝐶𝐶𝐶𝐶𝐶𝑆𝑆𝑢𝑢𝐶𝐶𝐶𝐶→𝐶𝐶𝑗𝑗 � + 1
Here AC stands for average change. Thus, if a user has completed concept Ci, all concepts Cj which have not been completed are recommended in the order of decreasing value of average increase of CiCj
5. ST UDE NT SI M I L A R I T Y B A SE D R E C OM M E NDA T I ON
across all users.
User-user collaborative filtering has been widely used in e-commerce systems but e-learning is a new platform for it. User based collaborative filtering works around finding similarity between users based on how they rate certain items in the domain. Then it predicts ratings for the current user on unrated items based on how similar users rated those items.
This method can be very effectively used in e-learning systems as similarity between users can be used in recommending courses and concepts.
For calculating similarity between students we use a modified cosine similarity metric:
𝑢𝑢𝐶𝐶𝑚𝑚(𝐶𝐶, 𝑗𝑗) = ∑ 𝑢𝑢𝐶𝐶𝐶𝐶 ∗ 𝑢𝑢𝑗𝑗𝐶𝐶𝐶𝐶∈𝐶𝐶𝐶𝐶∩𝐶𝐶𝑗𝑗
�∑ 𝑢𝑢𝐶𝐶𝐶𝐶2𝐶𝐶∈𝐶𝐶𝐶𝐶 �∑ 𝑢𝑢𝑗𝑗𝐶𝐶2𝐶𝐶∈𝐶𝐶𝑗𝑗
Where sic represents the score of ith student in concept cand Ci represents the list of concepts whose test, student i has given.
If we replace both c € Ci and c € Cj in the denominator with c € Ci ∩ C j, it is essentially cosine similarity but using it in the given form has an added benefit. It acts as an automatic damping factor and also takes into consideration the cases when two students have a large difference in the total number as well as list of concepts they have each taken. Any concept which is not common will contribute to the denominator but not to the numerator thus reducing the similarity value, which is intuitively correct.
After calculating the similarity, the prediction value for each concept (which is not attempted by the current user) is calculated for the current user.
𝑃𝑃𝐶𝐶𝐶𝐶 =∑ 𝑢𝑢𝐶𝐶𝑚𝑚(𝐶𝐶, 𝑗𝑗) ∗ 𝑢𝑢𝑗𝑗𝐶𝐶𝑗𝑗∈𝑆𝑆
∑ 𝑢𝑢𝐶𝐶𝑚𝑚(𝐶𝐶, 𝑗𝑗)𝑗𝑗∈𝑆𝑆
Where Pic
6. C OL L A B OR A T I V E F I L T E R I NG (B A SE D ON R A T I NG S)
represents Prediction value for Student i in Concept c and the set S represents the set of students who have attempted Concept c. After calculating the prediction values, the concepts whose prediction value is greater than a threshold(can be the passing marks) are recommended in decreasing order of prediction values.
Collaborative filtering is one of the widely used techniques for recommendation. Collaborative Filtering is an approach to determine the similarity between two items based on ratings provided by other users. It uses the known preferences of a group of users to make recommendations or predictions of the unknown preferences for other users [10]. This is one of the most successful technology for building recommendation systems till date and is widely used. In the proposed recommendation model items are learning objects or material like tutorials or lectures from which a student learns about a concept. This method attempts to predict the utility/suitability of a learning objects to a particular user based on the ratings provided by other users. Once we have predicted the utility of various learning objects, we propose to recommend the top k learning objects to the user [11]. The two key steps involved are as follows:
1) Computing similarity between two items. The most popular techniques used for this step is the Pearson's correlation coefficient [12] and cosine based approach. The simple well-known formula used is:

Recommendation Techniques for Adaptive E-learning 11
Advances in Computer Science and Information Technology (ACSIT) Print ISSN: 2393-9907; Online ISSN: 2393-9915; Volume 2, Number 1; January-March, 2015
𝑢𝑢𝐶𝐶𝑚𝑚(𝐶𝐶, 𝑗𝑗) = ∑(𝑅𝑅𝑆𝑆 ,𝐶𝐶−𝑅𝑅𝑆𝑆����)(𝑅𝑅𝑆𝑆 ,𝑗𝑗−𝑅𝑅𝑆𝑆����)
�∑(𝑅𝑅𝑆𝑆 ,𝐶𝐶−𝑅𝑅𝑆𝑆����)2�∑(𝑅𝑅𝑆𝑆 ,𝑗𝑗−𝑅𝑅𝑆𝑆����)2
Where Ru,i is the rating given to Ii
2) The prediction for each user u in the user-set U correlated with each item i in the item-set I is calculated as follows:
by user u, R is the mean rating of all the ratings provided by u. An item-item similarity matrix is created and top k itemssimilar to the last learning object used by the user is chosen.
𝑃𝑃𝑆𝑆 ,𝐶𝐶 = ∑ (𝑢𝑢𝐶𝐶𝑚𝑚 (𝐶𝐶,𝑆𝑆)∗𝑅𝑅𝑆𝑆 ,𝑆𝑆)𝑆𝑆∈𝑁𝑁∑ (|𝑢𝑢𝐶𝐶𝑚𝑚 (𝐶𝐶,𝑆𝑆)|)𝑆𝑆∈𝑁𝑁
Where N represents the item i’s similar item set, and Ru,t
7. R E C OM M E NDI NG C ONC E PT S F OR R E M E DI A T I ON
is the rating given to item t by user u.
Recommendations are not only designed to suggest best new concept, but also to suggest concepts, which the user is attempting incorrectly frequently. For this, we suggest the following recommendation technique suggesting the concepts to the user, which he has forgot. The basis of this technique is that any question does not test the user just on one concept. There is a certain degree to which a question judges the student on one concept, as denoted in the Question-Concept (QC) matrix, in the concept-mapping section before.
For every concept for a particular student, we retrieve two parameters:
1) Number of times, Ni, concept Ci
2) The total dependency, D
's questions have been attempted wrongly consecutively
i among the questions, attempted wrongly for the concept C
A concept is considered as forgotten if and only if the following condition holds true:
i
Ni
Here M is the total number of questions contributing to that concept, N
≥ M * 30%
i is the total number of consecutive wrong attempts in concept Ci’s question, Di is the total dependencies of wrongly attempted questions. We have assigned a revision importance (Ri) to every concept that signifies the priority with which the student should revise the concepts in which he has misconception. This parameter is calculated by giving equal weight-age to both the parameters namely Ni and Di
𝑅𝑅𝐶𝐶 = 0.5 ∗ 𝑁𝑁𝐶𝐶 + 0.5 ∗ 𝐷𝐷𝐶𝐶
, as follows:
Now the user is recommended concepts in order of decreasing importance (Ri
8. E V A L UA T I ON M ODE L
) of the concepts.
Evaluation of recommender systems has only lately started to become more important and systematic. In our system, we have implemented a layered evaluation model [13] which decomposes the recommendation model into several layers based on several criteria and then evaluates each layer individually. Since our learning model is based on programming concepts, the recommendation system is broken down into following 5 criteria as used by the PeRSIVA evaluation model [14] which forms the basic framework for our evaluation model - Effectiveness of System, Adaptability of the System, State on Computer Programming, Students' progress in Future, and Necessity of Revision.
The student is provided with a small set of feedback questions each time he/she interacts with the learning model. The responses of the student are collected for several questions over a period of time.The responses of the student are over a scale of range 1(not at all) to 5(very much).The feedback questions are on the above mentioned basic criteria. Based on these responses, the average response for each criteria is calculated and the then the system is judged based on these criteria.
Apart from evaluating the model based on feedback, we have also implemented an evaluation technique to judge the quality of the learning material and the quiz based upon the material.It is very important for students' learning process that the learning material and the quiz based upon that are very much related and the quiz is based on the material. This helps the student to correctly monitor his learning process as well as his knowledge levels in the concepts. Thus, to measure the relation between the material and the quiz, we have inculcated the accuracy factor. Accuracy can simply be defined as average score of all students in each concept in terms of percentage. The corresponding accuracy and relation table can be depicted as follows:
Table 3: A ccur acy and R elation Accuracy % Relation between material and quiz
≥75 Excellent 50-75 Good 25-50 Average <25 Poor
Apart from the above two criteria, we have inculcated two very well-known parameters in the domain of evaluation systems - precision and recall [15]. Precision and recall, according to our model, can be defined as:
𝑃𝑃𝑆𝑆𝐶𝐶𝐶𝐶𝐶𝐶𝑢𝑢𝐶𝐶𝐶𝐶𝐶𝐶 = 𝑁𝑁𝑆𝑆𝑚𝑚𝐶𝐶𝐶𝐶𝑆𝑆𝐶𝐶𝐶𝐶 𝑟𝑟𝐶𝐶𝐶𝐶𝐶𝐶 𝐶𝐶𝐶𝐶𝐶𝐶𝐶𝐶𝐶𝐶𝑆𝑆𝑆𝑆𝑢𝑢 𝑆𝑆𝐶𝐶𝐶𝐶𝐶𝐶𝑚𝑚𝑚𝑚𝐶𝐶𝐶𝐶𝐶𝐶𝐶𝐶𝐶𝐶𝑇𝑇𝐶𝐶𝑆𝑆𝑇𝑇𝑇𝑇 𝐶𝐶𝑆𝑆𝑚𝑚𝑛𝑛𝐶𝐶𝑆𝑆 𝐶𝐶𝐶𝐶 𝐶𝐶𝐶𝐶𝐶𝐶𝐶𝐶𝐶𝐶𝑆𝑆𝑆𝑆𝑢𝑢 𝑆𝑆𝐶𝐶𝐶𝐶𝐶𝐶𝑚𝑚𝑚𝑚𝐶𝐶𝐶𝐶𝐶𝐶𝐶𝐶𝐶𝐶
𝑅𝑅𝐶𝐶𝐶𝐶𝑇𝑇𝑇𝑇𝑇𝑇 = 𝑁𝑁𝑆𝑆𝑚𝑚𝐶𝐶𝐶𝐶𝑆𝑆𝐶𝐶𝐶𝐶 𝑟𝑟𝐶𝐶𝐶𝐶𝐶𝐶 𝐶𝐶𝐶𝐶𝐶𝐶𝐶𝐶𝐶𝐶𝑆𝑆𝑆𝑆𝑢𝑢 𝑆𝑆𝐶𝐶𝐶𝐶𝐶𝐶𝑚𝑚𝑚𝑚𝐶𝐶𝐶𝐶𝐶𝐶𝐶𝐶𝐶𝐶
𝑇𝑇𝐶𝐶𝑆𝑆𝑇𝑇𝑇𝑇 𝐶𝐶𝑆𝑆𝑚𝑚𝑛𝑛𝐶𝐶𝑆𝑆 𝐶𝐶𝐶𝐶 𝑟𝑟𝐶𝐶𝐶𝐶𝐶𝐶 𝐶𝐶𝐶𝐶𝐶𝐶𝐶𝐶𝐶𝐶𝑆𝑆𝑆𝑆𝑢𝑢

Devanshu Jain, Ashish Kedia, RakshitSingla and Sameer Sonawane
Advances in Computer Science and Information Technology (ACSIT) Print ISSN: 2393-9907; Online ISSN: 2393-9915; Volume 2, Number 1; January-March, 2015
12
By the term- "Good Concept" we mean concepts which have average ratings above 4 in scale of 1-5. Also,"Number of concepts recommended" is the number of recommendations displayed to the learner. The values of precision and recall vary between 0 and 1 and it is often observed that increase in any one of the leads to decrease in the other. Hence, a new parameter which combines both of them is generated and popularly known as the
F1 metric. It can be stated as follows:
𝐹𝐹1 𝑚𝑚𝐶𝐶𝑆𝑆𝑆𝑆𝐶𝐶𝐶𝐶 = 2∗𝑃𝑃𝑆𝑆𝐶𝐶𝐶𝐶𝐶𝐶𝑢𝑢𝐶𝐶𝐶𝐶𝐶𝐶 ∗𝑅𝑅𝐶𝐶𝐶𝐶𝑇𝑇𝑇𝑇𝑇𝑇𝑃𝑃𝑆𝑆𝐶𝐶𝐶𝐶𝐶𝐶𝑢𝑢𝐶𝐶𝐶𝐶𝐶𝐶 +𝑅𝑅𝐶𝐶𝐶𝐶𝑇𝑇𝑇𝑇𝑇𝑇
The F1 metric in our model gives equal weight-age to precision and recall. Its value ranges from 0 to 1 and higher its value, better is the recommendation model.
9. C ONC L USI ON A ND F UT UR E W OR K S
Adaptive E-learning is a powerful tool to challenge illiteracy. It removes the requirement for all third party activities like logistics, operational expenses, etc. which act as bottlenecks for efficient imparting of education. But it is unfortunate that the technology's state in the present time is just above that of an on-line lecture, where lecture videos and assignments are published on the Internet and the student can browse through it, without any recommendations.
The system can be further improved by engaging parameters based on context independent information like personal traits and cognitive abilities of the user. NiskosManouselis et al proposed such parameters [16]. The concept mapping can also be fully automated by mining the data from academic articles as proposed by Chen, et al [17]. The collaborative filtering algorithms can also be extended to account for multiple criteria as proposed by Nilashi et al [18].
R E F E R E NC E S
[1] L. Freifeld, “Training magazine ranks 2013 top 125 organisations,” Training Magazine, 2013.
[2] V.Shute and B.Towle, “Adaptive e-learning”, Educational Psychologist, vol. 38, no. 2, pp. 105-114, 2003.
[3] K. Chrysfiadi and M. Virvou, “A knowledge representation approach using fuzzy cognitive maps for better navigation support in an adaptive learning system”, SpringerPlus, vol. 2, no. 1, 2013.
[4] S.-M. Bai and S.-M. Chen, “Automatically constructing grade member-ship functions of fuzzy rules for students’ evaluation”, Expert Systems with Applications, vol. 35, no. 3, pp. 1408-1414, 2008.
[5] S.-M. Chen and P.-J. Sue, “Constructing concept maps for adaptive learning systems based on data mining techniques,” Expert Systems with Applications”, vol 40, no. 7, pp. 2746-2755, 2013.
[6] K. Chrisfiadi and M.Virvou, “Student modelling approaches: A literature review for the last decade”, Expert Systems with Applications, vol. 40, no. 11, pp. 4715-4279, 2013.
[7] A.C. Martins, L. Faria, C. V. de Carvalho, and E. Carrapatoso, “User modelling in adaptive hypermedia educational systems”, Educational Technology and Society, vol. 11, no. 1, pp. 194-207, 2008.
[8] K. Chrisfiadi and M. Virvou “Evaluating the integration of fuzzy logic into student model of a web-based learning environment”, Expert Systems with Applications, vol. 39, no. 18, pp. 13127-13134, 2012.
[9] S. Graf, S. R. Viola, and T. Leo, “In-depth analysis of the felder-silvermanlearningstyledimensions,”JournalofResearchonTechnology in Education, pp. 79–93, 2007.
[10] [10] T. M. K. Xiaoyuan Su, “A survey of collaborative filtering techniques,” Advances in Artificial Intelligence, vol. 2009, 2009.
[11] [11] M. Deshpande and G. Karypis, “Item-based top-n recommendation algorithms,” ACM Trans. Inf. Syst., vol. 22, pp. 143–177, Jan. 2004.
[12] [12] Y. Li, Z. Niu, W. Chen, and W. Zhang, “Combining collaborative filtering and sequential pattern mining for recommendation in e-learning environment,” in Advances in Web-Based Learning - ICWL 2011 (H. Leung, E. Popescu, Y. Cao, R. Lau, and W. Nejdl, eds.), vol. 7048 of Lecture Notes in Computer Science, pp. 305–313, Springer Berlin Heidelberg, 2011.
[13] [13] S. D. G. Manouselis N., Karagiannidis C., “Layered evaluation in recommender systems: A retrospective assesment,” Journal of e-Learning and Knowledge Society, vol. 10, no. 1, pp. 11–31, 2014
[14] [14] M. V. KonstantinaChrysafiadi*, “Persiva: An empirical evaluation method of a student model of an intelligent e-learning environment for computer programming,” Computers & Education, vol. 68, pp. 322–333, 2013
[15] [15] G. S. AselaGunawardana, “A survey of accuracy evaluation metrics of recommendation tasks,” Journal of Machine Learning Research, vol. 10, pp. 2935–2962, 2009.
[16] [16] N. Manouselis and D. Sampson, “Dynamic knowledge route selection for personalised learning environments using multiple criteria,” in APPLIED INFORMATICS-PROCEEDINGS-, no. 1, pp. 448–453, UNKNOWN, 2002.
[17] [17]N.-S. Chen, Kinshuk, C.-W. Wei, and H.-J. Chen, “Mining e-learning domainconceptmapfromacademicarticles,”ComputersandEducation, vol. 50, no. 3, pp. 1009–1021, 2008.
[18] [18] M. Nilashi, O. bin Ibrahim, and N. Ithnin, “Hybrid recommendation approaches for multi-criteria collaborative filtering,” Expert Systems with Applications, vol. 41, no. 8, pp. 3879–3900, 2014.

Advances in Computer Science and Information Technology (ACSIT) Print ISSN: 2393-9907; Online ISSN: 2393-9915; Volume 2, Number 1; January-March, 2015 pp. 13-17 © Krishi Sanskriti Publications http://www.krishisanskriti.org/acsit.html
Emerging Application of Wireless Sensor Network (WSN) (Underwater Wireless Sensor Network)
Ambika Sharma1 and Devershi Pallavi Bhatt2 1M.Tech , Banasthali Vidyapith, Newai, India
2MCA, Pursuing Ph.D.,Banasthali Vidyapith, Newai, India E-mail: [email protected], [email protected]
Abstract—Wireless Sensor Networks (WSN) is an emerging area in the field of research. WSN consists of spatially distributed tiny sensor nodes, they sense and transfer the data and make it available to the sink. In this paper author has talked about a new and rare application of WSN that is Underwater Wireless Sensor Network applications
1. INTRODUCTION OF WIRELESS SENSOR NETWORK
WSN is described as wireless sensor network, which is network of data sources distributed in nature and provides the information about the phenomenon of environment to multiple end users. WSN is a collection of several wireless sensing devices which are able to process, talk to peers and sense. They are centralized (base station or sink). [1]
The figure shown above consists of various sensor nodes (small in size) which does senses and communicates with each other without the presence of wires. These tiny nodes are capable of sensing and processing the data, they also communicate various components with each other. Data is routed with the help of sensors to one or more base stations so that communication can be performed with other nodes which are spread within our environment.
Sensor is an electronic device that detects or measures physical quantity and converts it further into an electronic signal i.e. sensors do translate various aspects of physical quantity to representation that are understandable and which are easily processed by the computers. [2]
2. VISION BEHIND THE SENSOR NETWORKS: Sensor nodes are embedded into the physical world.
Higher level identification and tasks are performed by the network in these devices.[1]
WHAT IS SENSOR NODE?
Sensing node has three components: Control Processing Unit (CPU) Sensor Array Radio Transceiver 1. Nodes are powered from batteries. 1. On-board storage is seen and actuators may be present.
3. CHARACTERISTICS OF SENSOR:
While choosing a sensor the following characteristics should be kept in mind:
Hysteresis Transfer Function Sensitivity Linearity Accuracy Noise Bandwidth Dynamic Range Resolution

Ambika Sharma and Devershi Pallavi Bhatt
Advances in Computer Science and Information Technology (ACSIT) Print ISSN: 2393-9907; Online ISSN: 2393-9915; Volume 2, Number 1; January-March, 2015
14
Above explains the Wireless Sensor Network with the explanation, characteristics and the vision behind the Sensor network.
But our topic is Underwater Wireless Sensor Network which is used for various underwater applications, but why only underwater sensor network?
As water covers 2/3rd of the earth in the form of seas and oceans, so UWSN is came into existence.
So UWSN can be used in various applications like:
Detection of amount of gas and oil present underwater. Detection of pollution Ocean Currents are being monitored Fish or any other micro organisms are being tracked. Seismic prediction Various autonomous underwater application Detection of undersea earthquake(natural disaster) Detection of pre causes of the disaster with warning
Radio waves act as communication medium, through which various sensor nodes can communicate at long distances at frequency 30 to 300 Hz for which antennas are required that are large and require power for high transmission.
Introduction of Underwater Wireless Sensor: UWSN’S research field has grown significantly in the past few years which offer communication between various nodes and protocols for exchanging information.
Underwater environment has used acoustics for ages for communication as language; an appropriate example of the same is communication between dolphin and whales (for information exchange).
Lewis Nixon was the first one who developed sonar type for military purpose which was able to detect submarines. Later, piezoelectric properties of quartz were used for the detection of submarine which wasn’t useful but laid the roots for sonar designed devices.
In the late 90’s researchers were aware of various features underwater communication was able to provide us with like search for various geological resources like gas, oil etc, detection and tracking of banks of fish and archaeology of submarine including connections that were multipoint in nature were capable of translation of networked communication technology to underwater environment. UWSN have confronted us with various applications like:
Offshore exploration Pollution Monitoring and the other would be discussed
further.
The architecture of UWSN differs from the terrestrial ones, due to the characteristics provided by the transmission medium (sea water) and signal which are employed while transmission of the data (acoustic ultrasound signals) (Akyilidiz et al, 2006). [3]
Architecture of underwater sensor network system
The diagram below shows the general architecture of underwater sensor network which describes the capabilities of UWSN’s architecture. The diagram considers the capabilities of a sensor node situated underwater, its interaction with the environment, other adjacent nodes and various applications.
Four various nodes are seen in the diagram:
At lowest layer there are large numbers of nodes present (the small circular nodes-transparent) responsible for data collection due to the presence of sensors, also these sensor nodes are responsible for communication with other adjacent nodes, by, acoustic modems which have short range of transmission. These sensor nodes are moderate in price, power of computing and capacity of storage. Batteries are present, but long term operations are spending asleep.
At top layer control nodes are present which are either connected to the internet or are operated by human-beings. These nodes may be positioned on an off-shore or on-shore platform. The control nodes are expected to have large capacity of storage for buffering of data and also access to ample power of electrical. Communication of the control nodes with sensor node is done with the help of relay node whereas the connection of sensor node with underwater acoustic medium further connected to a control node is wired in nature.
SSSe
R
Super node
Platform Buoy

Emerging Application of Wireless Sensor Network (WSN) 15
Advances in Computer Science and Information Technology (ACSIT) Print ISSN: 2393-9907; Online ISSN: 2393-9915; Volume 2, Number 1; January-March, 2015
Third type of node is Super nodes which are able to access networks of high speed. Two implementations are considered here:
1. First, nodes are attached to tethered buoys which are capable of communicating with the base station, with the help of high speed radio communication.
2. Second, these nodes are placed on the sea floor, connected to the base station with the help of fiber optics.
Despite these, super nodes provide rich connectivity of network, also helps in creating various points of collection of data for underwater acoustic network.
Finally, the green objects named robots provide various services to the platform.
The nodes discussed above vary in power i.e. from 8-bit to 32-bit embedded processor.
Power of battery and careful monitor of consumption of energy is very essential sensor node. Each layer present in system architecture should be able to minimize consumption of energy. For optimizing: placement of sensors which are good and coverage of communication, tethers are used to ensure that the nodes are positioned where they are expected to be roughly. A tiered deployment is anticipated where greater resources are present with some of the nodes. Some nodes are expected to be mobile while others to be wired. Also mobile nodes are expected to recover from various failures or these failures can be replaced by humans. Nodes move autonomously, while some nodes are tethered to one location and are expected to move due to anchor’s drift or external effect’s disturbance. For inter node communication various networking protocols are required, which allow self configuration and coordination of underwater nodes. Certain assumptions about the application which does match the design are:
Application benefit is achieved from data storage which is temporary in nature and local processing, where the storage is used to buffer data that manages communication (low speed).
Also nodes do benefit from pair wise computation and communication. [4]
4. CHALLENGES IN UWSN:
Maintenance of underwater device is required due to periodical corrosion and fouling which leaves an impact on its lifetime.
To develop less expensive, robust, sensors that are stable and are based on nano technology.
High bit error rates.
Memory availability is low as compared to other technologies.
Power and batteries are limited. Characterized by high cost as extra protective sheaths are
required for sensors. Limited bandwidth. Due to multi path and fading the channel of underwater is
impaired. New integrated system is required for synoptic sampling
of chemical, biological and physical parameters for the improvement of understanding the marine system processes.
Delay in propagation of underwater is five order magnitudes higher than Radio Frequency (RF) terrestrial channel.
5. ADVANTAGE OF UWSN:
Sensors are deployed in hostile environment with minimum maintenance which fulfils the need of real time monitoring, especially in remote and hazardous scenarios.
Application of Underwater Wireless Sensor Networks:
Huge potential is seen in the field of underwater domain that does monitor river’s and marine’s environment health, monitoring which is quite difficult and costly; so regulation of drivers in hours and the depth at which they work, also require boat on surface which is costly to operate and is subjected to weather conditions.
Fig Anti-submarine warfare
Above figure shows anti-submarine warfare which is the branch of naval which does use aircraft, surface warships or
Data R
Solar Transmi
Acoustic
Radio
Buoys

Ambika Sharma and Devershi Pallavi Bhatt
Advances in Computer Science and Information Technology (ACSIT) Print ISSN: 2393-9907; Online ISSN: 2393-9915; Volume 2, Number 1; January-March, 2015
16
other submarines which tracks/deter other submarines or to find or destroy/damage enemies’ submarine.
As shown above in the figure the sensor network is spread underwater that is able to monitor variables that are physical in nature like pollutants present in water, pressure, temperature, conductivity and turbidity.
The underwater network is able to track various pollutants after that does monitors them and then using the acoustic signals and passing on them further to the platform as sensor report.
Further various other applications of UWSN are as follows:
Pollution monitoring i.e. presence of pollutants underwater, oil that spills from broken ships or boats that causes harm to marine animals is monitored with the help of UWSN.
Ocean currents and winds can also be monitored with the help of UWSN, which further provide us with better weather broadcast details, climatic changes, tracking of fishes etc.
Oceanic environment is being detected with the help of UWSN.
Detection of underwater field of oils or reservoirs, routes for cables i.e. undersea exploration is possible due to UWSN.
UWSN consist of sensor nodes which are able to detect seismic activity that can provide tsunami warnings or is able to study the effects of the same.
Navigation i.e. detection of seafloor hazards, rocks or route is provided by UWSN
Underwater robots are grouped and co-ordinated with the help of UWSN.
Sensor that is distributed in nature and also is mobile can monitor surveillance area, can detect or recognize an intruder.
Ongoing Implementation
The above device which does consist of two ultrasound transducers marked in red circles are also known as ultrasonic
sensors or transceivers as they both receive and send, and do have their working similar to sonar or radar which evaluates their target’s attributes by echo interpretation from sound or radio waves. These transducers do generate sound waves with high frequency and does evaluate the echo received by the sensor which does measures the interval of time between receiving the echo which determines the distance to an object and sending the signal.
6. CONCEPT OF THE ABOVE TECHNOLOGY:
With the help of in-air acoustics (acoustics in an interdisciplinary science which deals with waves which are mechanical in nature in liquids, solids and gases and further also includes topics like sound, vibration, infrasound and ultrasound) it does simulate underwater acoustics.
The propagation is 5 times slower than underwater which is further very helpful for the system as it does allow emulation for underwater at longer distances.
Hardware required for in-air stand-in test bed is “Cricket node” which is developed at MIT which further consist of transducers based on ultrasound which consist of the same software platform as that of – mica2 which further has 128kb memory of program , ChipconCC100 (CSMA/FSK)of 40 kHz ultra sounders .
It does consist of the following challenges:
Has bandwidth which is very low that is unable to modulate data over the channels which are acoustic in nature, which can be solved by combining radio frequency with acoustic.
Has ultrasound which is of short range in nature i.e.12m in air
Ultrasound is unreliable
Unreliable time-stamping of radio frequency. [5]
7. RESULTS OF VARIOUS CURRENT RESEARCHES:
“State-of-the-Art in Protocol Research for UWSN” believes that the environment of underwater particularly does require cross layer design solution (where cross layer defines the way by which the network can achieve sharing of the information, which basically shows the co-operation among various layers that helps in combining the resources and create a highly adaptive network) which does enable the use of scarce resources that are available in an efficient manner.
“Research Challenges and Applications for underwater sensor networking” suggested focusing on

Emerging Application of Wireless Sensor Network (WSN) 17
Advances in Computer Science and Information Technology (ACSIT) Print ISSN: 2393-9907; Online ISSN: 2393-9915; Volume 2, Number 1; January-March, 2015
communication which is short range in nature that would avoid challenges of long-range transfer. “Mobicom workshop WuWNet07”Analysis of reliability of relay for multi-hop underwater acoustic communication proved that multi-hop is very helpful for acoustic networks in shallow underwater.
Drift-Tolerant Model for management of data in sensor networks of ocean does uses real experiment which proves that fleet of various drifters monitoring models is practical as long as deployment periods, initial drifter location, deployment locations are well designed. [6]
8. FUTURE TREND
UWSN provides us with various advantages along which it does require various development in its technology which would leave a great impact on the industry. Following are some of them:
Bandwidth use should be best which can be achieved by the improvement in the physical layer.
Error rate should be reduced with the help of forward error correcting codes.
Power and energy consumption by each sensor node should be kept in mind i.e. power and energy consumed by the device should be less. Sensor nodes should be adaptable to the environmental condition which would help in saving energy.
Routing protocols should be discovered which are able to determine the position of the nodes geographically.
Cross layer communication between the layers would be helpful in information sharing amongst the nodes.
9. CONCLUSION
UWSN are growing rapidly and is seen following path of radio frequency as in terrestrial networks, while there is presence of several research field where UWSN can be applied.
The above paper discusses wireless sensor network, how a sensor node works, then a short description on underwater sensor network, its architecture, challenges, applications and ongoing implementations. We here have presented an overview of UWSN that explains the development and incorporation of this technology which leads it to the development of various commercial products and solutions that underwater network can provide us with.
REFERENCES
[1] The Basics of Wireless Sensor Networking and its Applications Daniele Puccinelli
[2] Wireless Sensor Networks: Past, Present and Future -Heinzelman University of Rochester
[3] Modelling Underwater Wireless: Sensor Networks Jesús Llor and Manuel P. Malumbres Universidad Miguel Hernández de Elche Spain
[4] Underwater Sensor Networking: Research Challenges and Potential Applications-USC/ISI Technical Report ISI-TR-2005-603; John Heidemann Yuan, Li Affan Syed, Jack Wills Wei Ye - USC/Information Sciences Institute
[5] Wireless Sensor Networks: From Terrestrial to Underwater* A talk by: Affan A. Syed, GRA USC/ISI with John Heidemann
[6] Underwater Acoustic Sensor Networks (UW-ASN): Xiong Junjie -2009.2.10

Advances in Computer Science and Information Technology (ACSIT) Print ISSN: 2393-9907; Online ISSN: 2393-9915; Volume 2, Number 1; January-March, 2015 pp. 18-20 © Krishi Sanskriti Publications http://www.krishisanskriti.org/acsit.html
Speech Feature Extraction and Classification Techniques
Kamakshi1 and Sumanlata Gautam2 1,2Department of Software Engineering ITM University Gurgaon, India E-mail: [email protected], [email protected]
Abstract—Using feature extraction we are able to reduce the variability in speech by eliminating the unwanted voices, noise and different sources of speech signal information. Speech signals are highly variable. There are varieties of techniques to extract feature from speech. In this paper we have presented most used and exposed techniques and their benefits and importance.
1. INTRODUCTION
Speech is most common form by which humans communicate their feelings and necessities. It is one of the most ancient ways to express ourselves. There are two types of speech, voiced speech and unvoiced speech. When there are glottal pulses being created by periodic opening and closing of vocal fold, it is called as voiced speech and when there is continuous air flow pushed by lungs is called as unvoiced speech. Speech signals are of high variability depends on various factors and features of speech, which includes rate of Speaking(words uttered per minute),Contents spoken, Acoustic conditions, Tone, Pitch(frequency of speech) , Accent and Pronunciation.
Speech signals are studied by speech processing, where valid information is extracted about the content and the speaker. Phonemes are the elementary object of a speech signal –the smallest unit of speech sound, Syllable-can be defined as one or more Phoneme, while Word- is composition of one or more syllable.
Using feature extraction we are able to reduce the variability in speech by eliminating the unwanted voices, [1] background noise and many different sources of speech signal information which may occur from multiple speakers. Feature extraction is used in speech processing and speech recognition systems, which find vast scope of utility in security, military, law and medical sciences. Speech processing is basically study and analysis of speech signals and thereby processing them through various methods to extract valid information about the content and the speaker.
But there are several problem which occur in Speech Processing like Acoustic variability, Noise, Different types of microphones used, Speaking variability if the person shouts,
whispers, or is suffering from cold, [2] Speaker variability, Linguistic variability when a sentence is pronounced in different ways, Pronunciation of the speaker, Some people tend to speak in a louder tone.
Speech recognition or voice recognition is conversion of speech signal into computer readable format or just Speech text.
Applications of Speech Recognition are that they are used in vehicle navigation systems, human computer
Interaction, Pronunciation evaluation, field of robotics, fields of gaming, [3] Transcription of speech into mobile
Texts, field of disabilities which occur in people.
Some SR systems use “Speech independent speech recognition” whereas in some individual speaker reads a section of text into SR system. These systems are capable of analyzing the person’s voice, fine-tune it to extract the specific features, compare it accurately with the different original speaker’s voice samples to recognize the person. These are called “speaker dependent systems”.
Voice recognition or speaker identification refers to “who” is speaking rather than “what” is being spoken. It can be use for various security purposes such as authentication or verification of the identity of a person. There are 2 types in which voice recognition can be classified. Speaker dependent system is used for dictation software. No specific training is required and the working of software is based on learning unique characteristics of a person’s voice and the other is speaker independent Is commonly found in telephone application, here in this technique user have to read few pages.
For a successful feature extraction we must follow some speaking etiquettes. There should be No Mimicry, Speech signal should be balanced all time, Speech signal should occur normally and naturally, Speech signal should be easy to

Speech Feature Extraction and Classification Techniques 19
Advances in Computer Science and Information Technology (ACSIT) Print ISSN: 2393-9907; Online ISSN: 2393-9915; Volume 2, Number 1; January-March, 2015
measure, there should be lesser variation and least amount of noise.
2. TECHNIQUES
There are number of techniques available for speech feature extraction like PLP (Perceptual Linear Predictive Coefficient), LPC (Linear predictive coder analysis),LPCC(Linear Predictive Cepstral Coefficient), MFCC(Mel-Frequency Cepstral Coefficient),FFT (Power Spectral Analysis),MEL (Mel Scale Cepstral Analysis),RASTA (Relative Spectra Filtering of Log Domain Coefficient),DELTA (First order Derivative).
2.1 LPC (Linear Predictive Analysis)
LPC is most profound and powerful method used for encoding quality speech at low bit-rate.LPC is tool used mostly used in audio signal processing and speech processing. Here specific speech samples can be approximated at current time as linear combination of previous speech samples.
LP model is based on production of human speech. Utilizing a conventional filter source model, where glottal vocal tract and the lip radiation transfer function is interpret into one all-pole filter. [4] Its principle is just to minimize sum of the squared differences between speech (original) and estimated speech signal over a finite duration.
LPC is simple to implement & mathematically precise, it is a powerful speech analysis technique .LPC is used in the electronic music field as well, With all such application LPC has a disadvantage of having highly correlated feature components.
Type of LPC filters are Voice excitation LPC, Residual Excitation LPC, Pith Excitation LPC, Multiple Excitation LPC (MPLPC), Regular Pulse Excitation LPC (RPELPC), Coded Excited LPC (CELP).
2.2. MFCC (Mel Frequency Cepstral Coefficient)
This can be considered as of the standard method for feature extraction. Through many years of research and Analysis over recognizer, vast variety of speech signals feature representations have been experimented. MFCC is most popular and accurate amongst all. MFCC works by reducing frequency information of the speech signals into smaller number of coefficients .It is simplified model of the auditory processing of signals which is relatively fast and easy to compute. In the below Fig. MFCC can be considered as its noise sensitivity.
MFCC are commonly derived as [5]: 1. Take Fourier transform of a signal.
2. Powers of the spectrum obtained are mapped above onto the Mel scale by using triangular overlapping windows. 3. Log of the powers is taken for each Mel Frequencies 4. Discrete cosine transform is taken which has the list of Mel Log powers just as of some signal. 5. MFCCs are amplitude of resulting spectrum.
Fig. 1: Block Diagram for Calculation of MFCCs
MFCC provides good discrimination and is very simple, fast, efficient technique in signal processing.
Problems faced in MFCC are it has low robustness to noise, Limited representation of speech signals, its Sensitivity to noise and Information of 2 phonemes instead of 1may occur in a frame in continuous speech environment.
2.3 LPCC (Linear Predictive Cepstral Coefficient)
Linear prediction coding is an alternative method for spectral envelop estimation. This method is also known by names all-pole model or auto-regressive model.
In LPCC the only difference is that MFCC has window but the warping step is deferred
In LPCC, the feature components are de-correlated because of cepstral analysis. It has better robustness in comparison to LPC. In LPCC, Linear scales are not adequate for representation of speech production or perception.
Fig. 2: Computation of LPC Coefficient
2.4 PLP (Perceptual Linear Prediction)
PLP model was developed by Hermensky 1990, the goal of which was to elaborate the understanding of psychophysics of the human auditory and hearing accurately as the features are extracted by extraction process. PLP cepstral coefficient has their computation which uses PLP functions that are already defined in an analysis library. The method mentioned is vulnerable when short-term [6] spectral values have been

Kamakshi and Sumanlata Gautam
Advances in Computer Science and Information Technology (ACSIT) Print ISSN: 2393-9907; Online ISSN: 2393-9915; Volume 2, Number 1; January-March, 2015
20
modified by frequency response of communication channels. Before we compute frame which is based on PLP analysis, we define guidelines which will govern this computation process.
PLP works in similar fashion as that of LPC analysis based on short term spectrum of the speech signals by some transformations based on the psychophysics.
PLP has low-dimensional resultant feature vector. PLP peaks are independent to the length of the vocal tract. Disadvantage of PLP is that due to the communication channel, noise and equipment used causes alteration of the spectral channel.
2.5 FFT (Power Spectral Analysis)
One of the common techniques of carrying out studies on a spectral signal is through power spectrum. The frequency component of signal over time is being described in power spectrum of speech signal.
During the analysis a major question arises that “power of a signal is contained in which specific frequency?” Eureka to answer is the Power Spectra. It is typically in a form of distribution of power value as frequency function, where the average of speech signal is considered as “power”. In frequency domain, it’s the FFT´s magnitude squared.
Power spectra computations can be performed for the entire signal in a single and simple method by averaging together segments of periodgrams of the time signal which gives output to be the "power spectral density"(PSD).
This averaging of long-duration signal periodgrams segments further assigns power to correct and relevant frequencies with utter accuracy and reduces noise fluctuations in power amplitudes.[7] The reduction in frequency resolution is because of lesser data points that are now available for each and every FFT calculation.
Spectral windowing (Windowing of each segment) is most effective method of improving PSD accuracy, but this eliminates contribution of the speech signal near end of the segment. The solution obtained is overlapping of the segments.
First step for computation of power spectrum is to perform DFT(Discrete Fourier Transform) which further computes frequency information of equivalent time domain signal here we use real-points FFT for increased frequency. Both the information regarding magnitude and phase of any of original signal in the time domain are being contained in resulting output.
2.6 MEL (Mel Scale Cepstral Analysis)
MEL is very similar to PLP. In MEL, the spectrum is always warped in accordance to MEL scale, while in PLP it is performed in accordance to the BARK scale coefficients. Mel
scale analyses also have an option similar to that of PLP of using a RASTA filter for compensation of linear channel distortions. All pole model is being used in PLP, this helps in smoothening the modified power spectrum whereas cepstral smoothing is used in MEL to smoothen the modified power spectrum.
2.7 RASTA (Relative spectra Filtering)
RASTA filtering is for removing of all distortions. It can be used either with log spectra or cepstral domains. RASTA is a technique in which a band pass filter is applied to the energy in each frequency sub band for smoothening over short term noise variations and also to smoothen spectral changes over frame to frame. [8] For smoothing per frame’s spectral changes low-pass filtering is very helpful. Equivalent to band pass filter’s, high-pass portion performs the task of alleviating effect of convolution noise that is introduced in the channel.
Application of RASTA is that its robust along with that the spectral component that change slower or quicker than the rate of the speech signal are suppressed. Disadvantage is that it gives a poor performance in clean speech environment.
3. ACKNOWLEDGEMENTS
I would like to extend my heartiest thanks with a deep sense of gratitude and respect to all those who provides me immense help and guidance during my project.
I would also like to thank my guide Sumanlata Gautam for providing a vision about the system. I have been greatly benefited from her regular critical reviews and inspiration throughout my work.
I would like to express my sincere thanks to our Head of Department Dr.Latika Singh.
REFERENCES
[1] Automatic Speech Recognition: A Deep Learning Approach By Dong Yu, Li Deng
[2] Multilingual Speech Processing (Recognition and Synthesis)
[3] Understanding Computers in a Changing Society By Deborah Morley
[4] Urmila Shrawankar, Dr. Vikas Thakrey “TECHNIQUES FOR FEATURE EXTRACTION IN SPEECH RECOGNITION SYSTEM: A COMPARATIVE STUDY”
[5] Proceedings of International Conference on VLSI, Communication, Advanced Devices, Signals & Systems and Networking (VCASAN-2013) By Veena S. Chakravarthi, Yasha Jyothi M. Shirur, Rekha Prasad
[6] A Graphical Framework For The Evaluation Of Speaker Verification Systems, Nikolaos Mitianoudis
[7] Http://www.wavemetrics.com/products/igorpro/dataanalysis/signalprocessing/powerspectra.htm
[8] http://www.cslu.ogi.edu/toolkit/old/old/version2.0a/documentation/csluc/node5.html

Advances in Computer Science and Information Technology (ACSIT) Print ISSN: 2393-9907; Online ISSN: 2393-9915; Volume 2, Number 1; January-March, 2015 pp. 21-26 © Krishi Sanskriti Publications http://www.krishisanskriti.org/acsit.html
Revolution of E-learning (Current and Future Trends in E-learning, Distance Learning and
Online Teaching Learning Methodologies)
Akash Ahmad Bhat1 and Qamar Parvez Rana2 1Department of Computer Applications Shrivenkateshwara University Gajraula, Amroha (UP) India-244236
2Course Director CCNA Jamia Hamdard (Hamdard University) New Delhi India- 110062 E-mail: [email protected], [email protected]
Abstract—Due to tremendous inventions in internet technology the whole teaching learning methodologies have been changed. The traditional education system which was fully dependent on the class room teaching learning process and it was named as “Madrasa” or “Gurukul”. This trend was slowly changed to postal coaching in 1970’s. Due to invent of internet and other technologies abrupt changes have been made in teaching learning process. Now a new concept with great influence has come up which is Education for all, anywhere, anytime. This paper will focus on the new innovative teaching learning methodologies and also its importance in coming days. In this paper, I have tried to explore a comparative study among e-learning, distance learning and on-line learning methodologies and how ARM technology can improve the teaching learning methods by reducing the H/W cost. Keywords: e-learning, distance learning, on-line teaching learning, teaching methodologies, education for all.
1. INTRODUCTION
E-learning or electronic learning typically means that using a computer to deliver part or all of a course .It may be in a school, part of your mandatory business training or a full distance learning course. In early days many people thought that by bringing computers into the classrooms would remove the human element that some learners need but with the passage of time technology has developed and now we embrace smart phones and tablets in the classrooms and offices as well as using a wealth of interactive designs that makes distance learning not only engaging for the users but valuable as a lesson delivery medium. The perfect blended learning environment is provided by the Virtual Colleges to offer anyone the chance to take their online training to the next level by building partnerships with quality training providers and combining this with a dedicated experienced technical team and support staff.
E-learning, online-learning, distance-learning are the common terms to define online-learning. Distance learning is a way to deliver education to the students who are not able to present in
regular classes. Distance learning provides learners (students) a way to learn when they are separated by time, distance or both from accessing information. In distance learning there is no need of physical presence of learner. A campus based institution which may offer courses using e-learning should entirely bounded by internet or other computer networks. E-learning can be defined as an education which is using a process to learn with the help of different electronics applications. E-learning delivers information using various types of media which includes audio, image, animation and video. In addition some applications are also used such as video file, CD, DVD, internet etc. Online-education is a mode of providing education over internet. The above ways of delivering education are somehow related to each other. When learners are far away from educational institutions or they are not able to get education on regular basis due to some personal reasons but eager to learn then the above mentioned modes come into existence. E-learning can be used in or out of the classrooms. E-learning is useful throughout the world, especially in a country like India or China where population is very high, this type of teaching learning methodologies are very much essential. It is assumed that after 15 to 20 years from now the conventional education system will be almost irrelevant as most of the learners will not get admission in conventional educational Institutes. So therefore, the people will be forced to take education through these alternative modes.
2. CONSEQUENCE OF DISTANCE LEARNING Distance education is the most renowned descriptor used when referencing distance learning. Distance learning is an effort to provide access to those learners who are geographically distant. During the last two decades, the relevant literature shows that various authors and researchers use inconsistent definitions of distance education and distance learning. A proposed definition identified the delivery of instructional materials, using both print and electronic media when computers became involved in the delivery of education.
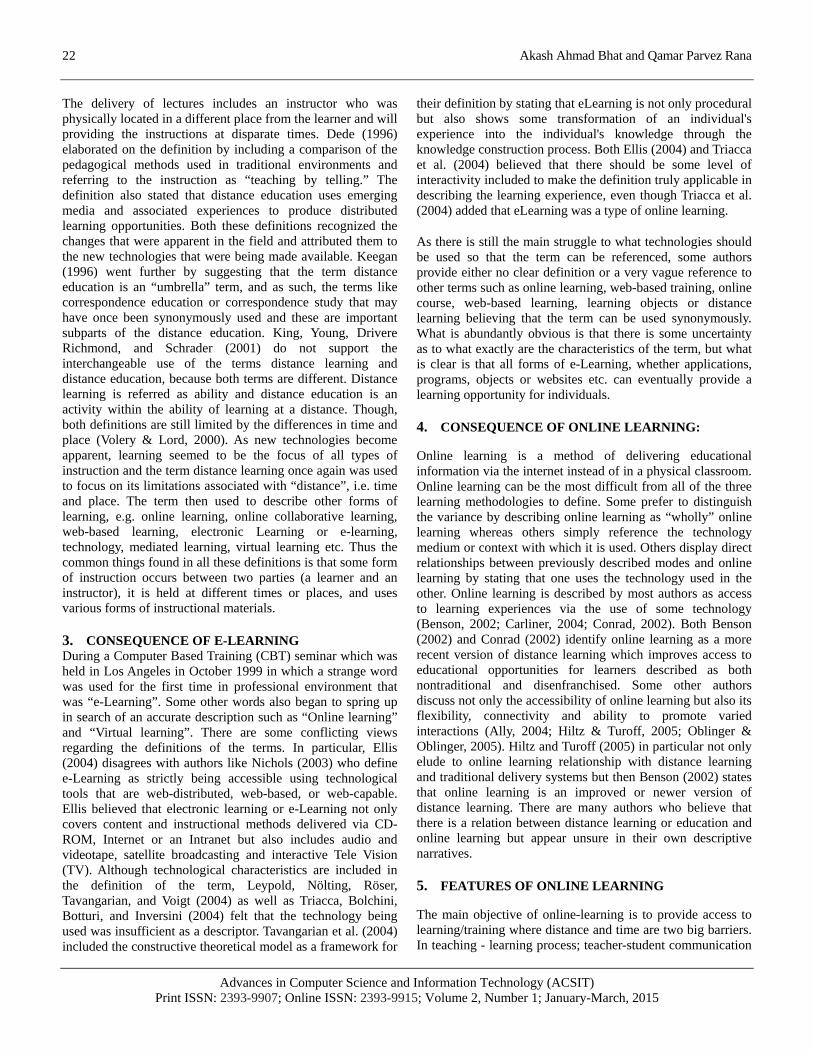
Akash Ahmad Bhat and Qamar Parvez Rana
Advances in Computer Science and Information Technology (ACSIT) Print ISSN: 2393-9907; Online ISSN: 2393-9915; Volume 2, Number 1; January-March, 2015
22
The delivery of lectures includes an instructor who was physically located in a different place from the learner and will providing the instructions at disparate times. Dede (1996) elaborated on the definition by including a comparison of the pedagogical methods used in traditional environments and referring to the instruction as “teaching by telling.” The definition also stated that distance education uses emerging media and associated experiences to produce distributed learning opportunities. Both these definitions recognized the changes that were apparent in the field and attributed them to the new technologies that were being made available. Keegan (1996) went further by suggesting that the term distance education is an “umbrella” term, and as such, the terms like correspondence education or correspondence study that may have once been synonymously used and these are important subparts of the distance education. King, Young, Drivere Richmond, and Schrader (2001) do not support the interchangeable use of the terms distance learning and distance education, because both terms are different. Distance learning is referred as ability and distance education is an activity within the ability of learning at a distance. Though, both definitions are still limited by the differences in time and place (Volery & Lord, 2000). As new technologies become apparent, learning seemed to be the focus of all types of instruction and the term distance learning once again was used to focus on its limitations associated with “distance”, i.e. time and place. The term then used to describe other forms of learning, e.g. online learning, online collaborative learning, web-based learning, electronic Learning or e-learning, technology, mediated learning, virtual learning etc. Thus the common things found in all these definitions is that some form of instruction occurs between two parties (a learner and an instructor), it is held at different times or places, and uses various forms of instructional materials.
3. CONSEQUENCE OF E-LEARNING During a Computer Based Training (CBT) seminar which was held in Los Angeles in October 1999 in which a strange word was used for the first time in professional environment that was “e-Learning”. Some other words also began to spring up in search of an accurate description such as “Online learning” and “Virtual learning”. There are some conflicting views regarding the definitions of the terms. In particular, Ellis (2004) disagrees with authors like Nichols (2003) who define e-Learning as strictly being accessible using technological tools that are web-distributed, web-based, or web-capable. Ellis believed that electronic learning or e-Learning not only covers content and instructional methods delivered via CD-ROM, Internet or an Intranet but also includes audio and videotape, satellite broadcasting and interactive Tele Vision (TV). Although technological characteristics are included in the definition of the term, Leypold, Nölting, Röser, Tavangarian, and Voigt (2004) as well as Triacca, Bolchini, Botturi, and Inversini (2004) felt that the technology being used was insufficient as a descriptor. Tavangarian et al. (2004) included the constructive theoretical model as a framework for
their definition by stating that eLearning is not only procedural but also shows some transformation of an individual's experience into the individual's knowledge through the knowledge construction process. Both Ellis (2004) and Triacca et al. (2004) believed that there should be some level of interactivity included to make the definition truly applicable in describing the learning experience, even though Triacca et al. (2004) added that eLearning was a type of online learning.
As there is still the main struggle to what technologies should be used so that the term can be referenced, some authors provide either no clear definition or a very vague reference to other terms such as online learning, web-based training, online course, web-based learning, learning objects or distance learning believing that the term can be used synonymously. What is abundantly obvious is that there is some uncertainty as to what exactly are the characteristics of the term, but what is clear is that all forms of e-Learning, whether applications, programs, objects or websites etc. can eventually provide a learning opportunity for individuals.
4. CONSEQUENCE OF ONLINE LEARNING:
Online learning is a method of delivering educational information via the internet instead of in a physical classroom. Online learning can be the most difficult from all of the three learning methodologies to define. Some prefer to distinguish the variance by describing online learning as “wholly” online learning whereas others simply reference the technology medium or context with which it is used. Others display direct relationships between previously described modes and online learning by stating that one uses the technology used in the other. Online learning is described by most authors as access to learning experiences via the use of some technology (Benson, 2002; Carliner, 2004; Conrad, 2002). Both Benson (2002) and Conrad (2002) identify online learning as a more recent version of distance learning which improves access to educational opportunities for learners described as both nontraditional and disenfranchised. Some other authors discuss not only the accessibility of online learning but also its flexibility, connectivity and ability to promote varied interactions (Ally, 2004; Hiltz & Turoff, 2005; Oblinger & Oblinger, 2005). Hiltz and Turoff (2005) in particular not only elude to online learning relationship with distance learning and traditional delivery systems but then Benson (2002) states that online learning is an improved or newer version of distance learning. There are many authors who believe that there is a relation between distance learning or education and online learning but appear unsure in their own descriptive narratives.
5. FEATURES OF ONLINE LEARNING
The main objective of online-learning is to provide access to learning/training where distance and time are two big barriers. In teaching - learning process; teacher-student communication

Revolution of E-learning (Current and Future Trends in E-learning, Distance Learning and 23 Online Teaching Learning Methodologies)
Advances in Computer Science and Information Technology (ACSIT) Print ISSN: 2393-9907; Online ISSN: 2393-9915; Volume 2, Number 1; January-March, 2015
takes places through online technologies. Our new improving technologies provide so many advantages to the learners over traditional learning. This type of learning system is more flexible. Benefits of online-learning courses are:
Online-learning let us choose our own time schedule. Avoid class distractions. Courses are accessible 24×7. 24×7 help desk is available. Provide different learning styles. Provide many ways of delivery. When participants are separated by distance from classes. Students pursuing higher education are finding themselves stuck in financial matter. Online-learning is the solution which is available at very low cost. Students can learn anything at anytime by using this advanced technology. Time is the main barrier to employees who need to improve their skills. E-learning breaks these barriers. Like traditional classes, online-learning systems do not require particular timing. Provide suitable time schedule according to the demand of learners. Individuals can access digital library for study materials. Students can access those documents which are unavailable at traditional libraries. Thus it provides another important advantage to learners by proving access to important and rare documents.
6. ONLINE LEARNING COMPONENTS
LMS (Learning Management System)
The LMS is the platform where individuals can view their syllabus, materials including videos, audio files etc. In some system individuals can interact with others via e-mail or interactive chat.
Learners are free to listen, read or watch assignments on their own available time. Some students order their textbooks while others ask for eBooks. Essential resources include podcasts, PowerPoint Presentation, WordPad, webcasts etc.
Students have their own assignments and due dates. They can use discussion forums while facing difficulties in assignments or projects. Students are asked to discuss their projects via blogs. It is necessary to represent their knowledge.
7. FEATURES OF E-LEARNING
E-Learning is self-paced and provides a chance to the students to speed up or slow down as necessary.
E-Learning allows students to choose content and tools according to their interests, needs, and skill levels.
E-Learning provides greater student interaction and collaboration.
E-Learning improves computer and Internet skills of the students.
E-Learning accommodates multiple learning styles using a variety of delivery methods.
By E-Learning geographical barriers are eliminated, opening up broader education options.
E-Learning makes the accessibility round the clock and allows a greater number of people to attend classes.
E-learning is the attention of every major university in the world, most of their own online degrees, certificates, and individual courses.
Traveling time and associated costs (parking, fuel and vehicle maintenance) are reduced or eliminated.
Cheap method of achieving education. No need of tuition fee, residence charges, food, child care etc.
Organizations, companies, institutions are using e-learning because its cost is lower than traditional training.
8. E-LEARNING COMPONENTS
E-learning approaches can include different types of components:
E-learning study material E-mentoring Virtual classroom
9. SYNCHRONOUS & ASYNCHRONOUS E-LEARNING
Synchronous e-learning occur in case of real time. Whereas, asynchronous e-learning is time independent. Comparisons between these two approaches are shown below:
Synchronous Asynchronous It includes chat E-mail Live discussion on websites Wiki Share applications Blogs Video conference Forum
10. NECESSARY BUILDING REQUIREMENTS FOR ONLINE LEARNING COURSES
Different types of training courses involve good planning which is more important in this field. Regular Classes involve a huge effort in delivering the content. Whereas e-learning must be structured and it should be able to used multiple times without making ongoing adjustments.
Technology is necessary for designing and delivering e-learning. Different tools are used for producing e-learning materials. MS word is a program in MS office package which can be used as a tool to produce text documents. MS-PowerPoint is another tool which can be used as a presentation tool. To make content interactive, better tools are required e.g. creating 3D animations, 3D images more tools are required. For creating media components some specialized tools are necessary e.g. Adobe Photoshop, Adobe Flash.

Akash Ahmad Bhat and Qamar Parvez Rana
Advances in Computer Science and Information Technology (ACSIT) Print ISSN: 2393-9907; Online ISSN: 2393-9915; Volume 2, Number 1; January-March, 2015
24
There are some requirements for e-learning such as desktop, notebook, kindle, printers. In addition, Internet connection is necessary. Textual e-learning materials do not need high-speed Internet connection. But presentations, live-conversation requires high-speed Internet connection. Offline classes in e-learning do not need Internet connection. They can be delivered through CD’s DVD’s etc.
11. FEATURES OF DISTANCE LEARNING
Distance education aims to deliver a high quality university education to students who are not able to be physically present on classrooms. Distance education allows freedom to choose when and where one can complete his/her degree. With flexibility of distance education anyone can study on his/her own way and on his/her own time.
“I am too old to study”. This is a common sentence in our daily life. Distance learning develops self-motivation and gives an independent approach to lifelong learning. With relaxation of timing, presence at classes, one can study at his/her own pace.
12. WORKING OF DISTANCE EDUCATION SYSTEMS
Students pursuing education through distance learning need to access their study materials. For this reason, the whole system must provide a central digital library. This library may ask a student about his/her ID and password. Students can see webcasts regarding their courses. They can access eBooks, audio files, presentation etc. Some authoritative tools are also necessary. Lectures delivered by teachers must be live on air so it requires high speed internet connection. Teachers giving presentations to their students require some specialized tools. Adobe Photoshop, MS PowerPoint, Movie Maker, Adobe Flash are some examples of these necessary tools.
What about student knowledge? What about their demonstrations? These can be solved by an automated question & answering system, discussion forum etc. Group chat, email are also great way of communicating with others. Students can share their own thoughts on discussion forum which helps other students in their studies.
13. COMPARISONS BETWEEN E-LEARNING, ONLINE-LEARNING AND DISTANCE LEARNING E - Learning, Online Learning and Distance Learning are the three terms which are interrelated to one another. E-learning is a special term that is used to define learning through electronic medium. This is learning in which the interaction between student and teacher is online. They may or may not be in the same building the learning and the communication is done online. There may be an offline component (e.g, a student might write a response on paper) but there is always an online
connection (e.g. they take a picture of their response to send to the teacher). It focuses on the terms such as anytime, anywhere. Computer power is involved with this type of learning methodology. Nowadays not only computers are involved with this but mobile phones, tablets, PDAs, kindle like devices are also involved. It removes the concepts like “physical presence in the class room”, “scheduled time”. Among so many advantages there are some limitations as well which are as under:
Students will need machine of minimum specification. Starting cost of e-learning system is very expensive. Machine compatibility issues e.g. some users viewing a
document compatible for windows systems, but other students are unable to open that file because they are using some other operating systems.
It highly depends on internet coverage. If some learners unable to use Internet, they can’t access services provide by e-learning.
Online-learning is similar to e-learning. It also removes the problem of distance and time which were main barriers of learning. Online-learning is appropriate for remote places. Like traditional learning, open-learning do not rely on the concept of time schedule and physically presence. Someone doing research in a particular field may face some problems due to the presence of online learning he/she can immediately contact with some expert. Another great advantage of online-learning is that up-to-date information is available.
Advance subjects are available all the time. Experts on advance fields are available 24×7. Open-learning also save money, since some online programs cost less than tradition learning programs. The disadvantages as under:
Although instructors are available 24×7 through email, IM but some learners may face the lack of face-to-face communication.
There are still many different fields like engineering, aviation – that require practical instructions which are not available online.
Online systems are expensive to build. The whole infrastructure is greatly dependent on IT and
IT professionals. Electronic devices are mandatory in this case. Hence a
learner without electronic device, internet connection is out of this field.
As a breakaway from conventional learning, distance learning defines a new way of teaching in the absence of a direct interaction with teacher and student. One of the big advantages of distance learning is anyone can access the knowledge by means of post or online programs. This contrasts with other learning systems, e-learning and online-learning. Delivery of knowledge can also use electronic media, e.g. CD, DVD, email. Distance learning provides better

Revolution of E-learning (Current and Future Trends in E-learning, Distance Learning and 25 Online Teaching Learning Methodologies)
Advances in Computer Science and Information Technology (ACSIT) Print ISSN: 2393-9907; Online ISSN: 2393-9915; Volume 2, Number 1; January-March, 2015
accessibility. If someone goes for the online learning method, he/she will only need to have an electronic device and internet connection. Distance learning system has disadvantages too. There is no direct interaction with teacher or instructor. Someone may find themselves in the deep ocean while they are handling their course material.
One should not get distracted to social networking while e-studying or online-studying. We can see that all these learning methodologies are related directly or indirectly with each other. The key points of these learning systems are:
Eliminating timing problem Cover the problem of geographical separation from
learning institutions Removes the limitation of discussion with experts Gives opportunity to study advance topics There are some common challenges with these methodologies:
IT infrastructure involved in these fields is expensive. Maintenance of service requires a great monitoring on the
entire system. Providing accurate materials to students is a common
challenge Learners use different devices, hence compatibility is also
a common challenge. Lack of face-to-face interaction.
14. ABSTRACT INFRASTRUCTURE MODEL OF:
1. E-LEARNING 2. DISTANCE LEARNING 3. ONLINE-LEARNING
Currently wide range of web-accessible technologies and other services are present which fit into this field. It includes Virtual Private Networks, Local Web-Hosting, Local Area Network, Web-based video delivery etc. VPNs, LANs, Web-Hosting, all technologies use Client-Server architecture. Some of the main requirements when using the Client-Server architecture are:
Processing speed of Servers. Storage space of study materials on Servers. High-speed internet connection. Specific desktop-applications and web-based applications
for end users. Implementing such infrastructure are too costly to mid-size organizations or small-organizations. So they have to depend on IT companies. Maintaining such infrastructure is also expensive.
15. ARM ARCHITECTURE
Introduction
ARM architecture is 32-bit RISC (Reduced Instruction Set Computer) architecture, developed by British company ARM Holdings. ARM based computer fits into a single 10 cm by 5 cm circuit board.
Some advantages of ARM based computer: It consumes significantly less power. Reduce cost. Generate low heat Replace servers. It uses Linux based open source Operating System. To provide a better service, industry use well known
three tier architecture. A classical definition of three tier architecture:
A three - tier architecture is a client-server architecture in which the functional process logic, data access, computer data storage and user interface are developed and maintained as independent modules on separate platforms. The structure of this architecture uses three implementations:
Level 1 which displays related information. Level 2 which controls application functionality by
manipulating details. Level 3 where actual information is stored.
It is proposed to use ARM based systems to reduce the cost of expensive infrastructure of e-learning, online-learning systems.
16. CONCLUSION AND FUTURE SCOPE
E-learning, online-learning, distance-learning has several competitive blessings during a variety of areas like accessibility, flexibility, technology. Nowadays many colleges, universities supply a wide range of online courses, distance courses. Use of online resources for learning is increasing. According to Dr. Wang Liam, “in the future there won’t be a difference between online or face-to face education and that they will both be interweaved together to produce the best output.”
According to a white paper
The real future lies not just in the technology, but in the potential to integrate several key areas:
E-learning to develop this capital. Knowledge management of intellectual capital. Web-enabled electronic performance support systems to
use this capital more productively.

Akash Ahmad Bhat and Qamar Parvez Rana
Advances in Computer Science and Information Technology (ACSIT) Print ISSN: 2393-9907; Online ISSN: 2393-9915; Volume 2, Number 1; January-March, 2015
26
REFERENCES
[1] en.wikipedia.org/wiki/E-learning [2] en.wikipedia.org/wiki/Distance_education [3] www.theguardian.com/education/online-learning [4] Beatrice Ghirardini, Jasmina Tisovic, “E-learning
methodologies A guide for designing and developing e-learning courses”, Food and Agriculture Organization of United Nations, Rome 2011
[5] http://www.expertsbuzz.com/2012/07/importance-of-e-learning-education-and..html
[6] http://education-portal.com/benefits_of_online_learning.html [7] http://education-
portal.com/articles/What_are_the_Disadvantages_of_Online_Schooling_for_ Higher_Education.html
[8] http://link.springer.com/article/10.1007/s10734-004-0040-0 [9] en.wikipedia.org/wiki/ARM_architecture [10] www.arm.com/ [11] http://whatis.techtarget.com/definition/ARM-processor [12] en.wikipedia.org/wiki/Virtual_private_network [13] http://blog.commlabindia.com/elearning-design/infrastructure-
for-elearning [14] en.wikipedia.org/wiki/Computer_cluster [15] en.wikipedia.org/wiki/Multitier_architecture [16] www.techopedia.com/definition/24649/three-tier-architecture [17] http://www.hotcoursesabroad.com/india/blog/online-education-
the-past-present-and-future/dr liam [18] E-learning the future of learning (white paper)
(www.elearnity.com) [19] http://www.virtualcollege.co.uk/elearning/elearning.aspx [20] [20]http://www.worldwidelearn.com/elearning-
essentials/elearning-benefits.htm [21] [21]http://www.nfstc.org/pdi/Subject00/pdi_s00_m03_02_a.htm [22] [22]https://bgrasley.wordpress.com/2014/02/28/whats-the-
difference-between-e-learning-online-learning-blended-learning/ [23] [23]http://www.aconventional.com/2014/02/the-difference-
between-online-learning.html [24] [24]Siddharth Sehra*, Sunakshi Maghu and Avdesh Bhardawaj,
“Comparative Analysis of E-learning and Distance Learning Techniques”, International Journal of Information & Computation Technology, Volume 4, Number 8 (2014)

Advances in Computer Science and Information Technology (ACSIT) Print ISSN: 2393-9907; Online ISSN: 2393-9915; Volume 2, Number 1; January-March, 2015 pp. 27-29 © Krishi Sanskriti Publications http://www.krishisanskriti.org/acsit.html
Sentimental Analysis Using Social Media and Big data
Arpita Gupta1 and Anand Singh Rajawat2 1PG Scholar, Department of CSE, SVITS, Indore, India
2Department of CSE, SVITS, Indore, India E-mail: 1arpitagupta0505@gmail, 2comanandsrajawat@gmail. com
Abstract—Social media is bestest way of communication. Millions of people communicate through this everyday. There are two major problems encounter when we talk about processing of the data related to social media. One is ambiguity of data and the other is data is completely unstructured. To overcome this major area of problems in social media here we can use some techniques of Big data in which analysis and collection of data plays major role or key role. It allows the data collection and analysis from a big data without hindrance, obstruction and time delay. The focus of our project is to analysis the unstructured data and overcomes the problem of ambiguity using hadoop and this will increase performance and security will also be improved. Keywords:-Sentiment analysis, Text mining, Machine learning, Big data, Wordnet.
1. INTRODUCTION
Big Data is trending research area in computer Science and sentiment analysis is one of the most important part of this research area. Big data is considered as very large amount of data which can be found easily on web, Social media, remote sensing data and medical records etc. in form of structured, semi-structured or unstructured data and we can use these data for sentiment analysis.
Sentimental Analysis is all about to get the real voice of people towards specific product, services, organization, movies, news, events, issues and their attributes[1]. Sentiment Analysis includes branches of computer science like Natural Language Processing, Machine Learning, Text Mining and Information Theory and Coding. By using approaches, methods, techniques and models of defined branches, we can categorized our data which is unstructured data may be in form of news articles, blogs, tweets, movie reviews, product reviews etc. into positive, negative or neutral sentiment according to the sentiment is expressed in them.
Sentiment analysis is done on three levels [1] Document Level Sentence Level Entity or Aspect Level.
Document Level Sentiment analysis is performed for the whole document and then decide whether the document express positive or negative sentiment. [1]
Entity or Aspect Level sentiment analysis performs finer-grained analysis. The goal of entity or aspect level sentiment analysis is to find sentiment on entities and/or aspect of those entities.
Sentence level sentiment analysis is related to find sentiment form sentences whether each sentence expressed a positive, negative or neutral sentiment. Sentence level sentiment analysis is closely related to subjectivity classification. Many of the statements about entities are factual in nature and yet they still carry sentiment. Current sentiment analysis approaches express the sentiment of subjective statements and neglect such objective statements that carry sentiment [1]. For Example, “I bought a Motorola phone two weeks ago. Everything was good initially. The voice was clear and the battery life was long, although it is a bit bulky. Then, it stopped working yesterday. [1]” The first sentence expresses no opinion as it simply states a fact. All other sentences express either explicit or implicit sentiments. The last sentence “Then, it stopped working yesterday” is objective sentences but current techniques cannot express sentiment for the above specified sentence even though it carry negative sentiment or undesirable sentiment. Context-aware sentiment analysis tackles the problem of ambiguity by attempting to determine the superordinate concept of the sentiment term in a given context. Straightforward for humans with ample domain experience, this can be a difficult task for automatedsystems. [2]. The focus of our project is to analysis the unstructured data and overcomes the problem of ambiguity.
2. LITERATURE SURVEY
Research is carried out in two basic ways: qualitative and quantitative. In a qualitative approach, the researcher makes knowledge claims based primarily on a constructivist perspectives (i. e. the multiple meanings of individual

Arpita Gupta and Anand Singh Rajawat
Advances in Computer Science and Information Technology (ACSIT) Print ISSN: 2393-9907; Online ISSN: 2393-9915; Volume 2, Number 1; January-March, 2015
28
experiences, meanings socially and historically constructed, with an intent of developing a theory or pattern) or advocacy/participatory perspectives (i. e. political, issue-oriented, collaborative or change oriented) or both [3]. Qualitative research involves finding out what people think, and how they feel - or at any rate, what they say they think and how they say they feel. This kind of information is subjective. It involves feelings and impressions, rather than numbers. On the other hand, quantitative research focuses on measuring an objective fact. Key to conducting quantitative research is definition of variables of interest and to a large extent a sense of detachment in the data collection by the researcher. Quantitative research analyses data using statistics and relies on large samples to make generalized statements.
A new trend has emerged in research today - the mixed method research design or plural research designs. Plural research design combines both qualitative and quantitative research methods in market studies and is becoming quite a fashion in social science research. Triangulation also can be impractical to some research situations given the high research cost of multiple data collection and the time delays in data collection and data analysis[4]. Sentiment analysis provides a faster, simpler and less expensive alternative to traditional qualitative market research techniques like observations, interviews and even ethnography as well as provides information in real time
3. RELATED WORK
Sentiment analysis is most popular tend in today’s world. Lot of work has been done in this sector. Following are some approaches which are most popular in today’s world. There has been a lot of research in the area of Sentiment analysis. Bo Pang and Lee were the pioneers in this field. Current works in this area includes using a mathematical approach which uses a formula for the sentiment value depending on the proximity of the words with adjectives like ‘excellent’, ‘worse’, ‘bad’ etc. Our project uses the Naïve-Bayes approach[5], support vector machine[6] , maximum entropy and an hadoop cluster for distributed processing of the textual data. Also the analysis native linguistics of a particular country along with Englishusage is also being worked upon.
HADOOP The Hadoop platform was designed to solve problems which had lot of data for processing. It uses the divide and rule methodology for processing. It is used to handle large and complex unstructured data which doesn’t fit into tables. Twitter data being relatively unstructured can be best stored using Hadoop. Hadoop also finds a lot of applications in the field of online retailing, search engines, finance domain for risk analysis etc.
HDFS Hadoop Distributed File System (HDFS) is a distributed file system which runs on commodity machines. It is highly fault tolerant and is designed for low cost machines. HDFS has a high throughput access to application and is suitable for applications with large amount of data. HDFS has a 1 master server architecture which has a single name node which regulates the file system access. Data nodes handle read and write requests from the file system’s clients. They also perform block creation, deletion, and replication upon instruction from the Name node. Replication of data in the file system adds to the data integrity and the robustness of the system.
Fig. 1: Data Replication
Data replication is done for achieving fault tolerance. The large data cluster is stored as a sequence of blocks. Block size and the replication factor are configurable. Replication factor is set to 3 in our project which means 3 copies of the same data block will be maintained at time in the cluster.
4. OUR APPROACH
In our approach we focused more on the speed of performing analysis than its accuracy i. e. performing sentiment analysis on big data which is achieved by splitting the various modules of data in following steps and collaborating with hadoop for mapping it onto different Machines . part of speech tagged using opennlp. This tagging is used for following various purposes.
i. Stop words removal: The stop words like a, an , this which are not useful in performing the sentiment analysis are removed in this phase. Stop words are tagged as _DT in Opennlp. All the words having this tag are not considered.
ii. Unstructured to structured: Twitter and facebook comments are mostly unstructured i. e. ‘aswm’ is written ‘awesome’, ‘happyyyyyy’ to actually ‘happy’. Conversion to structured
Datanode
client Secondary Namenode
Namenode
Datanode Datanode

Sentimental Analysis Using Social Media and Big data 29
Advances in Computer Science and Information Technology (ACSIT) Print ISSN: 2393-9907; Online ISSN: 2393-9915; Volume 2, Number 1; January-March, 2015
is done by dynamic data records of unstructured to structured and vowels adding.
iii. Emoticons: These are most expressive method available
for opinion. The emoticons symbolic representation is converted in to words at this stage i. e. _ to happy.
iv. To overcome the problem of ambiguity.
A. Real time data and features
The real time that is necessary for this project is obtained from the streaming API’s provided by twitter or facebook. For the development purpose twitter provides streaming API’s which allows the developer an access to 1% of tweets tweeted at that time bases on the particular keyword. The object about which we want to perform sentiment analysis is submitted to the twitter API’s which does further mining and provides the tweets related to only that object. Twitter data is generally unstructured i. e use of abbreviations is very high. A tweet consists of maximum 140 characters. Also it allows the use of emoticons which are direct indicators of the author’s view on the subject. Tweet messages also consist of a timestamp and the user name. This timestamp is useful for guessing the future trend application of our project. User location if available can also help to gauge the trends in different geographical regions.
B. Part of Speech
The files which contained the obtained tweets are then
C. Root form
The given words in tweet are converted to their root form to avoid the unwanted extra storage of the derived word’s sentiment. The root form dictionary is used to do that which is made local as it is heavily used is program. This lowers the access time and increases the overall efficiency of the system.
D. Sentiment Directory
The sentiment Directory is created using standard data from sentiment wordnet and using all possible usage of a particular word i. e. “good” can be used in many different ways each way having its own sentiment value each time it is used. So overall sentiment of good is obtained from all its usage and stored in a directory which should be again local to the program (i. e. in primary memory) so that time should not be wasted in searching word in the secondarymemory storage.
E. Map-reduce Algorithm
The faster real time processing can be obtained by using cluster architecture set up by hadoop. The program contains chained map-reduce structure which used to process ever tweet and assign the sentiment to each remaining words of tweet and then summing it up to decide final sentiment. Here special care should be taken for the phrasal sentences where sentiment of phrase matters rather than sentiment of each
word. It can be done by dynamic directory of phrases and their sentiment values can be obtained from standard algorithm PMI-IR .
5. FUTURE SCOPE
At this moment, the code can handle the analysis part with a very good accuracy. But there are a few areas which have a lot of scope in this aspect. Sarcastic comments are the ones which are very difficult to identify. Tweets, Posts and commentscontaining sarcastic comments give exactly opposite results owing to the mindset of the author. These are almost impossible to track. Also depending on the context in which a word is used, the interpretation changes. For ex: the word ‘unpredictable’ in ‘unpredictable plot’ in context of a land plot is negative whereas ‘unpredictable plot ’ in context of a movie’s plot is positive. So it’s important to relate the interpretation with the context of the tweets. Also the use of native language combined with English usage is difficult to interpret.
6. CONCLUSION
Sentiment analysis is a very wide branch for research. We have covered some of the important aspects. We plan ahead to improve our algorithm used for determining the sentiment value. Also the project as of now can also be expanded to other social media platform usages like movie reviews(IMDB reviews), personal blogs. The accuracy achieved is also mentioned below. [7]Emoticons and the use of hashtags for the sentiment evaluation is a very important inference related to sentiment analysis of social media data. Our project uses emoticons but the use of hashtags to determine the context of the tweet or post is not done. Hence with the current limitations the accuracy is found to be 74%
REFERENCES
[1] Bing Liu, Sentiment Analysis and Opinion Mining, Morgan and Claypool Publishers, May 2012. p. 18-19, 27-28, 44-45, 47, 90-101.
[2] http://systems-sciences. uni-graz. at/etextbook/bigdata/sentiment_analysis. html.
[3] Creswell, John. (2007). Qualitative Inquiry and Research Design. Choosing Among FivemApproaches. 2nded. Sage Publications Inc: California.
[4] Kelle, Udo. (2006). “Combining Qualitative and Quantitative Methods in Research Practice: Purposes and Advantages. ” Qualitative Research in Psychology, 3 (4): 293 311.
[5] ApoorvAgarwal, Owen Rambow, Rebecca Passonneau, “Sentiment Analysis of Twitter Data”
[6] Vapnik, Vladimir, N. (1995). The Nature of Statistical Learning Theory, Springer-Verlag: New York.
[7] Bing Liu, Minquinghu, “Mining and summarizing Customer Reviews”

Advances in Computer Science and Information Technology (ACSIT) Print ISSN: 2393-9907; Online ISSN: 2393-9915; Volume 2, Number 1; January-March, 2015 pp. 30-34 © Krishi Sanskriti Publications http://www.krishisanskriti.org/acsit.html
L ossless I mage C ompr ession of M edical I mages Using G olomb R ice C oding T echnique
G ir ish G angwar 1, M aitr eyee Dutta2 and G aurav G upta3 1M.E. Scholar, Department of CSE National Institute of Technical Teachers Training & Research, Chandigarh, India
2Professor & Head, Department of CSE National Institute of Technical Teachers Training & Research, Chandigarh, India 3
E-mail: M.E. Scholar, Department of ECE National Institute of Technical Teachers Training & Research, Chandigarh, India
Abstract—Medical Science Applications generate a huge amount of sequential images for medical diagnosis, such as Magnetic Resonance Images (MRI), Computed Tomography (CT) scan, and Fluoroscopy. Fluorography is a continuous form of X-Ray. These images take up a large amount of storage and also takes large time and cost in transmission. To maintain the good quality of medical images, lossless compression is preferred, because it is very difficult to diagnose a problem in blurred or poor quality images. The existing algorithm for still image compression such as Run Length Encoding (RLE), Huffman coding and Block Truncation Coding (BTC) were developed by considering the compression efficiency parameter by giving least importance to the visual quality of images. Hence we introduce a new lossless image compression technique based on Golomb-Rice Coding, which efficiently maintain the compression ratio up to 8.7 for good visual quality in the reconstruction process and enhanced Peak Signal to Noise Ratio (PSNR) up to 34.525627 for test image im_3 and 35.526205 for test image im_10 in medical images. The Proposed work of this technique is simulated and tested in MATLAB. Keywords: Fluoroscopy; ROI; Lossless image compression; Huffman Coding; Golomb-Rice Coding.
1. I NT R ODUC T I ON Digital images have become very popular in the present scenario, especially in Medical science application, electronic industries and other organizations like satellite imaging, and multimedia applications. In the last few years medical images have been increased tremendously in terms of generation, transmission and storage. This has brought the attraction of many researchers in developing novel techniques for compressing medical images.
Image compression is the process of minimizing the size in bytes of an image file without degrading the visual quality of the image to an unacceptable level. The compact file size allows to store more images in a fixed amount of disk or memory space. It also reduces the transmission time required for images to be sent over the Internet or downloaded from Web pages.
Compression techniques can be classified into Lossy and Lossless compression.
Lossy compression reduces the size of an image by permanently eliminating certain information, especially redundant information. Lossy compression reduces the accuracy of medical images, and which makes doctors unable to diagnose the case of the patient. JPEG, DCT and DWT are some common examples of lossy image compression techniques.
All the original data can be reconstructed when the file is uncompressed. By implementing lossless compression, every single bit of data that was present in the original file remains as it is after the file is uncompressed. All of the information is completely restored. So it is specially used for Medical image compression. JPEG-LS, PNG, TIFF are some lossless image compression file formats. Lossy image compression techniques provide a high compression ratio while the lossless image compression techniques give an improved visual quality of images after reconstruction process[1][2].
The Haar wavelet, which is the simplest of all the 2D DWT, along with thresholding has been applied on a JPEG image. After that Run Length Entropy Coding has been adopted. This approach is used for compression of image using parameter CR (Compression Ratio) without losing the parameter PSNR, the quality of image, using less bandwidth [3]. Run length coding is the standard coding technique for compressing the images. This method counts the number of repeated zeros which is represented as RUN and appends the non-zero coefficient represented as LEVEL following the sequence of zeros. Then it was observed that for the occurrence of consecutive non-zero sequence the value of RUN is zero for most of the time, so this redundancy was removed by encoding the nonzero coefficient (LEVEL) only, instead of an ordered pair of RUN (= 0)/ LEVEL. According to this scheme the single zero present between two non zero coefficients would be encoded as (1,0) .The proposed work aims at

Lossless Image Compression of Medical Images Using Golomb Rice Coding Technique 31
Advances in Computer Science and Information Technology (ACSIT) Print ISSN: 2393-9907; Online ISSN: 2393-9915; Volume 2, Number 1; January-March, 2015
removing the unintended RUN, LEVEL (1,0) pair used for a single zero present between the two non-zero characters. So instead of using (1, 0) pair for the zero between non-zero characters, a single ’0’ will be encoded [4].
Huffman coding is a variable length coding that assigns longer codes to symbols with low probabilities and shorter codes to symbols with higher probabilities. This coding scheme is efficient to compress differential data[5].The RLE is one of the most popular and simplest method that is applied to the repeated data or code pattern in a single code[6]. The combination of two effective compression methods that is RLE and Huffman was proposed to reduce the data volume, pattern delivery time and save power in scan applications[7]. In medical images the combination of run length and Huffman coding was implemented on MRI images and X-Ray angiograms to achieve maximum compression [8]. Lossless compression of Fluoroscopy medical images using correlation and Huffman coding was done in [9][10]
A new method for lossless compression of pharynx and esophagus fluoroscopy images, using correlation and combination of Run Length and Huffman coding on the difference pairs of images classified by correlation. From the experimental results obtained, the proposed method achieved improved performance [11]. A hint for the application of Golomb Rice encoding for compressing Fluoroscopic medical images was given in [11].
Golomb coding is a lossless data compression technique using data compression codes invented by Solomon W. Golomb in the 1960s. Alphabets following a geometric distribution will have a Golomb code as an optimal prefix code, making Golomb coding highly suitable for situations in which the occurrence of small values in the input stream is significantly more likely than large values. Rice coding is invented by Robert F. Rice. It denotes using a subset of the family of Golomb codes to produce a simpler (but possibly suboptimal) prefix code; Rice used this in an adaptive coding scheme, although "Rice coding" can refer to either that scheme or merely using that subset of Golomb codes. Whereas a Golomb code has a tuneable parameter that can be any positive value, Rice codes are those in which the tuneable parameter is a power of two. This makes Rice codes convenient for use on a computer, since multiplication and division by 2 can be implemented more efficiently in binary arithmetic. Rice coding is used as the entropy encoding stage in a number of lossless image compression and audio data compression methods [12]. Golomb-Rice coding, is introduced also for improve the JPEG standard. Since the coding scheme is not based on frequency analysis from certain of images to gain a codebook, the decoded images that are encoded with this scheme are assured in average quality. The standard JPEG compression scheme can import these two for higher compression rates or wider application fields [13]. Hierarchical interpolating prediction and adaptive Golomb-
Rice coding, and achieves 7-35 times faster compression than existing methods such as JPEG2000 and JPEG-LS, at similar compression ratios [14].
2. G OL OM B -R I C E C ODI NG
In this Rice–Golomb encoding, the remainder code uses simple truncated binary encoding, also named "Rice coding" (other varying-length binary encodings, like arithmetic or Huffman encodings, are possible for the remainder codes, if the statistic distribution of remainder codes is not flat, and notably when not all possible remainders after the division are used). In this algorithm, if the M parameter is a power of 2, it becomes equivalent to the simpler Rice encoding.
1. Fix the parameter M to an integer value. 2. For N, the number to be encoded, find
quotient = q = int[N/M] remainder = r = N modulo M
3. Generate Codeword 1. The Code format: <Quotient Code><Remainder Code>, where
2. Quotient Code (in unary coding) 1. Write a q-length string of 1 bits 2. Write a 0 bit 3. Remainder Code (in truncated binary encoding) 1. If M is power of 2, code remainder as binary format. So log2(𝑀𝑀) bits are needed. (Ricecode)
2. If M is not a power of 2, set b=�log2(𝑀𝑀)� 1. If r<2b
2. If r>=2-M code r as plain binary using b-1 bits. b-M code the number r+2b
-M in plain binary representation using b bits.
Example
Set M = 10. Thus b=⌈log2(10)⌉ =4
The cutoff is 2b
Table 1(a): R esults of G olomb C oding for M =10 and b=4
-M=16 10=6
Encoding of Quotient Part Q Output bits 0 0 1 10 2 110 3 1110 4 11110 5 111110 6 1111110
….. …………. N 111…….1110
Table 1(b): R esults of G olomb C oding for M =10 and b=4
Encoding of remainder part R Offset Binary Output 0 0 0000 000 1 1 0001 001 2 2 0010 010
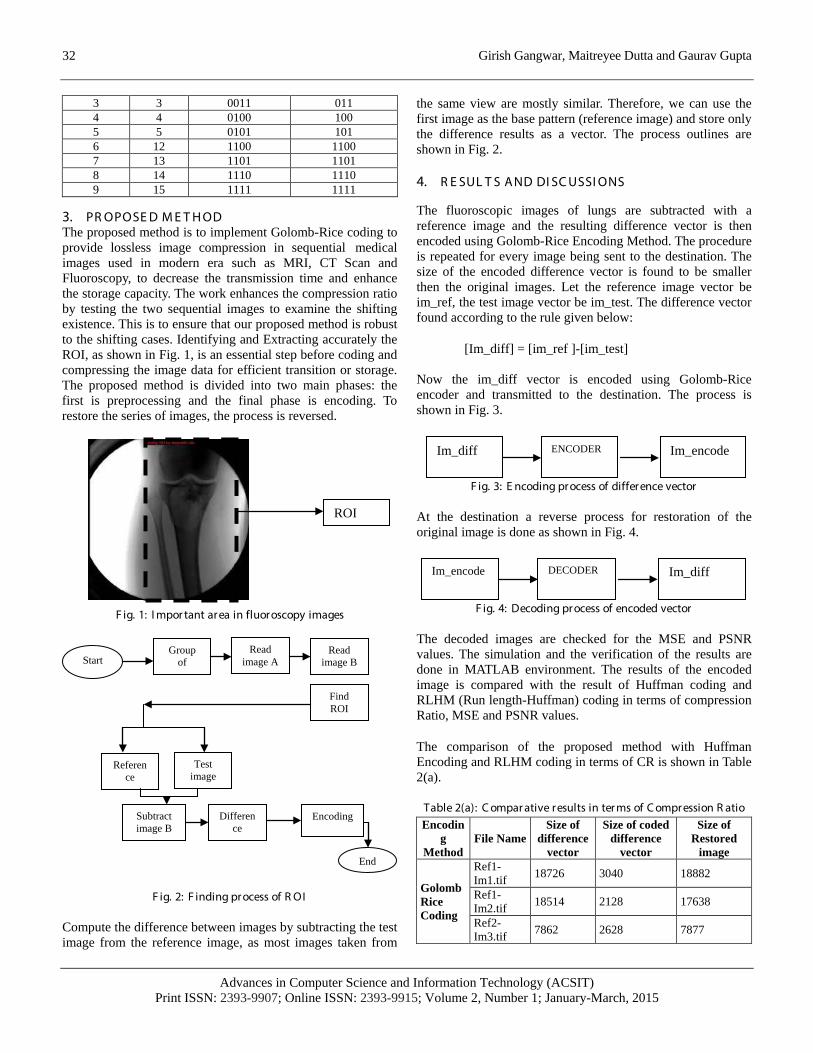
Girish Gangwar, Maitreyee Dutta and Gaurav Gupta
Advances in Computer Science and Information Technology (ACSIT) Print ISSN: 2393-9907; Online ISSN: 2393-9915; Volume 2, Number 1; January-March, 2015
32
3 3 0011 011 4 4 0100 100 5 5 0101 101 6 12 1100 1100 7 13 1101 1101 8 14 1110 1110 9 15 1111 1111
3. PR OPOSE D M E T H OD The proposed method is to implement Golomb-Rice coding to provide lossless image compression in sequential medical images used in modern era such as MRI, CT Scan and Fluoroscopy, to decrease the transmission time and enhance the storage capacity. The work enhances the compression ratio by testing the two sequential images to examine the shifting existence. This is to ensure that our proposed method is robust to the shifting cases. Identifying and Extracting accurately the ROI, as shown in Fig. 1, is an essential step before coding and compressing the image data for efficient transition or storage. The proposed method is divided into two main phases: the first is preprocessing and the final phase is encoding. To restore the series of images, the process is reversed.
F ig. 1: I mpor tant area in fluoroscopy images
F ig. 2: F inding process of R OI
Compute the difference between images by subtracting the test image from the reference image, as most images taken from
the same view are mostly similar. Therefore, we can use the first image as the base pattern (reference image) and store only the difference results as a vector. The process outlines are shown in Fig. 2.
4. R E SUL T S A ND DI SC USSI ONS
The fluoroscopic images of lungs are subtracted with a reference image and the resulting difference vector is then encoded using Golomb-Rice Encoding Method. The procedure is repeated for every image being sent to the destination. The size of the encoded difference vector is found to be smaller then the original images. Let the reference image vector be im_ref, the test image vector be im_test. The difference vector found according to the rule given below:
[Im_diff] = [im_ref ]-[im_test]
Now the im_diff vector is encoded using Golomb-Rice encoder and transmitted to the destination. The process is shown in Fig. 3.
F ig. 3: E ncoding process of difference vector
At the destination a reverse process for restoration of the original image is done as shown in Fig. 4.
F ig. 4: Decoding process of encoded vector
The decoded images are checked for the MSE and PSNR values. The simulation and the verification of the results are done in MATLAB environment. The results of the encoded image is compared with the result of Huffman coding and RLHM (Run length-Huffman) coding in terms of compression Ratio, MSE and PSNR values.
The comparison of the proposed method with Huffman Encoding and RLHM coding in terms of CR is shown in Table 2(a).
Table 2(a): C ompar ative results in ter ms of C ompression R atio Encodin
g Method
File Name Size of
difference vector
Size of coded difference
vector
Size of Restored
image
Golomb Rice Coding
Ref1-Im1.tif
18726 3040 18882
Ref1-Im2.tif
18514 2128 17638
Ref2-Im3.tif
7862 2628 7877
End
Find ROI
Read image A
Group of
Read image B
Start
Subtract image B
Reference
Test image
Difference
Encoding
ROI
Im_diff ENCODER Im_encode
Im_encode DECODER Im_diff

Lossless Image Compression of Medical Images Using Golomb Rice Coding Technique 33
Advances in Computer Science and Information Technology (ACSIT) Print ISSN: 2393-9907; Online ISSN: 2393-9915; Volume 2, Number 1; January-March, 2015
Ref2-Im4.tif
7856 2368 7886
Ref2-Im5.tif
7784 2385 7793
Ref2-Im6.tif
7968 2584 7964
Ref2-Im7.tif
7657 2538 7685
Ref2-Im8.tif
7456 2653 7565
Ref2-Im9.tif
7665 2638 7686
Ref2-Im10.tif
7454 2453 7484
Huffman Encoding
Ref1-Im1.tif
18726 5770 18786
Ref1-Im2.tif
18514 6182 18820
Ref2-Im3.tif
7862 5680 7874
Ref2-Im4.tif
7856 4986 7867
Ref2-Im5.tif
7784 5588 7798
Ref2-Im6.tif
7968 5984 7986
Ref2-Im7.tif
7657 5830 7699
Ref2-Im8.tif
7456 5417 7552
Ref2-Im9.tif
7858 5081 7872
Ref2-Im10.tif
7827 4467 7863
RLHM Coding
Ref1-Im1.tif
18726 3454 18786
Ref1-Im2.tif
18514 2862 18820
Ref2-Im3.tif
7862 3455 7868
Ref2-Im4.tif
7856 3546 7876
Ref2-Im5.tif
7784 3350 7789
Ref2-Im6.tif
7968 3559 7976
Ref2-Im7.tif
7657 3245 7657
Ref2-Im8.tif
7456 3127 7472
Ref2-Im9.tif
7233 3273 7283
Ref2-Im10.tif
7468 3529 7477
The comparison of the proposed method with Huffman Encoding and RLHM coding in terms of MSE & PSNR is shown in Table 2(b).
Table 2 (b): C ompar ative R esults in ter ms of M SE & PSNR T he gr aphical compar ison of the proposed method with H uffman
E ncoding and R L H M coding in ter ms of compression R atio (C R ) is shown in F ig. 5.
Encoding Method File Name MSE PSNR
Golomb Rice Encoding
Im1.tif 28.639636 33.595124 Im2.tif 42.948235 31.835346 Im3.tif 28.234761 34.525627 Im4.tif 64.154267 29.535246 Im5.tif 48.725367 33.352566 Im6.tif 63.763782 28.562662 Im7.tif 52.377263 32.367457 Im8.tif 62.637263 28.536666 Im9.tif 43.635626 31.525625 Im10.tif 53.635526 35.526205
Huffman Coding
Im1.tif 74.658577 29.400007 Im2.tif 170.606866 25.810839 Im3.tif 92.426246 27.326635 Im4.tif 53.943453 23.762187 Im5.tif 74.637609 28.612736 Im6.tif 64.154267 25.712678 Im7.tif 48.725367 27.672321 Im8.tif 63.763782 21.672377 Im9.tif 52.377263 24.763278 Im10.tif 62.637263 25.712672
RLHM Coding
Im1.tif 74.658577 29.434002 Im2.tif 170.606866 25.844834 Im3.tif 92.427372 28.657574 Im4.tif 53.327678 23.546647 Im5.tif 74.732684 28.356577 Im6.tif 64.326478 25.765648 Im7.tif 48.322387 27.567475 Im8.tif 63.132891 22.676576 Im9.tif 52.873242 24.576437 Im10.tif 62.328974 25.654564
F ig. 5: C ompar ative analysis with exper imental results for different encoding scheme in ter ms of compression r atio (C R ).

Girish Gangwar, Maitreyee Dutta and Gaurav Gupta
Advances in Computer Science and Information Technology (ACSIT) Print ISSN: 2393-9907; Online ISSN: 2393-9915; Volume 2, Number 1; January-March, 2015
34
5. C ONC L USI ON
The research work in this thesis describes that the Golomb rice encoding method improves the compression ratio and maintains visual quality in case of shifted images to the other method like Huffman coding and Run length Huffman coding. The experimental results in this thesis validate the research work. According to the results calculated, the Golomb Rice coding method achieves better compression ratio up to 8.7 for test image (im2) as the size of difference vector reduces from 18514 to 2128 in this method , the values of MSE is 28.639636 and PSNR value is 33.595124 and for difference vector of test image im1 and the values of MSE is 42.948235and PSNR value is 31.835346 for test image im2 which is better than Huffman coding and Run length Huffman (RLHM) coding methods.
The Compression Ratio enhances the storage capacity and the MSE & PSNR values improve the visual quality of restored image.
6. A C K NOW L E DG M E NT
Authors would like to acknowledge their deep sense of gratitude to all those who supported us for their valuable guidance and for their constant support to carry out this work.
R E F E R E NC E S
[1] Rafael C.Gonzalez and Richards E. Woods, “Digital Image Processing”, Third Edition, pp 547-560, Pearson Education, Inc, 2009.
[2] T. Cebrail, S.K. Sarikoz, "An overview of Image Compression App Jain A. K.-"Fundamentals of Digital Image Processing", Prentice Hall, 1989. roaches", The 3rd International conference on Digital Telecommunications, IEEE 2008
[3] Rashmita Sahoo, Sangita Roy, Sheli Sinha Chaudhuri,” Haar Wavelet Transform Image Compression using Run Length Encoding”, proc. Of International Conference on Communication and Signal Processing,pp. 71-75,2014.
[4] Amritpal Singh, V.P. Singh, "An Enhanced Run Length Coding for JPEG Image Compression", international Journal of Computer Applications (0975-8887) Volume 72- No. 20, June 2013.
[5] T.Song and T. Shimamoto, “Reference Frame Data Compression Method for H.264/ABC”, IEICE Electronics Express, vol. 4, No. 3, pp. 121-126, 2007.
[6] J.L.Nu n ez ans S. Jones, “Run Lenth Coding Extensions for high performance Hardware Data Compression ”, IEEE proceedings-Computer digital techniques, vol. 50, No. 6, pp. 387-395, 2003.
[7] M. Norani and M. H. Tehranipour, “RL-Huffman encoding for test compresion and power reduction in scan application”, ACM Trans., USA, vol. 10, issue 1, pp. 91-115, 2005.
[8] R.S. Sunder, C. Eswaral and N. Shriram, “Performance evaluation of 3D Transform for medical image compression”, proc. Of IEEE International conference, Electro Information Technology, Lincoln, NE, vol 6, pp. 6, 2005.
[9] A. S. Arif, S. Mansor, R. Logeswaran and H. Abdul karim, “Lossless compression fluoroscopy medical images using correlation ”, Journal of Asian Scientific Research, vol. 11, No. 2, pp. 718-723, 2012.
[10] A. S. Arif, S. Mansor, R. Logeswaran and H. Abdul karim, “Lossless compression fluoroscopy medical images using correlation and the combination of runlenth and Huffman Coding”, Proc. Of IEEE International Coference on Biomedical Engineering and Science, pp. 759-762, 2012
[11] A. S. Arif, S. Mansor, R. Logeswaran and H. Abdul karim, “Lossless compression of pharynx and Esophagus in fluoroscopic medical images”, International Journal of bioscience , Biochemistry and Bioinformatics, vol. 3, No. 5, pp. 483-487, 2013.
[12] Golomb, S.W. (1966). , Run-length encodings. IEEE Transactions on Information Theory, IT--12(3):399--401
[13] Chin-Chen Chang , Yeu-Pong Lai, “An Enhancement of JPEG Still Image Compression with Adaptive Linear Regression and Golomb-Rice coding”, proc. of Ninth International Conference on Hybrid Intelligent Systems, pp. 35-40, 2009.
[14] Jun Takada, Shuji Senda, Hiroki Hihara, Masahiro Hamai, Takeshi Oshima, Shinji Hagino, Makoto Suzuki, Satoshi Ichikawa, “A Fast Progressive Lossless Image Compression Method for Space and Satellite Images” published in Geoscience and Remote Sensing Symposium, . IEEE International, pp. 479-481, 2007.
[15] Zoran H. Peric, Jelena R. Nikoli , Aleksandar V. Mosi , “Design of forward adaptive hybrid quantiser with Golomb–Rice code for compression of Gaussian source”, published in IET communications, 2014, vol. 8, issue 3, pp. 372-373.
[16] Jian-Jiun Ding, Hsin-Hui Chen, and Wei-Yi Wei, “Adaptive Golomb Code for Joint Geometrically Distributed Data and Its Application in Image Coding”, IEEE Transactions on Circuits & Systems for Video Technology, vol. 23, no. 4, April 2013, pp. 661-670.

Advances in Computer Science and Information Technology (ACSIT) Print ISSN: 2393-9907; Online ISSN: 2393-9915; Volume 2, Number 1; January-March, 2015 pp. 35-38 © Krishi Sanskriti Publications http://www.krishisanskriti.org/acsit.html
The Distributed Computing Paradigm: Cloud Computing
Prabha Sharma
CSE UIET, PUSSGRC Hoshiarpur E-mail: [email protected]
Abstract—The distributed computing system uses multiple computers to solve large-scale problems over the Internet. It becomes data-intensive and network-centric. In distributed computing, the main stress is on the large scale resource sharing and always goes for the best performance. In this article, we have reviewed the emerging area of distributed computing paradigm i.e. cloud computing. Keywords: Distributed Computing Paradigm, cloud computing, utility computing
1. INTRODUCTION
Distributed computing has been an essential component of scientific computing for decades. It consists of a set of processes that cooperate to achieve a common specific goal. computing.[29] The various paradigm of distributed computing has been shown below. The utility computing is basically the grid computing and the cloud computing which is the recent topic of research. This classification is well shown in the Figure 1.1.
Cloud computing is becoming main computing paradigm. The use of cloud computing has been increased exponentially. It has various characteristics and advantages of on-demand computing, shared infrastructure, pay-per-use model, scalability and elasticity. Cloud computing is also called as utility computing which deliver software, infrastructure, platform as a service in pay as you use model to the consumer [1][2]. There are many definitions for cloud computing.
According to National Institute of Standard and Technology(NIST) which is generally accepted standard, ”cloud computing is a model for enabling convenient, on demand, network access to a shared pool of configurable computing resources (such as networks, servers, storage, applications and services) that can be rapidly provisioned and released with minimum management efforts or service provider interaction”. Cloud service models include Saas, Paas, Iaas and deployment models include public, private, hybrid and community-shared infrastructure for specific community. Cloud computing is a kind of ; it has evolved by addressing the QoS (quality of service) and reliability problems. Cloud computing provides the tools and technologies to build data/compute intensive parallel applications with much more affordable prices compared to traditional parallel computing techniques.[9]
Cloud computing shares characteristics with:
Client–server model — Client–server computing refers broadly to any distributed application that distinguishes between service providers (servers) and service requestors (clients)[10]
Grid computing — "A form of distributed and parallel computing, whereby a 'super and virtual computer' is composed of a cluster of networked, loosely coupled computers acting in concert to perform very large tasks."
Mainframe computer — Powerful computers used mainly by large organizations for critical applications, typically bulk data processing such as: census; industry and consumer statistics; police and secret intelligence services; enterprise resource planning; and financial transaction processing.[11]
Utility computing — The "packaging of computing resources, such as computation and storage, as a metered service similar to a traditional public utility, such as electricity.[12][13]
Peer-to-peer — A distributed architecture without the need for central coordination. Participants are both suppliers and consumers of resources (in contrast to the traditional client–server model).

Prabha Sharma
Advances in Computer Science and Information Technology (ACSIT) Print ISSN: 2393-9907; Online ISSN: 2393-9915; Volume 2, Number 1; January-March, 2015
36
A few related term are mentioned here. A computing cluster consists of a collection of similar or identical machines that physically sit in the same computer room or building. Each machine in the cluster is a complete computer consisting of one or more CPUs, memory, disk drives, and network interfaces. The machines are networked together via one or more high-speed local area networks. Another important characteristic of a cluster is that it’s owned and operated by a single administrative entity such as a research center or a company. Finally, the software used to program and manage clusters should give users the illusion that they’re interacting with a single large computer when in reality the cluster may consist of hundreds or thousands of individual machines. Clusters are typically used for scientific or commercial applications that can be parallelized. Since clusters can be built out of commodity components, they are often less expensive to construct and operate than supercomputers .Although the term grid is sometimes used interchangeably with cluster, a computational grid takes a somewhat different approach to high performance computing. A grid typically consists of a collection of heterogeneous machines that are geographically distributed. As with a cluster, each machine is a complete computer, and the machines are connected via high-speed networks. Because a grid is geographically distributed, some of the machines are connected via wide-area networks that may have less bandwidth and/or higher latency than machines sitting in the same computer room. Another important distinction between a grid and a cluster is that the machines that constitute a grid may not all be owned by the same administrative entity. Consequently, grids typically provide services to authenticate and authorize users to access resources on a remote set of machines on the same grid. Because researchers in the physical sciences often use grids to collect, process, and disseminate data, grid software provides services to perform bulk transfers of large files between sites. Since a computation may involve moving data between sites and performing different computations on the data, grids usually provide mechanisms for managing long-running jobs across all of the machines in the grid.
2. CHARACTERISTICS: Cloud computing exhibits the following key characteristics:[30]
Agility improves with users' ability to re provision technological infrastructure resources.
Application programming interface (API) accessibility to software that enables machines to interact with cloud software in the same way that a traditional user interface (e.g., a computer desktop) facilitates interaction between humans and computers. Cloud computing systems typically use Representational State Transfer (REST)-based APIs.
Cost: cloud providers claim that computing costs reduce. A public-cloud delivery model converts capital expenditure to operational expenditure.[14] This purportedly lowers barriers to entry, as infrastructure is typically provided by a third party and does not need to be purchased for one-time or infrequent intensive computing tasks. Pricing on a utility computing basis is fine-grained, with usage-based options and fewer IT skills are required for implementation (in-house).[15] The e-FISCAL project's state-of-the-art repository[16] contains several articles looking into cost aspects in more detail, most of them concluding that costs savings depend on the type of activities supported and the type of infrastructure available in-house.
Device and location independence[17]enable users to access systems using a web browser regardless of their location or what device they use (e.g., PC, mobile phone). As infrastructure is off-site (typically provided by a third-party) and accessed via the Internet, users can connect from anywhere.
Virtualization technology allows sharing of servers and storage devices and increased utilization. Applications can be easily migrated from one physical server to another.
Multitenancy enables sharing of resources and costs across a large pool of users thus allowing for: centralization of infrastructure in locations with
lower costs (such as real estate, electricity, etc.) peak-load capacity increases (users need not
engineer for highest possible load-levels) utilisation and efficiency improvements for systems
that are often only 10–20% utilised.[18] Reliability improves with the use of multiple
redundant sites, which makes well-designed cloud computing suitable for business continuity and disaster recovery[19]
Scalability and elasticity via dynamic ("on-demand") provisioning of resources on a fine-grained, self-service basis in near real-time[20][21](Note, the VM startup time varies by VM type, location, os and cloud provider[51]), without users having to engineer for peak loads.[22][23][24]
Performance is monitored, and consistent and loosely coupled architectures are constructed using web services as the system interface[25][26]
Security can improve due to centralization of data, increased security-focused resources, etc., but concerns can persist about loss of control over certain sensitive data, and the lack of security for stored kernels.[27]Security is often as good as or better than other traditional systems, in part because providers are able to devote resources to solving security issues that many customers cannot afford to tackle.[28] However, the complexity of security is greatly

The Distributed Computing Paradigm: Cloud Computing 37
Advances in Computer Science and Information Technology (ACSIT) Print ISSN: 2393-9907; Online ISSN: 2393-9915; Volume 2, Number 1; January-March, 2015
increased when data is distributed over a wider area or over a greater number of devices, as well as in multi-tenant systems shared by unrelated users. In addition, user access to security audit logs may be difficult or impossible. Private cloud installations are in part motivated by users' desire to retain control over the infrastructure and avoid losing control of information security.
Maintenance of cloud computing applications is easier, because they do not need to be installed on each user's computer and can be accessed from different places.
There are many cloud vendors which offer their services upon some monitory cost. Cloud computing proved to be beneficial for enterprises [4]. Some of the big cloud infrastructure/service providers are Amazon [5], Salesforce [6], Google app engine [7] and Microsoft azure [8].
Various Cloud computing approaches use parallelism to improve the computational performance of applications. The Google MapReduce framework is particularly good at this so long as the problem fits the framework. Other approaches to high performance computing have similar constraints. It’s very important for developers to understand the underlying algorithms in their software and then match the algorithms to the right framework. If the software is single-threaded, it will not run faster on a cloud, or even on a single computer with multiple processing cores, unless the software is modified to take advantage of the additional processing power. Along these lines, some problems cannot be easily broken up into pieces that can run independently on many machines. Only with a good understanding of their application and various computing frameworks can developers make sensible design decisions and framework selections.
3. VARIOUS RESEARCH AREAS
Although much progress has already been made in cloud computing, there are a number of research areas that still need to be explored. Issues of security, reliability, and performance should be addressed to meet the specific requirements of different organizations, infrastructures, and functions.[29]
Security As different users store more of their own data in a cloud, being able to ensure that one user’s private data is not accessible to other users who are not authorized to see it becomes more important. While virtualization technology offers one approach for improving security, a more fine-grained approach would be useful for many applications.
Reliability As more users come to depend on the services offered by a cloud, reliability becomes increasingly important, especially for long-running or mission critical applications. A cloud
should be able to continue to run in the presence of hardware and software faults. Google has developed an approach that works well using commodity hardware and their own software. Other applications might require more stringent reliability that would be better served by a combination of more robust hardware and/or software-based fault-tolerance techniques.
Vulnerability to Attacks If a cloud is providing compute and storage services over the Internet such as the Amazon approach, security and reliability capabilities must be extended to deal with malicious attempts to access other users’ files and/or to deny service to legitimate users. Being able to prevent, detect, and recover from such attacks will become increasingly important as more people and organizations use cloud computing for critical applications.
Cluster Distribution Most of today’s approaches to cloud computing are built on clusters running in a single data center. Some organizations have multiple clusters in multiple data centers, but these clusters typically operate as isolated systems. A cloud software architecture that could make multiple geographically distributed clusters appear to users as a single large cloud would provide opportunities to share data and perform even more complex computations than possible today. Such a cloud, which would share many of the same characteristics as a grid, could be much easier to program, use, and manage than today’s grids.
Network Optimization Whether clouds consist of thousands of nodes in a computer room or hundreds of thousands of nodes across a continent, optimizing the underlying network to maximize cloud performance is critical. With the right kinds of routing algorithms and Layer 2 protocol optimizations, it may become possible for a network to adapt to the specific needs of the cloud application(s) running on it. If application level concepts such as locality of reference could be coupled with network-level concepts such as multicast or routing algorithms, clouds may be able to run applications substantially faster than they do today. By understanding how running cloud applications affects the underlying network, networks could be engineered to minimize or eliminate congestion and reduce latency that would degrade the performance of cloud-applications and non-cloud applications sharing the same network.
Interoperability Interoperability among different approaches to cloud computing is an equally important area to be studied. There are many cloud approaches being pursued right now and none of them are suitable for all applications. If every application were run on the most appropriate type of cloud, it would be useful to share data with other applications running on other types of clouds. Addressing this problem may require the

Prabha Sharma
Advances in Computer Science and Information Technology (ACSIT) Print ISSN: 2393-9907; Online ISSN: 2393-9915; Volume 2, Number 1; January-March, 2015
38
development of interoperability standards. While standards may not be critical during the early evolution of cloud computing, they will become increasingly important as the field matures.
4. APPLICATIONS
Even if all of these research areas could be addressed satisfactorily, one important challenge remains. No information technology will be useful unless it enables new applications, or dramatically improves the way existing applications are built or run. Although the effectiveness of cloud computing has already been demonstrated for some applications, more work should be done on identifying new classes of novel applications that can only be realized using cloud computing technology. With proper instrumentation of potential applications and the underlying cloud infrastructure, it should be possible to quantitatively evaluate how well these application classes perform in a cloud environment. Experimental software engineering research should be conducted to measure how easily new cloud-based applications can be constructed relative to non-cloud applications that perform similar functions. [29]
5. CONCLUSION
In this paper motivation and suggestions for additional research has been provided. As more experience is gained with cloud computing, the breadth and depth of cloud implementations and the range of application areas will continue to increase. Like other approaches to high performance computing, cloud computing is providing the technological underpinnings for new ways to collect, process, and store massive amounts of information. Based on ongoing research efforts, and the continuing advancements of computing and networking technology, cloud computing is poised to have a major impact on our society’s data centric commercial and scientific endeavors.
REFERENCES
[1] M. Armbrust, A. Fox, R. Griffith, A. D. Joseph, R. Katz, A. Konwinski, G. Lee, D. Patterson, A. Rabkin, I. Stoica, and M. Zaharia, “A view of cloud computing,” Communications of the ACM, vol. 53, pp. 50–58, April 2010. [Online]. Available:http://doi.acm.org/10.1145/1721654.1721672.
[2] M. Creeger, “Cloud computing: An overview,” ACM Queue, vol. 7, June 2009.
[3] Jericho Forum, “Cloud cube model: selecting cloud formations for secure collaboration,” Version 1.0, April, 2009, San Francisco CA, USA: The Open Group. [Online]. Retrieved(Aug.30,2011):http://www.opengroup.org/jerich o/cloud_cube_model_v1.0.pdf
[4] M. D. de Assuncao, A. di Costanzo, and R. Buyya, “Evaluating the cost benefit of using cloud computing to extend the capacity of clusters,” in Proceedings of the 18th International Symposium on High Performance Distributed Computing (HPDC ’09), Jun. 2009, pp. 141– 150.
[5] “Amazon elastic compute cloud,”http://aws.amazon.com/ec2/.
[6] “Salesforce’s force.com cloud computingarchitecture,”http://www.salesforce.com/platform/.
[7] “Google app engine,” https://appengine.google.com/.
[8] “Windows azure platform,”http://www.microsoft.com/windowsazure
[9] Distributed Application Architecture". Sun Microsystem. Retrieved 2009-06-16.
[10] Sun CTO: Cloud computing is like the mainframe".Itknowledgeexchange.techtarget.com. 2009-03-11. Retrieved 2010-08-22.
[11] It's probable that you've misunderstood 'Cloud Computing' until now". TechPluto. Retrieved 2010-09-14.
[12] Danielson, Krissi (2008-03-26). "Distinguishing Cloud Computing from Utility Computing". Ebizq.net. Retrieved 2010-08-22.
[13] Recession Is Good For Cloud Computing – Microsoft Agrees". CloudAve. Retrieved 2010-08-22.
[14] Defining 'Cloud Services' and "Cloud Computing"". IDC. 2008-09-23. Retrieved 2010-08-22.
[15] e-FISCAL project state of the art repository".
[16] Farber, Dan (2008-06-25). "The new geek chic: Data centers". CNET News. Retrieved 2010-08-22.
[17] He, Sijin; L. Guo, Y. Guo, M. Ghanem,. Improving Resource Utilisation in the Cloud Environment Using Multivariate Probabilistic Models. 2012 2012 IEEE 5th International Conference on Cloud Computing (CLOUD). pp. 574–581. doi:10.1109/CLOUD.2012.66. ISBN 978-1-4673-2892-0.
[18] King, Rachael (2008-08-04). "Cloud Computing: Small Companies Take Flight". Bloomberg BusinessWeek. Retrieved 2010-08-22.
[19] Mao, Ming; M. Humphrey (2012). "A Performance Study on the VM Startup Time in the Cloud". Proceedings of 2012 IEEE 5th International Conference on Cloud Computing (Cloud2012): 423. doi:10.1109/CLOUD.2012.103. ISBN 978-1-4673-2892-0.
[20] Dario Bruneo, Salvatore Distefano, Francesco Longo, Antonio Puliafito, Marco Scarpa: Workload-Based Software Rejuvenation in Cloud Systems. IEEE Trans. Computers 62(6): 1072-1085 (2013)[1]
[21] Defining and Measuring Cloud Elasticity". KIT Software Quality Departement. Retrieved 13 August 2011.
[22] Economies of Cloud Scale Infrastructure". Cloud Slam 2011. Retrieved 13 May 2011.
[23] He, Sijin; L. Guo; Y. Guo; C. Wu; M. Ghanem; R. Han. Elastic Application Container: A Lightweight Approach for Cloud Resource Provisioning. 2012 IEEE 26th International Conference on Advanced Information Networking and Applications (AINA). pp. 15–22. doi:10.1109/AINA.2012.74. ISBN 978-1-4673-0714-7.
[24] He, Qiang, et al. "Formulating Cost-Effective Monitoring Strategies for Service-based Systems." (2013): 1-1.
[25] A Self-adaptive hierarchical monitoring mechanism for Clouds Elsevier.com
[26] "Encrypted Storage and Key Management for the cloud". Cryptoclarity.com. 2009-07-30. Retrieved 2010-08-22.
[27] Mills, Elinor (2009-01-27). "Cloud computing security forecast: Clear skies". CNET News. Retrieved 2010-08-22.
[28] http://www.nsa.gov/research/tnw/tnw174/articles/pdfs/TNW_17_4_Web.pdf
[29] http://en.wikipedia.org

Advances in Computer Science and Information Technology (ACSIT) Print ISSN: 2393-9907; Online ISSN: 2393-9915; Volume 2, Number 1; January-March, 2015 pp. 39-42 © Krishi Sanskriti Publications http://www.krishisanskriti.org/acsit.html
Data Quality and the Performance of the Data Mining Tools
Mrs. Rekha Arun1 and J. Jebamalar Tamilselvi2 1Research Scholar, Sathyabama University, Chennai
2Research Supervisor, Sathyabama University, Chennai
Abstract—This investigation focuses on the impact of data quality on the performance of data mining tools used at national research institutes of northern India. Performance criteria namely: Computational Performance, Functionality, Usability and Ancillary Task Support were considered for the study. Regression models were developed from the data collected with the help of a suitable and tested questionnaire. The analysis revealed that ‘Computational Performance’ is significantly affected by the completeness of data, while ‘Functionality’ is mainly affected by the consistency of data. Validity of data has an affect on the ‘Usability’ of the tool. Consistency of data and completeness of data have significant impact on ‘Ancillary task support of the tool’ with consistency having greater influence than completeness. Thus it is concluded that data quality has vital impact on the performance of the data mining tools. Keywords: Data mining, Data quality, Computational performance, Functionality, Usability, Ancillary task support
1. INTRODUCTION
Majority of research and business organizations are moving towards data mining and data warehousing now a days. This technology switching requires integration of data collected over long periods of time and through multiple generations of database technology. Researchers typically utilize diverse information from multiple database support planning of experiments or analysis and interpretation of results. This assimilation of data from diverse schemas and data sources may cause low quality data. Four sources of error are observed in bioinformatics databases.
1. Attribute level–incorrect values of individual field, the cause may be errors in original data submitted or from automated systems for record processing.
2. Record Level–conflicts between or misplacement of fields within a record
3. Single Source Database Level–Conflicting or duplicate entry.
4. Multi Source Database Level–imperfect data integration and source synchronization.
High quality data or clean data are essential to almost any information system that requires accurate analysis of large amount of real world data. To improve the quality of data, four
essential tasks are suggested by DOD (Department of Defence) as
a) Define scope problem, identify objectives, identify and review Documentation, Develop quality metrics.
b) Measure Apply organization metrics, Flag suspect data.
c) Analyze Indentify conformance issues, Provide recommendations, Prioritize conformance issues, Validate conformance issues.
d) Improve Select improvement opportunities, Implement improvements, Document improved quality, Update organizations standards.
The data mining tools bring together techniques from machine learning, pattern recognition, statistics databases, and visualization to address the issue of information extraction from large data bases.
2. IMPACT OF DATA QUALITY ON PERFORMANCE OF DATA MINING TOOL
Impact of data quality on the performance of data mining tools can be analyzed by investigating four categories of criteria namely Computational Performance, Functionality, Usability, and Ancillary task support as suggested by Collier et al. (1999). The data quality attributes are adopted from the guidelines provided by the Department of Defence which comprise ‘ Validity’, ‘Timeliness’, ‘Consistency’, ‘Completeness’, ‘Uniqueness’, and ‘Accuracy’. Regression models were developed to study the impact of data quality on data mining tool for the four performance criteria.
Computational Performance of Data Mining Tool
Computational performance is the tool’s ability to handle a variety of data sources in an efficient manner i.e. to easily handle data under a variety of circumstances rather than on performance variables that are driven by hardware configurations and/or inherent algorithmic characteristics. The regression model for the same is given table 2

Mrs. Rekha Arun and J. Jebamalar Tamilselvi
Advances in Computer Science and Information Technology (ACSIT) Print ISSN: 2393-9907; Online ISSN: 2393-9915; Volume 2, Number 1; January-March, 2015
40
Impact of Data Quality on Computational Performance of Data Mining Tool
Model R R square Adjusted R
Square Std. Error of the Estimate
1 .490a .240 .222 .503
ANOVA b
Model Sum of squares
DF Mean Square F Sig.
Regression 3.437 1 3.437 13.589 .001a Residual 10.874 43 .253
Total 14.311 44
Coefficients a
Unstandardized coefficients Standardized Coefficients B Std. error Beta
(constant) .827 .162 5.109 .000 Completeness .253 .069 .490 3.686 .001
Excluded Variables b
Model Beta Ins
T Sig. Partial
Correlation
CollinearityStatistics Tolerance
Accuracy .007a .043 .966 .007 .715 Consistenc
y -.054a -.367 .715 -.057 .848
Timeliness .183a 1.223 .228 .185 .781 Uniqueness .008a .049 .961 .008 .710
Validity .010a .066 .948 .101 .866
a) Predictors, completeness b) Dependents variable : Computational Performance This table represents the regression model, it can be analyzed that the impact of the data quality on computational performance of a data mining tool is 24 percent. Rest of the performance is affected by other factors. The F value is 13.589 significant at 0.01 level. From the coefficients table it can be analyzed that data quality attribute significant at 0.01 level and t-value of COMP is 3.686 significant at .010 level. Excluded variables table represents the variables having significant value greater than 0.05 and are thus excluded from the regression equation and do not majorly affect the computational performance of data mining tool.
Functionality of Data Mining Tool:
Software functionality helps access how well the tool will adapt to different data mining problem domains. It is the inclusion of a variety of capabilities, techniques and methodologies for data mining. Results of the multiple regression analysis are made available in table 3 the value of R square is .417 which is significant at level 0.01. This indicates that the quality of data slightly affects the functionality of a data mining tool. Data quality attribute ‘Consistency of Data’ explains the 41.70 rest of the variance is affected by some other factors
Impact of Data Quality on Computational Performance of Data Mining Tool
Model R R square Adjusted R
Square
Std. Error of Estimate
1 .646a .417 .404 .811
ANOVA b Model Sum of
squares
DF Mean
Square
F Sig.
Regression 20.277 1 20.277 30.8
09
.000a
Residual 28.301 43 .658
Total 48.578 44
Coefficients a
Unstandardized coefficients Standardized Coefficients B Std. error Beta (constant) -1.546 .796 -1.942 .059 Consistency .978 .176 .646 5.551 .000
Excluded Variables b
Model Beta Ins T Sig. Partial Correlation
Collinearity Statistics Tolerance
Accuracy .113a .644 .523 .099 .447 Completeness .159a 1.263 .213 .191 .848 Timeliness -.106a -.816 .419 -.125 .813 Uniqueness .114a .890 .379 .136 .836
a) Predictors in the model : (constant), Consistency b) Dependents variable : Functionality
Usability of Data Mining Tool
Usability refers to the quality, how easy a tool is to learn and use i.e. accommodation with different levels and types of users without loss of functionality or usefulness. Multiple regression is used to analyze the impact of data quality on ‘Usability’ of data mining tool and is illustrated in table 4
Impact of Data Quality on Computational Performance of Data Mining Tool
Model R R square Adjusted R Square
Std. Error of the Estimate
1 .431a .186 .167 .742
ANOVA b
Model Sum of squares
DF Mean
Square F Sig.
Regression 5.418 1 5.418 9.834 .003a Residual 23.693 43 .551 Total 29.111 44

Data Quality and the Performance of the Data Mining Tools 41
Advances in Computer Science and Information Technology (ACSIT) Print ISSN: 2393-9907; Online ISSN: 2393-9915; Volume 2, Number 1; January-March, 2015
Coefficients a
Unstandardized coefficients Standardized Coefficients B Std. error Beta 1 (constant) .957 .836 1.145 .259 Validity .554 .177 .431 3.136 .003
Excluded Variables b
Model Beta Ins
T Sig. Partial
Correlation
CollinearityStatistics Tolerance
Accuracy .142a .842 .405 .129 .671 Completeness .074a .499 .621 .077 .866 Consistency .066a .338 .737 .052 .510 Timeliness -.001a -.005 .996 -.001 .862 Uniqueness -.009a -.057 .955 -.009 .863
The result of multiple regression exhibited in table 4 indicate that the impact of data quality attributes on the ‘usability’ of the data mining tool is 18.6 percent. The F-value is 9.834 which is significant at 0.01 levels. A variable ‘validity of date’ is significance affecting the usability and having t-value 3.136 at 0.01 level of significance. Excluded variable table list the variable with significant greater than 0.05.
Ancillary task support of data mining tool
Ancillary task support allows the user to perform the variety of data cleansing, manipulation, transformation, visualization and other tasks that support data mining. Theses task include data selection, cleansing, enrichment, value substation, data filtering, binning of continuous data, generating derived variables, randomization, deleting records, etc.
Impact of data quality on Ancillary task support of data mining tool
Model R R square Adjusted R square
Std. Error of the estimate
1 .481a .231 .231 .624 2 .555b .308 .275 .599
ANOVA a
Model Sum of square
Df Mean square
F Sig.
1regression 5.037 1 5.037 12.937 .001a Residual 16.741 43 .389 Total 21.778 44 2regrssion 6.704 2 3.352 9.339 .000b Residual 15.074 42 .359
Coefficients a
B Std. error
Beta T sig
1(constant) 2.045 .612 3.339 .002 Consistency .487 .136 .481 3.597 .001 2(constant) 2.175 .591 3.608 .001
Consistency .369 .141 .364 2.611 .012 completeness .191 .089 .300 2.155 .037
Excluded variables b
Model Beta In t Sig. Partial correlation
Collinearity statistics Tolerance
Accuracy .203a 1.015 .316 .155 .447 Completeness .300a 2.155 .037 .316 .848 Timliness -.009a -.058 .954 -.009 .813 uniqueness .046b .310 .758 .048 .836 validity .151a .806 .425 .123 .510 2accuracy .046b .218 .829 .034 .376 timeliness -.115b -.898 .374 -.139 .707 uniqueness -.115 -.724 .473 -.112 .665 validity .099b .539 .593 .84 .500
a. predictors in the model(constant),consistency b. predictors in the model:(constant),consistency,
completeness c. dependent variable: ancillary task support
From the regression model given in the bove table 5 the value of R square is .308 which is significant at level 0.01 this indicates that the quality of data significantly affects the ancillary task support of a data mining tool data quality attributes ‘consistency of data” and ‘completeness of data’ together explain the 30.8percent of the variance (R square ) in the ancillary task support of the data mining software rest of variance is affected by some other factors consistency of data has and completeness of data are significant at 0.01level.the beta value indicates the relative influence of the entered variables, that is, ’completeness of data’(beta=0.300).this can be analysis that the rest of the factors do not significantly contribute and are kept in excluded variable list
3. CONCLUSION
From the above analysis it can be observed the data quality has vital impact on the performance of data mining tool at research list organizations
a) Computational performance of the data mining tool is significantly affected by the ‘completeness of data’.
b) Data quality attribute ‘consistency of data’ majorly affects the functionality of the data mining software .reset the variance is affected by some other factors
c) Validity of data has been affect on the usability of data mining tool
d) Two data quality attributes ‘consistency of data’ and ‘completeness of data’ have impact and ancillary task support of data mining tool, where consistency has greater influence than completeness.
Consequently, data for the research must be collected are measured keeping in mind the six attributes of data quality since they have great impact on the performance of data

Mrs. Rekha Arun and J. Jebamalar Tamilselvi
Advances in Computer Science and Information Technology (ACSIT) Print ISSN: 2393-9907; Online ISSN: 2393-9915; Volume 2, Number 1; January-March, 2015
42
mining tools. The study has been carried for the research institutes related to health in Rajasthan and Gujarat including the two institutes.
REFERENCES
[1] Yi-Ping Phoebe Chen(Ed.) 2005. Bio informatics Technologies, Springer–Verlag Berlin Heidelberg, Chapter 3: Dtata ware housing in Bioinformatics, Judice L Y Koh and Valdimir Brusic.
[2] C.Sumithradevi, M.Punithavalli 2009, “Detecting Redundancy in Biological Databases–An efficient Approach”, Global Journal of Computer Science and Technology, Page 141-45 Vol 9, No.4
[3] DOD Data Administration Guidelines 2003, DOD guidelines on data quality management.
[4] V.Ganti, J.Gherke, and R.Ramakrishnan 2001. “DEMON: Mining and Monitoring Evolving Data”, IEEE Transactions on Knowledge Management and Data Engineering, Vol.13, No.1, pp.50-62.
[5] J.Hipp, U.Guntzer, and U.Grimmer 2001. “Data Quality Mining”, Workshop on Research Issues in Data Mining and Knowledge Discovery.
[6] D.Luebbers, U.Grimmer, and M.Jarke 2003. “Systematic Development of Data Mining–Based Data Quality Tools”, Proceedings of the 29th VLDB Conference, Berlin, Germany.
[7] M.Ge, and M.Helfert 2007. “A review of information quality research–develop a research agenda”, in The International Conference of Information Quality, Cambridge, Massachusetts, USA.

Advances in Computer Science and Information Technology (ACSIT) Print ISSN: 2393-9907; Online ISSN: 2393-9915; Volume 2, Number 1; January-March, 2015 pp. 43-47 © Krishi Sanskriti Publications http://www.krishisanskriti.org/acsit.html
Secure Message Transmission with Watermarking using Image Processing
Shivi Garg1 and Manoj Kumar2 1M.Tech Scholar, Delhi Technological University Delhi
2Delhi Technological University Delhi E-mail: [email protected], [email protected]
Abstract—This paper presents a system that allows the users to securely transfer the messages by hiding them in the digital images. To accommodate the messages the original cover image is slightly modified by the embedding algorithm to obtain the stego image. The system uses the scheme of watermarking along with the concepts of Image processing. Here 1-bit information is hidden in the pixels of an image. On changing this image by some image attributes like inverting, gray scale, contrast, brightness, cropping, resizing and color filtering by varied degree in the pixels of an image, the proposed system tries to compare the percentage matching in the watermark so that a proper threshold can be set to detect the presence of a watermark.
1. INTRODUCTION
Techniques for hiding information have existed since ancient times. Earlier methods include communication via invisible inks, covert channels, microdots, and spread spectrum channels.[1] Invisible ink is invisible either on application or soon thereafter, and which later on can be made visible by some means. Invisible ink is applied to a writing surface with specialty purpose stylus, stamp, fountain pen, toothpick, calligraphy pen or even a finger dipped in the liquid. Microdots are, fundamentally, a steganographic approach to message protection. A microdot is text or an image substantially reduced in size onto a small disc to prevent detection by unintended recipients. Various techniques explored by the authors involved embedding information within digital media, specifically digital images. Data can be hidden in image files by manipulating color values of the pixel. Another digital media other than images, which can be used for steganography are video files. AVI files are created out of couple streams. Because of existence of those streams, it is possible to hide data not only in file's frames but also in mentioned audio stream.
2. DIGITAL WATERMARKING TECHNIQUE
A watermarking algorithm embeds watermark in different kinds of data like image, text, audio, video etc. The embedding process is done by using a private key which maps the locations within the multimedia object (image) where the
watermark would be embedded. Once the watermark is embedded, several attacks can happen because the online object can be digitally processed. The attacks are unintentional. Hence the watermark has to be very robust against all attacks which are possible. When the owner wants to check the watermarks in the attacked and damage multimedia object, she/he depends on the private key that was used to embed the watermark. Using the secrete key, the embedded watermark can be detected. This detected watermark may or may not combine the original watermark because the image might have been attacked. Hence to validate the existence of watermark, the original data is used to compare and extract the watermark signal (non-blind watermarking) or a correlation method is used to detect the strength of the watermark signal from the extracted watermark (blind watermarking). In the correlation, detected watermark from the original data is compared with the extracted watermark.
3. PROPOSED SYSTEM
This System extends the concept of watermarking in the field of image processing[2]. This system tries to hide 1 bit information in the pixels of an image. On changing this image by some image attributes like inverting, gray scale, contrast, brightness, cropping, resizing and color filtering by varied degree in the pixels of an image, system tries to compare percentage matching in the watermark so that a proper threshold can be set to detect the presence of a watermark[3].
4. EMBEDDING ALGORITHM i. In this an image is taken for which (x, y) pixel pairs are
obtained. Secret key is concatenated with the pixel pair. ii. Compute the hash of the concatenated bit pattern.
iii. Compute the mod with the shifting parameter ‘α’. This will give the position for the pixels.
iv. If the mod result is 0, then compute the position of the LSB bit by taking the mod with the position parameter ‘β’.

Shivi Garg and Manoj Kumar
Advances in Computer Science and Information Technology (ACSIT) Print ISSN: 2393-9907; Online ISSN: 2393-9915; Volume 2, Number 1; January-March, 2015
44
v. Change the 0 bit to 1 bit and count the number of pixels changed.
vi. Change the image by modifying the pixels by 10 %, 20% or by applying different image processing methods like contrast, color filter and match the number of pixels with the changed pixels.
vii. If the matched pixel is greater than the set threshold, then the watermark is detected else rejected.
Fig. 1: Flowchart of proposed scheme
5. RESULTS AND ANALYSIS
5.1. Invert an Image
It simply inverts a bitmap, meaning that each pixel value is subtracted from 255. The Invert command inverts all the pixel colors and brightness values in the current layer, as if the image were converted into a negative. Dark areas become bright and bright areas become dark. Hues are replaced by their complementary colors[4].
(a) original image (b) inverted image Fig. 5.1 (a) Original image (b) inverted image
Table 5.1: Percentage matching for the inverted image
5.2. Gray Scale
Gray scale filtering is in reference to the color mode of a particular image. A gray scale image would be a black and white image; any other color would not be included in it. Basically, it's a black and white image; the colors in that image, if any, will be converted to the corresponding shade of
gray (mid tones between black and white) thus making each bit of the image still differentiable[5].
(a). Original image (b) Gray image Fig. 5.2 (a) Original image (b) Gray image
Table 5.2: Percentage matching for the Gray image
5.3. Contrast (values between -100 and 100)
Contrast refers to the amount of color or gray scale differentiation that exists between various image features in digital images. Images having a higher contrast level generally display a greater degree of color or gray scale variation than those of lower contrast[6].
Table 5.3: Percentage matching for the Contrast image
Images with positive contrast values: As the contrast value increases, the percentage matching of the pixels is reduced. Images with the positive contrast value is shown in the Fig. 5.3(i).
Fig. 5.3(i): Positive Contrast Image: (a) Contrast +10 (b)
Contrast +20 (c) Contrast +30 (d) Contrast +40 (e) Contrast +50 (f) Contrast +60 (g) Contrast +70
Images with negative contrast values: As the contrast value is reduced, the pixel matching shows an absurd behavior of up

Secure Message Transmission with Watermarking using Image Processing 45
Advances in Computer Science and Information Technology (ACSIT) Print ISSN: 2393-9907; Online ISSN: 2393-9915; Volume 2, Number 1; January-March, 2015
and down values. Images with the negative contrast is shown in the Fig. 5.3(ii).
Fig. 5.3(ii): Negative Contrast Image:(a) Contrast-10 (b) Contrast -20 (c) Contrast -30 (d) Contrast -40 (e) Contrast -50 (f)
Contrast -60 (g) Contrast -70
5.4. Brightness (values between -255 and 255)
Brightness refers to the overall lightness or darkness of the image. The Brightness filter adds a value to each pixel, and if we go over 255 or below 0 the value is adjusted accordingly and so the difference between pixels that have been moved to a boundary is discarded. Doing a Brightness filter of 100, and then of -100 will not result in the original image - we will lose contrast. The reason for that is that the values are clamped[7].
Table 5.4: Percentage matching for the Brightness value of an image
Image results with positive brightness are shown in the Fig. 4(i).
Fig. 5.4(i): Image Brightness Positive: (a) Brightness +25 (b)
Brightness +50 (c) Brightness +75 (d) Brightness +100 (e) Brightness +125 (f) Brightness +150 (g) Brightness +175 (h)
Brightness +200 (i) Brightness +225
Image results with negative brightness shown as in Fig. 5.4(ii).
Fig. 5.4(ii): Image Brightness Negative: (a) Brightness -25 (b)
Brightness -50 (c) Brightness -75 (d) Brightness -100 (e) Brightness -125 (f) Brightness -150 (g) Brightness -175 (h)
Brightness -200 (i) Brightness -225
5.5. Gamma (values between 0.2 and 5 for RGB)
A gamma filter works by creating an array of 256 values called a gamma ramp for each value of the red, blue and green components [8]. The gamma value must be between 0.2 and 5.
The formula for calculating the gamma ramp is
255 * (i / 255)1/gamma + 0.5.
If this value is greater than 255, then it is clamped to 255. It is possible to have a different gamma value for each of the 3 color components. Then for each pixel in the image, we can substitute the value in this array for the original value of that component at that pixel.
Table 5.5: percentage matching for the Gamma filtered image
Image results for the Gamma filter as shown in the below Fig. 5.5
Fig. 5.5: Gamma Filter: (a) Gamma 0.2 (b) Gamma 0.5 (c)
Gamma 0.8(d) Gamma 1 (e) Gamma 3 (f) Gamma 5

Shivi Garg and Manoj Kumar
Advances in Computer Science and Information Technology (ACSIT) Print ISSN: 2393-9907; Online ISSN: 2393-9915; Volume 2, Number 1; January-March, 2015
46
5.6. Color Filter
Color filters are sometimes classified according to their type of spectral absorption: short-wavelength pass, long-wavelength pass, or band-pass; diffuse or sharp-cutting; monochromatic or conversion. The short-wavelength pass transmits all wavelengths up to the specified one and then absorbs. The long-wavelength pass is the opposite. Every filter is a band-pass filter when considered generally [9].
It just adds or subtracts a value to each color. The most useful thing to do with this filter is to set two colors to -255 in order to strip them and see one color component of an image. For example, for red filter, keep the red component as it is and just subtract 255 from the green component and blue component.
Table 5.6: Percentage matching for the Color Filtered image
Image results
Fig. 5.6: Color Filter:
(a) RED Filter (b) GREEN Filter (c) BLUE Filter
5.7. Resize an Image
When image is resized, total number of the pixels are reduced.
Original image Dimensions: 202 X 202
Table 5.7: Percentage matching for the Resized image
Image results: As the image size reduces, the pixels matching will reduce because bit information is lost will resizing it to a smaller dimension. Image results are shown as in Fig. 5.7.
Fig. 5.7: Resize Image: (a) 10 X 10 (b) 30 X 30 (c) 50 X 50 (d) 70 X 70 (e) 90 X 90 (f) 110 X 110 (g) 130 X 130 (h) 150 X 150 (i) 170
X 170(j) 190 X 190 (k) 200 X 200
5.8. Crop an Image
When image is cropped, some material from the edges is trimmed to show a smaller area.
Table 5.8: percentage matching for the cropped image
As the cropping area increases, the percentage matching in the pixels reduces the large amount of pixels are modified resulting in the loss of bit information thereby difficult to detect the watermark.
Image Results are shown in the Fig. 5.8 given below:
Fig. 5.8: Cropped Image: (a) (10, 10) (b) (30, 30) (c) (40, 40) (d) (50, 50) (e) (70, 70) (f) (100, 100) (g) (120, 120) (h) (150, 150)

Secure Message Transmission with Watermarking using Image Processing 47
Advances in Computer Science and Information Technology (ACSIT) Print ISSN: 2393-9907; Online ISSN: 2393-9915; Volume 2, Number 1; January-March, 2015
6. CONCLUSION
The proposed scheme is robust to all the attacks .In this 1-bit information is hidden in an image based on the position parameter ‘α’ and hiding parameter ‘β’. ’α’ gives the row of the pixel where this bit information is hidden. And ‘β’ gives the last four LSB bits where this bit is to be hidden. Then this image is modified resulting the change in the pixel value. Then percentage of matching pixels is calculated and based on that a threshold can be set in the future.
REFERENCES
[1] Information Hiding: Steganography and Watermarking - Attacks and Countermeasures Neil F. Johnson, Zoran Duric, Sushil Jajodia, 3rd Edition, Kluwer Academic Publisher, 2003.
[2] Sangeet Saha, Chandrajit pal, Rourab paul, Satyabrata Maity, Suman Sau A brief experience on journey through hardware developments for image processing and it’s applications on Cryptography University Of Calcutta, Kolkata, India.
[3] Feng Bao, Robert H. Deng, Beng Chin Ooi, Yanjiang Yang, Tailored Reversible Watermarking Schemes for Authentication of Electronic Clinical Atlas, National University of Singapore.
[4] docs.gimp.org/en/gimp-layer-invert.html, webpage. [5] www.codeproject.com/Articles/33838/Gray/Image-Processing-using-C. [6] www.codeproject.com/Articles/33838/Contrast/Image-Processing-using-
C. [7] www.codeproject.com/Articles/33838/Brightness/Image-Processing-
using-C. [8] www.smokycogs.com/blog/image-processing-in-c-sharp-adjusting-the-
gamma. [9] www.workspaces.codeproject.com/saleth-prakash/image-processing-
using-matrices-in-csharp.

Advances in Computer Science and Information Technology (ACSIT) Print ISSN: 2393-9907; Online ISSN: 2393-9915; Volume 2, Number 1; January-March, 2015 pp. 48-52 © Krishi Sanskriti Publications http://www.krishisanskriti.org/acsit.html
Risks Involved in E-banking and their Management Syed Masaid Zaman1 and Qamar Parvez Rana2
1Department of Engineering & Technology Shrivenkateshwara University Gajraula, Amroha (UP) India-244236
2Course Director CCNA Jamia Hamdard (Hamdard University) New Delhi–110062, India E-mail: [email protected], [email protected]
Abstract—The wide development of the Internet technology is creating the opportunity for organizations to extensively utilize computer systems for the delivery of services. The emergence of new business models which rely on electronic payment systems, creating a new threat and vulnerability which leads to risk. This paper deals with the formal classification of attacks and vulnerabilities that affect current internet banking systems. In recent years the number of malicious applications which are used to target online banking transactions has increased dramatically. This represents a challenge not only to the customers who uses electronic payment systems, but also to the organizations which provide these facilities to their customers. This paper makes an attempt to explore empirically the details of E-Banking. In this study different types of risks have been indicated and therefore vulnerabilities and mitigation methods have been suggested to solve those risks in E-Banking. Modern security management methods now acknowledge that most risks cannot be completely eliminated and that they need to be managed in a cost effective manner. This paper will focus on the development of a methodology for the assessment and analysis of threat and vulnerabilities within the context of a security risk management. Keywords: risk management, vulnerabilities, mitigation methods, E-banking.
1. INTRODUCTION
E-banking or internet banking is the term that signifies and encompasses the entire sphere of technology initiatives that have taken place in the banking industry. As the name suggests E-banking, E stands for electronic and banking is the term which we all know, it means that it involves the electronic technology. The means of technology used in E-banking are electronic channels which includes telephone, mobile phones, internet etc. which are used for delivery of banking services and products. The concept and scope of electronic banking (e-banking) is still in the transitional stage. E-banking has broken all the barriers of branch banking. In this modern world of technology most of the banking happens while you are sipping coffee or taking an important call. Electronic banking services like ATMs are available at your doorsteps. Banking services are accessible round the clock for all the seven days of the week. This tremendous change happens only due to advent of IT. Due to the adoption of IT in banking services, banks today operate in a highly globalized, liberalized, privatized and a
competitive environment. E-banking means that any user can get connected to his/her bank’s website to perform any of the virtual banking transaction with a personal computer or mobile phone. Currently there is a clear need of efficient security models to banks which offer online access to their banking systems. E-banking services reduce the gap between the difficulties in customer understanding of the banking transactions and their participation in improving the sophistication of these services. E-banking leads to having a competitive advantage in the different levels.
2. TYPES OF ATTACKS AND RISKS IN E-BANKING
There are main four types of attacks in e-banking which are as under:
Online line attacks Local attacks Remote attacks Hybrid attacks.
Types of online Attacks Due to the advent of IT all things became easy on one side. On the other side the risk of online attacks also increases. Now Banks and service providers need to provide security against various types of online attacks. The object of an attack may vary. Attackers may try to exploit know Vulnerabilities in particular operating systems. They also may try repeatedly to make an unauthorized entry into a Web site during a short time frame thus denying service to other customers. We can categorize the attacks into three main groups:
3. LOCAL ATTACKS
Every common user always made mistakes by believing that their online banking session is perfectly safe when they use an SSL (Secure Sockets Layer) connection by third-party users. Security experts continually state that everything is safe if there is a yellow padlock symbol in the browser window. This is true, but the user realizes that SSL was designed to secure the channel from the user machine to the bank computer and not the end points themselves. Whatever is done with the data before the start point and after the end point of the SSL

Risks Involved in E-banking and their Management 49
Advances in Computer Science and Information Technology (ACSIT) Print ISSN: 2393-9907; Online ISSN: 2393-9915; Volume 2, Number 1; January-March, 2015
channel is completely out of the SSL encryption context. The Trojan drops a dynamic link library (DLL) and registers its CLSID as a browser helper object in the registry. Thus the Trojan is able to intercept any information that is entered into a web page before it is encrypted by SSL and sent out. This functionality can also be performed by injecting the Trojan directly into the web browser’s memory space, which can often bypass desktop firewalls while making outgoing connections. Other local attack methods include monitoring all network traffic, running a layered service provider (LSP), writing its own network driver, or displaying a carefully developed duplicate copy of a website on top of the official website. The user believes that the opened Web site is the real bank site. The URL in the address bar is not spoofed and even the yellow SSL padlock reveals the correct certificate details, if any user should ever take the time to verify it. Only the overlaid fake password prompt is not part of the original web site and of malicious intent. For better security use of non-static user credentials a user name and a static password are simply no longer enough to protect online banking sessions. Some companies are already responded to these threats by introducing dynamic passwords including RSA secured ID tokens or one-time passwords on paper lists called transaction umbers (TAN).
4. REMOTE ATTACKS
Phishing An e-mail is sent to the user by attacker. Usually, these e-mails claim to come from a legitimate organization such as a bank or online retailer. The e-mail requests the user to update or to verify his/her personal and financial information which includes date of birth, credit card numbers, login information, account details and PINs etc. The e-mail which is sent to the user contains a link that takes him/her to a spoof (duplicate) website that looks identical (or very similar) to the organization’s genuine site. The attacker can then capture personal data such as passwords and other financial details. By clicking on the link provided by the attacker may also download malware onto your computer. By the malware your future use of the internet may be recorded and forward to the attacker. The attackers will then use this information to attack bank accounts, credit cards etc. of the users.
Pharming After phishing started a “ph-fashion” another slightly advanced technique appears that is pharming. It is same as by phishing (stealing PINs, Passwords, Credit card numbers etc). Attacker creates false websites in the hope that people will visit them by mistake. Users can sometimes do this by mistyping a website address – or sometimes a attacker can redirect traffic from a genuine website to their own. The 'pharmer' or attacker will then try to obtain your personal details when you enter them into the false website.
Malware attacks Short form of 'malicious software', this is designed to access your computer system without your consent. The term covers a variety of interfering software/programs which includes viruses, worms, Trojan horses and spyware. Attackers try to send the malware through attachments and try to trap you by sending false emails with attachments suggesting you to update your account information.
Voice-over-IP VoIP (voice over IP) is an IP telephony term for a set of facilities used to manage the delivery of voice information over the Internet. Voice over IP involves Sending voice information in digital form in discrete packets rather than by using the traditional circuit-committed protocols of the public switched telephone network. Major advantage of VoIP and Internet telephony is that, it avoids the tolls charged by ordinary telephone service.
Traditionally the phone service has been a trustworthy source. With caller ID the number can be traced easily. Phreaking and other attacks were possible but they were quite difficult and specialized. With the advent of voice-over-IP and gateways from IP telephony to the public switched telephone network associating a number with a real person has become a whole lot harder. There can be a much more convoluted trail between a VoIP connection and a real person and caller ID is easily spoofed by an attacker.
Vishing It is another word for VoIP Phishing which involves a party calling you faking a trustworthy organization (e.g. your bank). It is an attempt by attackers to take confidential details from you Details like user id, login & transaction password, Unique registration number(URN), One time password (OTP), Card PIN, Grid card values, CVV or any personal parameters such as date of birth, mother's maiden name etc. over a phone call.
Man-in-the-middle attacks This type of attacks was before the computers. This type of attack happens when an attackers inserting themselves in between two parties communicating with each other. These attacks are essentially eavesdropping attacks. VoIP is particularly vulnerable to man-in-the-middle attacks. In t h e s e a t t a c k s the attacker intercepts call-signaling, Session Initiation Protocol (SIP) message traffic and masquerades as the called party to the calling party, or vice versa. Once the attacker has acquired this position, he/she can hijack calls via a redirection server.
Automated answering systems Most of the companies including banks are using the automated answering and menu system. On the other hand these types of machines are also used by the attackers to crack the customer’s accounts. Combined with VoIP and war-

Syed Masaid Zaman and Qamar Parvez Rana
Advances in Computer Science and Information Technology (ACSIT) Print ISSN: 2393-9907; Online ISSN: 2393-9915; Volume 2, Number 1; January-March, 2015
50
dialing techniques an attacker can automatically try hundreds of numbers and use an automated system exactly the systems which are using banks, solicits details like credit card numbers in the name of ease of use or security. If any candidate victim has responded to the automated system only once, attackers need to involve a human to interact with the customer. This type of attack is both scalable and affordable.
Keystroke capturing/logging Anything you type on a computer can be captured and stored. This can be done by using a hardware device attached to your computer or by software running almost invisibly on the machine. Keystroke logging is often used by attackers to capture personal details including passwords. Some viruses are even capable of installing such software without the user's knowledge. The risk of encountering keystroke logging is greater on computers shared by a number of users. An updated antivirus software program and firewall can help you to remove the harmful software before it can be used.
5. HYBRID ATTACKS
Attacks on online banking are increasingly complex; hybrid and cross channel attacks are the newest ways of committing fraud. For the attacker the most successful methods are hybrid attacks that combine strategies from both local and remote attacks. A trivial attack would be if a Trojan executed on the infected machine checked all saved bookmarks for known valuable online services and replaced the URL with a fake one, similar to phishing emails. The obvious flaw in this plan is that the user can see the modified URL if they check the address bar of the browser. So the browser setting needs to be modified y Trojan to not display the address bar or overlay it with a fake pop-up window. Even though this is feasible, because it resides on the same level as basic phishing attacks and can be equally done by remote attacks. The more sophisticated approach of the attacker would be to use all the power they have on the infected machine and altering the hosts file is an obvious place to start. The hosts file gives the possibility to the attacker to redirect certain domains to predefined IP addresses. This technique is used by the Trojan.
Some other types of attacks are: Sniffers: Also known as network monitors, this is
software used to capture keystrokes from a particular PC. This software could capture login ID’s and passwords.
Guessing Passwords: Using software to test all possible combinations to gain entry into a network.
Brute force (also known as brute force cracking): It is a trial and error method used by application programs to decode encrypted data such as passwords or Data Encryption Standard (DES) keys, through exhaustive effort (using brute force) rather than employing intellectual strategies.
Random Dialing: This technique is used to dial every number of a known bank telephone exchange. The
objective of dialing all the numbers is to find a modem connected to the network and can be used as a point of attack.
Social Engineering: An attacker calls the bank’s help desk impersonating an authorized user to gain information about the system including changing passwords.
Trojan horse: A programmer can embed code into a system that will allow the programmer or another person unauthorized entrance into the system or network.
Hijacking: Intercepting transmissions then attempting to deduce information from them. Internet traffic is particularly vulnerable to this threat.
6. TYPES OF RISKS
Credit risk This is the risk to earnings or capital from a customer's failure to meet his financial obligations. Electronic banking enables customers to apply for credit from anywhere in the world. If banks will intend to offer credit through the internet, it is extremely difficult for them to verify the identity of the customer. Verifying collateral and perfect security agreements are also difficult.
Strategic risk The strategic risk is defined as a risk related to the possibility of negative financial consequences caused by erroneous decisions, decisions made on the basis of an inappropriate assessment or failure to make correct decisions relating to the direction of the Bank’s strategic development. Many senior managers may not fully understand the strategic and technical aspects of Internet banking. With the advent of the technology the competition increases at rapid rate, now need to introduce or expand Internet banking without an adequate cost benefit analysis. The resources and structure of organization may not be able to manage Internet banking.
Transaction risk Transaction risk or Operational risk is the risk of direct or indirect loss resulting from inadequate or failed internal processes by people and systems or from external events. The main factors of transaction risk involve Inadequate Information Systems, Breaches in internal controls, Fraud, Processing Errors, Unforeseen catastrophes. A high level of transaction risk may occur with Internet banking products if they are not adequately planned, implemented, and monitored by the banks. Banks offering financial products and services through the Internet must be able to meet their customer’s expectations. Customers who conduct business over the Internet are likely to have little tolerance for errors or omissions from financial institutions that do not have sophisticated internal controls to manage their Internet banking business.

Risks Involved in E-banking and their Management 51
Advances in Computer Science and Information Technology (ACSIT) Print ISSN: 2393-9907; Online ISSN: 2393-9915; Volume 2, Number 1; January-March, 2015
Information security risk This is the risk to earnings and capital arising out of slack (lax) information security processes by which institutions are exposed to malicious hacker or insider attacks, denial-of-service attacks, viruses, data theft, data destruction and fraud. The rapid change of technology and the fact that the Internet channel is accessible universally makes this risk especially critical.
Liquidity risk The uncertainty arising from a bank’s inability to meet its obligations when they are due, without incurring unacceptable losses is known as liquidity risk. It also includes the inability to manage unplanned changes in market conditions affecting the ability of the bank to liquidate assets quickly and with minimal loss in value. Electronic banking or Internet banking increases deposit volatility from customers who maintain accounts solely on the basis of rates or terms. The management must therefore be prepared for immediate changes and consequently immediate solutions.
Compliance risk Compliance risk is the current and prospective risk to earnings or capital arising by violation of laws, prescribed practices, rules, regulations, internal policies, and procedures or ethical standards. This risk also arises in situations where the laws or rules governing certain bank products or activities of the Bank’s clients may be uncertain or untested. This risk may lead the institution to fine, civil money penalties, payment of damages and the voiding of contracts. Compliance risk can expose to diminished reputation, reduced franchise value, reduced expansion potential, inability to enforce contracts and limited business opportunities. Banks need to understand and interpret existing laws as they apply to Internet banking and ensure consistency with other channels such as branch banking.
Foreign exchange risk Foreign exchange risk is the risk of negative effects on the financial result and capital of the bank caused by changes in exchange rates. This arises when assets in one currency are funded by liabilities in another. Internet banking or electronic banking may encourage residents of other countries to transact in their domestic currencies. Internet banking may also lead customers to take speculative positions in various currencies with the ease and lower cost of transacting. Foreign exchange risk increases in higher holdings and transactions in nondomestic currencies.
Interest rate risk This risk is arising from movements in interest rates (e.g. interest rate differentials between assets and liabilities and how these are impacted by interest rate changes) to earnings or capital. By internet banking a large pool of customers can be attracted towards loans and deposits. Also, given that it is easy to compare rates across banks. Pressure of interest rates is
higher, so the banks need to react quickly to the changing interest rates in the market.
This risk is arising from negative public opinion and it is current and prospective risk to earnings and capital. The reputation of banks may be damaged by poor internet banking services (e.g., limited availability, software with bugs, poor response). Customers are less forgiving of any problem and thus there are more stringent performance expectations from the Internet channel. Hypertext links can make a link between bank’s sites to other sites and may reflect an implicit endorsement of the other sites.
7. MITIGATION MEASURES
Payments effected through alternate payment products/channels are becoming popular among the customers with more and more banks providing such facilities to their customers. While the move of providing the e-banking facilities to the customers the banks indeed promotes and encourages the usage of electronic payments, it is important that the banks ensure that transactions made through such channels are safe and secure and not easily amenable to fraudulent usage. Cyber-attacks are becoming more unpredictable and electronic payment systems becoming vulnerable to new types of misuse. So, what can banks and financial institutions do to protect their customers from the impact of man-in-the-browser attacks? The authentication measures of the customers fall short in this scenario, so instead financial institutions can mitigate their risk by gaining a better understanding of the activity occurring within the online banking session to determine. A layered approach to online banking fraud monitoring – one that analyzes the login event, the outgoing transaction and risky sequences of events – best positions a financial institution to minimize online banking fraud. All customer interactions can be categorized into event classes that incorporate both monetary and non-monetary actions. These are as follows:
Payment events—Financial transactions such as bill payment and funds transfers
Login events—IP address and session ID profiling. Password events—Changes in logon passwords. Profile events—Changes to customer demographic
information (e.g., addresses). Payee events—Changes to external payee account details. Navigation events—Changes to how a customer navigates
an online internet portal. In isolation, one of these events may not indicate fraudulent activity. When combined, however, they predict strong patterns of criminal intent.
A new industry with a rich variety of vendors came into existence and became a global industry for electronic security. Many types of companies operate in this industry. These companies are involved in every facet of securing the wide

Syed Masaid Zaman and Qamar Parvez Rana
Advances in Computer Science and Information Technology (ACSIT) Print ISSN: 2393-9907; Online ISSN: 2393-9915; Volume 2, Number 1; January-March, 2015
52
area networks over which financial services are provided. Following is a brief description of the major categories of vendors. Companies involved with active content monitoring and filtering produce tools that examine for potentially destructive content material entering a network. The tools provided by the vendors are used to monitor all content entering a network for malicious codes, such as harmful attributes. The methods like Trojans, worms and viruses are used to deploy an attack once the perpetrator enters the system. Viruses are set of instructions or programs that infect other programs on the same system by replicating themselves. Virus scanners which are also known as utility software’s are critical in mitigating these attacks. Vendors of virus scanners provide those utility software’s that scans and cleans networks and is periodically updated.
Intrusion Detection Systems Vendors Companies that produce network intrusion detection systems provide products to monitor network traffic and alert the systems administrator with an alarm when someone is attempting to gain unauthorized access.
Firewall Vendors A firewall is a network security system that controls incoming and outgoing network traffic based on a set of rules. Firewall is a virtual “security guard” provided by the vendors at the entrance of the customer’s facilities. A firewall is a system that implements the access-control policy between two networks. These virtual security guards are created by the vendors to protect a network’s integrity.
Penetration Testing Companies Pentest a short form of penetration test is an attack on a computer system with the intention of finding security weaknesses, potentially gaining access to it. Penetration testing companies simulate attacks on networks to test for a system’s inherent weaknesses. They then provide the security to attacks found during the simulation. Vulnerability-based scanning tools provide a current snapshot of a system’s vulnerabilities.
Cryptographic Communications Vendors Vendors who supply this product enable the client company to protect its communications with an encryption envelope. Encryption is a technique which uses complex algorithms to shield messages transmitted over public channels. It provides safe passage to data from source to destination. At the destination the message is decrypted using another algorithm. It is highly recommended for use by mobile workforces and/or large non centralized corporations or institutions.
8. CONCLUSION
The knowledge of the real role of IS in banks would help IS managers in managing information systems by judging the business needs of the IS projects, associated risks, importance
and ranking of IS managers in organizational hierarchy, need for innovation and flexibility in IS planning approach, etc. The security models currently used in internet banking systems are strongly based on user identification and authentication methods which are also the components where most Internet banking system vulnerabilities are found. Most of the attacks directed at online banking systems target the user focusing on obtaining authentication and identification information through the use of social engineering and compromising the user's Internet banking access device in order to install malware which automatically performs banking transactions, apart from obtaining authenticated data. By this fact it is indicated that banks should provide security mechanism which should be as user independent as possible. Mitigating the risk of user related information’s leaks and security issues affecting the system and leads to fraud.
REFERENCES
[1] Lucas, H C (1994). Information Systems Concepts for Management,San Francisco: McGraw-Hill.
[2] Kulkarni, P G (1997). "Trends and Effectiveness of IT in Banking Sector," in Kanungo, Shivraj (ed.), Information Technology at Work—A Collection of Managerial Experiences, New Delhi: Hindustan Publishing Corporation
[3] HALLER, N. A One-Time Password System (RFC 2289). Internet Engineering Task Force. [S.l.].1998
[4] CAVUSOGLU, Hasan e Cavusoglu, Huseyin. Emerging Issues in Responsible Vulnerability Disclosure. Workshop on Information Technology and Systems (WITS 2004). Barcelona, Spain, 2004.
[5] Threats to online Banking published by virus bulletin, July 2005
[6] O. Dandash, P. Dung Le, and B. Srinivasan, Internet banking payment protocol with fraud prevention, 2007
[7] www.researchmanuscripts.com/isociety2012/6
[8] Abha Singh “E-banking” Edition 2012
[9] 22nd International Symposium on Computer and Information Sciences, Nov. 2013.
[10] www.ijaiem.org/volume2Issue3/IJAIEM-2013-03-15

Advances in Computer Science and Information Technology (ACSIT) Print ISSN: 2393-9907; Online ISSN: 2393-9915; Volume 2, Number 1; January-March, 2015 pp. 53-55 © Krishi Sanskriti Publications http://www.krishisanskriti.org/acsit.html
Towards a Hybrid System with Cellular Automata and Data Mining for Forecasting Severe Weather
Patterns Pokkuluri Kiran Sree1 and SSSN Usha Devi N2
1Sree Vishnu Engineering College for Women Bhimavaram 2University College of Engineering, JNTUK Kakinada
E-mail: [email protected], [email protected]
Abstract—Early detection of possible occurrences of severe convective events would be useful in order to avoid, or at least mitigate, the environmental and socio-economic damages caused by such events. In this project, we investigate the use of data mining techniques strengthened with cellular automata in forecasting maximum temperature, rainfall, evaporation and wind speed arriving at a hybrid system. The proposed classifier considers six neighborhood Cellular Automata (CA), which was implemented efficiently by a modified CLONAL classifier for accurate weather prediction. 6CAMCC classifier together with the standard data mining techniques will certainly improve the performance of the hybrid system. The performance of the proposed algorithms has shown 6.4% improvement when compared using standard performance metrics and the algorithms for predicting the temperature, rainfall, evaporation and wind individually.
1. INTRODUCTION
Climate Forecasting involves foreseeing how the current situation with the air will change. Present climate conditions are acquired by ground perceptions, perception from satellites, ships, flying machine, floats, blow ups and climate stations covering the whole planet. This incorporates data from over the seas, from the surface (ships and floats), from high in the climate (satellites) and underneath the seas (a system of extraordinary buoys called Argo).creating conjectures is a complex procedure which is continually being overhauled. Climate gauges made for 12 and 24 hours are regularly very precise. Gauges made for two and three days are normally great. In any case past around five days, estimate precision tumbles off quickly. The rate of information era and capacity far surpasses the rate of information investigations. This speaks to lost open doors regarding exploratory bits of knowledge not picked up and effects or adjustment methods not satisfactorily educated. While there is a developed writing in atmosphere insights and scattered applications of information mining, orderly endeavors in atmosphere information mining need. Numerous specialists have attempted to utilize information mining innovations as a part of regions identified with meteorology and climate forecast.
2. REVIEW OF WEATHER FORECASTING
Decision trees: Decision trees models are generally utilized as a part of information mining to look at the information and to incite the tree and its decides that will be utilized to make expectations. Various diverse calculations may be utilized for building choice trees including CHAID (Chi-squared Automatic Interaction Detection), CART (Classification And Regression Trees), Quest, and C5.0. A choice tree is a tree in which each one limb hub speaks to a decision between various choices, and each one leaf hub speaks to a choice. Contingent upon the calculation, every hub may have two or more extensions. For instance, CART creates trees with just two limbs at every hub. Such a tree is known as a double tree. At the point when more than two limbs are permitted this is known as a multiway tree . Fluffy Logic: Fuzzy Logic is a basic yet effective critical thinking strategy with far reaching materialness. It is presently utilized as a part of the fields of business, frameworks control, hardware and activity designing.
The Rule Base: The standard base is a situated of principles of the If-Then structure. The If segment of a principle alludes to the level of enrollment in one of the fluffy sets. The Then partition alludes to the result, or the related framework yield fluffy set. For instance, one standard could be expressed: If (dry & unsaturated & drying & excessively light & overcast) Then (low likelihood of mist) the following step is to determine a framework yield, a likelihood of haze development, from the relevant standards. Note that few sets of guidelines above have the same result, or framework yield. The estimation of the yield is allotted the estimation of the "most genuine", or strongest, tenet.
3. CELLULAR AUTOMATA & DESIGN
A cell robot (CA) comprises of a standard framework (grid) of cells (automata), each of which can be in one of a limited

Pokkuluri Kiran Sree and SSSN Usha Devi N
Advances in Computer Science and Information Technology (ACSIT) Print ISSN: 2393-9907; Online ISSN: 2393-9915; Volume 2, Number 1; January-March, 2015
54
number of states. At discrete time steps, all cells all the while upgrade their states relying upon their current state and those of their prompt neighbors (i.e., contingent upon the nearby neighborhood setup of each one cell). For this upgrade step, all cells utilize the same deterministic redesign standard, which records the new cell states for every conceivable neighborhood setup. This overhaul procedure is then rehashed ("iterated") for a specific number of time steps.
Cell Automata (CA) are scientific models of decentralized spatially expanded frameworks. They comprise of countless basic individual units, or "cells", which are joined just by regional standards, without the presence of a focal control in the framework. Each one cell is a straightforward limited robot that over and again upgrades its own particular state, where the new cell state relies on upon the cell's present state and those of its prompt (neighborhood) neighbors. Be that as it may, notwithstanding the constrained usefulness of every individual cell, and the cooperations being confined to neighborhood neighbors just, the framework overall is fit for delivering many-sided examples, and even of performing confounded processings. In that sense, they structure an option model of reckoning, one in which data handling is carried out in an appropriated and exceedingly parallel way. Due to these properties, CA have been utilized widely to study complex frameworks in nature, for example, liquid stream in physical science or example development in science, additionally to study data transforming (reckoning) in decentralized spatially amplified frameworks (common or manufactured). Here, we will give a concise outline of the distinctive courses in which calculations could be possible with cell automata.
The data sets are collects from NCDC (National Climatic Data Center). The inputs are processed with set of 6CAMCC. Six neighborhood is taken into consideration.
This section explains the steps involved in modified CLONAL algorithm in brief. 1. Generate initial antibody population (AIS-MACA rules)
randomly and call it as Ab. It consists of two subsets of memory population Abm and reservoir population Abr.
2. Construct a set of Antigens population call it as Ag (DNA Sequence with Class/ Input).
3. Select an antigen Agj , from Ag the antigen population. 4. Expose every member of the antibody population to the
selected antigen Agj , Check whether it is predicting the correct class or not and calculate affinity of the rule with the antigen via fitness equations .
5. Select m highest affinity antibodies (AIS-MACA rules) from Ab and place them in Pm.
6. Generate clones for each antibody, which will be proportional to the affinity as per the equation . Place the clones in the new population Pi.
7. Apply mutation to the newly formed population Pi where the degree is inversely proportional to their affinity as per equation . This produces a more mature population Pi
*.
8. Recalculate the affinity of the rule with the corresponding antigen as in step 4. Order the antibodies in descending order. ( high fitness antibody will be on the top)
9. Compare the antibodies from Pi* with the antibodies
population from Abm. Select the better fitness rules and remove them from Pi* and place them in Abm.
10. Randomly generate antibodies for introducing diversity.
Compare the antibodies in Abr , the left out antibodies in Pi
* and randomly generate antibodies. Select the better fitness rules among three antibody sets and place them in Abr.
11. For every generation compare the antibodies in Abm and Abr and place the best in Abm.
12. The output of the classifier is set of rules in Abm (solution set).
Fig. 1: Design of the Weather Forecast System
4. CAMCC RESULTS & DISCUSSION
Fig. 2: GDP per year
The gross domestic product is taken from the statistics of USA. We have done examinations to assess both the MCS following strategy and the information mining methodology proposed in the paper. Firstly, we contrasted our MCS following methodology and the zone covering following technique proposed by Arnaud The physically ''master eyescanning'' strategy is additionally embraced as an execution benchmark of test results. Figure3 represents the exploratory results and correlations of the above routines. As demonstrated in Fig. 2,3 MCS no. measures the quantity of effectively followed Mcss; Error Rate measures the rate of slip in following, which is processed by utilizing the MCS no. as

Towards a Hybrid System with Cellular Automata and Data Mining for Forecasting Severe Weather Patterns 55
Advances in Computer Science and Information Technology (ACSIT) Print ISSN: 2393-9907; Online ISSN: 2393-9915; Volume 2, Number 1; January-March, 2015
numerator and the followed MCS no. of ''master eye-filtering'' system as denominator. This has demonstrated that the cloud following precision of our system makes an normal of 17% improvement over the following strategy proposed by Arnaud et al., and is close to the following precision of meteorologists. To take after on, the MCS information mining methodology is then tried on MCS following results. There are, altogether, 320 qualified Mcss that have been followed and described for information mining, among which 50 Mcss have moved out of the Tibetan Plateau (1051e): among them, 37 Mcss to ''E'', 9 Mcss to ""NE"" and 4 Mcss to ''SE''. A sum of 70% of the recognized MCS structures, that is, 224 Mcss, was utilized as train examples and the staying 30% was kept for testing. A gathering of deduction standards are produced and a situated of natural, physical model charts are plotted. records the ensuing choice guidelines of the C4.5 choice tree calculation used to arrange the evolvement patterns and moving trajectories of the Mcss moving out of the Tibetan Plateau at 500 hpa level. After the pruning process, the quantity of misclassifications on the experiments is 5 out of 96 Mcss and the mistake rate is 5.2%.
Fig. 3: Forecast on the Out High Temperature
5. CONCLUSION
We have successfully developed a preliminary system for predicting severe weather patterns. The performance of the proposed algorithms has shown 6.4% improvement when compared using standard performance metrics and the algorithms for predicting the temperature, rainfall, evaporation and wind individually. The accuracy of the classifier is due to good training algorithm with 6neighbour CAMCC.
REFERENCES
[1] Pokkuluri Kiran Sree et al, Investigating an Artificial Immune System to Strengthen the Protein Structure Prediction and Protein Coding Region Identification using Cellular Automata Classifier. International Journal of Bioinformatics Research and Applications ,Vol 5,Number 6,pp 647-662, ISSN : 1744-5493. (2009) (
[2] Pokkuluri Kiran Sree et al, Identification of Promoter Region in Genomic DNA Using Cellular Automata Based Text Clustering. The
International Arab Journal of Information Technology (IAJIT),Volume 7,No 1,2010,pp 75-78.
[3] Pokkuluri Kiran Sree et al, A Fast Multiple Attractor Cellular Automata with Modified Clonal Classifier for Coding Region Prediction in Human Genome, Journal of Bioinformatics and Intelligent Control, Vol. 3, 2014, pp 1-6.
[4] Pokkuluri Kiran Sree et al, A Fast Multiple Attractor Cellular Automata with Modified Clonal Classifier Promoter Region Prediction in Eukaryotes.Journal of Bioinformatics and Intelligent Control, Vol. 3, 1–6, 2014.
[5] Pokkuluri Kiran Sree et al, 5.MACA-MCC-DA: A Fast MACA with Modified Clonal Classifier P romoter Region Prediction in Drosophila and Arabidopsis. European Journal of Biotechnology and Bioscience, 1 (6), 2014, pp 22-26,
[6] Pokkuluri Kiran Sree et al, Cellular Automata in Splice Site Prediction. European Journal of Biotechnology and Bioscience, 1 (6), 2014, pp 36-39
[7] Pokkuluri Kiran Sree et al, AIX-MACA-Y Multiple Attractor Cellular Automata Based Clonal Classifier for Promoter and Protein Coding Region Prediction. Journal of Bioinformatics and Intelligent Control 3, no. 1 (2014): 23-30.
[8] Pokkuluri Kiran Sree et al, PSMACA: An Automated Protein Structure Prediction Using MACA (Multiple Attractor Cellular Automata). Journal of Bioinformatics and Intelligent Control 2, no. 3 (2013): 211-215.
[9] Pokkuluri Kiran Sree et al, An extensive report on Cellular Automata based Artificial Immune System for strengthening Automated Protein Prediction. Advances in Biomedical Engineering Research (ABER) Volume 1 Issue 3, September 2013, pp 45-51.
[10] Pokkuluri Kiran Sree et al, A Novel Protein Coding Region Identifying Tool using Cellular Automata Classifier with Trust-Region Method and Parallel Scan Algorithm (NPCRITCACA). International Journal of Biotechnology & Biochemistry (IJBB) Volume 4, 177-189 Number 2 (December 2008).(Eight Years Old Journal) Listed in Indian Science Abstracts, ISSN: 0019-6339,Volume 45, Number 22, November 2009.
[11] Pokkuluri Kiran Sree et al, HMACA: Towards proposing Cellular Automata based tool for protein coding, promoter region identification and protein structure prediction. International Journal of Research in Computer Applications & Information Technology, Volume 1 Number 1, pp 26-31,2013.
[12] Pokkuluri Kiran Sree et al, PRMACA: A Promoter Region identification using Multiple Attractor Cellular Automata (MACA) in the proceedings CT and Critical Infrastructure: Proceedings of the 48th Annual Convention of Computer Society of India- Vol I Advances in Intelligent Systems and Computing Volume 248, 2014, pp 393-399.
[13] Pokkuluri Kiran Sree et al, Towards Proposing an Artificial Immune System for strengthening PSMACA: An Automated Protein Structure Prediction using Multiple Attractor Cellular Automata proceedings of International Conference on Advances in electrical, electronics, mechanical and Computer Science(ICAEEMCS)-2013, ISBN: 978-93-81693-66-04 on September 2nd2013, Hyderabad.
[14] Pokkuluri Kiran Sree et al, Multiple Attractor Cellular Automata (MACA) for Addressing Major Problems in Bioinformatics in Review of Bioinformatics and Biometrics (RBB) Volume 2 Issue 3, September 2013, pp70-76.
[15] Pokkuluri Kiran Sree et al, Protein coding region Identification ,in proceedings of 2nd International Conference on Proteomics Bioinformatics, July 2-4, 2012 Embassy Suites Las Vegas, USA “,( Special Issue of Journal of Proteomics & Bioinformatics. (USA), Volume 5 Issue 6–123, ISSN:0974-276X,H
[16] Pokkuluri Kiran Sree et al, Hybrid Attractor Cellular Automata for Addressing Major Problems in Bioinformatics in Research and Reviews: Journal of Engineering and Technology, Volume 2 Issue 4, October-2013,pp 42-48.

Advances in Computer Science and Information Technology (ACSIT) Print ISSN: 2393-9907; Online ISSN: 2393-9915; Volume 2, Number 1; January-March, 2015 pp. 57-60 © Krishi Sanskriti Publications http://www.krishisanskriti.org/acsit.html
A Survey of Software Project Management Tool Analysis
Alka Srivastava
Student ,CDAC,Noida ; Computer Science and Engg. Master of Technology Center for Development of AdvanceComputing, Noida
E-mail: alka. rkgit@gmail. com
Abstract—Paper provides in depth review of software project management tool and literature ,its benefits and drawbacks. A lot of work has been done on software project management tool in order to improve estimation accuracy None of them gives 100% accuracy but proper use of them makes estimation process smoother and easier. Organizations should automate estimation procedures, customize available tools and calibrate estimation approaches as per their requirements. Software estimation has always been an active research area. Accurate software estimation is desirable in any software project, not only to properly schedule budget, resources, time and cost and avoid overrun but also to reasonably estimate as software organizations with better estimates and planning will be able to get the projects in bidding
1. INTRODUCTION
Software engineering is the discipline which paves the roadmap for development of software within given schedule and effort and with the desired quality. The process begins with estimating the size, effort and time required for the development of the software and ends with the product and other work products built in different phases of development. The tools available for automating some of the activities are great help in the whole development process. However these tools isolate the process of estimation, planning & tracking and calibration. Various software project management tools are based on estimation, planning & tracking and calibrations. The problems being faced in the software developments are cost overrun, schedule overrun and quality degradation.
2. BACKGROUND
Methodologies are used in software project management tools for estimation of project
Estimation methodologies:[5]
i. Analogy method ii. top down method iii. Bottom up method
i. Analogy method
In analogy approach the project to be estimated is compared with the already completed projects of that type if exists. The historical data of previously completed projects helps in the estimation. However it works only when previous data is available. Needs systematically maintained database.
ii. Top down method
Top down approach requires less functional and non-functional requirements and is concerned with the overall characteristics of the system to be developed. This estimation is quite abstract at the start and accuracy improves step by step. It can underestimate the cost of solving difficult low-level technical components. However top down approach takes into account integration, configuration management and documentation costs.
iii. Bottom up method
This method does estimation of each and every individual component and combines all components to give the overall, complete estimation of project. This approach can be an accurate method if the system has been designed in detail. However bottom up method can underestimate the cost of system level activities such as integration and documentation.
3. ESTIMATION TECHNIQUES:[5]
Various techniques are used in software project management tools to caters the estimation procedure
i. Parametric Approach
ii. Heuristic Approach All of the heuristic techniques are “soft” in that no model based estimation is used. There are many techniques that come under parametric as well as heuristic approaches. Few are elaborated.

Alka Srivastava
Advances in Computer Science and Information Technology (ACSIT) Print ISSN: 2393-9907; Online ISSN: 2393-9915; Volume 2, Number 1; January-March, 2015
58
i. Parametric Approaches:
LOC. Direct software size can be measured in terms of LOC (Lines of code), one of the oldest techniques. This measure was first proposed when programs were typed on cards with one line per card. Its disadvantage is that accuracy of LOC is highly dependent on the software completion and before that only expert judgment estimates.
Function Points Metrics. In FPA an estimated count is taken against Number of external inputs, outputs, Number of external inquiries, interface files, Number of internallogical files. For each domain value a low, medium orhigh weight is chosen. Besides the above mentioned domain values, fourteen complexity factors like Back up and recovery, Data Communication etc are given certain values as per software requirement and final estimate is calculated. Function points are simple to understand, easy to count, require little effort and practice. It is independent of the technology, methodology used. Function Point is mostly used than LOC and at times more accurate than LOC, however it is abstract, difficult to automate and not a direct software size measure rather related to the functionality of a system. FP is very subjective. They depend on the estimator. FPA does not assign due importance to processing complexity. None of the FP or LOC is an ideal metric for all types of projects. FP is suitable for MIS applications.
COCOMO and COCOMO-II: Constructive Cost Model (COCOMO) was first proposed by Barry W. Boehm An empirical well-documented, independent model not tied to a specific software vendor, based on project experience is quite popular for software cost and effort estimation. The most fundamental calculation in the COCOMO model is the use of Effort Equation to estimate the number of Person-Months required to develop a project.
Effort= Ax (SIZE)B
Where A is proportionality constant and B represents economy. B depends on the development mode. The estimate of a project's size is in SLOC.
To get the respective results COCOMO takes LOC. COCOMO- II takes LOC, Function or Use Case points as software size input. COCOMO model is provided for three operational modes: 1. Organic. Applied in projects that have a small,
experienced development team developing applications in a familiar environment.
2. Semi-detached. Semi-detached mode is for projects somewhere in between.
3. Embedded. Embedded mode should be applied to large projects, especially when the project is unfamiliar or there are severe time constraints
ii. Heuristic Approach
Expert Judgment Method. Expert judgment is done based on experience either just by a project manager or by a team of experts involved in the project. Process iterates until some consensus is reached. It works well in situations where no historical data is available. For estimation accuracy industry data can be used as a reference. Very small growing organization often makes use of this technique, however irrespective of the size or maturity of a software house, expert judgment is the wildly used method in the Industry. Several variations are adopted under expert estimation like it can be done in a group of experts of different domains belonging to the same or different projects.
Thumbs Rule. Thumbs rule is subjective in nature. Decision is taken based on personal interests, a biggest disadvantage of this method.
Delphi Technique. In Delphi technique a coordinator plays a central role. In this technique no direct interaction is there among the experts. Coordinator takes input from all the experts individually, complies the result and continues the process un-till same and balanced feedback is captured.
Wide Band Delphi Technique. Wide band Delphi Technique was introduced at Rand Corporation. Later refined by Barry Boehm. The technique can help you estimate, plan and schedule almost anything. In wide band Delphi method a one to one interaction is there among the group members (experts) as opposite to Delphi technique. Here the conflicts if any are resolved face to face till a mutual agreed decision point is reached. Lots of overhead involves (time, team involvement, planning) for relatively small sets of tasks. How ever its strength lies in iterative, team based and collaborative meeting.
It is comprised of 6 steps: 1. Planning 2. Kickoff meeting 3. Individual preparation 4. Estimation meeting 5. Assembling tasks 6. Reviewing results & iteration
4. COMPARATIVE STUDY OF SOFTWARE PROJECT MANAGEMENT TOOL:
An overview of some of the tools studied in this paper. The tools studied are CoStar 7. 0 developed by SoftStar Systems, Construx Estimate 2. 0 developed by Construx Software Builders, COCOMO II. 1999. 0 developed by University of Southern California ,SLIM-ESTIMATE suite developed by Quality Software Management and Open Proj tool developed by Serena Software.

A Survey of Software Project Management Tool Analysis 59
Advances in Computer Science and Information Technology (ACSIT) Print ISSN: 2393-9907; Online ISSN: 2393-9915; Volume 2, Number 1; January-March, 2015
CoStar:[2]
Costar is a software estimation tool based on COCOMO II. The tool is useful for generating estimates for size, effort, time duration and staffing level. This tool can generate reports for all the phases of development lifecycle, for the cost drivers, reports for schedule etc.
Costar 7. 0 runs under Windows 95, Windows 98, Windows NT 4, Windows 2000, and Windows XP. CoStar is a complete estimation tool and does not have any feature for management. It comes with its own calibrator called Calico which uses multiple regression method for calibration or the USC calibration tool can be use for its calibration.
The report generated by the tool includes estimated information only like the estimated size of a component, estimated time required in each phase, schedule estimates etc. CoStar is a perfect example of isolation of estimation process and management process in currently available tools. For calibration, CoStar does not store any past project data. Past projects’ data needs to be feed in its calibrator i. e. Calico. Regression method needs a larger number of past projects’ data for getting an accurate estimate, feeding which manually is a tiresome task. CoStar does not provide any facility for any kind of project tracking.
Construx Estimate:[1]
Construx Estimate is also a software estimation tool based on COCOMO II. The tool provides the user with 10 project types and subtypes, according to which the tool decides which COCOMO model should be used for estimation. Some of the project types are business system, control system, internet systems, real time systems(embedded and avionics) etc. It also has 10 phases of development for calculating the estimates accurately according to the phase. It also provides feature for adjusting the priority for schedule and effort. The outputs (estimates) are displayed in both the graphical form and in the text format.
Similar to CoStar, Construx Estimate is also a pure estimation tool without any feature for project management. Project tracking is also missing in the tool. Report is generated for the projects but with the estimates only not with the current status of the projects.
5. COCOMO II 1999. 0:[4]
This is a tool developed in University of Southern California comprises of estimation and calibration. It provides user with the facility to estimate size using three methods; function point analysis, source lines of code or adaptation source lines of code. It also provides the feature for estimating for the maintenance phase. The best feature of the tool is its flexibility
that a user can even change the parameters’ values used in the equation directly.
The tool does not have any management or tracking facilities but in calibration it can import data from any source file or the data stored in the tool of the earlier project (in this case still actual size and effort needs manual entry). The calibration method used in the tool is again multiple regression method which has its own drawbacks. The tool does not generate any kind of report.
6. SLIM-ESTIMATE:[3]
SLIM-ESTIMATE is a tool developed by Quality Software Management and used for estimation. This tool is available with its aide for planning, tracking and calibration.
QSM is a tool based on SLIM estimation model. It has its own calibration and control module. It provides user with five solution options; detailed input method, quick estimate, solve for productivity index, solve for size and create solution from history. If little information about the project is available then quick estimate is used otherwise detailed input method can be used for a detailed estimate. If user has the schedule, effort and is given the size then user can use solve for productivity index method which gives the required productivity index for the project’s development within the given schedule and with the given effort and size. If the project’s size is only the missing information then solve for size method can be used to get the size estimate that can be built with the given effort, productivity index and within the given schedule. Report generation is the only feature missing in the tool.
Open Proj
Developer: Serena Software OpenProj is an open source project management software
intended as a complete desktop replacement for Microsoft Project, being able to open existing native Project files
It was developed by Projity in 2007. OpenProj runs on the Java Platform, allowing it to run on
a variety of different operating systems. The current version includes Earned Value costing Gantt chart PERT graph Resource Breakdown Structure (RBS) chart Task usage reports Work Breakdown Structure(WBS) chart
OpenProj provides control, tracking and management of projects. OpenProj works on Linux, Unix, Mac or Windows platforms, and it's free.

Alka Srivastava
Advances in Computer Science and Information Technology (ACSIT) Print ISSN: 2393-9907; Online ISSN: 2393-9915; Volume 2, Number 1; January-March, 2015
60
Study of tools has revealed the following drawbacks in the current scenario.
Drawbacks
1. Tools available for the above activities are isolated to each other i. e. the tools available are either estimation tools or for planning and tracking.
2. The tools available for planning used to send the information of task assigned to individuals through mails and the information pertinent to the assigned task is kept in some version control system.
3. Any supporting documents or reports should be available to the person in the organization like SRS for the project, design specification. Current tools do not have this feature.
4. During the development, the management needs to keep track of information about the status of project; the tools available do not have such features.
5. Reports at any stage of development are needed another important feature absent in available tools.
6. While calibration, past projects’ data need to fetched manually.
7. The method used for calibration of tools does not incorporate the expert’s judgment in the resulting parameter values.
The Proposed Solution Overview
The major problem in the current scenario is the isolated estimation, planning & tracking and calibration, so the solution would be Project Management Software that will combine these activities. The proposed system will first stores the details of the projects, clients and developers which are right now in paper form or if available in electronic form are in isolation to each other. The information about the projects, clients, developers would be available easily. The system will automate the process of the estimation using the COCOMO II model for effort estimation. The system will also help in tracking the status of project by taking daily input from each developer in the organization and will show the status in the form of a Gantt chart. The system will generate the reports for the projects. While calibrating the model the system will incorporate the experts’ judgment in the final values of parameters of the model. The system will give the information about the activities in the organization and the time taken in each activity.
Benefits of Proposed Solution
1. Clumsy calculation for estimation is no longer needed. 2. Planning and tracking would rather be a simpler task. 3. Information about the projects, clients and developers are
no longer needed to be stored in other forms. 4. Activity details would be available easily. 5. The reports could be generated with a single mouse click. 6. Notification on various conditions can be customized
according to the users’ choice.
7. Data for calibration would be available in the tool itself and no manual data entry is required for calibration.
8. The calibration would be more accurate and hence the estimation too.
7. CONCLUSION
Software estimation helps project management to plan the project. Tools available for the project estimation are great helps in the process. But estimating the project and then planning it without caring about the status of project at any instant of time is a problem worth to be considered. The process known as tracking is an important process that needs to be integrated with the estimation and planning process. The core of software crisis starts with the wrong estimation. Thus the calibration of the model being used for the estimation, with the past projects’ data experienced by the organization, is an activity of utmost importance. the calibration of the estimation model against organization, team and project should be done regularly. Various papers of Software project management studied for estimation ,planning ,tracking and calibration. Which are helpful for software project management tool analysis.
REFERENCES
[1] “Construx Estimate tool”, www. construx. com
[2] “CoStar tool”, www. softstarsystems. com
[3] “SLIM-ESTIMATE tool”, www. qsm. com
[4] “COCOMOII Model definition manual”, University of southern California
[5] Mehwish Nasir, A Survey of Software Estimation Techniques and Project Planning Practices,NUST Institute of Information Technology, Pakistan, IEEE Computer Society Washington, DC, USA 2006
[6] Bradford Clark, Sunita Devnani-Chulani and Barry Boehm, “Calibrating the COCOMO I1 Post-Architecture Model”, 1998 IEEE
[7] Sunita Chulani, Barry Boehm, Bert Steece, “Bayesian Analysis of Empirical Software Engineering CostModels”,July/August 1999
[8] Ching-Seh Wu and Dick B. Simmons,” Software Project Planning Associate (SPPA):AKnowledge-Based Approach for Dynamic Software Project Planning and Tracking”,October 25-27, 2000
[9] Kawal Jeet1, Renu Dhir2 ,Vijay Kumar Mago3 and Rajinder Singh Minhas4,” MaSO:A Tool for Aiding the Management of Schedule Overrun “, IEEE 2nd International Advance Computing Conference 2010.

Advances in Computer Science and Information Technology (ACSIT) Print ISSN: 2393-9907; Online ISSN: 2393-9915; Volume 2, Number 1; January-March, 2015 pp. 61-63 © Krishi Sanskriti Publications http://www.krishisanskriti.org/acsit.html
Advances in Computer Science and Information Technology (ACSIT) Print ISSN: 2393-9907; Online ISSN: 2393-9915; Volume 2, Number 1; January-March, 2015
Security Analysis of Web Application using Genetic Algorithms in Test Augmentation Technique
Keertika Singh1 and Garima Singh2
1M.Tech (Software Engineering) Babu Banarasi Das University, Lucknow, INDIA 2Assistant Professor, BBDU Babu Banarasi Das University, Lucknow, INDIA
E-mail: [email protected], [email protected]
Abstract—A security of web is a branch of Information Security that deal with the security of web application , website, web services. Security of the web deal with testing the security of the confidential data and make the data remain confidential. This Paper proposed an approach to test the web application by using a concept of genetic algorithms. The approach of security testing is based on understanding of how the client (browser) and the server communicate using HTTP. A researchable test suite was generated to cover as many fault sensitive transaction relation as possible with the genetic algorithms. SQL injection attack are very critical as attacker can get a vital information from the server database. The proposed methodology is to create a researchable test suite based on the collected user session with genetic heuristic. The main aim of this paper is to explain the application of genetic algorithms to generate a test cases of the web application on bases of user session.
1. INTRODUCTION Testing is the process of exercising software with the intent of finding errors. This fundamental philosophy does not change for WebApps. In fact, because Web-based systems and applications reside on a network and interoperate with many different operating systems, browsers, hardware platforms, and communications protocols, the search for errors represents a significant challenge for Web engineers[1]. Web Application is a application that is used over a network. Testing of web application is one of the time consuming task so many of the developer neglect the testing activity. Web application testing is a very expensive process in terms of time and resources due to the nature of web application. Testing, designing and generating test cases are challenging tasks because web application is complex and changeable.
The web application is considered as one of the distributed system, with a client– server or multi-tier architecture, including the following characteristics:-
-Wide number of users are distributed all over in the world access concurrently
-Web Application always run in heterogeneous execution environment i.e. different hardware, network connections, operating systems, Web servers, and Web browsers.
-It is able to generate software components at run time according to user inputs and server status.
1.1) The following WebApp characteristics drive the process: Immediacy. Web-based applications have an immediacy that is not found in any other type of software. That is, the time to market for a complete Web site can be a matter of a few days Developers must use methods for planning, analysis, design, implementation, and testing that have been adapted to the compressed time schedules required for WebApp development.
Security. Because WebApps are available via network access, in order to protect sensitive content and provide secure modes of data transmission, strong security measures must be implemented throughout the infrastructure.
Aesthetics. An undeniable part of the appeal of a WebApp is its look and feel. When an application has been designed or sell products, aesthetics may have as much to do with success.
2. GENETIC ALGORITHM
Genetic algorithms is a heuristic based search practice and we use this because of their ability to generate near global optimum solution and their extensive use in the prose of heuristics. The use of genetic algorithms is also facilitated by the fact that many of the testing problems can be formulated as search problems. For occurrence, in our case, the problem of generating adequate test data can be formulated as the problem of searching the input domain of the program, for those input values that satisfy the adequacy test criteria or that can identify faults in the program.
There are many real life problems where genetic algorithm is applied.[2]
The population of chromosomes is a possible solution of the problem. This is the starting of genetic algorithm. A

Keertika Singh and Garima Singh
Advances in Computer Science and Information Technology (ACSIT) Print ISSN: 2393-9907; Online ISSN: 2393-9915; Volume 2, Number 1; January-March, 2015
62
chromosome is a string of binary digits and it is the set of values of input variable and are obtained from the input domain each digit that can form a chromosome is called a gene [3]. This initial population can be totally random or can be created manually using processes such as greedy algorithm. The pseudo code of a basic algorithm for GA is as follows;[4]
Initialize (population) Evaluate (population)
While (stopping condition not satisfied) {
Selection (population) Crossover (population)
Mutate (population) Evaluate (population)}
2.1) A GA uses three operators on its population
Selection A selection scheme is applied to determine how individuals are chosen for mating based on their fitness. Fitness can be defined as a capability of an individual to survive and reproduce in an environment. Each chromosome is evaluated.
Crossover or Recombination: After selection, the crossover operation is applied to the selected chromosomes. It involves swapping of genes or sequence of bits in the string between two individuals. This process is repeated with different parent individuals until the next generation formed.
Mutation: Mutation alters chromosomes in small ways to introduce new good traits. It is applied to bring diversity in the population.
Table 1
CLASSICAL ALGORITHMS GENETIC ALGRITHMS Generate a single point at each iteration. The sequence of point approach an optimal solution.
Generate a population of a point at each iteration. The best point in the population approaches as a optimal solution.
Select a next point in the sequence by a deterministic computation.
Select the next population by computation which use random number generation
2.2) Estimation of Global minima for Stochastic Problem GA can solve both constructed and non constructed optimization problem which is totally based on a natural
process of selection. The GA differs from a classical, derivative- based, optimization algorithms.[4]
Fig. 1: Block Diagram of Genetic Algorithms
3) PROPOSED WORK; In a proposed methodology, a set of requests sent from clients are recorded as log of server. Three portions of the request is considered for the user-session-based testing[6]. The first portion is user IP and timestamp, which is used to identify a user session. In general, a user session is said to have began when a new IP address sends a request to the server and ends when the user leaves the web site, or the session is timed out. Another portion is composed of request pattern (GET/POST) and URL, which is called base request, while the third portion is the parameter-value pairs carried by base request. An identified user session can be simplified as a sequence of base requests and parameter-values to describe users’ sequential actions for web resources. On each Web server, request by the user is considered as a record. The record generally include request source (user IP address), request time, request mode (such as GET, POST), the URL of requested information, data transport protocol (i.e. HTTP), status code, the number of bytes transferred and the type of client, etc. It scan the log however, it is difficult to organize these original records directly. We initial eradicate inappropriate data that include records whose status codes are erroneous, embedded resources such as script files and multimedia files having extension names are .gif, .jpeg or .css, etc., to obtain the set of user sessions for analysis. Then, we create user sessions through scanning the logs on Web servers. Once a new IP address occurs, a new user session is created.[7]
Table 2: Comparision Study of Function Used in Test Case Generation by Genetic Algorithms[9]
FITNESS FUNCTION
FILTERING FUNCTION
CROSSOVER FUNCTION
MUTATION FUNCTION ACCEPTANCE FUNCTION
CONTROL FUNCTION
The fitness function is used to calculating the fitness value of chromosome.
In this sort chromosomes according to fitness from high to low, and select chromosomes in order.
Two chromosomes with the highest fitness and lowest fitness are selected from the chromosomeGroup and compared
A mutation probability is predefined to control whether or not a mutation operation will be carried out for a chromosome.
Acceptation function is used to compare the fitness values of 4 chromosomes, the offsprings and their parents.
Control function is used to control the coordination of the 5 modules. These 5 modules work logically and iteratively unit.

Security Analysis of Web Application using Genetic Algorithms in Test Augmentation Technique 63
Advances in Computer Science and Information Technology (ACSIT) Print ISSN: 2393-9907; Online ISSN: 2393-9915; Volume 2, Number 1; January-March, 2015
the fitness function, of “test case generation using GA”, is Fitness value = (_ * |CDTR| + |CLTR|) / (_ * |DTR| + |LTR|)
Chromosome whose fitness is lower than a predefined percentage of the parents’ average fitness should not be selected.
The *next pointer of the crossover points (if they are present) will be exchanged with each other.
Chains are selected from chromosomes of the initial population, until the common ratio between the selected chain and the mutating chromosome is smaller than a defined common ratio threshold.
The three modules of crossover, mutation and acceptation are in a nested loop to deal with chromosome.
3.1) ALGORITHMS FOR IDENTIFYING AFFECTED ELEMENT Algorithm: ReduceUSession input: The set of user sessions Λ = {s1, …, sk}, where k is the number of user sessions; The URL trace U1, …, Uk, which are requested by s1, …, sk respectively; output: The reduced set of user sessions denoted by Γ; begin Γ = Ф; while (another user session that is not marked in Λ exists) tag1 = FALSE; tag2 = FALSE; Select a user session si that is not marked in Λ, and then mark it with “USED”; for (the URL trace Uj requested by each user session sj in Γ) if isPrefix(Uj, Ui) //the URLs requested by si is //more, so sj is redundant Γ = Γ-{sj}; tag1 = TRUE; endif; if isPrefix(Ui, Uj) //here, Γ keeps unchanged, //and si is redundant
tag2 = TRUE; break; //exit for cycle endif; endfor;
3.2) Testing Web Applications Using Genetic Algorithm When the prioritization and grouping of the user session is done, we get several initial test suites and test cases. However, the test scheme generated by the elementary prioritization is not fast in finding faults and can not satisfy the requirements earlier. Therefore, genetic algorithm is used further to optimize the grouping and prioritization. Selection, crossover and mutation are the 3 basic operator of GA. Mainly six modules are used in this it include fitness function, filtering function, crossover function, mutation function, acceptation function and control function.[8]
4) Implementation of genetic Algorithms: The user connects to our network using a standard, Java-enabled browser, such as Netscape Navigator or Microsoft Internet Explorer. The browser loads a web page in which a reference to the GAWebTutor applet has been embedded. The applet code migrates across the internet from the web server to the client browser where it is interpreted by the Java Virtual Machine.
Fig. 2: GAWebTutor Interface
Keertika Singh and Garima Singh
Advances in Computer Science and Information Technology (ACSIT) Print ISSN: 2393-9907; Online ISSN: 2393-9915; Volume 2, Number 1; January-March, 2015
64
The client user enters parameter information through standard GUI components provided in the applet, such as drop-down lists, text boxes, etc. Once the user clicks on the “run” button the client waits for results. Once received, the client displays the contents of the best chromosome and its fitness rating for each generation of the GA. Additionally, a graphical illustration of the tour represented by the best solution from each population is displayed for the user. The chromosomes and tour graphics are displayed serially to reinforce the idea of an evolving solution set. The final tour of the last generation changes color to indicate to the user that all results have been displayed.[10,11]
3. CONCLUSION AND FUTURE WORK
The approach of this paper is to capture the series of logs of the server by the set of request send from the client, the three portion of the request is to be considered as user session and testing is being applied over it. We initially check the status code, when the record status code is erroneous, embedded resources then it is used then it is used to set the user session for analysis. Reduced user session algorithms and user session prioritization is applied to generate the initial test suit and test case.
In future research many question need to be answered and many factors are not yet considered like running cost of each test cases including loading time, time to save test state. The investigation should also be done on augmentation of the generated test suit to meet a full coverage from a structural analysis.
REFERENCES
[1] Roger S. Pressman, Ph.D. Senior Consulting Editor C. L. Liu, National Tsing HuUniversity Consulting Editor Allen B. Tucker, Bowdoin College Fundamentals of Computing and Programming Computer Organization and Architecture Systems and Languages Theoretical Foundations Software Engineering and Databases.
[2] S. Khor, P. Grogono, “Using a Genetic Algorithm and Formal Concept Analysis to Generate Branch Coverage Test Data Automatically”, Proceedings of the 19th International Conference on Automated Software Engineering (ASE”04), 1068-3062/04 © IEEE.
[3] M. R Girgis, “Automatic Test Data Generation For Data Flow Testing Using A Genetic Algorithm”, Journal of Universal Computer Science, Vol.11, No.6, pp.898-915, June 2005
[4] Sangeeta sabharwal, ritu sibal, chayanika Sharma “Prioritization of test case scenarios derived from activity diagram using genetic algorithm”. ICCCT, pp.481-485 IEEE (2010).
[5] www.mathswork.com [6] E. Hieatt and R. Mee, “Going Faster: Testing the Web Ap-
plication,” IEEE Software, Vol. 19, No. 2, 2002, pp. 60-65. [7] D. C. Kung, C. H. Liu and P. Hsia, “An Object-Oriented Web
Test Model for Testing Web Applications,” Proceedings of the 1st Asia-Pacific Conference on Web Applications, New York, 2000, pp. 111-120.
[8] J. H. Holland, “Adaptation in Natural and Artificial System,” University of Michigan Press, Michigan, 1975.
[9] User Session-Based Test Case Generation and Optimization Using Genetic Algorithm* Zhongsheng Qian J. Software Engineering & Applications, 2010, 3, 541-547
[10] L.R. Knight and R.L. Wainwright, “HYPERGEN: A Distributed Genetic Algorithm on a Hypercube,” Proceedings of the 1992 Scaleable High Performance Computing Conference, SHPCC ’92, Williamsburg, VA., April 26-29, 1992.
[11] C. Prince, R.L. Wainwright, D.A. Schoenefeld, and Travis Tull, “GATutor: A Graphical Tutorial System for Genetic Algorithms,” SIGCSE Bulletin Vol. 26, No. 1, March 1994, pp. 203-207.

Advances in Computer Science and Information Technology (ACSIT) Print ISSN: 2393-9907; Online ISSN: 2393-9915; Volume 2, Number 1; January-March, 2015 pp. 64-70 © Krishi Sanskriti Publications http://www.krishisanskriti.org/acsit.html
Automatic Face Recognition in Digital World Radhey Shyam1 and Yogendra Narain Singh2
1Dept. of Computer Science & Engineering Instituteof Engineering and Technology Lucknow–226 021, India
2Dept. of Computer Science & Engineering Institute of Engineering and Technology Lucknow–226 021, India
E-mail: [email protected], [email protected]
Abstract—Digital images have become prevalent, through the spread of surveillance cameras, smart phones, and digital cameras. Economical data storage has led to enormous online databases of facial images of identified individuals, such as licensed drivers, passport holders, employee IDs and convicted criminals. Individuals have embraced online photo sharing and photo tagging on platforms, such as Facebook, Instagram, Picasa and Flickr. Face recognition is a biometric identification by scanning an individual’s facial attributes and matching it against a digital library of known facial images or a video frame from a video source. In recent years, reliable automated face recognition has become a realistic target of biometric researchers. This paper addresses the current state-of-the-art strengths and weaknesses of the face (2D), general face (3D), and hybrid (2D+3D) face recognition methods. Some of the popular face recognition methods among them, including Eigenfaces, Fisherfaces, Local Binary Pattern (LBP) are critically evaluated. Furthermore, the obtained results of these methods are compared against our novel Augmented Local Binary Pattern (A-LBP) face recognition method. The experimental results of these methods are also verified by plotting the Receiver Operating Characteristic (ROC) curve on the face databases, such as AT & T-ORL, Indian Face Database (IFD), Extended Yale B, Yale A, Labeled Faces in the Wild (LFW) and Own database. A-LBP face recognition method performs better than Eigenfaces, Fisherfaces and LBP methods, especially for those facial databases having variations, such as mild pose and ambient illumination.
1. INTRODUCTION
Face recognition system (FRS) is a technique that enables cameras to identify people automatically. Due to the necessity of correct and effective FRS, it leads towards the activeness of biometric research in the race of the digital world. The real- life face recognition applications, include civil application, access control, border controls, criminal investigations, identity checks in the field, Internet communication, computer entertainment, etc. Automated face recognition can be deployed live to trace for a watch-list of a suspicious person, or afterthe fact using surveillance footage of a crime to investigate from the suspects facial databases.
Facebook’s tag suggestions, an automated system that identifies friend’s faces each time you upload a photo, which automatically clusters pictures of the same person. It can be
accurately recognize a person’s gender. This capability is employed by electronic billboards that display different messages depending on whether a man or woman is looking at them, as well as by services that deliver dynamically updated reports on meeting-spot demographics [2]. Name Tag, a face recognition app that lets users match a face to their digital identity. It can also make a pretty good guess as to someone’s age category [3]. Intel and Kraft employed this capability last year in developing vending machines that dispense free pudding samples only to adults [4]. Moreover, the Chinese manufacturing subcontractor Pegatron employed it to screen job applicants, spotting those who are under age [2]. Some of the digital footprints of individual recognition are shown in Fig. 1.
Fig. 1: Examples of digital footprints of individual recognition [1].
A mega project namely, unique identification (UID) programme of the government of India aims to provide a biometric-based unique number to every Indian for their identity proofing. Biometric identification seems to have become the government’s new go-to solution for all kinds of problems. Biometrics prove to be an obvious choice in individual identification schemes. It is easier to identify different individuals with their faces and the automatic face recognition is playing a leading role in this direction. But, the unhitching optimism in the use of biometric technology and

Automatic Face Recognition in Digital World 65
Advances in Computer Science and Information Technology (ACSIT) Print ISSN: 2393-9907; Online ISSN: 2393-9915; Volume 2, Number 1; January-March, 2015
the collection of biometric data on a massive scale masks several concerns regarding compromises of individual privacy, such as Big Data and privacy issues, Biometric ID and theft of private data, and Biometric data and potential misuse [5].
Fig. 2: Schematic of a typical automatic face recognition process [6].
Face recognition has made substantial progress in face modeling and analysis techniques in recent years, but this problem is still unsolved or partially solved. Some of its limitations are due to an insufficiently efficient database of facial images. And some of its limitations are a result of algorithms not yet able to compensate fully for things like pose variations, facial expressions, illumination, or subjects who are wearing hats or sunglasses or sport new face hair or makeup. Systems have developed for face detection and tracking, but reliable face recognition still offers a great challenge to computer vision and pattern recognition researches. There are several reasons for recent increased interest in face recognition, including rising private and public concern for strong security, the need for identity verification and recognition in the digital world, and the need for facial analysis and modeling techniques in multimedia data management and computer entertainment.
Furthermore, recent advances in automated facial analysis, pattern recognition, and machine learning have made it possible to devise automatic face recognition systems to address these applications. The different stages employed in a typical face recognition system are shown in Fig. 2. In addition, the automated facial analysis will find many applications, such as entertainment, home automation, medical or educational.
In summary, the contribution of the paper is to address the aspect of automatic face recognition in the digital world. The face recognition methods perform well in the favorable environments and require less computational effort in comparison to the general face recognition methods. The recognition accuracy achieved by most of the facial images are not as such that fulfill the stringent security requirement. Furthermore, human recognizes individuals using their faces with confidence but the performance reported by a facial images requires human intervention for final judgment. The face recognition using the general face image method
recognizes individual using the general face model that synthesizes facial features. The general face images require more computational efforts. This paper outline the current state-of-the-art of the facerecognition methods using face (2D), general face (3D) andhybrid face (2D+3D) images and critically evaluate them. Therest of the paper is organized as follows. In Section 2, areview of face recognition methods is presented. The issuesof automated face recognition method are presented in Section 3. Our contributions are presented in Section 4, and Finally,conclusions are summarized in Section 5.
2. FACE RECOGNITION: A REVIEW
Automatic recognition of people from their facial geometryis a challenging problem because of the diversity in facesits variations. The facial geometry holds enough information to discriminate people from others. The morphologicalappearance of a person is subject to constant change andit differs in a significant manner during the various stagesof life. The discriminatory features of facial geometry arecommonly studied under the individuality of the faces thatrefers the characteristics that set one person apart from others.The conditions of being individual, or different from othersestablish the individuality of a person. The converging factorsthat increase the quantum of individuality are demographicinformation and facial marks. The demographic informationincludes race and skin color while face marks include scars,moles and freckles. These are soft biometric factors thatcan play an important role in improving face matching andretrieval [7].
From the past decades, considerable work has been done forface recognition methods and the issues related to automaticface recognition [8]–[15]. Typically, the best known facerecognition methods can be categorized as follows: (i) Facerecognition methods, (ii) General face recognition methods,and (iii) Hybrid face recognition methods.
2.1 Face Recognition Methods (Before1990’s)
One of the earliest face recognition method was presentedby Bledsoe in 1966 [16]. Bledsoe outlined the challenges offacial recognition, such as changes in pose, illumination, facialexpressions and aging. He found very low correlation betweentwo images of the same person with two different poses.The first automated face recognition system was developedby T. Kanade in 1973 [17]. Since then there has been astagnant period in automatic face recognition. The work ofKirby and Sirovich [18], and Turk and Pentland on Eigenfaces[8] reinvigorated facial recognition research. The next milestone in facial recognition research achieved when the faceswere analyzed using linear discriminant analysis (LDA) andclassification was performed on Fisherfaces [9]. The multiclassLDA methods were also developed for managing more thantwo classes [19]. Belhumeur et al.

Radhey Shyam and Yogendra Narain Singh
Advances in Computer Science and Information Technology (ACSIT) Print ISSN: 2393-9907; Online ISSN: 2393-9915; Volume 2, Number 1; January-March, 2015
66
presented a comparativestudy on Eigenfaces and Fisherfaces [9]. They achieved therecognition accuracy of 99.6% using Fisherface method whenexperimented on Yale database [20]. The main weakness ofFisherface method is its linearity behavior. The independentcomponent analysis (ICA) is another method that has beenexplored for feature extraction as well as image discriminationfor facial recognition.
Local feature analysis (LFA) is another method used toconstruct a family of locally correlated features in eigenspace[21]. It produces a minimally correlated and topographicallyindexed subset of features that define the subspace of interest.The strength of LFA method is to utilize specific facial featuresinstead of the entire representation of the face for recognition.The method selects specific areas of the face such as the eyesor mouth, to define features and used for recognition. Thefeatures used in the LFA are less sensitive to illuminationchanges and are easier for estimating rotations. Ahonen et al.have proposed a method of facial image representation basedon local binary pattern (LBP) [22].
Wiskott et al. proposed the elastic bunch graph method(EBGM) where a set of jets corresponding to different facefeatures were derived from face images [10]. The successof the EBGM method may be due to its alikeness to thehuman visual system. The method performs well for frontalor nearly frontal face images, but their performance decreaseswith variations in illumination and pose. They reported therecognition accuracy of 80-82% on FERET database.
2.2. General Face Recognition Methods (after 1990’s)
The processing steps of a general face recognition methodinclude general face construction, feature localization, featureextraction and matching. The general face is reconstructed bycombining the shading information with prior knowledge of asingle reference model to novel face. The general face modelcontains sufficient information about the face geometry. Ina general facial geometry, facial features are represented byboth local and global curvatures [23], Elastic Bunch GraphMatching (EBGM) [10] and general facial morphable models[12].
Chang et al. have proposed a multi-region based general face recognition method [24]. In this method, multipleoverlapping subregions around the nose are independentlymatched using ICP and the results of multiple general facematches fused. The recognition rate of 92% was claimed onFRGC 2.0 [25] database. The method selects landmark points,automatically and resulted an improved performance in thecase of facial expression changes. Blanz et al. have proposeda method based on a general facial morphable model thatencodes shape and texture in terms of model parameters [15].For face recognition, they used shape and texture parametersthat are separated from imaging parameters, such as poseand
illumination conditions. They reported the recognitionaccuracy of 97.4%. Cootes et al. have experimented the synthetic images that are generated using a parametric appearancemodel [13]. They have shown an efficient direct optimizationapproach that matches the shape and texture simultaneously.
Numerous biometric researchers have described differentmethods for matching deformable models of shape and appearance to novel images. Naster et al. have proposed amodel of shape and intensity changes using a general facialdeformable model of the intensity landscape [14]. They haveused a closet point surface matching method for performingthe fitting of face or general face images. The proposed modelsof appearance can match any class of deformable objects. In[26], Passalis et al. have experimented an approach on thegeneral face using deformable models. An average generalface is computed on a statistical basis for a gallery databasethat results the recognition accuracy of 90% on FRGC 2.0database.
Chang et al. have presented a method that independentlymatches multiple regions around the nose and combines individual matching results to make the final decision. Bronsteinet al. proposed a method based on the isometric model offace surfaces that infer an expression invariant face surfacerepresentation for general face recognition. Bronstein et al.haveexperimented an approach to general face recognitionthat is useful for deformation related to face changes [27].The objective is to change the general face to an Eigenformwhich is invariant to the type of shape deformation. Theyhave reported the recognition rates of 100% on the databasecontaining 220 images of 30 persons. Li et al. have proposed adiscriminative model that addresses face matching in the presence of age changes. In this model, each face is represented bydesigning a densely sampled local feature description schemesuch as scale invariant feature transformation and multi-scaleLBP [11]. They have claimed the recognition rates of 83.9%on MORPH database [28].
Vetter and Poggio proposed a general face morphablemodel, which is based on a vector space representation offaces [29]. The general face morphable model to imagescanbe used for recognition across different pose and texture offaces. They reported 95% recognition rates on CMU Multi-PIE [30] and FERET [31] database. Park and Jain haveproposed a method, namely structure from motion (SfM)that reconstructs the general face model for compensatinglow resolution, poor contrast and non frontal pose [32]. Afactorization based structure from motion method is used forgeneral facial reconstruction. The proposed synthetic modelhas been tested on a CMU face database and they claimedan improvement in matching to 30-70%. Furthermore, Shyamand Singh have presented the concept of new face recognitionmethod, called A-LBP which is a variant of LBP. This methodshows the

Automatic Face Recognition in Digital World 67
Advances in Computer Science and Information Technology (ACSIT) Print ISSN: 2393-9907; Online ISSN: 2393-9915; Volume 2, Number 1; January-March, 2015
significant improvement in recognition accuracyover LBP [6], [33]–[35].
2.3. Hybrid face Recognition Methods (2000’ onwards)
The hybrid face recognition methods outperform both faceand general face methods alone. Hybrid face recognitioncombines the face information of face images and general facemodel to render a decision. Chang et al. have presented different approaches for combining face information that performsindividually the Eigenfaces on the intensity and range images[36]. They reported recognition performance of 99% forhybrid, 94% for general face, and 89% of face images. Godil et al. have experimented hybrid face recognition on the CAESARdatabase [37]. They use eigenfaces for matching both the faceand the general face, where general face represents a rangeimage. Numerous approaches to score level fusion of the twoor more results have been explored. They have reported therecognition rates of 82% on the range images.
Lu and Jain have experimented on hybrid system using iterative closest point and the face matching using LDA [38]. Theyhave reported 98% recognition rates on neutral expressionsand 91% on the larger set of neutral and smiling expressions.Wang et al. have experimented hybrid face recognition usingGabor filter responses in face and point signatures in generalface [39].
Mian et al. have proposed a novel holistic general facespherical face representation (SRF) method [40]. The SFR isused in conjunction with the scale invariant feature transform(SIFT) descriptor to form a rejection classifier. It eliminatesa large number of ineligible candidates faces from the galleryat an early stage. The SFR is a low-cost global general facedescriptor that achieves an improved performance of 95-99%for non-neutral and neutral face images, respectively.
3. ISSUESOF AUTOMATED FACE RECOGNITION
The effectiveness of a face recognition method depends onhow much it utilizes the knowledge of facial anatomy thatincludes face skeleton, muscles of the face and skin properties;image analysis techniques, photographic information, historyof facial identification and the computing resources. However,the idea of organizing the facial features into levels as soft biometrics for achieving better performance is also appealing. Forexample, the easily observable features like skin color, gender,and the general appearance of the face can be considered first.Then localized facial features are considered next and finallyfacial marks, skin discoloration, and moles are considered.
Primarily, the working of a face recognition system can beviewed as favorable and non-favorable conditions. In
favorableconditions the frontal face detection from static images undernormal lighting and favorable conditions is a well solved problem. Methods such as the LDA, LFA, LBP, A-LBP, EBGMand their combinations perform well in favorable conditions.In non-favorable conditions the face detection from videoimages under variations of pose, expression, illumination, background, aging and the distance between the camera andsubject, is a partially solved problem. In order to mitigate theissued involved in non-favoring conditions, the face recognition methods mostly employ synthetic models such as generalface deformable model and active appearance model to detectdiscriminative facial features.
The lack of statistical analysis of the facial morphologyand geometry reduces the discriminatory information availableto an individual. Therefore the research must be focused onto compute the statistics of facial uniqueness that cover thehierarchical analysis of facial features as suggested by Klareand Jain [7]. Some biometric researchers suggest that theinformation of the ears is also a noticeable factor that maybe included with the face detection. Because, anatomy ofears is considered to be stable than other facial features, inparticular, the ears of two individuals cannot be the same[17]. Singh et al. have suggested that the fusion of the physiological signal such as electrocardiogram with an unobtrusivebiometrics faces improves the recognition accuracy of theresulting system [41], [42]. The ECG can supplement themissing information contents of the face biometrics and solvethe problem of spoofing attacks on the face recognition system[43], [44].
The general face recognition methods can achieve significantly higher accuracy than facial counterpart. The main challenge of general face recognition methods is the acquisitionof general face images. However, the methods like surfacematching of facial features are more robust against expressionchanges. Similarly, the general face deformation model reportsbetter results, but it suffers from computational problems andpoor generalization. The commercial solutions claim a goodrecognition accuracy, using general face models, but generalface recognition is still an active research field.
It has been reported that hybrid methods of face recognitionperforming better than face or general face alone. Somemethods notify that facial images cannot be directly applied togeneral face images. But efficient methods are still needed forhandling the changes between the gallery and probe images.The approaches that treats the face as a rigid shape doesnot work well with expression changes. It is suggested thatapproach would be to enroll a person in the gallery bydeliberate sampling a good set of different facial expressionand to match against probe using the well set of shapesrepresenting a person. We need an efficient method for generalface as well as hybrid face images for handling the subjectvariations.

Radhey Shyam and Yogendra Narain Singh
Advances in Computer Science and Information Technology (ACSIT) Print ISSN: 2393-9907; Online ISSN: 2393-9915; Volume 2, Number 1; January-March, 2015
68
In order to compute the facial similarities between faceimages acquired at different sources of frontal image and agedimages, the availability of a database that contains the imageswith substantial facial expression change, inter-class subjectvariation with demographic change and images with time delayis essentially needed.
4. OUR CONTRIBUTIONS Here, we present our contribution to address some issuesof automated face recognition. The brief introduction of ournovel method that relies on the LBP, called Augmented LocalBinary Pattern. Earlier work on the LBP have not given muchattention on the use of non-uniform patterns. They are eithertreated as noise and discarded during texture representation, orused incombination with the uniform patterns. The proposedmethod targets the non-uniform patterns and extract the discriminatory information available to them so as to prove theirusefulness. They are used in combination to the neighboringuniform patterns and extract invaluable information regardinglocal descriptors.
The proposed method employs a grid-based regions. However, besides the directly putting all non-uniform patterns into59th bin, it replaces all non-uniform patterns with the mode ofneighboring uniform patterns. For this, we have taken a filterof size 3x3 that is moved on the entire LBP generated surfacetexture. In this filtering process, the central pixel’s value isreplaced with the mode of a set in case of the non-uniformityof the central pixel. This set contains 8-closet neighbors ofcentralpixel, in which non-uniform neighbors are substitutedwith 255. Here 255 is the highest uniform value.
Table 1: Face Recognition Accuracies (%) of Eigenfaces, Fisherfaces, LBP and A-LBP Methods on Different Face
Databases.
Our novel A-LBP along with other face recognition methods, such as Eigenfaces, Fisherfaces and LBP are tested on
thepublicly available and our own created (characteristics of thedatabase is frontal and near to frontal) face databases, such asAT & T-ORL [45], Indian Face Database (IFD) [46], extendedYale B [47], Yale A [20], Labeled Faces in the Wild [48] andown database. These databases differ in the degree of variationin pose (p), illumination (i), expression (e) and eye glasses (eg)present in their facial images.
The performance of these face recognition methods as wellas our own A-LBP face recognition method (See Table I) isanalyzed using equal error rate, which is an error, where thelikelihood of acceptance assumed the same value to the likelihood of rejection of people who should be correctly verified.The performance of the proposed method is also confirmed bythe receiver operating characteristic (ROC) curves (See Figure3). The ROC curve is a measure of classification performancethat plots the true acceptance rate (TAR) against the falseacceptance rate (FAR).
The recognition accuracy of Eigenfaces, Fisherfaces, LBPand A-LBP is 94.90%, 95.03%, 92.50% and 95% at 5.1%,4.7%, 7.5% and 5% of the FAR respectively, on the AT &T-ORL database. A-LBP shows the significant improvementfrom LBP. The recognition accuracy of Eigenfaces, Fisherfaces, LBP and A-LBP is 88%, 88.14%, 96.61% and 96.61%at 12%, 11.86%, 3.39% and 3.39% of the FAR respectivelyon the IFD database. A-LBP does not make any change ascompared to LBP, because this database is highly affected bythe pose variations.
The recognition accuracy of Eigenfaces, Fisherfaces, LBPand A-LBP is 56.65%, 60.53%, 74.11% and 86.11% at43.35%, 39.47%, 25.89% and 13.89% of the FAR respectively,on the Ext. Yale B database. A-LBP shows the significantimprovement from all methods, because this database is highlyaffected by the variations of ambient illumination. The recognition accuracy of Eigenfaces, Fisherfaces, LBP and A-LBP is81.19%, 86.67%, 60% and 76.86% at 18.81%, 13.33%, 40%and 32.14% of the FAR respectively on the Yale A database.A-LBP shows the significant improvement from LBP methods.

Automatic Face Recognition in Digital World 69
Advances in Computer Science and Information Technology (ACSIT) Print ISSN: 2393-9907; Online ISSN: 2393-9915; Volume 2, Number 1; January-March, 2015
Fig. 3: ROC curves showing the performance of Eigenfaces,
Fisherfaces,LBP and A-LBP face recognition methods on face databases: (a) AT & T-ORL, (b) Indian Face Database, (c)
Extended Yale B, (d) Yale A, (e) LabeledFaces in the Wild, and (f) Own Datasets.
The recognition accuracy of Eigenfaces, Fisherfaces, LBPand A-LBP is 56.92%, 55%, 65% and 67.37% at 43.08%,45%, 35% and 32.63% of the FAR respectively on the LFWdatabase. A-LBP shows the significant improvement from allmethods. The recognition accuracy of Eigenfaces, Fisherfaces,LBP and A-LBP is 87.50%,87.50%, 85% and 85% at 12.50%,12.50%, 15% and 15% of the FAR respectively, on the owndatabase.
5. SUMMARY
Digital images have become prevalent, through the spreadof surveillance cameras, smart phones, and digital cameras.Economical data storage has led to enormous online databasesof facial images of identified individuals, such as licenseddrivers, passport holders, employee IDs and convicted criminals. Individuals have embraced online photo sharing andphoto tagging on platforms, such as Facebook, Instagram,Picasa and Flickr. We have experimented and compared theperformance of the Eigenfaces, Fisherfaces, LBP and A-LBP face recognition methods, after observing recognitionaccuracy results of the face recognition methods. It showsthat the results are also highly vulnerable by the nature of theface databases apart from having favorable and non-favorableconditions. Although, A-LBP face recognition method performs better than Eigenfaces, Fisherfaces and LBP methods,especially for those facial databases having variations, such asmild pose and ambient illumination.
6. ACKNOWLEDGEMENT The authors acknowledge the Institute of Engineering andTechnology (IET), Lucknow, Uttar Pradesh Technical University (UPTU), Lucknow for their financial support to carry outthis research under the Technical Education Quality Improvement Programme (TEQIP-II) grant.
REFERENCES [1] http://www:slideshare:net/pssudhish/anil-jain-
50yearsbiometricsresearchsolvedunsolvedunexploredicb13.
[2] http://www:eetimes:com/author:asp?doc id=1320789.
[3] http://www:nametag:ws/.
[4] http://download:intel:com/newsroom/kits/embedded/pdfs/.
[5] http://www:goacom:com/goa-news-highlights/3520-biometric-scanners-to-be-used-for-elections.
[6] Shyam, R., Singh, Y.N., “Face recognition using augmented local binary patterns and bray curtis dissimilarity metric,” in Proc. of 2ndInt’l Conf. on Signal Processing and Integrated Network (SPIN 2015).Noida India: IEEE, Feb. 2015, p. TBA.
[7] Klare, B., Jain, A.K., “On a taxonomy of facial features,” in Proc. of 4thIEEE Int’l Conf. on Biometrics Theory, Applications and Systems (BTAS), CrystalCity, Washington D.C., Sept. 28-30 2010.
[8] Turk,M.A., Pentland, A.P., “Eigenfaces for recognition,” J. Cogn. Neurosci., vol. 3, no. 1, pp. 71–86,1991.
[9] Belhumeur, P.N., Hespanha, J.P., Kiregman, D.J.,“Eigenfaces vs. fisherfaces: Recognition using class specific linear projection,” IEEE Trans. Pattern Anal. Mach. Intell., vol. 19, no. 7, pp. 711–720, July 1997.
[10] Wiskott, L., Marc, J., Kriiger, N., von der Malsburg, C., “Face recognition by elastic bunch graph matching,” IEEE Trans. Pattern Anal. Mach. Intell., vol. 19,no. 7, pp. 775–779, 1997.
[11] Li, Z., Park, U., Jain, A.K., “A discriminative model for age invariant face recognition,” IEEE Trans. Information Forensics and Security, vol. 6, no. 3, pp. 1028–1037, Sept. 2011.
[12] Blanz, V., Vetter, T., “Face recognition based on fitting a 3D morphable model,” IEEE Trans. Pattern Anal. Mach. Intell., vol. 25, no. 9, pp. 1063–1074, Sept. 2003.
[13] Cootes, T.F., Edwards, G.J., Taylor, C.J., “Active appearance models,” IEEE Trans. Pattern Anal. Mach. Intell., vol. 23, no. 6, pp. 681–685, June 2001.
[14] Naster, C., Moghaddam, B., Pentland, “Generalized image matching: Statistical learning ofphysically-based deformations,” Computer Vision and Image Understanding, vol. 65, no. 2, pp. 179–191,1997.
[15] Blanz, V., Romdhani, S., Vetter, T.,“Face identification across different poses and illuminations with a3D morphable model,” in Proc. of IEEE Int’l Conf. on Automatic Face and Gesture Recognition (AFGR’02),2002, pp. 202–207.
[16] Bledsoe,W.W.,“The model method in facial recognition: Technical report PRI-15,” in Proc. of Panoramic Recsearch Inc, California, 1966.
[17] Kanade, T., “Picture processing system by computer complex and recognition of human faces.” in PhD thesis, Kyoto University, 2011.
[18] Kirby, Sirovich, M., “Application of the KL procedure for the characterization of human faces,” IEEE Trans. Pattern Anal. Mach. Intell., vol. 12, no. 1, pp.103–108, 1990.
[19] Martinez, A.M., Kak, A.C.,“PCA versus LDA,” IEEE Trans. Pattern Anal. Mach. Intell., vol. 23, no. 2,pp. 228–233, 2001.
[20] UCSD: Yale http://vision:ucsd:edu/content/yale-face- database.
[21] Penev, P.S., Atick, J.J.,“Local feature analysis:A general statistical theory for object representation,”Network: Computation in Neural Systems, vol. 7,no. 3, pp. 477–500, 1996.
[22] Ahonen, T., Hadid, A., Pietikainen, M.,“Face description with local binary patterns: Application toface recognition,” IEEE Trans. Pattern Anal. Mach.Intell., vol. 28, no. 12, pp. 2037–2041, Dec. 2006.
[23] Abate, A.F., Nappi, M., Riccio, D., Sabatino, G.,“2D and 3D face recognition: A survey,” Pattern Recognition Letters, vol. 28, pp. 1885–1906, 2007.
[24] Chang, K.I., Bowyer, K.W., Flynn, P.J.,“Adaptiverigid multi-region selection for handling expressionvariation in 3D face recognition,” in Proc. of IEEE Workshop on Face Recognition Grand Challenge Experiments, June 2005.
[25] NIST: Frgc database http://www:nist:gov/itl/iad/ig/frgc:cfm.
[26] Passalis, G., Kakadiaris, I., Theoharis, T., Toderici, G., Murtuza, N., “Evaluation of 3D face recognitionin the presence of facial expressions: an annotated deformable modelapproach,” in Proc. of IEEE Workshop on Face Recognition Grand Challenge Experiments, vol. 1, June 2005, pp. 579–586.

Radhey Shyam and Yogendra Narain Singh
Advances in Computer Science and Information Technology (ACSIT) Print ISSN: 2393-9907; Online ISSN: 2393-9915; Volume 2, Number 1; January-March, 2015
70
[27] Bronstein, A.M., Bronstein, M.M., Kimmel, R.,“Three dimensional face recognition,” Int’l J. Computer Vision, vol. 64, no. 1, pp. 5–30, 2005.
[28] UNCW: Morph database http://ebill:uncw:edu/C20231 ustores/web/store main:jsp?STOREID=4.
[29] Vetter, T., Poggio, T.,“Linear object classes andimage synthesis from a single example image,” IEEE Trans. Pattern Anal. Mach. Intell., vol. 19, no. 7, pp.733–742, July 1997.
[30] Cmu multi-pie face database http://www:multipie:org/.
[31] NIST: Feret database http://www:nist:gov/itl/iad/ig/feret:cfm.
[32] Park, U., Jain, A.K.,“3D model-based face recognition in video,” in Proc. 2nd Int’l Conf. Biometrics,Seoul Korea, 2007.
[33] Shyam, R., Singh, Y.N.,“A Taxonomy of 2D and3D Face Recognition Methods,” in Proc. of 1st Int’l Conf. on Signal Processing and Integrated Network (SPIN 2014). IEEE, Feb. 2014, pp.749–754.
[34] Shyam, R., Singh, Y.N.,“Evaluation of Eigenfacesand Fisherfaces using Bray Curtis Dissimilarity Metric,” in Proc. of 9th IEEE Int’l Conf. on Industrial and Information Systems (ICIIS 2014), ABV-IIITM,Gwalior, India, Dec. 2014, p. TBA.
[35] Shyam, R., Singh, Y.N.,“Identifying individuals using multimodal face recognition techniques,”in Proc. of Int’l Conf. on Intelligent Computing, Communication & Convergence (ICCC-2014).Bhubaneswar, India: Elsevier, Dec. 2014, p. TBA.
[36] Chang, K.I., Bowyer, K.W., Flynn, P.J.,“Face recognition using 2D and 3D facial data,” in Proc. of Multimodal User Authentication Workshop, Dec. 2003, pp. 25–32.
[37] Godil, A., Ressler, S., Grother, P “Face recognition using 3D facial shape and color map information: comparison and combination,” in Proc. of Biometric Technology for Human Identification (SPIE),vol. 5404, Apr. 2005, pp. 351–361.
[38] Lu, X., Jain, A.K.,“Integrating range and texture information for 3D face recognition,” in Proc. of 7th IEEE Workshop on Applications of Computer Vision (WACV 2005), 2005, pp. 155–163.
[39] Wang, Y., Chua, C., Ho, Y.,“Facial feature detection and face recognition from 2D and 3D images,” Pattern Recognition Letters, vol. 23, pp. 1191–1202, 2002.
[40] Mian, A.S., Bennamoun, M., Owens, R.,“An efficient multimodal 2D+3D hybrid approach to automatic face recognition,” IEEE Trans. Pattern Anal. Mach. Intell., vol. 29, no. 11, pp. 1927–1943, Nov.2007.
[41] Singh, Y.N., Singh, S.K., Gupta, P.,“Fusion of electrocardiogram with unobtrusive biometrics: An efficient individual authentication system,” Pattern Recognition Letters, vol. 33, no. 11, pp. 1932–1941, 9 2012
[42] Singh, Y.N., Gupta, P., “Correlation based classification of heartbeats for individual identification,” SoftComputing, vol. 15, no. 3, pp. 449–460, 2011.
[43] Singh, Y.N., Singh, S.K., “A taxonomy of biometric system vulnerabilities and defences,” International Journal of Biometrics, vol. 5, no. 2, pp. 137–159, 12013.
[44] Singh, Y.N., Kumar, S.,“Vitality detection from biometrics: State-of-the-art,” IEEE World Congress Information and Communication Technologies (WICT 2011), pp. 106–111, Dec. 2011.
[45] Samaria, F., Harter, A.,“Parameterisation of a Stochastic Model for Human Face Identification,” in Proc. of 2nd IEEE Workshop on Applications of Computer Vision, Sarasota, FL, Dec. 1994.
[46] V. Jain and A. Mukherjee. (2002) The indian face database. http://vis-www:cs:umass::edu/$nsim$vidit/ fIgndianfFgacefDgatabase/.
[47] Lee, K.C., Ho, J., Kriegman, D.,“Acquiring linear subspaces for face recognition under variable lighting,” IEEE Trans. Pattern Anal. Mach. Intell., vol. 27,no. 5, pp. 684–698, 2005.
[48] Huang, G.B., Ramesh, M., Berg, T., Learned-Miller, E., “Labeled faces in the wild: A database forstudying face recognition in unconstrained environments,” in Technical Report, University of Massachusetts, Amherst, 2007, pp. 07–49.

Advances in Computer Science and Information Technology (ACSIT) Print ISSN: 2393-9907; Online ISSN: 2393-9915; Volume 2, Number 1; January-March, 2015 pp. 71-76 © Krishi Sanskriti Publications http://www.krishisanskriti.org/acsit.html
Cyber Security: A Challenge for India Ms. Shuchi Shukla
15th Year Student Of Integrated B.Tech(CSE)+MBA(Finance, HR) In Gautam Buddha University E-mail: [email protected]
Abstract—This research paper is about the Cyber security which has been a challenge for world due to increase in number of cyber crimes every year. This research would be completed with the help of secondary resources. In this we would be studying about cyber crime , what cyber crime includes of (types of cyber crime),what are the initiative taken by Indian Government in this field to overcome the problem, what steps should be taken by individual so that they are not being webbed in the cyber crime network. The decrease in cyber crime will help the young generation most because all the cyber crime that has been convicted so far was found to be in age of 16-25. Keywords: Cyber Crime, Phishing, Cyber law, Cyber cells, Cyber security
1. INTRODUCTION
Internet is the world’s largest networking system which facilitates every individual of the society or we can say it’s the best way of circulating news ,data ,information and many more such technical help to the world’s highest population. In other word we can say it has the solution to our every problem .Internet is now accepted globally or we can say its part of globalization. As we know everything comes with both pros and cons likewise internet also has its both pros and cons, likewise the number of users of internet is increasing on other hand number of cyber crime is also increasing. cyber crime has become a big challenge for the cyber security department. As per the data on the internet world stats website it was found that Asia has 45.7% of worlds total internet users, and around 243 million users are from India. [21].The Graph 1.1 shows us the statistics of Asian countries which depict us clearly about internet usage. India has the second largest number of Internet user among all the Asian countries.
It is expected that cyber crime is going to take a huge turn in 2015, cyber experts warned also that in upcoming times the fraudsters are gone take help of some new tricks to target the victims. Cyber Experts are accepting that fraudsters are going to target the organized sector more in order to be targeted, and planned some continuous attacks, which is known as APT (advanced persistent threats).This was the prediction which was made by Kaspersky Lab's Global Research and Analysis Team (GReAT).Since, 2008 every year it releases the list of cyber attack trends. [12]
GRAPH 1.1
Source: http://www.internetworldstats.com/stats3.htm#asia
2. WHAT IS CYBER CRIME?
The word “Cyber Crime” means the crime which is related to cyber web (related to computer and its world of internet). Cyber Crime includes all the illegal activities like accessing information through unauthorized sources, breaking up or stealing anyone’s personal profile detail to login their accounts. It also includes the web crime which make people trap in some kind of financial activities and there are many crime related to cyber like virus attacks, financial crimes, sale of illegal articles, pornography, online gambling, e-mail spamming, cyber phishing, cyber stalking, unauthorized access to computer system, theft of information contained in the electronic form, e-mail bombing, physically damaging the computer system, etc.
Cyber Crime is being categorized in two parts :one is Cyber crime in which the computers are the target ,in such cyber crimes hackers hack the computers in order to corrupt the files or misuse the data and information. And on other hand crime or fraud which takes place with the help of computers.
In 2011 Dr. Debarati Halder and Dr. K. Jaishankar defines the cyber crime as "Offences that are committed against individuals or groups of individuals with a criminal motive to intentionally harm the reputation of the victim or cause

Ms. Shuchi Shukla
Advances in Computer Science and Information Technology (ACSIT) Print ISSN: 2393-9907; Online ISSN: 2393-9915; Volume 2, Number 1; January-March, 2015
72
physical or mental harm to the victim directly or indirectly, using modern telecommunication networks such as Internet (Chat rooms, emails, notice boards and groups) and mobile phones (SMS/MMS)".
There are many researches and surveys which was conducted in regard of cyber crime and found that every two out of three persons who are being convicted for the cyber crime lies in the age group of 15 to 26 years because in this age group children don’t think twice before doing any wrong deed they just do things which they feel is right they don’t think the after circumstances of it.
3. TYPES OF CYBER CRIME Credit/Debit Card Fraud: It is fraud which can be done when the user is using some unauthorized sight for transaction , at that time users personal details , card number and CVV number of the card can be traced for the further crime which can be made afterwards with the help of the details which has been stolen . So everyone before making payment online should be bit more careful so that they don’t get trapped in such deeds.
Computer Fraud: It is the cyber crime which has been convicted most rapidly in few years. Computer Fraud is the fraud which uses information technology to perform fraud; it is also termed as internet fraud. In this hackers (black hat hackers) take the help of internet and many activities linked with internet to commit the fraud or crime. It is a punishable offence.
Cyber Bullying: It is the type of cyber crime which is done intentionally to harm someone’s self respect or in other word to harass, embarrass or insult someone by using internet, email or any other electronic communication.
Cyber Stalking/Online harassment: It is done by hackers when the target is known sometimes and sometimes a random person, it harms the victim’s personal life as victim is continually bombarded with the mails and other type of electronic communication in order to get trapped or harass the victim, it sometime done to disturbed the person mentally or emotionally.
Malicious Programs/Viruses: In this viruses and malicious programs which harm the victim by harming there computer resources (like corrupting files or, crashing computer system, deleting some important data).Malicious programs are sub divided into 5 groups but all of them do the same work which is harming or infecting the computer software or hardware: Worms, Viruses, Trojans, Hacker utilities. Other malware .With the help of malicious programs the BotNet crimes also take place .This word is being derived from two different words: Robot and network. In this criminal take the control over the computer using malicious programs in order to make crime.
Online Child Pornography: Online Child pornography is the exploitation of children sexually with the help of illegal media that has been shared with the help of internet.
“Unfortunately, we´ve also seen a historic rise in the distribution of child pornography, in the number of images being shared online, and in the level of violence associated with child exploitation and sexual abuse crimes. Tragically, the only place we´ve seen a decrease is in the age of victims. This is – quite simply – unacceptable.”-Attorney General Eric Holder Jr. speaks at the National Strategy Conference on Combating Child Exploitation in San Jose, California, May 19, 2011.[14]
Unwanted exposure to sexually explicit material etc. It is a crime which is done intentionally by sending some unwanted clippings, pictures etc by email or some electronic media ,it also includes the video and pictures which has been saved while video chatting through webcam.
Hacking: Its is about stealing someone’s personal information (like login password ,id of facebook ,orkut or any such account, stealing some organizations detail) with the help of unwanted coding which is mostly done by black hat hackers.
Identity Theft: When the cyber crime takes place with the help of someone’s personal information without coming in the notice of that person. It is basically a tool with the help of which frauds take place; it is sometimes used to manipulate data’s and many fraud schemes
IP Spoofing: It is a technique in which hacker access to someone else computer by creating the image of trusted access, in which intruder sends the information from the trusted host IP address, in order to break the secure and trusted IP address hacker need to use various techniques in order to make modification in the packet headers so that packet appears to be coming from trusted host IP address.
Phishing: It is a technique in which fraudster tries to steal individuals personal information such as passwords, credit card and bank account number via emails and other electronic communication, in this victim is been provided with a hyperlinks with take victims to the fraud sites and after that fraud take place by providing showing golden world to user in order to con them. There is also one term known as Voice Phishing, in this fraudster copies someone’s voice in order to gain personal information.
Spam: It is the channel or technique the user of electronic mail services gets bulk of emails in which they have been provided with the best offers on the product and services. The main purpose of the such mail is to con user, if the user get trapped in the offer which they are providing, then before completing the deal they ask for the payment to be made, and once you made the payment or provide the information of
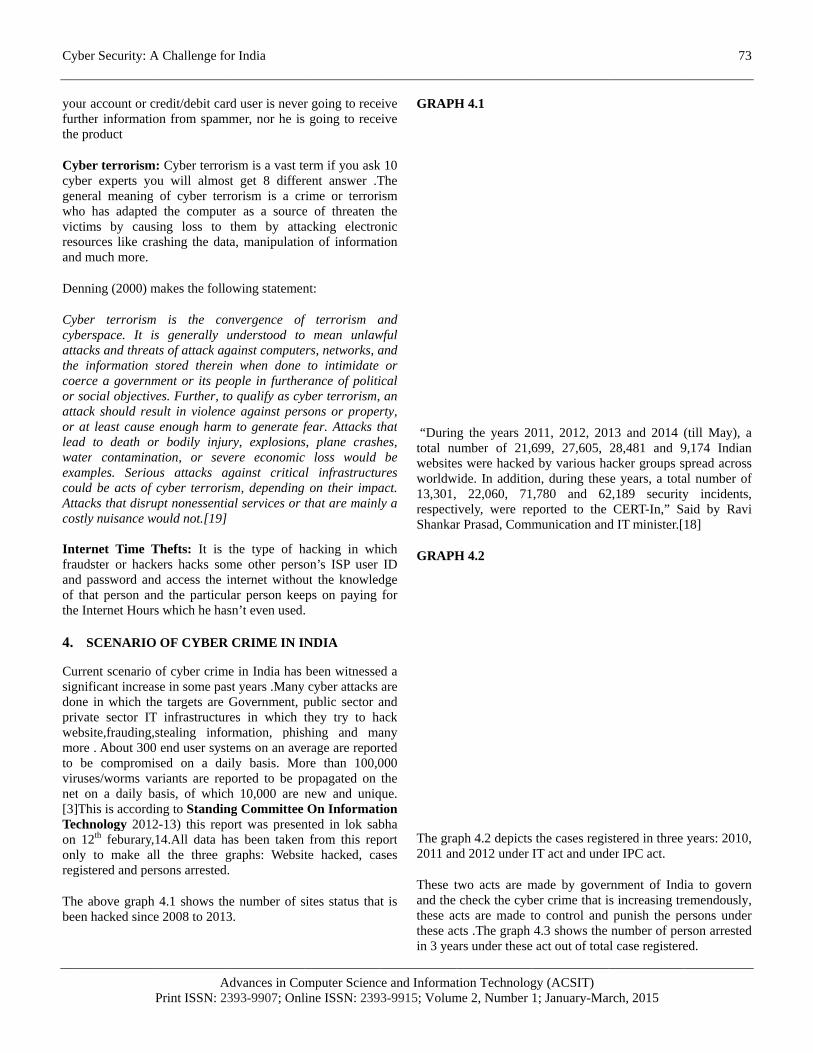
Cy
youfurthe
Cycybgenwhvicresand
De
Cycybattthecoeor attor leawaexacouAttcos Intfraandof the
4.
Cusigdonpriwemoto virnet[3]Teon onreg
Thbee
yber Security: A
ur account or crther informatie product
yber terrorismber experts yoneral meaningho has adaptedctims by caussources like crd much more.
enning (2000) m
yber terrorismberspace. It itacks and threae information erce a governmsocial objectiv
tack should resat least cause
ad to death oater contaminaamples. Seriould be acts of tacks that disrustly nuisance w
ternet Time Taudster or hackd password anthat person an
e Internet Hour
SCENARIO
urrent scenario gnificant increane in which thivate sector ITebsite,frauding,ore . About 300
be compromiruses/worms vt on a daily b]This is accordchnology 20112th feburary,
ly to make agistered and pe
he above graphen hacked sinc
A Challenge fo
APrint ISSN: 23
credit/debit carion from spam
m: Cyber terrorou will almos
g of cyber terrd the computesing loss to rashing the dat
makes the follo
m is the cois generally uats of attack ag
stored thereinment or its peves. Further, tosult in violence enough harmor bodily injuation, or sev
ous attacks agf cyber terrorisupt nonessentia
would not.[19]
Thefts: It is kers hacks somnd access the ind the particulrs which he has
O OF CYBER
of cyber crimase in some pashe targets are T infrastructur,stealing infor0 end user systised on a daariants are rep
basis, of whichding to Standin2-13) this repo,14.All data h
all the three gersons arrested.
h 4.1 shows thce 2008 to 2013
or India
Advances in Co393-9907; Onl
rd user is nevermmer, nor he is
rism is a vast test get 8 differrorism is a crer as a sourcethem by atta
ta, manipulatio
owing statemen
nvergence ofunderstood togainst computen when done ople in furthero qualify as cyce against persm to generate fry, explosions
vere economicgainst criticasm, dependingal services or
the type of hme other persointernet withoular person keesn’t even used.
CRIME IN IN
me in India has st years .ManyGovernment, p
res in which trmation, phistems on an aveily basis. Moported to be ph 10,000 are
ng Committee ort was presenas been taken graphs: Websi.
he number of s3.
omputer Sciencline ISSN: 239
r going to reces going to rece
erm if you askrent answer .Trime or terrorie of threatenacking electroon of informat
nt:
f terrorism ao mean unlawers, networks, a
to intimidaterance of politi
yber terrorism,sons or properfear. Attacks ts, plane crashc loss wouldal infrastructug on their impathat are mainly
hacking in whon’s ISP userut the knowledeps on paying.
NDIA
been witnessey cyber attackspublic sector athey try to hahing and ma
erage are reporore than 100,0ropagated onnew and uniqOn Informati
nted in lok sabfrom this rep
te hacked, ca
sites status that
ce and Informat3-9915; Volum
eive eive
k 10 The ism the
onic tion
and wful and
or ical an
rty, that hes,
be ures act. ly a
hich ID
dge for
ed a are and ack any rted 000 the
que. ion bha port ases
t is
GRAPH
“Durintotal nuwebsiteworldw13,301,respectiShankar
GRAPH
The gra2011 an
These tand thethese acthese acin 3 yea
tion Technologme 2, Number
H 4.1
ng the years 20umber of 21,6es were hacked
wide. In additio 22,060, 71ively, were rer Prasad, Comm
H 4.2
aph 4.2 depictsnd 2012 under
two acts are mcheck the cyb
cts are made tcts .The graphars under these
gy (ACSIT) 1; January-Ma
011, 2012, 20699, 27,605,
d by various haon, during thes,780 and 62
eported to the munication and
the cases regisIT act and und
made by goverber crime that ito control and 4.3 shows the act out of tota
arch, 2015
13 and 2014 (28,481 and 9acker groups sse years, a tota2,189 security
CERT-In,” Sad IT minister.[
stered in threeder IPC act.
rnment of Indiis increasing tr
punish the penumber of per
al case registere
73
(till May), a 9,174 Indian pread across
al number of y incidents, aid by Ravi 18]
years: 2010,
ia to govern emendously, ersons under rson arrested ed.

74
GR
5.
CEinvto cybmawhpre
6. 6.1It ima
RAPH 4.3
CYBER CRIN
ERT-IN is thevolves the grourespond to an
ber security ofanagement serhich comes undeventing cyber
It coordinatetake make anIt is an advicyber crimimminent thrIt work wgovernment solution for aIt helps in Aand its malicIt helps in Abasis It helps orgthreats. It help manprofiling theInteract witeffective andinvestigationIt Conduct cyber securit It Develop from cyber cIt is Collaboeffective inc
POLICY IN1. CCMP (Cybis the initiativeanage the cybe
APrint ISSN: 23
RIME PREVE
e Indian Compup of experts wny problem thf the country arvices. It is der Technolog attacks are:- es the responsend also respondisory which gie and givesreats.
which the secand many m
all the securityAnalyzing thecious code Analysizing th
ganizations to
ny organization network and t
th vendors and timely solutin training progrty to create awsecurity guide
crime. rating with Indident resolutio
NITIATIVES ber Crisis Mae which governer crime. So th
Advances in Co393-9907; Onl
ENTION: RO
puter Experts who handle or hat is being raand also perfor
the Governmgy. Some main
es to the securd to the major ive advices on s timely war
curity expertsmore to identiy problems. e vulnerabilitie
he web defacem
mitigate spam
ns: public andthen attacking snd others at lions for incide
rams on specwareness among
lines in order
dustry so that won
nagement Planment of Indiahat we are ab
omputer Sciencline ISSN: 239
OLE OF CER
Response Teimmediate rea
aised againstrm service qual
ment organizatrole of CERT
rity incidents tevents. Issues related
rnings regard
s on industryify the optim
es of the prod
ments on regu
ms and anomo
d private bothsystems large to prov
ent resolution a
ialized topicsg the peoples to protect peo
we can have so
an) a takes in orderle to identify
ce and Informat3-9915; Volum
RT-
eam ady the lity tion T-In
that
d to ding
y , mum
duct
ular
ous
h in
vide and
of
ople
ome
r to the
cyber rito dealreducecrisis mthere to
6.2. Na
Nationahas beeInformaInformamain foprivatethe infoable tovariousthe poli2014.Toplace wCenter)
Nationasecurityincludetrainingold andcyber cr
6.3. InfThe Inf2000 orof 20009th Junecame in
The actto faciliagencieinformawhich i
The mathe tranauthentiact wasable toin 200CommuITAA-2came ininto forthe ITalso tak
tion Technologme 2, Number
isk and threatswith it by avoit and manage
management do manage and p
tional Cyber S
al Cyber Secuen framed byation Technoloation Technoloocus of this polIT infrastructu
ormation from come up todrawbacks .It
icy it doesn’to overcome thi
which was nam
al Cyber Cooy and e-surves the preventio
g to the cyber cd outdated cyberimes in the co
formation Techformation Techr the IT Act) is0) which camee 2000 and innto force.
t demanded foritate electronic
es which invoation. This laws used in the co
ain purpose ofnsaction purpoification under
s not able to cosolve the prob08 the firsunication techn2008(Informatinto the presidece on 27th OctoAct-2000.It ga
ke care of the d
gy (ACSIT) 1; January-Ma
s easily and aftoiding it or take it. In differe
department, in portfolio the ris
Security Polic
urity Policy(NCy DeitY(Deparogy), Ministryogy, (GOI)Golicy is to protecure from the cy
m the fraudsterthe expectati
t was found thcame into the
is problem Themed as NCCC(N
ordination Ceeillance agencon strategies tocrime investigaer laws. In ordeountry.
hnology Act, 2hnology Act 2s an Act of the in the assistan
n the same yea
r the legal provc filling of doclves many pa
w is applied alontext of comm
this act was tose in which dr the law .But dome up to the
blem for whichst legislation nology was mion Technologyents assistance ober 2009.It coave recoginza
data privacy and
Ms. Sh
arch, 2015
fter identifyingking some stepent organizatio
which cybersk.
cy, 2013 (NCSP
CSP)) is the prtment of Elecy of Communovernment ofct or govern th
yber crime, ands .But the polions, it was shat after the dee force till 21e new policy InNational Cyber
entre proposecy in India.o the cyber criation and also rer to protect th
2000 and Cyb2000 (also knoe Indian Parliamnt of presidentar on October
vision for the ecuments with gaper work andl kind of datamercial activiti
o get legally redigital signaturedue to some drexpectations a
h it was made.for Inform
made which way Amendmenton 5th Feb 200
overed all the dtion to e trand many more.
huchi Shukla
we are able s in order to
ons we have experts are
P-2013)
policy which ctronics and nication and
India. The he public and d also to save licies wasn’t suffering the eclaration of st November nitiative took r Coordinate
ed the cyber It basically
ime, provide review some
he number of
er Security own as ITA-ment (No 21 t of India on
17, 2000 it
e-transaction governments’ d storage of
information ies.
cognized for e should get rawback this and not been So after that
mation and as known as Act 2008).It 09 and came drawbacks of nsaction, and

Cyber Security: A Challenge for India 75
Advances in Computer Science and Information Technology (ACSIT) Print ISSN: 2393-9907; Online ISSN: 2393-9915; Volume 2, Number 1; January-March, 2015
7. CYBER CELLS
There are currently 21 cities in India in which cyber cells are working as per the updated list from Information Security Awareness program by Department of Electronics and Information Technology, Government of India till 8th January 2015.The list cities are given below
Table 7.1
S. No Name Of Cities Have Working Cyber Cells 1 Assam 2 Bangalore 3 Bihar 4 Chennai 5 Delhi 6 Gujarat 7 Haryana 8 Himachal Pradesh 9 Hyderabad 10 Jammu 11 Jharkhand 12 Kerala 13 Meghalaya 14 Mumbai 15 Orissa 16 Pune 17 Punjab 18 Thane 19 Uttarakhand 20 Uttar Pradesh 21 West Bengal
Source: http://infosecawareness.in/cyber-crime-cells-in-india this is updated list till 8th Jan 2015
8. PREVENTION INDIVIDUAL SHOULD TAKE IN ORDER TO PROTECT HIMSELF/HERSELF FROM THE CYBER WEB TRAP.
Some steps and practices that can help one to minimize risk of being trapped in web of cyber crime:
Updating of Computer Systems This step avoid the cyber attack and in this we make sure that are system are up to date means it is fully equipped with all the updated software ,latest antivirus. But it doesn’t make sure that your system is cent percent safe .However, it make difficult for hackers to access the system.
Protecting computer with security software Security software is that software which helps to guard computer from malicious programs. Security software basically includes ant viruses and firewall.
Choosing strong passwords Password is the way to secure your account or data, so always select the strong password .Avoid the password which is common or can be easily be
hacked by hackers. Always choose the password which is the combination of lowercase, uppercase, numbers and special characters .And make the habit of changing password very frequently.
Guard/Protect Personal Information In order to take advantage from any online site you need to provide your personal details. So in that case guard your personal information one should be very careful while taking advantage of such services, it should only be done from trusted sites. Phishing mails should be avoided, don’t respond to unknown mails and tell the personal information to them, guard your email with the spammers.
9. PROPOSED MODEL
Take the help from right person If some kind of repair or assistance is needed to rectify the computer problem like maintenance or software updating then computer technician called for the help should be authenticated service provider or a certified computer technician. So that there is no threat to your data.
Social-Media Savvy The social media profile should be set to the privacy setting and review the security setting at frequent interval of time

Ms. Shuchi Shukla
Advances in Computer Science and Information Technology (ACSIT) Print ISSN: 2393-9907; Online ISSN: 2393-9915; Volume 2, Number 1; January-March, 2015
76
Secure Mobile Devices & Secure wireless network mobile devices and the wireless networks at home are more vulnerable if they are not properly secure. So while downloading applications in mobile be aware and choose trusted source
10. CONCLUSION
Internet and communication Technology is influencing everyone’s life in one or another way. In comparison to all other developing countries it was found that India has 243 millions internet user .As number of cyber usage is increasing in the same way number of cyber crime is also increasing. It has been seen that most of the cyber crimes that takes place is done by young generation .This study review us about the criminal offence that take place with the help of computer .It tells us about the websites that is been hacked in some past years .We can draw that the result about the various schemes, practices and the awareness program that can help an individual, organization to beware of the cyber crimes. In this research we have analyzed the steps that an individual should take care of in order to protect himself/herself from the fraudsters .In the upcoming time Information security teams would requires more number of skilled experts to deal with the different type of the cyber attackers. Every individual should be more careful at the time of dealing with any type of online transaction or while telling your personal information to someone.
Nowadays cybercrime has become a global issue which need to be resolved, therefore many laws has been enforced by different agencies including State police to collaborate with the CBI(Central Bureau of Investigation),NTRO(National Technical Research Organization) , Cert-In (Computer Experts Response Team-Indian) and INTERPOL to reduce number of cyber crimes.
REFERENCES
[1] Crime in India: 2011-Compendium (2012), National Crime Records Bureau, Ministry of Home Affairs, Government of India,New Delhi, India.
[2] Cyber Law & Information Technology (2011) by Talwant Singh, Additional District & Sessions Judge, New Delhi, India.
[3] Fifteenth Lokha Sabha , Fifty-Second Report, Standing Committee On Information Technology (2013-14),Ministry Of Communications And Information Technology (Department Of Electronics And Information Technology) Cyber Crime, Cyber Security And Right To Privacy
[4] Godbole & Belapure ,Cyber Security: Understanding Cyber Crimes, Computer Forensics and Legal Perspectives, Wiley India Pvt. Ltd, New Delhi, India,2012.
[5] Haldaer & JaishankarCyber Crime and the Victimization of Women: Laws, Rights and Regulations ,IGI Global, USA,2011.
[6] [6] Muthukumaran ,”Cyber Crime Scenario In India”, Criminal Investigation Department Review,Januaray 2008
[7] Nagpal,Introduction to Indian Cyber Law , Asian School of Cyber Laws, Pune, India,2008.
[8] Seth,Cyber Laws in the Information Technology Age , Jain Book Depot, New Delhi, India,2009.
[9] Shrivastav& Ekata,” ICT Penetration and Cybercrime in India: A Review”, International Journal Of Advanced Research In Computer Science and Software Engineering, Volume 3 ,Issue 7,July 2013
[10] Singh & Kandpal ,”Latest Face of Cybercrime and Its Prevention In India”,International Journal Of Basics And Applied Sciences,Vol 2 No. 4
[11] Suri & Chhabra, Cyber Crime ,Pentagon Press, New Delhi, India,2003.
[12] TimesofIndia,http://timesofindia.indiatimes.com/city/nagpur/Cyber-criminals-will-be-more-persistent-elusive-in-2015/articleshow/45754409.cms
[13] http://infosecawareness.in/cyber-crime-cells-in-india
[14] http://www.justice.gov/criminal/ceos/subjectareas/childporn.html
[15] http://www.philstar.com/business/2013/03/12/918801/study-social-networks-new-haven-cybercrime
[16] http://www.symantec.com/en/in/about/news/release/article.jsp?prid=20130428_01
[17] http://en.wikipedia.org/wiki/Computer_crime
[18] http://www.livemint.com/Politics/NNuFBA3F2iX4kxIXqKaX2K/CERTIn-reports-over-62000-cyber-attacks-till-May-2014.html?utm_source=copy
[19] http://www.symantec.com/avcenter/reference/cyberterrorism.pdf
[20] http://www.crime-research.org/library/Cyber-terrorism.htm
[21] http://www.internetworldstats.com/stats3.htm#asia

Advances in Computer Science and Information Technology (ACSIT) Print ISSN: 2393-9907; Online ISSN: 2393-9915; Volume 2, Number 1; January-March, 2015 pp. 77-80 © Krishi Sanskriti Publications http://www.krishisanskriti.org/acsit.html
E ffect of Slots on Oper ating F r equency B and of Octagon M icr ostr ip A ntenna
Simran Singh1, M anpr eet K aur 2 and J agtar Singh3 1M.tech, Electronics and Communication Engg. Yadavindra College of Engineering,
Punjabi University Patiala, Talwandi Sabo, Bathinda-151302, India 2Electronics and Communication Engg. Deptt., Yadavindra College of Engineering,
Punjabi University Patiala, Talwandi Sabo, Bathinda-151302, India 3
Abstract—In this paper design and compare slotted and Unslotted hexagonal patch microstrip antenna by using microstrip feed line which is easy impedance matching to 50 ohm and simulated with the help of HFSS 11 software. The proposed antenna have compact in size the total size of antenna 30 × 31 mm
Electronics and Communication Engg. Deptt., Yadavindra College of Engineering, Punjabi University Patiala, Talwandi Sabo, Bathinda-151302, India
2
1. I NT R ODUC T I ON
and teflone used as substrate material have dielectric constant 2.2.Due to lower dielectric constant provide higher operating bandwidth . This antenna can designed for C-band and X-band applications whose range is from 4-8 GHz and 8-12 GHz. The antenna design with slot on patch has 4.2db gain , return loss-11.96 dB and 290 MHz bandwidth when it operate on 4.35 GHz and at the 7.55 GHz it has 3.2dB gain , return loss -13.53dB and 330 MHz bandwidth and at 10.3 GHz it has 7db gain , return loss -26.72dB and 1100MHz bandwidth .When antenna design without slot it has return loss -12.72 db , 40 MHz bandwidth and -8db gain at 3.35 GHz , return loss -14.76 db,130 MHz bandwidth and gain 1.8dB at 6.10 GHz, return loss -13.26 dB,130 MHz bandwidth and 2.6db gain at 6.60 GHz , return loss -12.77db,160 MHz bandwidth and -3.4 db gain at 10.55 GHz. The simulation model of the proposed slotted antenna designed using software Ansoft HFSS. Key words: Slotted and unslotted microstrip antenna , Teflon.
The field of antenna design has become one of the most attractive fields in the communication. Antenna is the one of most important elements of the wireless communications systems. The antenna designed to transmit and receive electromagnetic wave. The microstrip patch antenna is one of the recently developed types of antenna. Communication has an important role to play in the worldwide society. Now days as the communication systems are rapidly changing over from “wired to wireless”. Wireless technology provides low charge alternatives and a flexible way use for communication [1].The microstrip antenna mostly useful for such as aircraft, spacecraft, satellite, and missile applications, where size ,weight, cost, performance, ease of installation, and aerodynamic profile are constraints .Where low profile antenna may be need. Now a days there are many other
government and commercial applications, such as mobile radio and wireless communications that's have similar specifications. To fulfill these requirement the microstrip antenna may be used .The other advantage of micro strip antenna is simple in structure and easy to manufacture facility and it’s also mechanical rebuts [2]. This antennas are suitable for planer and non planer surface. They are light in weight, low volume ,low cost, low profile ,smaller in dimension and ease of fabrication and conformity. However a microstrip patch antennas naturally have narrow bandwidth and enhancement is usually a demand for practical applications .So for extending the bandwidth countless approaches have been utilized for multi frequency applications.
2. A NT E NNA C ONF I G UR A T I ON
The antenna dimensions calculate by following : -
2
1
7726.12
ln2
1
−
+
+=
hF
FhFa
r
πεπ (1)
Where F can be calculated by using
rrfF
ε
910791.8 ×=
..................... (2)
F=resonant frequency of patch
.7726.12
ln2
12
1
++=
ha
ahaa
re
πεπ ....... ...(3)
a=Actual radius of patch, h=height of substrate, Ɛr=dielectric
constant of substrate.
Angle of Inerier=2 𝑛𝑛−4𝑛𝑛
* 90 (4)
n=number of segment.

Simran Singh, Manpreet Kaur and Jagtar Singh
Advances in Computer Science and Information Technology (ACSIT) Print ISSN: 2393-9907; Online ISSN: 2393-9915; Volume 2, Number 1; January-March, 2015
78
The effective radius of the antenna is obtained with equation given by Where fr is the operating frequency of antenna and εr is the dielectric constant of material and h is the thickness of the circular patch.
F ig. 1: Slotted patch hexagonal microstr ip antenna
Table 1: Same Dimension for both slotted and unslotted antenna
Dimension of substrate 30 × 30 𝑚𝑚𝑚𝑚2 Height of substrate 1.8 mm Dielectric constant Ɛr 2.1 Radius of patch 13 Dimension of feed line 3 × 3𝑚𝑚𝑚𝑚2 Number of segment 8
3. R E SUL T
R esult for slotted patch octagon micr ostr ip antenna
Table 2: Dimension of slot in octagon patch Size a arms of left triangle slot 5 × 5 × 5mm Size a arms of right triangle slot 5 × 5 × 5mm Radius of octagon slot 3 mm Interial angle of octagon slot 135˚ Length of each segments of octagon slot 2 mm Number of segments of octagon slot 8
F ig. 2: R etur n loss of slotted octagon patch antenna
The parameter VSWR is a measure that numerically describes how well the impedance of antenna has matched to the radio or transmission line to which it is connected. VSWR is a function of the reflection coefficient, which describes the power reflected from the antenna. The VSWR 1.67 at frequency band 4.35 GHz, a VSWR 1.53 at frequency 7.55 GHz and VSWR 1.09 at frequency band 10.3 GHz.
F ig. 3: V SW R of slotted octagon patch antenna
T otal G ain of antenna
Its another useful parameter to describe a performance of antenna. The gain is closely related to antenna directivity. The directivity describe a directional properties of antenna. Antenna give a different gain at different frequency. Gain 3dB at frequency 4.35GHz , 3dB at frequency 7.55 GHz and 7dB at frequency 10.3 GHz.
F ig. 4: G ain at frequency 4.35 G H z

Effect of Slots on Operating Frequency Band of Octagon Microstrip Antenna 79
Advances in Computer Science and Information Technology (ACSIT) Print ISSN: 2393-9907; Online ISSN: 2393-9915; Volume 2, Number 1; January-March, 2015
F ig. 5: G ain at frequency 7.55 G H z
F ig. 6: G ain at frequency 10.34 G hz
R esult of unslloted patch micr ostr ip antenna
F ig. 7: R etur n loss of unslotted octagon patch microstr ip antenna
The return loss (S) -12.49dB at frequency 3.35 GHz,-14.76 dB at frequency 6.10GHz,-13.26dB at frequency 6.60 GHz and -12.77dB at frequency 10.55GHz.
VSWR 1.16 at frequency 3.35GHz , 1.44 at frequency 6.10GHz,1.55 at frequency 6.10GHz and 1.59 at frequency 10.55 GHz.
F ig. 8: V SW R of unslotted octagon patch microstr ip antenna
T otal gain of antenna
F ig. 9: G ain at frequency 3.35 G H z
F ig. 10: G ain at frequency 6.10 G H z

Simran Singh, Manpreet Kaur and Jagtar Singh
Advances in Computer Science and Information Technology (ACSIT) Print ISSN: 2393-9907; Online ISSN: 2393-9915; Volume 2, Number 1; January-March, 2015
80
F ig. 11: G ain at frequency 6.60 G H z
F ig. 12: G ain at frequency 10.55 G H z
T able 3: C ompar isons of slotted and unslotted micr ostr ip antenna
Patch Freqency
band
Band width
Return loss
VSWR
Gain Radition Efficienc
y Slotted 4.35
GHz 290
MHz -11.72 dB 1.67 3 dB 94%
7.55 GHz
330 MHz
-13.53 dB 1.53 3.2 dB 96%
10.55 GHz
110 MHz
-26.72 dB 1.09 7 dB 92%
Unslotted
3.35 GHz
40 MHz -12.49 dB 1.16 -8 dB 44%
6.10 GHz
130 MHz
-14.76 dB 1.44 1.8 dB 64%
6.60 GHz
130 MHz
-13.26 dB 1.55 2.6 dB 70%
10.55 GHz
160 MHz
-12.77 dB 1.59 3.4 dB 60%
4. C ONC L USI ONS Octagon microstrip antenna designed with slot and without slot on compact octagon patch using microstrip line feed for a wide band wireless communications systems is fabricated on TEFLON and designed in HFSS. The result demonstrates that the proposed antenna with triangular and octagon slots and the cuts at special positions can to generate steady radiation patterns and is capable of wrapping the frequencies demanded by UWB Communication system, RFID, GSM, Wi-Fi and Wimax. Good agreement between the simulated and measured results further validates the utility of proposed antenna for given applications. Different design parameters with their effects were a studied. From the measurement results, this when this antenna is designed with slot give a performance at band 4.35 GHz a return loss is -11.96 dB ,bandwidth 290 MHz and gain 4.2 dB, at 7.55 GHz a return loss is -13.53dB , bandwidth 330MHz and gain 3.2 db, at 10.3 GHz a return loss is -26.72dB,bandwidth 1100 MHz and gain 7dB and the unslotted antenna at 3.35 GHz a return loss is -12.49dB,bandwidth 40 MHz and gain -8dB,at 6.10GHz a return loss-14.76 dB ,bandwidth 130 MHz and gain 1.8dB ,at 6.60 GHz a return loss -13.26dB,bandwidth 130MHz and gain 206dB,at 10.55 GHz a return loss -12.77 dB ,bandwidth 160MHz and gain -3.4dB. The slots and cut used here plays an important role in balancing resistive part and reactive part which affects the impedance matching.
R E F F E R E NC E S
[1] Rajeshwar Lal Dua,Himanshu Singh and Neha Gambhir,“2.45 GHz Microstrip Patch Antenna with Defected Ground Structure for Bluetooth,’’ International Journal of Soft Computing and Engineering (IJSCE) ,vol.1,pp 2231-2307,January 2012.
[2] S. S. Karthikayan Sushant S. Gaikwad, Meenakshi Singh, Ayachi Ajey,“ Size Miniaturized Fractal Antenna for 2.5GHz Application,” IEEE Students' Conference on Electrical, Electronics and Computer Science, vol 98 ,pp 4437-4434, ISSN 978-1-4673-1515-9, July 2012.
[3] C. A Balanis, “Antenna Theory: Analysis and Design, 3rd Ed, John Wiley & Sons, Inc, New York,2005.
[4] K. D parsandh ,“ Antenna and wave propagation , 3rd
[5] Tommi Hariyadi,“A Coplanar Waveguide (CPW) Wideband Octagonal Microstrip Antenna ,’’ IEEE International conference of information and communication technology ,vol–978,June 2013.
addition , satya parakasan ,New delhi.
[6] Ding Yu,WeiLong Liu and ZhenHao Zhang,“ Simple Structure Multiband Patch Antenna With Three Slots,’’IEEE,Middle East Conference on Antennas and Propagation (MECAP) vol-6,pp 247-254 , 2012.
[7] Mohamed A. Hassanien and Ehab K. I. Hamad,“ Compact Rectangular U-Shaped Micros trip Patch Antenna For UWB Application,’’ IEEE APS, (MECAP),Oct – 2010.
[8] Qing-Xin Chu and Liang-Hua Ye ,“ Design of Compact Dual-Wideband Antenna With Assembled Monopoles,” IEEE transaction ,vol–58,pp 4063 – 4066,Feb 2010.
[9] Nagendra Kushwaha and Raj Kumar,“ Design Of Slotted Ground Hexagonal Microstrip Patch Antenna and Gain Improvement With FSS Screen,” vol–51,pp 117–199, March 2013.
[10] Saurabh Sharma ,Anil Kumar, Ashish Singh , A.K. Jaiswal,“ Compact Notch Loaded Microstrip Patch Antenna For Wide Band Application”, International journal of Scientific and Research Publication,vol-2,pp 2550-3153 ,May 2012.

Advances in Computer Science and Information Technology (ACSIT) Print ISSN: 2393-9907; Online ISSN: 2393-9915; Volume 2, Number 1; January-March, 2015 pp. 81-85 © Krishi Sanskriti Publications http://www.krishisanskriti.org/acsit.html
Scalability Issues in Software Defined Network (SDN): A Survey
Smriti Bhandarkar1, Gyanamudra Behera2 and Kotla Amjath Khan3 1M. Tech. Student School Of Computer Engineering KIIT University, Bhubaneswar, Odisha 2M. Tech. Student School Of Computer Engineering KIIT University, Bhubaneswar, Odisha
3School Of Computer Engineering KIIT University, Bhubaneswar, Odisha E-mail: [email protected], 2 , [email protected] 3
Abstract—Software defined network deals with splitting of infrastructure layer from control layer which enhances the programming capability, flexibility, malleability and manageability of the network. This survey concerns about scalability issues in SDN which includes modification of hardware and software of networking devices and basic centralized architecture of SDN. We also give some light on scalability evaluation of different models of SDN. So, we conclude that by distributing control/intelligence over multiple controllers scalability of network can be increased. Keywords : scalability, data plane, control plane, hierarchy of SDN
1. INTRODUCTION
Software defined network[1-3] is a new emerging technology in the field of networking in which programs written in high-level languages like C, java, ruby, Perl etc for control plane by the network administrator are used to control the behavior of whole network.
Even though the traditional network is fully developed, it is unable to fulfill today's network requirements. There is no such a big change in this network, since 1970. The reasons for the need of this technology is as follows[4-5]
1. Change in traffic patterns 2. Complex network operations and management 3. Intelligent system which control behavior of lots of
network devices 4. Increase in amount of data i.e. big data
In spite of having lots of benefits over traditional network like flexible, adaptable, manageable, cost effective(in terms of time), scalability of SDN is a big issue i.e. centralized nature of control plane is not friendly with the growing organizational network.
There are various factors which affects the scalability of SDN. They are 1. Processing power of controllers and forwarding devices 2. Capacity of memory/buffer
3. Placement of controllers in the network 4. Latency/delay between controllers and network devices to
transfer packets 5. Traffic in the link
In this paper, we focus on challenges in SDN to scale-up the network and their proposed solutions. For this, we get that scalability of SDN can be enhanced by resolving the scalability issues of data plane and control plane. The rest paper is organized as follows. Section 2 discusses History of SDN. Section 3 focuses on Scalability issues of data plane. Section 4 focuses on hierarchy of SDN models and their scalability issues and finally section 5 has conclusion of paper with future work.
2. HISTORY OF SDN
The SDN has a incredibly long history but it is a recent concept in the field of networking and research. It depends on the concept of three existing network technologies i.e. programmable/active networks, centralized networks and network virtualization.
In active networks[6], each and every node has the capability to do computations and modifications on the content of the packets. It supports packet downloading and some tiny programs are appended in that packet then both are encapsulated in frames which are transmitted and processed at every node of the network along with their route.
The centralized network[7] has the concept that the server on the middle of the network controls and monitors other devices present in the network in the same way controller control and monitor the forwarding plane by providing services from the management plane.
The main idea of virtual networks[8] is to represent one or more logical network topologies on the single network infrastructure. It creates logical/virtual networks that are

Smriti Bhandarkar, Gyanamudra Behera and Kotla Amjath Khan
Advances in Computer Science and Information Technology (ACSIT) Print ISSN: 2393-9907; Online ISSN: 2393-9915; Volume 2, Number 1; January-March, 2015
82
decoupled from the underlying network hardware to ensure the network can better integrate and support increasing virtual environments. In virtual infrastructure, NV(network virtualization) can be used to create virtual network and this enables us to support the complex requirements in multi-tenancy environment. For example, it isolates network traffic in zones/containers. Tempest[9] is the first network virtualization project in which several switchlets runs on the top of the single ATM switch and share the same physical resources.
The concept of splitting infrastructure layer from the control layer[10] e.g. RCP[11] makes it different and more flexible from the traditional network ForCES[12] and OpenFlow[13] are the communicating protocols between control plane and forwarding plane. By using these protocols the controllers dynamically modifies the flow table entries in the flow table of the forwarding plane by adding , deleting and updating the flow entries.
The ONF[14] is the open source consortium which promotes the adoption and concepts of SDN by developing the OpenFlow protocol as standard protocol to communicate between the control plane and data plane(currently released version 1.4.0).
3. SCALABILITY ISSUES OF DATA PLANE
In the infrastructure layer, scalability is enhanced by modifying the hardware and software of the network or forwarding device means it depends on memory size and processing speed of CPU.
Kannan et al.[15] works on TCAM flow table size and power dissipation. They proposed the compact TCAM in which flow entries in the TCAM are replaced by shorter flow-ID and a field flow-ID is added/modified in the packet header. The controller contains a new special table known as flow-ID table to store the ID of various flows in the network.
Narayanan et al.[16] modifies the hardware of the switch by using multi-core programmable ASIC's and its architecture by using a high-speed bus and splitting the forwarding path into TCAM-based and software based path. This enhances the bus speed between on chip CPU and pipeline.
Lu et al.[17] uses the well equipped switches having powerful CPUs and DRAM (in GB) to setup an internal link having high bandwidth between ASIC and CPU.
Tanyingyong et al.[18] proposed a lookup procedure (software based) which used standard NIC and having cache flow table entries on that network interface card(NIC).
Luo et al.[19] proposed an OpenFlow switch algorithm which enhances the lookup procedures in the switch and CPU power.
Kang et al.[20] prepared an algorithm for the rule replacement in the controller which distributes the forwarding polices throughout the network and also update the flow table dynamically with the new flow entries.
4. HIERARCHY OF SDN AND THEIR SCALABILITY ISSUES
The SDN has centralized and decentralized architectures.
4.1. Centralized Model
In this architecture, the network intelligence i.e. control plane is centralized which means the single controller has the global view of network and it handle whole network as shown in fig. 2.
Devoflow[21] has the centralized architecture, it reduces the traffic i.e. flow requests and statistics between control layer and infrastructure layer by cloning rules, triggers and sampling. Shorter-flows are handled by data plane and important-flows are transferred to control layer, it reduces the traffic going towards the controller and enhance scalability.
Zuo Qingyun et al.[22] works on centralized architecture to increase the scalability of the network by reducing network traffic, for this they provide intelligence in the switch to handle the redundant packet-in messages and collects the flow
CONTROLLER
SWITCH SWITCH SWITCH
Fig. 2: Centralized control plane.
SDN
CENTRALIZED DECENTRALIZED
VERTICALLY DISTRIBUTED/ HIERARCHIAL
HORIZONTALLY DISTRIBUTED
Fig. 1: Hierarchy of SDN.

Scalability Issues in Software Defined Network (SDN): A Survey 83
Advances in Computer Science and Information Technology (ACSIT) Print ISSN: 2393-9907; Online ISSN: 2393-9915; Volume 2, Number 1; January-March, 2015
statistics from the data plane by using statistics server and sends a summarize report to the controller.
FlowVisor[23-24] is a special OpenFlow controller behaves like a transparent proxy running between switches and multiple controllers. It manages many controllers by slicing the network resources and tell one controller to control and monitor its own slice.
4.2. Decentralized Model
control plane splits between a number of controllers. The network is handled by two architectures
1. Horizontal ly d is tr ibuted control p lane 2. Vert ical ly dis t r ibuted control p lane
4.2.1. Horizontally Distributed Control Plane. Multiple controllers with comparatively equal capabilities control the whole network as shown in fig. 3.
In this architecture, single controller has the topology information of switch connected to the controller and the neighbor controller (local view) or the image of the whole network (global view). The controllers communicate with each other by using east-west bound interface.
Onix[25] has distributed control over the network. There exists some general API to access the network state distributed over the onix instances.
Hyperflow[26] takes the advantages of centralized control plane and gives the authority to all the controllers to share the same network wide view/global view and locally process the requests without disturbing any other remote node.
4.2.2. Vertically Distributed Control Plane. In this architecture, controllers/switches are arrange in a hierarchical level in which lower level sends network information to upper or higher level.
kandoo[27] has the hierarchical structure of two level as shown in fig. 4(a) in which the root controller manages those applications which require global view of the network like load balancing, routing etc and acts as a mediator between local controllers for co-ordination.
DIFANE[28] has the hierarchical structure as shown in fig. 4(b). Switches in the first level has the intelligence to manage some of the messages which makes it more scalable than architecture shown in fig. 4(a). The network administrator has the power to forward, modify, drop and measure the traffic on the switch. It works on two basic ideas
1. Distr ibute the ru les over the author i ty switches .
2 . The controller par t i t ion the ru les according to the par t i t ion algor i thm.
PALETTE[29-30] follows the ideas of DIFANE and uses pivot bit decomposition method and cut based decomposition graphical method to partition the flow table. Then, the minimized flow tables are distributed over the network to the different authority switches. To check the minimization of flow table they use Rainbow path coloring problem.
R-SDN[31] has a vertically distributed control plane. Number of network/forwarding devices on each layer increases according to the Fibonacci series as the idea keep in mind that series increase like branches of a tree (spanning tree) with no loop. They manages the network by using Fibonacci heap ordered tree for load balancing and routing. The algorithm is solvable in polynomial time and gives less response time as compared to the traditional network.
CONTROLLER
CONTROLLER CONTROLLER
SWITCH SWITCH SWITCH
Fig. 4(a): Vertically distributed control plane.
HOSTS HOSTS HOSTS
CONTROLLER
SWITCH SWITCH SWITCH
CONTROLLER
Fig. 3: Horizontally distributed control plane.

Smriti Bhandarkar, Gyanamudra Behera and Kotla Amjath Khan
Advances in Computer Science and Information Technology (ACSIT) Print ISSN: 2393-9907; Online ISSN: 2393-9915; Volume 2, Number 1; January-March, 2015
84
5. SCALABILITY EVALUATION OF DIFFERENT MODELS OF SDN
Jie Hu et al.[32] proposes a metric which evaluates scalability of different models of SDN i.e. centralized control plane, vertically distributed/hierarchical control plane and horizontally distributed control plane.
They define scalability of controller contains number of nodes varies from 𝑁𝑁1 to 𝑁𝑁2 as follows
𝜑𝜑(𝑁𝑁1 ,𝑁𝑁2) = 𝐹𝐹(𝑁𝑁1)𝐹𝐹(𝑁𝑁2) (1)
where,
𝐹𝐹(𝑁𝑁1) and 𝐹𝐹(𝑁𝑁2) ≡ productivity of control plane having nodes 𝑁𝑁1 and 𝑁𝑁2 respectively
Productivity[33] of control plane is defined as
𝐹𝐹(𝑁𝑁) = 𝜑𝜑(𝑁𝑁) × 𝑇𝑇(𝑁𝑁)𝐶𝐶(𝑁𝑁) (2)
where, 𝜑𝜑(𝑁𝑁) ≡Throughput of control plane for processing network requests 𝑇𝑇(𝑁𝑁) ≡average response time for each request
𝐶𝐶(𝑁𝑁) ≡ cost of deployment of control plane
𝑁𝑁 ≡ Number of nodes in the network
They proposed three theorems in which they find the scalability of different models of SDN and proves that
vertically distributed control plane is more scalable than the other models but they also proves that as the distance between network devices increase the scalability of every model or architecture drops due to delay in packet transfer in the network which is explained in the controller placement problem[34].
Syed A. S. et al.[35] gives the guidelines to modify the design of controller to scale up the network. They do performance evaluation on four controllers floodlight, maestro, nox and becon based on latency and scalability of thread by continuously sending packets to the controller and calculating response time per second for different number of threads and switches.
6. CONCLUSION
By this study, we conclude that SDN is easy to program, manageable and less complex as compared to the conventional network but the basic centralized nature of SDN is bottleneck for scalability of this network and it can be enhanced by decentralizing the control plane and modifying hardware and software of forwarding device and controller for load balancing, routing, traffic engineering etc. We further works on placement of controllers in the network so as to get maximum throughput and efficiency with less cost.
7. ACKNOWLEDGEMENTS
This work was supported by KIIT University, Bhubaneswar, Odisha, India.
REFERENCES
[1] Yosr Jarraya, Taous Madi, and Mourad Debbabi, "A Survey and a Layered Taxonomy of Software-Defined Networking", published in Communications Surveys and Tutorials, IEEE Issue: 99 , 2014.
[2] B. Nunes, M. Mendonca, X. Nguyen, K. Obraczka, and T. Turletti,“A survey of software defined networking: Past, present, and future of programmable networks,”Communications Surveys Tutorials, IEEE,no. 99, pp. 1–18, 2014.
[3] F. Hu, Q. Hao, and K. Bao, “A survey on software defined networking(SDN) and openflow: From concept to implementation,”IEEE Commun. Surveys Tuts., no. 99, pp. 1–1, 2014.
[4] Open Networking Foundation, "Software-Defined Networking: The New Norm for Networks," ONF White Paper, April 12, 2012.
[5] Myung-Ki Shin, Ki-Hyuk Nam,Hyoung-Jun Kim, “Software-Defined Networking (SDN): A Reference Architecture and Open APIs”, International Conference on ICT Convergence (ICTC), 2012.
[6] J. M. Smith and S. M. Nettles, “Active networking: one view of the past, present, and future,” IEEE Trans. Syst. Man Cybern, C, Appl. Rev., vol. 34, no. 1, pp. 4 –18, February 2004.
[7] Yacoby, Amnon, and Eden Shochat. "Centralized network control." U.S. Patent 7,788,366, issued August 31, 2010.
[8] Chowdhury, N. M., and Raouf Boutaba. "A survey of network virtualization." Computer Networks 54, no. 5 (2010): 862-876.
[9] Van der Merwe, J.E., Rooney, S., Leslie, I.M. and Crosby, S.A., "The Tempest - A Practical Framework for Network Programmability", IEEE Network, November 1997
CONTROLLER
SWITCH SWITCH
SWITCH SWITCH SWITCH
Fig. 4(b): Vertically distributed control plane.
HOSTS HOSTS HOSTS
HOSTS HOSTS

Scalability Issues in Software Defined Network (SDN): A Survey 85
Advances in Computer Science and Information Technology (ACSIT) Print ISSN: 2393-9907; Online ISSN: 2393-9915; Volume 2, Number 1; January-March, 2015
[10] SDN[EB/OL].[2013-9-24]. https://www.opennetworking.org/sdnresources/sdn-library /whitepapers. 2013.
[11] M. Caesar, D. Caldwell, N. Feamster, J. Rexford, A. Shaikh, and J. van der Merwe, “Design and Implementation of a Routing Control Platform,” in ACM/USENIX NSDI, 2005.
[12] A. Doria, J. H. Salim, R. Haas, H. Khosravi, W. Wang, L. Dong, R. Gopal, and J. Halpern, Forwarding and Control Element Separation (ForCES) Protocol Specification, http://tools.ietf.org/html/rfc5810/,request for Comments (RFC) 5810. ISSN: 2070-1721. March 2010.
[13] MCKEO WN N, ANDERSON T, BALAKRISHNAN H, et al. OpenFlow: Enabling Innovation in Campus Networks[J]. ACM SIGCOMM Computer
[14] Open Networking Foundation, OpenFlow Switch Specification, October 2013, version 1.4.0
[15] K. Kannan and S. Banerjee, “Compact TCAM: Flow Entry Compaction in TCAM for Power Aware SDN,” in Distributed,Computing and Networking, ser. Lecture Notes in Computer Science, D. Frey, M. Raynal, S. Sarkar, R. Shyamasundar, and P. Sinha, Eds. Springer Berlin Heidelberg, 2013, vol. 7730, pp. 439–444.
[16] R. Narayanan, S. Kotha, G. Lin, A. Khan, S. Rizvi, W. Javed, H. Khan, and S. Khayam, “Macroflows and Microflows: Enabling Rapid Network Innovation through a Split SDN Data Plane,” in European Workshop on Software Defined Net-working (EWSDN), October 25th-26th, Darmstadt, Germany. Washington, DC, USA: IEEE Computer Society, 2012, pp. 79–84.
[17] G. Lu, R. Miao, Y. Xiong, and C. Guo, “Using CPU as a Traffic Co-Processing Unit in Commodity Switches,” in the Proceedings of the first workshop on Hot Topics in Software Defined Networks, ser. HotSDN ’12. New York, NY, USA: ACM, 2012, pp. 31–36.
[18] V. Tanyingyong, M. Hidell, and P. Sjodin, “Using Hardware Classification to Improve PC-based OpenFlow Switching,” in IEEE 12th International Conference on High Performance Switching and Routing (HPSR), 2011, pp. 215–221.
[19] Y. Luo, P. Cascon, E. Murray, and J. Ortega, “Accelerating OpenFlow Switching with Network Processors,” in 5th ACM/IEEE Symposium on Architectures for Networking and Communications Systems, ser. ANCS ’09. New York, NY, USA: ACM, 2009, pp. 70–71.
[20] N. Kang, Z. Liu, J. Rexford, and D. Walker, “Optimizing the “One Big Switch” Abstraction in Software-Defined Networks,” in Proceedings of the 9th conference on Emerging networking experiments and technologies, ser. CoNEXT ’13. New York, NY, USA: ACM, 2013.
[21] A. R. Curtis et al., “DevoFlow: Scaling Flow Management for High-Performance Networks,” Proc. ACM SIGCOMM ’11, 2011, pp. 254–65.
[22] Zuo, Qingyun, Ming Chen, Ke Ding, and Bo Xu. "On generality of the data plane and scalability of the control plane in software-defined networking." Communications, China 11, no. 2 (2014): 55-64.
[23] B. Sonkoly, A. Gulyas, F. Nemeth, J. Czentye, K. Kurucz, B. Novak, and G. Vaszkun, “OpenFlow Virtualization Framework with Advanced Capabilities,” in 2012 European Workshop on Software Defined Networking, October 25th-26th, Darmstadt, Germany., ser. EWSDN ’12. Washington, DC, USA: IEEE Computer Society, 2012, pp. 18–23.
[24] R. Sherwood, M. Chan, A. Covington, G. Gibb, M. Flajslik, N. Handigol, T.-Y. Huang, P. Kazemian, M. Kobayashi, J. Naous, S. Seetharaman, D. Underhill, T. Yabe, K.-K. Yap, Y. Yiakoumis, H. Zeng, G. Appenzeller, R. Johari, N. McKeown, and G. Parulkar, “Carving Research Slices out of your Production Networks with OpenFlow,” SIGCOMM Comput. Commun. Rev., vol. 40, no. 1, pp. 129–130, Jan. 2010.
[25] T. Koponen et al., “Onix: A Distributed Control Platform for Large-Scale Production Networks,” Proc. 9th USENIX OSDI Conf., 2010, pp. 1–6.
[26] A. Tootoonchian and Y. Ganjali, “Hyperflow: A Distributed Control Plane for OpenFlow,” Proc. 2010 INM Conf., 2010, pp. 3–3.
[27] S. Hassas Yeganeh and Y. Ganjali, “Kandoo: A Framework for Efficient and Scalable Offloading of Control Applications,” Proc. HotSDN ’12 Wksp., 2012, pp. 19–24.
[28] M. Yu, J. Rexford, M. J. Freedman, and J. Wang, “Scalable flow-based networking with difane,” ACM Comput. Commun. Rev., vol. 41, no. 4,2010.
[29] Y. Kanizo, D. Hay, and I. Keslassy, “Palette: Distributing tables in software-defined networks,” Technion, Tech. Rep. TR12-05, 2012.
[30] Yossi Kanizo, David Hay, and Isaac Keslassy. Palette: Distributing tables in software-defined networks. In INFOCOM, pages 545–549,2013
[31] DAI, Wei, Guochu SHOU, Yihong HU, and Zhigang GUO. "R-SDN: A RECUSIVE APPROACH FOR SCALING SDN."
[32] Hu, Jie, Chuang Lin, Xiangyang Li, and Jiwei Huang. "Scalability of Control Planes for Software Defined Networks: Modeling and Evaluation."
[33] P. Jogalekar and M. Woodside, “Evaluating the scalability of distributed systems,” Parallel and Distributed Systems, IEEE Transactions on, vol. 11, no. 6, pp. 589–603, 2000.
[34] Jimenez, Yury, Cristina Cervello-Pastor, and Aurelio J. Garcia. "On the controller placement for designing a distributed SDN control layer." In Networking Conference, 2014 IFIP, pp. 1-9. IEEE, 2014.
[35] Shah, Syed Abdullah, Jannet Faiz, Maham Farooq, Aamir Shafi, and Syed Akbar Mehdi. "An architectural evaluation of SDN controllers." In Communications (ICC), 2013 IEEE International Conference on, pp. 3504-3508. IEEE, 2013.

Advances in Computer Science and Information Technology (ACSIT) Print ISSN: 2393-9907; Online ISSN: 2393-9915; Volume 2, Number 1; January-March, 2015 pp. 86-89 © Krishi Sanskriti Publications http://www.krishisanskriti.org/acsit.html
Impact of E-learning in Higher Education with Reference to Jammu & Kashmir State
Wasim Akram Zargar1 and Jagbir Ahlawat2 1,2Department of Information Technology Shri Venkateshwara University, Rajabpur, Gajraula, U.P. India
E-mail: 1
Abstract—This paper aims to discuss the role of E-Learning in the new Higher Educational Environment in the digital age which creates student-centered learning and educational practice, offering new more flexible learning methods. This review highlights some common themes and problems faced using e-learning and recommends implications for practice arising from these. E-learning developments based on changes to traditional pedagogy evoke the most inconsistencies in student perceptions and it is here that individual differences emerge as possible success factors. The study conducted revealed that their were different factors that influence the adoption of e-learning in higher educational institutions in J&K. The research findings confirm, Language barriers were found to be major barriers as well as deficient management awareness and support as the major obstruction.This study concludes that future research should investigate how students understanding of the teaching and learning process impacts on their study strategies and perceptions of online learning. Keywords: E-Learning, Higher Education, Strategies and Jammu & Kashmir
1. INTRODUCTION
E-learning is the use of electronic educational technology in learning and teaching. E-learning has emerged as a prerequisite to assemble the challenges posed by the improvement of information technology and its potential for greater access to knowledge [1]. E-learning was first introduced in developed countries; thus, the implementation and operation models developed there have been taken as benchmarks globally. Basically, the important factors and barriers to the implementation of e-learning within different societies and region may vary for those identified in developed regions, with varying degrees of intensity or importance [2]. Accordingly, the models available for implementation may not be applied across all steps and phases when utilized by different societies and countries. As such, influential factors and barriers to e-learning may vary between them.
The implementation of e-learning in the context of higher educational institutions has become the subject of much research and examination. The application of e-learning has traversed the boundaries of school and college education to permeate the entire learning spectrum, including internet-
based coaching for examinations. Realizing the potential and effectiveness of this platform, the corporate India is becoming progressively inclined towards utilizing e-learning for its employees. Importantly, regardless of the high standards of living within the country, With this noted, it is essential that organizations and the government work together in order to update and upgrade the skills of their subjects, whether employees, customers or students, and to further deliver on- going learning and training where e-learning is still to play a key role [3].Literacy rate in Jammu & Kashmir was just 68.7% in 2011 wherein about 78.3 males are literate, and only 58.0 out of 100 females are literate[4]. Jammu & Kashmir state is compounded by terrorism and militancy which has taken a heavy toll of life and public property besides throwing normal life out of gear. Education could not escape from this tragedy as most of the institutions in rural areas in the valley were destroyed and loss of schooling hours immensely affected the learning outcomes.
The aim of this research is to investigate and identify factors that will mostly influence the implementation of e-learning in J&K. In order to achieve this aim, our research was based on semi-structured interviews. The results of this study will help decision makers to gain a better understanding of the factors that determine and influence the adoption of e-learning in higher educational institutions in J&K.
2. ORIGIN
The origins of the term e-Learning is not certain, although it is suggested that the term most likely originated during the 1980's, within the similar time frame of another delivery mode online learning. [5] Nichols define e-Learning as strictly being accessible using technological tools that are either web-based, web-distributed, or web-capable. The belief that e-Learning not only covers content and instructional methods delivered via CD-ROM, the Internet or an Intranet [6] but also includes audio- and videotape, satellite broadcast and interactive TV is also the one.

Impact of E-learning in Higher Education with Reference to Jammu & Kashmir State 87
Advances in Computer Science and Information Technology (ACSIT) Print ISSN: 2393-9907; Online ISSN: 2393-9915; Volume 2, Number 1; January-March, 2015
Although technological characteristics are included in the definition of the term, Tavangaria[7] as well as Triacca[8] felt that the technology being used was insufficient as a descriptor. Tavangarian[7] included the constructivist theoretical model as a framework for their definition by stating that e -Learning is not only procedural but also shows some transformation of an individual's experience into the individual's knowledge through the knowledge construction process. Triacca [8]believed that some level of interactivity needs to be included to make the definition truly applicable in describing the learning experience, even though Triacca[8] added that e-Learning was a type of online learning.
As there is still the main struggle as to what technologies should be used so that the term can be referenced, some authors will provide either no clear definition or a very vague reference to other terms such as online course/learning, web-based learning, web-based training, learning objects or distance learning believing that the term can be used synonymously[9]. What is abundantly obvious is that there is some uncertainty as to what exactly are the characteristics of the term, but what is clear is that all forms of e-Learning, whether they be as applications, programs, objects, websites, etc., can eventually provide a learning opportunity for individuals.
The emergence of e-learning is arguably one of the most powerful tools available to the growing need for education. The need to improve access to education opportunities allowed students who desire to pursue their education but are constricted due to the distance of the institution to achieve education through "virtual connection" newly available to them. Online education is rapidly increasing and becoming as a viable alternative for traditional classrooms. According to a 2008 study conducted by the U.S Department of Education, back in 2006-2007 academic years, about 66% of postsecondary public and private schools began participating in student financial aid programs offered some distance learning courses, record shows only 77% of enrolment in for-credit courses being for those with an online component. These reflect the goals of the National Centre for E-learning and Distance Learning which are to achieve a number of key objectives, namely to:
• Organize e-learning applications in higher education institutions with high standards.
• Contribute to expanding the capacity of higher education institutions through the application of e-learning
• Distributeknowledge of technology and the culture of e-learning through information society
• Contribute to the evaluation of e-learning’s projects and research.
• Develop excellence standards for the design production and distribution of digital learning materials advise in the areas of e-learning,
• Promotenovel projects in the areas of e-learning and distance learning in institutions of higher education.
3. E-LEARNING IN INDIA
Albert Einstein once stated that “education is what remains after one has forgotten what one has learned in school.” While Einstein’s words may have been intended only in good humour, they aptly reflect the fact that effective education is, indeed, incessant, warrants constant learning, and is constantly evolving. In fact, the face of education has experienced a sea change of sorts over the decades. Once characterized by the traditional classroom model, education today has metamorphosed into learning that is instant, online, self-driven and on the go. The journey of education in India, too, has been dotted with innumerable milestones, and the most recent among these is e-learning.
The first IT-based teaching tool debuted in India in the 1980s through the advent of computer-based training, with study material being stored in CD-ROMs. However, it was the rapid emergence of the information and communication technology (ICT) market in the 1990s that gave significant and far-reaching impetus to the Indian e-learning market. Subsequently, the growing presence of the internet and increasing broadband connectivity gave rise to other web-based training models, thus giving further thrust to interactive online learning.
Further, organizations, using the public-private partnership (PPP) model have been setup, such as Centum Learning, a joint venture (JV) with National Skill Development Corporation (NSDC), which aims to train 12 million people by 2022. Similarly, Tata Interactive Systems, a Tata Group company, develops online course content for the pre-school and higher-education segments. Flexibility, cost effectiveness and enhanced accessibility - these are but a few of the primary drivers of online education, and are the forces encouraging working professionals and students to revisit education despite busy schedules, via the online education platform[10].
4. RESEARCH METHODOLOGY
The present study is basically an analysis of the higher education with reference to developing a strategy for successful implementation of e-learning and e-education in J&K. In order to estimate the extent and trend of e-learning, primary data was collected from the students, teachers and the people belonging to rural areas of J&K. The method used was based on a questionnaire. The data thus collected was verified for any discrepancies and information mismatch or errors in various e-learning models and appropriate formulation has

Wasim Akram Zargar and Jagbir Ahlawat
Advances in Computer Science and Information Technology (ACSIT) Print ISSN: 2393-9907; Online ISSN: 2393-9915; Volume 2, Number 1; January-March, 2015
88
been proposed. A statistical tool was used to analyze the data thus collected for meaningful interpretations. Barriers and challenges faced in implementing and adopting e- learning in the organization, focusing on identifying the most. In addition, secondary data was also collected for understanding the trends. The main sources of secondary data was obtained from government bulletins, reports of surveys conducted by various government and non-government organizations, research papers, periodicals, journals, authentic websites (official, private), published reports of internet, bank etc. The references were duly acknowledge and mentioned at the end of the work.
5. RESEARCH FINDINGS AND DISCUSSION
The research findings offer insights into the main and influential factors that influence the adoption of e-learning in higher educational institutions in J&K. After summarizing the data collected and highlighting the main points, following results were drawn.
The major part of the study was to recognize the key factors influencing the organizations surveyed from building an environment supportive of e-learning. Majority of those questioned on the limitations of e-learning, it was found that 22 out of 30 respondents stated deficient management awareness and support as the major obstruction. Maximum respondents revealed that the strategy of the management in the organization was not as per the intention to build an e-learning culture. Management found that E-learning as a waste of time process and an unsuccessful opportunity for learning. Although most of the respondent thought that supportive management is a key factor for the acceptance of any new project including e-learning. However, the management will not support e-learning unless they are aware of the benefits it offers, and unfortunately our management is unaware of the benefits and strategic advantages of e-learning. This was more obvious in the replies of respondent working in public higher educational institutions in J&K. In such cases, the apex administration is more worried with their own profit, rather than the organization’s picture. Whereas, in the private educational institutions, the management is more concerned with a return on investment and therefore adopting e-learning has a higher priority than in public organizations. Since the management was the source of resistance, the lower level employees did not sincerely buy into the e-learning projects. There was a ―lack of understanding about e- learning”, as many of the respondents mentioned in describing the institute situation. As a result, even when e- learning did deliver benefits, they were hampered by the inter- group conflict in the organizations. Many respondents stated that the management lacked the awareness of the strategic benefits of e-learning. Such a lack of awareness was felt through the absence of clear training and learning policies aimed at developing the knowledge and skills of their staff. Respondent mentioned that some managers and academics were computer illiterate; thus, they were afraid of the new technology and
more comfortable with traditional methods. Interestingly, an academic stated that the content development in the e-learning modules was very poor and there was a limited involvement in the contents development process. As a factor could cause unauthorized access to sensitive information and loss of users might hinder the adoption of e- learning. Surprisingly, one member of the top management was system integration where local systems are linked together and contain all different functions which would provide a full and real one stop shop. It is common for different departments to have different software and hardware that may not work together which may lead to e-learning implementation and adoption difficulties. The technological problems mentioned by the respondent were critical for the adoption of e-learning in J& K. Regardless of the fact that the necessary resources and equipment (personal computers in particular) for using e- learning were made available in most of the educational organizations surveyed, all respondent mentioned that there was plenty of room for improvement and the intensity of barriers was strong enough to wear away the positive effects obtained from e-learning. The implementation model of e-learning in J&K was not made up of the four usual stages but only one: integration, while there was not much concern consequence; many academics did not feel motivated to use the e-learning system and showed high levels of resistance and reluctance. Nevertheless, the key lesson which has been derived from this factor is that the problem is not one of structure but of processes. The difficulty consists in knowing the management processes that lead to a successful adoption of e-learning. The management in the surveyed educational organizations has failed to understand the strategic advantages of using e-learning as a means to improve the learning process.
It was found that 21 out of the 30 respondent Language barriers were found to be major barriers. Most of the e-learning contents used in the organizations were developed in English, and many of those organizations had a large number of employees who did not know the English language hence they were unwilling to use e-learning. Students in higher educational institutions in J&K also feel uncomfortable when using e-learning courses that were developed in English. It seemed that progress was still slow in content development and the organization environment still relied on contents and courses developed in English for e-learning. The fact that language is recognized as a significant barrier in J&K.
6. CONCLUSION
The study conducted revealed that their were different factors that influence the adoption of e-learning in higher educational institutions in J&K. The research findings confirm, Language barriers were found to be major barriers as well as deficient management awareness and support as the major obstruction.

Impact of E-learning in Higher Education with Reference to Jammu & Kashmir State 89
Advances in Computer Science and Information Technology (ACSIT) Print ISSN: 2393-9907; Online ISSN: 2393-9915; Volume 2, Number 1; January-March, 2015
REFRENCES
[1] Bottino, R.M., The evolution of ICT‐based learning environments: which perspectives for the school of the future? British Journal of Educational Technology, 2004. 35(5): p. 553-567.
[2] Ali, G.E. and R. Magalhaes, Barriers to implementing e‐learning: a J&ki case study. International journal of training and development, 2008. 12(1): p. 36-53.
[3] Al-Kazemi, A.A. and A.J. Ali, Managerial problems in J&k. Journal of Management Development, 2002. 21(5): p. 366-375.
[4] SAMIKSHA SURI, E-learning in Higher Educational Institutions in Jammu and Kashmir: Experiences and ChallengesInternational Journal of Engineering and Technical Research (IJETR)ISSN: 2321-0869, Volume-1, Issue-9, November 2013.
[5] Nichols, M. (2003). A theory of eLearning.Educational Technology & Society, 6(2), 1−10. Oblinger, D. G., &Oblinger, J. L. (2005). Educating the net generation.EDUCAUSE.Retrieved from. http://net.educause.edu/irlibrary/pdf/pub7101.pdf.
[6] Benson, L., Elliot, D., Grant, M., Holschuh, D., Kim, B., Kim, H., et al. (2002). Usability and instructional design heuristics for e-Learning evaluation. In P., & S. (Eds.),
[7] Tavangarian, D., Leypold, M. E., Nölting, K., Röser, M., & Voigt, D. (2004). Is e-Learning the solution for individual learning? Electronic Journal of e-Learning, 2(2),273−280.
[8] Triacca, L., Bolchini, D., Botturi, L., &Inversini, A. (2004). Mile: Systematic usability evaluation for e-Learning web applications. AACE Journal, 12(4).
[9] Dringus, L. P., & Cohen, M. S. (2005). An adaptable usability heuristic checklist for online courses. 35th Annual FIE '05. Presented at the Frontiers in Education.63.
[10] SatishKaushal Executive Director Government advisory services, EY. New roads to learning: perspectives on e-learning in India: E-learning: moving toward a self-servicing society. http://www.ey.com/IN/en/Industries/GovernmentPublic-Sector/GPS_New-roads-to-learning perspectives-on-e-learning-in-India

Advances in Computer Science and Information Technology (ACSIT) Print ISSN: 2393-9907; Online ISSN: 2393-9915; Volume 2, Number 1; January-March, 2015 pp. 90-94 © Krishi Sanskriti Publications http://www.krishisanskriti.org/acsit.html
Role of Genetic Algorithm in Network Optimization Shweta Tewari1 and Amandeep Kaur2
1M Tech Student, BBD University Lucknow, India 2Senior Lecturer, BBD University Lucknow, India
E-mail: [email protected], [email protected]
Abstract—In the field of engineering, solving a problem is not enough. The solution found must be the best possible solution. In other words, one must find the optimal solution to the problem. Optimization seeks to improve the performance towards some optimal point or points. Normally single objective optimization is carried out but many optimization problems have conflicting objectives. Use of GAs is considered as most appropriate method for multi objective optimization problems. Genetic Algorithms are search algorithms based on the mechanism of natural selection. Genetic Algorithm (GA) has the ability to manipulate multiple parameters concurrently; their use of parallelism allow them to produce multiple equally good solutions to the same problem. Optimization in network routing by considering multiple QoS parameters such as end-to-end delay, energy consumption, bandwidth, video conferencing, voice-over-IP, end-to-end delay, jitter, packet loss ratio, hop count etc. is a complex research issue. The paper presents a study on the work carried out for optimization in network routing using Genetic Algorithm in various types of Computer Networks.
1. INTRODUCTION
The paper presents an overview of various genetic algorithms (both single objective and multi objective) which are used for routing optimization in computer networks. This paper has been divided into multiple sections. Section II introduces Optimization and why it is required in Network Routing. In Section III different MO based computer network routing optimization approaches are discussed. Section IV includes issues and challenges in this field.
2. MULTI-OBJECTIVE OPTIMIZATION
Optimization seeks to improve the performance towards some optimal point or points. Normally single objective optimization is carried out but many optimization problems have conflicting objectives. Use of GAs is considered as most appropriate method for multi objective optimization problems.
It is possible that while solving a problem, one may need to optimize more than one objective function usually with tradeoffs involved.
Routing of packets in networks requires that a path will be selected either dynamically while the packets are being
forwarded, or statically (in advance) as in source routing from a source node to a destination.
A multi-objective optimization model can be stated as:
Optimize [Minimize/Maximize]
F(X) = {f1(X), f2(X) ……., fn(X)}
Subject to:
H(X) = 0
G(X) >= 0
In the above case,
F(X) is the set of functions to be optimized where the vector X is the set of independent variables.
H(X) and G(X) are the constraints of the model.
Optimization in network routing by considering multiple QoS parameters such as end-to-end delay, energy consumption, bandwidth, video conferencing, voice-over-IP, end-to-end delay, jitter, packet loss ratio, hop count etc. is a complex research issue
Representing the optimization of these resources mathematically, let us consider a network represented as a graph G= (N, E), where N is the nodes and E edges. Among nodes we have source node S ϵ N and let D be some destination, D ϵ N. Let (i, j) ϵ E be a link from node i to node j. dij, wij and bij be the delay, cost and available bandwidth for the link (i, j). Say P represents the path from source to destination. And a link (i, j) in the path P is denoted as Lij i.e. Lij = 1, if the link is selected for transmission of data else Lij = 0.
Optimization of few resource functions can be formulated as shown:

Role of Genetic Algorithm in Network Optimization 91
Advances in Computer Science and Information Technology (ACSIT) Print ISSN: 2393-9907; Online ISSN: 2393-9915; Volume 2, Number 1; January-March, 2015
Number of Hops:
End-to-end Delay:
Cost:
Bandwidth Consumption:
3. OPTIMIZATION IN NETWORK ROUTING USING GENETIC ALGORITHM
3.1. QoS Based
QoS routing has been receiving increasingly concentrated attention but finding the shortest path with many metrics is a NP complete problem. To overcome these limitations, development of approximated solutions and heuristic algorithms is required for multipath constraints QoS routing.
Bandwidth constraint, traffic from adjacent nodes, delay and number of hop counts to provide adaptive route in MANET are the QoS parameters which require optimization to achieve QoS routing in MANET. A multi-objective GA is proposed in [1] to optimize the above parameters.
A hybrid solution is proposed in [2] in which a hybrid algorithm that combines Genetic Algorithm and Particle Swarm Optimization algorithm is presented to solve anycast routing problem with multiple QoS constraints.
The methods used for removing illegal routes during initialization, crossover and mutation increase the algorithm complexity and time. To solve this issue a Genetic Algorithm is proposed in [3] wherein the algorithm is brought out with a new encoding and decoding method. It describes that how possible routes can be produced from prior knowledge and then selected based on fitness with respect to QoS.
Multiple QoS anycast routing is categorized as a nonlinear combination optimization problem. To solve this problem an
adaptive Genetic Algorithm in [4] is proposed in which adaptive probability of crossover and mutation over and over again is used in simple GA to achieve QoS routing.
Intelligent Agent Antnet based Routing Algorithm (IANRA) algorithm is proposed in [5] wherein enhancement of load balancing strategy is done in Wireless Network to find optimum and near optimum route by means of Genetic Algorithm using breeding capability of ants is the main goal of IANRA.
As in multimedia applications strict quality of service is required during the communication between a source and multiple destinations here raises the requirement for an efficient QoS multicast routing strategy. A multi-objective Genetic Algorithm is proposed in [6] that provide a model for resolving the routing problem and propose a new multicast tree selection algorithm based on GA to simultaneously optimize QoS parameters.
A hybrid genetic algorithm is proposed in [7] that enhance the advantages of GA and Ant Colony optimization Algorithm to optimize QoS routing of wireless mesh network. Simulation results prove that this algorithm has the fast calculation speed and high accuracy and it also can improve the efficiency in wireless mesh network QoS routing.
In [8] a genetic algorithm is proposed for QoS routing in ad hoc networks wherein a Search Space Reduction Algorithm is implemented to reduce the search space of genetic algorithm.
After the reduction of search space the GAMAN search time improves.
A genetic algorithm based unicast routing is proposed in [9] to provide energy efficient unicast, multipath route by considering multiple QoS parameters such as end to end delay, energy consumption, bandwidth and hop count in MANET.
Maintaining appropriate Quality of Service (QoS) for MANETs is a complex task due to the dynamic behavior of the network topology. A genetic based routing approach is defined in [10] to optimize the routing in MANET. The genetic approach will generate an optimized route on the basis of congestion over the network.
A multi-objective GA is proposed in [11] based on the idea of SPEA-II, to solve the QoS routing and wavelength allocation problem. The algorithm is experimented on a set of different scale test problems and the experiment results show very encouraging results in terms of the solution quality and diversity.
Increase on demand of applications such as streaming video, multiplayer interactive games and financial services imposes a

Shweta Tewari and Amandeep Kaur
Advances in Computer Science and Information Technology (ACSIT) Print ISSN: 2393-9907; Online ISSN: 2393-9915; Volume 2, Number 1; January-March, 2015
92
strict guarantee on quality of service basically on end to end delay, and cost bandwidth consumption. Further challenges occur with routing in dynamic environment where nodes are mobile. A multicast routing technique is proposed in [12] that is based on multi objective Genetic Algorithm. This algorithm optimizes multiple QoS parameters in MANET to find optimal multicast tree.
Current routing strategies such as distance vector (DV) and Link State (LS)are not optimal in terms of Quality of Service (QoS) for applications such as Voice over IP(VoIP),video on Demand. A QoS aware routing strategy based on Ant Colony Optimization concept is proposed in [13] to overcome this limitation.
To achieve QoS routing in Wireless Mesh Network a mathematical model is proposed in [14] which include QoS parameters such as power consumption, packet loss rates and delay and bandwidth. In the proposed model, multi objective evolutionary algorithm is used, specifically NSGA-II, where all required objectives are considered providing an optimal solution.
A QoS aware routing protocol is proposed in [15] to support heterogeneous layered unicast transmission and to improve energy usage through Cooperative Network Coding (CNC).
QoS multicast routing problem is categorized as a non-linear combination optimization problem and proved to be a NP complete problem. The solution to this problem is a hybrid algorithm proposed in [16] with ant colony optimization algorithm and particle swarm optimization algorithm.
Routing optimization with the goal to improve the quality of service provides a means to balance the traffic load in the network. The proposed solution in [17] deals with routing optimization in IPv6 network. The experimental results prove that the hybrid algorithm can meet QoS constraints of multicast routing problem excellently.
In [18] a priority based evolutionary multi objective optimization algorithms is described to find the optimal routes for the data flows of various QoS classes via optimizing multiple QoS parameters namely response time, bandwidth requirements and reliability according to the applications' priorities.
Quality of Service support becomes an essential aspect in wireless ad hoc networks such as VANET. An efficient routing technology is proposed in [19] in which routing protocol is optimized by applying a metaheuristic algorithm ACO. Meta heuristic algorithm can improve the QoS parameters such as end to end delay in routing which is comparable to well-known existing multipath routing protocols.
QoS based multimedia routing is an important requirement in Mobile Ad hoc networks. Ant Colony Optimization Algorithm is proposed in [20] as it exhibits number of desirable properties for MANET routing.
An adaptive QoS routing algorithm based on discrete particle swarm optimization is proposed in [21] for wireless sensor network as the already developed QoS routing algorithms can't take count into both network energy consumption and adaptive ability in room environments.
To achieve QoS based routing for real time services in wireless sensor network a solution based on NSGA II is proposed in [22].The proposed solution provides energy efficient QoS routing in cluster based WSNs.
3.2. Sensor Network
Routing is a challenging issue in wireless sensor networks due to their dynamic topological design. To solve this problem a genetic algorithm is proposed in [23].The proposed algorithm is a GA based simple straight forward address based shortest path routing in wireless ad hoc sensor networks.
A probabilistic performance evaluation framework and swarm intelligence approach for routing protocols is analyzed in [24] in which the survey analyzes the ACO and PSO based algorithms with other approaches applied for the optimization of an ad hoc and wireless sensor network routing protocols.
The sensors in Wireless Sensor Networks are characterized by limited battery life and low processing power which results in a limited network lifetime. A spanning tree topology is proposed in [25] in which the topology for wireless sensor network changes dynamically according to the nodes' remaining energy, in order to maximize the usage of the network.
A novel energy efficient clustering mechanism is proposed in [26] based on artificial bee colony algorithm, to prolong the network life-time.
3.3. Ad hoc Network
An optimization algorithm is proposed in [28] that use the load accepted rate, topological variety rate and routing delay time as measurements value to select the routing paths in ad hoc networks. The routing tables are replaced by pheromone tables which realize the network load dynamic distribution.
The dynamic shortest path routing problem occurs with the advancement in wireless network as more and more mobile wireless network appears. A solution to this problem is a genetic algorithm with immigrants and memory schemes is proposed in [29]. In the proposed algorithm MANETs are considered as target system. The experimental result show that

Role of Genetic Algorithm in Network Optimization 93
Advances in Computer Science and Information Technology (ACSIT) Print ISSN: 2393-9907; Online ISSN: 2393-9915; Volume 2, Number 1; January-March, 2015
the immigrants and memory based Genetic Algorithms can quickly reorganize according to the environment changes (i.e. the topological changes) and after each change produce high quality solutions.
Multipath routing for MD video in wireless ad hoc networks is an important issue to solve. A metaheuristic approach is proposed in [30] which is eminently effective in addressing complex cross layer optimization problems. A tight lower bound for video distortion as well as a solution procedure for the GA based approach is provided in the proposed approach.
The limitation of high delay occurs in the ad hoc networks of high mobility. To overcome this limitation a swarm optimization strategy is proposed in [31].A hybrid particle swarm optimization algorithm combining genetic algorithm is presented which can be used in a routing protocol and then establish an on demand routing protocol based on the novel algorithm.
Setting up routes in Maritime Tactical Network that meet high reliability is challenging issue as the network topology may change rapidly and unexpectedly in such type of network. Therefore a Genetic Algorithm based technique is proposed in [32] for optimized routing in MTN between shores and ships.
The multicast routing protocol are vulnerable to the component failure in ad hoc network due to the lack of redundancy in multipath and multicast structure that causes route selection tragedy in MANET. A new HGAPSO (Hybrid Genetic Algorithm Particle Swarm Optimization) based optimized MAODV is propose in [33], which improves the performance in the routing messages for multicast applications.
Dynamic route planning problem (DRPP) involving the optimization of a route for a single vehicle traveling between a given source and given destination has a solution proposed in [34] wherein HEADRPP comprises a graph partitioning algorithm (GPA) and a fuzzy logic implementation (FLI) applied into a genetic algorithm (GA) core, and provides both optimized ST and SP paths to the user.
4. CONCLUSION AND FUTURE WORK
Genetic Algorithms provide the best possible solution for the routing problem in a computer network by efficiently using the network resources.
Table 1: Summarize various works done in the field of network routing optimization using Genetic Algorithm
Major Focus References QoS Parameters [1-22] Anycast Routing [2] Multicast Routing [6] Sensor Network [24,25,26] Shortest Path Routing [23,29]
The survey shows that GA based approach of optimizing various network parameters achieve better results as compared to the traditional methods of solving complexoptimization problem.
In future GA can be used for optimizing more complex problems of Network Routing to improve QoS of a network.
REFERENCES
[1] Kotecha, K.; Popat, S.; "Multi objective genetic algorithm based adaptive QoS routing in MANET", Evolutionary Computation, 2007. CEC2007. IEEE Congress on DOI: 10.1109/CEC.2007.4424638, Publication Year: 2007
[2] Li Taoshen; Xiong Qin; Ge Zhuhai;"Genetic and particle swarm hybrid QoS anycast routing algorithm", Intelligent Computing and Intelligent Systems, 2009. ICIS2009. IEEE International Conference on DOI: 10.1109/ICICISYS.2009.5357837 Publication Year: 2009
[3] Zhou Yu; Zhao Xin; Ye Qingwei;“An Effective Genetic Algorithm for QoS-Based Routing Optimization Problem ", Information Science and Engineering (ICISE), 2009 1st International Conference onDOI:10.1109/ICISE.2009.245, Publication Year: 2009
[4] Taoshen Li; Zhihui Ge;"Adaptive genetic algorithm for multiple QoS anycast routing", Intelligent Computing and Intelligent Systems, 2009. ICIS2009. IEEE International Conference on Volume: 1 DOI: 10.1109/ICICISYS.2009.5358024, Publication Year: 2009
[5] Moghanjoughi, A.A.; Khatun, S.; Ali, B.M.; Abdullah, R.S.A.R.; "QoS based Fair Load-Balancing: Paradigm to IANRA Routing Algorithm for Wireless Networks (WNs)", Computer and Information Technology, 2008. ICCIT2008. 11th International Conference on DOI: 10.1109/ICCITECHN.2008.4803001 Publication Year: 2008
[6] Sun, Baolin; Li, Layuan;“A QoS multicast routing optimization algorithm based on genetic algorithm”, Communications and Networks, Journal of Volume: 8, Issue: 1 DOI: 10.1109/JCN.2006.6182911, Publication Year: 2006
[7] Hua Jiang; Liping Zheng; Yanxiu Liu; Min Zhang;"Multi-constrained QOS routing optimization of wireless mesh network based on hybrid genetic algorithm”, Intelligent Computing and Integrated Systems (ICISS), 2010 International Conference on DOI: 10.1109/ICISS.2010.5657067 Publication Year: 2010
[8] Barolli, A.; Spaho, E.; Xhafa, F.; Barolli, L.; Takizawa, M.; "Application of GA and Multi-objective Optimization for QoS Routing in Ad-Hoc Networks",Network-Based Information Systems (NBiS), 2011 14th International Conference on DOI: 10.1109/NBiS.2011.18,Publication Year: 2011
[9] Brindha, C.K.; Nivetha, S.K.; Asokan, R.; "Energy efficient multi-metric QoS routing using genetic algorithm in MANET", Electronics and Communication Systems (ICECS), 2014 International Conference on DOI: 10.1109/ECS.2014.6892695 Publication Year: 2014
[10] Vikas Siwach, Dr. Yudhvir Singh, Seema, Dheer Dhwaj Barak;" An Approach to Optimize QOS Routing Protocol Using Genetic Algorithm in MANET" ,International Journal of Computer Science and Management Studies, Vol. 12, Issue 03, Sept 2012 ISSN (Online): 2231-5268
[11] Hongyi Zhang; Zhidong Shen; "A multi-objective genetic algorithm for the QoS based routing and wavelength allocation problem”, Computing and Networking Technology (ICCNT), 2012 8th International Conference, Publication Year: 2012
[12] Ashraf, N.M.; Ainon, R.N.; Keong, P.K.; "QoS Parameter Optimization Using Multi-Objective Genetic Algorithm in MANETs"; Mathematical/Analytical Modelling and Computer Simulation (AMS), 2010 Fourth Asia International Conference on DOI: 10.1109/AMS.2010.40 , Publication Year: 2010
[13] Salivaz, C.; Farrugia, R.A.; "Quality of service aware Ant Colony Optimization Routing Algorithm", MELECON 2010 - 2010 15th IEEE

Shweta Tewari and Amandeep Kaur
Advances in Computer Science and Information Technology (ACSIT) Print ISSN: 2393-9907; Online ISSN: 2393-9915; Volume 2, Number 1; January-March, 2015
94
Mediterranean Electro technical Conference DOI: 10.1109/MELCON.2010.5476267,Publication Year: 2010
[14] Camelo, M.; Omana, C.; Castro, H.;"QoS Routing Algorithms based on Multi-Objective Optimization for Mesh Networks",Latin America Transactions, IEEE (Revista IEEE America Latina) Volume: 9,Issue: 5 DOI: 10.1109/TLA.2011.6031003,Publication Year: 2011
[15] Tarnoi, S.; Kumwilaisak, W.; Saengudomlert, P.; "QoS-aware routing protocol for heterogeneous wireless unicasts with cooperative network coding",Wireless Communication Systems (ISWCS), 2011 8th International Symposium on DOI: 10.1109/ISWCS.2011.6125321,Publication Year: 2011
[16] Chen Xi-hong ; Liu Shao-wei ; Guan Jiao ; Liu Qiang ; "Study on QoS Multicast Routing Based on ACO-PSO Algorithm Intelligent Computation Technology and Automation (ICICTA)", 2010 International Conference on Volume:3 DOI: 10.1109/ICICTA.2010.419, Publication Year: 2010
[17] Fgee, E.-B.; Elalo, A.; Phillips, William J.; Elhounie, A. ;"Using Routing Optimization in Next Generation Network to Achieve High QoS" ,Communication Networks and Services Research Conference (CNSR), 2010 Eighth Annual DOI: 10.1109/CNSR.2010.41,Publication Year: 2010
[18] Kumar, D. ; Kashyap, D. ; Mishra, K.K. ; Mishra, A.K ; "Routing Path Determination Using QoS Metrics and Priority Based Evolutionary Optimization" ,High Performance Computing and Communications (HPCC), 2011 IEEE 13th International Conference on DOI: 10.1109/HPCC.2011.87,Publication Year: 2011
[19] Mane, U. ; Kulkarni, S.A. ; "QoS realization for routing protocol on VANETs using combinatorial optimization Computing", Communications and Networking Technologies (ICCCNT),2013 Fourth International Conference on DOI: 10.1109/ICCCNT.2013.6726763 ,Publication Year: 2013
[20] Suganthi, B.; Sivakumar, D.; "Agent based QOS routing in Mobile Ad-hoc Networks: An overview",Sustainable Energy and Intelligent Systems (SEISCON 2012), IET Chennai 3rd International on DOI: 10.1049/cp.2012.2186,Publication Year: 2012
[21] Yi Jun; Huang He; Li Tamiflu;"A QOS routing algorithm based on DPSO for wireless sensor networks in indoor environment", Control Conference (CCC), 2011 30th Chinese, Publication Year: 2011
[22] Ekbatani Fard, G.H.; Monsefi, R.; Akbarzadeh-T, M.-R.; Yaghmaee, Mohammad.H; "A multi-objective genetic algorithm based approach for energy efficient QoS-routing in two-tiered Wireless Sensor Networks”, Wireless Pervasive Computing (ISWPC), 2010 5th IEEE International Symposium on DOI: 10.1109/ISWPC.2010.5483775, Publication Year: 2010
[23] Nallusamy, R., Duraiswamy, K. , Muthukumar, D.A. ,Sathiyakumar, C.;"Energy efficient dynamic shortest path routing in wireless Ad hoc sensor networks using genetic algorithm" ,Wireless Communication and Sensor Computing, 2010. ICWCSC2010. International Conference on DOI:10.1109/ICWCSC.2010.5415898, Publication Year: 2010
[24] Ali, Z.; Shahzad, W.; "Critical analysis of swarm intelligence based routing protocols in adhoc and sensor wireless networks",Computer Networks and Information Technology (ICCNIT), 2011 International Conference on DOI: 10.1109/ICCNIT.2011.6020945,Publication Year: 2011
[25] Apetroaei, I.; Opera, I.-A.; Proca, B.-E.; Gheorghe, L.; "Genetic algorithms applied in routing protocols for wireless sensor networks",Roedunet International Conference (RoEduNet), 2011 10th DOI: 10.1109/RoEduNet.2011.5993679 Publication Year: 2011
[26] Dervis Karaboga, Selcuk Okdem, Celal Ozturk; "Cluster based wireless sensor network routing using artificial bee colony algorithm", Published online: 24 April 2012
[27] Pourkabirian, A.; Haghighat, A.T.;"Energy-aware, delay-constrained routing in wireless sensor networks through genetic algorithm”, Software, Telecommunications and Computer Networks, 2007. SoftCOM 2007 15th International Conference on DOI: 10.1109/SOFTCOM.2007.4446058, Publication Year: 2007
[28] Sun Gai-ping ; Guo Hai-wen ; Wang Dezhi ; Wang Jiang-hua; "A Dynamic Ant Colony Optimization Algorithm for the Ad Hoc Network Routing",Genetic and Evolutionary Computing (ICGEC), 2010 Fourth International Conference on DOI:10.1109/ICGEC.2010.95 ,Publication Year: 2010
[29] Shengxiang Yang; Hui Cheng; Fang Wang;"Genetic Algorithms with Immigrants and Memory Schemes for Dynamic Shortest Path Routing Problems in Mobile Ad Hoc Networks”, Systems, Man, and Cybernetics, Part C: Applications and Reviews, IEEE Transactions on Volume:40,Issue: 1 DOI: 10.1109/TSMCC.2009.2023676,Publication Year: 2010
[30] Shiwen Mao ; Hou, Y.T. ; Xiaolin Cheng ; Sherali, H.D. ; "Multipath routing for multiple description video in wireless ad hoc networks", INFOCOM 2005. 24th Annual Joint Conference of the IEEE Computer and Communications Societies. Proceedings IEEE Volume: 1, DOI: 10.1109/INFCOM.2005.1497939, Publication Year: 2005
[31] Wei Chen ; Nini Rao ; Dasong Liang ; Ruihua Liao ; Weihua Huang; "An Ad Hoc routing algorithm of low-delay based on hybrid Particle Swarm Optimization",Communications, Circuits and Systems, 2008. ICCCAS 2008 International Conference on DOI: 10.1109/ICCCAS.2008.4657800,Publication Year: 2008
[32] Haider, Z.; Shabbir, F;"Genetic based approach for optimized routing in Maritime Tactical MANETs",Applied Sciences and Technology (IBCAST), 2014 11th International Bhurban Conference on DOI: 10.1109/IBCAST.2014.6778194, Publication Year: 2014
[33] Baburaj, E.; Valan, J.A.; "Impact of HGAPSO in Optimizing Tree Based Multicast Routing Protocol for MANETs",Computational Intelligence and Communication Networks (CICN), 2010 International Conference on DOI: 10.1109/CICN.2010.66,Publication Year: 2010
[34] Lai Wei Lup; Srinivasan, D.; "A hybrid evolutionary algorithm for dynamic route planning", Evolutionary Computation, 2007. CEC2007. IEEE Congress on DOI: 10.1109/CEC.2007.4425094, Publication Year: 2007

Advances in Computer Science and Information Technology (ACSIT) Print ISSN: 2393-9907; Online ISSN: 2393-9915; Volume 2, Number 1; January-March, 2015 pp. 95-97 © Krishi Sanskriti Publications http://www.krishisanskriti.org/acsit.html
Lossless Image Compression with Arithmetic Encoding
Thalesh P. Kalmegh1, A.V. Deorankar2 and Abdul Kalam3
1M. Tech scholar CSE Department GCOE, Amravati 2Head of the Department Infromation Technology GCOE, Amravati
3M. Tech scholar CSE Department GCOE, Amravati E-mail: [email protected], [email protected], [email protected]
Abstract—Image compression is a process that reduces the image size and removing the unreasonable information. Shorter data size is suitable because it simply reduces cost. There are number of different data compression methodologies, which are applied to compress most of the formats. Widely used in modern image and video compression algorithm such as JPEG, JPEG-2000, H-263, CALIC. This paper deals with the image compression with arithmetic encoding. Arithmetic encoding is common algorithm used in both lossy and lossless data-compression. It is an entropy technique, in which the frequently encountered seen symbols are encoded with fewer bits than lesser seen symbols. By using arithmetic encoding high degree of adaptation and redundancy reduction is achieved.
1. INTRODUCTION
In recent years, the development and demand of multimedia product grows increasingly fast, contributing to insufficient bandwidth of network and storage of memory device. Therefore, the theory of information compression becomes more and more substantial for shrinking the information redundancy to save more hardware space and transmission bandwidth. In computer science and manipulation of information theory, data compression or source coding is the procedure of encoding information using fewer bits or other information-accepting units than an unencoded representation. Compression is useful hence it helps reduce the consumption of expensive available resources like hard disk space or transmission bandwidth.
What is the so-known image compression coding? Image compression coding is to store the image into bit-stream as compressed as possible and to display the decoded image in the monitor as exact as possible. Now consider an encoder and a decoder. When the encoder gets the original image file, the image file will be changed into a series of binary data, which is known the bit-stream. The decoder then gets the encoded bit-stream and decodes it to form the decoded image. If the total data amount of the bit-stream is less than the total data amount of the original image, then this is known image compression.
Digital images are usually encoded by lossy compression methods due to their large memory or bandwidth requirements. The lossy compression methods accomplish high compression ratio at the cost of image quality degradation. Still, there are many cases where the loss of information or artifacts due to compression needs to be avoided, like medical, prepress, scientific and artistic images. As cameras and display systems are becoming high quality and as the cost of memory is lowered, we may also wish to hold our precious and artistic photos free from compression artifacts. Hence efficient lossless compression will become more and more important, while the lossy compressed images are usually satisfactory in many cases.
The goal of lossless image compression is to represent an image signal with the smallest possible number of bits without loss of any information, thereby speeding up transmission and minimizing storage requirements. The number of bits representing the signal is typically expressed as an average bit rate (average number of bits per sample for still images, and average number of bits per second for video). The goal of lossy compression is to accomplish the best possible fidelity given an available communication or storage bit rate capacity or to minimize the number of bits representing the image signal subject to some allowable loss of information. In this way, a much greater reduction.
2. ARITHMETIC ENCODING
The main objective of arithmetic coding is to achieve less average length of the Image. Arithmetic coding assigns code words to the corresponding symbols according to the probability of the symbols. In general, the arithmetic encoders are used to compress the data by replacing symbols represented by equal-length codes with the code words whose length is inverse proportional to corresponding probability. The occurrence probabilities and the cumulative probabilities of a set of symbols in the source image are taken into account. The cumulative probability range is applied in both

Thalesh P. Kalmegh, A.V. Deorankar and Abdul Kalam
Advances in Computer Science and Information Technology (ACSIT) Print ISSN: 2393-9907; Online ISSN: 2393-9915; Volume 2, Number 1; January-March, 2015
96
compression and decompression procedures. In the encoding process, the cumulative probabilities are calculated and the range is created in the beginning. Then the selected range is divided into sub parts according to the probabilities of the symbols. Then the next symbols are read and the corresponding sub range is selected. In this fashion, characters are read repeatedly until the end of the image is happened. Lastly a number should be taken from the final sub range as the output of the encoding process. This will be a fraction in that sub range. Therefore, the entire source image can be represented using a fraction. Arithmetic coding can handle adaptive coding without much increase in algorithm complexity. It calculates the probabilities on the fly and less primary memory is required for adaptation. Arithmetic is better suited for image and video compression
3. EXISTING SYSTEM
Among a variety of algorithm, the most widely used one may be lossless JPEG[11], JPEG- LS[12], LOCO- I [13], CACIC[14], JPEG 2000 & JPEG XR[15].
JPEG - JPEG became an international standard in 1992.JPEG is the ISO/IEC international standard 10918-1: digital compression and coding of continuous – tone still images, or the ITU-T recommendation T-81.
LOCO-I: LOCO-I (Low Complexity Lossless Compression for Images) is the algorithm at the core of the new ISO/ITU standard for lossless and near-lossless compression of continuous- tone images, JPEG-LS. It is conceived as a ―low complexity projectionǁ of the universal context modeling paradigm, matching its modeling unit to a simple coding unit. By compounding simplicity with the compression potential of context models, the algorithm ―enjoys the best of both worlds. It is established on a simple fixed context model, which comes near the capability of the more complex universal techniques for capturing high-order dependencies. The model is tuned for efficient operation in conjunction with an extended family of Golomb-type codes, which are adaptively selected, and an embedded alphabet extension for coding of low-entropy image regions. LOCO-I makes compression ratios similar or superior to those obtained with state-of-the-art schemes based on arithmetic coding. Furthermore, it is within a few percentage points of the best available compression ratios, at a much drop in complexity level.
CALIC: Context-based, adaptive, lossless image codec (CALIC). The codec obtains higher lossless compression of continuous-tone images than other lossless image coding techniques in the literature. This high coding efficiency is achieved with relatively low time and space complexities. CALIC place heavy emphasis on image data modeling. A unique characteristic of CALIC is the use of a large number of modeling contexts (states) to condition a nonlinear predictor
and adapt the predictor to varying source statistics. The nonlinear predictor can make up itself via an error feedback mechanism by learning from its mistakes under a given context in the past. In this studying process, CALIC estimates only the expectation of prediction errors conditioned on a large number of different contexts rather than estimating a large number of conditional error probabilities. The former approximation technique can afford a large number of modeling contexts without suffering from the context dilution problem of insufficient counting statistics as in the latter approach, nor from inordinate memory use. The low time and space complexities are also attributed to efficient techniques for forming and quantizing modeling contexts. CALIC was designed in response to the ISO/IEC JTC 1/SC 29/WG 1 (JPEG) call soliciting proposals for a new international standard for lossless compression of continuous tone images. In the initial evaluation of the nine proposals submitted at the JPEG meeting in Epernay, France, July 1995, CALIC had the lowest lossless bit rates in six of seven image classes: medical, aerial, prepress, scanned, video, and compound document, and the third lowest bit rate in the class of computer-generated images. CALIC gave an average lossless bit rate of 2.99 b/pixel on the 18 8-b test images selected by JPEG for proposal evaluation, equate with an average bit rate of 3.98 b/pixel for lossless JPEG on the same set of test images.
JPEG (Joint Photographic Experts Group) (1992) is an algorithm designed to compress images with 24 bits depth or grayscale images. It is a lossy compression method to implement algorithm. One of the characteristics that make the algorithm very flexible is that the compression rate can be adjusted. If we compress a lot, more information will be lost, but the output image size will be smaller. With a smaller compression rate we obtain a better quality, but the size of the out coming image will be bigger. This compression consists in making the coefficients in the quantization matrix bigger when we desire more compression, and smaller when we want less compression. The algorithm is established in two visual effects of the people visual system. First,peaople are more sensitive to the luminance than to the chrominance. Second, humans are more sensitive to changes in homogeneous areas, than in areas where there is more variation (higher frequencies). JPEG is the most utilized format for storing and transmitting images in Internet.
JPEG 2000 (Joint Photographic Experts Group 2000) - is a wavelet-based image compression standard. It was developed by the Joint Photographic Experts Group committee with the intention of superseding their original discrete cosine transform based JPEG standard. JPEG 2000 has higher compression ratios than JPEG. It does not tollerate from the uniform blocks, so features of JPEG images with very high compression rates. But it usually makes the image more blurred that JPEG.

Lossless Image Compression with Arithmetic Encoding 97
Advances in Computer Science and Information Technology (ACSIT) Print ISSN: 2393-9907; Online ISSN: 2393-9915; Volume 2, Number 1; January-March, 2015
Most of existing prediction methods acting in lossless compression are established on the raster scan prediction which is sometimes ineffective in the high frequency region.
4. PROPOSED WORK
To acquire a hierarchical prediction scheme To propose an edge directed predictor and
context adaptive model for this hierarchical scheme.
To be specific, propose a method that can apply lower row pixels as well as the upper and left pixels for the prediction of a pixel to be encoded.
For the compression of color images, the RGB is first converted into YCuCv by an RCT mentioned and Y channel is encoded by a conventional grayscale image compression algorithm.
5. ADVANTAGES
Lossless Compression High compression ratio
6. CONCLUSION
An appropriate context model for the prediction error is also determined and the arithmetic coding is utilized to the error signal corresponding to each context. For various sets of images, it is pointed that the proposed method further reduces the bit rates equate with JPEG 2000 and JPEG-XR.
REFERENCES
[1] M. J. Weinberger, G. Seroussi, and G. Sapiro, “LOCO-I: A low complexity, context-based, lossless image compression algorithm,” in Proc. 1996 Data Compression Conference, (Snowbird, Utah, USA), pp. 140-149, Mar. 1996..
[2] I. Ueno and F. Ono, “Proposed modification of LOCO-I for its improvement of the performance.” ISO/IEC JTC1/SC29/WG1 document N297, Feb. 1996.
[3] M. J. Weinberger, G. Seroussi, and G. Sapiro, “Fine-tuning the baseline.” ISO/IEC JTC1/SC29/WG1 document N341, June 1996.
[4] M. J. Weinberger, G. Seroussi, and G. Sapiro, “Palettes and sample mapping in JPEG-LS.” ISO/IEC JTC1/SC29/WG1 document N412, Nov. 1996.
[5] M. J. Weinberger, G. Seroussi, G. Sapiro, and E. Ordentlich, “JPEG-LS with limited-length code words.” ISO/IEC JTC1/SC29/WG1 document N538, July 1997.
[6] ISO/IEC 14495-1, ITU Recommendation T.87, “Information technology - Lossless and near-lossless compression of continuous-tone still images,” 1999.
[7] M. J. Weinberger, G. Seroussi, and G. Sapiro, “LOCO-I: A low complexity lossless image compression algorithm.” ISO/IEC JTC1/SC29/WG1 document N203, July 1995.
[8] Marcus, A., Semantic Driven Program Analysis, Kent State University, Kent, OH, USA, Doctoral Thesis, 2003.
[9] R. C. Gonzalea and R. E. Woods, "Digital Image Processing", 2nd Ed., PrenticeHall, 2004.
[10] Jian-Jiun Ding and Jiun-De Huang, "Image Compression by Segmentation andBoundary Description", Master’s Thesis, National Taiwan University, Taipei, 2007.
[11] Karthik S. Gurumoorthy, Ajit Rajwade, Arunava Banerjee, Anand Rangarajan,"A Method for Compact Image Representation Using Sparse Matrix and Tensor Projections onto Exemplar Orthonormal Bases”, IEEE Transactions on image processing, Vol. 19, No. 2, February 2010.
[12] Yuji Itoh, Tsukasa Ono, "Up-sampling of YCbCr4:2:0 Image Exploiting Inter-color Correlation in RGB Domain”, IEEE Transactions on Consumer Electronics, Vol. 55, No. 4, NOVEMBER 2009.
[13] Tae-Hyun Kim, Kang-Sun Choi, Sung-Jea Ko, Senior Member, IEEE,” Backlight Power Reduction Using Efficient Image Compensation for Mobile Devices,” IEEE Transactions on Consumer Electronics, Vol. 56, No. 3, August 2010.
[14] Ji Won Lee, Rae-Hong Park, SoonKeun Chang, "Tone Mapping Using Color Correction Function and Image Decomposition in High Dynamic Range Imaging”, IEEE Transactions on Consumer Electronics, Vol. 56, No. 4, November 2010.
[15] Fouzi Douak, Redha Benzid, Nabil Benoudjit,"Color image compression algorithm based on the DCT transform combined to an adaptive block scanning”, Int. J. Electron. Commun. (AEU ̈) 65, 2011, pp. 16–26.
[16] W.B .Pennebaker and J.L.Mitchell, JPEG still Image Data Compression standard. New York, NY,USA: Van Nostrand Reinhold,1993.