FILE COP ' IReport No.AF-79a - World Bank Documents
100
FILE COP ' IReport No.AF-79a This report was prepared for use within the Bank and its affiliated organizations. They do not accept responsibility for its accuracy or completeness. The report may not be published nor may it be quoted as representing their views. INTERNATIONAL BANK FOR RECONSTRUCTION AND DEVELOPMENT INTERNATIONAL DEVELOPMENT ASSOCIATION CURRENT ECONOMIC POSITION AND PROSPECTS OF THE REPUBLIC OF CAMEROON August 8, 1968 Africa Department Public Disclosure Authorized Public Disclosure Authorized Public Disclosure Authorized Public Disclosure Authorized Public Disclosure Authorized Public Disclosure Authorized Public Disclosure Authorized Public Disclosure Authorized
-
Upload
khangminh22 -
Category
Documents
-
view
0 -
download
0
Transcript of FILE COP ' IReport No.AF-79a - World Bank Documents

FILE COP ' IReport No.AF-79a
This report was prepared for use within the Bank and its affiliated organizations.They do not accept responsibility for its accuracy or completeness. The report maynot be published nor may it be quoted as representing their views.
INTERNATIONAL BANK FOR RECONSTRUCTION AND DEVELOPMENT
INTERNATIONAL DEVELOPMENT ASSOCIATION
CURRENT ECONOMIC POSITION
AND PROSPECTS
OF THE
REPUBLIC OF CAMEROON
August 8, 1968
Africa Department
Pub
lic D
iscl
osur
e A
utho
rized
Pub
lic D
iscl
osur
e A
utho
rized
Pub
lic D
iscl
osur
e A
utho
rized
Pub
lic D
iscl
osur
e A
utho
rized
Pub
lic D
iscl
osur
e A
utho
rized
Pub
lic D
iscl
osur
e A
utho
rized
Pub
lic D
iscl
osur
e A
utho
rized
Pub
lic D
iscl
osur
e A
utho
rized

CURRENCY EQUIVALENTS
Currency Unit: CFA francs (CFAF)
U.S. $1 = CFAF Z46.85CFAF 100 = U. S. $0. 4051CFAF 1, 000, 000 = U. S. $4, 051. 04

This report was prepared by Miessrz-.. Cornrlis JO A. Jansen
(Ghief of Mission), Timothy Lankester and Hanms Peter Muth
following a mission to Cameroon in May 19680

TABLE OF CONTENTSPageNo.
BASIC DATA (i)
SUNOARY AND CONCLUSIONS (iii)
I0 BACKGROUND 1
II. RECENT ECONOMIC DEVELOPMENTS
A. Origin and Expenditures on GDP 5
B. Fbreign Trade 7
C0 Sectoral Growth
(i) Agriculture 10(ii) Manufacturing Industry 13
(iii) Transportation 14(iv) Power 16
III. THE-FINAnCIAI, SITUATION.
A. Public Finance 18
B. Money, Credit, Prices, Wages 25
C0 Balance of Payments and Foreign Aid 27
IV. PROSPECTS FOR PRODUCTION AND CAPITAL FORIIATION
A. Introduction 29
B. Development Plans 30
C0 Sectoral Policies
(i) Agriculture 33(ii) Manufacturing 36(iii) Transportation 38(iv) Power 39(v) Education 40
D. Conclusion 40
V0 FINANCIAL PROSPECTS
A. Introduction 42
B0 Public Finance 43
C0 Private Sector Savings e5
D. Foreign Resources 46
VI. STATISTICAL APPENDIX
Map

BASIC DATA
Area: 183, 24 square miles; 475,450 square kilometers
Population (1968): 5v,49,000 (of which about 15,000 non-Africans)
Rate of growth: 2.1%Density: 29.7 per sq. mile
Political Status:
East Cameroon independent January 1, 1960;West Cameroon October 1. 1961;Federation October 20, 1961.Member Equatorial African Monetary Union andFranc Zone, Eauatorial African Economic andCustoms Union; Associated Member EEC.
Gross Domnestic Product (Est. 1967/68): $860 million(subsistence 20%)
Per capita: $157
Primary sector 37%Secondary sector 16%Transport, Trade, Services 47%
Rate of growth,1962/63 - 1966/67 7o3% (at current prices)
4i7% (at constant prices)
Percent of GDP at Market Prices
1962/63 - 196364 1964/65 - 196
Gross investment 10.8 14.9Gross savings 9e8 12.8Net import of goods
and services 10 2.1Balance of payments current -
account surplus o.6 -o.5Investmnent income payments net 1.4 1.2Government taxation revenue
(hbede:l.ratin 15.1 16 .4

Average ArmualIncrease
Money, Credit and Prices (CFAF billion) December 1967 196h - 1967
Total money supply 27.1 903%Quasi-money 2.9 1303%Commercial bank credit to private sector 3402 8 3%Rate of change in prices 3 -
Public Sector Operations (CFAF billion) 1966/67 1 / (revisedestimate
Governient current receipts 3109 3609Government current expenditures 3006 3208Surplus/Deficit +103 +401Government capital expenditures 308 306Public investment expenditures 105 10.5
External Public Debt (US$ million) 1967
Total debt (including undisbursed)at December 31, 1967 133
Total debt service 306Debt service ratio U02% of exports
Balance of Payrments (US$ million) Average annualincrease
1967 196)4 - 1967
Total exports 154 203%Total imports 186 1203%Current account deficit -45 téForeign aid disbursements 31 901%
Commodity concentration of exports 1967 196h
Coffee, Cocoa, Aluminurm 28%; 27%; 1i% 27%; 20%; 15%
Gross foreign exchange reserves 1967 196h
US$ million (end of year) 27 45
1I4F Position 31 Dec. 1967
Quota $1606 million
Drawings no ne
Bank/IDA Operations (in $million, at March 31, 1968)Amount committed Amount disbursed
Bank 1100IDA 7>55 o-85
2/ Current account in 1964 was in surplus.

SUIIMARY AND CONCLUSIONS
1. The Federal Republic of Cameroon, established in October 1961,consists of territories formerly administered by France and the UnitedISingdom. The govermnent of President Abidjo has handled post-independenceproblems firmly but with a sense of compromise, and bas successfully wea-thered tribal insurrection and the strains imposed by two administrativesystems and official languages. The governnent maintains close relationswith France and the European Common Market. It is a member of the franczone, ard the convertibility of its currency, the CFA franc, is guaranteedby the French treasury. Moreover, French aid and technical assistance playa vital role in the financing of economic development. As an associatedmember, the country also receives considerable aid from the European Com-mon Market. Cameroon has been trying to intensify economic cooperationwith its neighbors. In 1966 it entered into a customs and economic unionwith four of them. In May 1968, Chad and Central African RepXublicleft the unmon. A liberal policy bas been followed towards private ini-tiative; foreign private investment and management play a leading rolein manufacturing, banking and part of commerce and agricultural estates.Aware of the significant contribution of foreign capital and personnel,the government bas hitherto pursued its long-term goal of cameroonizationwitb moderation.
2. Per capita GDP stands at about 1 In recent years, GDP basgrown at about 5 per cent per year in real terms. This is well in excessof population growth, estimated at 2.1 per cent per year. Investment basincreased significantly as a proportion of GDP. Domestic savings havealso increased, and until recently almost matched total investment. Atthe same time, bowever, Cameroon bas been receiving substantial amountsof foreign aid and foreign private capital, but these have been nearlybalanced by transfers abroad of profits and incomes by foreign companiesoperating in the country and by the large number of expatriate personnel.
3. Foreign trade is the equivalent of about 40 per cent of GDP.Exports comprise a variety of agricultural crops, the môst important beingcocoa and coffee; and also aluminum. After impressive growth in theearly 60's, exports have scarcely risen in the past two years, largely owingto unfavorable prices and adverse weather conditions. The composition ofimports bas changed quite markedly in favor of raw materials and interme-diate and capital goods, reflecting the growth of consumer goods manufac-turing in the country. Total imports have grown fairly steadily, and havebeen on average covered by export earnings. However, in 1967 they increasedsharply leaving a substantial trade deficit for the first time.
4. About three-quarters of the working population is engaged in agri-culture, predominantly on a smallholder basis. Most farmers produce acombination of subsistence and export crops, and specialization is quitelimited. The contribution of agriculture to GDP bas dropped from about47 per cent to around 37 per cent since 1959. Nevertheless, though laggingbehind other sectors of the economy, production bas increased. Output of
- ii -
food crops appears to have been rising faster than population. Importsof foodstuffs are considerable, but mainly consist of items wbich cannotbe produced economically in Cameroon. Nutritional levels on the wholeare not unsatisfactory. The performance of export crops bas been mixed.Coffee, tbe most important foreign excbange earner, bas increased rapidly,witb the more valuable Arabica variety almost doubling in the past sixyears. Cocoa production grew considerably in the early 60's. But since1965, it bas stagnated under the effects of widespread disease. On theother hand, quality bas recently sbown a great improvement, and an importantdisease fighting and rebabilitation scheme launched in 1967 promises toraise output again. Banana production, once a major export, bas declineddrastically owing to Panama disease, and conversion to the more resistantand bigher yielding Poyo type has been slow. Output of rubber bas risenslowly, while tbat of paln products has stagnated. Cotton production, onthe other hand, has continued to grow rapidly since its introduction inthe 1950's, more than doubling over the past ten years.
5. Agricultural development bas been hampered by poor transportationand absence of regular marketing circuits. Land tenure problems and lackof credit have also been a constraint. The government bas recently passedlegislation clarif'ying the procedures for the expropriation of land forprojects in the public interest. It is also considering the possibilityof setting up an agricultural credit bank. However, it seems preferablethat credit be provided in connsction with specific schemes as is the casewith the current successful cocoa program. Progress in the future willdepend on overcoming these bottlenecks and also on the greater effective-ness of the extension services. The quality of extension personnel is good,but their work needs to be concentrated in productive schemos, and coordinatedto avoid contradictory instruction at the village level.
6. Manufacturing, though still a comparatively small sector, has pro-gressed extremely rapidly. In the past few years, industrial turnover basincreased by about 17 per cent annually. The main elements in this growthhave been import substitution of simple consumer goods and processing forexport, including aluminum. Industry has prospered with the help of astable political climate and generous fiscal benefits under Cameroon'sinvestment code. Opportunities for furtber import substitutions remain inmany lines, but increasingly industrial growth will depend on the expansionof tbe national and neighboring countries' markets.
7. Transportation is of decisive importance to the country's develop-ment. At present the network does not match up to its needs. Roads andrailways are few, and these are mostly in a poor state of repair. Theinadequacy of the road system is especially unfavorable for rural develop-ment. There has been some progress in improving the system recently, indlu-ding the establishment of a large maintenance equipment pool and the startof construction on a trunk road linking the major economic centers of Eastand West Cameroon. However, for the future more attention will need to begiven to the development of feeder roads. The Trans-Cameroon railway, wbich

- iii -
will eventually link the population centers of north and soutb, is advancingwell, and an urgently needed program to improve the central line bas justbegun. Cameroonts port capacity is nearing saturation; a study is beingundertaken to determine the most economic means for its expansion.
8. The educational system has grown rapidly and relatively satisfactoryschool attendance rates have been achieved. But shortage of trained teachersandothernecessaryinputs has lowered its effectivEmess. Izthe past twoyears,the government bas rightly re-oriented its policy to improving the qualityof the system and to expanding vocational instruction.
9. Cameroon bas enjoyed a generally stable financial situation, wbichhowever weakened to some extent in 1966 and 1967. In the early 1960's,budgetary operations, if anything, bad a deflationary effect. In 1965/66and 1966/67, however, tbey were expansionary. Substantial overall deficitsoccurred, coinciding with the phasing out of French budgetary support, andthus necessitated drawings on reserves. At the same tine, credit to theprivate sector expanded rapidly, leading to the increase in imports in1967, and consequently to a sharp fall in foreign exchange reserves. In1967/68 the fiscal situation has improved greatly, and measures have recentlybeen taken to curb the growth of credit. These, together with more favorableexport results, have led to a recovery of reserves in the first months of 1968.
10. Fiscal performance has improved quite impressively since indepen-dence. Budgetary savings have increased from a negative amount in 1961/62to about CFAF 4 billion ($16 million) in 1967/68. Current expenditureshave increased rapidly mainly on account of the growth of governnent sala-ries and allowances, but these have been more than matched by revenue growth.The latter has been due principally to the expansion of taxed activities,rather than to increases in tax rates. Capital expenditures on budgetaryaccount have also risen quite fast, altbough a higb proportion have goneinto adninistrative facilities. The one exception to this generally favor-able picture was 1966/67, when government savings fell off sharply owingto an extraordinary increase in current expenditures urnatched by revenues.But in 1967/68, renewed restraint on the expenditure side and a largeincrease in revenues bave brought about a strong recovery, with the largestcurrent surplus ever achieved. The government is determined to maintainthis improvement in the coming years, and is talidng action to hold downsalaries and allowances.
11. The goverrrnent's development strategy is outlined in its SecondFive-Year Development Plan (1966/67 - 1970/71). The Plan is framed withinthe perspective of doubling per capita income between 1960 and 1980, whichwould require an annual GDP growth of slightly below six per cent. Toachieve this, capital formation is projected to increase to 16 per cent ofGDP, as compared with 10 - 11 per cent during the First Plan period (1960/61 -1961/65), and it is expected to be split about equally between public andprivate sectors. Private investment is to be encouraged by maintaining aliberal attitude to foreign capital and through the benefits of the invest-ment code. Almost 50 per cent of public investment is intended for infra-

- iv -
structure, compared with 18 per cent for agriculture. Agriculture, however,will also indirectly benefit from investments in infrastructure, educationand health. Foreign aid is-expected to finance over one-third of totalinvestment and almost three-quarters of public, but a considerable increasein domestic public savings is also required.
12. The relative emphasis of the Plan is sound, as is the government'sconcentration on infrastructure, agriculture and social services whilerelying on the private sector to develop manufacturing. The excellent per-formance of the manufacturing sector in the last two years and immediateprospects indicate that the Plan's projections for private investment arelikely to be realized. Plan implementation in the public sector, however,has been somewhat disappointing. Public investment, while higher than inthe pre-Plan period, has fallen well below expectations, largely owing tothe shortage of qualified project personnel and adequately prepared projects.This is especiaUy the case in agriculture. Moreover, the composition ofpublic investment has diverged from that planned, mainly on account of thegovernment's excessive spending on administrative facilities. In this res-pect, as inthe Firet Plan period, the government bas failed to take the leadin pursuing the priorities it set. However, the capital budgets for thecoming year show a marked improvement, with closer adherence to Plan provi-sions.
13. The capacity for implementing projects bas been improving, and thestatus of projects and programs under execution indicate that public invest-ment could be increased significantly in the coming three years, resultingin total public investments for the five-year period of $288 million, 85 percent of the Plan target. Whether this can be achieved depends on financialavailabilities.
14. In the past, financial capacity was not on the whole a constraint,but it is likely to become increasingly so in the future. Public savingshave increased greatly since the early sixties, but on present revenue andexpenditure trends they are unlikely to contribute more than 27 per centover the next three years to the public investment total warranted by thecountry's increasing absorptive capacity. With the present institutionalarrangements, it is difficult for the government to tap domestic privatesavings. The mission's estimate of public investment in the coming threeyears therefore leaves a gap of about $150 million, and of $168 million ifdebt repayment and a small amount of foreign aid for schemes in the privatesector are included. Disbursements on already committed or near-committedaid are likely to be just over $100 million, so that $65 million would beneeded out of new commitments. In view of the relatively small contribu-tion of public savings to total public investment, and since part of publicsavings will be needed for sehemes unsuitable for external financing, it isnecessary that aid should cover a high portion of the costs of foreign-financed projects; this will require, particularly for agricultural pro-jects, a degree of local cost financing.

15. Aid prospects are sormewbat 'ess certain than hitherto. The gov-ernment should therefore seek to strengthen the revenue system in order to
increase public savings, and thereby reduce its reliance on foreign
assistance. This will require examining the possibilities of improving
tax administration and of increasing company and income tax. A cost/benefit
study of the investment code would also be desirable to determine whether
or not the fiscal benefits granted to companies under it bave been fully
justified. In addition, steps might also be considered to retain a
larger part oaZ private savings in the country.
16. Prospects for continued overall growth in the next few years appear
favorable. They will depend partly on the availability of finance forpublic investment. But assuming the level of public investment estimated
by the mission can be achieved, and given the expectation of continued
buoyancy in private sector investment, then the GDP growth rate of 5.8 per
cent projected in the Plan is likely to be somewhat exceeded. For the longer
termn, the probable increase in the population growth rate to about 3 per
cent per year as a result of falling death rates could impair the prospectsfor both total and per capita growtb. It would therefore be useful for the
government to start a study of the many problens connected with a possiblepopulation control program.
17. Servica on Cameroon's currently incurred public debt will reach a
peak of about $7 million, 4 - 5 per cent of projected exports in the early1970's, and a modest increase in debt on conventional terms would be jus-tified. However, in view of the country's poverty, and the size andduration of its need for development aid, most foreign assistance should
be on concessional terms.

THE ECONOMY OF CAMEROON
I. BACKGROUND
1. The purpose of this report is to upqate the analysis and conclusionsin the previous economic report on Cameroon.Y The encouraging progress ofthe economy noted in that report was the result of large infrastructureinvestments since the early l95Ots and various programs and projects inexport agriculture and manufacturing. According to the report, GDP in realterms had been increasing during the years 1959-1964 at an average yearly rateof about five percent. In the public sector, government had been successfulin raising current savings and development expenditures, while private sectordevelopment had been stimulated by the establishment of a favorable investmentclimate. Economic growth had been much helped by the monetary ties with Franceand the financial assistance from France and the European Economic Community(EEC).
2. As far as the future was concerned, the report felt that the govern-mentts Second Five-Year Plan (1966/67-1970/71) was unlikely to be fully imple-mented during the plan period. In view of political and economic uncertaintiesand administrative weaknesses,total investment would probably not exceed 80percent of the amount proposed in the Plan. At the same time, the report wasless optimistic than the planners about the scope for increasing domesticsavings, especially those in the public sector. The GDP growth rate for thePlan period was estimated in the report at 4-5 percent a year, well ahead ofthe estimated population growth of 2.1 percent.
3. In view of the light debt burden and at least moderately good exportprospects, the report felt that Cameroon was creditworthy for borrowing limitedamounts of capital on conventional terms. But in view of the countryts povertyand the likelihood that economic progress in the foreseeable future would berelatively slow, it was recommended that the major proportion of foreign finan-cial assistance be extended on concessional terms.
4. The Federal Republic of Cameroon, almost las large as France but withonly 5.4 million inhabitants, is a poor country. Per capita GDP is estimatedat CFAF 39,000 or $157 at the official exchange rate. About three-quarters ofthe population depends on agriculture for its livelihood, of which the vastmajority are smallholders. Nearly all farmers produce a mixture of cash andsubsistence crops, and thus, while subsistence cultivation accounts for about20% of GIP, a subsistence sector (i.e. producing wholly for self-consumption)as such is virtually non-existent. Except in West Cameroon, plantation agri-culture is relatively unimportant. Establishment of estate-type operations inEast Cameroon has been hampered by difficulties in establishing legal title toland under the prevailing land tenure system. Recently, however, steps havebeen taken to solve this problem. The country has considerable ecologicaldiversity which permits the cultivation of a large variety of crops; this isone of the strong points of the economy. The coastal, southern and south-eastern parts of the country are covered with tropical rain forests withsuitable conditions for tropical tree crops such as coffee, cocoa, palm oil,
] "The Economy of the Federal Republic of Caameroon", No. AF-48b datedNovember 3, 1966

- 2-
rubber, bananas. In the north, near Lake Chad, where rainfall is seasonal,cotton, groundnuts, rice and other cereals are grown. Between these regionsthere is a considerable area of higher lands with generally lower tempera-tures and sufficient rainfall for good grazing potential. With the exceptionof smaller areas of volcanic and alluvial terrains, soil fertility is nothigh. But thanks to good growing conditions (rainfall, sunshine) the nutri-tional position of the population is not unfavorable and there is no largeprevalence of hungeri/ S here are few known minerai resources that are com-mercially exploitable, However, ongoing exploration of oil deposits on andoff the liest Cameroon shore has shown favorable initial results. The rivershave good hydropotential, but little significance for navigation.
5. The Federation consists of the states qf East and West Cameroon,formerly U.N. Trust Territories, administered by France and the United Kingdom,respectively. It was established in October 1961. The former French territory,now the State of East Cameroon, is by far the larger of the two occupying 91percent of the total land area and comprising 79 percent of the population.The constitution gives wide powers to the President, who is chosen by directpopular vote. The President has the initiative for legislative proposalsincluding the formulation of the Federal budget which he subnits for approvalto the unicameral National Assembly. The President also appoints the minis-terial cabinet of the Federal and the Prime Ministers of the two State govern-ments. There is only one political party.
6. There is considerable ethnic, social and religious diversity withinthe country. In the north, the population is predominantly Sudanic, thesociety is semi-feudal, and Islam is the common religion. In the southernand coastal regions, the people are mainly Bantu, but comprise a multiplicityof tribes, languages, and customs. Christianity and animism are the mainforms of religion. In spite of these differences, Cameroon has enjoyedpolitical stability for the last six years. President Ahidjo, a northerner,has maintained a government of truly national complexion, and the task ofunifying the country, both politically and economically, is being pursuedwith energy and success. Post-independence problems have generally beenhandled with a sense of compromise, but not without firmness. The insur-rection in the early 1960's of the Bamileke, a major tribe living on high,fertile and very densely populated lands, on the border of East and WestCareroon, was brought under control with the use of military force. Anothermajor problem, the unification of East and West Cameroone is not yet fullysolved. Steps have been taken to harmonize the administration and taxes inthe two parts of the country. In 1966, the Federation introduced uniformcustoms duties, chiefly by raising West Cameroonts duties to the much higherlevel prevailing in the East. Direct taxes however are still much higher inthe West than in East Cameroon. The Federation has tlfo official languages,French and English. In order to improve day-to-day communications betweenthe two territories, the Federal Governrent is promoting bilingual instructionon a limited scale.
1 In several regions there are qualitative deficiencies, particularly ofproteins, fat, calcium, vitamins A, B2 and C. Cf. G. Winters, Méthodologedes enquêtes "Niveau de vie" en milieu rural Africain (Yaoundé, August 1967)

- 3 -
7. Cameroon maintains close financial and economic connections withFrance and the EEC, of which it is an associated member. It is a member ofthe franc zone and its currency, the CFA franc, which is in circulationthroughout former French Equatorial Africa, is fully convertible with theFrench franc. Cameroon shares with Gabon, Congo (Brazzaville), Chad andthe Central African Republic, a common central bank, the BCEAEC,1J whichwas established with French financial assistance, and whose headquartersis in Paris. Financial aid from France, mostly on a grant basis, has playeda vital role in the financing of Cameroonis development effort. Specialmarketing arrangements, however, for Cameroon 's export products in France arebeing phased out in line with the Yaoundé convention. According to theconvention, which established the ground rules for associated membershipin the Common Market, the EEC common outer tariff is to be applied to theproducts of associated members. However, in order to facilitate the tran-sition to competition on the basis of world market prices, the EuropeanDevelopment Fund (FED) of the EEC is providing, for a transitional period,price support for a number of products and aid for production diversification.Both these are coming up for re-negotiation in 1969. The government hasestablished friendly relations with its neighbors. The country is a memberof the Organization of African States and Madagascar (OCAM) and on January 1,1966, it formed, with four neighbor countries,d/ an economic and customsunion. The total number of inhabitants of the member countries is 11.6 million.their average per capita income about $110 and their combined imports in 1965amounted to $338 million. This union, the Union Douanière et Economique deltAfrique Centrale (UDEAC) introduced a conmon outer tariff and aimed atharmonization of investment decisions and investment encouragement laws withinthe union. A solidarity fund was established to provide compensation to Chadand Central African Republic for the loss of customs revenues arising fromthe union. In 1967/68 Cameroon contributed CFAF 500 million ($2 million)to it.In early May 1968 Chad and the Central African Republic left UDEAC to form anew association with Congo (Kinshasa). The other three members have statedthat they will continue the union. The departure of Chad and Central AfricanRepublic, the most;backward of the five, is likely to have little effect onCameroon. UDEACts existence has been too brief to have made already asubstantial contribution to regional development and at the present stageof development of member countries spectacular results are not to be expected.However, it is certainly desirable that this constructive attempt to widenthe scope for industrial development be continued.
8. While progress has been made in the field of education (in the moredensely populated areas primary school attendance and literacy among theyoung are high), the country still does not supply sufficient numbers ofhighly skilled administrative, professional and managerial personnel. African-ization of top civil service posts proceeded rapidly in the first few yearsof independence, but since 1964 the pace has slackened. A large number of
lJ Banque Centrale des Etats de l'Afrique Equatoriale et du Cameroun (CentralBank of the states of Equatorial Africa and Cameroon).
2| Central African Republic, Chad, Congo (Brazzaville), and Gabon.

expatriate advisers, many of them with previous administrative experiencein Cameroon 9 is assisting the goverrnnent. As far as the private sector isconcernedp government has maintained a liberal visa policy and most of theresponsible positions in industrys commerce and banking are held by foreigners.Meanwhile a large number of Cameroonians are pursuing advanced studies abroad.When these students will have obtained professional qualifications and sub-sequently the necessary career experience, they should eventually be able toreplace the expatriate element. Of necessity this is a slow process andpolitical pressure to accelerate it unduly should be resisted.
9. Population density is low in most of the country, about 11.5 persquare km for the country as a whole. This fact has contributed to a feelingamong policy makers that population growth (now estimated at 201 percent ayear) does not pose a serious economic problem and consequently governmenthas not yet formulated a policy of population control. Howeverg if preventivemedicines on which public health programs are now concentratingS proves suc-cessful, the death rate might drop quite drastically in a relatively shortperiod from its present estimated level of 26 per l,OOOc As has happened inmany other less-developed countriess the result would be a sharp rise in thepopulation growth probably to over three percent a year. Since this wouldlead to a lower savings rate (because of the increased dependency ratio) andincreased expenditures on high capital-output ratio activities such as edu-cation and pîob'lc administration9 the result would be perceptibly smallerannual GDP increases to be shared by much larger numbers. Under such condi-tions per capita income growth would slow down and the outlook for the countrywould be less favorable. These considerations suggest that it would be usefulfor the government to start, perhaps in cooperation with appropriate advisoryagencies, a study of the many difficult social9 cultural and medical problemsconnected with a possible population control program.

II. RECENT ECONOMIC DEVELOPMTS
A. Origin and Expenditures on GDP
10. The most recent official national accounts estimates relate tothe financial year 1964/65. For the three years that have passed sincethen there are no official estimates. In order to obtain a view of overalldevelopments in these recent years, the mission has attempted to piecetogether, from various sources of statistical informations tables showilngGDP by industrial origin and expenditure categories. In view of the scar-city and unreliability of statistical data the results are necessariytentative, but it is felt that they do provide an approximation of whathas happened in the economy and at the same time help judging the prospectsof the econony.
il. The first conclusion from these calculations is that the grow4thof GDP has remained well ahead of population growth. Annual GDP growthover the five-year period 1962/63 to 1966/67 is estimated at 7.3 percentin eurrent and .?7 percent in constant prices. The origin of GDP by prin-cipal economic sectors is shown in Table I.
Table I: GROSS DOMESTIC PROLWUCT BY INDUSTRIAL ORIGIN
(at current market prices, CFAF billion)
1959 1962/63 1963/64 1964/65 1965/66 1966/67 1967/68
Agriculture %4.o 61.2 64.6 68.2 70.7 72.1 77.8Manutacturing 16.7 19.2 22.1 25.4Construction 11.3 17.4 19.6 5.9 6.5 7,2 7.9Electricity,Gas, Water 1.0 1.3 1.5 1.7 1.9 2.0 2.2
Transport, Storage 3.4 5.8 6.8 10.6 12.7 14.7 16.7Commerce 29.4 37.1 39.9 38.4 40.5 42.6 46.6Public AdminisirationLa 10.4 13.9 15.0 19.7 21.7 25.9 27.9Other Servicest.2 4.1 8.0 9.1 6.7 6.9 6.9 8.4
GDP 113.6 144,7 156.5 168.1 180.1 193.5 212.9
9 No provision made for imputed rent of governnent buildings..Apparently no provision included for owner-occupied dwellings.
Sources: 1959-1963/64: Previous economic report (AF-48)1964/65: Direction de la Statistique, slightly adjusted by mission.1965/66-1967/68:Mission estimates.
The growth pattern in recent years bas been different for the various sectors.Agriculture felt the impact of very low cooea prices in 1965 and of drought

affecting the production of coffee, cotton and a number of other productsin 1966. This temporary slow-down in the growth of agricultural value addeddid not check the fairly fast growth rates of manufacturing production,transportation and construction activity. The proportion of these sectorsin GDP has been increasing significantly, On the other hand, the contribu-tion of agriculture has dropped to 37 percent, a level that is low in com-parison with other African countries./
12. The statistical basis of the table on expenditures on GDP (Table II;see also Statistical Appendix Table 25) is not strong, so that conclusionsmust be drawn with caution. It would appear that a considerable shift hastaken place from consumption to investment. Investment rose from 11 percentof GDP in 1962-64 to 15 percent in 1964-67. Public and private sectors bothparticipated in the upsurge of investment. The increase in private sectorinvestment is probably closely related to the earlier mentioned sharp increasein manufacturing production and the expansion in recent years of moderntransportation and distribution activities. The rapid increase in investmentand savings shown in the table would be a favorable development althoughthe level of investment is still low by international comparison (20-25percent of GDP in highly developed economies and 15-20 percent in a numberof fast growing developing economies).
Table II: EXPENDITURES ON GDP
(In percent of GDP)
Average Average
1 l96h/65 - 1966/67
Consumption 90.2 87.2
Private 75.3 69.3Public 14.9 17.9
Investment 10.8 1h.9
Private 7.0 9.5Public 3.8 5.5
Dmport Surplus 1.0 2.1
GOP 100 100
Savings 9.8 12.8
Source: Statistical Appendix, Table 25.
1| The average contribution of agriculture to GDP in French speakingcountries south of the Sahara is 45 percent, but this does not includea number of the more backward countries which rely probably even moreon agriculture. Source: IBRD World Tables.

-7-
13. Most of the increase in investment appears to be covered bdomestic savings. In fact, the net participation of foreign savingsiYin the financing of Cameroonts total investment, although on the rise, isquite small, only two percent of GDP and only 13 percent of total invest-ment. This is in apparent contradiction with the countryts heavy relianceon foreign aid and the evidently substantial private foreign investments,especially in the industrial sector. The explanation is that transfersout of private current income, and perhaps also capital by foreign enter-prises and residents are large, in fact almost as large as the capitalinflow. From 1962 to 1966 the net outflow of private funds on current andcapital account averaged about CFAF 4.1 billion. In this situation, thenet contribution to Cameroon of foreign aid and foreign private investmentconsists in the additions resulting from it to productive capacity ratherthan in a net strengthening of the savings-investment balance.
B. Foreign Trade
14. The basic importance of foreign trade to the Cameroon economyderives from the countryls meagre resource endowment and early stage ofindustrial development. These make it necessary to import most of therequirements for raw materials and intermediate products as well asvirtually all capital goods. The country also needs certain food imports.Recent overail developments in foreign trade are given in the followingtable:
Table III: EXPORTS AND IOPORTS
(In CFAF billion)
1962 1963 1964 1965 1966 1967
Exports 30.0 34.8 36.1 35.4 36.9 38.6Imports 28.3 31.6 32.8 37.4 36.1 46.4Trade Balance + 1.7 + 3.2 + 3.3 - 2.0 + 0.8 - 7.8
Source: Statistical Appendix Table 38.
Cameroonis tropical tree crops and, since the early 19 6 01s, aluminumexports, have provided foreign exchange earnings roughly equivalent tomerchandise importsa with the notable exception of 1967, which showeda substantial trade deficit. This i;as caused by a sharp increase inimports in the latter half of the year. The total value of foreign tradeas a percentage of GDPF, has fluctuated as follows:
1] Net import of goods and services

- 8 -
Table IV: FOREIGN TRADE AS PERCENT OF GDP
1959 1962/63 1963/64 1964/65 1965/66 1966/67
Exports 23.6; 21.5 23.9 22.9 20,9 19.8Imports 17.7 20.3 20.7 22.3 20.9 19.4
TOTAL 41.3 41.8 44.6 45.2 41.8 39.2
Source: Table I and Quarterly Economic Bulletin for trade on a fiscal year basis.
Betwfeen 1959 and 1964/65, the export ratio remained fairly steady, whilethe import ratio increased; since 1964/65, both ratios have declined,although in 1967/68 the import ratio has almost certainly risen again.
15. As pointed out before, the variety of export products has ensureda greater stability than experienced by some primary commodity exporters.For this reason, the 28 percent drop in cocoa prices in 1965/66, at the timeCameroonts largest export p,oduct led to only a 7 percent drop in the weightedaverage of export prices f Although the development of export prices since1962 has, on the whole, not been unfavorable, growth of total export valueshas not been very high, about 3.5 a year (comparing 1965-67 exports with1962-64 exports). Growth in export volume is shown in the following table(Table V). Of the principal products only coffee has had a high growthrate. In a few cases the fairly poor export showing is also due to increaseddomestie consumption. This is true for cotton, cocoa (recent establishmentof cocoa butter and chocolate factories) and groundnuts.
Table V: GROWTH OF VOLUME AND VALUE COMPOSITION OF EXPORTS
Average Average Average Value CompositionExport Volume Export Volume Annual Growth in 1967
1962-64 1965-67 Rate (in % of total(in thousand tons) (in %) export value)
Coffee 46.2 59.5 8.8 28.8Cocoa 69.7 744.9 2.5 25.2Aluminum 50o.7 46.9 -2,4 13.6Timber 236.7 254,1 2.4 6.9Cotton 14.8 17.2 5.1 4.7Rubber 8.2 10.7 9.3 2.9Bananas 117.>4 77.1 -13.1 1.9Palm kernels 17.9 18.3 0.8 1.4Palm oil 5.7 9.5 18.6 1.2
Source: Statistical Appendix Table 34.
1J According to mission calculation of export price index (1964/65 100):1962/63 1963/64 1964/65 1965/66 1966/67 1967/68
95 96 100 93 98 100
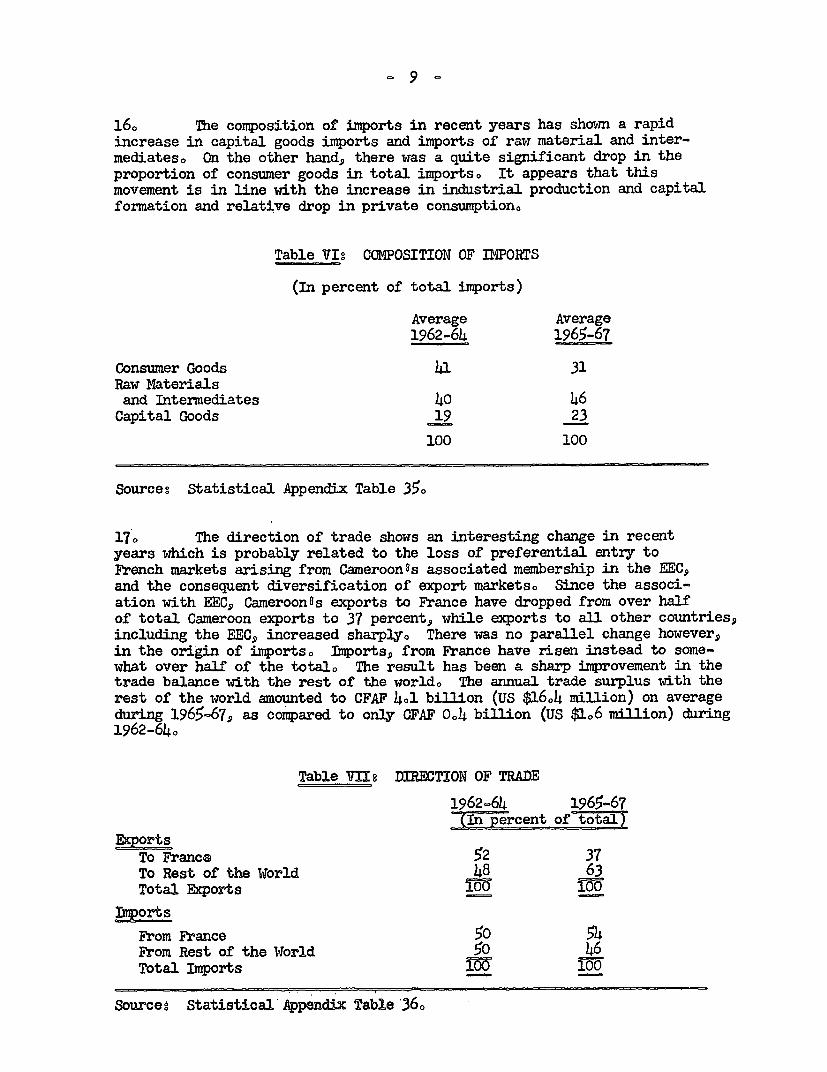
16. The composition of imports in recent years has shown a rapidincrease in capital goods imports and imports of raw material and inter-mediatesa On the other hand, there was a quite significant drop in theproportion of consumer goods in total imports, It appears that thismovement is in line with the increase in industrial production and capitalformation and relative drop in private consunptiono
Table VID CCWPOSITION OF IMPORTS
(In percent of total imports)
Average Average1962-64 1965-67
Consumer Goods 41 31Raw Materialsand Intermediates 40 46
Capital Goods 19 23
100 100
Source: Statistical Appendix Table 35o
170 The direction of trade shows an interesting change in recentyears which is probably related to the loss of preferential entry toFrench markets arising from Cameroon8s associated membership in the EEC9and the consequent diversification of export markets. Since the associ-ation with EECg Cameroon2s exports to France have dropped from over halfof total Cameroon exports to 37 percent, while exports to ail other countries,including the EEC, increased sharply. There was no parallel change however,in the origin of importsa Imports, from France have risen instead to some-what over half of the total. The result has been a sharp improvement in thetrade balance with the rest of the world, The annual trade surplus with therest of the world amounted to CFAF 4L1 billion (US $16,4 million) on averageduring 1965-67, as compared to only CFAF 04 billion (US $1o6 million) duringi962-64o
Table VIIg DIRECTION OF TRADE
1962-64 1965-67=Inpercent of
ExportsTo France 52 37To Rest of the World 48 63Total Exports îo100y
Iineorts
From France 50 54From Rest of the World 5° 46Total Imports 100 100
Sources Statistical'Appendi:x Table 36o

- 10 -
C. Sectoral Growth
Agriculture
18. The economy of Cameroon remains, to a large extent, based onagriculture. Roughly 80 percent of the population still live in ruralareas, compared to 87 percent in 1959. Agriculturets contribution to GDPis estimated at 37 percent in 1967/68 as against 47 percent in 1959. Thesector earns almost ail of Cameroonls foreign exchange, largely by exportingcocoa, coffee, cotton, bananas, lumber and a variety of other products.The country is, hcwever, not self-suufficient in food production. Food andbeverage imports have averaged CFAF 5.3 billion ($21 million) since 1963 ofwhich about a quarter consisted of "luxury-foods" - alcoholic beverages,Eiropean meats, fruits and vegetables, canned food. The three most im-portant single food items have been on the increase, as the followingtable shows:
Table VIII: IMPORTS
(In thousand tons)
1964 1965 1966 1967
Rice 6.8 9.9 7.9 10.1Flour 16.9 22.3 24.7 30.9Sugar 8.o 10.1 9.5 13.7
19. In East Camaeroon agricultural production is largely in the handsof smallgrowers. The normal pattern is for farmers to produce partly forcash and partly for subsistence0 Plot sizes average between one and threehectares. Two postwar attempts at creating a strong cooperative structurehave failed, chiefly because of lack of proper guidance and of understandingof cooperative principles and practices among leaders and peasant members.The major exception is the successful union of Arabica cooperatives (UCCAO)IJwhich provides technical and marketing guidance to the growers through theircooperatives. UCCAO markets the entire East Cameroon Arabica production. Afresh attempt at reorganizing the cooperative system was launched in 1965.The government is trying to avoid the flaws of earlier attempts, and indi-cations are that the movement may succeed among producers of export cropsfor whom cooperation in disease control, plant rejuvenation, harvesting andconditioning, and marketing usually means substantially higher cash incomes.Plantations exist on a limited scale, principally for oil palm and rubber.
20. In West Cameroon plantation agriculture is relatively more important.The Cameroon Development Corporation (oDC), a statutory authority of thegovernment, is much the largest agricultural enterprise, and controls some22,900 hectares. Rubber accounted for 54 percent and oil palms for 36 percent
1j Union des Coopératives de Café Arabica de l'ouest.

of the area. The planting estimate for 1968 is 3,700 hectares, of which73 percent for oil palms. Each year the corporation produces about 30percent of West Cameroonts exports.
21. There is little reliable information about the production ofsubsistence cropsl4' but it appears that output of the most important cropshas been increasing somewhat faster than population growth since the early1960's, although years with poor rainfaJ. have periodically damaged par-ticular crops. Maize, manioc, millet and sorghum, arrow-root, plantainsand yams are the basic staples. IWest Cameroon staples include potatoesand vegetables. Cultivation methods in subsistence agriculture are stillprimitive and the use of fertilizers and pesticides has remained very limitede
22. The possibilities of import substitution are limited by consumerpreferences and by climatic factors. Expatriates will probably continue toconsume imported goods, such as beverages, milk products and meat, in pre-ference for domestic produce and some staple products, notably wheat, cannotbe economically produced in Cameroon. However, the production of rice hasincreased quite rapidly since 1960, and industrial-type sugar cane productionstarted in 1967.
23. Production trends in several export crops appear encouraging.Several of these crops benefit from more intensive government financialand technical assistance. In the field of coffee, the government isencouraging conversion from the Robusta to the Arabica variety wherealtitude and climate permit. Arabica production, for which higher worldmarket prices prevail, has increased froxm about 11,000 tons in 1961/62to an estimated 21,000 tons in 1967/68_ In the same period the outputof Robusta increased from about 38,000 to some 52,000 tons. The 1968International Coffee Agreement raises Cameroonts official basic quotafrom 45,0oo to 60,000 tons. Cameroon has been selling well in non-quotamarkets, particularly Japan and Eastern Birope, but this trade is strictlybilateral and may fluctuate from one year to the next.
24. Cocoa production increased considerably between 1961/62 and1964/65, froma77,000 to 98,000 t, and has remained at or somewhat belowthis level since then. In part this is due to the sharp price drop in1965 which temporarily reduced the interest of growers. Meanwhile,quality improved. Only 21 percent of the 1963/64 crop was of superior
1/ In this report crops are categorized as subsistence and export orcash according to official Cameroonian terminology. Subsistencecrops include non-exported cash crops such as rice and sugar cane.
2 Agricultural production figures for East and lWest Cameroon aredifficult to reconcile since the former are kept for "campaignyears" and the latter for calendar years. All additions aretherefore somewhat arbitrary, particularly where productionfluctuates greatly from one year to the next. Neverthelessefor lack of more precise data, the data for East and West Cameroonhave been added without making any adjustments.

- 12 -
quality, but this share rose to 89 percent in the current (1967/68) campaign.After a USAID financed pilot program and a larger FAC supported prograrn,the Cocoa Price Stabilization Fund has launched in 1967 a cocoa rehabilitationscheme which is to cover 250,000 hectares in five years' time.
25. Banana production, once a major export product, has crumbled owingto the Panama disease. Conversion to the sturdier, disease resistant "Poyoa"variety is possible as far as growing conditions are concerned. However,the "Poyo" banana needs more attention from the farmer - irrigation, ferti-lization, support of the stems carrying the heavy bunches - which makesconversion based on sma11grower care a difficult venture. The added effortproduces Poyo yields up to four times higher than those common with GrosMichel plants. While Ivory Coast converted to Payo and rapidly increasedits banana production, Cameroon has hesitated and saw its output dwindlefrom an estimated 160,000 t in 1961/62 to less than 90,000 t in 1967/68(estimate). Poyo production in 1967/68 will exceed 30,000 t for the firsttime and has doubled every year since 1964/65. The goverrnment has requestedFMD financing for a large-scale conversion scheme, but there is still un-certainty whether to proceed on the basis of plantations or a smallholderscheme with intensive supervision.
26. Cotton production and harvest is managed by a French non-profitorganization (the Compagnie Française pour le Dléveloppement des FibresTextiles)o Cotton is grown in the North of the country. Production wasstarted in 1951/52, It had reached 20,000 t by 1957/58, and had increasedto 56,o0o t in 1966/67. Yield per hectare has increased somewhat erratically,due to great variation in annual rainfaU and to the policy of expandingcotton acreage every few years, since the extensive cultivation of new fieldsmakes for lower average yields. In 1966/67 average yield per hectare was570 kg. Tests at Guetale indicate that yields could be considerably increasedwith the use of fertilizer. An obstacle to more regular fertilization isthe high cost of transport.
27. In East Cameroon the output of palm oil and pal kernels hasfollowed a dowward trend in recent years. Production is la-rgely in thehands of smallgrowers who have shown growing aversion to the laborioustask of climbing the palm trees. (Wild palms are generally much higherthan plantation trees), East Cameroon used to export palm oil regularlyup to about 1961.- Since then domestic production has been supplemented byimports from West Cameroon. The Bank has been asked to help finance a 9,OOOhadevelopzr.ent prograrn in East Camneroon uzhich will assure the supply of thedomestic market and also produce exportable surpluses of palm oil. In WestCameroon the production of palm oil and palm kernels is largely in the handsof CDC and Paniol (Unilever). In 1967 Bank and IDA lent $18 million to CDCwhich intends to increase its oil palm plantations from 8,800 ha at the endof 1967 to 21,000 ha by 1973.
28. R&ibber production in East Cameroon has been stagnating at around4,o500 t aniually throughout the 19601s. Low world market prices are adducedas reasons for bad plantation maintenance. On the other hand, CDC in WestCameroon has almost doubled its output from 3,800 tons in 1961 to 7,300 tonsin 1967. Practically the entire output of East and West Cameroon is exported.

- 13 -
29. Production data for timber are available only for East Cameroon.Although the southeastern part of the country is heavily forested, productionhas not developed spectacularly. The yield per hectare in valuable timberis very low - much lower, for example, than in neighboring Gabon - and vastareas are virtually inaccessible. Lack of roads and high transportationcosts in general limit the scope for expansion.
30, The main livestock producing areas are the region around Adamoua,northern Cameroon and West Cameroon. Cattle and goat herds numbered about1.9 million each at the end of 1966, and there were about 1.5 million sheep,280,000 pigs and almost 7.4 million head of poultry. Inadequate transportis a serious problem for cattle and beef trade. Cattle are mainly transportedon hoof over large distances with severe loss in weight and quality. In theshort run, development of production is hampered by high mortality due todiseases, lack of care aild mneconomic slaughtering. For the long term, poorbreeds wiil be a constraint on output, but there are on-going experiments toimprove domestic types by cross-breeding with imported animals. Scantyavailable data suggest slow growth of beef production, considerable increasesin poultry sales, and little development for sheep, goats and pigs. Datafor production and sales outside the control of official inspectors -probably quite high - are not available.
31. - ProC.ction of fresh-water fish yields annually between 40,000 and45,000 tons. Three-fourths are caught in Lake Chad, the rest in the numerousrivers and in artificial fish ponds, a large number of which have been createdsince 1960. Fishing gear ard processing are still primitive which leads towaste and spoilage, Since the early sixties there has been marine fishingwith motorized. vessels on a commercial basis. These vessels landed about15,000 tons of fresh fish at Douala during 1967. In 1960 landings hadtotalled only 3,200 tons, No precise data exist on the production of tra-ditional sea fishing, but rough estimates indicate that annual productionis 10,000 tons.
Manufacturing Industry
32. Manufacturing consists primarily of agricultural processing plantsand import substitution ventures suitable for a small market: beverages,footwear, textiles and garments, bicycle assembly, paint, matches, soap.The large hydro-potential has led to the establishment of a large aluminumfactory based on imported alumina. Most of the industry is located in theport city Douala, where the infrastructure is adequate for many industrialpurposes. Growth of industry has been favored by political stability,liberal government attitude towards foreign investment and industrial creditfrom financial institutions at moderate cost. Credits of the government--owned Banque Camerounaise de Développement (BCD) bear interest rates of 6-7percent a year. Commercial bank interest rates respond to Central Bankdiscount rates which, depending on the kind of paper discounted, rangedfrom 2.5 to 6 percent in mid-1967. New BCD credits to industry (includinghandicraft) amounted to about $2.5 million a year during the last two yearsand long- and medium-term commercial bank credit to larger industrialenterprises amounted in 1967 to somewhat over $1 million. In addition, thegovernment-owned Société Nationale dlInvestissement (MNI) has since 1964 made

- 4 -
minority participations in the capital of industrial enterprises at anaverage annual rate of $1 million. Many industrial enterprises are sub-sidiaries of foreign concerns and as such have access to the funds andcredit of the mother organization. In order to increase domestic andforeign industrial investment, government adopted in 1960 an investmentct1e under which eligible enterprises are exempted for a period up to 10years from paying import duties and up to three years from paying otherindirect taxes. Some enterprises are also exempted from profits taxesand a number of large enterprises have been given under the code guaranteesof fiscal stability for up to 25 years. The enterprises that have receivedthis guarantee are the aluminum factory, the two largest power companies,the recently established sugar and fLour mills and the two companies searchingfor oil. In all, 11O firms have been granted benefits under the code, underthe UDEAC investment code which affords similar benefits to enterpriseswishing to export to other UDEAC members or under other Cameroon investmentlegislation. Total planned investment of the 110 firms amounted to $160million. It seems likely that a major part of this investment has beenrealized. Benefits under the investment code are generous. Even the minimumbenefit of exemption from import duties and indirect taxes amounts to 40-50percent of the value of the products concerned0 It is hard to judge whetherthe revenue loss represented by the benefits is matched by increases ininvestment, national income and, later, increased tax revenue.
33. The manufacturing sector as a whole has grown rapidlyo In recentyears, aggregate industrial turnover (including processing of export crops)increased by over 17 percent per annum at constant prices to over $180 millionequivalent in 1966/67. The number of employees increased by 14.5 percentannually to 15,O00. In the past, most of the progress has been derived fromnew plants manufacturing hitherto imported products. Opportunities forfurther import substitution remain in many lines, but increasingly industrialgrowth will depend on the expansion of the national and neighboring countriesmarkets. The UDEAC carries the promise of a larger market, although mostplants established in Cameroon under the UDEAC investmpent code so far havesold almost all of their output in Cameroon itself.L' Four firms in the shoeand textile branch sold more than 20 percent of their output to Chad and theCentral African Republic, which now have left UDEAC; these firms may facesome difficulties in the future.
Transportation
34. Given the wide geographic distribution of productive resources aswell as the limited degree of economic self-sufficiency of most parts of thecountry, the development of the transportation network is of decisive impor-tance for economic progress. The present transportation infrastructure doesnot measure up to this task in spite of some recent progress, There are fewroads and railwaysj and these are mostly in poor state. The country's major
1] Out of 43 such plants only one sold more than 40 percent of its outputin other UDEAC countries, while 26 sold over 90 percent in Cameroon itself(January-June 1967 data).
g/ There is 1 km of railroad and 2.4 km of asphalted road for every 1,000 kma2of surface. This compares with 5.2 and 8 lm., respectively in Senegal,1.9 and 2.6 lm in Ivory Coast, and 1.5 and 3.1 lm in M4adagascar.

sea port is becoming congested, and rapid increase of air traffic demandsadditional investments. The transportation problem is complicated by thefact that the central part of the country is one of the least populatedregions (4 inhabitants per km2 ), a vast economic no-man's land whichaccounts for 30 percent of the total land area of East Cameroon. Theeconomic return of north-south transportation projects is adversely af-fected by the long distances separating the two regions in the absenceof a sizable flow of goods originating in the central region.
35. In 1966 Cameroon had 14,700 km of roads of which 1,200 km wereasphalted and another 3,600 km were all-weather earth roads. About 9,800 kmwere secondary earth roads which permit only slow, high-cost and at timesdangerous vehicle traffic. An additional 17,000 km of tracks are practi-cally inaccessible for trucks and cars. The road network is primarilyconcentrated in the south-west (Douala-Yaounde region), the Bamileke regionand in the north. Large parts of the country have no road or rail connection.
36. The First Plan projected investments for roads and brid es totallingCFAF ll.8 billion ($47 million) for the five-year period. Foreign aid com-mitments during the same period and for the same purpose totalled CFAF 6.6billion. Although precise data on the First Plan are not available, it isvirtually certain that investments fell short of the Plan target, mainlyo%wing to deficiencies in project preparation and execution. In mid-1966projects involving CFAF 2.8 billion in foreign funds had not been completed.The Second Plan envisaged much larger investments in roads and bridgestotalling CFAF 16.5 billion, with CFAF 9.9 billion foreign financing andCFAF 1.0 billion to be contributed in labor. However, first year realizationsamounted to only about 56 percent of the Plants first year target, for thesame reason as during the First Plan. -
37. There are no reliable statistics on road traffic, but the numberof truck registrations suggests a growth rate of about 6 percent in recentyears of transportation of goods. Registration of passenger cars and buseswould indicate a growth rate of passenger traffic of between 13 and 17 percenta year. About 16,000 trucks are engaged in commercial transportation. Twoexpatriate companies dominate the business, but individual foreigners andCameroonians play a growing role in road transportation. Freight rates varyaccording to distance, state of the road, load factor (including possibilityof a return load). For distances in excess of 800 kms, they average aroundCFAF 10 per t/hm (US 40).
38. The railway net consists of a connection between Douala and Yaounde(345 km, the "central line") and a line from Dbuala to Nkongsamba (172 km).Passenger traffic-increased at a rate of about 6 percent in the last twoyears. Freight transportation has been more or less stationary, apparentlybecause the system in its present state cannot carry more traffic.
39. The central line which accounted for about 64 percent of passengertraffic in 1966/67 and for 82 percent of freight traffic is in a bad stateof repair. Some of the rail was laid before the First World lWar. Accidentsare frequent and there are long delays in the shipment of goods. In May ofthis year the railways started at $4.7 million rehabilitation program for thecentral line which would replace 146 km of rail laid between 1910 and 1926.

- 16 -
The financial position of the railway worsened in recent years, larogelybecause of increased financial charges and personnel and materials costs.The ratio of expenditures (excluding depreciation and taxes) to revenuesrose from 096:1 in 1964/65 to 0.8:1 in 1967/68.
40. The construction of the TransCameroon railway which is to linkYaounde with Ngaoundere (630 km) in the north is progressing well. Thefirst 100 km section was opened in July and early next year another 193 kmwill be completed. The financing of these first 293 km was secured fromFED ($17.3 nillion), USAID ($9.2 million) and FAC ($8.2 million).
41. At the end of 1967 Cameroon had two major commercial airports,Yaounde which can accommodate Caravelle jets and Douala which can accomodateail international jet planes. There is a large number of secondary airports.Table 20 in the appendix shows rapid increase in plane movements, passengerand freight traffic between 1963 and 1967. A new terminal building in Yaoundewas opened in 1968, and plans exist to construct a modern terminal at Douala,the old one being no longer adequate to handle traffic. Airport fees wereincreased in 1967 for the purpose of repaying borrowed funds for the Yaoundeterminal and establishing a special fund for the Douala terminus.
42. Cameroon has four sea ports handling about 1.5 million tons of freighteach year. Doueala, which accounts for 90 percent of merchandise traffic, haseleven bertlhs and is linlced to the railway system. Estimates of Doualals capacity,range up to 2.0 million tons a year. However, attainment of this would requireimportant changes, particularly as regards urarehouse and storage fees. Thereis little question that ,the eleven berths can accommodate vessels loadingand unloading 2 million tons, but the port has little space for lateralexpansion of storage facilities. The rates for storage should take this intoaccount and, after allowing for the necessary time for the removal of importedmerchandise and margins for the temporary storage of goods to be exported, asteep gradation of fees is needed to provide incentive for importers andexporters to occupy scarce space for a minimum of time. Currently, however,annual flat rates per square meter are charged which, in addition, are so lowthat the alternative of constructing storage space elsewhere in DDuala isunattractive to traders. For open storage, rates vary between US $0.40 and$2.23 per mn /year(9.6 square feet), and for magazine and hangar space betweenUS $3.04 and $7.29 per r2/year.
43. Dredging operations at Douala are not carried out regu.larly orefficiently. Draft alongside quay is 8 to 10 meters, but in the accesschannel it is between 4.7 and 5 meters; high tide adds up to 0.6 meters, sothat vessels up to about 5.2 meters draft can be accommodated safely.
Power
44. The major producer of electrical energy is Ehelcam (Energie Electriquedu Cameroun) which operates the Edea dam and power plant with an installedcapacity of 175,400 KVA. Enelcamn has only two clients, the aluminum plant(Alucam), also at Edea, which takes about 85-90 percent of MielcamIs production,and EDC (Electricité du Cameroun), the largest distributor of energy, whichabsorbs the rest. Enelcam is obliged to supply on demand a minimum (20,000 kwh)of electricity to EDC at all times. Thi.s limits Alucamts share, and thus

- 17
its output of aluminum during the dry season; but the completion of newinstallations by 1970 will aller full-scale operation the year round.Production by Enelcam has fluctuated bet.ween 0.98 and 1,07 billion ktvrhin the past five years. Fluctuations are due to variations in rainfail.Sales of pawer to EDC have risen from 50 to 76.5 million kwh between1962/63 and 1966/67. EDC operates a 609000 volt transmission line fromEdea to Douala, and a 909000 volt line from Edea to Yaounde will beinaugurated in July 1968. This line will cover Yaoundels needs for thenext 25 yearso Production in Wpest Cameroon made a big leap between 1962/63and 1964/65, but has declined slightly thereafter due to lack of rainfall,and stood at about 9.1 million kwh in 1965/66 and 1966/67. Consumption ofelectricity, Alucam apart9 has increased regularly by 13 percent in recentyears. The largest increases occurred in high tension power, which in Doualaincreased fronm 16.8 to 28.9 million kwh in three years, and in Yaounde from3.5 to 5'3 million kwh during the same period.

III. TE FINZCIAL SITUATION
45. The financial situation of Cameroon is characterized by closerelations with France and the Common Market. Ful currency convertibilityhas been guaranteed by an agreement with the French Treasury and monetarydevelopnents are supervised by a monetary conmittee with French represen-tation. Official aid from France is large and the flow of private capitalbetween the two countries is free from controls. In recent years aid andtrade with the Common 1<arket gained in importance. Cameroon has, on thewhole, enjoyed a stable financial position, although it has weakened tosome extent recently.
A. Public Pinance '
46. Government financial operations consist principally of the budgetsof the federal and two federated governments. The federal budget has thedominant position, accounting for over 60 percent of the budget expendituresand over 70 percent of revenues, The federated governments, whose main areaof responsibility are local administration, agriculture, road maintenanceand primary education, receive annual subventions from the federal budget.The Federal Government receives the proceeds of ah1 customs duties, whilethe states collect the bulk of direct taxes. Except for specific Frenchbudgetary support, which was terminated in 1965, the budgets do not includeforeign aid. This is normally channelled direct to the recipient concernedor through the Cameroon Developaent Bank.
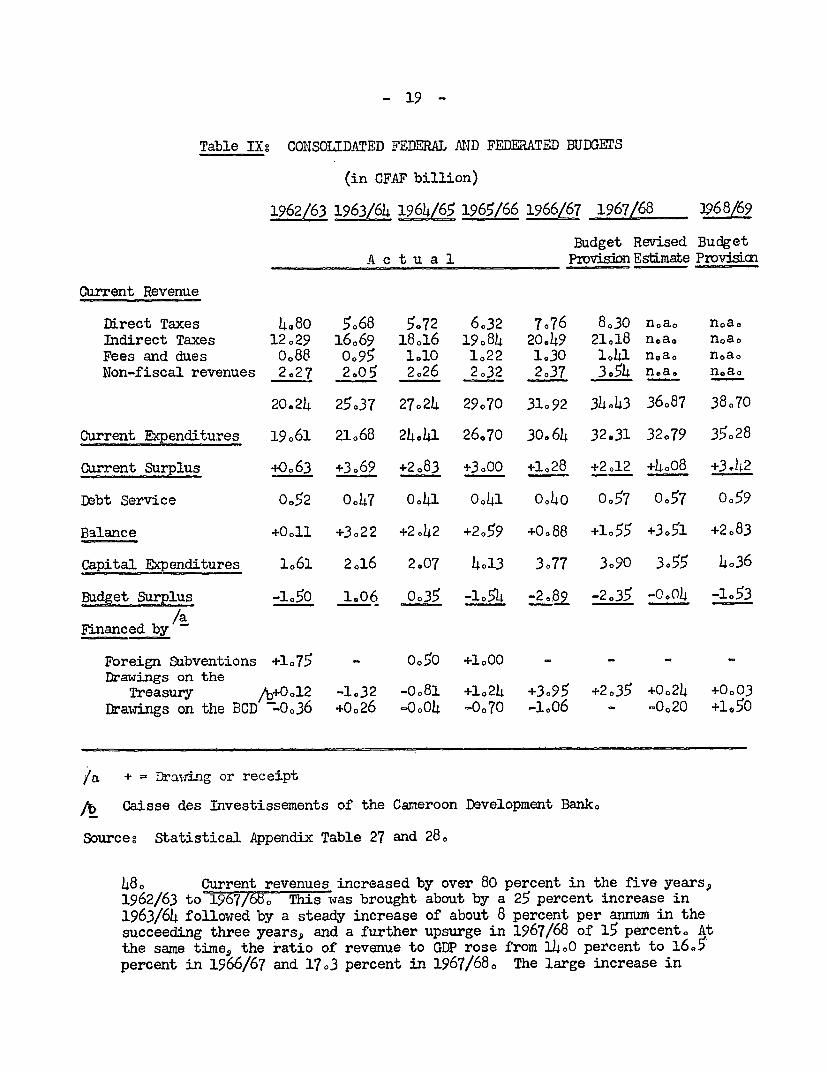
47. As indicated in the last Bank report, the early 1960ts saw amarked improvement in budgetary performance* In 1962/63, the current accountdeficit was eliminated and in 1963/64 and 1964/65 a current surplus emergedwhich was more than sufficient to cover capital expenditures. In 1965/66the current surplus remained substantial, although a sharp rise in capitaloutlays necessitated additional financingo In 1966/67, however, there wasa sharp retrogression with the current surplus falling off and, in spite ofa reduction in capital expenditures, causing a large overall deficit. Thisdeterioration appears to have been only temporary and was caused basicallyby an extraordinary increase in current expenditures. In 1967/68, based onresults for the first nine months, there has been an impressive recovery,and it appears thatthe current surplus wiI1 be the largest ever achieved.This has resulted from a large increase in revenue, especially from customsrevenue, and renewed restraint an the expenditure side. Furthermore, theoverall deficit has been practically eliminated. A consolidated statementof the budgetary operations of the three governments is given in the followingtable:
1] Cameroonts fiscal year runs from July 1 to June 30. For the Federaland East-Cameroon governments there is an additional 3 months"complementary" period during which expenditures if authorizedbefore the end of June may take place, and their accounts are closedat the end of September.
- 19 -
Table IX: CONSOLIDATED FEDERAL ANID FEDERTED BUDGETS
(in OFAF billion)
1962/63 1963/65 1964/65 196/66 196667 1967/68 1968/69
Budget Revised BudgetA c t u a 1 PovisiDn Estimate Pzvvi3ian
Current Revenue
Direct Taxes 4080 5.68 5,72 6.32 7.76 8.30 n.a. noa.Indirect Taxes 12.29 16.69 18.16 19.84 20.49 2118 n.a. n.aoFees and dues 0088 0o95 lelO 122 130 1041 n.a0 n.aoNon-fiscal revenues 2.27 2e05 2.26 2.32 2.37 3e54 n.a, n.ao
20.24 25-37 27024 29-70 31-92 34.43 36-87 38-70
Current EXpenditures 19.61 21.68 24.41 26.70 30.64 32.31 32-79 35.28
Current Surplus +0o63 +3.69 +2.83 +3.00 +1,28 +2012 +4 008 +3.42
Debt Service o052 0047 0041 0041 o0 4o 0o57 0°57 °o59
Balance +0011 +3.22 +2.42 +2059 +0.88 +1.55 +3.51 +2.83
Capital Expenditures 1061 2.16 2.07 4013 3077 3.90 3.55 4036
Budget Surplus -1l50 1.06 035 -1054 -2.8 -2.35 -0004 -153
Financed by
Foreign Subventions +175 - 0o05 +loOO - - -Drawings on the
Treasury /bh+ol 2 -1e32 -0o81 +1 024 +3.95 +2.35 +024 +003Drawings on the BCD -O.o36 +0.26 -0 004 -0-70 -1î06 - -0,20 +1,50
ja + - Drawi-ng or receipt
/b Caisse des Investissements of the Cameroon Development Bank,
Sourcee Statistical Appendix Table 27 and 28.
480 Current revenues increased by over 80 percent in the five yearsy1962/63 to 1967/6th This was brought about by a 25 percent increase in1963/64 followed by a steady increase of about 8 percent per annum in thesucceeding three years, and a further upsurge in 1967/68 of 15 percent. Atthe same timeS the ratio of revenue to GDP rose from 14i0 percent to 16.5percent in 1966/67 and 17.3 percent in 1967/68o The large increase in

_ 20 -
receipts in 1963/64 is explained by the introduction of a tax on businesstransactions in that year; thereafter, there have been no significantincreases in tax rates, except for the increase in duties on goods enteringWest Cameroon as a result of the harconization of customs duties in 1966,which may have brought in an additional CFAF 0.7 billion. The upward trendin revenues has been due primarily to the expansion of taxable activities.With indirect taxes accounting for about 65 percent of total revenues, andimport and export duties contributing about 75 and 15 percent respectivelyto these, the key element in 1964/65 and 1965/66 was the increase in foreigntrade. Foreign trade more or less stagnated in the following two years, butrevenues continued to rise, owing partly to deferred iimport duty payments,and partly to the continuing growth of the modern sector. The sharp increaseof revenues in 1967/68 appears to be due to the upsurge of imports in thesecond half of 1967. Direct taxes have increased, but their ratio to totalrevenue has remained roughly constant, The coming into force of the UDEACin 1966 may, if anything, have increased tax revenues. Certain tax lawshad to be adjusted, but the Governnent estimated in the 1966/67 budget thatCameroon would obtain CFAF 0.3 billion additional tax revenue from the UDEACarrangements. This was offset, however, by contributions to the UDEACsolidarity fund.
49. Cirrent exprenditures are fairly high because of the costly adminis-trative structure of two full-fledged state governments and a federal govern-ment. They would be higher still were it not for the annual payment of aboutCFAF 1 billion by France towards the salaries of expatriate school-teachersand civil servants. Without these payments, which would otherwise come withinthe purview of current budgetary expenditures, the overall budgetary situationwould be less favorable. On the whole, current expenditures have barely laggedbehind revenues, !with an average annual increase of 11 percent over the lastfive years. The largest increase took place in 1966/67, when expendituresrose by 15 percent as compared with the preceding year. Determined effortsby the governnent have reduced the increase to only 7.5 percent in 1967/68.An important element in this expansion has been the extension of governmentservices, particularly education and health. Another has been the rapidgrowth of government contributions and subsidies, particularly for educationand healthe augmented during the last two years by payments to the UDEACsolidarity fund (CFAF 0.3 billion and CFAF 0.5 billion respectively), andby measures to improve the distribution of food in West Cameroon followingthe rise in the cost of living resulting from tariff harmonization. Theoverriding factor, however, has been the rapid growth of personal emoluments.Governnent salary scales have in fact remained practically unchanged sinceindependence, but upgrading has caused a fast increase in wages and salaries.Between 1962/63 and 1967/68, while the number of Federal government employeesincreased by only about 4 percent, average salaries rose by almost 60 percent.In addition, civil servants receive extremely generous housing and familyallowances both of which have been on the increase. The governments are awareof the deleterious effect of these increases on public savings, and moregenerally on the rural-urban wage differential. Curtailment of civilservants emoluments is politically difficult, as in other African countries.Nevertheless, as a start the Federal Governinent is intending to pass legis-lation which would restrict the level of family allowances. Governnent alsointends to reduce sharply the number of civil servants annually promoted to

_ 21 -
a higher rank and to freeze the amount paid on rent allowances. The WestCameroon governnent has also recently reduced the number of its ministriesby three in an effort to economize.
50. Compared with many countries, governnent debt service payMentsi/have been small. This is because of the favorable terms on which aid hasbeen obtained in the past: in 1967/68, service payments were only about3 percent of total governinent debt outstanding (excluding guarantees).Consequently, current savings could be used largely for financing capitalexpenditures.
51. Capital expenditures / have risen impressively since the earlysixties; they have been almost twice as high in the years 1965/66 to1967/68 as in the preceding three years. The largest outlay, CFAF 4.13billion, occurred in 1965/66, after which expenditures declined somewhat.Over a third of the total in the most recent years has been spent onadministrative buildings and equipment, about a third on infrastructure,and the remainder about equally on agriculture and social services. Althoughin some cases necessary for governmentts efficient functioning, the outlayson administrative facilities have been excessive, and as pointed out in ChapterIV they threaten to jeopardize the success of the Second Plan. Capitalexpenditures on budgetary account constitute well under half of total publicinvestr,xents. Nevertheless, the over-concentration on slow yielding ormarginally productive schemes on budgetary account reflects the government1 sfailure to take the lead in following the priorities set out in the Plan.
1] It has not been possible to separate interest and amortization. Sincethe latter are the larger, total debt service payments have beenconsidered as falling outside current expenditure.
2] One idiosyncrasy of the budgetary system requires explanation at thispoint. Current expenditures, as shown in the final governnent accounts,refer to actual outlays. Capital expenditures, on the other hand, forthe Federation and East Cameroon, refer to authorizations only. At theend of each fiscal year, the unspent portion of authorizations istransferred to a special fund (Caisse des Investissements) held withthe Banque Camerounaise de Développement (BCD). Thereafter, disbursementsare made out of this fund as and when expenditure takes place. Sincetransfers to the fund have exceeded disbursements from it in most years,the governnent accounts give an inflated picture of capital expenditures.This confusing practice has been put to an end in the 1968/69 budget,and in future capital expenditures will be on the same footing ascurrent. However, disbursements will continue for at least two yearson the sizable funds built up in the BCD as a result of earlier transfers.The capital expenditure figures shown in Table IX and referred to areadjusted on the basis of information obtained from the BCD.

- 22 -
52. As indicated in the above table, capital expenditures anddebt service have been financed partly by current savings, partly by Frenchbudgetary support, and partly by drawings on the Treasury. In 1963/64 and1964/65 they were covered entirely by current savings; in 1965/66 they werefinanced in part by all three items. French budgetary support was terminatedin the same year, and in 1966/67 the sharp deterioration in savings resultedin drawings on the Treasury to the extent of almost CFAF 4 billion. melatter were accentuated by substantial transfers to the BCD for unspentcapital commitments (see previous footnote). In 1967/68, the recovery ofcurrent savings accompanied by lower investment outlays has practicallyeliminated the need for deficit financing, although again continued drawingson the Treasury have been necessary owing to additional net transfers to theBCD.
53. The drawings on the Treasury have been largely facilitated by thebuild-up of reserves in previous years. To the extent that the Treasury actsas banker to certain public bodies such as the Stabilization Funds, these alsohave contributed to financing the deficit. The Treasuryts liquidity positionhas deteriorated considerably in the past two years, falling from a high ofCFAF 11 billion in September 1965 to about CFAF 7 billion at the end of 1967.Since the beginning of 1968 assets have been rising fast again, partly onaccount of seasonal influences and partly because of the more favorablebudgetary situation. The government is determined to maintain the improvement.The 1968/69 budgets reflect this, with provision for only 7 percent increasein current expenditure and current savings of CFAF 3.4 billion. For the firsttime in several years there is scarcely any provision for drawing on Treasuryreserves, current savings being expected to cover the whole of capital outlaysinscribed in the budgets. The Federal Government, however, has prepared asupplementary investment budget ("compte hors budget"t) amounting to CFAF 0.6billion. This will be financed by funds transferred to the BCD in earlieryears and earmarked for specific projects but which the government hasrecently discovered are no longer required for them./ This, together withdisbursements on earlier capital authorizations also to be financed out ofBCD funds, will probably lead to a total capital outlay of CFAF 4.h billion.This will be higher than for any previous year.
54. As regards the composition of investment, the Federal Governnenthas implicitly recognized the deficiencies of earlier years by assigningthe preparation of both the federal and federated investment budgets forthe first time to the Ministry of Planning. The result is a closeradherence to Plan provisions, with priority given to joint financedprojects, and smaller provisions in general for administrativc facilities.
55. A number of factors have in the past limited the usefulness ofthe budget as a tool of economic policy. In the first place, the authoritieshave been preoccupied with the overall deficit defined as the excess of total
1] This liquidity windfall is the result partly of double payments andpartly of the completion of projects without using all the funds ear-marked thereto.

- 23 -
expenditure over receipts, but including in the latter drawings on theTreasury provided for in the budget, and as a corollary with the liquidityposition of the Treasury. The Treasury, as banker to the governnent andto the public bodies such as the agricultural price stabilization funds,and to the Postal Savings systemn, has a central role in the credit system,and it is therefore logical that the authorities should be concerned withits overall monetary impact. However, the subordination of budgetary policyto consideration of the liquidity position of the Treasury obscures theeconomic implications of the budget per se. There is little appreciationof the significance of the concept of current savings or of the overalldeficit as more commonly defined. This is reflected in the presentationof the budget and final accounts, which does not allow either to be shownclearly, although in the 1967/1968 and 1968/1969 budgets greater clarityhas been achieved.j/ A simple rearrangement showing the current surplusclearly and all drawings on the Treasury below the line would be an aid tounderstanding the econonic implications of budgetary operations. Secondldy,it has been difficult for the authorities to judge in advance the level ofgovernment expenditures owing to the carry-over of provisions, once authorized,from one year to the next. The amounts involved for current expenditures havebeen small, but for capital expenditures unspent authorizations reached overone-third of provisions in 1966/1967.?/ Besides obscuring the actual ex-penditure flow in any given period, this makes budgetary planning and fiscalmanagemn3nt difficult. In the 1968/1969 budget, a new system of appropriationfor the capital budget has been introduced which should make for a considerableimprovement. Finallyt information on budgetary results has often been in-complete and has been slow in appearing, and has therefore provided an unsatis-factory basis for the formulation of budgetary policy. The governnent sfinancial transactions are being computerized, and although initially thishas caused some confusion, it will undoubtedly provide a swifter and moreaccurate account of government operations. Already it has brought to lighta number of anomalies in the system.
56. Neither the information available on local governments nor thesize of the Ports and Waterways budget warrant detailed anaJ.ysis of theiroperations. Total expenditures af the local governments, including a smallamount on capital account, have been about CFAF 4 billion in recent years;these appear to have been covered mostly out of revenues.. The Ports andWaterways Authority, which is considered as part of the budgetary systemproper, since its budget is prepared and executed in the same manner as thefederal budget, has had current expenditures of between CFAF 500 million andCFAF 700 million per annum over the past five years, and capital expendituresaveraging CFAF 400 million, Cperating revenues on average more than coveredcapital expenditure between 1962/1963 and 196511966, but in the last two yearsthey have been insufficient, leaving about half of capital expenditures to befinanced out of reserve funds.
1 Previously, the current budget included under the head "Common and Miscel-laneous EXpenditures" a contribution to the capital budget, which wasequivalent to budgeted current savings. This same amount was then trans-ferred to the capital budget irrespective of whether current savings wereactually more or less. In 1967/68, these transfers between the currentand capital budgets were eliminated.As explained on page 21, disbursements on these unspent authorizationshave been made out of a special fund in the BCD.
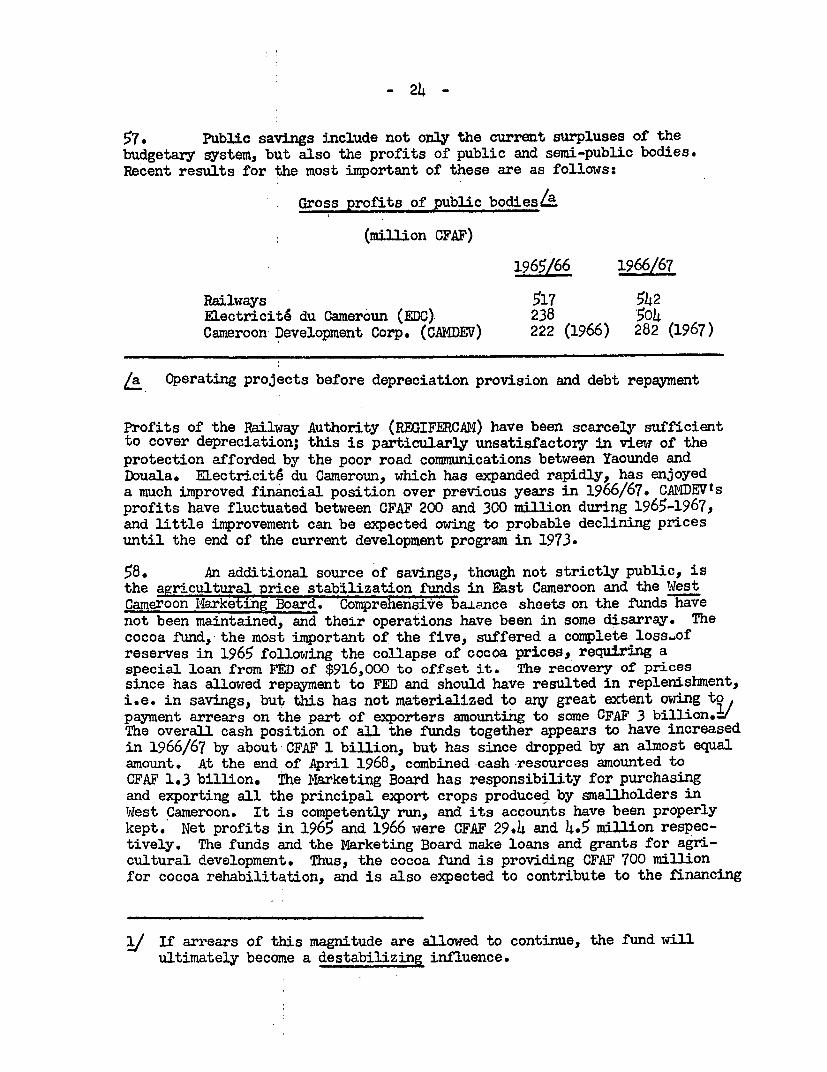
- 24 -
57. Public savings include not only the current surpluses of thebudgetary system, but also the profits of public and semi-public bodies.Recent results for the most important of these are as follows:
Gross profits of public bodies E
(million CFAF)
l96S/66 1966/67
Railways 517 542Electricité du Cameroun (EDC) 238 '504Cameroon Development Corp. (CAMDEV) 222 (1966) 282 (1967)
/ Operating projects before depreciation provision and debt repayment
Profits of the Railway Authority (REGIFERCAM) have been scarcely sufficientto cover depreciation; this is particularly unsatisfactory in view of theprotection afforded by the poor road communications between Yaounde andDouala. Electricité du Cameroun, which has expanded rapidly, has enjoyeda much improved financial position over previous years in 1966/67. CAMDEV'sprofits have fluctuated between CFAF 200 and 300 million during 1965-1967,and little improvement can be expected owing to probable declining pricesuntil the end of the current development program in 1973.
58. An additional source of savings, though not strictly public, isthe agricultural price stabilization funds in East Cameroon and the WestCameroon I4arketïng Board. Comprehensi-ve aience sheets on the funds havenot been maintained, and their operations have been in some disarray. Thecocoa fund, the most important of the five, suffered a complete loss-ofreserves in 1965 following the collapse of cocoa prices, requiring aspecial loan from FED of $916,000 to offset it. The recovery of pricessince has allowed repayment to FED and should have resulted in replenishment,i.e. in savings, but this has not materialized to any great extent owing topayment arrears on the part of exporters amounting to some OFAF 3 billion,i/The overali cash position of all the funds together appears to have increasedin 1966/67 by about CFAF 1 billion, but has since dropped by an almost equalamount. At the end of April 1968, combined cash resources amounted toCFAF 1.3 billion. The Marketing Board has responsibility for purchasingand exporting all the principal export crops produced by smallholders inWest Cameroon. It is competently run, and its accounts have been properlykept. Net profits in 1965 and 1966 were CFAF 29.4 and 4.5 million respec-tively. The funds and the Marketing Board make loans and grants for agri-cultural development. Thus, the cocoa fund is providing CFAF 700 millionfor cocoa rehabilitation, and is also expected to contribute to the financing
1] If arrears of this magnitude are allorwed to continue, the fund willultimately become a destabilizing influence.

- 25 -
of the East Cameroon oil palm project (SOPAME). The Marketing Boardhas recently financed coffee improvement and banana conversion schemes,and it has also made a OFAF 50 million loan to the West Cameroon govern-ment for general development. The funds do not lend to the government,but to the extent that they keep their reserves with the Treasury, defacto they may help finance government operations.
B. Money, Credit, 'Prices, Wages
59. Mloney supply amounts to the equivalent of 13 percent of GDP, andtime and sav s deposits (quasi-money) to only about 1 percent of GDP.Financial institutions, mostly subsidiaries of French banks, concentratechiefly on the needs of the import-export trade and of the industrialsector. According1y, fluctuations in credit to the private sector followclosely the ups and downs of foreign trade. In 1965, when cocoa priceswere low, credit to the private sector barely increased, foreign assetsdropped and the money supply remained almost constant. Subsequently, therehas been substantial expansion in private sector credit, probably relatedto increased industrial investment in Douala and Yaounde. Owing to theopenness of the Cameroon economy,excess demand easily leaks abroad in theform of increased imports; thus,in 1967 imports reacted to the continuingincrease in credit, limiting the increase in the money supply to a fairlymodest amount. but leading to a substantial loss of foreign assets. Atthe end of the year, foreign assets had declined to CFAF 2.7 billion. Thefirst three months of 1968 have seen a further credit expansion, but foreignassets have recovered to over CFAF 5 billion. Developments in the mainmonetary variables are shown in the following table:
Table X: MONETARY DEVELOPMENTS
(In CFAF billion)
1961 1964 1965 1966 1967at December 31
Money supply 14.4 21.0 21.2 25.9 27.1% increase 46% 1% 22% 5%
Credit to private sector&a 15.6 26.8 27.3 29.7 34.2
Credit to government -3.5 -9.4 -7.6 -6.1 -5.6
Foreign Assets 3.4 7.0 5.1 6.3 2.7
Quasi-money 0.5 2.0 2.3 2.4 2.9
L Includes credits of the Cameroon Development Bank.
Source: Statistical Appendix, Table 29.

- 26 -
In an effort to prevent a repetition of the decline in foreign assetsexperienced in 1967, the lfionetary Committ-ee of the BCEAEC for Cameroonrecently introduced more stringent rediscount ceilings. In addition,commercial banks will observe higher liquidity ratios.
60. Although its largest operation concerns the short-term financingof agricultural marketing (accounting for 65 percent of new credits madein 1964-1967), the principal source of medium- and long-term credit is theCameroon Development Bank (BCD). This is a 75 percent government-ownedinstitution. It is an important channel for loans from the Caisse Centrale,and it also has a CFAF 600 million line of credit from Kreditanstalt. TheBCD has had liquidity difficulties owing to bad debta which have necessi-tated special assistance from the government. Recently, however, it hasundergone reorganization and operations now appear to be on a sounder basis.The largest recipient of medium- and long-term loans from the BCD has beenreal estate, but since 1964 there has been a shift away in favor of industry.Loans for agricultural development have fallen off from CFAF 646 million in1962/63 to only CFAF 110 million in 1966/67. In view of the special problensof agricultural credit, the establishment of a separate Agricultural Bank isbeing considered.
61. The National Investment Corporation (SNI), a public corporation,was established in 1964 with the objective of promoting local industry byway of eauity participation. Resources consist of CFAF 250 million sub-scribed by the goverrment and the proceeds of CFAF 2 billion equipment bondissue, introduced in 1963 and sold to commercial banks. As of December 31,1967, SNI had subscribed to equity totalling CFAF 989 million, spread among21 companies. These included a wide range of activities (e.g. textiles,sugar, cement, tobacco, plywood, cocoa-processing, aluminum-processing,hotels). All but five are minority participations. The largest partici-pation, amounting to CFAF 212 million, was made recently in the Sociétédes Grands Hotels, which is constructing a luxury hotel near Yaounde. Thisparticipation accounts for 70 percent of the companyts capital. Thisexposure seems excessive since it represents 22 percent of participationsso far, and its majority status could imply that alternative sources ofcapital were not interested.
62. Official information on price movemients is confined to consumerprice indices, and until recently es-e have only related to non-Camieroonianfamilies. On the basis of these and of import data, it appears that priceshave increased by somewhat over 3 percent p.a. since 1963. Prices of importedgoods have increased faster than prices in general, indicating that the mainsource of the upward price movement has been on the import side. Largedifferentials exist on food prices as between rural and urban areas, andbetween different regions in the country. This is due to the high cost oftransportation, the absence of regular marketing circuits, and the small-scale nature of middlements operations. A recent study has shown thatmiddlemenls profits are high, resulting from the oligopolistic positionthey have in many areas.
1] SEDES, Circuits Commerciaux des Produits et Biens Essentiels. 1965.
- 27 -
63. The number of employed persons amounts to only about 200,000,around one-tenth of the entire work force. Dployment is concentrated inthe cities and in estate-type operations, and the effect of wage changesis therefore mostly felt in these areas. Wages in both the agriculturaland non-agricultural private sectors are governed by minimum wage legis-lation. In East Cameroon separate scales have existed for non-agriculturaland agricultural workers, with different rates for four separate zones.Minimum rates have not changed since 1963. In the highest zone they standat CFAF 36 per hour for non-agricultural workers, and at CFAF 26.5 per hourfor agricultural workers, and in the lowest zone at CFAF 20 and CFAF 15respectively, In the industrial sector, actual wage rates have generallyexceeded the minimum rates by a wide margin, but according to a recentsurvey (see Statistical Appendix, Table 24), they remained relativelystable between 1964 and 1966. In the agricultural sector, wage rates usedto follow the minima closely, but in the last few years employers have foundit impossible to maintain an adequate labor force at these rates, and con-sequently agricultural wages have increased quite rapidly. Between 1964and 1966, they rose by about 30 percent. Nevertheless, industrial wagelevels remain more than double wage levels in agriculture, and adding thepublic and private tertiary sectors, the urban-rural differential is greaterstill. This has been a stimulus to migration to the towns.
64. The Federal Government intends shortly to standardize the minimumwage rates for industry and agriculture (and also to reduce the number ofwage zones to three), in order to reduce the urban-rural differential, audthereby to help stem the drift to the towns. Agriculture will continue tobe the key sector, especially for exports, for many years to come. It istherefore imperative that the profitability of agricultural enterprisesshould not be jeopardized and that the government should encourage produc-tivity improvements in conjunction with any wage increases.
65. In West Cameroon minimum wage rates have been recently introduced.These are the same for both agricultural and non-agricultural sectors,ranging from CFAF 20 to CFAF 25 per hour for the three zones specified.Wages, raised by about 10 percent in 1966, conform fairly closely to theseminimum rates. CAMDEV, the largest employer in the region, pays a basicwage of about CFA? 20 per hour. In contrast to the East, employers in theagricultural sector do not have any difficulty in obtaining labor at suchcomparatively low rates.
C. Balance of Payments and Foreign Aid
66. There are no official balance of paynents estimates, except fora balance of payments of Cameroon -rith countries outside the franc zone.In view of the importance of relations with the franc zone, this partialbalance of payments provides little help in clarifying the overall situation.The mission has attempted to update the balance of payments estimates in theprevious economic report.!/ The results of these estimates are shown in
/ The most important elements of these estimates are official information ontrade, foreign aid, and foreign reserves. Estimates of current invisiblesincluding investment income and private transfers, were made on the basis ofpartial information and probable relationships with other economic magni-tudes. The remaining element of net private capital flows was then esti-mated as a residual, which obviously also includes the errors and omissionsmade in estimating all the other elements.

_ 28 -
Statistical Appendix Table 38. The most important recent developments appearto be the deterioration of the trade balance in the last three years, particu-larly in 1967, and the loss of foreign assets which has occurred in spite ofcontinuous large foreign aid and probably also quite large private foreigninvestments. The total loss in net foreign reserves during 1965-67 amountedto CFAF 4.3 billion ($17.2 million), which brought them down to CFAF 2.7billion at the end of 1967. Gross reserves stood at CFAF 6.7 billion($26.8 million),the equivalent of 2 months of imports. Thanks to favorableexport results, the assets position has been improving in early 1968, probablymore than can be accounted for by seasonal influences alone.
67. Foreign aid has continued at a relatively high level, aroundCFAF 8 billion a year ($32 million). This is about $6 per capita, lessthan the average per capita aid received in other francophone Ar icancountries ($lo.5) but the same as enjoyed by Africa as a whole.± Theorigin of aid has gradually changed; the proportion directly contributedby France dropped from two-thirds in the early 1960ls to around 45 percentof the total in recent years, while aid from the Common Market increased.French aid is divided almost equally between project aid and technicalassistance. Much of the technical assistance is also project-oriented.Budget support from France was phased out in 1965. The terms of Frenchaid are on the whole very favorable. Aid by the Fonds dtAide et de Co-opération (FAC) which accounts for the major part of disbursements inrecent years, is almost entirely on a grant basis. Loans by the CaisseCentrale de Coopération Economique (oCCE) should play a larger role infuture disbursements in view of commitments undertaken in recent years.These loans carry varying terms depending on the nature of the projects;interest rates generally vary between 3.5 - 5 percent a year, and repaymentperiods between 5 and 20 years. Bilateral aid has also been provided byseveral other countries in the following order of importance: U.S.A.,Germany, Italy, U.S.S.R., and the United Kingdom.
68. Aid from the European Economic Community (EEC) is provided bythe Fonds Européen de D6veloppement (FED). Under the first agreementwith the associated countries (First FED), Cameroon obtained commitmentsof $45 million for a number of development projects. More than half ofthe amount was devoted to transportation projects, of which the constructionof the Trans-Cameroon railway was by far the largest. The second FED,which expires in June 1969, has provided total support of $29 million. Thisamount consists mainly of project aid, but also includes the financing ofa number of programs to increase productivity in the agricultural sector.The second FEDLagreement was in part directed to the goal of assisting theassociated countries to become able to compete without the help of prefer-ential treatment and subsidies for their exports. Price support in thetransitional period, assistance to improve the agricultural productionstructure and to promote diversification of production, also outsideagriculture, account for one quarter of total FED support for Cameroonunder the second agreement. Bank and IDA commitments have so farconsisted as follows: $7 million loan and $1l million credit towardsCAMDEVIs development program (1967),and $0.55 million credit for highwayengineering studies (1968).
1/ .Source: -The flow of finanial resources to less developed countries,1961-65, OECD (Paris, 1967).

IV. PROSPECTS FOR PRODUCTION AND CAPITAL FOWIATION
A. Introduction
69. The basic facts of Cameroonts natural endoiment and attainedlevel of development provide a broad marking of the road to be followedtowards economic development. In the first place, there is the countrytsdependence on agriculture. The Cameroon economr is no longer a purelyagricultural one. Manufacturing, commerce and other service industrieshave grown rapidly as a proportion of total production. But the over-whelming majority of the population still depends for its livelihood onagriculture and for a long time to come absorption of workers by othersectors will be relatively small. Naturally therefore,promotion of agri-cultural production should have a central place in the development effort.Since persons active in this sector generally have neither the funds norknow-how to lift productivity rapidly to a higher level, government guidanceand assistance together with foreign aid and technical assistance are essen-tial to progress in this sector.
70. Promotion of agricultural development should be accompanied byimprovements in infrastructure. Particularly the transportation networkappears of poor quality and small in relation to the size of the countryand its population. Many parts of Cameroon have only very poor road con-nections. Difficult and costly access to markets is discouraging livestockproduction, forest exploitation and the commercialization and specializationof many crops naw grown for subsistence. It is also adding very considerablyto the cost of export production. Improvement of transportation appears anecessary condition for agricultural development and would at the same timehelp expand the market for industrial products.
71. Another important element in Cameroonts developiment strategy isthe improvement of education. This is of importance for a ready disseminationof more productive cultivation methods in agriculture, but also to producethe administrative and technical skills needed for commerce and industry.The emphasis should be on improvement of general education and expansionof specific branches of the system.
72. The fast increase of recent years in industrial production shouldcontinue, chiefly on the basis of further import substitution of consumerand intermediate goods and of processing of export products. The liberalattitude of governnent towards private initiative in manufacturing and incommerce and banking has been a major factor in the establishment of afavorable investment climat4 and continuation of this attitude should helpto maintain investor interest in Cameroon. But although industry hasbeen growing very fast, industrialization will have for many years to comeonly a limited role in the countryts economic development. The market forindustrial products is bound to remain fairly small and the contribution ofmanufacturing to GDP modest.

- 30 -
73. The conclusion is that agriculture, transportation and educationdeserve the main emphasis in the development effort. But in view of thestage of agricultural development,acceleration of GDP growth to a very highrate seems unlikely for the next few years. Past experience shows however,that a growth rate in excess of the present population growth rate should befeasible. Dependence on foreign funds as well as expertise would remain amajor factor. This brief outline of development possibilities and strategyforms the background to the discussion in the following sections of thegovernment s development plans and policies.
B. Development Plans
74. Cameroon launched its first Five-Year Development Plan in July1960. The Flan was modified in 1962 to include West Cameroon followfingunification. Preparation on the Second Plan began in 196 41 , but, in viewof relatively slow progress of First Plan investments,-it was not initiateduntil July 1966. Thus, the year 1965/66 was not covered in either of thedocuments, although in fact there was a substantial carry-over of expenditurefrom the First Plan provisions.
75. First Five-Year Development Plan. (1960/61-1964/65). Althoughinformation is stMil fragmentary, it is now possible to assess in generalterms the achievements of the First Plan. The Plan called for public ex-penditures of OFAF 53 billion and private investment of about CFAF 40 billionover the five-year period. IShile the sources of financing were not spelledout in detail, it was assumed that 60 to 70 percent' of the total .wouldbe financed from abroad. In reality, public investment over the five yearsonly amounted to some CFAF 26 billion, or half of the total envisaged. Ofthis, CFAF 13 billion was financed from domestic and CFAF 13 billion fromexternal sources. Private investment, on the'other hand, estimated at CFAF49 billion, exceeded expectations largely on account of an upsurge of activityin 1963/1964 and 1964/1965.
76. As pointed'out in the last Bank report, the large shortfall inpublic investment can be attributed principally to inadequate staffing inthe public sector, leading to poor project preparation and delays inimplementing projects once started. Lack of finance was not, on thewhole, a constraint. Except in 1961/1962, government budgetary operationscould have sustained larger investment outlays without resort to reserves,and particularly so in 196341964 and 1964/1965 with the emergence of sub-stantial government savings. As regards foreign aid, commitments farexceeded disbursements; for example, although by 1962/1963, CFAF 21 billionin foreign credits had been opened, only CFAF 13 billion had been disbursedin total by the end of the Plan period.
77. The pattern of public investment diverged substantially from thePlan. The concentration of public investment on social services was greaterthan envisaged. Farthermore, at least 25 percent (and probably more) ofpublic investment out of local resources was channelled into administrativefacilities, a category which was not included in the Plan itself. Investmentin infrastructure was approidmately CFAF 13 billion, as against CFAF 25.5billion planned. In relative terms this was about as envisaged. Investmentin production, notably agriculture, must therefore have been less thanplanned not only i-n absolute but in relative terms also.

- 31 -
78. The objective of the Plan was to raise GEP by 5.6 percent perannum. Judged against this target alone,the Plan might be regarded ashaving been reasonably successful. However, the main reasons for thegrowth rate achieved were the sizable private investment and the buoyancyof traditional exports. Public sector investments, wfhich were the Plandocumentts sole preoccupation, were disappointingly emall, and as a largeportion of them went into slow-yielding projects, they did not significantlycontribute to the growth of production.
79. Second Five-Year Development Plan. (1966/67-1970/71). Preparationof the Second Plan was much more thorough and broadly based than for theFirst Plan. Starting in 1964, a number of national planning commissionsbegan studying the problems and prospects of the various sectors of theeconomy. Regional commissions were also set up to examine the needs of theparticular regions. On the basis of these studies, a draft Plan was preparedand finally submitted to the Federal Assembly. The Plan was approved inAugust 1966.
80. In contrast to the first Plan, which was essentially a listing ofpublic sector projects, the Second Plan provides a comprehensive picture ofprospective developments in each sector, and for the economy as a whole. Anattempt was made to relate investments to specific output objectives withina global framework. Bearing in mind the deficiencies in First Plan execution,more attention was given to preparing studies which would allow quicker projectimplementation. In the private sector, investment targets were included foreach sector and sub-sector partly on the basis of investigations of thebusiness communities' intended outlays, and partly on the basis of residualinvestment requirements for the achievement of output objectives. Apartfrom filling the gaps in the overaIl picture, the inclusion of private in-vestment in a fairly detailed manner was clearly intended to make it anindicative plan for the private sector also. A further refinement ascompared with the first Plan was the incorporation of a simple manpowerplan and the formulation of education expenditures based on it.
81. The basic target of the Plan was to increase GDP at 5.75 percentper annum, within the broad objective of doubling GDP between 1960 and 1980.A secondary goal was the reduction in regional disparities within the country.In order to achieve the growth rate postulated, it was assumed that an in-vestment ratio averaging 16 percent of GDP would be necessary, as comparedwith 10 to 11 percent during the first Plan period. On this assumption, atotal investment outlay of CFAF 165.2 billion was envisaged, as comparedwith CFAF 93 billion planned and CFAF 74 billion achieved during the PirstPlan. The total was split almost equally between the public and privatesectors.
82. Statistical Appendix Table 26 provides a breakdown of plannedinvestments. In the public sector, infrastructure, as in the First Plan,accounts for almost 50 percent of outlays. Agriculture, nevertheless, hasa central position-in the Plan, for although public outlays in this sectorrepresent only 18 percent of the total, investments in infrastructure,education and health will indirectly stimulate agricultural activity.

- 32 -
In the private sector, production and especially industry is expected toreceive the principal portion of investment. Industrial investment isaimed at import substitution mainly, but also, to a smaller extent, atprocessing for export, e.g. aluminump cocoa butter, palm oil, rubber,plywood.
83. The overali conception of the Plan is well based and the relativeemphasis on the various sectors is unexceptionable. However, the Plan isoverly optimistic on two accounts. Fîrst, it assumes an average annualrate of public investment of CFA? 17 billion compared with a total of CFAF8.4 billion in 1964/65 and an annual average for the first Plan period ofabout CFAF 5 billion. Improvements have taken place in the planning machinerysince the launching of the first Plan, and as noted above, preparation of thesecond Plan has been more thorough. Nevertheless, in view of the continuedshortage of project personnel, such a large increment was likely to be overlyambitious with, unfortunately, inportant shortfalls probable in agriculture.Secondly, as regards the Plants financing, government savings are likely tobe less than projected, and the eufficiency of external assistance is some-what uncertain. This aspect of the Plan will be discussed in the finalchapter.
84. Information on the progress of the second Plan, as with the first,is extremely deficient. The Direction of the Plan has responsibility forreviewing the Plants execution, but as of now it has done little in thisrespect. It is possible, however, on the basis of budgetary data and otherinformation obtained to evaluate general Plan performance so far. In1966/1967, public investments amounted to about CFAF 10.5 billion comparedwith CFAF 154. billion planned. In 1967/1968, approximately the same outlayis likely to have taken place, against CFA? 20 billion planned. On the otherhand, while precise information is lacking, indications are that privateinvestment has exceeded the Plan target of CFAF 26 billion for the twfo yearsby a substantial amount. Public investment has been hampered by staff short-ages at the project level, by staff inadequacies within the Ministry ofPlanning (which has responsibility for overall plan execution), and by dif-ficulties in satisfying foreign donors for particular projects. However,in view of the reservations expressed in the preceding paragraph, and takinginto account the high levels of private investment, the level of totalinvestment has not been unsatisfactory.
85. On the other hand, the actual comosition of total public investmentmay be seriously questioned. In 1966/1967, outiay on administrative facilitiesactuaIly exceeded the planned amount, while total outlays were one-thirdlnoerthan forecast; and expenditure on social services represented 36 percent ofthe total as against 26 percent planned. The main burden of the shortfalltherefore fell on infrastructure and production. Taking government budget-ary operations alone, whereas outlay on administrative facilities duringthe two years wJas planned at 20 percent of total, capital commitments onthis item accounted for 44 percent of total coxmitments for government Planexpenditure. In addition, there are indications that a considerable portionof government outlay has been on projects outside the Plan altogether.

- 33 -
86. Without a shift-back to the priorities set out in the Plan, thereis a danger once again that too much investment will be channelled intoslow-yielding or unproductive i.nvestments, and the extensive work on thePlan itself will have been squandered. The Government appears to be awareof deficiencies in this respect, since the 1968/1969 capital budgets forboth the federal and state governments have been prepared for the firsttime by the Ministry of Planning with instructions to include only projectsprovided for in the Plan. However, for the Plan to have the operationalsingificance which it was intended to have, the Government will have topay dloser attention to it, and also improve its reviews of Plan progressand in the light of these reviews make necessary revisions in the Plan itself.
C. Sectoral Policies
Agriculture
87. Agriculture occupies a central position in the Second Plan.Investments directly benefitting agricultural production are 19.4 percentof the estimated total, with public investment accounting for CFAF 14.9billion and private investment for CFAF 17.5 billion. Agriculture willalso benefit indirectly from investments in infrastructure, education andhealth. Part of public investment is for additions to gove'nment-owinedproductive capacity, but weUl over half is intended to stimulate productionin the private sector. With production predominantly in private hands,progress in agriculture depends mainly on the activity of the private sectorand on its response to governnent schemes intended to benefit it. The Plantsobjectives for the agricultural sector are self-sufficiency in food cropsand most agricultural raw materials, and maximizing of export earnings.Achievement of these objectives is hampered by a number of structuralproblens, in particular transportation, marketing, land tenure, agriculturalextension and credit.
88. Farmers normally receive cash only for export crops, and noregular marketing circuits exist for subsistence crops. Urbanization anddepopulation of regions'closest to the two principal cities are making itmore difficult to assure sufficient food supplies to the towns. The need forinstitutional reforms such as the establishment of market places and areview of the middlemants role is recognized in the Plan. Part of thePlanls provisions' for developing transportation infrastructure is intendedto facilitate the establishment of regular marketing circuits. A verylarge number of peasants presently produce anywhere from 5 to 20 crops,usually none of them intensively. A better transportation infrastructurewould allow more regular inter-regional exchange and might thus encouragespecialization of production.
89. Agricultural development schemes in East Cameroon, private andpublic, have encountered obstacles in the form of the land tenure system.Land in Cameroon is generally owned by the tribes; the personal land titleis almost unknown. This applies to cultivated and fallow land and evento inaccessible tropical forest. Superimposed on tribal ownership is thecustomary law which gives temporary oamership to the smallgrower whohas been cultivating the land for many years. This quasi-dual ownership

- 34 -
makes questions of compensation for expropriation in the interest of adevelopment scheme difficult issues. Expropriation laws, dating back to1932, did not establish clear lines of procedure and authority and thereforeproved ineffectual. In 1966, however, government passed a law establishingclear expropriation and compensation procedures for projects i-n the publicinterest. A first implementing decree expropriates land for the EastCameroon oil palm project, for which Bank financing is being sought. Landtenure in WIest Cameroon does not pose problems of the same magnitude. A"Land and Native Rights Ordinance" defines the conditions under which nativeland can be utilized for the cocmon benefit against payment of a rental fee.
90. Agricultural development in Cameroon will depend critically onthe effectiveness of extension services. The Plan envisages considerableincreases in the numbers of trained workers available for rural assistanceand instruction, but says little about coordination of extension activities.Although the quality of extension personnel reportedly is good, their workneeds to be coordinated to avoid contradictory instruction at the villagelevel. In general, a concentration rather than a wider spread of extensionactivities is needed. Regional specialization of crops should in the longrun facilitate rural extension work.
91. The Plan expresses the desirability of establishing a NationalAgricultural Credit Bank. However, it would seem that the provision ofcredit tailored to specific projects is preferable to the establishmentof a conventional agricultural bank. A good example of such specificproject financing is that provided in the context of the cocoa rehabili-tation program. Under the program now in progress, the peasant buys sprayerand spraying material on credit, repays both (minus a subsidy) after thefirst harvest, and then continues to buy material only in the followingyears. Early repayment of the initial equipment loan is encouraged bygranting a subsidy on next yearts purchase of spraying material. In thefirst year of the present 250,0 hectare program extending over five years,the rate of repayment is in excess of 96 percent while the campaign is notyet finished, an achievement unheard of under traditional forms of banklending for agriculture, This programn, which entails etrong cooperationat the village level, could probably be adapted to other crops whereregeneration or conversion programs would yield equally prompt materialresults.
92. The Plan proposes no specific programs for subsistence cultivation;it merely predicts certain growth rates. Available statistical informationindicates favorable growth trends for most subsistence crops, and the projectedoutput level for such staples as maize, manioc, millet and plantains appearsto be conservative (see Statistical Appendix Table 11). The sugar project,which was started last year, is progressing well, and the targeted growthrate, leading to self-sufficiency by the early 1970's, should.be achieved.Rice production is somewhat behind Plan projections and will require aspecial effort if substitution of all importe is to be realized by 1971.
93. The prospects for export crops are somewhat mixed. Generally,the Plan appears slightly optimistic with regard to prices, and conserva-tive with regard to production. Mission estimates are for annual productiongrowth at 4.3 percent. But price projections in the Plan seem to imply

that the export price index will be more or less maintained at the 1963/64level. This is perhaps too optimistic, and most likely the growth rate atconstant prices is going to exceed that calculated at current prices. Thefollowing table shows Plan and mission estimates of the increase in produc-tion of the most important export crops.
Table XI: EXPORT CROPS IN THE SECOND PLAN
(In thousand tons)
1966/67 1970/lPlan Mission
Cocoa 93 130 130Coffee Robusta 45 64 64Coffee Arabica 19 20 25Groundnuts 85 120 110Bananas 100 191 125Cotton 56 75 75Palm oil 44 41 44Palm kernels 25 20 27Rubber 13 17 14Tobacco 3.8 2.7 3.5Tea 0.7 1.0 1.0Kola nuts 6.1 3.5 8.0
Total annual growth 4.3% 4.9%(value at constant prices)
94. Plan projections for cocoa production appear realistic, giventhe initial success of the current rehabilitation program. The two earlierprograms provided the extension service with the necessary skills and raisedpeasant interest in the obviously lucrative scheme, so that the presentprogram, covering over 70 percent`of Cameroonts cocoa producing area, hasnot encountered anyunforeseen obstacles. The projected increase in Robustacoffee production is quite large, but in view of rapid increases in recentyears, the target is probably attainable provided producer prices can bekept sufficiently attractive to growers. Arabica coffee production isestimated to have already exceeded in 1967/68 the Plan target of 20,000tons. It is felt in Cameroon that given the intensive effort of theArabica growerst organization to increase yields and planted area, produc-tion may reach 25,000 tons at the end of the Plan period. It seens unlikelythat banana production will reach the Planls projection, mainly becauseconversion to the Poyo variety has not yet been pursued with sufficientdetermination. Expectations for other export crops in the Plan appear onthe whole realistice with projections for groundnut and rubber productionperhaps somewhat on the high side.
95. Plan forecasts for meat production imply a growth rate of only2.8 percent annually; given the haphazard and unsanitary methods of livestockraising, this may be realistic. The outlook for fishery production is fairly
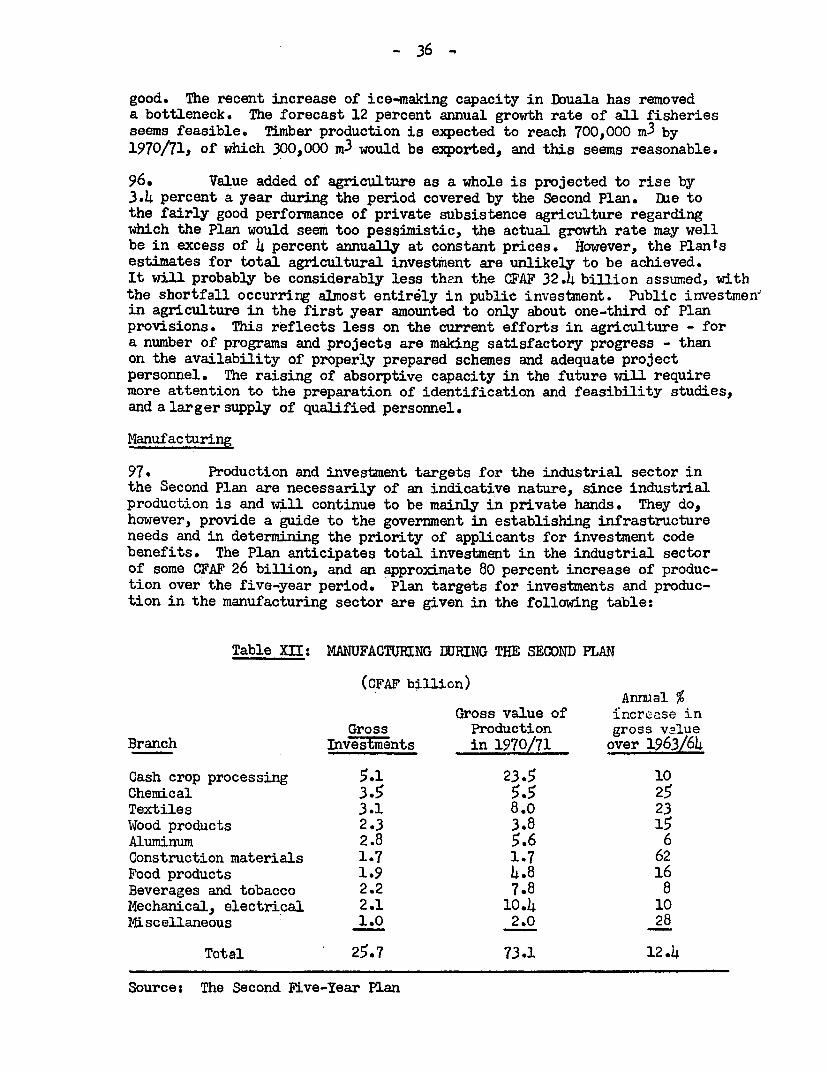
- 36 -
good. The recent increase of ice-making capacity in Dbuala has removeda bottleneck. The forecast 12 percent annual growth rate of all fisheriesseems feasible. Timber production is expected to reach 700,000 m3 by1970/71, of which 300o000 m3 would be exported, and this seems reasonable.
96. Value added of agriculture as a whole is projected to rise by3.4 percent a year during the period covered by the Second Plan. Due tothe fairly good performance of private subsistence agriculture regardingwhich the Plan would seem too pessimistic, the actual growth rate may wellbe in excess of 4 percent annually at constant prices. However, the Plantsestimates for total agricultural investment are unlikely to be achieved.It will probably be considerably lesa then the CFAP 32.4 billion assumed, withthe shortfall occurring almost entirély in public investment. Public investmen-in agriculture in the firet year amounted to only about one-third of Planprovisions. This reflects less on the current efforts in agriculture - fora number of programs and projects are making satisfactory progress - thanon the availability of properly prepared schemes and adequate projectpersonnel. The raising of absorptive capacity in the future will requiremore attention to the preparation of identification and feasibility studies,and a larger supply of qualified personnel.
Manufacturing
97. Production and investment targets for the industrial sector inthe Second Plan are necessarily of an indicative nature, since industrialproduction is and will continue to be mainly in private hands. They do,however, provide a guide to the governnent in establishing infrastructureneeds and in determining the priority of applicants for investment codebenefits. The Plan anticipates total investment in the industrial sectorof some CFAF 26 billion, and an approximate 80 percent increase of produc-tion over the five-year period. Plan targets for investments and produc-tion in the manufacturing sector are given in the following table:
Table XII: MANUFACTURING DURING THE SECOND PLAN
(CFAP billion)Annual %
Gross value of incrc-ase inGross Production gross value
Branch Investments in 1970/71 over 1963/64
Cash crop processing 5.1 23.5 10Chemical 3.5 5.5 25Textiles 3.1 8.o 23Wood products 2.3 3.8 15Aluminum 2.8 5.6 6Construction materials 1.7 1.7 62Food products 1.9 4.8 16Beverages and tobacco 2.2 7.8 8Mechanical, electrical 2.1 10.4 10Mlscellaneous 1.0 2.0 28
Total 25.7 73.1 12.4
Source: The Second Fïve-Year Plan

- 37 -
98. The largest investments are expected in cash crop processing.Two important items, a sugar factory and a cocoa butter factory, arealready completed, and the overall target should be fulfilled.
99. The chemical industry has the second largest investment target,with a fertilizer project accounting for 40 percent of the total. Thegovernment hopes to attract private capital for the construction of a66,000 ton fertilizer plant, producing on the basis of imported sulphurand ammonia, but there is no certainty yet about the availability of funds.Prima facie the project appears to be of uneconomic size.
100. Important investments are forecast in textiles. The industrywill be able to satisfy part of its raw materials needs from domesticallygrown cotton. First-year investments and production were high and theindustry appears to be prospering. The Plan targets seem reasonable.
101. Plan targets for the wood processing industry appear modest.First-year projections were exceeded by 94 percent, and domestic demandfor such items as railroad ties, telephone poles, construction materialand furniture is expected to remain strong. Improvement of the transpor-tation infrastructure, particularly the extension of the railroad pastYaounde, should also reduce transport costs. Governnent has recentlygranted special fiscal benefits to the lumber industry. Sixteen companieshave applied for these to date, and have submitted investment proposalstotalling CFAF 0.5 billion. Plan projections may, for these reasons, beexceeded by 10 to 15 percent.
102. The main element in the target for the aluminum industry is theconstruction of a rolling mill at Edea. This has already been completedand production has started. No major additional investments are envisagedduring the Second Plan. Production of aluminum ingots is presentlyrestricted by powJer shortages during dry summer periods. Improvementsin electricity supply should permit production to increase from about50,000 tons at present to 58,o0o tons in the 1970ts without furtherinvestments.
103. The projected rapid growth of the building materials industryis related to the establishment of a 45.,00o ton cement plant in the North.If exports to Chad are restricted because of recent UDEAC developments,the plant may have to work temporarily below capacity depending on theincrease of domestic demand.
104. The beverage and food products industries should meet or slightlyexceed investment and production targets of the Plan. First-year projectionswere exceeded by both. Bakeries, flour mills, cocoa butter and chocolatefirms have been or will be established during the five-year period, andprospects for a shrimp-freezing plant and animal fodder factory, as wellas an instant coffee plant, are good. In the beverage sector the productionof beer, ice, soft drinks and cigarettes is likely to develop as forecast.

- 38 -
l05. Most enterprises in the mechanical and electrical industryare small-scale, and little sophisticated equipment is employed. However,first-year investments amounted to 34 percent of the five-year target,and Plan projections wiU probably be exceeded.
106. Taking the industrial sector as a whole, investments and produc-tion will probably exceed targets. Planned production increases of 12percent per annum over the periods 1963/64-1970/71 is far below actualgrowth rates during the 1960ts. There still are many opportunities forinvestment in import substitution of simple consumer goods, and there isalready an embryonic intermediate goods industry producing for localconsumption; the prospects for these continue to be good. There is alsothe possibility of sales in the UDEAC countries, where Cameroon has theindustrial lead. Since it is likely that foreign capital and enterprisewill continue to be required for some time to come, much will depend onthe political clirnate and on the governmentts attitude to foreign investors.At present these are favorable but inevitably the Government will facepolitical pressure to reduce the role of foreigners in the economy.
Transportation
107. The importance of improved transportation facilities for generaleconomic development has been mentioned. Improvement and expansion of thehighway system is particularly important. The amount of investment to bedevoted to highway investment is large, about one-fifth of total publicsector investment. Emphasis is on trunk roads; planned investment insecondary and tertiary roads is fairly small.
CFAF billion Percent
Trunk roads 11.2 68Major other roads 2.1 13Road links and feeder roads 2*2 13Maintenance equipment 1.0 6
Total 16.5 100
Major trunk proJects are the link between the future railhead of theTrans-Cameroon railway at Ngaoundere up to Maltam in the north (718 km)which will be financed and built in several sections, and the Douala-Tiko-Victoria-Buea link (114 km) which will drastically shorten travellingtime between East and West Cameroon. This last project is in progress.Although the Plan mentions improvements of the Yaounde-Edea-Douala road,no action has been taken yet. Altogether trunk roads totalling 1,449 kmare to be constructed or improved by 1970/71o Plan targets for othermajor roads are for construction or improvement of 480 km of roads. ThePlan document does not contain information on the length of planned feederroads. As mentioned in paragraph 36, road investment in the first year ofthe Plan (1966/67) was far below target. For the future, it would seemessential to give greater attention to secondary and tertiary roads. Thiswould stimulate rurel production and permit more effective utilization oftrunk roads. In early 1968, the goverament established a maintenance

- 39 -
equipment pool at Douala to be furnished gradually at a cost of $8 million,twice the provision for this purpose in the Plan. A training school forroad maintenance officers is also being established.
108. On the. basis of an increase in road freighttrafficof 4-4.5 percentper year (9 percent for urban traffic), the Plan expects new vehicle regis-tration (trucks, buses and cars) to increase from 4,300 at present to 6,000at the end of the Plan. These estimates seem to be reasonable.
109. The largest single item of the railway investment program is thesecond and final section of the Trans-Cameroon railway. me cost of thissection (from Belabo to Ngaoundere) is estimated at $43 million, and FED,FAC and USAID have indicated willingness to share about 85 percent of thefinancing. A NEDECO-BCEOM team is making a preliminary study of extensionof the railway from 1balmayo to Bangui (Central African Republic). The Planenvisages also other railway infrastructure investments of CFAF 2 billion,and rolling stock investments of CFAF 1.3 billion. The share of self-financein these amounts to be provided by the railway is CFAF 2.5 billion. It isimperative that the program for improving the central line (see paragraph 39be pushed ahead rapidly. If this is done and the necessary rolling stockinvestments are made, the Plan objective of increasing traffic by 5 percentper annum should bé attainable.
110. No major investments in the ports of Cameroon are projected inthe Plan. The immediate need is for policy changes which would allow higherutilization of existing port capacity (see paragraph 42). Even with theseDouala is likely to be saturated before the mid-l970ts. A study on thepossible extension of Douala and of the alternative development of a deep-water port at nearby Victoria is just beginning.
Power
111. Cameroon is well endowed with water resources for the productionof energy, but significant investments are needed to exploit them. Theplan provides for an investment program of CFAF 6.3 billion. The bulk ofthis is for the construction of a new dam at Mbakaou on the Sanaga riverwhich will create a 2.3 billion m3 reservoir, and for a new power station,Edea III (Edea I and Edea II having been completed in 1950 and 1958, res-pectively). The dam is now under construction and will be finished at the endof 1969. Tlo of the five generators needed for Edea III are now on order andvill be delivered in April 1970. The remairing throe will be installed by1973. Thc. cost of the .lbnkaou-Edea III project iith 2 out of 5 Zenerntors in-ciuded (CFAF 1.2 billion) is boing financed by loans from the European Invest-ment Bank and CCCr, ard by self-financing by the electricity company, ENELCAM.Financing arrcngernents for the tbree additional generators have still to bemado. The Plan also makes provision for studies of several other sites for damzand hydro-electric stations: on the Nkan, Nyong,-Sanaga, Shumi and Noun riversin East Cameroon; on the i4echum, Cross and Ouve rivers in West Cameroon.
112. T e Mbakaou-Edea expansion program will ensure additional power,permitting the operation of the aluminum plant at full capacity and provisionfor the requirements of Douala and Yaounde throughout the 1970ls. The latterare expected to continue to grow at 12-15 percent annually. The pace of

- 40 -
development of pawer consumption in the secondary centers is likely tocontinue to be faster still; in the past three years, consumption grewat an annual rate of nearly 15 percent. Generating capacities in manycenters, particularly in the North, have been increased during the 1960'sand should suffice for the rest of the decade. Most of the secondarycenters will continue to be served by relatively small diesel generatingplants.
Education
113. The educational system has grown rapidly. In the period 1960-65,the number of elementary school pupils increased at the rate of about 10%per annumu, and that of secondary school pupils more than tripled. Thepercentage of children of school age (6-13) currently attending primaryschool is about 65 percent, although there are marked variations betweendifferent regions. They range from only 20 percent in the North to 95percent in the center south. The expansion, hawever, has not been ac-companied by an adequate increase in inputs: the proportion of qualifiedteachers, already too low, has declined,L' and construction of new buildingsand supplies of instructional materials has lagged. Consequently, thequality of education overall has declined; drop-out, repetition and examinatiorfailure rates have ah increased. At the same time, little has been done togear the type of instruction to the economic and social needs of the country.
114. The governnent's present policy, embodied in the Second Plan, is togive priority to improving the quality and productivity of education provided,rather than expanding the system in general. In view of the foregoingremarks, this is quite properé As far as primary education is concerned,special emphasis is being given to overcoming the shortage of qualifiedteachers by opening new training colleges. The backlog of classrooms isalso receiving attention. Some increase in the number of pupils is regardedas inevitable, but with a view to normalizing the size of classes, it isbeing cut back sharply from the 10 percent expansion of the early 601s. Thegovernment is also trying to improve the relevance of the educational systemto the countryts economic realities by expanding technical and other voca-tional education. Some foreign assistance has been obtained in this area,and more is being sought.
D. Conclusion
115. On the basis of the foregoing review of production and investmenttrends and prospects, it is possible to make a comparison between the SecondPlan estimates and the missionls rough appraisal. This is done in thefollowing table. Obviously mission estimates are very tentative; the purposeis to provide a rough indication of the economic grawth potential and theoverall size of financing requirements. An important feature of the estimatesis the considerable increase in investment represented by them. Investmentin the four years preceding the Second Plan averaged CFAF 22 billion, while
1] In 196h/65, the percentage of qualified primary school teachers inEast Cameroon was only 21 percent and in West Cameroon 31 percent.

- 41 -
our assessment for the Plan period amounts to CFAF 30 billion per year.The expected increase is largest in the public sector where investmentsare expected to rise from an average of CFAF 8 billion before the Plan toCFAF 14 billion. These estimates are based on whatever information isavailable on investments in the first two years of the Plan and on thestatus of projects and programs under execution. Mile these estimatesdo not imply a drastic rise in the proportion of investments to GDP (totalinvestment to GDP would remain about unchanged although public investmentwould rise from an average of 4.6 to 6.3 percent of GDP), they do indicatea significant increase in absolute sense of the capacity to implement develop-ment projects and programs.
Table XIII: PRODUCTION AND INVESTMENT IN THE SECOND PLAN
Annual Production Growth(percenri) Investment (CFAF billion)Plan Mission Plan Mission
Agriculture 3.4 4 32 25Manufacturing 9.8 14 26 29Transportation 6.9 5 55 46Power 8.9 9 6 6Other sectors 6.6 5 46 46
Public sector 85 72Private sector 80 80
GDP 5.8 6.6 Total 165 152
L Growth percentages for production are not fully comparable. The basefor production growth rates in the Plar. is 1963/64, while the missionestimates are only for the last three years of the Plan, i.e. 1968/69-1970-71.
116. It will be seen that the missionts estimates lead to slightlyhigher GDP growth and smaller investments.. This is because the areas ofexpected investment shortfall are mostly in slow-maturing projects inagriculture and transportation which would not have affected output inthe Second Plan anywiay. Making allowance for investments in the firsttwo years of the Plan, investments during the remainder of the Plan(1968/69-1970/71) would amount, according to the missionts estimates,to CFAF 96 billion, of which CFAF 51 billion in the public sector andCFAF 45 billion in the private sector.

V. FINANCIAL PROSPECTS
A. Introduction
117. The financing scheme set out in the Second Plan document indicatescontinued heavy reliance on external assistance which is estimated to accountfor 37 percent of total financial requirements. Most of the foreign aid isto be received by the public sector. Investment in the private sector is tobe financed almost entirely from private sector savings, after making dueallowance for the transfer abroad of part of them IDmplicit in themacro-economic framework of the Plan is the assumption that these trnasferswill con inue to be substantial and in fact, more than outweigh private,foreign investment in Cameroon.
118 The following table summarizes the financing scheme shown in thePlan, and gives for comparison mission estimates for the same items. Thebasis for these estimates will be discussed in subsequent sections of thischapter.
Table XIV: SECOND EIVE-YEAR PLAN - SOURCES OF FINANCING
(CFAF billion)
Plan Mission estimates1966/67 1967,ât 196d/69-1970771 TOTAL
Public investment 85 21 51 72
A. Public savings 30 8 14 22
B. Ecternal assistance 55 13 37 50
Grants to public sector 31Loans to public sector 24
Private Investment 80 35 h5 80
A. Private savingsless transfers abroad 74 32 42 74
B. External Assistance 6 3 3 6
Grants to private sector 1Loans to private sector 5
TOTAL 165 56 96 152

- 43 -
B. Public Finance
119. Goverrment action and finance, together with foreign aid andtechnical assistance, will continue to be decisive factors in Cameroon t seconomic development. The private sector is, apart from the mostly foreign-owned modern industrial and commercial enterprises, on the whole not active,and relies for finance, know-how and motivation, largely on government.Developments in public finance and aid are thus of prime importance foroverall economic development.
120. In the last six years, government revenue proved fairly responsiveto economic growth. Consolidated current revenue of the federal and stategovernnents rose from 16 percent in 1963/64 to 17 percent of GDP in 1967/68.As discussed in paragraph 48, this revenue growth was not so much the resultof increased tax rates, but rather of the growth of taxed activities, parti-cularly of industry, transportation, construction and commerce in the moremodern part of the economy. Ilhether the modern sector will obtain thefinancial resources to continue growing as a proportion of GDP dependsto a large extent on foreign aid and trade. For the purpose of our estimatesin the above table, we have assumed that no drastic deterioration will occurin these conditions, and that revenue will continue growing slightly as aproportion of GDP, to almost 18 percent in 1970/71, or at about 7t5 porcenta year.
121. Such a proportion of GDP is stili not very high. Further raisingof it is desirable in the interest of reducing the countryts reliance onforeign aid. This is especially important in view of the present uncer-tainties regarding future aid levels (see paragraph 129 below). The govern-ment should therefore seek to strengthen the revenue system in order toincrease public savings. IWIhile the mission is not able, on the basis ofits short visit, to formulate any proposals in this respect, it would seemthat certain areas deserve further study. (i) Improvement of tax adminis-tration could probably lead to revenue increase. Customs records at presentappear to be incomplete and frequently liable to misreporting of the natureof merchandise or under-reporting of the value. There is also scope forimproving tax auditing for income and prpfits tax purposes and for speediertax collection. (ii) The question arises whether further unification of thevarious import taxes (already partly realized under the UDEAC "tax unique")is feasible and would facilitate collection. (iii) Certain tax rates seemfairly low and could probably be raised. The company tax in East Caneroon,where most of the economic activity in tbe country is concentrated, amountsto 25% of net income; this is not high by international comparison, and thepercentage could probably be raised somewhat without serious adverse effecton investment incentives. As a step towards harmonizing taxes, West Cameroontscompany tax is being reduced from the present 40 percent to 35 percent. It
iJ This is not to say that foreign aid can be more than partially substitutedin the foreseeable future, since it is accompanied by essential expertise.The objective should be to increase Cameroonts portion of public sectorfinancing.

is suggested that the best final solution for company taxes in the Federationis perhaps between this level and the 25 percent now in force in EastCameroon. Income taxes in East Cameroon also appear low. Incomes belowCFAF 200,000 ($800) are tax exempt and incomes above this limit are subjectto a mildly progressive tax with a highest marginal rate of only 30 percent.Family deductions are generous: a married person with two children earning$8,000 - a very high income in Cameroon - would pay only 9 percent income tax.Lowering of the exemption limit could draw many more income earners into thetax net, and raising of the rate progression should lead to substantialincrease in total tax yield. (iv) Meanwhile, revenue growth will continueto be delayed to some extent by the tax exemptions extended to eligibleenterprises under the investment code. These exemptions are, as pointedout in paragraph 32, quite generous, and loss of revenue due to themconsiderable. A serious study of benefits and costs of the investmentcode from the fiscal and macro-economic point of view would seem veryuseful.
122. The Governmentts attempts since early 1967 to slow down thegrowth of current expenditures have played an important role in the recentimprovement of the overail fiscal performance. The budget for 1968/69provides again for a limitation of current expenditure growth to 7.5percent, which would be about the same rate of increase as probablyachieved during 1967/68. It will be recalled that expenditures in thefour preceding years had increased by 10-14 percent a year. An importantelement in the governmentts attempt to economize expenditures is a stricterlimitation on increases in the emoluments of public servants. No doubtit is highly desirable that the government attempt to husband very care-fully the resources that could be made available for economic development,and to this extent it would be desirable (if non-economic considerationspermit) to limit as much as possible the increase of expenditures forgeneral administration, (including fringe benefits for governnent servants)and national defense. If the rate of growth of these administrativ-3 ex-penditures could be held down, there would be much more leeway to authorizeincreased current expenditures which are important for economic development,especially for government agencies serving agriculture, forestry, fisheriesand livestock; commerce and industry; public works and planning. Contri-butions and subsidies for various private sector development activities,which in recent years have been the fastest growing element in currentexpenditures, should also be expected to rise. A further large claim onpublic resources will be made by education. School attendance at elementaryschools is expected to rise at an annual rate of only 2.5 percent; but effortsto raise the quiality and numbers of teachers and higher rates of growth insecondary and higher education, will certainly add to increases in educationoutlays. If growth of "administrative" current expenditure could be held tofive percent a year, and assumning total current expenditure grawth of 7.5percent a year as the government naw intends, it would be possible forcurrent expenditures important for economic development (including educationexpenditures) to increase by about 9.5 percent a year; assuming total currentexpenditure growth of 10 percent, they could increase at a rate of 14.5percent a year.
- 45 -
123. It is not possible for the mission to make a full assessmentof the probable development of current expenditures in the future, butin view of the weak staffing positions of several development ministriesand agencies,a current expenditure grow'th rate averaging 10 percent seensmost likely. Assuming this and revenue growth of 7.5 percent, governmentbudgetary savings for the last 3 years of the Plan would amount in total toabout CFAF 9 billion.
124. The contribution of public and semi-public bodies to public savingswas estimated in the Second Plan at CFAF 8 billion or CFAF 1.6 billion peryear. In 1966/67, these savings, including those of the Port and WlaterwaysAuthority, have accounted for approximately CFAF 1.3 billion. Given improvedmanagement and appropriate pricing policies, this target of the Second Planshould be within reach, and it can be assumed that about CFAF 5 billion insavings will be forthcoming in the remaining 3 years.
125. This amount does not include potential contributions to developmentfinancing by the price stabilization funds in East Cameroon and the MarketingBoard in West Cameroon. Since these contributions would chiefly be used forinvestment in private agriculture, the mission has treated them as privatesavings. The stabilization funds in Cameroon fulfill two functions. In thefirst place, they cushion the impact of price fluctuations by levies whenexport prices are higher than the producer prices established by the unds(see Statistical Appendix Table 12), and disbursing when prices are lower.The second function is a semi-fiscal one. The producer price, although onthe whole fixed high enough to maintain producer interest in the crops, stillleaves a margin in good years which can be used for economic developmentpurposes without endangering the fundst liquidity position. These resourcesprovide an important source of investment funds. Contributions by the fundsto the cocoa disease fighting campaign, and the proposed East Cameroon oilpalm project have been mentioned. The West Cameroon iMarketing Board fulfillsthe same useful function. In order to maximize the potential contributionto economic development, improvement in financial administration of thestabilization funds appears desirable. At present, it appears that thefunds are not able to present a clear picture of their financial situation.Delays in payments to and levies from the trade are common; the receivablesof the cocoa fund from exporters amounted, by the end of April 1968, toCFAF 3 billion ($12 million), a considerable interest-free loan to theprivate sector. As against this amount, there is a smaller sum which isdue to exporters. The potential contribution of the funds to economicdevelopment depends not only on improved administration but, first of all,of course, on the level of world market prices. Provided the presentmargin between export and producer prices is maintained, it would appearthat CFAF 1-2 billion could be made available annually for economicdevelopment.
C. Private Sector Savings
126.. Grouth of private savings was one of the favorable aspects ofrecent economic development. VWhether savings of the private sector willcontinue to grow at a relatively rapid rate will depend, as far as savingsin financial form are concerned, on the growth of business and household

- 46 -
incomes and also to a large extent on the investment climate and confidencein the future of the economy in general. The savings of the rural sectorinclude the building of huts, land clearance, and increases of livestock9which by their nature are not transferable and are therefore less affectedby these factors. For the Plan it is assumed that this type of savings willamount to a total of CFAF 7.8 billion over the plan period. This would beequivalent to about 4 percent of GDP originating in subsistence cultivation,which is perhaps too small a proportion; notionally, it is assumed thatsuch savings wiill be double this amount.
127. An important feature of the Cameroon economy is the free inflowand outflow of private resources. The balance of payments annually carriesa large net outflow of private profits and incomes, until recent years,almost matching the inflow of foreign aid (see paragraph 13). This outflowis due to the fact that many enterprises are owned and managed by expatriatesand to renmittances by foreign technical assistance personnel. Steps which theauthorities might consider to retain a larger part of these savings inCameroon are the establishment of more attractive conditions for depositorsof funds by raising the present fairly loy fixed-term deposit rates of thebanks and perhaps by issuing government bonds in suitably small denominationsto the general public at attractive interest rates and redemption terms.
128. The future course of private savings and inflows and outflows ofprivate funds is hard to predict. Probably it mnay be assumed that, as inthe past, resources will be retained or received in Cameroon to the extentthat favorable investment opportunities present themselves. Present insti-tutional arrangements, notably the absence of exchange restrictions and theclose financial relation with France and the Common MIarket more or lessensure that financial stringency will not be the main liniting factor inprivate sector development. mis is more or less in line with implicitassumptions on this matter in the Plan. However, the Plan did make allowancefor financing with official foreign aid of a limited number of developmentschemes in the private sector and this is also reflected in the missiontsestimates.
D. Foreign Resources
129. The need for foreign resources for the remainder of the Planperiod amounts, according to the missionts estimate, to CFAF 40 billion($160 million), almost CFAF 42 billion ($168 million) if debt repaymentsare included.i' lost of these requirements (CFAF 37 billion and CFAF 39billion, including repayments) would be in the public sector. Theseamounts represent a large increase over actual aid inflows in the lastthree years, which amounted to only CFAF 26 billion. This increase isconnected with-the increase in absorptive capacity mentioned in the lastchapter. Cn the basis of these estimates the following picture for foreignfinancing needs emerges. Aid in the pipeline will cover a considerable part
1] This includes project-related technical assistance, but excludes Frenchcontributions to teacherstand civil servantst salaries, currently amountingto about CFAF i billion annually. The reduction or elimination of thissupport would cause a commensurate increase in government expenditures andfall in public savings.

- 47 -
of requirements. Roughly estimated, undisbursed loans amount to around$4 - 45 milliono2/ Undisbursed grant aid from FAC and FED would bring thetotal of firmly conmmitted undisbursed aid to about $75 million. Some ofthe commitments being for slowŒ-maturing projects, disbursements over theperiod under consideration will probably not exceed $60 million. Aid inprospect includes the second section of the Trans-Cameroon railway, forwhich foreign financing of $38 million is being arranged, and the EastCameroon oil palm project with prospective financing of $9.6 million.Completion of the Trans-Cameroon railway is scheduled to take place at theend of 1971, and disbursements should thus fall almost entirely within thePlan period. Disbursements on the oil palm project are not expected to becompleted until the mid-1970's. These calculations still leave about $65million to be filled from new commitments, and the question is whether suf-ficient new commitments can be obtained to fill this gap. The availabilityof aid from France, which bas played such a large role in the financing ofCameroon's development to date, is under the present circumstances perhapsless assured than it has seemed to be in the past,while new aid commitmentsfrom FED are subject to renewal of the Yaoundé convention.
130. Public savings would cover only about 27 percent of total prospectivepublic investment. Moreover, public investment will continue to include anumber of schemes, such as construction of hospitals, primary achools, andadministrative buildings, which will not attract foreign financing. Sincethese will be undertaken iwholly out of goverrment fundsj the possible contri-bution of public savings to projects suitable for joint-financing will belowfer still. It is therefore nacessary that a high proportion of the costsof such projects be covered by foreign assistance; and this implies, particu-larly for agricultural projects, a degree of local cost financing.
1310 If absorptive capacity in the next few years were to prove smallerthan estimated by the mission, aid requirements would be correspondinglyless. But if our assessment is basically correct, then a shortfall of aidbelow CFAF 42 billion would require government to re-think seriously itspriorities in over-all resource allocation in the interest of economicdevelopment. This might require drastic fiscal action, perhaps on the linessuggested in paragraph 121, and rigorous efforts to curb current expendituregrowth. Contingency planning for this situation seema desirable.
132. Cameroon's external public debt amounts to $133 million. Most ofthis bas been incurred at modest interest rates of between 2 and 5 percentand with repayment periods of 10 - 15 years. Service on this debt will reacha peak in the early 1970's of about $7.2 million, > - 5 percent of projectedexport&. In view of the fact that export earnings are fairly diversifiedand thus probably not too vulnerable to sudden price changes, and because ofthe reasonably good fiscal position, government should not have great diffi-culty servicing this debt and a modest increase in debt on conventional termswould be justified. But since the country is poor and its road to develop-ment obviously long, a heavy debt burden is undesirable, and most of foreignassistance to Cameroon should therefore be on concessional terms.
1/ It is not possible to be precise, because information on a number of loansis incomplete. See also Statistical Appendix Table 1l

VI. STATISTICAL APPENDIX
Table No.
I. SXTEM14AL DEBTExternal medium- and long-term public debt
outstanding 1Estimated service payments due en external debt 2
Il. POPUIATIONTotal and working population 3Population groirth by region 4
III. PRODU0-TION AND EXPENDIrUREIand use 5Production of principal subaistence crops 6Production of principal cash crops ln
East Cameroon 7Production of principal cash crops in
West Cameroon 8Livestock and fisheries 9Cotton production in East Uameroon 10Agricultural production and Plan targets ilProducer prices established by agricultural
stabilisation funds 12Price projections for major export products
in the Second Flan 13Total number of motor vehicles 14Registration of motor vehicles azid tran.iport
capacity in East Cameroon 15Inventory of roads and highways 16Veiicle operating cost 17Railroad traffic and basic statistics 18Port traffic 19Commercial airport traffic 20Production of electricity 21Consumption of electricity 22&umnary of provisions of investment code 23Evolution of permanent employment in
East Cameroon 224Expenditures on GDP 25Second Five-Year Plan - breakdown of public
and private investment 26
IV. FUBLIC FNANCEConsolidated Federal and Federated budgets 27Revenue and current expenditures of Federal
and Federated Governments 28

(gi)
Table No.
VO MONEYj CREDfl AN') PRICESMonetary surFwY, 29Industrîal classïIicatîne of declared loans
and advances 30Camerron Davalopment Bank -ew lo8m
31Crsroon D"10nopmsnt Bank - loan and
inveetmtsa outstanadng 32Cost of 1îvIL indices 33
VI. FOEDN TRLJ AND IMCE CF PAYDENTSExports by walus and vol.u 3>4Impor,s by alue 35Coaemodity traae balance by areas 36lîsbursementé of foreîgi aid 37Balance of payfants 38

Table 1: CP2¶ERO!ON, EXTERNAL MEDIUM- AND LONG-TERMA PUBLIC DEBT OUTiTAIZDINGINCLUDING UNDISBURSED AS OF DECEMBER 31, 1967
Debt Repayable in Foreign Currency
(,in thousands of U.S. dollars)
Debt outstanding* December 31, 1967
Item. Disbursed Includingonly undisbursed
TOTAL EXTERNAL PUBLIJ DEBT. L 28 06h 80,179
Publicly-issued bonds 50
IB-D lôans - 7,000
IDA credit 487 11,000
Loan from EuropeaniDevelopment Fund - 6,h82
.u S. GovernmentVloan - AID 6,509 13,000
Loans from governments of,otherIBIRD members 1019 o . 4 647
United Kingdomn l594France '0,265 hi.,Oh
1 Debt with an original or extended maturity of- one year or more./2. Does not include.:a n'umber of loans for which precise.information is
unavailabie. Including these would add an.estimated U.S. $53 millionto debt outstanding' (ihcluding undisbursed).
Saource: RIBRD .StatisticaL Service Division, Economics Department, andinformation suppliedby Ministry or Planning.

Table 2: CMAIÉROON ESTIIMTED CONTRACTUAL SERVICE PAIMENTS DUE IN FUTUIRE C0l EXTEr.A`LIEDIUM- AND LONG-TERM1 PUBLIC DEET OUTSTANDING INCLUDING UNDISBURSED AS OF
DECEMIBER 31, 1967 /l
Debt Repasyable in Foreign Currency
(In thousands of U.S. dollars)
DEilT OUTST(BEGIN UF FzJv) PAYiENTs -UUr13A. PEh1UJ
INC LUDi) 1 u A 'tJi,T 1 -YEAti UNIDi SUi'ÈI3L ZATIO,N 1NPEiRLST- TUTAL
GRA ! tù1J .
1968 79 33,9 1,54:3 574 2,1161969 77,79,L. 1,i602 573 2, 17 51970. 76,194 1,626 550 2, 17i,1971 745683 1,604 527 2,1311972 72,99i4 1,471 505 1,97 :1973 719493 19427 681 2,108I'`74 10,066 1,154 8'49 2,00219-/5 o089912 1,4î87 &76 2,3b31976 67,425 1,463 857 2, 32t1977 ô5,962 1,629 940 2, 95619'36 ù4,333 1,93g 1 ,0'5 3,()3319 7- 62,345 2,qu61 1,037 3, 111980 60,265 2,135 'J99 .3,13:31981 508 313 0 2239 5 zi 3 1)11982 55,9391 2, 304 914 3,219
p Includes all debt listed in Table 1 exeept $8h0,000 loan from U.K. forwhich precise terms are not available. If this loan and the variousothers excluded in Table i are included, total debt service in 1968would be approximately $3.6 million, rising to an estirmated 57.2 nil-lion in 1971/72.
Source: IBRD Statistical 3ervices Division, Economic Department, andinformation supplied by Mlnistry of Planning.

Table 3 ESTr.:AT!I$ OF T-?E TGTAL A D IlX±NG FOPJLATI(F: & CIi'IOO: - i,6` AT MIDYAR
(in thousands)
._E as t C a m e r o o n W e s t Ca m e r o o n F e d e r a t i o n
Male. Female Total Male Female Total _Male Female Total
- - - - Sources c),b) - - - - - - - - Source b) - - - - - - - - - Source c)-
Total population 2,067 2,248 ;,315 561 573 1,134 2,628 2,821 5,449
By age group:
Under 15 867.- 831 1,698 275 276 . 551 1,1L2 1,107 2,24915 - 29 - i33 559 992 149- 153 302 582 712 1,29430 - ù9 .489 587 1,076 102 108 210 591 - 695 1,28650-- 64 200 201 Loi 29 29 58 229 230 459Over 64 78 70 148 6 7 13 84.. 77 161
Of working age (15-64): 1,122 1,347 2,h69 280 290 570 1,402 1,637 3,039
- - - - Sources a), d) - - - - - - - - - Source b) - - - - - - - -Sources a), b),d) - - - -
'Wforking on own account in agriculture 672. 1,118 1,790 168 . 2h5 h13 840 1,363 2,203Agricultural laborers 138 7 1h5 19 1 20 157 8 165Industrial emDloyees 27 2 29 3 * 3 30 2 32Civil servapts 29 3 32 13 1 1h h2 4 46Ail otherv' 164 32 196 hi 7 L8 . 205 39 244
Of working age but not economicallyactive 92 185 277 36 36 72 128 221 349
1/ including seasonal workers .which constitute an important share only in the "agricultural laborers" category (about 80%).
2/ includes the private tertiary sector, local crafts and skills and undetermined occupations.
Sources: a) 1;ission Zstirates;
b) The ?opulation o1' West Cameroon, 196h demographic survey, Ministère des Affaires Economiques et du Plan extrapolated to 1968 by the mission);c) Direction de la Statistique;
d) %apDort sur les Statisticues du Travail pour le Cameroun Oriental Année 1966, Ministère du Travail et des Lois Sociales.

Table 4: CAMEROON, POPULATION GRDWTH BY REGlON, URBANI/ VS. RUaAL, 1959-19752/(mid-year estimater, in 000)
3/Growth rates
1963 - 19751959 1963 1970 1975 (per cent)
Urban Rural Total Urban Rural Total Urban Rural Total Urban Rural Total U R T
Center - South 115 850 965 150 900 1,050 230 1,000 1,230 310 1,060 1,370 6.3 1.4 2.2
Coastal 240 215 455 300 240 540 420 310 730 530 380 910 4.7 4.0 4.5
West 80 595 675 90 620 710 140 630 770 210 610 820 7.4 -0.1 1.2
East 10 205 215 10 225 235 10 260 270 15 280 295 3.5 1.9 2.3
Total SouthCaneroon 445 1,865 2,310 550 1,985 2,535 800 2,200 3,000 1,065 2,330 3,395 5.7 1.0 2.5
Total North Cameroon 65 1.315 1,380 100 1,350 1,450 130 1,470 1,600 160 1,540 1,700 4.0 1.1 1.3
Total EastCameroon 510 3,180 3,690 65D 3,335 3,985 930 3,670 4,600 1,225 3,870 5,095 5.3 1.3 2.1
Total West Cameroon 90 830 920 135 885 1,020 170 1,030 1,200 200 1,150 1,350 3.6 2.3 2.4
Total Federation 600 4,010 4,610 785 4,220 5,005 1,100 4,700 5,800 1,425 5,020 6,445 5.o 1.5 2.1
1/ Urban population includes residents of centers with over 5,000 inhabitants;2/ 1959-1970: National Statistics Office estimates; 1970-1975: mission estimates based on the same assumptions regarding population growth rates;3/ Effective growth rate, taking into account inter-regional migrations; there may be apparent inaccuracies because of rounding of the annual data.
Sources: National Statistics Office (Direction de la Stntistique); Mission estimates.

Tabele 5 : LAM-xD US'S3 IN CA12iOON(000 hectares)
"ast Cameroon West Cameroon Total
Total area L 3,250 h,295 h7,545 100
Land area 42,700 h ,295 h6,995 98.3
Agricu1tu'ral area:Permanent meadows
and pastures 8,000 254/î 8,254 '17.4Arable land and land
under permanentcrops 1,590 404- 1,994 4.2
Fallo , land 5,hlO 911 6 321 13.3
Forested land 22,890 9h5 23,835 50.1
Other area:Unused but poten-
tially productive 4h000 1,721/1 5,721 12.0Built-on area,
wasteland, other 1,360 60 1,)20 3.0
/1 1i5ssion estinate.
Sources: East Cameroon: FAO Production Yearboolc 1966 (figures partlybased on estimates), 1954 data; IWlest Cameroon: The EconomiicPotential of WTest Cameroon (SPI), 1964 estimates.
Note: The definitions of the various headings are no-t alwzays identical.The data contained in the table have an indicative value onl.r.

Table 6 CAMEROON, PRODUCTION OF PRINCIPAL SUBSISTENCE CROPS(in 000 t.)
Area under cultivation1960/61 1961/6o2 1962.63 1963/64 1964/65 1965/66 (000 ha.)
Enst Cameroon
African vegetables n.a. 29 6 2 6 13 (19D5/66) 9
Arrow-root 545 32L 51>4 676 450 395 89European vegetables n.a. 1 2 2 2 10 6
Maize 97 109 175 216 170 2f46 221
ManiDc 581 435 447 417 >446 461 87
Millet, sorghum 354 312 336 377 4814 554 486Onions 8 6 1 2 1 5 1
Paddy 7 4 9 il 14 13 ilPlantains 513 525 661 696 695 585 106
Potatoes * * * 32 39 12 2
Pumpkin n.a. 42 9 5 7 19Sesame 6 3 5 2 3 2 6
Sugar cane 53 32 52 113 39 44 17
Yams n.a. 95 292 230 238 320 80Other crops n o t a v a i 1 a b 1 e ---
West Cameroon
Beans 10 9 10 (1964/65) 1
Manioc 28 27 29 40
Maize 50 40 42 81
Paddy not 2 2 3 not 4
Plantains 170 159 159 )Potatoes available 30 31 33 available ) 85
Vegetables 40 4o 41 )Yams 178 178 182 140Other crops --- n o t a v a i 1 a b 1 e ---
S-ources: East Cameroon, Direction de l'Agriculture;West Cameroon, Statistical Service, Buea.

Table 7 : EAST CAMERDON, PRDDUCTION OF PRINCIPAL CASH CROPS
(in OO0 t, unless specified)
1961/62 1962/63 1963/64 1964/65 1965/66 1966/67 1967/68
Bananas /1
"'poyo"t n.a. 7.6 8.7 8.4 15.4 29.1 n.a."Gros-Michel" n.a. 68.5 57.5 69.4 48.9 37.6 n.a.
Total Production 73.0 76.1 66.2 77.8 64.3 66.7 n.a.
Cocoa /1 67.7 70.0 85.2 89.4 80.8 87.0 90.0 (e)
Coffee /2
"Arabicfi." 6.9 7.7 10.7 11.6 15.6 12.0 15.0 (e)"Robusta", 34.4 34.9 34.7 32.4 48.8 42.6 50.0 (e)
Total Production 41.3 42.6 45.4 44.o 64.4 54.6 65.0 (e)
Coprah / - 0.4 0.4 0.7 1.1 0.3 n.a.
Cotton /3 25.1 41.4 45.6 44.0 57.5 55.8 n.a.
Groundnuts /1 54 66 74.9 78.3 82 n.a. n.a.
Kola /1 .2.6 2.7 3.2 3.3 5.1 6.1 n.a.
Palmkernels /4 20.0 22.8 21.1 15.7 16.3 18.0 n.a.
Palmoil/PalmkernelOil 22.0 27.0 32.7 30.0 31.2 27.3 n.a.
Pineapple /6 n,a. 2.4 2.8 2.8 2.8 3.2 n.a.
Rubber A 4.6 4.1 4.3 4.5 4.7 4.8 n.a.
Timber (in 000 m3 ) /7
Logs 394 381 478 480Sawn 79 65 .97 96 - not available -
Total Production 473 446 575 576
,Tobacco h1
Cut 1.7 1.7 1.8 0.7 0.8 2.2 n.a.Cover-leaf n.a. 1.0 1.2 1.4 1.3 1.6 n.a.
Total Production n.a. 2.7 3.0 2.1 2.1 3.8 n.a.
/1 Source: Direction de l'Agriculture (DA).72 Sources: DA to 1966/67; 1967/68 - Caisse de Stabilisation estimate.73 Source: Compagnie Francaise pour le Developpement des Fibres Textiles (CFDT).71 Sources: 1960/61-1961/62 - FAO Production Yearbook 1966; 1962/63 - notional
Mission adjustment; 1963/64 - Institut de lBcherche pour les Huileset Oleagineux (IRHO); 1964/65-1965/66 - FAO Production Yearbook 1966;1966/67 - IMission estimate. FAO figures are for calendar years.
/5 Palnoil and Palmkernel Oil. Sources: FAO Production Yearbook (figures are forcalendar years) to 1965/66; 1966/67 - Mission estimate.
/6 Coastal Eederal Inspection only - accounts for the largest part of production.
/7. Source: Previous IBRD Report.

Table 8 : WEST CAMEROON, PRDDUCTION OF PRINCIPAL CASH CROPS
(in 000 t, unless specified)
1961 1962 1963 1964 1965 1966 1967
Bananas
CDC /1 34.4 32.7 24.9 17.2 16.8 12.2 11.1
Others 57.0 54.3 42.8 34.1 n.a. n.a. n.a.
Total Production /2 91.4 87.0 67.7 51.3 n.a. n.a. n.a.
Cocoa
CDC /1 0.2 0.1 0.1 0.2 0.2 0.2 0.2
Others 9.0 4.3 5.2 8.6 5.8 6.2 6.2
Total Production /3 9.2 4.4 5.3 8.8 6.0 6.4 6.4
Coffee
,Arabica,, /4 3.8 n.a. 3.6 n.a. 6.5 6.5 5.8
'tRobustai' 7§ n.a. n.a. 3.1 n.a. 3 ° 2.3 1.5
Total Production n.a. n.a. 6.7 n.a. 9.5 8.8 7.3
Palmkernels
CDC /1 2.4 2.0 2.5 1.9 2.7 2.0 2.1
Others /5 3.5 3.3 3.1 4.2 4.4 4.5 4.6
Total Production 5.9 5.3 5.6 6.1 7.1 6.5 6.7
Palmoil
CDC /1 6.3 4.9 7.3 5.9 8.2 6.4 7.2
Others /6 3.8 3.4 4.9 7.1 9.7 10.2 11.9
Total Production 10.1 8.3 12.2 13.0 17.9 16.6 19.1
Pepper (in 000 kg)
CDC /1 36.4 35.3 28.0 44.1 33.0 38.6 59.8
Others Data not AvailableTotal Production
Rubber
CDC /1 3.8 4.2 5.1 4.9 6.4 6.7 7.3
Others /7 - Data not Available 1.1 1.4
Total Production 7.8 8.7
Tea (in 000 kg)
CDC /1 83.1 101.4 148.4 197.9 318.9 428.0 478.2
Others /7 Data not Available 288.0 285.8
TotalJProduction 716.0 764.0
Timber
LogsSawn - Data not Available
Total Production
/1 Source Cameroon Development Corporation (DDC).
72 Source IBRD.73 Sources: IBRD to 1964; 1965 - Statistical Service (Buea); thereafter Groupement
Interprofessionnel pour l'Etude et la Coordination des Intérêts Economiques
(GICAM)./4 Sources: Chamber of Commerce (CC) to 1965; therea±ter GICAM.
7§ Sources: IBRD to 1964; thereafter Mission and IBRD estimates; 1962 - notionalMission adjustment.
/6 PAMsOL only; smallholder production data not available. Sources: Institut de Recherchespour les Huiles et Oléagineux (IRHO) to 1966; 1967 - GICAM.
/7 Source : GIC M.
Note : Rows for which no source has been cited are residuals.
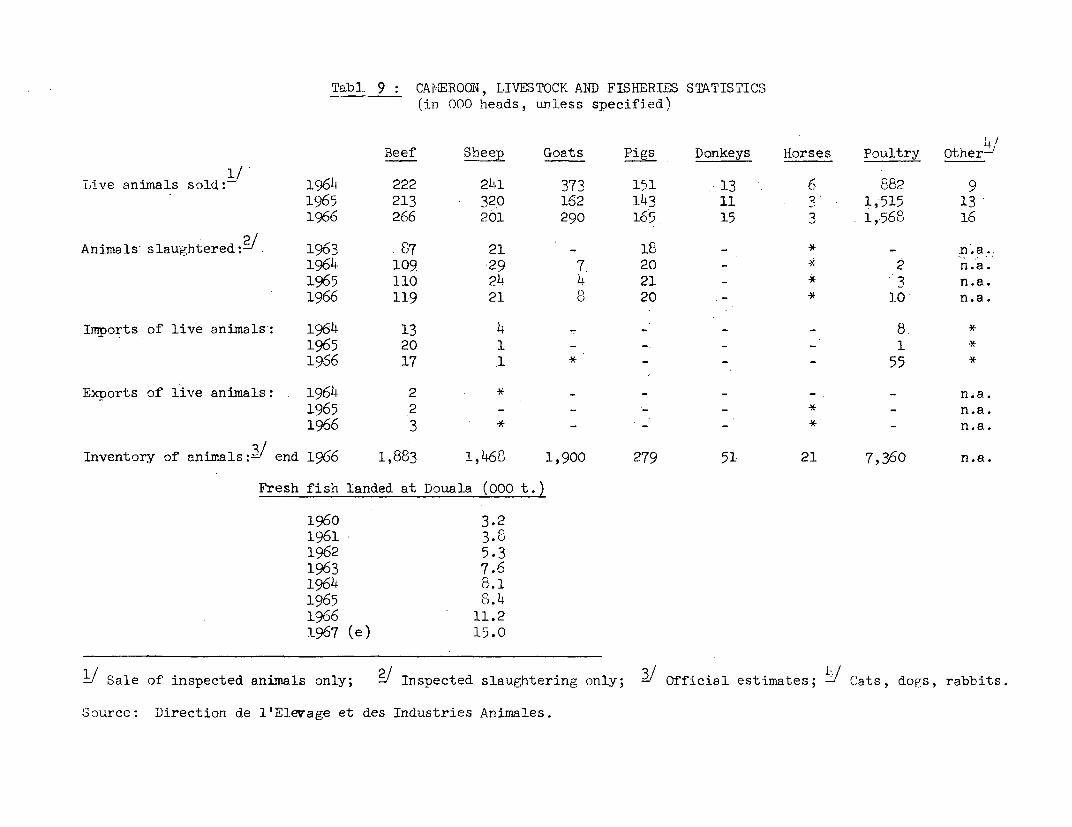
Tabl. 9 : CAMEROON, LIVESTOCK AID FISIOERIES STATISTICS(in 000 heads, unless specified)
Beef Sheep Goats Pigs Donkeys Horses Poultry Other b
Live aninals sold:- 1964 222 241 373 151 13 - 6 882 91965 213 320 162 143 il 3 1, 515 131966 266 201 290 165 15 3 1,568 16
Animals slaughtered:?/. 1963 87 21 - 18 _ * _ n.a.
1964 109 29 7 20 - 2 n.a.
1965 ii0 24 4 21 - * _ n.a.
1966 119 21 8 20 -lO n.a.
Imports of live animals: 1964 13 4 - - - 8 *
1965 20 1 - - - - 1 *
1956 17 1 * - - - 55 *
Exports of live animals: 1964 2 * - - - - - nia.
1965 2 - - - - * - n.a.
1966 3 * - - - * - n.a.
Inventory of animals: end 1966 1,883 1,468 1,900 279 51 21 7,360 n.a.
Fresh fish landed at Douala (000 t.)
1960 3.21961 3.81962 5.31963 7.61964 8.11965 8.41966 11.21967 (e) 15.0
J Sale of inspected animals only; J Inspected slaughtering only; / Official estimates; -/ Cats, dogs, rabbits.
Source: Direction de l'Elevage et des Industries Animales.

Table 10: EAST CA.0'T, COTTON PXODCTEI0N
Total Surface Production Yield(OOha.) (COOt.) (kg/ha)
1951/52 1.4 0,5 3701952/53 119 4e5 3801953/54 23.0 7.1 3081954/55 38.9 16.1 4151955/56 46,7 17.4 3751956/57 50.1 16.7 3341957/58 50.2 20.9 4151958/59 49,5 22.3 4501959/60 55.3 21.0 3791960/61 54.8 29.2 5331961/62 63.4 25.1 3961962/63 67.9 41.4 6121963/64 72.2 45.6 6311964/65 78,9 44.0 5571965/66 91.8 5705 6271966/67 97.8 55.8 570
1/ There may be apparent iracouracies becauseof rounding of the inputs.
Source: CFDT, Armual Reports.

Table 11: CA1EROON, AGRICULTURAL PRODUCTION AND PLAN TARGETS(in OOOt unless specified)
Product Actual Production Plan Target1963/614 1265/66 91 966/67/ 1970771
Maize 288 265Manioc - 90 60Millet, sorghum 554 155Paddy 16 31Plantain 7L5 850Potatoes 47 7Sugar cane 41 220Yamns, Cocoyams,
Sweet potatoes 895 995
Bananas 100 191Cocoa 93.1 130Coffee Arabica 18.5 20Coffee Robusta 11.9 61LCotton 55.8 75Groundnuts 85.o 120Kola nuts 6.1 3.5Palm kernels 21.5 19.6Palm oil h3.9 40.5Pepper (000kg, CDC only) 59.8 97.0Pineaiple 3.2 8.0Ruhber 12.6 17.0Tea (000kg) 716 980Tobacco 3.8 2.7
Meat:Beef 32.7 38.0Goat-Sheep 13.9 17.5Pork 6.1 8.9Poultry 1.1 5.2
Industrial fishing 152/ 30.8Traditional fishing 55 70.0
g Includes palm oil and palm kernel oil for East Cameroon.2 Latest available data./ .Latest available data, includes Mission estimates for West Cameroon.Latest available data, includes calendar-year data for West Cameroonand campaign-year data for East Cameroon.
j 1967 calendar year.
Sources: Second Five Year Development Plan and sources listed inTables 6 - 10.

Table 12: CAMEROON: PRODUCER PRICES ESTABLISHED BYTHE AGRICULTURAL STABILIZATION FUNDS /
(CrAF per kilo)
1960/61 1961/62 1962/63 1963/6h 196h/65 1965/66 1966/67 1967/68
Cocoa
Superior n.a. n.a. n.a. 75 85 55 65 65Average n.a. n.a. n.a. 72 80 45 55 55Inferior - - - - - 20 25 25
Cotton
White grain 27 28 28 28 28 28 28 28Yellow grain 27 28 28 28 28 28 28 28Unsorted 26 - 26 26 26 26 26 26 26
Coffee Robusta - 96 90 105 127 100 115 n.a.
Groundnuts 27 28 28 27 27 26 25 24
T/ There is also a fund for coffee arabica. It is currently levying CFAF 15 per kilofrom the Union des Cooperatives de Cafe Arabica de l'Ouest (UCCAO) and the Coop-Agrowhich market the product.
Source: Ministry of Commerce and Industry.

Table 13: CAMEROON, PRICE PROJECTIONS FOR MAJORAGRICTJLTURAL EXPORT PRODUCTS IN THE SECOND PLAXIZ
(in FCFA/t)
Product Producer Price F.o.b. Price1913/P, 1970/71 1963/6h 1970/71
Pananas 23,000 23,000 32,700 32,700Cocoa 70,000 55,0 122,000 107,000Coffee Arabice 17L,500 185,O00 n.a.Coffee Robueta 99,000 97,000 n.a.Colora 26,000 28,000 h1,600 _3,000Cotton 31,000 29,000 n.a.Groundnuts 21,000 18,000 39,hOO l,00OKola nuts 90,000 90,000 120,000 120,000Palm kernels 18,000 19,000 33,000 3L,200Palm oil ù0,500o 38,000 b5,000 n.a.Pepper 17C,000 200,000 200,000 230,000Rubber 64,OOO 70,000 n.a.Tea 120,000 120,000 n.a.Tobacco wrappers 182,000 190,000 538,000 57?,000Tobacco filters 60,000 55,000 115,000 110,000
Source: Second Five-Year Development Plan

Table 14: CAMEROCN, TOTAL NUMBER OF MOTOR VEHICLES
(registered montor vehicles excluding motorcycles and. motorcyclettes)
Beginning of East Cameroon West Cameroon Federation % Increase-Year
1949 71J 5 20 765 n.a.1950 1,152 38 1,190 561951 3,045 48 3,093 160
1952 4,893 78 4,971 611953 6,675 92 6,767 361954 8,773 113 8,1861955 12,240 171 12,411 4o1956 13,553 259 13,812 il
1957 15,866 384 16,250 l81958 li,372 650 19,022 171959 20,661 917 21,578 1i1960 22,788 1,499 24,287 1$.1961 25,821 2,021 27,842 151962 29,623 2,603 32,226 161963 32,605 3,581 36,186 121964 36,709 3,836 40,545 121965 40,650 (e) l4,400 (e) 45,050 (e) 11
1966 44,600 (e) 4,900 (e) 49,500 (e) 101967 48,500 (e) 5,400 (e) 53,900 (e) 9
Sources: Societé Générale de Traction et d'Exploitations for data up to 1964;1965 and 1966 - Mission estimates based on registration data and
a.ssumed annual retirement equivalent to about 10%oof new registrations;
1967 - Mission estimates based on oral information of the Secrttariatd'Etat aux Travaux Publics.

Table 15: EAST CAMEROON, REGISTRATION OF MOTOR VEHICLES AND TRANSPORT CAPACITY(private and government vehicles)
1959 1960 1961 1962 1963 196h 1965 1966
Annual Registratians of:
Passenger cars 998 865 1,362 1,986 2,265 2,205 2,420 2,563Motorcycles 181. 108 .66 50 59- 80 104 liiBuses: 263 230 302 280 240 286 285 219Delivery vans 646 570 834 927 875. 868 1,004 875Trucks 350 h56 879 926 585. 675 553 565Special vehicles 12 4 8 8 4 1 1h 10Tractors 23 18 32 28 34 31 24 53Trailers 10 23 23 62 33 49 69 41Heavy equipment 9 1 4 15 7 23 14 73
Total 2,492 2,275 3,510 4,282 4,102 4,218 4,487 4,510
Transport Capacity 1967 1967
Taxis in service (No.):î/ Trucks-/in service (total t):3Douala 700 North 1,300Yaounde 600 West 725Bafoussam 30 Center-South 5,300Nkongsamba 30 Coastal 3,800Garoua 4 East 46
Total 1,364 11,171
1/ Estimates of the Ministry of Public Works, East Cameroon only.2/ Trucks registéred for commercial transports for third account.3/ By Federal Inspection, East Cameroon only.
Source: Sécrétarial d'Etat aux Travaux Publics, partly estimates.

Table 16 CAi_R0H, IN-VEIIT IY OF ROADS AKD HIC-HwAYS(in km., as of Jaly 1, 1966)
Classification:/L Asphalt A 3 C D Total
North-Souuh Axis(inc'. Douala -YaoundéN'Gaounddré) 412 420 1,026 251 - 2,109
East-West LinksDouala-Buea-Victoria andYaoundé-Bafoussam-Bamenda 13 - 3h6 - - 364
52ransverses andsecondary roads 621 831 1.,598 422 3,926
Feeder and TertiaryRoads ,2 - 229 2,518 4,246 7,025
Ncn- Classified Roads(responsibility of
the comnuni'ies) - - - - 17,000 17,000
Totals 916 1,041 2,1032 4,367 21,668 30,42ù
/1 Categories A - D = classification of roads according to their eeneralcondition, A best, D worst.
Source: Direction des Travaux Publics et de la Circulation Routière.

Table 17: CAMEROON, VEHICLE OPERATIMG COSTS(in U.S. ¢/km, excluding taxes)
Tye of Road Cars Del.ivery vans and Buses Trucks (6.,5 t) Trailers (20-22 t)
Asphalt 10 14 20 20 34Stabilizedearth 12 18 26 26 51
Earth 14 22 30 30 65Track 18 26 40 40 81
Source: L'Brochet, based on SEDES, BCEOM and Ingeroute data on Cameroon andNiger.

Table 18: CK'IRION, .AILROAD TÎRAFFIJ AND BASIC STATISTIGS -
12 Months 1960 July-December1956 1957 1958 1959 + 6 m4onths 1961 1961/62 1962/63 1963/64 196b/65 1965/66 1966/67 1966 1967
NJumber oai ,assengers (000) 1,245 1,216 1,467 1,419 2,024 1,381 1,425 1,299 1,281 1,290 1,399 731 731PassQngrr-ki1ometers (million) 82.4 87.2 104.9 94.1 137.5 99.3 116.3 114.4 114.4 119.3 135.9 71.8 .76.0Avirage distance of triD (Xm) 2/ 66.1 71. 7 71.5 66.2 67.9 71.9 81.5 88.1 89.2 92.4 97.1 98.3 103.9ievenu~ per passenger-km (LIS cents) 1.0 0.9 1.0 1.1 1.0 1.0 1.1 1.1 1.1 1.2 1.2 1.2 1.2
Friight tons (000) 548 635 766 722 1,137 803 839 880 958 928 936 434 500Ta;-ki1omevers (iaillion) 2/ 97.1 109.1 127.9 119.2 195.8 134.2 142.7 157.7 173.1 176.0 181.5 79.5 98.1;;.rage distance/ton (km)-' 177.2 171.8 166.8 165.0 171.8 167.0 170.1 179.1 180.6 189.8 193.8 182.9 196.3.t ,uc, r.tu ton/k.m (US cents) 3.5 3.5 3.3 3.8 3.3 3.5 3.3 3.4 3.5 3.5 3.5 3.7
; r,g;h oE notwork (',m) 517 517 517 517 517 517 517 517 517 532 532 532 532
?oliing aJoG': 6/30/1962 6/30/1963 6/30/1964 6/30/1965 12/31/1966 12/31/1967
a. ornoç7ves 56 55 533e1f-prcp-l1ed car;s n.a. 14 19.oach:-s 63 60 58`'aU a-na baggage cars il 12 12! reirht cars 725 828 864ipecial cars n.a. 76 86jer: ice cars 88 116 121
!'echn-a:; assistance 57 48 43 40 40 39..-rrannen: staff 750 749 768 744 743 7441-i.i Lia^r- s taff 2,059 2,045 1,941 2,218 2,175 2,144
To al 2,866 2,842 2,752 3,002 2,958 2,924
2/-. 935
-1595' calendar àears, 1961/62-1966/67 fiscal years (JuLy 1-J,e 30). - Averages may shcw apparent inac .racies because of rounding of the two inputs.
* .::: I gie d is 'hermins de Fer du Dasero,n.

Table 19: CAMEROON, PORT TRAFFIC
lybu l1Yb 1962 1963 1964 196N 1966 1967
DoualaShip calls:
Merchant marine 828 889 1,013 974 1,002 1,001 1,049 1,315Fishing vessels n.a. n.a. n.a. n.a. 548 565 520 566All other n.a. n.a. n.a. n.a. 205 247 183 355
Passengers (000) 1/Arrivals 4.9 4.4 5.0 4.5 3.9 2.9 2.8 3.0Departures 6.0 4.5 4.1 4.3 5.0 4.3 4.0 3.4
FMEIGHT (in 000 t )
Douala 1/Arrival tons 411 4,3 518 537 607 659 652 832Departure tons 356 440 438 490 510 515 521 -553
Kribi 1/Arrival tons 7 9 12 10 13 1i il 12
Departure tons 33 31 30 31 28 42 50 61
GarouaArrival tons 16 25 21 28 32 37 27 2Departure tons 13 26 18 32 30 25 35 -
Victoria/TikoArrival tons 65 54 62 60 71 74 64 n.a.Departure tons 232 211 147 110 101 98 70 n.a.
TotalsArrival tons 499 581 613 635 723 781 754 (846)Departure tons 634 708 633 663 669 680 676 (614)
1/ International traffic only2/ The war in Nigeria has practically closed off the port of Garoua
Sources: Port of Douala, Capitainerie-C.D.C reports, Wharf AuthorityBulletin de la Statistique Generale

Table 20: CAI4ERDON, COMMERCIAL AIRPORT TRAFF;C, 1963-1967
1963 1964 1965 1966 1967
Plane Moveients /1
Douala 9,699 10,356 10,527 12,208 18,869Yaoundé 2,529 3,4e12 3,520 4,605 4,390Tiko n.a. 5,629 5,600 5,865 6,344Garoua 1,195 1,653 1,930 1,842 1,947N'Gaoundere 1,318 1,607 1,737 1,930 1,904Secondary Airfields /2 n.a. 2,563 2,804 2,705 2,521
Passengers (A + D, 000) /3
Douala 107.7 105.0 125.6 137.3 152.5Yaounde '41.4 -49.8 56.9 64.4 70.3Tiko n.a. 10.7 14.0 17.2 20.9Garoua 6.4 8.3 9.2 10.1 12.7N'Gaoundére 3.0 4.3 4.7 5.3 5.8Secondary Airfieldes n.a. 9.8 10.7 14.3 13.9
Freigh (A + D, 000 t)/4
Douala 8.7 8.4 9.0 U. 1 13.2Yaounde~ 1.5 1.6 1.6 1.9 19.1Tiko n.a. 0.2 0.1 0.1 0.2Garoua 0.6 1.0 0.8 1.1 1.1N'Gaoundéré 1.4 1.4 1.2 1.0 1.2Secondary Airfields n.a. 0.8 0.7 0.8 1.0
Mail (A + D, t)
Douala 921 785 744 665 628Yaounde 130 144 152 156 185Tiko n.a. 17 21 20 22Garoua , 16 22 20 26 31N'Gaoundere 7 10 1l 13 17Secondary Airfields n.a. 32 26 38 40
/1 Commercial flights only. /3 Excludes transit and non-paying passengers.72 Maroua, Foumban, Kribi, Yagoua, 7L Excludes non-paying freight.
Batouri,in order of their iÙportance-as of 1967 (plane movements). Source: ASECNA
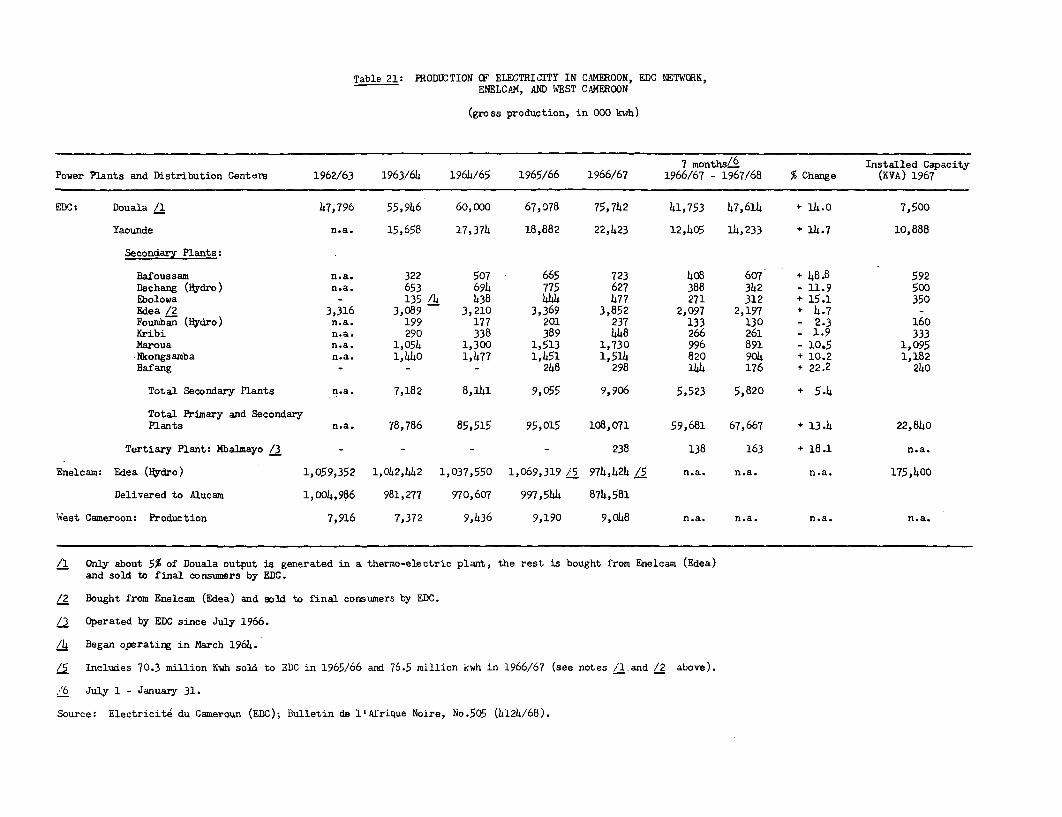
Table 21: FRODUCTION CF ELECTRICITY IN CAMEROON, EDC NETWORK,ENELCAN, AND WEST CAMEROON
(gross production, in 000 kwh)
7 months/6 Installed CapacityPower Plants and Distribution Centers 1962/63 1963/64 1964/65 1965/66 1966/67 1966/67 - 1967/68 % Change (KVA) 1967
EDC: Douala /1 47,796 55,946 60,000 67,078 75,742 41,753 47,614 + 14.0 7,500
Yaounde n.a. 15,658 17,374 18,882 22,423 12,405 14,233 + 14.7 10,888
Secondary Plants:
Bafoussam n.a. 322 507 665 723 408 607 + 48.8 592Dschang (Hydro) n.a. 653 694 775 627 388 342 - 11.9 500Ebolowa - 135 /4 438 444 477 271 312 + 15.1 350Edea /2 3,316 3,089 3,210 3,369 3,852 2,097 2,197 +4.7Foumban (Hydro) n.a. 199 177 201 237 133 130 - 2.3 160Kribi n.a. 290 338 389 448 266 261 _ 1.9 333Maroua n.a. 1,054 1,300 1,513 1,730 996 891 - 10.5 1,095Nkongsamba n.a. 1,440 1,477 1,451 1,514 820 904 + 10.2 1,182Bafang -- - 248 298 144 176 + 22.2 240
Total Secondary Plants n.a. 7,182 8,141 9,055 9,906 5,523 5,820 + 5.4
Total Primary and SecondaryPlants n.a. 78,786 85,515 95,015 108,071 59,681 67,667 + 13.4 22,840
Tertiary Plant: Mbalmayo /3 - - - - 238 138 163 + 18.1 n.a.
Enelcam: Edea (Hydro) 1,059,352 1,042,442 1,037,550 1,069,319 /5 974,424 /5 n.a. n.a. n.a. 175,400
Delivered to Alucam 1,004,986 981,277 970,607 997,544 874,581
West Cameroon: Production 7,916 7,372 9,436 9,190 9,048 n.a. n.a. n.a. n.a.
/1 Only about 5% of Douala output is generated in a thermo-electric plant, the rest is bought from Enelcam (Edea)and sold to final consumers by EDC.
/2 Bought from Enelcam (Edea) and sold to final consumers by EDC.
13 Operated by EDC since July 1966.
/4 Began operatirg in March 1964.
/5 Includes 70.3 million Kwh sold to EDC in 1965/66 and 76.5 million kwh in 1966/67 (see notes /1and /2 above).
/6 July 1 - January 31.
Source: Electricité du Cameroun (EDC); Bulletin de l'Afrique Noire, No.505 (4124/68).

Table 22 : CONSUMPTION OF ELECTRICITY IN CAMEROON
(EDC Network and dest Cameroon; in 000 kwh)
Domestic Other Motor Power EDC's Own Totaland Office Public Household and Small Con- Low HighLighting Lighting Uses Business sumption Tension Tension Total
EDC Network
1963/1964 - Douala 6,353 1,724 19,609 1,901 n.a. (29,587) 16,888 46,475Yaoundé 4,389 544 3,798 246 n.a. (8,977) 3,530 12,507Secondary Centers 1,575 358 2,520 716 n.a. (5,169) 734 5,903Total 12,317 2,626 25,927 2,863 n.a. (43,733) 21,152 64,885
19b4/1965 - Douala 7,811 2,039 20,359 1,944 n.a. (32,153) 18,986 (51,139)Yaoundé 5,109 510 2,789 1,440 n.a. (9,848) 3,706 (13,554)Secondary Centers 1,749 421 2,595 528 n.a. (5,293) 1,189 (6,482)Total 14,669 2,970 25,743 3,912 n.a. (47,294) 23,881 (71,175)
1965/1966 - Douala 7,248 2,212 21,253 1,849 1,234 33,796 23,135 56,931Yaoundé 5,704 487 3,132 1,781 114 11,218 3,936 15,154Secondary Centers 1,870 463 1,817 935 138 5,223 2,660 7,883Total 14,822 3,162 26,202 4,565 1,486 50,237 29,731 79,9681966/1967 - Douala 7,628 2,511 20,994 1,983 1,681 34,797 28,931 63,728Yaounde' 6,347 567 3,790 2,237 131 13,072 5,348 18,420Secondary Centers 1,964 551 785 970 158 4,428 4,260 8,688Tertiary Center /1 99 24 - 46 7 176 - 176Total 16,038 3,653 25,569 5,236 1,977 52,473 38,539 91,012
Domestic Uses Public Lighting All Other Uses Total
West Cameroon
1963 1,848 67 4,889 6,8041964 2,201 603 5,112 7,9161965 1,981 588 4,961 7,5301966 1,898 206 5,o64 7,1681967 (3 months) 504 29 1,241 1,774
/1 Operated by EDC since July 1966 (Mbalmayo).
Sources: EDC; Bulletin de la Statistique Genérale; Statistical Service, Buea.

Table 23: CAMEROON, SUMM4RY OF PROVIgIÎM-OF IRVEMENT CODE (LAW NO. 60/64
OF JUNE 27, 1960, AND LAW NO. 64-LF-6 OF APRIL 6, 1969)bSPkrIAL PROVISIONS AVAILABLE
TO SMALL- AND MEDIUM-SCALE SCHEDULESENTERPRISES
Tax Concessions A B C D
Import duties Exemption on specified goods Exemption on specified Exemption on speci- Exemption on speci- Exemption on speci-goods up to 10 years fied goods up to fied goods up to fied goods up to
10 years 10 years 10 years
Export duties No exemption May be reduced May be reduced May be reduced May be reduced
Single tax No exemption, but may be Three-year exemp- Three-year exemp- Three-year exemp- Three-year exemp-granted benefits of tion tion tion tionsingle tax system
Income taxes No exemption No exemption Five-year exemption Five-year exemption Five-year exemption(In addition, depreciation for first five years can beused as tax shield during following three years, ifauthorized)
Business license tax No exemption No exemption Five-year exemption Five-year exemption Five-year exemption
Land, mining, and No exemption No exemption Five-year exemption Five-year exemption Five-year exemptionforestry fees
Special Guarantees
Tax stability No guarantee Not liable to new Not liable to new Not liable to new No changes in basisimport or export import or export import or export of asa8esmoewt% ratestaxes for 10 years taxes for 10 years taxes for 10 years or methods of collec-
tion for 25 years,p-ùUB start-up graceperiod up to 5 years.
Transfer of earnings and No restrictions at present, but no guarantee against restrictions Transferability Transferabilityrepatriation of capital in the future guaranteed guaranteed
(Continied)

-2-
Table 23: CAMEROON, SUMMARY OF PROVISIONS OF INVESTMENT CODE (LAW NO. 60/64OF JUNE 27, 1960, AND LAW NO. 64-L,-6 OF APRIL 6, 1969).
SPECIAL PROVISIONS AVAILABLETO SMALL- AND MEDIUM-SCALE SCHEDULESENTERPRISES
Special Guarantees A B C D
Freedom-in hiring policies No restrictions at present, but no guarantee against restrictions Guarantee against any restrictions other(including unrestricted in the future than those covered under "specialuse of foreign personnel) obligations" (below)
Other None None None 1) Legal, economic, and financial stability.2) Stable conditions for marketing of goods.3) Free choice of suppliers.4) Renewal of forestry and mining operating
permits.5) Facilities for the use of hydraulic, electric
and other resources required for operations.6) Facilities for conveying products to the
place of shipment and the use of installa-tions at the place of shipment.
Special Obligations None None None Minimum equipment and production programs,vocational training, and development oflocal staff, welfare programs, etc.
Settlement of Disputes No provision No provision No provision Arbitration Arbitration
Duration of Agreement Not specified Not more than 10 Not more than 10 Not more than 25 Not more than 25years years years years

Table 2h: EVOLUTION 0F PEJFUANENT E4PLOYUENT IN EAST CAMEROON, BY MAJOR SECTORS,AND A4OUNTS OF SALAEESM DISTRIBUTED, 1964-66
(Xistributed salaries in million CFAF, average salaries in CFAF)
1964 1965 1966
Average Average AveragePermanent % of Salaries Annral Permanent % of Salaries Annual Permanent % of Salaries Annual
Sector Employees Total Distributed Salay Employees Total Distributed Salary Employees Total Distributed salary
Public 27,097 26.1 n.a. n.a. 26,601 25.1 n.a. n.a. 27,h90 25.0 n.a. n.a.
Private:
Primary 21,645 20.9 1,56l.5 72,000 19,916 18.8 1,492.3 75,000 20,871 19.0 2,075.4 99,000Secondary 17,787 17.1 3,919.0 220,000 20,393 19.3 4,580.8 225,000 24,911 22.7 5,239.4 210,000Tertiary 37,202 35.9 6,747.9 181,000 38,970 36.8 7,o56.7 181,000 36,571 33.3 8,061.2 220,000
Sub-total 76,631, 73.9 12,228.4 160,000 79,279 74.9 13,129.8 166,ooo 82,353 75.0 15,376.0 187,000
Total 103,731 100 n.a. n.a. 105,880 100 n.a. n.a. 109,843 100 n.a. n.a.
Source: Rapport sur les Statistiques du Travail pour le Cameroun Oriental Année 1966, Ministère du Travail et des Lois Sociales.

Table 25: CAMEROON>, EXPENDITURES CN GDP(at current market prides)
(in billions Of CFAF)
1959 1962/63 1963/64 1964/65 1965/66 1966/67
Conmumption 96.o 131.3 140.4 145.9 155.5 17Q.8
private 80.3 109.6 117.2 117.5 12h.2 133.5
public 15.7 21.7 23.2 28.4 31.3 37.3
Investment 11.9 15.2 17.2 25.0 29.1 26.6
private 6.6 10.0 U1.1 16.6 18.6 16.1
public 5.3 5.2 6.1 8.4 10.5 10.5
Net Ecports 5.7 -1.8 -1.J. -2.8 -4.< -3.9
GDP 113.6 144.7 168.1 180.1 U3.5
Savings 17.6- 13.4 16.1 22.2 24.6 22.7
Sources: 1959-1963/64: Previous economic report (AF-48)1964/65: Direction de la Statistique, with minor adjustments
by mission1965/66-1966/67: Mission estimates. The mission did not find sufficien
information to estimate expenditures in 1967/68.

Table 26: CAMEROON: SECOND FIVE YEAR PLAN -
BREAKDMIN OF PUBLIC AIND PRIVATE INVESTMENT(in billions of CFA francs)
Public Private Total Percentage
General Studies 2.28 - 2.28 1.4
ProductionAgriculture 11.56 10.83 22.39 13.5Livestock 1.85 0.06 1.91 1.1Fishing 0.37 1.69 2.06 1.2Forestry 1.09 4.90 5.99 3.6
Energy, Mines, Industry 3.84 35.58 39.41 23.9Tourism, Commerce 0.96 2.70 3.66 2.2
Total 19.67 55.76 75.42 U7W7
InfrastructureRoads, Bridges 15-55 1.00 16.55 10.0Ports, Waterways 1.62 - 1.62 0.9
Aviation, Meteorology 2.37 - 2.37 1.4
PTT 1.75 1.05 2.80 1.7Railways 18.44 - 18.hL 11.2
Motor Transport 0.15 16.03 16.18 9.8Total 39.77 1-.O 57.95 35.1
Social ServicesPublic Health 3.70 0.35 ù.05 2.5Education 7.19 2.73 9.92 6.0Youth, Sports 0.47 - 0o.7 0.3Housing, Urban Services 7.88 3.70 11.58 7.0
Total 19 24 6T78 26.02 15.8
Information 0.85 0.85 0.5
Administrative Equipment 2.65 - 2.65 1.6
Grand Total 8h.56 80.62 165.18 100.0
Source: Federal Republic of Cameroon, The Sécond Five Year Plan

Table 27: CAMRROON, CC!SOLIDATED FEDERAL AND. FEDERATED BUDGETS
(in billions of CFAF)
1962/63 1963/64 1964/65 1965/66 1966/67 1967/68 1967/68 1968/69(ACTUAL) (PROVISION) (REVISED EST.) (PROVISION)
CURRENT REVENUEFederal 13.79 18.37 20.00 21.?7 22.52 24.03 26.00 21.53East 5-.90 6.71 .-5 9.BO 10.38 11.00 10.66
Less federalsubventions - 035 .88 1.30 1.28 1.00 1.00 0.65
5.,90 -Zi- =.O -7.21 -=2 -9 2 10.00 10.01
West 1.82 2.00 1.84 2.47 2.43 2.82 2.67 2.76Less federal
subventions 1.27 1.36 1.20 1 1.55 1.80 1.80 1.600.55 o.64 o.6 _ 0.72 o.88 1.02 1_16
TOTAL REVENUE 2 2 .3 2 .2 31.92 P3__ _____
CURRENT EIPENDITUREYederai (less sub-
ventionis_tostates) 11.82 12095 14.86 16.24 19.39 20.08 20.83 22.39East 6.22 6.93 7.65 8.34 8.96 9.56 9.60 10.33West 1.7 1.80 1.90 2.12 2.29 2.67 2.36 2. 6TOTAL MRRENT 19.61 21. 2 26.70 30.64 3 32.79 35.2t
'XPEI\DITURE
CURRENT LiRFI-US ô.63 â 2.83 3.00 1.29 2.12 4.08 3.42
Debt Service / 0.52 0.47 0.41 0 0. 4 0.40 0.57 0.57 0.59
BALANCE 0.11 322 2.42 0. 8 2.83
CAPITAL EXPENDITURE/2Federal o.88 1.44 1.50 2.93 2.81 2.73 2.63 3.603East 0.40 0.35 0.23 0.78 o.68 0.82 0.72 0.56West 0.33 0.37 0.34 0.42 .0.28 0.35 0.20
TCTAL 1.61 2.16 2.07 :.13 3.77 .90 3.=
OVERALL BUDGETSURPIUS { EFICIT) (1.50) 1.06 035 (1.54) (2.89) 2 (0.04) (1.53)
FINANCED BY -Foreign subventions +1.75 - +0.50 +1.00 - -
Drawing on theTreasury(drawing +) +0.12 -1.32 -0.81 +1.24 +3.95 +2.35 +0.24 +0.03
Drawing on the, BCD(draming +M) -0.36 +0.26 -0.04 -0.70 -1.06 - -0.20 +1.50
L/ It bas not been possible to separate interest and amortization. Since the latter are the larger, total debt
service payments bave been considered as falling outside current expenditure.
2 Official figures for the Faderal and nast Cemeroon budgets include tranafers to the Caisse des Investissementof the BCD for expenditre at a later date. These have been-deducted from the official expenditurefigures, while the draw-down of deposits in the Caisse for authorisations of earlier fiscal years have beenadded, to obtain ectual capital expenditures on budgetary account.
13 Camprises a) 2.30 billion CFA lin the investment budget properj b) an estirated 0.70 billion CFA forprojects authorised in previous fiscal years,. to be financed aut of deposits in the Caisse des Inves-tissement of the BCD; c) 0.60 billion CFA in a special investment budget, to be financed out of idlefunds lin the Caisse des Investissements, which are not otherwise earmarked. These funds haveaccuzmlated owing both to payments errors and to the completion of proajecta without using all thefands earmarked.
/b The minus items indicate the excess of transfers to the Caisse des Investissements of the BCD over drawings.
Source: Budgets and Accounts of the Federal and Federated Governments, and information obtained from theCameroon Development Bank (BCD).

Table 28: CAHEROON, REVENUE AND CURRENT EXPENDITURFSOF THE FEDERAL AND FEDERATED GOVERNMENTS
(in billions of CFAF)
1962/63 1963/64 1964/65 1965/66 1966/67 1967/68 1967/68Actual Provision Rev. Estimate
CURRENT REVENUEDIRECT TAXES 4.80 5.68 5.72 6.32 7.76 8.30 na.
INDIRSCT TAXES/A 12.29 16.69 18.16 19.84 20.49 21.18 n.a.Import dutie.2 8.21 11.70 13.44 15.20 15.47 15.68 n.a.Export duties 2.72 3.17 3.4i 3.35 3.34 3.38 n.a.Domæstic taxes 1.36 1.82 1.31 1.29 1.68 2.12 n.a.
FEES AND DUES 0.88 0.95 1.10 1.22 1.30 1.41 n.a.
OTHER RECEIPTS 2.27 2.05 2.26 2.32 2.37 3.54 n.a.(including FTT)
TOTAL 20.24 25.37 27.24 29.70 3.2 3 36.87
CURRENT EIPE1NDITURESL2Genaral administration 10.19 11.70 12.22 13.24 14.91 14.79 n.a.and economic affairsEBducation and Health 3.79 3.90 4.44 5.08 6.02 6.35 n.a.National defense 3.39 3.27 3.54 3.81 4.33 4.70 n.a.Public works, Transport,Mines and PTT 1.75 2.25 2.31 2.50 2.74 2.94 n.a.
P#nsions 0.09 0.15 0.14 0.14 0.19 0.13 n.a.Contributions and 3ibsidies 0.140 0.41 1.76 1.93 2.45 3.4° n.a.
TCTAL 19.61 21.68 24.41 26.70 30.64 32.31 2.
/ No breakdown of indirect taxes is given in the Comptes Définitifs. The breakdown shown here is derived,on a proportional basis, froe the budget provisions./2 Including the tax on business transactions, since practically all the proceeds from it came froimport transactions.1 See Table 27, footnote 1.Source: Budgets and Accounts of the Federal and Federated Governments.

Table 29 : CMMOON - MONETARY SURVEY(in bLUion of CFAF)
1961 1962 1963 1964 1965 1966 1967 1968Xarcb June Sept. Dee. Marcb Jun Sept. De. Jan. Febf. Msrch
Total Foreign Assets 3.1h2 5.71 5.54 7.02 5.12 6i3 6.12 5 8 6.32 7.70 5.91 3.31 2.72 2.28 .33 546
Central Baric Assets (<rt) 5.01 6.60 8.33 8.77- 6.43- 7.51 8.76 8.10 8.30 10.15 8.23 6.18 5.87 5.52 8.15 9.22
Conmmercial and DevelopmentBania' Assets (net) -1.59 -.89 -2.79 -1.75 -1.31 -1.14 -2.64 -2.27 -1.98 -2.45 -2.29 -2.87 -3.15 -3-24 -3.82 -3.76
Domestic Credit 12.114 15.89 15.50 17.38 19.77 20.24 18.72 19.31 23-60 25.28 24.97 25.45 28.56 30-79 31.75 31.36
Claims on Government -3.46 -3.82 -7.88 -9.39 -7.56 -9.79 -9-90 -7.44 -6.13 -7.94 -6.88 -6.46 -5.62 -5.57 -6.50 -7.26
Claims on private sector 15.60 19.11 23.38 26.77 27.33 30.03 28.62 26.75 29-73 33.22 31.85 31.91 34.18 36.36 38.25 38.62
Money 114.39 18.18 18.90 20.99 21.20 23.9 2095 21.61 25.91 28.27 26.03 23.88 27.08 28.34 29.OL. n.a.
- Currency in circulation 8.38 10.07 11.28 121.83 10.77 11.81 10.30 10.58 l.146 15.70 13.85 12.33 14.64 15;97 16.50P. n.a.
Deposits 6.01 8.11 7.62 9.16 10.43 11.38 10.65 21.03 ii.h5 12.57 12.18 11-55 12.44 12.37 12.50& n.a.
*uasi Money 0.52 1.29 1.75 2.04 2.29 2.18 2.26 2.37 2 25 .52 2.74 2.76 2.89 2.93 3.00 2.96
Other Items (net) o.65 -2.13 0.38 1.36 17 0.24 1.40 1.16 1.66 2.19 2.14 2.12 1.31 1.79 4.08 n.a.
G Inoludes deposits with postal checking aysten.atimate.
Source: International Financial Statistics andBanque Centrale - Etudes et Statistiques.

Table 30: CAMEROON - INDUSTRIAL CLASSIFICATION OrDECLARED LOANS AND ADVANCES [1
(In Millions of CFA Francs)
At December 311962 % 1963 % 1964 % 1965 % 1966 % 1967 %
Short-termAgriculture 553 3.8 527 3.0 -419 2.1 621 3.0 1,139 5.1 1,0o5 3.8Electricity-water - - 4 0.0 .4 0.0 - - - - -Extraction of petrol 22 0.1 - - - - _ _ _ _ _Industry - textile 302 2.1 623 3.6 549 2.8 724 3.5 469 2.1 603 2.2
- wood 252 1.7 288 1.7 299 1.5 387 1.8 >55 2.0 305 1.1- other 357 2.L 616 3.5 359 1.8 596 2.9 882 4.o 1,162 2
Building, P.W. 573 U.0 1,216 7.0 1,190 6.o 1,507 7.3 1,435 6.4 1,885 6.8Transportation 728 5.0 881 5.1 1,105 5.6 983 4.8 1,353 6.1 1,528 5.5Exports 3,507 2>.5 4,055 23.3 5,514 27.9 5,033 24.5 5,942 26.7 8,627 31.2General Commerce 7,413 51.9 8,470 48.7 9,507 48.1 10,186 49.6 10,069 45.2 11,472 41.4Services 57h 4.O 698 4.o 812 4.1 514 2.5 534 2.14 1,04 3.8
Total 14,281 100.0 17,378 100.0 19,758 100.0 20,551 100.0 22,278 100.0 27,680 100.0
Medium and Long-Tern<2Agriculture 79 2.3 1,318 20.7 1,150 18.4 1,184 18.5 1,124 17.0 1,020 14.0Mining and
Industry 3,238 93.9 3,134 49.3 2,983 47.7 3,163 49.5 3,235 49.o 4,165 56.4Building 67 1.9 1,878 29.5 2,065 33.0 1,910 30.5 2,052 31.1 1,851 25.3Other 62 1.8 33 0.5 57 0.9 126 2.0 186 2.8 269 3.7
Total 3,447 100.0 6,363 100.0 6,255 100.0 6,393 100.0 6,597 100.0 7,305 100.0
/1 Declared to "Centrale des Risques".r2 In 1962 and 1963 only medium-term loans are included.
Source: Banque Centrale-Etudes et Statistiques.

Table 31: CAMEROON DEVELOPMENT BANK - NEWLOAN COMMITMENTS BY CATEGORY
(in millions of CFA Francs)
1961/62 1962/63 1963/64 196 4/65 1965/66 1966/67
Agriculture
Marketing credits 555 1,153 1,073 1,100 2,284 2,166Loans for development 544 646 145 197 110 110
Real Estate 881 599 583 67 501 433
Craft-work and Profes-sions 73 108 61 7 25 7
Industry 217 74 310 75 444 647
Consumer Credit 87 148 132 41 56 32
Commerce - 13 38 5 - 4
Public Institutions 56 61 _ _ 108 130
Total 2,413 2,802 2,343 1,493 3,528 3529
Source: Cameroon Development Bank, Annual Report for 1966/67.

Table 32: CAMEROON DEVELOPMENT BANK - LOANS AND INVESTMENTS OUTSTANDING
(in millions of CFA Francs)
1/June 30, 1961 June 30, 1963 June 30, 1965 June 30, 1967 March 31, 1968Amount % Amount % Amount % Amount % Amount
Loans and Advances.
Long-Term 767 43% 1,181 31% 1,067- 26% -1,458 35% 1,618 34%
Medium-Term 912 51% 1,718 46% 2,235 53% 2,097 50% 2,172 46%
Short-Term 106 6% 661 18% 649 16% 356 9% 648 14%
Total Loans & Advances 1,785 100% 3,560 95% 3,951 95% 3,911 94% 4,438 94%Equity Investments 8 ... 188 5% 231 5% 284 6% 314 6%
Total 1,793 100% 3,748 100% 4,182 100% 4,195 100% 4,752 100%
Agriculture, includingmarketing credit 414 23% 1,283 34% 1,441 34% 859 20% 916 19%
Real Estate 1,158 65% 1,786 48% 1,803 43% 1,562 37% 1,638 34%Consumer credit 45 2% 127 3% 129 4% 71 3% 89 2%
Commerce, Industry, Forestry,Public Institutions, Craft-work 176 10% 552 15% 809 19% 1,703 40% 2,109 h5%
Total, 1,793 100% 3,748 100% 4,182 100% 4,195 100% 4,752 100%
1/ Operating investments taken over from Credit du Cameroun
Source: Cameroon Developmuent Bank, Annual Reports and information provided.

Table 33: CA.;ERt)YT, COST OF LIVING INDICES
1959 1960 1961 1962/4 1963 1964 1965 1966 1967
1. General Retail Price lst. qu. 121.3Index for non-Camerooniatrn 2nd. qu. 121.9Household Consunption at ,3rd. qu.. 122.1Douala - -- - 4th. qu. 121.4
Base: Feb. 1963 - 100 85.5 90.8 91.8 9h.7 105.2 108.7 111.9 U8.9/3 121.7
2. General '.et(iail Price Index lst. qu. 116.3for non-Cameroonian House- 2nd. qu. 116.8hold Consunption at 3rd. qu. 117.4Yaounde 4hth. gu. 118.0
Base: Feb. 1963 =00/1 n.a. n.a. 89.9/3 92.8 102.7 108.5 110.9 113.5 117.2Base: March 1961 = 10072 n.a. n.a. 100.77- lC)400 115.0 121.5 12ù,.2 127.2 131.2
3. General Cost of Living lst. qu.-106.8Index at Victoria 2nd. qu. 111.1
Base: March 1965 = 100 n.a. n.a. n.a. n.a. n.a. n.a. 103.3 114.2 3rd. qu. 108.34th. gu. 113.6
109.9
/1 Adjusted from official base to facilitate comparison with Douala index.7- Official base.73 Based on 9 nmnthsl data and estimates for January, March and April.7E Data prior to 1963 have been adjusted from an old base period to the new one.
Sources: Bulletin de la Statistique Générale; Quarterly Economic Bulletin; Statistical Service Buea.

Table 34: CAMCROC4, PRINCIPAL EXPONTS BY VALUE AND VOIUME
(volume in thmssands of tons, value in l'Ions of C?AI)
1961 1962 1963 1964 95 1966 1967 1967Volume Value Volume Value Voume Value Volume Valie Volume Value v!- Tlue Volume Value Value in S
Cocoa
%sat 58.3 6,254 59.9 6,421 71.2 8,028 5j.9 6,293 69.2 6,497 71.1 6,445 65.5 8,879W 'est 7.3 497 6.4 557 12.6 942 5.1 593 8.6 812 5-9 643 4 3 592
Feder.tio,, 65.6 6,751 66.3 6,978 83.8 8,910 59.0 6,886 77.8 7,309 77.0 7,088 69.8 9,471 25.?
Goffee
East 35.5 5,121 38.1 5,216 40.1 5,880 44.7 8,303 42.9 6,653 59.4 9,527 56.6 9,597Vfest 4.3 650 3.0 529 7.2 6 5 1.04 5 1.189 7.4 1,371 6.6 l.235
Federation 39.8 5,771 41.1 5,745 47.3 6,52b 50.1 9,349 48.4 7,842 66.8 10,898 63.2 10,832 28.8
Bananas
East 51.3 821 52.4 842 55.3 887 61.1 979 68.8 1,102 46.8 749 34.4 550Wrest _8.4 1.989 81.3 1.577 47. -6 771 54.5 909 50.2 785 17.0O 182 14l. 166
Pederation 139.7 2,810 133.7 2,419 102.9 1,658 115.6 1,888 119.0 1,887 63.8 931 48.5 716 1.9
Palm Kernels
East 14.8 400 12.0 324 14.6 444 13.8 429 15.5 585 12.2 428 12.6 407'Wfest 2.5 61 2.5 523 4.6 150 6.1 192 6.o 209 4.0 125 4.7 12-9
Fedoration 17.3 461 14.5 382 19.2 594 19.9 621 21.5 794 16.2 553 17.3 536 1.4
Palm Oil
'est 6.2 267 3.6 149 4.8 194 8.7 414 12.9 755 5.7 228 9.8 457 1.2
Timber (Gross)
East 148.1 1,351 141.4 1,217 179.5 1,531 205.2 1,840 200.7 1,873 241.3 2,244 268.4 2,589Uest 116.0 911 89.0 636 45.0 325 50.0 450 31.1 288 19.5 176 1.2 10
Fedoration 264.1 2,262 230.4 1,853 224.5 1,856 255.2 2,290 231.8 2,161 260.8 2,420 269.6 2,599 6.9
Rabber
East 4.9 663 3.9 518 4.2 517 3.7 420 4.0 437 4.3 460 4.9 434'fest 4.2 592 4.1 542 3:; 948 5.5 686 6.5 783 5.5 595 6.8 663
-Federation 9.1 1,255 8.0 1,060 7.5 1,465 9.2 1,106 10.5 1,220 9.8 1,055 11.7 1,097 2.9
Cotton
East 10.3 1,1415 12.5 1,683 14.9 2,043 17.0 2,291 15.9 2,232 18.6 2,356 17.2 1,765 4.7
Groundnuts
East 9.9 387 7.8 317 17.7 717 18.1 662 10.6 423 5.4 230 3.1 131 0.4
Allldnum
Bast 46.o 4,798 51.0 5,294 52.3 5,471 48.7 5,116 46.1 4,933 46.6 5,096 480.04 5,100a 13.6
Other Exports 3,478 3,776 3,786 3,900 4,807 5,027 4,886
TOTAL EXPOllTS
!ast 24,203 25,126 29,117 30,037 29,276 32,416 314197 2West 5.482 4.530 4.161 4.486 5.87 3.466 3,393
Federation 29,685 29,656 33,278 34,523 34,363 35,882 37,590 100A-j _ ==e r
Adiusted et'orts a(30,285) (29,956) (34,778) (36,123) (35,363) (36,882) (38,590)
4 Official figure adjusted on the basis of company reporting.
42 Official figure adjusted to take into accoant adjustment of alucinum figure.
4 Total exports adjusted by mdision to take account of the valuation of certain exporta, notably bananas,at a fixed price by the Customs Authorities.
Source: Direction de la Statistique

Table 35: CAMEROON, IMPORTS
(in billions Of CFAF)
1963 1964 1965 1966 1967
East West Total East West Total East West Total East West Total East West Total
Foodstuffs, Beverages and Tobacco 3.40 1.18 4.58 3.42 0.99 4.41 3.59 1.05 6.64 3.35 0.98 4.33 4.61 0.62 5.23
Raw haterials 2.70 0.05 2.75 2.19 0.06 2.25 2.16 0.07 2.23 1.24 0.02 1.26 1.92 0.02 1.94
Of Animal and Vegetable Origin 0.31 0.01 0.32 0.29 0.01 0.30 0.37 0.05 0.42 0.33 0.02 0.35 0.56 0.02 0.58
Of Mineral Origin 2.39 0.04 2.43 1.91 0.04 1.95 1.79 0.02 1.81 0.91 - 0.91 1.36 - 1.36
Fuel/Lubricants 1.44 0.39 1.83 1.60 0.19 1.79 1.35 0.24 1.59 1.39 0.11 1.50 2.01 0.03 2.04
Semi Finished Products 3.12 0.56 3.68 4.13 0.53 4.66 4.68 0.51 5.19 4.76 0.35 5.11 6.55 0.39 6.94
Finished Products for Capital Equipment 4.51 0.52 5.06 5.06 0.53 5.59 7.80 0.56 8.36 8.01 0.56 8.57 9.78 0.29 10.06
Transport/Traction 2.04 0.15 2.19 2.28 0.15 2.43 3.42 0.14 3.56 3.11 0.21 3.32 4.16 0.10 4.26
Other Capital Equipment 2.49 0.37 2.86 2.78 0.38 3.14 4.38 0.42 4.80 4.89 0.35 5.24 5.62 0.19 5.81
for Agriculture 0.13 0.05 0.18 0. li 0.041 0.18 0.20 0.07 0.27 0.17 0.05 0.22 0.18 0.03 0.21
for Industry 2.37 0.32 2.69 2.64 0.34 2.98 4.17 0.35 4.52 4.72 0.30 5.02 5.44 0.15 5.59
Finished Products 11.53 2.12 13.65 12.18 1.96 114.14 13.40 1.97 15.37 13.56 1.79 15.35 18.90 1.30 20.20
ior Household Consumption 6.45 1.39 7.84 6.01 1.21 7.22 6.54 1.15 7.69 1.78 0.89 5.67 6.86 o.64 7.50
for Industrial Consumption 5.08 0.73 5.81 6.18 0.75 6.93 6.86 0.83 7.69 8.78 0.89 9.67 12.05 0.65 12.70
Total 26.73 4.84 31.57 28.59 4.26 32.85 32.98 1.1l1 37.39 32.31 3.80 36.11 43.78 2.64 46.42
Source: Quarterly Economic Bulletin and Osatoms Statistics.

Table 36 : CAMEROON - COMKODITY TRADE BALANCE BY AREAS
(in billions of FCFA)
1955 1959 1963 1964 1965 1966 1967
Exports
France 7.9 14.2 16.6 18i6 114.8 13.5 12.0iterling countries 2.5 3.4 2.7 2.0 1.6 1.4 0.9Dollar zone 1.9 2.8 1.8 2.3 33.3 5, 2 4 9EEC.(excl. France) 147 6.1 9a6 9.0 - l.3 10.5 13.7Other 2.8 5.5 2.6 2.6 3.4 5.3 6.0
Total : 19.8 32.0 33.3 34*5 34.4 35*9 37*5
Imports
France 11.4 12.3 15.7 17.3 19.>4 19.2 25.9Sterling countries 1.7 1.8 3.0 2.3 2.6 1. 1.5Dollar zone 1.6 1.8 2.5 2.4 3.2 2.5 2.1EE (Exci. France) 1.6 2.3 3.6 4.7 5'.9 6.7 7,3Other 3.0 3.7 6.8 6.2 6.3 6.6 9.6
Total 19.3 21.9 31.6 32.9 37.4 36.1 h6.4
Balance
France -3.5 +1.9 +0.9 +1.3 -14.6 -5.7 -13.9Sterling countries +0.8 +1.6 -0.3 -0.3 -1.0 +0.3 -o.6Dollar zone +0.3 +1.0 -0.7 -0.1 +0.1 +2.7 +2.8EEC (Excl. France) +3.1 +3.8 +6.0 +h43 +5.14 +3.8 +6.4Other .2 +1L8 -4.2 -3.6 -2P9 -1.3 l d
Total/1: +.5 +10.1 +1.7 +1.6 -3.0 -0.2 -8.9
/ Exports are based on the unadjusted official figures, except for a revision of the aluminunm figurefor 1967, See Table 34. Hence, the total trade balance does not correspond exactly to that shown in Table 38.
Sources: Bulletin de la Statistique GénéraleWuarterly Economic BulletinTrusteeship ReportsInformation provided by Direction de la Statistique

Table 17: G»MOCA]ROE, DISBURSEMENTS CF FOREDN AID
(in billions of CFAF)
1961 1962 1963 1964 1965 1966 1967
GRMNTS
T.A.;C.Budgetary support 3.37 3.05 1.75 -4/ 0.50 1.00 -Technical assistance 1.50 1.50 1.60 1.70 2.00 2.00 2.00Other 1.01 1.37 1.51 1.37 1.30 1.48 1.46
Total 55 5.92 47.8 3.07 37 .O .48 3.TW
F.E.D.First 0.05 0.76 1.05 1.81 2.59 2.28 1.62Second - - - 0 0.36 0.ho 0.57
Total 0.05 o 11-70 2.957 2.6 2.19
A*I.D. - 0.08 0.12 0.56 0.35 0.37 0.4o
U.N. 0.09 0.30 0.26 0.24 0.20 0.18 0.17
U.K. 0.04 - -:--- -
Total Grants 6.o6 7.o6 6.29 5.68 7.3o 7.71 6.22
LOANS3/
Caisse Centrale 0.82 0.51 o.46 0.38 0.31 0.82 0.47
F.E.D. - - - - - - 0.07
B.E.I. _ _ _ _ 0.30 0.30 0.30
A.I.D. - - - - 0.70 0.50 0.26
K.F.W. - - - - - 0.30 0.40
I.D.A. - - - - - - 0.12
Total Loans 0.82 0.51 o.46 0.38 1.31 1.92 1.62
'1OTAL AID 6.88 7.57 6.75 6.06 8.61 9.63 7.84
1J 1 billion CFAF in budgetary support was made available in fiscal 1963/64,but was only utilized in fiscal 1965/66.
/ Includes a smali amount of loans.2 Excluding disbursements on certain loans for which no information is
available - e.g. 207 million CFAF loan from U.K. in 1961.
Sources: Information provided by Cameroon Government, and by principaldonors; and Mission estimates.

Table 38: CAMEROON, BALANCE OF PAYMENTS
(in billions of CFAF)
196)2/ 1962 1963 1964 1965 1966 1967
Exports +24.8 +30.0 +34.8 +36.1 +35.4 +36.9 +38.6
Imports -23.7 -28.3 -31.6 -32.9 -37 .4 -36.1 -146.k4
Trade Balance + 1.1 + 1.7 + 3.2 + 3.2 - 2.0 + 0.8 - 7.8
Freight/Insurance - o.4 - 0.7 - o.8 - 1.0 - 1.2 - 1.4 - 1.5
Travel - 0.3 - 0.4 - 0.4 - 0.4 - 0.5 - 0.5 - o.6
Investment Income - 2.0 - 2.0 - 2.1 - 2.1 - 2.2 - 2.3 - 2.5
Other Services + 0.5 + 0.1 - 0.0 - 0.3 - 0.7 - 0.5 - o.6
Total - 1.1 - 1.4 - 0.1 - 0.6 - 6.6 - 3.9 -13.0
Transfer PaymentsPrivate - 4.1 - 3.6 - 3.1 - 3.1 - 3.2 - 3.3 - 3.4Official +5.5 + 6.6 + 5.7 + 5.1 + 6.7 + 6.7 + 5.0
Balance of Current Account + 0.3 + 1.6 + 2.5 + 1.5 - 3.1 - 0.5 -11.4
Capital TransactionsDebt Repayment - 0.2 - 0.4 - 0.4 - 0.4 - 0.4 - 0.5 - 0.5Official + 0.9 + 0.8 + 0.8 + 0.7 + 1.3 + 1.9 + 1.6Private and Errors and
Omissions - 0.1 - 0.3 - 3.1 - 0.2 + 0.3 - 2.2 + 6.631
Change in Foreign Assets _ 0.9 - 2.3 + 0.2 - 1.5 + 1.9 + 1.2 + 3.6
1/ Refers to East'Cameroon only. / Official figures adjusted for undervaluation of banana and tobacco exports.2/ (-) = increase, (+) = decrease.
bources: a) Exports and imports based on official figures, see Tables 34 and 35; b) Change in foreign assets,.see -Table 29; c) All other items.: Mission estimates based on information supplied by the CameroonGovernment and by the governments of the principal aid donor countries.

FEDERAL REPUBLIC L 1 COF CAMEROON
RAILWAYS M
Existiog MAIDUGURIEAU
- - ~... Under construction
Projected COTTON Under preliminary study
ROADS
Mair trunk, bituminized
Main trunk MOKOLO
Other main AOCATT I MAUA\T$ INTERNATIONAL AIRPORT LE COTTON
PORTS
. |SEASONAL RIVER SERVICES ,. |jU ) ~~~~~~~~~~~~~GROUNDNUTS -__
O 50 1 O o50 200 94KILOMETERS
/ \ 4V j- 1 pa iE ~~~~~~~~~~~~~MOUNDOU_
f}~~~~~~~~~~~~~'TN -- ,s / -"
__ - r/. oubouro
< § - t~~~~~AOUNDERE
. j ~~~korebe l ~ /( C ' T - ) Segn
*: '~/ f3ANANAS 20-/LMMamfe MEJA<ft 95ruMail~T aiu
X ~~> COXCo wFUMBAN \ ,N \ Ber.re 0Y^? Ct2' } { 4/yZSAME5) A
NK GSAI BA
*Kumeboc 0 e,
B'UEA ,çG6Oli, lALMBe tiv fl'~~~~~~~~~NANAS~~~~~N
. .OUNOE BONG MBANGDE
. OIL &9\|~~~~~E Z C( COAAkOnoI;n a 9 YOKADOUMAof,
SX~~~~~~~~~~~~~~ /ME T lNMERE ( Boy of Biofrao Tmié
il81j <~~~~~ E~NGMELIMA\
GI/IF 0F GU/NEA. m JOUM
GUIF OF CU/A/fA ;} < ~~~~TIMIBER )\\ ~~~TIBE _._ - M/
) Sb ~~~~~lPibrr pittîi îiuno
RIO MUNI i G A B O N C O N G O (Brazzaville) '$.JULY 1968 IBRD-2342