
i TABLE OF CONTENTS CHAPTER 2 – THEORY OF FAILURE MECHANISMS OF PIPES 2-1 2. INTRODUCTION 2-1 2.1...
31
i TABLE OF CONTENTS CHAPTER 2 – THEORY OF FAILURE MECHANISMS OF PIPES 2-1 2. INTRODUCTION 2-1 2.1 WHAT CONSTITUTES A FAILURE? 2-1 2.1.1 STRESS-STRAIN BEHAVIOUR OF A MATERIAL 2-2 2.1.1.1 STRESS-STRAIN BEHAVIOUR OF POLYMERS 2-4 2.1.1.2 STRESS-STRAIN BEHAVIOUR OF CAST IRON 2-6 2.1.1.3 STRESS-STRAIN BEHAVIOUR OF STEEL 2-7 2.2 CAUSES OF FAILURES 2-7 2.2.1 MANUFACTURING DEFECTS 2-7 2.2.2 CONSTRUCTION FACTORS 2-9 2.2.3 IN-SITU FAILURES 2-9 2.2.3.1 MOVEMENT OF SOIL 2-9 2.2.3.2 TEMPERATURE FAILURES 2-10 2.2.3.3 TENSILE AND COMPRESSION FAILURES 2-10 2.2.3.4 MATERIAL PROPERTIES 2-11 2.2.3.5 HYDRAULIC FACTORS 2-11 2.2.4 COMMON CAUSES OF FAILURES 2-12 2.3 TYPES OF PIPE FAILURES 2-14 2.3.1 CIRCUMFERENTIAL CRACK 2-14 2.3.2 BLOW OUT 2-14 2.3.3 BELL SPLIT 2-15 2.3.4 SPIRAL 2-16 2.3.5 LONGITUDINAL CRACKS 2-16 2.3.6 WEDGE SPLITTING 2-17 2.3.7 BRITTLE FAILURE 2-17 2.3.8 DUCTILE FAILURE 2-17 2.4 MATERIAL FAILURES 2-18 2.4.1 METALLIC FAILURES 2-18 2.4.2 CEMENT-BASED FAILURES 2-23 2.4.3 PLASTIC FAILURES 2-26
Transcript of i TABLE OF CONTENTS CHAPTER 2 – THEORY OF FAILURE MECHANISMS OF PIPES 2-1 2. INTRODUCTION 2-1 2.1...
i
TABLE OF CONTENTS
CHAPTER 2 – THEORY OF FAILURE MECHANISMS OF PIPES 2-1
2. INTRODUCTION 2-1
2.1 WHAT CONSTITUTES A FAILURE? 2-1 2.1.1 STRESS-STRAIN BEHAVIOUR OF A MATERIAL 2-2 2.1.1.1 STRESS-STRAIN BEHAVIOUR OF POLYMERS 2-4 2.1.1.2 STRESS-STRAIN BEHAVIOUR OF CAST IRON 2-6 2.1.1.3 STRESS-STRAIN BEHAVIOUR OF STEEL 2-7 2.2 CAUSES OF FAILURES 2-7 2.2.1 MANUFACTURING DEFECTS 2-7 2.2.2 CONSTRUCTION FACTORS 2-9 2.2.3 IN-SITU FAILURES 2-9 2.2.3.1 MOVEMENT OF SOIL 2-9 2.2.3.2 TEMPERATURE FAILURES 2-10 2.2.3.3 TENSILE AND COMPRESSION FAILURES 2-10 2.2.3.4 MATERIAL PROPERTIES 2-11 2.2.3.5 HYDRAULIC FACTORS 2-11 2.2.4 COMMON CAUSES OF FAILURES 2-12 2.3 TYPES OF PIPE FAILURES 2-14 2.3.1 CIRCUMFERENTIAL CRACK 2-14 2.3.2 BLOW OUT 2-14 2.3.3 BELL SPLIT 2-15 2.3.4 SPIRAL 2-16 2.3.5 LONGITUDINAL CRACKS 2-16 2.3.6 WEDGE SPLITTING 2-17 2.3.7 BRITTLE FAILURE 2-17 2.3.8 DUCTILE FAILURE 2-17 2.4 MATERIAL FAILURES 2-18 2.4.1 METALLIC FAILURES 2-18 2.4.2 CEMENT-BASED FAILURES 2-23 2.4.3 PLASTIC FAILURES 2-26
ii
LIST OF FIGURES FIGURE 2-1 – STRESS-STRAIN DIAGRAM FOR STRUCTURAL STEEL IN TENSION (ADAPTED FROM GERE, 2001)_________ 2-3 FIGURE 2-2 – LOAD-ELONGATION CURVES FOR POLYETHYLENE AT DIFFERENT TEMPERATURES (TAKEN FROM WARD, 1971)________________________________________________________________________________________ 2-5 FIGURE 2-3 – STRESS-STRAIN DIAGRAM FOR POLYVINYL CHLORIDE WITH VARIOUS STRAIN RATES (TAKEN FROM BROSTOW, 1986) ___________________________________________________________________________________ 2-5 FIGURE 2-4 – STRESS-STRAIN DIAGRAM FOR POLYVINYL CHLORIDE AT VARIOUS TEMPERATURES (TAKEN FROM BROSTOW, 1986) ___________________________________________________________________________________ 2-5 FIGURE 2-5 – TYPICAL STRESS-STRAIN CURVES FOR CAST IRON (TAKEN FROM MOLNAR, 2004) __________________ 2-6 FIGURE 2-6 – TYPICAL STRESS-STRAIN CURVES FOR MILD STEEL, CAST IRON AND CONCRETE (TAKEN FROM LUEBKEMAN, 1997) ___________________________________________________________________________________ 2-7 FIGURE 2-7 – CIRCUMFERENTIAL FAILURE (ADAPTED FROM MAKAR, 2004) ________________________________ 2-14 FIGURE 2-8 – TYPICAL BLOW-OUT TYPE FAILURE (ADAPTED FROM MAKAR, 2004) ___________________________ 2-15 FIGURE 2-9 – BLOW-OUT FAILURE WITH LONGITUDINAL CORROSION PITS (ADAPTED FROM MAKAR, 2004) _________ 2-15 FIGURE 2-10 – BELL SPLIT FAILURE (ADAPTED FROM MAKAR, 2004) ____________________________________ 2-15 FIGURE 2-11 – SPIRAL CRACK FAILURE (ADAPTED FROM MAKAR, 2004) __________________________________ 2-16 FIGURE 2-12 – LONGITUDINAL SPLITTING (ADAPTED FROM MAKAR, 2004)_________________________________ 2-16 FIGURE 2-13 – LONGITUDINAL CRACKING (ADAPTED FROM MAKAR, 2004) ________________________________ 2-16 FIGURE 2-14 – WEDGE SPLITTING (ADAPTED FROM MAKAR, 2004)______________________________________ 2-17 FIGURE 2-15 – BRITTLE TYPE FAILURE OF PLASTIC PIPE ______________________________________________ 2-17 FIGURE 2-16 – DUCTILE TYPE FAILURE OF A PLASTIC PIPE_____________________________________________ 2-18 FIGURE 2-17 – SINGLE CORROSION PIT OF GREY CAST IRON PIPE (CSIRO, 2004) ___________________________ 2-19 FIGURE 2-18 – COMBINATION OF CORROSION AND STRUCTURAL FAILURE (BLOW-OUT) (CSIRO, 2004) ____________ 2-19 FIGURE 2-19 – COMBINATION OF CORROSION AND STRUCTURAL FAILURE (CIRCUMFERENTIAL FRACTURE) (CSIRO, 2004) ________________________________________________________________________________________ 2-19 FIGURE 2-20 – STEEL PIPE WITH EXCESSIVE CORROSION DEPOSITS (DUNCAN, 2004) _________________________ 2-20 FIGURE 2-21 – STEEL PIPE WITH EXCESSIVE CORROSION AND DEGRADATION (DUNCAN, 2004) __________________ 2-20 FIGURE 2-22 – STEEL PIPE WITH CORROSION PITS AND HOLES (GREYVENSTEIN, 2004)________________________ 2-20 FIGURE 2-23 – AVERAGE FAILURE RATE PER 100 KM OF PIPELINE IN THE UK FOR METALLIC PIPES FROM (1998-2001) _ 2-21 FIGURE 2-24 – AVERAGE FAILURE RATE PER 100 KM OF PIPELINE IN THE UK FOR METALLIC PIPES FROM (1990-2001) _ 2-22 FIGURE 2-25 – PERCENTAGE OF FAILURE TYPES FOR METALLIC PIPES IN THE UK FROM (1990-2002)______________ 2-22 FIGURE 2-26 – FIBRE-CEMENT PIPE FAILURE (LONGITUDINAL FRACTURE) (CSIRO, 2004)______________________ 2-23 FIGURE 2-27 – FIBRE-CEMENT PIPE FAILURE (COMPLEX FRACTURE) (CSIRO, 2004) _________________________ 2-23 FIGURE 2-28 – FIBRE-CEMENT PIPE FAILURES (GREYVENSTEIN, 2004)____________________________________ 2-24 FIGURE 2-29 – AVERAGE FAILURE RATE PER 100 KM OF PIPELINE IN THE UK FOR FIBRE-CEMENT PIPES FROM (1998-2001)_______________________________________________________________________________________ 2-24 FIGURE 2-30 – AVERAGE FAILURE RATE PER 100 KM OF PIPELINE IN THE UK FOR FIBRE-CEMENT PIPES FROM (1990-2001)_______________________________________________________________________________________ 2-25 FIGURE 2-31 – PERCENTAGE OF FAILURE TYPES FOR FIBRE-CEMENT PIPES IN THE UK FROM (1990-2002)__________ 2-25 FIGURE 2-32 – BRITTLE FRACTURE OF A PVC PIPE (CSIRO, 2004) _____________________________________ 2-26 FIGURE 2-33 – RUPTURE OF A POLYETHYLENE PIPE (CSIRO, 2004) _____________________________________ 2-26 FIGURE 2-34 – DUCTILE FAILURE OF A PVC PIPE (CSIRO, 2004) _______________________________________ 2-27 FIGURE 2-35 – AVERAGE FAILURE RATE PER 100 KM OF PIPELINE IN THE UK FOR PLASTIC PIPES FROM (1998-2001) __ 2-27 FIGURE 2-36 – AVERAGE FAILURE RATE PER 100 KM OF PIPELINE IN THE UK FOR PLASTIC PIPES FROM (1990-2001) __ 2-28 FIGURE 2-37 – PERCENTAGE OF FAILURE TYPES FOR PLASTIC PIPES IN THE UK FROM (1990-2002)_______________ 2-28
iii
LIST OF TABLES TABLE 2–1– COMMON CAUSES OF CERTAIN FAILURES (ADAPTED FROM UKWIR, 2005) ________________________ 2-13
CHAPTER 2 – THEORY OF FAILURE MECHANISMS OF PIPES 2-1
CHAPTER 2 – THEORY OF FAILURE MECHANISMS OF PIPES
2. INTRODUCTION
Water is one of the most important resources required by people. Uses of water can be classified
as domestic, public, commercial, and industrial. Due to the high demand of water in various
areas a water supply system becomes very important. Modern water supply systems include
facilities for collection & storage, transportation, pumping, treatment, and distribution.
Water distribution systems are part of life support systems of any city. In big cities because of
population overload the natural water system collapses, and external support is required. Water
distribution systems are also used to develop cities far away from the natural water sources
(such as Johannesburg). In most of the cases water is collected from the natural source, and
treated. This treated water is then transported through the pipelines and pipe networks to the
cities.
South Africa is a water scarce country where a large number of people are still not provided with
adequate water. In the water distribution systems there are a lot of losses that are unaccounted
for. Thus leakage and unaccounted-for water plays a major factor in water management
systems. It is thought that this loss of water is partly caused by leak openings in pipes expanding
with increasing pressure, the effect of soil conditions around the pipe, and laminar flow conditions
through very small leak openings. Thus better understanding of the underlying factors of the
system will help design pressure management systems based on the actual conditions in the
system (such as pipe material, class and age, soil conditions, topography, network layout, etc.).
Once the factors for the problems are identified we will be able to manage water resources in a
sustainable manner that will benefit the country as a whole.
This chapter will described the various failure mechanisms of pipes. The behaviour of the
materials as well as various pipe failures will be described. However, there is not much
information on how pipes fail or why but the chapter will cover as much as possible.
2.1 WHAT CONSTITUTES A FAILURE?
In terms of engineering, concerning mechanics failure is a condition caused by collapse, break or
bending, so that a structure or structural element can no longer fulfil its purpose. Pipe failures are
thus defined when a pipe can no longer perform its intended task i.e. the pipe is losing water
even though there is no catastrophic failure.
CHAPTER 2 – THEORY OF FAILURE MECHANISMS OF PIPES 2-2
According to UK Water Industry Research (UKWIR, 2005) the definition of a mains failure is
more involved. Their definition is as follows:
Mains bursts include all physical repair work to mains from which water is lost which is
attributable to pipes, fittings, or joint material failures or movement, or caused or deemed to be
caused by conditions or original pipe laying or subsequent changes in ground conditions (such
as changes to a road formation, loading, etc where the costs of repair cannot be recovered from
a third party). Include ferrule failures that are attributable to mains material condition or local
ground movements, but not incidents of ferrule failure due to ferrule materials or poor
workmanship, or associated with the communication pipe connection.
Exclude maintenance work on valve packings, hydrant seals, air valves, etc. For the avoidance
of doubt, all leakage occurring at locations or through joint or material failures which would have
been designed for the life of the main (irrespective of whether earlier failure occurs) should be
regarded as mains bursts. Failure of consumable or maintainable items (valve packings etc)
should be classified as leakage. Also include incidents of over-pressure or pressure cycling, and
surge failures, etc, which reflect the system operating conditions, even where these failures are
accidental rather than associated with weaknesses in pipe condition.
All third party damage should be excluded where costs are potentially (rather than actually)
recovered from a third party. If these incidents are significant they should be reported in the
commentaries.
To understand failures one must understand the behaviour of the material, in order to do this a
stress-strain curve of a material is drawn which will convey important information about the
mechanical properties and behavioural characteristics of the material.
2.1.1 STRESS-STRAIN BEHAVIOUR OF A MATERIAL
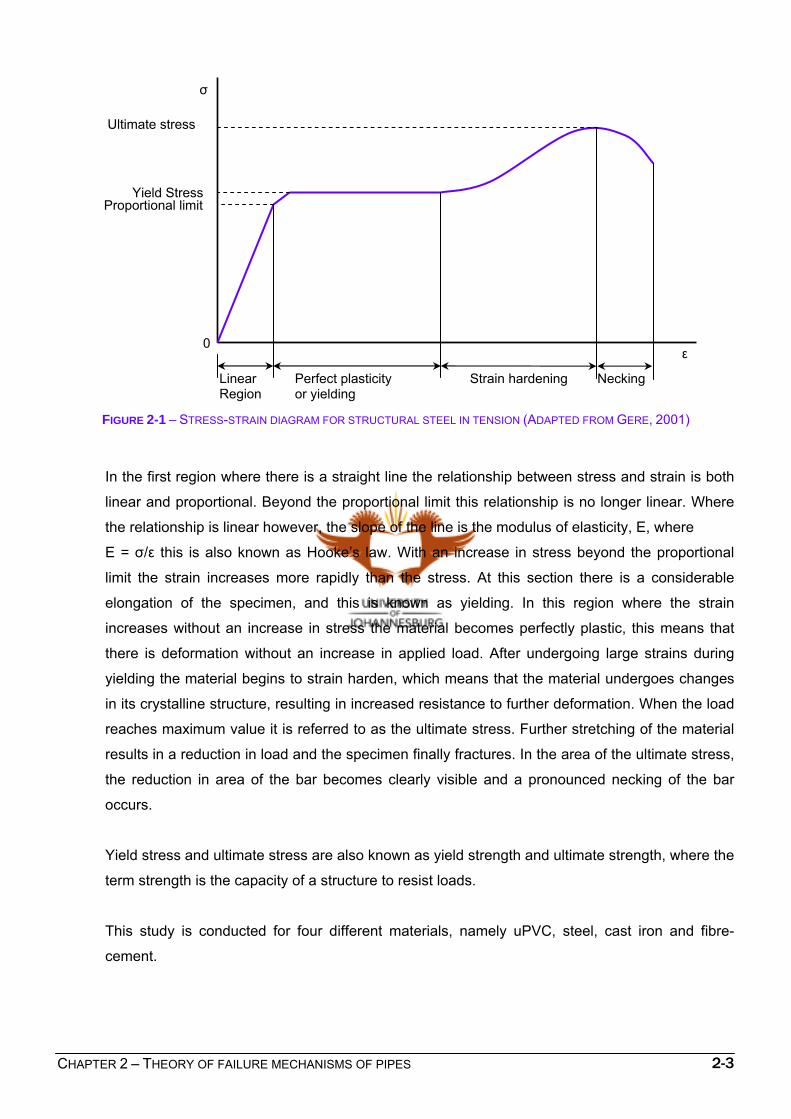
Figure 2-1 shows a typical stress-strain diagram for structural steel in tension (Gere, 2001). The
diagram is not to scale but will aid with the concepts of a stress-strain diagram.
CHAPTER 2 – THEORY OF FAILURE MECHANISMS OF PIPES 2-3
FIGURE 2-1 – STRESS-STRAIN DIAGRAM FOR STRUCTURAL STEEL IN TENSION (ADAPTED FROM GERE, 2001)
In the first region where there is a straight line the relationship between stress and strain is both
linear and proportional. Beyond the proportional limit this relationship is no longer linear. Where
the relationship is linear however, the slope of the line is the modulus of elasticity, E, where
E = σ/ε this is also known as Hooke’s law. With an increase in stress beyond the proportional
limit the strain increases more rapidly than the stress. At this section there is a considerable
elongation of the specimen, and this is known as yielding. In this region where the strain
increases without an increase in stress the material becomes perfectly plastic, this means that
there is deformation without an increase in applied load. After undergoing large strains during
yielding the material begins to strain harden, which means that the material undergoes changes
in its crystalline structure, resulting in increased resistance to further deformation. When the load
reaches maximum value it is referred to as the ultimate stress. Further stretching of the material
results in a reduction in load and the specimen finally fractures. In the area of the ultimate stress,
the reduction in area of the bar becomes clearly visible and a pronounced necking of the bar
occurs.
Yield stress and ultimate stress are also known as yield strength and ultimate strength, where the
term strength is the capacity of a structure to resist loads.
This study is conducted for four different materials, namely uPVC, steel, cast iron and fibre-
cement.
Linear Region
Perfect plasticity or yielding
Strain hardening Necking
Ultimate stress
Yield Stress Proportional limit
ε
σ
0
CHAPTER 2 – THEORY OF FAILURE MECHANISMS OF PIPES 2-4
2.1.1.1 STRESS-STRAIN BEHAVIOUR OF POLYMERS
Plastics are polymers primarily made of carbon, hydrogen and oxygen (Petrochem next, 2004).
Polyvinyl chloride, regularly referred to as PVC, is a thermoplastic material commonly used for a
variety of pressure pipe applications including potable water distribution piping, irrigation systems
and sewage mains. PVC offers a unique combination of structural characteristics, which enable it
to overcome the problems associated with older, more traditional pipe materials.
The stress/strain behaviour of a polymer can be categorised into several classes of behaviour:
Brittle Fracture – this fracture is characterized by no yield point which has a Hookean
behaviour at low strains and failure characterised by conchoidal lines which is a shell like
fracture pattern.
Yield Behaviour – characterised by a maximum in the stress-strain curve followed by yielding
deformation which is usually associated with ductile failure. Yield behaviour can result in
necking.
Rubber-Like Behaviour – characterised by the absence of a yield point but exhibiting a plateau
in an engineering stress-strain curve.
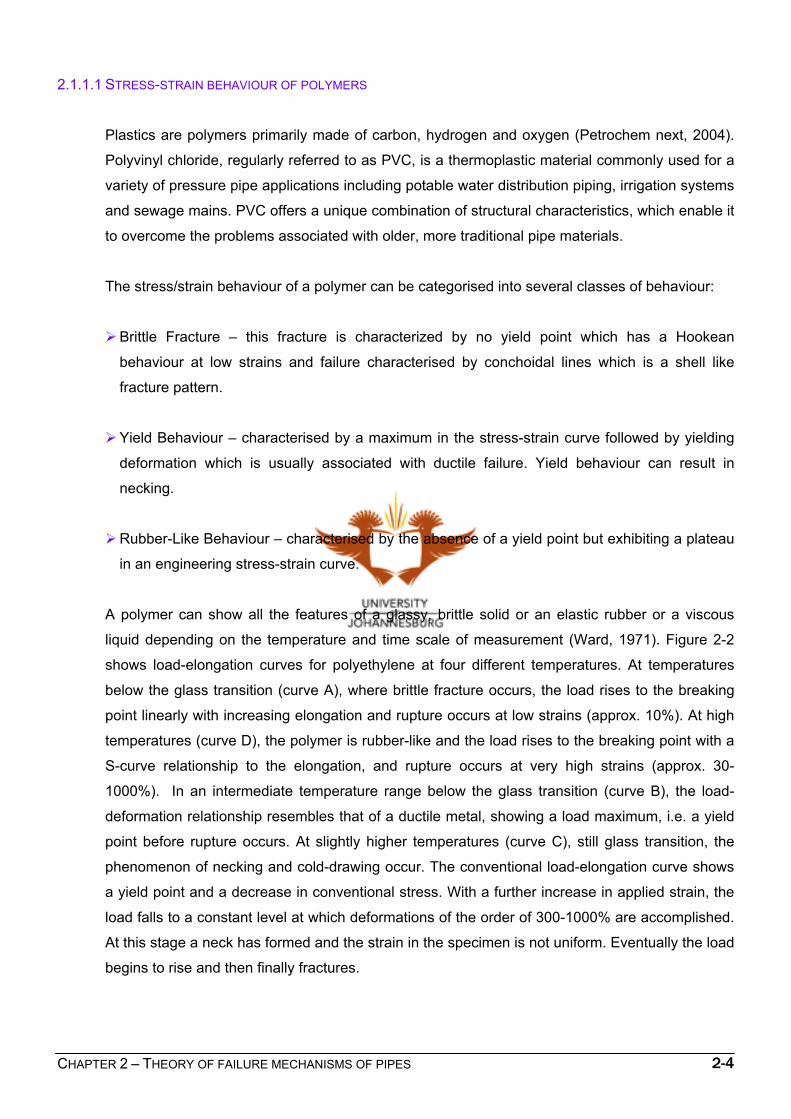
A polymer can show all the features of a glassy, brittle solid or an elastic rubber or a viscous
liquid depending on the temperature and time scale of measurement (Ward, 1971). Figure 2-2
shows load-elongation curves for polyethylene at four different temperatures. At temperatures
below the glass transition (curve A), where brittle fracture occurs, the load rises to the breaking
point linearly with increasing elongation and rupture occurs at low strains (approx. 10%). At high
temperatures (curve D), the polymer is rubber-like and the load rises to the breaking point with a
S-curve relationship to the elongation, and rupture occurs at very high strains (approx. 30-
1000%). In an intermediate temperature range below the glass transition (curve B), the load-
deformation relationship resembles that of a ductile metal, showing a load maximum, i.e. a yield
point before rupture occurs. At slightly higher temperatures (curve C), still glass transition, the
phenomenon of necking and cold-drawing occur. The conventional load-elongation curve shows
a yield point and a decrease in conventional stress. With a further increase in applied strain, the
load falls to a constant level at which deformations of the order of 300-1000% are accomplished.
At this stage a neck has formed and the strain in the specimen is not uniform. Eventually the load
begins to rise and then finally fractures.
CHAPTER 2 – THEORY OF FAILURE MECHANISMS OF PIPES 2-5
FIGURE 2-2 – LOAD-ELONGATION CURVES FOR POLYETHYLENE AT DIFFERENT TEMPERATURES (TAKEN FROM WARD, 1971)
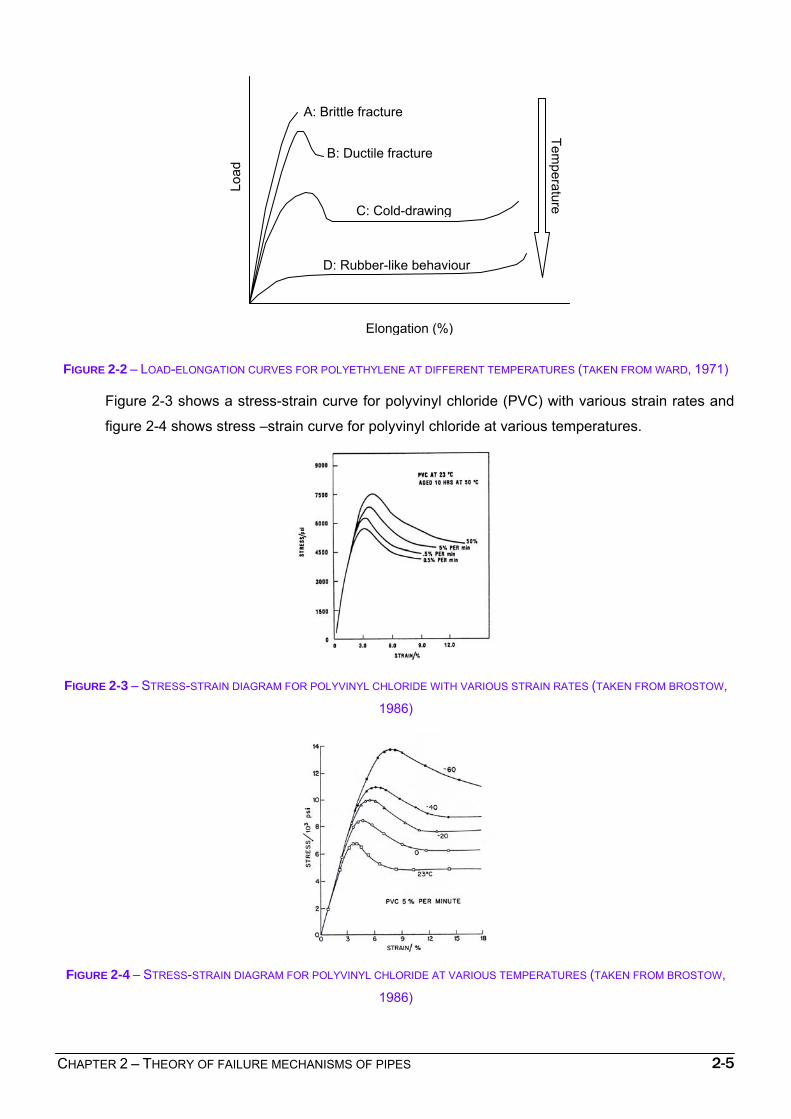
Figure 2-3 shows a stress-strain curve for polyvinyl chloride (PVC) with various strain rates and
figure 2-4 shows stress –strain curve for polyvinyl chloride at various temperatures.
FIGURE 2-3 – STRESS-STRAIN DIAGRAM FOR POLYVINYL CHLORIDE WITH VARIOUS STRAIN RATES (TAKEN FROM BROSTOW,
1986)
FIGURE 2-4 – STRESS-STRAIN DIAGRAM FOR POLYVINYL CHLORIDE AT VARIOUS TEMPERATURES (TAKEN FROM BROSTOW,
1986)
Load
Elongation (%)
A: Brittle fracture
B: Ductile fracture
C: Cold-drawing
D: Rubber-like behaviour
Temperature
CHAPTER 2 – THEORY OF FAILURE MECHANISMS OF PIPES 2-6
2.1.1.2 STRESS-STRAIN BEHAVIOUR OF CAST IRON
Many cast iron gas pipelines in use today have been in operation for over 100 years (Molnar,
2004). There are two ways of manufacturing cast iron pipes namely, pit casting and centrifugally,
or spin, casting. Many of the cast iron pipes used for piping are pit cast as centrifugal casting
was introduced only in the 1920s. Vertical pit casting was the preferred method of manufacturing
due to the longer sections of pipe that could be cast. Horizontal casting was limited by the
flexural rigidity of the mould core where bending of the core could cause inconsistent wall
thickness along the length of the pipe. In the 1920s, the process of centrifugally casting gray cast
iron pipe was introduced and became the primary manufacturing method of cast iron pipe by the
early 1930s this involved the iron into a mould that was horizontal and spinning. The speed of the
spinning depended on the required thickness of the pipe.
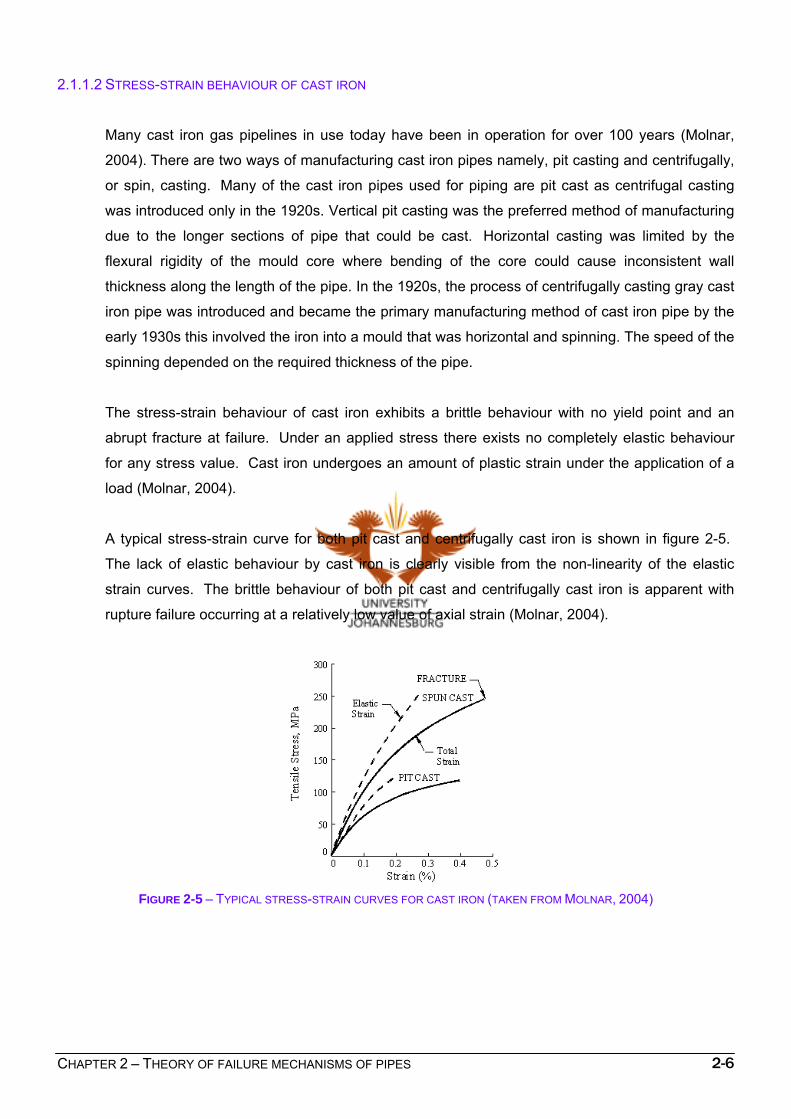
The stress-strain behaviour of cast iron exhibits a brittle behaviour with no yield point and an
abrupt fracture at failure. Under an applied stress there exists no completely elastic behaviour
for any stress value. Cast iron undergoes an amount of plastic strain under the application of a
load (Molnar, 2004).
A typical stress-strain curve for both pit cast and centrifugally cast iron is shown in figure 2-5.
The lack of elastic behaviour by cast iron is clearly visible from the non-linearity of the elastic
strain curves. The brittle behaviour of both pit cast and centrifugally cast iron is apparent with
rupture failure occurring at a relatively low value of axial strain (Molnar, 2004).
FIGURE 2-5 – TYPICAL STRESS-STRAIN CURVES FOR CAST IRON (TAKEN FROM MOLNAR, 2004)
CHAPTER 2 – THEORY OF FAILURE MECHANISMS OF PIPES 2-7
2.1.1.3 STRESS-STRAIN BEHAVIOUR OF STEEL
The stress-strain behaviour of steel, as seen in section 2.2.1, differs from cast iron and ductile
iron because of its ability to behave perfectly elastic and the existence of a definitive yield point
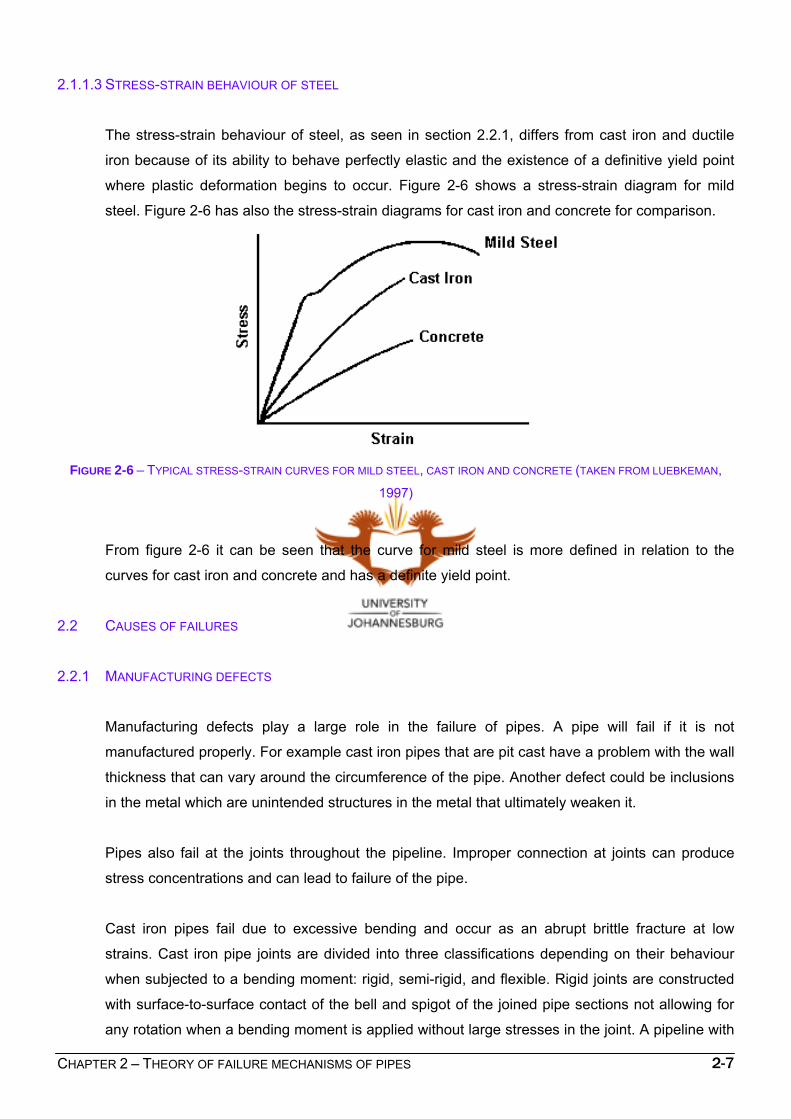
where plastic deformation begins to occur. Figure 2-6 shows a stress-strain diagram for mild
steel. Figure 2-6 has also the stress-strain diagrams for cast iron and concrete for comparison.
FIGURE 2-6 – TYPICAL STRESS-STRAIN CURVES FOR MILD STEEL, CAST IRON AND CONCRETE (TAKEN FROM LUEBKEMAN,
1997)
From figure 2-6 it can be seen that the curve for mild steel is more defined in relation to the
curves for cast iron and concrete and has a definite yield point.
2.2 CAUSES OF FAILURES
2.2.1 MANUFACTURING DEFECTS
Manufacturing defects play a large role in the failure of pipes. A pipe will fail if it is not
manufactured properly. For example cast iron pipes that are pit cast have a problem with the wall
thickness that can vary around the circumference of the pipe. Another defect could be inclusions
in the metal which are unintended structures in the metal that ultimately weaken it.
Pipes also fail at the joints throughout the pipeline. Improper connection at joints can produce
stress concentrations and can lead to failure of the pipe.
Cast iron pipes fail due to excessive bending and occur as an abrupt brittle fracture at low
strains. Cast iron pipe joints are divided into three classifications depending on their behaviour
when subjected to a bending moment: rigid, semi-rigid, and flexible. Rigid joints are constructed
with surface-to-surface contact of the bell and spigot of the joined pipe sections not allowing for
any rotation when a bending moment is applied without large stresses in the joint. A pipeline with
CHAPTER 2 – THEORY OF FAILURE MECHANISMS OF PIPES 2-8
rigid joints behaves as a continuous beam with no relative rotations at the joints. Flanged and
turned and bored joints are classified as rigid joints. These types of joints were used in the
earliest installations of cast iron pipelines. Prevention of leakage is provided by a packing and
caulking materials within a bell and spigot joint. The behaviour of these joints is highly dependent
on the type and condition of the packing and caulking materials. In water mains, the packing
remained pliable and deformable allowing for rotation at the joint. The packing also swelled with
the absorption of water that helps in sealing any points of leakage.
Failure at a joint can be partial failure or complete failure. Partial failure occurs at lead caulked
joints when the rotation is enough to cause an opening to form in the joint where the packing and
the pipe are in contact. This allows leakage to occur at the joint. Complete failure of both semi-
rigid and flexible joints occurs when the rotation at the joint is great enough to cause the spigot to
force the packing or rubber gasket out of place and for the spigot and bell to come into contact.
This metal-to-metal contact between the two pipe sections, called metal binding, is the point
where the joint is considered to have completely failed because with the addition of a small
rotation will cause a large increase in the stress within the joint.
For steel pipes they are joined by mechanical, rubber-gasket push-on, and ball and socket joints.
The majority of line pipe are joined by welding in order to create a leak-tight joint and a pipeline
that behaves as a continuous beam. This method of joining line pipe can be accomplished in the
field during installation. A few types of welds that can be used are the single- and double-butt
weld joint, and the lap weld joint. The quality of construction of these joints defines the strength of
the pipe at their location. The advantage of joining line pipe by welded joints is that there is a
very small reduction in the strength of the pipeline at the location of the joint. The percentage of
loss of strength for the three types of joints mentioned range from only 0 to 25 percent (Molnar,
2004).
Another defect that can happen mainly in metallic pipes is that of corrosion. Corrosion can cause
components to be no longer able to fulfil their purpose and thus they must be removed from
service. Corrosion can also initiate fatigue or be involved in brittle fractures. Contamination can
affect products in contact with surfaces; it can also cause the corrosion of metals, and cause
surface attack on non-metals. If the contaminating material is hard or the carrion products are
abrasive contamination can result in abrasion. Chemical changes influenced by heat, light, or
temperature can over time result in degradation. Thus if a pipe is not coated and protected it can
be vulnerable to corrosion and contamination causing corrosion pits and wall thinning and
ultimately ending in failure.
CHAPTER 2 – THEORY OF FAILURE MECHANISMS OF PIPES 2-9
2.2.2 CONSTRUCTION FACTORS
Pipe failures can be attributed to various construction factors. These factors can include improper
handling of pipes, i.e. when pipes are handled in the incorrect way when laying the pipes in the
ground (for example dropping or bending the pipe). Improper handling can also be when pipes
are left out in the sun to long as for plastic pipes as the thermal properties are the affected. If the
bedding on which the pipe is to be laid is inadequate this can affect the performance of the pipe
by inducing unwanted pressures around the pipe wall. If there is any physical damage to the pipe
or the coating of the pipe wall this can affect the performance of the pipe especially in metallic
and cement-based pipes as this can lead to contamination and corrosion and degradation of the
pipe wall and subsequent failure of the pipe.
2.2.3 IN-SITU FAILURES
2.2.3.1 MOVEMENT OF SOIL
When pipes are buried under ground there are external pressures that act on the pipe. These
external loads are not symmetrical thus the differential loading can cause bending in the pipe
wall. Possible loads on buried pipes include internal fluid pressure, which includes pumping
head, water hammer or test pressure, vertical soil pressure, superimposed live loads due to
vehicles, self weight of pipe and its contents and crushing or bending by heaving or moving soils.
Thus the excessive loads may result in failure due to either crushing or compression in the pipe
wall, tensile failure, bending of pipe wall, longitudinal bending, excessive deflection or buckling.
Another fracture that can occur within the soil in shear fracture. Shear is a combination of
compression and tensile stress. A shear fracture is a fracture that occurs at right angles to the
section and will be flat with no evidence of any directional properties. It may be seen that bending
has taken place prior to the shear, where the bending is slight the final fracture can be by shear.
However if major bending is present the outer surface will involve tensile failure followed by final
shear failure.
Torque is a form of shear where twisting has been applied. If pure torque is involved i.e. where
part of the component has been static and the other part has be subjected to twists, it can be
seen that there is a 45° angle tensile-type failure. Torque loading exists with other forms of failure
such as ductile tensile failure where additional torque has been applied and with fatigue shear
where the cracks will propagate at a 45° angle. Where the component has smooth surface
impact torque will result in bursting-type cracks parallel with the fracture.
CHAPTER 2 – THEORY OF FAILURE MECHANISMS OF PIPES 2-10
With non-metals shear is rather rare, yet torsion failures can be common with plastics/polymers
and wood.
2.2.3.2 TEMPERATURE FAILURES
Where components are subjected to a temperature above or below the specifications, there can
be changes to the material structure and dimensions which can change the performance
properties of the section. The effect of heating and cooling on plastic/polymer materials is more
significant than with metals. Changes in temperature can induce tensile or compressive stresses
which can lead to failure of the pipe.
2.2.3.3 TENSILE AND COMPRESSION FAILURES
Tensile failure has four branches of failure. Ductile tensile failure has well defined characteristics
as there is a reduction in the area of the fracture known as ‘necking’. This feature indicates that
the material passed the yield strength and stretched to a measurable degree beyond before
reaching the ultimate tensile strength resulting in the fracture of the material. This will indicate
that the material has a good degree of ductility and has been subjected to the load slowly and
without impact. The term necking was discussed in section 2.2.1. Brittle tensile failure is the
opposite of the ductile fracture as there is no reduction in size at the area of fracture. The
material is working properly one moment and the next it has failed. Fatigue failure is due to the
application of a cyclic tensile load. The component may be within its design yield strength but a
small portion of the component will be taken beyond the ultimate tensile strength resulting in a
crack. The crack will then propagate each time the stress is increased beyond the ultimate
tensile strength at that point. Bending failure will not necessarily result in fracture. When a
component bends beyond a certain degree it will no longer fulfil its purpose, however the fact that
it bent will indicate a degree of ductility. The failure mechanism involved with bending will either
be the ductile or brittle fracture.
Compression failure is seldom a reason for fracture. Compression causes a component to be
pushed not pulled. The yield strength of a material under compression is exactly the same as for
tension. When a component is undergoes tensile loading and the yield strength is exceeded,
there is a reduction in the cross-sectional area, consequently the unit load will increase and the
fracture will take place if the load is continually applied. With compression, when the yield
strength is exceeded there will be an increase in the cross-sectional area, thus for fracture to
occur the load must be increased further. Failure by compression will therefore seldom result in
fracture.
CHAPTER 2 – THEORY OF FAILURE MECHANISMS OF PIPES 2-11
2.2.3.4 MATERIAL PROPERTIES
Material properties play an important role in a pipe as the material changes over time. The
design strength of a pipe is only specified for a certain time and thus consequently reduces over
time. As was seen in section 2.2.1 the stress strain curves also change over time thus deforming
the pipe permanently i.e. plastic deformation. The material properties have to then taken into
consideration when deciding on a material to use. Improper choice in material can lead to
catastrophic failure.
2.2.3.5 HYDRAULIC FACTORS
There are various hydraulic factors that influence in-situ failures such as losses, thrust caused by
internal pressure, water hammer, erosion of water pipe from soil and negative pressures within
the pipe. Negative pressures can be caused when there is a fire and the fire brigade draws the
water at one node in the network causing a rapid drop of pressure at the other nodes in the
system.
HEAD LOSSES
Friction losses always occur when fluids are conveyed in pipelines. These losses depend on the
flow velocity of the fluid, the pipe diameter, and length and the material of the pipe. In order to
overcome these friction losses and supply water at the required pre-determined pressure,
additional energy in the form of a pump needs to be introduced into the system.
When fluid is transported in a pipe, the loss of head due to friction can be calculated according to
the Darcy-Weisbach equation:
Where hf is the friction loss in the pipe, λ is the friction coefficient, L is the length of the pipe, d is
the diameter of the pipe, v is the velocity of the fluid in the pipe and g is the gravitational
acceleration.
The total friction head loss in the system is made up of different losses namely, the entrance loss
(he), the loss in bends in the pipe (hb), the loss resulting from changes in diameter of the pipe
(hc), the loss in valves (hv), the loss at the exit of the pipe (hx) and the friction loss itself (hf).
Theses losses are all proportional to the dynamic head and thus the total loss in the pipeline can
be expressed as follows:
⎟⎟⎠
⎞⎜⎜⎝
⎛⎟⎠⎞
⎜⎝⎛=
gv
dLhf 2
2λ
⎟⎟⎠
⎞⎜⎜⎝
⎛+++++⎟⎟
⎠
⎞⎜⎜⎝
⎛= xvcbe
fT d
LgvH λλλλλ
λ2
2
CHAPTER 2 – THEORY OF FAILURE MECHANISMS OF PIPES 2-12
Where HT is the total pressure head loss and (v2/2g) is the dynamic head.
THRUST CAUSED FROM INTERNAL PRESSURE
An unbalanced thrust is introduced when ever there is a change in direction of the pressure or
full flowing gravity of the pipeline. This thrust is caused by either of the following: a change in the
direction of flow and the force resulting from the internal pressure. The magnitude of the forces
caused by the change in direction of flow is negligible (Myles). The magnitude of the resultant
outward thrust equals the sum of the vector sum of the forces caused by the internal pressure at
the change of direction. The unbalanced thrust can be counteracted by a concrete thrust block
bearing against the pipe trench bottom and wall.
WATER HAMMER
The phenomenon of water hammer takes place when a sudden change in flow velocity occurs.
This can be caused when a valve is opened or closed, a pump is switched on or off, a pipe
failure occurs or when a pipeline is filled. The effect of water hammer on a pipe is in principle the
same as for any material of the pipe. This means that the pipes are exposed to higher stresses
and possible negative pressure over a very short time period as a result of the pressure surges.
EROSION OF PIPE WALL
Erosion of a pipe wall can have a detrimental effect on the pipe. There have been investigations
concerning the effect of a fluidised zone (Niven, 1998). The fluidised zone occurs when the
particles outside a leak in a pipe are dislodged by the water jet from the leak. The size of this
zone is dependant on the depth bellow surface level and the flow of the jet. It is also dependant
on the soil properties. The internal and external pipe pressure i.e. the pressure in and outside of
the pipe wants to equalize. Thus the jet is discharging at the resultant pressure between the
inside and outside the pipe in attempt to equalize the pressure. When this jet is flowing into the
soil the pressure from the jet moves the soil around causing a scouring effect around the leak.
This scouring can erode the pipe wall from the outside and damage the pipe.
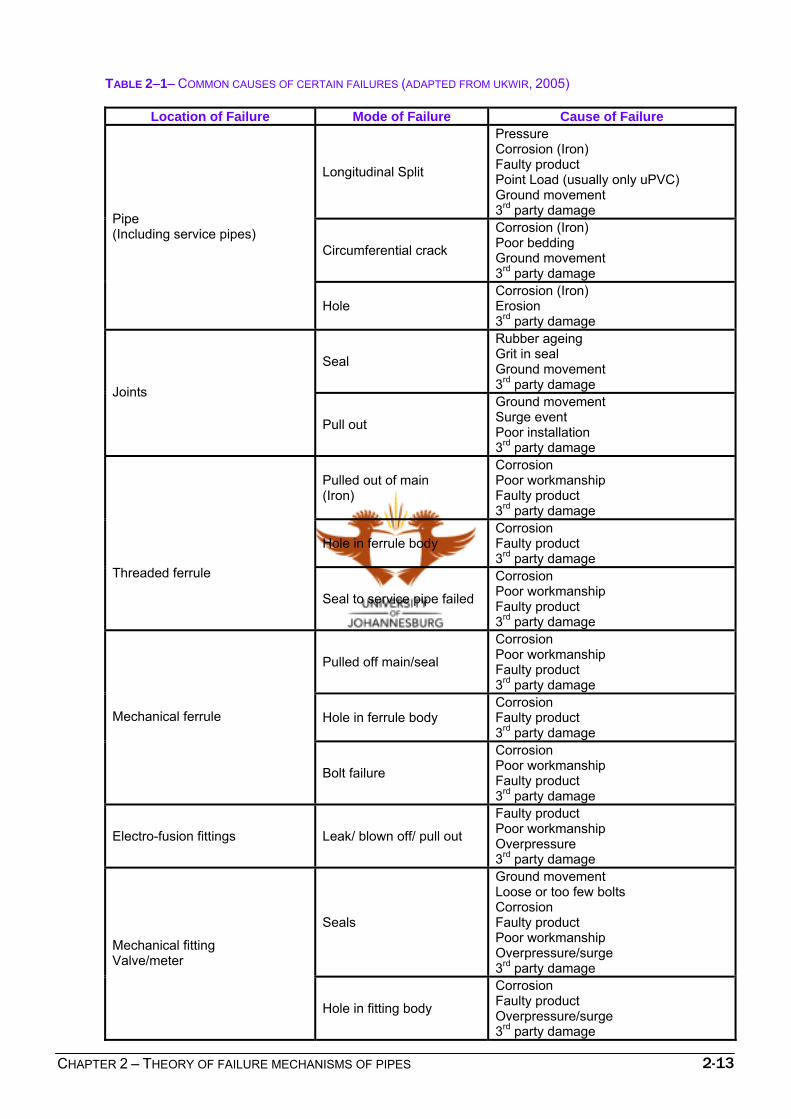
2.2.4 COMMON CAUSES OF FAILURES
Certain causes of failures occur depending on where along the pipeline the failure takes place,
i.e. at the joints, within the pipe etc. Table 2-1 shows the common cause and failure modes
depending on where the failure has occurred (UKWIR, 2005). This can act as a failure code to
distinguish where and how the pipe has failure by referring to the table in table 2-1.
CHAPTER 2 – THEORY OF FAILURE MECHANISMS OF PIPES 2-13
TABLE 2–1– COMMON CAUSES OF CERTAIN FAILURES (ADAPTED FROM UKWIR, 2005)
Location of Failure Mode of Failure Cause of Failure
Longitudinal Split
Pressure Corrosion (Iron) Faulty product Point Load (usually only uPVC) Ground movement 3rd party damage
Circumferential crack
Corrosion (Iron) Poor bedding Ground movement 3rd party damage
Pipe (Including service pipes)
Hole Corrosion (Iron) Erosion 3rd party damage
Seal
Rubber ageing Grit in seal Ground movement 3rd party damage Joints
Pull out
Ground movement Surge event Poor installation 3rd party damage
Pulled out of main (Iron)
Corrosion Poor workmanship Faulty product 3rd party damage
Hole in ferrule body Corrosion Faulty product 3rd party damage
Threaded ferrule
Seal to service pipe failed
Corrosion Poor workmanship Faulty product 3rd party damage
Pulled off main/seal
Corrosion Poor workmanship Faulty product 3rd party damage
Hole in ferrule body Corrosion Faulty product 3rd party damage
Mechanical ferrule
Bolt failure
Corrosion Poor workmanship Faulty product 3rd party damage
Electro-fusion fittings Leak/ blown off/ pull out
Faulty product Poor workmanship Overpressure 3rd party damage
Seals
Ground movement Loose or too few bolts Corrosion Faulty product Poor workmanship Overpressure/surge 3rd party damage
Mechanical fitting Valve/meter
Hole in fitting body
Corrosion Faulty product Overpressure/surge 3rd party damage
CHAPTER 2 – THEORY OF FAILURE MECHANISMS OF PIPES 2-14
2.3 TYPES OF PIPE FAILURES
There are many different types of failures of pipes, with variations caused by both the size of pipe
and the type of loading on it. The following pictures illustrate the various types of failure modes.
2.3.1 CIRCUMFERENTIAL CRACK
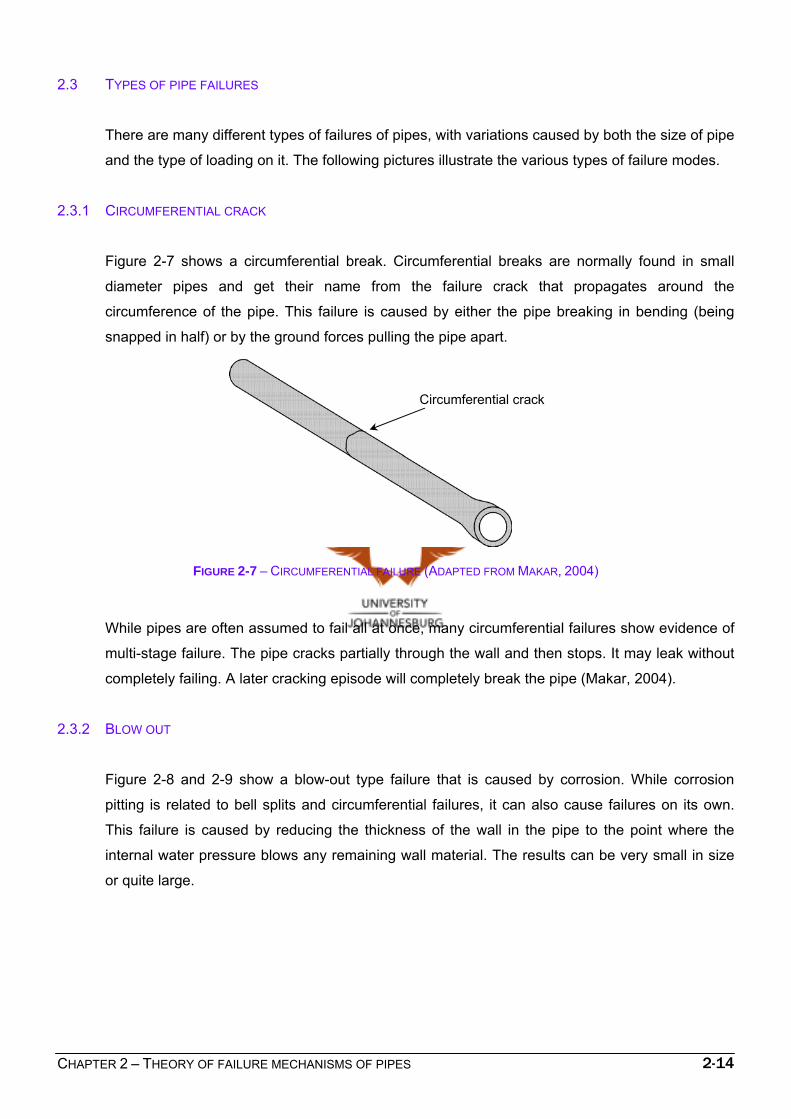
Figure 2-7 shows a circumferential break. Circumferential breaks are normally found in small
diameter pipes and get their name from the failure crack that propagates around the
circumference of the pipe. This failure is caused by either the pipe breaking in bending (being
snapped in half) or by the ground forces pulling the pipe apart.
FIGURE 2-7 – CIRCUMFERENTIAL FAILURE (ADAPTED FROM MAKAR, 2004)
While pipes are often assumed to fail all at once, many circumferential failures show evidence of
multi-stage failure. The pipe cracks partially through the wall and then stops. It may leak without
completely failing. A later cracking episode will completely break the pipe (Makar, 2004).
2.3.2 BLOW OUT
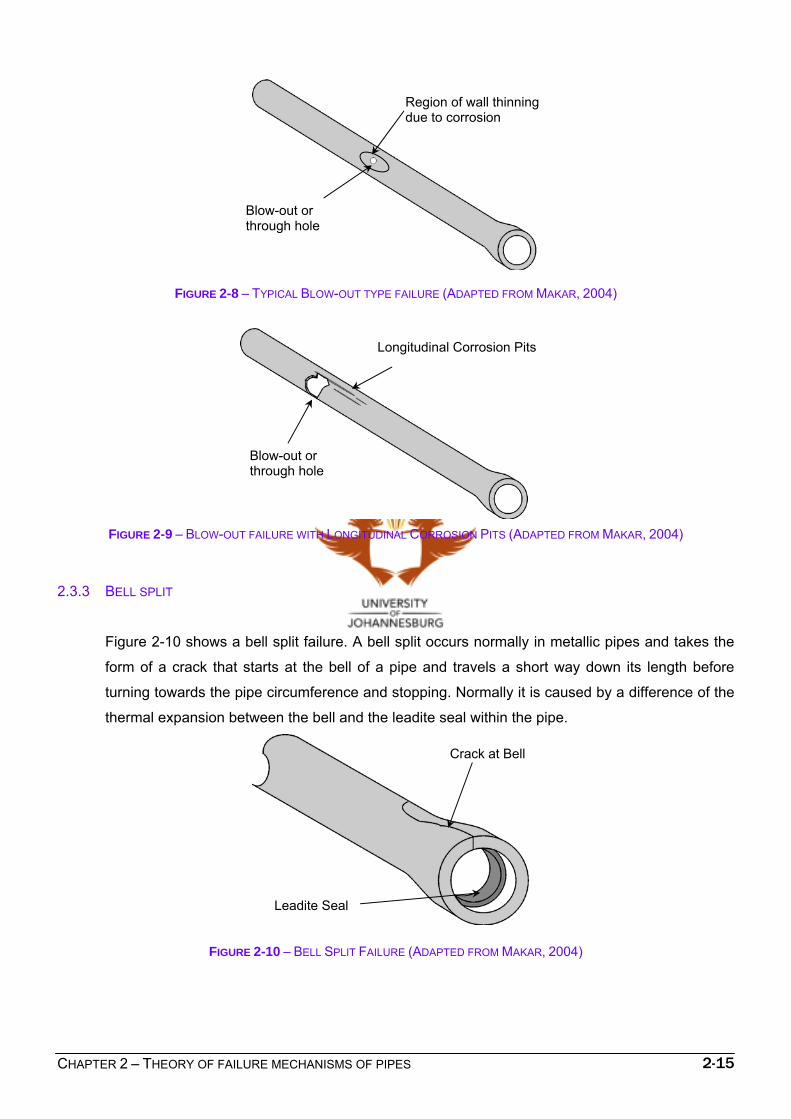
Figure 2-8 and 2-9 show a blow-out type failure that is caused by corrosion. While corrosion
pitting is related to bell splits and circumferential failures, it can also cause failures on its own.
This failure is caused by reducing the thickness of the wall in the pipe to the point where the
internal water pressure blows any remaining wall material. The results can be very small in size
or quite large.
Circumferential crack
CHAPTER 2 – THEORY OF FAILURE MECHANISMS OF PIPES 2-15
FIGURE 2-8 – TYPICAL BLOW-OUT TYPE FAILURE (ADAPTED FROM MAKAR, 2004)
FIGURE 2-9 – BLOW-OUT FAILURE WITH LONGITUDINAL CORROSION PITS (ADAPTED FROM MAKAR, 2004)
2.3.3 BELL SPLIT
Figure 2-10 shows a bell split failure. A bell split occurs normally in metallic pipes and takes the
form of a crack that starts at the bell of a pipe and travels a short way down its length before
turning towards the pipe circumference and stopping. Normally it is caused by a difference of the
thermal expansion between the bell and the leadite seal within the pipe.
FIGURE 2-10 – BELL SPLIT FAILURE (ADAPTED FROM MAKAR, 2004)
Blow-out or through hole
Region of wall thinning due to corrosion
Longitudinal Corrosion Pits
Blow-out or through hole
Crack at Bell
Leadite Seal
CHAPTER 2 – THEORY OF FAILURE MECHANISMS OF PIPES 2-16
2.3.4 SPIRAL
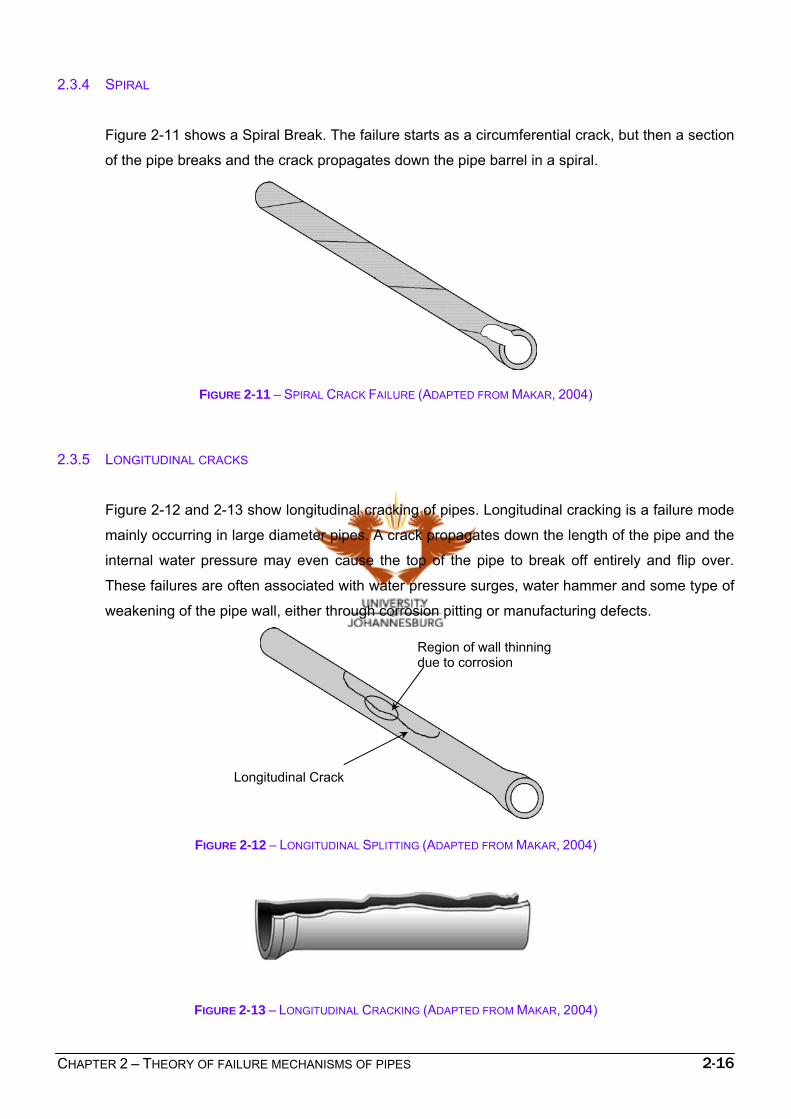
Figure 2-11 shows a Spiral Break. The failure starts as a circumferential crack, but then a section
of the pipe breaks and the crack propagates down the pipe barrel in a spiral.
FIGURE 2-11 – SPIRAL CRACK FAILURE (ADAPTED FROM MAKAR, 2004)
2.3.5 LONGITUDINAL CRACKS
Figure 2-12 and 2-13 show longitudinal cracking of pipes. Longitudinal cracking is a failure mode
mainly occurring in large diameter pipes. A crack propagates down the length of the pipe and the
internal water pressure may even cause the top of the pipe to break off entirely and flip over.
These failures are often associated with water pressure surges, water hammer and some type of
weakening of the pipe wall, either through corrosion pitting or manufacturing defects.
FIGURE 2-12 – LONGITUDINAL SPLITTING (ADAPTED FROM MAKAR, 2004)
FIGURE 2-13 – LONGITUDINAL CRACKING (ADAPTED FROM MAKAR, 2004)
Longitudinal Crack
Region of wall thinning due to corrosion
CHAPTER 2 – THEORY OF FAILURE MECHANISMS OF PIPES 2-17
2.3.6 WEDGE SPLITTING
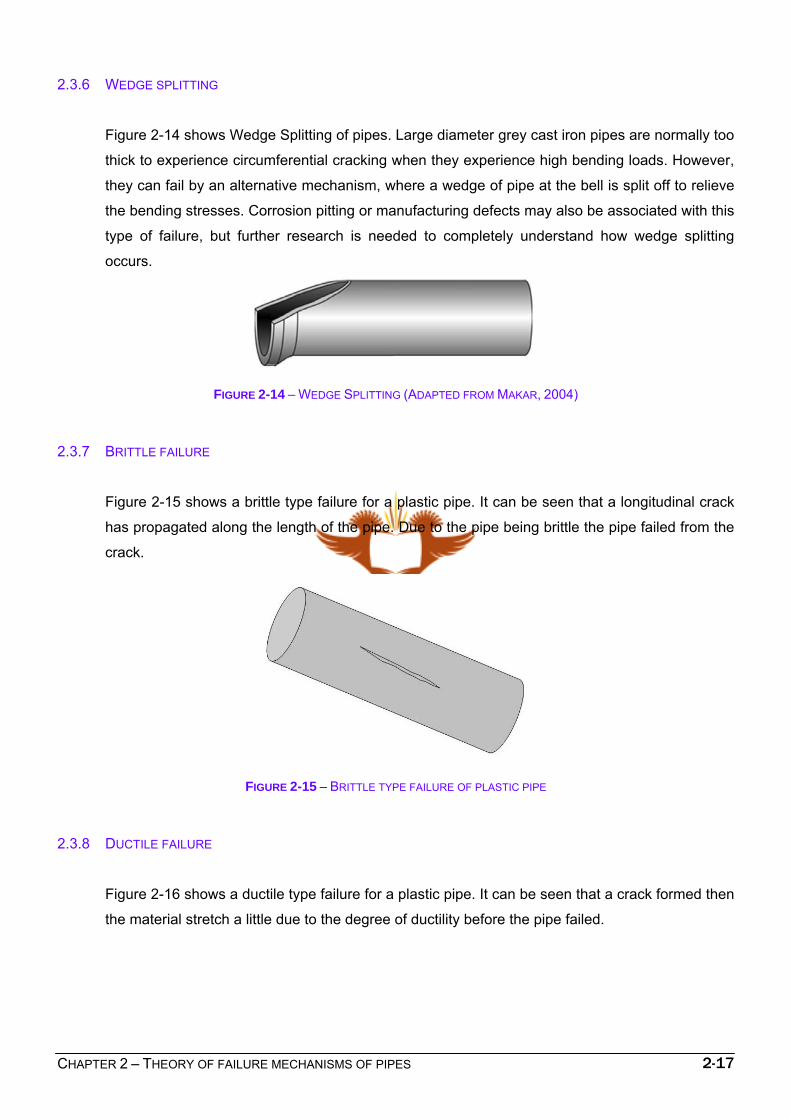
Figure 2-14 shows Wedge Splitting of pipes. Large diameter grey cast iron pipes are normally too
thick to experience circumferential cracking when they experience high bending loads. However,
they can fail by an alternative mechanism, where a wedge of pipe at the bell is split off to relieve
the bending stresses. Corrosion pitting or manufacturing defects may also be associated with this
type of failure, but further research is needed to completely understand how wedge splitting
occurs.
FIGURE 2-14 – WEDGE SPLITTING (ADAPTED FROM MAKAR, 2004)
2.3.7 BRITTLE FAILURE
Figure 2-15 shows a brittle type failure for a plastic pipe. It can be seen that a longitudinal crack
has propagated along the length of the pipe. Due to the pipe being brittle the pipe failed from the
crack.
FIGURE 2-15 – BRITTLE TYPE FAILURE OF PLASTIC PIPE
2.3.8 DUCTILE FAILURE
Figure 2-16 shows a ductile type failure for a plastic pipe. It can be seen that a crack formed then
the material stretch a little due to the degree of ductility before the pipe failed.
CHAPTER 2 – THEORY OF FAILURE MECHANISMS OF PIPES 2-18
FIGURE 2-16 – DUCTILE TYPE FAILURE OF A PLASTIC PIPE
2.4 MATERIAL FAILURES
Different pipe materials will fail by different mechanisms. In general, pipe materials are grouped
into three categories:
Metallics
Cement-based
Plastics
The UK Water Industry Research (UKWIR, 2005) has proposed to set up a database containing
information on failures of pipes. This database will contain information about how many pipes fail
per 100 km of pipeline, the type of failures as well as the monthly trends of failures for all pipe
materials. Within the following sub headings graphs will be shown for the rate per 100km of
pipeline for the various materials as well as a monthly trend of failure rates throughout the year
showing which materials fail more during certain months. And the last graphs will show which
type of failure a material is more susceptible to i.e. circumferential crack, blow-out etc.
2.4.1 METALLIC FAILURES
Metallic pipes (CSIRO, 2004) can fail by corrosion only or as a combination of corrosion and
excessive loading. Figure 2-17 shows a single corrosion pit at the outer surface of a grey cast
iron pipe.
CHAPTER 2 – THEORY OF FAILURE MECHANISMS OF PIPES 2-19
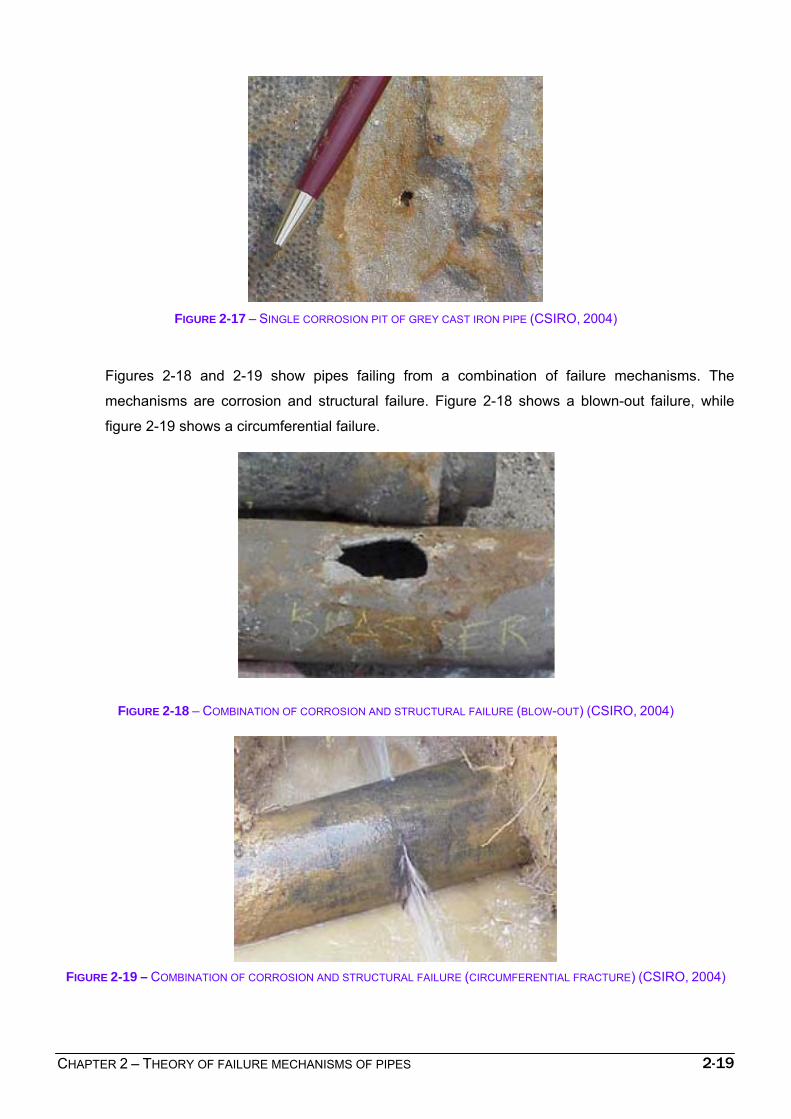
FIGURE 2-17 – SINGLE CORROSION PIT OF GREY CAST IRON PIPE (CSIRO, 2004)
Figures 2-18 and 2-19 show pipes failing from a combination of failure mechanisms. The
mechanisms are corrosion and structural failure. Figure 2-18 shows a blown-out failure, while
figure 2-19 shows a circumferential failure.
FIGURE 2-18 – COMBINATION OF CORROSION AND STRUCTURAL FAILURE (BLOW-OUT) (CSIRO, 2004)
FIGURE 2-19 – COMBINATION OF CORROSION AND STRUCTURAL FAILURE (CIRCUMFERENTIAL FRACTURE) (CSIRO, 2004)
CHAPTER 2 – THEORY OF FAILURE MECHANISMS OF PIPES 2-20
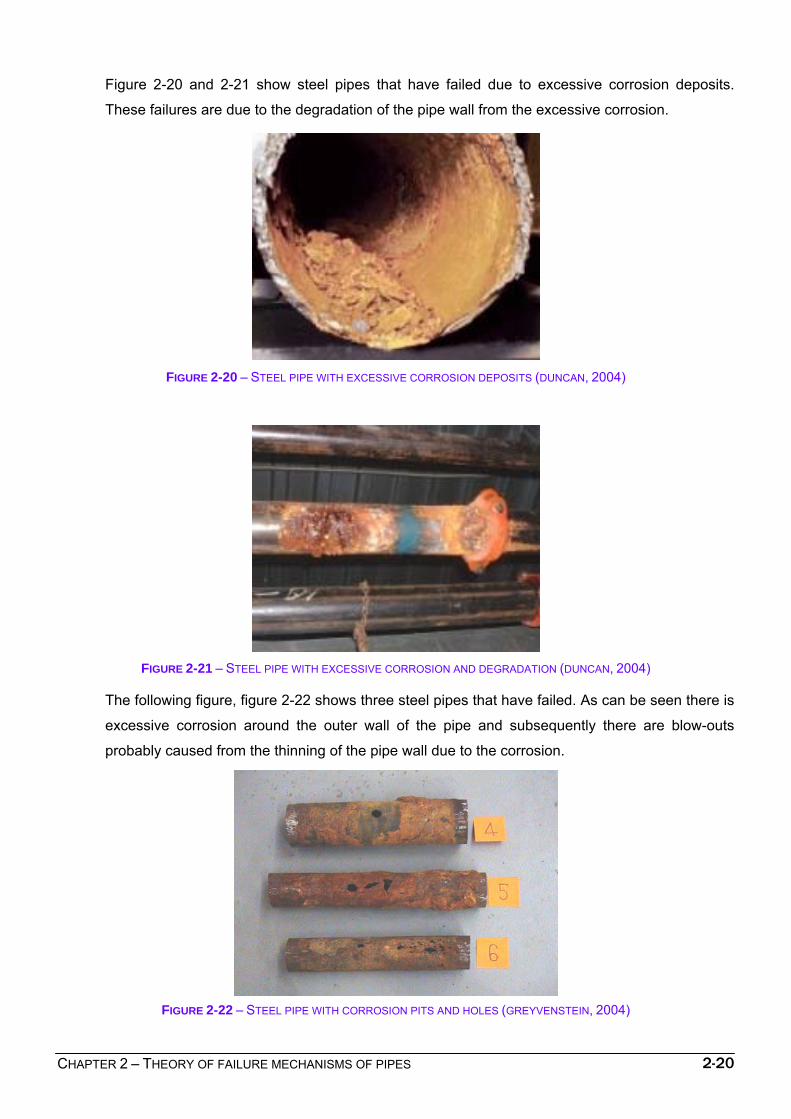
Figure 2-20 and 2-21 show steel pipes that have failed due to excessive corrosion deposits.
These failures are due to the degradation of the pipe wall from the excessive corrosion.
FIGURE 2-20 – STEEL PIPE WITH EXCESSIVE CORROSION DEPOSITS (DUNCAN, 2004)
FIGURE 2-21 – STEEL PIPE WITH EXCESSIVE CORROSION AND DEGRADATION (DUNCAN, 2004)
The following figure, figure 2-22 shows three steel pipes that have failed. As can be seen there is
excessive corrosion around the outer wall of the pipe and subsequently there are blow-outs
probably caused from the thinning of the pipe wall due to the corrosion.
FIGURE 2-22 – STEEL PIPE WITH CORROSION PITS AND HOLES (GREYVENSTEIN, 2004)
CHAPTER 2 – THEORY OF FAILURE MECHANISMS OF PIPES 2-21
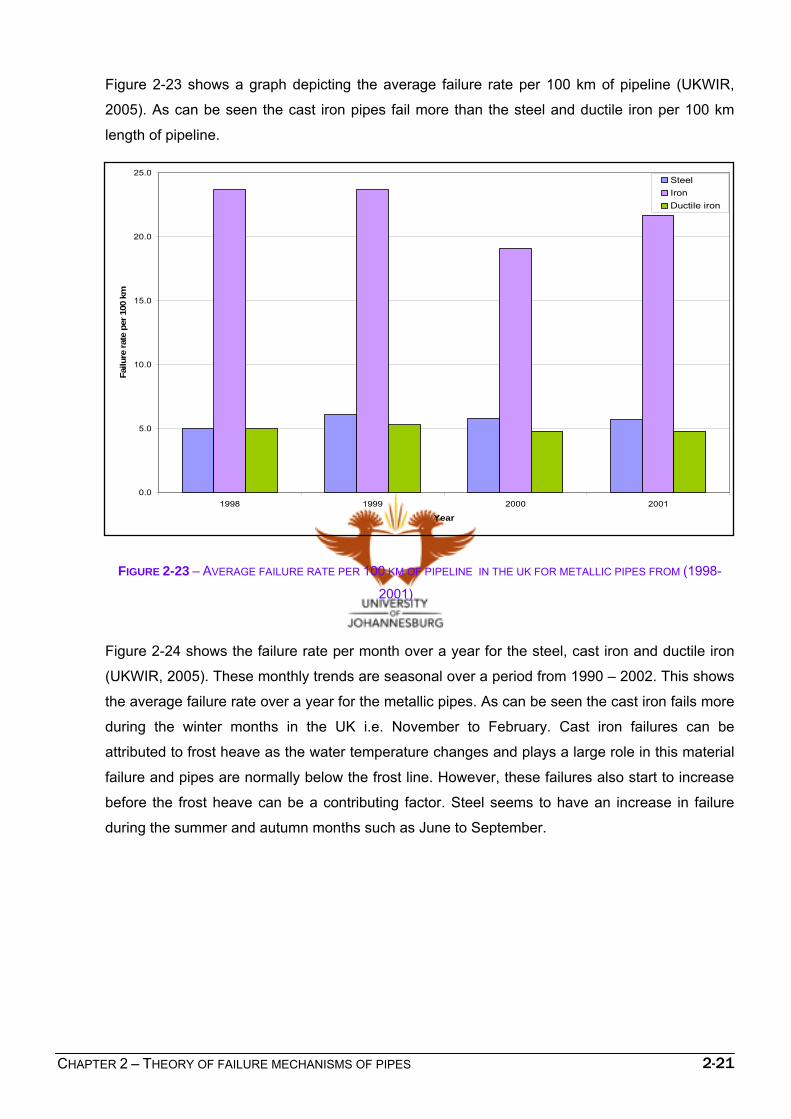
Figure 2-23 shows a graph depicting the average failure rate per 100 km of pipeline (UKWIR,
2005). As can be seen the cast iron pipes fail more than the steel and ductile iron per 100 km
length of pipeline.
FIGURE 2-23 – AVERAGE FAILURE RATE PER 100 KM OF PIPELINE IN THE UK FOR METALLIC PIPES FROM (1998-
2001)
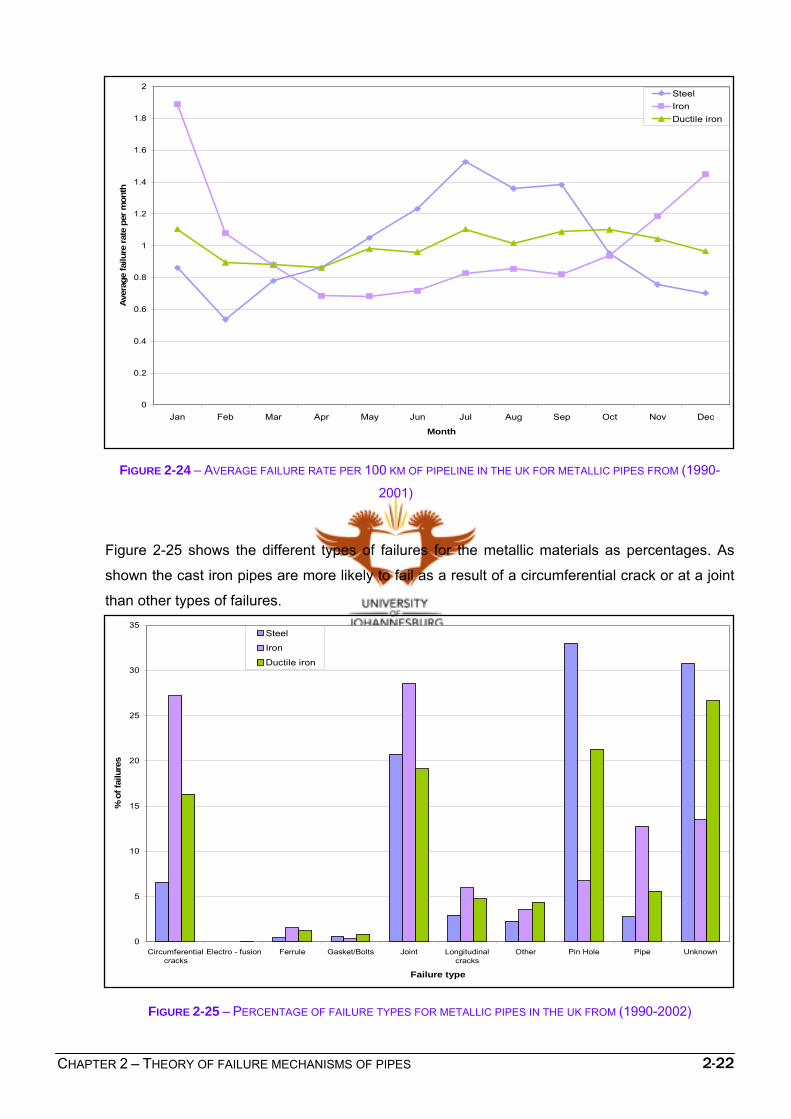
Figure 2-24 shows the failure rate per month over a year for the steel, cast iron and ductile iron
(UKWIR, 2005). These monthly trends are seasonal over a period from 1990 – 2002. This shows
the average failure rate over a year for the metallic pipes. As can be seen the cast iron fails more
during the winter months in the UK i.e. November to February. Cast iron failures can be
attributed to frost heave as the water temperature changes and plays a large role in this material
failure and pipes are normally below the frost line. However, these failures also start to increase
before the frost heave can be a contributing factor. Steel seems to have an increase in failure
during the summer and autumn months such as June to September.
0.0
5.0
10.0
15.0
20.0
25.0
1998 1999 2000 2001
Year
Failu
re ra
te p
er 1
00 k
m
SteelIronDuctile iron
CHAPTER 2 – THEORY OF FAILURE MECHANISMS OF PIPES 2-22
FIGURE 2-24 – AVERAGE FAILURE RATE PER 100 KM OF PIPELINE IN THE UK FOR METALLIC PIPES FROM (1990-
2001)
Figure 2-25 shows the different types of failures for the metallic materials as percentages. As
shown the cast iron pipes are more likely to fail as a result of a circumferential crack or at a joint
than other types of failures.
FIGURE 2-25 – PERCENTAGE OF FAILURE TYPES FOR METALLIC PIPES IN THE UK FROM (1990-2002)
0
0.2
0.4
0.6
0.8
1
1.2
1.4
1.6
1.8
2
Jan Feb Mar Apr May Jun Jul Aug Sep Oct Nov Dec
Month
Ave
rage
failu
re ra
te p
er m
onth
SteelIronDuctile iron
0
5
10
15
20
25
30
35
Circumferentialcracks
Electro - fusion Ferrule Gasket/Bolts Joint Longitudinalcracks
Other Pin Hole Pipe Unknown
Failure type
% o
f fai
lure
s
Steel
Iron
Ductile iron
CHAPTER 2 – THEORY OF FAILURE MECHANISMS OF PIPES 2-23
2.4.2 CEMENT-BASED FAILURES
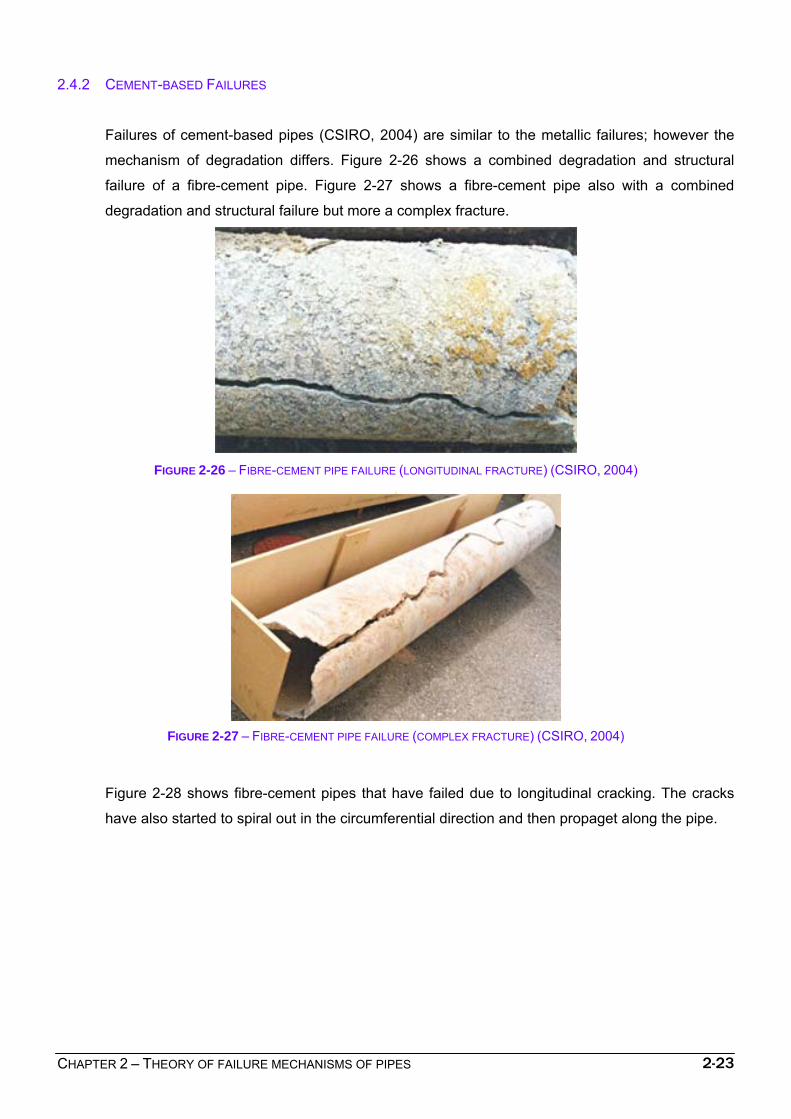
Failures of cement-based pipes (CSIRO, 2004) are similar to the metallic failures; however the
mechanism of degradation differs. Figure 2-26 shows a combined degradation and structural
failure of a fibre-cement pipe. Figure 2-27 shows a fibre-cement pipe also with a combined
degradation and structural failure but more a complex fracture.
FIGURE 2-26 – FIBRE-CEMENT PIPE FAILURE (LONGITUDINAL FRACTURE) (CSIRO, 2004)
FIGURE 2-27 – FIBRE-CEMENT PIPE FAILURE (COMPLEX FRACTURE) (CSIRO, 2004)
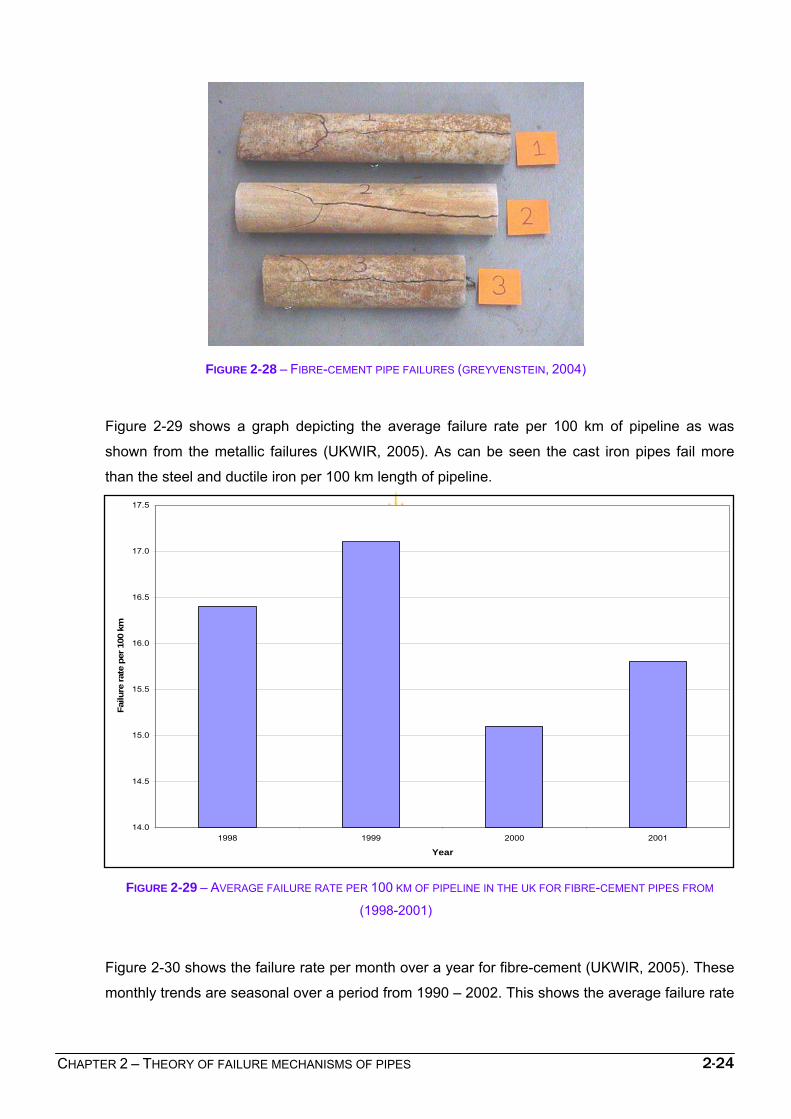
Figure 2-28 shows fibre-cement pipes that have failed due to longitudinal cracking. The cracks
have also started to spiral out in the circumferential direction and then propaget along the pipe.
CHAPTER 2 – THEORY OF FAILURE MECHANISMS OF PIPES 2-24
FIGURE 2-28 – FIBRE-CEMENT PIPE FAILURES (GREYVENSTEIN, 2004)
Figure 2-29 shows a graph depicting the average failure rate per 100 km of pipeline as was
shown from the metallic failures (UKWIR, 2005). As can be seen the cast iron pipes fail more
than the steel and ductile iron per 100 km length of pipeline.
FIGURE 2-29 – AVERAGE FAILURE RATE PER 100 KM OF PIPELINE IN THE UK FOR FIBRE-CEMENT PIPES FROM
(1998-2001)
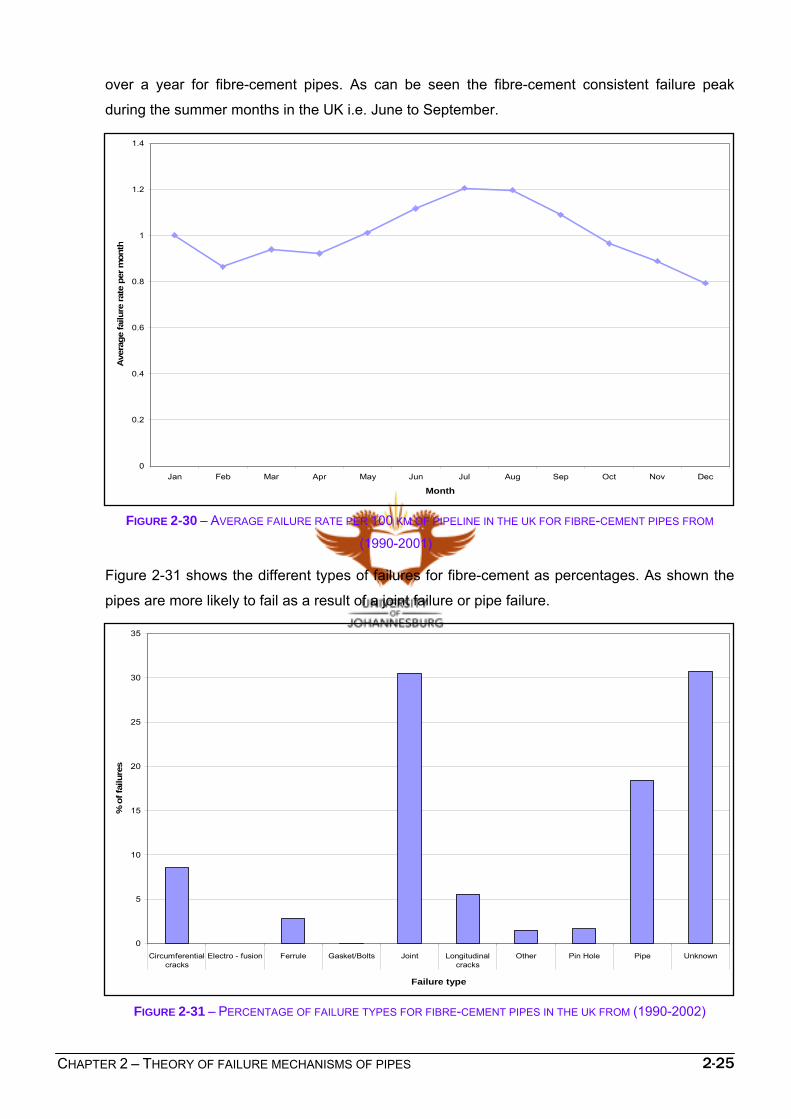
Figure 2-30 shows the failure rate per month over a year for fibre-cement (UKWIR, 2005). These
monthly trends are seasonal over a period from 1990 – 2002. This shows the average failure rate
14.0
14.5
15.0
15.5
16.0
16.5
17.0
17.5
1998 1999 2000 2001
Year
Failu
re ra
te p
er 1
00 k
m
CHAPTER 2 – THEORY OF FAILURE MECHANISMS OF PIPES 2-25
over a year for fibre-cement pipes. As can be seen the fibre-cement consistent failure peak
during the summer months in the UK i.e. June to September.
FIGURE 2-30 – AVERAGE FAILURE RATE PER 100 KM OF PIPELINE IN THE UK FOR FIBRE-CEMENT PIPES FROM
(1990-2001)
Figure 2-31 shows the different types of failures for fibre-cement as percentages. As shown the
pipes are more likely to fail as a result of a joint failure or pipe failure.
FIGURE 2-31 – PERCENTAGE OF FAILURE TYPES FOR FIBRE-CEMENT PIPES IN THE UK FROM (1990-2002)
0
0.2
0.4
0.6
0.8
1
1.2
1.4
Jan Feb Mar Apr May Jun Jul Aug Sep Oct Nov Dec
Month
Ave
rage
failu
re ra
te p
er m
onth
0
5
10
15
20
25
30
35
Circumferentialcracks
Electro - fusion Ferrule Gasket/Bolts Joint Longitudinalcracks
Other Pin Hole Pipe Unknown
Failure type
% o
f fai
lure
s
CHAPTER 2 – THEORY OF FAILURE MECHANISMS OF PIPES 2-26
2.4.3 PLASTIC FAILURES
Plastic pipes (CSIRO, 2004) are relatively ‘young’ pipes so their failure mechanisms are still not
completely understood however these pipes also fail and therefore have to be studied. Plastics
are a unique material that can be ductile under one condition, and with a relatively small change
in conditions be brittle. A common example of this is seen with Silly Putty®. If one pulls this
material slowly it can be stretched almost indefinitely (ductile). However, if one pulls quickly on
this material it breaks (brittle).
Decreasing the temperature of the Silly Putty®, decreases the stretching rate at which it
becomes brittle. In essence, plastics have important properties that are temperature and time
(rate) dependent, a characteristic that is not seen with other materials. This is an important
consideration when designing a part out of plastic. If the engineer does not take this into account,
a plastic part may be able to absorb loads under one condition, but completely fail under another
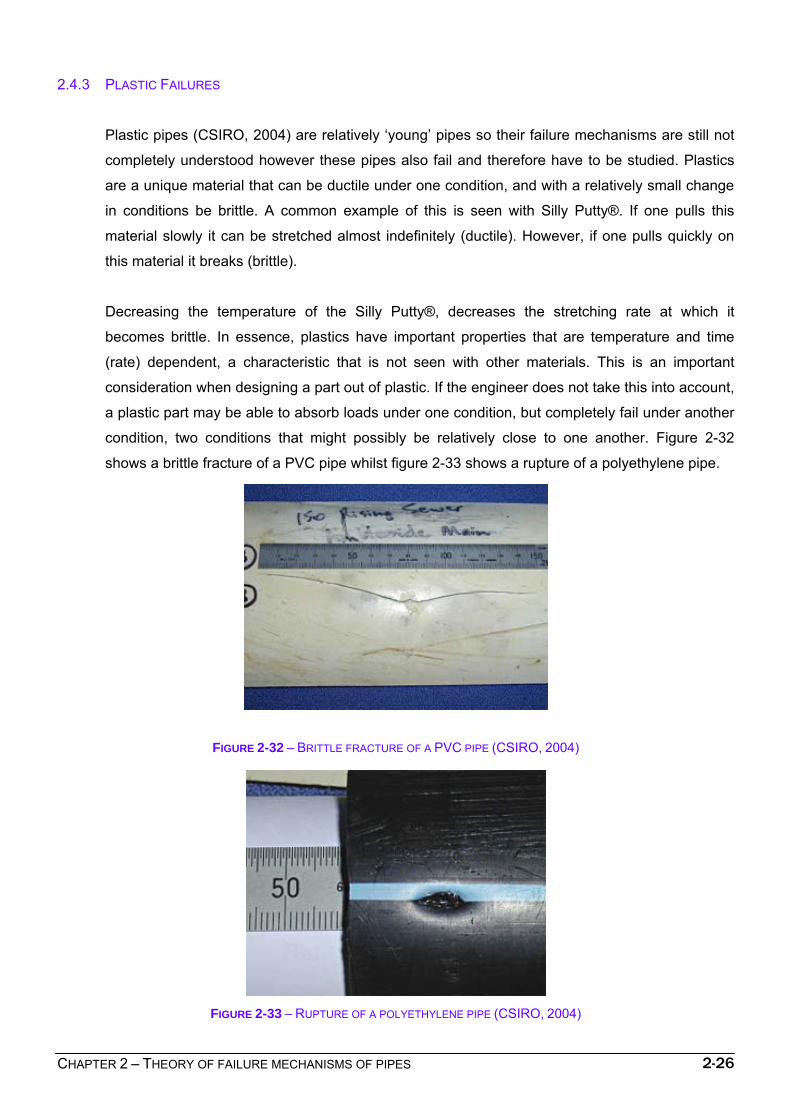
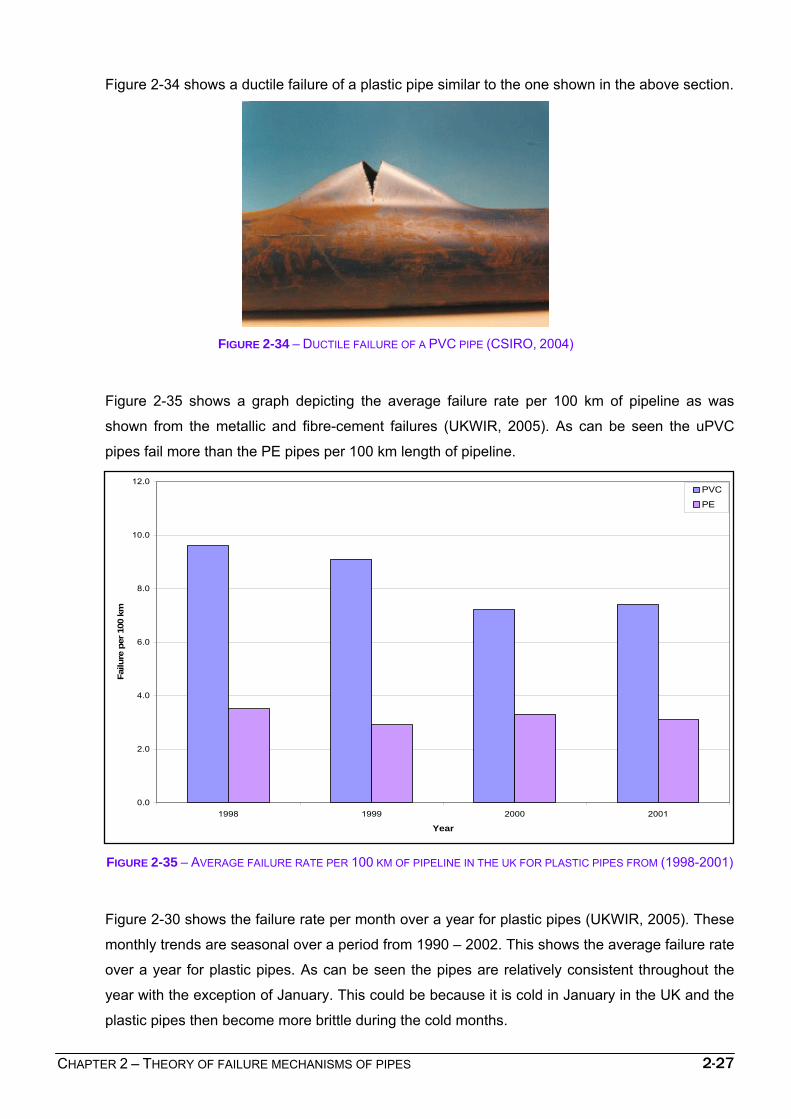
condition, two conditions that might possibly be relatively close to one another. Figure 2-32
shows a brittle fracture of a PVC pipe whilst figure 2-33 shows a rupture of a polyethylene pipe.
FIGURE 2-32 – BRITTLE FRACTURE OF A PVC PIPE (CSIRO, 2004)
FIGURE 2-33 – RUPTURE OF A POLYETHYLENE PIPE (CSIRO, 2004)
CHAPTER 2 – THEORY OF FAILURE MECHANISMS OF PIPES 2-27
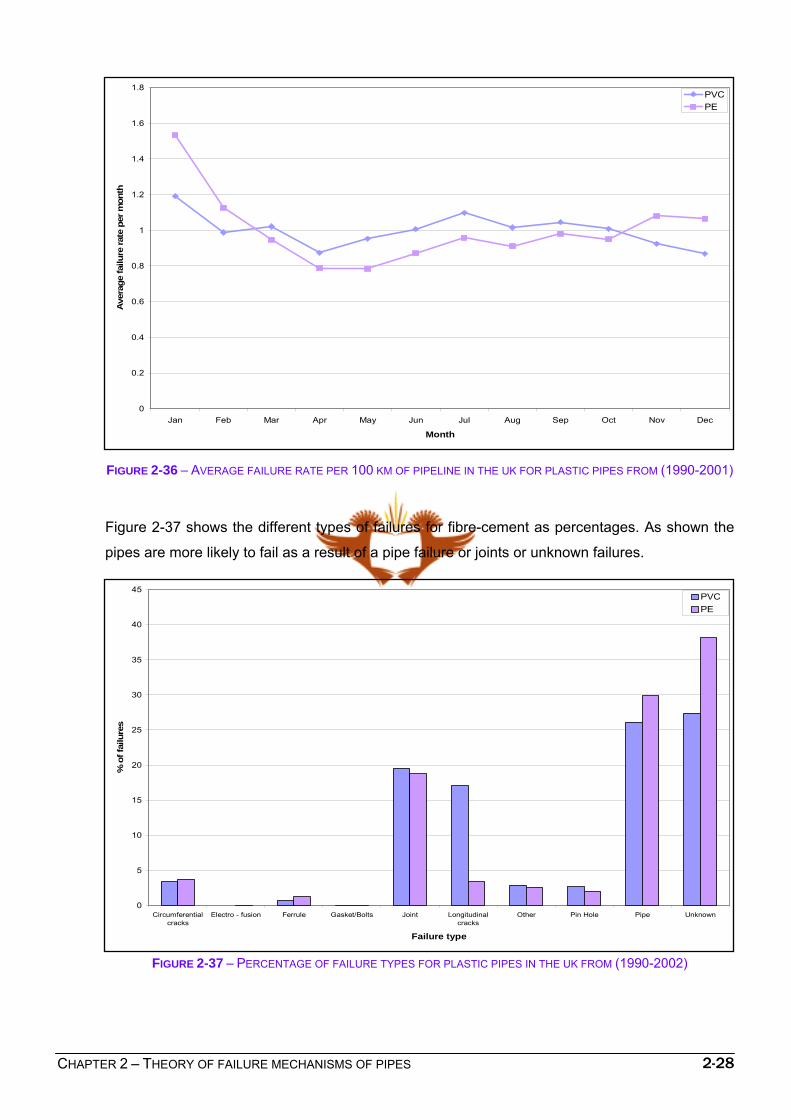
Figure 2-34 shows a ductile failure of a plastic pipe similar to the one shown in the above section.
FIGURE 2-34 – DUCTILE FAILURE OF A PVC PIPE (CSIRO, 2004)
Figure 2-35 shows a graph depicting the average failure rate per 100 km of pipeline as was
shown from the metallic and fibre-cement failures (UKWIR, 2005). As can be seen the uPVC
pipes fail more than the PE pipes per 100 km length of pipeline.
FIGURE 2-35 – AVERAGE FAILURE RATE PER 100 KM OF PIPELINE IN THE UK FOR PLASTIC PIPES FROM (1998-2001)
Figure 2-30 shows the failure rate per month over a year for plastic pipes (UKWIR, 2005). These
monthly trends are seasonal over a period from 1990 – 2002. This shows the average failure rate
over a year for plastic pipes. As can be seen the pipes are relatively consistent throughout the
year with the exception of January. This could be because it is cold in January in the UK and the
plastic pipes then become more brittle during the cold months.
0.0
2.0
4.0
6.0
8.0
10.0
12.0
1998 1999 2000 2001
Year
Failu
re p
er 1
00 k
m
PVC
PE
CHAPTER 2 – THEORY OF FAILURE MECHANISMS OF PIPES 2-28
FIGURE 2-36 – AVERAGE FAILURE RATE PER 100 KM OF PIPELINE IN THE UK FOR PLASTIC PIPES FROM (1990-2001)
Figure 2-37 shows the different types of failures for fibre-cement as percentages. As shown the
pipes are more likely to fail as a result of a pipe failure or joints or unknown failures.
FIGURE 2-37 – PERCENTAGE OF FAILURE TYPES FOR PLASTIC PIPES IN THE UK FROM (1990-2002)
0
0.2
0.4
0.6
0.8
1
1.2
1.4
1.6
1.8
Jan Feb Mar Apr May Jun Jul Aug Sep Oct Nov Dec
Month
Ave
rage
failu
re ra
te p
er m
onth
PVCPE
0
5
10
15
20
25
30
35
40
45
Circumferentialcracks
Electro - fusion Ferrule Gasket/Bolts Joint Longitudinalcracks
Other Pin Hole Pipe Unknown
Failure type
% o
f fai
lure
s
PVCPE


![1-[2-(3,4-Dichlorobenzyloxy)-2-phenylethyl]-1 H -benzimidazole](https://static.fdokumen.com/doc/165x107/63152ee185333559270d05af/1-2-34-dichlorobenzyloxy-2-phenylethyl-1-h-benzimidazole.jpg)

