Hybrid brain-computer interface and functional electrical stimulation for sensorimotor training in...
38
Hybrid Brain-Computer Interface and Functional Electrical Stimulation for Sensorimotor Training in Participants with Tetraplegia: A Proof-of-Concept Study Aleksandra Vuckovic 1 , Leslie Wallace 2 , David B. Allan 2 1 Biomedical Engineering Research Division, School of Engineering, University of Glasgow, James Watt (south) building, G12 8QQ Glasgow, UK Email:[email protected] 2 Queen Elizabeth National Spinal Cord Injuries Unit, Southern General Hospital, 1345 Govan road, G51 4TF Glasgow, UK Email: [email protected] ABSTRACT Background and Purpose: Bilateral impairment of hand function in persons with tetraplegia decreases quality of life. The purpose of the study was to test whether functional electrical stimulation (FES) controlled by a hybrid brain-computer interface (BCI) could be used for rehabilitation of the hand in participants with tetraplegia. This case series documents a concept of simultaneous training of efferent (motor) and afferent (sensory) pathways across the injury site. Methods: Two participants with subacute tetraplegia took part in this proof-of-concept study. The primary goal was to determine whether the BCI system could drive the FES device by accurately classifying the participants’ intent (open or close the hand) based on the brain signals. Participant 1 had C5 Brown-Sequard syndrome, while Participant 2 had a complete C5 lesion. Participants 1 and 2 received 10 sessions and 4 sessions of BCI-FES respectively. Novel time-switch BCI strategy to activate FES was based on motor imagery. In one of the sessions, a hybrid BCI-FES based on two spontaneously generated brain rhythms was tested. The BCI used a sensory-motor rhythm during motor imagery to activate a stimulator, and
-
Upload
independent -
Category
Documents
-
view
5 -
download
0
Transcript of Hybrid brain-computer interface and functional electrical stimulation for sensorimotor training in...
Hybrid Brain-Computer Interface and Functional Electrical Stimulation for Sensorimotor
Training in Participants with Tetraplegia: A Proof-of-Concept Study
Aleksandra Vuckovic1, Leslie Wallace2, David B. Allan2
1Biomedical Engineering Research Division, School of Engineering, University of Glasgow,
James Watt (south) building, G12 8QQ Glasgow, UK
Email:[email protected]
2Queen Elizabeth National Spinal Cord Injuries Unit, Southern General Hospital, 1345 Govan
road, G51 4TF Glasgow, UK
Email: [email protected]
ABSTRACT
Background and Purpose: Bilateral impairment of hand function in persons with tetraplegia
decreases quality of life. The purpose of the study was to test whether functional electrical
stimulation (FES) controlled by a hybrid brain-computer interface (BCI) could be used for
rehabilitation of the hand in participants with tetraplegia. This case series documents a
concept of simultaneous training of efferent (motor) and afferent (sensory) pathways across
the injury site.
Methods: Two participants with subacute tetraplegia took part in this proof-of-concept study.
The primary goal was to determine whether the BCI system could drive the FES device by
accurately classifying the participants’ intent (open or close the hand) based on the brain
signals. Participant 1 had C5 Brown-Sequard syndrome, while Participant 2 had a complete
C5 lesion. Participants 1 and 2 received 10 sessions and 4 sessions of BCI-FES respectively.
Novel time-switch BCI strategy to activate FES was based on motor imagery. In one of the
sessions, a hybrid BCI-FES based on two spontaneously generated brain rhythms was tested.
The BCI used a sensory-motor rhythm during motor imagery to activate a stimulator, and
2
occipital alpha rhythms to deactivate the stimulator. Participants received BCI-FES therapy
2-3 times a week in addition to the conventional therapy. Imagery ability and strength of the
hand muscles were measured before and after the treatment.
Results: Both participants learned to operate the BCI-FES system on the first session. For
Participant 1, average classification accuracy for motor imagery based BCI was 83.5% (left
hand) and 83.8% (right hand), Participant 2 had a classification accuracy of 83.8% for the
right hand. Visual feedback was associated with a fourfold increase of brain response during
imagination of movement in both participants. Participant 1 had moderate improvement in
functional outcome while there was no change for Participant 2.
Discussion and Conclusion: We demonstrated feasibility of BCI-FES for simultaneous
sensory-motor training using two naturally generated brain rhythms. Studies on larger
number of participants would be needed to separate the effect of training from the effect of
the natural recovery.
Video Abstract available (see Video, Supplemental Digital Content 1,
http://links.lww.com/JNPT/xx) for more insights from the authors
Keywords: Brain computer interface, Functional electrical stimulation, Tetraplegia, Motor imagery,
Even related desynchronisation

3
BACKGROUND AND PURPOSE
Motor imagery (MI) activates brain areas similar to those activated with voluntary
movement, and is potentially a powerful tool to promote motor rehabilitation.1 There have
been two studies on the effect of motor imagery in participants with spinal cord injury (SCI)
showing potential for improving hand trajectory after tendonesis.2,3 The major problem with
motor imagery is how to assist participants to imagine moving their paralyzed limbs. With
the advent of brain computer interface (BCI) it has become possible to measure the brain
activity associated with imagining movements. 4,5,6 However, previous BCI studies performed
on participants with chronic SCI focused on developing assistive devices for a long term use,
rather than using BCI for rehabilitation of motor function.4
Prior studies of BCI for rehabilitation have primarily focused on persons with stroke, 5,6
this focus has practical significance as BCI promotes functional reorganization of the cortical
structures.7,8 To date, the scientific community has not explored the potential of BCI for
rehabilitation of participants with SCI, although it is believed that only 10% of spared
neuronal pathways is sufficient to provide a functional recovery.9 In patients with SCI
reorganization occurs at the cortical and sub-cortical level, 10 causing spinal cord atrophy,11
cortical atrophy12,13 and cortical reorganization of sensory-motor cortex.14-17 BCI targeting
training of cortical structures may increase the volume of activation of the motor cortex
controlling muscles affected by a SCI. At the same time it may also impact secondary
complications such as phantom limb sensation and neuropathic pain.18-20
In humans, it is not possible to record from or modulate neuronal activity originating from
the spinal cord with non-invasive approaches, but it is believed that input from the brain and
periphery may promote activity-dependent plasticity of spinal cord circuits.21-22 From that
perspective a therapy based on combined simultaneous activation of the motor pathways
4
(through MI) and the sensory pathways (through FES) of the corticospinal tract should have
a bigger effect than both therapies alone.8,23 This is supported by the principle of Hebbian
learning,24 i.e. ‘things that fire together wire together’. Studies on able-bodied people show
that peripheral electrical stimulation enhances motor evoked potential in people performing
either real25 or imagined movements.26
Prior studies of BCI-driven FES in participants with stroke were not concerned with the
integrity of the afferent sensory pathways, and therefore brain responses to FES were not
measured. In participants with SCI activation of sensory-motor cortex through FES would be
a prerequisite for successful therapy. To enable a fully participant-driven system capable of
controlling both activation and deactivation of FES at the participant’s own pace, we
developed a hybrid on/off BCI switch that relies on two spontaneously generated brain
rhythms, the sensory-motor and the occipital alpha rhythm. The novelty of the proposed
system is that, unlike hybrid systems in the literature that rely on a combination of evoked
and externally induced rhythms, 27 this system is solely based on two participant-generated
EEG rhythms and as such does not require any additional external device to initiate either an
on or off command.
In this study we tested the feasibility of using BCI-FES system on two participants with
sub-acute tetraplegia in a realistic clinical environment. We assessed simultaneous activation
of sensory and motor pathways by recording neuromuscular and cortical responses over
repeated treatment sessions. We also tested hybrid on/off BCI switch in one of the treatment
sessions.
5
CASE DESCRIPTION
Participants
Two male participants with tetraplegia (both right-handed) participated in the study. Level
and severity of injury were assessed based on the American Spinal Cord Injury Association
(ASIA) international standards for the neurological classification of spinal cord injury,28,29 as
a part of participants’ regular medical treatment prior to commencing the study. Sensation to
light touch and two-point discrimination were tested to assess the integrity of the sensory
pathways for proprioception, touch and vibration and pinprick test was used to test the
integrity of pain and temperature sensory pathways. In both participants, FES produced
visible brain responses for all tested hand muscles, confirming their suitability for the study.
Participant 1, aged 45 years, was 3 months post injury, and was classified by the ASIA
Impairment Scale (AIS) as AIS B, with an incomplete hemi-section (i.e, Brown-Sequard
syndrome) of the spinal cord at level C5. In his left upper extremity, Participant 1 had
preserved sensation of light touch and vibration, but no sensation of pain and temperature in
the C6 – C8 distribution. This participant had a motor score 1/5 for wrist extension with a
zone of partial preservation extending to the C8 distribution. In his right upper extremity he
had preserved motor function (5/5 throughout) and sensation of pain and temperature but no
sensation of light touch and vibration in his C7-T1 distribution. Participant 2, aged 32 years,
was 4 months post C5 injury, and was classified as AIS A (no anal sensation). This
participant had motor score 1/5 for wrist extension with scores 0/5 in the C7-T1. Despite the
AIS classification, as noted above, the application of FES to the hand muscles produced
visible brain waves in this subject. The Oxford Manual Muscle test30 was used to assess the
function of the hand muscles before and after the experimental treatment (see Table 1).
<<<insert Table 1 about here>>>

6
At the time of the study both participants were hospitalized receiving their regular
occupational therapy 5 times a week for one hour. Participants received BCI-FES therapy 2-3
times per week. Participant 1 was involved in the study for 4 weeks (10 sessions) while
Participant 2 was involved in the study for 2 weeks (4 sessions). The study was conducted in
accordance with the Declaration of Helsinki and was approved by the regional hospital
Ethical Committee. Both participants provided informed consent.
INTERVENTION PROTOCOL
Recording and Testing Procedures:
The EEG was recorded using the gtec EEG amplifier (Guger Technologies, Austria). A
ground electrode was connected to the participants’ left ear. Bipolar EEG was recorded from
electrode location CF3-CP3 and CF4-CP3 (based on the internationally recognized 10-20
system of electrode placement). The sampling frequency was 256 Hz and the EEG signal was
filtered between the 0.5 and 30 Hz. Impedance was kept under 5kΩ.
Electrical stimulation (Rehastim, Hasomed, Switzerland) was applied using bipolar
electrodes placed on the wrist extensor muscles (extensor carpi radialis longus). Stimulation
parameters were: pulse duration 300 µs, amplitude 15 mA, frequency 30 Hz. The stimulus
amplitude was set to produce a visible wrist extension and was kept constant throughout the
study. Pulse amplitude gradually increased during first 5s to minimize discomfort. One
bipolar channel, located over the corresponding contralateral cortex, was used to control FES
applied to produce activation of the respective wrist extensor muscles.
The participants’ ability to generate imagined movements was tested using Kinesthetic and
Visual Imagery Questionnaire (KVIQ)31 with a 5-point rating scale (1 no imagery, 5 excellent
7
imagery), separated for kinesthetic (KI) and visual imagery (VI). The experiment consisted of
two phases. In the first phase (assessment phase), participants performed a cue-based motor
imagery task. This task was used to produce Event-Related Synchronisation/
Desynchronisation maps (ERS/ERD)32 to determine frequency bands that were most reactive
to motor imagery. These frequency bands were used in the second phase to control FES. In
the second phase (treatment phase), participants took a part in a multi-session BCI-FES
study. ERD/ERS were also calculated in the treatment phase to demonstrate activation of FES
by self-paced motor imagery. ERD/ERS presents the relative change of power of the EEG
signal across a range of frequency bands during motor imagery as compared to a reference
period. Desynchronisation (ERD) shows a relative drop in energy during motor imagery and
is related to the increased cortical activity during imagery of the motor task. In its simplified
version, for a chosen frequency band, ERS/ERD is calculated as
( )100%/ ⋅−=
R
REERDERS
Where E is ‘an event’, e.g. motor imagery and R is ‘a reference period’ preceding the event.
ERS/ERD maps were created in EEGLab,33 under Matlab version 2009 (The MathWorks
Inc., Natick, MA, USA). Time-frequency analysis was performed using a sinusoidal wavelet
with minimum 3 wavelet cycles per data window at lowest frequencies. To present
statistically significant areas a t-percentile bootstrap method was used with a significance
level α=0.05 (N=2000 trials) with a False Discovery Rate34 correction for multiple
comparisons.
Cue-based motor imagery task
The cue-based motor imaginary task was a part of the assessment phase. Participants sat in
front of a computer screen that was positioned approximately 1.5m in front of them. They
were instructed to perform kinesthetic motor imagery of activities performed mentally with

8
their left or right hand, depending on the direction of the on-screen cue. An arrow symbol
pointing rightward was a cue to perform the motor imaginary task with the right hand, while
an arrow pointing leftward was a cue to perform the motor imaginary task with the left hand.
Experimental paradigm is shown in Fig. 1. A single trial consisted of the following: at t=0s a
warning sign (a cross) appeared on the screen and stayed there until t=5s. At t=1s an arrow
appeared on the screen and stayed there until t=2.25s. Participants were instructed to imagine
that they were waving with the cued hand from the moment the arrow appeared on the screen
until the moment a cross disappeared from the screen, i.e. from t=1s until t=5s. The rightward
and leftward pointing arrows appeared in a random order. The time between the two trials
was also random, between 5s and 8s.
Each session was divided into smaller sub-sessions, each sub-session lasting about 5
minutes, and consisting of 20 trials (10 trials for the right and 10 for the left hand). The BCI
paradigm was developed using the BioSig Open Source package.35 Participant 1 had 6 sub-
sessions (60 trials of each hand, 120 trials in total), in each of the 10 sessions in which he
participated. Participant 2 had 4 sub-sessions (40 trials of each hand, 80 trials in total) due to
limited sitting time, resulting in reduced duration of the sessions for each of the 4 sessions in
which he participated. The ERD/ERS maps were calculated with respect to the reference
period (R in Equation 1) before the warning sign, from t=-0.5s until t=-1.5s. The event (E in
Equation 1) was the whole period of motor imagery, from t=1s until t=5s.
Figure 1 about here
BCI-controlled Functional Electrical Stimulation
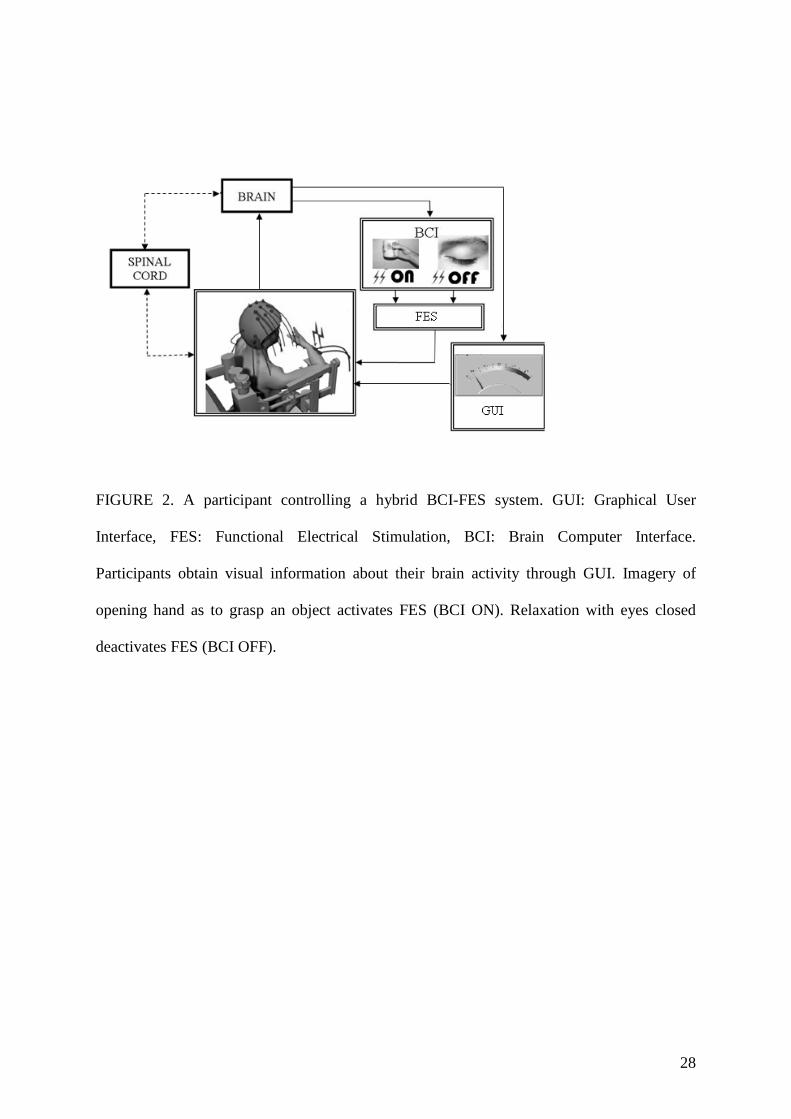
BCI-controlled FES was a part of the treatment phase. The experimental setup is shown in
Figure 2. We asked participants to imagine extending the wrist and opening the hand as to
9
grasp an object and to imagine sensation in their muscles as if opening the hand (kinesthetic
imagery). The BCI detected the participants’ intention to open their hand and used it as a
control signal to activate the FES, thereby opening the participant’s hand (FES ON; Fig 2).
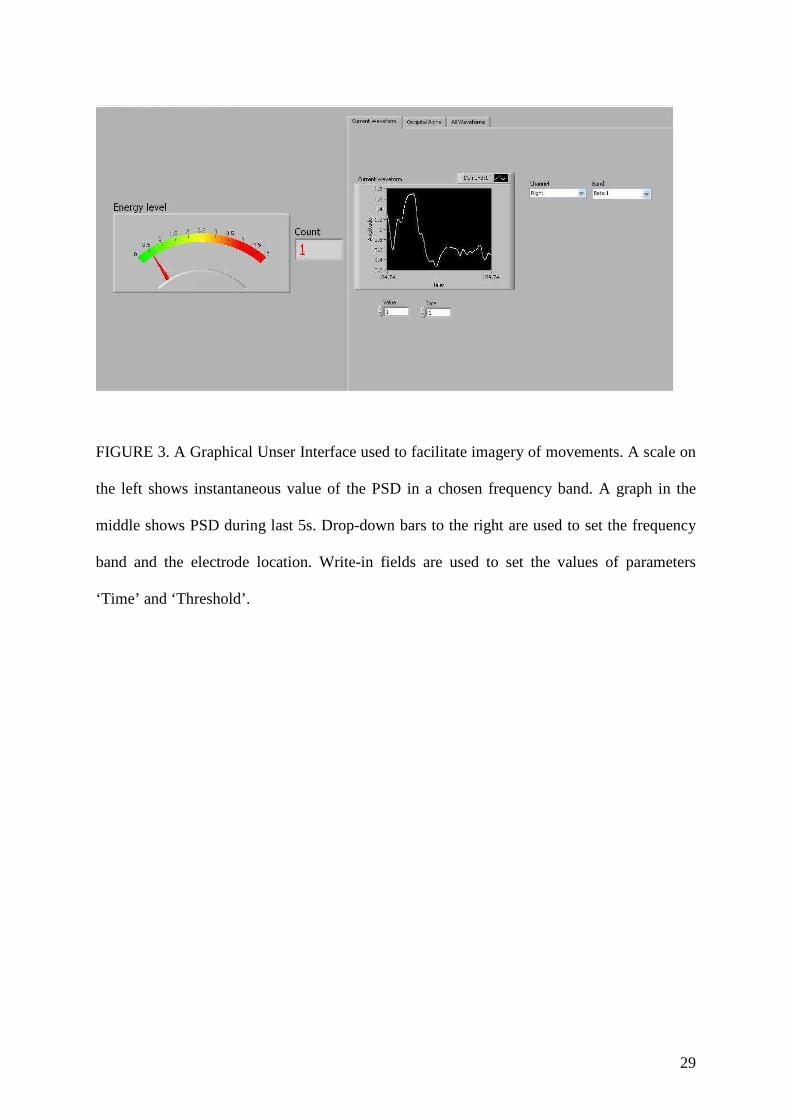
To facilitate motor imagery, a graphical user interface in the form of a scale (Fig 3) was used
to provide participants with visual feedback of their brain activity. To deactivate the
stimulator (FES OFF; Fig 2) participants closed their eyes and relaxed, thus generating OFF
command signal for the FES device. Alternatively FES could be switched off automatically
after 10s. (Note that images related to ‘FES ON’ and ‘FES OFF’ in Figure 2 represent a
schematic illustration of the tasks and were not shown to the participants. Graphical user
interface shown to participants is presented in Figure 3.)
Figure 2 about here
The on-line environment was developed in Simulink/Matlab version 2009 (The
MathWorks Inc., Natick, MA, USA), which had representative modules of both the EEG
device (gtec.usbamp, Guger technologies, Austria) and of the electrical stimulator (Rehastim,
Hasomed, Switzerland). A graphical user interface was designed in LabView 9 (National
Instruments, Austin, TX, USA), which communicated with Simulink via the Simulation
Interface Toolkit. The graphical user interface had three screens: Screen 1 (Fig. 3) was used
for participants’ training to improve motor imagery and provide visual feedback of the Power
spectral density (PSD). PSD value was used to activate FES through BCI. Screen 2 was used
to setup parameters for the occipital alpha rhythm control for a hybrid BCI. Screen 3
provided a simultaneous overview of the PSD in all five frequency bands. Screens 2 and 3
were used by the experimenter only.
Figure 3 about here
10
To the left of Screen 1 there was a scale with an indicator, providing the instantaneous
value of the PSD in one of the following frequency bands: delta, theta, mu/alpha, beta 1 (12-
16 Hz) and beta 2 (16-24 Hz) rhythms. These five bands cover the main frequency range of
interest. Alpha and beta 2 rhythms are called sensory-motor rhythms (SMR).36 During the
imagery of movement PSD of SMR typically drops,32 shifting the scale to the left. To the
right of the scale there was a counter showing how many times FES was activated. A graph in
the middle showed instantaneous PSD in the last 5s. Under the graph there were two write-in
fields to set the value of the ‘Threshold’ and the ‘Time’. When the PSD was under the
‘Threshold’ value for duration of the ‘Time’ the counter increased by one and FES was
activated. On the right side of the screen there was a drop-down menu to select between the
right and left hand and another drop-down menu to select among the five different frequency
bands.
BCI-FES control strategy
The control was based on a time-controlled threshold switch. A controlled parameter was
Power Spectral Density (PSD) of the EEG signal in a chosen frequency band, calculated
using a 5th order Hanning window, over a moving average window of 1s, in steps of 125 ms
(giving 8 samples/s). To activate the FES, a PSD was measured over the contra-lateral cortex,
CF3-CP3 for the right hand and CF4-CP4 for the left hand. Before each treatment session
participants were asked to briefly imagine moving their hand as if grasping an object. Motor
imagery activated the sensory-motor area, causing a decrease in the PSD of the SMR. A
minimum PSD value was taken as ‘Threshold’. Participants were then asked to relax with
their eyes open for 60s. In this case, if the PSD unintentionally dropped under the ‘Threshold’
within this period of time (as indicated by a counter on Screen 1, Fig 3), the threshold value
11
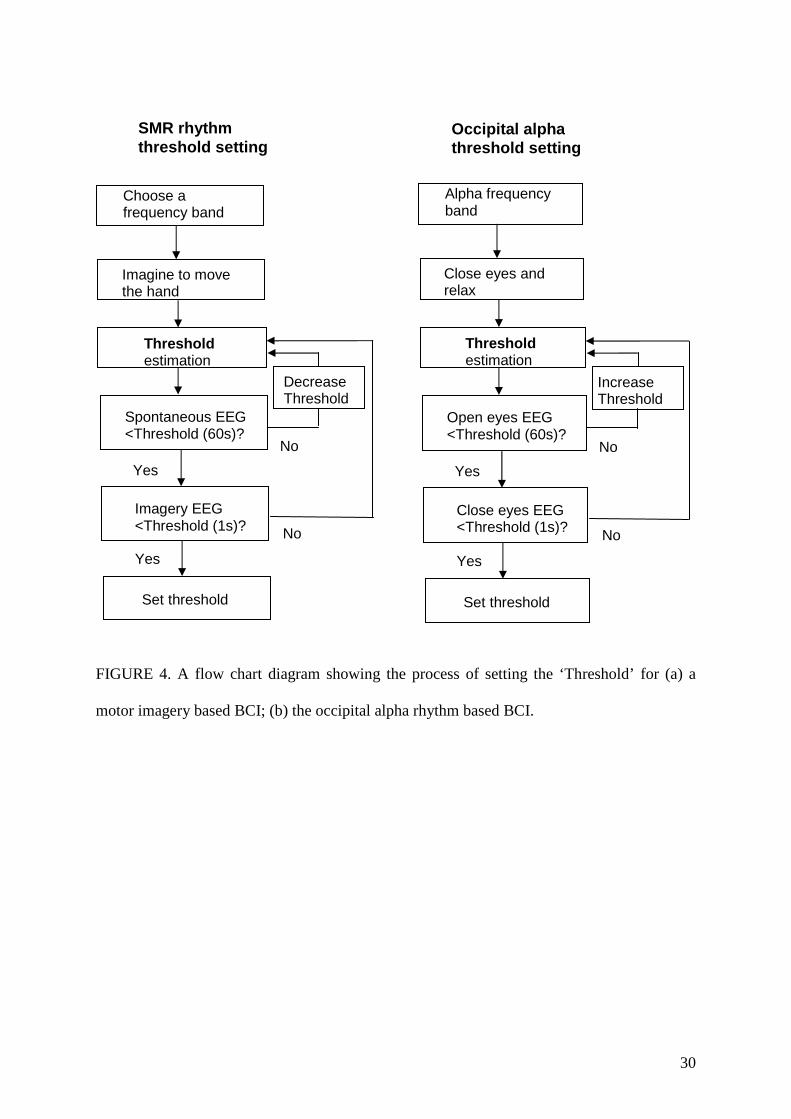
was reduced and the whole procedure was repeated. Empirical iterative procedure is shown in
Fig. 4a.
Figure 4 about here
Once control parameters were set, participants had to apply motor imagery to keep the
PSD under the ‘Threshold’ for 1s in order to activate the FES. At times it was necessary to
make compromises between system reliability and ease of use. A time switch of 1 second
duration was introduced to avoid unintentional activation of FES by natural fluctuation of
SMR. Following this, if sensory pathways were preserved, FES kept the sensory-motor
cortical areas active. Thus a low PSD of SMR was initially achieved by motor imagery
(activating motor pathways) and then maintained by FES. Once the FES was switched on, it
was not necessary for participants to continue with the motor imagery because the sensory-
motor area was being kept active by FES through the sensory afferent pathways. Combined
motor imagery and FES action formed the basis of the sensory-motor training.
A disadvantage of the approach was that once the FES activated the sensory-motor area, it
could not be switched off by using the SMR and FES had to be switched automatically after
10s. To enable participants to keep FES active for as long as they wished, a hybrid BCI was
used. Hybrid BCI was tested in one session only for each patient. To deactivate the FES
through hybrid BCI, participants used their natural alpha rhythm from the occipital area
(electrode locations O1 and O2).36 Unlike the SMR, the occipital alpha rhythm was not
affected by the electrical stimulation and could be independently controlled even in the
presence of FES. The PSD of the alpha rhythm activity (8-12 Hz) in this area increased when
participants closed their eyes and relaxed. Participants’ PSD of the alpha rhythm on either O1
or O2 had to stay above ‘Threshold’ for 1s in order to deactivate a FES (Fig 4b).
For calculating ERS/ERD maps the ‘event’ period started at the moment the FES was
activated (t=0s). Participants were asked to keep PSD under the ‘threshold’ from t=-1s until
12
t=0s. ‘Reference’ period was chosen from t=-4s until t=-2s. ERS/ERD maps were shown for
a period t=-5s until t=5s. Electrical stimulation lasted from t=0s until t=10s.
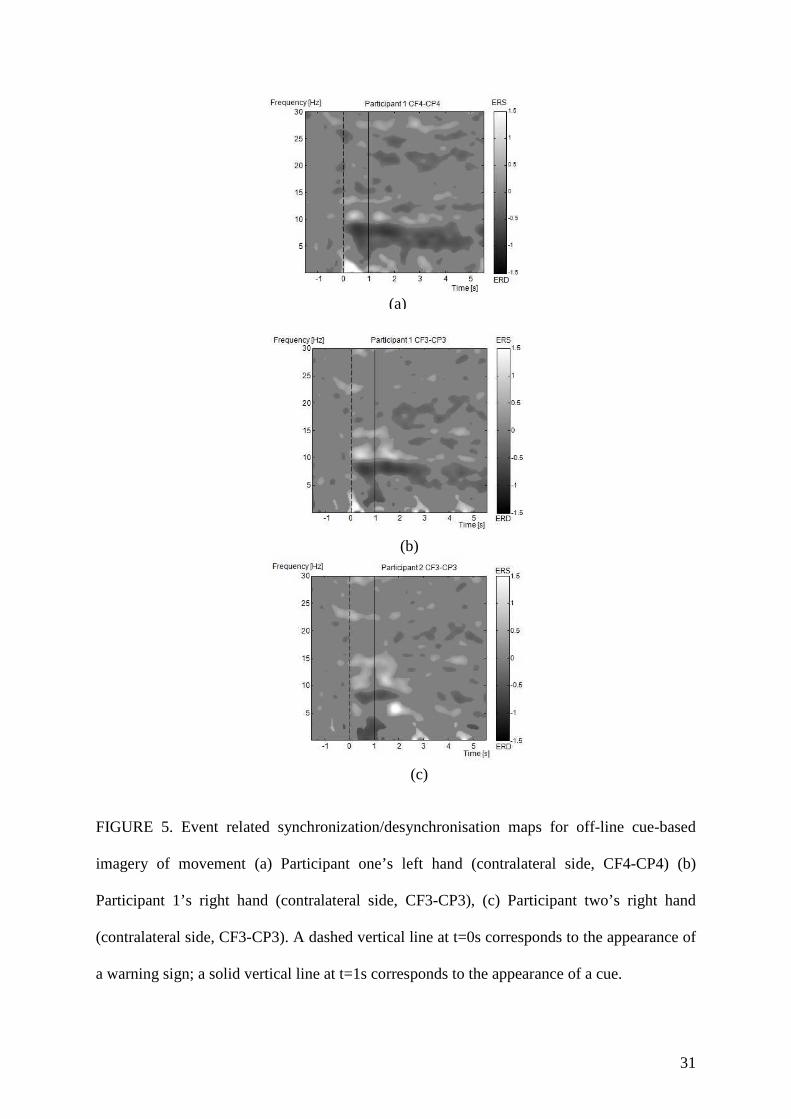
OUTCOMES ERD/ERS maps for Participants 1 and 2 recorded from hemisphere controlling the hand
receiving the training are shown in Figure 5. In both participants, the most reactive frequency
band was in the mu range (8-12 Hz), which was used to calculate PSD to control the FES.
Participant 1 had a weaker response (less ERD) from the hand with lost proprioception, than
from the hand with lost motor function. Participant 2 had weaker desynchronisation of the mu
rhythm than Participant 1.
Figure 5 about here
Before treatment, Participant 1 had a KI score of 2.3 and a VI score of 3.5 (2=poor,
3=moderate) while Participants 2 had a KI score 2.0 and a VI score 3.1. Participant 1
practiced one hand at a time, motor imagery of his left hand and combined sensory-motor
imagery of his right hand. These two types of imagery were very similar, as they both
involved kinesthetic imagery of movement. For the sensory-motor imagery, Participant 1 was
additionally asked to imagine sensation of touch while grasping different objects. Initially the
participant had difficulties with sensory-motor imagery of his right hand. We facilitated
object-oriented sensory-motor imagery by providing sounds from various everyday objects
(mugs, glasses, mobile phones) and placing objects in front of the participants. Participants
were instructed to imagine wrist extension, the same tasks as subsequently produced by FES,
but in a context of a functional object oriented task. Object-oriented motor imagery is a
preferred motor imagery strategy in people with low KI score.37 Participant 2 practiced motor
imagery with his right hand only. Due to limited sitting time, duration of the experimental
session was up to 1 hour.
13
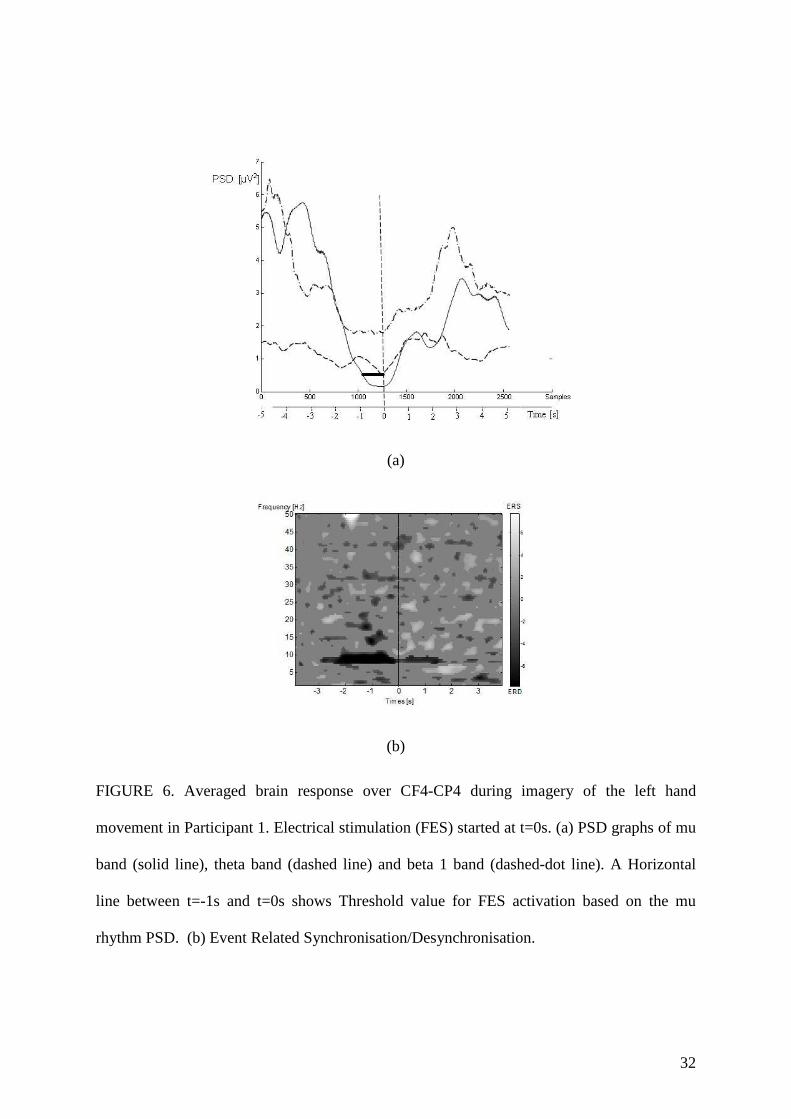
Average values of PSD in the mu, theta and beta 1 frequency band (over the electrode
location CF4-CP4) for one training session of the left hand in Participant 1 are shown in
Figure 6a. Theta (4-8 Hz) and beta 1 (12-16 Hz) were chosen as frequency bands adjacent to
the mu frequency band (8-12 Hz). Stimulation started at t=0s (dashed vertical line). A sharp
decrease in mu PSD can be noticed prior to the stimulation, staying under ‘The Threshold’
value for 1s. During FES, the PSD of the mu rhythm increased slowly but stayed noticeably
lower than in the period before stimulation. PSD in the other two rhythms did not drop,
indicating voluntary control of the mu rhythm only.
The ERD/ERS map in the same period indicated a drop in the energy level of the mu
rhythm about 2s prior to FES activation as illustrated in Fig. 6b. The ERD was clearly
sustained over a period of 2s during electrical stimulation. Weaker ERD can be noticed
around 8Hz for t>2s. The reference period was from t=-4s to t=-2s and FES started at t=0s.
The ‘threshold’ value was much lower than the statistical significance used to calculate the
ERD/ERS maps (Fig 5). The low ‘threshold’ was set to prevent the unintentional activation
of the FES. Comparing range of ERS/ERD bars in Figure 5 and 6 one can notice four fold
stronger ERD during FES control than during spontaneous motor imagery without feedback
(600% Fig 6b compared to 150% in Fig 5). The feedback provided quantitative information
about the quality of motor imagery, encouraging participants to reduce power of their mu
rhythm beyond its value during a cue-based imagery of movement.
Figure 6 about here
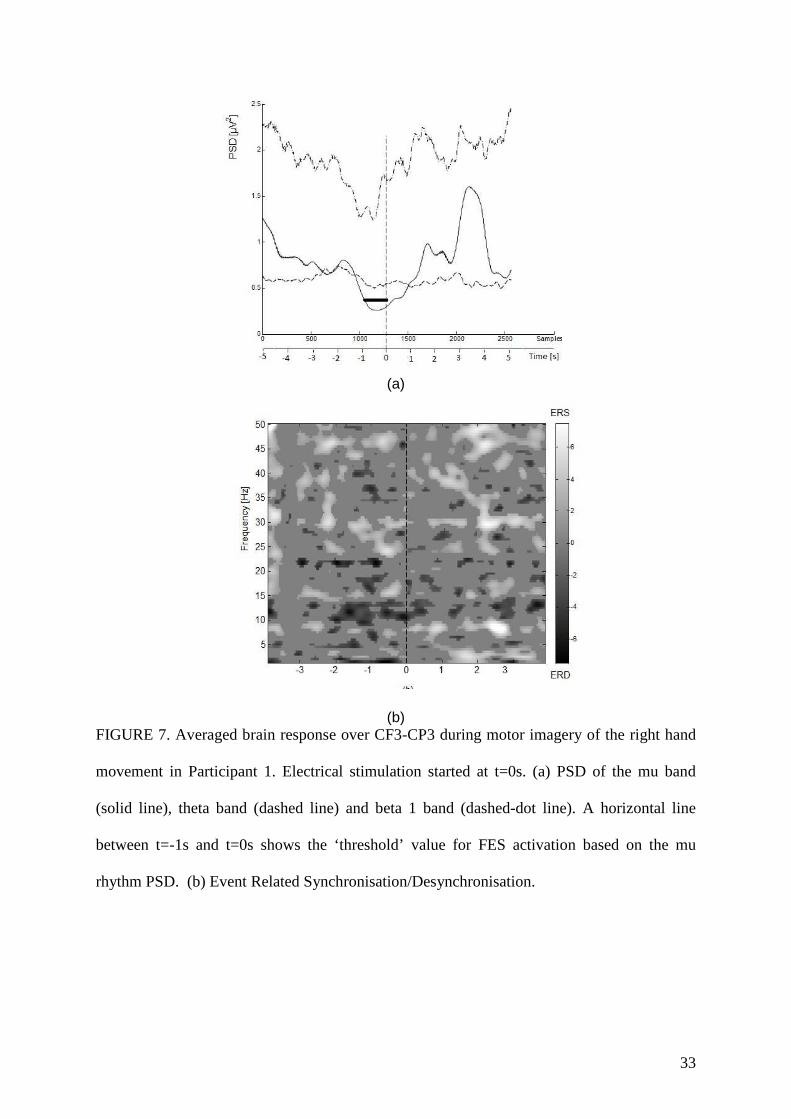
Values recorded from the electrode location CF3-CP3 when Participant 1 controlled FES
over his right wrist muscles are shown in Figure 7. The mu rhythm PSD (Fig 7b) dropped
prior to stimulation but then reached higher levels during FES, indicating that the FES did not
activate the sensory-motor cortex to the same level as during motor imagery of the hand with
preserved sensation. While ERD/ERS maps show much stronger ERD than during motor
14
imagery without feedback (Fig 5b), it is weaker and less sustained than for the left hand (Fig
6b).
Figure 7 about here
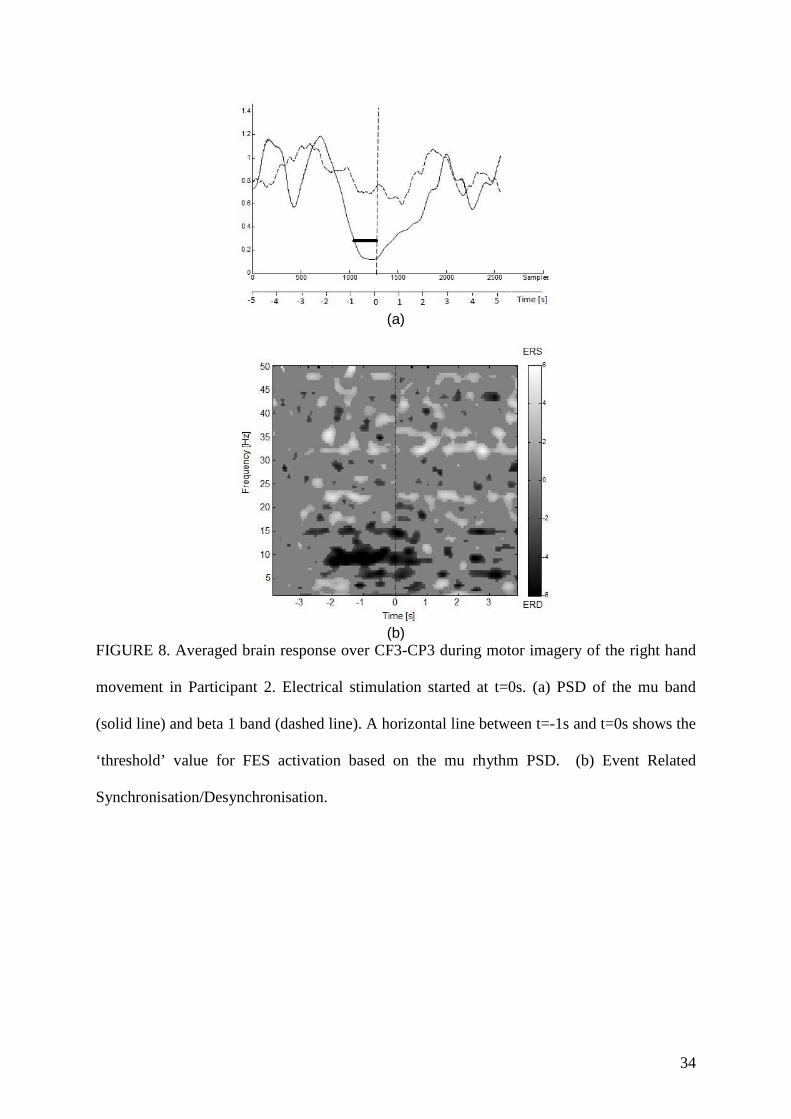
The PSD of the mu and beta 1 band for electrode location CF3-CP3 in Participant 2 (while
controlling the FES applied over his right wrist muscles) is shown in Figure 8a. His ERD
with feedback (fig. 8b) was much stronger than the ERD without feedback (Fig 5c).
Figure 8 about here
It is notable that although the percentage of ERD is higher when visual feedback is
provided, ERD seemed less sustained with visual feedback than during cue-based motor
imagery task (shown in Fig. 5). One possible explanation for this is that participants stopped
the motor imagery once the FES was activated. Intensity of the FES activation was gradually
increased over the first 5s but it may not have been sufficiently strong to produce statistically
significant ERD. When FDR is used to compensate for multiple comparisons, weaker ERD
were treated as ‘non-significant’. Therefore the ERD which was statistically significant in
Figure 5, where max ERD was up to 150%, would not be statistically significant in Figure 6-
8 where maximum ERD was up to 600%.
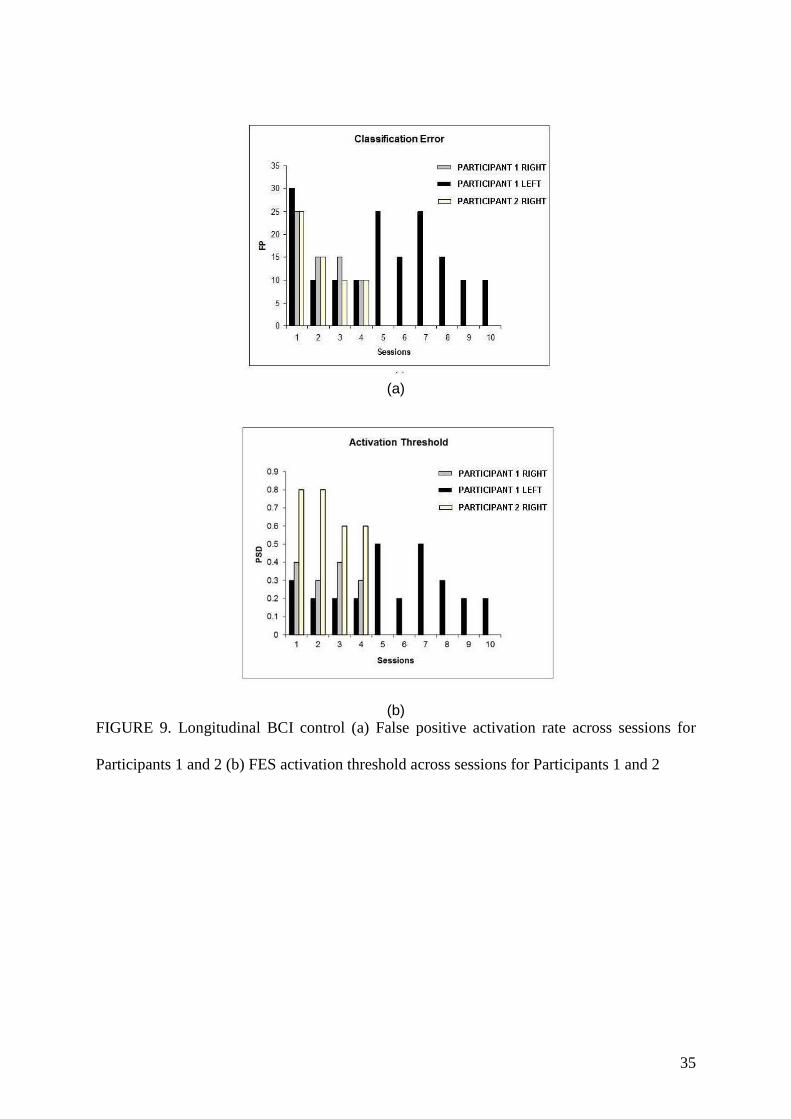
The ‘False Positive’ (FP) activation rate for using BCI training over different sessions for
both participants, for the treatment phase is shown in Figure 9a. The false positive activation
rate measure was used to test the reliability of the BCI control. A false positive activation rate
shows, in percentage, how many times the FES was activated when a participant did not
intend to activate it. The task was to imagine extending the wrist and opening the hand as to
grasp an object, thereby activating the FES 20 times. The FES was deactivated automatically
after 10s. The average false positive activation rate for participant one’s left hand was 16.5
±7.5 %, and 16.2±6.3% for the right hand. The average false positive activation rate for
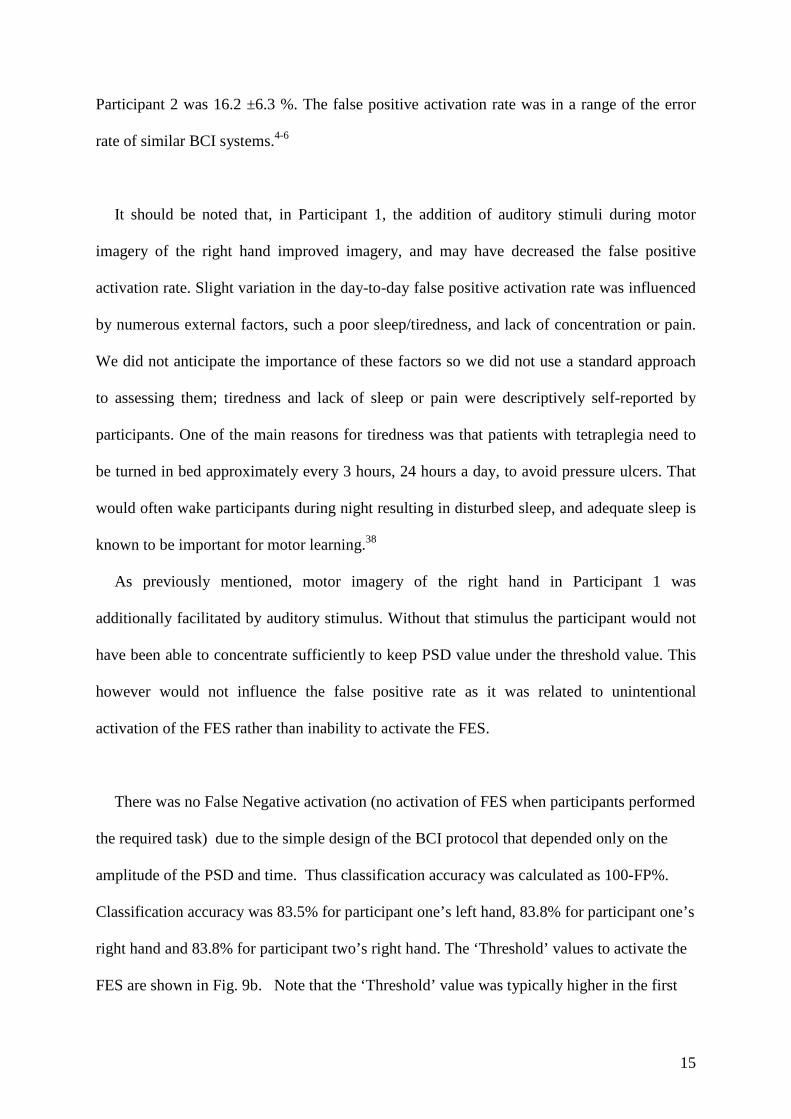
15
Participant 2 was 16.2 ±6.3 %. The false positive activation rate was in a range of the error
rate of similar BCI systems.4-6
It should be noted that, in Participant 1, the addition of auditory stimuli during motor
imagery of the right hand improved imagery, and may have decreased the false positive
activation rate. Slight variation in the day-to-day false positive activation rate was influenced
by numerous external factors, such a poor sleep/tiredness, and lack of concentration or pain.
We did not anticipate the importance of these factors so we did not use a standard approach
to assessing them; tiredness and lack of sleep or pain were descriptively self-reported by
participants. One of the main reasons for tiredness was that patients with tetraplegia need to
be turned in bed approximately every 3 hours, 24 hours a day, to avoid pressure ulcers. That
would often wake participants during night resulting in disturbed sleep, and adequate sleep is
known to be important for motor learning.38
As previously mentioned, motor imagery of the right hand in Participant 1 was
additionally facilitated by auditory stimulus. Without that stimulus the participant would not
have been able to concentrate sufficiently to keep PSD value under the threshold value. This
however would not influence the false positive rate as it was related to unintentional
activation of the FES rather than inability to activate the FES.
There was no False Negative activation (no activation of FES when participants performed
the required task) due to the simple design of the BCI protocol that depended only on the
amplitude of the PSD and time. Thus classification accuracy was calculated as 100-FP%.
Classification accuracy was 83.5% for participant one’s left hand, 83.8% for participant one’s
right hand and 83.8% for participant two’s right hand. The ‘Threshold’ values to activate the
FES are shown in Fig. 9b. Note that the ‘Threshold’ value was typically higher in the first
16
session than in the following one. We also notice that ‘Threshold’ values are proportional to
the false positive activation rate, with the higher threshold corresponding to the higher error
rates.
Figure 9 about here
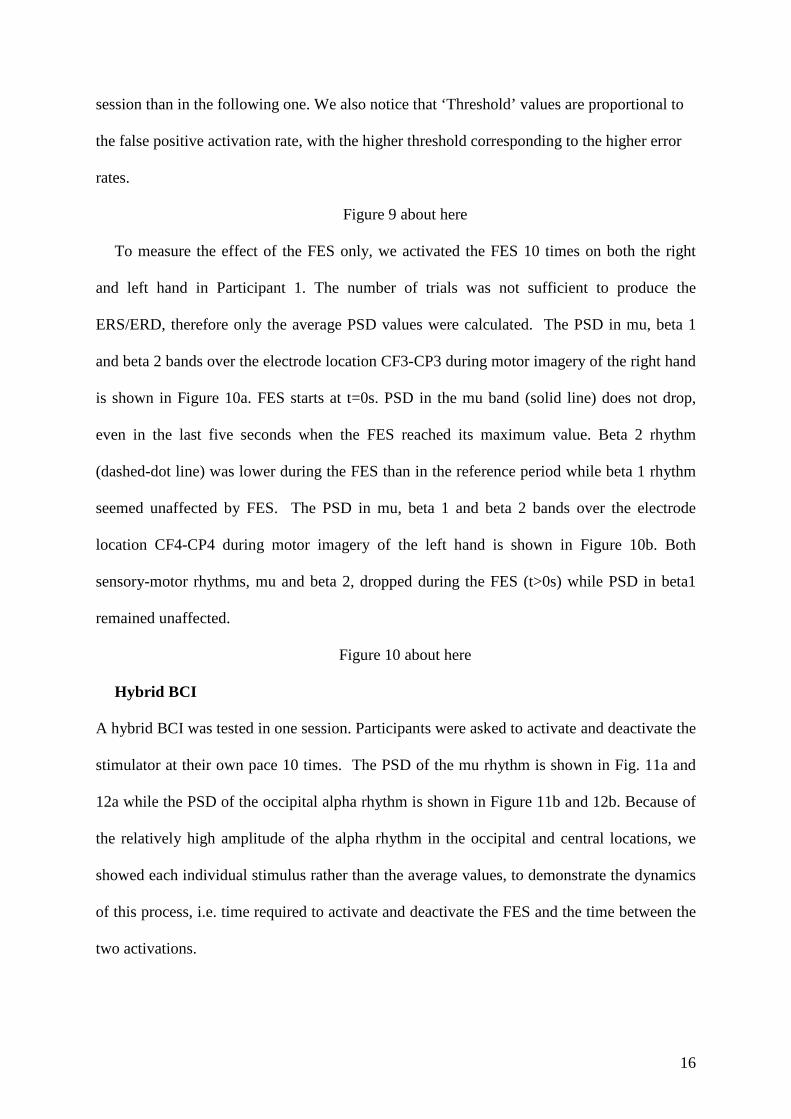
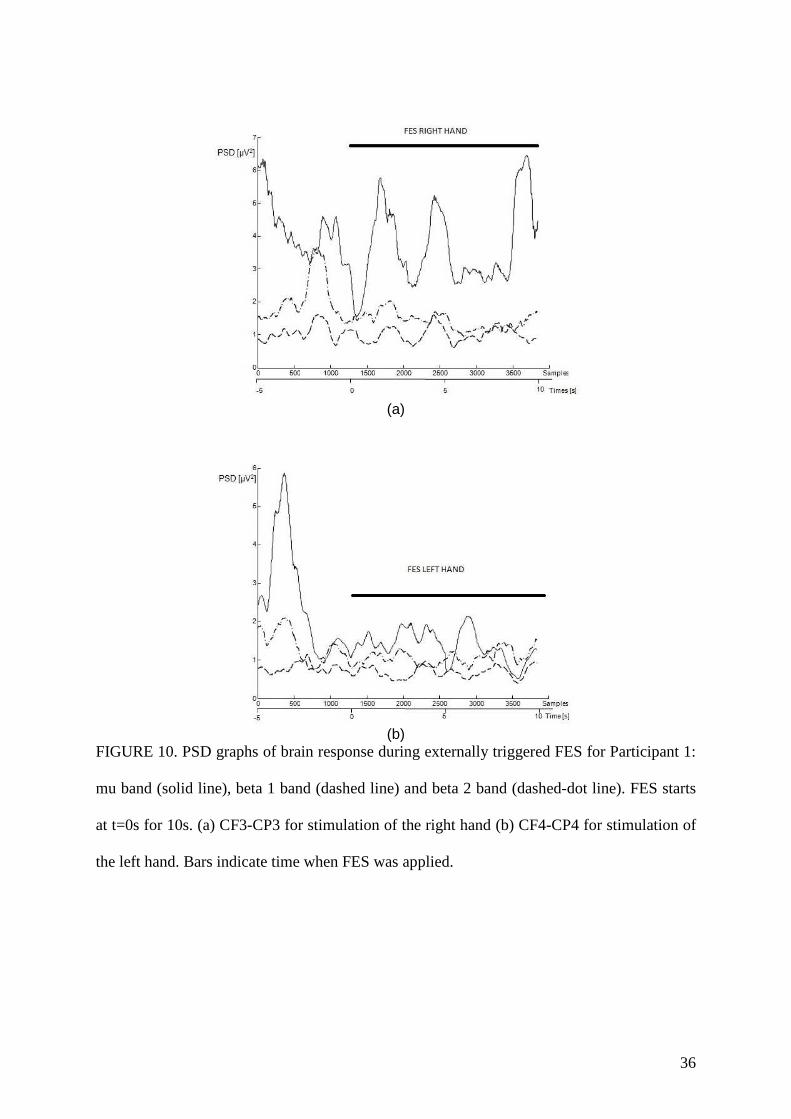
To measure the effect of the FES only, we activated the FES 10 times on both the right
and left hand in Participant 1. The number of trials was not sufficient to produce the
ERS/ERD, therefore only the average PSD values were calculated. The PSD in mu, beta 1
and beta 2 bands over the electrode location CF3-CP3 during motor imagery of the right hand
is shown in Figure 10a. FES starts at t=0s. PSD in the mu band (solid line) does not drop,
even in the last five seconds when the FES reached its maximum value. Beta 2 rhythm
(dashed-dot line) was lower during the FES than in the reference period while beta 1 rhythm
seemed unaffected by FES. The PSD in mu, beta 1 and beta 2 bands over the electrode
location CF4-CP4 during motor imagery of the left hand is shown in Figure 10b. Both
sensory-motor rhythms, mu and beta 2, dropped during the FES (t>0s) while PSD in beta1
remained unaffected.
Figure 10 about here
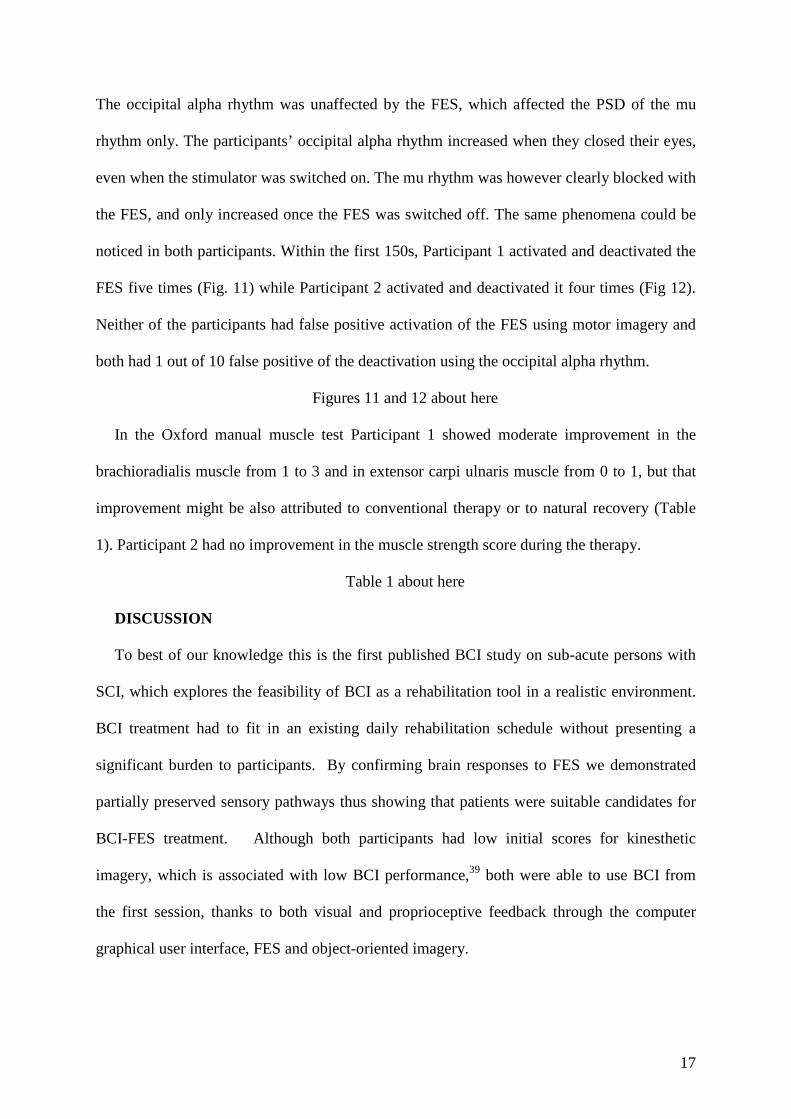
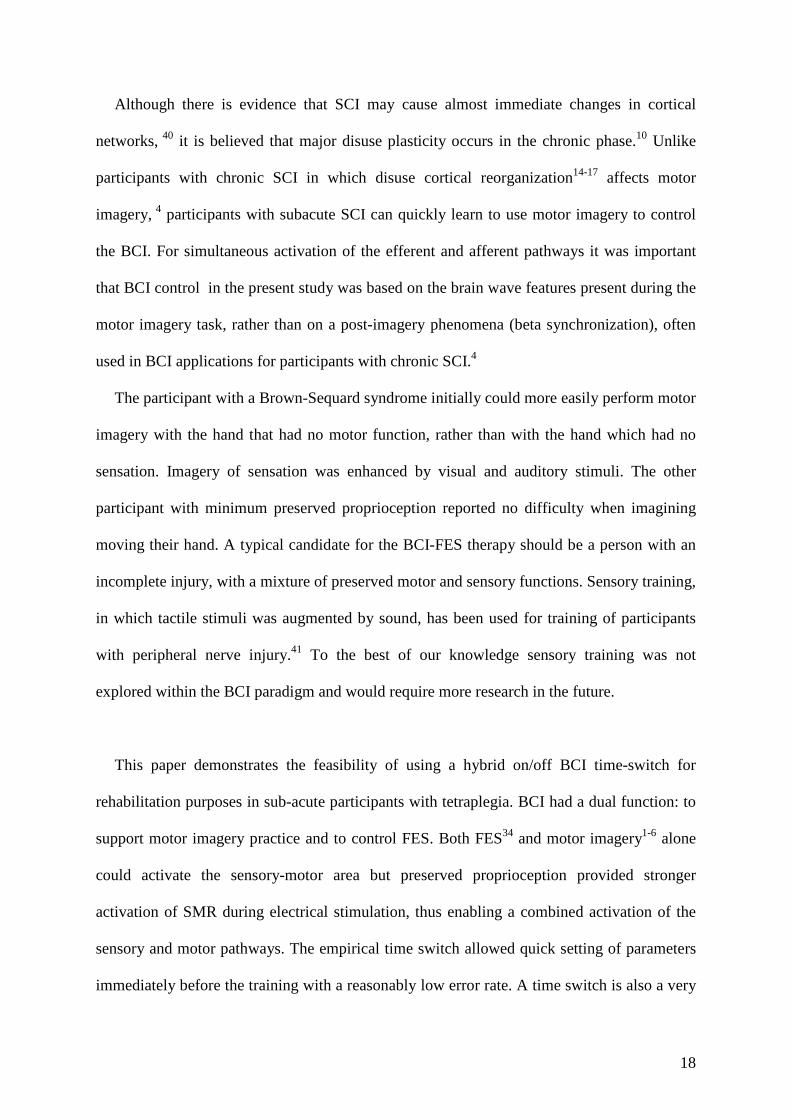
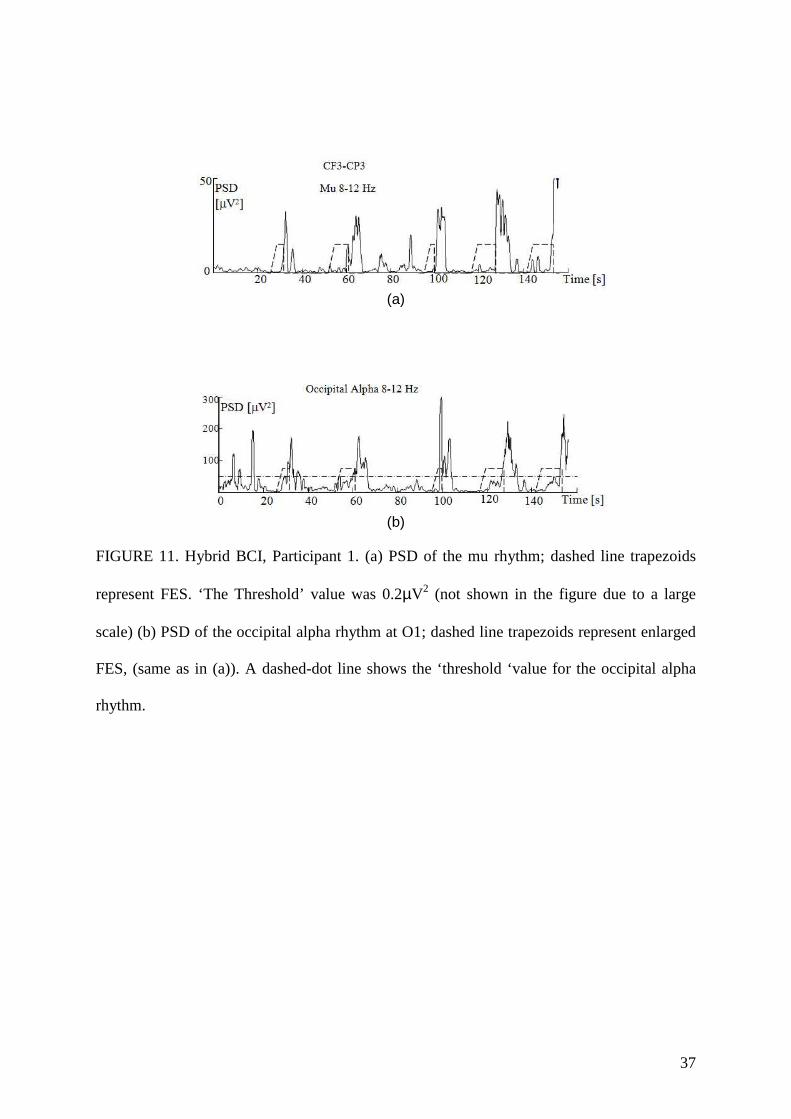
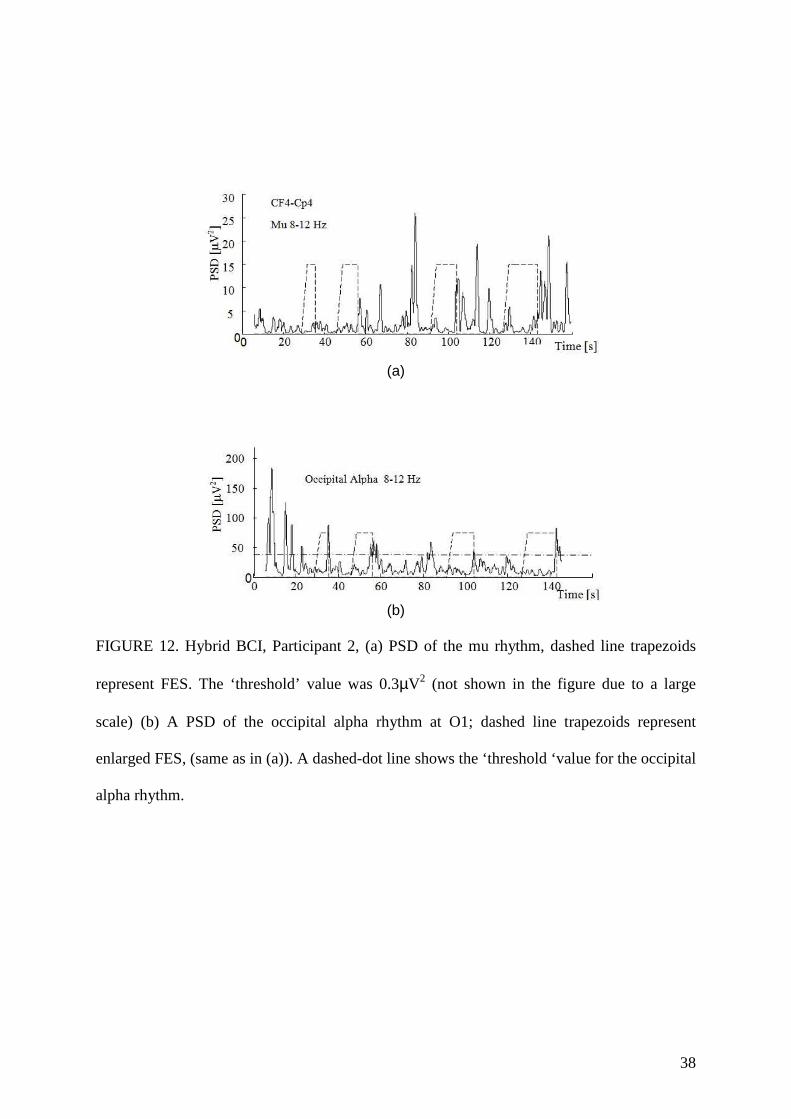
Hybrid BCI
A hybrid BCI was tested in one session. Participants were asked to activate and deactivate the
stimulator at their own pace 10 times. The PSD of the mu rhythm is shown in Fig. 11a and
12a while the PSD of the occipital alpha rhythm is shown in Figure 11b and 12b. Because of
the relatively high amplitude of the alpha rhythm in the occipital and central locations, we
showed each individual stimulus rather than the average values, to demonstrate the dynamics
of this process, i.e. time required to activate and deactivate the FES and the time between the
two activations.
17
The occipital alpha rhythm was unaffected by the FES, which affected the PSD of the mu
rhythm only. The participants’ occipital alpha rhythm increased when they closed their eyes,
even when the stimulator was switched on. The mu rhythm was however clearly blocked with
the FES, and only increased once the FES was switched off. The same phenomena could be
noticed in both participants. Within the first 150s, Participant 1 activated and deactivated the
FES five times (Fig. 11) while Participant 2 activated and deactivated it four times (Fig 12).
Neither of the participants had false positive activation of the FES using motor imagery and
both had 1 out of 10 false positive of the deactivation using the occipital alpha rhythm.
Figures 11 and 12 about here
In the Oxford manual muscle test Participant 1 showed moderate improvement in the
brachioradialis muscle from 1 to 3 and in extensor carpi ulnaris muscle from 0 to 1, but that
improvement might be also attributed to conventional therapy or to natural recovery (Table
1). Participant 2 had no improvement in the muscle strength score during the therapy.
Table 1 about here
DISCUSSION
To best of our knowledge this is the first published BCI study on sub-acute persons with
SCI, which explores the feasibility of BCI as a rehabilitation tool in a realistic environment.
BCI treatment had to fit in an existing daily rehabilitation schedule without presenting a
significant burden to participants. By confirming brain responses to FES we demonstrated
partially preserved sensory pathways thus showing that patients were suitable candidates for
BCI-FES treatment. Although both participants had low initial scores for kinesthetic
imagery, which is associated with low BCI performance,39 both were able to use BCI from
the first session, thanks to both visual and proprioceptive feedback through the computer
graphical user interface, FES and object-oriented imagery.
18
Although there is evidence that SCI may cause almost immediate changes in cortical
networks, 40 it is believed that major disuse plasticity occurs in the chronic phase.10 Unlike
participants with chronic SCI in which disuse cortical reorganization14-17 affects motor
imagery, 4 participants with subacute SCI can quickly learn to use motor imagery to control
the BCI. For simultaneous activation of the efferent and afferent pathways it was important
that BCI control in the present study was based on the brain wave features present during the
motor imagery task, rather than on a post-imagery phenomena (beta synchronization), often
used in BCI applications for participants with chronic SCI.4
The participant with a Brown-Sequard syndrome initially could more easily perform motor
imagery with the hand that had no motor function, rather than with the hand which had no
sensation. Imagery of sensation was enhanced by visual and auditory stimuli. The other
participant with minimum preserved proprioception reported no difficulty when imagining
moving their hand. A typical candidate for the BCI-FES therapy should be a person with an
incomplete injury, with a mixture of preserved motor and sensory functions. Sensory training,
in which tactile stimuli was augmented by sound, has been used for training of participants
with peripheral nerve injury.41 To the best of our knowledge sensory training was not
explored within the BCI paradigm and would require more research in the future.
This paper demonstrates the feasibility of using a hybrid on/off BCI time-switch for
rehabilitation purposes in sub-acute participants with tetraplegia. BCI had a dual function: to
support motor imagery practice and to control FES. Both FES34 and motor imagery1-6 alone
could activate the sensory-motor area but preserved proprioception provided stronger
activation of SMR during electrical stimulation, thus enabling a combined activation of the
sensory and motor pathways. The empirical time switch allowed quick setting of parameters
immediately before the training with a reasonably low error rate. A time switch is also a very
19
suitable method for rehabilitation, having the right timing between BCI classification and
FES. The time switch relies on the low level of PSD that indicates active imagery. In a recent
study26 it was shown that FES maximizes the motor evoked potential response if delivered
during the MI, rather than immediately after. This is unlike the BCI systems used for
communication and control, which often use a post post-imagery phenomena.4 A hybrid BCI
allowed participants to determine the duration of the FES activation. Although this is less
relevant for simple tasks, in the future this might allow more flexibility in performing
complex tasks, such as combined reaching and grasping. Unlike the hybrid BCIs proposed in
the literature, our hybrid BCI relies on two naturally generated brain rhythms and did not
require additional equipment to induce the brain activity. 27
The current study reflects some practical issues related to experiments in hospitalized sub-
acute participants: variation in the participants level of concentration from one day to another
affected BCI parameters and BCI reliability; limited sitting time (to prevent pressure ulcers)
dictated simple experimental setup based on 2 bipolar channels and simple, threshold based
algorithm. Most of previous BCI studies involved participants in the chronic phase, when the
process of natural recovery is reduced and their general health condition is more stable. 2-6
Limitations
There are two limitations of this study, one being that participants took part for a relatively
short period of time over a limited number of sessions; this was sufficient to demonstrate the
feasibility of the system for a long-term use but was insufficient to demonstrate functional
and neurological improvement. The second limitation is that the number of participants was
small and the effect of treatment was mixed with the effect of the natural recovery. Further
controlled studies with the larger number of participants are required to determine the
functional relevance of a BCI-FES therapy and to differentiate between the effect of the
therapy and the effect of a natural recovery. 42
20
SUMMARY
This paper demonstrates the feasibility of a long-term use of BCI-FES system on sub-acute
patients with SCI as a rehabilitation tool in a realistic environment. Despite low initial scores
for kinesthetic motor imagery, both patients were able to use BCI from the first session,
thanks to combined visual and proprioceptive feedback. The paper also explores the
feasibility of sensory imagery training enhanced by visual and auditory stimuli. Finally, this
study demonstrates the feasibility of using hybrid BCI based on two natural brain rhythms,
the mu rhythm and the occipital alpha rhythm, that enabled patients to determine the onset
and duration of FES activation. Hybrid BCI might allow more flexibility in performing
complex motor task. Further controlled studies are required to determine functional relevance
of BCI-FES therapy.
21
REFERENCES
[1] Mulder T. Motor imagery and action observation: cognitive tools for rehabilitation. J
Neural Transm. 2007; 114(10):1265-78
[2] Cramer SC, Orr EL, Cohen MJ, Lacourse MG. Effects of motor imagery training after
chronic, complete spinal cord injury. Exp Brain Res. 2007;177(2):233-42
[3] Grangeon M, Revol P, Guillot A, Rode G, Collet C. Could motor imagery be effective in
upper limb rehabilitation of individuals with spinal cord injury? A case study. Spinal
Cord. 2012;50(10):766-71.
[4] Pfurtscheller G, Guger C, Müller G, Krausz G, Neuper C. Brain oscillations control hand
orthosis in a tetraplegic. Neurosci Lett. 2000;292(3):211-214
[5] Tam W, Tong K, Fei M, Gao S. A Minimal Set of Electrodes for Motor Imagery BCI to
Control an Assistive Device in Chronic Stroke Subjects: A Multi-Session Study. IEEE
Trans Neural Syst Rehabil Eng. 2011;19: 617-627
[6] Daly JJ, Cheng R, Rogers J, Litinas K, Horvat K, Dohring M. Feasibility of a new
application of noninvasive Brain Computer Interface (BCI): a case study of training for
recovery of volitional motor control after stroke. J Neurol Phys Ther. 2009;33(4):203-11
[7] Dobkin BH. Brain-computer interface technology as a tool to augment plasticity and
outcomes for neurological rehabilitation. J Physiol. 2007; 579(Pt 3): 637-42.
[8] Jarosiewicz B, Chase SM, Fraser GW, Velliste M, Kass RE, Schwartz AB. Functional
network reorganization during learning in a brain-computer interface paradigm. Proc Nat
Acad Sci. 2008; 105(49):19486-91
[9] Bunge RP, Puckett WR, Becerra JL, Marcillo A, Quencer RM. Observations on the
pathology of human spinal cord injury: a review and classification of 22 new cases with
details from a case of chronic cord compression with extensive focal demyelination. Adv
Neurol. 1993;59:75– 89.
22
[10] Nardone R, Holler Y, Brigo F, Seidl M, Christova M, Bergman J et al. Functional brain
reorganisation after spinal cord injury: systematic review of animal and human studies.
Brain Res. 2013; 1504:58-73
[11] Lundell H, Barthelemy D, Skimminge A, Dyrby TB, Biering-Sørensen F, Nielsen JB.
Independent spinal cord atrophy measures correlate to motor and sensory deficits in
individuals with spinal cord injury. Spinal Cord. 2011;49(1):70-5.
[12] Jurkiewicz MT, Mikulis DJ, Fehlings MG, Verrier MC. Sensorimotor cortical activation
in participants with cervical spinal cord injury with persisting paralysis. Neurorehabil
Neural Repair. 2010;24(2):136-40
[13] Wrigley PJ, Gustin SM, Macey PM, Nash PG, Gandevia SC, Macefield VG et al.
Anatomical changes in human motor cortex and motor pathways following complete
thoracic spinal cord injury. Cereb Cortex. 2009;19(1):224-32
[14] Kokotilo KJ, Eng JJ, Curt A. Reorganization and preservation of motor control of the
brain in spinal cord injury: a systematic review. J Neurotrauma. 2009;26(11):2113-26
[15] Angel MJ, Davey N, Ellaway P, Chen R, ‘Lesions in the peripthery and spinal cord’, in
Plasticity in the human nervous system, Eds Boniface S and Ziemman U. Cambridge
University press 2003, pp 204-230
[16] Tran Y, Boord P, Middleton J, Craig A. Levels of brain wave activity (8-13 Hz) in
persons with spinal cord injury. Spinal Cord. 2004 Feb;42(2):73-9.
[17] Green JB, Sora E, Bialy Y, Ricamato A, Thatcher RW. Cortical motor reorganization
after paraplegia: an EEG study. Neurology. 1999;53(4):736-43
[18] Gustin SM, Wrigley PJ, Siddall PJ, Henderson LA. Brain anatomy changes associated
with persistent neuropathic pain following spinal cord injury. Cereb Cortex.
2010;20(6):1409-19.
23
[19] Wrigley PJ, Press SR, Gustin SM, Macefield VG, Gandevia SC, Cousins MJ et al.
Neuropathic pain and primary somatosensory cortex reorganization following spinal cord
injury. Pain. 2009;141(1-2):52-9
[20] Waxman SG, Hains BC Fire and phantoms after spinal cord injury: Na+ channels and
central pain. Trends Neurosci. 2006;29(4):207-15.
[21] Wolpaw JR. Spinal cord plasticity in acquisition and maintenance of motor skills. Acta
Physiol. 2007; 189:155-169.
[22] Wolpaw JR, Tennissen AM. Activity- dependent spinal cord plasticity in health and
disease. Ann Rev Neurosci. 2001;24:807-43.
[23] Grosse-Wentrup M, Mattia D, Oweiss K. Using brain–computer interfaces to induce
neural plasticity and restore function. J. Neural Eng. 2011; 8:025004
[24] Hebb DO. The organization of behavior. 2009 Taylor and Francis library, pp. 17-38
[25] Barsi GI, Popovic DB, Tarkka IM, Sinkjaer T, Grey MJ. Cortical excitability changes
following grasping exercise augmented with electrical stimulation. Exp Brain Res.
2008;191(1):57-66
[26] Mrachacz-Kersting N, Kristensen SR, Niazi IK, Farina D. Precise temporal association
between cortical potentials evoked by motor imagination and afference induces cortical
plasticity. J Physiol. 2012;590(Pt 7):1669-82
[27] Brunner C, Allison BZ, Altstätter C, Neuper C. A comparison of three brain-computer
interfaces based on event-related desynchronization, steady state visual evoked potentials,
or a hybrid approach using both signals. J Neural Eng. 2011; 8(2): 025010.
[28] Marino RJ, Barros T, Biering-Sorensen F, Burns SP, Donovan WH, Grave DE, et al.
International standards for neurological classification of spinal cord injury. J Spinal Cord
Med. 2003;26(suppl 1):S50-S56.
24
[29] Waring WP, Biering-Sorensen F, Burns S, Donovan W, Graves D, Jha A, et al. 2009
review and revisions of the international standards for the neurological classification of
spinal cord injury. J Spinal Cord Med 2010; 33: 346–52.
[30] Porter S. Tidy's Physiotherapy. Edinburgh: Churchill Livingstone, 2013
[31] Malouin F, Richards C, Jackson PL, Lafleur MF, Durand A, Doyon J. The Kinesthetic
and Visual Imagery Questionnaire (KVIQ) for Assessing Motor Imagery in Persons with
Physical Disabilities: A Reliability and Construct Validity Study. J.Neurol. Phys. Ther.
2007; 37(1): 20-29
[32] Pfurtscheller G, da Silva L, Event-related EEG/MEG synchronization and
desynchronization: basic principles. Clin Neurophysiol.1999;110:1842-1857
[33] Delorme A, Makeig S. EEGLAB: an open source toolbox for analysis of single-trial EEG
dynamics including independent component analysis. J Neurosci Methods. 134:9-21,2004
[34] Benjamini Y, Yekutieli D. The control of the false discovery rate in multiple testing under
dependency. Ann. Statist. 2011;29:1165-1188
[35] Scherer R. rtsBCI – a collection of methods and functions for real-time data acquisition,
storage, signal processing and visualization based on Matlab/Simulink. Available online:
http://biosig.sf.net (accessed May 2014)
[36] Niedermeyer E ‘Ch 9. The normal EEG of the waking adult’. In: Electroencephalography.
Basic principles, clinical applications and related fields. Eds: Niedermeyer E and da Sliva
FL. Lippincott, Williams&Wilkins, 2005. pp167-192
[37] Vuckovic A, Osuagwu B. Using a motor imagery questionnaire to estimate the
performance of a Brain-Computer Interface based on object oriented motor imagery. Clin
Neurophysiol. 2013; 124:1586-95
[38] Alham Al-Sharman A, Siengsukon CF. Performance on a functional motor task is
enhanced by sleep in middle-aged and older adults . J Neurol Phys Ther. 2014, 38:xx-xx
25
[39] Müller GR, Neuper C, Rupp R, Keinrath C, Gerner HJ, Pfurtscheller G. Event-related
beta EEG changes during wrist movements induced by functional electrical stimulation of
forearm muscles in man. Neurosci Lett. 2003;340(2):143-7.
[40] Aguilar J, Humanes-Valera D, Alonso-Calvino E, Yague JG, Moxon KA, Oliviero A, et
al. Spinal cord injury immediately changes the state of the brain. J Neurosci 2010;307528-
7537.
[41] Rosén B, Lundborg G. Enhanced sensory recovery after median nerve repair using
cortical audio-tactile interaction. A randomised multicentre study. J Hand Surg Eur Vol.
2007;32(1):31-7.
[42] Fawcett JW, Curt A, Steeves JD, Coleman WP, Tuszynski MH, Lammertse DJ, et al.
Guidelines for the conduct of clinical trials for spinal cord injury as developed by the
ICCP panel: spontaneous recovery after spinal cord injury and statistical power needed for
therapeutic clinical trials. Spinal Cord 2007; 45(3):190-205.

26
Table 1
Table 1
Participant 2, left hand
Muscle BR EDC ECU ECR FPL EPL FDP
Before 1+ 1 0 1 1 1 1
After 3 1+ 1 1+ 1+ 1 1+
Participant 1, right hand
Before 5 5 5 5 5 5 5
After 5 5 5 5 5 5 5
Participant 2, right hand
Before 1 0 0 0 0 0 0
After 1 0 0 0 0 0 0
Results of the Oxford manual muscle test before and after treatment.
Key (muslces):BR:brachioradialis, EDC=extensor digitorum communis, ECU=extensor carpi ulnaris,
ECR=extensor carpi radialis, FPL=flexor pollicis longus, EPL=extensor pollicis longus , FDP=flexor
digitorum profundus).
Key (Oxford manual muscle test): 1=Flicker of movement, 2=Through full range actively with
gravity counterbalanced, 3=Through full range actively against gravity, 4=Through full range
actively against some resistance, 5=Through full range actively against strong resistance

27
FIGURE 1. Timeline of a cue-based experimental paradigm. Warning sign (a cross) appears
at t=0s and stays on the screen until t=5s. A cue (an arrow) indicating to imagine left or right
hand movements appears at t=1.25s and stays until t=5s. Motor imagery lasts from t=1s until
t=5s.
… 0 2 4 5
CUE
3-5 s
Time (s)
WARNING
3
WARNING
-1 1
+
28
FIGURE 2. A participant controlling a hybrid BCI-FES system. GUI: Graphical User
Interface, FES: Functional Electrical Stimulation, BCI: Brain Computer Interface.
Participants obtain visual information about their brain activity through GUI. Imagery of
opening hand as to grasp an object activates FES (BCI ON). Relaxation with eyes closed
deactivates FES (BCI OFF).
29
FIGURE 3. A Graphical Unser Interface used to facilitate imagery of movements. A scale on
the left shows instantaneous value of the PSD in a chosen frequency band. A graph in the
middle shows PSD during last 5s. Drop-down bars to the right are used to set the frequency
band and the electrode location. Write-in fields are used to set the values of parameters
‘Time’ and ‘Threshold’.
30
FIGURE 4. A flow chart diagram showing the process of setting the ‘Threshold’ for (a) a
motor imagery based BCI; (b) the occipital alpha rhythm based BCI.
Decrease Threshold
Imagine to move the hand
Threshold estimation
Spontaneous EEG <Threshold (60s)?
Choose a frequency band
Imagery EEG <Threshold (1s)?
Set threshold
Yes
Yes
No
No
Close eyes and relax
Threshold estimation
Open eyes EEG <Threshold (60s)?
Alpha frequency band
Close eyes EEG <Threshold (1s)?
Set threshold
Yes
Yes
No
No
Increase Threshold
SMR rhythm threshold setting
Occipital alpha threshold setting
31
FIGURE 5. Event related synchronization/desynchronisation maps for off-line cue-based
imagery of movement (a) Participant one’s left hand (contralateral side, CF4-CP4) (b)
Participant 1’s right hand (contralateral side, CF3-CP3), (c) Participant two’s right hand
(contralateral side, CF3-CP3). A dashed vertical line at t=0s corresponds to the appearance of
a warning sign; a solid vertical line at t=1s corresponds to the appearance of a cue.
(a)
(b)
(c)
32
(a)
(b)
FIGURE 6. Averaged brain response over CF4-CP4 during imagery of the left hand
movement in Participant 1. Electrical stimulation (FES) started at t=0s. (a) PSD graphs of mu
band (solid line), theta band (dashed line) and beta 1 band (dashed-dot line). A Horizontal
line between t=-1s and t=0s shows Threshold value for FES activation based on the mu
rhythm PSD. (b) Event Related Synchronisation/Desynchronisation.
33
(a)
(b) FIGURE 7. Averaged brain response over CF3-CP3 during motor imagery of the right hand
movement in Participant 1. Electrical stimulation started at t=0s. (a) PSD of the mu band
(solid line), theta band (dashed line) and beta 1 band (dashed-dot line). A horizontal line
between t=-1s and t=0s shows the ‘threshold’ value for FES activation based on the mu
rhythm PSD. (b) Event Related Synchronisation/Desynchronisation.
34
(a)
(b)
FIGURE 8. Averaged brain response over CF3-CP3 during motor imagery of the right hand
movement in Participant 2. Electrical stimulation started at t=0s. (a) PSD of the mu band
(solid line) and beta 1 band (dashed line). A horizontal line between t=-1s and t=0s shows the
‘threshold’ value for FES activation based on the mu rhythm PSD. (b) Event Related
Synchronisation/Desynchronisation.
35
(a)
(b)
FIGURE 9. Longitudinal BCI control (a) False positive activation rate across sessions for
Participants 1 and 2 (b) FES activation threshold across sessions for Participants 1 and 2
36
(a)
(b)
FIGURE 10. PSD graphs of brain response during externally triggered FES for Participant 1:
mu band (solid line), beta 1 band (dashed line) and beta 2 band (dashed-dot line). FES starts
at t=0s for 10s. (a) CF3-CP3 for stimulation of the right hand (b) CF4-CP4 for stimulation of
the left hand. Bars indicate time when FES was applied.
37
(a)
(b)
FIGURE 11. Hybrid BCI, Participant 1. (a) PSD of the mu rhythm; dashed line trapezoids
represent FES. ‘The Threshold’ value was 0.2µV2 (not shown in the figure due to a large
scale) (b) PSD of the occipital alpha rhythm at O1; dashed line trapezoids represent enlarged
FES, (same as in (a)). A dashed-dot line shows the ‘threshold ‘value for the occipital alpha
rhythm.
38
(a)
(b)
FIGURE 12. Hybrid BCI, Participant 2, (a) PSD of the mu rhythm, dashed line trapezoids
represent FES. The ‘threshold’ value was 0.3µV2 (not shown in the figure due to a large
scale) (b) A PSD of the occipital alpha rhythm at O1; dashed line trapezoids represent
enlarged FES, (same as in (a)). A dashed-dot line shows the ‘threshold ‘value for the occipital
alpha rhythm.