Human Development Scenarion of Malaysia: ASEAN and Global Perspective
76
Asian Journal of Applied Science and Engineering, Volume 1, No 1 (2012) ISSN 2305-915X Copyright © 2012, Asian Business Consortium | AJASE Page 1 Vol. 1, No. 1/2012
Transcript of Human Development Scenarion of Malaysia: ASEAN and Global Perspective
Asian Journal of Applied Science and Engineering, Volume 1, No 1 (2012) ISSN 2305-915X
Copyright © 2012, Asian Business Consortium | AJASE Page 1
Vol. 1, No. 1/2012

Asian Journal of Applied Science and Engineering, Volume 1, No 1 (2012) ISSN 2305-915X
Copyright © 2012, Asian Business Consortium | AJASE Page 2
ABC Journals Online Submission
Peer Reviewed
Open Access
Online Archives
Paperless Review
Prompt Feedback
Well Indexed
Global Circulation
International Authorship

Asian Journal of Applied Science and Engineering, Volume 1, No 1 (2012) ISSN 2305-915X
Copyright © 2012, Asian Business Consortium | AJASE Page 3
ASIAN JOURNAL OF APPLIED SCIENCE AND ENGINEERING
International Standard Serial Number: 2305-915X Frequency: 2 issues per year
Established: 2012 www.ajase.weebly.com
Review Process: Blind peer-review
Volume 1, Number 1/2012 (First Issue)
Published by
Asian Business Consortium
Copyright
Reproduction in any form or by any means of any part of this production requires the written permission of the publishers.
All communication should be addressed to the Managing Editor, AJASE Email: [email protected]
Asian Business Consortium www.abcreorg.weebly.com

Asian Journal of Applied Science and Engineering, Volume 1, No 1 (2012) ISSN 2305-915X
Copyright © 2012, Asian Business Consortium | AJASE Page 4
AJASE is included and indexed in Scribd., An online web-controlled datadase directory
BRP Bangladesh, Research Publishing Community, Bangladesh; IndexCopernicusTM, Internationally recognized data base, Warsaw, Poland;
ASA’s Publishing Options, An Author’s Guide to Journals. Washington, DC 20005, USA;
getCITED, an online, member-controlled academic database directory and discussion forum; &
Publishing 1.com, Business Portals B.V., Ericastraat 19, 5615 BJ Eindhoven, The etherlands.
We are working closely with many major
databases to get ABC
journals indexed, including AcademicOne,
EBSCO, EI Compendex, CAS, ProQuest, DOAJ,
and etc. We will gradually
publish the index information of each
journal and try to have a high ISI impact factor for
each journal eventually.

Asian Journal of Applied Science and Engineering, Volume 1, No 1 (2012) ISSN 2305-915X
Copyright © 2012, Asian Business Consortium | AJASE Page 5
EDITORIAL BOARD
Advisor
Professor Dr. Mohammad Osman Gani Talukder Vice Chancellor, Varendra University, Rajshahi, Bangladesh
Editor-in-chief
Dr. Asma Ahmad Shariff Associate Professor, Center for Foundation Studies in Science, University of Malaya, Malaysia
Managing Editor
Dr. Alim Al Ayub Ahmed Assistant Professor, Faculty of Business, ASA University Bangladesh
Vice Chairman, Asian Business Consortium, Bangladesh
Consulting Editors
Dr. Iqbal Hossain, Professor of Statistics & Chairman, Faculty of Business, ASA University Bamgladesh
Dr. Vinai K. Singh, Professor, Department of Applied Mathematics & Dean Academic, Raj Kumar Goel Engineering College, Ghaziabad U.P., INDIA
Dr. Lutfar Rahman, Professor, Dept of Mathematics, Rajshahi University, Bamgladesh
Dr. Shahzad Ali Khan, Head of Department of Health Systems & Policy, Quaid-e-Azam
University, Pakistan
Dr. Hasan Mahmud Reza, Associate Professor, Department of Pharmacy, North South University (NSU), Bangladesh
Dr. M. Abul Kalam Azad, Associate Professor, Department of Applied Mathematics, Rajshahi University, Rajshahi, Bangladesh
Dr Pankaj, Chairperson, Research Degree Committee, Sr. A.P. & Research Coordinator, Department of Mathematics, Indus International University, Una, H.P., India
Dr. Mohammad Anwar Hossain, Assistant Professor, Department of Genetics & Plant Breeding, Bangladesh Agricultural University, Mymensingh, Bangladesh
Dr. Gulzar A. Khuwaja, Department of Computer Engineering, King Faisal University, Saudi Arabia
Dr. Halenar Igor, Slovak University of Technology in Bratislava, Slovakia
The Editorial Board assumes no responsibility for the content of the published articles.
Asian Journal of Applied Science and Engineering, Volume 1, No 1 (2012) ISSN 2305-915X
Copyright © 2012, Asian Business Consortium | AJASE Page 6
Asian Business Consortium is a
self supporting organization and
does not receive funding from any
institution/government. Hence, the
operation of the journal is solely
financed by the processing fees
received from authors. The
processing fees are required to meet
operations expenses such as
employee salaries, internet services,
electricity etc. Being an Open
Access Journal, AJASE does not
receive payment for online
subscription as the journals are
freely accessible over the internet. It
costs money to produce a peer-
reviewed, edited, and formatted
article that is ready for online and
print publication, and to host it on a
server that is freely accessible
without barriers around the clock.

Asian Journal of Applied Science and Engineering, Volume 1, No 1 (2012) ISSN 2305-915X
Copyright © 2012, Asian Business Consortium | AJASE Page 7
Asian Journal of Applied Science and Engineering
Blind Peer-Reviewed Journal
Volume 1, Number 1/2012 (First Issue)
Contents
1. Biogas Production from Water Hyacinth (Eichhornia Crassipes) 09-13
Kamrun Nahar
2. Phytormediation of copper toxicity in soil by various corn and vegetables of
Bangladesh
14-22
M. Mafizur Rahman, Jakaria, M. Shahriar, S.K. Biswas, &
Rokibul Islam
3. Human Development Scenario of Malaysia: ASEAN and Global Perspective 23-34
Md. Sujahangir Kabir Sarkar, Sumaiya Sadeka, &
Md. Mehedi Hasan Sikdar
4. Performance of south facing windows for indoor ventilation & thermal
comfort at Dhaka
35-43
Mahbuba Afroz Jinia & Saiful Hasan Tariq
5. Impact of Environmental Education Technology in Secondary Educational
Institutions: A Study in Chittagong City Area
44-51
Md. Rahimullah Miah & Mir Abu Saleh Shamsuddin
6. E-Commerce of undergraduate’s perspective: The conceptual framework 52-58
Mohd. Nizam Bin A. Baharuddin, Dr Lawrence Arokiasamy,
Dr Huam Hon Tat, & Rani Ann Balaraman
7. Long Term Causality of Export Led Growth (ELG) using VECM model
with reference to India
59-71
Dr. Amitabh Joshi
AJASE Publish
Online and Print
Version Both

Asian Journal of Applied Science and Engineering, Volume 1, No 1 (2012) ISSN 2305-915X
Copyright © 2012, Asian Business Consortium | AJASE Page 8
Asian Business Consortium realizes the meaning of fast publication to researchers, particularly to those working in competitive and dynamic fields. Hence, we offer an exceptionally fast publication schedule including web based & paper less prompt peer-review by the experts in the field and immediate publication upon acceptance.
AJASE adopt a blinded review policy. Authors are blind to reviewers. Typically, the review period is within 6 weeks. If authors do not receive a decision letter by email in 8 weeks after the submission, the corresponding author may send an email to inquire the status of their submission. If you need a shorter review period due to special circumstances, you may request such along with your explanation of the situation by email; however, AJASE cannot guarantee granting the request because high quality judgment of scientific work in short time is a challenge.

Asian Journal of Applied Science and Engineering, Volume 1, No 1 (2012) ISSN 2305-915X
Copyright © 2012, Asian Business Consortium | AJASE Page 9
Biogas Production from Water Hyacinth
(Eichhornia Crassipes)
Kamrun Nahar
Assistant Professor, Department of Environmental Science and Management, North South University,
Dhaka, Bangladesh
ABSTRACT
Sustainability generally depends on the socio-economic development of a country and the availability and consumption of energy. The available sources of energy can be classified into nonrenewable and renewable. In the renewable account, the energy is being deposited everyday whereas the non- renewable energy deposits are continuously depleted by our withdrawals. Due to continuous depletion in the natural resources by an increased consumption of the energy, alternatives of fossil fuels must be searched out. Bioenergy is the only alternative and cheap source of energy which can be made available especially for the rural agricultural people of Bangladesh. This paper describes the various uses of an important energy crop, Water hyacinth and the production of biogas using it as a feedstock, which could be collected from the water body and converted to gas, fertilizer and many other useful products.
Key words: Water hyacinth, water purification, biomass, compost, biogas
INTRODUCTION
During the diminishing of global natural resources and energy supply, the focus must be shifted to other forms of renewable energy sources. The second generation biofuel plants are potential sources for producing a useable grade of biodiesel, ethanol or biogas for energy production. Potential plants to use as sustainable energy sources include trees, certain grasses and crops such as corn, sugarcane, sweet sorghum and also the aquatic plant such as Water hyacinth. Aquatic plants, especially water hyacinth have the benefit of not requiring fertile land to grow, and thus do not take precious land/space away from food crops. Also, the harvest frequency for aquatics tends to be on the order of days, whereas the frequency for trees and crops are on the order of months or years and are much more difficult to harvest. The plentiful availability, low cost, and rapid growth of water hyacinths make them an ideal candidate for biofuel production.

Asian Journal of Applied Science and Engineering, Volume 1, No 1 (2012) ISSN 2305-915X
Copyright © 2012, Asian Business Consortium | AJASE Page 10
Water hyacinth (Eichhornia Crassipes) is a flowering aquatic plant which can live and reproduce by floating freely on the surface of water. Plant size ranges from a few inches to around a meter in height. It grows in mats up to 2 meters thick which can significantly reduce light and oxygen, change water chemistry, affect flora and fauna underneath and cause significant increase in water loss due to evapotranspiration. The average height of the plant is about 45 cm in mature stage but generally ranges from 30 to 70 cm. Roots are variable in length from about 10 to 90 cm long [1] and are superb micro-sites for bacterial communities [2]. The rhizomes are generally 1 to 25 cm long, occasionally producing internodes. The plant is luxuriant in growth and multiplies very rapidly. The plant leaf, which is large and glazy, is composed of 49.6% protein, 16.0% lipids. 26.9% carbohydrates, 1.7% fibre and 5.8% ash [3]. Two types of water hyacinth are abundantly available, the long type and the dwarf type. The former type is mostly available in stagnant water having high effluent while the later is available mostly in paddy fields [4]. Chemical Composition of these types revealed that long and dwarf water hyacinth contain
Crude protein Crude fiber Ether
CH3-CH2-O-CH2-CH3
Nitrogen-Free
Extract (NFE) Ash
Long
hyacinth
Dwarf
hyacinth
Long
hyacinth
Dwarf
hyacinth
Long
hyacinth
Dwarf
hyacinth
Long
hyacinth
Dwarf
hyacinth
Long
hyacinth
Dwarf
hyacinth
14.28% 11.87% 21.79% 18.22% 2.01% 1.18% 44.49% 52.85% 17.43% 15.88%
The chemical composition of water hyacinth grown in water with more effluents resulted in higher chemical makeup than that grown in water with fewer effluents. It also causes practical problems for marine transportation, fishing and at intakes for hydro power and irrigation schemes. It is also considered a serious threat to biodiversity. It can be collected and used as an available source of biomass for energy and for various other uses. A native of South America, it is abundantly found in India, Bangladesh, and South East Asia and in the Philippines Islands. Under favorable conditions Water hyacinth grows very rapidly. The concept of using aquatic plants for conversion to energy (methane) is gaining attention in tropical and sub tropical regions of the world where warm climate is conductive to plant growth through out the year. Anaerobic digestion of organic matter is the oldest method for disposing the waste. The anaerobic digestion of animal, agricultural and industrial wastes has been widely studied. However, very little work has been done using aquatic plants particularly Water Hyacinth.
IMPORTANCE OF THE PLANT
It is abundantly available and does not require any land space. It grows readily without any need for sowing, weeding or fertilizing, so it costs nothing. It is rich in Nitrogen, Phosphorus and Potassium, so can be used as organic fertilizer. The plant has a fibrous tissue and a high energy and protein content and can be used for a variety of useful applications. It has tough, fibrous roots that purify water by absorbing the nitrogen, phosphorus and Potassium on which it thrives. The plant is extremely tolerance towards and of high capacity of up taking heavy metals as Cadmium, Chromium, Cobalt, Nickel, Lead and Mercury etc. The plant often takes up these metals and toxic materials from wastewater for their metabolic use [5]. It is also being used in various processes for producing bio-gas, compost and fiber-based material etc.

Asian Journal of Applied Science and Engineering, Volume 1, No 1 (2012) ISSN 2305-915X
Copyright © 2012, Asian Business Consortium | AJASE Page 11
1. Fibre boards. 2. Furniture. 3. Crafts. 4. Paper
USES OF THE PLANT
Various uses of Water Hyacinth in developed and developing world [6]: In many countries water hyacinth is being used as compost for growing mushrooms and also to clean the pollutants including toxic heavy metals To make rope and furniture, the stem of water hyacinth is being used by burning the plants; ashes are used for making soap. Water hyacinth briquettes are used as fuel. Due to scarcity of land, crops are also growing on the hyacinth raft. Dried water hyacinth is used as a fuel, making mat from the plant and producing biogas for cooking. It is called ―Pig weed" as people in many countries are feeding to their pigs. It is also using as food for cattle. The flowers, leaves and petioles are eaten as a vegetable in many Asian countries. Recently it is being used in waste water treatment plant due to its ability to tolerate high levels of pollution.
SOURCE OF ENERGY
Due to vegetative reproduction and extremely high growth rate Water hyacinth spread rapidly. It has been used as a potential biomass for the production of biogas because of its high growth yield and availability in large amount throughout the year and all over the world. Biogas from Water hyacinth is done by a digester. To reach at an optimum condition for the production of maximum amount of gas, the lower volatile fatty acids (acetic acid) and Cow dung can be used with water hyacinth. With this process, the biogas plants could be run even in the cold winter nights by using the additive (acetic acid). After digestion of Water Hyacinth,
1
2
3 4

Asian Journal of Applied Science and Engineering, Volume 1, No 1 (2012) ISSN 2305-915X
Copyright © 2012, Asian Business Consortium | AJASE Page 12
the waste products (residue) can be used as good manure for soil fertility, which is free from harmful chemicals and is a boon for sustainable agriculture practices. To produce biogas, generally biomass is used. Among the floating macrophytes, the water hyacinth is found to be most productive compared to other small leaf floating plants. Biogas produced from water hyacinth is similar to that from cow dung. A plant with the capacity of about 6 cubic meters can be used to produce the gas. The easily biodegradable matter particularly hemi- cellulose is higher in water hyacinth than cow dung [7]. To reach an optimum condition for the production of a maximum amount of biogas from Water Hyacinth, the following three tasks should be done successfully. Collecting the hyacinth from the lake/ water bodies and delivering it to a processing site, the biomass should be shredded to make slurry with cow dung and catalyst and processing it into as many saleable products as possible.
BIOGAS TECHNOLOGY
Biogas is produced by anaerobic digestion which takes place in a reactor or digester (an air tight container usually sited below ground) and the usable product is methane gas which can be used as a fuel for cooking, lighting or for powering an engine to provide shaft power. The residue from the digestion process provides a fertilizer rich in nutrients. In this method water hyacinth is to shred into slurry and digest in a continuous process, as cow dung is customarily used [8]. Experiment will need a digestion tank (known as the Digester), shredders, gas holders, pipes and fittings, a supply of water hyacinth, cow dung and catalyst. Animal farm should be the part of the project or associated with it as animal manure also acts as an important catalyst and increases the production of biogas. About 4000 liters of gas per ton of semi dried water hyacinth being produced with a methane content of up to 64% [9].
Figure 1: Experimental Setup for Biogas Production

Asian Journal of Applied Science and Engineering, Volume 1, No 1 (2012) ISSN 2305-915X
Copyright © 2012, Asian Business Consortium | AJASE Page 13
A blend of Water hyacinth and Cow dung in the ratio of 2:3 by weight is most suitable for biogas production. Addition of very little amount of lower volatile fatty acid particularly acetic acid facilitates the gas production. This technique is very much helpful at the village level of Bangladesh for the farmers using biogas plants. The rate of production of biogas from Water hyacinth is higher as compared to Cow dung slurry. The digested slurry (residue) can be used as useful chemical free eco-friendly manure.
CONCLUSION
As an abundantly available source of biomass, the excessive growth of Water Hyacinth can be used as energy production as well as a resource of various important uses [10]. By using water hyacinth biomass in Bangladesh, we can produce bio gas and many other useful items and hence increase employment opportunity and generate income.
REFERENCES
1. Reza A and Khan J 1981. Water hyacinth as cattle feed. Indian Journal of Animal Science 51: 702-706.
2. J. Todd, B. Josephson, The design of living technologies for waste treatment / Ecological Engineering 6 (1996) 109-136.
3. T. M. Abo Bakr, N. M. El-Shemi and A. S. Mesallam 2005 ―Isolation and chemical evaluation of protein from water hyacinth‖. Food Science and Technology Department, Faculty of Agriculture University of Alexandria Alexandria Egypt Volume 34, Number 1, 67-73.
4. Birendra K. Kumar, WATER HYACINTH (Eichhronia crassipes) AS A FEED FOR RUMINANTS, Department of Animal Nutrition College of Veterinary Science Assam Agricultural University Khanapara, Guwahati-22, Assam, pp 2, India
5. V. Singhal and J. P. N. Rai. 2002. Biogas production from water hyacinth and channel grass used for phytoremediation of industrial effluents. Department of Environmental Sciences, G.B. Pant University of Agriculture and Technology, Pantnagar-263 145, India
6. Oracle Education Foundation. 2009. http://www.Library.thinkquest.org/co126023/uses.htm
7. Robbins, J.E., Armold, M.T., Weiel., J.E. 1983. Anaerobic Digestion of Cellulose Dairy Cattle Manure Mixture, Agricultural Wastes, Vol.8. Pp.105-118.
8. Shoeb, H and Singh, H.J. 2000. Kinetic Studies of Biogas Evolved from Water Hyacinth. Agroenviron. 2nd International Symposium on New Technologies for Environmental Moniroring and Agro-Applicationas.
9. Technical information on water hyacinth. 2010, http://practicalaction.org/practicalanswers/product_info.php
10. Keith L., Hans, M.H. 2000. A practical Handbook of uses of Water hyacinth from across The world.
Asian Business Consortium is an independent research house committed to publishing and delivering superior, Peer-reviewed
standard research

Asian Journal of Applied Science and Engineering, Volume 1, No 1 (2012) ISSN 2305-915X
Copyright © 2012, Asian Business Consortium | AJASE Page 14
Phytormediation of copper toxicity in soil by
various corn and vegetables of Bangladesh
M. Mafizur Rahman1, Jakaria
2, M. Shahriar
2, S.K. Biswas
1, & Rokibul Islam
1
1Lecturer, Department of Biotechnology and Genetic Engineering, Islamic University, Kushtia, Bangladesh 2Department of Biotechnology and Genetic Engineering, Islamic University, Kushtia, Bangladesh
ABSTRACT
In Bangladesh copper toxicity created in agricultural fields due to using copper containing fungicide or fertilizer and in some industrial areas due to its effluents. The aim of present study is to identify hyperaccumulator corn and vegetables that are effective for phytoremediation of copper in polluted area. Twelve types of vegetables are selected and each is planted in artificial copper contaminated soils. Atomic Absorption Spectrophotometer (AAS) is used for analysis of copper in soils and vegetable samples in which six vegetable species are selected as hyperaccumlators and thus they can be used for remediation of polluted area. The highest accumulation rate of copper in case of cucumber (Cucumis sativus), swamp cabbage (Ipomoea aquatica), sudan grass (Indian ricegnas), bottle gourd (Lagenaria siceraria), lentils (Lens culinaris ) and spinach (Spinacia oleracea) are respectively 9.19 mg/g, 1.86 mg/kg, 11.77 mg/g, 2.71 mg/g, 1.19 mg/g and 22.97 mg/g. Thus these plants can be used for remediation of polluted area. Key words: Copper ion, Heavy metals, Hyperaccumulator, Phytoextraction, Remediation.
INTRODUCTION
In Bangladesh copper toxicity is rarely occurred in nature but it is created temporarily in agricultural fields due to using copper containing fungicide or fertilizer and in some industrial areas due to its effluents. Copper toxicity may accumulate due to application of sewage sludge, pig slurries or more commonly through persistent use of copper-containing fungicides or fertilizers or industrial effluents. With heavy fungicide use on land, mild symptoms of copper toxicity have been observed on sweet potato[1]. Beside this, Concentrations of Cu, Zn, Pb, Cr, Cd, Fe, and Ni have been estimated in soil and vegetables grown in and around an industrial area of Bangladesh. The order of metal contents was found to be Fe > Cu > Zn > Cr > Pb > Ni > Cd in contaminated irrigation water, and a similar pattern Fe > Zn > Ni > Cr > Pb > Cu > Cd was also observed in arable soils [2]. Though copper is essential to human life and is required for various biological processes, but like all heavy metals, is potentially toxic as well [3]. The average abundance of copper in the earth‘s crust is recorded as 24 to 55 ppm [4]. The acceptable limit for human consumption of Copper (Cu) is 10 ppm. Copper is an essential element and its recommended uptake limit in

Asian Journal of Applied Science and Engineering, Volume 1, No 1 (2012) ISSN 2305-915X
Copyright © 2012, Asian Business Consortium | AJASE Page 15
plant is 0.0-5.0 mg/kg [5]. The acceptable range for human intake is up to 10 mg/kg [6] and the daily recommended limit is 2-3 mg/day. When copper exceeds its safe level concentration, it causes hypertension, sporadic fever, uremia and coma etc. The presence of copper ions, cause serious toxicological concern [7]. high quantities of Metals such as Cu (copper), Pb (lead), Zn (zinc) and Cd (cadmium) can decrease crop production due to the risk of biomagnifications in the food chain. There is also the risk of underground and surface water contamination [8], [9].
Phytoextraction (also known as phytoaccumulation) is a form of phytoremediation, in
short phytoextraction is the process of removing contaminants from soil or sediment by
having plants take them up and store them in above ground, harvestable tissues.
Phytoextraction was developed in the framework of an intense research effort for more
efficient, cheaper and less hazardous techniques to remediate contaminated soils. It
consists in the removal of heavy metals from soil rather than organic compounds or
chemicals by plants through uptake and accumulation into biomass [10]. Interestingly,
phytoremediation was recognized and documented by humans more than 300 years ago,
however the scientific study and development of suitable plants was not conducted until
the early 1980's [11]. Hyper-accumulators are defined as higher plant species capable of
accumulating metals at levels 100-fold greater than those typically measured in common
nonaccumulator plants. Thus, a hyperaccumulator will concentrate more than 10 mg kg-1
Hg (mercury); 100 mg kg-1 Cd; 1,000 mg kg-1 Co (cobalt), Cr (chromium), Cu and Pb; and
10,000 mg kg-1 Ni and Zn. The capacity to hyperaccumulate metals is a relatively rare
phenomenon in the plant kingdom, occurring in approximately 400 species of vascular
plants total [12]. The goal of heavy metal extraction is to reduce metal levels in the soil up
to the acceptable levels within a reasonable time frame [13], [14], [15]. So the present research aimed to study the identification of hyperaccumulator crops and vegetable plants belongs to family of Brassicaceae, Apiaceace, Poaceae, Malvaceae, Basellaceae and Solanaceae, Chenopodiaceae and Cucurbitaceae in Bangladesh perspective which is able to phytoextract the toxic level of copper in industrial, agricultural and mining areas of Bangladesh.
MATERIAL AND METHOD
Soil sample and measurement Soil sample is collected from the garden of Soil Resource Development Institute (S.R.D.I.) zonal research center muraridah, Jhenaidah (district). Here only the surface soil is collected. After that, the soil is dried in natural air, clean to remove grass and dirt in a 2mm iron sieve. The soil sample also grinded. The collected soil is tested for the presence of different metal concentration Cu, Mg, K, N, P, S, B, Zn, Fe, Mn, pH and organic matter etc (Table-1). Plantation
Spread seeds on damp paper towel, cover with several paper towels, and store in a
warm, dark place for 3 days until they sprout (Figs.l-p.). Make stock solution of 0.1M,
0.05M and 0.025M Copper sulphate. For 0.1M, add 15.96g Copper sulphate and fill with
distilled water to the 1 Liter mark on the volumetric flask. Use the same procedure for 0.05
M by adding 7.98 g Copper sulphate and for 0.025 M by adding 3.99 g and filling the 1
Liter volumetric flasks with the distilled water to the line. Prepare 38 growth chambers by
cutting off the top third of each plastic bottle. The top piece is then inverted, placed on top
of the chamber and taped to the base. Heat a cork borer and use it to punch a 1 centimeter
Asian Journal of Applied Science and Engineering, Volume 1, No 1 (2012) ISSN 2305-915X
Copyright © 2012, Asian Business Consortium | AJASE Page 16
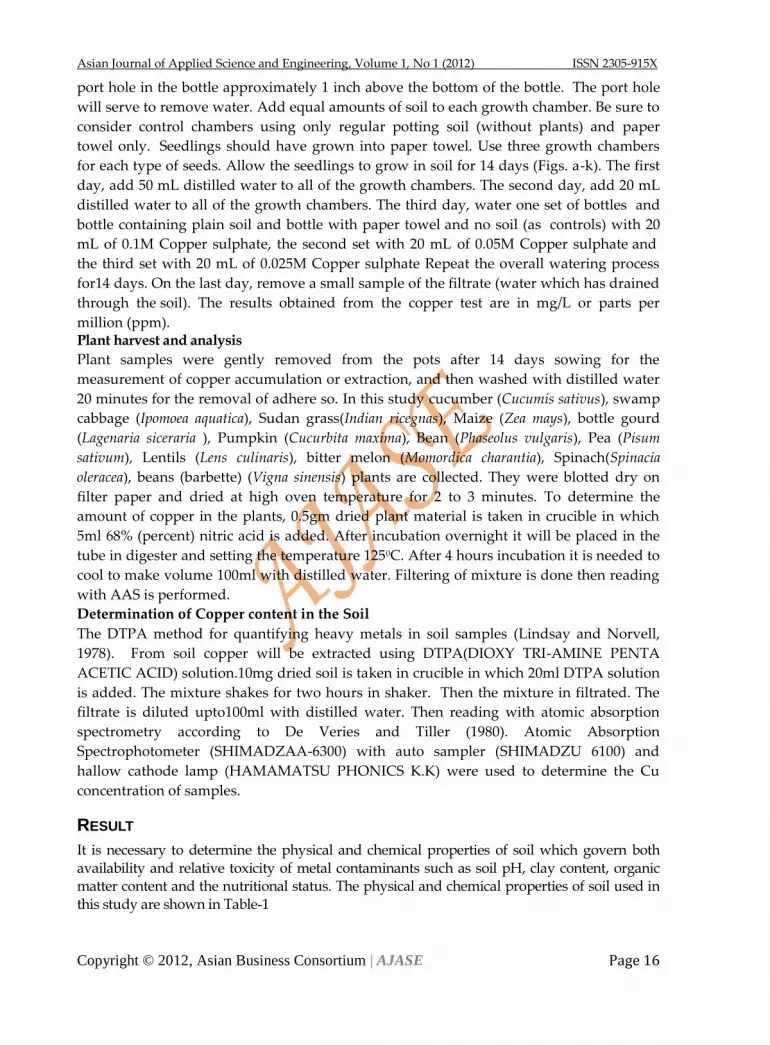
port hole in the bottle approximately 1 inch above the bottom of the bottle. The port hole
will serve to remove water. Add equal amounts of soil to each growth chamber. Be sure to
consider control chambers using only regular potting soil (without plants) and paper
towel only. Seedlings should have grown into paper towel. Use three growth chambers
for each type of seeds. Allow the seedlings to grow in soil for 14 days (Figs. a-k). The first
day, add 50 mL distilled water to all of the growth chambers. The second day, add 20 mL
distilled water to all of the growth chambers. The third day, water one set of bottles and
bottle containing plain soil and bottle with paper towel and no soil (as controls) with 20
mL of 0.1M Copper sulphate, the second set with 20 mL of 0.05M Copper sulphate and
the third set with 20 mL of 0.025M Copper sulphate Repeat the overall watering process
for14 days. On the last day, remove a small sample of the filtrate (water which has drained
through the soil). The results obtained from the copper test are in mg/L or parts per
million (ppm). Plant harvest and analysis
Plant samples were gently removed from the pots after 14 days sowing for the
measurement of copper accumulation or extraction, and then washed with distilled water
20 minutes for the removal of adhere so. In this study cucumber (Cucumis sativus), swamp
cabbage (Ipomoea aquatica), Sudan grass(Indian ricegnas), Maize (Zea mays), bottle gourd
(Lagenaria siceraria ), Pumpkin (Cucurbita maxima), Bean (Phaseolus vulgaris), Pea (Pisum
sativum), Lentils (Lens culinaris), bitter melon (Momordica charantia), Spinach(Spinacia
oleracea), beans (barbette) (Vigna sinensis) plants are collected. They were blotted dry on
filter paper and dried at high oven temperature for 2 to 3 minutes. To determine the
amount of copper in the plants, 0.5gm dried plant material is taken in crucible in which
5ml 68% (percent) nitric acid is added. After incubation overnight it will be placed in the
tube in digester and setting the temperature 1250C. After 4 hours incubation it is needed to
cool to make volume 100ml with distilled water. Filtering of mixture is done then reading
with AAS is performed.
Determination of Copper content in the Soil
The DTPA method for quantifying heavy metals in soil samples (Lindsay and Norvell,
1978). From soil copper will be extracted using DTPA(DIOXY TRI-AMINE PENTA
ACETIC ACID) solution.10mg dried soil is taken in crucible in which 20ml DTPA solution
is added. The mixture shakes for two hours in shaker. Then the mixture in filtrated. The
filtrate is diluted upto100ml with distilled water. Then reading with atomic absorption
spectrometry according to De Veries and Tiller (1980). Atomic Absorption
Spectrophotometer (SHIMADZAA-6300) with auto sampler (SHIMADZU 6100) and
hallow cathode lamp (HAMAMATSU PHONICS K.K) were used to determine the Cu
concentration of samples.
RESULT
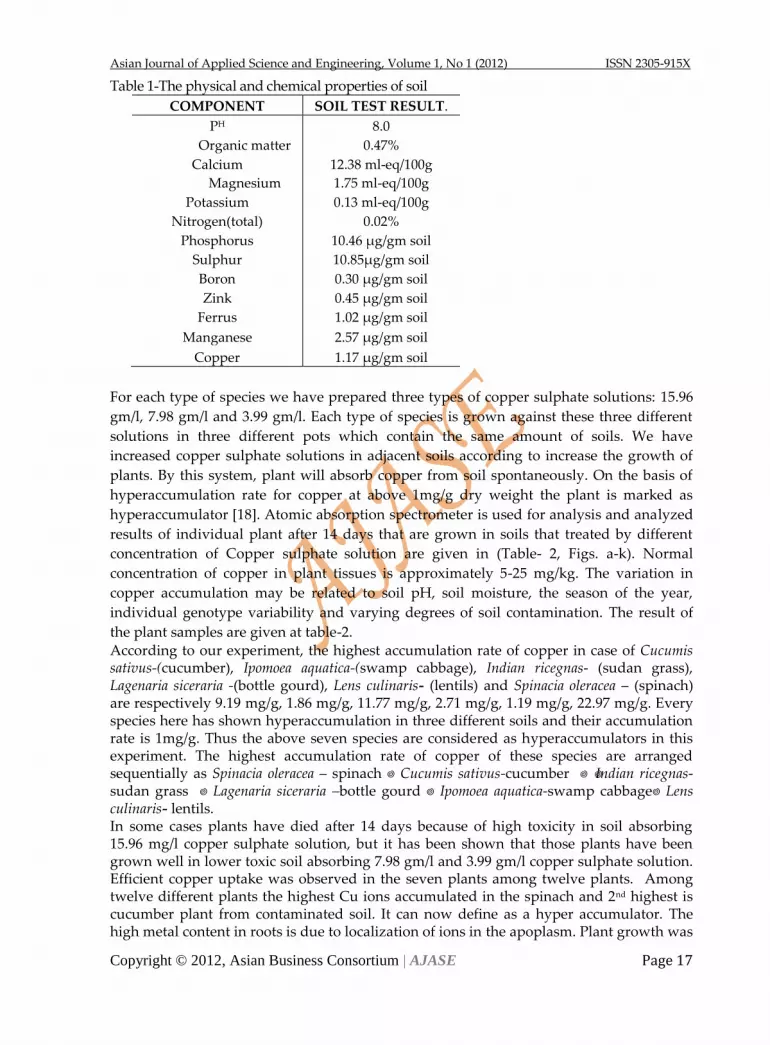
It is necessary to determine the physical and chemical properties of soil which govern both availability and relative toxicity of metal contaminants such as soil pH, clay content, organic matter content and the nutritional status. The physical and chemical properties of soil used in this study are shown in Table-1
Asian Journal of Applied Science and Engineering, Volume 1, No 1 (2012) ISSN 2305-915X
Copyright © 2012, Asian Business Consortium | AJASE Page 17
Table 1-The physical and chemical properties of soil
COMPONENT SOIL TEST RESULT.
PH 8.0
Organic matter 0.47%
Calcium 12.38 ml-eq/100g
Magnesium 1.75 ml-eq/100g
Potassium 0.13 ml-eq/100g
Nitrogen(total) 0.02%
Phosphorus 10.46 µg/gm soil
Sulphur 10.85µg/gm soil
Boron 0.30 µg/gm soil
Zink 0.45 µg/gm soil
Ferrus 1.02 µg/gm soil
Manganese 2.57 µg/gm soil
Copper 1.17 µg/gm soil
For each type of species we have prepared three types of copper sulphate solutions: 15.96
gm/l, 7.98 gm/l and 3.99 gm/l. Each type of species is grown against these three different
solutions in three different pots which contain the same amount of soils. We have
increased copper sulphate solutions in adjacent soils according to increase the growth of
plants. By this system, plant will absorb copper from soil spontaneously. On the basis of
hyperaccumulation rate for copper at above 1mg/g dry weight the plant is marked as
hyperaccumulator [18]. Atomic absorption spectrometer is used for analysis and analyzed
results of individual plant after 14 days that are grown in soils that treated by different
concentration of Copper sulphate solution are given in (Table- 2, Figs. a-k). Normal
concentration of copper in plant tissues is approximately 5-25 mg/kg. The variation in
copper accumulation may be related to soil pH, soil moisture, the season of the year,
individual genotype variability and varying degrees of soil contamination. The result of
the plant samples are given at table-2. According to our experiment, the highest accumulation rate of copper in case of Cucumis sativus-(cucumber), Ipomoea aquatica-(swamp cabbage), Indian ricegnas- (sudan grass), Lagenaria siceraria -(bottle gourd), Lens culinaris- (lentils) and Spinacia oleracea – (spinach) are respectively 9.19 mg/g, 1.86 mg/g, 11.77 mg/g, 2.71 mg/g, 1.19 mg/g, 22.97 mg/g. Every species here has shown hyperaccumulation in three different soils and their accumulation rate is 1mg/g. Thus the above seven species are considered as hyperaccumulators in this experiment. The highest accumulation rate of copper of these species are arranged sequentially as Spinacia oleracea – spinach Cucumis sativus-cucumber Indian ricegnas- sudan grass Lagenaria siceraria –bottle gourd Ipomoea aquatica-swamp cabbage Lens culinaris- lentils. In some cases plants have died after 14 days because of high toxicity in soil absorbing 15.96 mg/l copper sulphate solution, but it has been shown that those plants have been grown well in lower toxic soil absorbing 7.98 gm/l and 3.99 gm/l copper sulphate solution. Efficient copper uptake was observed in the seven plants among twelve plants. Among twelve different plants the highest Cu ions accumulated in the spinach and 2nd highest is cucumber plant from contaminated soil. It can now define as a hyper accumulator. The high metal content in roots is due to localization of ions in the apoplasm. Plant growth was
Asian Journal of Applied Science and Engineering, Volume 1, No 1 (2012) ISSN 2305-915X
Copyright © 2012, Asian Business Consortium | AJASE Page 18
significantly reduced in the wheat varieties, where as in both the plants, belongs to Chenopodiaceae and Cucurbitaceae family (i.e. spinach and cucumber) plant growth increased by increasing the copper ion concentration up to low level (i.e. 25µM). Copper exposure influenced several biochemical and physiological parameters. Administration excess amount of copper was followed by an increase of Cu ions and its associated symptoms of toxicity in leaves. Typical symptoms of copper toxicity developed 15 days after the beginning of treatments. Chlorophyll concentration was decreased in response to heavy metal toxicity. Highest reduction was observed in both the varieties of pea and bitter melon. Necrotic lesions were seen on the plants treated with 100µM copper.
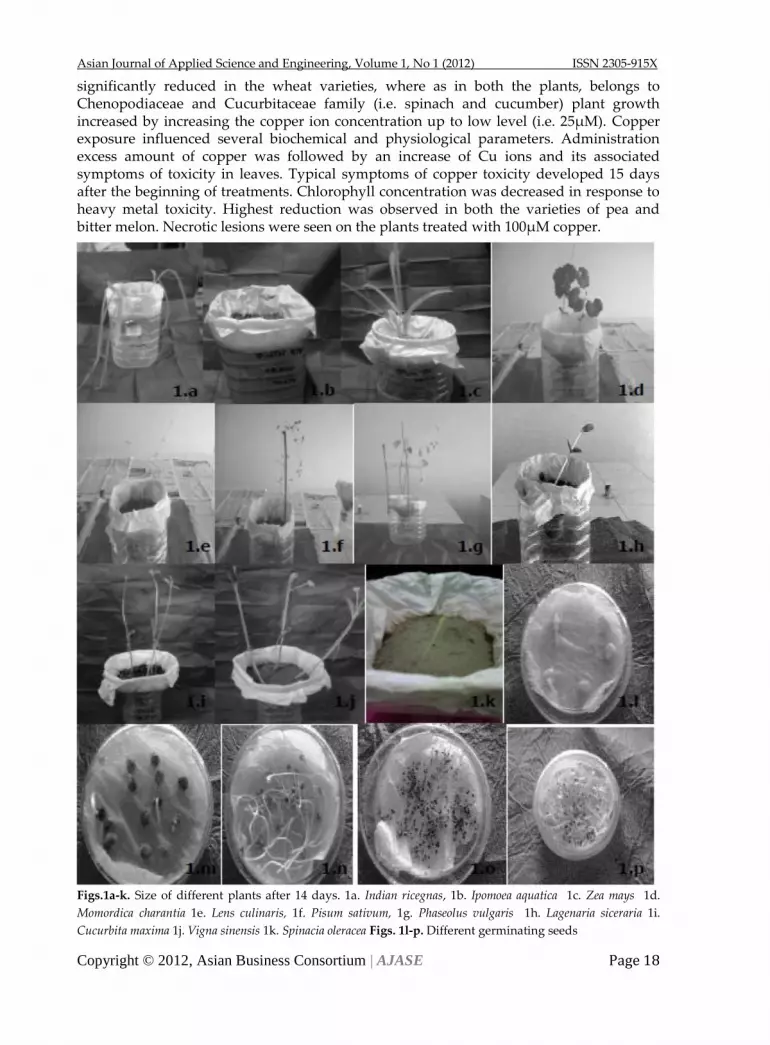
Figs.1a-k. Size of different plants after 14 days. 1a. Indian ricegnas, 1b. Ipomoea aquatica 1c. Zea mays 1d.
Momordica charantia 1e. Lens culinaris, 1f. Pisum sativum, 1g. Phaseolus vulgaris 1h. Lagenaria siceraria 1i.
Cucurbita maxima 1j. Vigna sinensis 1k. Spinacia oleracea Figs. 1l-p. Different germinating seeds

Asian Journal of Applied Science and Engineering, Volume 1, No 1 (2012) ISSN 2305-915X
Copyright © 2012, Asian Business Consortium | AJASE Page 19
Table-2: The following table shows the result of amount of copper in plant samples according to
AAS reading.
Name of plant Concentration of
copper sulphate
solution added
to soil (gm/l)
Concentration
of Copper of
plant dry
weight (mg/g)
Comment
Cucumis sativum (cucumber) 15.96 9.1904 Hyper accumulator
7.98 4.7050
3.99 4.0982
Ipomoea aquatic (swamp cabbage) 15.96 1.8410 Hyper accumulator
7.98 1.5937
3.99 1.8590
Indian ricegnas ( Sudan grass) 15.96 0.9897 Hyper accumulator
7.98 4.9127
3.99 11.7725
Zea mays (maize) 15.96 0.8370
7.98 0.54054
3.99 0.9736
Lagenaria siceraria (bottle gourd) 15.96 1.72716 Hyper accumulator
7.98 2.71446
3.99 1.24589
Cucurbita maxima (pumpkin) 15.96 1.89898
7.98 0.54241
3.99 0.69708
Phaseolus vulgaris (bean) 15.96 1.37738
7.98 0.56884
3.99 0.74349
Pisum sativum (pea) 15.96 1.15603
7.98 0.52884
3.99 0.84349
Lens culinaris (lentils) 15.96 0.75904 Hyper accumulator
7.98 1.01484
3.99 1.19343
Momordica charantia (bitter melon) 15.96 0.97102
7.98 0.56842
3.99 0.56832
Spinacia oleracea (spinach) 15.96 6.59857 Hyper accumulator
7.98 22.9753
3.99 7.65333
Vigna sinensis (barbette) 15.96 0.73901
7.98 0.94857
3.99 1.23938

Asian Journal of Applied Science and Engineering, Volume 1, No 1 (2012) ISSN 2305-915X
Copyright © 2012, Asian Business Consortium | AJASE Page 20
DISCUSSION
The most common heavy metal contaminants are Cd, Cr, Cu, Hg, Pb and Zn. Plants grown
in metal enriched substrata take up metal ions in varying degrees. Normal concentration
of copper in plant tissues is approximately 5-25 mg/kg. Plant copper concentrations are
controlled within a remarkably narrow range and plant copper concentrations above 100
mg/kg are rare even in the presence in high soil copper. The variation in copper
accumulation may be related to soil pH, soil moisture, the season of the year, individual
genotype variability and varying degrees of soil contamination [16]. Uptake is largely
influenced by the availability of metals, which is in turn determined by both external (soil
associated) and internal (plant associated) factors. In only a limited number of plant
species a heritable tolerance or resistance occurs, which enables these plants to grow on
metal contaminated soils [17].
In this experimental process of phytoextraction, for analysis use twelve species of plants.
For each type of species we have prepared three types of copper sulphate solutions: 15.96
gm/l, 7.98 gm/l, and 3.99 gm/l. Each type of species is grown against these three different
solutions in three different pots which contain the same amount of soils. We have
increased copper sulphate solutions in adjacent soils according to increase the growth of
plants. By this system, plant will absorb copper from soil spontaneously. In previous
articles we have found that if an individual plant accumulates above 1mg Cu/g plant dry
weight –this is considered as hyperaccumulator [18]. If any species show
hyperaccumulation in the above three different copper sulphate solution containing soils
we have considered them as hyperaccumulators. Among twelve plants, six plants
exhibited the highest concentration of metal while other plants were lowest (Table2).
According to our experiment, the highest accumulation rate of copper in case of Cucumis
sativus-(cucumber), Spinacia oleracea – (spinach), Ipomoea aquatica-(swamp cabbage), Indian
ricegnas- (sudan grass), Lagenaria siceraria -(bottle gourd), Lens culinaris- (lentils) and are
respectively 9.19 mg/g, 22.97 mg/g 1.86 mg/g, 11.77 mg/g, 2.71 mg/g, 1.19 mg/g. Every
species here has shown hyperaccumulation in three different concentration of soil and
their accumulation rate is above 1mg/g. The accumulation of copper was 1.110 mg/g dry
weight of water hyacinth plant. [19]. This amount was the lowest level as compared to
above plant species.
The visual symptoms of toxicity varied depending on the element and plant species tested.
In general Mustard, Sunflower and Raddish showed to be more tolerant to the presence of
excess metals in the soil and did not show any sign of toxicity. For the other species,
shoots presented generalized interveinal chlorosis, purple spots and browning, shriveling,
decrease in development and in some cases necrosis and leaf death. All the symptoms
described have been reported in literature for eucalyptus cultivated in heavy metals
contaminated soil [20]. At high concentrations, copper can become toxic causing
symptoms such as chlorosis and necrosis, stunting, leaf discoloration and inhibition of root
growth. Initially in a plant, root is inhibited by copper toxicity in soil [21]. We have just
observed that which plant root is tolerable to copper toxicity in initial stage of plant
growth. Thus we have observed the plants only for 14 days.

Asian Journal of Applied Science and Engineering, Volume 1, No 1 (2012) ISSN 2305-915X
Copyright © 2012, Asian Business Consortium | AJASE Page 21
The future of phytoremediation is still in research and development phase, and there are
many technical barriers which need to be addressed. Both agronomic management practices
and plant genetic abilities need to be optimized to develop commercially useful practices.
Many hyperaccumulator plants remain to be discovered, and there is a need to know more
about their physiology [13]. Optimization of the process, proper understanding of plant
heavy metal uptake and proper disposal of biomass produced is still needed.
CONCLUSION
Phytoextraction is a fast developing field, since last ten years lot of field application were
initiated all over the world, it includes Phytoextraction of Organic, Inorganic and
Radionuclides. This sustainable and inexpensive process is fast emerging as a viable
alternative to conventional remediation methods, and will be most suitable for a developing
country like Bangladesh. Most of the studies have been done in developed countries and
knowledge of suitable plants is particularly limited in Bangladesh. In Bangladesh
commercial application of Phytoextraction of soil heavy metal has not been started yet. But
in India, neighbouring country of Bangladesh, it is available at the present days. We have
used phytoextraction process used in this research to remove copper toxicity in soil.
REFERENCES
[1] O’Sullivan, J., Loader, L., Asher, C., and Blamey, P. Troubleshooting nutritional
problems in a new industry: sweet potato in North Queensland. Proceedings of
the First Australian New Crops Conference, Gatton, July 1996.
[2] Jasim Uddin Ahmed and Md. Abdul Goni. Heavy metal contamination in water
soil and vegetables of the industrial areas in Dhaka, Bangladesh. Environmental
Monitoring and Assessment, 166, 2010, 347-357
[3] Hifsa, et al. Phytoremidiation of Cu (II) by Calotropis procera roots, New York Science
Journal, 3, 2010, 3-8
[4] Deepa, R., Senthilkumar, P., Sivakumar, S., Duraisamy, P. & Subbhuraam, C. V.
Copper Availability and Accumulation by Portulaca oleracea Linn. Stem Cutting.
Environmental Monitoring and Assessment, 116, 2006, 185-195
[5] Institute of Medicine, Dietary Reference Intakes: Calcium, Phosphorus, Magnesium,
Vitamin D, and Fluoride. Washington, DC: National Academy Press 1997, pp: 190-249.
[6] Yusuf, A.A., Arowolo T.O.A. and Bamgbose, O. Cd, Cu and Ni level in vegetables
from industrial and residential areas of lagos City, Nigeria. Global Journal
Environment Science, 1, 2002, 1-6.
[7] Davis ТА, Volesky B, Vieira R.H.S.F. Sargassum seaweed as biosorbent for heavy
metals. Water Resourse, 34, 2000, 4270-4278
[8] Schmidt, U. Enhancing phytoextraction: the effect of chemical soil manipulation on
mobility, plant accumulation and leaching of heavy metals. Journal
Environmental Quality, 32, 2003, 1939-1954.
[9] Nowack, B.; Schulin, R.; Robinson, B.H. Critical assessment of chelant-enhanced
metal phytoextraction. Environmental Science and technology 40, 2006, 5525-5532.

Asian Journal of Applied Science and Engineering, Volume 1, No 1 (2012) ISSN 2305-915X
Copyright © 2012, Asian Business Consortium | AJASE Page 22
[10] Nascimento, C.W.A.; Xing, B. Phytoextraction: a review on enhanced metal
availability and plant accumulation. Scientia Agricola, 63: 2006, 299-311.
[11] Lasat, M.M. Phytoextration of metals from contaminated soil: a review of
plant/soil/metal interaction and assessment of pertinent agronomic issues.
Journal of Hazardaus Substance Research 2, 2000, 1-25.
[12] Reeves, R.D.; Baker, A.J.M. Metal-accumulating plants. Phytoremediation of toxic
metals: Using plants to clean up the environment, 1999, p. 193-229. In: Raskin, I.;
Ensley, B.D., eds. John Wiley, New York, NY, USA.
[13] Raskin, I., Kumar, P.B.A.N., Dushenkov, S. and Salt, D. Bioconcentration of heavy
metals by plants. Current Opinion Biotechnology 5, 1994, 285-290.
[14] Nanda-Kumar, P.B.A., Dushenkov, V., Motto, H. and Raskin, I. Phytoextraction: the
use of plants to remove heavy metals from soils. Environmental Science and
Technology, 29, 1995, 1232-1238.
[15] Hung W.J. and Blaylock M. J. phytoremediation of uranium – contaminated soil:
role of organic acids in triggering uranium hyperaccumulation in plants.
Enviornmental Science and Technology. 32, 1998, 2004-2008.
[16] Reeves, R. D. and Baker, A. J. ‚Metal- Accumulating Plants‛, Phytoremediation of
toxic metals: Using plants to clean up the environment. Raskin, I. and Ensley, B.
D. (ed.) New York: John Wiley & Sons, Inc., 2000, 193-229.
[17] Brooks, R.R., Lee, J., Reeves, R.D. and Jaffre, T. Detection of nickeliferous rocks by
analysis of herbarium specimens of indicator plants. Journal of Geochemistry
Exploration, 7, 1997, 49-58.
[18] Baker A. J. M. and Brooks R. R. Terrestrial higher plants which hyperaccumulate
metalic elements. A review of their distribution, ecology and phytochemistry. –
Biorecovery 1, 1989, 81-126.
[19] Low, K.S., Lee, C.K. and Thai, C. H. Biosorption of copper by water hyacinth roots.
Journal of Environmental Sciience Health A. 29, 1994, 171-188.
[20] Accioly, A.M.A.; Soares, C.R.F.S.; Siqueira, J.O. Calcium silicate to reduce heavy metal
toxicity in eucalyptus seedlings. Pesquisa Agropecuária Brasileira. 44, 2009, 180-188.
[21] Van Assche, F., Clijsters, H. Effects of metals on enzyme activity in plants. Plant Cell
Environment, 13, 1990, 195-206.
Why publish on AJASE?
High quality editorial board
Rigorous and rapid peer review
Open Access & high citation rate
Will apply for ISI track in the near future
Asian Journal of Applied Science and Engineering, Volume 1, No 1 (2012) ISSN 2305-915X
Copyright © 2012, Asian Business Consortium | AJASE Page 23
Human Development Scenario of Malaysia:
ASEAN and Global Perspective
Md. Sujahangir Kabir Sarkar1&2
, Sumaiya Sadeka3, Md. Mehedi Hasan Sikdar
4
1Ph.D. Research Fellow, South East Asia Disaster Prevention Research Institute (SEADPRI), Universiti
Kebangsaan Malaysia (UKM), Malaysia 2Assistant professor, Department of Agricultural Economics and Rural Sociology, Patuakhali Science &
Technology University, Patuakhali, Bangladesh 3Department of Social Work, Rajshahi University, Rajshahi, Bangladesh 4Assistant professor, Department of Statistics, Patuakhali Science & Technology University, Patuakhali,
Bangladesh
ABSTRACT
Human development is one of the core considerations of a country‘s level of development. This study focuses on the performance of development indicators highlighting Malaysian scenario among the ASEAN and some other countries of the world. Malaysia has achieved the 61st place in the world according to the performance of human development. In the Human Development Report (HDR) 2011, countries are divided into very high human development, high human development, medium human development and low human development. Malaysia has perceived a good position among the group of high human development countries and ASEAN countries. It has occupied third position among ASEAN countries according to GNI per capita and HDI rank. Income Gini-coefficient of Malaysia is comparatively higher meaning that larger income inequality prevailing in Malaysian nations but it can be noted that very few people of Malaysia live below poverty line just 3.8 percent. Malaysia‘s position is quite good in term of ecological footprint, environmental performance index, renewable energy, fossil fuels, etc but still far behind from the very high human development countries. Moreover it has possessed the worst position among the ASEAN because of producing highest emission of carbon dioxide and green house gas. So it is really alarming that though Malaysia is one of the influential countries in the ASEAN but it has failed to achieve best position among the South East Asian countries. Moreover, in many case Malaysia‘s position is still far away from the performance of different indicators of the developed countries of the world though Malaysia is committed to be a developed nation by 2020. So for transforming Malaysia as a developed nation it need to concentrate to accelerate a very good performance of human development indicators. Key words: Human Development, Malaysia, ASEAN, Global
Asian Journal of Applied Science and Engineering, Volume 1, No 1 (2012) ISSN 2305-915X
Copyright © 2012, Asian Business Consortium | AJASE Page 24
INTRODUCTION
Human development is one of the core considerations of a country‘s level of development. According to United Nations Development Program (UNDP), human development is about creating an environment in which people can develop their full potential and lead productive and creative lives in accordance with their needs and interests (UNDP, 2001). Costantini and Monni (2008) have stated that human development has to be the first objective of international development policies, whereas an increase in human well-being is necessary to provide a sustainable path. Human development should be the ultimate objective of human activity, its aim being healthier, longer, and fuller lives (Anand and Sen 2000; Ranis et al. 2000 and Ülengin et al. 2011). Moran et al. (2008) used Human Development Index (HDI) as an indicator of development and argued that a HDI of no less than 0.8 and a per capita Ecological Footprint less than the globally available biocapacity per person represent minimum requirements for sustainable development that is globally replicable. Malaysia is committed to reach a very good human development country with a record of strong economic performance and poverty reduction and a goal of transforming itself into a high-income and developed nation by 2020. Malaysia has occupied the 61st place in the world according to the performance of human development (HDR, 2011). Moreover, the country has largely achieved its Millennium Development Goals, well ahead of the 2015 target date. Furthermore these significant achievements, which enabled Malaysia to provide better service for health and education of its people, and largely eradicate poverty. Malaysia‘s economy expanded at a robust 5.8% annual rate in the 5 years before 2008, contributing to a reduction in overall poverty (based on the national poverty line) from 5.7% in 2004 to 3.8% in 2008 (ADB, 2011). After a reduction of GDP (Gross Domestic Product) growth in 2009, the economy rebounded strongly again in 2010, by an estimated 6.9%, on the back of a moderate recovery in exports and stronger domestic demand (ADB, 2011). According to the Environmental Performance Index (EPI), Malaysia ranked 54 among the 163 countries in the year 2010 (EPI, 2010). There is a large gap between the nations according to indicators of human development. So Malaysia‘s position comparing to the other nations need to be evaluated time to time in terms of development parameters.
WHY DOES THE STUDY INCLUDE ASEAN AND GLOBAL PERSPECTIVE?
This study focuses on the different development indicators among the ASEAN countries and some other countries of the world. This article explores the Malaysian scenario as well as to derive comparison among the ASEAN (Association of Southeast Asian Nations) countries regarding human development indicators. Moreover as a committed country for a developed nation by 2020, it is very essential to determine the Malaysian scenario beyond ASEAN. So what is the global position of Malaysia and how is the country far from the performance of different indicators among the countries of the globe, this situation has been explored by this study. At the same time it has drawn attention of the Malaysian backwardness and forwardness in the global level. The countries that have been selected in this study cover developed countries, developing countries and least developed countries including all ASEAN countries. Most of the data that have been used in this paper have been extracted from the Human Development Repot (HDR) 2011 of the United Nations Development Program (UNDP). This study has explored the Malaysian position and performance of human development indicators among the ASEAN and global perspective which will help for policy prioritization, actions and research.
Asian Journal of Applied Science and Engineering, Volume 1, No 1 (2012) ISSN 2305-915X
Copyright © 2012, Asian Business Consortium | AJASE Page 25
DISCUSSION OF FINDINGS
Human Development Index
UNDP measures Human Development Index (HDI) every year among the countries for highlighting the performance of human development indicators. HDI is a simple composite measure that includes health, schooling and income. But UNDP Human Development Report (HDR) explores the performance of many indicators along with HDI. The world‘s average HDI increased 18 percent between 1990 and 2010 (41 percent since 1970), reflecting large improvements in life expectancy, school enrolment, literacy and income (HDR 2010). Almost all countries benefited. Poor countries are catching up with rich countries on the HDI, convergence that paints a far more optimistic picture than do trends in income, where divergence continues. China‘s per capita income grew an astounding 1,200 percent over the 40 years, but the Democratic Republic of the Congo‘s fell 80 percent (HDR 2010). Advances in technical knowledge and globalization have made progress more feasible for countries at all levels of development.
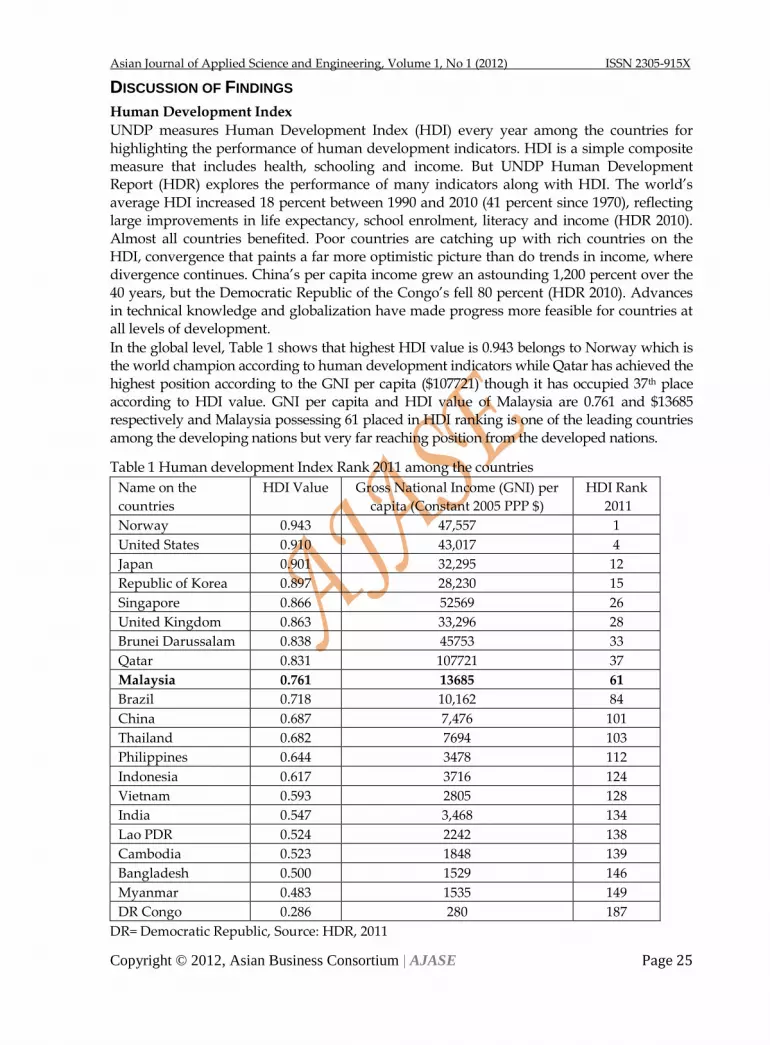
In the global level, Table 1 shows that highest HDI value is 0.943 belongs to Norway which is the world champion according to human development indicators while Qatar has achieved the highest position according to the GNI per capita ($107721) though it has occupied 37th place according to HDI value. GNI per capita and HDI value of Malaysia are 0.761 and $13685 respectively and Malaysia possessing 61 placed in HDI ranking is one of the leading countries among the developing nations but very far reaching position from the developed nations.
Table 1 Human development Index Rank 2011 among the countries
Name on the
countries
HDI Value
Gross National Income (GNI) per
capita (Constant 2005 PPP $)
HDI Rank
2011
Norway 0.943 47,557 1
United States 0.910 43,017 4
Japan 0.901 32,295 12
Republic of Korea 0.897 28,230 15
Singapore 0.866 52569 26
United Kingdom 0.863 33,296 28
Brunei Darussalam 0.838 45753 33
Qatar 0.831 107721 37
Malaysia 0.761 13685 61
Brazil 0.718 10,162 84
China 0.687 7,476 101
Thailand 0.682 7694 103
Philippines 0.644 3478 112
Indonesia 0.617 3716 124
Vietnam 0.593 2805 128
India 0.547 3,468 134
Lao PDR 0.524 2242 138
Cambodia 0.523 1848 139
Bangladesh 0.500 1529 146
Myanmar 0.483 1535 149
DR Congo 0.286 280 187
DR= Democratic Republic, Source: HDR, 2011
Asian Journal of Applied Science and Engineering, Volume 1, No 1 (2012) ISSN 2305-915X
Copyright © 2012, Asian Business Consortium | AJASE Page 26
Global Comparison among Different Groups
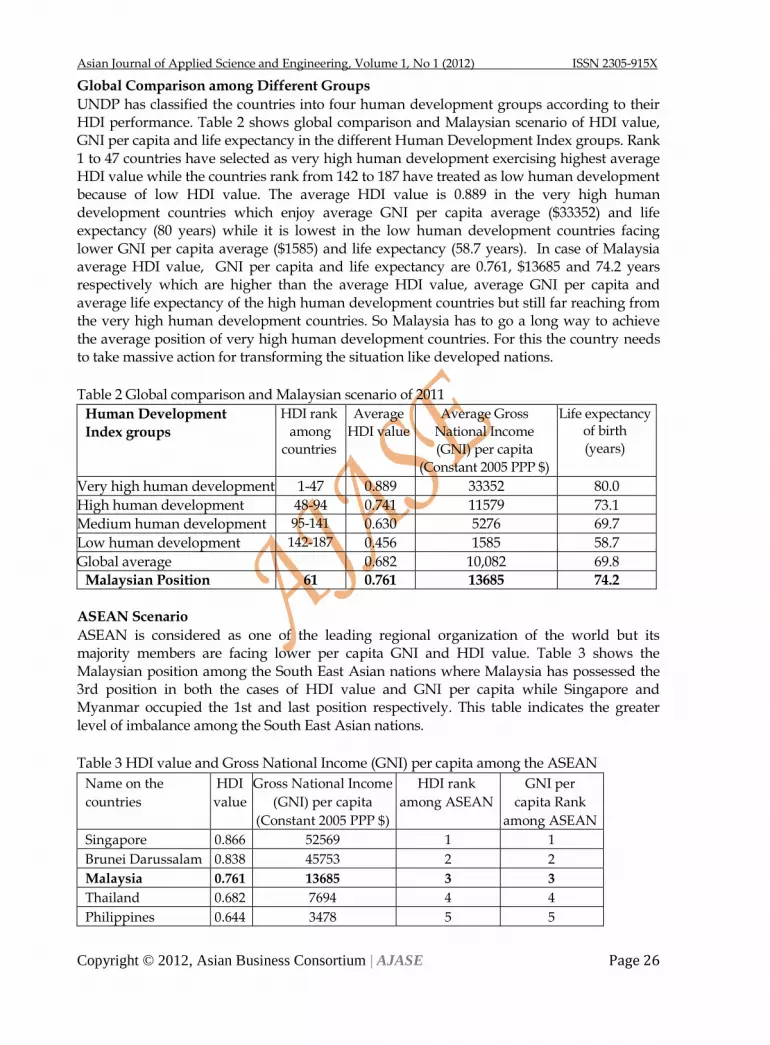
UNDP has classified the countries into four human development groups according to their HDI performance. Table 2 shows global comparison and Malaysian scenario of HDI value, GNI per capita and life expectancy in the different Human Development Index groups. Rank 1 to 47 countries have selected as very high human development exercising highest average HDI value while the countries rank from 142 to 187 have treated as low human development because of low HDI value. The average HDI value is 0.889 in the very high human development countries which enjoy average GNI per capita average ($33352) and life expectancy (80 years) while it is lowest in the low human development countries facing lower GNI per capita average ($1585) and life expectancy (58.7 years). In case of Malaysia average HDI value, GNI per capita and life expectancy are 0.761, $13685 and 74.2 years respectively which are higher than the average HDI value, average GNI per capita and average life expectancy of the high human development countries but still far reaching from the very high human development countries. So Malaysia has to go a long way to achieve the average position of very high human development countries. For this the country needs to take massive action for transforming the situation like developed nations.
Table 2 Global comparison and Malaysian scenario of 2011
Human Development
Index groups
HDI rank
among
countries
Average
HDI value
Average Gross
National Income
(GNI) per capita
(Constant 2005 PPP $)
Life expectancy of birth
(years)
Very high human development 1-47 0.889 33352 80.0
High human development 48-94 0.741 11579 73.1
Medium human development 95-141 0.630 5276 69.7
Low human development 142-187 0.456 1585 58.7
Global average 0.682 10,082 69.8
Malaysian Position 61 0.761 13685 74.2
ASEAN Scenario
ASEAN is considered as one of the leading regional organization of the world but its majority members are facing lower per capita GNI and HDI value. Table 3 shows the Malaysian position among the South East Asian nations where Malaysia has possessed the 3rd position in both the cases of HDI value and GNI per capita while Singapore and Myanmar occupied the 1st and last position respectively. This table indicates the greater level of imbalance among the South East Asian nations.
Table 3 HDI value and Gross National Income (GNI) per capita among the ASEAN
Name on the
countries
HDI
value
Gross National Income
(GNI) per capita
(Constant 2005 PPP $)
HDI rank
among ASEAN
GNI per
capita Rank
among ASEAN
Singapore 0.866 52569 1 1
Brunei Darussalam 0.838 45753 2 2
Malaysia 0.761 13685 3 3
Thailand 0.682 7694 4 4
Philippines 0.644 3478 5 5

Asian Journal of Applied Science and Engineering, Volume 1, No 1 (2012) ISSN 2305-915X
Copyright © 2012, Asian Business Consortium | AJASE Page 27
Indonesia 0.617 3716 6 6
Vietnam 0.593 2805 7 7
Lao PDR 0.524 2242 8 8
Cambodia 0.523 1848 9 9
Myanmar 0.483 1535 10 10
Source: Prepared by authors from HDR, 2011
Income Gini Coefficient among the Countries
The Gini coefficient is a measure of the inequality of a distribution having a range from 0–1, where 0 corresponds with perfect equality (where everyone has the same income) and 1 corresponds with perfect inequality (where one person has all the income — and everyone else has zero income).
Table 4 Income Gini Co-efficient, 2000-11 (inequality adjusted) among the countries
HDI Rank 2011 Name on the countries Income Gini Co-efficient,
2000-2011
1 Norway 0.26
4 United States 0.41
12 Japan -
15 Republic of Korea -
26 Singapore 0.52*
28 United Kingdom -
33 Brunei Darussalam -
52 Seychelles 0.19
61 Malaysia 0.46
84 Brazil 0.54
101 China 0.42
103 Thailand 0.54
112 Philippines 0.44
124 Indonesia 0.37
128 Vietnam 0.38
134 India 0.37
138 Lao PDR 0.37
139 Cambodia 0.44
149 Myanmar -
158 Haiti 0.60
187 DR Congo 0.44
Source: HDR 2011, * Shweta, P. 2012
Table 4 shows that income inequality prevails in all the nations. In global scenario Haiti
(0.60) and Seychelles (0.19) has occupied the worst and best position in terms of income
Gini coefficient. In ASEAN scenario, all the member countries face a greater level of
income inequality where Thailand, Malaysia, Philippines and Cambodia’s problem are
acute. However, the highest and lowest income Gini coefficient has been found in
Thailand (0.54) and Lao PDR & Indonesia (0.37) respectively.

Asian Journal of Applied Science and Engineering, Volume 1, No 1 (2012) ISSN 2305-915X
Copyright © 2012, Asian Business Consortium | AJASE Page 28
Human Development Index Trends
This index is measured by the performance of human development indicators. Nearly all the countries of the world are enjoying a positive trend in case of Human Development Index. Especially the developing countries growth is higher than the developed countries because of significant improvement of some development indicators.
Table 5 Human Development Index trends in the world, 1980-2011
HDI
Rank
2011
Name on the
countries
Human Development Index value Average annual
HDI growth (%)
1980 1990 2000 2005 2009 2011 1980-2011
1 Norway 0.796 0.844 0.913 0.938 0.941 0.943 0.55
4 United States 0.837 0.870 0.897 0.902 0.906 0.910 0.29
12 Japan 0.778 0.827 0.868 0.886 0.895 0.901 0.47
15 Republic of
Korea
0.634 0.742 0.830 0.866 0.889 0.897 1.13
26 Singapore - - 0.801 0.835 0.856 0.866 -
28 United Kingdom 0.744 0.778 0.833 0.855 0.860 0.863 0.48
33 Brunei
Darussalam
0.750 0.784 0.818 0.830 0.835 0.838 0.36
61 Malaysia 0.559 0.631 0.705 0.738 0.752 0.761 1.00
84 Brazil 0.549 0.600 0.665 0.692 0.708 0.718 0.87
101 China 0.404 0.490 0.588 0.633 0.674 0.687 1.73
103 Thailand 0.486 0.566 0.626 0.656 0.673 0.682 1.10
112 Philippines 0.550 0.571 0.602 0.622 0.636 0.644 0.51
124 Indonesia 0.423 0.481 0.543 0.572 0.607 0.617 1.23
128 Vietnam - 0.435 0.528 0.561 0.584 0.593 -
134 India 0.344 0.410 0.461 0.504 0.535 0.547 1.51
138 Lao PDR - 0.376 0.448 0.484 0.514 0.524 -
139 Cambodia - - 0.438 0.491 0.513 0.523 -
149 Myanmar 0.279 0.298 0.380 0.436 0.474 0.483 1.78
187 DR Congo 0.282 0.289 0.224 0.260 0.277 0.286 0.05
Sources: HDR, 2011
Poverty Scenario
Now the world population is exceeding 7000 million. Poverty is still a great problem of the world especially the developing and least developed countries are continuously fighting with this. According to the recent statistics, number of hungry people in the world 925 million in 2010 which is 13.6 percent of the world population (World Bank, 2011). Malaysia is having a good position among the ASEAN and the global level possessing poverty only 3.8 percent of its population while Cambodia has belonged the worst position in the ASEAN. Population below poverty line in Table 6 has been derived from the HDI Report 2011. It is determined that Haiti has occupied the world worst position and the big Asian giant China has possessed the world best position regarding the level of national poverty.
Asian Journal of Applied Science and Engineering, Volume 1, No 1 (2012) ISSN 2305-915X
Copyright © 2012, Asian Business Consortium | AJASE Page 29
Table 6 Population below national poverty line and Malaysian scenario
Category Population below poverty line (%) Country
Position of Malaysia 3.8 Malaysia
Best in the world 2.8 China
Worst in the world 77.0 Haiti
Best in the ASEAN 3.8 Malaysia
Worst in the ASEAN 30.1 Cambodia
Environmental Sustainability
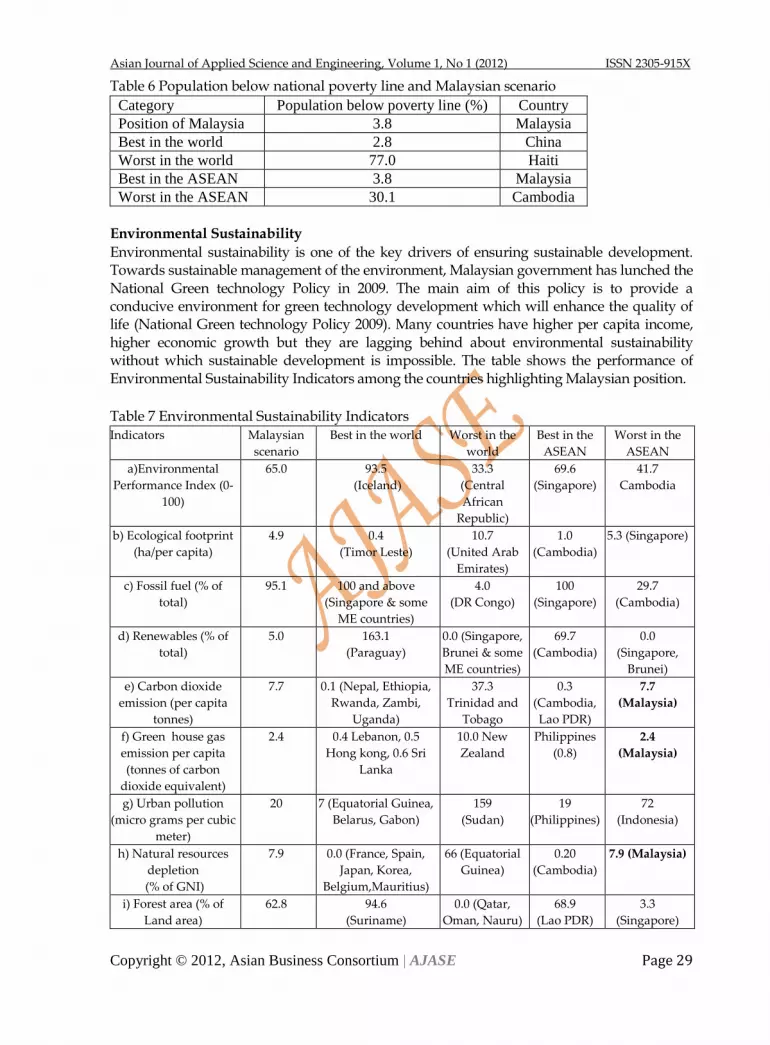
Environmental sustainability is one of the key drivers of ensuring sustainable development. Towards sustainable management of the environment, Malaysian government has lunched the National Green technology Policy in 2009. The main aim of this policy is to provide a conducive environment for green technology development which will enhance the quality of life (National Green technology Policy 2009). Many countries have higher per capita income, higher economic growth but they are lagging behind about environmental sustainability without which sustainable development is impossible. The table shows the performance of Environmental Sustainability Indicators among the countries highlighting Malaysian position.
Table 7 Environmental Sustainability Indicators Indicators Malaysian
scenario
Best in the world Worst in the
world
Best in the
ASEAN
Worst in the
ASEAN
a)Environmental
Performance Index (0-
100)
65.0 93.5
(Iceland)
33.3
(Central
African
Republic)
69.6
(Singapore)
41.7
Cambodia
b) Ecological footprint
(ha/per capita)
4.9 0.4
(Timor Leste)
10.7
(United Arab
Emirates)
1.0
(Cambodia)
5.3 (Singapore)
c) Fossil fuel (% of
total)
95.1 100 and above
(Singapore & some
ME countries)
4.0
(DR Congo)
100
(Singapore)
29.7
(Cambodia)
d) Renewables (% of
total)
5.0 163.1
(Paraguay)
0.0 (Singapore,
Brunei & some
ME countries)
69.7
(Cambodia)
0.0
(Singapore,
Brunei)
e) Carbon dioxide
emission (per capita
tonnes)
7.7 0.1 (Nepal, Ethiopia,
Rwanda, Zambi,
Uganda)
37.3
Trinidad and
Tobago
0.3
(Cambodia,
Lao PDR)
7.7
(Malaysia)
f) Green house gas
emission per capita
(tonnes of carbon
dioxide equivalent)
2.4 0.4 Lebanon, 0.5
Hong kong, 0.6 Sri
Lanka
10.0 New
Zealand
Philippines
(0.8)
2.4
(Malaysia)
g) Urban pollution
(micro grams per cubic
meter)
20 7 (Equatorial Guinea,
Belarus, Gabon)
159
(Sudan)
19
(Philippines)
72
(Indonesia)
h) Natural resources
depletion
(% of GNI)
7.9 0.0 (France, Spain,
Japan, Korea,
Belgium,Mauritius)
66 (Equatorial
Guinea)
0.20
(Cambodia)
7.9 (Malaysia)
i) Forest area (% of
Land area)
62.8 94.6
(Suriname)
0.0 (Qatar,
Oman, Nauru)
68.9
(Lao PDR)
3.3
(Singapore)

Asian Journal of Applied Science and Engineering, Volume 1, No 1 (2012) ISSN 2305-915X
Copyright © 2012, Asian Business Consortium | AJASE Page 30
j) Change in forest area
(%)
-7.8 223 (Iceland) -68.3
(Comoros)
44.3
(Vietnam)
-20
(Cambodia)
k) Endangered species
(% of all species)
18 0.0 (San Marino) 25 (New
Zealand)
9
(Lao PDR)
19 (Philippines)
ME= Middle East, Source: Prepared by authors from HDR, 2011
According to the Environmental Performance Index (EPI) Malaysia has achieved a good score of 65 out of 100 while the best country in the world and best in the ASEAN has been placed by the Iceland (93.5) and Singapore (69.6) respectively. The ecological footprint shows that the world is increasingly exceeding its global capacity to provide resources and absorb wastes. Most of the high and middle income countries have exceeded the global average biocapacity (biologically productive area per person) which is 1.8 global hectares (gha) per capita. The Malaysian footprint estimated as 4.9 which are alarming for environmental sustainability and need to be reduced while Singapore (5.3) and United Arab Emirates (10.7) has fallen worst position in ASEAN and world respectively. Malaysia has blessed by fossil fuel as it constitutes 95 percent of its total resources while Singapore is the highest among the ASEAN countries. Table 7 shows that some Middle East countries like Kuwait, Saudi Arabia, United Arab Emirate, Qatar, Bahrain, etc. are enriched with fossil fuel (100 %). In case of renewables, Malaysia captures just only 5.0 percent of its total resources and Singapore has no renewable but surprisingly Cambodia (69.7 %) is the highest among the ASEAN members.
Emissions per capita are much greater in very high HDI countries than in low, medium and high HDI countries combined because of more energy-intensive activities like driving cars, cooling and heating homes and businesses, consuming processed and packaged food. The average person in a very high HDI country accounts for more than four times the carbon dioxide emissions and about twice the methane and nitrous oxide emissions of a person in a low, medium or high HDI country— and about 30 times the carbon dioxide emissions of a person in a low HDI country (HDR, 2011). Malaysia is producing highest Carbon dioxide emission and Green house gas emission per capita among the ASEAN countries while Trinidad and Tobago (37.3) and New Zealand (10.0) has occupied the worst position for emissions respectively.
Urban pollution is comparatively less in Malaysia but it is quite acute in case of Indonesia in ASEAN while highest level of urban pollution in the world in Sudan. Malaysia has sufficient forest area (62.8% of Land area) and Singapore (3.3%) has a great lacking in this case among the ASEAN countries. Another important indicator of environmental sustainability is natural resources depletion where Malaysia‘s position (7.9 % of its GNI) is worst in the ASEAN. Finally forest area in Malaysia is decreasing and Malaysia‘s position in case of endangered species (18 % of all species) is dangerous but it is mentionable that world best position in forest change and worst position for endangered species has gone to the Iceland (223%) and New Zealand (25%) respectively.
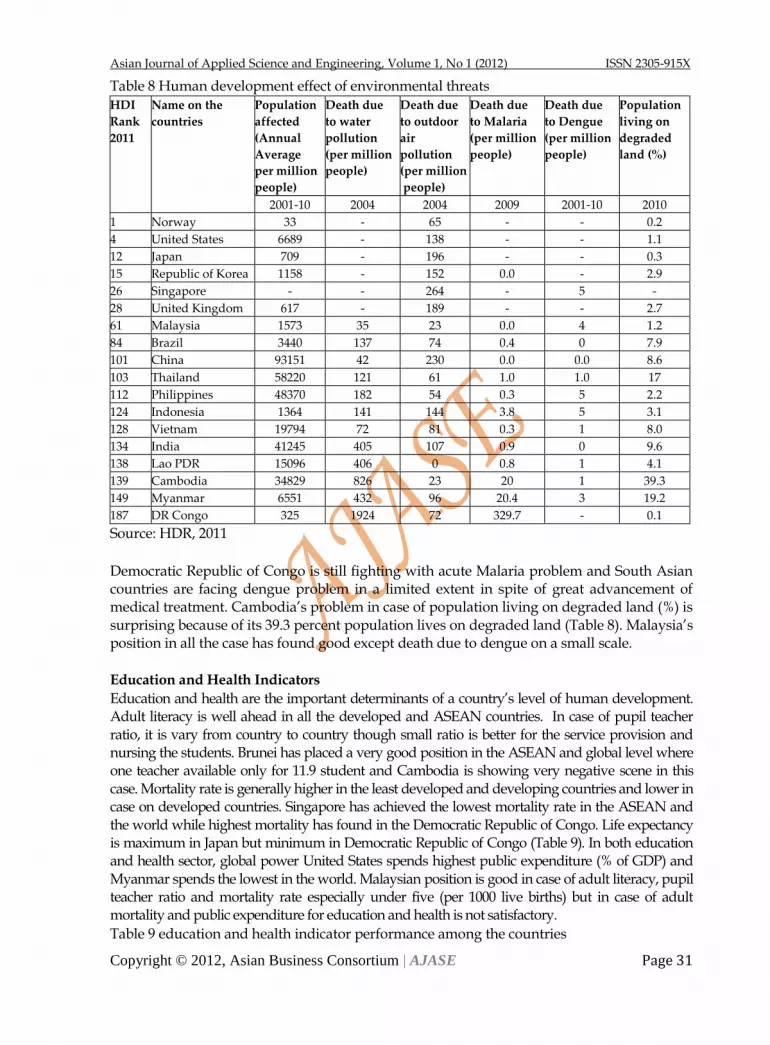
Human Development Effect of Environmental Threats
Every year many people of different countries are affected due to environmental hazards. Highest and lowest annual average of affected population has found China and Norway respectively. Water pollution is another environmental threat which is influencing human development negatively. Highest death due to water pollution (1924 per million people) has occurred in the Democratic Republic of Congo which is the world worst country according to human development. Most of the developed and developing countries are facing outdoor air pollution and surprisingly highest death due to outdoor air pollution (per million people) has found in Singapore while Lao PDR has no death for this in 2004.
Asian Journal of Applied Science and Engineering, Volume 1, No 1 (2012) ISSN 2305-915X
Copyright © 2012, Asian Business Consortium | AJASE Page 31
Table 8 Human development effect of environmental threats
HDI
Rank
2011
Name on the
countries
Population
affected
(Annual
Average
per million
people)
Death due
to water
pollution
(per million
people)
Death due
to outdoor
air
pollution
(per million
people)
Death due
to Malaria
(per million
people)
Death due
to Dengue
(per million
people)
Population
living on
degraded
land (%)
2001-10 2004 2004 2009 2001-10 2010
1 Norway 33 - 65 - - 0.2
4 United States 6689 - 138 - - 1.1
12 Japan 709 - 196 - - 0.3
15 Republic of Korea 1158 - 152 0.0 - 2.9
26 Singapore - - 264 - 5 -
28 United Kingdom 617 - 189 - - 2.7
61 Malaysia 1573 35 23 0.0 4 1.2
84 Brazil 3440 137 74 0.4 0 7.9
101 China 93151 42 230 0.0 0.0 8.6
103 Thailand 58220 121 61 1.0 1.0 17
112 Philippines 48370 182 54 0.3 5 2.2
124 Indonesia 1364 141 144 3.8 5 3.1
128 Vietnam 19794 72 81 0.3 1 8.0
134 India 41245 405 107 0.9 0 9.6
138 Lao PDR 15096 406 0 0.8 1 4.1
139 Cambodia 34829 826 23 20 1 39.3
149 Myanmar 6551 432 96 20.4 3 19.2
187 DR Congo 325 1924 72 329.7 - 0.1
Source: HDR, 2011
Democratic Republic of Congo is still fighting with acute Malaria problem and South Asian countries are facing dengue problem in a limited extent in spite of great advancement of medical treatment. Cambodia‘s problem in case of population living on degraded land (%) is surprising because of its 39.3 percent population lives on degraded land (Table 8). Malaysia‘s position in all the case has found good except death due to dengue on a small scale.
Education and Health Indicators
Education and health are the important determinants of a country‘s level of human development. Adult literacy is well ahead in all the developed and ASEAN countries. In case of pupil teacher ratio, it is vary from country to country though small ratio is better for the service provision and nursing the students. Brunei has placed a very good position in the ASEAN and global level where one teacher available only for 11.9 student and Cambodia is showing very negative scene in this case. Mortality rate is generally higher in the least developed and developing countries and lower in case on developed countries. Singapore has achieved the lowest mortality rate in the ASEAN and the world while highest mortality has found in the Democratic Republic of Congo. Life expectancy is maximum in Japan but minimum in Democratic Republic of Congo (Table 9). In both education and health sector, global power United States spends highest public expenditure (% of GDP) and Myanmar spends the lowest in the world. Malaysian position is good in case of adult literacy, pupil teacher ratio and mortality rate especially under five (per 1000 live births) but in case of adult mortality and public expenditure for education and health is not satisfactory.
Table 9 education and health indicator performance among the countries

Asian Journal of Applied Science and Engineering, Volume 1, No 1 (2012) ISSN 2305-915X
Copyright © 2012, Asian Business Consortium | AJASE Page 32
Name on the
countries
Adult
literacy
rate
(% age
15 and
older)
Pupil
teacher
ratio in
primary
education
(pupils per
teacher)
Mortality Life
expectancy
(Years)
Public
expenditure on
education
( % of GDP)
Total
expenditure
on health
( % of GDP Under
five (per
1000 live
births)
Adult
(per 1000
people)
2005-2010 2005-2010 2009 2009 2011 2009 2009
Norway - - 3 66.5 81.1 9.7 9.7
United States - 13.9 8 106 78.5 16.2 16.2
Japan - 18.1 3 64.0 83.4 8.3 8.3
Republic of Korea - 22.4 5 77.5 80.6 6.5 6.5
Singapore 94.7 17.4 3 59.0 81.1 3.9 3.9
United Kingdom - 18.3 6 76.5 80.2 9.3 9.3
Brunei Darussalam 95.3 11.9 7 93.5 78 3.0 3.0
Malaysia 92.5 14.6 6 135 74.2 4.8 4.8
Brazil 90.0 23.0 21 152.5 73.5 9.0 9.0
China 94.0 17.2 19 114.5 73.5 4.6 4.6
Thailand 93.5 16.0 14 204.5 74.1 4.3 4.3
Philippines 95.4 33.7 33 185 68.7 3.8 3.8
Indonesia 92.2 16.6 39 188.5 69.4 2.4 2.4
Vietnam 92.8 19.5 24 140 75.2 7.2 7.2
India 62.8 - 66 209.5 65.4 4.2 4.2
Lao PDR 72.7 30.5 59 270 67.5 4.1 4.1
Cambodia 77.6 49.1 88 270 63.1 5.9 5.9
Myanmar 92.0 28.4 71 231.5 65.2 2.0 2.0
DR Congo 66.8 37.3 199 386 48.4 9.5 9.5
Source: HDR, 2011
Performance of Economic Indicators
Economic indicators vary among the countries. Sometime it is guessed that the developed countries constitute the very good position in all the economic indicator performance but it is not true. From the Table 10 it is clear that some of the indicator performance is good in case of developing nations. As for example Qatar has occupied the first place in case of GDP per capita (PPP $) & GNI per capita (constant 2005 PPP $) while Seychelles is for Income Gini co-efficient and net FDI inflow. Worst position of Income Gini co-efficient and GDP per capita (PPP $) & GNI per capita (constant 2005 PPP $) has gone to the Haiti and democratic Republic of Congo respectively. United States allocates the highest share of their GDP for public expenditure and health. In case of Malaysia, though it has disbursed highest share of GDP allocation to the public expenditure and health among the ASEAN countries but it is still far reaching compare to some other countries. Malaysia and Singapore experienced lowest and highest FDI respectively among the Southeast Asian Nations.

Asian Journal of Applied Science and Engineering, Volume 1, No 1 (2012) ISSN 2305-915X
Copyright © 2012, Asian Business Consortium | AJASE Page 33
Table 10 Economic indicators among the countries
Name
on the
countries
GDP per
capita
(PPP $)
GNI per
capita
(constant
2005 PPP $)
FDI net
Inflow
(% of
GDP)
Net ODA
received
(% of GDP)
Income
Gini co-
efficient
Public
expenditure
On education
(% of GDP)
Public
expenditure
on health
(% of GDP)
2009 2009 2009 2009 2000-11 2006-2009 2009
Norway 56,214 47557 3.0 - 0.26 9.7 9.7
United States 45,989 43017 1.0 - 0.41 16.2 16.2
Japan 32,418 32295 0.2 - - 8.3 8.3
Republic of Korea 27,100 28230 0.2 - 6.5 6.5
Singapore 50,633 52569 9.2 - 0.52* 3.9 3.9
United Kingdom 35,155 33296 3.4 - - 9.3 9.3
Brunei Darussalam - 45753 - - - 3.0 3.0
Qatar 91379 107,721 - - 41.1 2.5 2.5
Seychelles 19587 16729 32.5 3.5 0.19 4.0 4.0
Malaysia 14,012 13685 0.7 0.1 0.46 4.8 4.8
Brazil 10367 10162 1.6 0.0 0.54 9.0 9.0
China 6,828 7476 1.6 0.0 0.42 4.6 4.6
Thailand 7,995 7694 1.9 0.0 0.54 4.3 4.3
Philippines 3,542 3478 1.2 0.2 0.44 3.8 3.8
Indonesia 4,199 3716 0.9 0.2 0.37 2.4 2.4
Vietnam 2,953 2805 8.4 4.4 0.38 7.2 7.2
India 3,296 3468 2.5 0.2 0.37 4.2 4.2
Lao PDR 2,255 2242 5.4 7.2 0.37 4.1 4.1
Cambodia 1,915 1848 5.4 7.7 0.44 5.9 5.9
Myanmar - 1535 - - - 2.0 2.0
Haiti 1151 1123 0.6 - 0.60 6.1 6.1
DR congo 319 280 9.0 23.9 44.4 9.5 9.5
Source: HDR, 2011
CONCLUSION AND RECOMMENDATION
Human Development Report is a great focus of different development parameters among the countries. This report shows a greater imbalance among the countries regarding the performance of human development indicators. Malaysia‘s position is quite well in case of high human development countries and ASEAN countries in term of ecological footprint, environmental performance index, renewable energy, fossil fuels, etc but still far behind from the very high human development countries regarding GNI per capita, life expectancy and so on. But it has possessed the worst position among the ASEAN because of producing highest emission of carbon dioxide and green house gas. Malaysia is very positive due to its strong economic growth and relatively lower poverty. But it is really alarming that though Malaysia is one of the dominant countries in the ASEAN but it is fail to achieve best position among the South East Asian countries. This country is also far away from the developed country‘s position. So Malaysia needs to gear up the performance of human development indicators for getting a very good position in the ASEAN and global level. There is also need further research regarding the human development scenario because Malaysia is currently lacking prior research on this issue.
Asian Journal of Applied Science and Engineering, Volume 1, No 1 (2012) ISSN 2305-915X
Copyright © 2012, Asian Business Consortium | AJASE Page 34
Followings are the major recommendations for Malaysia:
Proper actions need to be taken to reduce emission of carbon dioxide and green house gas.
Steps should be taken to increase income and income generating activities for the people in a way to reducing the gap between rich and poor
Natural resources depletion should be reduced to achieve environmental sustainability
Public expenditure on education and health should be increased for accelerating quality education and good health
Further research need to conduct for evaluating the Malaysia‘s position time to time.
REFERENCES
ADB. 2011. Asian Development Outlook 2011. Manila.
Anand S. and Sen A. 2000. Human development and economic sustainability. World Development.28(12):2029-49.
Costantini V. and Monni S. 2008. Environment, human development and econometric growth. Ecological Economics. 64(2):867-880.
EPI, 2010. Environmental Performance Index 2010, Estimated by Yale University, New Haven, Connecticut, United States.
HDR, 2010. Human Development Report 2010: The Real Wealth of Nations: Pathways to Human Development. Published by United Nations Development Programme, 1 UN Plaza, New York, NY 10017, USA.
HDR, 2011. Human Development Report 2011: Sustainability and Equity: A Better Future for All, Published by United Nations Development Programme, 1 UN Plaza, New York, NY 10017, USA.
Moran, D.D., Wackernagel, M., Kitzes, J.A. Goldfinger S.H. and Boutaud, A. 2008. Measuring sustainable development-Nation by nation. Ecological Economics, 64: 470 – 474.
National Green technology Policy 2009. Ministry of energy, green technology and water. Federal government of Malaysia, Putrajaya.
Ranis, G., Stewart F. and Ramirez A. 2000. Economic growth and human development. World Development. 28(2):197-219.
Shweta, P. 2012. Singapore Poverty Inquiary http://13pangsh.files.wordpress.com/2011/05/singapore-poverty-inquiry.pdf
United Nations Development Program (UNDP) 2001. Human Development Report: Making new technologies work for human development. New York: Oxford University Press.
Ülengin, F., Kabak, O., Önsel, S., Aktas, E. and Parker, B. R. 2011. The competitiveness of nations and implications for human development. Socio-Economic Planning Sciences 45 (2011) 16-27
World Bank, 2011.World Hunger and Poverty Facts and Statistics,Washington D.C. USA.http://www.worldhunger.org/articles/Learn/world%20hunger%20facts%202002
Submit your next manuscript at- www.abcjournals.weebly.com ABC Journals is a unique forum to offer open access to all of its articles. Now ABC Journal‘s portfolio is over eight journals, which publish both online and in print.

Asian Journal of Applied Science and Engineering, Volume 1, No 1 (2012) ISSN 2305-915X
Copyright © 2012, Asian Business Consortium | AJASE Page 35
Performance of south facing windows for indoor
ventilation & thermal comfort at Dhaka
Mahbuba Afroz Jinia & Saiful Hasan Tariq
Lecturer, Department of Architecture, Stamford University Bangladesh
ABSTRACT
The way we think of Nature, thus ventilation, especially air flow greatly influences the form and substance of our daily lives, the buildings we design and therefore how they sustain the nature of place. Flow of air is one of the most important natural features available to architects to enhance the physical quality of interior spaces. Cross ventilation and wind flow is the major issue for thermal comfort of an interior space. Effect of ventilation is necessary for a residential building as it gives the users a comfortable and soothing environment. In residential buildings artificial ventilation is expensive to some extent. Maintaining natural air flow in the interior spaces is the only way for good health and healthy ventilation in a cost efficient way. In Bangladesh, it is preferred to provide openings at south because most of the time of the year southern wind flows over the country due to climatic situation. It is well known that a building having openings at south and at opposite or oblique corners is better ventilated. Placing the window is oblique (at 45°) to the inlet opening of the same room is the best solution for cross ventilation at Bangladesh. But a different scenario has been observed in south facing east-west elongated building. There are some openings which remains in wind shadow and failed to provide enough wind flow to the interior space although is placed in south facade. This paper focuses on discussing this factor affecting good ventilation, air flow and thermal comfort for the south facing opening position of a building. A horizontally elongated south facing residential building at Dhaka has been taken for the case study and analysis has been done on the basis of literature review, field survey and questionnaire survey. Key words: Ventilation, thermal comfort, Wind pressure, windward & leeward side, window position.
INTRODUCTION
The way we think of Nature thus ventilation, especially air flow greatly influences the form and substance of our daily lives, the buildings we design and therefore how they sustain the nature of place. Flow of air is one of the most important natural features available to architects to enhance the physical quality of interior spaces. It is a resource in the tropics which the architects can use without any cost. In residential buildings artificial ventilation, that is, air condition is expensive in some extend. It is also not for good health to remain

Asian Journal of Applied Science and Engineering, Volume 1, No 1 (2012) ISSN 2305-915X
Copyright © 2012, Asian Business Consortium | AJASE Page 36
under artificial ventilation even at home. So, maintaining natural air flow in the interior spaces is the only way for good health and health ventilation. Bangladesh is a tropical country and most of the time of the year we get southern wind because of our geographic location on the world. It is a common solution for the buildings of our country to provide windows facing south to receive the blessing of nature, southern wind and enough sunlight. It is well known that a building having openings at south and at opposite or oblique corners is better ventilated. But a different scenario is observed in south facing east-west elongated building. Air flow and ventilation differ for the south facing windows at different position of the façade. Therefore, placing windows at south is not the only solution, the window position in a long façade is also important in design to receive the southern wind.
RESEARCH OBJECTIVES
In many cases it has been observed that the comfortable condition due to ventilation and air flow is not always same in all the living areas in the same building, especially an elongated building. The study intends to find the ventilation and thermal comfort situation of different indoor spaces having windows in different position of an east-west elongated south facing residential buildings in Dhaka city. The research also search the answer, whether all the south facing windows get positive wind pressure or not for good ventilation properties.
METHODOLOGY
To conduct the research, a literature review has been made on wind flow and ventilation properties. A south facing east-west elongated residential building having open spaces at south has been fundamentally selected for the study. As the direction of wind flow in Bangladesh changes due to season change and the wind flow is not constant all of the year, it is difficult to measure the wind speed in a short time span to conduct a specific research. A detail field survey has been conducted by questionnaire of the occupants. The basis of questionnaire is based on thermal comfort and ventilation condition of different spaces. Finally, different living spaces have been named into some study areas to analysis and summarize the findings of the research.
CLIMATE OF BANGLADESH
Bangladesh has a tropical monsoon climate characterized by seasonal variations in rainfall, high temperatures, and high humidity. Regional climatic differences in this flat country are minor. Three seasons are generally recognized: a hot, muggy summer from March to June; a hot, humid and rainy monsoon season from June to November; and a warm-hot, dry winter from December to February. In general, maximum summer temperatures range between 38°C. and 41°C. April is the hottest month in most parts of the country. January is the coolest (but still hot) month, when the average temperature for most of the country is 16-20°C during the day and around 10°C at night.
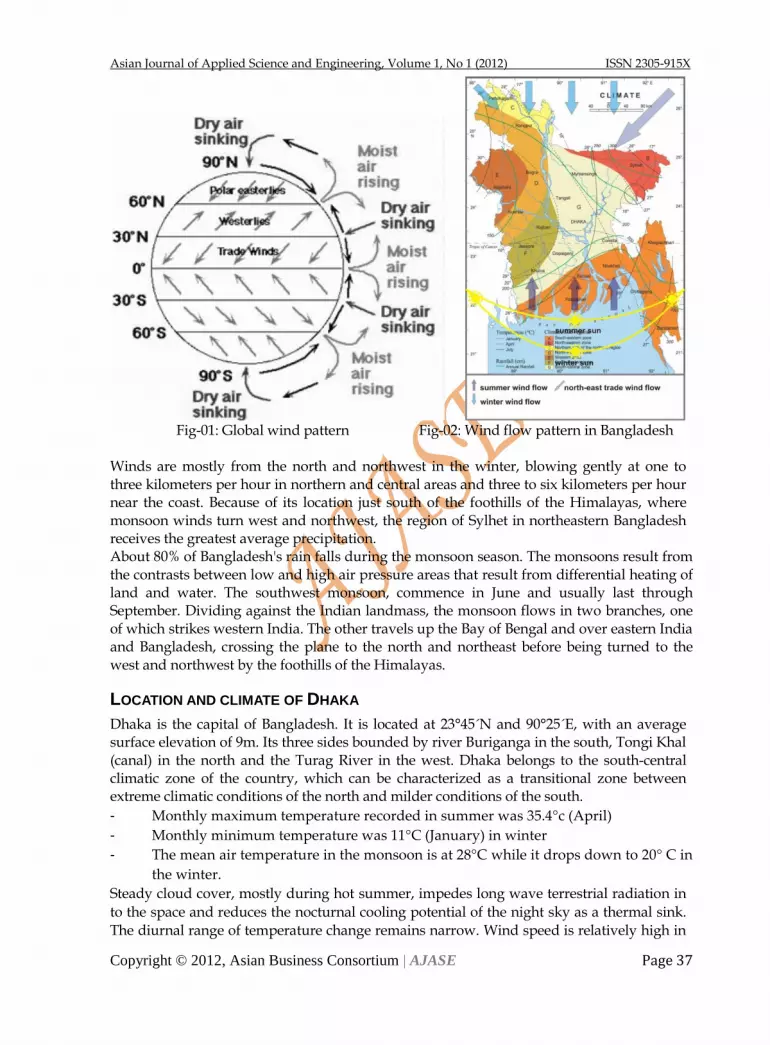
Asian Journal of Applied Science and Engineering, Volume 1, No 1 (2012) ISSN 2305-915X
Copyright © 2012, Asian Business Consortium | AJASE Page 37
Fig-01: Global wind pattern Fig-02: Wind flow pattern in Bangladesh Winds are mostly from the north and northwest in the winter, blowing gently at one to three kilometers per hour in northern and central areas and three to six kilometers per hour near the coast. Because of its location just south of the foothills of the Himalayas, where monsoon winds turn west and northwest, the region of Sylhet in northeastern Bangladesh receives the greatest average precipitation. About 80% of Bangladesh's rain falls during the monsoon season. The monsoons result from the contrasts between low and high air pressure areas that result from differential heating of land and water. The southwest monsoon, commence in June and usually last through September. Dividing against the Indian landmass, the monsoon flows in two branches, one of which strikes western India. The other travels up the Bay of Bengal and over eastern India and Bangladesh, crossing the plane to the north and northeast before being turned to the west and northwest by the foothills of the Himalayas.
LOCATION AND CLIMATE OF DHAKA
Dhaka is the capital of Bangladesh. It is located at 23°45´N and 90°25´E, with an average surface elevation of 9m. Its three sides bounded by river Buriganga in the south, Tongi Khal (canal) in the north and the Turag River in the west. Dhaka belongs to the south-central climatic zone of the country, which can be characterized as a transitional zone between extreme climatic conditions of the north and milder conditions of the south.
- Monthly maximum temperature recorded in summer was 35.4°c (April)
- Monthly minimum temperature was 11°C (January) in winter
- The mean air temperature in the monsoon is at 28°C while it drops down to 20° C in
the winter.
Steady cloud cover, mostly during hot summer, impedes long wave terrestrial radiation in
to the space and reduces the nocturnal cooling potential of the night sky as a thermal sink.
The diurnal range of temperature change remains narrow. Wind speed is relatively high in
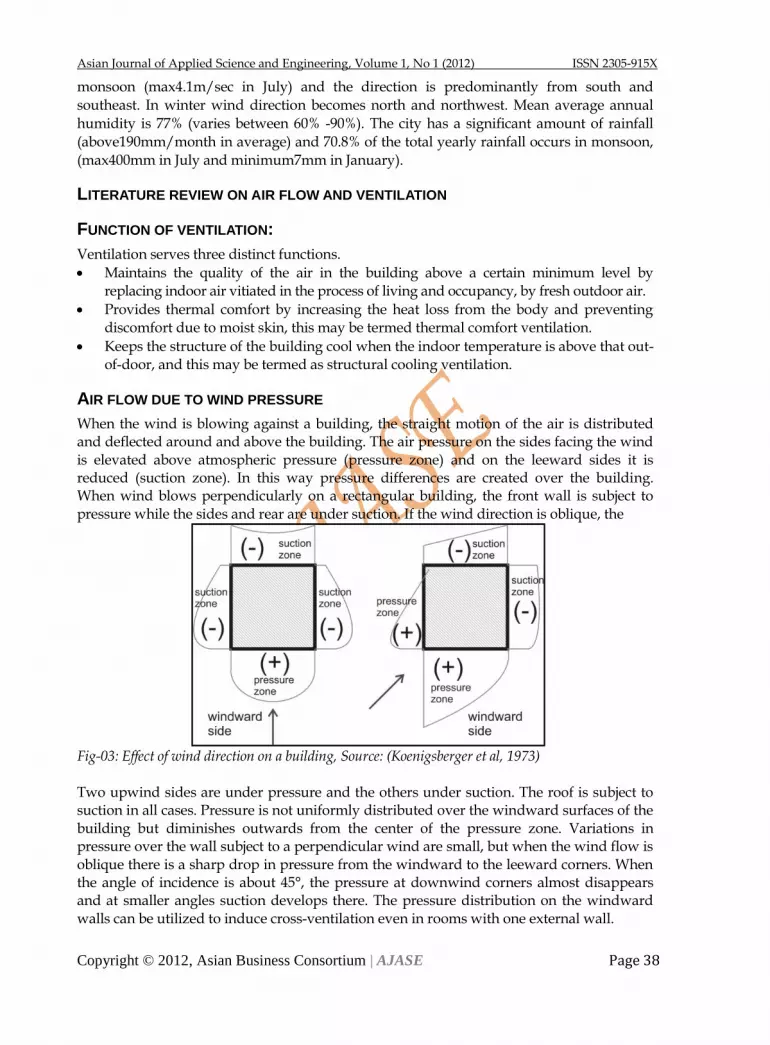
Asian Journal of Applied Science and Engineering, Volume 1, No 1 (2012) ISSN 2305-915X
Copyright © 2012, Asian Business Consortium | AJASE Page 38
monsoon (max4.1m/sec in July) and the direction is predominantly from south and
southeast. In winter wind direction becomes north and northwest. Mean average annual
humidity is 77% (varies between 60% -90%). The city has a significant amount of rainfall
(above190mm/month in average) and 70.8% of the total yearly rainfall occurs in monsoon,
(max400mm in July and minimum7mm in January).
LITERATURE REVIEW ON AIR FLOW AND VENTILATION
FUNCTION OF VENTILATION:
Ventilation serves three distinct functions.
Maintains the quality of the air in the building above a certain minimum level by replacing indoor air vitiated in the process of living and occupancy, by fresh outdoor air.
Provides thermal comfort by increasing the heat loss from the body and preventing discomfort due to moist skin, this may be termed thermal comfort ventilation.
Keeps the structure of the building cool when the indoor temperature is above that out-of-door, and this may be termed as structural cooling ventilation.
AIR FLOW DUE TO WIND PRESSURE
When the wind is blowing against a building, the straight motion of the air is distributed and deflected around and above the building. The air pressure on the sides facing the wind is elevated above atmospheric pressure (pressure zone) and on the leeward sides it is reduced (suction zone). In this way pressure differences are created over the building. When wind blows perpendicularly on a rectangular building, the front wall is subject to pressure while the sides and rear are under suction. If the wind direction is oblique, the
Fig-03: Effect of wind direction on a building, Source: (Koenigsberger et al, 1973)
Two upwind sides are under pressure and the others under suction. The roof is subject to suction in all cases. Pressure is not uniformly distributed over the windward surfaces of the building but diminishes outwards from the center of the pressure zone. Variations in pressure over the wall subject to a perpendicular wind are small, but when the wind flow is oblique there is a sharp drop in pressure from the windward to the leeward corners. When the angle of incidence is about 45°, the pressure at downwind corners almost disappears and at smaller angles suction develops there. The pressure distribution on the windward walls can be utilized to induce cross-ventilation even in rooms with one external wall.
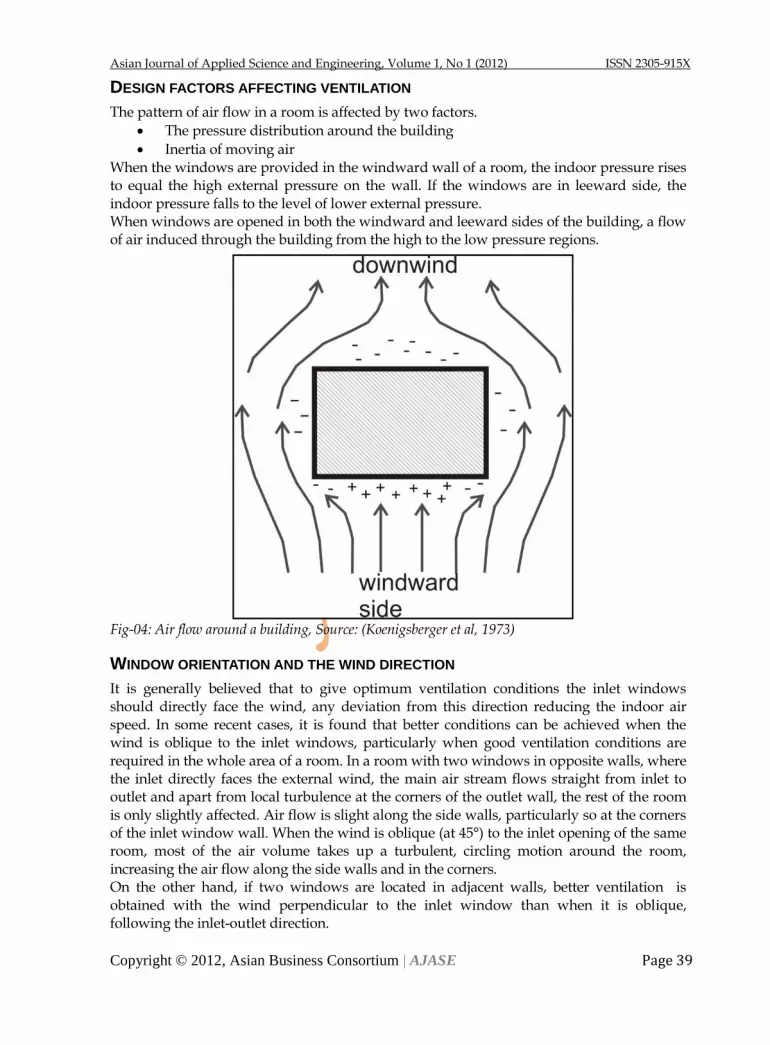
Asian Journal of Applied Science and Engineering, Volume 1, No 1 (2012) ISSN 2305-915X
Copyright © 2012, Asian Business Consortium | AJASE Page 39
DESIGN FACTORS AFFECTING VENTILATION
The pattern of air flow in a room is affected by two factors.
The pressure distribution around the building
Inertia of moving air When the windows are provided in the windward wall of a room, the indoor pressure rises to equal the high external pressure on the wall. If the windows are in leeward side, the indoor pressure falls to the level of lower external pressure. When windows are opened in both the windward and leeward sides of the building, a flow of air induced through the building from the high to the low pressure regions.
Fig-04: Air flow around a building, Source: (Koenigsberger et al, 1973)
WINDOW ORIENTATION AND THE WIND DIRECTION
It is generally believed that to give optimum ventilation conditions the inlet windows should directly face the wind, any deviation from this direction reducing the indoor air speed. In some recent cases, it is found that better conditions can be achieved when the wind is oblique to the inlet windows, particularly when good ventilation conditions are required in the whole area of a room. In a room with two windows in opposite walls, where the inlet directly faces the external wind, the main air stream flows straight from inlet to outlet and apart from local turbulence at the corners of the outlet wall, the rest of the room is only slightly affected. Air flow is slight along the side walls, particularly so at the corners of the inlet window wall. When the wind is oblique (at 45°) to the inlet opening of the same room, most of the air volume takes up a turbulent, circling motion around the room, increasing the air flow along the side walls and in the corners. On the other hand, if two windows are located in adjacent walls, better ventilation is obtained with the wind perpendicular to the inlet window than when it is oblique, following the inlet-outlet direction.

Asian Journal of Applied Science and Engineering, Volume 1, No 1 (2012) ISSN 2305-915X
Copyright © 2012, Asian Business Consortium | AJASE Page 40
CASE STUDY: STUDY OF AN EAST-WEST ELONGATED SOUTH FACING RESIDENTIAL
BUILDING
The study building is situated in Malibagh, one of the densely populated areas of Dhaka city. It is a government colony for Rajuk officers. As like as the other government colony in Dhaka city, this building is also east-west elongated and this is an important reason for choosing this case for the study. This building is constructed on 1962-1964 and the area of per floor is around 3000 square feet. 3rd floor is selected for the study of wind flow to get optimum result. At present here lives a family having 10 permanent members.
Fig-05: existing condition of the study area, Source: Author
Fig-06: Existing plan of the building, Source: Author
At present there is an open space in front of the building (at south). At north there is two
no‘s seven storied buildings. There is 25‘ wide road at east and a 4 storied building at west.
The building has enough chance to get plenty of southern wind and day light at south.
Initially the building was 3 storied; the 3rd floor was an additional floor. The building has
load bearing brick wall structure and concrete slabs.

Asian Journal of Applied Science and Engineering, Volume 1, No 1 (2012) ISSN 2305-915X
Copyright © 2012, Asian Business Consortium | AJASE Page 41
ANALYSIS OF AIR MOTION DUE TO WIND PRESSURE
Fig-07: Air flow in the indoor spaces, Source: Author The study is based on the effect of wind flow through the southern windows and finding the real scenario of the spaces having southern exposure. For the research, the south facing spaces are divided into four areas, they are: study area 01, study area 02, study area 03 and study area 04. Detail field survey to find responses of the users of the residence has been done and the wind pattern that has found shown in fig: 07.
SUMMARY OF AIR FLOW AND VENTILATION CONDITION
Chart-01: Occupants responses about ventilation and thermal comfort in different study area
Study area Ventilation
condition
Thermal
condition
User
satisfaction
Study area 01 M VG VG E – excellent
VG – Very good
M – Moderate
NG – Not good
VB – Very Bad
Study area 02 E E E
Study area 03 E VG VG
Study area 04 NG M NG
From the above chart, it is found that good thermal and ventilation condition is found at study area 02 and 03, that means the middle spaces of the total elevation getting the good situation but the spaces having windows at the end points are getting worse situation than the others. At study area 01 there is little chance of having cross ventilation because the 2nd window at west of the room remain closed for privacy concern. As the east and west are blocked, thermal comfort is good at study area 01. At study area 02 there is enough cross ventilation and also thermal comfort. So the user satisfaction is highest here. At study area 03 there is enough cross ventilation but thermal comfort hampers at afternoon due to

Asian Journal of Applied Science and Engineering, Volume 1, No 1 (2012) ISSN 2305-915X
Copyright © 2012, Asian Business Consortium | AJASE Page 42
having window at west. This space has a large opening at south so it gets enough wind flow almost all day around. The worse situation is arriving at study area 04. Though it has a great chance for cross ventilation because of having window at corner position (at south and east), which is the best position for internal cross ventilation, is suffering much. There is not enough wind flow. Thermal comfort is also not so good because the room get heated at morning because of having an opening at east. As there is less wind cross-flow, the heat does not come out from the room and gets trapped and resulting warmer summer nights.
Fig-08: Indoor spaces of study areas, Source: Author
FINDINGS ON THE BASIS OF LITERATURE REVIEW AND CASE STUDY

Asian Journal of Applied Science and Engineering, Volume 1, No 1 (2012) ISSN 2305-915X
Copyright © 2012, Asian Business Consortium | AJASE Page 43
Fig-09: Positive and negative wind pressure zone around the study building, Source: Author The reason of having less ventilation of the study area 01 and 04 can be explained by the theory of wind pressure zone and wind suction zone. The both spaces are in negative wind pressure zone and the openings are in wind shadow and getting less wind flow, as it has been found in the literature review. Therefore it is found that all the south facing windows do not get positive wind pressure and good ventilation properties in indoor area unless it is positioned in positive wind pressure zone.
CONCLUSIVE REMARKS
From the case study in this research, the building seemed to be well ventilated but from a detail field survey and study on the occupants it is found that the entire south facing spaces is not getting the blessing of natural wind at a same rate just because of placement of windows and building orientation. The positioning of an opening at south is not the only solution for good ventilation of an interior space, Even when the window is oblique (at 45°) to the inlet opening of the same room (study area 04), ventilation condition may be not good. The position of the room along with openings is very important for comfort situation. Architects or designers should keep it in mind while designing a building to provide special kind of design solution for the openings placed at negative wind pressure zone. Environment friendly design solution is the basic need at present world. For designing a sustainable building, proper ventilation and natural lighting gets the first priority. Therefore, to design a well ventilated residence, each and every factors affecting ventilation should get equal importance to consider.
REFERENCES
Linda G. and Wang D. (2002), Architectural Research Methods. Ahmed, Zebun Nasreen (1994), Assessment of Residential Sites in Dhaka with respect to
Solar Radiation Gains; thesis submitted for Doctor of Philosophy; B. Givoni (1969), Man, Climate and Architecture Koenigsberber O. H. (1973), Manual of Tropical housing and Building Markus T. A., Morris E. N., Buildings, Climate and Energy
Important!!!
If the responses and the revised manuscript are not
submitted by the deadline, submission is deemed to have
been abandoned. The rejection of the manuscript will be
conveyed to the Authors. AJASE

Asian Journal of Applied Science and Engineering, Volume 1, No 1 (2012) ISSN 2305-915X
Copyright © 2012, Asian Business Consortium | AJASE Page 44
Impact of Environmental Education
Technology in Secondary Educational
Institutions: A Study in Chittagong City Area
Md. Rahimullah Miah1 & Mir Abu Saleh Shamsuddin
2
1Lecturer in MIS, Leading University, Sylhet, Bangladesh 2Lecturer in Education, Govt. Teachers Training College, Chittagong, Bangladesh
ABSTRACT
An exploitative field study to determine the environmental education technology among teachers and learners in secondary levels among the government, autonomous and private educational institutions in Chittagong urban area of Bangladesh was conducted in 40 schools. The study details the standards established, the results measured, and the successes achieved since the new direction passages mentioning the current status of environmental education technology in the mentioned schools to look as an overview study in regional issue with pragmatic reasons. Uniqueness of environmental education‘s technology was identified based on relevant tools to enhance teachers and learners on their teaching-learning with exploring and understanding the world around them through literature review, observations and interviews with teachers and relevant bodies. The 40% schools were out of frequent technology which is maximum percentage while 2.5% schools were used laptop- minimally percentages. The 51% of respondents showed interest and attention in class when teachers incorporated environmental education technology into their lessons. Overall, it was concluded that environmental education in the urban schools needs some enhancement to the training curricula with technological arena. The study focused the concept and overview about the environmental education and gave steps required for augmentation with techniques and tactics of these effective institutions. Finally, we focus future research trajectories of the co-managed approaches and recommendations for how to further develop the demanding environmental education technology among biologists, engineers and other relevant professionals. Keywords: Environmental Education, Technology, Learners and Professionals.
1. INTRODUCTION
Education is the modern technological arena for present and upcoming generations which ties within propinquity among teachers, learners and motivated people. They are accustomed to incorporate environmental concerns. Consciousness of environmental concerns has grown tremendously over the last decade as modern science and a more
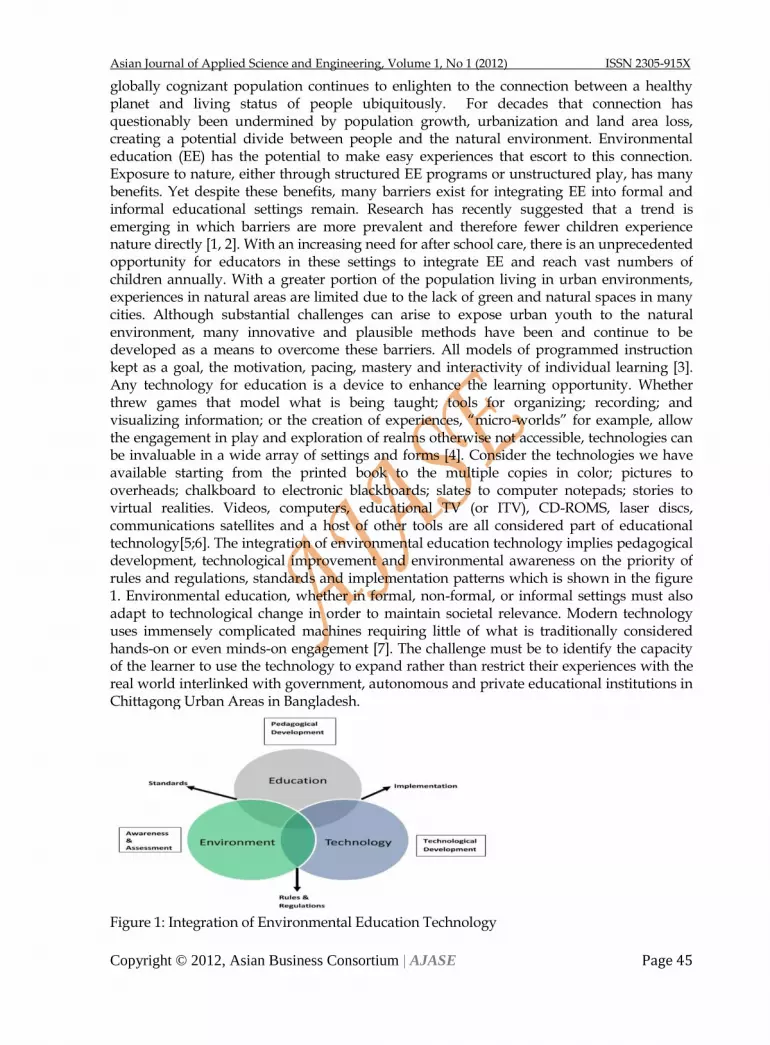
Asian Journal of Applied Science and Engineering, Volume 1, No 1 (2012) ISSN 2305-915X
Copyright © 2012, Asian Business Consortium | AJASE Page 45
globally cognizant population continues to enlighten to the connection between a healthy planet and living status of people ubiquitously. For decades that connection has questionably been undermined by population growth, urbanization and land area loss, creating a potential divide between people and the natural environment. Environmental education (EE) has the potential to make easy experiences that escort to this connection. Exposure to nature, either through structured EE programs or unstructured play, has many benefits. Yet despite these benefits, many barriers exist for integrating EE into formal and informal educational settings remain. Research has recently suggested that a trend is emerging in which barriers are more prevalent and therefore fewer children experience nature directly [1, 2]. With an increasing need for after school care, there is an unprecedented opportunity for educators in these settings to integrate EE and reach vast numbers of children annually. With a greater portion of the population living in urban environments, experiences in natural areas are limited due to the lack of green and natural spaces in many cities. Although substantial challenges can arise to expose urban youth to the natural environment, many innovative and plausible methods have been and continue to be developed as a means to overcome these barriers. All models of programmed instruction kept as a goal, the motivation, pacing, mastery and interactivity of individual learning [3]. Any technology for education is a device to enhance the learning opportunity. Whether threw games that model what is being taught; tools for organizing; recording; and visualizing information; or the creation of experiences, ―micro-worlds‖ for example, allow the engagement in play and exploration of realms otherwise not accessible, technologies can be invaluable in a wide array of settings and forms [4]. Consider the technologies we have available starting from the printed book to the multiple copies in color; pictures to overheads; chalkboard to electronic blackboards; slates to computer notepads; stories to virtual realities. Videos, computers, educational TV (or ITV), CD-ROMS, laser discs, communications satellites and a host of other tools are all considered part of educational technology[5;6]. The integration of environmental education technology implies pedagogical development, technological improvement and environmental awareness on the priority of rules and regulations, standards and implementation patterns which is shown in the figure 1. Environmental education, whether in formal, non-formal, or informal settings must also adapt to technological change in order to maintain societal relevance. Modern technology uses immensely complicated machines requiring little of what is traditionally considered hands-on or even minds-on engagement [7]. The challenge must be to identify the capacity of the learner to use the technology to expand rather than restrict their experiences with the real world interlinked with government, autonomous and private educational institutions in Chittagong Urban Areas in Bangladesh.
Figure 1: Integration of Environmental Education Technology
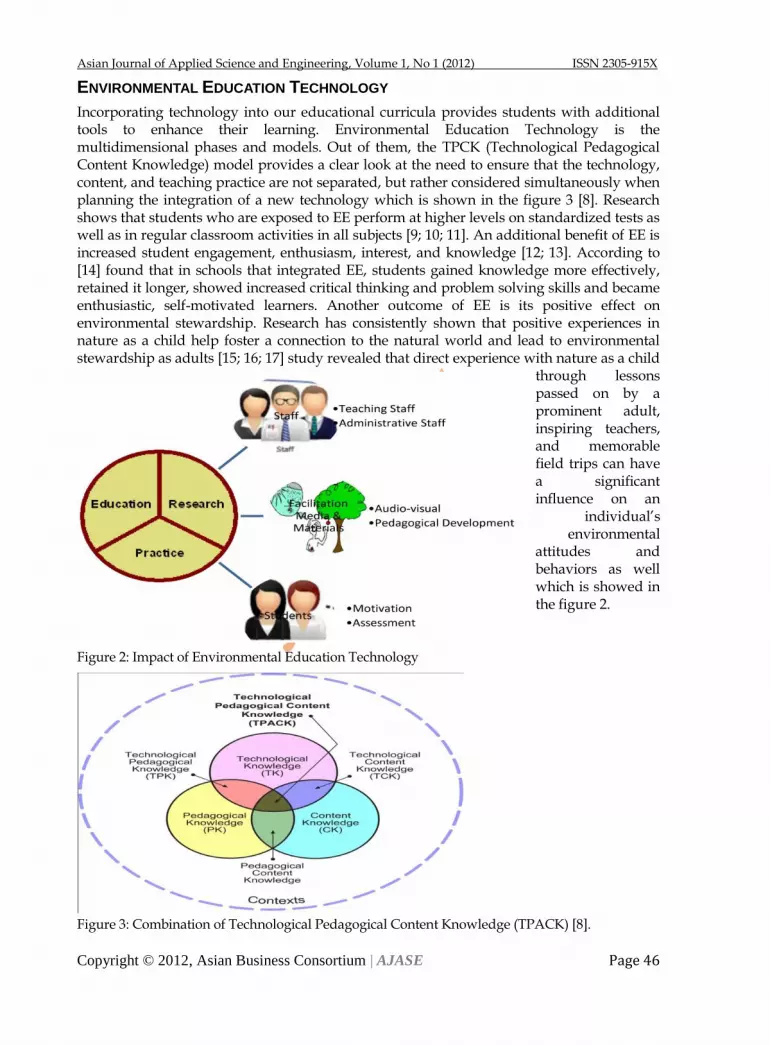
Asian Journal of Applied Science and Engineering, Volume 1, No 1 (2012) ISSN 2305-915X
Copyright © 2012, Asian Business Consortium | AJASE Page 46
ENVIRONMENTAL EDUCATION TECHNOLOGY
Incorporating technology into our educational curricula provides students with additional tools to enhance their learning. Environmental Education Technology is the multidimensional phases and models. Out of them, the TPCK (Technological Pedagogical Content Knowledge) model provides a clear look at the need to ensure that the technology, content, and teaching practice are not separated, but rather considered simultaneously when planning the integration of a new technology which is shown in the figure 3 [8]. Research shows that students who are exposed to EE perform at higher levels on standardized tests as well as in regular classroom activities in all subjects [9; 10; 11]. An additional benefit of EE is increased student engagement, enthusiasm, interest, and knowledge [12; 13]. According to [14] found that in schools that integrated EE, students gained knowledge more effectively, retained it longer, showed increased critical thinking and problem solving skills and became enthusiastic, self-motivated learners. Another outcome of EE is its positive effect on environmental stewardship. Research has consistently shown that positive experiences in nature as a child help foster a connection to the natural world and lead to environmental stewardship as adults [15; 16; 17] study revealed that direct experience with nature as a child
through lessons passed on by a prominent adult, inspiring teachers, and memorable field trips can have a significant influence on an
individual‘s environmental
attitudes and behaviors as well which is showed in the figure 2.
Figure 2: Impact of Environmental Education Technology
Figure 3: Combination of Technological Pedagogical Content Knowledge (TPACK) [8].

Asian Journal of Applied Science and Engineering, Volume 1, No 1 (2012) ISSN 2305-915X
Copyright © 2012, Asian Business Consortium | AJASE Page 47
METHODS OF THE STUDY
In this study mainly social science and historical methodology has been pursued. Moreover systematically aspects of natural environment with distinguished features of its makeup, curriculum shall be analyzed and reviewed. In respect of resource materials of research in this paper mainly measured the references in the personnel and demo-official proceedings, published reports, newspapers, magazine, bulletin, souvenir, journals and various relevant institutions‘ reports to be related in environmental education technology. Secondly, some of the helpful literatures related to environmental education technology in Chittagong Metropolitan areas written by well-known researchers have been taken to compare, cross and justify against the objectives. The above mentioned source-materials have been collected in governmental, non-governmental and different libraries etc in Bangladesh. We have also utilized modern technologies like internet, websites, email, mobile & telephone, Skype, conferencing and relevant network etc. to collect facts and information about our research field which was help us to reach a further more accurate decisions and opinions. Feedback meeting carried out in order to share the research findings with the respondents and staffs to get their feedback suggestions and comments of environmental education technology during the organized interview through questionnaires.
RESULTS AND DISCUSSION
Assessment of Environmental Education in the Classroom As a result, Environmental Concepts in the Classroom for Teachers introduces six principles for integrating environmental education into the classroom setting in the Table 1. Principles for Integrating Environmental Concepts in the Classroom
Sl. no. Principles for Integrating Environmental Concepts
1. Direct experience is the basis of learning
2. Responsible action is integral to, and a consequence of, environmental education
3. Life on Earth depends on, and is part of, complex systems
4. Human decisions and actions have environmental consequences
5. Environmental awareness enables students to develop an aesthetic appreciation of the environment.
6. The study of the environment enables students to develop an environmental ethic.
Table 1: The six concepts that the Environmental Concepts in the Classroom documents seen as the basis of environmental education.
The suggested guidelines are followed with modern technology accordingly (i) Integration of traditional subjects or multidisciplinary approaches, (ii) Presentation of a range of perspectives,(iii) Currency, (iv) Multicultural perspectives, (v) The place of action specially national park, (vi) Both local and global perspectives, (vii) Hopefulness, (viii) Humility where the 44% respondents are shown for strongly agree for the use of EE technology. On the other hand, agree 38%, neutral 13%, disagree 4% and strongly disagree only 1% respondents of the use of environmental education technology in the studied classrooms which is shown in the figure 4.
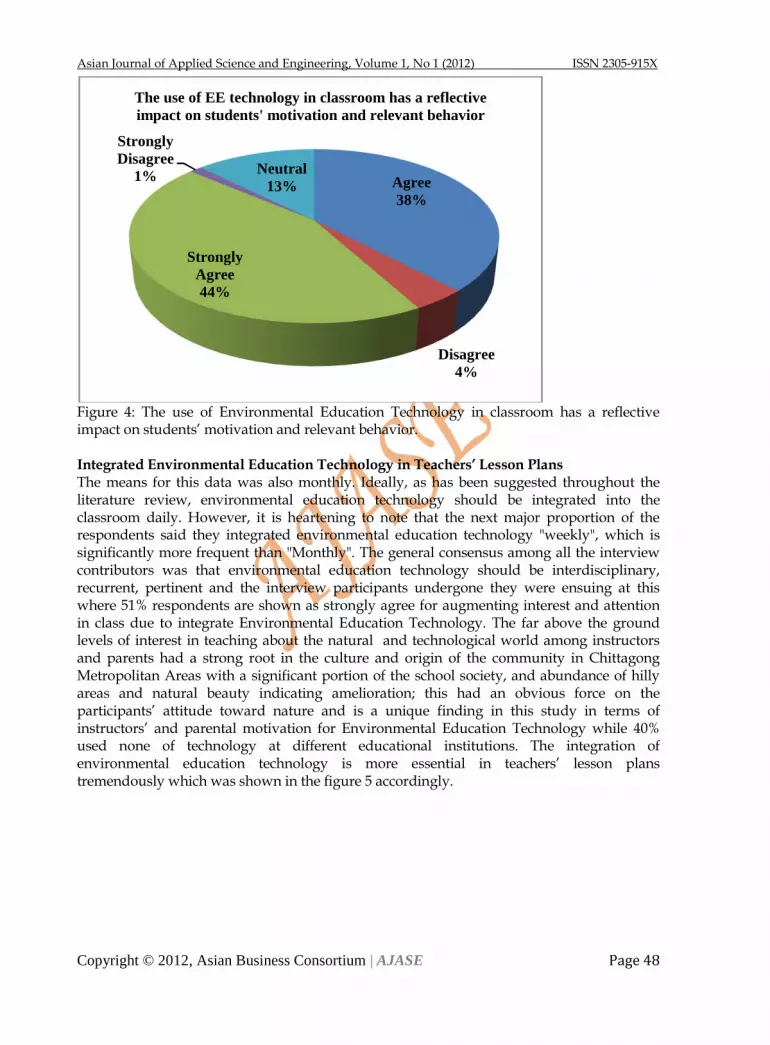
Asian Journal of Applied Science and Engineering, Volume 1, No 1 (2012) ISSN 2305-915X
Copyright © 2012, Asian Business Consortium | AJASE Page 48
Figure 4: The use of Environmental Education Technology in classroom has a reflective impact on students‘ motivation and relevant behavior. Integrated Environmental Education Technology in Teachers’ Lesson Plans The means for this data was also monthly. Ideally, as has been suggested throughout the literature review, environmental education technology should be integrated into the classroom daily. However, it is heartening to note that the next major proportion of the respondents said they integrated environmental education technology "weekly", which is significantly more frequent than "Monthly". The general consensus among all the interview contributors was that environmental education technology should be interdisciplinary, recurrent, pertinent and the interview participants undergone they were ensuing at this where 51% respondents are shown as strongly agree for augmenting interest and attention in class due to integrate Environmental Education Technology. The far above the ground levels of interest in teaching about the natural and technological world among instructors and parents had a strong root in the culture and origin of the community in Chittagong Metropolitan Areas with a significant portion of the school society, and abundance of hilly areas and natural beauty indicating amelioration; this had an obvious force on the participants‘ attitude toward nature and is a unique finding in this study in terms of instructors‘ and parental motivation for Environmental Education Technology while 40% used none of technology at different educational institutions. The integration of environmental education technology is more essential in teachers‘ lesson plans tremendously which was shown in the figure 5 accordingly.
Agree
38%
Disagree
4%
Strongly
Agree
44%
Strongly
Disagree
1%Neutral
13%
The use of EE technology in classroom has a reflective
impact on students' motivation and relevant behavior
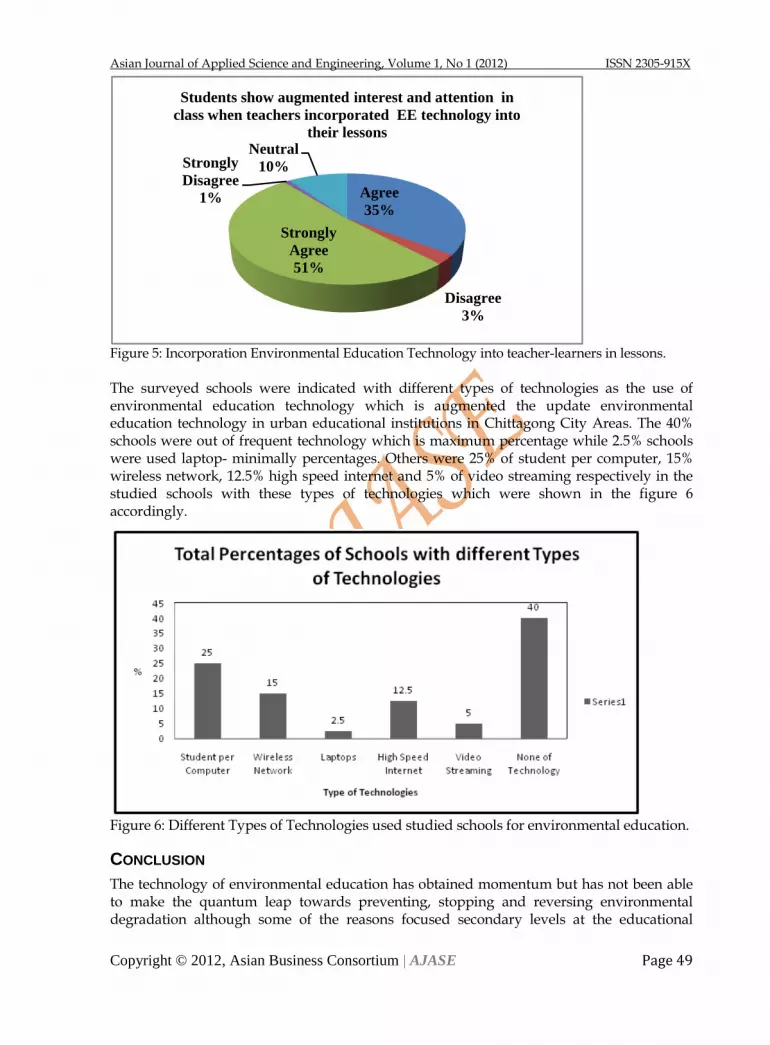
Asian Journal of Applied Science and Engineering, Volume 1, No 1 (2012) ISSN 2305-915X
Copyright © 2012, Asian Business Consortium | AJASE Page 49
Figure 5: Incorporation Environmental Education Technology into teacher-learners in lessons.
The surveyed schools were indicated with different types of technologies as the use of environmental education technology which is augmented the update environmental education technology in urban educational institutions in Chittagong City Areas. The 40% schools were out of frequent technology which is maximum percentage while 2.5% schools were used laptop- minimally percentages. Others were 25% of student per computer, 15% wireless network, 12.5% high speed internet and 5% of video streaming respectively in the studied schools with these types of technologies which were shown in the figure 6 accordingly.
Figure 6: Different Types of Technologies used studied schools for environmental education.
CONCLUSION
The technology of environmental education has obtained momentum but has not been able to make the quantum leap towards preventing, stopping and reversing environmental degradation although some of the reasons focused secondary levels at the educational
Agree
35%
Disagree
3%
Strongly
Agree
51%
Strongly
Disagree
1%
Neutral
10%
Students show augmented interest and attention in
class when teachers incorporated EE technology into
their lessons

Asian Journal of Applied Science and Engineering, Volume 1, No 1 (2012) ISSN 2305-915X
Copyright © 2012, Asian Business Consortium | AJASE Page 50
institutions in Chittagong City Areas (CCA). This study showed that although impact of environmental education is included in CCA curricula and classrooms, it is not necessarily taught frequently or effectively except modern technology viz. computer, laptop and internet including field trip and video streaming. For environmental topics at secondary level schools are only included in the science and social studies mentioning slightly others relevant courses. Teachers who are inexperienced in environmental education lack guidance and could most benefit from the existing policy with new technological arena. Teachers identified a number of obstacles to environmental education in CCA including insufficient teacher training, scarce teaching resources, inadequate funding and lack of time. Based on the information we have gathered, we would like to put forth some suggestions for the improvement of environmental education technology in CCA schools. We are paying attention future research trajectories of the co-managed approaches and recommendations to the government and existing institutions for how to further develop the demanding environmental education technology among biologists, engineers and other relevant professionals which is affected to the society positively.
REFERENCES
[1] Clements, R. (2004). An investigation of the status of outdoor play. Contemporary Issues
of Early Childhood, 5(1), 46-50.
[2] Singer, D., Singer, J., D'Agostino, H., & DeLong, R. (2009). Children's pastimes and play
in sixteen nations. American Journal of Play 1(3), 283-312.
[3] Bork, A.D., and A. Poly (1992) ‚Application on effects on learning.‛ (Pp 119-172). In J.
Hebenstreit, B. Levrat, A. Bork, D. Walker, A. Poly, F. Seye-Sylla, S.Q. Fakhro, M.
Lally, N. Hall, D. Batanov, P. Gorny, R. Lewis, M. Murray-Lasso, and R. Gwyn
(1992). Education and informatics worldwide: The state of the art and beyond. London:
Jessica Kingsley Publishers.
[4] Goldenberg, E.P., Russell, S. J., and Carter, C. J. (1984). Computers Education and
Special Needs. Reading, Massachusetts: Addison-Wesley Publishing Company.
[5] Baldwin, L. V. & S. Dawes (1991). Educational Technology in Engineering. Washington,
D.C.: National Academy Press.
[6] Veen, W. (1995) Factors affecting the Use of computers in the Classroom: Four case
Studies In Watson, D. & D.
[7] Huxley, A. (1972). Achieving a Perspective on the Technological Order In M. Kranzberg
and W. H. Davenport (eds.). Technology and Culture: An Anthology. New York:
Schoken Books.
[8] The Way of the Future (2012): Embedding Technology in 21st Century Schools. URL:
http://tpack.org/
[9] Ernst, J. (2007). Factors associated with K-12 teachers' use of environment-based
education. Journal of Environmental Education, 38(3), 15-32.
[10] Glenn, J. L. (2000). Environment-based education: Creating high performance schools and
students. Washington, DC: NEETF.
[11] Lieberman, G., & Hoody, L. (1998). Closing the achievement gap: Using the environment
as an integrating context for learning. San Diego, CA: State Education and
Environmental Roundtable

Asian Journal of Applied Science and Engineering, Volume 1, No 1 (2012) ISSN 2305-915X
Copyright © 2012, Asian Business Consortium | AJASE Page 51
[12] Christenson, M. A. (2004). Teaching multiple perspectives on environmental issues in
elementary classrooms: A story of teacher inquiry. The Journal of Environmental
Education, 35(4), 3-16.
[13] Dresner, M. (2002). Teachers in the woods: Monitoring forest biodiversity. The Journal
of Environmental Education, 34(1), 26-31.
[14] Lieberman, G.A., and L.L. Hoody. 1998. Closing the Achievement Gap: Using the
Environment as an Integrating Context for Learning. State Education and
Environment Roundtable. Poway, CA
[15] Chawla, L. (1999). Life paths into effective environmental action. The Journal of
Environmental Education, 31(1), 15-26.
[16] Palmer, J. (1993). Development of concern for the environment and formative
experiences of educators. The Journal of Environmental Education, 24(3), 26-30.
[17] Palmer, J., Suggate, J., Bajd, B., & Tsaliki, E. (1998). Significant influences on the
development of adults’ environmental awareness in the UK, Slovenia, and
Greece. Environmental Education Research, 4(4), 429-444.
UPCOMING
ABC JOURNAL OF SCIENTIFIC RESEARCH Aim and Scope ABC Journal of Scientific Research is a blind peer-reviewed international research journal which deals with applied as well as theoretical issues. The authors welcome papers in all the major issues including:
Research Article Statistics Review Article Applied Business Studies Scientific Commentaries Medical Studies Computer Science Social Sciences Technological Science Natural Sciences Engineering Agricultural Sciences Biology Zoology Chemistry Geology Physics Short Communication Mathematics All other Applied and Theoretical Scientific Research
Contact Information Paper submissions should be electronically in MS-Word form on the following email address [email protected]. Www.Abcjournals.Weebly.Com

Asian Journal of Applied Science and Engineering, Volume 1, No 1 (2012) ISSN 2305-915X
Copyright © 2012, Asian Business Consortium | AJASE Page 52
E-Commerce of undergraduate’s perspective:
The conceptual framework
Mohd. Nizam Bin A. Baharuddin1, Dr Lawrence Arokiasamy
2,
Dr Huam Hon Tat3, Rani Ann Balaraman
4
1PhD Research Fellow, Department of Accounting, Universiti Tunku Abdul Rahman (UTAR), Malaysia 2Assistant Professor, Department of Business and Management, Quest International University Perak
(QIUP), Malaysia 3Department of Business and Management, Quest International University Perak (QIUP), Malaysia 4PhD Research Fellow, School of Communication, University Science Malaysia (USM), Malaysia
ABSTRACT
This study was undertaken following the Online shopping behaviour is turning inevitably in this modern life due to the increase of globalization. Online shopping behavior is influence by perceived usefulness (PU), perceived ease of use (PE), trust (TS) and perceived enjoyment (PJ) which is adopted from Technology Acceptance Model (TAM). In a nutshell, the findings in this study concur with that of Davis (1986) that technology acceptance will bring effect on consumer‘s intend to purchase via internet. Keywords: Online shopping behavior, undergraduate and institutions of higher learning.
INTRODUCTION
Electronic commerce also known as (e-commerce) is turning inevitably in this modern life due to the increase of globalization. Thus, the trend of online retail is more popular and widely used by many businessmen. According to Global Consumer Report (2010), reported by Nielsen Company on the trend of online shopping showed that more than two thirds of the world‘s online users have made online shopping to purchase products and their needs. In 2010, Malaysians spent RM1.8 billion on online shopping and this figure is expected to increase dramatically in 3 years‘ time (Nielsen, 2010). In fact, eBay is one of the famous online auction and shopping website in the world stated that the Gross Merchandise Sales (GMS) in year 2003 estimated total $24 billion of items sold which have increase 60% compare to year 2002 which reported $15 billion of items sold (Steiner, 2004). In year 2008, eBay marketplace contain 78 million transactions which involving 82.5% of buyers and 5.76% of sellers among 14.5 million users (Shen&Sundaresan, 2011). With this trend university students have become the most important online consumer group and main users of internet. According toXu and Paulins (2005) have reported that 90% of the university students have access to the internet in every day. Furthermore, university students have huge potential consumption via Internet and more economic autonomy compared to other groups of consumers (Hu, Sun, Zhang, Zhang, Luo, & Huang, 2009). Therefore, automatically the online retailers have targeted university students as a group of
Asian Journal of Applied Science and Engineering, Volume 1, No 1 (2012) ISSN 2305-915X
Copyright © 2012, Asian Business Consortium | AJASE Page 53
their customer. The online retailers must fully understand the behavior of university students from public and private universities towards the online shopping. Although there are many researchers studied the online shopping behaviour, most of the past studies carried out in developed countries, such as Australia (Cass &Fenech, 2003), United States (Taylor &Strutton, 2010), South Korea (Kim, Kim, & Shin, 2009) and China (Dai &Zheng, 2010). Studies on e-shopping behaviour in Malaysia are limited.Kwek, Lau, and Tan (2010) conducted a research on the effects of shopping orientations, online trust and prior online purchase experience toward customers‘ online purchase intention. Besides, study on online shopping behavior done by Osman et al. (2010) was only focused on the undergraduates from public university. There is no study done on the comparison of differences online shopping behavior between undergraduates from public and private universities in Malaysia. The problem of the research is whether there is a difference in online shopping behavior between public and private universities in Malaysia.
ONLINE SHOPPING BEHAVIOUR
After reviewed numerous past studies relating to the online shopping behavior/intention, most of the researcher applied Technology Acceptance Model (TAM) in their research. The Technology Acceptance Model (TAM) was first introduced by Davis (1986). This model was expanded from classic Theory of Reasoned Action (TRA) (Fishbein&Ajzen, 1975). It consists of 2 factors: perceive ease of use and perceive usefulness which replaced the factors introduced in the TRA. Perceived usefulness refers to the degree of a user who believes that using the system will enhance his or her performance; while perceived ease of use refers to the degree of the user believes that using the system will be free from effort (Davis, 1989). Both of the factors are specific perceptions and are anchored to specific beliefs users hold about the system (Dillon & Morris, 1996). TAM describes how the user behaviour come to accept and used a technology. This theory is one of the most widely used and influential models in the field of information systems, technology and services. It has been fully validated to be powerful as a framework to predict user acceptance of new technology (Li, 2009). TAM has been applied in many past studies to study on the website quality and consumer online purchasing intention of air ticket (Fazli&Tahir, 2009), University Student Behavioral Intention Model of Online Shopping (Hu et al., 2009), Consumer e-shopping acceptance: Antecedents in a technology acceptance model (Ha &Stoel, 2009), Perceived Usefulness, Perceived Ease of Use, and User Acceptance of information Technology (Davis, 1989), The Role of Trust in Customer Online Shopping Behavior: Perspective of Technology Acceptance Model (Chi & Tang, 2005), Extending the technology acceptance model for adoption of E-shopping by consumers in Turkey (Celik&Yilmaz, 2011), and Modeling roles of subjective norms and eTrust in customers‘ acceptance of airline B2C eCommercewebsities (Kim, Kim, & Shin, 2009). This model focuses on intention of using information technology and demonstrates how these acceptance will bring effect on consumer‘s intend to purchase via internet. Therefore, technology acceptance model is applied in this research to give an explanation on public and private university students‘ behaviour of online shopping.
PERCEIVED USEFULNESS AND PERCEIVED EASE OF USE
According to Hu et al. (2009), perceived usefulness is used to examine the online shopping behavior in the study and it has positive relationship to the attitude to buy online. Besides
Asian Journal of Applied Science and Engineering, Volume 1, No 1 (2012) ISSN 2305-915X
Copyright © 2012, Asian Business Consortium | AJASE Page 54
that, Celik et al. (2011) revealed that perceived usefulness has significant relationship towards attitude of online shopping for consumers in Turkey by obtaining data from the 606 internet users in Turkey through online survey. Kim et al. (2009) indicated that the perceived usefulness, perceived ease of use and eTrust have significant relationship to the attitude toward use and intention to reuse. A study of investigate online shopping behavior done by Liao & Hsieh (2010) has determined perceived usefulness has a positive relationship towards the attitude of 600 respondents in Taiwan to buy online. The relationship between the perceived ease of use and the online shopping behavior was examined in Ha et al. (2009). The result has indicated that perceived ease of use was significant to the acceptance of customer to buy apparel product online. On the other hand, perceived ease of use is tested in a study whether it has significant relationship towards attitude of online purchasing through online stores, (Chi et al., 2005). The result has indicated that perceived ease of use of consumer to buy online has significant relationship to his or her attitude by using online stores. Hu et al. (2009) revealed that perceived ease of use was positively related to attitude towards using online shopping. The study was done by distributed 208 online questionnaires.
TRUST
Trust is identified as a psychological state that people have the intention to accept vulnerability based on their beliefs that transactions with sellers will meet their confident transactions expectations due to the sellers‘ competence, integrity, benevolence, and predictability (Zhu et al., 2009; Paul, Pavlou, Liang, &Xue, 2007; Gefen, Karahanna, & Straub, 2003; McKnight &Chervany, 2001). Zhu et al. (2009) indicated that the perceived usefulness, perceived ease of use, the perceived risk and trust have significant relationship with the intention to purchase online. However, trust significantly reduced perceived risk in the proposed model of the study. The researcher has found that perceived usefulness, perceived ease of use and trust has positive relationship with the consumer attitudes. Consumer‘s intention to buy air ticket online with low-cost carrier airline service was examined by using website quality: usability, empathy, perceived risk, trust, website design and information quality (Fazli et al., 2009). The result revealed that usability, empathy, perceived risk, trust, website design and information quality have significantly affecting the intention of buying air ticket online. Trust to the system was tested whether it influence the behavior of the people towards web information system (Du et al., 2009). The result described the PEOU and PU had positive effects on the establishment of trust. Therefore, trust has a positive relationship towards the user intention of using the web information system.
PERCEIVED ENJOYMENT
Perceived enjoyment is defined as ‗the extent to which the activity of using the system is to be perceived enjoyable in its own right, apart from any performance consequences that may be anticipated‘ (Davis, Bagozzi, &Warshaw, 1992). Shopping enjoyment was investigated to study the shopping orientations and gender differences on online information searches and purchase behavior (Seock& Bailey, 2008) and they found that shopping enjoyment significantly affecting to respondent‘s online information searches. In m-commerce, enjoyment was tested towards the m-loyalty and the result revealed that it was an important factor in investigation of m-loyalty (Cyr, Head, &Ivanov, 2006). Enjoyment was significantly predicted the intention to buy online (Broekhuizen&Huizingh, 2006).

Asian Journal of Applied Science and Engineering, Volume 1, No 1 (2012) ISSN 2305-915X
Copyright © 2012, Asian Business Consortium | AJASE Page 55
COMPARISON OF ONLINE SHOPPING BEHAVIOR BETWEEN TWO GROUPS
Difference in online shopping behavior was tested by indicate students from two country and different country have different in online shopping behavior (Yang, Lester, & James, 2007; Park & Jun, 2003; Hirst&Ashwin, 2009). According to Yang et al. (2007), they studied on the attitudes toward buying online as predictors of shopping online for British and American university students. The outcome has revealed that British respondents were less favorable attitude towards online shopping while American respondents were more favorable attitude towards online shopping. Park et al. (2003) studied on the difference between Korea and American in term of internet usage, internet innovativeness, perceived risks of internet buying and internet buying behaviors. The result indicated that no significant difference in Korea and American consumers for internet buying intentions or online buying experience. However, it shown that there were significant differences between both country in internet usage and the perceived risks of internet buying. Comparison of online shopping behavior between online shoppers in London and Bangkok was examined and the researcher found that there was significant difference in online shopping behavior between online shoppers in London and Bangkok (Hirst et al., 2009).
CONCEPTUAL MODEL
The research model to examine the public and private university online shopping behavior is depicted in Figure 1. There are two types of variables in this model: Independent variable and Dependent variable. The independent variables will affect the dependent variable. Independent variable consists of four elements which are perceived usefulness, perceived ease of use, trust and perceived enjoyment while dependent variable is online shopping behavior.
Figure 1: Conceptual Framework of online shopping behavior
CONCLUSIONS
This research only concern on four variables, this is consider no sufficient to obtain better understanding on the behavior of the undergraduates in online shopping. The future research is recommended to take more variables into consideration such as perceived risk, consumer satisfaction and consumer preferences which may change over time in relation to

Asian Journal of Applied Science and Engineering, Volume 1, No 1 (2012) ISSN 2305-915X
Copyright © 2012, Asian Business Consortium | AJASE Page 56
changing of economy and trends. Thus, the reliability of information will be boosted and more reliable to current online market demand from time to time. Besides that, the characteristics of respondents such as age, race, gender and level of income may become a main source to contribute the different online shopping behavior. All this factors are not been pointing out on this study, hence future research should more concern all of it. On the other hand, factor such as characteristics of online product may also result the change of online shoppers behavior. For that reason, future researchers may consider this factor which truly reveals the demand of online shoppers on their research. The researchers should consider adding space for comments in the questionnaires design. This improvement increase responses from respondents as it gives an opportunity to voice but not to exercise force choosing in questionnaires. Besides, the statement in each constructs should be consistent by standardize all the constructs with same amount of statement. This enhances the comparability among constructs. For example, it will enhance the result in Pearson Correlation. The researcher is recommended to produce a timeline for the research before the research start. This helps researcher to conduct research according to time and able to produce high quality of work as there will be more idle time for questionnaires distribution. The questionnaires distribution helps researcher to obtain more accurate and reliable data for the research. It is highly recommended that to distribute questionnaires in more geographical area of university to study the online shopping behavior among undergraduates. In conclusion, this study is discussedthe connections between the independent variables (IV) and the dependent variable (DV) whichare perceived usefulness, trust, perceived ease to use, and perceived enjoyment are relating to the online shopping behavior between public and private universities undergraduate students.
REFERENCES
Broekhuizen, T. L. J., &Huizingh, E. K. R. E. (2006). Investigating the effect of consumer
traits on the relative importance of TAM constructs in an e-commerce context,
Proceedings from the ICEB eBRF Conference, 29 November - 1 December 2006,
University of Tampere, Finland
Cass, A. O., &Fenech, T. (2003). Web retailing adoption: exploring the nature of internet
users web retailing behavior. Journal of retailing and consumer services, 10, 81-94.
Celik, H. Y., &Yilmaz, V. (2011).Extending the technology acceptance model for adoption
of E-shopping by consumers in Turkey.Journal of Electronic Commerce Research,
12(2),152-164.
Chi, W. H., & Tang, T. W. (2005). The role of trust in customer online shopping behavior:
perspective of technology acceptance model. Retrieved July 31, 2011, from
http://www.casos.cs.cmu.edu/events/conferences/2005/2005_proceedings/Tang.pdf
Cyr, D., Head, M., &Ivanov, A. (2006). Design aesthetics leading to m-loyalty in mobile
commerce. The International Journal of Information Systems Applications, 43, 950-963.
Dai, Z., &Zheng, X. T. (2010).An empirical study on factors which affect consumers’ online
shopping behavior.International conference on e-business and e-government.
Davis, F. D. (1986). Technology acceptance model for empirically testing new end-user
information systems: Theory and results.Doctoral Dissertation.Massachusetts
Institute of Technology.

Asian Journal of Applied Science and Engineering, Volume 1, No 1 (2012) ISSN 2305-915X
Copyright © 2012, Asian Business Consortium | AJASE Page 57
Davis, F. D. (1989). Perceived usefulness, perceived ease of use, and user acceptance of
information technology.MIS Quarterly, 13(3), 319–39.
Davis, F. D., Bagozzi, R. P., &Warshaw, P.R. (1992).Extrinsic and intrinsic motivation to use
computers in the workplace.Journal of Applied Social Psychology, 22(14), 1111-1132.
Dillon, A., & Morris, M. (1996). User acceptance of information technology: theories and
models. In: M. Williams (ed.), Annual Review of Information Science and Technology,
31, (Medford, NJ: Information Today).
Du, Y. Q., & Chao, J. (2009).An empirical study of end-user trust in a web information
system.International Conference on Information Management, Innovation Management
and Industrial Engineering, 1, 561-564.
Fazli, M., &Tahir, M. N. H. (2009). Website quality and consumer online purchase intention of
air ticket. International Journal of Basic & Applied Sciences IJBAS, 9(10), 20-25.
Fishbein, M., &Ajzen, I. (1975). Belief, Attitude, Intention, and Behavior: An Introduction to
Theory and Research. Reading, MA: Addison-Wesley.
Gefen, D., Karahanna, E., & Straub, D. W. (2003). Trust and TAM in online shopping: An
integrated model. MIS Quarterly, 27(1), 51-90.
Ha, S., &Stoel, L. (2009). Consumer e-shopping acceptance: antecedents in a technology
acceptance model. Journal of Business Research, 62, 565-571.
Hirst, A., &Ashwin, M. (2009). Cross cultural difference between online shoppers in London
and Bangkok. International Review of Business Research Papers, 5(4), 167-191.
Hu, Y., Sun, X., Zhang, J., Zhang, X., Luo, F., & Huang, L. (2009). A university student
behavioral intention model of online shopping based on TAM. International
Conference on Information Management, Innovation Management and Industrial
Engineering, 625-628.
Kim, H. B., Kim, T., Shin, S. W. (2009).Modeling roles of subjective norms and eTrust in
customers’ acceptance of airline B2C eCommerce websites.Tourism management,
30, 266-277.
Kwek, C. L., Lau, T. C., & Tan, H. P. (2010). The Effects of shopping orientations, online
trust and prior online purchase experience toward customers’ online purchase
intention. Journal of International Business Research, 3, 63-76.
Li, C. F. (2009). Extending the Technology Acceptance Modelto investigate the factors affecting the
user satisfaction in internet banking.Unpublished master’s thesis, National Formosa
University. Taiwan.
Liao, P. W., & Hsieh, J. Y. (2010).Using the Technology Acceptance Model to explore online
shopping behavior: Online experiences as a moderator.Management and Service
Science (MASS) International Conference.
McKnight, D. H., &Chervan, N.L. (2001). What trust means in e-commerce customer
relationships: An interdisciplinary conceptual typology. International Journal of
Electronic Commerce, 6(2), 35-59.
Nielsen, A. C. (2010, June). Global consumers attitudes towards online shopping.
Retrieved from July 4, 2010, from
http://hk.nielsen.com/documents/Q12010OnlineShoppingTrendsReport.pdf
Osman, S., Chan, B. Y. F., &Choo, B. H.(2010). Undergraduates and online shopping
behavior.Journal of Asian Social Science, 6, 133-146.
Asian Journal of Applied Science and Engineering, Volume 1, No 1 (2012) ISSN 2305-915X
Copyright © 2012, Asian Business Consortium | AJASE Page 58
Park, C., & Jun, J. K. (2003). A cross-cultural comparison of internet buying behavior:
Effects of internet usage, perceived risks, and innovativeness. International
Marketing Review, 20(5), 534-553.
Paul, A. P., Liang, H., &Xue, H. (2007). Understanding and mitigating uncertainty in
online exchange relationships: A principle-agent perspective. MIS Quarterly, 31(1),
105-136.
Seock, Y. K., & Bailey, L. R. (2008).The influence of college students’ shopping orientations
and gender difference on online information searches and purchase
behaviors.International Journal of Consumer Studies, 32, 113-121.
Shen, Z. &Sundaresan, N. (2011).eBay: An E-commerce Marketplace as a Complex
Network. Journal of Industrial Economics, 12, 655—664.
Steiner, I. (2004, January 22). E-commerce independent news for eBay. Retrieved from July
4, 2010, from http://www.auctionbytes.com/cab/abn/y04/m01/i22/s01
Taylor, D.G., &Strutton, D. (2010). Has e-marketing come to age? Modeling historical
influences on post-adoption era internet consumer behaviors.Journal of business
research, 63, 950-956.
Xu, Y., &Paulins, V. (2005).College students' attitudes toward shopping online for apparel
products: Exploring a rural versus urban campus. Journal of Fashion Marketing and
Management, 9(4), 420 – 433.
Yang, B., Lester, D., & James, S. (2007). Attitudes toward buying online as predictors of
shopping online for British and American respondents.Cyberpsyhology& Behavior,
10(2), 198-203.
Zhu, D. S., O’Neal, G. S., Lee, Z. C., & Chen, Y. H. (2009). The effect of trust and perceived
risk on consumers’ online purchase intention.International Conference on
Computational Science and Engineering, 5, 771-776.
Why Open Access ???
In the traditional publishing model, readers have limited access to scientific papers; authors do not have copyright for their own papers, and cannot post their papers on their own websites, which presents a significant barrier to the sharing of knowledge, as well as being unfair to authors. Open access can overcome the drawbacks of the traditional publishing model and help scholars build on the findings of their colleagues without restriction
Asian Journal of Applied Science and Engineering, Volume 1, No 1 (2012) ISSN 2305-915X
Copyright © 2012, Asian Business Consortium | AJASE Page 59
Long Term Causality of Export Led Growth
(ELG) using VECM model with reference to
India
Dr. Amitabh Joshi
Professor, Department of Applied Mathematics & Dean Academic, Raj Kumar Goel Engineering
College, Ghaziabad, U.P., INDIA
ABSTRACT
The aim of this paper is to study the long term and short term relationship between Export and GDP. Various statistically tests like Johansen Cointegration Test, Vector Error Correction Estimates, Wald test, ARCH Test and Serial Correlation Test have been performed. The data was collected from the website of World Bank for a period of 41 years i.e. 1970 to 2011. It was observed that the data shows cointegration between the variables but long term association was not found. Keywords: GDP, Export, Cointegration, VEC Method, ARCH Test, Serial Correlation, Wald Test.
INTRODUCTION
A country should be concerned about improving the quality of life of its citizens overall,
and this involves macroeconomic development in a highly competitive and globalised
world. Thus, creating wealth and/or increasing Gross Domestic Product (GDP) are of
prime importance for any economy. There are two approaches to achieve this goal. One
possibility is to find new export markets and provide an important engine for development.
This strategy, second possibility is that it should primarily focus on economic growth to
generate international trade? Exports are believed to be crucial in providing the impetus for
economic growth in developing countries. Consequently, the export-led growth (ELG)
strategy has been put forward as an alternative to the inward oriented strategy of
development. In the literature there has been a considerable debate on the ELG and growth-
driven export (GDE) hypotheses to decide the development policies and, of course, their
implications for international trade.
After Independence India had an inward-looking trade and investment policy, which
included import substitution. This allowed the country to be self-sufficient but the costs of
many goods for consumers were high because the industries did not face competition from
abroad and multinational companies (MNCs). In 1990s, India began to follow economic
liberalization approach wherein tariffs and import and export controls were relaxed. This
reduced the costs to import inputs and further reduced the costs of some consumer goods.
Thus the economic reforms resulted into real GDP growth, export growth, productivity
increases, along with increased government borrowing and spending and an ever-

Asian Journal of Applied Science and Engineering, Volume 1, No 1 (2012) ISSN 2305-915X
Copyright © 2012, Asian Business Consortium | AJASE Page 60
expanding fiscal deficit. The paper is divided in three sections: first one is review of
literature, second is research methodology and third section is result and conclusion.
REVIEW OF LITERATURE
Ghosh and Ostry( 1995) has argued that using vector auto-regression analysis current
account in developing countries acts as a buffer to smooth consumption in the face of
shocks and capital mobility may after all be quite high in this group of countries. Jansen, K.
(1995) tried to assess the channels of macroeconomic impact and their intensity and
suggested that export-oriented DFI is likely to have a positive effect on private investment
and growth, but can have adverse balance-of-payments consequences using Thailand as
example.
Kónya and Singh (2006) reviewed close to thirty export-growth time-series studies
published etween 1978 and 2005. Based on various time-series techniques (unit-root and
cointegration tests; singleequation, vector autoregressive (VAR) and vector error-correction
(VEC) models), they focus exclusively either on India or on a group of countries that
includes India. Though the results are sometimes controversial and sensitive to model
specification, four studies found support for a significant positive correlation between
exports and economic growth; eight for the ELG hypothesis; seven for the GDE hypothesis;
and two for two-way causality between exports and growth.
It is Adam Smith who first studies the relationship between international trade and
economic growth. In his view, the development of division is the principal factor to
improve the long-time growth of productivity, and the degree of division is constrained by
the scope of market. Expansion of market will naturally deepen the division and improve
the productivity, and then improve economic growth; The engine theory causes
controversial disputes, many economists suggest that trade growth of developing countries
is correlated to their own economic growth, their export growths are constrained by the
economic growth of developed countries. William. Lewis is the representative personage of
such economists. Irving Kravis (1970) puts forward new viewpoint, which is later accepted
by lots of western economists, that foreign trade is a maid of economic growth rather than
an engine. Classical school, Marxian school and New classical school all suggest that
foreign trade has just indirect impact on accumulation and economic growth, in fact,
foreign trade impacts on them through profit margin. Further, some Latin American
economists have completely negative attitude on engine theory, they suggest that ,in
modern global economy regime, developed capitalism countries are the core which is
regulating the outer consisting of developing countries, the outer countries must comply
with the core countries. This kind of depending relation makes foreign trade the reason of
weakening the economy of the developing countries rather than the reason of improving
the economy of the developing countries.
Li Yuhong et. Al. (2010) did co-integration analyses with the data of import, export and
economic, and the results suggests that growth of import greatly promotes economic
growth of China, while that of export performs an opposite one.
Giles & Williams (1999) they contributed to this literature in two ways. First, they provided
a comprehensive survey of more than one hundred and fifty ELG applied papers. They
described the changes that have occurred, over the last two decades, in the methodologies
used to empirically examine for relationships between exports and economic Growth, and
provide information on the current findings. The last decade has seen an abundance of time

Asian Journal of Applied Science and Engineering, Volume 1, No 1 (2012) ISSN 2305-915X
Copyright © 2012, Asian Business Consortium | AJASE Page 61
series studies which focus on examining for causality via exclusions restrictions tests,
impulse response function analysis and forecast error variance decompositions. Their
second contribution is to examine some of these time series methods. They showed that
ELG results based on standard causality techniques are not typically robust to specification
or method. Their results suggest that extreme care should be exercised when interpreting
much of the applied research on the ELG hypothesis.
Konya (2000) This paper investigates the possibility of Granger causality between the
logarithms of real exports and real GDP in twenty-five OECD countries, between 1960 and
1998. Two complementary testing strategies are applied. First, depending on th e time series
properties of the data, causality is tested with Wald tests within finite-order vector
autoregressive (VAR) models in levels and/or in first-differences. Then, with no need for
pre-testing, a modified Wald procedure is used in augmented level VAR systems. In both
cases we experiment with alter native deterministic trend degrees. Our study illustrates
how sensitive the Granger causality test results can be to different methods and model
specifications. This fact should warn applied researchers to take extreme care when
interpreting such results. With this limitation in mind, upon our analysis we are confident
to claim that there is no causality (NC) between exports and growth in the Netherlands,
export causes growth (ECG) in Belgium and Iceland, growth causes export (GCE) in
Canada and Japan, and there is two-way causality (TWC) in Sweden and in the UK.
Although with less certainty, we also suspect that there is NC in Hungary, France, Greece
and Luxembourg, ECG in Australia, Austria, Denmark, Ireland, Spain and Switzerland,
GCE in Finland and Korea. However, in the case of Italy, Mexico, New Zealand, Norway,
Portugal and the USA the results are too controversial to make a simple choice.
Altaf et al. (2012) The main purpose of this article is to determine the significance of
macroeconomic variables on Pakistan‘s economic growth with the application of vector
autoregression (VAR) modelling using annual time series data. The quantitative evidence
shows that real per-capita income growth is caused by money-supply. Exchange rate
policies, government spending and money supply are significant in the regression of
Investment. Similarly, exports and exchange rate policies affect the growth of real per-
capita money supply. Forecast errors have been generated for both models using Variance
Decomposition (VDC) analysis.
Feasel et al. (2001) used the impulse response analysis and variance decomposition and
suggested that the investment rates and growth rates of exports had significant short run
effect on the growth rate of per capita output. They employed Vector auto-regression
(VAR) analysis on the data of Korea for the period 1956-1994 and found the dynamic
relationships among investment rates, output growth and export growth. To examine the
impact of financial development on economic growth in china, Shan (2003) used Vector
Auto-Regression technique. He found that after contribution of labor input financial
development came as the second force in leading economic growth in China.
Kandil and Mirzaile (2004) used the data of nine developing countries in the Middle East
and applied the empirical model include three policy variables: government spending, the
money supply and the exchange rate. They found that there is asymmetry in the cyclical
behavior of private consumption. The stabilizing function of policy shock appeared to
asymmetric within countries and varied across countries. To maximize the policy effect on
desired private consumption, the policy stance carefully designed which is the largest
growing component of aggregate demand in many developing countries. They highlighted
importance of country specific studies and argued that the result obtained from cross
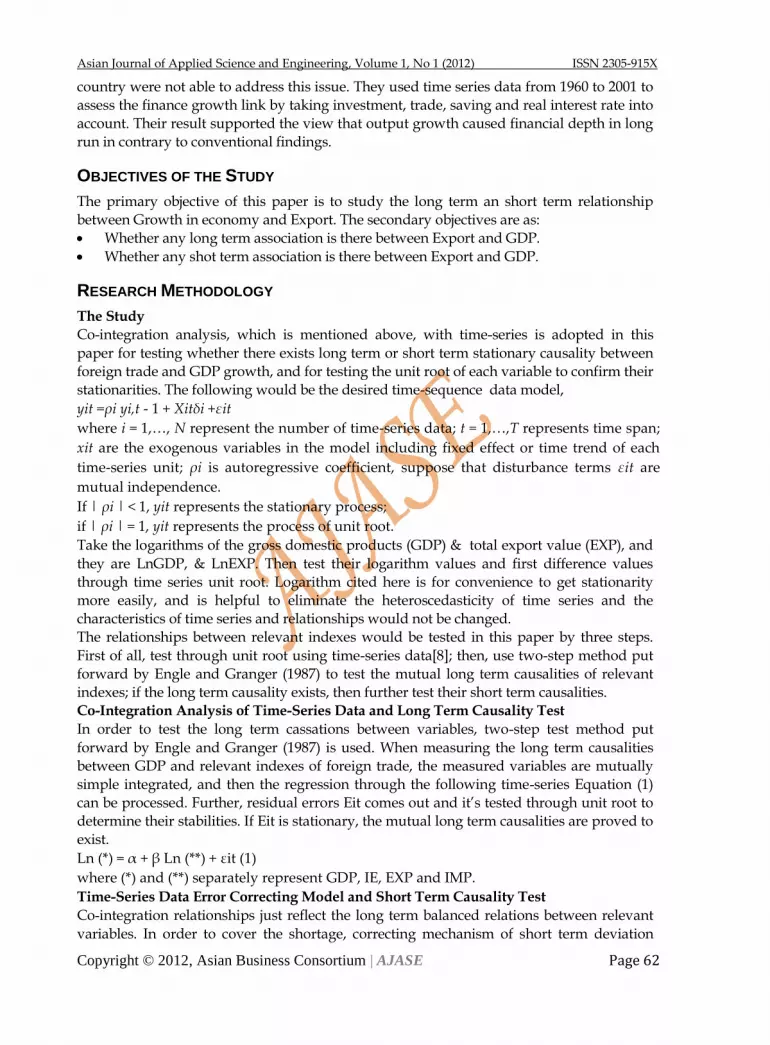
Asian Journal of Applied Science and Engineering, Volume 1, No 1 (2012) ISSN 2305-915X
Copyright © 2012, Asian Business Consortium | AJASE Page 62
country were not able to address this issue. They used time series data from 1960 to 2001 to
assess the finance growth link by taking investment, trade, saving and real interest rate into
account. Their result supported the view that output growth caused financial depth in long
run in contrary to conventional findings.
OBJECTIVES OF THE STUDY
The primary objective of this paper is to study the long term an short term relationship
between Growth in economy and Export. The secondary objectives are as:
Whether any long term association is there between Export and GDP.
Whether any shot term association is there between Export and GDP.
RESEARCH METHODOLOGY
The Study
Co-integration analysis, which is mentioned above, with time-series is adopted in this
paper for testing whether there exists long term or short term stationary causality between
foreign trade and GDP growth, and for testing the unit root of each variable to confirm their
stationarities. The following would be the desired time-sequence data model,
yit =ρi yi,t - 1 + Xitδi +εit
where i = 1,…, N represent the number of time-series data; t = 1,…,T represents time span;
xit are the exogenous variables in the model including fixed effect or time trend of each
time-series unit; ρi is autoregressive coefficient, suppose that disturbance terms εit are
mutual independence.
If | ρi | < 1, yit represents the stationary process;
if | ρi | = 1, yit represents the process of unit root.
Take the logarithms of the gross domestic products (GDP) & total export value (EXP), and
they are LnGDP, & LnEXP. Then test their logarithm values and first difference values
through time series unit root. Logarithm cited here is for convenience to get stationarity
more easily, and is helpful to eliminate the heteroscedasticity of time series and the
characteristics of time series and relationships would not be changed.
The relationships between relevant indexes would be tested in this paper by three steps.
First of all, test through unit root using time-series data[8]; then, use two-step method put
forward by Engle and Granger (1987) to test the mutual long term causalities of relevant
indexes; if the long term causality exists, then further test their short term causalities.
Co-Integration Analysis of Time-Series Data and Long Term Causality Test
In order to test the long term cassations between variables, two-step test method put
forward by Engle and Granger (1987) is used. When measuring the long term causalities
between GDP and relevant indexes of foreign trade, the measured variables are mutually
simple integrated, and then the regression through the following time-series Equation (1)
can be processed. Further, residual errors Eit comes out and it‘s tested through unit root to
determine their stabilities. If Eit is stationary, the mutual long term causalities are proved to
exist.
Ln (*) = α + β Ln (**) + εit (1)
where (*) and (**) separately represent GDP, IE, EXP and IMP.
Time-Series Data Error Correcting Model and Short Term Causality Test
Co-integration relationships just reflect the long term balanced relations between relevant
variables. In order to cover the shortage, correcting mechanism of short term deviation

Asian Journal of Applied Science and Engineering, Volume 1, No 1 (2012) ISSN 2305-915X
Copyright © 2012, Asian Business Consortium | AJASE Page 63
from long term balance could be cited. At the same time, as the limited number of years, the
above test result may cause disputes. Therefore, under the circumstance of long term
causalities, short term causalities should be further tested as well. The error correcting
models could be built as,
d LnGDPit = ηi + Σα1d LnGDPi, t – 1+ Σβ1d LnEXPi, t-1 + λ ECMit + εit (1)
where t represents year, d represents first difference calculation, ECMit represents the errors
of long term balance. If λ = 0 is rejected, error correcting mechanism happens, and the tested
long term causality is reliable, it could be unreliable. If β1 = 0 is rejected, and then the short
term causality is not proved to exist.
The Sample
The data was collected for a period of 41 years i.e. 1970 – 2011. The Indian GDP value is
taken at USD rate and Indian Export value is also taken at USD rate. The data is time series
in nature and hence we need to check the stationarity of data. Johansen Cointegration Test
has been applied.
RESULT AND ANALYSIS
Null Hypothesis: There is No Cointegration Between the variables.
The null hypothesis is rejected because the probability is less than 5 percent. It means there
is cointegration between the variables.
Alternative Hypothesis: There is atleast one cointegrating variables. The alternative
hypothesis is accepted at 5 percent probability.
Johansen Cointegration Test
Date: 10/03/12 Time: 23:54
Sample (adjusted): 3 42
Included observations: 40 after adjustments
Trend assumption: Linear deterministic trend
Series: GDP EXP01
Lags interval (in first differences): 1 to 1
Unrestricted Cointegration Rank Test (Trace)
Hypothesized Trace 0.05
No. of CE(s) Eigenvalue Statistic Critical Value Prob.**
None * 0.541824 33.28390 15.49471 0.0000
At most 1 0.050286 2.063795 3.841466 0.1508
Trace test indicates 1 cointegrating eqn(s) at the 0.05 level
* denotes rejection of the hypothesis at the 0.05 level
**MacKinnon-Haug-Michelis (1999) p-values
Unrestricted Cointegration Rank Test (Maximum Eigenvalue)
Hypothesized Max-Eigen 0.05

Asian Journal of Applied Science and Engineering, Volume 1, No 1 (2012) ISSN 2305-915X
Copyright © 2012, Asian Business Consortium | AJASE Page 64
No. of CE(s) Eigenvalue Statistic Critical Value Prob.**
None * 0.541824 31.22011 14.26460 0.0001
At most 1 0.050286 2.063795 3.841466 0.1508
Max-eigenvalue test indicates 1 cointegrating eqn(s) at the 0.05 level
* denotes rejection of the hypothesis at the 0.05 level
**MacKinnon-Haug-Michelis (1999) p-values
Unrestricted Cointegrating Coefficients (normalized by b'*S11*b=I):
GDP EXP01
1.83E-12 -2.73E-11
1.72E-11 -6.91E-11
Unrestricted Adjustment Coefficients (alpha):
D(GDP) -4.81E+10 1.69E+09
D(EXP01) -8.57E+09 1.65E+09
1 Cointegrating Equation(s): Log likelihood -1994.731
Normalized cointegrating coefficients (standard error in parentheses)
GDP EXP01
1.000000 -14.90328
(1.66044)
Adjustment coefficients (standard error in parentheses)
D(GDP) -0.088194
(0.01371)
D(EXP01) -0.015728
(0.00330)
Vector Error Correction Estimates
Date: 10/03/12 Time: 23:55
Sample (adjusted): 4 42
Included observations: 39 after adjustments
Standard errors in ( ) & t-statistics in [ ]

Asian Journal of Applied Science and Engineering, Volume 1, No 1 (2012) ISSN 2305-915X
Copyright © 2012, Asian Business Consortium | AJASE Page 65
Cointegrating Eq: CointEq1
GDP(-1) 1.000000
EXP01(-1) 316.8386
(52.3709)
[ 6.04990]
C -2.09E+13
Error Correction: D(GDP) D(EXP01)
CointEq1 0.003402 0.000841
(0.00067) (0.00014)
[ 5.04027] [ 6.12336]
D(GDP(-1)) -0.607263 0.062156
(0.31502) (0.06414)
[-1.92771] [ 0.96905]
D(GDP(-2)) -0.840578 -0.311778
(0.42471) (0.08648)
[-1.97919] [-3.60535]
D(EXP01(-1)) 0.597009 -0.057030
(1.38754) (0.28252)
[ 0.43026] [-0.20186]
D(EXP01(-2)) 1.481283 0.301538
(1.23061) (0.25057)
[ 1.20369] [ 1.20341]
C 8.25E+10 1.79E+10
(1.6E+10) (3.3E+09)
[ 5.13057] [ 5.45359]
R-squared 0.665672 0.857146
Adj. R-squared 0.615016 0.835501
Sum sq. resids 7.20E+22 2.99E+21
S.E. equation 4.67E+10 9.51E+09
F-statistic 13.14109 39.60097

Asian Journal of Applied Science and Engineering, Volume 1, No 1 (2012) ISSN 2305-915X
Copyright © 2012, Asian Business Consortium | AJASE Page 66
Log likelihood -1010.209 -948.1394
Akaike AIC 52.11329 48.93023
Schwarz SC 52.36922 49.18616
Mean dependent 4.55E+10 1.16E+10
S.D. dependent 7.53E+10 2.35E+10
Determinant resid covariance (dof adj.) 5.52E+40
Determinant resid covariance 3.95E+40
Log likelihood -1933.495
Akaike information criterion 99.87153
Schwarz criterion 100.4687
The Equation for Dependent Variable will be: D(GDP) = C(1)*( GDP(-1) +
316.838576*EXP01(-1) - 2.089460373e+013 ) + C(2)*D(GDP(-1)) + C(3)*D(GDP(-2)) +
C(4)*D(EXP01(-1)) + C(5)*D(EXP01(-2)) + C(6)
This equation will be our Error Correction Model and export will be dependable variable.
C(1) is the coefficient of the integrating equation. 316.838576*EXP01(-1) -
2.089460373e+013 ) this will be cointegrating equation.
For Short term causality, the equation will be: C(4)*D(EXP01(-1)) + C(5)*D(EXP01(-2))
The equation for Independent variable will be: D(EXP01) = C(7)*( GDP(-1) +
316.838576*EXP01(-1) - 2.089460373e+013 ) + C(8)*D(GDP(-1)) + C(9)*D(GDP(-2)) +
C(10)*D(EXP01(-1)) + C(11)*D(EXP01(-2)) + C(12)
Dependent Variable: D(GDP)
Method: Least Squares
Date: 10/03/12 Time: 23:58
Sample (adjusted): 4 42
Included observations: 39 after adjustments
D(GDP) = C(1)*( GDP(-1) + 316.838576*EXP01(-1) - 2.089460373E
+013 ) + C(2)*D(GDP(-1)) + C(3)*D(GDP(-2)) + C(4)*D(EXP01(
-1)) + C(5)*D(EXP01(-2)) + C(6)
Coefficient Std. Error t-Statistic Prob.
C(1) 0.003402 0.000675 5.040274 0.0000
C(2) -0.607263 0.315017 -1.927713 0.0625
C(3) -0.840578 0.424709 -1.979187 0.0562
C(4) 0.597009 1.387542 0.430263 0.6698
C(5) 1.481283 1.230614 1.203694 0.2373
C(6) 8.25E+10 1.61E+10 5.130573 0.0000

Asian Journal of Applied Science and Engineering, Volume 1, No 1 (2012) ISSN 2305-915X
Copyright © 2012, Asian Business Consortium | AJASE Page 67
R-squared 0.665672 Mean dependent var 4.55E+10
Adjusted R-squared 0.615016 S.D. dependent var 7.53E+10
S.E. of regression 4.67E+10 Akaike info criterion 52.11329
Sum squared resid 7.20E+22 Schwarz criterion 52.36922
Log likelihood -1010.209 Durbin-Watson stat 1.960480
Wald Test:
Equation: Untitled
Test Statistic Value df Probability
F-statistic 1.016277 (2, 33) 0.3730
Chi-square 2.032553 2 0.3619
Null Hypothesis Summary:
Normalized Restriction (= 0) Value Std. Err.
C(4) 0.597009 1.387542
C(5) 1.481283 1.230614
Restrictions are linear in coefficients.
The coefficient at lag 1 is .003402 at 5 percent probability. It means there is no long term
causality between GDP and Export.
Null Hypothesis: There is no long term causality between GDP and Export.
The probability is 0 percent which means the hypothesis is rejected but since the value of
coefficient is positive, we can say that there is no long term causality.
Wald Test:
Equation: Untitled
Test Statistic Value df Probability
F-statistic 1.016277 (2, 33) 0.3730
Chi-square 2.032553 2 0.3619
Null Hypothesis Summary:
Normalized Restriction (= 0) Value Std. Err.
C(4) 0.597009 1.387542
C(5) 1.481283 1.230614
Restrictions are linear in coefficients.
Null Hypothesis H0: Export of Lag 4 & 5 cannot jointly influence GDP. Probability of Chi
square statistic is more than 5% which means null hypothesis is accepted. Thus it can be
Export cannot affect the GDP in short run.
Histogram
Null Hypothesis H0: Residual is normally distributed. Results shows that probability of
Jarque – Bera test statistic is less than 5 percent. It means the null hypothesis is accepted.
Thus we can say that the data is normally distributed.

Asian Journal of Applied Science and Engineering, Volume 1, No 1 (2012) ISSN 2305-915X
Copyright © 2012, Asian Business Consortium | AJASE Page 68
ARCH Test:
F-statistic 6.228804 Probability 0.017289
Obs*R-squared 5.605050 Probability 0.017909
Test Equation:
Dependent Variable: RESID^2
Method: Least Squares
Date: 10/04/12 Time: 00:00
Sample (adjusted): 5 42
Included observations: 38 after adjustments
Variable Coefficient Std. Error t-Statistic Prob.
C 1.17E+21 7.24E+20 1.611191 0.1159
RESID^2(-1) 0.384093 0.153898 2.495757 0.0173
R-squared 0.147501 Mean dependent var 1.89E+21
Adjusted R-squared 0.123821 S.D. dependent var 4.36E+21
S.E. of regression 4.08E+21 Akaike info criterion 102.4121
Sum squared resid 6.01E+44 Schwarz criterion 102.4983
Log likelihood -1943.830 F-statistic 6.228804
Durbin-Watson stat 1.977164 Prob(F-statistic) 0.017289
Null hypothesis H0: There is no ARCH effect. The Probability value of observed R square
0
4
8
12
16
20
-1.0e+11 0.00000 1.0e+11
Series: Residuals
Sample 4 42
Observations 39
Mean 2.70e-06
Median 3.01e+09
Maximum 1.50e+11
Minimum -1.20e+11
Std. Dev. 4.35e+10
Skewness 0.207341
Kurtosis 6.322422
Jarque-Bera 18.21698
Probability 0.000111
Asian Journal of Applied Science and Engineering, Volume 1, No 1 (2012) ISSN 2305-915X
Copyright © 2012, Asian Business Consortium | AJASE Page 69
is 2.38 percent which is below 5 percent. Hence null hypothesis is rejected. It means there
is ARCH effect among variables.
Breusch-Godfrey Serial Correlation LM Test:
F-statistic 34.61605 Probability 0.000000
Obs*R-squared 26.93800 Probability 0.000001
Test Equation:
Dependent Variable: RESID
Method: Least Squares
Date: 10/04/12 Time: 00:00
Presample missing value lagged residuals set to zero.
Variable Coefficient Std. Error t-Statistic Prob.
C(1) -1.77E-06 0.000435 -0.004056 0.9968
C(2) 0.226313 0.182516 1.239963 0.2243
C(3) -0.233969 0.245101 -0.954581 0.3472
C(4) -1.690533 0.796923 -2.121325 0.0420
C(5) 2.472789 0.743882 3.324169 0.0023
C(6) -3.53E+09 9.70E+09 -0.363383 0.7188
RESID(-1) 0.391802 0.124755 3.140566 0.0037
RESID(-2) -0.061723 0.106064 -0.581937 0.5648
R-squared 0.690718 Mean dependent var 2.70E-06
Adjusted R-squared 0.620880 S.D. dependent var 4.35E+10
S.E. of regression 2.68E+10 Akaike info criterion 51.04235
Sum squared resid 2.23E+22 Schwarz criterion 51.38360
Log likelihood -987.3259 Durbin-Watson stat 1.939475
Null hypothesis H0: There is no Serial Correlation Effect. The Probability value of
observed R square is 0.000 percent which is below 5 percent. Hence null hypothesis is
rejected. It means there is Serial Correlation effect among variables.
CONCLUSION
The results showed that there is no long term causality between Export and GDP. The
result of Wald test also showed that short term causality is also not there between GDP
and Export. The simple reason for this is that the total weightage of Export in GDP is
minimal i.e. the volume of export is insufficient to affect overall value of GDP either in
long term or in short term.

Asian Journal of Applied Science and Engineering, Volume 1, No 1 (2012) ISSN 2305-915X
Copyright © 2012, Asian Business Consortium | AJASE Page 70
REFERENCES
Ahmad Mohsin H., Shaista A., & Mohammad S. B. (2004). Foreign Direct Investment, Exports
and Domestic Output in Pakistan. Pakistan Development Review, 42(4), 715-723.
Ang, J. B. and J.C. McKibbin, (2005) Financial Liberalization, Financial Sector Development and
Growth: Evidence from Malaysia. Centre for Applied Macroeconomic Analysis
Working Paper Series.
Asma S., & Hui X. F. (2009). Negative Impact of FDI: A Cointegrated Approach. The
International Journal of Organizational Innovation, 2, 272-282.
Box, G. E. P. and G.C. Tiao, (1975) Intervention Analysis with Applications to Economic and
Environmental Problems. Journal of the American Statistical Association, (70): 70-79.
Feasel, E., Y. Kim, and S. C. Smith, (2001) A VAR Approach to Growth Empirics: Korea. Review
of Development Economics, (5): 421-32.
Fry, M., Claessens, S., Burridge, P., & Blanchet, M. (1995). Foreign Direct Investment, Other Capital
Flows and Current Account Deficits: What Causes What?. Working Paper no. 1527 (World
Bank Policy Research).
Ghatak, A. (1998) Vector Autoregression Modelling and Forecasting Growth of South Korea.
Journal of Applied Statistics, 25 (5): 579-592.
Granger, C. W. J. (1986). Developments in the Study of the Cointegrated Economic Variables.
Oxford Bulletin of Economics and Statistics, 48, 201-212.
Gulzar, S., & Hui, X. F. (2006). Thirty years of chronic current account deficit 1972-2001: The
case of Pakistan. J. Harbin Inst. Technol., 14, 259-264.
IMF Country Report No. 05/408, 2005.
Iqbal, Z. and G. M. Zahid, (1998) Macroeconomic Determinants of Economic Growth in
Pakistan. The Pakistan Development Review, summer 37 (2): 125-148.
Jansen, K. (1995). The Macroeconomic Effects of Direct Foreign Investment: The Case of
Thailand. World Development, 23, 193-210. http://dx.doi.org/10.1016/0305-
750X(94)00125-I
Kandil M. and I. A. Mirzai, (2004) Macroeconomic Policies Cyclicality and Planned
Consumption: Evidence from the Middle East. International Monetary Fund Report
Washington D.C. 20431.
Khan, A. H., A. Malik, and L. Hasan, (1995) Exports, Growth and Causality: An Application of
Co-integration and Error-correction Modeling. The Pakistan Development Review,
winter 34(4): Part 3: 1001-1012.
Kónya, L. & Singh, J.P. 2006, Exports, imports and economic growth in India, La Trobe
University, School of Business discussion paper, series A, no. 06.06: 23.
Kónya, L. 2004a, ‘Export-led growth, growth-driven export, both or none? Granger causality
analysis on OECD countries’, Applied Econometrics and International Development,
4(1):7394.
Kónya, L. 2004b, ‘Unit-root, cointegration and Granger causality test results for export and
growth OECD countries’, International Journal of Applied Econometrics and Quantitative
Studies, 1(2): 67–94.
Kumar, N., & Pradhan, J. P. (2002). Foreign Direct Investment, Externalities and Economic Growth in
Developing Countries: Some Empirical Explorations and Implications for WTO Negotiations
on Investment. RIS Discussion Papers 27.
Kravis, I.B. (1970), Tade as a Handmaiden of Growth : Similarities between the nineteenth and
twentieth centuries, Economic Journal 80, 850-70
Asian Journal of Applied Science and Engineering, Volume 1, No 1 (2012) ISSN 2305-915X
Copyright © 2012, Asian Business Consortium | AJASE Page 71
Sahoo, D., & Mathiyazhagan, M. K. (2002). Economic Growth in India: Does Foreign Direct
Investment Inflow Matter? Working Papers 115 (Institute for Social and Economic
Change. Bangalore).
Shan, J. (2003) Financial Development and Economic Growth: The Empirical Evidence from
China. Proceedings of the 15th Annual Conference of the Association for Chinese
Economics Studies Australia (ACESA), Melbourne, 2-3.
Yuhong Li, Zhongwen Chen & Changjian San (2010), Research on the Relationship between
Foreign Trade and the GDP Growth of East China—Empirical Analysis Based on
Causality, Modern Economy, 2010, 1, 118-124
WEBLIOGRAPHY
Athreye, S., & Kapur, S. (2001). Private Foreign Investment in India: Pain or Panacea?. The
World Economy, 24(3), 399-424. http://dx.doi.org/10.1111/1467-9701.00362
Bekaert, G., Harvey, C. R., & Lundblad, C. (2003). Equity market liberalization in emerging
markets. [Online] Available: http://ssrn.com/abstract=795345
Chakraborty, C., & Basu, P. (2002). Foreign direct investment and growth in India: A
cointegration approach. Applied Economics, 34, 1061-1073.
http://dx.doi.org/10.1080/00036840110074079.
Ghosh, A., & Ostry, J. D. (1995). The Current Account in Developing Countries: a
Perspective from Consumption Smoothing Approach. World Bank Economic
Review, 9(2), 305-333. http://dx.doi.org/10.1093/wber/9.2.305
Klein, M. W., & Olivei, G. P. (2008). Capital account liberalization, financial depth, and
economic growth. Journal of International Money and Finance, 27, 861-875.
http://dx.doi.org/10.1016/j.jimonfin.2008.05.002
Konya, Laszlo , Export-Led Growth or Growth-Driven Export? New Evidence from Granger
Causality Analysis on OECD Countries. Central European University Working Paper
No.15/2000. Available at SSRN: http://ssrn.com/abstract=254090 or
http://dx.doi.org/10.2139/ssrn.25409
Kumar, Naresh and Fodea, Alina, Perspective on Economic Growth of BRIC Countries: A Case
of Brazil and India (February, 13 2009). Available at SSRN:
http://ssrn.com/abstract=1342255 or http://dx.doi.org/10.2139/ssrn.1342255
Root, Franklin, R., & Ahmed. (1979). Empirical Determinants of DFI in Developing
Countries. Economic Development and Cultural Change, 27(4).
http://dx.doi.org/10.1086/451139
AJASE? www.ajase.weebly.com
High quality editorial board
Rigorous and rapid peer review
Open Access & high citation rate
Will apply for ISI track in the near future
Asian Journal of Applied Science and Engineering, Volume 1, No 1 (2012) ISSN 2305-915X
Copyright © 2012, Asian Business Consortium | AJASE Page 72
Why Work with ABC
1. Voluntary reviewers have complete authority to set the standards for the acceptance of manuscripts;
2. Voluntary reviewers have complete authority to determine whether a manuscript is accepted or not;
3. Voluntary reviewers have the right to revise the scope and policies of their journals;
4. Voluntary reviewers pay a reduced fee for ABC publication;
5. ABC has its own marketing team. Editorial board/Voluntary review board members are not required to solicit papers.

Asian Journal of Applied Science and Engineering, Volume 1, No 1 (2012) ISSN 2305-915X
Copyright © 2012, Asian Business Consortium | AJASE Page 73
Asian Journal of Applied Science and Technology
(Peer reviewed international journal) ISSN 2305-915X
Open Access Philosophy Under Open Access Philosophy, AJASE will not charge for the access
of its journals. This will ensure that a large percentage of students,
scholars, researchers and practitioners will be able to benefit from the
research published through ABC journals. Moreover, this process will
also enable authors’ papers to receive a higher ranking. A greater
number of people being able to access and consequently refer to
papers will mean a higher citations and Impact Factor for ABC
journals. Following are advantages of Open Access Philosophy:
1. The full text of all issues of AJASE is freely available to anyone, online.
2. Your research work will be indexed and abstracted in the
internationally reputed databases and search engines immediately
after publication.
3. Open Access increases the number of downloads, page views,
citations etc. increasing the rate of
dissemination of your research
work manifold.
4. It is inferred from past
researches that the papers published under "Open Access Philosophy" are four
times more likely to be cited than the papers published under "Non-Open
Access Philosophy"
Peer Review Policy
Paperless, web-based peer review system, professional and helpful suggestions from reviewers. Articles in this
journal have undergone a rigorous blind peer review system, based on initial editor screening and involving in-
country and international refereeing, ensures that articles meet the highest standards of quality. Most ABC
journals have ISSN with IMPACT FACTORS. It facilitates our scholars, researchers, scientists, professors,
corporates, governmental research agencies, librarians etc., in a more positive way in their research proceedings.
Faster Turnaround Time
Many journals take many months, even years to publish research. By the time papers are published, often they become
outdated. AJASE publishes papers in the shortest possible time, without compromising on quality. This will ensure that
the latest research is published, allowing readers to gain maximum benefit. We provide feedback instantaneously and
furnish details of the outcome within about 5 - 6 working days of submission of your research paper. This enables
research scholars to use their time effectively on the actual research rather than on the follow ups.
Strong International network & Collaboration
We have exposure to wide range of industries across geographies and worldwide connect through international
colleagues and thereby the recognition. We work in collaboration with extremely creditable companies, academic
institutions, reputed publication units, government bodies and research firms. By publishing with us, you join ABC
Global Research Community of 50,000 scientists / researchers.
For Details- go through the link: www.ajase.weebly.com

Asian Journal of Applied Science and Engineering, Volume 1, No 1 (2012) ISSN 2305-915X
Copyright © 2012, Asian Business Consortium | AJASE Page 74
Global Disclosure of Economics and Business (Peer reviewed international journal)
ISSN 2305-9168
Why Publish on GDEB
1. Open Access Have you ever been frustrated to find that it costs $30 to download the full text file of an article you wish to read? The full text version of all papers published at GDEB is freely available online to anybody. 2. Affordable Most open-access journals charge more than a thousand dollars per accepted manuscript. From ABC’s perspective, that means, access to publication for authors is not truly open. ABC’s
publication fee is affordable, at $60 per accepted paper. ABC aims to encourage all scientists to work together to share knowledge. 3. High-quality editorial board ABC is very careful in its selection of editorial board members. All ABC Journals board members are experts in their respective fields. 4. Rigorous peer review Acceptance of a submission is solely based on recommendations by editors and peer reviewers. 5. Rapid review process Paper less & web based review system. Typically, the review period is complete within 4 weeks. 6. High citation rate Our open-access policy guarantees that anyone can read an author’s papers online. ABC plans to have ABC journals included in all major databases, and indexed by Thomson Reuters (ISI). 7. Authors retain copyright All papers published on GDEB are open–access. Under this system, authors retain ownership of the copyright for their content, but they allow anyone to download, reuse, reprint, modify, distribute, and/or copy the content, as long as the original authors and source are cited properly.
Faster Turnaround Time
Many journals take many months, even years to publish
research. By the time papers are published, often they become
outdated. GDEB publishes papers in the shortest possible
time, without compromising on quality. This will ensure that
the latest research is published, allowing readers to gain
maximum benefit. We provide feedback instantaneously and
furnish details of the outcome within about 5 - 6 working days of submission of your research paper. This enables research scholars to use their time effectively on the
actual research rather than on the follow ups.
Strong International network
By publishing with us, you join ABC Global Research Community of 50,000 scientists / researchers.
For Details- go through the link: www.gdeb.weebly.com
GDEB Publish
Online and Print
Version Both

Asian Journal of Applied Science and Engineering, Volume 1, No 1 (2012) ISSN 2305-915X
Copyright © 2012, Asian Business Consortium | AJASE Page 75
It gives us immense pleasure to forward the link of the current issue of our Journal Asian Accounting and Auditing Advancement (4A Journal) circulated all over the world 141 countries/territories (Japan; United Kingdom; United
States; Russia; Australia; China; Canada; France; Germany; Hong Kong; Italy; Mexico; New Zealand; Singapore; Spain;
Swaziland; Switzerland; Taiwan; Afghanistan; Albania; Algeria; Argentina; Armenia; Austria; Bahrain; Bangladesh;
Barbados; Belgium; Benin; Bhutan; Bolivia; Bosnia and Herzegovina; Botswana; Brazil; Brunei; Bulgaria; Cameroon; Chile;
Colombia; Congo [DRC]; Costa Rica; Côte d’Ivoire; Croatia; Cyprus; Czech Republic; Denmark; Djibouti; Egypt; Eritrea; Ethiopia; Fiji; Finland; Gambia; Georgia; Ghana; Greece; Guatemala; Guyana; Hungary; Iceland; India; Indonesia; Iran;
Iraq; Ireland; Israel; Jamaica; Jersey; Jordan; Kazakhstan; Kenya; Kuwait; Kyrgyzstan; Laos; Latvia; Lebanon; Lesotho;
Liberia; Libya; Lithuania; Luxembourg; Macau; Macedonia [FYROM]; Malawi; Malaysia; Maldives; Malta; Mauritius; Moldova;
Morocco; Mozambique; Myanmar [Burma]; Namibia; Nepal; Netherlands; Nicaragua; Nigeria; Norway; Oman; Pakistan; Palestinian Territories; Panama; Papua New Guinea; Paraguay; Peru; Philippines; Poland; Portugal; Qatar; Romania;
Rwanda; Saudi Arabia; Senegal; Serbia; Sierra Leone; Slovakia; Slovenia; South Africa; South Korea; Sri Lanka; Sudan;
Suriname; Sweden; Syria; Tanzania; Thailand; Togo; Trinidad and Tobago; Tunisia; Turkey; Uganda; Ukraine; United Arab
Emirates; Uruguay; Uzbekistan; Venezuela; Vietnam; Yemen; Zambia; Zimbabwe), for your kind reference and record.
Asian Journal of Applied Science and Engineering, Volume 1, No 1 (2012) ISSN 2305-915X
Copyright © 2012, Asian Business Consortium | AJASE Page 76
Asian Business Review ISSN: 2304-2613 (Print)
ISSN: 2305-8730 (Online) Email: [email protected]
Call for Papers
Asian Business Review www.abrjournal.weebly.com
Peer Review Policy Open Access Policy Well Indexed Online Submission Online Archives Global Circulation Free ABC Membership Call for Board Member
Respected Author Asian Business Consortium believes that a standard, well indexed and worldwide circulated
Journal can be an effective agent of sharing beliefs, values and research deeds. We are pleased to inform you that Asian Business Consortium is going to publish Vol. 2, No.1 (2013) Issue of its International Peer Reviewed Journal Asian Business Review {International Standard Serial Number: 2304-2613(p); 2305-8730(e)}.
Through this letter we are inviting articles from interested faculty members, scholars, and writers of the universities and other educational institutions for this 2nd Issue, which is expected to be in the press by the 1st week of March, 2013 or in any of the forthcoming issue of the journal. We also invite articles from foreign authors. We hope you will find ABR to be of international standard.
ABR will contain research-based articles on Business, Technology and Social Sciences and such other subjects which are significantly related to the religion of Asia. We will appreciate your cooperation in this regard and request you to kindly circulate this invitation letter to your faculty/department members so that they can avail this opportunity.
Submission of Papers: Full papers written in English and not submitted elsewhere,
should be submitted in MS WORD format through the website (online submission) http://abrjournal.weebly.com/submission.html.
Important Deadlines for the Inaugural Issue a) Submission of Full Paper 10th February 2013 b) Reviewer’s Feedback and Notification of Full Acceptance 15th February 2013 c) Registration Deadline 20th February 2013 d) Expected to be in the press by the 1st week of March, 2013
Processing Fee for Regular Issue US$ 80 (Outside Bangladesh Author, except shipping) BDT 6000 (Bangladeshi Resident Author)
The journal is patronized by Asian Business Consortium (ABC). All authors of the ABR will be considered as ABC member. With regards, Editor, Asian Business Review