Human Development Report Maharashtra 2002
333
-
Upload
khangminh22 -
Category
Documents
-
view
0 -
download
0
Transcript of Human Development Report Maharashtra 2002


HumanDevelopment
ReportMaharashtra
2002

© 2002Government of MaharashtraMumbai
All rights reserved. No part of this publication may be reproduced, storedor transmitted in any form or by any means without the prior permissionof the Government of Maharashtra. Price: Rs 500 Print version Web versionTypeset and printed by Government Central Press, Layout, design and resetting by Astricks,Netaji Subhash Road, Charni Road, Mumbai 400004 New Delhi 110070for Government of Maharashtra, Mumbai www.astricks.com

CHIEF MINISTER Mantralaya, Mumbai 400032
Date: 3/5/2002
MESSAGE
Maharashtra enjoys the reputation of being the most progressive and well-administeredState in the country. The State Government is aware that although progress has been achievedin various sectors since the inception of Maharashtra, much remains to be done in manyfields. The Government is, therefore, making strenuous efforts to provide basic minimumservices to the people, including drinking water, health, education, employment opportunities,etc. The issues like securing peoples participation, poverty alleviation, social protection to thepoor, removal of regional imbalances, good governance are also high on the agenda of theGovernment. We are committed to the cause of human development.
I compliment the Planning Commission and the United Nations Development Programmefor collaborating with the State Government in preparation of the Maharashtra Human De-velopment Report (MHDR), which provides an objective, in-depth analysis of the presentstatus of various aspects of human welfare in our State.
I am sure, the authoritative and comprehensive document, so meticulously prepared, pro-viding a realistic assessment of the current status of human development in Maharashtra, willserve as a guide for future planning in various fields to achieve socio-economic well-being ofour people.
I appreciate the endeavour. (Vilasrao Deshmukh)
MAHARASHTRA

ea=h
foŸk o fu;®tu egkjk"Vª ’kklu
ea=ky;] eaqcà 400032
MINISTER FOR FINANCE AND PLANNING
GOVERNMENT OF MAHARASHTRA
Mantralaya, Mumbai 400032
MESSAGE
Maharashtra has a creditable record of development in different areas because of sustainedefforts of development planning spread over last four decades. The benefit of developmentunfortunately has not reached equally to various sections of our population or to people livingin different regions of the State. In particular, progress has been very uneven in the field ofeducation, health and nutrition. Progress in these areas is very important to ensure sustaineddevelopment of the sections of the population who are lagging behind. On the basis of latestindicator of human development, Maharashtra seems to be falling behind in comparison witha number of other States which apparently are less developed.
The Maharashtra Human Development Report, 2002 prepared by the State with the helpof Planning Commission and UNDP gives us a detailed analysis of the situation of differentaspects of human welfare in the State in a desegragated manner. This, I hope, will help in amore focussed attention on the relatively neglected areas to enable them to catch up with therest of the State. This Report will prove a milestone in the process of development planningof the State. I appreciate the efforts made by the Government officials, the experts, officialsof UNDP and the Planning Commission who were involved in the formulation of this Report.
(Jayant Patil)

lnL; ;®tuk vk;®x
;®tuk Òou
uà fnYyh 110001
MEMBER PLANNING COMMISSION
YOJANA BHAVAN NEW DELHI 110001
MESSAGE
I congratulate the Government of Maharashtra on the preparation of their First HumanDevelopment Report. I am glad that both the UNDP and the Planning Commission supportedthis endeavour.
The preparation of a Human Development Report is symptomatic of the growing realizationthat people are at the center of the development process. Development is not confined toeconomic attainments alone. But is multi-dimensional with a focus on expanded opportunitiesand enhanced choices through building of capabilities.
Maharashtra’s experience is a unique one. While per-capita income is forty per cent, higherthan the all India average, there are enormous intra-state differences, both in the levels ofattainment and in poverty ratios. These differences are brought out in the Report and areattributed largely to an uneven natural resources endowment. The Marathwada and Vidarbhaareas of the State are characterized by drought proneness with agriculture subject to periodicdroughts which in turn have an adverse impact on the incomes of the majority. This issue ofregional imbalances within the State is a complex one but has to be addressed effectively bythe Government.
Another problem is the existence of a large urban population living in slums. Measureswould have to be taken to tackle this problem as well, and to improve the living conditionsof the slum-dwellers.
The Report has given some pointers for future course of action. In this, the State Gov-ernment, the Civil Society and the Panchayati Raj Institutions would all have to work intandem. The success of the Report would therefore, depend to a large extent upon the followup actions that would be taken after the Report is released.
Once again, I would like to commend the State Government for bringing out this Report.It has been prepared with the help and involvement of a wide spectrum of developmentpractitioners both from the Government and Civil Society. I wish you all success in the pursuitof the goals that have been mapped out for the future.
(Kamaluddin Ahmed)
KAMALUDDIN AHMED

United Nations Development Programme
l;qDr jk"Vª fcdkl dk;ZØe
Message
On behalf of the United Nations Development Programme, I would like to expressappreciation of the Maharashtra Human Development Report, which shows the status, achieve-ments and challenges, as also the way forward for poverty eradication, sustainable livelihoodsand all-round social development in the State.
The Report highlights the issues of income and employment generation, reduction inpoverty and regional disparities, provision of basic minimum services, people’s participationand development of human capabilities, especially of the income poor.
While the Maharashtra HDR places the State amongst the high-income States, it alsopoints out diversities within the State and argues that high per-capita income has not alwaysresulted in improving social attainments commensurately.
I am very pleased that the analysis in the Report has flagged the crucial importance ofinvesting in gender-equality, effective local governance and the need to ensure social protection,especially for the poor. The State Government must be commended for focussing strongly ona right to development approach in the Report, including livelihoods promotion, guaranteedaccess to basic services, and the treatment of HIV/AIDS as a mainstream development issue.
I once again congratulate the Government of Maharashtra for its enduring commitmentto the cause of human development, and express confidence that the Report will be a criticaland key tool for lasting people-centered development in Maharashtra.
(Brenda Gael McSweeney)
UNDP Resident Representative & UN Resident Coordinator
55, Lodi Estate, Post Box No. 3059, New Delhi-110003 India
Tel: 24628877 Fax: 91-11-24627612 Email: [email protected], http://www.undp.org.in Cable: UNDEVPRO, New Delhi

Preface
Like a lion who looks back with a sense ofpride and self-esteem as to how much he hasachieved wondering how much remains to
be conquered, (Sinhavalokan) we need to sit backand ask ourselves, what have we done all these yearsthat would qualify us to be called a civilized society.Human beings are different and better than theanimals in that they are endowed with the power tothink, power to reason. That being so, we areexpected to cherish and exert ourselves for achieve-ment of values such as equality, liberty and frater-nity. Equality in terms of availability of equalopportunity for development and enhancement ofquality of one’s own life. Development of an indi-vidual is intimately linked with social developmentand vice versa.
This theory was well known to all of us for quitelong and all of us have been trying in that direction.But it needs to be done in a more organised waywith proper planning and through time-bound pro-grammes. Preparation of human development re-ports is therefore of paramount importance both forknowing exactly where we have reached and forfuture planning.
World Human Development Report 2000 addsa new dimension to the concept of human develop-ment and its evaluation. It lays emphasis on the stateof human rights in a particular society to assess itsdevelopment. It sees an organic relationship be-tween human rights and development. Assessmentof human development, if combined with the hu-man rights perspective, can indicate the duties ofothers in the society to enhance human develop-ment in one way or the other. The human rightsapproach may offer an additional and very usefulperspective for the analysis of human development.Human rights have intrinsic value as ends in them-selves. They also have instrumental value.
There are causal links between the realisation of
one right and that of another—right to food, rightto free speech, right to education and so on. Theyare all linked with each other and cannot be viewed,achieved and evaluated in isolation. This is preciselywhat the great Man of Indian Renaissance, JusticeMahadev Govind Ranade (1842–1901) said a hun-dred years ago. In his Presidential address to theSocial Conference of which he was also the founderat Satara in May 1900, he said, ‘You cannot have agood social system when you find yourself low inthe scale of political right nor can you be fit toexercise political rights and privileges unless yoursocial system is based on reason and justice. Youcannot have a good economic system when yoursocial arrangements are imperfect. If your religiousideas are low and groveling, you cannot succeed insocial, economic or political spheres. This interde-pendence is not an accident, but is the law of ournature. Like the members of our body, you cannothave strength in the hands and the feet if yourinternal organs are in disorder; what applies to thehuman body holds good of the collective humanity,we call the society or state. It is a mistaken viewwhich divorces considerations, political from socialand economic and no man can be said to realise hisduty in one aspect who neglects his duties in theother directions.’
The World Human Development Report 2000has brought out another very important fact to ournotice. It says, ‘The link between economic pros-perity and human development is neither automaticnor obvious. Two countries with similar income canhave very different HDI values; countries with simi-lar HDI values can have very different incomes.’This underlines the need to view development as anoverall development of human society.
HDRs by UNDP have emerged as the principaladvocacy platform for sustainable human develop-ment. The need however, is to translate advocacy intoaction plans. It is therefore the process and change in
Preface i

mindsets that is critical for successful action based onthe State HRD. Change in mindsets of policy makersand of those who are entrusted with the all-importantresponsibility of implementing the policies. Goodeconomics has become imperative for good politicsin the new global context, as also on the basis of ourown past experiences in development planning.
Maharashtra is widely acclaimed as a progressiveand developed State. The progress that the State hasachieved in different sectors since its inception on1 May 1960 is laudable. However, much remainsto be achieved. Government will have to play aproactive role in social investments such as drinkingwater, health, education, employment generationetc. Such investments would be expected to ensurethat all sections of society benefit equally from thegrowth of economy. A host of policy initiatives have
been taken and efforts are being made to redressregional inequalities as well as the backwardness ofspecific areas. However, there has to be a frameworkof analysis for determining the impact of suchpolicies aimed at redressing inequalities and theirimplications for the key indicators of social devel-opment. It is in this perspective that a State HumanDevelopment Report acquires considerable signifi-cance as an important policy tool for leveraginggreater resources and focussing attention on areascritical to an overall social development.
With valuable assistance from the PlanningCommission and under guidance of the UNDP, wehave been able to come out with a comprehensivestatus-report-cum-policy document which wouldenable us to herald a new era of overall humandevelopment in the State.
DR RATNAKAR MAHAJAN, Executive Chairman, State Planning Board, Maharashtra
ii Human Development Report Maharashtra 2002
Prologue
The UNDP initiative of ranking countrieson the basis of their human developmentindices has been accepted universally as an
effective method to bring into focus deficiencies inhealth, education and access to other essential facil-ities for a good living. From a simple measure of percapita income as indicator of development, we havemoved into a much more holistic concept of ‘wellbeing’ of the population. Preparation of state levelHuman Development Reports (HDRs) has alsobeen gaining ground in India. States like MadhyaPradesh, Karnataka, Sikkim and Rajasthan havecome out with their State Human DevelopmentReports, trying to emulate the methodology pro-pounded by UNDP
Various measures of well being of the populationdisaggregated at the district level are found to beextremely useful to catalyse adoption of appropriatemeasures by Government and other agencies. We,in Maharashtra, also felt the need to undertake suchan effort to obtain valuable information and analysisde-segregated at the district level, which can beusefully utilised by all concerned. This idea wasconceived in February 2001 and within a reasonableperiod of about one year and two months it hasbeen possible to come out with this MaharashtraHuman Development Report 2002.
This effort could not have been at a moreappropriate juncture, this year being the launchingyear of the Tenth Five-Year Plan. Maharashtra hasmany creditable achievements and is either theleader or among the leaders in many indices ofdevelopment. But certain disparities or stark realitiesreflect very adversely on these developmentalachievements of the State. Human development, asa measure of well being of the population, seems tobe eluding a large section of our population. Thehuge slum population with a falling quality of life,the great disparity in the levels of income amongvarious parts of the State, the unabated population
growth, the growing adverse sex ratio, the big dif-ference in the nutrition status—all call for seriousintrospection. For ensuring a happy and stablepopulation and a stable social fabric, reorientationand reprioritisation of the policies and programmesand the deployment of the State’s resources is abso-lutely necessary. This Human Development Reportis an effort to provide in-depth analysis of the stateof affairs in various aspects of the human welfare invarious regions and districts of the State.
It is important that the Human DevelopmentReport so prepared must not be perceived only as aGovernment document, giving a catalogue ofachievements and schemes and programmes of theGovernment departments. It has to rise above suchloyalties and should be able to look at facts as theyare, dispassionately, often critically, so that the re-port so prepared can enable the reader to be able toperceive the truth. In this regard, though the Plan-ning Department of the Government of Ma-harashtra has coordinated this effort andGovernment of Maharashtra fully owns this Report,it has been meticulously ensured that free and frankopinion, unhindered by any constraints are ex-pressed in its various Chapters. It has been ensuredthat professional and technical considerations getthe importance they deserve. Therefore, in manyplaces in this report, opinions and views have beenexpressed which may sound critical of the Govern-ment’s policies and programmes, but that is what itought to be.
The preparation of this Report was first conceivedby the Executive Chairman of the State PlanningBoard, Dr Ratnakar Mahajan, whose leadership tothis exercise was critical. The State Government re-ceived unstinted technical advice and financial sup-port from UNDP and financial assistance from thePlanning Commission of the Government of India.A tripartite MoU was signed on 12 April 2001,among Planning Commission, UNDP and the
Prologue iii

Government of Maharashtra which lay down theirrespective roles and responsibilities in the preparationof the MHDR. The MHDR is, therefore, the resultof the cumulative efforts of the UNDP, PlanningCommission, Government of India and the agenciesof the State Government.
It will be appropriate to briefly narrate theprocess which has been followed in the finalisationof this report. At the outset, two workshops at aninterval of about a month were organised for final-ising the contents of the Human DevelopmentReport and the methodology to be adopted for thepurpose. These workshops were attended by theconcerned Secretaries and the Heads of concerneddepartments of the State Government. The reputedinstitutions and individuals who are known to havemade valuable contribution in various aspects ofhuman development and representatives of UNDPand Planning Commission, Government of Indiaalso participated. These workshops helped in final-ising the framework of the HDR. These workshopsalso helped identify the resource persons who couldbe approached for contributing to this report. Forcoordinating and advising the Government in final-ising the various aspects of this Report, an AdvisoryCommittee was appointed under the Chairmanshipof Executive Chairman of the State Planning Boardwith eminent persons like Dr BhalachandraMungekar, Vice-Chancellor of Mumbai University,Dr Rupa Shah, Vice-Chancellor, SNDT University,Mumbai, Dr Anil Kakodkar, Chairman of theAtomic Energy Commission, Professor R.R. Singh,Director, Tata Institute of Social Sciences, Mumbai,Shri T.K. Roy, Director, International Institute forPopulation Sciences, Mumbai, as members. In ad-dition, all the Secretaries of the concerned Depart-ments and the Heads of the departments ofI.C.D.S., Women and Child Welfare, Primary Edu-cation and Health Services, were associated. ShriB.M. Nagrale, the Director, Economics and Statis-tics, Maharashtra, as well as the Regional CensusDirector, Shri Sameer Biswas, were closely associ-ated with the Advisory Committee.
In order to give statistical support to the ResourcePersons, a team of officers from the Directorate of
Economics & Statistics, Maharashtra under the lead-ership of Shri D.R. Bhosale. Additional Director, wasset up. This team consisted of Smt. A.D. Deo, ShriS.G. Jagtap, all Joint Directors and Shri D.G. Sute,Shri J.V. Chaudhary, Deputy Directors, and Shri K.S.Jagtap, Senior Research Officer. The latest informa-tion, including from the Census, was made availableto the Resource Persons by the members of this Cellwho also took pains to prepare appropriate tables,charts and graphs required by the Resource Persons.The Director of Census Operations gave great helpin making available the latest information from thecensus to make the HDR relevant to the currentsituation.
The Resource Persons prepared various back-ground papers, and workshops were organised inthe presence of the members of the Advisory Com-mittee where each of them made presentations oftheir papers and these were thoroughly discussed.The heads of Government Departments who werepresent in the workshops checked the facts andinformation and gave their views which were dulynoted by the Resource Persons. The papers so final-ised were subsequently made use of for the prepa-ration of the current HDR.
It was realised that the papers contributed bythe Resource Persons reflected the perspective, thestyle and the conviction of the authors, and werecomplete treatises by themselves. It was necessary toweave them together into an integrated reportavoiding overlapping, bringing continuity and put-ting the matters in a uniform style. This job hasbeen competently performed by Shri Mahesh Vi-japurkar, Bureau Chief and Deputy Editor of TheHindu based in Mumbai, who has helped ensurethat the essentials of the papers written by theResource Persons are maintained, the integrity ofanalysis is sound and the basic focus is sustained.Shri Vijapurkar has also consulted Resource Personsinformally wherever needed and has given the finalChapters a reader-friendly appearance. The Chap-ters written have been also vetted by the respectivedepartments of the State Government to ensure thatthe facts are put correctly and that the views ex-pressed are not at variance with the reality of the
iv Human Development Report Maharashtra 2002

situation. And finally, we had the assistance of aPress Coordinator to help in various aspects ofpublication—Shri K. Vijayakumar from the Eco-nomic and Political Weekly (EPW). He has beenextremely useful in tying up loose ends and coordi-nating with the press. He has also used his experi-ence of work in the EPW to rectify minordeficiencies here and there. We are indeed fortunatethat Shri Prakash Akolkar, Senior Assistant Editor,Maharashtra Times has undertaken the Marathitranslation of the Report.
It is also necessary to acknowledge the creativework in the designing of the Report of MaharashtraHuman Development 2002 from the Directorateof Information & Public Relations. We wish tothank Ms Seema Ranalkar, Deputy Director andMs Mrinalini Pitale for their design inputs. We alsoappreciate the efforts of Shri R.S. Kulkarni, whohas now retired from service, and Shri R.S. Par-chake, Officer on Special Duty in the PlanningDepartment, who has taken great pains to helporganise the review meetings and logistics of theReport’s preparation since the very beginning. It isalso necessary to put on record the hard work doneby Shri U.S. Sonawane, Manager, GovernmentCentral Press and his team in insuring the excellentquality of the publication.
The Planning Commission, Government of In-dia, has supported the preparation of the Report.We acknowledge with thanks the advice and en-couragement of Dr Rohini Nayyar, Adviser (Rural
Development), and Mr B.N. Nanda. Dr Nayyaralso provided substantive inputs at the design stageand in successive peer review meetings.
Under the leadership of Dr Brenda McSweeney,Resident Representative of the India Country Of-fice, UNDP has not only been the inspiration forlaunching this project but it has actually helped usin great many ways in the process of preparation.In this regard, the contributions from Professor K.Seeta Prabhu, Head, HDRC and Dr Suraj Kumar,Programme Adviser, UNDP, need to be gratefullyacknowledged. They have participated and guidedin all our deliberations, in going through the draftChapters and making appropriate suggestions in thefinal design of the Report. But for the guidance andhelp from both of them and members of the HDRCteary (Ms Aparna Pande, Trishna Satpathy and ShriV. Srinivasan), it would not have beer, possible tocome out with this Report in such a short time.
This Human Development Report, therefore, isthe culmination of the team effort of Governmentofficials, of experts and of a large number of otherdignitaries. It is a report of Government of Ma-harashtra. But in a sense, it is unique, that it doesnot reflect the opinion and views of the Governmentof Maharashtra alone. Rather, many of the critiquesare directed towards itself. We hope that all con-cerned will look at this Report in that constructivespirit and will help in bringing into sharper focusthe need for change in the policy paradigm to usherin a more humane and egalitarian society.
A SOKE BASAK
Ex-Principal Secretary, Planning Department and presently Additional Chief Secretary, Home Department
Prologue v

Contents
Title PageCopyright PageMessages – Chief Minister
– Minister for Finance and Planning– Member, Planning Commission– UNDP Resident Representative and UN Resident Coordinator
Preface iPrologue iiiList of Contributors viList of Boxes viiiList of Tables viiiList of Figures x
CHAPTER I: Human Development: Concept and Measurement 1
CHAPTER II: Rich Heritage: A Guide to the Future 7
CHAPTER III: Population: Trends and Prospects 11
CHAPTER IV: Economic Development: Growth and Equity 33
CHAPTER V: Health and Nutrition 53
CHAPTER VI: Education 79
CHAPTER VII: Gender Issues 105
CHAPTER VIII: Growth and Human Development 129
CHAPTER IX: The Way Forward 137
Glossary 143
Annexures 145–1491. District Domestic Product 1452. National Sample Survey Data on Consumer Expenditure 1473. Expert Group Methodology on Poverty Line 1474. Methodology for the Construction of the HDI 1485. Methodology for the Construction of Achievement Indices in Education 1496. Methodology for the Construction of Achievement Indices in Health 149
Annexure Tables: Index 1. Key Indicators: Table 1 151–1542. Population: Tables 2–12 155–1663. Economic Growth and Poverty: Tables 13–27A 167–1844. Health and Nutrition: Tables 28–53 185–2165. Education: Tables 54–89 217–2556. Gender Issues: Tables 90–108 256–2787. Human Development Indicators: Tables 109–117 279–287
References 289
Front Cover
Back Cover
Contents vii

List of Boxes3.1 Fertility Rates: Rural vs Urban 133.2 The New Population Policy 153.3 A Huge Urban Sprawl 223.4 Mumbai Metropolis—Shifting Populations 234.1 Informal Sector and Employment in Maharashtra 334.2 The Landless Farmer and EGS 344.3 Participatory Irrigation Management: Pani Panchayats in Maharashtra 374.4 Sectoral Composition and District Incomes 384.5 Tackling the Developmental Backlog in Maharashtra 414.6 How Does EGS Work? 454.7 Energy Intake and Undernutrition 505.1 HIV/AIDS and Human Development in Maharashtra 615.2 Assessment of Healthcare Facilities in Public Sector 695.3 Private Healthcare—Evidence through Utilisation Studies 705.4 Whys of Private and Public Investment 715.5 Accreditation initiative in Mumbai 725.6 Decentralisation of Primary Healthcare 735.7 The People’s Health Campaign in Maharashtra and improvement in Health Services 756.1 Private Efforts 806.2 State Education Policy and Programmes 856.3 Night Schools For Day Workers 866.4 Education of Children With Disabilities 1017.1 To Protect the Vulnerable 1077.2 Data Inadequacies 1087.3 Son Preference 1107.4 Single Women and Deprivation 1117.5 Trafficking in Women 1117.6 Helping Victims of Violence 1137.7 Child Marriage and Teen Pregnancy 1147.8 Female Headed Households 1177.9 Rule by Proxy 1237.10 ‘Our Vote . . . ’ 124
List of Tables1.1 Maharashtra in a Comparative Framework 43.1 Contribution of Net Migration to Population Growth in Maharashtra 133.2 Population Growth and Density in Maharashtra, 1961–2001 143.3 Mortality Transition in Maharashtra 163.4 Phases of Fertility Transition in Maharashtra 163.5 Age Specific and Total Fertility Rates and Crude Birth Rates from NFHS-1, NFHS-2, and the
SRS by residence 173.6 Vital Rates: Comparison of Maharashtra with Select States 183.7 Comparison of Maharashtra with Select States—Factors Leading to Fertility Decline 193.8 Level of Urbanisation in Maharashtra 213.9 Population, Annual Rates of Growth, Components of Growth of Greater Mumbai, 1951–91 223.10 Population Growth of Divisions 243.11 Division-wise Rural–Urban Growth of Population, Maharashtra, 1991, 2001 273.12 Slum and Non-Slum Population of Ten Cities/Towns in Maharashtra 29
viii Human Development Report Maharashtra 2002

3.13 Utilisation of Health Services and its impact on Fertility and Mortality 294.1 Sectoral (%) Distribution of Workers: Maharashtra 354.2 Unemployment Rate (%) (Daily Status): Maharashtra and All-India 394.3 Relative Sectoral Product per Worker: Maharashtra 394.4 Average Consumption, Inequality and Poverty across Districts: Maharashtra (1993/94) 515.1 Prevalence of Ailments and Hospitalisation by MPCE Fractile Group and Social Group,
Maharashtra 1995–96 555.2 Percentage Distribution of Deaths by Major Cause Groups in Rural Maharashtra
(excluding Senility) 1981–94 565.3 Incidence of Undernutrition of Children (below two years of age) 575.4 Prevalence of Selected Diseases in Maharashtra 595.5 HIV/AIDS Status in Maharashtra Indicators, August 1986 to October 2000 625.6 District-wise number of AIDS cases reported and deaths reported in Maharashtra,
August 1986 to February 2001 625.7 Percentage of Households having Drinking Water and Sanitation Facilities in Maharashtra 635.8 Percentage of Households having Water Supply and Sanitation Facilities, Maharashtra 635.9 Differentials in Level of Key Indicators of RCH by selected Background Characteristics, 1998–99 645.10 Percentage Receiving selected Antenatal Care Services 655.11 Number of Hospitals, Beds and Dispensaries per lakh population across States and by Rural
and Urban Areas 675.12 Availability of Medical Care Facilities in Maharashtra 675.13 Average Population Covered by PHC, CHC and Sub-Centre 685.14 Healthcare humanpower availability in Rural Areas of Maharashtra as on 30–6–1998 685.15 Availability of at least 60 per cent of critical inputs in District Hospitals, First Stage Referral
Units and Community Health Centres, Maharashtra, 1999–2000 685.16 Healthcare Facilities in Mumbai, Rural and Urban Maharashtra by Public and Private Sector 695.17 Utilisation of Public and Private Facilities in Rural and Urban Maharashtra 705.18 Per cent of users of Public Health Facilities in Maharashtra 715.19 Public Expenditure on Healthcare in Maharashtra 725.20 Percentage distribution of Medical Expenditure in Public Healthcare Sector by selected
Line Items in Maharashtra, 2000–2001 735.21 Expenditure on Malaria Control Programme by Line Items (in percentage), Maharashtra 745.22 Expenditure on Leprosy Control Programme by Line Items (in percentage), Maharashtra 745.23 Expenditure on National Tuberculosis Control Programme by Line Items (in percentage),
Maharashtra 745.24 Average out-of-pocket Medical Expenditure on Treatment of an Ailment in Outpatient
Care and Inpatient Care Units, 1986–87 and 1995–96 746.1 Resource Allocations: Maharashtra and Some Major States, 1997–98 826.1A Actual Expenditure on Education 826.2 Growth of Schools and Colleges in Maharashtra, 1960–1998 826.3 Growth of Schools, Teachers and Students: Ratios over Time 836.4 Participation of Girls in Different Levels of Education 876.5 Dropout Rates by Standard in Maharashtra, 1998–99 886.6 Primary and Secondary Schools by Management Type, Maharashtra 1998–99 896.7 Trends in Male and Female Literacy Levels, Maharashtra 1951–2001 (per cent) 896.8 District-wise Literacy and Rates: 2001 916.9 District-wise Gender Dimensions in Educational Attainment: 2001 926.10 District-wise Literacy Rates for Rural and Urban: 2001 (per cent) 936.11 Years of Schooling, Maharashtra and Other States 946.12 Percentage of Students Passing Board Exams in Maharashtra 95
Contents ix

6.13 Percentage of Educational Attainments of Workers in Agriculture in Maharashtra 966.14 Government of India and State Share of Resources for DPEP Project 986.15 Literacy Percentage: Rural Areas/DPEP 996.16 Estimates of Enrolment and Out of School Children DPEP Nine Projects Districts 1999–2000 997.1 Age-Specific Mortality Rates for Maharashtra–1996 1107.2 Number of Women Engaged in Household Duties 1167.3 Proportion of Women Engaged in Domestic Work, in Maharashtra—1999–2000 1178.1 Human Development Indicators—Education 1308.2 Human Development Index and Per Capita District Domestic Product 1318.3 Achievement and Improvement Indices for Literacy (1991–2001) 1338.4 Achievement and Improvement Indices for IMR (1981–1991) 135
List of Figures3.1 Desire for No Children and use of Contraception among Couples with Two Living Children 203.2 Percentage Urban Population in Maharashtra, by Divisions, 1991, 2001 213.3 Decadal Growth of Rural and Urban Population in Maharashtra by Divisions, 1991–2001 274.1 State Domestic Product: Re 21,22,160 million (1999–2000) 354.2 Comparison of Irrigation and Productivity over Four Decades 364.3 Comparison of Irrigation and Productivity of Land 374.4 Per Capita District Domestic Product: 1998–99 404.5 Labour Attendance under the EGS: 1975–2001 474.6 Incidence of Poverty across Districts: Maharashtra (1993–94) 494.7 Incidence of Urban Poverty: Maharashtra and All-India 494.8 Incidence of Poverty (Rural and Urban Combined): Maharashtra and All-India 495.1 Trends in Infant Mortality, Maharashtra 1971–1999 545.2 Trends in Life Expectancy at Birth, Maharashtra 1970–97 545.3 Rural-Urban Differentials in Infant Mortality Indicators: Maharashtra 1997 545.4 Adequacy of Calorie Intake in Maharashtra 565.5 Percentage of Eligible Women/Children Enrolled and Benefited under the ICD Scheme in
Maharashtra State (March 2001) 585.6 Prevalence of Tuberculosis, Maharashtra: 1992–93 and 1998–99 595.7 Growth of Health Care Facilities, Maharashtra, 1961–1995 665.7A Health Facilities in Public and Private Sector, Maharashtra 675.8 Population Served Per Hospital Bed, Maharashtra, 1961–1995 716.1 Growth of Primary and Secondary Schools: Maharashtra, 1960–1998 816.2 Main Activity of Children (Age 11–14): Percentage of Total Child Population Percentages
of Total Child Population Census Data 876.3 Dropout Rates of Different Stages, 1998–99 886.4 Percentage of Students who pass Board Exams: Maharashtra, 1998–1999 946.5 Educational Attainments: Workers in Agriculture: Maharashtra NSS 55th Round 966.6 Educational Attainments: Social Groups NSS 55th Round, Maharashtra 977.1 Missing Women 1097.2 District-wise Gaps in Male/Female (M–F %) Literacy Rate Maharashtra, 2001 120
x Human Development Report Maharashtra 2002

List of Contributors of Background Papers
Name, address, tel/fax number of the Resource Person/Institution Name of the Paper Contributed1. Dr M. H. Suryanarayana,
Professor, Indira Gandhi Institute of Development Research,Gen. Vaidya Marg, Goregaon (East), Mumbai 400065.
Tel. No. 022-8400919 (Off) 022-8490757 (Res)Fax No. 022-8402752/8402026e-mail: [email protected]
Growth & Poverty Reduction inMaharashtra: Constraints, Policy Options &Developments
2. Dr Ravi Duggal,Senior Scientist & Coordinator,CEHAT (Centre for Enquiry into Health & Allied Themes),B.M.C. Maternity Home, 2nd floor,135, A. E. Military Road, Next to Lokdarshan,Marol, Andheri (West), Mumbai 400059.
Tel. No. 022-8519420 Fax No. 022-8505255e-mail : [email protected]
Health & Nutrition in Maharashtra
3. Dr Sangita Kamdar,Research Associate, Department of Economics,University of Mumbai,Kalina, Santacruz (East), Mumbai 400098.
Tel. No. 022-6528198 / 6942 (Off) 022-3869035 (Res)Fax No. 022-6528198e-mail: [email protected]
Economic Development & Its Relationwith Human Development across Districtsin Maharashtra
4. Prof. Sumati Kulkarni,Head, Department of Development Studies,International Institute for Population Sciences,Govandi Station Road, Deonar, Mumbai 400088.
Tel. No. 022-5587516/5564883 Fax No. 022-5563257e-mail: [email protected]
Population: Trends and Prospects
5. Dr Rukmini Banerji,PRATHAM, Mumbai Education Initiative,Y.B. Chavan Centre, Nariman Point, Mumbai 400021.
Tel. No. 022-3851405 / 1423e-mail: [email protected]
Education
6. Dr (Mrs) Usha Bane,PRATHAM, Mumbai Education Initiative,Y.B. Chavan Centre, Nariman Point, Mumbai 400021.
Tel. No. 022-3851405 / 1423e-mail: [email protected]
Civil Society Movements, Social Justice &Local Governance in Maharashtra
7. Dr Divya Pandey,Consultant, Research Centre for Women’s Studies,S.N.D.T. Women’s University, 21, Goutam Darshan,Off J.P. Road, Seven Bunglows, Mumbai 400053.
Tel. No. 022-6604001 / 8493 022-6606648 Ext. 297022-6341822 (Res)
Fax No.: 022-6604001e-mail: [email protected]
Gender Issues
Contents →


CHAPTER I
Human Development: Concept and Measurement
Conceptually, Human Development is thecombination of people’s entitlements andactual attainments in the crucial aspects of
their lives: education, health and livelihoods. Takentogether, these three elements form the everydayexperience of—and even an unremitting strugglefor—‘development’. It is true for all people as indi-viduals and also members of a community, a Stateor the nation. It is, then, the sum of outcomes relat-ing to schooling, health services and quality of life-chances such as life expectancy and nutrition andimportantly, income. This revolves critically aroundaccess and the quality of services available. Withrespect to incomes, it is a question of a secure andadequate and above all, sustainable livelihood andthe quality of consumer choices that flow from it.
Human Development has been defined as the‘process of enlarging people’s choices’. The mostcritical ones are those that enable one to lead a longand healthy life and in the process to be educatedand to enjoy a decent standard of living. Additionalchoices include political freedom, guaranteed hu-man rights and self respect. The key dimensions ofhuman rights include promotion of gender andeconomic equity, social and cultural rights, particu -larly those pertaining to healthcare, food, water,education, environment and culture.
In 1990, the United Nations Development Pro-gramme (UNDP) launched the first Human Devel-opment Report (HDR). It was pioneered byMahbub ul Haq and Amartya Sen. These HDRshave stimulated discussions world-wide leading towhat is now called the ‘human development move-ment’ which includes international and nationalgovernments, policy makers, planners, opinion lead-ers, parliamentarians, media, NGOs and variousmembers of civil society.
HDRs propose composite indices that go be-yond income-based measures. The Human Devel-opment Index (HDI), Gender Development Index(GDI), Gender Empowerment Measure (GEM)and Human Poverty Index (HPI) have been intro-duced in various HDRs since 1990. The method-ology used has been evolved, taking into accountthe need to strike a balance between indicators thatcapture the complexity of human development andavoiding the inclusion of too many indicators thatcould produce a perplexing, picture. However, de-spite the limitations imposed by simple indices andaverages, these composite indices have helped inhighlighting the need to remove human deprivationon a priority basis—a purpose for which the HDIis more suitable than only GDP as a measure.
Human Development Reports: National
and Sub-national
Many countries have brought out their NationalHuman Development Reports (NHDRs) whichhave been instrumental in the shift from advocacyto action. The preparation of NHDRs has contrib-uted to the identification and monitoring of na-tional and sub-national human developmenttargets, the tracking of development gaps and theirimpact on constituent groups, especially the vulner-able. The reports have been effective tools for theformulation of national development strategies andspecific action plans and programmes, includingthose related to poverty reduction and towards moreeffective development assistance.
In India, the preparation of Human Develop-ment Reports has been pioneered at the State level.The process has brought together a wide spectrumof development practitioners from government andcivil society, and has helped States that have engaged
Human Development: Concept and Measurement 1

in the preparation of the State Human Develop-ment Reports (SHDRs) in enhancing allocations tohuman development priority sectors. They havehelped significantly in assessing the impact of vari-ous interventions, evaluating the strengths and in-adequacies and mapping the road ahead.
The motivation behind the decisions of StateGovernments to prepare their HDRs has been thediversity and the complexity of the regions withinas well as the fact that the State Governments havethe mandate for action on Human Developmentsectors as per the Constitution.
The process of preparation of State HDRs canprovide disaggregated data and indicators, enablingpolicy makers to identify more precisely critical re-quirements specific to larger sub-regions with theirdistinct diversities. Thus, SHDRs can help in direct-ing and focusing public investment towards provisionof basic minimum services and strengthening socialcapital, especially in the backward regions.
State Governments have been encouraged by theUnited Nations Development Programme (UNDP)and the Planning Commission of the Governmentof India to embark on the preparation of HDRs.The principles followed by the UNDP and PlanningCommission in their co-operation with the StateGovernments are that:
• The analysis and contents of the HDR should beundertaken by an independent team of experts atthe behest of the State Government.
• The integrity and coherence in the contents ofthe HDRs should have added value to the usersof the HDR.
• There should be a commitment to widespreaddissemination of the HDR and discussion by avariety of methods, including oral and visualmeans of communication.
• The preparation of the HDRs should be cost-ef-fective.
Maharashtra too has now undertaken this exer-cise, concerned as it is at profiling the status of its
people, and using it to chart its future course ofaction.
Maharashtra: A Profile
Maharashtra, located on the west coast abutting theArabian Sea, and carved out as a linguistic entity ofMarathi-speaking people, is the second largest(among India’s 28 major States and 5 Union Territo-ries) in terms of population and the third largest interms of area. As per the Census 2001, its populationis 96.8 million or 9.42 per cent of the Indian popu-lation and is spread over 307,713 square kilometres.
One among the richer States, with a per capitaincome that is 40 per cent higher than the all-Indiaaverage, Maharashtra’s income is derived more fromthe secondary and tertiary sectors. Agriculture has notmade the State self-sufficient in food grains but thetilt towards commercial crops has given rise to avibrant agro-processing industry though mostly lim-ited to sugarcane, to some extent cotton and latelyfruits and vegetables. This focus on sugarcane in turnhas reduced the scope for equity in sharing a preciousresource—water for irrigation.
Maharashtra also has the country’s second larg-est urban population, with about 43 persons out ofevery 100 living in towns and cities. It has a largemigrant population, of which nearly 72 per centspeak Marathi, which is the most widely spokenlanguage. Other prominent languages are Hindi,Urdu and Gujarati.
Positioned between 16° N and 22° N latitudeand 72° E and 80° E longitude, Maharashtra witha 720 km long coastline stretching from Daman inthe north to Goa in the south, is encircled by theStates of Gujarat, Madhya Pradesh, Chhattisgarh,Andhra Pradesh and Karnataka (refer Map). It fallsin the resource development zone called the WesternPlateau and Hill Regions, one of the 15 such zonesinto which India is divided on the basis of theagro-climatic features.
Maharashtra’s topography is diverse. It is classifiedinto five broad regional groups, historically evolved
2 Human Development Report Maharashtra 2002

as socio-cultural units—Greater Mumbai, WesternMaharashtra, Marathwada, Konkan and Vidarbha,Mumbai being the country’s prime metropolis. Theseregions are divided into six revenue divisions foradministrative purposes. Each division has its head-quarters at Navi Mumbai, Nashik, Pune, Auran-gabad, Nagpur and Amravati respectively. The 35districts are divided amongst these divisions.
Konkan division consists of Mumbai, Thane,Raigad, Ratnagiri and Sindhudurg districts on thecoast where landholdings are small but more or lessevenly distributed, and has no irrigation facilitiesworth mentioning. Nashik, Dhule, Nandurbar, Jal-gaon and Ahmednagar districts with a large tribalpopulation, with large landholdings, high level oflandlessness, forests, a few fertile tracts and goodrainfall comprise the Nashik divi-sion. Pune, Sangli,Satara, Kolhapur, and Sholapur districts constitutethe Pune division, and have relatively lower rainfallbeing in the narrow rain shadow area though itssmaller landholdings are served by canals and wells.
The Nashik and Pune divisions being contiguous,mesh into what is popularly known as WesternMaharashtra,
Marathwada’s Aurangabad, Jalna, Parbhani,Hingoli, Nanded, Osmanabad, Beed and Laturtogether form the Aurangabad division and areculturally well tied, all of them being from theerstwhile State of Hyderabad. The region is rockyand dry with low and uncertain rainfall, largelandholdings and some landlessness. One part ofVidarbha, comprising Buldhana, Akola, Amaravati,Washim and Yavatmal is administered by the Ama-ravati division and the rest of the same region,comprising Nagpur, Wardha, Bhandara, Gondiya,Chandrapur and Gadchiroli districts, is assigned toNagpur division. The two divisions of Vidarbhacover part of a plateau with deep black soils, assuredrainfall and medium to large landholdings and highlevels of landlessness. Bhandara, Gondiya, Chan-drapur and Gadchiroli districts have a large tribalpopulation and forest cover.
Human Development: Concept and Measurement 3

The State has an uneven natural resourceendowment. Its soil endowment is poor in quality,being residual and obtained from the underlyingbasalts. Though a beneficiary of the South WestMonsoon, which lasts from July to September, therainfall is varying; it is as high as 2000 mm in theWestern Ghats and some 600 mm in the plains.
Maharashtra’s net sown area is around17,732,000 hectares of which only 14.5 per cent isirrigated, of which more than half i.e., 55 per cent,is by wells. This renders agriculture vulnerable todroughts, a fact borne out by the periodic fluctua-tions in farm output, which in a normal year pro-duces only about 90 per cent of the State’s foodgrain requirements. The rural economy is not diver-sified, though the mineral base is abundant—coal,manganese, iron ore and tin being some of theimportant minerals. The mineral belt stretchesacross Chandrapur, Gadchiroli, Bhandara and Nag-pur districts. Ilmenite is found in Ratnagiri district.
Mumbai, Maharashtra’s capital city was once theicon of industrialisation in the country. With thedecline of manufacturing, it is now instead theprincipal financial centre and a major commercialhub of the country. A maritime state, Maharashtrahas five districts along the coast with two major
ports, Mumbai and Nhava Sheva; the first is in thecity of Mumbai and the other across the harbour inRaigad district.
An inter-State comparison of key indicatorsacross some major States reveals that Maharashtra’shigh income level has not been matched by its attain-ments in social development (Table 1.1). The Statehas performed better than a few other states but hassome distance to cover before it catches up with theothers. However, this Report is a measure of Maha-rashtra’s own status and it would expectedly marchforward according to its own genius, using its richexperience and expectations.
The development trajectory of Maharashtra, itsendowments and constraints, including high urbanprimacy, large scale in-migration and persistence ofpoverty, uneven development and spread of socialand economic gains, has been documented in thisReport. Human development, in addition to im-proving human welfare directly, is an excellentinvestment in terms of the contribution it can maketo economic growth. For this, the pattern of eco-nomic growth is important in that it has an impacton distribution of incomes. Reduction in incomepoverty and redistribution of physical assets helpin improving productive capabilities of the poor,
Table 1.1
Maharashtra in a Comparative Framework
No. State
Life expectancy at birth 1996–2000Percentage of
population belowpoverty line (30
day recall period)
1999–2000 Percapita Net State
Domestic Product(Rs – current
prices)
1998–99Literacy Rate
(per cent) 2001Female Male
1 Maharashtra 68.19 65.31 25.02 22763 77.27
2 Karnataka 63.36 61.73 20.04 14909 67.04
3 Punjab 71.40 68.39 6.10 20463 69.95
4 Gujarat 62.77 61.53 14.07 18792 69.97
5 Madhya Pradesh 57.21 56.83 37.43 10507 64.11
6 Goa n.a. n.a. 4.40 n.a. 82.32
7 Tamil Nadu 67.58 65.21 21.12 17349 73.40
8 All India 63.39 62.36 26.10 15562 65.38
Sources: (1) Government of India, 2001; (2) RGI, 2001.
4 Human Development Report Maharashtra 2002

enhance their ability to access basic services andparticipate as empowered citizens.
In short, economic growth by itself, thoughnecessary, is not a sufficient condition for humandevelopment attainment. Despite its higher level ofeconomic growth and being one of the higher-income States with growth rates that exceed that ofseveral States, in terms of Human DevelopmentIndex (HDI) Maharashtra was ranked third among17 States in 1991 with a HDI value of 0.532.
Maharashtra Human Development Report:
Purpose and Focus
Existing levels of human deprivation in Maharashtraneed to be seen both as a challenge and an opportu-nity for focused action by the Government to elimi-nate them. It is important to note that the humandevelopment approach offers a comprehensive frame-work that goes beyond a mere sectoral and/or depart-mental mode of action.
The Maharashtra HDR attempts to assess andexplain the status of human development in the
State and helps articulate policy implications. Con-forming to the dimensions of human development,issues related to population, poverty, education,health and nutrition and gender have been analysedin separate chapters. Gender and people’s participa-tion issues have also been considered as crosscuttingthemes. It may be noted that this Report is anoverview intended to galvanise public debate. Assuch it does not claim to offer a comprehensiveanalysis of issues such as urban poverty, informalsector livelihoods, forestry and environment, etc.,which could be covered in subsequent documents.
In the Report, analysis moves from the State tothe district level, highlighting issues related to datagaps, data comparability and availability The struc-ture of the Report has evolved considering mainquestions raised in a consultative dialogue withvarious partners, taking into account the concernsof the people of Maharashtra.
This document is expected to promote deeperunderstanding of the challenges and opportunitiesfor human development action and sustainability ofthe challenges that have been met since the forma-tion of the State of Maharashtra.
Chapter II →
Human Development: Concept and Measurement 5


CHAPTER II
Rich Heritage: A Guide to the Future
Maharashtra is not a mere geographic ex-pression or just faceless numbers, but anentity built out of centuries of collective
effort of its people, backed by a culture and ethosthat is distinctly its own. Maharashtra has its ownspiritual dimension, having spawned saint afterthinking saint, some of them like Sant Dnyaneshwarwho walked the land some 700 years ago. Therehave been landmarks like the rebellion against re-strictive social norms by Mahatma Jyotiba Phule,who opened the doors of development and socialjustice to the disadvantaged masses in the middle ofthe 19th century which, in turn helped shape thelater mass movements towards equity.
Maharashtra’s political identity was establishedwith the emergence of Chhatrapati Shivaji, whoorganised the people both politically and militarily.The saints of that time, while offering their spiritualcontribution, helped the cultural awakening of theregion as well; they preached common wisdom aswell as helped spread nationalism. That was the timewhen building of a new administrative system en-ergised the people. It was not for nothing thatShivaji was called the jaanataa raja, a ‘knowingking’. After all, he added value to the lives of thepeople.
Pro-People Concerns
In 1676, two years after his coronation, a letter fromthe Chhatrapati to the Subedar of Prabhavali hadsaid:
Go from village to village. Conduct meetings withfarmers and take stock of the prevailing situation.Determine whether farmers have the capabilityand the human resources for cultivation of land.Those who have the capability and the manpower
but do not have the necessary agricultural imple-ments, bulls, or do not have adequate food grainsfor sustenance can be provided with funds to pur-chase 2–3 bulls and a few sacks of grain. Once thefarmers attain a certain level of self-sufficiency, theprincipal amount of funds given to them can begradually recovered. In this effort, even if 2,00,000laris (Rs 40,000 today) are spent, as long aswasteland is brought under cultivation, taxes in-creased and farmers made self-sufficient, such ex-penditure is acceptable to us.
The Subedar was not to remain at his seat ofpower but travel to villages, keep in touch with thepeople and give instructions for the benefit of theState.
The letter to the Subedar of Prabhavali helpeddesign a win-win strategy for both the State and thepeople. Foregoing loans, former wastelands werebrought under the plough, farmers earned theirlivelihood and the State obtained its revenue after agap of time—investment in the future by the wiseruler. Welfare was the cornerstone of the principlesthat guided the Chhatrapati’s approach to the peo-ple. His intent and purpose was to create a neworder, sensitive to the needs of the common people.Latter day social reformers and political leadersdrank at the fountain of his wisdom.
Social Justice and Equity
It is from this sense of social justice and equity, whichcontinues to underscore the intent of the policymakers in Maharashtra even today, that the landreforms became a common slogan leading to thefine-tuning of tenancy laws between 1957 and 1965.Watandari system was abolished. This could havehappened only in Maharashtra, which by March
Rich Heritage: A Guide to the Future 7
2000 saw 1.49 million tenant-farmers getting own-ership in respect of 1.73 million hectares of land. Thenext step was the ceiling on agricultural holdings inJanuary 1962, the ceilings being revised and loweredin 1975, with surplus lands to the extent of 0.26million hectares being allotted to 0.14 million lan-dless persons, all of which led to an increase in thenumber of holdings. The development of these landsattracted help from the State so that the neo-ownerdid not suffer a handicap.
The link with history is clear, especially when onesees other States following with their own laws,converting their slogans into positive conclusions.Not surprisingly, Maharashtra recorded more than 10per cent of the total achievements in India in man-aging surplus lands. Subsequent political and socialleaders were inspired by Shivaji’s approach, which wasone of humane development. The vision was that ofa society in which the status of women was valuedand the welfare of the poor, regardless of caste andreligion, had to be given priority.
Building Social Capital
Maharashtra extracted much from the period com-mencing from the entry of the British into Indiaand the impact on the emerging political thinkingand social reforms of that time. The learning expe-rience was not confined to the spheres of politicsand social justice but also in the field of industry.Seen in the context of current phases of globalisa-tion, this was a new phase of building social capitalin Maharashtra.
A modern civil society—organised citizens ex-panding the limits of freedom against the existingsocial norms and State laws—emerged to see twodistinct streams of activity stimulated by Britishrule. Pune, the erstwhile seat of Peshwa power, waswitness to the emergence of an organised politicalthought opposed to British rule. It also saw socialreform movements take shape and grow. National-ism and social reform developed parallel to eachother, rarely converging and co-operating and oftencritical of one another. Maharashtra benefited fromboth.
Activism
It was not accidental that most social and politicalactivists began their work by opening schools, startingfrom one for girls—the first of its kind in the country—established in 1848, signifying that formal educa-tion and support to women was the foundation ofsocial change. These initiatives inspired even princelyStates of those times to absorb in their domain suchradical ideas into policy. As far back as in 1902,Kolhapur State reserved 50 per cent of all jobs forthe backward classes and gave unhindered entry to‘untouchables’ into schools. Notes by reformers ofthose times on effective running of schools could wellbe models for today.
When Mumbai became the industrial hub ofthe country, indigenous entrepreneurship rose inWestern Maharashtra at the start of the 20th cen-tury: the first iron plough was produced. The firstrailway in India ran in what is today Maha-rashtra.The first textile mill too was built in Mumbai in1874. Later, industrial activity gained in the hinter-land, with even smaller princes providing patronageand support. Organised industry grew, mostly inand around larger urban areas, generating a largeworking class that later affected the course of socialand political movements, including the birth oftrade unions. Industrial workers were gripped by anew, larger consciousness beyond the immediate tobecome an integral part of the Indian Independencemovement. They created a new stream of activistswho were sensitive to class issues in addition to thecaste issues of social and economic justice
If grassroots activism sustained movements, othercivil society contributions came from a host of writerswho dealt with social and political issues. Marathitheatre also took its cue, using mythological storiesto communicate anti-British messages. The strong,reformist movement shaped many a leader who latercame under Mahatma Gandhi’s sway and played atremendous role in shaping politics which was givena constructive social justice orientation. This plat-form, enriched by the freedom movement, helpedbuild Maharashtra’s vision of all-round development.The subsequent Samyukta Maharashtra Movement,
8 Human Development Report Maharashtra 2002

which successfully saw the bringing together of allMarathi speaking people living in contiguous areasinto Maharashtra State, was a realisation of the fer-vent articulation of the literary people. It took justthree turbulent years to acquire a full political dimen-sion. The movement reached remote villages throughpolitical, social and cultural channels and did notlimit itself to formation of a linguistic State butrevived the agenda for social and economic justice.One major contribution of that campaign was thecreation of a number of young, educated activistsfrom the peasantry who later came to govern Maha-rashtra at different levels. Some of them remained inthe Opposition, agitating continuously for social andeconomic justice.
If issues of land and water and economic justicehad a strong political content, gender issues some-how stayed in the social domain. However, womenplayed an active role in the Independence move-ment and post-1947 social movements. More re-cently reservation for women in Panchayati Rajinstitutions and Urban Local Bodies has also en-hanced their political participation.
Resource Optimisation
Land and irrigation, however, have been major areasof interest as well as concern for both the State andthe people, both being related to productivity of theland as well as livelihood. Often droughts are thebiggest concern for a State with an over-stretchedagricultural resource base. In this context, Ma-harashtra would have been expected to focus onirrigating its lands rapidly. Even as growth in thissector was slow, civil society was also increasinglyaware. Since 1975, there has been some movementtoward optimising use of irrigation and ensuringequity There have been several experiments thatcaught the imagination of even the Administration,ranging from Pani Panchayats (water co-operatives)concept where everyone has a right to water, to waterconservation to recharge the underground aquifers.People have even built their own dams by capitalisingon the availability of sand in a riverbed and plannedequitable distribution of harvested water, not based
on landholdings individuals but as an entitlementeven for the landless.
There has been no collaboration between theGovernment and Non-Government Organisations(NGOs) on two kinds of projects. In water conser-vation projects where bunds along contours arrestrainwater run-offs to charge village wells, funds havecome from the exchequer and skill and effort fromthe people catalysed by voluntary agencies. Withregard to Water Users’ Associations (surface irriga-tion systems managed by NGOs for equitable dis-tribution amongst the entitled of the canal), theGovernment acknowledged its usefulness and nowas a policy would like all future distribution to bedone by the users themselves.
Grassroots Networking
Co-operatives in Maharashtra are perhaps the bestexample of people’s initiatives and the State’s facilita-tion coming together for the larger common good.In a situation where ambition and finances are mis-matched but the drive exists, co-operatives are acritical aspect of economic decentralisation. Thoughthe British Government adopted the Co-operationAct in 1904, its impact was felt after the formationof Maharashtra when political leadership activelypromoted them and created mechanisms to providecritical financial inputs. Co-operatives are not limitedto the sugar sector, though politically it is the mostrevered and dominant, but encompass dairying, poul-try, fisheries and spinning mills. Co-operative creditinstitutions too began to grow since the 1970s
This movement played a vital role in creatingmajor rural assets, which in turn triggered invest-ments in higher education particularly in the ruralareas. Not just rural credit but agro-processing, agro-marketing, consumer stores influenced life there. Themovement includes co-operative housing, which isthe norm in urban areas, is not only spectacular butunique, its success rooted in traditions of volunteer-ism. Slum-dwellers, who have no legal right to thelands occupied by them, too have moved to formco-operatives in initiatives supported by the State to
Rich Heritage: A Guide to the Future 9

build improved habitation for themselves though thishas had a very limited success. Even a sick industrialunit in Mumbai was taken over by a co-operative ofemployees. Though these two are not phenomenalsuccesses, they certainly have a value in the effortitself. The catalogue of inspiration and deeds can goon but at times, there are moments in the course of
a State’s history when the need arises for stocktakingand a fresh look at the way things are done, or notdone. Assessing the gains made, quantifying theshortfalls, enumerating the difficulties and findingsolutions is a constant challenge. Perhaps one suchmoment to reflect is now, and the MaharashtraHuman Development Report is an attempt in thisdirection.
Chapter III →
← Contents
10 Human Development Report Maharashtra 2002


CHAPTER III
Population: Trends and Prospects
It shocked even urban sensibilities when R.D.Karve, teaching in a Mumbai college, willinglysuffered slights heaped on him by the commu-
nity that considered him a maverick far removedfrom reality. Undaunted by this disapproval, oftenridicule, Karve set up the country’s first birth controlclinic in 1921 in Mumbai, easily the most liberalcity of even those times. He strove to educate peopleon birth control by use of contraceptives as a meansto ensure the welfare of women and children.
He campaigned diligently, having spent his lifeeducating women on issues of birth control, whichto him was a sure path to their emancipation. Hedealt with the issue of sexually transmitted diseasesas well. He did not waver despite stiff oppositionand till recently, his work went unrecognised.Though a non-official legislation supporting a Statepolicy for birth control found support from B.R.Ambedkar, even that was defeated by the view thatbirth control was to be achieved by abstinence andself-control. This issue was to affect Maharashtra fora number of years even after Independence.
Awakened to the emerging realities, the city’sMunicipal Corporation too took a pioneering step,allowing family planning clinics to be set up in twoof its maternity centres. By then, the realisation hadbegun to strengthen that mothers having too manychildren far too frequently, especially during thestart and the middle of their reproductive age wasdetrimental to them and their families’ health. Withthe civic body’s move came perhaps the first officialrecognition and patronage, probably quite well intime, to the striving for smaller families. That theclinics remained largely under-utilised is anotherstory; many a woman did not even believe planninga family was possible at all.
The Government of Maharashtra’s family plan-ning programme was launched ten years after theMunicipal Corporation of Bombay’s path-breakingeffort, to bring the issue of birth control into thelarger public domain. Another decade later, it washanded over to Zilla Parishads (District Councils)guided by the premise that decentralisation wouldaccelerate the pace of implementation. Maternal andChild Health Services were integrated with the familyplanning programme, christening the entire approach‘Family Welfare’. It was characterised, as develop-ments later showed, by massive participation ofwomen who were relatively more willing to acceptthe methods on offer. The participation of men wasrestricted to the fringes, a feature not unique toMaharashtra.
Achievements
Cash awards of Rs 25 million each for family plan-ning achievements were given to the Governmentof Maharashtra for two successive years, 1982–83and 1983–84. It touched a new high in 1990–91:5,25,000 sterilisations against the target of 5,75,000set by the Government of India. This 91 per centrealisation was the highest among the 15 majorStates. In the 25 years since 1967, more than halfthe couples came to be protected by family planningmethods; 10 million sterilisations and about fivemillion insertions of intra-uterine devices (IUDs)were recorded. The subsequent ten years’ effortsculminated in another 5.1 million sterilisations.
During the first twenty-five years of family plan-ning, Maharashtra spent Rs 5,750 million on theFamily Welfare Programme. Expenditure from1993–94 to 1998–1999 was also substantial:Rs 9,024.5 million with an estimated expenditure
Population: Trends and Prospects 11

for 1999–2000 being Rs. 1,707.1 million. For thesubsequent year, the estimate is of Rs. 1,577.7million.
Second Most Populated
Eighty years after Maharishi Karve’s pioneeringwork and subsequent massive public expenditure,the 2001 Census of India put the total populationof Maharashtra at 96,752,247, which is 9.4 per centof India’s population. This makes Maharashtra thesecond most populated state after Uttar Pradeshamong 28 major States. The silver lining, however,is that Maharashtra’s contribution to the total is onlyabout half of UP’s 16.2 per cent. It is also aboutequal to what Bihar provided. In 40 years since itsformation on a linguistic basis, Maharashtra’s popu-lation had increased from 39.6 million to 96.7million, the first three decades actually seeing thepopulation double itself. The fourth decade waswitness to an addition of another 18 million people.This addition is equal to the entire population ofJammu & Kashmir and Uttaranchal. The 40 yearsaccounted for an increment equal to a little morethan Rajasthan’s present population.
The population scenario in Maharashtra is notrosy because of a growth rate that now hovers abovetwo per cent. Government’s efforts at curbing popu-lation by massive spending on programmes havebeen negated by the prevailing social norms thatwould have to be overcome to reduce the populationgrowth rate. As teenage fertility is a vexing issue, thesuccess of population control programmes woulddepend critically upon better governance aspectssuch as effective enforcement of laws pertaining tothe minimum age for marriage.
Troubling Features
The 2001 Census revealed several troubling demo-graphic trends in Maharashtra. The density of popu-lation increased by more than two and half timesfrom 129 persons per sq. km in 1961 to 314 personsin 2001. The 96.8 million size of the population issubstantially more than the 92.9 million projectedby the Population Foundation of India. The Expert
Committee’s projection was much lower at just 91million. Two other grim projections indicate thatMaharashtra may well be host to anything between123.6 million and 127.4 million people in 2021.
Rural-Urban Mix
Being an almost even mix of the rural and urban,one assumption was that Maharashtra would benefitby a combination of industrialisation, higher in-come levels and history of social reform focused onwoman’s uplift and empowerment. The hypothesiswas that it would leave its distinct positive imprinton population trends, that urban values and com-pulsions would bring about a favourable inclinationtowards smaller families. Despite 42.4 per cent ofthe population living in towns and cities, bothgrowing in numbers, size and population densities,this did not happen.
Urbanisation attracted migrants who added thenumbers, especially to that of Mumbai and othermajor cities. Mumbai, Thane and the region aroundurban Nagpur gained in population. Nearly half thepopulation is in these urban areas and Pune division.
Maharashtra could not sustain a decline in fertil-ity; fertility rates alone have the potential to make adifference between what is and what can or shouldbe. Implications of smaller families for the health ofthe entire family, especially women and children, theconsequent possibility of conserving the family’s re-sources to spread it optimally on all children towardstheir education and well-being, seems to have beenignored. In fact, the percentage of couples exposedto specific family planning messages relevant to theiruse or situation—a key, initial input in the battleagainst burgeoning numbers—is far lower for Maha-rashtra in comparison to some other States including,notably, Kerala and Tamil Nadu, though it is betterthan in Andhra Pradesh and West Bengal.
During the Second National Family Health Sur-vey, women’s knowledge regarding different meth-ods of family planning was assessed. It was foundthat 99 per cent of them only generally knew of atleast one modern method of avoiding conception.
12 Human Development Report Maharashtra 2002

Queries on exposure to family planning messageslist if a woman saw or heard a message on familyplanning from specific media like radio, television,cinema, newspaper, wall painting or folk dance etc.However such a message originating from any mediais just one way of getting the relevant information.By and large, people came to know about familyplanning through interpersonal communication orby reading articles, etc., though they may not give aspecific message.
Impact of Migration
Migration to urban areas from other States and fromwithin Maharashtra has left its impact on fertilitysince those from backward regions bring their socialnorms with them. They also seem to bring a pref-erence for sons, early marriages and even teenagemotherhood. Sex-selective migration, with manymigrants leaving behind their families, has a depress-ing effect on fertility but the second stage of migra-tion when earlier migrants bring their families tolive with them changes the situation. Since mostmigrants come from rural areas of particularly lessadvantaged districts within the State or from otherStates, we witness a remarkable ruralisation of theurban areas, weakening the effect of urbaniseddemographic trends. Table 3.1 indicates the magni-tude and trends of migration in Maharashtra, interm of its share in the overall population increase.
For instance, in Dharavi, Asia’s biggest slum—adubious distinction for Mumbai and Maha-rashtra—in the heart of Mumbai, a woman givesbirth to 1.3 more children than an average womanin a non-slum area of the same metropolis. Box 3.1
shows that the trends in slum areas slow downfertility decline. The total fertility rate of 2.69 inthe slums is only slightly lower than the 2.74 re-corded for rural Maharashtra. One third of thebirths to mothers in slums are of a third or a higherorder birth. For the rural population, this percent-age is 43 while for the non-slum population inMumbai it is about 25 per cent.
Rural and urban Maharashtra together did regis-ter a relatively lower decadal population growth be-tween 1991–2001 at 22.6 per cent compared to 25.7per cent in 1981–91. But it is much less than theimpressive gains made in the four southern States ofKerala, Tamil Nadu, Andhra Pradesh and Karnataka,and even Goa; the growth rate of below two per centhas been eluding Maharashtra. It is alarmingly poisedwell above the country’s exponential growth rate of
Table 3.1
Contribution of Net Migration to Population Growth in Maharashtra
Year Annual Exponen-tial Growth Rate
(per cent)
Annual NaturalIncrease Rate(per cent)*
Annual NettMigration Rate
(per cent)Net Migration as
Per Cent of Growth
Estimated NetMigrants Per Year
(million)1981–91 2.29 2.06 0.23 10.0 0.161991–2001 2.04 1.65 0.39 19.1 0.34
* Based on the difference between average Crude Birth Rate (CBR) and Crude Death Rate (CDR) for the two decades (based on the moving averages of CBR and CDR from SRS data from 1981–1999).
Source: Office of the Registrar General, Government of India, Sample Registration System.
Box 3.1Fertility Rates: Rural vs. Urban
Urbanisation has helped check populationgrowth rates. As per NFHS data, urban fertilityis much lower than rural fertility. But in Mumbaidespite 100 per cent urbanisation, it is not as lowas one would expect it to be.
According to NFHS-2, the total fertility rateof rural Maharashtra is 2.74. For urban Maha-rashtra other than Mumbai, it is 2.24, and formetropolitan Mumbai, 2.13. Within Mumbai, itis 2.69 for slum areas; for the non-slum areas itis 1.40, underscoring how fertility in Mumbaihas not declined to the expected level because ofrelatively higher fertility in slum areas whereabout half of Mumbai lives.
Population: Trends and Prospects 13

1.93 per cent, which had declined from 2.14 per centin the previous decade. Female sterilisation and useof IUDs—the predominant birth control method—did not help reduce fertility rates. The net migrationrate too moved up from 10 per cent in 1981–91 to19 per cent during 1991–2001. Table 3.2 indicatesthe steady increase in indicators pertaining to Maha-rashtra’s population size, density and rate of growthbetween 1961–2001.
Infant Mortality and Teenage Fertility
Infant mortality rate (IMR) is also relatively high at48 deaths per 1000 live births—a far cry fromKerala’s IMR of 14. It varies between 58 in the ruraland 31 in urban areas, the gap itself indicative ofthe availability of education, health care and theiraccess to people. Or, seen the other way, the people’sability to access them.
Statistically, a woman in Maharashtra during herproductive span of life gives birth to 2.7 children.Most women complete their childbearing by the timethey are 35. A quarter of the contribution comes fromteenaged mothers, some delivering their first child bythe time they are merely 15. Mothers between theages of 20 and 24 years contribute 40 per cent, whichis the highest for all age groups. This highlights thealarming prevalence of marriages before the legallypermissible age for girls, with all its negative impli-cations of poor health of the mother and the child,resulting even in infant deaths.
High order child bearing, apart from early mar-
riage of girls, also means that there is low use ofspacing methods, late sterilisation, high preference forsons and lower use of antenatal and natal services.Mothers who were illiterate or came from poorerfamilies lost more children during birth and up to fiveyears of the child’s life than those who had at leasthigh school education or had better standards ofliving.
Declining Sex Ratio
A declining sex ratio in the population is alsostrongly suggestive of the neglect of girl childrenand sex selective abortions where available medicalservices are used to realise two goals: a small familyand more importantly, compliance with the persist-ent traditional attitude that favours a son. Not onlyhas this preference for a male child led to a lateracceptance of contraception but also to sex deter-mination tests and eventual foeticide. To combatthis practice, sex determination tests were banned,but the impact of this ban is yet to be assessed. Therelatively better sex ratio in the remote tribal areasis one indicator of a positive bias in favour of girls.
Alarming Status
Alarmed at this demographic status, a Study Groupset up by the State Planning Board in 1992 recom-mended a broad sweep of policy options to curb thepace of population growth. Principally, it soughtnew incentives and simultaneous disincentives toencourage vasectomies and sterilisations after one ortwo children.
Table 3.2
Population Growth and Density in Maharashtra, 1961–2001
YearTotal Popula-tion (million)
Absolute Deca-dal Increase(million)
Per CentDecadalIncrease
Change in Per-centage Decadal
Increase
Density(persons
per km 2 )Increase in
density1961 39.6 – – – 129 –1971 50.4 10.8 27.3 – 164 351981 62.8 12.4 24.6 –2.7 204 401991 78.9 16.1 25.6 +1.0 257 532001 96.8 17.9 22.7 –2.9 314 57
Source: Office of the Registrar General, Government of India, Census of India, 1961, 1971, 1981, 1991, and 2001.
14 Human Development Report Maharashtra 2002

In 2001, the Government of Maharashtra an-nounced its New Population Policy with the goal ofreducing:
• Total Fertility Rate from 2.7 in 1997 to 2.1 in2004 and 1.8 in 2010.
• Crude Birth Rate from 22.5 in 1998 to 18 in 2004and 15 in 2010.
• Crude Death Rate from 7.7 in 1998 to 6.4 in 2004and 5 in 2010.
• Infant Mortality Rate from 49 in 1998 to 25 in2004 and 15 in 2010.
• Neonatal Mortality Rate from 33 in 1996 to 20in 2004 and 10 in 2010.
• Maternal Mortality Rate from 310 in 1998 to 150in 2004 and below in 2016.
These objectives were to be realised by variousspecific interventions linked to acceptance of a smallfamily norm.
In any developing society decline in mortalityprecedes decline in fertility. According to CensusActuaries, Maharashtra had a death rate of 19.8 perthousand during 1951–61 and dropped to 17 dur-ing the next decade. As per Sample RegistrationSystem (SRS) data during the 18 years from 1971the death rate declined further, to 7.5 per thousandfrom 12.3—a huge drop of 39 per cent—with themajor decline of 24 per cent occurring between1971 and 1981.
There is a wide gap between the crude deathrate in rural and urban areas. In 1999, CDR was8.7 in the rural and 5.6 in urban areas. To start with,the rural CDR in Maharashtra in 1971, for instance,was 13.7 and declined by 36 per cent in threedecades. The urban CDR, however, declined by 41per cent during the three decades after 1971 to 1999but among the three decades, the last since 1991
Box 3.2The New Population Policy
When announcing the New Population Policy on9 May 2001, the Government of Maharashtra putto the fore the reasons why the policy was formu-lated. In 60 years from 1901, the population ofareas that now constitute Maharashtra had dou-bled. But in 30 years since 1961, it had doubledagain. Of the several reasons the main was mar-riage of girls at an early age and preference for themale child.
The policy stressed the need to vigorouslyimplement the existing laws under:
• The Child Marriage Restraint Act, 1978• The Pre-natal Sex Determination Act, 1994• Registration of Births and Deaths Act, 1969• Energetic activation of the Women’s Policy• Provision of free education to girls.
As a disincentive, eligibility from 1 May 2001for contesting to get elected or being appointed/nominated to Zilla Parishads, Panchayat Samitis,civic bodies from Municipal Corporations down-wards, Government-owned corporations, co-op-erative societies, district co-operative banks, milk
producers’ unions, etc., was restricted to those whohave not more than two children. This was aimedat awakening the people to the need to restrict thesize of the family as an ideal.
Gram Panchayats slowing substantial gains inrestricting births get financial support for wells,public toilets, repairs to Gram Panchayat offices,school buildings and roads.
The Savitribai Phule Kanya Kalyan Yojana wasrevised to focus on couples below the poverty lineand linked to the education of girls and their ageat marriage. Couples under 40 years of age but withonly one daughter and who opted for either a ster-ilisation or vasectomy become eligible for a FixedDeposit in the girl-child’s name till she attains 18years of age. If the girl child completes her educationup to the 10th Standard, she becomes eligible foranother Rs 5,000 in a Fixed Deposit for anotherfive years but encashable only if such girls marryafter their 20th year. If the couple decide on steril-isation or vasectomy after two female children, theFD is limited to Rs 5,000 in the first instance butthe post-10th Standard reward is unchanged.
Population: Trends and Prospects 15

contributed very little i.e., 1.8 per cent to thisdecline. (Table 3.3.)
Table 3.3
Mortality Transition in Maharashtra
Years Crude Death Rate Infant Mortality RateTotal Rural Urban Total Rural Urban
1971* 12.3 13.7 9.5 101 109 811981* 9.4 10.5 7.1 75 84 521991* 7.8 9.0 5.7 59 67 411999 7.5 8.7 5.6 48 58 31per centdecline1971–81 23.6 23.4 25.3 25.7 22.9 35.81981–91 17.0 14.3 19.7 21.3 20.2 21.21991–99 3.8 3.3 1.8 18.6 13.4 24.41971–99 39.0 36.5 41.1 52.5 46.8 61.7
* Based on moving averages of SRS rates of the given year, previous year and the following year.
Source: Office of the Registrar General, Government of India, Sample Registration System.
Wide Differential
Within Maharashtra the urban-rural differential toois wide. Though Maharashtra is ranked secondamong the major states with an infant mortality rate(IMR) of 48 per 1000 live births in 1991, it hasbeen only 14 in Kerala. The rural and urban IMR
in Maharashtra is high, it being 58 for the formerand 31 for the latter. If there are any changes in thevariation in Maharashtra, they are only adverse. In1971, the rural IMR was higher by almost 35 percent than the urban IMR but has now becomealmost twice that. The urban IMR declined by 62per cent in three decades while the rural rate de-clined much slowly by 47 per cent.
During the five years preceding 1999, IMRstagnated at 44 compared to the rate of 62 five yearsearlier. It was mainly due to the 36 per cent declinein post-neonatal mortality than deaths during thefirst month after birth. During these years, the ruralIMR declined from 77 to 51 but in the urban areas,it remained more or less stagnant, dropping from36 to just 33. The child mortality level, however,was much lower at per 1000 in 1999. More childrenwere lost by illiterate mothers—63 per 1000 livebirths—than mothers who had at least high schooleducation; their IMR was just 27. A similar differ-ential is found between mothers from householdswith lower standard of living and those from ahigher standard: 69 and 29.
While estimates of Census Actuaries indicate abirth rate of 39.6 per 1000 during 1961–71, thelater National Family Health Surveys showed adecline to 32.2 between 1971 and 1997. During
Table 3.4
Phases of Fertility Transition in Maharashtra
CBR TFRPhase Year Total Rural Urban Total Rural Urban
I. Decline in CBR and TFR 1971–77 1971 (SRS) 32.2 33.7 29.0 4.6 4.9 3.01977 (SRS) 26.2 26.8 25.0 3.4 3.5 3.1
II. Increase in CBR and TFR 1977–84 1984 (SRS) 31.1 32.1 29.3 3.8 4.1 3.3III. Decline in CBR and TFR 1984–91 and further 1991 (SRS) 26.2 28.0 22.9 3.0 3.4 2.5
1989–91 NFHS-1 26.7 28.4 24.4 2.9 3.1 2.5IV. Further decline 1997 (SRS) 23.1 24.4 21.0 2.7 3.0 2.3
1998–99 NFHS-2 23.0 23.8 21.6 2.5 2.7 2.21999 (SRS) 21.1 21.6 20.3 n.a. n.a. n.a.
Sources: 1. Office of the Registrar General, Government of India, Sample Registration System.2. Population Research Centre, Gokhale Institute of Politics and Economics, Pune and International Institute for Population
Sciences, Mumbai (1992). National Family Health Survey 1991–92, Maharashtra.3. International Institute for Population Sciences, Mumbai and ORC-MACRO, USA. National Family Health Survey-2,
1999, Maharashtra, (unpublished).
16 Human Development Report Maharashtra 2002

the same period, the total fertility rate (TFR) de-clined from 4.6 to 2.7—a 41.3 per cent drop. Butthis substantial change in both the crude birth rateand the total fertility rate during the period 1971to 1977 was neutralised—actually what was seenwas a set back—till 1984 due to the over-enthusiasmof the machinery chasing statistics during the Emer-gency by every means. The CBR reverted to 1971levels in 1984. The fertility rate at 3.8 though higherthan the 3.4 recorded in 1977 was lower than 4.6recorded in 1971. The change was seen in both ruraland urban areas.
Sterilisations
Merely the sterilisation numbers do not necessarilyhave a linear correspondence with a decline in TotalFertility Rate (TFR). It depends on the age at whichsterilisations are performed and the number of chil-dren already produced before accepting sterilisation.If accepted by most of the couples at a later age andafter 3–4 children are born, then it has a much lowerimpact on fertility The link between achievementsof the programme and fertility impact had becomeso weak in Maharashtra that birth rate was stagnantaround 28–29 for 1982–89 despite an increase in
recorded couple protection rate from 35 in 1980 to55 in 1989.
It is possible there are some problems with thequality of official statistics on the number of sterili-sations. What is more important is that in order tohave a strong impact on fertility, family planningmethods must be used effectively, at the right age andat low parity i.e., after 1–2 children. Mere numericalincreases in sterilisations at any later age are notenough to bring about any fast decline in fertility.
There was a steady decline after 1984 in bothCBR and TFR and by 1997, the former droppedby 26 per cent from 31.7 to 23.1 and the latter, by29 per cent from 3.8 to 2.7. The decline among theurban population was faster. The rural area laggedbehind, which necessitates a new agenda specificallyfor that segment.
Migrants Compound Lag
The lag during six years during the Emergency andits consequent impact later delayed the fertilitytransition in Maharashtra. The compounding factorwas the inflow of large number of migrants, espe-
Table 3.5
Age Specific and Total Fertility Rates and Crude Birth Rates from NFHS-1, NFHS-2, and the SRSby residence
NFHS-1(1989–91) NFHS-2 (1996–98) SRS (1997)
Age-Group Total Urban Rural Total Urban Rural Total15–19 0.141 0.094 0.156 0.129 0.036 0.066 0.05420–24 0.227 0.185 0.254 0.223 0.200 0.278 0.24525–29 0.132 0.111 0.101 0.106 0.144 0.164 0.15530–34 0.053 0.045 0.026 0.034 0.054 0.066 0.06135–39 0.012 0.014 0.010 0.012 0.019 0.023 0.02140–44 0.006 0.000 0.000 0.000 0.006 0.007 0.00745–49 0.000 0.000 0.000 0.000 0.002 0.003 0.002TFR 15–44 2.86 2.24 2.74 2.52 2.30 3.02 2.72 TFR 15–49 2.86 2.24 2.74 2.52 2.31 3.04 2.73 CBR 26.3 21.6 23.8 23.0 21.0 24.4 23.1 Note: Rates from NFHS-1 and NFHS-2 are for the period 1–36 months preceding the survey. Rates for the age group 45–49
might be slightly biased due to truncation. Rates from the SRS are for one calendar year. Age-specific and total fertility rates are expressed per woman.
Sources: 1. Sample Registration System, Office of the Registrar General, 1999.2. Centre for Operations Research & Training, Vadodara and International Institute for Population Sciences, Mumbai, 2000,
National Family Health Survey-2, Maharashtra Preliminary Report.
Population: Trends and Prospects 17

cially in the peak age group, possibly neutralisingthe reduction in birth rates.
Marital fertility declined in all age groups above35 by when the childbearing functions were almostover for most women. Even for those in the 25–29and 30–34 years segment, it declined but the 1977–84 phase saw increases in these age groups as well.The age group of 20 to 24, which even in urban areas,provided substantial contribution of 41 per centwhich was quite close to the 46 per cent recorded inrural areas. What causes worry is that Maharashtrahas substantially high fertility amongst teenagers.
Teenaged Mothers
A fourth of the total fertility is from mothers be-tween 15 and 19 years of age. In addition, amongthe teenaged mothers who gave birth during 1996–1999, it was either a second or a third child at suchyoung age. The urban regions witness 21 per centof such occurrences and the rural areas, 28 per cent.Nearly a third of the rural women and a fifth of allwomen in Maharashtra in that age group are cur-rently married. The National Family Health Surveyin 1999 revealed that 23 per cent of currentlymarried girls in rural Maharashtra who are between15 and 19 years and 32 per cent of women in theage-group of 20–24 were married before they were15 years old. This only underscores the lax imple-mentation of laws relating to early marriages.
Of course, this alarming statistical profile is, ina way—though it cannot be much of a solace—animprovement over many years of what was actuallymuch worse. Amongst the population of marriedwomen above 40, the proportion of those who weremarried before they were 15 was alarmingly high atover 50 per cent.
Contraception Use
By 1992, 54 per cent of then married women werecurrent users of birth control methods. It was anoption exercised by 54 per cent of rural women and53 per cent in the towns and cities. Actually, therehas been a growth in use of contraception by couplesfrom 35 per cent to 56 per cent from 1980 to 1992and by 1999, it peaked to 61 per cent. However,even non-southern States are ahead in this. Protec-tion is higher at 68 per cent in Himachal Pradesh,67 per cent in Punjab and West Bengal, 62 per centin Haryana, 64 per cent in Delhi.
Female Sterilisation Leads
Though Maharashtra was a pioneer in the accep-tance of vasectomies in the 50s and 60s, nearly 80per cent of contraception is currently by femalesterilisation. Use of intra-uterine devises (IUD),condom and pills was confined to a minuscule eightper cent of the currently married women. There hasbeen an improvement in the use of IUDs, condoms
Table 3.6
Vital Rates: Comparison of Maharashtra with Select States
Indicators Maharashtra Kerala Tamil Nadu West Bengal Andhra PradeshCrude Death Rate (1999) 7.5 6.4 8.0 7.1 8.2Crude Birth Rate (1999) 21.1 18.0 19.3 20.7 21.7Infant Mortality Rate 48.0 14.0 52.0 52.0 66.0Total Fertility Rate (1997)
Total 2.7 1.8 2.0 2.6 2.5Rural 3.0 1.8 2.1 2.9 2.6Urban 2.3 1.8 1.8 1.8 2.1
TFR (NFHS-1) Total 2.9 2.0 2.5 2.9 2.6TFR (NFHS-2) Total 2.5 1.96 2.2 2.3 2.3Per Cent of Birth of Order 3+ 39.1 21.0 23.1 36.5
Sources: 1. Registrar General’s Office, Government of India Sample Registration Bulletin, 1997, 1999.2. For last 3 rows IIPS, National Family Health Survey-1 and 2, Mumbai.
18 Human Development Report Maharashtra 2002

and pills over the years but that has not beensignificant enough. On the other hand, highlightingthe regressive, reluctant participation of males inbirth control, is the number of men who took tovasectomies: it declined from 6.2 per cent to 3.7 percent between 1992 and 1999.
Maharashtra ranks high on the strength of someof its other indices among five States, includingKerala, Tamil Nadu, West Bengal and AndhraPradesh (Table 3.6). Progressive, relatively betterliteracy levels, higher urbanisation, higher percent-age of households with electricity and industrialisa-tion mark it out as a key State with the country’shighest per capita State income of Rs 23,398 atcurrent prices in 1999–2000 which is higher thanthe All-India level.
The factors that can lead to fertility decline inMaharashtra are not very strong. The percentage ofcouples exposed to family planning messages islower than all the selected States except West Bengaland Andhra Pradesh. Women generally marry earlythough there has been a slight improvement. Halfthe girls in Maharashtra are married by the timethey are 16.4 of age. This age at which young girlsmarry is slightly higher in the other three southernStates except Andhra Pradesh. Half—that is nearly50 per cent—of the girls married and in the agegroup of 20–24 are those who were married by the
time they were only eighteen. In Kerala and TamilNadu, this percentage is significantly very muchlower at 17 and 25 per cent respectively. A quarterof the contribution to the total fertility rates is fromthe youngest age group, which is much higher thanin Kerala and Tamil Nadu though not higher thanin Andhra Pradesh. (Table 3.7)
Strong Son Preference
There is a strong son preference in Maharashtra. Asthe Table 3.7 shows 27 per cent women want moresons than daughters and 84 per cent want at leastone son. Only 35 per cent of women with twochildren use contraception if they do not want ason. If a family has a son and a daughter, contra-ception is resorted to by at least 63 per cent ofwomen. If the two children are boys, then thepercentage jumps to 79 per cent. This preferencehas only led to delayed acceptance of contraceptionwhich promoted a pronounced distortion in the sexratio.
Since trained health professionals attend tofewer deliveries and the attendance at antenatalclinics by women is much lower, acceptance ofsterilisation is rather late in their productive life. InMaharashtra, professional health workers attend toonly 59 per cent of deliveries. In Kerala 94 per centand in Tamil Nadu 84 per cent of deliveries are
Table 3.7
Comparison of Maharashtra with Select States—Factors Leading to Fertility Decline
Indicators Maharashtra KeralaTamilNadu
WestBengal
AndhraPradesh
Per cent of women age 20–24 married by age 18 47.70 17.0 24.9 45.9 64.3Median age at marriage (years) 16.40 20.2 18.7 16.8 15.1Per cent of contribution of age 15–19 to TFR 25.60 9.9 18.9 23.4 59.6Contraceptive use—Any Method (per cent) 60.90 63.7 52.1 66.6 57.0Per cent sterilised 52.20 51.0 46.0 33.8 75.9Per cent exposed to Family Planning message 62.20 80.6 75.7 56.5 19.8Per cent wanting more sons than daughters 27.01 14.6 9.6 20.7 19.8Per cent wanting at least one son 84.50 72.6 66.3 79.9 76.0Per cent who received all recommended antenatal care 31.00 64.9 50.8 19.7 35.6Per cent of deliveries attended by health professional 59.40 94.0 83.8 44.2 65.2
Source: International Institute for Population Sciences and MEASURE DHS + ORC-MACRO (2000), National Family Health Survey-2 (NFHS-2), India, 1998–99.
Population: Trends and Prospects 19

attended to by health workers leading to higheracceptance of sterilisation as a means to limit furtherbirths. Only 50 per cent of the women acceptsterilisations in Maharashtra but in the other States,80 per cent of women with two children do notwant more children. However, of them, 70 per centin Andhra Pradesh, and 60 per cent in Kerala andTamil Nadu accept sterilisation. Only 31 per centreceive antenatal care in Maharashtra against 65 percent of women in Kerala.
Gender Selection
Gender selection by clinical prenatal methods is oneof the many reasons for the poor overall sex ratiothat was 936 in 1961 and declined to 922 in 2001.However, studies show that there is a difference inthe sex ratio at birth for births to women who havegone for antenatal care (ANC) including sonogra-phy (893) and births to women who have not gonefor any ANC (983). Maharashtra’s lower than thenational average sex ratio could be the result of lowsex ratio in the 0–6 population cohort due to thestrong son preference achieved by selective abor-tions, neglect of the girl child after birth withconsequent higher infant and child mortality.
Migration and Sex Ratio
When men migrate to places away from their homesin search of jobs, they add to the number of malesin the towns and cities to which they belong. Sincethey leave behind—at least in most cases, if not inall—their families, they detract from the number of
males in the population left behind. Therefore, anet out-migration status of district, with more menthan women leaving for better pastures in andaround urban centres for economic reasons is animportant factor in determining the sex ratio inRatnagiri (1135), Sindhudurg (1077), Gondiya(1055). Even Satara (995) and Bhandara (982) havesex ratios much above the State average. But, incontrast, Mumbai (774), Mumbai (Suburban)(826), Thane (857), Pune (917) and Aurangabad(919) are the districts with sex ratio much belowthe State average (922). These districts are obviouslymagnets for migrants.
The drastic decline in the sex ratio in age group0–6 in the past ten years is a serious matter. In 2001,it was 917, compared to 946 in 1991. Though theratio is not as low or adverse as in States like Punjab(793), Himachal Pradesh (897), Haryana (820), andGujarat (878), when taken in the context of the acutedecrease within a short span of just ten years, issignificant, indicating a pronounced negative trend.
Maharashtra’s experience in this area is wellwithin the finding that lower sex ratios in the 0–6population cohorts are more likely to be prevalent inStates which are developed enough to have a strongacceptance of small family norm as well as a tradi-tional preference for a son. Kerala is, of course, anexception. Availability of doctors and health servicesin these States enable women translate the society’slonging into the actual achievement of the sex com-position they desire. Less developed States like UttarPradesh, Bihar also have a strong son preference butwomen in these States are more likely to go for morechildren until they get a son. Even if they wantabortion, they do not have easy access to the services.
Lowest Sex Ratios
In Maharashtra, Sangli (850), Kolhapur (859),Jalgaon (867), Aurangabad (884) and Satara (884)are the districts with lowest sex ratio in 0–6 agegroup in the State. Three of them belong to theprosperous sugar belt in Western Maharashtra andJalgaon which cultivates banana as a cash crop. Onthe other hand, Gadchiroli, Nandurbar, Gondiya,
0
20
40
60
80
100
Maharashtra Kerala Tamil Nadu West Bengal Andhra Prade
States
% not wanting % using % accepting
Figure 3.1
Desire for No Children and Use of Contraceptionamong Couples with Two Living Children
20 Human Development Report Maharashtra 2002

Bhandara and Ratnagiri are the districts with a highsex ratio (954–974). The first two are tribal districtswhere the status of women is likely to be high andRatnagiri has high sex ratio perhaps because therethe girl child is less neglected.
Urbanisation
Maharashtra, the second most urbanised State inIndia with 42.4 per cent of the population living intowns, cities and a metropolis like Mumbai, has itsown demographic tale to narrate (Table 3.8). Thishuge urban population accounts for 14.4 per centof India’s entire urban population. Till 1991, Maha-rashtra was the most urbanised State; that privilegehas now gone to Tamil Nadu whose 43.9 per centpopulation is urban.
Table 3.8
Level of Urbanisation in Maharashtra
Year Urban UnitsUrban
Population(Million)
UrbanPopulationas Per Cent
of TotalPopulation
DecadalGrowthRate ofUrban
Population
1961 266 11.2 28.2 21.31971 289 15.7 31.2 40.81981 307 22.0 35.0 40.01991 336 30.5 38.7 38.92001 378 41.0 42.4 34.3
Source: Biswas, S.K., 2001, Provisional Population Totals for Maharashtra, Census of India, 2001, Series 28, Paper No. 1
Urban lifestyle and attitudes generally have amodernising influence on demographic behaviourin general, and health seeking behaviour in particu-lar which can lead to fast decline in fertility andmortality. Though it is true that in developingcountries like India, urbanisation is not alwaysbacked by vigorous industrialisation, its modernis-ing influence is likely to be strong. The percentageof urban population can be considered an importantdevelopmental indicator for influencing the demo-graphic situation.
Across Maharashtra, there are sharp variations
in the levels of urbanisation, in terms of bothnumbers of cities and towns as well as populationscontained therein. In Konkan division comprisingMumbai, Mumbai Suburban, Thane, Raigad, Rat-nagiri and Sindhudurg, 72 per cent of the popula-tion is urban but almost all of it is in Mumbai,Mumbai Suburban and Thane. In Pune and Nagpurdivisions, one-third of the population is urban. InNashik—Nashik and Pune divisions, which are con-tiguous covering all of Western Maharashtra—andAmaravati divisions one-fourth of the population isurban. Nagpur and Amaravati divisions take in theirsweep all of Vidarbha. However, it is only one-fifthin Aurangabad division, which encompasses all ofMarathwada (Figure 3.2).
The Konkan region is the most urbanised regionin Maharashtra with two districts, Mumbai andMumbai Suburban, being 100 per cent urban andThane district having 73 per cent urban population.A tract of rural Thane district is tribal as well. Thus inMaharashtra, in the broad regional sense, Konkan isthe most urbanised, Marathwada the least and West-ern Maharashtra is more urbanised than Vidarbha.
Widespread Urbanisation
Cities like Mumbai and its satellites like Thane,Kalyan and Navi Mumbai are not the only urbanregions though they are the major urban centres.Growing urbanisation is seen across the State, therebeing, by 2001, as many as 378 towns and cities. In1961 this number was 266. During the same period,the urban population swelled by four times, from
Perc
enta
ge
Aurangabad0
10
20
3040
50607080
Konkan Nashik Pune Nagpur Amravati
Divisions1991 2001
Figure 3.2
Percentage Urban Population in Maharashtra,by Divisions, 1991, 2001
Population: Trends and Prospects 21

11.1 million in 1961 to 41 million indicating how,while newer urban units came into being, older oneswere growing in size, population and density Theirdecadal growth, which peaked to above 40 per centin 1961–71, however has been slowing down since1971. During 1991–2001, it slackened from 39 to34 per cent. It has to be noted that not just the villagesbut these towns and cities are also the originatingpoint for a substantial number of migrants intoMumbai and areas around it (Box 3.3).
Greater Mumbai, with its sheer size, opportuni-
ties and kinship between the new migrant and theearlier migrant, has its tremendous attraction formigrants. That has been one major, though not theonly reason for Greater Mumbai’s growth, whichhad a population of 4.15 million in 1961 and grewto 11.9 million in 2001 (Table 3.9).
Next to Mumbai, in both population and geo-graphic size, are Pune and Nagpur. Pune grew duringthe decade of 1991–2001 to switch places withNagpur to be the second largest city with Nagpuremerging as the third. Navi Mumbai moved from the
Box 3.3A Huge Urban Sprawl
Mumbai and Mumbai Suburban districts, whichare huge, contiguous urban entities, and togetherknown as metropolitan Mumbai, with a popula-tion of 11.9 million, constitute the most populouscity in Maharashtra. This population is about 12per cent of all of Maharashtra’s population.
Across Maharashtra, the number of cities hostingmore than a million people each is seven. Six havea population of between half a million to million.
In contrast, the average size of a village, popu -lation-wise, is 1,275; the average size, by the samenorm, of an urban unit is 1,08,518.
Nashik had a growth rate, the highest amongall urban areas, of 58.8 per cent during the decade.
Thane district, adjacent to Mumbai, an indus -trial hub in itself, and host to a combination of theurban and the rural, even tracts of tribal popula-tion, has the largest number of major towns for anydistrict in Maharashtra. They include Thane cityitself, Kalyan-Dombivli, Bhiwandi-Nizampur,Mira-Bhayandar, Ulhasnagar, Navi Mumbai.
And in turn, most of the residents of these towns,save perhaps Bhiwandi-Nizampur with its power-loom activity, depend on Mumbai for a living.
Table 3.9
Population, Annual Rates of Growth, Components of Growth of Greater Mumbai, 1951–91
Year Population in’000s
Rate of Growth(per cent p.a.)
Decade Increase(’000s)
Natural Increase(’000s)
Net Migration(’000s)
Share of Migra-tion (per cent)
1951 2994 5.1 1193 243 950 79.61961 4152 3.3 1158 558 600 51.81971 5971 3.6 1819 934 885 48.71981 8243 3.2 2272 1204 1068 47.01991 9926 1.9 1683 1387 296 17.62001* 11914 1.8 1989 1257 732 36.8
Note: Net Migration till 1981 estimated both by using Vital Statistics and Life Table Survival Ratio Method and that for the decade 1981–91 by Vital Statistics Method.
* As estimated by Sudha DeshpandeThough the above data shows sharp decline in the growth rate and percentage share of net migration in 1991, it was primarily the result of under-enumeration of Mumbai’s population. She estimates that if counted correctly in in 1991, Mumbai’s population would be 10.5 to 10.7 million, net migration 0.88 million to 1.13 million and its share in the 39 to 45 per cent and not 17.6 per cent.
Source: Census of India, Maharashtra, 1951 through 2001. Primary Census Abstracts for Greater Bombay; Mumbai Mahanagarpalika,Administrative Reports of the Municipal Commissioner and Public Health Department, 1951 through 1993 (Socio-Economic Review of Mumbai, 1997–98, Centre for Research and Development, Mumbai).
22 Human Development Report Maharashtra 2002

15th to 10th place during the same period. Exceptfor the cities of Nashik, Pune, Solapur and Kolhapur,the decadal growth rates declined. These growth rates,though declining, need to also stabilise.
Migrants to this prime urban region of Mumbaiare drawn from other districts in Maharashtra andother States of India (Box 3.4). The 1981 and 1991Census revealed that just five States, Maharashtra,Uttar Pradesh, Gujarat, Karnataka and Tamil Naduaccounted for more than four-fifths of the rural andthree-fourths of urban migrants into Mumbai. A
little less than half of the rural and nearly a third ofurban migrants came to Mumbai from other dis-tricts of Maharashtra.
Intra-State Migrants
These three divisions—Konkan, Pune and Nashik—accounted for nine out of every 10 migrants fromother districts of Maharashtra. Migrants fromMarathwada division contributed barely five to sixper cent to the stock of intra-State migrants whileVidarbha accounted for much less, one to two per
Box 3.4Mumbai Metropolis—Shifting Populations
Greater Mumbai’s own decadal growth rate hasbeen declining rapidly—perhaps one hearteningfeature for a city almost coming apart at its seams—since 1971. It declined from 43.8 per cent dur-ing 1961–1971 to 38.1 per cent during 1971–1981and then to 20.41 per cent during 1981–1991 andfinally to 20.41 per cent during the last decade.
The growth rate of Mumbai Suburban districttoo declined from 36.15 per cent during 1981–91to 27.20 per cent.
The share of net migration in Greater Mumbai’spopulation growth substantially declined from 47per cent during 1971–81 to just 17.6 per centduring 1981–91. The volume of net migration isalso seen to have declined from 1.07 million during1971–81 to 0.29 million during 1981–91, raisingdoubts regarding the reliability of the count ofheads in the Census, 1991.
Another possibility is the movement of thesettled population within Greater Mumbai. Popu-lation moving from the island city to the suburbswithin Greater Mumbai, thus switching the densi-ties around a bit. Some have moved away to furthersuburbs or adjacent towns and cities.
Also, many newcomers to the city seem to optfor the Suburban District and then move on to theurban settlements on the periphery of Mumbai butin Thane District—Thane city, Kalyan-Dombivli,Navi Mumbai and Mira-Bhayandar, strengtheningtheir dormitory character—while keeping the pres-sure on island Mumbai in particular and nowGreater Mumbai in general.
It would appear that by putting to use residentialpremises in the busy, congested areas of South Mum-bai which earlier had a residential-commercial pro-file for more commercial (shops or businesses) hasnot made any difference to the day-time densities ofthe various locations: they continue to teem withpeople. People who lived there earlier now, commuteback and forth on packed trains from the distantsuburbs.
One reason why a large number of newmigrants are settled in Thane district or NaviMumbai could well be the comparatively lowerhousing prices there, and greater gentrification ofwhat was earlier considered the outback of theregion, served by an umbilical cord-like suburbanrailway system.
Decongestion by shift of population, driven byeconomic considerations, including pagdi (cash forvacated premises), has not meant much. Only thecharacter of the places has changed but not thepressures.
Population in the other far-flung areas of theurban agglomeration have been growing faster, asshown by the decadal growth rate during 1991–2001.
If the Municipal area of Greater Mumbai grewby 20.03 per cent, the growth of the entire urbanagglomeration was of the order of 29.94 while theurban pockets in Thane grew by 66.78 per cent.The more telling growth came in Mira-Bhayandarand Navi Mumbai during the same decade: 196.29per cent and 128.76 per cent respectively.
Population: Trends and Prospects 23

cent of total migrants. Five districts, Ratnagiri,Sindhudurg, Satara, Pune and Raigad together ac-counted for a little over two-thirds of male and overthree-fifths of female migrants who came to Mum-bai from other districts of Maharashtra.
Nearly one-third of urban migrants came toMumbai from other districts of Maharashtra. Amongthe migrants to Mumbai from other districts ofMaharashtra nearly half of the men and women camefrom the adjoining districts of Thane and Konkan,which includes the three districts Raigad, Ratnagiriand Sindhudurg. Almost one-third were from Punedivision and one-tenth from Nashik division.
Intra-State Migration
An earlier study of labour mobility in Mumbai’smanufacturing sector done in 1990 revealed that 57per cent of migrants were from other districts ofMaharashtra itself. Migrants from Uttar Pradeshformed one-third. Those from Karnataka formed 15per cent of the sample not born in Maharashtra.Gujarat and Kerala contributed 12 per cent each.Ratnagiri and Sindhudurg accounted for 47 per centof male and 68 per cent of female migrants inMumbai born in other districts of Maharashtra.Sangli contributed 13 per cent, while the contribu-tion of Raigad, Kolhapur and Satara was nine percent each.
Regional Distribution
Regional demographic imbalance in Maharashtra isanother area of concern. Western Maharashtra, Vi-
darbha, Marathwada and Konkan are four regions,which have distinct cultural as well as economiccharacteristics due to the historical factors that havenot been fully overcome. Notwithstanding effortsover the past four decades to identify and fund theremoval of backlogs in the investment in physicalinfrastructure that has a bearing on economic de-velopment, the levels of attainments between theseregions vary This has resulted into redistribution ofpopulation (Table 3.10).
If Mumbai and Thane, as also Nagpur region,gained population, Aurangabad division alone experi-enced a substantial decline in population growth rateduring 1991–2001 as compared to 1981–91. Nearlyhalf of the State’s population (46 per cent) is concen-trated in two divisions of Konkan and Pune.
There are extreme variations in the population-wise size of districts in Maharashtra. They rangefrom Mumbai Suburban district with a populationof 8.6 million in 2001 to the tiny Sindhudurgdistrict with a population of just 0.86 million. Allthe five largest districts in Maharashtra, each witha population above 4 million are from WesternMaharashtra including Konkan region: MumbaiSuburban, Thane, Pune, Nashik and Ahmednagar.They together account for one-third of the totalpopulation of Maharashtra State. Out of six districtsin Konkan region, Sindhudurg and Ratnagiri havea population less than 2 million each while Thaneand Mumbai Suburban, more than 80 lakh each.The remaining two districts Mumbai and Raigadare in the mid-sized category with population sizeof between 2 to 4 million.
Table 3.10
Population Growth of Divisions
DivisionsPer Cent of
Population in 1971Per Cent of
Population in 2001Per Cent Increase
in 1971–81Per Cent Increase
in 1981–91Per Cent Increasein 1991–2001
Konkan 22.8 25.6 32.04 27.12 28.03Pune 21.3 20.6 22.37 25.46 21.69Nashik 16.7 16.3 23.09 24.82 21.83Aurangabad 16.0 16.1 20.73 31.38 21.78Nagpur 11.8 11.0 24.16 21.76 18.23Amaravati 11.3 10.3 21.04 20.81 18.67Maharashtra 100.0 100.0
Source: S.K. Biswas; Provision, Population, Totals for Maharashtra, Census of India, 2001, Series 28, Paper No. 1.
24 Human Development Report Maharashtra 2002
In Western Maharashtra, Nandurbar and Dhuleare small districts with population of less than 2million each, while each of the three districts—Nashik, Pune and Ahmednagar—have populationsof more than 4 million. The remaining five are inthe middle category. In Vidarbha region, only Nag-pur district is in the category of above 4 million.From the remaining 10 districts, six districts fall inthe slot of those with less than 2 million. Fourdistricts, Buldhana, Amaravati, Chandrapur andYavatmal are in the middle category i.e., each havinga population between 2 to 3 million. In Marathwadaregion, not a single district has a large population.Half the districts have a population below 2 millioneach and the half, between 2 to 4 million.
In Konkan, only a little over half (54.9 per cent)of Thane district’s area is in the category of highgrowth rate of above 30 per cent while Mumbai,Ratnagiri and Sindhudurg have recorded decadalincrease of less than 10 per cent. In Western Ma-harashtra, Pune is in the high growth rate (30+ percent) category, only three districts Nandurbar, Nashikand Ahmednagar are in the medium growth categoryof 20–30 per cent while the remaining six districtsare in the low growth segment of less than 20 percent. Apparently, migration to high growth rate areasis one critical factor, apart from the weak urbanisingeffect, for its present status. In Vidarbha, not a singledistrict is in the high growth category. Except Akola,Nagpur and Gadchiroli, which have medium growth,all others have low population growth rates of lessthan 20 per cent. In Marathwada, Aurangabad is theonly district in the high growth category. Nanded andLatur are in the medium growth category. Populationof all the remaining five districts increased at a slowrate during the decade 1991–2001. Population Densities
The Konkan region, mainly its northern extremity,is a very high-density region with three districtshaving a very high population density i.e., Mumbai(21,190 per sq. km), Mumbai suburb (19,255 persq. km) and Thane (850 per sq. km). Pune andKolhapur from Western Maharashtra and Nagpurfrom Vidarbha are the only three other districts with
density above 400 per sq. km. One district fromKonkan, Sindhudurg and another, Osmanabadfrom Marathwada and five districts from Vidarbha,Gadchiroli, Washim, Wardha, Chandrapur andYavatmal have low density below 200 per sq. km.All the remaining 22 districts have medium densitybetween 201–301 per sq. km.
As far as the sex ratio for the overall populationis concerned, in only three districts, Ratnagiri(1,135), Sindhudurg (1,077) and Gondiya (1,005)is it favourable to women. In the case of Ratnagiri,as is well known, it has been the result of out-migration of males to Mumbai for education andemployment. At the other extreme are districts likeMumbai (774), Mumbai Suburban (826), andThane (857), which have recorded a sex ratio thatis extremely unfavourable to females. These threedistricts are magnets for migrants predominated bymales from other districts of Maharashtra and fromother States of India This explains the low sex ratioin these districts.
In the Konkan region, three districts report sexratios below 940 per 1000 women and the remainingthree record sex ratios above 970. In Marathwada,there is not a single district with a high sex ratio above970, which is also likely to be the result of maleout-migration. This is corroborated by the decline inthe growth rate of Aurangabad division. ExceptAurangabad (919), all other districts are in the middlecategory with a sex ratio between 941 and 970.
It is the sex ratio of the population in the agegroup 0–6 which has caused more anxiety after theresults of 2001 census were released because of thepossibility of its relation with sex selective abortions.One district from the Konkan region (Mumbai898), six from the Western Maharashtra, Jalgaon(867), Ahmednagar (890), Satara (884), Sangli(850), Solapur (897), and Kolhapur (859) and twodistricts from Marathwada, Aurangabad (884) andBeed (898) report a sex ratio of less than 900 in thepopulation age 0–6. Not a single district in Vidar-bha falls in this category. In all 12 districts, threefrom Konkan, one each from Western Maharashtra(Nandurbar) and Marathwada (Nanded) and seven
Population: Trends and Prospects 25

from Vidarbha record high sex ratios (above 941).All the other 14 districts are in the medium category,with a sex ratio between 901 to 941.
Fertility Indicators
Only Greater Mumbai and Sindhudurg had TFRsless than 3, according to 1991 Census data, whileThane, Raigad and Ratnagiri had TFRs between 3and 4, not a single district having a TFR above 4.On the contrary in Western Maharashtra, Vidarbhaand Marathwada not a single district had a TFR lessthan 3. All Marathwada districts except Osmanabadhad a TFR above 5. Two districts from WesternMaharashtra, Nashik (4.2), Solapur (4), four dis-tricts from Vidarbha, Buldhana (4.5), Gadchiroli(4), Akola (4.1), Yavatmal (4.1) and Osmanabad(4.6) from Marathwada had TFR between 4 and 5.The remaining 15 districts: three from Konkan,seven from Western Maharashtra and five fromVidarbha had TFRs of between 3 and 4.
District-wise TFRs for the latest period are notavailable but another indicator-percentage of birthsof order 3 and above available from Rapid HouseholdSurvey (LIPS, 2000)—may give some idea aboutregional variations in fertility levels. It reveals that inall nine districts, three from Konkan region, Mumbai,Raigad and Sindhudurg; four from Western Ma-harashtra, Kolhapur, Pune, Sangli and Satara and twofrom Vidarbha, Nagpur and Wardha have lower fer-tility as indicated by less than 30 per cent higher orderbirths (3+). Not a single district from Marathwada isin this category But all the districts in Marathwadaexcept Osmanabad fall in the category of 40 or higherper cent of 3+ order births, indicating a disturbinglyhigh fertility situation. Two districts from Vidarbha,Akola and Buldhana are also in this high fertilitycategory. All the remaining 13 districts—two fromKonkan, five each from Western Maharashtra andVidarbha and one from Marathwada are in the mid-dle category of 30–40 per cent higher order births.
Contraceptive Prevalence
According to the Eligible Couple Survey (Rural) donein 1999, rural areas of nine districts in Maharashtra
have low contraceptive prevalence of between 50 and59 per cent. Out of these four are from Marathwada:Nanded, Jalna, Aurangabad, and Latur. Only one,Buldhana is from Vidarbha and the remaining fourare from Konkan region: Thane, Raigad, Sindhudurg,and Ratnagiri. There are seven other districts withhigh order contraceptive prevalence of above 70 percent in the rural areas. Four out of these seven arefrom the Western Maharashtra viz., Pune, Sangli,Satara, Kolhapur and three are from Vidarbha, Nag-pur, Amaravati and Wardha. Disturbingly enough,high contraception is not prevalent in a single districtfrom Marathwada. The remaining 13 are in themiddle category including the 100 per cent urbandistricts of Mumbai and Mumbai Suburban.
Male Literacy
The range of variation for male literacy rate is from66 per cent in Nandurbar district to 92.7 in Mum-bai Suburban but a majority of the districts are inthe narrow range of 80–92 per cent. In Konkanregion all the six districts are in the category of highmale literacy rate of above 85 per cent. At the otherextreme, in Marathwada only Aurangabad districtis in this category and all the others, except Jalnawith low male literacy rate 79 per cent, are in themedium category of 80–85 per cent. In WesternMaharashtra and Vidarbha, the situation is quitesimilar: one district each in low category—Nandur-bar (66 per cent) and Gadchiroli (70 per cent), twoeach in medium category (80–85 per cent)—Dhuleand Solapur in Western Maharashtra and Chan-drapur and Yavatmal in Vidarbha. All the remainingdistricts in both the regions are in the literacycategory of above 85 per cent.
Female Literacy
Compared to male literacy, the range of variationsin female literacy in Maharashtra is very wide i.e.,from 45.5 per cent in Nandurbar to 83 per cent inthe Mumbai district. In Konkan, all except two(Raigad and Ratnagiri being in the medium rangeof 60–70 per cent) are in the high female literacycategory of 70 per cent and above. At the otherextreme, in Marathwada region, all are in the low
26 Human Development Report Maharashtra 2002

female literacy category of below 60 per cent excepttwo, except Aurangabad and Latur positioned in themiddle category of 60 to 70 per cent. Not a singledistrict is in the high literacy category here.
In both Western Maharashtra and Vidarbha, adistrict each, Nandurbar with 45.5 per cent andGadchiroli with 50.6 per cent respectively are in thelow category. In Western Maharashtra all the othersexcept Pune (72 per cent) are in the middle category.On the other hand, in Vidarbha, five districts,Akola, Amaravati, Wardha and Nagpur are in thehigh category and the remaining six are in themedium category.
Literacy could well be one of the key factors inlower fertility. For instance, most of Marathwada withlow female levels of literacy also have TFRs above 5.Greater Mumbai, apart from other factors like in-migration, has had a low TFR of 3 and so is the casewith Thane and Raigad with a range of 3 and 4.
Urbanisation Level
Urbanisation promotes a lifestyle and an attitudethat leads to a demographic behaviour that is aimedat improvement of the individual and the family inareas of health, education and employment. Thesein turn can lead towards a faster decline in bothfertility and mortality. The level of urbanisation,often measured in terms of urban population’s sizeitself can be an important developmental pointer tosome extent influencing demographic situation.
Konkan division, mainly because of 100 percent urbanisation of two districts, Mumbai andMumbai Suburban, and substantial urban characterof Thane, is 72 per cent urbanised (Table 3.11 andFigure 3.3). No other region matches this level ofurbanisation. In Pune and Nagpur divisions, a thirdof the population is urban, in Nashik and Amaravatidivisions one-fourth of the population is urbanwhile in Aurangabad division urban population isjust one-fifth of the total population.
Among the three other districts of Konkan, Sin-dhudurg and Ratnagiri have only above 10 per centurban population while Raigad is in the middle cate-gory (21–40 per cent urban). At the other extreme,in Marathwada not a single district is in the ‘high’category (40+ per cent urban). Out of eight, four, viz.Jalna, Beed, Osmanabad, Hingoli are in the low (lessthan 20 per cent urban) category and the rest are inthe middle category (21–40 per cent urban). In West-ern Maharashtra and Vidarbha a district each, Puneand Nagpur are in the high category. In Western
Perc
enta
ge
0
10
20
30
40
50
Konkan Nashik Pune Aurangabad Nagpur Amravati
DivisionsRural Urban
Figure 3.3
Decadal Growth of Rural and Urban Populationin Maharashtra by Divisions, 1991–2001
Table 3.11
Division-wise Rural–Urban Growth of Population, Maharashtra, 1991, 2001
Name of Division
Total Population2001
Per Cent Population2001
Per Cent Population1991
Decadal PopulationGrowth 1991–2001
Rural Urban Rural Urban Rural Urban Rural UrbanKonkan 61.84 186.24 24.93 75.07 28.53 71.47 11.88 34.48Nashik 113.33 44.41 71.82 28.16 74.54 25.46 17.43 34.71Pune 124.79 74.95 62.48 37.52 67.46 32.54 12.71 40.30Aurangabad 117.58 38.32 75.42 24.58 78.12 21.88 17.58 36.78Amaravati 73.04 26.37 73.47 26.53 74.97 25.03 16.29 25.79Nagpur 66.75 39.91 62.58 37.42 65.02 34.98 13.80 26.47
Source: Registrar General, Government of India, 2001.
Population: Trends and Prospects 27

Maharashtra only three districts, Ahmednagar, Nan-durbar and Satara are in the ‘low’ category, while inVidarbha five districts Yavatmal, Washim, Bhandara,Gondiya, Gadchiroli are in the ‘low’ category.
Slums: A Proliferating Reality
In Maharashtra, where urbanisation as a trend isstrong and the capacity to provide affordable hous-ing stock limited, slums are a reality. To Mumbaigoes the unenviable credit of being the host to Asia’sas well as India’s biggest slum: Dharavi, a sprawlingentity, a microcosm of the far-flung country. It is ahabitat as well as a place of enterprise, which hasbeen its growth engine. Squalor is because of sheerovercrowding and absolute lack of amenities.
A slum is defined as a compact area of at least300 population, or some 70 households of poorlybuilt congested living quarters, often illegally onlands that do not belong to the owner/occupant ofthe tenements. The environment is unhygienic, theinfrastructure to support the habitation is woefullyinadequate or even non-existent.
As per the findings of the Census, 2001, Maha-rashtra has 10.6 million people in the slums, thelargest among all States. Dharavi, of course, is un-paralleled in its size and density. The Census 2001reported for the first time, the population living innotified slums in towns with population of morethan 50,000. And the figures are disturbing: 31.7per cent of the 33.6 million people in 62 towns andcities reported living in slums.
Dharavi, of course, is not the only Mumbaislum—these shantytowns are virtually everywhere,with people spilling over on to the sidewalks as wellas railway margins. Greater Mumbai has the mostnumber of people living in slums. Nearly half ofGreater Mumbai resides in them i.e., 49 per cent ofthe metropolis’ total of 11.9 million.
Compare this to other cities and the contrast issharp: Delhi–19 per cent of its total population;Kolkata–33 per cent; Chennai–1.1 million or 26 percent and Bangalore–0.3 million or only 8 per cent.
As cities go, not only Mumbai but all the othermajor ones are hosts to slums, except that Nagpurand Pune have between a half and three-quartermillion people in slums which means a third ofNagpur and a fifth of Pune are consigned to livingin slums. The other major towns have less than amillion living in such conditions, the remarkableaspect being that a relatively newer city like NaviMumbai having about the same population (0.14million) in such conditions as are to be found inNashik or Aurangabad, which are older cities.
The City, the Slum and Fertility Issues
Whatever the size of the town or city in Maha-rashtra, a slum is almost an inevitable feature,mainly because of unaffordable housing and migra-tion from less endowed regions of the State and thecountry. The number of slums and the numbers ofinhabitants of such slums, give it a larger dimensionin major cities like Mumbai.
Alternative growth centres seem to be an option,tried but not with much success by way of feltimpact on the earlier congested habitat which con-tinue to remain that way, notwithstanding themovement away from major locations of concen-trated populations. Slums have seldom disappearednaturally because people have abandoned them.They are in fact re-occupied by others.
Decentralisation would depend largely on theefforts at dealing with relocation of industrial activityand creating new employment opportunities outsideMumbai. If Navi Mumbai’s experience is any indica -tion, the efforts at population dispersal has not keptpace with expectations simply because hoped-forlevels of new opportunities did not materialise.
In the long run, the population would have to bedispersed, though there has been intermittent debateon limiting or even stopping the influx of migrants.Such proposals, however, face constraints imposed bythe Constitution, which gives freedom of movement,and by implication, choice of residence. However,decongestion of cities is the real solution, an inescap-able requirement but least attended to.
28 Human Development Report Maharashtra 2002

Meantime, to contend with the issue of slumsweakening the urbanisation effect, the present pictureindicates the need to improve the health services forslum areas by strengthening the urban health infra-structure like urban health posts. No doubt, eventoday slum indicators in Mumbai on some aspectsare better than other urban areas in Maharashtrathough they are far worse than non-slum areas.
Table 3.12
Slum and Non-Slum Population of Ten Cities/Towns in Maharashtra
(in million)
Town/CitySlum
PopulationNon-SlumPopulation
TotalPopulation
Maharashtra Class I and II Towns
10.64 23.16 33.80
Greater Mumbai 5.82 6.09 11.91Nagpur 0.73 1.32 2.05Pune 0.53 2.01 2.54Thane 0.42 0.84 1.26Amaravati 0.23 0.32 0.55Solapur 0.23 0.64 0.87Malegaon 0.21 0.20 0.41Nashik 0.14 0.93 1.07Navi Mumbai 0.14 0.57 0.71Aurangabad 0.14 0.74 0.88Source: Registrar General, Government of India, 2001.
Table 3.13
Utilisation of Health Services and its impacton Fertility and Mortality
Indicators from NFHS-2Mumbai
Non-Slum
MumbaiSlum
OtherUrbanAreas of
Maharashtra
Infant Mortality Rate 16.3 28.1 34.7% Institutional Deliveries 92.0 84.0 79.0% Receiving Antenatal
Check-up97.6 95.1 94.8
% Using Contraception 63.0 52.0 59.0% Higher Order Births
(3+)25.0 35.0 33.0
Total Fertility Rate 1.4 2.7 2.2Source: NFHS-2
NFHS-2 data shows that utilisation of healthservices in Mumbai’s slums is a shade better thantheir use in other urban areas of Maharashtra though
it is not as good as non-slum areas (Table 3.13). Yet,fertility in slum areas is worse than not only non-slum areas and but also higher than other urbanareas of Maharashtra. Even contraception use inslum areas is lower than other urban areas, despitebetter utilisation of antenatal services. It appearsthat efforts in slum areas to strengthen the familyplanning services to bring about change in theirattitude regarding family size and to persuade themto accept family planning at an earlier stage isrequired. More efficient service delivery along withInformation Education Communication activitiesto change the attitude in slum areas is called for.
Cultural VariationsCultural variations also can influence acceptance ofthe small family norm and utilisation of healthservices and its impact on the process of decline infertility and mortality. Religion and caste can betaken as a proxy for cultural practices. From thispoint of view, the imbalance in the composition ofpopulation by religion and SC/ST population invarious districts can be discussed on the basis of the1991 Census. After Hindus, Muslims with a 9.7 percent content in the total population and Buddhistswith 6.4 per cent are the two other major religiousgroups in Maharashtra.
In most of the districts, the Muslim populationis much less than 10 per cent but in Marathwadaall the districts except Osmanabad have a higherpercentage of Muslim population of between 11 to18 per cent. In the Konkan region, only GreaterMumbai has a relatively high percentage of 16.8. InWestern Maharashtra, Nashik and Jalgaon districtshave a 10 to 11 per cent Muslim population. InVidarbha only in three districts, Buldhana, Akolaand Amaravati, it is 12 to 14 per cent.
As per the same census, 6.4 per cent of the popu-lation in Maharashtra is Buddhist. In Konkan andWestern Maharashtra all other districts except Rat-nagiri (7.5 per cent), Greater Bombay (5.6 per cent),and Satara (5.1 per cent) have less than 5 per centBuddhist population. In Marathwada half the dis-tricts—Aurangabad, Jalna, Parbhani, and Nanded—have a Buddhist population between 9–12 per cent.
Population: Trends and Prospects 29

In seven districts of Vidarbha: Nagpur, Bhandara,Chandrapur, Akola, Amaravati, Wardha, Buldhanathis population is in the range of 12–17 per cent andone more district, Gadchiroli has 8 per cent of them.
About 11 per cent of the total population belongto the scheduled castes but all the districts in Ma-rathwada had a higher percentage of scheduled castepopulation (11–19 per cent). In Western Ma-harashtra only five districts, Ahmednagar, Sangli,Solapur and Kolhapur report a higher percentage ofscheduled caste population (12–15 per cent). InVidarbha, majority of districts—Akola, Amaravati,Wardha, Nagpur, Bhandara, Chandrapur and Gad-chiroli hosts a higher percentage (12–18) of sched-uled caste population.
About 9 per cent of the population in Ma-harashtra are scheduled tribes, according to the 1991census. Not a single district in Marathwada exceptNanded (11.8 per cent scheduled tribe population)has more than five per cent scheduled tribe popula-tion. In the Konkan region, Thane and Raigad record18.1 and 12.8 per cent population respectively. TwoWestern Maharashtra districts, Dhule with 40.9 percent and Nashik with 24.2 per cent and three districtsin Vidarbha, Gadchiroli (38.7 per cent), Chandrapur(19.7 per cent) and Yavatmal (21.5 per cent) have ahigh concentration of scheduled tribe population.Besides these, four more districts in Vidarbha, Ama-ravati, Wardha, Nagpur and Bhandara have around14–16 per cent of tribals.
Cultural Constraints
Though programmes and services are the same acrossthe State, the efficiency of their implementation, thequality and the extent to which these services areaccessible, efficient and utilised by the people differfrom district to district. It depends on the attitudeand the overall level of modernisation reached by thepeople, who are both—beneficiaries of the pro-grammes as well as the workers who implement theprogramme. Education, urbanisation, exposure tomass media act as modernising forces which canchange attitudes and improve the utilisation andquality of various programmes. At the same time,
many cultural practices and behavioural patterns con-tinued over generations can act as constraints. Ifdifferent regions have inherited different culturaltraits, they do not progress at the same pace. So it isessential to see whether there are pockets where theforces are not congenial to such changes, and thendesign strategies to overcome constraints.
It is in this context that instead of treating thewhole of Maharashtra as one homogenous entity, itmay be prudent to adopt area-specific strategies. But‘area’ here is not a geographical concept. It hascultural connotations due to certain historical fac-tors in a State comprising broad, distinct regionslike Marathwada, Vidarbha and Western Ma-harashtra and Konkan, each with a varying culturalnuance or attitude.
Marathwada, once part of the erstwhile Nizam’sHyderabad State, has distinct cultural traits inher-ited from there. It has a relatively higher Muslimpopulation and later Buddhist population. Vidar-bha is more attuned to the cultural practices of theHindi belt, having been a part of it earlier.
Western Maharashtra is different from these tworegions, but has extreme variations within it. TheKonkan’s Mumbai-Thane belt, plus Pune, industri-alised and urbanised, has within it vast slum popu-lations which again are not homogenous. It consistsof people from various states. In the rest of WesternMaharashtra too, on the one hand there are districtslike Sangli-Kolhapur which are a part of the sugar-belt and consists of a new rich population with highaspirations, while on the other hand there is a heavyconcentration of tribal population in Nandurbarand Nashik districts. Even the new rich sugar beltdistricts are facing challenges like a decline in sexratio and widespread risk of HIV/AIDS.
By and large, the quality of Family Planning andhealth services has to improve. And more impor-tantly, to generate demand for these services in allsections of the population, strategies need to bedeveloped keeping in view the needs of differentpopulation groups, which are under-served or whichdo not utilise the available health and family welfare
30 Human Development Report Maharashtra 2002

services fully. Muslims, for instance, identify familyplanning with sterilisation, to which they are opposedto but might be favourable to spacing methods buthave high order births compared to any other seg-ment of the population. Tribals have their own dis-tinct culture, diet pattern and system of medicine andthey hardly resort to the modern system. Mumbaislum population consists of thousands of migrantswho carry from their native place to Mumbai theirown culture, attitude, and behavioural patterns,which influences their demographic behaviour.
Earlier research has shown that Muslim respon-dents generally do not favour sterilisation but theydo not have objection to other methods. NFHS-2data also shows that among Muslims, only about 37per cent respondents have accepted while another11 per cent use modern spacing methods. One percent uses traditional methods. Among Hindusabout 54 per cent opted for sterilisation and hardlyeight per cent the spacing method. Even amongBuddhists about 61 per cent have accepted sterili-sation and among scheduled castes 57 per cent haveaccepted it.
The Survey does not show that scheduled casteor Buddhist populations have any opposition tosterilisation. Among scheduled tribes, the level ofcontraceptive use is much lower at 54 per cent thanothers (61–64 per cent). But even among them,about half accept sterilisation and hardly four percent accept spacing methods. Comparison of thetotal fertility rates of different groups show that onan average, there are varying fertility rates amongsocial groups of Muslims, Hindus and also amongBuddhists, Scheduled Castes and Scheduled Tribes.
Therefore, new and effective culture specificstrategies for the Muslim, the tribal and the slumpopulation need to be designed to ensure that theyuse the services. The approach could involve abroader base of expertise, including medical practi-tioners with deep insights into the attitudes of thesesegments of population, the NGOs and communityleaders. Because Maharashtra is already a ‘developedState’ the challenge of a heterogeneous populationcannot be ignored. Actually, it cries out for attention.
The Future
Maharashtra’s population as per the 2001 census at96.8 million has far exceeded the projected popu-lation estimates of the Expert Committee which putit at 91.03 million and also the estimate given bythe Population Foundation of India, 92.99 million.
Four sets of population projections for the year2021 are possible, based on the actual data of theCensus 2001, where alternative assumptions regard-ing fertility and mortality are employed.
If the TFR of 2.01 which is the replacementlevel is the goal as envisaged by the Government ofMaharashtra’s New Population Policy is reached in2004, the TFR of 1.8 which Kerala now has securedwould be sometime in 2011. This would mean fasterfertility decline.
If the decline in TFR is delayed by ten years,the replacement level would be attained only around2014 and the Kerala’s TFR would be reached in2016 and not 2011—a delay of five years. Thatwould be a slow fertility decline.
If the life expectancy at birth for males wouldincrease from 66 in 2001 to 72 in 2021 and forfemales, increase from 69 to 75 in the same period,the IMR would drop from 38 to 18 in two decadesfrom 2001 to 2021. That would be slow mortalitydecline.
If the expectancy of life at birth for malesincreases from 66 to 75, and correspondingly forfemales from 69 to 78 by 2001, the IMR duringthe two decades would decline from 38 to 10. Thatwould be fast mortality decline.
Net migration levels and age distribution forboth male and female migrants as assumed in theExpert Committee is also assumed for each decadefor this set of projections. It would be close to thenet migration for Maharashtra during 1991–2001.
If the health system and other forces that impingeon the demographic status do not lead to efficient
Population: Trends and Prospects 31

performance and if the fertility and mortality declineslowly, the population would reach 126.1 million in2001, adding 29.4 million to what the number is now.If the health system and modernising forces are moreefficient, both fertility and mortality will decline fast,the population would be 125 million in 2021, adding22.25 million to the population.
On the other hand, if the mortality declines fastbut fertility declines slowly, then the projection is ofa highest growth when the population would reach127.4 million in 2021. A minimum addition can beforeseen if mortality declines slowly and fertility de-clines faster. In that event, the population would reach123.6 million in 2001.
In short, Maharashtra will face the challenge ofat least a 124 million population. Even if the Popu-lation Policy succeeds in achieving both the goalspertaining to fertility and mortality, population in2021 will be around 125 million, provided thatmigration trend continues unchanged. If it is ableto achieve only the mortality goal and fails to achievethe fertility goal in the given time, the populationwill reach 127 million by 2021.
Policy Implications
There is a need to adopt suitable policies and tostrengthen the existing policies to accelerate theprocess of fertility and mortality decline in Maha-rashtra and to improve the quality of life. The imperatives are as follows:
• Finding effective measures to reduce mortality ofchildren within one month after birth.
• Strengthening the urban health infrastructure todeal with nearly stagnant urban neonatal childmortality.
• Implementing strictly laws relating to the age ofmarriage, especially of girls, and strengtheningextension activity to change the attitude of peopletowards early marriages and their adverse impacton health, family economics and resultant socialimplications.
• Promoting spacing methods among young cou-ples to reduce teenage fertility.
• Efforts to emphasise early acceptance of spacingmethods and sterilisation after two children, re-gardless of the sex composition of the family bythat time.
• Strengthening of extension activities and effortsby non-governmental organisations to project apositive image of a girl to reduce son preferenceand prevent sex selective abortions.
• Serious and continuous efforts at improving thecoverage and utilisation of antenatal services andpromotion of deliveries attended by health pro-fessionals.
• Using the power of the electronic media forimproving exposure to family planning messagesdirectly and giving the message indirectly throughits more innovative and imaginative use.
• Strengthening of health and family welfare serv-ices for slum population of Mumbai.
• Inter-sector co-ordination to strengthen efforts toreduce the regional imbalance by providing moreemployment opportunities, infrastructure etc., toimprove the quality of life in less developeddistricts, especially in the Marathwada regionwhich is least advanced in terms of most of theindicators.
More than mere direct incentives and disincen-tives, these long-term measures are more likely toaccelerate the process of population stabilisation inMaharashtra.
Chapter IV →
← Contents
32 Human Development Report Maharashtra 2002


CHAPTER IV
Economic Development: Growth and Equity
Maharashtra has consistently done well foritself in terms of economic growth. ItsState Domestic Product is the second
highest among all States despite the poor quality ofits arable land, scanty rainfall in the interiors and askewed spatial distribution of its resource endow-ments. During the 1990s, Maharashtra’s perform-ance was next only to neighbouring Gujarat. Inindustrialisation too it ranks high and is constantlyin race for further industrial investment with Gu-jarat. In terms of per capita income, it is onlymarginally lower than Punjab.
However, economic growth has necessarily to bejudged in terms of its sectoral composition andregional distribution as well as its impact in termsof generating income and employment for the poor.As the foregoing analysis would show, the problemis the pattern of distribution where wealth has beenunevenly distribute, leading to wide disparities.
This growth, a significant development experi-ence in the country, has been rich and prismatic,achieved against odds. It has come largely fromnon-agricultural sectors, essentially in regions like
Box 4.1Informal Sector and Employment in Maharashtra
Data from the Economic Census and Sample Sur-veys in Maharashtra indicates that the informalsector in urban areas and urbanised districts isincreasingly a predominant source of employmentin the State.
Employment in Maharashtra has increased inabsolute terms from 8.42 million to 9.47 million,between the years 1990 and 1998. During thisperiod, the share of informal sector employmenthas increased from 52 to 59 per cent indicating thegrowing predominance of this sector in Maha-rashtra. The composition of employment genera-tion in the informal sector has been shifting awayfrom establishments towards own account enter-prises (OAEs). An examination of the sectoral dis-tribution of employment in OAEs revealed agrowing proportion of employment in retail tradefrom 41 per cent to 18 per cent, while the share ofthe manufacturing sector declined from 24 per centto 18 per cent.
At the regional level, over 70 per cent of non-agricultural employment in the State is being gen-erated in urban areas over the past two decades.Further five out of thirty districts, viz., Mumbai,
Thane, Pune, Nashik and Nagpur accounted for 55per cent of total employment in the non-agriculturalsector. During the period 1990–98, there has beena distinct trend of growing informalisation of em-ployment. A substantial proportion of employment,both in agricultural and non-agricultural activities,has been generated in own account enterprises.
There has been greater dependence on unor -ganised employment and a tendency of resortingto home-based employment opportunities, both inrural and urban areas and across districts. Lack ofadequate employment opportunities in non-agricultural establishments, which is confinedmainly to urban areas, has caused a trend of grow-ing employment in home-based enterprises. As aresult, the more industrialised districts of Mumbai,Thane and Pune continue to be the principalsource of employment in the State.
While employment opportunities have in -creased at an annual rate of 1.56 per cent, substan-tial rise has been in the informal sector. This sectoris typically characterised by underemployment andchronic income deprivation, accentuating theproblem of poverty among the employed.
Economic Development: Growth and Equity 33

Mumbai and Thane, leading to both sectoral andregional imbalances in development. This growth,led by an urban-centric, non-agricultural focus hashad its visible consequences: pockets of urban afflu-ence with shades of poverty and a continuing drawfor migrants. As Box 4.1 shows, the urban informalsector is now playing a major role in providingemployment in the State.
The engines of growth in the rural economyneed to be strengthened further, especially as thebulk of employment continues to be in the farmsector. A corrective required to neutralise the restric-tion of the capacity to absorb the rural labour intoproductive activities has been the much-lauded Em-ployment Guarantee Scheme, a mechanism thatensures wages to the farm labour that finds no workon the farms for any reason, including droughts.
Income Instability
Agriculture in the State is the laggard. It continues
to be at the mercy of uncertain monsoons, which iseither inadequate in precipitation or uneven inspread over the season, putting agriculture undertremendous stress. As a result, the rural populationis subject to a high degree of instability in incomesand levels of living. As a means to counter thisincome instability, for instance, more women—twice in number than that of men—work as mar-ginal workers, seeking to supplement familyincomes. It also signifies low gains from agricultureas well as individual efforts to contain the impactof poverty.
Rainfall distribution is uneven, varying consid-erably across the regions, a major part being drywith rainfall below 800 mm annually. Even wateravailability for drinking is uneven, with some vil-lages even now lacking adequate potable drinkingwater, the supply becoming quite scarce in summer.As early as 1984, Ahmednagar, Solapur, Dhule,Jalgaon and Buldhana, were categorised as droughtprone. Estimates for 1999–2000 show that only14.5 per cent of the net sown area in the State wasirrigated, that too mainly because of irrigation bywells; some 55 per cent of the total irrigation is bywells. Farming being thus vulnerable to drought,the average yields of cereals per hectare and totalfood grains production is the lowest among themajor States with the State producing only 90 percent of its requirement.
Smaller Landholdings’ Impact
Rural economy is not diversified. Some 83 per centof the operational holdings are devoted to cropproduction and 13 per cent to livestock. The averagesize of the landholding has decreased, from 4.28 perhectares in 1970–71 to 3.11 hectares in 1980–81,2.64 hectares in 1985–86 and 2.21 hectares in1990–91, impacting adversely on productivitythough smaller holdings mean more people havesome, though small, landholding now than they didin the past. The pressure of population on land isintense and increasing, as is evident from the fall inthe average size of holdings. But this has beenfurther compounded by an increase in the inequalityin distribution of operational holdings. The Gini
Box 4.2The Landless Farmer and EGS
The agricultural census of 1991–92 placed thenumber of small farmers holding between oneand two hectares of land at 27,27,587. On theother hand, the number of marginal farmersholding less than one hectare of land accordingto the same census, was 32,74,761.
The number of persons engaged as agricul -tural labour, however, was higher than the totalof the small and the marginal farmers: 83,13,223.And those who registered themselves for workbecause of perceived risk of unemployment dur-ing that time of distress numbered 45,18,974 ofwhom 21,46,560 were women.
These numbers underscore the profile of thelarge mass of people dependent on agriculture,instability of incomes and the extent of distressduring droughts.
According to the Maharashtra Economic De -velopment Council figures, in 1961, cultivatorsand agricultural labour accounted for 70 per centof total workers in Maharashtra. In 1991, it was60 per cent.
34 Human Development Report Maharashtra 2002

coefficient being 0.526, 0.571 and 0.598 in 1970–71 1981–82 and 1991–92 respectively.1
There is, thus, a limitation to the potential foragricultural growth in Maharashtra. So is the casewith the scope for rural labour absorption andproductive employment, rendering the State’s econ-omy a hostage to this lag. The unemployment ratesin rural and urban Maharashtra for instance is high,and about two-thirds of the workforce is dependenton agriculture as a source of livelihood resulting inlow levels of per capita income in rural areas. Thisconstraint drove Maharashtra towards a path thatled to pursuing growth options largely on the non-agricultural front. The record has been one wheresecondary and tertiary sectors have been the instru-ments of the growth process but not so with regardto absorption of a growing workforce. To make adifference, Maharashtra has to alleviate unemploy-ment and poverty in the rural sector.
Income and Undernourishment
Income levels indicate and determine partly theextent of human development. Its nuances, how-ever, are better profiled not just by the levels butthe periodic changes in their levels, aggregate as wellas its composition. Such an empirical approachhelps appreciation of the magnitude of the problemof underdevelopment and to identify the sectors thatcause the lag.
A major part of Maharashtra is poor in terms ofincome. There is a substantial incidence of poverty,statistical estimates for the State as a whole showinga decline in poverty over time but these are notcorroborated by estimates of real consumption.Measured by quantities of cereal consumption andcalorie intake, the population does not show anymarked improvement. A large proportion of therural and urban population is undernourished.
Trends
In terms of income measure—which is one but notthe sole determinant of human development—Ma-harashtra emerges as one of the richer States in thecountry. In 1998–99, the per capita State DomesticProduct (SDP) was Rs 20,644, higher by about 40per cent of the all-India average of Rs 14,712.
Provisional estimates for 1999–2000 show theSDP at current prices to be Rs. 21,22,160 millionand the per capita SDP at Rs 23,398. A little morethan half of the total contribution to this came fromthe tertiary sector which was, at 11,17,730 millionor 52.67 per cent. The primary sector contributed17.18 per cent with Rs 3,64,590 million, the secon-dary sector’s share being 30.15 per cent, i.e.,Rs 6,39,840 million, marking Maharashtra as havinga large non-agricultural economy.
Table 4.1
Sectoral (%) distribution of workers: Maharashtra
Sector 1961 1971 1981 1991Primary 72.07 66.73 64.03 61.51Secondary 12.52 14.52 16.07 15.80Tertiary 15.41 18.75 19.90 22.69Total 100.00 100.00 100.00 100.00Source: Census abstracts.
An important feature of this pattern of economicdevelopment is that the secondary and tertiary sectorstogether dominate the output generating activities interms of both origin of income and employment ofworkforce. Maharashtra emerges as the most devel-oped because, Punjab, though richer than Maha-
1. The Gini coefficient is a statistical measure to mark the extentof inequality, varying from ‘0’ to ‘1’. When income is equallydistributed, when everyone in society has the same level of income,
1753
30
Primary Secondary Tertiary
Figure 4.1
State Domestic Products: Rs 21,22,160 million(1999–2000)
Economic Development: Growth and Equity 35

rashtra in terms of income, is predominantly anagrarian economy in terms of both income andemployment criteria. But looking at only the sectoralshare of employment, primary sector contributes themost in Maharashtra, as shown in Table 4.1.
Economic Growth
Since its formation in 1960, Maharashtra’s econ-omy, in terms of net SDP grew at 4.73 per cent perannum till 1999–2000 and the per capita SDP at2.43 per cent per annum. In comparison to theall-India performance over successive Plan periods,Maharashtra’s performance shows the non-agricul-tural sectors playing a major role; neutralising theadverse implications of the poor performance of theprimary sector. What is more important is that thegrowth rate has accelerated in successive decades.
Maharashtra’s economy was virtually stagnantduring the 1960s. Per capita SDP stagnated largelydue to stagnation in the agricultural domesticproduct. The dominance of agriculture in theprimary sector had considerable adverse implica-tions for the rural economy, worsening the unem-ployment and poverty situation in ruralMaharashtra. The decline in primary sector domes-tic product, however, was more than neutralisedby positive growth rates in the secondary sector at4.42 per cent per annum and tertiary sector at4.31 per cent. As a result, the domestic productin Maharashtra’s economy as a whole increased ata modest rate of 2.52 per cent per annum. Thetotal SDP growth just managed to keep pace withthe population growth rate.
Though agricultural performance improvedduring the subsequent decades, its progress was notsustained. It registered a growth rate of 6.64 percent per annum during 1970–80, stagnated at astatistically insignificant 3.28 per cent per annumduring 1980–90 and picked up at 4.39 per centper annum again in 1990–00. The average agricul-tural growth rate during 1960–2000 was 2.92 percent per annum, which barely exceeded the popu-lation growth rate of 2.24 per cent. The primary
sector as a whole showed a growth pattern similarto agriculture.Irrigation Productivity and Livelihood
Irrigation is intrinsically related to the productivityof land and livelihood of a large number of people,droughts being a single major cause of socio-economic drag on the development, and Maha-rashtra would have been expected to focus on irrig-ating its land rapidly. This in turn is linked to a
number of socio-economic issues confronting theState (Figure 4.2).
Maharashtra’s position remained poor in terms ofproductivity of food grains production. Its relation-ship to irrigation is unmistakable (see Figure 4.3).
Since 1960, there has been a significant devel-opment of irrigation but its growth rate has not beenmaintained. Especially in the background of a na-tional average of 33 per cent, this stagnation isstriking. Many suggestions to optimally use irriga-tion, by an eight-monthly instead of perennial sup-ply for crops like sugarcane, which consumes mostof the irrigated water, have been propagated but notwidely implemented.
When irrigation is scarce, Maharashtra has cho-sen water-intensive sugarcane as its principal cashcrop and built an impressive rural socio-political andeconomic edifice, which is responsible for someone-third of sugar production in the country. More
0
2
4
6
8
10
60—61 70—71 80—81 90—91 99—00
Yiel
d pe
r hec
tare
of f
ood
grai
n in
10
0 kg
0
5
10
15
20
Gro
ss ir
rigat
ed a
rea
as %
of
gros
s cr
oppe
d ar
ea
Productivity Irrigation
Figure 4.2
Comparison of Irrigation and Productivityover Four Decades
36 Human Development Report Maharashtra 2002

than half of the irrigation goes to sustain a crop onthree per cent of its cropped area.
Sugarcane requires 10-hectare cm per wetting,30 wettings producing some 1,000 quintals. Onthe other hand, millet, often needing only suppor-tive irrigation, can do with five-hectare cm perwetting, for just two wettings. These two crops, ofcourse, are at the two extreme ends of a spectrumof crops with rice for instance falling somewherein the middle, needing just seven-hectare cm perwetting for ten wettings. Grape and fruits requireabout the same quantum per irrigation as rice but
the crops need to be irrigated almost thrice thenumber of times. On the other hand, in respect ofirrigation, the share of gross irrigated cropped togross cropped area has risen from 6.48 per cent in1960–61 to 15.41 per cent in 1999–2000 but thatis hardly enough to ensure security to the agricul-tural sector.
The secondary and tertiary sectors, on the otherhand, registered sustained improvement (AnnexureTable 26). Consistent with the overall growth pat-tern of these two sectors, total SDP too improved.As a result, per capita SDP, which stagnated during
0
5
10
15
20
25
30
35
40
Mahara
shtra
Madhy
a Prad
esh
Rajasth
anOris
sa
Karnata
ka
Gujarat
Bihar
India
Andhra
Prades
h
Uttar P
rades
h
West B
enga
l
Tamil N
adu
Haryan
a
Punjab
Gra
in p
er h
ecta
re in
100
kg
0
10
20
30
40
50
60
70
80
90
100
Are
a as
% o
f cr
op
ped
are
a
Productivity
Irrigation
Figure 4.3
Comparison of Irrigation and Productivity of Land
Box 4.3Participatory Irrigation Management: Pani Panchayats in Maharashtra
There has been a concerted effort at equitabledistribution of irrigation water, mostly by NGOsacross Maharashtra, with varying degrees of suc-cess. The Pani Panchayat, a concept of collectiverights, believes that water is a community asset thathas to be shared by all—including the landless—and Water User Societies that emerged by people’saction on canals owned and operated by the Gov-ernment have tried to make sure that its distribu-tion was optimised. This has actually inspired theGovernment of Maharashtra to decide that in thenext three years, it would move out of distributionof irrigation water and instead, allow co-operativesof farmers to deal with it to ensure that the missing
equity in entitlements are restored to water usersas well as promote efficiency in utilisation.
A 21 June 2001 decision of the Government ofMaharashtra is that unless farmers form such co-op-eratives, they would not receive irrigation water fortheir fields. Water from completed irrigation projectswould be assigned on a volumetric basis for crops ina manner that suffices the irrigation needs of theplanned cropping pattern and the distribution has tobe by farmers themselves. In that event, the scope ofpreference for crops other than the pattern laid downin the command management programme would beminimised, ensuring equity in water shares.
Economic Development: Growth and Equity 37

the 1960s, started growing thereafter. It increasedat about the same rate of 3 per cent per annumduring the 1970s and 1980s and at an acceleratedrate of 4.65 per cent per annum during the 1990s.In sum, per capita SDP increased at the compoundannual growth rate of 2.43 per cent per annumduring the entire period.
Uneven Sectoral Growth
The growth process of Maharashtra is characterisedby periodic fluctuations across almost all the sectors.Still there are some sectors, which played an impor-tant role in the growth process. For instance, asregards the secondary sector, manufacturing in bothregistered and unregistered segments, electricity, gasand water supply have been the most vibrant activi-ties in the sense that they have shown a sustainedgrowth record over the decades. Trade, transport,communication, banking and real estate dominatedthe scene with reference to the tertiary sector.
The uneven growth performance of the threemajor sectors is amply brought out by fluctuationsin their respective shares in the total SDP. Theprimary sector’s share declined gradually from 42.14per cent in 1960–61 to 29.86 per cent in 1970–71,27.69 per cent in 1980–81, 22.88 per cent in1990–91 and finally to 17.44 per cent in 1999–
2000. This would clearly imply that the primarysector, agriculture in particular, has not shown thegrowth momentum to the same extent as the re-maining sectors.
The secondary sector as a whole increased itsshare from 26.13 per cent in 1960–61 to 31.70 percent in 1970–71 and remained at the same level forthe rest of the period. Thus the secondary sector haskept up with the average pace of the economy sincethe 1970s. It is the tertiary sector, which seems tohave grown consistently at a pace higher than theaverage for the economy. Its share increased from31.73 per cent in 1960–61 to 38.44 per cent in1990–91 and finally to 50.45 per cent in 1999–00.Trade and transport seem to be the major sub-sectors,which account for the observed growth performanceof Maharashtra.
The primary sector, notwithstanding its declin-ing share of output, continues to be the major sourceof livelihood in terms of employment While its shareof income has declined from 42.14 to 22.88 percent between 1960–61 and 1990–91 its share ofwork force declined from 72.07 to 61.50 per cent.In other words, the percentage point decline inemployment is less than the decline in share ofoutput for the primary sector. The secondary sectorincreased its share of output as well as workforce.
Box 4.4Sectoral Composition and District Incomes
Sectoral distribution of incomes across districtsshows regional disparities in the level and nature ofeconomic activities.
Greater Mumbai, once a huge base for manufactur-ing, has 36 per cent of its income accounted for bythe secondary sector and 62 per cent by the tertiary.Structural changes as indicated by the relative de-cline, as was with Mumbai metropolitan region,where the primary sector declined but others gainedascendance to contribute more, is visible in Thaneand Raigad districts. Pune, Nagpur and Auranga-bad also followed this pattern.
At the other extreme are districts like Sindhudurgin Konkan, Osmanabad in Marathwada, Gadchi-roli and Chandrapur in Vidarbha show a high share
of income from the primary sector which is as highas 40 per cent.
As per the Fourth Economic Census Report, 1998of the total enterprises in Maharashtra, 15 per centare in Greater Mumbai followed by 7.4 per cent inPune, seven per cent each in Kolhapur and Thanedistricts.
In terms of jobs generated, Greater Mumbai holdsthe prime place, accounting for 27 per cent of thetotal employment in Maharashtra. Thane, Puneand Kolhapur follow with 8.8 per cent, 8.2 per centand five per cent respectively. These four locationsaccount for close to half i.e., 49 per cent of all jobsin Maharashtra, underscoring yet again regionaldisparities and their consequences.
38 Human Development Report Maharashtra 2002
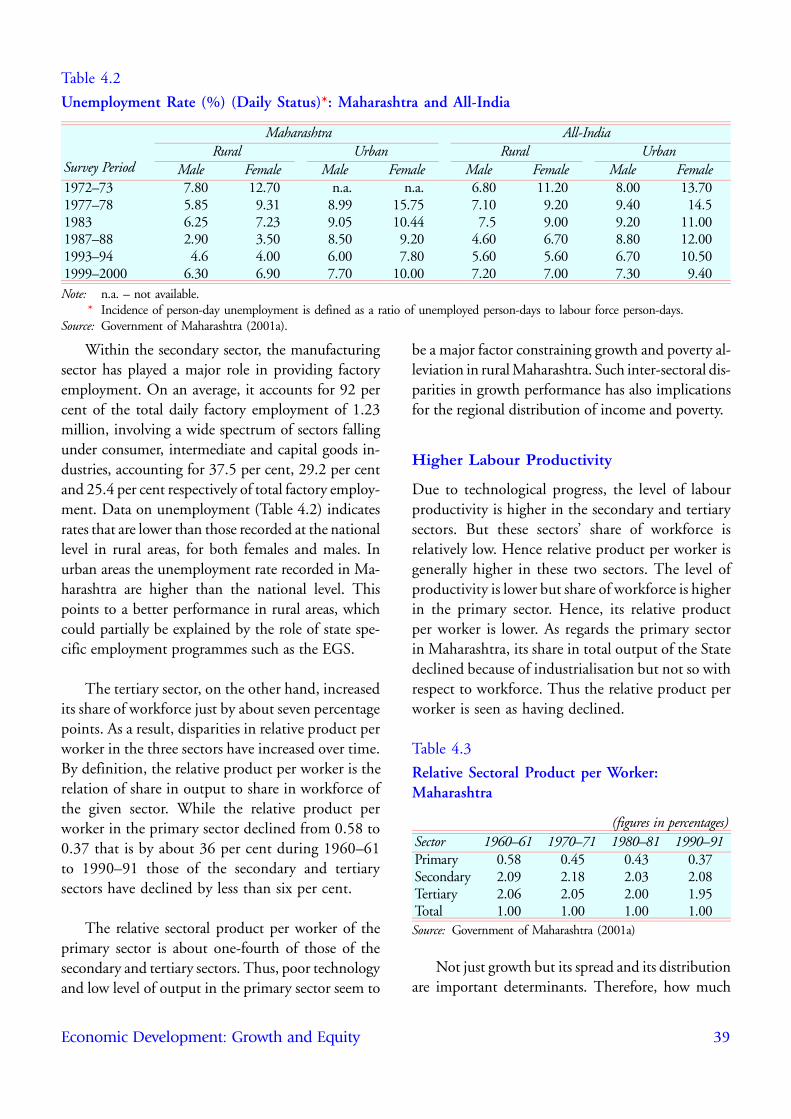
Within the secondary sector, the manufacturingsector has played a major role in providing factoryemployment. On an average, it accounts for 92 percent of the total daily factory employment of 1.23million, involving a wide spectrum of sectors fallingunder consumer, intermediate and capital goods in-dustries, accounting for 37.5 per cent, 29.2 per centand 25.4 per cent respectively of total factory employ-ment. Data on unemployment (Table 4.2) indicatesrates that are lower than those recorded at the nationallevel in rural areas, for both females and males. Inurban areas the unemployment rate recorded in Ma-harashtra are higher than the national level. Thispoints to a better performance in rural areas, whichcould partially be explained by the role of state spe-cific employment programmes such as the EGS.
The tertiary sector, on the other hand, increasedits share of workforce just by about seven percentagepoints. As a result, disparities in relative product perworker in the three sectors have increased over time.By definition, the relative product per worker is therelation of share in output to share in workforce ofthe given sector. While the relative product perworker in the primary sector declined from 0.58 to0.37 that is by about 36 per cent during 1960–61to 1990–91 those of the secondary and tertiarysectors have declined by less than six per cent.
The relative sectoral product per worker of theprimary sector is about one-fourth of those of thesecondary and tertiary sectors. Thus, poor technologyand low level of output in the primary sector seem to
be a major factor constraining growth and poverty al-leviation in rural Maharashtra. Such inter-sectoral dis-parities in growth performance has also implicationsfor the regional distribution of income and poverty.
Higher Labour Productivity
Due to technological progress, the level of labourproductivity is higher in the secondary and tertiarysectors. But these sectors’ share of workforce isrelatively low. Hence relative product per worker isgenerally higher in these two sectors. The level ofproductivity is lower but share of workforce is higherin the primary sector. Hence, its relative productper worker is lower. As regards the primary sectorin Maharashtra, its share in total output of the Statedeclined because of industrialisation but not so withrespect to workforce. Thus the relative product perworker is seen as having declined.
Table 4.3
Relative Sectoral Product per Worker: Maharashtra
(figures in percentages)Sector 1960–61 1970–71 1980–81 1990–91Primary 0.58 0.45 0.43 0.37Secondary 2.09 2.18 2.03 2.08Tertiary 2.06 2.05 2.00 1.95Total 1.00 1.00 1.00 1.00Source: Government of Maharashtra (2001a)
Not just growth but its spread and its distributionare important determinants. Therefore, how much
Table 4.2
Unemployment Rate (%) (Daily Status)*: Maharashtra and All-India
Survey Period
Maharashtra All-IndiaRural Urban Rural Urban
Male Female Male Female Male Female Male Female1972–73 7.80 12.70 n.a. n.a. 6.80 11.20 8.00 13.701977–78 5.85 9.31 8.99 15.75 7.10 9.20 9.40 14.51983 6.25 7.23 9.05 10.44 7.5 9.00 9.20 11.001987–88 2.90 3.50 8.50 9.20 4.60 6.70 8.80 12.001993–94 4.6 4.00 6.00 7.80 5.60 5.60 6.70 10.501999–2000 6.30 6.90 7.70 10.00 7.20 7.00 7.30 9.40Note: n.a. – not available.
* Incidence of person-day unemployment is defined as a ratio of unemployed person-days to labour force person-days.Source: Government of Maharashtra (2001a).
Economic Development: Growth and Equity 39

and what has been the economy’s spread across thedistricts and regions and how evenly? The Fact Find-ing Committee on Regional Imbalances in Maha-rashtra has gone into that question and districts havebeen classified based on a set of indicators for agricul-ture, industry, human resources and infrastructure.
Dispersed Development
Inter-district disparities in growth performance maybe verified in terms of the simple outcome measure,viz., district-wise estimates of income and its com-position. The estimates for 1998–99 bring out thefollowing features that are a cause for concern.
• Dhule, with a per capita domestic product ofRs 11,789, is the poorest district. Mumbai districton the other hand, has a per capita domestic prod-uct of Rs 45,471, which is almost four times thelevel obtaining in Dhule.
One approach to examine the uneven levels ofdevelopment across districts could be to rank themon the basis of per capita district domestic productand classify them into four different ordinal groups,i.e., the poorest, lower middle, upper middle andrichest quarter. This classification could be withreference to the three quartiles, that is, lower quar-tile, middle quartile (median) and the upper quar-tile. The three quartiles for 1998–99 are 13,827,16,700.5 and 20,411 respectively.
• The districts of Dhule, Jalna, Osmanabad,Nanded, Yavatmal, Latur, Buldhana and Par-bhaniform the poorest quarter. They account for just 11per cent of the total income generated in the State.Five of these eight districts belong to Marathwada.
• Ratnagiri, Bhandara, Ahmednagar, Beed, Satara,Akola and Jalgaon belong to the lower middlequarter. These districts, spread across the six dif-ferent geographical divisions of Maharashtra, to-gether contribute just 14.3 per cent to the totalSDP.
• Wardha, Gadchiroli, Amaravati, Solapur, Chan-drapur, Aurangabad, Sindhudurg, and Sangli con-stitute the upper middle quarter. These districtsare located in five different divisions. Their SDPshare at 14.8 per cent is marginally higher thanthat of the lower middle quarter. Placing Gadchi-roli in the upper middle quarter could be surpris-
ing since it is virtually a poor district. But estimatesof income generated by districts are done by allo-cating State aggregates of SDP across regions withreference to its workforce etc., and a district likeGadchiroli ends up showing a statistically higherper capita District Domestic Product. It is thusplaced in the second richest quarter but is actuallythe 17th poorest district.
• The richest quarter consists of Nashik, Kolha-pur,Pune, Nagpur, Raigad, Thane and Mumbai. TheKonkan division, because of Mumbai, MumbaiSuburban and Thane districts in its perimeter,dominates this group. Together they contributeabout 60 per cent of the total SDP.
• Mumbai accounted for about 25 per cent of theState income followed by Thane (ten per cent),Pune (nine per cent) and Nagpur (five per cent).
0 5000 10000 15000 20000 25000 30000 35000
Maharashtra
Mumbai
Thane
Raigad
Nagpur
Pune
Kolhapur
Nashik
Sangli
Sindhudurg
Aurangabad
Chandrapur
Solapur
Amravati
Gadchiroli
Wardha
Jalgaon
Akola
Satara
Beed
Ahmednagar
Bhandara
Ratnagiri
Parbhani
Buldhana
Latur
Yavatmal
Nanded
Osmanabad
Jalna
Dhule
Rupees per annum (at current prices)
Figure 4.4
Per Capita District Domestic Product: 1998–99*
* See Note at Annexure Table. No. 111.
40 Human Development Report Maharashtra 2002

In other words, these four urban or largely urbandistricts alone accounted for about 50 per cent ofthe State income in Maharashtra. On the otherhand, Amaravati division, consisting of the dis-tricts of Buldhana, Akola, Amaravati and Yavatmal,
contributed just seven per cent of the total Stateincome. Thus, a striking character of economicdevelopment in Maharashtra is the wide disparityin income across districts.
Box 4.5Tackling the Developmental Backlog in Maharashtra
Maharashtra was formed in 1960, merging thecontiguous Marathi speaking areas of BombayState, Madhya Pradesh and Hyderabad State. Ofthese three regions, the area from Bombay State wasbetter developed both in economic and social indi-cators though the Marathi-speaking region lackeda distinct business class of its own. The other twowere less developed or relatively backward and foryears, these regional disparities were carried for-ward. Western Maharashtra, with the dominanceof a successful political entrepreneurial class thatemerged later kept the region ahead. This triggered in 1984 the setting up of a Fact-Finding Committee on Regional Imbalance headedby the economist, V.M. Dandekar. The Committeequantified, at 1982–83 prices, the total developmen-tal backlog for the entire State sans Greater Mumbaito be Rs 31,770 million, of which Konkan’s share wasRs 2,956 million, Western Maharashtra-Rs 8,840million, Marathwada–Rs 7,508 million and Vidar-bha–Rs 12,465 million. This backlog in investmenthas been mainly in essential sectors like roads, irriga-tion, public health and technical education, whichstrengthened regional disparities though over theyears, this historic burden was substantially cor-rected, but not completely neutralised. In 1994, three Regional Development Boards,provided for by Article 371(2) of the Indian Consti-tution to give a statutory guarantee to the policy andprocess of removing regional disparities was set up,with the Governor having a special responsibility toensure liquidation of the backlog. Between 1985–86and 1999–2000, Rs 89,808 million was provided forremedial action but actually Rs 82,378 million wasexpended. Inflation played an additional role inkeeping the gap alive; increasing and larger worksbeing undertaken and rising prices and costs addingtheir bit. This provision was activated for the first time inthe country, a full 38 years after it was incorporatedin the Indian Constitution, which also meant thatthere were no precedents to go by for Maharashtra.Article 371(2) enjoins upon the Governor to act to
secure equity in distribution of resources for evendevelopment of the State by neutralising backlogs.This he has to do ‘notwithstanding anything in thisConstitution.’ The spirit behind these Development Boards isto not only ensure equitable distribution of funds tofuel development but to wrench the system awayfrom the traditional belief that planning means fin-ancial allocation and not actual achievements interms of assets. Once the funds available at their dis-posal are allocated to various Government Depart-ments by the Boards, they cease to have any controlover its effective and timely deployment. Sometimes,funds meant for wiping out backlogs in crucial areasare sought to be spent on building gymnasiums oreven wayside bus-shelters. This would call for a lookat the way priorities are determined and a monitoringmechanism evolved and what exists, strengthened. A subsequent committee which reviewed the in -dicators afresh in 1994, determined the then obtain-ing backlog at Rs 153,357 million at current costsper unit of development, spread over the three re-gions. The backlog for Vidarbha was Rs 69,610 mil-lion (45.33 per cent), Marathwada’s share wasRs 46,260 million (30.13 per cent) and rest of Maha-rashtra—not just ‘Western Maharashtra’ DandekarCommitte referred to—had a share of Rs 37,682million (24.54 per cent). The total backlog remain-ing to be tackled now, as of April 2001 is Rs 83,790million after the post-1994 allocations made to neu-tralise the backlog. The panel has shown that between 1984 and1994 disparity had actually widened across the re-gions; the disparity indices for Vidarbha and Marath-wada had increased by 28 and 29 per cent respect-ively but had actually declined in the case of Maha-rashtra by 33 per cent. Sectoral distribution of thebacklog at that point of time indicated that Vidarbhaand Marathwada had a higher backlog in physicalinfrastructure and the rest of the State accounted fora higher backlog in social infrastructure. The estimates of backlog, as of April 2000, on thebasis of cost of projects, were Rs 98,309 million.
Economic Development: Growth and Equity 41

• Not only is there a sharp disparity between GreaterMumbai and rest of Maharashtra but within thevarious regions too a substantial divergence exists.In Konkan, Thane and Raigad have a high percapita district domestic product than its other dis-tricts. In Western Maharashtra, Pune tops butDhule and Nandurbar are at the bottom. In Ma-rathwada, Aurangabad compares closely with mostothers in Western Maharash-tra but within theregion, has no peers; they in fact compare withNandurbar. Buldhana, Yavatmal and Bhandaracome in the same category.
The above discussion shows the extent and criti-cal nature of inter-district disparities in Ma-harashtra. A strategy for balanced and equitabledevelopment would have to address the issue ofredressing historical backwardness in the State ashighlighted in Box 4.5.
Mumbai’s Pre-eminence
Mumbai district has no peers as its per capita do-mestic product exceeds the upper quartile by morethan three times the inter-quartile range, which isthe distance between the lower and upper quartiles.This is a statistical measure used to determinewhether Mumbai is far removed from the remainingdistricts in terms of their general pattern. Mumbai,Thane and Raigad generate per capita income levels,which exceed the upper quartile by more thanone-and-half times the inter-quartile range and aredifferent from the rest of the State. Among the topthree, Mumbai and Thane owe their pre-eminentposition largely to the tertiary sector, which ac-counts for more than 50 per cent of the DistrictDomestic Product, Raigad’s status is based on thedominance of the secondary sector.
Land and the Landless
Land is a major asset base but most of the arableland is of poor quality. Coupled with uneven rainfallpatterns that service the farms, the level of incomegenerated from the agricultural sector is low. Itdeclined during the 1960s. This, coupled with thefact that Maharashtra has a very large proportion of
landless rural households further aggravated therural unemployment situation. It worsened duringthe drought of 1972–73. Still agriculture accountedfor 80.7 per cent of the total rural employment in1977–78. Wage employment constituted 39.7 percent of the total employment with more than halfbeing casual workers.
Thus, the rapid progress in the non-agriculturalsectors has, in totality, given Maharashtra the pushtowards a high level of income. This feature, alongwith the restricted geographical spread of economicdevelopment, implies that both the average level ofincome and the degree of inequality in its distributionacross persons in the State would be high. For the samereason, unemployment and incidence of povertywould be high in the backward regions. The depriva-tion of the poor would worsen in any year of droughtor even bad monsoon. This would call for explicitpolicy intervention of various forms in the economyto deal with drought, unemployment and poverty. Ifso, how did the government policy grapple with thisquestion? How far has it succeeded in its efforts?
Against this background, the Government ofMaharashtra followed a multi-pronged approachinvolving policies that sought to promote equity bydirect institutional reforms and anti-poverty andproductivity enhancing programmes in agriculture.Some of the anti-poverty programmes are imple-mented jointly with the Central Government andothers independently by the State.
Though Maharashtra was formed on a linguisticbasis, it was also a cobbling together of different re-gions that had distinct agrarian structures during thepre-Independence period. Konkan region had mainlysmall landholdings due to its geographical featuresand tenure systems. It had a double tenure systemcalled Khoti, Western Maharashtra had the Rayatwarirevenue system. Marathwada was under the Nizam’srule and the extent of inequality in the distribution oflandholding ownership was much high than in Kon-kan and Western Maharashtra. Vidarbha belonged tothe Central Provinces & Berar, where both Rayatwariand Malgujari tenurial systems prevailed. As a result,
42 Human Development Report Maharashtra 2002
it had a class of large landowners and high degree ofinequality in the distribution of landholdings.
Efforts at reforming the agrarian system con-sisted mainly of measures to prevent fragmentationof holdings, abolish intermediaries, impose a ceilingon land ownership, tenancy laws to confer owner-ship rights on tenants, and redistribute land to thelandless. In addition, the beneficiaries were alsoprovided with financial assistance to meet the costsof developing the allotted land. About 14.9 lakhtenants have benefited to the extent of 17.4 lakhhectares of land. Yet, estimates of the extent ofinequality in the distribution of operational land-holdings as a whole has increased over time. Giventhe diverse agrarian and institutional structures indifferent regions, the regional impact of the reformefforts differed. The impact is marked in Vidarbhaand moderate in Marathwada. In Konkan and West-ern Maharashtra, where land distribution had beenmore egalitarian, the impact as a consequence of theland reforms was felt much less.
Drought Mitigation
The drought of 1972, often described as worst everin recent memory, was a turning point in that itenabled the formulation and implementation ofsome important poverty alleviation and relief duringscarcity. They have remained, since then, with im-provements and changes brought in from time totime in some of the programmes and in the meansemployed by the government to assist the peoplecombat adversities. The most imaginative and directmeans employed towards this end is the Employ-ment Guarantee Programme, executed from theState’s own resources, specifically generated for thepurpose. Programmes sponsored by the Central gov-ernment too find a place in the many ways povertyis sought to be dealt with.
They include:
• Programme of Small/Marginal Farmers and Lan-dless Agricultural Labourers aimed at land devel-opment, optimum use of water and landresources, improved agricultural practices, inten-
sive cultivation, development of small irrigationand animal husbandry.
• Scarcity Relief Programme to deal with scarcityand drought conditions.
• Crash Scheme for Rural Employment till 1974 foremployment generation and asset creation.
• Pilot Intensive Rural Employment Project till1977.
• Village Employment Scheme.• Scheme for the Benefit of Artisans (1974).• Drought Prone Area Programme (1974–75).• Food for Work Programme.
Employment Programmes
Presently, several employment programmes, spon-sored by either the State Government or the Centre,whose avowed objective is to promote economicsecurity of the poor by providing employment, bothself-employment and wage employment, are avail-able. Some of the Centre’s programmes are:
• Jawahar Gram Samridhi Yojana, a centrally spon-sored employment programme and a reincarnationof the Jawahar Rozgar Yojana, to promote infra-structure development involving scope for sus-tained employment opportunities at the villagelevel.
• Employment Assurance Scheme started in Decem-ber 1993, with the twin objectives of provid-ingwage employment to the poor and creating durableassets to sustain growth and employment.
• Swarnajayanti Gram Swarojgar Yojana a restruc-tured version of the Integrated Rural Development(IRDP) and other self-employment programmesto assist the poor families with bank credit andGovernment subsidy for acquiring income gener-ating assets and cross the poverty line within threeyears.
• Swarna Jayanti Shahari Rojgar Yojana is an enve-lope for the Urban Self-Employment Programmeand Urban Wage Employment Programme for theurban unemployed /under-employed poor andeducated upto IX standard.
• Prime Minister’s Rojgar Yojana seeks to provideself-employment to educated unemployed youthsin the rural and urban areas.
Economic Development: Growth and Equity 43

The State Government sponsors its own pro-grammes.
• Employment Promotion Programme wherein theeducated unemployed are trained in skills to securethem employment.
• Employment Promotion Programme for AssistingEducated Unemployed under which ‘Seed MoneyAssistance’ to the extent of 15 to 22.5 per cent ofthe project cost.
• Programmes for training apprenticeship and pro-moting capacity for enterprise among the educatedunemployed.
Employment Guarantee Scheme
One major, and indeed unique, programme forpoverty alleviation through employment generationand asset creation and which has elicited world-wideattention, is the Employment Guarantee Scheme.It is relevant even today despite being launched overa quarter of a century ago. It is based on the geniusof using public works to play the role of a safety netby providing stabilisation benefit to the poor wholack skills of any kind except perhaps possess physi-cal stamina. It has enabled the deployment of labourof the poor to build infrastructure for development.Its preponderant and immediate benefit every year,especially during times of distress due to droughts,is the effect of enabling the poor to handle the riskof decrease in consumption.
For instance, during April to December 2000,the EGS provided 88.4 million person-days of em-ployment as against 27.3 million person-days underthe Jawahar Gram Samridhi Yojana and EmploymentAssurance Scheme. With the shift in emphasis frompure wage employment generation to creation ofsocial and economic infrastructure in the centrallysponsored special employment programmes, the de-mand on the EGS to provide additional employmentopportunities may increase in the future.
The EGS tries to ensure that social security is aright. This programme was introduced in the ruralareas as well as very small (‘C’ class) municipal townswhen the unemployment situation worsened duringthe drought of 1971–74. This programme assures
employment on demand to even the unskilled. Itsslogan is ‘magel tyala kaam’ (whoever seeks work,will get it). The objectives are to protect the weakersections of society and to build infrastructure andphysical assets, which would insulate the rural econ-omy against deleterious effects of subsequentdroughts. The programme has statutory support inthe Maharashtra Employment Guarantee Act,1977, which became operational from 26 January1979. It is a direct intervention, at huge cost: some95 million person-days per annum by spendingabout Rs 5,000 million. Details of the working theEGS are given in Box 4.6.
Over a period, especially in the later part of1990s, some changes were brought into the EGSprogramme, mainly to generate more employmentas well as to promote the growth potential in ruralareas. Because of these changes, wells could be dugon privately owned lands and plantations raised.
Jawahar Wells: This was introduced in September1988 to provide wells for the small and marginalfarmers. The beneficiary composition was to be suchthat 30 per cent belonged to SC/ST/NT/Neo-Bud-dhist households having holdings up to 2 hectares,another 30 per cent to small farmer households withup to 2 hectares and 40 per cent from size-holdingclass of more than 2 hectares.
Horticulture: By linking it with the programme onhorticulture since 21 June 1990, this change permitshorticulture programmes on the land of any farmerand plantations on up to a minimum of 0.2 hectareand a maximum of 4 hectares of the beneficiary. Thegovernment would bear the entire cost for projectson lands belonging to SC/ST/NT and small farmers.As regards others, government would bear the coston only the unskilled portion of the work and only75 per cent of the cost on the skilled portion.
SocialForestry: The Government has also undertakensocial forestry since 1992–93, on private barren landto promote soil and water conservation as well asraise the physical access to fuel wood, grass and othertypes of wood.
Tuti Tree Plantation & Sericulture: Since agriculture’spotential to absorb labour is limited, rural labour
44 Human Development Report Maharashtra 2002

gets employed for only a part of the year. To enhancethis potential on time and income criteria, thegovernment introduced plantation of tuti trees andsericulture. This scheme is a feasible proposition asthe climate is conducive and the business is com-mercially viable as well profit yielding. The schemehas been in operation since 1992–93 in Amaravati,
Yavatmal, Wardha, Solapur, Kolhapur, Jalgaon,Dhule, Ahmednagar, Nanded and Latur districts.
EGS: An Assessment
The EGS has really been undertaken on an impres-sive scale. It began, on a small scale in May 1972,
Box 4.6How does EGS work?
All adult residents of villages and ‘C’ class munici-pal towns are eligible to apply for jobs under thisprogramme. A minor within the age group 15–18years too can apply if the family does not have thesupport of any older earning member. The Talathi or Gram Sevak is the authority withwhom the job seeker has to register and seek em-ployment under the EGS from the Tahsildar byundertaking to work for a continuous time intervalof at least 30 days. The job seeker is to be providedemployment within fifteen days, failing which theapplicant is entitled to an unemployment allow-ance of two Rupees per day. Interestingly, an in-crease in this amount was never sought, nor given. Upto 60 per cent of the total cost of a work isearmarked for wages. Any work spot has to employa minimum of 50 persons. The programme guaran-tees work but it is restricted to unskilled manualwork in the local district. Generally jobs are offeredat sites within the Panchayat Samiti area. If the worksites fall beyond a distance of eight kilometres fromthe residence of the job seeker, then the Act providesfor camping arrangements and travel expenses. Government departments like Irrigation, PublicWorks, Agriculture, Forest and Zilla Parishads im-plement the programme seeking to ensure the du-rability and reliability of the system. The EGS permits only productive works. Theoverriding concern is to insulate the vulnerablepopulation and the economy against the harmfuleffects of drought. Hence, priority is attached toprojects concerned with conserving moisture andwater.From this perspective, the public works are rankedas follows: highest priority is assigned to labourintensive pieces of major and medium irrigationprojects, canal works, minor irrigation, percolationand storage tanks and underground bandharas.Next in order are works related to soil conservation
and land development, afforestation and social for-estry, roads and flood protection. Choice of projects for the EGS is restricted tothose involving intensive use of unskilled labour.Towards this end, the programme stipulated a wagecomponent of at least 60 per cent for the coststructure. For exceptional cases like canal works ofmajor and medium irrigation projects, the floor isset at 50 per cent. Wages are fixed on a piece rate basis, withreference to tasks like digging, breaking rocks, shift-ing earth and transplanting. Rates are fixed suchthat an average person can earn by putting in sevenhours of work or at least an amount equal to theminimum wages prescribed for agricultural labourin the corresponding zone till 1983. Earlier, thisparity was avoided to ensure that labour did notflow out and away from agricultural operations.EGS programmes are implemented with referenceto a plan and work schedule. The beneficiaries are provided with drinkingwater, shelter for rest, First Aid Box, crèches andshelter, ex-gratia payment to workers in the eventof death or injuries during work since all work ismanual and virtually unskilled in nature. There isan arrangement for maternity benefit of 15 daysleave of absence to those female labourers who haveworked for an uninterrupted interval of 75 workingdays before delivery. The resources for this programme are raised byspecial taxes on professions, trades, callings andemployment. Additional tax is by way of cess onmotor vehicles and on Sales Tax, a special assess-ment of irrigated agriculture land, surcharges onland revenue and a tax on non-residential urbanlands and buildings under Maharashtra EducationCess Act. A matching contribution annually fromthe State Government equal to the net collectionfrom these sources is provided.
Economic Development: Growth and Equity 45

as soon as the impact of the drought was felt. Itgenerated employment to the extent of 4.5 millionperson-days at a cost of Rs 18.8 million during1972–73, thus safeguarding food security of thevulnerable sections, minimising the social cost ofdrought measured in terms of excess mortality, eco -nomic and nutritional insecurity. Soon it expandedto reach 205.4 million person-days of employmentinvolving an expenditure of Rs 1,092.3 millionduring 1979–80. The annual generation of workwas close to 94.9 million with a staggering expen-diture of Rs 4,939.7 millions by 1999–2000 bywhen the number of person-days of employmentstabilised. The average monthly labour attendancewas about half a million during 1975–90 and 0.19million during 1991–2000 at an average cost ofRs 28 per person-day at 1993–94 prices. Of course,this was possible because of the priority assigned towage employment and the considerable expenditureon the programme. Ever since its inception in 1972,wages alone have accounted for about 67 per centof the whopping expenditure of Rs 62,890 millionon the programme. This estimate is some measureof cost-effectiveness of the programme in povertyalleviation and its magnitude provides a good ac-count of the efficiency with which the EGS transfersincome to the poor.
The programme succeeded in providing em-ployment during the lean season within a year anddrought years over time. Month-wise labour atten-dance under the EGS during 1975 to 2001 providesevidence that labour attendance peaks during thelean season (March–May) and is minimum duringthe peak season (September–November) (Figure4.5). The EGS provided the maximum number of205.4 million person-days of employment during1979–80 and also some of the highest number ofperson-days of 178 million, 190 million and 188million during 1984–85, 1985–86 and 1986–87respectively. This has helped in insulating the in-comes and levels of living of the weaker sectionsagainst seasonal as well as periodic fluctuations inthe agricultural economy. The decline in unemploy-ment in rural Maharashtra during the 1970s and1980s bears ample testimony to the effective rolethe EGS programme has played in this respect.
The EGS is claimed to have served two pur-poses: those of raising the average wage level andreducing the variability in the wage rate. Betterwages were the major attraction for the landlessagricultural labourers. Average EGS wage was in-creased from 90 paise per person-day in 1976–7 toRs 2.23 (at 1960–61 prices) in 1999–2000. Cur-rently, the daily wage, worked out on the basis ofvolumetric work done, ranges between Rs 45 andRs 51 which is on par with the wages prescribed forfarm labour. In other words, it has more thandoubled during this period. But there is little evi-dence to corroborate that the EGS has really raisedmarket wages. EGS has, in fact, followed the farmwage structure. Guaranteed employment during theoff-season and drought years seems to have ensuredsome stability in real wages in Maharashtra.
Of course, EGS has also generated second-round effects on income generation thanks to theemphasis on strengthening rural infrastructure.However, the rural rich seem to have benefiteddisproportionately more than the poor from suchassets, but political support for the EGS continuesand is a show-case project though monitoring couldimprove. The programme is neighbourhood basedand provides for childcare facilities. In addition,wage payment to female workforce without anygender discrimination has provided ample incentivefor female labour participation in the EGS in therural areas. Female participation in the EGS pro-grammes has ranged between 30 to 50 per cent.
Annual project-wise estimates of expenditureshow that generally works relating to irrigation,agriculture, forestry, roads and others, includingShram Shakti, Horticulture and Jawahar wellsreceived substantial allocation. During 1990–91 to1999–2000, irrigation accounted for 15.4 per centof the total expenditure incurred under the EGS;agriculture 15.5 per cent, forests 11 per cent, road19 per cent, others 12.5 per cent and Horticulture/Shram Shakti/Jawahar wells 26.6 per cent.
Till December 2000, the EGS has provided fora total of 0.36 million projects of different types,most (95 per cent) of which have been completed.
46 Human Development Report Maharashtra 2002

Majority (63 per cent) of these projects were relatedto soil conservation and land development and 13per cent were irrigation works.
Effort has been taken to ensure equity in thespatial allocation of EGS expenditures. Of the totalEGS expenditure during 1972–73 and 1999–2000,the backward Aurangabad division alone accountedfor about 30 per cent, followed by the other divi-sions; Nashik (20.2 per cent), Nagpur (16.1 percent), Pune (15.9 per cent), Amravati (10.5 percent) and Konkan (7.3 per cent).
The programme appears to be reasonably self-targeted, that is, given the requirement physicallabour, largely the poorest opted for this type ofemployment. They belong to Scheduled Castes andScheduled Tribes and other economically backwardcommunities. There is some evidence to supportthis claim: The National Sample Survey findings for1987–88 and 1993–94 show that the extent ofparticipation in public works like the EGS isremarkably higher in the lowest monthly expendi-ture classes in Maharashtra.
Thus, the EGS seems to have been successful interms of absolute magnitudes of employment gener-ated during the 1970s and 1980s. It seems to havelost steam during the 1990s, with a possible rationingof employment when the wage rates were pushed up(Annexure Table 27 and Figure 4.5). This is also theperiod when unemployment had gone up (Table 4.2).
Food and Nutrition Security
Despite being a food grain deficit state, the PublicDistribution System’s (PDS) role in promoting foodsecurity of the vulnerable sections by ensuring regularavailability of food grains has been recognised onlyof late. The average annual quantity of cereals deliv-ered was 25.8 kg per capita during the 1970s and1980s. The PDS came to be relied upon only indrought years, when quantities delivered increased.As a result, cereal quantities delivered fluctuatedbetween a low of 16.77 kg and high of 45.37 kg percapita per annum during the 1970s and 1980s.
The PDS is aimed at promoting physical avail-ability of rice and wheat and other household con-sumption items like edible oils, sugar and keroseneat reasonable prices. At present, this programme isimplemented through a network of 46,705 ra-tion/fair price shops of which 35,708 are located inthe rural, including tribal areas and 10,997 in theurban. In 1999–2000, the fair price shops liftedabout 0.69 million tonnes of rice and 1.07 milliontonnes of wheat for delivery for the beneficiaryhouseholds; Mumbai alone accounted for about 15per cent of this. The programme involves a three-tiersupply card scheme whereby benefits are targetedonly at the vulnerable families that are both ruraland urban. In addition, the State Government im-plements a ‘Specially Subsidised Public DistributionScheme’ in 68 talukas of 15 districts for the tribalswhich provides pulses, iodised salt, tea powder,
Month (April) by YearAtte
ndan
ce (l
akhs
) on
the
last
day
of t
he m
onth
0
2
4
6
8
10
12Series 1
2000
1999
1997
1995
1993
1991
1989
1987
1985
1983
1981
1979
1977
1975
Figure 4.5
Labour Attendance under the EGS: 1975–2001
Economic Development: Growth and Equity 47

toilet and washing soaps in addition to the itemssold through the PDS network.
The Government implements different pro-grammes to promote the nutritional status of thevulnerable groups. The Integrated Child Develop-ment Services in rural and urban areas providesnutritious supplementary food to children under theage of six years, pregnant women and nursing moth-ers from poor families. Similar in scope and actionbut restricted to the vulnerable groups in urbanslums are the Special Nutrition Programmes forUrban Slums. ‘Policy for Women’ seeks to removeconstraints of any type on the personality develop-ment of women while the Department of Womenand Child Welfare undertakes programmes to pro-mote their welfare.
A National Social Assistance Programme, under-taken with complete Central assistance, provides forsocial assistance to the poor and vulnerable families.In particular, it involves an old age pension schemeof Rs 75 per month to each of the destitute who are65 years and more. It has a National Family BenefitScheme, which provides households with a grant ofRs 10,000 in the event of death of its breadwinner.The State Government has introduced SanjayGandhi Niradhar Anudan Yojana under which anold/ disabled/ handicapped destitute gets a dole of Rs250 per month. Similar in scope is the Indira GandhiBhumihin Vriddha Shetkari Mazdoor Sahayya Yojanabut restricted to rural agricultural labour born inMaharashtra.
Besides these programmes, the government alsoundertakes a series of measures to provide shelter tothe weaker sections like the Slum RehabilitationScheme, Shivshahi Punarvasan Prakalp Ltd. in theurban areas and the Indira Awas Yojana in the ruraldomain.
Growth and Equity
How far have the policies to promote growth andequity succeeded in poverty alleviation over time andacross space in Maharashtra? Poverty estimates are interms of proportion of rural and urban population
having a consumption level less than the normativeconsumption to ensure sufficient energy measured incalories for an active and healthy life. This minimumis called the poverty line.
These are summary measures based on statisticalestimates of consumption in value terms; and povertylines adjusted for price changes with price indicesdefined for a fixed basket of goods for the base year.But such estimates may throw up a misleading pictureduring a period of structural transformation of theeconomy involving changes in consumption and pro-duction patterns, technology and relative prices. Thisis all the more so because of methodological changesin the NSS during 1999–2000, which render theseestimates not comparable with those for the earlierperiods in a strict sense. One option is to verify themwith reference to quantitative estimates of cerealconsumption, a major source of calories, and actualintake of calories, protein and fat available for someyears up to 1993–94. Such estimates are presented inAnnexure Tables 25, 25A and 25B. A desegregatedprofile of poverty by rural and urban sectors at thedistrict level could be obtained only for a single year1993–94.
The findings are as follows:
• Incidence of rural poverty increased between1973–74 and 1977–78 and declined thereafter. Atthe all-India level, it declined till 1987–88, in-creased during 1993–94 and declined thereafter.The percentage point reduction in incidence ofrural poverty between 1973–74 and 1993–94 wasat a higher level in Maharashtra (35.49) than atthe all-India level (28.52). The number of poorhas also declined between these two years. Thedecrease was more pronounced in rural Maha-rashtra at 42.53 per cent than in rural India as awhole: 24.47 per cent. As a result, incidence ofrural poverty in Maharashtra, which was alwaysabove the national average, fell below it in 1991–2000 (Annexure Table 21, Figure 4.6).
• Urban poverty declined since 1973–74 in bothMaharashtra and countrywide with the differencethat there was a marginal increase in Maharashtrabetween 1983 and 1987–88. Further, the reduc-tion in urban poverty between 1973–74 and1999–2000 was less in Maharashtra–16.32 per-
48 Human Development Report Maharashtra 2002

centage point—than in all-India-–23.16 percent-age point. However, the decrease in poverty ratioswas not sufficient to neutralise the growth in urbanpopulation; the number of the poor increased inurban Maharashtra and urban India as a whole.The increase in the number of urban poor was
more in Maharashtra at 38.04 per cent than in all-India 17.42 per cent (Annexure Table 21). Incid-ence of urban poverty in Maharashtra was less thanthe national average till the mid-80s. It has crossedthe national average since then (Figure 4.7).
• With this pronounced decline in rural poverty andthe predominant size of the rural sector, povertyin Maharashtra as a whole declined since the mid-70s. Between 1973–74 and 1999–00, the propor-
tion of poor population in Maharashtra declinedby 28.90 percentage points as compared with27.63 percentage points at the all-India level. Thepercentage reduction in the number of poor washigher in Maharashtra (21.42 per cent) than inIndia as a whole (16.80 per cent) (Figure 4.8).
The statistical estimates of poverty discussedabove are obtained by comparing estimates of con-sumption distribution with those of poverty lines,both measured at current prices. Current price esti-mates of the poverty lines are obtained using priceindices defined for a fixed basket of consumptionitems. Such fixed-weight price indices are subject tomeasurement errors because they cannot account for
0 10 20 30 40 50 60
Maharashtra
Mumbai
Thane
Raigad
Nagpur
Pune
Kolhapur
Nashik
Sangli
Sindhudurg
Aurangabad
Chandrapur
Solapur
Amravati
Gadchiroli
Wardha
Jalgaon
Akola
Satara
Beed
Ahmednagar
Bhandara
Ratnagiri
Parbhani
Buldhana
Latur
Yavatmal
Nanded
Osmanabad
Jalna
Dhule
Headcount ratio (%)
Figure 4.6
Incidence of Poverty across Districts: Maharashtra (1993–94)
Source: See relevant Table.
Year
Hea
dcou
nt ra
tio (%
)
0
10
20
30
40
50
1973–74 1977–78 1983 1987–88 1993–94 1999–2000
Maharashtra All-India
Figure 4.7
Incidence of Urban Poverty: Maharashtra andAll-India
Source: See relevant Table.
Hea
dcou
nt ra
tio (%
)
0
10
20
30
40
50
60
1973–74 1977–78 1983 1987–88 1993–94 1999–2000
Year
Figure 4.8
Incidence of Poverty (Rural and Urban Combined): Maharashtra and All-India
Source: See relevant Table.
Economic Development: Growth and Equity 49

changes in consumption due to changes in relativeprices, in quality, and introduction of new products.The shortcoming is all the more serious in a devel-oping country undergoing structural changes in pro-duction, consumption and the markets.
Changing Consumption
One such change in Maharashtra is the change incereal production and consumption pattern in favourof superior but costlier cereals like rice and wheat.There have also been changes in consumption infavour of non-cereal food items in Maharashtra. Ac-cordingly, the finding of a decline in statistical esti-mates of rural poverty is not at all corroborated byestimates of cereal consumption and calorie intake forrural and urban Maharashtra (Annexure Table 25).
• Cereal consumption has declined in rural Maha-rashtra since 1961–62. Total monthly per capitacereal consumption of the rural population as awhole has declined from about 13.5 kg during themid-70s to less than 11.5 kg during the 1990s.The estimates do not show any significant im-provement in cereal consumption of the bottomdecile groups. Urban cereal consumption has vir-tually been stagnant.
• Average calorie intake in rural Maharashtra de-creased from 2,280 in 1960–61 to 2,144 in 1983and further down to 1,939 in 1993–94 (Annexure
Table 25). What should cause worry is the fact thatthere was a decline in the calorie intake of all thedecile groups of rural population between 1983and 1993–94. The proportion of rural populationwith a calorie intake less than the normative mini-mum of 2,400 calories, though it has declinedfrom 86.56 per cent in 1972–73 to 78 per cent in1983, has increased to 89 per cent in 1993–94. Asregards the other two nutrients, protein intakedeclined and intake of fats increased between 1983and 1993/94.
• In urban Maharashtra, average calorie intake in-creased from 1,916 in 1960–61 to 2,028 in 1983,which again declined to 1989 in 1993–94 (An-nexure Table 25). However, the bottom 40 percent of the urban population experienced progres-sive improvement in terms of calorie, protein andfat consumption. As a result, incidence of caloriedeficiency in urban Maharashtra did not worsen;it declined from 70.14 per cent in 1972–73 to67.82 per cent in 1983 and remained about thesame level (68.30 per cent) in 1993–94.
In sum, majority of the rural and urban popu-lation remains undernourished. The observed de-cline in cereal consumption and calorie intake couldbe due to changes in consumer tastes and the re-duction in calorie intake called for in the context ofimprovement in methods of production, health fa-cilities and standard of living. How serious is the
Box 4.7Energy Intake and Undernutrition
• Low dietary intake is the most important causeof under-nutrition in children.
• Low birth weight, poor infant feeding practicesand infections are other major factors responsiblefor under-nutrition.
• Notwithstanding low dietary intake, prevalenceof severe under-nutrition is low in Kerala becauseof more equitable distribution of food betweenincome groups and within the family and betteraccess to health care.
• Despite higher average dietary intake, under-nu-trition rates are higher in Uttar Pradesh, MadhyaPradesh and Orissa because of lack of equitabledistribution of food and poor access to healthcare.
• Screening and identification of undernourished
children and appropriate nutrition and healthintervention are essential for reduction in under-nutrition in children.
Imperatives• Remove or minimise the intra-state differences
by replicating the progress achieved in betterperforming districts.
• Undertake realistic Primary Health Centre(PHC) based decentralised area-specific micro-planning, tailored to meet local needs.
• Involve Panchayati Raj institutions in micro-planning and monitoring at the local level foreffective implementation of the programme andensuring effective community participation.
• Achieve incremental improvement in perform-ance in all districts.
50 Human Development Report Maharashtra 2002

extent of shortfall would depend upon the relevanceof the calorie norm of the 1950s today.
Estimates of rural poverty at the district levelfor the year 1993–94 show that rural poverty hasvirtually been eliminated in the prosperous districtof Raigad (4.94 per cent), followed by Kolhapur(6.97 per cent) and Thane (8.29 per cent) (Table4.4). However, incidence of rural poverty was themaximum in Dhule (45.6 per cent), the districtwhich also ranks the lowest in terms of per capitadistrict domestic product. Incidence of poverty in
rural Maharashtra as a whole was 26.60 per cent,which, as can be expected, lies between the estimatebased on the State sample (17.05 per cent) and thatbased on the Central sample (37.61 per cent).
Incidence of urban poverty is the lowest inGadchiroli (6.11 per cent), followed by Mumbai(7.84 per cent). More than two-thirds of the urbanpopulation had consumer expenditure levels belowthe poverty line in the urban sectors of Ahmednagar(68.06 per cent), Akola (71.39 per cent) and Buld-hana (74.09 per cent). About 31 per cent of the
Table 4.4
Average Consumption, Inequality and Poverty across Districts: Maharashtra (1993/94)
District Rural Urban CombinedDistrict Per CapitaConsumption Per
Month (Rs atcurrent prices)
Incidenceof
Poverty(%)
LorenzRatio(%)
Average Per CapitaConsumption Per
Month (Rs atcurrent prices)
Incidenceof
Poverty(%)
LorenzRatio(%)
Average Per CapitaConsumption Per
Month (Rs atcurrent prices)
Incidenceof
Poverty(%)
Ahmednagar 269.18 33.37 26.80 316.39 68.06 30.60 276.65 38.86Akola 260.30 30.78 23.03 299.41 71.39 26.78 271.50 42.41Amaravati 281.97 24.21 24.35 394.45 45.39 27.02 318.63 31.11Aurangabad 283.16 34.88 30.88 511.80 46.00 42.90 358.05 38.52Beed 251.78 34.23 24.31 344.48 57.82 30.84 268.41 38.46Bhandara 293.42 23.26 24.39 397.48 56.51 31.11 307.04 27.61Buldhana 245.16 37.76 24.13 283.33 74.09 26.49 253.02 45.24Chandrapur 284.73 32.04 27.77 430.07 35.55 25.90 325.48 33.02Dhule 232.31 45.57 23.58 329.25 62.32 25.65 252.19 49.00Gadchiroli 301.44 28.63 29.97 622.46 6.11 20.39 329.41 26.67Jalgaon 239.83 37.22 23.88 340.01 63.01 28.99 267.32 44.30Jalna 280.78 31.26 30.84 349.85 58.45 34.19 292.46 35.86Kolhapur 375.02 6.97 25.36 470.21 25.07 24.01 400.08 11.73Latur 343.59 24.66 32.54 404.23 42.35 27.76 355.95 28.2Nagpur 310.22 24.24 26.85 464.28 42.09 34.27 405.40 35.27Nanded 287.25 34.16 31.55 369.67 57.03 31.95 305.15 39.13Nashik 270.84 35.98 28.36 417.52 42.91 28.18 322.98 35.44Osmanabad 369.92 16.67 34.56 349.10 58.81 33.45 366.76 23.07Parbhani 301.82 28.55 31.97 323.57 60.10 27.81 309.46 39.63Pune 318.73 17.89 25.89 575.56 27.27 34.14 449.04 22.65Raigad 398.75 4.94 23.51 601.63 24.36 32.19 435.29 8.44Ratnagiri 311.53 24.69 29.98 445.59 29.31 25.13 323.79 25.10Sangli 401.56 14.43 33.54 386.59 53.26 24.21 398.16 23.26Satara 300.11 22.64 24.92 461.78 39.75 32.98 320.94 24.84Sindhudurg 256.76 20.55 21.54 389.07 53.31 27.24 234.52 23.04Solapur 278.25 31.16 26.86 331.40 62.92 26.69 293.54 40.30Thane 430.92 8.29 29.84 635.27 15.74 29.06 563.02 13.11Wardha 308.81 27.40 28.14 412.68 39.08 27.00 336.40 30.50Yavatmal 270.39 25.74 22.37 355.08 53.03 24.81 284.94 30.43Mumbai – – – 721.59 7.84 28.39 721.59 7.84Maharashtra 302.90 26.60 28.76 537.19 31.24 33.77 393.57 28.4Source: Department of Economics and Statistics, Government of Maharashtra.
Economic Development: Growth and Equity 51

urban population in Maharashtra lived below thepoverty line in 1993–94.
Combined estimates for the district as a wholeindicate that incidence of poverty was the least inMumbai (7.84 per cent) and highest in Dhule (49per cent), with the average for the State being 28.40per cent. There is significant negative correlationbetween the ranks of districts in terms of per capitadomestic product and incidence of poverty. That is,incidence of poverty is generally higher in thosedistricts, which are economically backward in termsof per capita domestic product. Naturally, this callsfor efforts at securing a balanced regional develop-ment of Maharashtra. Conclusion
Maharashtra’s economy has demonstrated a strongtrack record of growth and is a visible success storyfor the rest of the country but its weakness is itsuneven distribution of the gains of the growth. Theimplications are clear: the urban-centric growth ofeconomic activity, where more of it is centredaround the secondary and enlarging tertiary sector,has drawn more and more people to urban areas,adding to the strains to the urban sector. This hasalso added to the difficulties of living in a ruralregion where the primary sector, dominated byagriculture with relative poor returns by way ofincomes, fails to meet the economic requirement ofthe people.
The policy options, should therefore, be multi-focal, including in its canvas both the urban andrural domains to:
• Encourage investment in the primary sector toboost growth and reduce acute unawareness indevelopment.
• Help improve the growth in the secondary andsustain it in the tertiary sector.
• Give greater attention to enable the spread of
economic gains evenly across the regions, andreduce the disparities between the urban and therural populations. Intra-state differences can beminimised only by replicating the progressachieved in the better performing districts in thebackward areas.
• Mitigate the hardships caused by poverty, re-flected mainly in the lower calorific intake by asubstantial portion of the State’s population, bybuilding on the principles that anchor the incomegeneration for the rural poor through the Em-ployment Guarantee Scheme.
• Develop the Public Distribution System in amanner that it reaches out to the rural and urbanpoor since EGS alone has not completely eradi-cated incidence of poverty but only helped reduceit. Improved access which would enable higheroff-take of food grains by the economically vul-nerable sections is vital; access does not mean justmore PDS outlets but timely availability of foodgrains at affordable prices.
• Improve the reach of irrigation facilities, if notby immediate increases in capital investment byensuring equity and greater spread in distributionof water by reducing coverage extended to water-intensive crops. The fact that regardless of thewillingness, ability or desire to increase capitaloutlays, the built-in limitations increasing irriga-tion to arable areas because of natural constraintslike the availability of water resources, has to berecognised and equity in distribution under everyproject built and those being built guaranteed.
• Put greater emphasis on dry land agriculture byincreasing investments in watershed developmentand water conservation activities.
• Emphasise diversification of agriculture, encour-age value addition through proper policy pack-ages, promotion of technology processing etc.
• These could help reduce the motivation to mi-grate from rural areas to urban zones and evenassist in encouraging reverse migration.
Chapter V →
← Contents
52 Human Development Report Maharashtra 2002


CHAPTER V
Health and Nutrition
Income levels alone do not determine the wellbeing of a people but it is a criterion that cannotbe circumvented. But more importantly, a true
reflection of an individual or a society is to be foundin the nutritional and health status attained whichcan be measured by life expectancy at birth, infantmortality rate and nutritional attainments. In Ma-harashtra, where average per capita income is higherthan national levels but is unevenly distributed, theother test would be on attainments in the area ofimprovement in life expectancy at birth and whetherinfant mortality is declining and how well nourishedare the people.
Once these levels are established, other aspectsof health, including the means to find and ensurecorrectives arise. Much depends, naturally, on theaccess to healthcare, the quality and the spread ofits facilities. The issue of health infrastructure istherefore a major one. What is the status of health-care infrastructure, how much of it is run by publicresources and how well is it utilised by all sections—the urban and the rural, the rich and the poor? Howclose are the health attainments in Maharashtra tothe Alma Ata Declaration (1978) of Health for Allby 2000?
On two counts, Maharashtra has done fairly well,though there is room for improvement—raising lifeexpectancy at birth and reducing infant mortality rate(IMR). Life expectancy levels are higher for womenand the differential in IMR between males and fe-males is only marginal. The nutritional status, how-ever, does not correspond to other attainments,including economic measures. More than half thehouseholds in the State fall below the prescribedstandard norm for nutrition and these householdsreceive less than 90 per cent of the required level of2,700 calories per day per consumer.
Infant Mortality
From 105 in 1971, the infant mortality rate (IMR)declined to 48 per 1,000 live births in 1999, withthe differential across males and females being onlymarginal to the extent that it barely exists (Figure5.1). In the case of life expectancy at birth it isfavourable to females. From 54.5 years during1970–75, it improved to 63.8 years for males in1993–97; whereas in the case of females it increasedover the same period from 53.3 years to 66.2 years,which is remarkable. What stands out, however, isthe urban-rural differential; men have a relativelylower life expectancy in the villages compared towomen but the life expectancy is higher for bothsexes in towns and cities. The rural-urban differen-tials in mortality are also quite marked, reflectingits influence on life expectancy at birth. Latestestimates indicate that life expectancy at birth is67.7 years and 61.7 years for urban and rural malesrespectively. It is 71.2 years and 63.9 years for urbanand rural females respectively.
This differential is marked between the twoareas in the case of IMR as well, which in 1999was 58 for the rural population and 31 for theurban population (Figure 5.1). Though the overallIMR has gradually declined, the gap in the accom-plishment between the urban and rural regions inthis segment has been slowly declining, causingconcern. Infant and child mortality data, when seenin detail (Figure 5.3), also reflect a declining trendbut the urban-rural gap persists here as well. In therural areas, the number of deaths per 1,000 livebirths within a month of life is twice of what prevailsin towns and cities. In these critical areas, as in thecase of life expectancy, the future focus would haveto lie in bridging this differential which is obviouslyclosely associated with the availability of and
Health and Nutrition 53

accessibility to health services, which is better inthe urban areas.
For instance, Greater Mumbai—a 100 per centurban region comprising two districts—offers astark contrast to the rest of the State. According tothe Registrar General of India’s findings in 1991,the overall IMR was 37 for Mumbai and the childmortality rate was 50. It was greater than 100 inAkola, Yavatmal and Gadchiroli districts, higherthan 74 in Ratnagiri, Nashik, Jalna, Buldhana,Amaravati, Wardha, Nagpur, Bhandara and Chan-drapur districts. Female IMR was particularly highat 126 in Yavatmal, 101 in Chandrapur and 117 inGadchiroli districts. It is in Vidarbha that one findsthe IMR higher than the State average.
Morbidity
In understanding the health status of a population,the morbidity profile is equally relevant, being asubjective phenomenon influenced not only by ac-tual burden of illness but also by education, expo-sure to healthcare services, health expectations andeven recall periods used in a survey. The morbidityrate for a two-week recall period was 52 per thou-sand in rural areas and 48 per thousand in the urban.But the rate of hospitalisation was 19 per thousandin the rural areas while it was 26 per thousand inurban areas, the large differential being a functionof access to hospitals, which vary vastly for the ruraland urban areas. Women in the urban regions havereported a higher level of morbidity for both acuteand other ailments.
Morbidity stems from both diseases of povertyas well as those induced by affluent living but thefocus has to be on the diseases afflicting the poorsince it is a major cause of worry. Their diseases areclassified as those due to poor living conditions andpreventable by immunisation and improving accessto nutrition. Those preventable by improvementsto living conditions are typhoid, pneumonia, tuber-culosis, gastro-enteritis, cholera, dysentery, jaundiceand fevers including influenza. Diseases that can beprevented by immunisation are measles, whoopingcough, diphtheria, polio and tetanus.
111 9190 73
69 58 58
105
83 7964 60 48 48
88
6149 44 38
3131
020406080
100120
1971 1976 1981 1986 1991 1996 1999
Infant Mortality Rate
Total Rural Urban
Year
Figure 5.1
Trends in Infant Mortality, Maharashtra 1971–99
Source: Refer relevant Table.
54.557.1
62.163.5
65.8 66.2
53.3 55.6
59.6 61.263.5 63.8
50
55
60
65
70
1970–75 1976–80 1981–85 1986–90 1991–95 1993–97
Life
exp
ecta
ncy
(in y
ears
)
Male Female
Year
Figure 5.2
Trends in Life Expectancy at Birth, Maharashtra 1970–97
Source: Refer relevant Table.
47
32
16
35
10
56
38
19
40
11
3121
10
26
8
0
102030
4050
60
InfantMortality
Rate
Total Rural Urban
NeonatalMortality
Rate
Post-natalMortality
Rate
Peri-natalMortality
Rate
Rate per thousand population
StillBirthRate
Figure 5.3
Rural-Urban Differentials in Infant MortalityIndicators: Maharashtra 1997
Source: Refer relevant Table.
54 Human Development Report Maharashtra 2002
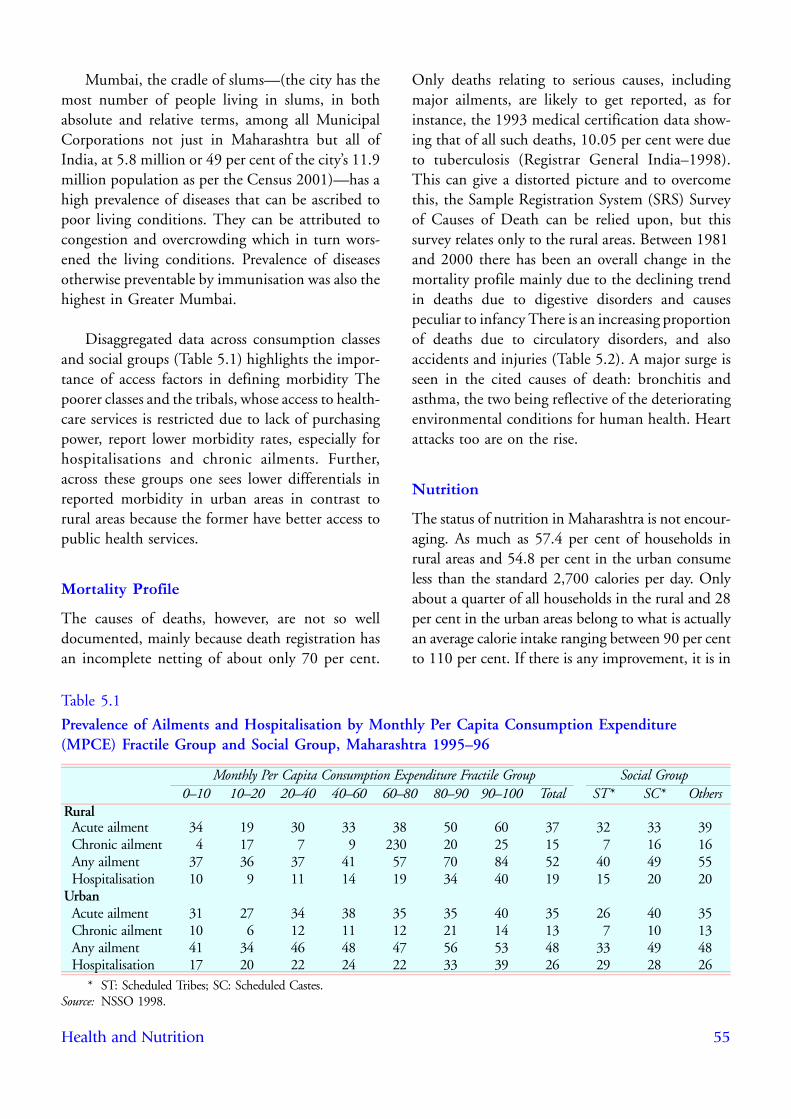
Mumbai, the cradle of slums—(the city has themost number of people living in slums, in bothabsolute and relative terms, among all MunicipalCorporations not just in Maharashtra but all ofIndia, at 5.8 million or 49 per cent of the city’s 11.9million population as per the Census 2001)—has ahigh prevalence of diseases that can be ascribed topoor living conditions. They can be attributed tocongestion and overcrowding which in turn wors-ened the living conditions. Prevalence of diseasesotherwise preventable by immunisation was also thehighest in Greater Mumbai.
Disaggregated data across consumption classesand social groups (Table 5.1) highlights the impor-tance of access factors in defining morbidity Thepoorer classes and the tribals, whose access to health-care services is restricted due to lack of purchasingpower, report lower morbidity rates, especially forhospitalisations and chronic ailments. Further,across these groups one sees lower differentials inreported morbidity in urban areas in contrast torural areas because the former have better access topublic health services.
Mortality Profile
The causes of deaths, however, are not so welldocumented, mainly because death registration hasan incomplete netting of about only 70 per cent.
Only deaths relating to serious causes, includingmajor ailments, are likely to get reported, as forinstance, the 1993 medical certification data show-ing that of all such deaths, 10.05 per cent were dueto tuberculosis (Registrar General India–1998).This can give a distorted picture and to overcomethis, the Sample Registration System (SRS) Surveyof Causes of Death can be relied upon, but thissurvey relates only to the rural areas. Between 1981and 2000 there has been an overall change in themortality profile mainly due to the declining trendin deaths due to digestive disorders and causespeculiar to infancy There is an increasing proportionof deaths due to circulatory disorders, and alsoaccidents and injuries (Table 5.2). A major surge isseen in the cited causes of death: bronchitis andasthma, the two being reflective of the deterioratingenvironmental conditions for human health. Heartattacks too are on the rise.
Nutrition
The status of nutrition in Maharashtra is not encour-aging. As much as 57.4 per cent of households inrural areas and 54.8 per cent in the urban consumeless than the standard 2,700 calories per day. Onlyabout a quarter of all households in the rural and 28per cent in the urban areas belong to what is actuallyan average calorie intake ranging between 90 per centto 110 per cent. If there is any improvement, it is in
Table 5.1
Prevalence of Ailments and Hospitalisation by Monthly Per Capita Consumption Expenditure(MPCE) Fractile Group and Social Group, Maharashtra 1995–96
Monthly Per Capita Consumption Expenditure Fractile Group Social Group0–10 10–20 20–40 40–60 60–80 80–90 90–100 Total ST* SC* Others
RuralAcute ailment 34 19 30 33 38 50 60 37 32 33 39Chronic ailment 4 17 7 9 230 20 25 15 7 16 16Any ailment 37 36 37 41 57 70 84 52 40 49 55Hospitalisation 10 9 11 14 19 34 40 19 15 20 20
UrbanAcute ailment 31 27 34 38 35 35 40 35 26 40 35Chronic ailment 10 6 12 11 12 21 14 13 7 10 13Any ailment 41 34 46 48 47 56 53 48 33 49 48Hospitalisation 17 20 22 24 22 33 39 26 29 28 26
* ST: Scheduled Tribes; SC: Scheduled Castes.Source: NSSO 1998.
Health and Nutrition 55

the urban areas. Per capita production of food grainsalso reflects a decline from 172 kg per capita in 1986to 140 kg per capita in 1999. The adequacy of calorieintake is reflected in Figure 5.4. Such a low level offood intake impacts the nutritional status of womenand children. Nearly half the ever-married womenbetween 15 and 49 years suffer from anaemia, whichis marginally higher in the rural areas at 51.2 per centthan in the urban areas, where it is 44.8 per cent.The proportion of women in the clutches of mild,moderate and severe anaemia is 31.5 per cent, 14.1per cent and 2.9 per cent respectively. Of the childrenunder three years, 76 per cent were also suffering fromanaemia, the levels being comparatively higher inrural areas. Mild anaemia was prevalent among 24.1per cent, its incidence was moderate among 47.4 percent and severe among 4.4 per cent.
NFHS-2 (1998–99) also gives additional infor-mation on nutritional status based on age, heightand weight of women and children. The averageheight of an ever-married woman in 15–49 agegroup in Maharashtra was 151 centimetres, similarto the average height of an Indian woman. Chronicenergy deficiency is usually indicated by body massindex (BMI) of below 18.5 kg/m2. About 40 percent of the women in Maharashtra have a BMI ofbelow 18.5 kg/m2. As in the case of women, a largeproportion of the children too were undernour-ished. It can be seen that the percentage of childrenunder 3 years who were found to be undernourished
in terms of nutritional status indices, weight for age,height for age and weight for height was 50, 40 and21 per cent respectively.
Some quantification is available on the impactof the lower nourishment in terms of undernour-ishment and stunting respectively for the districtsof Maharashtra (Table 5.3). There are two measures
Table 5.2
Percentage Distribution of Deaths by Major Cause Groups in Rural Maharashtra (excluding Senility)1981–1994
1981 1991 1994 2000Causes of Death
Coughs 31.3 25.7 25.4 8.1Causes peculiar to infancy 21.1 19.4 16.7 8.8Disorders of circulatory system 8.2 12.8 13.7 21.0Fevers 3.7 3.8 2.3 0.8Other clear symptoms 9.2 12.8 16.4 14.5Digestive disorders 10.4 4.8 4.6 2.9Accidents and injuries 8.3 13.4 13.5 11.6Diseases of central nervous system 4.7 5.7 6.5 8.1Child birth and pregnancy 1.1 1.6 1.0 0.2Others 2.0 – – –
Source: RGI, respective years.
More than Adequate 17%
Rural
Adequate 25%
Not Adequate 58%
Figure 5.4
Adequacy of Calorie Intake in Maharashtra
M ore thanAdequate17%
Urban
Adequate 28%
Not Adequate 55%
Source: Refer relevant Table.
56 Human Development Report Maharashtra 2002

of deprivation—severe deprivation and mild mal-nutrition. Maharashtra does have a high percentageof undernourished children. By the weight-for-agenorm, the percentage of undernourished childrenbelow two years of age is high, i.e., at about 20 percent and more in Ratnagiri in Konkan, Ahmednagarand Pune in Western Maharashtra, Beed in Marath-wada, and districts of Vidarbha including Amara-vati, Bhandara, Chandrapur and Gadchiroli.
Data on height-for-age indicator reflects a highincidence of severe stunting in most districts ofMarathwada—Aurangabad, Jalna, Beed, Nanded,Parbhani and Osmanabad—and Vidarbha’s Buld-hana, Amaravati, Yavatmal, Nagpur, Bhandara andChandrapur, Western Maharashtra’s Jalgaon, Ah-mednagar and Pune with the percentage beinghigher that 30 per cent in these districts. Data forDhule and Nandurbar has not been reported but asimilar situation may be assumed to exist.
Concepts of prevention of communicable dis-eases and nutritional deficiencies and the use ofmodern medicine have been identified as importantfactors that can lead to curbing higher incidence ofunder- and malnourishment and mortality Buthealth workers working amongst the tribal peopletrace the non-utilisation of health services by themto traditional beliefs and superstitions. Cultural al-ienation of healthcare providers including doctors,nurses and the alien design and culture of healthcareinstitutions like hospitals and PHCs have been citedas another impediment to increased utilisation ofhealthcare facilities.
Nutritional inadequacy in individuals, especiallyin the formative years of life, could mean undernour-ishment and consequential stunting apart from mak-ing individuals susceptible to infections resulting inhigher mortality. Nutritional insufficiency is higheramong tribal populations and its implications areclear.
Integrated Child Development Services
(ICDS)
Use of the Integrated Child Development Services
Table 5.3
Incidence of Undernutrition of Children (belowtwo years of age)
Weight for Age Height for Age
No. DistrictBelow2 SD
Below3 SD
Below2 SD
Below3 SD
(1) (2) (3) (4) (5) (6) 1 Mumbai n.a. n.a. n.a. n.a. 2 Mumbai (Subn) n.a. n.a. n.a. n.a. 3 Thane 38.2 13.7 46.2 24.7 4 Raigad 30.3 7.9 38.7 18.2 5 Ratnagiri 45.9 20.1 50.8 28.0 6 Sindhudurg 29.9 11.0 44.0 26.3 7 Nashik 40.8 16.1 48.8 26.3 8 Dhule n.a. n.a. n.a. n.a. 9 Nandurbar n.a. n.a. n.a. n.a.10 Jalgaon 42.8 15.1 56.8 36.511 Ahmednagar 46.8 24.2 63.6 38.312 Pune 42.2 19.8 60.6 34.513 Satara 37.8 15.3 49.6 28.214 Sangli 33.6 13.4 49.9 23.815 Solapur 38.2 13.8 49.5 24.316 Kolhapur 31.9 10.5 42.6 18.917 Aurangabad 45.5 17.8 57.0 34.918 Jalna 32.3 14.8 59.1 32.719 Parbhani 40.9 12.5 58.0 32.220 Hingoli n.a. n.a. n.a. n.a.21 Beed 43.2 19.3 55.9 37.822 Nanded 39.8 15.4 59.1 35.823 Osmanabad 31.4 7.0 55.9 31.824 Latur 31.7 12.3 52.7 27.125 Buldhana 49.9 17.9 65.9 45.026 Akola 39.8 12.0 47.5 28.927 Washim n.a. n.a. n.a. n.a.28 Amaravati 49.7 20.9 64.9 42.729 Yavatmal 43.8 13.0 56.6 33.530 Wardha n.a. n.a. n.a. n.a.31 Nagpur 40.4 16.8 61.7 34.232 Bhandara 48.5 20.2 68.9 45.333 Gondiya n.a. n.a. n.a. n.a.34 Chandrapur 51.1 25.8 60.3 40.635 Gadchiroli 50.8 15.9 54.6 31.7
District Total 40.6 15.9 54.6 31.7
Note: Each index is expressed in Standard Deviation Units (SD)from median of the international reference population.Children who are more than 2 SD below reference mediaare considered to be undernourished and those who fallmore than 3 SD from reference median are consideredto be severely undernourished. Below 2 SD includes below3 SD.
Source: Salunke et al. (1997).
Health and Nutrition 57

(ICDS) to improve the nutritional status of womenand children has met with some success with theState Government providing for supplementary nu-trition to children under six years of age, pregnantwomen and nursing mothers belonging to poorfamilies enrolled at Anganwadis. But even here, asomewhat disturbing picture emerges in that thenumber of beneficiaries is always lower than thoseeligible and though over the years, more individualsare being brought into the net, their percentagefluctuates without showing any substantial increase.
For instance, service statistics indicate thatabout 0.24 million pregnant women, 0.25 millionnursing mothers and 3.13 million children—allpoor and targeted by Anganwadis benefited fromthese schemes in March 2001, accounting for 56.1per cent, 55.6 per cent and 63.9 per cent of theeligible population (Figure 5.5). A year earlier, thecoverage was higher, being 0.28 million pregnantwomen, 0.30 million nursing mothers and 3.20million children, which is 60.7 per cent, 59.97 percent and 64.53 per cent respectively of the eligiblepopulation. In March 1996, some 62.5 per centpregnant and 61.7 per cent of nursing mothers and60.9 per cent children benefited. But the proportionof eligible women and children who were enrolledand benefited from ICDS schemes does not seem
to cross the 70 per cent barrier between the tworeference points used here. The overall nutritionalstatus of the State would have been better if therehad been a wider coverage of the ICDS schemes.Not just enrolment, but even, the accrual of benefitsamong the enrolled must be enhanced.
Disease Control
With the exception of leprosy, the prevalence ofother diseases is still quite high without any visibledeclining trends. Use of vaccines has helped thecrude death rates to decline but morbidity andmortality due to communicable diseases like tuber-culosis, malaria, leprosy continue to account for amajor share. Poor sanitation and solid waste man-agement has been another factor that has contrib-uted to the prevalence of communicable diseases.
Malaria
During 1998–99, 16 districts—Raigad, Thane, Ah-mednagar, Dhule, Jalgaon, Nashik, Pune, Nanded,Yevatmal, Chandrapur, Amaravati, Bhandara, Gad-chiroli, Nagpur, Wardha and Mumbai—were classi-fied as high-risk districts for malaria. District MalariaControl Societies have been established and registeredfor each tribal district in the State but the profile onaccount of malaria is disturbing (Annexure Table 40).
NFHS surveys recorded the prevalence of ma-laria for a period of three months prior to the surveyand over the two periods of the survey and estab-lished that there has been a substantial increase inincidence from 3,742 (1992–93) to 4,098 (1998–99) per 1,00,000 population. The reproductive andchild health (RCH) survey around the same periodas NFHS-2 recorded a lower incidence of 3,526.While the incidence of malaria, as per the NFHSsurveys, in urban areas has nearly doubled over thesame period, it has shown a decline in rural areas.The RCH survey also records higher rural morbidity(Table 5.4).
An audit on the malaria programme by theComptroller and Auditor General (CAG) has listedsome reasons why the National Malaria Eradication
71%
56%
71%
56%
74%
65% 69%
58%
83%
68%
77%
64%
PregnantWomen
NursingWomen
Children(6-12 months)
Children(1-3 years)
Children(3-6 years)
Percentage
Enrolled Benefited
TotalChildren
Figure 5.5
Percentage of Eligible Women/Children Enrolledand Benefited under the ICD Scheme in Maharashtra State (March 2001)
Source: Refer relevant Table.
58 Human Development Report Maharashtra 2002

Programme did not make a significant dent on theincidence of the disease. Delay in treatment, failureto provide treatment, sub-standard anti-malarialdrugs for treatment and use of sub-standard insect-icides, shortage of staff as per prescribed norms andnot even carrying out entomological surveys during1992–93 and 1995–97 were cited as importantcauses. This, however, is only as far as the govern-ment programmes go, where the major emphasis ison prevention. Since an overwhelmingly large pro-portion of care is provided by the private healthsector, a large responsibility for the failure of tack-ling malaria lies with the private providers. Malariaas a disease has a simple regimen of treatment atone level; at another, it needs a sanitary environmentthrough prevention and promotional programmes.Both areas need attention.
Leprosy
The programme dealing with Leprosy is a successstory. There are many facets to it but the mostimportant is that leprosy as a disease is handled almost
wholly by the public sector. It continues to be avertical programme, has been allocated adequate re-sources over the years and has used innovative meth-ods in management of the programme. To improveefficiency and effectiveness of this approach, district
Prevalence rate per1 lakh population
282
236
342293
330
250
0
50
100
150
200
250
300
350
1992–93 1998–99Year
Total Rural Urban
Figure 5.6
Prevalence of Tuberculosis, Maharashtra: 1992–93 and 1998–99
Source: Refer relevant Table.
Table 5.4
Prevalence of Selected Diseases in Maharashtra
Malaria (3 month prevalence) per 100,000 populationTotal Male Female Rural Urban
NFHS-1 1992–93 3742 3630 3850 5100 1800NFHS-2 1998–99 4098 – – 4509 3551RCH-RHS 1998 3526 3356 3707 3800 2943
Leprosy (point prevalence) per 100,000 populationNFHS-1 1992–93 NCAER 1994 RCH-RHS 1998
Urban 30 – 28.24Rural 100 65 81.56Total 72 – 64.45
Tuberculosis (point prevalence) per 100,000 population
NFHS-1 1992–93NFHS-21998–99
NFHS-2 1998–99(Medically Treated TB)
RCH-RHS1998
Rural 330 236 191 255Urban 250 342 282 169Total 293 282 230 228
Blindness (point prevalence) per 1000 population NFHS-1Total Male Female Rural Urban
Partial Blindness 32.1 28.5 35.9 36.5 26.1Complete Blindness 3.2 2.7 3.7 4.1 3.2
Source: Sundar 1995; PRC and IIPS 1995; IIPS 2000; IIPS and ORC Macro, 2000.
Health and Nutrition 59
leprosy societies were set up and this strategy helpedsubstantially.
Maharashtra has historically had one of thehighest endemicity of leprosy in the country butover the last decade has led others in reducing it, aswell as providing successful treatment of cases. Themulti-drug treatment has contributed significantlyto the sharp decline in its prevalence.
The NFHS and RCH provide evidence support-ing the comprehensive coverage of the NLEP sur-veys (Table 5.4). The estimate of leprosy prevalencegenerated through these surveys is comparable tothe performance figures under the government pro-gramme, verifying the fact that it succeeded mainlybecause it was a public programme with the relativenon-involvement of the for-profit private healthsector. A number of NGOs have also been activeand working in collaboration with the public healthprogramme. These surveys, however, also reveal thatworryingly rural prevalence of leprosy is nearlythrice that in urban areas, indicating the slowerprogress in the rural domain.
Tuberculosis
There are 29 district TB centres and 2,491 peripheralhealth institutions, which include Rural Hospitals,Cottage Hospitals, Primary Health Centres, NagarParishad Dispensaries, etc., where the anti-TB pro-gramme is implemented through MultipurposeHealth Workers of the primary healthcare pro-gramme. To control TB more effectively, a RevisedNational Tuberculosis Control Programme(RNTCP) is being implemented since 1998–99. Theoperational objective of RNTCP is to cure 85 percent newly detected sputum positive cases throughDirectly Observed Treatment Short Course Chemo-therapy (DOTS). To facilitate this a State TB Societywas formed and registered in 1998. District TBSocieties have also been formed in Raigad and Pune(Rural) districts and Mumbai, Pimpri-Chinchwadand Pune Municipal Corporations.
TB is the biggest challenge among the spectrumof infectious diseases. Although the prevalence rate
appears to have declined (Table 5.4), greater effortsare required to reduce it further. The overall preva-lence of TB across the two NFHS rounds has beennearly constant at 293 per 1,00,000 population(NFHS-1) and 282 (NFHS-2). This makes for acaseload of over 2,60,000 TB cases at any point oftime. Again the rural urban differences are wide buthere it is expectedly the urban areas that bear thebrunt. Between the two rounds, the picture hasreversed. Surprisingly the RCH survey, which indi-cates near identical overall prevalence of TB, showsa reversed rural-urban picture with rural areas hav-ing a higher prevalence.
The inadequate performance of the programmelies in late detection. Most of this happens becausethe private doctors treat TB patients in the earlierstages of the disease for cough and other respiratoryinfections. This delayed diagnosis and consequentworsening of the cases end up with the public sectorhealth services. Studies have shown not only theincapacity of the private health sector in handlingTB but also their contribution to drug resistancedue to misuse of drugs (Uplekar and Rangan, 1996).Further, with the rising threat of HIV/AIDS, tuber-culosis becomes an even greater danger.
HIV/AIDS
The challenge of HIV/AIDS is an important issuefor Maharashtra given that it has the highest preva-lence of the disease among Indian States today. Giventhe complexity of the issues surrounding HIV, suchas awareness, harm reduction and elimination ofstigma and discrimination, it becomes increasinglyimportant for all stakeholders in the fight against theepidemic to mainstream a rights-based developmentapproach. Box 5.1 examines the poverty-disease cor-relates, showing that HIV/AIDS needs to be tacklednot only as a communicable disease but also as aregular development issue in Maharashtra.
The National AIDS Control Programme, a 100per cent centrally sponsored scheme is being imple-mented to help Maharashtra tackle the challenge ofHIV/AIDS. In its first phase the project was sanc-tioned for the period September 1992 to March
60 Human Development Report Maharashtra 2002

1999. Going by the success of Phase I, Phase II isbeing implemented, except in Mumbai, through theMaharashtra State AIDS Control Society (MSACS)set up in 2000. It is responsible for planning, co-ordination, implementation and monitoring ofAIDS prevention and control programmes at theState level. For implementation of NACP in the cityof Mumbai, the Brihan Mumbai Municipal Corpo-ration has set up Mumbai District AIDS ControlSociety (MDACS).
The entire focus of the NACP is awareness
campaigns and education, and surveillance of spe-cific groups of population. For instance, surveillanceis done through screening of blood samples fromSTD clinic patients and women seeking antenatalcare. The surveillance data collected from varioussites (STD clinics and ANC clinics) shows widevariations across sites.
Whatever data is available on the incidence ofHIV/AIDS (Table 5.5) is itself disconcerting sinceit reflects only a tip of the iceberg, most of the datacoming from only the public healthcare system.
Box 5.1HIV/AIDS and Human Development in Maharashtra
The relationship between disease and destitution isa complex and mutually reinforcing one. The socialand economic terrain of HIV/AIDS in Maha-rashtra is related to variables such as high degreesof labour mobility (often male migration to urbanareas), persistent poverty and endemic hunger thatoften drive the commercial sex work in the State.
In May 1986, Maharashtra’s first AIDS case wasdetected in Mumbai. Today, the State records thehighest incidence of HIV in India, accounting forover 50 per cent of all HIV/AIDS cases in thecountry. According to the NACO classification, theState is categorised as Concentrated-Stage I, withHIV prevalence rate in antenatal clinics exceeding1 per cent (2.4 per cent).
Surveillance site data from Maharashtra showsthat HIV infection has spread rapidly among Com-mercial Sex Workers (CSWs), as indicated by thoseattending STD clinics. It is rapidly spreading in lowrisk population groups, the average time lag being 3to 5 years as the virus spreads from CSWs to theirclients who act as the ‘bridge population’ to the lowrisk groups such as their wives. In 1999, HIV sero-prevalence among STD patients in Maharashtra was19 per cent. In Mumbai, prevalence of HIV amongSTD patients had risen in 1999 to 56 per cent from1 per cent in 1987.
Findings of a Behavioural Sentinel Survey (July–October 2000) in selected areas of Maharashtra, in-cluding urban areas of Mumbai, Pune, Thane andrural and urban areas of Sangli district, indicate thatawareness of HIV and the need for condom use was
high among both brothel-based (over 91) per cent)and non-brothel-based CSWs. However, while 64per cent of non-brothel-based CSWs used condomswith all their paying partners, only 32 per cent usedcondoms consistently with their non-paying part-ners during the last 12 months.
The spread of HIV is not a random event, but iscaused by specific behavioural patterns, with strongsocio-economic implications. The correlates of HIVwith human deprivation are now increasingly beingresearched. According to a NACO shady, HIVprevalence tends to indicate a positive relationshipwith the following variables—poverty ratio, migra-tion, urbanisation and child mortality. Given thatMaharashtra has a high incidence of all these factors,the challenge of HIV/AIDS is formidable indeed inthe State.
In view of this link, it may be useful to designanti-HIV interventions not only in the areas ofharm prevention and reduction, but also developsocial security and livelihood interventions forhigh-risk groups such as the commercial sex work-ers for many of whom the fear of declining incomesafter ‘prime age’ increases the propensity to maxi-mise clients, even if it involves unprotected sex.
The fear of HIV is overshadowed by the fear ofold age. In order to address this, a human develop-ment strategy for Maharashtra must address issues ofstigma and discrimination (especially for people liv-ing with AIDS) and strive for ensuring that a caringsociety guarantees rights of access to basic services toall.
Contribution: Human Development Resource Centre (HDRC), UNDP, New Delhi.
Health and Nutrition 61

Table 5.5
HIV/AIDS Status in Maharashtra Indicators,August 1986 to October 2000
Indicator August 1986 to October 2001
No. of Blood Units Screened 5,348,320ELISA Reactive 72,856HIV Positivity Rate (General Population) 1.4No. of persons tested (High Risk Behaviour) 668,402No. of HIV +ve persons 92,479HIV Positivity Rate (High Risk Groups) 13.8No. of AIDS Cases 10,160No. of AIDS Deaths 966Source: Maharashtra State AIDS Control Society, Mumbai.
Available data from Maharashtra State AIDSControl Society shows that between August 1986and October 2001, 72,856 units out of 5.34 millionunits of blood screened tested positive for ELISAReactive tests i.e., 1.36 per cent. During the sameperiod, of the 6,68,402 persons in the High RiskBehaviour, 92,479 tested positive i.e., 13.8 per cent.
There is hardly a district in Maharashtra withoutAIDS. Only two, Osmanabad and Wardha reportedno cases. Though 13 districts reported cases of AIDSbetween 1986 and 2001, they reported no deaths.What is intriguing is that some of these districtshave fairly large number of AIDS cases—116 inChandrapur, 92 in Akola and 40 in Aurangabad(Table 5.6) but even these did not report any AIDSrelated deaths. This could be a pointer to possiblypoor reporting.
Both by incidence and fatality, Sangli and Mum-bai lead with a high number of AIDS cases: 2,952cases out of a total of 6,644 cases across Maharashtraand 200 deaths of the total of 696 deaths betweenAugust 1986 to February 2001. Mumbai is a majorreservoir but smaller towns like Sangli (2,077 casesand 267 deaths), Kolhapur (314 cases and 113deaths), Satara (380 cases and 26 deaths) and Pune(375 cases and 53 deaths) throw up a disconcertingpicture of the situation. These four districts accountfor some 47 per cent of the total cases in Maharashtra;Mumbai for about 44 per cent. The data from thefour districts, however, does not indicate the urban-rural differentials that could be present.
Both the incidence and fatality are higher amongmales than among females. It may be useful to studywhy, apart from Mumbai, the Pune-Satara-Sangli-Kolhapur belt has there been such high incidence incomparison to other, districts. This, however, maynot be an accurate picture since the system of report-ing and actual screening may be somewhat inade-quate. The treatment component is as yet absent inthis programme. As regards awareness and education
Table 5.6
District-wise number of AIDS cases reportedand deaths reported in Maharashtra, August1986 to February 2001
SurveillanceCentre
AIDS Cases AIDS DeathsMale Female Total Male Female Total
Raigad 57 10 67 4 1 5Ratnagiri 14 5 19 0 0 0Thane 79 16 95 5 2 7Ahmednagar 9 12 21 1 1 2Nashik 4 1 5 1 1 2Dhule 1 1 2 0 1 1Jalgaon 12 9 21 1 1 2Pune 216 159 375 14 39 53Satara 280 100 380 24 2 26Solapur 8 5 13 1 1 2Kolhapur 231 83 314 81 32 113Sangli 1461 616 2077 198 69 267Sindhudurg 5 2 7 3 1 4Aurangabad 30 10 40 0 0 0Beed 9 0 9 0 0 0Jalna 7 1 8 0 0 0Nanded 1 0 1 0 0 0Osmanabad 0 0 0 0 0 0Latur 4 2 6 1 1 2Parbhani 6 0 6 0 0 0Akola 78 14 92 0 0 0Amaravati 2 0 2 0 0 0Buldhana 3 0 3 1 0 1Yavatmal 1 1 2 0 1 1Bhandara 0 0 0 0 0 0Chandrapur 95 21 116 0 0 0Gadchiroli 1 0 1 0 0 0Nagpur 7 3 10 5 3 8Wardha 0 0 0 0 0 0Mumbai 2432 520 2952 164 36 200Total 5053 1591 6644 504 192 696Other states 248 57 305 17 9 26Foreigners 4 3 7 2 2 4Grand Total 5305 1651 6956 523 203 726Source: Directorate of Health Services.
62 Human Development Report Maharashtra 2002

a wide array of groups like high school and collegestudents, truck drivers, sex-workers, eunuchs, streetchildren, migrant workers etc. are targeted, as is thegeneral public through the mass media. Much of thisis done through NGOs, whose role is especiallycritical since they form an interface between thegovernment programme and the target population.
Blindness
Blindness is a major problem in Maharashtra withover 3.5 per cent of the population having eitherpartial or complete blindness, cataract being themain reason with 80 per cent of the blindnessattributed to cataract as per the Performance Budgetreport of the Government of Maharashtra. Since1994, to expedite cataract surgeries, World Bankassistance of Rs 83 crores has been pumped into thisprogramme. To effectively implement the projectand to reduce the backlog of cataract blind peoplein the State, District Blindness Control Societieshave been set up in each district.
NFHS-1 is the only source that provides asurvey-based data on blindness. It reveals that theoverall prevalence of partial blindness was 32 per1000 and that of complete blindness was three per1000. The prevalence of both partial and completeblindness is higher among women and in rural areas.
Water Supply and Sanitation
Access to safe drinking water and sanitation facilitiesis one of the significant determinants of health statusin the population. Available data indicates that in1991, 54 per cent rural and 91 per cent urban house-holds had safe drinking water facilities. (Table 5.7)NFHS data shows that the drinking water situationbetween 1992 and 1999 has shown little improve-ment.
Sanitation too has a major public health impactand here both urban and rural areas are inadequatelyprovided. Though around 75 per cent of householdsin urban areas have latrine, drainage system andgarbage disposal (Table 5.8), the public health con-sequences of inadequate sanitation facilities are
greater in densely populated urban areas where 32per cent of the population is residing in slums (RGI,2001). Even in many municipal towns, under-ground drainage is not a common feature, which inturn triggers several health risks.
Family Welfare Programme
Given the formidable challenge of population con-trol in Maharashtra, Family Welfare Programmeshave been centre stage. When the Government ofIndia abolished the method-specific approach in1996 where targets for all activities were fixed atnational level, Maharashtra adopted its own strategy,where expected levels of contraceptive use for eachdistrict were estimated using criteria based on. birthrates and death rates. The district level officers drewthe targets. Unlike in the earlier approach geared tomeet set targets while quality of services and health-care facilities received lower priority, the emphasisof the target free approach is on better quality ofservice. Personnel in the PHCs were trained and thefocus shifted to topics like quality of care, informedchoice and the assessment of community needs.
Table 5.7
Percentage of Households having DrinkingWater and Sanitation Facilities in Maharashtra
1992–93 1998–99Drinking water from pump/pipe 78.5 81.9Any toilet/latrine facility 40.8 45.9
Source: IIPS 1995; IIPS and ORC Macro 2000.
Table 5.8
Percentage of Households having Water Supplyand Sanitation Facilities in Maharashtra
Type of Facility Rural UrbanSafe drinking water (1991) 54.0 90.5Latrine (1993) 7.7 76.5Underground sewage (1993) 0.0 19.5Drainage system (1993) 31.0 77.6Garbage disposal (1993) 32.0 74.2Source: CSO 2000; NSSO 1998.
The family welfare programme is a high priorityprogramme. Under this programme as revealed by
Health and Nutrition 63
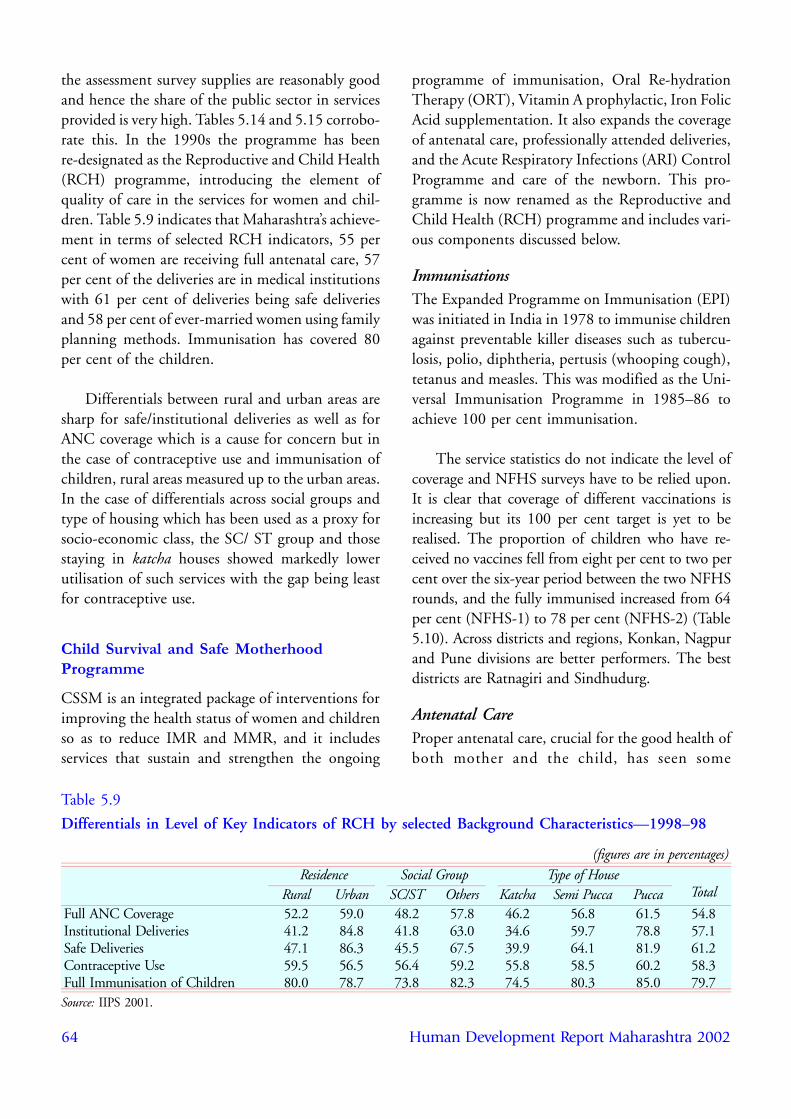
the assessment survey supplies are reasonably goodand hence the share of the public sector in servicesprovided is very high. Tables 5.14 and 5.15 corrobo-rate this. In the 1990s the programme has beenre-designated as the Reproductive and Child Health(RCH) programme, introducing the element ofquality of care in the services for women and chil-dren. Table 5.9 indicates that Maharashtra’s achieve-ment in terms of selected RCH indicators, 55 percent of women are receiving full antenatal care, 57per cent of the deliveries are in medical institutionswith 61 per cent of deliveries being safe deliveriesand 58 per cent of ever-married women using familyplanning methods. Immunisation has covered 80per cent of the children.
Differentials between rural and urban areas aresharp for safe/institutional deliveries as well as forANC coverage which is a cause for concern but inthe case of contraceptive use and immunisation ofchildren, rural areas measured up to the urban areas.In the case of differentials across social groups andtype of housing which has been used as a proxy forsocio-economic class, the SC/ ST group and thosestaying in katcha houses showed markedly lowerutilisation of such services with the gap being leastfor contraceptive use.
Child Survival and Safe Motherhood
Programme
CSSM is an integrated package of interventions forimproving the health status of women and childrenso as to reduce IMR and MMR, and it includesservices that sustain and strengthen the ongoing
programme of immunisation, Oral Re-hydrationTherapy (ORT), Vitamin A prophylactic, Iron FolicAcid supplementation. It also expands the coverageof antenatal care, professionally attended deliveries,and the Acute Respiratory Infections (ARI) ControlProgramme and care of the newborn. This pro-gramme is now renamed as the Reproductive andChild Health (RCH) programme and includes vari-ous components discussed below.
ImmunisationsThe Expanded Programme on Immunisation (EPI)was initiated in India in 1978 to immunise childrenagainst preventable killer diseases such as tubercu-losis, polio, diphtheria, pertusis (whooping cough),tetanus and measles. This was modified as the Uni-versal Immunisation Programme in 1985–86 toachieve 100 per cent immunisation.
The service statistics do not indicate the level ofcoverage and NFHS surveys have to be relied upon.It is clear that coverage of different vaccinations isincreasing but its 100 per cent target is yet to berealised. The proportion of children who have re-ceived no vaccines fell from eight per cent to two percent over the six-year period between the two NFHSrounds, and the fully immunised increased from 64per cent (NFHS-1) to 78 per cent (NFHS-2) (Table5.10). Across districts and regions, Konkan, Nagpurand Pune divisions are better performers. The bestdistricts are Ratnagiri and Sindhudurg.
Antenatal CareProper antenatal care, crucial for the good health ofboth mother and the child, has seen some
Table 5.9
Differentials in Level of Key Indicators of RCH by selected Background Characteristics—1998–98
(figures are in percentages)Residence Social Group Type of House
TotalRural Urban SC/ST Others Katcha Semi Pucca PuccaFull ANC Coverage 52.2 59.0 48.2 57.8 46.2 56.8 61.5 54.8Institutional Deliveries 41.2 84.8 41.8 63.0 34.6 59.7 78.8 57.1Safe Deliveries 47.1 86.3 45.5 67.5 39.9 64.1 81.9 61.2Contraceptive Use 59.5 56.5 56.4 59.2 55.8 58.5 60.2 58.3Full Immunisation of Children 80.0 78.7 73.8 82.3 74.5 80.3 85.0 79.7Source: IIPS 2001.
64 Human Development Report Maharashtra 2002

improvements in the coverage of ANC services overthe six-year period from NFHS-1 to NFHS-2. In-stitutional deliveries and deliveries supervised bytrained health professionals (PRC and IIPS, 1995;IIPS and ORC Macro, 2000) also increased, facili-tating safe delivery and better health of the motherand child. The differentials across regions and dis-tricts are similar to that for immunisation. Konkan,Pune and Nagpur divisions did better than the Stateaverage for ANCs and the former two for institu-tional deliveries. As expected, Mumbai topped forboth ANCs and institutional deliveries, followed bySindhudurg. The worst districts were Nashik, Dhuleand Parbhani for ANCs and Gadchiroli, Bhandaraand Jalna for institutional deliveries.
Childhood DiarrhoeaThe Oral Re-hydration Therapy Programme wasinitiated in Maharashtra since 1986–87 in phasesto prevent deaths due to diarrhoea among childrenbelow five years of age. All districts were coveredunder this scheme by 1989–90. The programmefocuses on training, health education and supply ofORS packets. The percentage of children who haddiarrhoea showed an increase in NFHS-2 as com-pared to NFHS-1 and may be due to the seasonalvariations during data collection, which affects theprevalence of diarrhoea. Knowledge of ORS packetshas increased from 47 per cent to 65 per cent.Percentage of children who were given ORT hadalso increased over the same period indicating im-provements in the use
Reproductive Tract InfectionsThis is a recent initiative. But not much informationis available in the performance budgets except that
there is a World Bank and Central governmentsupported RCH programme for which in 2001–2002, Rs 680 million was allocated, 97 per cent ofthis is towards materials and supplies, mostly forcontraception and immunisation services. At thehealthcare delivery level there is no evidence of anysubstantial inputs into dealing with RTIs which therecent RCH survey clearly revealed that 27 per centof women and 10 per cent of men reported havinghad at least one such episode in ‘last three months’.Across districts there was substantial variation withAkola (43 per cent), Nanded (38 per cent) and Jalna(37 per cent) reporting high prevalence for womenand Bhandara (17 per cent), Yavatmal and Wardha(14 per cent) and Nanded (13 per cent) for men(Annexure Table 47) indicating a large potentialdemand for such services, that needs to be met.
Healthcare Delivery and Utilisation
The public delivery system is organised on the basisof population and geographical entitlements. At theapex are the tertiary institutions or teaching hospitals,located in Mumbai and other larger cities like Pune,Solapur, Nagpur, Thane, Aurangabad etc. Presentlythere are 11 such hospitals, owned and run by theState Government in addition to two run by theCentral Government and four by Municipal Corpo-rations. District headquarters, at the next level, haveCivil Hospitals, usually of 100–500 beds with mostbasic specialities and of late, some of the larger onesamong them are used as teaching hospitals. There are21 civil hospitals with 5,910 beds. These hospitalsare core centres for referral medical care for the ruralareas, catering also to the district towns where theyare located. Many taluka and other towns have
Table 5.10
Percentage receiving selected Antenatal Care Services
NFHS-11 NFHS-2 2
Rural Urban Total Rural Urban TotalReceived 2 or more doses of Tetanus Toxoid 65.4 79.8 71.0 72.0 79.4 74.9Received iron and folic acid tablets or syrup 69.6 72.2 70.6 82.3 88.6 84.8Received antenatal check-up outside home from:
1. Doctor 45.3 85.7 61.0 55.3 89.6 68.72. Other Health Professional 11.8 2.8 8.3 24.7 4.4 16.8
Source: 1 PRC and IIPS 1995; 2 IIPS and ORC, Macro 2000.
Health and Nutrition 65

smaller hospitals or sub-divisional hospitals run bylocal self-governments. In the rural areas, at the30,000-population level—it is 20,000 for tribal andhill areas—Primary Health Centres (PHCs) and sub-centres with two health workers per 5,000 populationare in place. These health centres have one doctorwith six beds and para-medical personnel, providingthe first contact care to villagers. Presently there are1,762 PHCs, 169 PHUs, 61 mobile health units and9,725 sub-centres.
During the expansion of the rural health infra-structure, under the Minimum Needs Programmein the 1980s, Rural Hospitals were set up or someor the older PHCs upgraded as Community HealthCentres, to make first referral care available to therural population closer to where they live. These30-bedded hospitals had four basic specialities—Medicine, Surgery, Obstetrics and Gynaecology andPaediatrics. Maharashtra has 345 Rural Hospitals,each reaching out to about 1,50,000 population(one per 5 PHCs). In some cities, urban healthcentres on the pattern of PHCs are being set upunder the India Population Project supported by theWorld Bank and other similar projects. (Table 5.14)
There are teaching hospitals in the private sectoras well, in addition to Government run teachinghospitals. Some of these private teaching collegesare dependent on public hospitals for infrastructuresupport. Most of these private large tertiary hospitalsoperate as non-profit making institutions whilesmall private hospitals and nursing homes mostlyoperate on commercial basis. Their share in hospi-tals is 87 per cent, in dispensaries it is 88 per centand in beds it is 47 per cent. The increasing numberof private medical colleges being set up reflects agreater commercialisation of medical education fa-cilities. Nine district hospitals have been allowed tobe used by the private medical colleges on paymentbasis for performing the functions of the teachinghospitals, indicating a shift towards private-publicpartnership in providing medical education andhealth services.
Both qualitatively and quantitatively, there is awide gap in the healthcare infrastructure available
in the rural and urban areas. Urban areas have botha concentration of hospitals and nursing homes aswell as qualified doctors, it being true as much withthe public sector as it is with the private (Figures5.7 and 5.7A). Most of the public hospitals are inthe cities, district and sub-divisional towns. Dispro-portionately, over 80 per cent of the beds in thepublic hospitals are in urban areas where 42.4 percent of the population lives. So is the case with theprivate sector. This has led to a much better avail-ability of health services in the urban areas. Forexample, in the year 2000, the number of doctorsper 1,00,000 population in urban areas is 139.8 ascompared to a mere 23.7 in rural areas (Table 5.12).Similar disparities are evident across other relatedindicators. This is in contrast to Punjab and Kerala,where the services are more evenly spread betweenthe urban and rural regions, perhaps explaining whythese States do better in the health domain thanMaharashtra (Tables 5.11 and Annexure Table 48).Apart from the patent urban-rural differentials, Ma-harashtra also has a wide variation across districtsand regions. For example, Mumbai, Pune, Wardhaand Nagpur have a better ratio of population tofacilities (Annexure Tables 48 and 49).
Compared to other developed States, the overall
1041
67
5050
5
1282
05
1282
05
5025
1
8928
6
6250
017
921
9434
0
3745
385
54
2932
6
1694
9
1010
1
3085
9
0
20000
40000
60000
80000
100000
120000
140000
1961 1971 1981 1991 1995
Population covered per facility
Hospitals Dispensaries PHC
Year
Figure 5.7
Growth of Health Care Facilities, Maharashtra,1961–1995
Source: Refer relevant Table.
66 Human Development Report Maharashtra 2002

health sector in Maharashtra is weaker, not havingkept pace with its general economic attainments(Annexure Table 50). Its intra-state differences area cause for greater concern. The urban areas, espe-cially in and around Mumbai and in south-westernMaharashtra are well provided for but the rest lagsbehind in health infrastructure. Its rural infrastruc-ture of PHCs and SCs are as per the defined normsbut they are not adequately supported by inputsneeded to run a proper healthcare system. Publicinvestment and health expenditures are not onlyinadequate but have declined in the 1990s. Ma-harashtra’s position relative to other States has alsoworsened (Table 5.13) (Annexure Table 51).
Table 5.12
Availability of Medical Care Facilities in Maharashtra
Type of Facility
Number per1,00,000 population
Total Rural UrbanAllopathic hospital (1995)1 5.9 1.0 13.2Allopathic Dispensaries (1995)1 9.9 2.6 21.3Avurved, Unani, HomeopathyInstitutions)1
2.4 n.a. n.a.
Beds (1995)1 153.9 44.7 324.7Doctors-Allopathic (2000)2 72.5 23.7 139.8All System Doctors (2000)2 167.6 77.8 290.3Nurses (2000)2 140.5 65.4 244.3
Source: (1) Based on data in Government of Maharashtra (2000).
(2) Supplied by Directorate of Economics and Statistics, Government of Maharashtra, Mumbai.
The rural-urban distribution for doctors and nurses in2000 provided by respective medical councils are on thebasis of the 1991 census distribution ratios.
Medical Care
Household based national surveys by the NationalSample Survey Organisation and the NationalCouncil for Applied Economic Research providesinformation on utilisation for medical care facilities(Table 5.17). These surveys show a declining trendin the use of public facilities in Maharashtra overthe years. The NSSO surveys reveal that use ofpublic hospitals for in-patient care has declined
61%
39%
90%
10%
48% 52%
Hospitals Dispensaries Beds
Private % Public %
Figure 5.7A
Health Facilities in Public and Private Sector,Maharashtra
Source: Refer relevant Table.
Table 5.11
Number of Hospitals, Beds and Dispensaries per lakh population across States and by Rural and Urban Areas
StatesHospitals Beds
Ref YearDispensaries
As onRural Urban Total Rural Urban Total Rural Urban TotalAndhra Pradesh 1.7 10.6 4.2 19.8 189.8 65.5 1-1-94 0.4 0.4 0.4 1-1-93Gujarat 0.6 15.1 5.6 24.3 422.5 161.7 1-1-95 8.2 31.2 16.1 1-1-95Haryana 0.1 1.5 0.4 4.0 152.8 40.6 1-1-96 0.3 4.1 1.2 1-1-93Karnataka 0.1 1.7 0.6 10.4 233.5 79.4 1-1-96 1.8 1.6 1.7 1-1-94Kerala 6.5 7.5 6.7 198.0 414.2 255.1 1-1-94 6.4 6.4 6.4 1-1-94Maharashtra 0.9 8.3 3.8 20.7 219.7 97.7 1-1-93 0.7 24.4 9.9 1-1-93Punjab 1.8 2.2 1.9 62.9 156.2 90.4 1-1-96 7.7 3.6 6.5 1-1-96Tamil Nadu 0.2 1.7 0.7 11.8 232.9 87.5 1-1-90 0.4 1.9 0.9 1-1-90West Bengal 0.2 1.4 0.5 11.7 237.0 73.7 1-1-96 0.8 0.7 0.7 1-1-96All India 0.7 4.3 1.6 19.4 212.7 69.1 1-1-96 1.7 6.7 3.0 1-1-96
Source: Based on CBHI, 1998.
Health and Nutrition 67

from 45 per cent of the cases in 1987 to 31 per centin 1996 and for ambulatory care, the use of publicfacilities has dropped from 26 to 18 per cent duringthe same period. The urban areas have marginallyhigher utilisation rates in the public sector as com-pared to rural areas. The declining use of publichealth facilities in the context of high levels ofpoverty is a symptom of the deterioration of thepublic health system. This is clearly evident fromthe assessment of public health facilities done by theGovernment (Box 5.2).
Table 5.14
Healthcare humanpower availability in RuralAreas of Maharashtra as on 30-6-1998
InPosition
Sanc-tioned
% inPosition
Female ANMs 11,590 11,915 97.3Health Worker/MPW (M) 7,978 12,440 64.1Health Assistant (F) 1,698 1,536 110.5Health Assistant (M) 3,691 4,549 81.1Doctors at PHC 2,993 3,068 97.6Specialists (Surgeons, Obstetricians, Gynaecologists,Physicians and Paediatricians)
753 1,207 62.4
Radiographer 330 414 79.7Pharmacist 1,839 2,080 88.4Lab Technician 1,350 1,480 91.2Nurse Midwife 3,121 3,386 92.2Block Extension Educator 292 320 91.3
Source: DGHS 2000.
Information on the utilisation of various servicesis also available from recent national level surveys(National Family Health Surveys and Reproductiveand Child Health-Rapid Household Survey), whichwere largely confined to information on reproductiveand child health services (Table 5.18). The latter alsogives data at the district level (Annexure Table 53).
Table 5.15
Availability of at least 60 per cent of critical inputs in District Hospitals, First Stage ReferralUnits and Community Health Centres, Maharashtra, 1999–2000
ItemNo of Dis-trict Hospi-tals having
% ofFRUshaving
% ofCHCshaving
% ofPHCshaving
Infrastructure 9 100 97 88Staff 8 34 28 60Supply 2 50 8 87Equipments 10 34 10 96Total number ofunits listed
10 50 71 645
Source: IIPS 2001.
These studies reveal that over 48 per cent of thewomen had availed antenatal care services frompublic sector (53 per cent rural and 40 per centurban) and for pregnancy complications, 40 percent (50 per cent in rural areas and 30 per cent inurban areas). From those who had delivered in aninstitution, 49 per cent had used public facilities
Table 5.13
Average Population Covered by PHC, CHC and Sub-Centre
(As on 31-3-1991)Average population covered by a
(As on 30-6-1999)Average population covered by a
Sub-Centre PHC CHC Sub-Centre PHC CHCAndhra Pradesh 6,175 37,995 10.5 4,949 31,972 2.2Gujarat 3,793 30,888 1.8 4,116 30,964 1.4Haryana 5,400 31,427 3.0 6,303 36,136 2.3Karnataka 3,988 27,430 2.1 4,201 20,409 1.4Kerala 4,204 23,509 4.0 4,384 23,212 2.8Maharashtra 5,167 29,379 1.7 5,401 30,913 1.7Punjab 5,012 7,022 2.1 2,693 32,978 1.5Tamil Nadu 4,234 25,721 5.0 4,494 27,168 5.4West Bengal 6,269 31,966 5.7 6,878 44,287 5.6India 4,753 28,011 3.2 5,164 30,854 2.4Source: Computation based on data from Rural Health Statistics (1992 and 2000) and expert committee on population projection
(1996).
68 Human Development Report Maharashtra 2002

(53.3 per cent rural and 43.2 per cent urban).Among the women who experienced post-deliverycomplications, around 36 per cent had sought treat-ment from the public sector.
The public sector is also a major provider ofcontraceptives in the State accounting for 75.2 percent of all acceptors of modern methods. Level ofutilisation of contraceptives from public sector varied
Table 5.16
Healthcare Facilities in Mumbai, Rural and Urban Maharashtra by Public and Private Sector
Public Facilities (Govt. + Local Body) Private Facilities
MumbaiOtherUrban Rural
TotalPublic Mumbai
OtherUrban Rural
Per CentPrivate
Teaching Hospital 4 13 – 17 1 16 – 50General Hospital 76 192 – 268 1,416 – – –Rural Hospital – – 345 345 – 2.849 – –PHC/PHU/HP 176 206 1,990 2,372 – – – –Sub-centre – – 9,725 9,725 – – – –Dispensary 235 507 – 742 1,832 3,914 – 88Hospital beds 20700 29288 20862 70850 23202 38827 – 47
Source: The data in this table has been worked out from the Performance Budget (2001–2002 Budget) for State Government for theyear 1999 and from the Statistical Abstract for local bodies and private sector for 1995 (Government of Maharashtra, 1998).However Mumbai data has been compiled from the records of the BMC for 1999, and hence totals do not match with theStatistical Abstract since the latter does not record complete information. The private sector data is an under-estimate and alsorefers to 1995, except for Mumbai where it is based on a survey by CEHAT.
Box 5.2Assessment of Healthcare Facilities in Public Sector
Analysing the facilities available in selected publichealth care institutions gives a brief idea about itsfunctioning. The RCH Facility survey (1999–2000) undertaken by Ministry of Health and Fam -ily Welfare, has reviewed all public healthcarefacilities available in selected districts in each State.A total of 13 districts were covered in Maharashtraand facilities required for proper functioning ofdistrict hospitals, first stage referral units, commu-nity health centres and primary health centres wereevaluated. (Annexure Tables 30–35)
Physical Infrastructure and Medical Equipment
The district hospitals and most of the CommunityHealth Centres (CHCs) seem to be self-sufficient interms of water, electricity, vehicles and operationtheatre facilities. Two of the district hospitals andmajority of first stage referral units lacked separateaseptic rooms and any linkage with blood bankfacility. Availability of these facilities is inadequate inCHCs and PHCs. Though the district hospitals hadmost of the essential medical equipment, severeshortage of these facilities was seen in FRUs andCHCs. More than 50 per cent of FRUs and CHCsdid not have even a Boyle’s apparatus, oxygen cylin-der, high-pressure steriliser and ECG Machine.
Medical Personnel
Almost all the public healthcare units had generalduty doctors, staff nurses and laboratory techni-cians. But a majority of them did not have servicesof specialist doctors like an obstetrician and gynae-cologist, paediatrician, RTI/STI specialist patholo-gist and anaesthesiologist. A majority of the PHCsdid not have laboratory technicians as well aswomen medical officers.
Contraceptives and Vaccines
The PHCs and the district hospitals had adequatestocks of contraceptives and vaccines but the FRUsand CHCs were not as well stocked. Vitamin Awas deficient in all the institutions.
Overall Inputs
The share of public healthcare units that werehaving at least 60 per cent of the critical inputsshowed a mixed picture. While most district hos-pitals had problem with supplies, the FRUs, CHCsand PHCs suffered shortages of staff and the firsttwo of supplies and equipment as well.
Health and Nutrition 69

from 18.1 per cent for the oral pill to 93.1 per centfor male sterilisation. The level of utilisation forfemale sterilisation from the public sector was alsohigh (82.3 per cent), while 29.8 per cent and 19.9
per cent of users had got their IUDs and condoms,respectively, from the public sector.
The role of the public sector in providing
Table 5.17
Utilisation of Public and Private Facilities in Rural and Urban Maharashtra
Inpatient Care Outpatient CareRural Urban Rural Urban
Public Others Public Others Public Others Public OthersNSSO 1986–87 43.6 56.4 46.2 53.8 26.7 73.7 25.0 75.0NCAER 1993 30.5 69.5 58.8 41.2 43.8 56.2 32.5 67.5NSSO 1995–96 31.2 68.8 31.8 68.2 16.0 82.0 17.0 81.9
Source: NSSO 1992; Sundar 1995; NSSO 1998a.
Box 5.3Private Healthcare—Evidence through Utilisation Studies
Organised documentation on the private healthsector is scarce but what is available is due to somebasic statutory requirements like registration ofdoctors with their Councils and of hospitals withlocal governments. The Central and State Govern-ments in their statistical reports, which invariablyare plagued by incomplete reporting, report these.The professional associations of doctors and hos-pitals have neither documented basic informationabout their profession and institutions nor make itpublic. Data from government statistical reports showthat two-thirds of the hospitals and over 40 per centof hospital beds are in the private sector. The incom-pleteness of this data, especially on the private sector,makes it difficult to substantiate the growth that istaking place with regard to the private health sector.Hence the only evidence available on the working,size and the character of the private health sector ishousehold studies of healthcare seeking behaviour.At the national level the NSSO surveys from the42nd and 52nd Rounds and the NCAER studieshelp here. There are smaller micro studies at the Stateor district levels (Annexure Table 39). The two NSSO surveys clearly show that be -tween 1987 and 1996 private health sector utilisa-tion in Maharashtra increased from 56 per cent to68 per cent in rural areas and from 54 per cent to68 per cent in urban areas for inpatient services. Incase of outpatient care, the private health sectorwas already accounting for three-fourths share in1987 and this increased marginally to 77 per cent
in 1996. This period coincides with the declininginvestments by the State in public healthcare. TheNCAER studies also tell more or less the samestory. The smaller studies done at different pointsof time in Maharashtra also indicate a very largeand growing share of the private health sector.Given the large size of the private healthcare sector,there are two major concerns, which need to beaddressed. First is the issue of quality and mini-mum standards for the services provided. Whilestudies of public institutions have shown compla-cency, long waiting time, non-availability of doc-tors and medicine etc., as its ills, the study of privateinstitutions and providers have shown absence ofany minimum standards, both clinical and physicalas well as irrational drug use, etc. Secondly, the private health sector operates inan unregulated environment. The professionalmedical bodies have not shown any concern to-wards setting up basic rules while the government,despite some regulations, does not implementthem. Both these issues require some concern to-day, both at the level of policy making as well asin the profession. In Mumbai, there is an initiativecalled Forum for Healthcare Standards to help setup an accreditation system which would help setup basic norms and monitor its practice towardsquality care. The State Government has under-taken an initiative for drastic changes in the Medi-cal and Clinical Establishment Act to regulatequality and minimum standards in healthcare pro-vision.
70 Human Development Report Maharashtra 2002

immunisation services to children was even higheras we can see that 83 per cent of children wereimmunised in public healthcare facilities. The pro-portion of children who were immunised from thepublic sector ranged from 89 per cent to 67 per centin rural areas and urban areas, respective.
In the case of outpatient care services, only a smallproportion of children were taken to public healthservices for treatment if they were suffering fromdiarrhoea and pneumonia. The levels of utilisation ofthe public sector for treating these ailments was 13.6per cent, 10 per cent and 12.5 per cent in rural areas,urban areas and combined, respectively. This is muchlower than the NSSO data for treatment of generalmorbidity in the public sector.
The above analysis clearly indicates that of allhealthcare services the public sector dominates onlyin delivering contraceptive and immunisation serv-ices. A sizeable proportion of the population wasfound to be depending on public sector for repro-duction related services, and for inpatient care serv-
Population served per bed
1430 1347
860690 649
0200400600800
1000120014001600
1961 1971 1981 1991 1995
Year
Figure 5.8
Population Served Per Hospital Bed, Maharashtra, 1961–1995
Source: Refer relevant Table.
Box 5.4Whys of Private and Public Investment
An analysis of facilities shows that in the publicand publicly aided medical institutions, wherethe indicators considered are hospitals, dispensa-ries, PHCs and number of beds in all institutionsper lakh of population per square kilometre,Greater Mumbai has the biggest concentration.Other districts lag behind. At the other extreme, Dhule-Nandurbar inWestern Maharashtra, Beed and Osmanabad inMarathwada and Gadchiroli in Vidarbha arelower down on the scale of availability of medicalfacilities. In the matter of medical education, the twosectors, public and private, have played a role butthe nature of education and health makes itimperative for governmental intervention, thisdimension indicated by government expendi-tures on the creation and maintenance of socialinfrastructure facilities. Government expenditure on the revenue ac -count and capital account represent politicalcommitment towards the development of socialsectors. Expenditures on the revenue accountindicate allocations towards recurrent costs whilethose on the capital account represent allocationstowards the development and maintenance ofinfrastructure facilities. A notable feature of the education and healthsystem is that the private sector coexists with thegovernment sector, the latter expected to fosteran egalitarian arrangement. It is the desire for abetter quality of social amenities that creates ademand for private sector facilities.
Table 5.18
Per cent of users of Public Health Facilities inMaharashtra
Type of Services Rural Urban All1. Inpatient care services3 31.2 31.8 –2. Outpatient care services3 16. 0 17.03. Antenatal care services2 53.0 39.6 48.84. Pregnancy complications2 50.0 29.8 40.05. Delivery care2 53.3 43.2 48.76. Post delivery complications2 36.3 36.7 36.57. Contraceptive methods1
(a) Pill 28.6 10.6 18.1(b) IUD * 28.1 29.8(c) Condom 27.3 14.4 19.9(d) Female Sterilisation 89.9 69.4 82.3(e) Male Sterilisation 96.4 77.0 93.1(f) All Modern Methods 85.5 59.1 75.2
8. Immunisation of children2 89.1 67.1 82.79. Diarrhoea and Pneumonia
(for children)213.6 10.0 12.5
Note: The figures are per cent using public facilities fromamongst all users. The balance users used private facilities
* number using IUDs in rural areas are very few.Source: 1 IIPS and ORC, Macro 2000; 2 IIPS 2000;
3 NSSO 1998a.
Health and Nutrition 71

ices. And there is clear evidence of declining trendsin use of public facilities for medical care and otherhealth services. Overall, the utilisation pattern seemsto be closely associated with government policy witha larger emphasis on reproductive and child healthissues. The private health sector in contrast hasexpanded rapidly in the last decade. However, fewmicro-studies have been undertaken in this area,which indicate the penetration of the private health-care system to even the remotest areas, though theproviders are not necessarily either qualified or cer-tified. They seem to be filling a gap and even thepoor have begun to use it in large numbers, asdemonstrated by both micro studies and nationalsurveys (Annexure Table 52).
Private Sector
The private healthcare sector in Maharashtra is boththe largest in the country as well as better developed,with some of the largest and well-known privatehospitals being located here, especially in Mumbai.These large hospitals, expensive and sophisticated,though private, are registered as non-profit institu-tions, which is a peculiar feature not found to thesame extent elsewhere in the country. Though onlythe well heeled find its facilities easily accessible,legally in lieu of tax benefits the hospitals are sup-
posed to provide free services to 20 per cent to 30per cent of their total clients. But in reality, not allsuch free services accrue to the poor, which is theirentitlement.
Public Expenditure on Health
The share of health expenditure in the governmentbudget has decelerated over the years, which mayhave an adverse impact on long-term growth andmay lead to further human deprivation.
Health expenditure reckoned here includes ex-penditure borne by Ministries of Health and FamilyWelfare and therefore, excludes water supply andsanitation. It thus includes curative care i.e., hospi-tals and dispensaries, preventive and promotionalprogrammes such as control of diseases, family plan-ning, immunisation, medical education, EmployeeState Insurance Scheme (ESIS), Food and DrugAdministration, etc.
Health expenditure as a percentage of NSDP atcurrent prices declined from the levels of 0.8 percent in the 80s to 0.6 per cent in 1998–99. As aproportion to total government spending from over6.5 per cent in the 1980s, it dropped to 4.6 per centin 1998–99 (Table 5.19 and Annexure Table 51).
Box 5.5Accreditation initiative in Mumbai
A stakeholder based, ‘Healthcare AccreditationCouncil’ has been recently formed in Mumbai.Uniquely, the Council includes a range of stake-holders—representatives of hospital owners, pro-fessional bodies, consumer organisations andNGOs. The council has been an outcome of aresearch study undertaken by CEHAT, Mumbai in1997–98, to assess the need, views and willingnessof various stakeholders to evolve a framework foran accreditation system. Presently, the council is in the process of devel -oping standards for small private hospitals with afocus on certain key aspects which include struc-tural design, equipment, wards, labour rooms, op-erating theatres, essential drugs, reception rooms,consulting rooms, medical records and waste man-agement among other aspects. It is examining
systems and process related issues, including grad-ing, method and periodicity of assessment andfinancing of the body as well as other areas (e.g.Indicators). Subsequently the forum plans to de-velop standards and indicators for specialities andsuper specialities. The Council would be a non-profit body andthe founding members have contributed the initialfunds for establishing the body. This initiative isan attempt to create a more positive environmentwithin the established private health sector by in-volving them more meaningfully with other stake-holders in a quality assurance mechanism. Thisshould help begin a process of ending a number ofills prevailing in the private health sector and leadtowards some form of accountability towards theusers of such services.
72 Human Development Report Maharashtra 2002

Revenue expenditure on health as a share of totalgovernment expenditure too has shown a declinedespite increasing healthcare demands of the popu-lation. Curative care in urban areas receives dispro-portionate attention when compared to thehealthcare needs of rural population while publicexpenditure should actually, as per World HealthOrganisation norms, should ideally be five per centof the State’s Public Expenditure.
Expenditure on National Disease Control pro-grammes also shows a declining trend. There has beenan increase in non-plan expenditure, mainly on ac-count of salaries and a weakened commitment in planexpenditure. Further desegregation of expenditure onNational Disease Programme shows that spending onMalaria, Leprosy, TB and Blindness control pro-gramme accounts for nearly ninety per cent of thetotal disease programme expenditure. Among the
four; the share of Malaria (50 per cent to 70 per cent)and Leprosy (15 per cent to 30 per cent) is very high.In 1998–99 the share of Malaria touched 71 per centbecause of the flow of funds from World Bank
Table 5.19
Public Expenditure on Healthcare in Maharashtra
(in Rupees million)States 1980–81 1985–86 1990–91 1995–96 1998–99Total Public Health Expenditure 1307 4782 4976 9061 11855Per capita (Rs) 20.99 69.12 63.67 105.46 132.20Per cent to revenue expenditure 6.53 10.65 5.68 5.28 4.62Per cent of NSDP 0.80 1.70 0.80 0.60 0.60
Source: Finance and Revenue Accounts, Government of Maharashtra, various years. Population and income data used from StatisticalAbstract of India.
Box 5.6Decentralisation of Primary Healthcare
One special feature of Maharashtra’s health systemis the early devolution of primary healthcare im-plementation to the Zilla Parishads (District Coun-cils). Right from the start of the State in 1961,primary healthcare, school education and othersocial sector programmes/ schemes were given tothe Zilla Parishad’s to implement. The Zilla Par-ishad’s get grants in aid as establishment and pur-posive grants under section 182 and 183respectively, of the Maharashtra Zillah Parishadand Panchayat Samiti Act, 1961 for handling:• Vaccinations• School health clinics• Primary health centres
• Primary health units• Mobile health units• Allopathic dispensaries• Construction and upgrade of PHCs and sub-
centres• Examination of ashram school children• District local board schemes
This early devolution helped Maharashtra gain anearly lead among States to expand the rural health-care infrastructure. Maharashtra was one of the firstStates to establish the norm of one PHC per30,000 population and one sub-centre per 5,000population in the early 1980s itself.
Table 5.20
Percentage distribution of Medical Expenditurein Public Healthcare Selector by selected LineItems in Maharashtra, 2000–2001
Expenses on itemDistricthospital
Women’shospital
Cottage/Other
hospitalsDispen-saries
Medicine 19.56 14.52 9.53 4.87Diet 1.66 2.62 1.13 n.a.Linen 1.21 0.97 1.30 n.a.Salaries, TA etc. 70.29 77.36 77.42 76.40Other 8.49 5.51 11.92 18.73Total expenses 100.00 100.00 100.00 100.00
Source: Government of Maharashtra, Performance Budget 2001–2002, Public Health Department.
Health and Nutrition 73

Assisted Malaria Control project. It is also revealedthat over the years there is a rapid increase in theshare of salary component and a decline in the shareof non-salary component (Tables 5.21, 5.22 and5.23).
Expenditure on family welfare programmes hasbeen increasing steadily and in 1995–96 stood at
14.8 per cent of the total government expenditure.Spending on maternal and child health (MCH)during the same period showed the same upwardtrend. This is when the Child Survival and SafeMotherhood (CSSM) programme was introducedto reduce maternal and child mortality. The empha-sis on family welfare is on rural welfare services, buthere too the bulk of expenditure is on salaries.
Table 5.21
Expenditure on Malaria Control Programme by Line Items (in percentage), Maharashtra
Year Salaries Travel Drugs Others Total (in Rs millions)1988–1989 61.08 3.58 2.14 33.20 323.651992–1993 84.09 0.00 15.91 0.00 415.621995–1996 80.89 2.11 7.51 9.49 544.011998–1999 87.28 1.16 7.72 3.84 1005.21
Source: Performance Budgets, Government of Maharashtra, respective years.
Table 5.22
Expenditure on Leprosy Control Programme by Line Items (in percentage), Maharashtra
Year Salaries Travel Drugs Diet Others Total (in Rs millions)1988–1989 72.29 9.21 4.83 0.31 13.36 111.321992–1993 n.a. n.a. n.a. n.a. n.a. 179.201995–1996 53.80 3.49 3.76 0.06 38.89 220.961998–1999 76.52 7.03 3.63 0.59 12.23 221.68
Note: n.a.: Break-up not available.Source: Performance Budgets, Government of Maharashtra, respective years.
Table 5.23
Expenditure on National Tuberculosis Control Programme by Line Items (in percentage), Maharashtra
Year Salaries Travel Drugs Diet Others Total (in Rs millions)1988–1989 51.43 2.71 34.24 3.29 8.33 90.551992–1993 n.a. n.a. n.a. n.a. n.a. 128.791998–1999 66.57 2.80 22.37 2.42 5.84 209.59Note: n.a.: Break-up not available.Source: Performance Budgets, Government of Maharashtra, respective years.
Table 5.24
Average out-of-pocket Medical Expenditure on Treatment of an Ailment in Outpatient Care and Inpatient Care Units, 1986–87 and 1995–96
Figures in Rupees
Source of Treatment
Inpatient Care Outpatient Care1986–871 1995–962 1986–871 1995–962
Urban Rural Urban Rural Urban Rural Urban RuralPublic 400 439 1439 1529 52 87 73 91Others 1928 901 5345 3836 99 153 161 175All 1499 842 3997 3089 87 132 140 163
Source: 1 NSSO 1992; 2 NSSO 1998.
74 Human Development Report Maharashtra 2002

All this has implications on utilisation of publichealth services, and data from national surveysclearly reveal a declining share of public services inhealthcare (Table 5.17). And this also means in-creased burden in out-of-pocket expenditures forhealthcare. Between the two NSSO rounds, out-of-pocket costs have increased three-fold for in-patient care and by about 50 per cent for outpatientcare. The increases are even higher for those usingprivate healthcare. Urban users are spending signi-ficantly larger amounts on both in-patient andout-patient services.
Health Sector Reforms
Maharashtra’s public health sector was viewed with agreat deal of pride, and pressures to privatise werestrongly resisted, largely due to the history of socialreforms and progressive public actions. The firstchange came via GR No. HFR-1087/3653/8–9dated 2 February 1988, which prescribed chargingusers of district hospitals, the rationale being, as perthe NSS 42nd Round findings, use of the privatefacilities by even the poor which was seen as thewillingness to pay
Box 5.7The People’s Health Campaign in Maharashtra and improvement in Health Services
The People’s Health Campaign is an innovative,grassroots-to-global movement for Health for All, acampaign for better health that has been activesince July 1999, to enquire into the current stateof health services and to demand better healthcare.In Maharashtra, over 60 health and science-relatedorganisations, women’s and other organisations ofdiverse backgrounds have formed a broad front tohighlight health as a vital social and political issueaffecting the life of every citizen. The backgroundto this campaign is a global wake-up call beinggiven to governments around the world, remindingthem of their promise and pledge made in 1978 toprovide ‘Health for All by 2000 AD’. India tookthe lead in this campaign and over 2000 organisa-tions and NGOs, including 19 national networks,in 20 States are involved in the Peoples HealthAssembly (PHA) process.
The main objectives of the campaign in Ma -harashtra has been to seek basic improvement inpublic health services, social regulation of the pri-vate medical sector and ask that health services tobe sensitised to women’s needs. ‘Health Dialogues’ were carried out at the grass-roots level, in about 40 talukas of 15 districts—Pune,Beed, Osmanabad, Thane, Kolhapur, Nashik,Nanded, Raigad, Ahmednagar, Chandra-pur, Satara,Sangli, Gadchiroli, Wardha and Ratna-giri. An ‘en-quiry’ was conducted into the status of health serv-ices using a standard checklist of 15 mandatoryhealth related services. Following this people ap-proached the block level health authorities for a
dialogue seeking specific improvements in variousservices found lacking, while also offering their co-operation, with mixed response from both authori-ties and private doctors, ranging from the defensiveto the supportive. Various different forms were usedin the process, such as kala jathas, poster exhibitions,street plays and demonstrations to press the people’sclaim to better health services. In Mumbai and Pune,the state of public dispensaries and hospitals wasdocumented.
People’s Monitoring of Healthcare Services
One tool in this process is the ‘Health-Calendar’,a specially prepared blank monthly calendar fordisplay at prominent places in the villages. It showsthe planned visits to the village by ANMs, MPWsetc. Since the people know when the health workeris to visit, they can remain in the village on thatday to avail of their services. On the actual days oftheir visit, they would sign on this calendar, pub-licly recording the visit. Experience shows that thissimple tool has increased the visits and utilisationof health services, helping bridge the gap betweenthe people and the health-services.
Realising the dream of Health for All
Making healthcare a fundamental right, enacting asocial legislation on minimum standards in theprivate medical sector, doubling the public budg-etary allocations for health and initiating a schemefor a village based healthcare provider arc some ofthe issues being raised through this platform at theState and National levels.
Contributed by Dr Anant Phadke, CEHAT, Pune.
Health and Nutrition 75

Its immediate impact was reflected in the Per-formance Budget report of subsequent years, whichshowed drastic declines in OPD and in-patient usersat most district hospitals. After this experience, mosthospitals began to ignore the GR that was neverseriously implemented, bringing back the patientsto the district hospitals.
The recovery of user charges varied from 0.1 percent to 0.18 per cent of the total public healthexpenditure from 1989 to 1996. Caught in thedilemma of increasing resource crunch with thepublic bodies on the one hand and the crying needto create more public health facilities, public-privatepartnership—a new initiative seems to have beenadopted in the post-SAP (Structural AdjustmentProgramme) era. For instance, patients from publichospitals are being referred to private institutionsfor sophisticated investigations like CT Scans andMRIs, often when public institutions should havetheir own such facilities. Similarly, facilities in ninedistrict hospitals have been allowed to be used byprivate medical teaching colleges for a small sum ofRs 10.8 million a year. The Government spends thesame amount to train 10 graduate doctors.
In Mumbai, the Municipal Corporation hasagreed on a policy initiative to privatise all peripheralhospitals and maternity homes which between themhave nearly 6,000 beds in 42 institutions. The non-clinical services have been privatised and a studyshows that while the unit costs went down the qualitydeteriorated (Bhatia and Mills, 1997). Again inMumbai, the Maharashtra Government has enteredinto partnership with a multinational pharmaceuticalmajor to equip and run one of its hospitals. This isperhaps the beginning of new system of private-pub-lic partnership in delivery of health services.
In the footsteps of Andhra Pradesh, Punjab andWest Bengal, Maharashtra too has taken up a healthsystems development project supported by theWorld Bank to improve secondary hospitals, that isCHCs, sub-divisional hospitals and district hospi-tals. The broad objectives of this are:
• To improve the systems performance and quality
of healthcare services in secondary healthcareinstitutes;
• To narrow current coverage gaps by increasingaccess to healthcare delivery and
• To improve efficiency in the allocation and use ofhealth resources.
Since the project is very recent no impact assess-ment is possible but issues like user-charges, priva-tisation of non-clinical services, supporting privatehospitals in blocks which do not have CHCs, ex-tension of honorary system to district hospitals andCHCs etc. are being considered. Other featuresinclude strengthening a referral system so that sec-ondary hospitals do not have to deal with firstcontact care, supporting hospitals with specialityfacilities to becoming training centres for privateand public doctors to facilitate CME since nowre-registration is compulsorily linked to a definitenumber of hours of CME etc.
While the Health Systems Development Projectmay have a number of positive features; it lacks teethto bring about structural reforms. The strategy isbasically to make piecemeal changes and not struc-tural changes. Serious reforms imply structuralchanges. When we look at budgetary allocations wedo not find an encouraging picture. Despite theWorld Bank supported initiative, budgetary supportto the public health sector is declining. The secon-dary institutions would then have improved infra-structure, their capacities enhanced with externalassistance but with overall declining support topublic health services there is a likelihood that theupgraded institutions will not be able to give up-graded services.
Conclusions
Some trends are very clear, like the rural-urban dis-parities with the former needing more attention thathas been given but this do not imply that urbanhealth services are good; they are also considerablystress under the New Economy. It has been com-pounded by inter-regional disparities with a clearpattern of districts in Vidarbha, Marathwada and
76 Human Development Report Maharashtra 2002

Western Maharashtra at a considerable disadvantagein terms of the existing health resources in theseregions as compared to Mumbai and Western Ma-harashtra. Other trends indicate that improvementin inputs have definitely made a positive impact inoverall results. In case of preventive care, the publichealth services continue to play a lead role and thishas been critical to overall improvements in healthoutcomes.
During the 1980s when the public health infra-structure expanded in rural areas one even saw therural-urban and inter-regional gap in health statusreduce substantially but presently the reduction inpublic health investment and expenditures hasslowed further gains, especially in rural areas. Thereis a clear need for more resources for healthcare inthe public domain to achieve better equity in healthoutcomes, the focus being on both qualitative andquantitative aspects, making it affordable to thepeople. Only such a strategy will strengthen thepublic health sector and be of benefit to the people,especially the poor and deprived sections of thepopulation.
Suggested Policy Options
• Widen the coverage under ICDS, given thatnutritional status of more than half of the popu-lation is impaired. The netting has to be higherthan the 70 per cent that is seen as achieved.
• While strengthening the rural health infrastruc-ture, enhance its capacity to deal with curative
aspects of healthcare without diluting its tradi-tional thrust on immunisation and reproductive-health coverage. The access to the healthcareinfrastructure in the rural areas and its utilisationhas to be enhanced. This may require fundingconsistent with the requirements. Financial allo-cations would have to be continually upgradedsince health is a key element in human develop-ment.
• Sustain the coverage in reproductive-health cov-erage and improve upon it. Maharashtra is yet toreach the replacement growth rate of two percent, has high levels of fertility including amongteenaged mothers.
• Strengthen the monitoring of the private healthsystem, ensuring that physical and clinical stand-ards are established and followed.
• Focus on HIV/AIDS, especially on the reasonswhy they have shown alarming incidence in Mum-bai and the Pune-Satara-Sangli-Kolhapur belt. En-sure that mainline development programmesaddress issues of social security and livelihood, andensure rights-based access to basic services. Im-prove databases and reporting systems, includingfrom the private sector healthcare system.
• Ensure that the private sector healthcare systemwhich runs non-profit hospitals as Trusts, mainlyin the urban centres, adhere to the legal commit-ment of free treatment to the poor.
• Ensure a progressive movement towards publicspending of up to five per cent of the State publicexpenditure on healthcare.
Chapter VI →
← Contents
Health and Nutrition 77


CHAPTER VI
Education
Education is critical for improving the humancondition. It is an enabling process leadingto social progress. Economists stress its role
in human capital accumulation, human rights ac-tivists press for it as a basic right, and politiciansrealise it raises awareness and leads to greater par-ticipation in civic life. As the thrust towards humandevelopment intensifies, education will continue tobe one of the essential mechanisms to bring abouta change in people’s life chances. In other words,education will be the key.
Human development depends on expanding op-portunities and increasing skills. The underlying as-sumption is that each stage of education leads tohigher capacities because an individual learns more atevery step. It also assumes that education implies anincreased ability to make better choices. While tracingeducation’s role in human development, two broadsets of factors over time have to be focussed upon:
• Opportunity and access: have they increased andare they widely distributed in the population?
• Outcomes: are more people participating in it andis the proportion rising? Moreover, are a greaternumber of people getting more education? Are theattainments distributed widely among the popula-tion?
In this context, where is Maharashtra placed?
Historical trends have shaped both the contem-porary status of education and its policy underpin-nings. Four major threads have had a profound andlasting influence on its fabric:
• Historical evolution in the nature of agrarianrelations.
• Role of social movements in bringing educationto the historically disadvantaged group.
• Influence of leading thinkers and social activistson the position of women.
• Participation of voluntary organisations and pri-vate groups in the provision of education.
Challenge to Orthodoxy
During the nineteenth century, a complex combi-nation of economic, social and administrative fac-tors led to a more widespread distribution ofopportunities in the agricultural sector than else-where in the country and social stratification pat-terns were not very sharp. This had its implicationsfor the spread of education in later periods.
In the nineteenth and twentieth centuries, twoimportant social and political processes were visible.Social movements influenced by thinkers and activ-ists such as Mahatma Jyotiba Phule and ShahuMaharaj challenged orthodoxy and laid emphasis onthe uplift of historically disadvantaged groupsthrough education. At the same time, there was atide of political activity in reaction to colonial rule,what is interesting is that these two processes ranparallel to each other. Peasant caste organisationschallenged some of the nationalist leaders who wereperceived only as representing the interests of urbaneducated elite.
Key to Improvements
The guiding philosophy of reform movements inMaharashtra, starting from the Satyashodhak Samajof Mahatma Phule was to enable workers and peas-ants to overcome their social and economic disad-vantages and enjoy their natural and human rights.Education was the key that opened the doors tofurther improvements in their lives and livelihoods.An egalitarian thrust led to multifaceted innovations
Education 79

and interventions in education including starting ofhostels for children of all castes, reservations fordalits, schools for girls. To start with, a princely state,Kolhapur institutionalised many of these changesmotivated by reform thought and strategy; educa-tion not only became free and enrolment uptoprimary levels compulsory but measures were de-signed to encourage peasants to send their childrento school.
In the hundred years preceding Independence,many a social reformer and political leader in Maha-rashtra actively organised educational opportunitiesand teaching at different levels even as serious think-ing and action on the status of women was takingplace. Mahatma Phule started the first school for girls,a pattern that found favour with other social thinkerstoo, provoking a discussion on women’s issues. Theaim was to secure social progress at every level. Thusthe relative gender equality in contemporary
Maharashtra’s education system is a legacy of thehistorical trends. This imprint of historical trends isvisible today. Private initiative and voluntary actionin facilitating education has been a strong charac-teristic of Maharashtra. (Box 6.1)
Access, Participation and Achievement
The levels of State expenditure and resource alloca-tion across different sectors are crucial indicators ofthe thrust of Government policy and the strengthof its political will. In the last two decades, therehas been increasing attention paid to social sectorexpenditure by researchers, international develop-ment agencies and policy makers.
Nationally, the proportion of plan outlays allo-cated to the education sector i.e., 6.79 per cent, wasthe highest in the First Plan (1951–56). It declinedsteadily thereafter and ranged between 4.34 per centand 4.90 per cent respectively between the Secondand Fourth Plans, reached a low of 2.59 per cent inthe Sixth Plan and increased to a level of over 4 percent only in the Eighth Plan. In the case of healthand family welfare, the allocations were around 3per cent of total allocations in most Plans. Variouscommittees and government initiated commis-sions—for example, Education Commission andRamamoorthy Committee, both of 1991—havesuggested that the government should spend at least6 per cent of its GNP on education. India has beenwell below this level.
The share of elementary education in the totaleducation outlay was as high as 56 per cent in theFirst Plan. This share steadily decreased, and in theSeventh Plan this sector was allotted only 34 percent of the education budget. In the Eighth Plan,the allocation increased to 42 per cent. The shareof expenditure going to higher education and tech-nical education in the period between the SecondPlan and the Fifth Plan was in the range of 34 percent to 49 per cent. Although the share of highereducation has dropped considerably, it still remainshigher than 20 per cent. Rising salaries of teachershave absorbed much of the higher levels of expen-diture on elementary education. Thus, the increased
Box 6.1Private Efforts
Private initiative and voluntary action in facili-tating education has been a strong characteristicof Maharashtra.
During the British era, voluntary groups andeducation societies, led by Brahmins fuelled muchof the effort on education while self-propelledcitizens’ movements, like the Rayat ShikshanSanstha spread education to the villages, focussingon those who have been traditionally out of it andbring them to the mainstream.
Importance of institutional mechanisms forproviding primary and secondary education inthe agricultural hinterland on a large scale wasrecognised and acted upon. This Sanstha set upand ran hostels and schools around the State,developed systems for contributions in kind fromvillage communities so that schools could beself-sustaining.
Now, in the realm of higher education, espe -cially technical and medical, a whole lot of enter-prise fuelled by co-operatives of agro-processors,especially sugarcane, have helped spread collegesacross Maharashtra, often in places which wereearlier scarcely imagined as likely locations.
80 Human Development Report Maharashtra 2002

expenditures do not necessarily lead to their im-provements in quantitative coverage or qualitativeupgrading of the education system.
In Maharashtra, resource allocation patterns arenot very different. Social service expenditure as apercentage of State Domestic Product has remainedless than 6 per cent since mid-1980s. The share ofeducation in the SDP was 3.17 per cent in 1988–89.This ratio dropped to 2.75 per cent by 1995–96.
Within the education budget, the proportion ofelementary education was around 45 per cent from1988–89 to 1995–96. Secondary education’s sharewas in the range of 39 per cent to 40 per cent andthe rest went to higher and technical education. Itis clear even from these basic figures that a dispro-portionate share of spending has been on higher andtechnical education in the State, which again is areflection of the broader national trend. It is worthnoting that the share to adult education in Maha-rashtra has been less than one per cent for most ofthe 1980s and 1990s. Nationally, the share of adulteducation in the Plan documents has risen from oneper cent in the Fourth Plan to eight per cent in theEighth Plan.
Compared to other States, the proportion oftotal Plan and non-Plan expenditures going to edu-cation at 17.3 per cent in Maharashtra is lower thanthe national average of 19.5 per cent. Maharashtra’sannual expenditure per primary school student atRs 951.90 is considerably lower than the nationalaverage of Rs 1,396.30 but the situation with sec-ondary school resource allocation is exactly thereverse and amongst the highest in the country.(Table 6.1)
Human Expenditure Ratio (HER) is the percent-age of state income devoted to human priority con-cerns such as elementary education, preventivehealthcare, water supply, sanitation and nutrition.UNDP suggests that 5 per cent is essential if a countryis to do well on the human development front but inMaharashtra, the human expenditure ratio had beenaround 2.2 per cent in 1988–89 and dropped to 1.84per cent by 1995–96. Which means Maharashtra’s
resource allocation patterns neither reveal any majordepartures from national trends nor do they reflectany concerted thrust on education as a major devel-opment priority for the State.
Provision and Access
Since 1960, the growth of educational institutionsat all levels has been impressive. Primary schoolsdoubled in their numbers in forty years even as ofsecondary schools have grown phenomenally byfive-fold. During the same period, the number ofcolleges and other institutions of higher learninghave increased tenfold. The numbers of secondaryand higher secondary schools have be steadily in-creasing each decade. (Table 6.2)
In 1960, there were fourteen primary schoolsfor each secondary school. This has declined to 4.5primary schools for each secondary school. In termsof availability of secondary schools, their numberincreased considerably to absorb students from pri-mary schools. Again, in 1960, there were 427 pri-mary schools for each college. By 1998, there were75 primary schools per college (Table 6.3). In manyIndian States, the education pyramid is typicallyquite steep, with a large number of primary schoolsthat feed few secondary schools and even fewercolleges. In Maharashtra, trends in the relativegrowth patterns of educational institutions at dif-ferent levels indicate a flattening out of the educa-tion pyramid between 1960 and 1998.
010000200003000040000500006000070000
1960 1970 1980 1990 1998
Number of Primary Schools
Number of Secondary Schools
Figure 6.1
Growth of Primary and Secondary Schools:Maharashtra, 1960–1998
Education 81

Table 6.1
Resource Allocations: Maharashtra and Some Major States, 1997–1998
State
Percentage of Total(plan and non-plan)Budgeted Expendi-ture on Education
Expenditureon Education(Rs millions)
Percentage ofEducation Expen-diture on Prim-ary Education
Percentage ofEducation Expen-diture on Second-
ary Education
Per StudentExpenditure:
Primary(Rs)
Per StudentExpenditure:
Secondary(Rs)
1 Andhra Pradesh 16.2 17571.8 42.3 33.3 690.7 5481.92 Karnataka 18.0 16526.8 49.8 30.2 935.2 2533.93 Gujarat 20.9 18149.4 53.4 32.4 1193.6 4483.74 Madhya Pradesh 16.3 16195.0 64.1 18.5 761.8 1465.25 Kerala 25.0 16238.0 48.7 30.6 1724.9 4574.2 6 Maharashtra 17.3 36714.0 44.1 39.3 951.9 4870.6 7 Tamil Nadu 20.4 22179.0 49.5 34.1 1055.2 3405.4
India 19.5 324587.0 48.5 31.9 1396.3 4170.5
Table 6.1A
Actual Expenditure on Education
(Rs in millions)
DescriptionActual Expenditureduring 1996–97
Actual Expenditureduring 1997–98
Actual Expenditureduring 1998–99
Elementary education 18698.0 21482.2 23271.9Secondary education 165552 19578.8 20657.5Adult education 90.3 85.9 84.3Language development 00.5 00.5 00.7General 508.4 828.4 622.3Sports etc 904.0 2099.8 1899.7Removal of regional imbalance 113.5 14.8 28.5Total expenditure 36869.9 43040.4 46564.9 School Education Department
% of expenditure on primary education to total expenditure 50.71 49.88 49.98Expenditure on primary to total expenditure 44.90 43.09 44.36Primary school enrolment 11971690 1216955 12291051
Standard 1–7Secondary school enrolment 4337446 4585542 4748310
Higher Secondary 3035159 3143043 3250367
Table 6.2
Growth of Schools and Colleges in Maharashtra, 1960–1998
Year Number ofPrimary Schools
Number of Secondaryand Higher Secondary
SchoolsNumber of Institutionsof Higher Education
Ratio ofPrimary SchoolPer Sec. School
Primary SchoolPer College
1960 34594 2468 81 14.0 427.11970 44535 5313 264 8.4 168.71980 51045 6119 407 8.3 125.41990 57744 9972 650 5.8 88.81998 64918 14579 866 4.5 75.0
Source: Education Department, Government of Maharashtra.
82 Human Development Report Maharashtra 2002

Although there is some variation across districtsin the ratio of secondary to primary schools, in everydistrict there has been an increase in the number ofsecondary schools over time (Annexure Table 81).
Over the last thirty years (Table 6.3) there hasbeen a steady growth in a number of dimensions.There has been approximately 15 per cent increasein every decade in the number of primary schools.The average number of students in each school hasalso risen from approximately 140 students perprimary school in 1970 to about 190 in 2000. Theaverage number of teachers, however, has remainedbetween four and five teachers per primary schoolwith each teacher handling about 40 students each.The overall picture for Maharashtra suggests thatthe State has managed to remain on a stable pathregarding student-teacher ratios. The average size ofprimary school has also remained manageable.
Secondary schools are on a different pattern.They tend to be larger in size and draw from a biggercatchment area. The average size of secondaryschool, which was about 391 students in 1970 isnow of about 560 students in 2000. Despite theincrease in size, the number of teachers per schoolhas remained remarkably steady between fourteenand sixteen teachers over a span of thirty years. Thedecade of 1980s saw a sudden increase in the num-ber of secondary schools. The increase in the num-ber of secondary schools was well over 100 per centbetween 1980 and 1990. Much of this suddengrowth can be attributed to the change in schoolingstructures across the country. In the mid 1980s, theNew Education Policy brought in the era of 10+2in which up to Standard X the student was in asecondary school and then shifted to a junior collegeor higher secondary school to complete the last twoyears of formal schooling.
Table 6.3
Growth of Schools, Teachers and Students: Ratios over Time
1970 1980 1990 2000Primary School
Total number of schools 44535 51045 57744 65586Total number of school teachers 177946 222070 268322 313656Total school enrolment 6199325 8392356 10421602 12694398
Secondary SchoolTotal number of schools 5313 6119 9978 14767Total number of school teachers 74685 114065 181842 235490Total school enrolment 2077127 3309333 5794120 8274750
Primary School RatiosNumber of teachers per school 4.0 4.4 4.6 4.8Number of students per school 139.2 164.4 180.5 191.3Number of students per teacher 34.8 37.8 38.9 40.1
Secondary School RatiosNumber of teachers per school 14.1 18.6 18.2 16.0Number of students per school 391.0 540.8 581.0 560.4Number of students per teacher 27.8 29.0 31.9 35.0
Primary School IncreasePercentage increase in last 10 years:
Number of primary schools – 14.6 13.1 14.9Number of primary school teachers – 24.8 20.8 17.9Number of children in primary school – 35.4 24.2 21.8
Secondary School IncreasePercentage increase in last 10 years:
Number of secondary schools – 15.2 63.0 48.1Number of secondary school teachers – 52.7 59.4 29.9Number of children in secondary school – 59.3 75.1 42.8
Source: Directorate of Education, Government of Maharashtra, various years.
Education 83

For every 100,000 population there are 13,265students in primary school, 8633 secondary schoolstudents and 1335 students in colleges (AnnexureTable 82). Except in Gadchiroli district, there is novillage in Maharashtra having a population of 200without a primary school within a radius of 1.5 km.
Improving Access
The Government of Maharashtra has specific pro-grammes and schemes to target particularly vulner-able populations. Free passes to travel byState-owned transport system was incorporated as aspecial motivation and facilitating element to en-courage girls to attend schools, if the schools wereaway from their villages. For example, in 1996,schools were created for children of sugarcane work-ers to provide continuity in education despite sea-sonal migration. The new Vasti Shala scheme’sdesign provides schooling opportunities in inacces-sible locations or if there is no primary school withinhalf a kilometre of a habitation. Special facilities,such as free textbooks, free uniforms and writingmaterial are available for primary school students(Standard I to IV) in educationally backward areasof 103 blocks. To encourage scheduled caste andscheduled tribe children to attend school, uniformsand writing material is provided—the expenditureon this account is fixed at Rs 70 per pupil for clothesand Rs 10 per pupil for writing materials. There areother supplementary schemes like the Book Bankscheme for supplying textbooks to poor childrenespecially SC and ST. Attendance allowance is paidto encourage enrolment and attendance of girls inprimary school at the rate of rupee one per day forall girls in areas and for girls whose parents are belowthe poverty line. Tribal students in Standard V to Xare paid a stipend (Rs 40 per month to boys and Rs50 to girls in Standard V to VII and for StandardVIII to X Rs 50 per month for boys and Rs 60 permonth for girls) if they attend school at least 75 percent of the working days.
The bottom line for any school improvement planis whether there are enough funds sanctioned andspent to achieve the goals. For Maharashtra, as in thecase of several other States, additional external sources
of funds from Government of India and from donoragencies or governments was made available througha number of different projects such as DPEP andPEEP. The schemes did become operative in the latterhalf of the 1990s with the commitment of Govern-ment of Maharashtra being approximately Rs 2,000million. The implementation of these schemes, how-ever, varies considerably by programme/ project andacross districts. For example, 60 per cent of thosetargeted in the Book Bank scheme for Standard I toIV receive the books, and only 40 per cent of thetargeted in Standard V to VII group actually benefit(Annexure Table 83). Even in effectiveness, there isvariation across districts: for the Standard I to IV BookBank Scheme, 100 per cent of targeted children inOsmanabad, Bhandara and Amaravati receive books,but only 23 per cent of the eligible children in Buld-hana and 31 per cent in Akola get them. The schemeof providing stipend to tribal students reaches almost80 per cent of all targeted children.
Teacher Training
Based on national policy guidelines (National Policyon Education 1986), a new curriculum was ap-proved in 1995. New textbooks were prepared bythe year 1997. From 1997–98, the implementationof the new curriculum started in Standard I and II.It was extended to Standard III and IV in 1998–99and for Standard V in 1999–2000. In the currentyear, focus has been on the introduction of Englishin primary classes.
An intensive teacher training was put in placeto support the new curriculum. Termed as SMARTPT (State-wide Massive and Rigorous Training forPrimary Teachers) it has covered almost all primaryschool teachers in Maharashtra. In 1997–98,1,68,290 teachers of Standard I and II were trained.During 1998–99, 1,70,353 teachers of Standard IIIand IV were trained and in 1999–2000, 98,104teachers of Standard V were trained. The large-scaleteacher training effort undertaken by the State Gov-ernment in the late 1990s has been remarkable, theother significant element in this being the appoint-ments of Central Primary School Co-ordinators anddecentralised monitoring and academic guidance.
84 Human Development Report Maharashtra 2002

Box 6.2State Education Policy and Programmes
Keeping within the framework outlined by Na-tional Education Policy of the Government ofIndia formulated in 1986, Maharashtra set up atask force to develop its programme of action, in abid to meet its own needs based on the prevailingstatus of education. This was the first exercise by aState government to prepare a policy paper oneducation, subsequent to the National EducationPolicy of 1986. The task force consisted of govern-ment officers, education experts and repre-sentatives of the main educational institutions inthe State. In 1994, the Programme of Action,outlining the framework and approach as well asprogrammatic details of how to make primaryeducation universal was announced.
Literacy programmes were also detailed. Writ -ten in simple language that could be understoodby a cross-section of people, this document waswidely circulated. It communicated a strong, con-viction that primary education is a critical invest-ment that will lead to sustained development overtime and without which participation in the emerg-ing global economy and benefiting from technol-ogy will not be possible.
The goals set out in the action plan are:Every child beyond the age of six to be in school.
• Every child to attend school regularly at least tillthe age of fourteen.
• Every child to master the content laid down foreach standard.
The document spells out a detailed plan of action ofhow the objectives are to be met.• Access to schools especially in unserved habita-
tions or where schools are at a distance; expan-sion of existing school facilities, balwadi oranganwadis close to the primary school wereplanned. Non-formal centres were designed tocater to children who had dropped out or forsome reason could not go to school.
• Predominantly tribal blocks and districts in Ma-rathwada region of Maharashtra would receivespecial focus as compared to the State average,these areas have a higher number of single teacher
schools and lower than average number of upperprimary schools. The performance of these areason key outcome measures such as completionrates is also relatively low. Ashram shalas run bythe tribal welfare department do not receive ade-quate educational guidance and therefore the levelof education remains less than satisfactory. A va-riety of schemes targeted at overcoming the prob-lems faced by disadvantaged children andeducationally backward areas were conceptual-ised: book bank, scholarships, uniforms and writ-ing materials, midday meals, support for travelcosts. These programmes were designed to en-courage and raise participation in education.
• A particularly noteworthy feature of the actionplan document has been a stress on education inthe mother tongue. Even though Maharashtra isa predominantly Marathi speaking State, the StateGovernment believes that children should betaught in their mother tongue. In fact Mumbai’sprimary schools are conducted in eight differentlanguages, textbooks are developed in several lan-guages other than Marathi and made availabledespite the relatively higher research and devel-opment costs. Grants are provided to institutionsrunning secondary schools in other languages.
• To improve the teaching-learning environment,a comprehensive set of measures was planned.This included in-service training and textbooksbased on competency standards laid down foreach standard, and more child-centred methodsof teaching. In the years since 1995, Ma-harashtra conducted widespread training for allits primary school teachers.
• The action plan documents weaknesses in thecurrent systems of monitoring the educationsystem. Monitoring systems are not effectivebecause officers have to spend much of theirtime in administration and do not have enoughtime to focus on quality improvements in edu-cation. Data that is generated is old and notuseful for local planning. A self-evaluation grad-ing tool for schools is available but not in usewidely. Better organisation and more effectivedelivery was planned in the succeeding years toimprove overall monitoring and reporting.
Source: Government of Maharashtra.
Education 85

Child Participation
At the primary level, are most children of school-going age going to school in Maharashtra? Howwidespread is child labour? There are no straight-forward answers to these questions. Differentsources of data show different trends.
Data from school sources show a very highenrolment rates but estimates from household sur-veys as part of the National Sample Survey (NSS)shows much lower participation in the educationsystem and this gap, however, is as true for Maha-rashtra as it is for all of India. Since 1981, the censushas grouped children by age and categorised themain use of their time on a regular basis. Fourmutually exclusive categories are used: attendingschool and not working, attending and working,not attending school and working and, not attend-ing school and not working.
A quick analysis of the 1981 census figures forMaharashtra as a whole shows that 63 per cent of
children in the age group 6 to 10 attend school anddo not work. About three per cent work and do notattend school, and the remaining 34 per cent neitherattend school regularly nor work (Annexure Table83). For the older age group of children between theages of 11 and 14, some 60 per cent are in schooland not working, 19 per cent are not in school andnot working and almost 17 per cent are child labour-ers who do not go to school. By 1991, a markedchange is visible: the proportion of children going toschool and not working among the 11 to 14 year-oldshas risen to 77 per cent. The percentage of childrenwho are not in school and working has declined to10 per cent. Also the children who are not regularlyengaged in any activity whether it is work or schoolhas also fallen from 18 per cent in 1981 to 13 percent in 1991. The compilation from the 2001 censusdata is not available as yet.
The second round of the National FamilyHealth Survey 1998–99 also asked all members ofthe respondents’ household who are between theages of 6 and 17 whether they are currently attend-
Box 6.3Night Schools for Day Workers
Night schools are numerous in metropolitan Mum-bai, most of them located in the Mumbai district,catering mostly to the poor who had to drop outto earn a livelihood or migrants who are schooldropouts working in the informal sector. Moststudents join these schools, driven by their passionfor bettering their own lot but the reality is that itis tougher to go to work during the day and studyat night. Some of the functioning night schools are at leasta 100 years old and are recognised by the EducationDepartment, though lower attendance, slow learn-ing and poor results are a feature of this system. It isnot uncommon for the schools to get notices fromauthorities to explain poor performance. The differ-ence in these schools and the ordinary day schools isnot in the syllabus to be covered—it is the same,actually—but the time available. They need to man-age in half the time what other schools can in theordinary course of 5–6 hours per working day. In Mumbai, to ensure that the percentage ofpasses at the school leaving stage is better, pre-
examination crash courses have enabled improve-ment in the results. But the night schools continueto be bogged down by the problem of pupils havingto contend with break in their earlier studies, bur-den of work during the day and the lower attentionby the time they come to attend the classes at theend of a hard working day. Night schools are scattered across Maharashtra,but their concentration is the highest in Mumbai,especially the island city. The first night schoolemerged in Mumbai around the time Jyotiba Phuletook up adult education as a means of empower-ment of the disadvantaged. The first one, nowknown as The Bradely Night School, in Mazgaon’sworking class areas started by a missionary womancame up around 1885. The second night schoolwas started in the working class area of Parel in1922 but from 1951, in a short span of some fiveyears, some 100 such schools were set up. Now,some 150 are known to be working. Most of the students finance their own educa -tion, paying fees out of their earnings during the day.
86 Human Development Report Maharashtra 2002

ing school. Although there are some rural-urbanvariations, the compiled data shows that over 84 percent of boys and 79 per cent of girls in this agegroup in Maharashtra are going to school. Althoughthe same indicators show a much higher level forKerala, the Maharashtra numbers are considerablyhigher than the national average, which is 78 percent for boys and 66 per cent for girls.
Enrolment rates calculated from school datashows a much more positive picture: enrolment ratefor boys and girls appears to be close to 100 percent in the late 1990s.
Enrolment in all levels of education has in-creased for boys as well as for girls. Since 1960, thegrowth rate in enrolment in secondary level ofeducation has been higher than in the primary stageswith the biggest increase coming in the decade ofthe 1970s (Table 6.4). Secondary school enrolmentrates, have remained high through the period indi-cating continuous and rising participation of thepopulation in post-primary levels of education. Inindustrialising economies, higher levels of urbanisa-tion and industrialisation are correlated with in-creasing enrolment in post-primary education. Thistrend is visible in Maharashtra too.
Boys and girls have been studying together inprimary and secondary schools both in urban andrural areas for a long time and in recent years,especially among the more elite urban schools, atendency for non-coeducational schools is also vis-ible. A variety of different indicators of femaleparticipation in education show that girls positionrelative to that of boys is better in this State than inmany other Indian States. In 1960, close to 36 percent of students in primary schools were girls. By1998, this proportion has risen to 48 per cent.
Only a quarter of secondary school students andstudents in institutions of higher education in 1960were female. In both these levels of the educationsystem, the proportion of women has risen well over40 per cent by the end of the 1990s. The proportionof girls who attend primary school has increasedfrom 22 per cent in 1960 to 41.6 per cent in 1998,and it is often thought that presence of womenteachers induces a higher turnout of girl students inschools. Whether it is a cause or an effect, it is afact that there are a large number of women teachingin Maharashtra’s schools.
A closer look at the ratio of girls in each standardshows that all through primary and upper primary
0 20 40 60 80 100
In School and notworking
In School andworking
Not in School andnot working
Not in Schooland working
1991 1981
Figure 6.2
Main Activity of Children (Age 11–14): Percentages of Total Child PopulationPercentages of Total Child Population CensusData
Source: Census figures.
Table 6.4
Participation of Girls in Different Levels ofEducation
Year% of
PrimaryStudents
% ofSecondaryStudents
% ofHigher
SecondaryStudents
% ofHigher
EducationStudents
Womenas % ofPrimarySchool
Teachers1960 35.8 26.8 – 24.0 22.11965 37.8 28.7 – 25.4 24.81970 39.3 30.6 – 25.5 26.41975 41.3 34.1 33.3 27.4 29.11980 43.0 36.0 31.0 31.7 31.5 1985 44.7 37.3 33.9 32.3 35.91990 46.0 40.6 36.6 34.7 38.41994 47.2 43.1 38.7 38.6 40.11995 47.5 43.7 39.4 38.8 41.11996 47.6 44.2 40.4 40.6 41.11997 47.9 44.6 41.1 42.1 41.91998 48.0 45.3 42.0 42.8 41.6Source: Directorate of Education, Government of Maharashtra,
various years.
Education 87

levels, the proportion of girls remains high at approxi-mately 48 per cent of the total student population inStandard I to VII (Annexure Tables 86 and 87). Girlsparticipation in higher secondary and junior collegeat around 40 per cent is lower than in primary school.In rural areas, distance of secondary schools andjunior colleges may be an important factor that keepsgirls participation down in the higher levels.
High Enrolment, High Dropouts
The dropout rates for the State show a strong increas-ing trend for each succeeding level of the schoolsystem. Data for the school year 1998–99 indicatethat by the time children reach Standard IV only 85per cent of the boys and 86 per cent of girls out ofthe cohort size of 100 who started in Standard I fouryears ago remain in school. These fractions dip fur-ther in Standard VII 69 per cent of boys and 66 percent of girls survive and by Standard X only 47 percent of the original group of boys and 40 per cent ofthe same for girls remain. (Annexure Table 87)
While the dropout rates for boys and girls arequite similar at Standard IV, as they get older thisratio begins to diverge. By Standard X, a substantiallylower percentage of girls remain in the educationsystem as compared to boys. The standard-wise drop-out rates also show a steady increase through theschool years. (Table 6.5).
Figure 6.3 shows the aggregate picture for Ma-harashtra as well as the trends in two districts: Pune,which is above average and Jalna, which is wellbelow average. In both cases, it is clear that thetrends for boys and girls are quite similar. Thegender difference is smaller at the lower grade levelsand increases as children get older and is most acutein the backward districts.
From the aggregate State-level or district-wisedata, it is not possible to say who stays in school andwho drops out and why. Even if disaggregated datawere available, it is difficult to disentangle the pushand the pull factors. On the push side, there areconcerns about quality of schools. A poorly perform-ing student is more likely to drop out of school ascompared to a high achieving student. The NHFS-2recorded over 40 per cent of boys in the age groupof 6–17 saying they were not attending school as theywere ‘not interested in studies’ and only 13.8 per centwere quoted as saying that it ‘costs too much’. Wheya large proportion of children lag behind academi-cally, the causes are often connected with the teach-ing-learning situation in the schools more than thecharacteristics of individuals.
Another important ‘push’ factor especially be-yond the elementary school level has to do withprivate secondary schooling. In Maharashtra, themajority of students attend primary schools run bythe zilla parishad or the municipality (AnnexureTable 84). However, more than 90 per cent of
0
20
40
60
80
100
Percentage of children
Boys Girls All
Retention up to Standard IV Retention up to Standard VII
Retention up to Standard X
Figure 6.3
Droup-out Rates at Different Stages, 1998–99
Source: Directorate of Education, Maharashtra State, Pune.
Table 6.5
Dropout Rates by Standard in Maharashtra,1989–99
Standard Boys Girls AllStandard 2 8 7 7Standard 3 7 6 7Standard 4 15 14 15Standard 5 18 20 19Standard 6 26 28 27Standard 7 31 34 32Standard 8 37 43 40Standard 9 40 49 44Standard 10 53 60 56
Source: Directorate of Education, Government of Maharashtra.
88 Human Development Report Maharashtra 2002

secondary schools in Maharashtra are privately run.There is a great deal of variation in private schools.
Educational Attainment
There are a variety of indicators of educationaloutcomes starting from the basic measure, ‘literacy’to different levels of educational attainment. In anydiscussion of educational outcomes, it is importantto discuss what learning is supposed to take placefor any given level of schooling and assess whatproportion of students in their educational careerachieve mastery of the level of learning/skills pre-scribed for that stage. Such information lays out thelearning or achievement patterns in an educationsystem but is not easily available in India. Passpercentages in annual board exams are the only kindof figures available for discussion. Despite its short-comings, this measure at least indicates how manystudents in any given year are meeting the standardsfor Standard X and Standard XII laid down by thegovernment. In the absence of good quality andreliable achievement norms it is hard to judge the‘quality’ of the educational outcomes produced bythe educational system in the State.
Literacy Rates
The overall trends in literacy in the State reflect largeincreases in every decade (Table 6.7). Both male andfemale literacy levels have increased substantially in40 years since Maharashtra was formed. Resourceallocations to adult literacy or adult education pro-grammes have remained minimal in the State despiteliteracy campaigns in various districts. Therefore, therising levels of literacy can be attributed to other
factors such as the expansion of school enrolment,widespread provision of basic education as well as togeneral improvements in the economic condition ofthe masses. However, historically disadvantagedgroups such as scheduled castes and tribes lag behind.Districts with large tribal populations also indicate alower literacy level as in several districts of Vidarbhaand Marathwada.
Table 6.7
Trends in Male and Female Literacy Levels,Maharashtra 1951–2001 (per cent)
Year Persons Males Females1951 27.91 40.49 15.561961 35.08 49.26 19.801971 45.77 59.40 31.001981 57.24 70.06 43.501991 64.87 76.56 52.322001 77.27 86.27 67.51
Note: Literacy rates for 1951, 1961 and 1971 relate to popu-lation aged five years and above. The rates for the years1981 to 2001 relate to the population aged seven yearsand above.
Source: Census figures.
Literacy level is a commmonly used indicator insocial science research and analysis. In the Indiancontext, it is important to raise questions about howit is measured and therefore what this measure standsfor. Although literacy rates have gone up considerablyover time, the methods and tools for measurementof literacy have remained relatively crude. Accordingto categorisation in the Census, a literate is one whocan write his or her own name. This ability does notautomatically translate into even being able to reador write simple sentences for a vast majority of
Table 6.6
Primary and Secondary Schools by Management Type, Maharashtra 1998–99
Sr. No. Type of Management
Number ofPrimary Schools
Percentage ofPrimary Schools
Number ofSecondary Schools
Percentage ofSecondary Schools
1 Central Government 33 0 65 0 2 State Government 442 1 293 2 3 Zilla Parishad 53169 82 612 4 4 Municipal 4396 7 205 1 5 Private aided 3743 6 9644 69 6 Private unaided 3135 5 3191 23
Total 64918 100 14010 100
Source: Education at a Glance, Directorate of Education, Maharashtra State 1998–99.
Education 89

uneducated people. Although it is obvious that liter-acy is a convenient and easily available indicator formost countries and states, the actual content of theparameter and the method of measurement shouldbe kept in mind when interpreting trends.
Between 1961–2001, during the forty year spansince Maharashtra was formed, the literacy rate morethan doubled from 35.08 per cent to 77.27 per cent,the increase being particularly rapid in the decade1991 to 2001 when the literacy rate increased by 12percentage points. It must be noted however, that theliteracy rates for 1961 relate to population aged fiveyears and above. The rates for 2001 relate to thepopulation aged seven years and above. In 1991, theliteracy rate among the Scheduled Castes (SC) was56.5 per cent (70.5 per cent for males and 41.6 percent for females). The literacy rate in 1991 amongthe Scheduled Tribes (ST) was 36.8 per cent (49.1per cent for males and 24 per cent for females).
In terms of district-level data from the 2001Census, the highest literacy rates of about 87 per centprevailed in Mumbai and Mumbai Suburban. Severalother districts also had above 80 per cent literacy rates(Table 6.8). These include Nagpur, Amaravati, Akolaand Wardha in Vidarbha region, Thane and Sind-hudurg in Konkan and Pune in Western Maha-rashtra. The lowest literacy rate of 56 per cent was inNandurbar, also in Western Maharashtra. On thelower side of attainment were several districts ofMarathwada including Jalna, Parbhani, Hingoli,Beed and Nanded; and Gadchiroli in Vidarbha.
As per the 1991 census outside Mumbai region,the highest literacy rate (7+) of 75.81 per cent (Table6.8) was recorded in Sindhudurg district of Konkanwhile the lowest rate of 42.89 per cent was recordedby Gadchiroli district in Vidarbha. In 2001,Gadchiroli continued to remain at the lower end ofthe scale of attainment in literacy while Sindhudurgseemed to have been taken over by several otherdistricts. In 1991, while all districts of Konkan andmost districts of Western Maharashtra and Vidarbhahad achieved above 60 per cent literacy, not a singledistrict belonging to the Marathwada region hadachieved 60 per cent literacy.
By 2001, all Marathwada districts crossed 65per cent literacy levels with Aurangabad, Osman-abad and Latur touching 74 per cent, 70 per centand 72 per cent respectively but when attainmentsare measured by literacy rates, Marathwada lagsbehind rest of Maharashtra.
Disparate levels of literacy are a historical legacyof the State. Literacy rates were higher in the Bom-bay region than in Hyderabad and Madhya Pradeshregions even during colonial times. The percentageof literates to total population in the erstwhileBombay region was 6.98 per cent in 1911, whereasin Central Provinces and Berar region, parts ofwhich were included in Maharashtra subsequently,the literate constituted only 3.57 per cent of totalpopulation. The situation with respect to femaleliteracy was even more deplorable with Bombay andCentral Provinces recording literacy rates of 1.45and 0.32 per cent respectively.
Inter-regional disparities in literacy rates seemsto be declining as evident from the decline in thevalue of the coefficient of variation from 32.61 percent in 1961 to 9.21 per cent in 2001.
The 55th Round of NSSO (1999–2000) indi-cate that the percentage of not-literate in the 6–14age group in rural areas was 5.39 for self-employedin non-agriculture, 5.17 for agricultural labour, 9.32for other labour and lower at 4.41 for self-employedin agriculture. In urban areas the percentage of not-literate was lower at 3.94 for self-employed and 3.03for regular wage/salaried persons. However, the per-centage of not-literate is higher for casual labour inurban areas at 4.80. Across social groups, not-literateare higher in the age group 6–14 in rural areas thanin urban areas. 7.33 per cent of Scheduled Castesand 7.38 per cent of Scheduled Tribes in the 6–14age group in rural areas are not-literate while thecorresponding figures for urban areas were 3.41 and4.96 per cent.
Literacy campaigns spread across Maharashtraand given their intensity stimulated a high degreeof voluntarism among the adult literates within thelocal communities, especially in the countryside.
90 Human Development Report Maharashtra 2002

Interestingly, school students, a sizeable proportionof whom were girls, formed more than a third ofthe number of instructors deployed. The rest camefrom among the cultivators, agricultural labour,housewives and even the self-employed and thosewho had only casual employment. They have suc-ceeded in creating a human resource base of personsinterested in the effective delivery of education at
the micro-level, the continual interfacing betweenthe instructors and the members of village educationand village literacy committees helping consolidatethe process of community participation.
Seen from a wider perspective, this communitybonding will help in the long-term in giving promi-nence to education at the decentralised level and
Table 6.8
District-wise Literacy and Rates: 2001
No. Districts
Literacy Rate (Age 7+)2001 (per cent)
Mean Years of Schooling(Std. 1–7) 1999–2000 Dropout Rate (per 100) 1998–99
% Rank Years Rank 7 Standard Rank 10 Standard Rank1 2 3 4 5 6 7 8 9 10 1 Mumbai 86.82 2 5.852 6 19 4 53 13 2 Mumbai (Subn) 87.14 1 5.852 7 19 5 53 14 3 Thane 81.00 6 5.460 13 34 16 62 24 4 Raigad 77.32 13 5.313 17 43 27 66 31 5 Ratnagiri 75.35 19 4.921 20 19 6 57 19 6 Sindhudurg 80.52 8 6.356 1 15 2 34 1 7 Nashik 75.10 20 4.151 28 23 8 64 27 8 Dhule 72.08 26 3.836 30 45 28 56 16 9 Nandurbar 56.06 35 3.836 31 45 29 56 1710 Jalgaon 76.06 17 5.131 19 29 10 50 1111 Ahmednagar 75.82 18 4.550 22 41 26 60 2212 Pune 80.78 7 5.740 9 30 13 50 1213 Satara 78.52 12 5.425 14 18 3 42 414 Sangli 76.70 15 5.600 10 31 14 60 2315 Solapur 71.50 27 4.228 26 38 24 65 3016 Kolhapur 77.23 14 5.768 8 11 1 41 317 Aurangabad 73.63 23 4.207 27 37 22 57 2018 Jalna 64.52 33 2.870 35 51 34 73 3519 Parbhani 67.04 31 3.017 33 47 31 72 3320 Hingoli 66.86 32 3.017 34 47 32 72 3421 Beed 68.48 30 4.116 29 45 30 62 2522 Nanded 68.52 29 3.507 32 53 35 69 3223 Osmanabad 70.24 28 4.249 25 40 25 62 2624 Latur 72.34 25 5.306 18 35 20 59 2125 Buldhana 76.14 16 4.305 24 37 23 64 2826 Akola 81.77 5 5.355 15 34 17 49 927 Washim 74.03 22 5.355 16 34 18 49 1028 Amaravati 82.96 4 5.586 11 35 21 56 1829 Yavatmal 74.06 21 4.263 23 47 33 64 2930 Wardha 80.50 9 6.258 3 31 15 46 631 Nagpur 84.18 3 6.286 2 19 7 36 232 Bhandara 78.68 10 6.104 4 29 11 47 733 Gondiya 78.65 11 6.104 5 29 12 47 834 Chandrapur 73.07 24 5.551 12 27 9 45 535 Gadchiroli 60.29 34 4.872 21 34 19 54 15
Maharashtra 77.27 – 4.970 – 31 – 53 –
Sources: Column 3: Biswas (2001), Columns 7 and 9: Data provided by the Directorate of Economics and Statistics, Pune.
Education 91

further the objectives of various development arms ofthe Government of Maharashtra. The committees,being decentralised and voluntary, have the potentialfor being instruments for social accountability of theprimary education system. This is the crucial appealof the programme, intended or otherwise. The com-ing together of learners in literacy classes provided
them with a welcome break from monotony of theirlives and for women particularly, gave a platform forsocial interaction. This peer-bonding has helped,studies show, in promoting higher levels of motiva-tion among women who seek upward social mobilitywithin the community, an enhanced sense of self-worth and nurture the formal education of their
Table 6.9
District-wise Gender Dimensions in Educational Attainment: 2001
No. Districts
Literacy Rate (Age 7+), 2001(per cent)
Dropout Rate (per 100), 1998–997th Standard 10th Standard
Males Females Boys Girls Boys Girls1 2 3 4 5 6 7 8 1 Mumbai 89.95 82.71 15 23 51 55 2 Mumbai (Suburban) 92.65 80.39 15 23 51 55 3 Thane 86.06 75.00 44 33 62 61 4 Raigad 86.40 68.06 41 55 63 69 5 Ratnagiri 86.28 65.98 19 19 49 65 6 Sindhudurg 90.21 71.67 15 15 32 37 7 Nashik 85.19 64.16 20 25 59 69 8 Dhule 81.90 61.76 44 46 52 62 9 Nandurbar 66.32 45.55 44 46 52 6210 Jalgaon 86.53 64.95 28 32 48 5111 Ahmednagar 86.21 64.88 36 43 54 6412 Pune 88.55 72.32 33 28 48 5213 Satara 88.45 68.71 15 21 34 5014 Sangli 86.25 66.88 29 34 56 6515 Solapur 82.28 60.07 34 39 60 7116 Kolhapur 87.67 66.38 10 12 33 4917 Aurangabad 85.07 61.28 35 39 52 6218 Jalna 79.17 49.25 47 55 65 8019 Parbhani 80.58 52.98 43 51 66 7920 Hingoli 81.11 51.96 43 51 66 7921 Beed 80.69 55.38 41 50 56 7022 Nanded 81.14 55.12 51 54 64 7823 Osmanabad 82.03 57.55 37 43 54 6924 Latur 83.63 60.28 31 39 54 6525 Buldhana 87.17 64.55 34 41 57 7126 Akola 89.22 73.82 34 34 44 5427 Washim 86.01 61.32 34 34 44 5428 Amaravati 89.28 76.21 40 30 56 5529 Yavatmal 84.47 63.01 46 47 62 6430 Wardha 87.70 72.80 33 29 46 4631 Nagpur 90.25 77.65 21 20 37 3432 Bhandara 89.11 68.11 29 28 45 4833 Gondiya 89.54 67.89 29 28 45 4834 Chandrapur 83.19 62.56 28 27 45 4535 Gadchiroli 69.72 50.64 37 29 51 57
Maharashtra 86.27 67.51 34 32 60 56
Source: Columns 3 and 4: Biswas (2001), Columns 5, 6, 7 and 8: Directorate of Economics and Statistics, Pune.
92 Human Development Report Maharashtra 2002

children. The jump 15.2 points in literary rates forwomen compared to 9.7 for males across Maha-rashtra—the highest ever achieved in a decade—istestimony to this.
Gender Dimensions
Female literacy has reached the all time high of 68per cent in 2001 (Table 6.9). However, femaleliteracy rate was lower than that of males in alldistricts of the State. Almost all the districts of theState have achieved 60 per cent female literacy levelsin 2001. Exceptions to this are the districts ofNandurbar (46 per cent), Jalna (49 per cent),Parbhani (53 per cent), Hingoli (52 per cent), Beed(55 per cent), Nanded (55 per cent), Osmanabad(58 per cent) and Gadchiroli (51 per cent). It maybe observed that most of these districts belong toMarathwada region.
The dropout rate for girls and boys at theStandard VII level and Standard X underscore someimportant aspects. For girls, it was often lower thanfor boys at Standard VII in several districts while itwas higher or equal to that of boys at Standard Xin all districts, except Nagpur, Thane and Amara-vati. The drop out rate for girls was considerablylower than that for boys in Standard VII for thedistricts of Thane, Pune, Amaravati, Wardha andGadchiroli. It may be observed that except for thedistrict of Gadchiroli, the remaining districts havehigh literacy rates. The omission of Mumbai in thiscategory needs to be noted.
Literacy Rates for Social Groups
Literacy rates for Scheduled Castes are in line withoverall trends. Districts in Konkan region recordedhigher literacy rates for Scheduled Castes, followedby the districts in Vidarbha and Western Maha-rashtra. Nashik and Dhule in Western Maharashtraand Amaravati, Yavatmal, Wardha, Nagpur, Bhan-dara, Chandrapur and Gadchiroli in Vidarbha have alarger proportion of between 30 and 50 per cent SCand ST in the total population. These districts, withthe exception of Gadchiroli, registered literacy ratesof 45 to 60 per cent for SC indicating the use ofopportunities provided by the Government. Marath-
wada has the lowest literacy rates for this social group.Literacy rates for Scheduled Tribes are lower thanthose for Scheduled Castes in most districts. Literacyrates amongst Scheduled Tribes range between 34 to52 per cent for the districts of Amaravati, Yavatmal,Wardha, Nagpur, Bhandara and Chandrapur (thedistricts with larger proportion of SC and ST popu-lation). However, Scheduled Tribes in Nashik, Dhuleand Gadchiroli (also with large proportion of SC andST have lower literacy rates. (Table 6.10).
Table 6.10
District-wise Literacy Rates for Rural andUrban 2001 (per cent)
No. District Rural Urban 1 2 3 4 1 Mumbai – 86.82 2 Mumbai (Subn) – 87.14 3 Thane 64.77 86.88 4 Raigad 74.13 87.14 5 Ratnagiri 73.45 89.92 6 Sindhudurg 79.54 89.66 7 Nashik 69.35 83.98 8 Dhule 67.36 85.25 9 Nandurbar 51.40 80.2710 Jalgaon 72.77 84.1011 Ahmednagar 73.53 85.0012 Pune 72.60 86.5613 Satara 77.16 86.5914 Sangli 74.22 84.2215 So1apur 68.47 77.8716 Kolhapur 73.41 86.1317 Aurangabad 67.92 83.3018 Jalna 61.85 75.8219 Parbhani 62.26 76.7920 Hingoli 64.85 77.6021 Beed 65.75 80.8422 Nanded 65.28 78.6123 0smanabad 68.20 80.9524 Latur 69.54 81.3325 Buldhana 74.00 84.0026 Akola 79.24 85.7527 Washim 72.16 82.7628 Amaravati 79.58 89.2329 Yavatmal 71.09 86.6530 Wardha 77.53 88.6431 Nagpur 75.76 88.7532 Bhandara 76.75 88.9933 Gondiya 77.18 89.1734 Chandrapur 67.90 83.7035 Gadchiroli 58.54 83.16
Maharashtra 70.84 85.76
Source: Biswas (2001).
Education 93
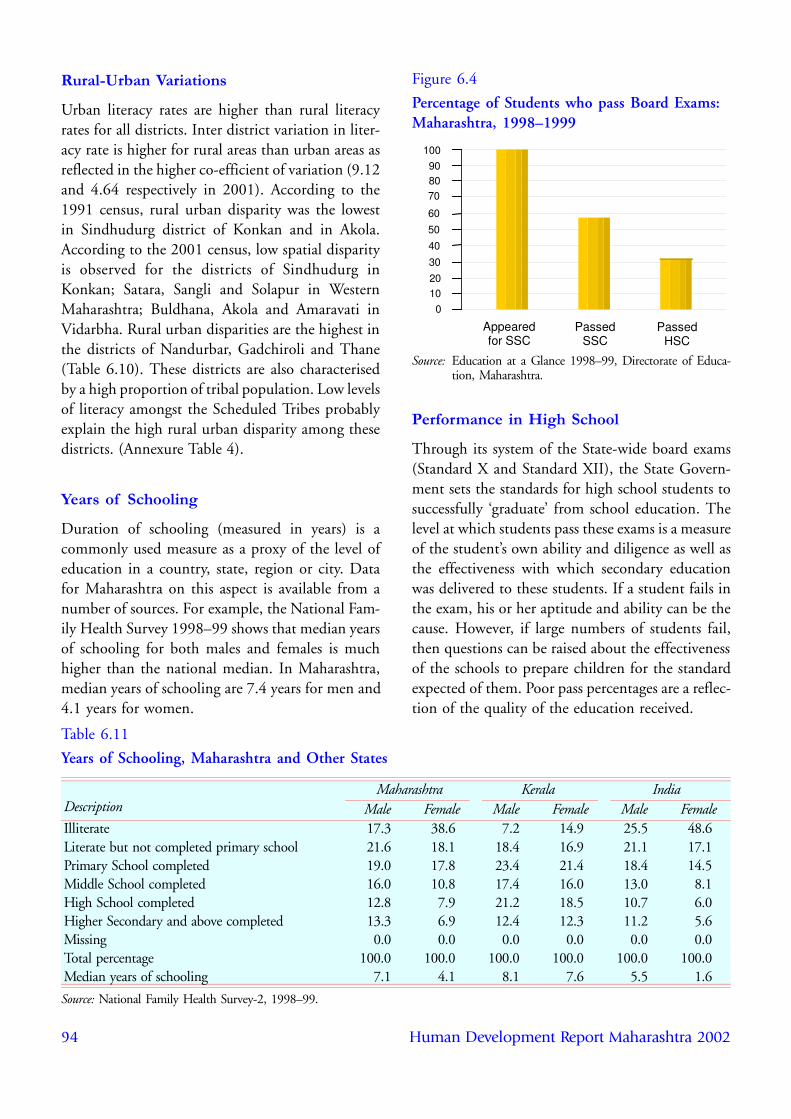
Rural-Urban Variations
Urban literacy rates are higher than rural literacyrates for all districts. Inter district variation in liter-acy rate is higher for rural areas than urban areas asreflected in the higher co-efficient of variation (9.12and 4.64 respectively in 2001). According to the1991 census, rural urban disparity was the lowestin Sindhudurg district of Konkan and in Akola.According to the 2001 census, low spatial disparityis observed for the districts of Sindhudurg inKonkan; Satara, Sangli and Solapur in WesternMaharashtra; Buldhana, Akola and Amaravati inVidarbha. Rural urban disparities are the highest inthe districts of Nandurbar, Gadchiroli and Thane(Table 6.10). These districts are also characterisedby a high proportion of tribal population. Low levelsof literacy amongst the Scheduled Tribes probablyexplain the high rural urban disparity among thesedistricts. (Annexure Table 4).
Years of Schooling
Duration of schooling (measured in years) is acommonly used measure as a proxy of the level ofeducation in a country, state, region or city. Datafor Maharashtra on this aspect is available from anumber of sources. For example, the National Fam-ily Health Survey 1998–99 shows that median yearsof schooling for both males and females is muchhigher than the national median. In Maharashtra,median years of schooling are 7.4 years for men and4.1 years for women.
Performance in High School
Through its system of the State-wide board exams(Standard X and Standard XII), the State Govern-ment sets the standards for high school students tosuccessfully ‘graduate’ from school education. Thelevel at which students pass these exams is a measureof the student’s own ability and diligence as well asthe effectiveness with which secondary educationwas delivered to these students. If a student fails inthe exam, his or her aptitude and ability can be thecause. However, if large numbers of students fail,then questions can be raised about the effectivenessof the schools to prepare children for the standardexpected of them. Poor pass percentages are a reflec-tion of the quality of the education received.
Table 6.11
Years of Schooling, Maharashtra and Other States
DescriptionMaharashtra Kerala India
Male Female Male Female Male FemaleIlliterate 17.3 38.6 7.2 14.9 25.5 48.6Literate but not completed primary school 21.6 18.1 18.4 16.9 21.1 17.1Primary School completed 19.0 17.8 23.4 21.4 18.4 14.5Middle School completed 16.0 10.8 17.4 16.0 13.0 8.1High School completed 12.8 7.9 21.2 18.5 10.7 6.0Higher Secondary and above completed 13.3 6.9 12.4 12.3 11.2 5.6Missing 0.0 0.0 0.0 0.0 0.0 0.0Total percentage 100.0 100.0 100.0 100.0 100.0 100.0Median years of schooling 7.1 4.1 8.1 7.6 5.5 1.6
Source: National Family Health Survey-2, 1998–99.
Appearedfor SSC
PassedSSC
PassedHSC
0
1020
30
40
50
60
708090
100
Figure 6.4
Percentage of Students who pass Board Exams:Maharashtra, 1998–1999
Source: Education at a Glance 1998–99, Directorate of Educa-tion, Maharashtra.
94 Human Development Report Maharashtra 2002

Table 6.12
Percentage of Students Passing Board Exams inMaharashtra
Percentage of Students 1998Appeared for SSC 100Passed SSC 57Passed HSC 32
Source: Education at a Glance 1998–99. Directorate of Educa-tion, Maharashtra.
Data from 1998–1999 show the pass percentagesfor the secondary school examinations as well as forthe higher secondary examination (Table 6.12).Overall, for the State as a whole, the board exam passpercentages are not impressive; 60 per cent passpercentage for a cohort of students means that thereis wastage for 40 per cent of the student group (Figure6.4). Dropout at this stage has a strong correlationwith the quality of the education system. For every100 students who take the SSC exam, 57 pass. If thesame set of students goes on to take the HSC examstwo years later, only 32 of the original 100 studentssurvives successfully. Without disaggregated data, itis hard to pinpoint who passes and who fails, buteven with the aggregate district level data it is obviousthat lack of adequate preparation is the major ‘push’factor at this stage.
There are, however, considerable variations inpass percentages or ‘survival rates’ by district (An-nexure Table 78). It has seldom, if at all, been higherthan the 70 per cent mark. The districts of Marath-wada and Vidarbha perform poorly as compared tothe State average. The secondary and higher secon-dary exam results are an indicator of how economi-cally and educationally backward districts remainbackward in overall terms of development as well.
Secondary school opportunities have increasedacross Maharashtra and enrolments have risen sub-stantially over time. Even as late as 1998, the schoolsystem is unable to prepare almost half the childrento attain the high school degree. Therefore, whileMaharashtra has made major strides in the quanti-tative provision of secondary schooling, it has man-aged to retain favourable student-teacher ratios inthe secondary schools. Yet the quality of the process
and of the product remains in serious doubt. By itsvery definition, human development implies en-hancement of productive capacity of people andtheir skill base. The secondary education scenarioin Maharashtra is unable to effectively translateschooling opportunities into actual educational at-tainment in terms of learning.
Population Groups and Educational
Attainments
The 55th Round of the National Sample Surveyprovides data on educational attainments for differ-ent groups in the population. Apart from the clas-sification by sex and age, the dataset provides figuresfor Scheduled Castes and Scheduled Tribes as wellas for different occupational categories (self-em-ployed in agriculture, in non-agriculture, agricul-tural labourer etc) and with which the distributionof educational attainment for different groups of thepopulation can be analysed.
Although this is a cross-sectional data set, it ispossible to track changes over time by comparingyounger age groups with older age groups. Exceptfor the young people sampled in this round whomay still be studying, others have already acquiredtheir education while they were young. For thepurpose of investigating changing patterns overtime, two age groups have been selected: the youngadults (aged 15 to 29) and a middle aged group(aged 40 to 49). On an average there is a 25-yearage gap between these two groups. Those whoturned forty in 2000 were born when the State cameinto existence in 1960. A comparison between theeducational attainments of these two age groups willshow whether each of these occupational or socialgroups has been able to translate available schoolingopportunities into educational attainment.
The data from the 55th Round allows a furtherrefined analysis of different occupational and socialgroups. Again, for the purpose of simplicity, twogroups in the population have been chosen for com-parison from the many groups that were available.Here, Scheduled Caste men and women are com-pared to non-SC/ST/OBC men and women, and
Education 95

agricultural workers are compared with those who areself-employed in agriculture. For lack of better data,these two categories can be seen as proxies for landlesswage labourers and landowners or tenants.
Literacy among Agricultural Labourers
Among male agricultural labourers, the dramaticincrease in literacy is visible when the older andyounger age groups are compared. (Table 6.13)Among the younger group, a much higher propor-tion of men have completed elementary schooling.Almost 15 per cent of the younger men have com-pleted either secondary, higher secondary or gradu-ation as compared to less than 5 per cent of oldermen who had attained these levels. The percentagedecline in illiteracy among the male self-employedis almost the same as that among the agriculturallabourers, however the illiteracy level was muchlower for this group of older men. Self-employmentin agriculture automatically implies land ownershipor land taken on lease. Among farm owning house-holds especially younger men, illiteracy levels areextremely low (well under 10 per cent).
A noteworthy aspect of the education of agricul-tural labourers and self-employed men in agricultureis the pattern of distribution of educational attain-ments among the younger male agricultural labour issomewhat similar to the distribution among the olderself-employed men. Some 63 per cent of the youngeragricultural labourer and 44 per cent of the olderself-employed men have completed elementary
schooling i.e. primary and middle. But in the secon-dary schooling category, the percentage of older self-employed men (at 28.5 per cent) is significantly muchhigher than the percentage of younger agriculturallabourers i.e., 3.6 per cent. These numbers suggestthat the ability of the male agricultural labourer todayto access and complete secondary schooling in Ma-harashtra is still extremely low. Even 25 years ago,over a third of rural self-employed men could obtainthese higher levels of education.
Taking secondary and higher secondary catego-ries together, and comparing the younger men from
Table 6.13
Percentage of Educational Attainments of Workers in Agriculture in Maharashtra
Description Not-literate Primary Middle SecondaryHigher
Secondary GraduateMale agricultural labour 15–29 17.7 21.5 30.1 21.5 7.2 1.9Male agricultural labour 40–49 55.3 30.2 8.0 5.0 1.4 0.1Male self-employed in agriculture 15–29 7.3 13.1 27.7 31.8 13.5 6.6Male self-employed in agriculture 40–49 25.3 33.5 18.1 15.7 4.5 3.0Female agricultural labour 15–29 33.8 30.9 18.9 8.1 2.9 0.4Female agricultural labour 40–49 83.3 13.9 1.3 0.7 0.0 0.7Female self-employed in agriculture 15–29 19.6 26.2 28.0 16.9 7.3 1.9Female self-employed in agriculture 40–49 65.4 20.1 11.2 2.1 1.2 0.0
Source: NSS 55th Round.
0 20 40 60 80 100
Femaleagricultural
labour 15–29
Femaleagricultural
labour 40–49
Female self-employed in
agriculture15–29
Female self-employed in
agriculture40–49
Not Literate Primary Middle
Secondary Higher Secondary Graduate
Figure 6.5
Educational Attainments: Workers in Agriculture, Maharashtra NSS 55th Round
96 Human Development Report Maharashtra 2002

both occupational categories, the differences in sec-ondary and higher secondary attainments are stark.In the 15–29 age group, about 11 per cent ofagricultural labourers have completed secondary orhigher secondary levels. For the same age group ofself-employed, the percentage attaining the secon-dary or a higher secondary level is 45 per cent.
There possibly could be a big gap in secondaryschool attainment among men of the same age be-tween these two rural occupational groups for withoutmore detailed empirical evidence and better contex-tual data, there can be no definitive answers. Wide-spread provision of primary education through zillaparishad schools has fuelled the rise in primary schoolattainment across the board. But secondary schoolingmay be too expensive for agricultural labourers.
Age and Illiteracy
Illiteracy is high among the older age group ofwomen; more than 80 per cent of female agricul-tural labourers and more than 60 per cent of womenfrom landholding families cannot read or write. Forthe younger generation, illiteracy levels are signifi-cantly lower. However, more than 40 per cent ofagricultural labourers even in the age group 15–29remain non-literate. NSS data shows that youngerwomen who are agricultural labourers have hadsome education. Thirty-two per cent completed theprimary level and 20 per cent have studied up toStandard VII. Higher education attainments arenegligible. For self-employed women in the agegroup 15–29, the trends are more favourable: 27per cent have primary schooling, another 27 percent have completed the elementary stage and afurther 16 per cent have secondary school degrees.
Women lag behind their male counterparts inthe same age group in each occupational categoryThe distribution of educational attainment amongyounger women from landholding families is infe-rior to the distribution of educational attainmentamong men of the same age group who are agricul-tural labourers. Thus, educational disadvantage restsnot only on occupational or economic backgroundbut is compounded by gender.
Social Trends
What trends characterise the distribution of educa-tional attainment of different social groups? WhenScheduled Caste groups are compared with a groupthat is not scheduled caste, tribe or from otherbackward castes, there is hardly any difference inthe proportion of urban males in the secondary andhigher educational category between the two agegroups. Both age groups have a little more than 50per cent of their population who have either secon-dary or higher degrees. Even among the scheduledcaste urban males, there is little difference in per-centage of the secondary and higher categories be-tween the older and younger age groups.Opportunities and attainments have remained sta-ble in urban areas for those seeking high schooldegrees, whether they are from scheduled castes orothers. For higher education degrees, the youngerScheduled Caste urban males have made consider-able gains (19 per cent with higher secondary andcollege degrees) as compared to their older counter-parts (5 per cent) (Annexure Table 89).
Over 29 per cent of younger rural ScheduledCaste men have secondary and higher attainments—a small difference over their older counterparts
0 10 20 30 40 50
UrbanFemales:
Others 15–29
UrbanFemales:
Others 40–49
UrbanFemales: SC
15–29
UrbanFemales:
SC 40–49
Not Literate Primary MiddleSecondary Higher Secondary Graduate
Figure 6.6
Educational Attainments: Social Groups NSS55th Round, Maharashtra
Education 97

(25 per cent). Among rural SC women, the propor-tion gaining secondary and higher levels is approxi-mately 14 per cent—a bigger gain over their olderwomen counterparts. Younger rural ScheduledCaste men are far ahead of women in their educa-tional attainments. Still, the proportion of ruralScheduled Caste men and women who have gainedsecondary and post secondary education has notchanged very dramatically in the last 40 years.
The higher proportion of urban scheduled casteyounger men gaining college degrees may be afunction of reservation and quotas. It may also bedue to the fact that growing urbanisation has gen-erated more opportunities for highly educated peo-ple. But what accounts for the relatively stable andunchanged scenario as far as secondary education isconcerned? Lower secondary school attainmentsamong women may be due to low returns to edu-cation for Scheduled Caste rural women. The stablepattern of secondary school attainment among ruralScheduled Caste men seems to suggest that neitherdemand nor supply forces have changed dramati-cally in these areas over the last several decades.
Special Projects
There are two special focus areas, apart from theprimary and secondary education in Maharashtra:comprehensive primary school improvement initia-tives in educationally backward districts and thehandling of issues regarding the education of dis-abled children. One of them, the District PrimaryEducation Programme (DPEP) was aimed at uni-versalising primary education.
Across Maharashtra, the progress in primary edu-cation especially in terms of access and enrolment
since 1960 has been impressive. Yet there remaineda set of districts, particularly in Marathwada, thathave been historically backward educationally. Underthe State Government’s new Plan of Action an-nounced in 1994, the DPEP (District Primary Edu-cation Programme) was a major new programme tobe introduced to deal specifically with improvingprimary education in these educationally backwarddistricts. Maharashtra was amongst the first DPEPstates.
Under DPEP, the attempt at universalisation wasthrough formal schools and non-formal or alternativecentres, increasing retention and improving learning.A specific focus was also on reducing disparities be-tween social groups and between boys and girls. In thefirst phase, in 1994, the programme was introducedin the five low literacy districts of Marathwada i.e.Aurangabad, Parbhani, Latur, Nanded, and Osman-abad. In 1997, four more districts—Beed and Jalnafrom the same region, and Dhule from Western Ma -harashtra and Gadchiroli from Vidarbha, were added.All these districts had an adult female literacy levellower than 39 per cent according to the 1991 census.
DPEP goals envisaged a comprehensive ap-proach to educational improvement. The interven-tion included building physical infrastructure,teacher training, creation of new teaching methodsand materials, a wide variety of programmes toincrease community participation. Girls educationand tribal education were special focus areas. Amajor portion of the funds was from externalsources that came through the Ministry of HumanResource Development, Government of India. TheState Government also contributed resources. (An-nexure Table 3 supplement indicates the relativeshares of both contributors).
Table 6.14
Government of India and State Share of Resources for DPEP Project
Funds Released by Government of India State Share Released % Shareof StateUpto 1998–99 1999–2000 Total Upto 1998–99 1999–2000 Total
9551.51 1500 11051.51 1592.05 349.22 1941.27 14.9
1608.86 1900 3508.86 256.74 533.74 790.48 18.4
Source: DPEP Document 2001.
98 Human Development Report Maharashtra 2002

Table 6.15
Literacy Percentage: Rural Areas/DPEP
District 1981 1991 2001
Aurangabad 36.8 47.8 67.9Parbhani 33.5 40.8 76.8Nanded 31.7 42.5 78.6Latur 36.1 51.6 81.5Osmanabad 39.6 51.2 80.9Beed 37.2 45.2 80.8Jalna 29.6 42.0 75.8Dhule 40.1 43.8 67.4Gadchiroli 39.9 40.2 83.2
Source: DPEP Document, Department of Education, Govern-ment of Maharashtra.
Unlike some other States, Maharashtra’s contri-bution to the project in terms of financial resourceshas been at the targeted level of 15 per cent andappears to have been timely. This is another indica-tion of a serious commitment of the State Govern-ment to improving education in its moreeducationally backward areas.
Without more detailed data it is difficult todisentangle cause and effect, but some clear trendsare visible from these nine districts (Table 6.16).
Literacy Rates
The nine districts were selected for inclusion in theprogramme primarily on the basis of low literacylevels. In 1991 these were among the lowest literacydistricts in the State. While there has been a secularrise in literacy rates across the country and acrossthe State, it is interesting to note that there is asharper increase in literacy levels in all project dis-tricts in the decade 1991 to 2001 as compared tothe previous decade.
Part of this increment in literacy must be attrib-uted to the DPEP intervention and to the literacyprogrammes.
The DPEP database provides figures for schoolenrolment and out of school children for the schoolyear 1999–2000. There are 28,71,072 children inStandard I to V in the nine districts covered by
DPEP. A massive household survey in all 12,533villages in the summer of 1999 when highly urban-ised areas were omitted showed that 1,61,110 chil-dren in the age group 6 to 9 and 3,35,290 childrenin the age group 9 to 14 were out of school.Unfortunately the data for in school children is bygrade level whereas the data for out of school chil-dren is by age group. Therefore age-specific schoolenrolment figures cannot be computed from thisdata. Still, a quick look at the available numberssuggest that the proportion of out of school childreneven in the rural areas in these districts is not high.
Table 6.16
Estimates of Enrolment and Out of SchoolChildren DPEP Nine Projects Districts, 1999–2000
Number of Children in School in Std I to VBoys 1490941Girls 1380131Total 2871072% of girls in total Std I to V enrolment 48.10
Number of children out of schoolBoys (age 6–9) 80210Girls (age 6–9) 80890Total (age 6–9) 161100% of girls in total number of children out of school (age 6–9) 50.2 Boys (age 9–14) 164084Girls (age 9–14) 171206Total (age 9–14) 335290% of girls in total number of children out of school (age 9–14) 51.1
Number of disabled children identifiedBoys 18639Girls 13541Total 32180
Number of disabled children enrolled in schoolBoys 11180Girls 8006Total 19186
% of all disabled children who have been enrolledBoys 60.0Girls 59.1Total 59.6
Source: DPEP Document 2001.
Education 99

In order to ensure education for all children, alarge number of new schools and Standard V classeswere started. For example, in DPEP Phase 1 dis-tricts, 441 new schools and 1017 Standard V classeswere started. The numbers for DPEP II districts ishigher at 871 new schools and 1599 Std V classes,these figures being for 1999–2000. In addition thereare alternative schooling centres, contract schoolsand special schools for children of sugarcane work-ers. There are a total of 1,715 alternative schoolingcentres across the nine districts covering more than40,000 children.
The available figures for in school children andout of school children do not show any significantdisparity between boys and girls. Gender inequalityin access to school is low. The figures for disabledchildren indicate that there are fewer girls who areidentified as disabled than boys. Whether this is areflection of actual trends or a bias in reporting isnot clear. Nonetheless, the percentage of disabledgirls who have been enrolled in school is exactly thesame as that of boys. DPEP’s focus on inclusion hasbeen instrumental in identification and enrolmentof disabled children.
Creation of new schools, expansion of newschools, enrolment drives, increased level of com-munity participation, improvement of teaching inschools—all initiatives undertaken under DPEPmay be the possible reasons for children going toschool and staying in school.
Compared to enrolment or attendance, data fordropout rates and achievement levels are alwaysmore difficult to collect and to interpret availabledata is also not straightforward. Further, the datathat is available is usually cross-section for one pointin time. Therefore it is not possible to understandif there have been significant changes over time forthe different cohorts of children who have beengoing through primary school over time.
There has been, however, one cohort analysisconducted for schools in the project districts whichhad Standard I in 1996–97 and offered instructionup to the end of Standard IV or V by 1999–2000/
2000–2001. The study covered 13,216 schools and5,53,169 children and pointed to several importantfindings:
• Transfers: On average 14.6 per cent students tooka transfer certificate and left schools in which theyhad started their formal education. Children wholeft with transfer certificates were left out offurther analysis.
• Duration of staying in the same school: Of thechildren who did not take a transfer certificate,an average of 76.6 per cent children stay withinthe same school which offers up to Standard IVand about 66.2 per cent children stay in the sameschools which have upto Standard V. The rest ofthe children left school due to a variety of otherreasons. The researchers suggest that the ‘persist-ence of high drop out rates in some districts is amajor cause of concern’ (DPEP, 2000).
• Completion rates: 62.1 per cent in the schoolswhich had upto Standard V. There is howeverconsiderable inter-district variation in comple-tion rates, but the completion rates are similarfor boys and girls.
The available figures and analysis of completion,dropout and achievement levels for children in theDPEP districts are indicative and instructive onseveral counts: first, more in-depth study of educa-tional processes and outcomes is being undertaken.Better data and more sophisticated analysis are be-coming available to understand the underlying pat-terns of educational change. Without a betterunderstanding, solutions cannot be designed. Sec-ond, a range of inputs have gone into the educationsystem; some of these changes like infrastructuraldevelopment, massive training of teachers andchanges in teaching methodology, decentralised pat-terns of planning and implementation, higher com-munity participation and targeted schemes forspecial groups. While it will not be possible to saywhich of these inputs had the greatest impact ofincreasing access or improving achievement, it isclear that the comprehensive ‘package’ has led tobetter performance on at least the indicators thatare easy to measure—enrolment and access. Third,improving achievement levels and completion rates
100 Human Development Report Maharashtra 2002

Box 6.4Education of Children with Disabilities
In all the documents produced by the Directorateof Education, there is no mention of children withdisabilities though, approximately one in twentychildren are disabled, and increasing numbers ofchildren with medical conditions now survive. Social policy research has revealed that familieswith disabled children experience a range of socialand economic problems when trying to school thechildren. Unfortunately, historically, education ofdisabled seems to be an ignored area, both in thecountry and in the State. Disability and poverty are very closely linked.Parents of disabled children are not aware of theirroles and responsibilities towards their disabledwards. It is assumed that all disabled children needspecial inputs of special educators and have to besent to the special schools. Special schools are veryfew, are disability specific and are run by the volun-tary sector. These schools are expensive and do notprovide other incentives such as fee exemption, freeuniforms, textbooks etc. Naturally parents cannotafford the high cost of special education and dis-abled children have a very low literacy rate—only17 per cent in the most serviced Mumbai areawhere there is a heavy concentration of specialschools (NSSO 1991). Programme on Integrated Education of Dis -abled Children or PIED was initiated to promoteinclusion of disabled in the mainstream, with aprovision for a special educator for every eightchildren. The school was paid the salary of theitinerant teacher and children were given specialgrants for aids and appliances including Braillebooks, crutches, hearing aids etc. Although theblind schools in India are more than 100 years old,the blind have been fighting for their right to be apart of the mainstream. There are several itinerant teachers even in re -mote areas and blind children seem to have bene-fited from the PIED scheme. Unfortunately therest of the disability sector did not take advantageof the scheme. A study of the PIED scheme inMaharashtra by the SCERT showed that there are17 times more children attending integratedschools than those attending special schools. Implemented from 1995 to 2001, DPEP had amandate for integrated education. In Maharashtra
it involved 1767 children in various schools in 177villages in nine selected blocks. Block and districteducation officers, teachers, head teachers and sen-ior officers of DPEP were trained with help fromdisability consultants. Special educators, one eachwith a specialisation in mental retardation, physicaldisabilities, blindness and hearing handicaps wereappointed at the district level. It was proposed thatthey would do the training at the block level andthe trained education officers would cascade thetraining to village level. The DPEP programme also carried out struc -tural modifications to make schools accessible toall children. Even toilets were adopted in a fewschools. One of the major achievements of theprogramme in Maharashtra was to create awarenessand sensitise policymakers and senior officers tothe issues of disabled children.
In 1995, a landmark legislation was adopted onanti-discrimination and equal opportunities. Thelaw has a special chapter on education of disabledchildren and has a mandate for providing educa-tion in the least restrictive environment. This lawwas publicised very widely and has given disabledchildren a right to be educated in regular neigh-bourhood schools.
Finally, in June 2001, Government of Maha-rashtra took a step towards inclusion by reservingthree per cent seats for disabled in all educationinstitutes including higher education. This positivediscrimination has seen a sudden growth of chil-dren with disabilities in schools. In a survey of 25schools in Mumbai (which had never admitteddisabled children in their 30 years or more ofexistence), now have between 30 and 50 childrenattending regular classes.
Integration of the disabled will have indirectimplications for appropriate interventions and im -proved service delivery to a vulnerable client group.It will provide important new data for the sociologyof childhood, and for disability studies, broadeningand deepening our understanding of these areas ofsocial life. Inclusion and positive action would pavethe way for more specific studies of particularaspects of disabled childhood, and demonstrate theimportance of child-centred approaches.
Education 101

is much more difficult than increasing enrolmentand takes longer time. It is conceivable that thecomprehensive set of inputs that have gone into theeducation system and processes in the DPEP dis-tricts in the last five years will lead to substantialchanges in learning and completion rates over alonger period of time.
Both DPEP and the Primary Education En-hancement Programme have contributed to the ba-sic approach to education development, especiallyschool improvement in the State. Both projectsshare important similarities: (a) focus on backwarddistricts and on disadvantaged areas and popula-tions, (b) a comprehensive approach that includesinfrastructure development, quality improvement inteaching-learning, academic support to regularschools, alternative schools to serve unserved habi-tations or for difficult group. (c) Decentralised de-cision-making processes in line with the 73rdamendment to the Constitution, and (d) as part ofa larger DPEP and PEEP network across otherdistricts in the State, learning from widely sharedexperiences. Achievement studies done as part ofboth programmes suggest that learning gains arevisible in both target areas and populations.
Conclusion
Since human development is expansion of enablingopportunities such as education and improving thepopulation’s capabilities, where does Maharashtrastand? Have enabling opportunities indeed in-creased, and at the same time, whether and how, arehuman capabilities being enhanced. Tracking pro-vision or access is relatively straightforward: thenumber of schools and colleges and their distribu-tion across space and time is easy to see. Thequestion of whether human capabilities are increas -ing, at least as they relate to education, is muchmore difficult to trace and analyse.
There are data and measurement issues. For anymeaningful evaluation, adequate evidence is needed.For a comprehensive analysis of education in Ma-harashtra, better data on several key areas would beneeded, for instance, with regard to:
• Reliable estimates of out of school children.
• Accurate data on school attendance.
• Appropriate methods for tracking dropouts.
• Achievement or learning data for different levels.
Although a majority of children in the age group6 to 14 are in school, it is the marginal groups whoremain outside the ‘education net’ and who are themost difficult to deal with. Different sources of datalike the census, national sample surveys and otherhousehold surveys provide estimates of age specificenrolment rates or estimates of out of school chil-dren and working children. Household surveysources generate figures that vary considerably fromschool sources. To design programmes or policies toaddress these disadvantaged children, it is importantto understand their magnitude and location andreasons for being out of school.
Enrolment numbers simply state that childrenare on the rolls of the school register. Attendanceindicates the extent of students’ actual ‘attachment’to school. The effective delivery of education needscontinuous attendance. Unfortunately, attendancefigures although collected regularly at the schoollevel are rarely available at an aggregated level.Similarly, the dropout rate is a good indicator of theefficacy of the school system; the current mode ofmeasuring dropout rate is crude. In fact, the currentdropout statistics vary vastly from district to districtand there is no a priori reason for the source of thesevariations.
Human Capability
Finally, while human capabilities can be definedquite broadly, the basic foundations on which otherhuman capabilities can be built, is the learning thatis expected to take place in primary and secondaryschool. In terms of analysing if human capabilitiesare increasing or not, it is imperative that we un-derstand what children are able to learn at each level(or grade) in the educational system. Learningachievement data is rarely collected and aggregated.Available studies suggest that low levels of learningare endemic in the Indian education system. There-fore, the reliability or appropriateness of ‘years of
102 Human Development Report Maharashtra 2002

schooling’ as a good proxy for higher capabilities iscalled into question. If, on average, the achievementlevels of children in Standard IV are not significantlydifferent from that in Standard II, then the indicator‘years of schooling’ has no traction. Reliable andaccurate data on learning levels needs to be col-lected, aggregated and discussed. Without informa-tion on this topic being available and widelydisseminated, the critical issue of student learningcannot even enter the domain of public debate andconcern.
Status of Education
As far as education is concerned, today’s Maha-rashtra presents a mixed picture of plenty and pov-erty, of widespread development accompanied bypockets of deprivation. While the quantitative ex-pansion of schooling opportunities have been im-pressive, quality remains a question.
Has the provision of educational opportunitiesincreased? Has its distribution spread more widelyin the population? Are more people participating ineducational activities? Are more people getting moreeducation? Is the population become more capable,at least in terms of competencies? Are increasingproportions of people participating in different lev-els of education? Are different levels of educationalattainment distributed widely in the population?
Modern Maharashtra’s education system is builton a strong progressive legacy of the past. It is visiblein patterns of participation in education of girls andwomen as well as rising educational attainmentamong the historically disadvantaged groups. Edu-cation was a core arena of activity for Maharashtra’ssocial reformers and political leaders in pre-inde-pendence India. But with the increasing dependenceon State provision and support since 1960, the roleof progressive and voluntary activism in educationhas declined substantially. At the same time, thereis rising involvement of private and commercialinterests buttressed by political leadership’s localinitiatives to consolidate their hold on the socio-economic underpinnings of the community to beserved, in secondary and post-secondary education.
On the quantitative side, there is no doubtabout the impressive increases with respect to accessto basic education. The numbers of primary schoolsand secondary schools per capita population haveincreased substantially. Despite increasing enrol-ments at all levels, the government has managed tokeep teacher-pupil ratios remarkably stable. Thereare exceedingly few habitations anywhere in theState without schools. Practically all teachers ofgovernment schools have received intensive in-serv-ice training in the last five years. Whether primaryor secondary, the distribution of schooling oppor-tunities has been relatively even across the State.Thus, the broad picture that emerges is that provi-sion has increased and the distribution of educa-tional opportunities has widened.
Over time, in each age group, a larger propor-tion of the population is participating in education.The differences between boys and girls in Ma-harashtra are much smaller than in most States. Infact, the participation of boys and girls is quitesimilar till higher levels of the education system.Although enrolments are rising among scheduledcastes and tribes, their performance lags behind thatof the rest of the population.
Although access to schooling is high in the State,dropout levels are also high. Rapidly rising highersecondary and college enrolment is accompanied bypoor rates of success in school board exams. Verylittle information is publicly available about howmany children in school know or have learned ascompared to what they are expected to know. How-ever, from learner achievement studies conductedby DPEP and from learning achievement estimatesavailable in urban municipal primary schools, it isapparent that quality of basic education still remainsto be improved.
Widespread State provision of primary school-ing is found side by side with high levels of privateactivity in the secondary stage. Whether the private(aided and unaided) provision of schooling at thesecondary stage implies that post-primary educationremains out of reach of the lower income groupsneeds to be studied carefully.
Education 103

Overall, since 1960, there has been no markedreallocation of expenditures to education, andwithin the education budget to elementary educa-tion. There has been no major restructuring ofexpenditure in favour of districts with poor educa-tional participation levels or attainment levels.
At least for elementary education, through thenew curriculum, textbooks and intensive large-scalein-service teacher training, the State government isattempting to upgrade learning levels of students.The longer run impact of these inputs on student
outcomes will take time to bear fruit. A similarthrust needs to be designed and executed for sec-ondary education as well. For a time bound andrapid universalisation of literacy and of elementaryeducation, to ensure that every child in the Stateis in school and learning, a serious high prioritypush is needed. This will need higher commitmentof resources than is visible right now. It is onlywhen all adults are literate and all children are inschool, that the basic foundation of human de-velopment of Maharashtra will be strong and sus-tainable.
Chapter VII →
← Contents
104 Human Development Report Maharashtra 2002


CHAPTER VII
Gender Issues
A female must first survive, then grow andflourish. For this, she requires capabilitiesthat equip her to increase the range of
options to decide what kind of life she wants to lead.She needs freedom to pursue her needs and interests.But female deaths at different ages result in warpedfemale-male ratio in the population at different ages.Within this imbalance is the story of gender dis-crimination and deprivation. When compared to ason, she is seen by society to be of negative worth,and this is followed by her trials and tribulations asa reproductive being. At what age she marries andhow many children she bears, how many she canavoid are actions subject to social norms, not herchoice though it influences her health and limits herabilities including her education.
Records of nutritional deficiencies indicate thelack of growth possibilities for women. Reproductiveyears are women’s most vulnerable years when sup-port for maternity and limiting births is crucial. Howwell are infants and children of both sexes protectedby healthcare so that planned births do not pose arisk of losing the now fewer children and therebyinduce more births as compensation is important.Education is a major capability for improvingwomen’s opportunities for participation in society inmany rewarding ways through better care of self andfamilies, better employment; better ability to takepart in cultural, social and political activities.
By gainful employment women can acquire anindependent income and secure entitlements toboth productive and consumption resources in so-ciety. The kind of employment she gets, the termsand conditions under which she retains it, therewards she gets for her paid or unpaid work, thepossibility of a variety of jobs at different levels ofskill and prestige determine her access to resources
including monetary reward, rest, leisure and escapefrom drudgery.
Women’s entitlements are not limited to incomebut by socially determined norms over which shehas little control. Even her independently earnedincome might not often enhance her entitlement orher freedom but it does open up this possibility.Participation in political activities, presence in dif-ferent rungs of government, community affairs, andorganised activities at collective level to promotewomen’s interests speak of her empowerment.
Gender equality thus has two elements: women’sdevelopment and empowerment. Developmentconfers capabilities but to make use of them, thewomen have to be able to participate in activitiesthat lend them authority and voice in private andpublic space, which in turn require resources, eco-nomic and social. Some important indicators ofempowerment would be ownership and control ofcritical productive resources like land, access tocredit, membership in non-family groups, commu-nity organisations, active participation in co-opera-tives, trade unions and other professionalorganisations, representation in decision-makingbodies from the local to the apex levels. As citizens,they have a right to deliberate and make decisionson behalf of society but more importantly, in deci-sions that affects their lives.
Maharashtra’s Landmarks
Historically, Maharashtra has better achievementson women’s rights than most others. As a societyand as a State, its catalogue of concern and actionon issues relating to deprived women, driven as itis by the rich political and socio-cultural history ofreform as well as vigorous women’s movements. The
Gender Issues 105
state has been pro-active in promoting policies forwomen’s development and empowerment. It is aState where a woman from Pune secured maternitybenefits as a single, unwed mother on grounds thatMaternity Benefits Act did not stipulate that awoman has to be married to bear a child.
There are several Centrally Sponsored Schemessuch as IRDP, DWCRA, TRYSEM, Nehru RozgarYojana, ICDS, that include as a component, theprovision of pre- and post-natal care for women,nutrition and immunisation for children. In addition,Maharashtra itself has specific programme, whichinclude the Employment Guarantee Scheme wherematernity leave with wages is a norm. Nearly 40 percent of beneficiaries of EGS have been women.
As early as 1975, Maharashtra pioneered theconcept of a development corporation—MahilaArthik Vikas Mahamandal—for economic supportto women seeking self-employment if they were be-low the poverty line, providing them with training,credit and marketing facilities. The Government pro-vides 100 per cent financial assistance to women’sco-operatives. Since 1993, the Mahila SamruddhiYojana provides attractive interest on small deposits.Widows get monetary aid towards wedding expensesof their daughters. Working Women’s Hostels aresupported. A State Women’s Commission has alsobeen set up.
However, multiplicity of schemes has led toresources being spread thin and is perhaps a deter-rent in making a real dent on women’s economicsituation. The government is unable to meet therequirements of all deserving aspirants to aid. Whileselection of projects could be more imaginative,administrative costs far outweigh actual benefits tothe recipients. Most efforts tend to be ad hoc assis-tance even as the exclusive economic focus ignoresthe problem of unequal gender relations within thefamily. This necessitates other measures like gendersensitisation of all levels of government, communityand households.
A Policy for Women in 1994 after a separatedepartment for Women and Child Development
was created a year earlier but this document ofwell-meant and lofty intents requires spirited imple-mentation. Already, a new incarnation of the Policyfor Women has come into being, marking out fiveareas for special emphasis:
• To eliminate violence
• To improve the economic status of women Topromote women-friendly personnel policies
• To explore use of mass media
• To increase the participation of women in localself-government and in community
The proposal include changes in law pertainingto marriage, succession and property and wouldrequire strong back-up action since there is alreadya prevailing 30 per cent reservation for women inGovernment jobs. But this affirmative quantifica-tion of entitlement does not specify as to the levelsup to which these quotas are available.
Around the time the Policy for Women wayunveiled, a remarkably progressive move requiredall housing allotments made through State or Cen-tral schemes to be jointly made to the husband andwife. Laws governing co-operative housing was alsochanged to enable bylaws that make it easier forjointly owned flats to be transferred to the womanin the event of her husband’s death. The woman’sright to her matrimonial home is also admitted inlaw but in the event of a divorce, problems havearisen in cases where a joint family has been inresidence there and/or the accommodation is toosmall. Now, activists seeking to secure rights to thewomen are campaigning for recognition that a mat-rimonial home is a place where the husband andwife reside regardless of who owns the premises sothat a woman cannot be thrown out because anin-law has legal title to it. As of now, a husband canwill away his property.
The Government of Maharashtra recognised theneed for special protection to women, using a draftoutlined by the State Women’s Commission, withinputs from several NGOs in the women’s sector, isdrafting a law, which would need to be enacted bythe State Legislature. Maharashtra Government’s
106 Human Development Report Maharashtra 2002
commitment to such a law in principle stems fromthe acknowledgement that women who suffer fromsocio-economic hardships do not lodge complaintsfearing social and economic repercussions includingpossible loss of family ties, shelter and sustenance.Also, that they fear their witnesses are intimidatedeven as lengthy criminal proceedings pose furtherhardships. More significantly, the women see per-sons and institutions responsible for their securityabandoning their responsibilities. Article 15(3) ofthe Indian Constitution enables the States to enactsuch special laws and if enacted, would be the firstever in the country. Box 7.1 documents the local
procedures whereby women are protected againstsexual harassment in Maharashtra.
If and when such a law is enacted, its observancewould be mandatory for all government, semi-gov-ernment organisations, local bodies and also suchentities which are promoted, licensed, recognised orassisted by Government; defaults would attractwithdrawal of grants, aid, permission and licences.
Maharashtra has decided to make the Women’sComponent Plan an integral part of the State’sdevelopment plan. Ten per cent of revenue receipts
Box 7.1To Protect the Vulnerable
The proposed law requires District Vigilance Com-mittees headed by a Commissioner of Police, Col-lector or a Superintendent of Police, with officialsincluding the Sessions Judge, the GovernmentPleader, Chief Executive Officer of Zilla Parishads,Social Welfare Officer dealing with ICDS and arepresentative of Woman and Child Welfare De-partment, to be formed. Against these seven mem-bers from the government side, there would beanother 11 representatives of social organisationsworking for women on it.The proposed law has provisions for Women Wel-fare Magistrates (WWM), Inspecting Social Work-ers and Reconciliation Committees, the lastoperating under the District Free Legal Aid Com-mittees that are already in place. All the function-aries under the proposed law would be deemed tobe to be public servants and no civil or criminalproceedings can be initiated against them withoutthe prior permission of the State Women’s Com-mission.
Once a woman comes for help as a victim ofsexual harassment or betrayal, her complaint wouldbe required to be registered in a confidential regis-ter, ensure her personal security and well-being andinform the District Vigilance Committee and theMagistrate.
The Magistrate also refers the issue to the DVCwhich in turn, would recommend the bonds re-quired to be obtained, give a right to an audiencebefore the WWM and move the ReconciliationCommittee. The WWM will help secure shelter,
maintenance security and well-being of the womenpending the proceedings in a court. The WWMmay obtain bonds at any stage. The Reconciliation Committee, irrespective ofthe conditions of eligibility, shall arrange for rap-prochement and irrespective of the woman’s con-sent, find out if it is in her full interest. Helpincludes removing genuine fears about intimida-tion of witnesses so that the victim is enabled topursue her case freely in a court of law. Witnesses and the victim would be questionedonly at places of their convenience to avoid inhib-ited articulation or embarrassment to their mod-esty. No part would be made public without theconsent of the victim. Remand of up to 30 daysfor offenders is allowed. As regards bonds, no appeal against the orderof the WWM is permitted and appeal is possibleonly in the High Court. WWM’s interim ordersare to be deemed as interlocutory orders. Detentionand bonds can be till the final disposal. Courts, while dealing with these cases decidethe issue of guilt or innocence and the responsibil-ity for maintenance or security separately. The Statewould not be saddled with the financial responsi-bility of maintenance but the persons primarilyresponsible for her maintenance and those whocaused disruption would bear it. Trials would be speedy, with a notice on thelawyer deemed to be a notice to the client andwitnesses and adjournments for the convenience ofthe lawyers being given only in exceptional cases.
Gender Issues 107
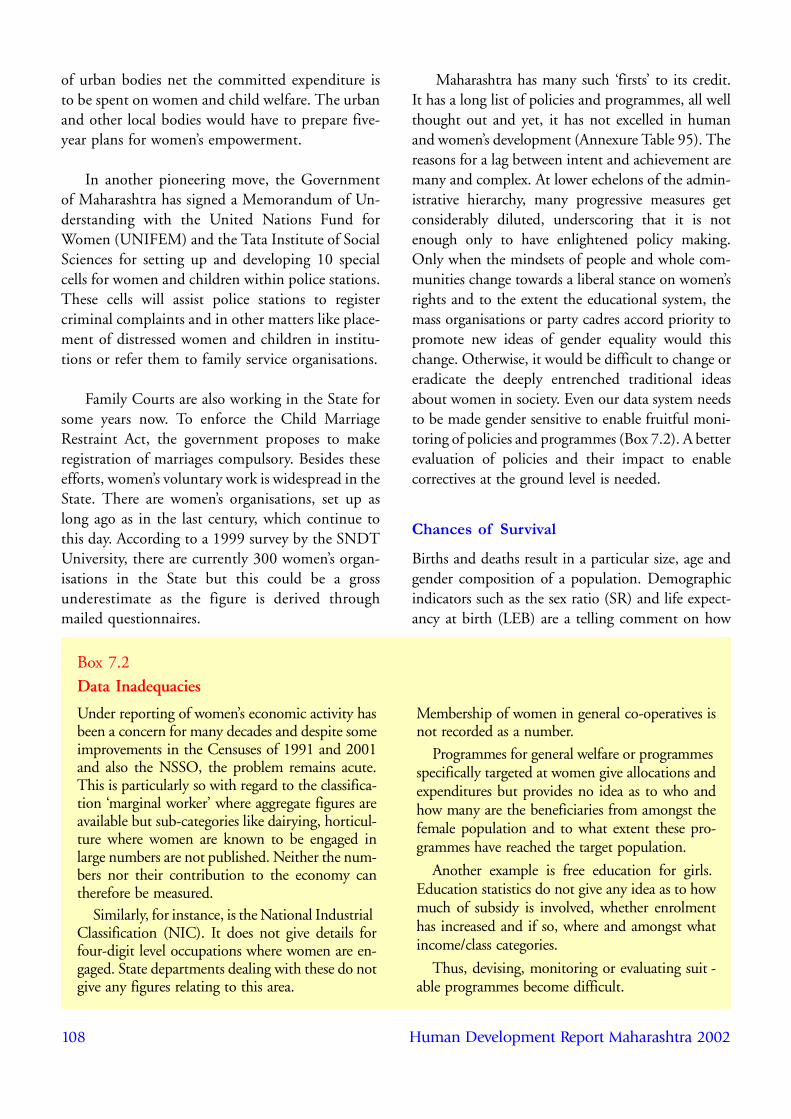
of urban bodies net the committed expenditure isto be spent on women and child welfare. The urbanand other local bodies would have to prepare five-year plans for women’s empowerment.
In another pioneering move, the Governmentof Maharashtra has signed a Memorandum of Un-derstanding with the United Nations Fund forWomen (UNIFEM) and the Tata Institute of SocialSciences for setting up and developing 10 specialcells for women and children within police stations.These cells will assist police stations to registercriminal complaints and in other matters like place-ment of distressed women and children in institu-tions or refer them to family service organisations.
Family Courts are also working in the State forsome years now. To enforce the Child MarriageRestraint Act, the government proposes to makeregistration of marriages compulsory. Besides theseefforts, women’s voluntary work is widespread in theState. There are women’s organisations, set up aslong ago as in the last century, which continue tothis day. According to a 1999 survey by the SNDTUniversity, there are currently 300 women’s organ-isations in the State but this could be a grossunderestimate as the figure is derived throughmailed questionnaires.
Maharashtra has many such ‘firsts’ to its credit.It has a long list of policies and programmes, all wellthought out and yet, it has not excelled in humanand women’s development (Annexure Table 95). Thereasons for a lag between intent and achievement aremany and complex. At lower echelons of the admin-istrative hierarchy, many progressive measures getconsiderably diluted, underscoring that it is notenough only to have enlightened policy making.Only when the mindsets of people and whole com-munities change towards a liberal stance on women’srights and to the extent the educational system, themass organisations or party cadres accord priority topromote new ideas of gender equality would thischange. Otherwise, it would be difficult to change oreradicate the deeply entrenched traditional ideasabout women in society. Even our data system needsto be made gender sensitive to enable fruitful moni-toring of policies and programmes (Box 7.2). A betterevaluation of policies and their impact to enablecorrectives at the ground level is needed.
Chances of Survival
Births and deaths result in a particular size, age andgender composition of a population. Demographicindicators such as the sex ratio (SR) and life expect-ancy at birth (LEB) are a telling comment on how
Box 7.2Data Inadequacies
Under reporting of women’s economic activity hasbeen a concern for many decades and despite someimprovements in the Censuses of 1991 and 2001and also the NSSO, the problem remains acute.This is particularly so with regard to the classifica-tion ‘marginal worker’ where aggregate figures areavailable but sub-categories like dairying, horticul-ture where women are known to be engaged inlarge numbers are not published. Neither the num-bers nor their contribution to the economy cantherefore be measured. Similarly, for instance, is the National IndustrialClassification (NIC). It does not give details forfour-digit level occupations where women are en-gaged. State departments dealing with these do notgive any figures relating to this area.
Membership of women in general co-operatives isnot recorded as a number.
Programmes for general welfare or programmesspecifically targeted at women give allocations andexpenditures but provides no idea as to who andhow many are the beneficiaries from amongst thefemale population and to what extent these pro-grammes have reached the target population.
Another example is free education for girls.Education statistics do not give any idea as to howmuch of subsidy is involved, whether enrolmenthas increased and if so, where and amongst whatincome/class categories.
Thus, devising, monitoring or evaluating suit -able programmes become difficult.
108 Human Development Report Maharashtra 2002

conducive the conditions prevailing in a society are,to the survival of women and the quality of life theycan expect to have.
The life expectancy at birth (LEB) for womenin Maharashtra stands at 65.4 years—higher thanfor men which is 63 years and much higher thanthe corresponding figure for women in the countryas a whole (59.7 years). Only in two other States inthe country—Kerala and Punjab—do women havehigher LEB, 74.7 and 67.6 years respectively. TheState’s high LEB is not in itself a cause for gratifi-cation because of the other disturbing feature, viz.a declining sex ratio.
In the absence of gender discrimination, a popu-lation should contain as a norm at least 1,050women for every 1,000 men, because of the inherentbiological superiority of women. However, as farback as 1901 the sex ratio in the State was muchlower at 978. It has been declining ever since, fallingrather sharply from 934 in 1991 to 922 in 2001.In absolute terms, the deficit of women has beenrising steadily from slightly more than 2,00,000 in1901 to nearly four million in 2001, jumping bymore than a million in the last decade (AnnexureTable 98, Figure 7.1). A deficit of this magnitudeis a sure sign of socio-economic conditions that areso punitive to women as to wipe out their biologicaladvantage. Even when there are modest gains, theydo not wipe out the overall deficit of women thathas accumulated owing to historic patriarchy.
This social phenomenon continues to be an en-during conundrum. The State’s low sex ratio is the
combined effect of increased migration of men, a dec-line in the proportion of girl children born and a highmortality rate for girls and young women. After elimi-nating the influence of migration, the relative effectsof the last two factors on the sex ratio can be measuredby examining Sex Ratio at Birth (SRB) and the age-specific Mortality Rates for women in the State.
In the absence of reliable data on SRB one canlook at the Child Sex Ratio (CSR): The CSR is theSex Ratio for the age group 0–6 years and as suchis free of the influence of migration. The CSR forMaharashtra, recorded in Census 2001 is 917. Ittranslates into a deficit of at least 83 girl childrenfor every 1,000 boys born in the last six years, whichis a definite worsening of the chances of survival forfemales in the State. Commenting on decliningChild Sex Ratios, the Census Commissioner rightlyremarks, ‘One thing is clear—the imbalance that has set in atthis early age is difficult to be removed and wouldremain to haunt the population for a long time to come’(Census of India 2001, page 96).
Within the State there is a great deal of variationin CSR: all the districts of prosperous Konkan, tribalEastern Maharashtra and all but one district of Vidar-bha have CSR higher than the State average. Thehighest Child Sex Ratio of 974 is reported in thetribal belts of Gadchiroli. The fully urban GreaterMumbai and all districts of Western Maharashtra, incontrast, exhibit CSR lower than the State average,(Annexure Table 90) the inter-regional differencesinviting investigation.
012345
Deficit of women in millions
1 2 3 4 5 6 7 8 9 10 11
Census Years 1901–2001
Figure 7.1
Missing Women
Gender Issues 109

Mortality Rates at Different Ages
Data on Age-Specific Mortality reveal the effect ofthe neglect of women in general and of the girl childin particular. Under-five mortality rate for femalesis much higher than the corresponding rate formales (Table 7.1) which the National Family HealthSurvey, 2000 also reflects: the under-five mortalityrate for Maharashtra is 58.1 per cent compared tothe national average of 94.9 per cent. Women be-tween 15–19 years also have a higher mortality ratethan their male cohorts all of which is the cumula-tive effect of neglect of girls in their early years whichtakes its toll on their health. Nutritional deficien-cies, particularly anaemia of girls and women, is welldocumented. Early marriage, often before the legallypermissible age and pregnancy, in their teens, highlevels of fertility as well as complications duringchildbirth such as toxaemia and bleeding of thepuerperium, pose high risks. Mortality rates forwomen at higher ages, however, are lower than formen. In addition, unmarried, widowed and sepa-rated women face another set of problems (Box 7.4).Women, it is evident, must pass the constraints thatthreaten their childhood and youth to finally takeadvantage of a longer life span.
Box 7.3Son Preference
Sons, in the Indian context, are traditionally seenas assets in economic, political and ritualistic termsby a male-dominant society. Social norms, values,and customs, especially those pertaining to prop-erty make the girl child the lesser child so that thebirth of a daughter in a family is a matter of regret.Consequently, the girl child is neglected, decreas-ing her chances of survival in a society focused onmasculinisation. At another level, development and consequentprosperity has not only left the traditional premiumfor the son untouched but has provided the meansof obtaining this premium. New emerging technolo-gies such as pre-natal sex determination tests and XYchromosome separation help eliminate girl childrenin the womb itself. The population policy in India,
which has promoted the small family norm througha system of incentives and disincentives, has ironi-cally reinforced girl rejection. A majority of Indian women live under oppres-sive social conditions that deny any choice to themin matters relating to whether and how manychildren they can have, forcing their involvementin their own elimination. Practices like sex deter-mination after conception through amniocentesis,ultrasonography and other techniques were ren-dered illegal in 1986 due to pressure from women’sgroups. This law, ‘The Maharashtra Regulation ofPre-natal Diagnostic Techniques (PNDT) Act,’though one of the earliest steps taken by any Statein India has not been effectively implemented.These practices continue.
Table 7.1
Age-Specific Mortality Rates for Maharashtra:1996
Sr.No. Age Group
Mortality Rates %
Female Male Total
1 2 3 4 5 1 0–4 13.9 12.4 13.1 2 5–9 1.0 1.1 1.0 3 10–14 0.7 0.8 0.7 4 15–19 1.5 0.8 1.1 5 20–24 1.5 1.8 1.7 6 25–29 2.0 2.2 2.1 7 30–34 1.9 2.9 2.4 8 35–39 2.5 3.5 3.0 9 40–44 2.0 6.0 4.110 45–49 4.6 6.7 5.711 50–54 6.6 8.6 7.612 55–59 11.2 15.6 13.413 60–64 20.3 31.9 25.814 65–69 30.8 40.6 35.715 70–74 62.1 67.5 64.616 75–79 89.5 111.3 99.617 80–84 91.5 134.4 111.418 85+ 181.6 164.5 173.6
All Ages 7.0 7.8 7.4
Source: Sample Registration System, Statistical Report 1996. Registrar General of India, New Delhi.
110 Human Development Report Maharashtra 2002

Violence against Women
Violence is an extreme form of social chastisementthat women face. In recent years, all types of crimesagainst women are reported to be rising in India ingeneral and in Maharashtra in particular. Since avail-able statistics are based only on registered cases, theactual number is estimated to be many times higher.
The total number of cases of crimes againstwomen has increased in the State: an increase from13,913 in 1993 to 16,567 in 1996 or, 19 per centover just three years. Crimes against women includingthose committed within the family are generally clas-sified into six types: rape, kidnapping and abduction,dowry deaths, torture, molestation, and eve-teasing.
Data reveals torture was the most widespread ofall crimes: in 1996, it constituted 55.27 per cent.While instances of kidnapping, dowry deaths andeve-teasing have declined between 1993 and 1996,torture has registered the steepest increase (35.72per cent), followed by rape (30.44 per cent) andmolestation (7.71 per cent) (Annexure Table 96).
Maharashtra, in fact, had the highest number oftorture cases (28.1 per cent) in the country in 1995.Box 7.5 reveals the nature and scale of traffickingin women especially girl children.
Box 7.4Single Women and Deprivation
Unmarried, widowed, separated and divorcedwomen across class and communities suffer fromdependency and are considered a burden to thefamily and the society. Most family laws areweighed against women such that maintenance inthe event of divorce, most unilaterally by the man,is meagre or non-forthcoming. Remarriage is more difficult for women thanmen. Widowed, divorced and separated women inthe State together number around 8.8 million andconstitute 9.1 per cent of the population, as com-pared to men in similar circumstances who consti-tute only 2.1 per cent of the population. Of these,women above 60 years constitute more than 52 percent of the widowed, divorced or separated. Shorn of their roles as wives and potentialmothers, they have the lowest status amongstwomen. These women are also prey to post-meno-pausal diseases like osteoporosis and are, thus, themost vulnerable, yet ignored section of the popu-lation besides girls under five.
Two case studies focuses the dire need for di -rectional efforts in providing equity and equality,which are the rights of all women. Of 600 women surveyed by Samajwadi MahilaSabha in Dhule district from 1987–93, 400 weredeserted due to lack of dowry, because their hus-bands did not find them attractive or were addictedto drugs and liquor. Another 150 were deserted forinability to bear children. They were labelled infertilewithout having medical tests conducted. About 50were deserted because they bore only female childrenor fell ill too often. Of these women, 400 were agedbetween 19–25, 150 between 26–35 and 50, 35–50. In a 1993 TISS study, 81 per cent of 16 desertedwomen in rural and urban areas of Maharashtramentioned domestic violence as the primary prob-lem in their marriage. Sixteen out of 18 womenhad been married between the age of 12–17, be-cause of this desire to marry girls off early, girls arenot provided enough education or skills to supportthemselves when their marriage breaks up.
Box 7.5Trafficking in Women
There are no official figures for sex workers andtrafficking in women. The number of womenand girl sex workers for the country as a wholeis estimated to be over 0.9 million of whichMumbai has a little under half: 0.4 million. Anestimated 30 per cent of these comprise minorgirls. There has been an annual increase in childprostitution of eight to ten per cent, accordingto published media reports. In Maharashtra’s cities, child sex workers con -stitute over 0.1 million. Of them, 93 per cent wereraped, kidnapped or abducted. Even though wehave a law against traffic in women, there hasrarely been any conviction. Sex workers also facethe scourge of HIV/AIDS. These women live un-der exploitative conditions trapped in the nexusbetween brothel keepers, pimps and the police.
Gender Issues 111

Statistics from the National Crimes Records,Bureau show a decline in the number of crimesregistered with the Maharashtra Police during2000–2001, the decline being visible across all typesof crimes. Of the 10,875 cases registered up toSeptember 2001, rape–1012, kidnapping–669,dowry deaths–89, cruelty at home or torture–4,383,molestation–2,108, eve-teasing-–1,101 and abet-ment to suicide–921. Torture continued to be themost widespread crime.
The National Crimes Records Bureau ranksMaharashtra high in terms of the number of crimesagainst women with 173.81 crimes per year permillion population. This gives Maharashtra the du-bious distinction of being the State with the fourthhighest incidence, Rajasthan with 208.16, MadhyaPradesh with 206.97 and Delhi with 197.14 crimesper year per million population.
Since most instances of physical and mentaltorture occur within the family, the increase incountry as a whole (59.7 years). Only in two otherStates in the country—Kerala and Punjab—dowomen have higher LEB, 74.7 and 67.6 years re-spectively. The State’s high LEB is not in itself acause for gratification because of the other disturb-ing feature, viz. a declining sex ratio.
Growing Up Healthy and Strong
The complex interplay of macro level social policies,the socio-cultural environment and the householddynamics result in a rather gloomy picture ofwomen’s health. As per available statistics, life ex-pectancy of women has increased; infant mortalityrates have come down. While this positively implieslowered risk of death among women, these figuresalso hide the high levels of ill-health and absence ofhealthy conditions for living.
Household Amenities and Health
India is committed to Alma-Ata Declaration of 1978to provide Health for All (HFA) and HFA is anintegral part of social and economic development ofthe community through provision of adequate food
and proper nutrition, safe drinking water, promotionof personal hygiene and basic sanitation. Healthservices have to be integrated to include curative;preventive, promotive and rehabilitative services.Household amenities such as sufficient availability ofwater and sanitation facilities are crucial for the healthof all household members but more so for womenand children. Women’s mobility is restricted due tovarious reasons and rural women are more vulnerableas a large majority i.e., 81 per cent of rural householdsin India have no toilet facility at all. Similarly, 73 percent of rural households in India rely mainly on fuelwood, indicating a health hazard. Women have towalk long distances to collect fuel wood that putsgreat strain on their energy The quality of fuel hasdeteriorated which affects cooking time. Women andchildren get exposed to smoke which cause respira-tory health problems.
Household amenities in Maharashtra are credit-able in some ways but inadequate in other ways. 82.1per cent of households have electricity and 81.9 percent have drinking water piped or from a hand pump.But hardly 45.9 per cent—an improvement on all-India figures—have toilet or latrine facilities. Biomassfuel is used for cooking in 51.9 per cent of house-holds. Very few households—28.3 per cent—havepucca houses. With an average of 3 persons per room,most live in overcrowded residences, not conduciveto good living. (Data from NFHS-2, Table 2.12)
Physical and Mental Health
Given the rigid gender roles and gender inequalitiesin society, women are more prone to sexually trans-mitted diseases (STDs) and HIV infection. Whenunsafe abortions end unwanted pregnancies,women succumb to a range of reproductive tractinfections (RTIs). Fear of being accused of promis-cuity drive women into avoiding any medical help.The study conducted by the agency SEARCH inGadchiroli district, found gynaecological diseasesamong 92 per cent women. The average number ofsuch diseases per woman was a remarkably high 3.6per cent. Infections such as vaginitis, cervicitis andother inflammatory diseases (PID) relating to thepelvis were contacted by half of the sampled women.
112 Human Development Report Maharashtra 2002

The survey also found that because female-basedcontraceptives usually have burdensome or painfulside effects, women tend to avoid them. It is im-perative that family planning be preceded by atten-tion to RTIs and gynaecological diseases.
For every maternal death there are 16 to 17women who suffer morbidity that can last theirentire life time. Married women are highly suscep-tible to contracting PIDs and HIV infection fromhusbands. It is difficult for women to negotiate safesex in the Indian patriarchal family where maleshold the ultimate power to decide on sexual activity.Infected women face additional risk of becominginfertile or producing low birth weight babies. Fearof being abandoned prevents them from seekingearly treatment.
Women have special needs for protein, iron, fat,carbohydrates, vitamins and minerals. Without suf-ficient nutrition their growth in adolescence isstunted, and thus leads to poorly developed bonesand muscles. The body weight and height too arelow. Malnutrition, added to the hard and strenuousphysical work, drains their energy. It also results infoetal wastage and low birth weight babies when theyattain motherhood. Anaemia due to iron deficiency
impairs functional efficiency, immuno-competenceand learning ability. It contributes to maternal mor-bidity and mortality.
The National Family Health Survey (NFHS-2)collected data on various types of food intake fromever-married women in terms of how often theyconsume various types of food (daily, weekly, occa-sionally or never). Women who live in towns, areeducated, have a good income generally eat good,nutritious food, have greater awareness, higher pur-chasing power and better supply of various types offruits and vegetables.
Height-weight data (NFHS-2 Table 7.5, p. 246)sum up nutritional status. The mean height forever-married women in India is 151.2 cm. It variedbetween 150 and 155 cm between different states,the mean height for women in Maharashtra being151.4 cm, which is slightly higher than the nationalaverage. Thirteen per cent of women in India arevery short—less than 145 cm in height—but inMaharashtra 12 per cent of women are very short.
The Body Mass Index (BMI) assesses both thin-ness and obesity. The mean BMI for women in Indiais 20.3, for Maharashtra it is 20.2. BMI of less than
Box 7.6Helping Victims of Violence
A large number of NGOs are working on women’sissues in Maharashtra. Included amongst these areorganisations that help victims of violence.
These organisations are distinguished by thevariety of strategies they follow ranging from infor-mation dissemination on health, child care, literacyetc., building awareness through street plays, coun-selling, legal aid, training in self-defence, mobilisa-tion of savings of the community, mobilisation ofloans from governments and other sources, voca-tional training and establishment of work centresto provide economic independence to the victims.
One interesting and innovative strategy adoptedby one organisation is described in a TISS study:
‘Another noteworthy initiative targeted a villagethat was given a new ‘name’ because of its notoriousrecord of dowry deaths.’
‘In village “Patan” in Dhule district the Samaj-wadi Mahila Sanghatana organized a mass meetingof ten gram panchayats, which after deliberationsdecided to change its name to “Soon Mare” literallymeaning in Marathi “the village which kills itsdaughters-in-law”.’
‘The village became the butt of much publicridicule. Accompanied by a massive propaganda,parents of young girls in neighbouring villages werepersuaded not to give their daughters in marriageto families in Soon Mare. This public boycott hadsuch a significant impact that even to this date,
Extracted from: Nishi Mitra (2000), Domestic Violence as a Public Issue—A Review of Responses, Unit for Women’s Studies, TataInstitute of Social Studies, Mumbai.
Gender Issues 113

18.5 indicates chronic energy deficiency. There are40 per cent of women in Maharashtra against 36per cent all-India who have a BMI below 18.5.These women are acutely starved.
The nutritional inputs for girls and women areinsufficient to meet their energy expenditure. Defi-ciency of iron, folic acid, Vitamin B12 and othernutrients lead to anaemia. Anaemia is a major causeof maternal and perinatal mortality and low birthweight of babies. Anaemia remains a serious prob-lem among pregnant women. Half of the women(49 per cent) in Maharashtra are anaemic. Thosewith mild, moderate and severe anaemia were 31.5per cent, 14.1 per cent and 2.9 per cent respectively.(NFHS-2).
Gender Bias in Child Nutrition
Three summary indices of nutritional status areweight for age, height for age and weight for height.The children suffering from chronic and acute un-der nutrition could be underweight, short, thin,wasted or stunted for their age. As high a figure as68 per cent children are underweight revealing themagnitude of the situation with regard to childhealth. The height-for-age index shows that 54 per
cent are stunted and weight-for-height index indi-cates that 24 per cent of children are wasted. Maha-rashtra is characterised by high levels of wastingamong children compared with the all India averageof 18.3 per cent. (NFHS-2)
The NFHS report does not give us State-wisepercentages for male and female children but pointsthat ‘overall girls and boys are about equally under-nourished, but girls are slightly more likely thanboys to be underweight and stunted, whereas boysare slightly more likely to be wasted’. How good thefood intake is for a child, depends on whether sheor he is first born or later as well as the birth intervalbetween two children. (NFHS-2)
The Nutritional status of children is stronglyrelated to maternal nutritional status and to thehousehold’s standard of living. Education of themother plays a significant role. Children of illiteratemothers are likely to be twice as under nourishedcompared to children of mothers who have com-pleted at least high school. Inadequate nutrition isa cause of serious anaemia prevalent among childrenin India (NFHS-2). Overall, nearly three quartersi.e., 74 per cent of these children between the age6 and 35 months have some level of anaemia. In
Box 7.7Child Marriage and Teen Pregnancy
In India, the legal age of marriage for girls is 18.But many girls are still married much before thatage and are engaged in hard manual labour andhousehold tasks as well.
A girl requires 4–5 years for physical growthafter she attains menarche. The data from theNational Nutrition Monitoring Bureau confirmthat between their 14th and 18th year, the girlsgain on an average 6–8 kg in their body weight and5 cm in their heights.
If girls are married soon after the onset ofmenarche and if their marriages are consummatedimmediately, it may lead to pregnancy. Such ado-lescent mothers have to compete for threefold nu-trient demands—the demand for repair andmaintenance of their own tissues, for foetal growthand development and for their own future growth.
The mean age at marriage for females in Maha-rashtra has shown improvement from 17.6 years in1971 to 19.7 in 1991 Census. According to NFHS-2in 1999, it rose from 19.7 to 19.8 years (AnnexureTable 99). Rural females marry at an age lower thanthe national average, but what is inexplicable is thatthis is also true for both sexes in urban areas.
According to the Reproductive and ChildHealth Survey, a sizeable number i.e., 30.9 per centof girls marry below the age of 18. Child marriageswere very high in some districts of Marathwada.The proportion of such marriages in total were63.7 per cent in Nanded, 59.4 per cent in Beed,58.1 per cent in Latur, 55.6 per cent in Jalna, and50.9 per cent in Aurangabad. At the other end ofthe spectrum, in Sindhudurg only 3.8 per cent ofthe girls marry before the age of 18.
114 Human Development Report Maharashtra 2002
Maharashtra, slightly more than three-quarters i.e.,76 per cent children were found anaemic. There isa strong positive relationship between the haemo-globin levels of mother and the prevalence of anae-mia among children. Diarrhoeal disease is alsoresponsible for nutritional loss among children.
Fertility Levels, Sex Selection and Family
Planning
The number of children born to a woman is usuallya matter of worry for population policy. It has adifferent bearing on women. What affects her healthand her work burden is determined by the numberof children, the spacing and ability to control birthsby less harmful means and the number of years shehas to bear the burden of child bearing. Mother-hood cuts into their time and mobility to engage inother pursuits like employment, participation insocial, cultural and political activities unless specialsupport services are given.
Earlier, it used to be said that women spendthree-fourths of their lives in pregnancy and lactationwhich no longer need be true since availability anduse of contraception is a major instrument of women’sliberation. The more schooling a woman has, thefewer the children she bears. Urban women andwomen in households with a high standard of livinghave fewer children than women in rural and lowerincome households (NFHS-2, Table 4.3 and 4.4).
There is a continued dominant preference for ason with 27 per cent of sampled women wantingmore sons than daughters while only a minusculetwo per cent wanting more daughters (NFHS-2,Table 4.25). At least one son was wanted by 84.5per cent while 79.3 per cent sought at least onedaughter. More than one son was the ideal for many.
There is considerable spread of knowledge onfamily planning with currently married women ofage 15–44 years knowing all five modern methodsof contraception—male and female sterilisation,IUD, pills and condom being 88.1 per cent inGreater Mumbai. This was followed by 84.5 percent in Thane, 80.8 per cent in Nagpur and 80.5
per cent in Akola. The number of couples practisingfamily planning by any method was observed to be68.6 per cent for Wardha and 68.1 per cent forSatara with a low of 47 per cent in Sindhudurg dueperhaps to migration of men. There are also cou-ples/women who desire contraception but have nothad access to it for whatever reason. These constitute19.6 per cent in the State, varying with 30.5 percent in Aurangabad and Nanded to 10 per cent inSatara district where levels of urbanisation and ruralinfrastructure have made a difference.
On the other hand, a surprising 41.5 per centof currently married women were not using anyfamily planning method in urban Maharashtra com-pared to 37.3 per cent in rural areas (NFHS-2, Table5.7). This gain of more than four per cent in ruralareas is not much to gloat over for rural women usemore terminal than spacing methods. Female ster-ilisation of 52 per cent outstripped male sterilisa-tion, which is about five per cent. Preference forfemale sterilisation persists in urban areas as well—an urban female sterilisation rate of 44 per cent to1.5 per cent for males underscoring male reluctanceto take responsibility for contraception. AnnexureTable 100 indicates that over a period of nearly twodecades the share of vasectomy has drastically comedown from 15.67 per cent in 1980–81 to just 0.27per cent in 1998–99. Terminal methods are not onlydrastic but also pose especially serious health hazardsfor women.
The number or years a woman endures child-bearing tasks is another indication of ‘child bearing’burden. Child bearing in India begins at a very earlyage and is spread over 10 years. The median age atfirst and the last birth in Kerala is 21.1 and 27.9while in Maharashtra, the median age at first birthis 18.8 years and 27.1 at last birth. Child bearingbegins earlier and ends earlier shortening the repro-ductive span to 8.4 years where as in Kerala the spanis 6.8 years, beginning late and ending at a higherage. Some 83 per cent women had not used anyother contraception before sterilisation (NFHS-2,p. 150). What all these figures stress is how gender-unequal is the burden of managing the size of thefamily, whether in decisions, methods, or the timing
Gender Issues 115

and their consequences. Disconcertingly, terminalmethods of family planning take place at very lowages that are below 25 years in Maharashtra.
Maternal Care
Maternity management involves proper care duringpregnancy and providing safe conditions for deliveryand post-birth follow-up to ensure that the mentaland physical health of the women as well as the babyis normal. Weak women produce weak babies whoin turn become weak mothers. According to theRapid Household Survey under the Reproductiveand Child Health Project of the Indian Institute ofPopulation Sciences (Annexure Table 101), ante-natal care during pregnancy covers 87.8 per centwomen in Maharashtra. Sindhudurg does betterwith 100 per cent performance while the lowest at64.4 per cent is in Nashik. But at the level ofcomplete and full antenatal care availability, therecord is not so favourable. Only 54.8 per cent ofwomen received at least one anti-tetanus injectionand iron-foliate tablet in all-Maharashtra, with 81.8per cent in Greater Mumbai, which is the highest,and 31.5 per cent in Nashik, which is the lowest.Although all pregnant women in Sindhudurg re-ceive some antenatal care, not all receive full care.Greater Mumbai does better as it has better healthinfrastructure.
Institutional delivery has reduced maternal mor-tality. Institutional deliveries are resorted to by, 93.2
per cent of pregnant women in Greater Mumbai,76.7 per cent in Sindhudurg, 75 per cent in Pune,73.7 per cent in Kolhapur and 71.2 per cent inThane. The State average drops to 57.1 per centbecause other districts have not achieved much inthis area. At the other extreme, only 16.5 per centchildren have hospital births and 20.5 per cent ofthe safe deliveries in Gadchiroli, a tribal district.Overall, only 61.2 per cent of the women in theMaharashtra have safe deliveries, attended by a doc-tor/nurse/auxiliary nurse-midwife (ANM). GreaterMumbai with 94.1 per cent safe delivery tops alldistricts. Some other districts with good perform-ance are Sindhudurg (81.2 per cent), Kolhapur(79.4 per cent), Pune (77.7 per cent), Thane (73.3per cent) and Sangli (72.4 per cent).
Sexually Transmitted Infections
About one-fourth of women in Maharashtra hadsome symptoms of RTI/STI. The highest numberof such cases were reported in Akola (43.5 per cent).
Awareness and knowledge regarding sexuallytransmitted diseases is essential for sexual and repro-ductive health for men and women, the level ofawareness depending on how frequently rural healthfunctionaries visit rural women. On an average, 62per cent of women across Maharashtra reported hav-ing knowledge of HIV/AIDS, the highest (94 percent) being in Greater Mumbai. Awareness dependson how frequently rural health functionaries visit
Table 7.2
Number of Women Engaged in Household Duties
Division
Sex Ratio: Females per 1000 MalesRural Urban
CultivatorsAgricultural
WorkersHouseholdIndustry
OtherWorkers Cultivators
AgriculturalWorkers
HouseholdIndustry
OtherWorkers
1 Konkan 1186 1338 821 314 517 876 892 1552 West Maharashtra 845 1434 945 330 411 1106 1583 2023 Khandesh 715 1310 855 229 400 976 842 1494 Marathwada 751 1325 886 256 242 910 1276 1465 Vidarbha 581 1153 541 247 195 799 770 1566 East Maharashtra 725 1463 1472 271 628 1309 1409 1777 Greater Mumbai Nil Nil Nil Nil 251 453 515 190
Maharashtra 789 1311 928 289 346 928 945 175
Source: Census of India, 2001, Maharashtra, Directorate of Census Operations, Mumbai.
116 Human Development Report Maharashtra 2002

rural women. Families in Gadchiroli were better at-tended in the sense that ANMs’ visits cover 80 percent women. At the other extreme is Aurangabadwhere only 16 per cent rural women reported suchvisits.
Women’s Access to Resources
Work, being central to human life, confers prestigeand social identity, stimulates social interaction,develops skills and contributes to national income.It is a well-known fact that all women work andthat most of the work done by them is undervaluedboth by custom and perception. Although domesticwork is part of the process of raising a family, it isoften arduous (like fetching water), has a demand-ing element (such as childcare), is time-consumingand expenditure saving (like food processing andgardening). Yet, it is considered ‘natural’ or of littleeconomic value even though it has well-definedopportunity costs.
Even specific contributions to economic pro-duction within the family are invisible since theyare not paid for in cash or kind (Table 7.3). Evenpaid work is imperceptible because it is unregulatedand takes place within the house. Because of theseconceptual and measurement difficulties, our datasystems routinely fail to record fully the economiccontribution of women’s work. Work ParticipationRates (WPRs) merely measure participation ofwomen in paid work but WPRs are neverthelessimportant as they indicate the extent of women’scontrol over resources as well as their entitlementsto assets and credit.
Table 7.3
Proportion of Women Engaged in DomesticWork in Maharashtra: 1999–2000
Area % Women Engaged in Domestic WorkRural 30.64Urban 46.50Person 36.88Source: NSS 55th Round, 1999–2000, Quick Tabulation.
The issue of recording female-headed householdsis examined in Box 7.8.
Womens Work in Rural Maharashtra
Agriculture, as elsewhere in the country, is the biggestemployer of women in Maharashtra. By Census 2001estimates, of the 12.7 million women working inrural areas of the State, 89 per cent are employed inagriculture, 41 per cent as cultivators and 48 per centas agricultural labour. A small percentage also worksin household industry and in other non-farm occu-pations. More women than men work as farm work-ers for wage—1,311 per every 1,000 males—and 789women for every 1,000 males are cultivators them-selves (Annexure Table 10). This significantly altersthe popular image of ‘the farmer as a man’. Also,Census data reveal a higher increase in the proportionof women cultivators than of men implying that moremen are moving out of agriculture and a process offeminisation of agriculture is under way. The overallpattern of the predominance of women in agricul-tural labour is reflected in four agro-climatic regionsof the State. Only Konkan has a predominance ofwomen cultivators over men because more men havemigrated out and Eastern Maharashtra has morewomen than men working in household enterprises.
Box 7.8Female Headed Households
Official data records headship of the householdsin terms of who is declared so by the household.This creates a severe anomaly between actualeconomic contribution and the head as recog-nised by the household. The official figures of female headed house -holds therefore are not necessarily the same ashouseholds economically totally or for the majorpart, supported by females, due to absence ofearning males or unemployment of males. Thisfigure is estimated by field studies as close to 30per cent. This caution needs to be kept in mind whileinterpreting the data on female-headed house-holds: among the estimated rural households of10,778,100 in the State, some 9,28,200 are female-headed which, is 8.6 per cent of the total. In urbanareas, among a total of 73,83,800 households49,01,00 are headed by women, constituting 6.6per cent of the total. (NSS, 55th Round, 1999–2000).
Gender Issues 117

In places where there is heavy male out-migra-tion such as Ratnagiri, Sindhudurg and Raigad,women shoulder the entire burden of agriculturaloperations. What is worrying is the larger increasein the proportion of agricultural workers as com-pared to cultivators in the female population overthe 1990s, marking a relative lack of growth in theireconomic status. There is also some indirect evi-dence that women have diversified into activitiesallied to agriculture during the same period, anexample being the dairy sector. Cow and buffalomilk production in rural Maharashtra has increasedsubstantially along with an increase in the partici-pation of households in this activity.
Time allocation studies in the Warana Milk Co-operative show that women spend four to eight timesthe time spent by men in tasks such as collection offodder, cleaning and feeding of animals, milking andpreparation of dung cakes. Thus, though official datagenerally categorise dairy as an activity involvingparticipation of households, it is the women who domost of the work. From 1970 to the late 1980s,horticulture, dairy and poultry received a boost, withthe government pro-actively enabling ownership ofmilch cattle, setting up of insemination centres, etc.Consequently, milk production emerged as an im-portant allied activity so much so it has even becomethe main source of income for some families. Whilewomen did most of dairy work, men did the mar-keting. The growth of horticulture too has beensignificant but gender-wise data on employment inthis sector is not available. Women in rural areas arealso shifting to the non-farm sector but, unlike in thecase of men, this is taking place mostly in traditional,home-based industries.
Quality of Women’s Work in Agriculture
Census as well as NSS data throw light on the natureand quality of women’s work: a larger proportion ofwomen than men participate in subsidiary and mar-ginal work. Moreover, more than half of the em-ployed women work as casual labour with no morethan 1.5 per cent working on a regular basis. Thereis, in fact, greater shift towards casual work bywomen in the State than in the country as a whole.
Taken together, these factors explain why employ-ment of women fluctuates between peak and leanseasons and why weekly and daily rates of unem-ployment amongst women are much higher thantheir usual status (Annexure Table 102). Thus,women in rural Maharashtra rely on impermanentand insecure employment and are therefore, in andout of the labour market in consonance withchanges in agricultural activity. It is natural thatunder such conditions of employment, the illiteraterather than the educated enter the labour market inlargest numbers (Annexure Table 80). Entitlementsdepend on endowments—of education, skills, andassets such as land ownership and freedom formobility. Given that these are low for women, theiropportunity to build capabilities in minimal.
Women’s Work in Urban Maharashtra
The distinctive feature of women’s participation inthe urban sector is the low rate of participation: onlyaround 13 per cent of the female population are inthe work force. A large rural-urban gap has alwaysexisted and is partly a reflection of the very differentconditions faced by women in the two labour mar-kets. The agricultural context allows the combinationof home management with outside work, requiresrelatively low skill levels, on-job training is easy andtherefore more women are able to participate in therural sector. In contrast, urban markets demandgreater skill levels, given the organised nature of workand literacy requirements and on-job training, whichmay not match women’s endowments. Distance be-tween the home and the workplace create problemsof time and money and are also incompatible withchildcare requirements. Only 9.2 per cent (AnnexureTable 104) are engaged in urban household industry.This, however, may not be an accurate picture sincemost field studies indicate that some women aredoing home-based work.
As regards the educational attainments womenin the urban labour market, there is bipolar distri-bution: those at the lowest level, that is illiterate andthose at the highest level, with higher educationparticipate in larger numbers in the urban labourmarket.
118 Human Development Report Maharashtra 2002

Quality of Women’s Work in the Urban Sector
The largest number of women in the urban sectoris self-employed (45.3 per cent) and comprisemainly domestic workers, hawkers and ragpickers.Next in magnitude is the category of regular em-ployees (33.3 per cent). Only a relatively smallpercentage, i.e., 21.4 per cent is engaged in casuallabour. The clubbing of principal and subsidiaryworkers makes it difficult to get a correct estimate.
Non-farm Occupational Pattern
In rural Maharashtra, women in the non-farm sectorare concentrated in manufacture, trade and ho-tel/restaurant and public administration/educa-tion/commercial service etc. as per the 55th NSSround. Of these a very small fraction i.e., less thanone per cent, are in occupations requiring high levelsof skill, education and training such as professionaland technical workers, scientists, medical profes-sionals and administrative, executive and managerialcadres. The situation is better in the urban jobmarket.
As per the NSS 55th round, the bulk of theurban women in the non-farm sector are concen-trated in (i) public administration, education, com-mercial services, (ii) in the hotel industry and (iii)in manufacturing units, the largest percentage i.e.,36.9 per cent employed in the first mentioneddivision. This is corroborated by data from theFourth Economic Census (1998) also support thatconclusion (Annexure Table 108). There is a con-centration of women in gender-stereotyped jobs.This implies less scope for enhancing entitlements.The silver lining is that various levels of governmentand quasi-government bodies have been hospitableto women. There has been an increasing trend inemployment at various levels in spite of a declinesince 1996 in total employment. More than 16 percent of government employees in 2000 werewomen. Of these, Local Government employedaround 49 per cent, the rest almost equally dividedbetween the State and Central Governments. Quasi-government organisations of both the Centre andState, employ 22 per cent. No data is however
available on women’s employment at various levelsof government hierarchy.
Monetary Rewards
Customary notions about skill levels influence wagedifferences by gender. Even when women do thesame work, the Equal Pay for Equal Work Act isoften not implemented. NSSO data supports thisview, especially in the agricultural sector, whereidentical work/activity by women fetches only 60–75 per cent of the male wage. A woman engaged incasual labour in public works earns on an average,Rs 26.85 per day, while one engaged in other worksearns Rs 25.28 compared to the man who makesRs 49.38 and Rs 38.06 respectively Wage disparitiesare wider in the urban market where a woman ispaid Rs 29.18 compared to the man who earnsRs 61.70 per day. These rates are also found to beless than the corresponding national averages.
Women’s Literacy and Schooling
For improving skills, the bare minimum is literacy.The relationship between educational attainmentsand awareness of hygiene, improvement in familyhealth, child health, girls’ education and generalfamily welfare is well established. Formal educationdelays marriage, kindles a desire for a small family,increases the chances of survival of children and hasthus a positive effect on fertility reduction. It in-creases a woman’s earning capacity and the potentialfor her empowerment. It is one of the most impor-tant tools of expanding social opportunity.
Maharashtra’s literacy rates are well above thenational average, ranking tenth among the majorStates and Union Territories with an overall literacyrate of 77.27 per cent compared to the nationalaverage of only 65.38 per cent. It is eighth amongIndia’s twenty-eight States in terms of its male liter-acy rate (86.27 per cent) but eleventh in terms offemale literacy rate, which is 67.51 per cent. Thecomparable national averages are 75.85 per cent and54.16 per cent respectively. This level of femaleliteracy have been achieved mainly through theTotal Literacy Campaign and an active public policy
Gender Issues 119

aimed at attracting girls into the system of formaleducation.
Literacy campaigns were first initiated in Maha-rashtra in the districts of Sindhudurg and Wardhain 1990. By March 2001, it extended to all 35districts, of which 32 completed the three primers.Women have been more enthusiastic than men. Ofthe targeted 6.41 million adults, 5.27 million wereenrolled of whom 4.87 million completed the pro-gramme. The post literacy programme has beencompleted in eleven districts and is underway ineleven others.
Formal education is free for girls up to the 12thStandard and for boys, up to the 10th so thateducation is truly universalised at the primaryschool level, particularly for girls. The target now isto have a primary school within 1.5 kilometres of ahabitation of at least 200 people. The norm fortribal areas is only half a kilometre and a minimumof 15 students. Girls studying in standards V to Xin rural areas are provided free travel on State-runbuses to attend secondary schools outside theirvillages. English is now a subject in all non-Englishmedium schools, with a view to helping studentscompete better at the national and internationallevels. In spite of such informed policies, there aretoday around 19 million non-literates in the Statewhich of course includes the elderly. Of this, 13million are women (Annexure Table 93).
District-wise, only 13 of the 35 have femaleliteracy rates higher than the State average. Thesefall into the Konkan, Western Maharashtra andVidarbha regions. Of these, Greater Mumbai, Nag-pur, Amravati, Thane, Akola, Pune and Sindhudurghave achieved literacy rates of more than 70 percent. The difference between male and female liter-acy levels has narrowed but the decadal rate ofgrowth of female literacy in these districts has de-clined. Special strategies are now needed for remov-ing residual illiteracy. This residual categorycomprises women from very poor or householdsheaded by women, who eke out a living in theinformal sector, their daughters who need to sup-plement the family income and/or support their
mothers in managing the home chores and siblings.It includes women from the scheduled or backwardcastes and itinerant tribes.
Twenty-two districts of Khandesh, Marathwadaand East Maharashtra regions have literacy ratesbelow the State average. Of these, Osmanabad,Beed, Nanded, Parbhani, Hingoli, Gadchiroli, Jalnaand Nandurbar have female literacy of less than 60
0 5 10 15 20 25 30
Mumbai
Mumbai Suburban
Thane
Raigad
Nagpur
Pune
Kolhapur
Nashik
Sangli
Sindhudurg
Aurangabad
Chandrapur
Washim
Solapur
Amravati
Gadchiroli
Wardha
Jalgaon
Nandurbar
Akola
Satara
Beed
Ahmednagar
Bhandara
Gondia
Ratnagiri
Parbhani
Buldana
Latur
Yavatmal
Nanded
Osmanabad
Hingoli
Jalna
Dhule
% Gap
Districts
Figure 7.2
District-wise Gaps in Male/Female (M–F %)Literacy Rate, Maharashtra 2001
120 Human Development Report Maharashtra 2002

per cent but show relatively high rates of growth infemale literacy in the last decade. If the momentumis sustained, these districts should be able to bridgethe large gaps that exist at present between male andfemale literacy rates. Nandurbar has the lowest rateof female literacy at 45.55 per cent (Annexure Table93, Figure 7.2).
The inter-regional differences in literacy can, toan extent, be explained by historical factors. Horti-cultural development in Konkan, the social reformmovements in Western Maharashtra and early de-velopment of a market economy in Vidarbha facili-tated the transition of these regions from castedominated, subsistence agricultural economies todeveloped market economies, paving the way forthe spread of literacy. In contrast the still prevalentfeudal structure of Khandesh, Marathwada andEastern Maharashtra has inhibited the spread ofliteracy. Tribal belts have been poor performers.
Schooling
Maharashtra catalogues 66,050 primary, 14,748secondary and 3,614 higher secondary schools in2001, of which, 1980 (3 per cent) primary, 850 (5.8per cent) secondary and 235 (6.5 per cent) highersecondary schools are exclusively for girls. For highereducation there are eight universities offering bothprofessional and non-professional courses with theircolleges dispersed all over the State. In addition,there is the SNDT University, India’s first andMaharashtra’s only women’s university establishedin 1906 by Maharishi Karve.
For the majority of males and females in the State,primary school is the end of schooling. In urban areas,an equal proportion of men and women manage toreach middle school education. Of the total enrol-ment of 12.32 million in primary, 7.78 million insecondary and 1.34 million in higher secondaryschools in 2000–2001, girls constituted 49 per cent,45 per cent and 42 per cent respectively. The dropoutrates in Maharashtra for 1999–2000 were 17 per centat the primary stage, 40 per cent at the middle schoollevel and 52 per cent at the secondary school levelfor boys but higher at 18 per cent, 42 per cent and
59 per cent respectively for girls. This means that outof every 100 boys and 100 girls enrolled in 1990–91in class I, only 48 boys and 41 girls completedstandard X in 1999–2000.
Inability to continue in education has been, forlong, a major difficulty for children especially forgirls in spite of policy measures designed to encour-age girls’ education. Though these measures havesucceeded in increasing enrolment of girls, it couldnot retain them in the system for the requirednumber of years. The reasons for this are diverse:social and economic returns from education of girlsis not perceived to be high because the traditionalmindset defines women’s role only in terms of bear-ing and rearing of children and housekeeping. Evenif so perceived, there is reluctance to invest in girlsbecause the benefits are expected to accrue to themarital family of the girl. Sons on the other handwill presumably earn and support parents. In addi-tion, non-availability of schools in many villages orabsence of adequate transport facilities are otherinhibiting factors as also practical difficulties suchas the lack of synchronisation of bus timings withschool hours. Fear and anxiety for the safety of theirgirls prevent parents from sending them to schoolsoutside their village. Not only the monetary costs,part of which the State endeavours to meet but alsotime spent on girls’ schooling is seen as better spenton the family. The private economic and social costsof maintaining the girl child in school appear tothem to be far too large to be compensated by thesubsidies paid by the State.
Boys and Girls in Schools
On an average, only 64.5 girls appeared for theStandard X examination for every 100 boys in 1999but girls do better; five per cent more girls than boyspassed the examination. Girls excel boys at the HigherSecondary Examination too (Annexure Table 105).
Yet, girls do not get a chance to fulfil this prom-ising start. More girls dropout before completion ofa course right up to higher education, professionaland non-professional. This in turn results in thefuture segregation of women in the job market.
Gender Issues 121

Women students gravitate towards certain areasof study like humanities, home science, nursing,music and dancing, oriental studies and in the areaof medicine, homeopathy, dentistry and Unani.These ‘soft’ options limit employment openings forthem in better paying areas. Men dominate the areasof fine arts, social work and library science, tradi-tionally perceived to be the domain of women.
Development to Empowerment
For 87.5 per cent women in Maharashtra, the onlydomain where the woman’s writ runs is kitchen.Nearly half of the women cannot seek healthcarefor themselves or purchase jewellery or other majorhousehold items. Half or more could not visit orstay with their parents or siblings, go to the marketor visit friends without permission from their familymembers. For 35.8 per cent women, husbands andother senior members of the family control theirearned incomes. In comparison with other States,Maharashtra has a mixed record on women’s auton-omy It is in the middle range with respect to all theindicators. (NFHS-21)
In Politics
Women in Maharashtra have taken political posi-tions as is reflected in this song of the tribal womenwho were members of the Sharmik Sanghatana inDhule district: Let’s enter politics, continue our struggles And take leadership. Can’t put up with oppression anymore, O Venubai, why do you remain repressed? Come out and join our rally.
In the early 1970s, women demanded protectionagainst unemployment through schemes like the Em-ployment Guarantee Scheme. They also sought landrights for women. To them, politics was a collectiveendeavour for social transformation against all op-pression, exploitation, injustice and degradation.
Women in Maharashtra have a collective politi-cal past. Various mass movements, including the
freedom movement and later, various protests, haveseen them play a major role. Their involvement inpeasant and ecological movements has been strong.Tens of thousands of them were caught up in theanti-price rise protests of 1972 and their participa-tion was keen in the Chandwad Conference in 1986where women demanded that economic and socialissues that concerned or troubled them be redressed.Stree Mukti Andolan Sampark Samiti, (a joint forumof several women’s groups, acted as an effectivepressure group).
Despite this strong involvement, women are notyet fully integrated into the formal political struc-ture. They have two roles here: as voters and candi-dates. As voters, there are fewer women than menvoters. There has been a decline in the gender gapthough it continues to persist. Currently, the gendergap is 5.32 per cent though it is higher in (parlia-mentary) constituencies such as Rajapur (11.19 percent), Parbhani (10.99 per cent), Amaravati (10.34per cent), Akola (10.08 per cent) and Washim (9.96per cent). As voters, their turnout at the pollingbooths has been growing, not so much because oftheir own political consciousness but because ofmass mobilisation of women by political parties.Nevertheless, as candidates who made it to thepolitical destination, they have fared rather poorly.In the 1999 Lok Sabha elections, only four werereturned from out of 48 constituencies.
Neither is the story concerning the MaharashtraState Assembly a happier one. The highest particip-ation was in earlier times, when in 1957–62, 12.87per cent of the MLAs were women. Moreover, thepost 1990s trend does not show any improvementin women’s share despite improvement in femaleliteracy. The women in the Legislative Council—Maharashtra has a bicameral system—accounted for13.88 per cent of total members during 1952–58.It is worth noting that the percentage of women inthe Legislative Council is now at an all time high(20.5 per cent) since 1937.
The low representation of women, is attributedby studies to special difficulties women face sincethey do not have independent access to finance and
122 Human Development Report Maharashtra 2002

other resources to fight elections. They are also seenas being reluctant to enter mainstream politics be-cause of criminalisation of politics and even fear ofcharacter assassination. This leads to the conclusionthat the poor presence now in the electoral politicalarena as caused by the poor status of women insociety; an all round empowerment of women is aprerequisite for their political participation. TheWomen’s Reservation Bill, on the other hand, is nowvirtually in cold storage (Annexure Table 106).
In Panchayat Raj Institutions
Panchayati Raj, introduced in 1962 has seen womenbeing nominated in the 1970s, not elected to posi-tions in gram panchayats and zilla parishads. Soonit was realised that they did not have the same statusas those elected, though the nominated belonged tofamilies of influential politicians. Two committees,one the Balwant Rai Mehta Committee and theother, headed by Ashok Mehta looked at thewomen’s place in these bodies and the recommen-dation was that each gram panchayat should haveat least two elected members.
The Government of Maharashtra earmarked 30per cent of all seats for women in each local gov-ernment body in 1990 after which, women politi-cians expected that reservation would encouragemore women to enter formal, mainstream politics.
Several women without party affiliations contestedthe elections as independent candidates, which wereheld at different places between late 1991 and early1992. These included women from trade unionsand women’s groups as well as social workers andprofessional women. No doubt, a substantial num-ber of women who contested these elections be-longed to the families of politicians, at least a fewof them holding them for their husbands, fathers,sons, or even in-laws.
The advantages of reservations for women inPanchayati Raj institutions were however negatedby strong patriarchal structures still prevalent in thecommunities that do not tolerate women’s presencein public spaces. Where elected women are awareof their rights and duties, have information aboutgovernment schemes and village development pro-grammes and receive support from the community,specifically men folk, their presence has influencedthe socio-economic scenario of the village. Simplethings like learning to sit in a chair, or sign theirnames create confidence. Exposure to public spacesand physical mobility are empowering and carrygreat potential for transformation.
The Constitutional (73rd Amendment) Act in1993 reserved at least a third of the seats for womenin the local bodies. As on 1 April, 2001, total numberof women in different municipal corporations was
Box 7.9Rule by Proxy
In Maharashtra, whether it is in gram panchayats,samitis, zilla parishads, there is a practice, though notuniversal, at least in visible number of cases ofwomen contesting elections, to get elected to seatsjust to hold the seat for a male member of the family.Often, the male is a husband, father, father-in-lawor brother-in-law and rarely, a son. Almost invari-ably, the effort is to retain the reigns within thefamily. It is not uncommon for a woman to just signaway her authority to the upa-sarpanch, even if sheis an elected sarpanch to fill a reserved slot becausethe powerful males dictate the terms. This practiceis seen in a pronounced manner in municipal coun-cils and samitis, where the practice of a male func-
tioning as a proxy to the woman who has her legiti-mate rights curtailed.
Which means a woman gets her right by law butis encroached upon by a convention which only usesher as a proxy for the male in a male dominatedsociety. They constitute a pair, the man wielding theauthority and the women providing the formality. Insome towns, it is not uncommon for a separate chairbeing assigned to the male in the office from wherehe ‘functions’.
But, as more and more women emerge in theirown right to fill these places, a trend that is begin-ning to strengthen, such rule by proxy would dimin-ish and disappear. Until then . . .
Gender Issues 123

484 (33.1 per cent). Greater Mumbai and Pune eachhad the highest number of women elected to it (34.1per cent) and Sangli had the lowest proportion ofwomen members at 30.1 per cent. Only three mu-nicipal corporations had women as mayors: Thane,Nashik and Nagpur. The number of standing com-mittees varied from district to district with Thane at29 topping the list. In Greater Mumbai’s 10 standingcommittees, half had women chairpersons. Kolhapurhad 40 per cent and Sangli, 37.5 per cent headed bywomen. They were least in Nagpur, which of courseboasted a woman mayor. In all 22 per cent of chair-persons of these committees were women (AnnexureTable 94).
In municipal corporations, including in GreaterMumbai’s civic body the total reserved seats are nowpegged at 539 for women and without exception,they have held these seats. The number of suchmunicipal corporations is on the increase, with somenew towns upgraded from a council to a corporationperiodically when a town’s population crosses3,00,000.
The number of women in municipal councilswhich manage civic affairs in towns with popula-tions of less than 3,00,000 was generally lower thanin municipal corporations (30 per cent) but thereare district variations. The lowest was in Nanded at5.2 per cent and the highest being in Solapur with36.8 per cent. Just 4.2 per cent of the civic councilpresidents were women; women chaired 26.2 percent of all standing committees. In Parbhani Mu-nicipal Council, women headed 50 per cent of thestanding committees.
The 223 municipal councils in Maharashtra havebetween them, 1,727 seats reserved for women andin two nagar panchayats, 12 are similarly set aside.
Women constitute 33 per cent of zilla parishadmembers. Only 9 women i.e., 1.5 per cent occupieda president’s position at the zilla parishad level. Seenin percentages, women at the helm of standingcommittees at the district level was more or less thesame as at the Municipal Corporation level, at 18.2per cent (Annexure Table 94).
At the Panchayati Samiti or block level, womenconstituted 32.7 per cent of the total members butonly 9.6 per cent were chairpersons. There were27,596 gram panchayats in the State and womenaccounted for 29.2 per cent of the total membershipwhich is four per cent lower than 33 per centreserved by law. Women elected as sarpanches ofthese gram panchayats was 29.4 per cent (AnnexureTable 94).
All Women Panchayats
The first all-women panchayat in Maharashtra wasformed in 1962 at Nimbut village in the sugar beltof Pune district. Another such all-women Panchayatwas formed in 1984 in Mauje Rui village of thesame district (Pune). During 1983, a panel of 13women contested gram panchayat elections in vil-lages like Indoli and Palshi in Satara district. Theychallenged the culture of male domination in poli-tics by employing innovative methods such as hold-ing street corner meetings to expose corruptpoliticians. Though women could not win, they
Box 7.10‘Our Vote . . . ’
On the 10th of March 2000, more than 1,200 ruralwomen from different villages assembled on theoccasion of the death anniversary of KrantijyotiSavitribai Phule at Sayagata village of Chandrapurdistrict. They announced ‘Mahila Rajsatta Andolanby chanting slogans—“Our Vote Our Govern-ance”.’ These women were either members of their
gram panchayats, small savings groups or mahilamandals. As a result of the Mahila Rajsatta Ando-lan, 145 institutions and organisations are workingtogether in 30 districts, 129 taluks and 841 villagesin Maharashtra. Their objective is to encouragewomen’s participation in gram sabha andpanchayats.
Source: Nilambari Gokhale, Resource and Support Centre for Development, Belapur, Navi Mumbai.
124 Human Development Report Maharashtra 2002

showed that women are capable of working in thepolitical sphere if they are organised.
In the 1989 elections, eight women’s Panchayatscame to power because of the Shetkari Sanghatana’sinitiatives, with its call to rural women to enterpolitics. These villages are: Salod and Erangaon inAmaravati district, Yenora in Wardha, Metikheda inYavatmal, Vitner in Jalgaon, Nimbgaon Bhogi inPune, Ralegaon Siddhi in Ahmadnagar and Bitar-gaon in Solapur district. In 1992, two more women’sPanchayats—Bhende Khurd in Ahmadnagar andBrahmanghar in Pune district—came to power.These are good beginnings (Annexure Table 107).
In Co-operatives SHGs and DWCRA
Programmes
The co-operative movement in Maharashtra is wellestablished with a total membership of 32,660,983as on 1 April 2001, women constituting 11.60 percent, but they are not in decision-making positionsin these organisations. Very few women—actually0.09 per cent were chairpersons of these institutions.
Mahila Arthik Vikas Mahamandal Limited(MAVIM) was established in 1975, its purposebeing dispersal of credit and information to poorrural women through formation of Self-HelpGroups (SHGs). At present, they are concentratedin 12 districts of Maharashtra. The total number ofSHGs organised in the State by March 2001 was4,488. Majority of these groups 3,828 (85.29) percent were organised by MAVIM and local NGOsformed the rest. About one-fourth of these SHGsin Pune, Nanded and Chandrapur were organisedby NGOs. Except MAVIM no other NGO hadorganised any microcredit groups in tribal belt ofDhule and Gadchiroli.
SHGs primarily inculcate thrift and savingsamong groups of 15–20 reinforced by the rewardof collective credit without requiring pledging ofany property, interest being easy for those in aprecarious economic status. The collective respon-sibility enforces discipline and the pride of havingmade a contribution adds to their self-worth, the
fact that they leave their hearth to attend meetings.These have emerged as community based organisa-tions helping members maximise the use of internalas well as external resources. They have, being smalland self-directed proved that enhanced income andproductive use of credit is possible.
The total membership of women in SHGs inMaharashtra is 69,168. These groups have distrib-uted loans worth Rs 145,470,543 through the in-ternal lending process to its members. Half of thesegroups are linked with banks and received bankloans worth Rs 65,491,117 till end of fiscal 2001.
During 1995–96, 2,175 DWCRA groups wereformed with 27,333 women as members. Of these,14,831 received financial help from the government.Within a span of three years from 1996, their numbermore than doubled to 4,490 with the membershiprising to 49,474 women. In all, 37,774 i.e., 76.3 percent of the members getting this financial assistance.To what extent micro credit really lifts women out oftheir low income trap is debatable in the absence ofother supports like marketing, training etc.
A number of professional women’s organisationssuch as Women Lawyers’ Collective, Women Execu-tives, Women Board of Directors, Women in Bank-ing, Women Entrepreneurs, etc. are mutual supportgroups. They also work for redress of women’sproblems in their specific professions. Among them,Annapurna Mahila Mandal set up in 1975 is aunique organisation that began by organising homebased ‘Khanawalis’ (meal providers) catering to theindustrial labourers in Mumbai. It has since ex-tended its activities to other self-employed womenin many other districts of Maharashtra and has amembership of over one lakh women and expand-ing. It provides training for self-employment andloans for entrepreneurship development linked withsavings and old age security of women.
Status of Women
The position of women appears to be contingenton the general development of a region as well ason the particular socio-cultural characteristics of
Gender Issues 125

Highlights: Gains and Gaps in Women’s Development in Maharashtra—2001
Gains Gaps 1. Life Expectancy at Birth (LEB)
LEB high for women: 63 years. The benefits of high LEB accrue only to those womenwho survive high mortality rates in the early years oflife.
2. Sex RatioOverall Sex Ratio (OSR) higher than national average(933) in 25 districts (out of 35) Child Sex Ratio (CSR)higher than national average (927) in fifty per cent ofthe districts. Konkan and East Maharashtra have CSRhigher than the national average.
OSR of the State lower than the national average.Sharpest decline in the last decade. CSR for the State lower than the national average.Greater Mumbai, all districts of Western Maharashtraand most districts of Marathwada have CSR lower than927.
3. Infant Mortality Rate (IMR)IMR in the State lower than the national average(67.6).
IMR still high at 43.7 compared to the target of 30fixed by the Population Policy, 2001. Age specificdeath rate for female children aged 1–4 years is high.
4. Maternal Mortality RateMMR in the State lower than the national average. MMR is still high at one maternal death for 297 live
births. 5. (ASDR Age-Specific Death Rate)
Female ASDR higher than male between 25 and 69years.
Female ASDR higher than male between 15 and 24years. Reduction in female ASDR only after they crossthe reproductive years.
6. Older WomenThere are schemes like Sanjay Gandhi Niradhar Yojanafor old women.
The proportion of older women in the State isincreasing. Of 8.8 million widowed, separated anddivorced women in the State, 52 per cent are abovethe age of 60. Morbidity and dependence of thesewomen is high. The amount and coverage of old agepension is very low.
7. ViolenceGender sensitisation of police personnel is beingundertaken. More women police are being recruited.Better reporting and improved registration of crimesagainst women.
All types of crime against women on the increase.Negative attitudes against women increasing. Tortureis the most prevalent. Torture constituted 55.27 percent of all crimes in the State. Convictions for crimeagainst women are negligible.
8. General Health of Women and ChildrenApart from Government infrastructure, many NGOsare working on health issues. There is a strong people’smovement too.
42 per cent of women in the State have Body MassIndex of less than 18.5. Anaemia is widespread—49per cent of women and 76 per cent of the children areaffected.
9. ImmunisationGood progress in coverage, 80 per cent of children inthe State have received all vaccines.
Regional disparities persist. Gender segregated data notavailable.
10. Age At Marriage (AAM)Improvement in Mean AAM. Percentage of women getting married below the legal
age at marriage (18 years) is 39.9 per cent for the State.This percentage is very high in some districts ofMarathwada.
126 Human Development Report Maharashtra 2002

that region, promoting or inhibiting gender devel-opment and empowerment. At the policy level, theState is way ahead of many others in the country.Gender development is not commensurate with thepotentially enabling socio-political conditions. Thebenefits of growth should be shared among regionsand among people equally.
There is an urgent need to include the poor into
the development process through reforms, infra-structure development and enhancement of socialattainments. Gender gaps across the districts of theState in demographic features, health, education,employment and political participation show a widearray of discriminations.
The message is: invest in women for their goodand the society; it has a multiplier effect.
Highlights: Gains and Gaps in Women’s Development in Maharashtra—2001 (continued)
Gains Gaps11. Total Fertility Rate (TFR)
TFR (2.52) of the State lower than the national average(2.85).
34.6 per cent of births are of third order. Many districtshave TFR greater than 3.
12. Maternal CarePercentage of women who received any type ofantenatal care is high 87.8 per cent.
But percentage of women who had full antenatal careis only 54.8.
13. Work Participation Rate (WPR)WPR for women higher than at national level. High WPR in rural Maharashtra may only indicate
compulsion rather than choice. WPR for urbanwomen low, only 15 per cent. A large percentage ofwo me n wor k a s c a s ua l l abour a nd a tsubsidiary/marginal activities in rural sector.Difference between male and female wage rates wide.
14. Literacy and EducationFemale Literacy Rate high (67 per cent). Maharashtraranks 11th among Indian States. Enrolment of girls inprimary school high (103 per cent) of the referencegroup and increasing. Government has madeeducation free for girls up to standard twelve and forboys up to standard ten. Primary schools are also tobe set up within 15 km of a habitation of 200 peopleand within half a kilometre of a tribal settlement.
Girls drop out at the end of primary school in thelargest proportions as well as at the end of every stageof school education.
15. Higher EducationMany institutions in the State set apart exclusively forwomen.
Inability to continue in education is also true of girlsin higher education. Women gravitate towards certainareas of study, laying the foundations for segregationand reduced opportunities in the labour force.
16. EmpowermentThe State has introduced reservation of one-third ofthe seats in panchayati raj institutions; Proposed Billof Rights; Improved property rights in co-parcenaryproperty, matrimonial property and in publicallotment of land and housing. Twelve, all women’spanchayats exist in the State. Women constitute 11.60per cent of total membership in cooperatives. Thepercentage of women membership in the legislativecouncil is at an all time high, 20.5 per cent, in thelegislative assembly.
Women in elected bodies in decision-making positionsare few. Women panchayati members face maleresistance, which makes it difficult for them to takeindependent decisions. While some efforts have beenmade to educate women members of elected bodies atdifferent levels to discharge their duties effectively,much remains to be done.
Gender Issues 127

Policy Options
• Registration of clinics offering amniocentesis,their close monitoring, mandating data fromabortion clinics for public inspection, educationthrough PHCs and panchayats on scale similarto family planning programme are required. Cur-riculum changes in schools to remove gender biaswould be useful.
• Improving the opportunities for education,health, employment and property rights.
• Enforce existing measures like Anti-Dowry Act.
• Combat the high levels of anaemia and malnu-trition, especially in the tribal belt on a warfooting.
• Ensure registration of marriages to arrest mar-riages below the legally permissible age and teen-age pregnancies; it would also assist women incases of divorce and bigamy, as Hindu marriagesdo not have documentary evidence.
• Emphasise spacing, non terminal methods andprovide for follow-up to help improve reproduc-tive health.
• Improved wage rates, especially for women, im-provement in agricultural productivity, develop-ment of non-farm employment in rural areas,investment in rural infrastructure are the onlyhope for pulling rural women up.
• Focus special efforts on rural women since morewomen in rural areas are illiterate.
• Avoid relapse into illiteracy among the neo-liter-ate by introducing advanced primers.
• Encourage Women’s Groups to run literacy pro-grammes especially in rural areas since literacy inslums has improved due to the involvement ofNGOs.
• Identify local solutions to retain girls in educationsince free education and free transport to schoolshas attracted them in increasing numbers. The
problems faced by girls are likely to vary overregions, communities and castes.
• Strengthen by training the role of women inPanchayat Raj since, despite familial and societalconstraints, they are already beginning to decide onimportant developmental issues of their villages.
• Conduct field research to estimate if free educa-tion has improved the schooling of girls and ifso, by what extent.
• Gender sensitise elected members of all demo-cratic institutions and ensure egalitarian powersharing between women and men in positions ofpower such as chairpersons of the standing com-mittees, sarpanches, presidents of panchayatsamities and mayor, making local self-governancemore effective.
• Generate desegregated data and publish themregularly to enable trend analysis on
– Female foeticide according to land holding,occupation, education and social groups inboth rural and urban areas.
– District-wise infant, neo-natal and under fivemortality.
– Registration of births and deaths.
– Morbidity data from hospital records.
– Occupational and mental health data.
– Female Life Insurance Policyholders and bene-ficiaries.
– School enrolment of girls/boys by privateschools versus municipal and other local bodyschools.
– District-wise wage rates for different jobs.
– Data on membership of Mahila Mandals.
– District level data on female heads of house-holds and women deserted by their husbands.
– District-wise data on crimes against womenand convictions.
Chapter VIII →
← Contents
128 Human Development Report Maharashtra 2002

CHAPTER VIII
Growth and Human Development
Maharashtra is ranked amongst the varioushigh-income States but in terms ofHuman Development Index (HDI), its
rank is lower since the high per capita incomes havenot resulted in corresponding levels of human de-velopment attainment. There are several anomaliesand distortions, chief among them being high levelsof poverty, wide inequalities in the distribution ofassets and consumer expenditure, high levels ofunemployment and regional disparities.
When examining the links between economicdevelopment and human development, three as-pects are to be considered: literacy and mean yearsspent in schooling, infant mortality rate and anthro-pometric measurements like weight and height asindicators for education, health and nutrition. Us-ing them, a Human Development Index (HDI) canbe constructed for Maharashtra. With that the leveland pattern of human development attainmentacross its districts can be visualised.
On these crucial counts, where do Maharashtraand its districts stand?
There have been notable achievements. Literacyrates have improved, from a mere 39.13 per cent in1971 to 77.27 per cent in 2001, the pace of progresshaving been rapid in the last decade. If Mumbairegion had 87 per cent of its population literate,most others had attained around 80 per cent literacy.Nandurbar district with 56 per cent had the lowestlevels of literacy but that is substantially higher thanthe State average of 1961, all of which points outto the gains made as well as to what needs to bedone. Disparate levels across Maharashtra are ahistoric legacy.
Mean years of schooling—that is the time spent
for basic education, is a realistic indicator of thestock of human capital. The attainment on thisindicator varies from 6.36 years in Sindhudurg to2.87 for Jalna. The State average, for 1999–2000was 4.970. On the other hand, dropout rate washigher at 53 per cent at Standard X than for Stand-ard VII, which was 31 per cent across Maharashtra.Non-enrolment and dropout decisions are com-pelled by several factors including lower incomesand the need to work at home in rural areas. Morechildren belonging to lower incomes are not en-rolled in urban areas compared to the rural.
In a population where more than half the popu-lation consumes less than 90 per cent of the normalminimum daily calorific value, the children are quiteundernourished, reflecting its impact on their phy-sique with its attendant implication to their generalhealth. This has been highlighted in the earlierchapters.
The Human Development Index (HDI) is alsoa tool for measuring the non-income dimensions ofthe quality of life and is a composite index of threebasic components of development—longevity,knowledge and income. Longevity is represented aslife expectancy at birth and is indicative of thecapability of leading a long healthy life. Educationalattainment, a capability for acquiring knowledge forcommunicating and community participation, isthe weighted average of two educational stock vari-ables—adult literacy and the average number ofyears spent in schooling; adult literacy getting a2⁄ 3rd weightage and schooling 1⁄ 3rd.
This HDl however does not enable the trackingof the improvement or change in the indicators ofattainment. Therefore, attainment Indices in Edu-cation and Health using the indicators of literacy
Growth and Development 129

Table 8.1
Human Development Indicators—Education
No. DistrictsLiteracy Rate (Age 7+) 2001
Mean Years of Schooling(Std. 1–7) 1999–2000 Dropout Rate (per 100) 1998–99
% Rank Years Rank 7 Std. Rank 10 Std. Rank
1 2 3 4 5 6 7 8 9 10
1 Mumbai 86.82 2 5.852 6 19 4 53 13
2 Mumbai (Subn.) 87.14 1 5.852 7 19 5 53 14
3 Thane 81.00 6 5.460 13 34 16 62 24
4 Raigad 77.32 13 5.313 17 43 27 66 31
5 Ratnagiri 75.35 19 4.921 20 19 6 57 19
6 Sindhudurg 80.52 8 6.356 1 15 2 34 1
7 Nashik 75.10 20 4.151 28 23 8 64 27
8 Dhu1e 72.08 26 3.836 30 45 28 56 16
9 Nandurbar 56.06 35 3.836 31 45 29 56 17
10 Jalgaon 76.06 17 5.131 19 29 10 50 11
11 Ahmednagar 75.82 18 4.550 22 41 26 60 22
12 Pune 80.78 7 5.740 9 30 13 50 12
13 Satara 78.52 12 5.425 14 18 3 42 4
14 Sangli 76.70 15 5.600 10 31 14 60 23
15 Solapur 71.50 27 4.228 26 38 24 65 30
16 Kolhapur 77.23 14 5.768 8 11 1 41 3
17 Aurangabad 73.63 23 4.207 27 37 22 57 20
18 Jalna 64.52 33 2.870 35 51 34 73 35
19 Parbhani 67.04 31 3.017 33 47 31 72 33
20 Hingoli 66.86 32 3.017 34 47 32 72 34
21 Beed 68.48 30 4.116 29 45 30 62 25
22 Nanded 68.52 29 3.507 32 53 35 69 32
23 Osmanabad 70.24 28 4.249 25 40 25 62 26
24 Latur 72.34 25 5.306 18 35 20 59 21
25 Buldhana 76.14 16 4.305 24 37 23 64 28
26 Akola 81.77 5 5.355 15 34 17 49 9
27 Washim 74.03 22 5.355 16 34 18 49 10
28 Amaravati 82.96 4 5.586 11 35 21 56 18
29 Yavatmal 74.06 21 4.263 23 47 33 64 29
30 Wardha 80.50 9 6.258 3 31 15 46 6
31 Nagpur 84.18 3 6.286 2 19 7 36 2
32 Bhandara 78.68 10 6.104 4 29 11 47 7
33 Gondiya 78.65 11 6.104 5 29 12 47 8
34 Chandrapur 73.07 24 5.551 12 27 9 45 5
35 Gadchiroli 60.29 34 4.872 21 34 19 54 15
Maharashtra 77.27 – 4.970 – 31 – 53 –
Sources: Column 3: S.K. Biswas, (2001); Columns 7 and 9: Data provided by the Directorate of Education, Pune.
130 Human Development Report Maharashtra 2002

and infant mortality rate have been constructed.The methodology and data sources are outlined inthe appendices, but it has to be noted that healthhas been represented by IMR, as data for life expec-tancy is not available at the district level.
The HDI using the UNDP methodology for theyear 2000 highlights the backwardness of the districtsof Marathwada and Vidarbha, the results presentedin Table 8.2, which gives the HDI value of 0.58 forthe State. Only districts of Mumbai—both city andsuburban—and Thane, as well as Raigad, Sind-hudurg, Pune, Satara, Sangli, Kolhapur and Nagpurbeing above the State average. Significantly, Nagpuralone is from Vidarbha’s districts and none of theMarathwada districts, it may be noted, are in the listof above-the-State’s average attainment.
If western parts, including Konkan, are moredeveloped than those on its eastern side, there arecertain districts within the western region, which hastheir own backwardness. The tribal district of Dhuleas well as Nandurbar has low values and ranking.Nandurbar’s HDI value is a mere 0.28. Marathwada’sdistricts are the most backward among all districts ofMaharashtra with values lower than the State average.For Jalna, it is 0.27 and Aurangabad, with 0.57 comesbarely close to the State average. None of the otherMarathwada district has a value higher than 0.47.With regard to Vidarbha, it must be said none ofthem is above or on par with the State average withthe exception of Nagpur which has a HDI value of0.71 and amongst all districts, is ranked fifth. Ama-ravati and Wardha are relatively more developed ofVidarbha districts with HDI values of 0.50 and 0.49and are ranked correspondingly at 15 and 16 respec-tively. Gadchiroli, despite being in the second quartilein terms of per capita district domestic product, hasthe lowest HDI value of 0.21, just a notch belowYavatmal’s 0.22.
Districts in the Mumbai region occupy the topslot but the difference in value for them and the restis stark. This phenomenon is explained partly by thehigh per capita income of Mumbai city. It also con-veys the existence of a sharp divergence between thesocial sector attainments of metropolitan Mumbai
Table 8.2
Human Development Index and Per CapitaDistrict Domestic Product
No. Districts HDI2000 Rank
PCDDP (Rs)1998–99
(At CurrentPrices) Rank
1 2 3 4 5 6 1 Mumbai 1.00 2 45471 1 2 Mumbai (Subn.) 1.00 1 45471 2 3 Thane 0.82 3 33200 3 4 Raigad 0.70 6 30364 4 5 Ratnagiri 0.44 22 14354 25 6 Sindhudurg 0.60 9 20016 10 7 Nashik 0.51 13 20636 8 8 Dhule 0.36 30 11789 34 9 Nandurbar 0.28 32 11789 3510 Jalgaon 0.50 14 16449 1711 Ahmednagar 0.57 11 15251 2212 Pune 0.76 4 28000 613 Satara 0.59 10 15563 2014 Sangli 0.68 7 20411 915 Solapur 0.48 17 18097 1316 Kolhapur 0.64 8 20925 717 Aurangabad 0.57 12 19365 1118 Jalna 0.27 33 12047 3319 Parbhani 0.43 24 13827 2620 Hingoli 0.43 25 13827 2721 Beed 0.47 18 15303 2122 Nanded 0.37 29 13068 3123 Osmanabad 0.38 28 12905 3224 Latur 0.47 19 13677 2925 Buldhana 0.41 27 13823 2826 Akola 0.44 23 16069 1827 Washim 0.36 31 16069 1928 Amaravati 0.50 15 17168 1429 Yavatmal 0.22 34 13382 3030 Wardha 0.49 16 16952 1631 Nagpur 0.71 5 28878 532 Bhandara 0.46 20 14467 2333 Gondiya 0.46 21 14467 2434 Chandrapur 0.41 26 19325 1235 Gadchiroli 0.21 35 17140 15
Maharashtra 0.58 – 22763 –
Source: PCDDP: Directorate of Economics and Statistics, 2001,District Domestic Product of Maharashtra 1993–94 to1998–99, Government of Maharashtra, Mumbai.
Growth and Development 131

and the rest of Maharashtra. The HDI values ascribedto various districts highlights the regional disparities,which persist despite being dealt with by the Govern-ment of Maharashtra through financial allocations forinvestment to remedy the imbalances. The high valuefor Mumbai has in fact pushed up the HDI for theState.
There is a strong link between the HDI rankingsof the districts and the per capita district domesticproduct (PCDDP) for 1998–99 at current prices.Those districts, which have a higher value on HDIalso rank higher on the PCDDP, except for Satara,which is an exception with a high value on HDIbut lower in rank for PCDDP. Those with lowerHDI are correspondingly lower on the PCDDP.
Achievement Indices
HDI measures absolute deprivation and improve-ment in the performance level of the lowest per-forming segment will cause the index for all othersto drop. Similar is the effect when a top performerimproves its performance. To avoid j’s performanceto affect i’s performance, it is necessary to set themaximum value M, at a level, which is higher thanthe maximum recorded value. M may be set at alevel, which represents an unattainable target (seeAnnexure). Similarly, m, the minimum value maybe set at the actual minimum value attained histori-cally or some smaller number. This procedure alsocorrects other biases connected with linear measuresof deprivation.
These indices are important in yet another sense.They measure non-income dimensions of develop-ment. There are conceptual problems in includingincome along with attainment in education andhealth. Income represents purchasing power overgoods and services and therefore, needs to be consid-ered as a means or an input towards human develop-ment attainment. Literacy, mean years of schooling,life expectancy and infant morta1ity are final outcomesof the processes of development.
Conceptual problems apart, there are empiricalproblems in estimating incomes at the district level.
Annexure I has listed these difficulties. AchievementIndices thus evaluate a district’s performance vis-à-vis other districts without including the incomedimension.
More important, the HDI measures attainmentat a point in time. It is often necessary and inter-esting to study the pattern of improvement or de-cline in human development attainment over time.Hence, Achievement Indices have been constructedfor the districts of Maharashtra using literacy for2001 to represent education and infant mortalityrate in 1991 to represent health (as data for 2001is not available yet.) The Improvement Index, IIL,measures the increase in literacy rate in the period1991 to 2001 and the Improvement Index, IIMR,estimates the decline in infant mortality rate in theperiod 1981 to 1991.
Achievement indices in literacy rates (AIL) atthe district have been estimated, using source datafrom the Census documents and adjusted to makedistricts comparable across 1991 and 2001 (seeAnnexure III for methodology). For 1991, it variedbetween 0.8056 for Mumbai and 0.3654 for Gad-chiroli. All Marathwada districts fall below the Stateaverage of 0.6097. For 2001, the AIL continued tobe at top for Mumbai at 0.8536 and Nandurbar waslowest at 0.5118 but the positions of Marathwadaremained the same with all them recording lowervalues than the State average of 0.7474.
The Improvement Index (IIL) for 1991–2001indicated Akola to have the first rank, followed byAmaravati, Nagpur, Bhandara, Gondiya and Dhule.The districts with low value IIL were Nandurbar,Sindhudurg, Washim, the two Mumbai districts andGadchiroli. Those with high ranks in AIL in 1991continued with better performance in 2001 (Table8.3). These included the districts of Mumbai districts,Nagpur, Pune, Amaravati, Wardha and Thane. At thelower end are Dhule, Nandurbar, Jalna, Parbhani,Hingoli, Beed, Nanded and Gadchiroli.
Over 1991–2001, no major changes appear inthe rankings of the districts with respect to achieve-ment in literacy except Sindhudurg and Akola. The
132 Human Development Report Maharashtra 2002

districts that have higher levels of literacy in anearlier period continue to maintain a lead overdistricts with lower levels of literacy ‘Initial condi-tions’ appear to have given certain districts a ‘lead’over other districts that have had a lower startingpoint. The IIL has indicated that in terms of changeover the period 1991–2001, Akola has the highest
rank on the index and Sindhudurg, which achievedrapid improvement in 1981–1991, has slowed downthe pace of improvement in 1991–2001.
Health: 1981–1991
In the case of health, Achievement Indices for Infant
Table 8.3
Achievement and Improvement Indices for Literacy (1991–2001)
No. Districts AIL 1991 Rank AIL 2001 Rank IIL 1991–2001 Rank1 2 3 4 5 6 7 8 1 Mumbai 0.8056 1 0.8536 2 0.0630 32 2 Mumbai (Subn.) 0.8056 2 0.8571 1 0.0685 31 3 Thane 0.6616 8 0.7889 6 0.1049 14 4 Raigad 0.5994 16 0.7480 13 0.1030 17 5 Ratnagiri 0.5856 17 0.7261 19 0.0921 24 6 Sindhudurg 0.7312 3 0.7836 8 0.0481 34 7 Nashik 0.5814 19 0.7233 20 0.0920 25 8 Dhule 0.4580 28 0.6898 26 0.1240 3 9 Nandurbar 0.4580 29 0.5118 35 0.0232 3510 Jalgaon 0.6033 15 0.7340 17 0.0888 2811 Ahmednagar 0.5670 21 0.7313 18 0.1061 1012 Pune 0.6783 5 0.7864 7 0.0910 2713 Satara 0.6297 10 0.7613 12 0.0976 1914 Sangli 0.5846 18 0.7411 15 0.1051 1315 Solapur 0.5154 25 0.6833 27 0.0945 2216 Kolhapur 0.6327 9 0.7470 14 0.0829 2917 Aurangabad 0.5220 24 0.7070 23 0.1088 818 Jalna 0.4028 34 0.6058 33 0.0923 2319 Parbhani 0.4176 32 0.6338 31 0.1031 1620 Hingoli 0.4176 33 0.6318 32 0.1019 1821 Beed 0.4424 30 0.6498 30 0.1033 1522 Nanded 0.4241 31 0.6502 29 0.1108 723 Osmanabad 0.4919 27 0.6693 28 0.0955 2124 Latur 0.5063 26 0.6927 25 0.1053 1125 Buldhana 0.5743 20 0.7349 16 0.1052 1226 Akola 0.6203 11 0.7974 5 0.1396 127 Washim 0.6203 12 0.7114 22 0.0610 3328 Amaravati 0.6673 6 0.8107 4 0.1253 229 Yavatmal 0.5329 23 0.7118 21 0.1073 930 Wardha 0.6661 7 0.7833 9 0.0961 2031 Nagpur 0.7071 4 0.8242 3 0.1135 432 Bhandara 0.6077 13 0.7631 10 0.1121 533 Gondiya 0.6077 14 0.7628 11 0.1118 634 Chandrapur 0.5490 22 0.7008 24 0.0912 2635 Gadchiroli 0.3654 35 0.5588 34 0.0808 30
Maharashtra 0.6097 – 0.7474 – 0.0968 –
Notes: (i) AIL: g (100 – 10) – g (100 – x)/g (100 – 10) where x = actual value.(ii) IIL: Ln (100 – x1) – Ln (100 – x2)/Ln(100 – 10) where x1 and x2 are actual values in 1991 and 2001 respectively.
Source: Nanda (1991), Biswas (2001).
Growth and Development 133

Mortality (AIIMR) have been constructed. (SeeAnnexure IV for the methodology).
The results of AIIMR 1981 gave Mumbai thehighest value at 0.6554 followed by Pune, Sangli,Kolhapur and Ahmednagar all in Western Ma-harashtra. All the districts of Vidarbha except Nag-pur registered the lower values. The AIIMR 1991has Mumbai in the top position again at 0.7908followed by Sangli, Thane, and Ahmednagar inWestern Maharashtra and Parbhani in Marathwada.At the lower end were the districts of Vidarbhaexcept Nagpur. All of them registered values lowerthan the State average of 0.4756 including Nagpur.The Improvement Index in IMR (IIMR) for theperiod 1981–1991 shows Parbhani to have the high-est rank followed by Bhandara, Thane, Raigad andChandrapur. Of these, one district belonged toMarathwada, two to Vidarbha and two to WesternMaharashtra.
Districts that performed well in 1981 wereMumbai, Pune, Sangli, Kolhapur, Ahmednagar,Ratnagiri, Sindhudurg, Satara, Solapur and Beed.Districts which are lower down in ranks were Gad-chiroli, Chandrapur, Bhandara, Yavatmal, Wardha,Buldhana, Amaravati, Raigad, Akola and Parbhani.
Most districts that fared well in reducing infantmortality belonged to Konkan and Western Ma-harashtra. The poor performers belonged to theVidarbha region in 1981. In 1991, the districts thatimproved their ranks substantially include Thane,Raigad, Aurangabad, Parbhani, Nanded and Bhan-dara. The ranks of the districts in Vidarbha do notshow any marked improvement. However, the Im-provement Indices, which show the improvementover 1981–1991, indicted several districts of Vidar-bha to have reduced IMR substantially. These in-clude Bhandara, Chandrapur, Buldhana andWardha. Parbhani in Marathwada has achieved thehighest rank in the Improvement Indices in IMR(IIMR), which is noteworthy.
To sum up, Mumbai appears to have the highestrank with respect to achievement in both literacyand infant mortality rates. Greater Mumbai, Thane,
Pune, Satara and Kolhapur appear to have the high-est rank with respect to AIL 2001 and AIIMR 1991.All districts of Marathwada, except Aurangabad,record low ranks on the AIL 2001 and all thedistricts of Vidarbha, except Nagpur record lowranks on the AIIMR 1991.
The Achievement Indices thus reveal that thedistricts of Marathwada with the exception ofAurangabad lag behind in education as indicated byliteracy rates. The Achievement Indices for healthas represented by infant mortality rates indicate thatthe districts of Vidarbha with the exception ofNagpur lag behind in health.
Several districts of Marathwada such as Auran-gabad, Parbhani, Hingoli and Beed have high rankson the AIIMR while several district of Vidarbhasuch as Akola, Amaravati, Wardha, Nagpur, Bhan-dara and Gondiya have high ranks on the AIL.
Thus when the Achievement Indices, AIL andAIIMR, are compared with the HDI it may beinferred that the ranks of Aurangabad, Parbhani,Hingoli and Beed in Marathwada are lower on theHDI because of low status on literacy despite highranks on the AIIMR. The opposite is the case withthe districts of Vidarbha. Akola, Amaravati,Wardha, Bhandara and Gondiya record low or me-dium ranks on the HDI despite high ranks on theAIL 2001 due to lower ranks on the AIIMR 1991.
Comparison of Achievement Indices at two dif-ferent time points indicates progress or improvement.These have been called the Improvement Indices. TheImprovement Index for literacy, IIL, reveals Dhule,Nanded and Latur to have higher ranks in terms ofchange over time. This is despite their low status onthe Achievement Index, AIL 2001. Similarly, theImprovement Index for IMR, IIIMR, indicatesBhandara and Gondiya to have substantially reducedinfant mortality rates over 1981 to 1991 despite highinfant mortality rates in 1991.
Nutrition is yet another key element in deter-mining the level of attainment of a population butfor that, district-wise data is not available. The
134 Human Development Report Maharashtra 2002

extent of malnutrition and undernutrition needs tobe studied since they render an individual suscepti-ble to infections resulting in higher mortality. Theproblem of undernourishment in Maharashtra isacute; the State has several districts with a sizeabletribal population.
The measures of nutrition are in terms of height-for-age, weight-for-age and height-for-weight. Themeasures weight-for-age and height-for-age havebeen reported to indicate undernourishment and
stunting respectively for the districts of Maharashtra.There are two measures of deprivation viz. valuesexceeding-3SD indicating severe deprivation andthose exceeding-2SD indicating mild malnutrition;Maharashtra has a high percentage of undernourishedchildren. The weight-for-age indicator using themeasure-3SD shows that the percentage of under-nourished children below two years of age is high inRatnagiri in Konkan, Ahmednagar and Pune in West-ern Maharashtra, Aurangabad and Beed in Marath-wada, and districts of Vidarbha including Buldhana,
Table 8.4
Achievement and Improvement Indices for IMR (1981–1991)
No. Districts AIIMR 1981 Rank AIIMR 1991 Rank IIMR 1981–1991 Rank 1 2 3 4 5 6 7 8 1 Mumbai 0.6554 1 0.7908 1 0.1354 29 2 Thane 0.2885 14 0.6838 3 0.3953 3 3 Raigad 0.1633 23 0.5459 12 0.3825 4 4 Ratnagiri 0.3386 6 0.4697 19 0.1311 30 5 Sindhudurg 0.3386 7 0.5000 15 0.1614 26 6 Nashik 0.2929 13 0.4466 22 0.1537 28 7 Dhule 0.2841 16 0.4816 18 0.1975 22 8 Jalgaon 0.2094 18 0.4938 17 0.2844 15 9 Ahmednagar 0.3433 5 0.6740 4 0.3307 610 Pune 0.4245 2 0.6292 7 0.2047 2011 Satara 0.3199 8 0.6377 6 0.3178 1012 Sangli 0.4191 3 0.7378 2 0.3187 913 Solapur 0.3199 9 0.5127 13 0.1927 2314 Kolhapur 0.3675 4 0.6047 9 0.2372 1915 Aurangabad 0.2885 15 0.5969 10 0.3084 1316 Jalna 0.1822 20 0.4638 21 0.2816 1617 Parbhani 0.1822 21 0.6464 5 0.4642 118 Beed 0.3199 10 0.6292 8 0.3093 1219 Nanded 0.1977 19 0.5127 14 0.3150 1120 Osmanabad 0.3108 11 0.5000 16 0.1892 2421 Latur 0.3108 12 0.5892 11 0.2784 1722 Buldhana 0.1056 25 0.4299 24 0.3243 723 Akola 0.1784 22 0.3339 28 0.1554 2724 Amaravati 0.1633 24 0.3675 26 0.2042 2125 Yavatmal 0.0679 27 0.2335 30 0.1656 2526 Wardha 0.0780 26 0.3979 25 0.3199 827 Nagpur 0.2254 17 0.4697 20 0.2443 1828 Bhandara 0.0285 28 0.4354 23 0.4069 229 Chandrapur 0.0253 29 0.3577 27 0.3324 530 Gadchiroli 0.0253 30 0.3108 29 0.2855 14
Maharashtra 0.2542 – 0.4756 – 0.2214 –
Notes: (i) AIMR = 1 – ((X – 30)/(190 – 30)) ^0.5. (ii) IIMR = AIMR (t) – AIMR (t – 1). (iii) IMR = Number of deaths from birth to age one per thousand live births.
Source: Registrar General of India (1997).
Growth and Development 135

Amaravati, Nagpur, Bhandara, Chandrapur and Gad-chiroli.
In the case of the height-for-age indicator, themeasure 3SD indicated incidence of severe stuntingin most districts of Marathwada and Vidarbha re-gion, Jalgaon, Ahmednagar and Pune of WesternMaharashtra. Data for Dhule and Nandurbar hasnot been reported but a similar situation may beassumed to exist.
Concepts of prevention of communicable dis-eases and nutritional deficiencies and the use ofmodern medicine have been identified as importantfactors leading to higher incidence of under- andmalnourishment and mortality. Health workersworking amongst the tribals trace the non-utilisa-tion of health services by the tribal population totraditional beliefs and superstitions. Cultural aliena-tion of health care providers including doctors,nurses, MPWs, and the alien design and culture ofhealth care institutions like hospitals and PHCshave been cited other impediments to increasedutilisation of health care facilities.
Social Factors
Societal considerations need to be taken into ac-count while discussing human development attain-ment. Social environment is an important factor,which fosters attainment in education and healthparticularly for women. It is difficult to measure
social attitudes. Hence, female literacy has beentaken to be an indicator of social attitude towardswomen. As the status of women improves, the ageof marriage is likely to be postponed. Hence, thishas also been considered as an indicator of progressof the society or modernisation.
Conclusions
• There are sharp disparities across regions, districtsand between the urban and rural areas, betweenMumbai and rest of Maharashtra in the attain-ments in education, health and nutrition.
• Marathwada districts are the most backwardamong all districts of Maharashtra and score lowon the HDI.
• Since the pattern of growth of income has impli-cations for HDI, the growth of the secondarysector and rise in employment in non-agriculturalenterprises are needed to further the structuralchanges. Also, economic growth has to be dis-persed.
• Significance of physical infrastructure cannot beunderplayed. Access to amenities as well as socialinfrastructure in the form of schools and health-care facilities are crucial to ensure their optimaluse. Access to schools and health facilitiesemerged as important since average distance be-tween villages is high in Maharashtra. So is thecase with healthcare facilities.
Chapter IX →
← Contents
136 Human Development Report Maharashtra 2002

CHAPTER IX
The Way Forward
Maharashtra is indeed a deeply contrastingand widely divided world—one of un-precedented opulence and the other of
remarkable deprivation, destitution and gender op-pression. That too, in an age and era, when democ-racy, participatory government, concepts of humanrights, globalisation and a border-less world are verymuch part of the prevailing intellectual rhetoric.Alongside, there exists a ‘real’ world wherein iswidespread hunger, persistence of poverty, worsen-ing of our environment, violation of elementaryfreedom as well as basic liberties. This potent com-bination results in increasing inequalities and wid-ening of the gap between sections of the people inour society, placing the sustainability of our eco-nomic and social lives in peril.
Overcoming this malaise has to be the centralpart of the ‘effort’ of any society. Maharashtra, withits historic background of seeking to foster equityamong all sections of society, is no exception. Un-derstanding, assessing and evaluating these issuesand suggesting measures to improve and enrich thelives of the people is the subject matter of thisHuman Development Report.
Human development is defined as expandingthe range of people’s choices. The poor are poorbecause their set of capabilities is small—not becauseof what they don’t have, but because of what they can’tdo. Well-being is possible by things people can dorather than things people have. If their set of capa-bilities grows larger, people can do more of thethings they would like to do. Economic develop-ment expands the choice people have over theircapabilities. It has a meaning only when the re-sources and access to the gains crafted from themare evenly spread across the population. It is thepattern of growth, not just growth in itself or by
itself that is important for human development; ithas to enable improvement in the productive capa-bility of the people and their participation in valueadded activities thereby increasing their purchasingpower.
The Human Development Index (HDI) of asociety/community/state/country considers threeimportant factors—health, education and access toresources—to arrive at the well-being index. Thesethree factors and their significant influence on thenature and type of capabilities that availability andaccessibility of these factors induce in its people tolead the kind of life they want to live, have beensubject to adequate intellectual inquiry to qualifyfor inclusion in the HID.
The ‘instrumental’ freedoms to promote humandevelopment are economic facilities and opportuni-ties, political freedoms, social opportunities, transpar-ency guarantees and protective security. The societalarrangements to facilitate the process of human de-velopment and bring value to the lives of all peopleare the social system, the State, the market andexchange mechanism, the legal system, political sys-tem, the media and public interest groups and civilsociety organisations. The interplay between the re-quirement of freedoms and the societal arrangementsare at best known for their complexity and unpre-dictability.
Fundamentally, human assets such as capacityfor basic labour, skills and good health can beprogrammed through a directed effort. Similarlynatural assets such as land can be distributed, physi-cal and financial assets can be created. These arerelatively achievable, as it is in the interest of the‘privileged’ to foster the development of these assetsfor their own relative prosperity but for some others,
The Way Forward 137

it is the possibility of the ‘unintended consequences’of such interventions. However, social assets, suchas network of contacts and reciprocal obligationsthat can be called on in time of need, and politicalinfluence over resources, is a separate category byitself. To tackle this aspect the instrumental free-doms and the societal arrangements have to have acausal effect to generate the ‘even-chance’ for allpeople.
Every human development report must stir con-sciences and should further our progress towards ahumane society.
Maharashtra indeed has a lot to be proud of,and these aspects have found emphatic mention inthe report. Do we rest on our laurels or do we spurourselves to greater action and glory? To decide onthis question, an exercise of this kind has to beconstructively critical. This is also to enable us topause and reflect on achieved progress. It is themoment to measure the ‘unintended consequences’and limit their negative impact. It is time for stock-taking followed by midway course correction beforedesigning a new blueprint.
What is worrisome is the flip side of Maha-rashtra, a ‘progressive’ State.
Maharashtra produces less food grains than itsrequirements. It is endowed with poor quality soil.Only 14.5 per cent of the net sown area of approxi-mately 17.75 million hectares are irrigated. Agricul-ture is vulnerable to drought and directly affects thelives of the farm labour and small landowners andin many ways, impacts the entire population acrossthe State. This translates to migration to urban areasin times of distress that eventuates to a permanentshift, with unintended consequences. There is fur-ther aggravation because of a dominance of a cashcrop preference, which guzzle irrigation waters dis-proportionate to the area under cultivation depriv-ing any scope for equity. The other dimension tothis is that water users have been asked to bandtogether, on the strength of successes of voluntaryenterprise of the people, to ensure equitable distri-bution to all legitimate claimants of their share to
it. In most irrigation projects, originally set outcropping patterns in the command areas have notbeen either adhered to or ensured; that could havepromoted some equity in distribution.
The logical and natural outcome to providefocus on water conservation schemes in areas whereirrigation projects exist and where none are everlikely to be built since farming has to be made morereliable and productive. If this is achieved, thecommunity of farm-dependent people become ‘sta-ble population’ in that they have lesser incentive tomigrate and can benefit from the fruits of location-based development that governments normally arerelatively better at doing.
About a third of the population of Class I andII towns in Maharashtra live in slums. For GreaterMumbai, the proportion is tending towards the halfway mark. To Greater Mumbai goes the unenviablecredit of being the host to Asia’s biggest slum whichis actually a dubious distinction.
A Slum as per The Oxford Illustrated Dictionaryis a dirty, squalid, overcrowded street/district inhabitedby the very poor. A slum (as defined in this reportbased on the Census’ yardstick) is a compact area ofat least 300 people, of some 70 households of poorlybuilt, congested living quarters, often illegally onlands that do not belong to the owners/occupant ofthe tenements. The environment is unhygienic, theinfrastructure to support is woefully inadequate oreven non-existing. The reality is that it is the mini-mum size, not the average, which underscores thelevel of spread of deprivation.
Slums are a proliferating reality. If such largenumbers of people choose living in slums in inhu-man conditions, there must be a compelling reasonfor their choice or the lack of it. As usual, theunintended consequences of the proliferation ofslums and their unhygienic environment are whatcondition the life and health of the entire popula-tion there.
Urbanisation, it is believed, leads to a demo-graphic behaviour that aims at improvement of the
138 Human Development Report Maharashtra 2002

individual and the family in areas of health, educa-tion and employment. These in turn are supposedto lead to a fast decline in fertility and mortality.Nevertheless, as seen in the previous pages of thisdocument, it has not always been the case.
The urban population of Maharashtra is con-tinually growing as a percentage of the total popu-lation. It is currently 42.4 per cent of the totalpopulation. This trend in urbanisation coupled withthe fact that a third of the population of urbanMaharashtra is forced to live in slums negates thesupposedly positive effects of urbanisation. An un-hygienic and congested environment as evidencedin slums is not conducive for improvement in healthstandards of the population. The supposed improve-ment in education and employment opportunitiesof urban areas should be interpreted carefully. Whydo people migrate to urban areas and live in slums?Is it out of choice? If employment and incomes werepossible at their respective places would one mi-grate, at all, to urban areas and live in slums? Thequestion begs an answer!
Apparently, efforts at urbanisation, which isactually the effect of people’s movement towards awell ordered, prosperous and egalitarian living can-not be mutually exclusive of attempts to improvethe quality of life and choices in the ruralscapes. Ifnot in simultaneous action, it requires to be at-tended to in tandem.
As regards the supposed decline of fertility, thedata is self-evident. The fertility rate for rural Maha-rashtra is 2.74, it is marginally lower at 2.69 in thecase of urban slum areas and it is significantly lowerat 1.39 for urban non-slum areas in Maharashtra.
Maharashtra is the second most populous Statein India, next only to Uttar Pradesh. Its populationgrowth rate is alarmingly poised to well above thecountry’s exponential rate of 1.93 per cent. This largeincrease in population together with urban migrationinto slum settlements, is potentially disastrous com-bination. That overcrowded ‘slums’ do not contributeto improving the human development index but alsopull down developmental efforts in other areas due
to the unintended consequences appear to be aninevitable outcome.
Maharashtra has the second highest per capitaState Domestic Product, among 15 major States butits spatial distribution is uneven. The per capita netSDP was Rs 20,644, higher by about 40 per centof the all-India average of Rs 14,712 in 1998–99.However, a major portion of Maharashtra is poorin terms of income as the distribution of income isskewed with Dhule district being the poorest andhaving a per capita SDP of Rs 11,789; in contrastMumbai districts are the richest with Rs 45,471,almost four times the level of Dhule. There is alsosubstantial incidence of poverty as measured bycereal consumption and calorie intake. Majority ofthe rural and urban population is undernourishedand this is reflected in turn in their poor health.
The skewed development offers a rich and pris-matic insight into why Maharashtra is where it istoday. Its growth is urban-centric, has a non-agri-cultural focus and has had its visible consequences.It is obvious to anyone that this trend has to bereversed, or in the least, the highly undesirable sideeffects are contained.
In health, as in other sectors, there is improve-ment in the life expectancy at birth; however, thereare still many areas of serious concern. The infantmortality rate (IMR) for the State, though decliningis still high at 48 per thousand with many districtsrecording IMR above 100 per thousand. Female IMRin Yavatmal district is particularly high at 126 perthousand. Gender preference in favour of a malechild, considering it an asset unlike a daughter whois a liability, prevails. Laws to check pre-natal gender-selection has had little impact while its effectiveenforcement could lead to not only gender-equitywithin the family to start with but reflect positivelyon the health of the mother whose need to bearchildren frequently would be reduced.
The all-India female-male ratio as per the 2001census is 92.7 girls per 100 boys. This has fallensharply from the 1991 figure of 94.5 girls per 100boys. If the regional trends were analysed,
The Way Forward 139

Maharashtra figures below the national average andis a cause for concern.
Mumbai, the biggest urban centre in the coun-try and the cradle of slums has a phenomenally highoccurrence of diseases ascribable to unhygienic liv-ing conditions, poor sanitation, congestion andovercrowding. Prevalence of diseases preventable byimmunisation was also the highest in Greater Mum-bai. Malaria, Tuberculosis and now the spectre ofLeptosporosis and other communicable and infec-tious diseases, is looming large, not in cities butacross Maharashtra. About half the cases of AIDSwere reported in Greater Mumbai. 3.5 per cent ofthe population in Maharashtra have either partialor complete blindness.
Though women enjoy a higher life expectancy,their nutritional status falls below the prescribedstandard of 2,700 calories per day. Inadequate nu-trition is a cause of serious anaemia. Overall, nearlythree-fourth of the children between the age of 3–6have some level of anaemia. Many girls are marriedbefore the legally marriageable age of 18 years. Themedian age for the first and the last birth in Maha-rashtra is 18.8 years and 28.1 years respectively.Child bearing begins early and ends early leavingthe mother impoverished in body and mind. Weakmothers produce weak babies and they in turnbecome weak mothers. Poor nutritional standardand neglect of the female child result in poor healthleading to susceptibility to diseases. Healthcare fa-cilities, both reliable and accessible, especiallythrough spending in the public domain, with im-proved facilities and skills in the rural areas is ur-gently called for.
Early motherhood has the unintended conse-quence of neglect of formal education and skillsrequired to seek gainful employment. On an averagethough girls fare academically better, only 65 girlscomplete higher secondary examination in compari-son to 100 boys. This pattern gradually decreasesthe domain of women in decision-making. In poli-tics and social sphere there are some illustriouswomen there in their own right, on the strength oftheir own capabilities but they are more an excep-
tion rather than the general rule. At the cutting edgeof grassroots democracy in the local bodies, the ruleby proxy is often in vogue where a woman gets herright by law but is traduced upon by convention,which only uses her as a proxy for a male, usually arelation. Such males together with the electedwoman do represent a socio-political phenomenon,which possibly is inevitable but which needs to bechanged quickly with education and empowerment.
In understanding the different aspects of the evilof gender inequality, we have to look beyond thepredicament of women and examine the problemcreated for men as well as the asymmetric treatmentof women. These causal connections can be verysignificant. Gender empowerment of women tendsto reduce child neglect and mortality, cut downfertility, overcrowding, and more generally, broadensocial concern and care. The extensive penalties ofneglecting women’s interests rebound on men witha vengeance.
Gender inequality hurts the interests of not onlythe girls and grown up women, but also boys andmen, through biological connections and throughsocietal connections.
The various policy implications and optionshave been highlighted at the end of each of thevarious chapters. Apart from a wise ruler who laidthe foundations of a sensitive attitude towards peopleand their concerns, Maharashtra also has had a largeroster of social thinkers and doers like Jyotiba Phule,Shahu Maharaj, father-son duo of the Karves whopioneered social reforms and took steps towardstransformation of our society. They gave women aposition and role in the progress of our society byrecognising their entitlements and enabling its ac-quisition. This message has, however, sadly forgot-ten and lost. This needs to be revived.
As stated in the beginning, the ‘instrumental’freedoms to promote human development and thesocietal arrangements to facilitate the process must beenhanced and strengthened to bring about the desiredoutcome. The unintended consequences of the out-come is required to be monitored continuously and
140 Human Development Report Maharashtra 2002

corrected for which even data bases have to be im-proved and kept in the public domain for a liberalsociety to measure the march of the society.
Given the realities on the ground, and societalexperience of the way resources, both human andmaterial are deployed and used, several areas needfocused attention. They are: 1. Managing water resources better by
• Conservation of water for drinking and irrigation
• Optimising water shares to lands, increasing eq-uity in distribution
• Increasing the proportion of irrigation of arableland
2. Stabilising income potential from agriculturaloperation by
• Provision of farm inputs to improve productivityof the lands and predictability of incomes
• Reducing vulnerability of small farmers/farm la-bourers
• Discouraging migration of unskilled labour to ur-ban areas which do not have the capacity to absorb,and encouraging reverse migration
3. Empowering women by
• Strict enforcement of the legally marriageable agewhich would, in turn
– Improve their health
– Give them the time to complete secondaryeducation
– Correct the female–male ratio
– Delay childbearing tasks till they are ready
• Punishing female foeticide• Avoiding the system of male-proxies for elected
women and restore true power to women
• Targeting improvement of women’s health to
reduce anaemia and make possible for childrenborn being healthier
4. Targeting compulsory elementary education for all children by
• Providing school-based nutrition in a workablemanner which in turn would
– Improve their nutrition status
– Simultaneously, ensure attendance and facili-tate learning
• Focussing on immunisation and other healthrelated programmes to improve child’s health
5. Improving healthcare by
• Extending further the medicare facilities, espe-cially in the rural areas
• Ensuring such facilities grow in the public do-main, with public funding
• Making such facilities more accessible
• Monitoring the delivery capabilities ethical as-pects of the system
6. Enhancing
• Nutritional status of that slice of populationwhich consumes now less than 90 per cent ofcalorific value per day per head
• Food security by providing improved access forthe poorer population to the PDS
• Netting more and more eligible women and chil-dren under ICDS
• Literacy levels, especially preventing lapsing ofneo-literate communities into illiteracy
This Human Development Report would bemore than justified if it contributes to appropriatelysensitising the opinion makers and the policy mak-ers to address these issues in a more concerted andmeaningful manner.
Glossary →
← Contents
The Way Forward 141

Glossary
A. Definitions of Statistical Terms
1. Crude Birth Rate (CBR)
= Number of live births in a given year
Mid year population × 1000
2. Crude Death Rate (CDR)
= Number of deaths in a given year
Mid year population × 1000
3. Natural Increase Rate is the difference between CrudeBirth Rate and Crude Death Rate.
4. Net Migration Rate is the difference between the In-migration rate and Out-migration rate. It is equal topopulation growth rate per annum minus the naturalincrease rate per annum.
5. Infant Mortality Rate (IMR) per 1000 live births—Probability of dying between birth and before complet-ing one year.
6. Neonatal Mortality per 1000 live births—Probabilityof dying within one month after birth.
7. Post Neonatal Mortality per 1000 live births—Prob-ability of dying after one month after birth but beforecompleting one year.
8. Age Specific Fertility Rate (ASFR) is defined as thenumber of live births in a specific age-group of womenper thousand female population of that age-group.
9. Total Fertility Rate (TFR) per woman in a given yearis average number of children born to a woman duringthe reproductive span (age 15–49 years) provided sheexperiences the current age-specific fertility rates.
10. General Fertility Rate (GFR) is defined as the numberof live births per 1000 women in the reproductiveage-group (15–49 years) in a given year.
11. Maternal Mortality Rate (MMR) reported annualnumber of deaths of women from pregnancy relatedcauses per lakh live births.
12. Sex Ratio is number of females per thousand males.
13. Life Expectancy at Birth (LEB) is the average numberof years expected to be lived at the time of birth ifcurrent mortality trends were to continue.
14. Literate is a person who can read and write with un-derstanding in any language is considered as literate and
a person who can merely read but cannot write is takento be as illiterate.
15. Gross Enrolment Ratio is the number of students en-rolled in a level of education whether or not they belongto the relevant age-group for that level as a percentageof population in the relevant age-group for that level.
16. Net Enrolment Ratio is the number of students enrolledin a level of education who belongs in the relevantage-group as a percentage of the population in theage-group.
17. Labour Force is defined as the total persons working(or employed) and seeking or available for work (orunemployed).
18. Work Force is persons engaged in any gainful activityare considered ‘workers’ (or employed). They are thepersons assigned any one or more of the nine activitycategories under the first broad activity category i.e.‘working or employed’.
19. Workforce Participation Rate is defined as the propor-tion of workers in the population.
20. Employed and Unemployed according to usual statusapproach, (with a reference period of 365 days) adoptedby National Sample Survey Organisation (NSSO) aperson is considered as working or employed if he/sheis engaged relatively for a longer time, during the ref-erence period of last 365 days in any one or more ofthe work activities. He/she is considered as seeking oravailable for work or unemployed if he/she is not work-ing but is either seeking or available for work for arelatively longer period of the specified reference period.
21. Principal Status is the status of activity on which aperson spent relatively longer time of the preceding 365days prior to the date of survey was considered theprincipal usual activity status of the person.
22. Subsidiary Status is a ‘non-worker’ (on the basis ofprincipal usual activity status) who pursued some gain-ful activity in a subsidiary capacity was considered tobe usually working in a subsidiary capacity.
23. Human Expenditure Ratio (HDR)—It is a percentageof State Income devoted to human priority concernsviz. elementary education, preventive health care, watersupply, sanitation and nutrition.
Glossary 143

B. Acronyms AIDS Acquired Immuno-deficiency SyndromeAIL Achievement Indices in LiteracyAAM Age at MarriageASDR Age Specific Death RateANC Ante Natal CareANM Auxiliary Nurses, MidwifeARl Acute Respiratory InfectionBMC Brihanmumbai Municipal CorporationBMI Body Mass IndexCAG Comptroller and Auditor GeneralCBR Crude Birth RateCDR Crude Death RateCBHI Central Bureau of Health IntelligenceCEHAT Centre for Enquiry into Health and Allied
ThemesCHC Community Health CentreCPIAL Consumer Price Index for Agricultural
LabourersCPIIW Consumer Price Index for Industrial WorkersCPINM Consumer Price Index for Non-manual
EmployeesCPR Couple Protection RateCSSM Child Survival and Safe MotherhoodCSO Central Statistical OrganisationCSR Child Sex RatioCSW Commercial Sex WorkerDDP District Domestic ProductDPAP Drought Prone Area ProgrammeDPEP District Primary Education ProgrammeDWCRA Development of Women and Children in
Rural AreasECG Electro Cardio GraphEGS Employment Guarantee SchemeEPI Expanded Immunisation ProgrammeESIS Employees State Insurance SchemeFRU First Stage Referral UnitsGDI Gender Development IndexGDP Gross Domestic ProductGEM Gender Empowerment MeasureGNP Gross Net ProductGoI Government of IndiaGoM Government of MaharashtraHDI Human Development IndexHDR Human Development ReportHER Human Expenditure RatioHFA Health For AllHP Health Post
HPI Human Poverty IndexICDS Integrated Child Development SchemeIIL Improvement Indices in LiteracyIIMR Improvement Indices in Infant Mortality RateIIPS International Institute for Population SciencesIMR Infant Mortality RateIRDP Integrated Rural Development ProgrammeIUD Intra Uterine DeviceLEB Life Expectancy at BirthMCACS Maharashtra State Aids Control SocietyMCH Maternal and Child HealthMMR Maternal Mortality RateMPW Multi Purpose WorkerNACP National Aids Control ProgrammeNCAER National Council for Applied Economic
ResearchNFHS National Family Health SurveyNGO Non-Governmental OrganisationNLEP National Leprosy Eradication ProgrammeNMEP National Malaria Eradication ProgrammeNSDP Net State Domestic ProductNSS National Sample SurveyNSSO National Sample Survey OrganisationOPD Out Patient DepartmentORT Oral Rehydration TherapyPCDDP Per Capita District Domestic ProductPDS Public Distribution SystemPEEP Primary Education Enhancement ProgrammePHC Primary Health CentrePHU Primary Health UnitPNDT Pre-Natal Diagnostic TechniquesPRC Population Research CentreRCH Reproductive and Child HealthRGI Registrar General, IndiaRNTCP Revised National Tuberculosis Control
ProgrammeRTI Reproductive Tract InfectionSAP Structural Adjustment ProgrammeSDP State Domestic ProductSRB Sex Ratio at BirthSRS Sample Registration SchemeSTD Sexually Transmitted DiseasesSTI Sexually Transmitted InfectionsTB TuberculosisTFR Total Fertility RateTRYSEM Training for Rural Youth for Self EmploymentUNDP United Nations Development ProgrammeWPR Work Participation RateZP Zilla Parishad
← Contents Annexures →
144 Human Development Report Maharashtra 2002

Annexures
I
District Domestic Product
1. ConceptFor purposes of problem assessment and policy design, ide-ally the concept of income with reference to any givengeographical unit/economic agent should be defined interms of final accrual. However, for reasons like lack ofinformation on income flows across regions or among eco-nomic agents, estimation of such a concept is not possible.For instance, we have only estimates of state domestic prod-uct originating within its geographical boundaries. For simi-lar reasons, the concept that can be estimated at the districtlevel may be defined by the ‘income originating’ approach.That is, it may be defined as the final bill of goods andservices produced within the physical boundaries of thegiven district. In other words, the concept is restricted to adocumentation of production activities.
Of course, there is the problem of locating activities forwhat are really supra-regional sectors like banking and in-surance, central government administration, and transportand communication. It may not be possible to take intoaccount the net income flows to local residents from migrantrelatives outside and vice versa. Similarly, a district may berich in terms of endowment of natural resources like mineraland forest resources and hence, may generate substantialroyalty income to the state. By this measure, the district maybe rich. However, the district could be really poor andbackward in terms of actual income accruing to the residents.For reasons like these, estimates of DDP may not reflect thereal economic endowment levels of the local residents andhence, welfare consequences of the growth process or differ-ent policy measure.
However, in the chapter on Human Development Indi -ces, the Per Capita District Domestic Product is on the basisof details available for 30 districts of Maharashtra. Since thenew districts are mere territorial divisions of existing districts,the following adjustments have been made. The Per CapitaDistrict Domestic Product (PCDDP) of Mumbai has beentaken to be that of Mumbai Suburban, PCDDP of Dhuleto be that of Nandurbar, PCDDP of Akola to be that ofWashim, PCDDP of Parbhani to be that of Hingoli, andthe PCDDP of Bhandara to be that of Gondiya.
The PCDDP has been made available by the Directorateof Economics and Statistics (2001) and has been estimated
using the ‘income originating approach’. District income hasbeen defined as the sum of economic value of all goods andservices produced within the district, irrespective of the factwhether persons inside the district own the income or out-side. In view of the open character of the economic activitiesand the absence of data relating to inter-district flows, the‘income-originating’ approach has been adopted though the‘income-accruing’ approach would have been preferred.
Availability of data presents problems, as data for primaryand registered manufacturing sector are available. Howeverdata for other sectors is not only scanty; often, it is unreliable.Hence, wherever basic data was available the methodologyused at the state level has been followed for the preparationof estimates at the district level. In other cases, dependingupon the availability of the data, relevant indicators havebeen utilised to allocate the state level estimates to the dis-tricts.
Hence, the district domestic product may be lookedupon as mere approximation to district income.
2. Methods of Estimation: A SurveyThis section provides a brief profile of the methodology usedin the estimation of district-wise domestic products in Ma-harashtra and their implications for a study like the one onregional aspects of human development.
District domestic products are estimated by methodssimilar to that used by the Central Statistical Organisationfor the national accounts: that is, a combination of produc-tion and income approaches (and also expenditure approach(e.g. construction) in a few cases). The state governmentdepartments have sought to generate estimates, to the extentpossible, with reference to direct estimates available from thedistricts. For this purpose, output originating within districtboundaries is classified into two categories:
(a) Product which can be estimated using direct infor-mation for the district; and
(b) product that has to be estimated using indirect in-dicators.
In spite of their best efforts, the states do not seem to havereally succeeded in sticking to this approach. Instead, theyseem to have resorted to different combinations of these twoapproaches depending upon data availability.
Annexures 145

For purposes of estimation, the entire district economy isclassified into the following categories:
(1) Primary sector covering agriculture, forestry, fisheries, mining and quarrying;
(2) Secondary sector including manufacturing (both registered and unregistered) construction, electri-city, gas and water supply; and
(3) the Tertiary sector covering railways, transport and storage, communication, trade, hotels and restaur-ant, banking and insurance, real estate, ownership of dwelling and business services, public administr-ation and other services.
Production approach is used largely for the primary andthe registered manufacturing sectors.
Agriculture:The value added in agriculture in a given district is estimatedon the basis of estimates of prices and output available forthe district concerned. For crops for which such details arenot available, but only estimates of area cultivated are avail-able, estimates of output are made on the basis of pilot/adhoc surveys or state-level estimates are allocated across dis-tricts as per the area estimates. However, estimates of valueadded are derived after deducting estimates of input costsinterpolated from state aggregates. Given the informationconstraint, this is the best option. However, the estimatesinterpolated from state-aggregates disregard the heterogene-ity across districts. Hence, they would suffer from the short-coming that they do not consider inter-regional variationsin yield and price levels.
Livestock:The state aggregates by type of livestock product are distrib-uted across districts with reference to the livestock popula-tion concerned. Ideally one should consider allowing fordifferences in cattle type and yield, estimates of district-wiselivestock population for different years with appropriateadjustments for inter-district migration of cattle over years.
Forestry and Logging:The estimates are based largely on district-wise estimates ofvalue of output available with the Forest Department andForest Development Corporation. Value added is obtainedby netting out.
Fishing:Estimates for this sector are based on district-wise estimatesof production and prices.
Mining and Quarrying:Estimates of output and prices are from districts. Input andcost estimates are from the state level. However, interpolatedcost estimates would distort the picture on income generatedin a district.
Manufacturing (registered):Value added estimates by districts are derived from the sched-ules of the Annual Survey of Industries.
Manufacturing (unregistered):State-level estimates are allocated with reference to work-force numbers. This approach ignores inter-district differ-ences in yield and price levels.
Construction:State estimates obtained by the expenditure approach areallocated with reference to workforce. There is a differencebetween workforce size by residence and that by place ofwork. DDP estimates for construction by district made withreference to workforce size by residence are likely to beaffected by variations in the difference caused by daily, sea-sonal and even permanent migration of workforce.
Electricity, Gas and Water Supply:For electricity value added from private companies is allottedto respective districts and value added by public institutionsis distributed to districts on the basis of workforce. In respectof water works, estimates are allotted on the basis of work-force only. However, in the case of gas units estimates aredistributed to districts on the basis of biogas plants in thedistrict.
Railways:The income from railways is allotted with reference to theworkforce.
Transport by Other Means and Storage:The district-wise estimates of income from mechanised roadtransport in the public, private and unorganised sectors onthe basis of district-wise workforce in the respective sub-sec-tors. A similar procedure is adopted for estimates of incomefrom storage.
Communication:The income is allocated across districts with reference toworkforce estimates.
Trade, Hotels and Restaurants:District-wise estimates are made with reference to workforcein Maharashtra State.
Real Estate, Ownership of Dwellings and BusinessServices:The allocation is made with reference to workforce estimates.
Public Administration:The workforce estimates are used as the relevant indicator.
Other Services:State level estimates are allocated with reference to workforcein the districts.
146 Human Development Report Maharashtra 2002

The valuation of district-wise quantities at state-levelprices would convey a misleading information about the realendowment levels across districts. Allocation of state aggre-gates with reference to workforce estimates or similar districtspecific indicator would not account for inter-regional het-erogeneity and consequent income difference.
II
National Sample Survey Data on Consumer
Expenditure
The National Sample Survey (NSS) is a socio-economicenquiry on a nationwide scale. It is carried out in the formof annual/biannual rounds. For this purpose, the NationalSample Survey Organisation (NSSO) has its own field officesspread all over the country. Since 1954 the State Govern-ments also carry out such surveys independently using thesame sample design and schedules as those of the NSSO.The State samples are generally as large as those of theNSSO. These two field operations constitute what are calledthe state and central samples of the NSS. The idea is toincrease the sample size by pooling the central and statesample results so as to permit disaggregated estimates at theregional level. Accordingly, the estimates of poverty at thestate/national level presented in this study are based on thecentral sample results and those at the district level are basedon pooled central and state sample results. The NSS collects information on various socio-economicaspects of households; household consumption is one of themost important. The data are collected on the basis ofhousehold interviews. For this purpose, the households areselected based on simple random sampling. The sampledesign is stratified and two-stage in both rural and urbansectors. Rural sector is stratified with respect to homogeneityof population density, cropping pattern, etc. while the urbansector with respect to population sizes of towns and cities.Villages are the first stage units in the rural sector; urbanblocks in the urban sector. The households constitute thesecond stage units in both the sectors.
The NSS concept of consumer expenditure includes allthe non-productive expenditure incurred by the households.It includes consumption out of home-grown produce, gifts,loans etc. Data on perquisites like food in the employer’shouse are not included in the NSS estimates of consumptionof the employee households. This must have resulted inunderestimation of food grain consumption by the employeehouseholds who in the rural sector are generally poor landlesshouseholds. In-kind wage payments, including preparedfood at the employer’s home, used to be quite common
during the fifties and sixties. There has been increasinglandlessness and actualisation of labour since the mid-sev-enties, which must have resulted in increasing market de-pendence of the poor. Such progressive market dependenceof the landless poor must have involved increasing moneti-sation of the labour market and hence, also that of theirconsumption. As a result, the extent of underestimation offood grains consumption by the poorer households andhence, overestimation of poverty must have declined. The NSS distinguishes between consumption fromhome-grown stock and those from market purchases; itvalues the former at farm harvest prices and the latter atmarket retail prices. Poverty estimates based on such datausing conventional statistical deflators may be valid in astationary context. The estimates lose their meaning andrelevance when the context itself undergoes a change, thatis, during a period of monetisation and urbanisation as foundin Maharashtra (Suryanarayana, 2000). Another major shortcoming, which has adversely affectedthe comparability of the NSS estimates of consumer expen-diture and hence, estimates of poverty for the year 1999–2000 with those for the earlier years, is the change in thereference period used for data collection. The NSSO gener-ally collects consumer expenditure data for a reference periodof thirty days. But during the 55th Round (1999–2000),the NSSO collected data (i) on food, pan, tobacco andintoxicants for two different reference periods of seven daysand 30 days; (ii) on remaining items for a reference periodof 365 days from the same households. This change inmethodology could have affected the comparability of theNSS estimates for the following reason. Earlier experimentsby the NSSO on reference periods have shown that estimatesof per capita expenditure on food obtained from one weekas a reference period are about 30 per cent higher than thoseobtained with one month as a reference period. Conversely,the estimates of non-food expenditure for a reference periodof 365 days are found to be lower (GoI, 2001c; p. 194).Their combined effect must have led to an overestimationof consumption by about 18 per cent. This is one reasonthat has to be kept in mind while comparing the results forthe year 1999–2000 with those for the earlier years andinterpreting the changes in them.
III
Expert Group Methodology on Poverty Line
The Planning Commission constituted an Expert Group in1989 to reconsider methodological and computational as-pects of poverty estimation. The Expert Group was to lookinto the methodology used to estimate incidence of poverty
Annexures 147

at the national as well as state levels. According to the ExpertGroup ‘the poverty line defines on an average the level ofper capita per day expenditure which meets a normativeminimum standard of living, deemed reasonable. Calorieintake is but one of the ingredients, though an importantone, of the minimum standard, but the poverty line makesan allowance for non-food consumption needs as well onthe basis of observed consumer behaviour. The Group rec-ognises the desirability of defining the normative standardfor non-food consumption and its constituents, withoutreference to actual behaviour, but until this is done, theexisting basis seems to be the most practical and reasonable.It is this consumption basket that constitutes the minimumstandard for defining the boundary between the poor andthe non-poor (GoI, 1993; p.30). The Expert Group hasrecommended that the all-India poverty lines and normssuggested by the Task Force (GoI, 1979) on minimum needsand effective consumption demand be the basis for furtherestimates of poverty. To begin with, state-specific poverty lines for the baseyear 1973–74 are to be estimated applying the same nationalliving standard norm uniformly to all states. This is to ensurecomparability of poverty estimates across states and overtime. For this purpose the ‘standardised commodity basketcorresponding to the poverty line at the national level’ is tobe valued at state specific prices in the base year. This is doneusing Fisher’s cost of living index estimated to captureinter-state price differentials with respect to all-India byChatterjee and Bhattacharya (1974) for the rural sector andthose by Minhas, Kansal and Jain (1992) for the urbansector. The state-sector-specific poverty lines for subsequentyears are to be updated by their respective consumer priceindices obtained as weighted state-sector-specific commod-ity group price indices where the weighting diagram is givenby the corresponding all-India consumption basket for thebase year poverty line. The Expert Group has recommendedthe use of published commodity group price indices fromthe Consumer Price Index for Agricultural Labourers(CPIAL) for the rural and a simple average of ‘suitablyweighted’ price indices from Consumer Price Index for In-dustrial Workers (CPIIW) and Consumer Price Index forNon-manual Employees (CPINM) for the urban sector forpurposes of consumer price indices. Given the state-specificpoverty lines, the corresponding poverty ratios are to beestimated relying ‘exclusively’ on the NSS size distributionof per capita consumption expenditure. And all-India pov-erty ratios are to be obtained as ‘a ratio of the aggregatenumber of State-wise poor persons to the total all-India(rural and urban) population’ (GoI, 1993; p. 34).
The poverty lines obtained for the rural and urban sectorsof Maharahstra and all-India as per the Expert Group meth-odology are as follows:
(per capita per month in Rs)
Year Maharashtra All-India
Rural Urban Rural Urban1973–74 50.47 58.64 49.63 56.961977–78 58.07 74.64 56.84 72.501983 88.24 127.23 89.45 117.641987–88 115.61 184.45 115.43 165.581993–94 194.94 328.56 205.84 281.351999–00 318.63 539.71 327.56 454.11
Source: Gol (1993, 2000 and 2001b).
IV
Methodology for the Construction of the
HDI
A country’s deprivation with respect to each of the indicatorsis calculated using the following formula:
I(i, j) = j
[(max X (i, j) − X (i, j)]/Range (i)
Where:
I(i, j) is the deprivation indicator for the jth country withrespect to the ith variablemax X(i, j) is the maximum of X(i, j) across countries
jX(i, j) is the value of the ith variable for the jth countryRange(i) is the range of the ith variable across countries
In the next step, an average deprivation indicator I(j) for eachcountry is calculated by taking a simple average of thedeprivation indicators:
I(j) = ∑ i = 1
3
I(i, j) /3
The HDI for the jth country is then derived as (1– averagedeprivation index)i.e. HDI(j) = 1 − I(j)
Using this methodology a Human Development Index hasbeen developed for the districts of Maharashtra. The indi-cators used have been literacy and mean years of schoolingto represent attainment in education. The weights attachedhave been two-thirds and one-third respectively. Attainmentin health has been represented by the indicator infant mor-tality rate, as data for life expectancy at the district level isnot available. Income has been represented by the Per CapitaDistrict Domestic Product at constant prices (1993–94) forthe year 1998–99.
Data SourcesData for literacy levels for 2001 has been taken from the
148 Human Development Report Maharashtra 2002

census documents and mean years of schooling have beencalculated using the data on enrolment made available bythe Directorate of Economics and Statistics. Data on infantmortality rates at the district level for 1991 is available inthe Registrar General of India (1997), which is based on theCensus Data. The Directorate of Economics and Statistics(2001) provided the Income Data for the districts.
V
Methodology for the Construction of
Achievement Indices in Education
The achievement indices and improvement indices con-structed by Kakwani (1993) enabies the comparison ofachievements (levels) and improvements (changes) in thestandards of living as indicated by literacy rates or infantmortality rates across regions. These indicators have asymp-totic limits reflecting physical and biological maxima. Also,the relationship between achievement and values of the in-dicators is not linear, as an incremental improvement at ahigher limit of achievement would represent higher levels ofachievement than similar incremental improvements from alower base. Hence, the observed differences in the levels ofthe social indicators do not reflect their true achievement.An axiomatic approach is used to derive an achievementindex, which is normalised to lie between 0 and 1. Theachievement function derived accommodates the view thatan improvement in the standard of living of a country whenit is already at a higher level signifies an achievement greaterthan that of another with an equal increase from a lowerbase. The improvement index is then derived as the differ-ence between the values of the achievement index in twotime-periods. Since the achievement function is defined asa univariate function of the indicators of well being, theimprovement index so obtained is additive.
This methodology is used to measure the levels andimprovements in literacy rates across the districts of Ma-harashtra over the period 1991–2001. Let x be the literacyrate of a country which has m and M as lower and upperbounds, respectively. M is an asymptotic limit in the sensethat x never reaches this value, although it may come arbi-trarily close to M. Let m be the lower bound for x. Kakwani(1993) attempts to define an appropriate index Q (x1, x2,m, M) to measure a country’s improvement when the valueof the indicator x moves x1 to x2 . Suppose f (x, m, M) isthe achievement function which is equal to 0 if x = m and1 if x approaches M; thus it lies between 0 and 1. Anachievement index that lies between 0 and 1 is specified as:
f (x, m, M) = g (M – m) – g (M – x)/g (M – m)
f (x, m, M) will lie between 0 and 1 for all g(x)
provided g′(x) > 0, g(x) > 0 for x > 0 and lim g(x) = 0, as x approaches 0.
As the literacy rate increases, a further increase must beregarded as a greater achievement than an equal increase atlower levels of literacy rate. In other words, g(x) must be aconcave function. Kakwani (1993) uses a concave functionwhich has been used by Atkinson and is given by g(x) = Ln(x) for e = 1 which provides a class of achievement functions.
f (x, m, M)
= Ln (M – m) – Ln (M – x)/Ln (M – m) for e = 1
where Ln stands for natural logarithm. The achievementfunction is zero when x = m and it approaches unity whenx approaches M. Kakwani states that it is customary to defineLn (x) approaching to zero as x approaches zero. However,in the data set of this paper, this functional form does notgive results. Hence the functional form of achievement indexin literacy (AIL) used in this paper is
AIL (x) = g (M – m) – g (M – x)/g (M – m)
or
1 – [g (M – x)/g (M – m)]
where g (.) is a positive, increasing function with lim g(x) =0 as x approaches 0.
The improvement index for literacy (IIL) is defined as:
IIL = Ln (M – x1) – Ln (M – x2)/Ln(M – m)
The Achievement Indices using M to be 100 and m to be10 for 1991 and 2001 and the Improvement Index for1991–2001 have been presented in Table 8.3.
VI
Methodology for the Construction of
Achievement Indices in Health
With reference to infant mortality rates, the functional formas given by Kakwani (1993) does not give adequate results.Hence, the functional form as given by Datta et al (1997)has been used. The achievement index for infant mortality(AIIMR) is defined as
AIIMR (x) = 1 – ((x – m)/(M – m)) ^ 0.5
Where x = the actual infant mortality rate, m and M as thelower and upper bounds. The maximum and minimumvalues have been taken to be larger and smaller, respectivelythan the actual extreme points observed during the referenceperiod. The improvement index is the difference betweenthe achievement indices in the two time-periods
IIMR = AIMR(t) – AIMR(t – 1)
This implies that higher the Index value, better is theperformance in reducing the IMR. The Achievement Indices for 1981 and 1991, using thelower and the upper limit as 30 and 180, and the Improve-ment Index for 1981–1991 are presented in Table 8.4.
← Contents Annexure Tables—Key Indicators: Table 1 →
Annexures 149

Annexure Tables: Index
1 Key Indicators 1 Interstate Comparison of Key Indicators 151
2 Population 2 District-wise Population of Persons Males and Females and Decadal Growth Rate for the Years
1961, 1971, 1981, 1991 and 2001 155 3 District-wise Density and Sex-Ratio for the Years 1961, 197l, 1981, 1991 and 2001 157 4 District-wise Scheduled Castes Population and Percentage to the Total Population for the Years
1961, 1971, 1981 and 1991 158 5 District-wise Scheduled Tribes Population and Percentage to the Total Population for the Years
1961, 1971, 1981 and 1991 159 6 District-wise Number of Main Workers and Work Participation Rate as per 1961 Census 160 7 District-wise Number of Main Workers and Work Participation Rate as per 1971 Census 161 8 District-wise Number of Main Workers and Work Participation Rate as per 1981 Census 162 9 District-wise Number of Main Workers and Work Participation Rate as per 1991 Census 16310 District-wise Number of Main Workers and Work Participation Rate as per 2001 Census 16411 Participation Rate of Male and Female Among Main Workers and Marginal Workers as per
Population Census 2001 16512 Under-5 Mortality Rate for Boys and Girls (1970–1998) 166
3 Economic Growth and Poverty13 Persondays Created under EGS for the Years 1990–91, 1995–96 and 1999–2000 16714 District Income at Current Prices for the Years 1993–94, 1997–98, and 1998–99 16815 District Income at Constant Prices for the Years 1993–94, 1997–98 and 1998–99 16916 Percentage Share of District Income (NDDP) to State Income at Current and Constant Prices 17017 Sector-wise Percentage Share in Total District Income at Current Prices 17118 Sector-wise Percentage Share in Total District Income at Constant (1993–94) Prices 17219 Employment in Central Government, State Government and Local Bodies for 2000 17320 Employment in Central Government Quasi and State Government Quasi for 2000 17421 Number of Families Below Poverty Line for 1997–98 17522 Agricultural Wage Rate per Day for Males and Females 17623 Employment in Central Government, State Government and Local Bodies (1996–2000) 17824 Selected Indicators of Human Development 17925 Estimates of Per Capita Intake of Calories, Protein and Fat per Diem by Decile Groups:
Urban Maharashtra 18025A Monthly Per Capita Cereal Consumption (Kg) by Select Decile Groups: Maharashtra 18126 Growth in State Domestic Product at Factor Cost by Sector, Maharashtra, 1960–2000 18227 EGS: A Statistical Profile 18327A Sectoral Growth Performance during different Five Year Plan Periods—Maharashtra and
All India (Average Growth Rate: Per Cent Per Annum) 184
4 Health and Nutrition28 Number of Medical Institutions for 1961, 1971, 1981, 1991 and 2000, and Annual Growth
Ratio for 1961 to 2000 and 1991 to 2000 185
Annexure Tables: Index a

29 Population per Government Medical Institution and Number of Medical Institutions per lakh population for 1961, 1971, 1981, 1991 and 2000 186
30 Number of PHCs, Population per PHC, and Number of PHCs per lakh population for 1961, 1971, 1981, 1991 and 2000 187
31 Number of Sub-Centres, Population per Sub-Centre and Sub-Centre per lakh population for 1991 and 2000 189
32 Number of Beds in Medical Institutions* for 1961, 1971, 1981, 1991 and 2000, and Annual Growth Rate for 1961 to 2000 and 1981 to 2000 190
33 Population per Bed, and Beds per lakh population for the Years 1961, 1971, 1981, 1991 and 2000 191
34 Total ANC Registered and Total Deliveries Conducted by Various Attentions for 2000–01 19235 Infant and Children’s Immunisation Programme for the Year 2000–01 19336 AIDS Cases Surveillance for the period—August 1986 to February 2001 19537 Reproductive and Child Health Indicators–1997 19638 Fertility and Child Mortality Indicators–1991 19739 Average Population covered by PHCs, CHCs annd Sub-Centres 19840 Prevalence Rate of Leprosy and Malaria Eradication Programmes 19941 District-wise Beneficiaries Covered Under ICDS Programme for the Year 2000–01 20042 District-wise Unnatural Deaths and Number of Unnatural Deaths per lakh population
for the Year 1999 20343 Rural-Urban Differentials in Availability of Medical Manpower, Maharashtra, 1981 and 1991 20444 Percentage of Couples Effectively Protected by Various Family Planning Methods 2000–01 20545 Number of Beneficiaries under Supplementary Nutrition Programme (ICDS Programme)
in the Month of March 1996–2000 20646 Selected District-wise Child Health Indicators, Maharashtra, 1998–99 20747 Percentage of Males and Females having at least one of RTI/STI Symptoms, Maharashtra 20848 Health Care Indicators across Selected States in India 20949 Availability of Health Care Infrastructure Facilities in Maharashtra by Districts 21150 Number of Hospitals, Dispensaries, Beds, Doctors and Nurses per 1,00,000 population
in Selected States 1981–1995/1997 21251 Total Health Expenditure and Per Capita Expenditure on Health and Health Expenditure
as a Percentage of NSDP for Some Major States 21352 Summary of Information on Studies Covering Morbidity and Utilisation of Health Care
Services from the Private Sector and on Medical Expenditure in Maharashtra 21453 Per cent Utilising Health Care Services from Private Sector for Selected RCH Services
by Districts, Maharashtra, 1998–99 216
5 Education54 Management-wise Number of Primary Schools for the Years 1990, 1995 and 2000 21755 Number of Preprimary Schools, their Enrolment and Number of Teachers for the Years
1990 and 2000 21956 Number of Lower Primary Schools and their Enrolment for the Years 1990, 1995 and 2000 22057 Number of Upper Primary Schools and their Enrolment for the Years 1990, 1995 and 2000 22158 Number of Total Primary Schools and their Enrolment for the Years 1990, 1995 and 2000 22259 Number of Teachers in Lower and Upper Primary Schools and Teacher–Pupil Ratio for the
Year 1990 22360 Number of Teachers in Lower and Upper Primary Schools and Teacher–Pupil Ratio for the
Year 1995 22461 Number of Teachers in Lower and Upper Primary Schools and Teacher–Pupil Ratio for the
Year 2000 225
b Human Development Report Maharashtra 2002

62 Number of Secondary and Higher Secondary Schools and their Enrolment for 1990 226 63 Number of Secondary and Higher Secondary Schools and their Enrolment for 1995 227 64 Number of Secondary and Higher Secondary Schools and their Enrolment for 2000 228 65 Management-wise Number of Secondary and Higher Secondary Schools (1990) 229 66 Management-wise Number of Secondary and Higher Secondary Schools (1995) 230 67 Management-wise Number of Secondary and Higher Secondary Schools (2000) 231 68 Number of Teachers in Secondary and Higher Secondary Schools and Teacher–Pupil Ratio
(1990) 232 69 Number of Teachers in Secondary and Higher Secondary Schools and Teacher–Pupil Ratio
(1995) 233 70 Number of Teachers in Secondary and Higher Secondary Schools and Teacher–Pupil Ratio
(2000) 234 71 Enrolment Ratio to Age-Groups 6–11, 11–14 and 6–14 (1990) 235 72 Enrolment Ratio to Age-Groups 6–11, 11–14 and 6–14 (1995) 236 73 Enrolment Ratio to Age-Groups 6–11, 11–14 and 6–14 (2000) 237 74 Senior Colleges, their Enrolment and Number of Teachers 238 75 Senior Colleges, their Enrolment and Number of Teachers (1995) 239 76 Junior and Senior Colleges, their Enrolment and Number of Teachers (2000) 240 77 District-wise Literacy Percentage for the Years 1961, 1971, 1981, 1991 and 2001 241 78 S.S.C. and H.S.C. Examination Results, March 2000 243 79 School Attendance Rate of Boys and Girls for the Age Group 6–14 years (2000) 245 80 Percentage of Population Completed at least Middle Level (Upto VII Std.)—1991 246 81 District-wise Distribution of Educational Institutions during 1970–2000 247 82 Number of Students at Different Levels of Education for every one lakh population—1998–99 248 83 Children’s Primary Activity 249 84 Schools, Teachers and Students Ratio-Time Series 250 85 Percentage of Household Population of Age 6–17 Years Attending School by Sex and Area—
1998–99 251 86 Stage-wise Enrolment: Total and Girls Primary and Secondary Schools (1985–1999) 252 87 Standard-wise Enrolment: Total and Girls Primary, Secondary Schools and Colleges, 1998–99 253 88 Retention Rates at Different Stages 254 89 Percentage of Educational Attainments of Different Social Groups in Maharashtra 255
6 Gender Issues 90 Percentage of Child Population and Sex Ratio in Age Group 0–6 as per 1991 and 2001 256 91 Number of Primary Schools, High Schools and Colleges for Girls—1995 257 92 Number of Primary Schools, High Schools and Colleges for Girls—2000 258 93 Women’s Literacy Rate as per 1961, 1971, 1981, 1991 and 2001 Censuses 259 94 Women’s Participation in Local Bodies as on 1 April 2001 261 95 Women Employment Rate (per cent) for 2000 263 96 Crimes Against Women 264 97 Performance of States with Respect to Different Measures of Gender Development 265 98 Some Important Demographic Indicators–2001, India and Maharashtra 266 99 Singulate Mean Age at Marriage 267100 Percentages of Family Planning Acceptors by Various Methods 268101 Indicators of Reproductive and Child Health in Maharashtra 269102 Division-wise Distribution of Literate and Non-literate in Maharashtra 271103 Number of Women Engaged in Household Duties (Principal Status) and also Participating
in Specified Additional Activities per 1000 Women Engaged in Household Duties 272
Annexure Tables: Index c

104 Number of Persons in the Labour Force per 1000 Persons: Usual Status, Current Weekly Status and Current Daily Status for Maharashtra and India: 1999–2000 273
105 Percentage of Women Members in Maharashtra Legislative Assembly: 1937–2000 274106 Percentage of Women Members in Maharashtra Legislative Council: 1937–1996 275107 All Women Panchayats in Maharashtra 276107A Percentage Distribution of Population by Marital Status and Age in Maharashtra, 1996 277108 Gender Dimensions in Educational Attainment 278
7 Human Development Indicators109 Infant Mortality Rate and Child Mortality Rate—1991 279110 Nutrition (below 2 years of age)—1997 280111 HDI and Per Capita District Domestic Product (at current prices) 281112 Literacy Rate, Mean Year of Schooling and Dropout Rate 282113 Achievement and Improvement Indices for Literacy (1991–2001) 283114 Achievement and Improvement Indices for IMR (1981–1991) 284115 District-wise Classification of Village Amenities 285116 Percentage Distribution of Census Houses by Kutcha, Semi Pucca and Pucca, and
Households Having Facilities Available 286117 HDI, AIL, AIIMR, IIL and IIIMR 287
Key Indicators: Table 1 →
Population: Tables 2–12 →
Economic Growth and Poverty: Tables 13–27A →
Health and Nutrition: Tables 28–53 →
Education: Tables 54–89 →
Gender Issues: Tables 90–108 →
Human Development Indicators: Tables 109–117 →
← Contents
d Human Development Report Maharashtra 2002

Key IndicatorsTable 1
Interstate Comparison of Key Indicators
Sr.No. State
Crude Birth Rate 1999 Crude Death Rate 1999Total Fertility Rate (TFR)
1997–98Couple
Protected31-3-2001*
Total Rural Urban Total Rural Urban Total Rural Urban
1 2 3 4 5 6 7 8 9 10 11 12
1 Andhra Pradesh 21.7 22.0 20.6 8.2 9.0 5.7 2.4 2.6 2.1 5.8
2 Assam 27.0 28.0 18.9 9.7 10.1 6.2 3.2 3.4 2.0 15.2
3 Bihar 31.5 32.4 25.2 8.9 9.2 7.1 4.3 4.5 3.1 21.2
4 Gujarat 25.4 27.0 22.0 7.9 8.8 5.9 3.0 3.3 2.5 52.8
5 Haryana 26.8 27.7 23.3 7.7 8.0 6.4 3.3 3.5 2.7 49.4
6 Karnataka 22.3 23.7 19.2 7.7 8.7 5.5 2.4 2.6 2.0 56.3
7 Kerala 18.0 18.1 17.7 6.4 6.5 6.3 1.8 1.8 1.9 39.6
8 Madhya Pradesh 31.1 33.1 23.6 10.4 11.1 7.6 3.9 4.1 2.6 45.9
9 Maharashtra 21.1 21.6 20.3 7.5 8.7 5.6 2.7 2.9 2.3 49.3
10 Orissa 24.1 24.6 20.3 10.7 11.1 7.1 2.9 3.0 2.3 37.6
11 Punjab 21.5 22.5 18.6 7.4 7.9 6.1 2.6 2.7 2.1 65.5
12 Rajasthan 31.1 32.5 24.9 8.4 8.9 6.4 4.1 4.4 3.0 36.1
13 Tamil Nadu 19.3 19.8 18.2 8.0 8.7 6.6 2.0 2.1 1.8 50.4
14 Uttar Pradesh 32.8 33.9 27.5 10.5 11.1 8.1 4.6 4.8 3.6 38.0
15 West Bengal 20.7 22.9 14.3 7.1 7.2 6.8 2.4 2.7 1.7 32.2
India 26.1 27.6 20.8 8.7 9.4 6.3 3.2 3.5 2.4 46.2
* Provisional figures.Source: (1) Cols 3 to 8: SRS Bulletin, April 2001.
(2) Cols 9 to 11: Statistical Report, 1998 of SRS.(3) Col. 12: Department of Family Welfare, Government of India, New Delhi.
Annexure Tables 151

Key IndicatorsTable 1 (continued)
Interstate Comparison of Key Indicators
Sr.No. State
Infant Mortality Rate–1999
Neo-NatalMortality
Rate–1999
ChildMortality
Rate–1999
Percentage ofBirths Order
(4th andHigher)
Medical Attentionat Birth
Total Urban Rural Institut-ional
TrainedProfessionals
1 2 13 14 15 16 17 18 19 20
1 Andhra Pradesh 66 75 37 46 18.1 7.8 42.8 27.7
2 Assam 76 79 36 51 27.5 25.9 21.1 16.1
3 Bihar 63 64 55 44 22.9 33.0 15.4 19.4
4 Gujarat 63 70 45 44 19.6 16.8 36.3 38.3
5 Haryana 68 70 58 41 22.4 19.5 24.7 68.1
6 Karnataka 58 69 24 42 16.7 12.9 49.2 26.0
7 Kerala 14 14 16 11 3.6 5.1 97.1 1.8
8 Madhya Pradesh 90 96 55 61 32.6 25.8 14.7 22.1
9 Maharashtra 48 58 31 29 12.7 15.5 47.8 20.6
10 Orissa 97 100 65 60 29.0 21.4 13.9 24.0
11 Punjab 53 57 39 33 16.8 13.4 12.7 86.1
12 Rajasthan 81 85 59 50 27.7 26.4 8.0 26.3
13 Tamil Nadu 52 58 39 35 13.0 6.9 64.8 21.5
14 Uttar Pradesh 84 88 66 52 29.6 36.4 7.8 42.0
15 West Bengal 52 55 40 30 15.0 16.1 36.2 13.9
India 70 75 44 45 22.5 23.9 25.4 28.8
Source: Cols 13 to 15: SRS Bulletin, April 2001.Cols 16 to 20: Statistical Report, 1998, SRS.
152 Human Development Report Maharashtra 2002

Key IndicatorsTable 1 (continued)
Interstate Comparison of Key Indicators
Sr.No. State
Life Expectancyat Birth–1997
Mean Age atMarriage—1998–99 Literacy Rate–2001 Adult Literacy
Rate 1991Male Female Male Female Total Male Female
1 2 21 22 23 24 25 26 27 28
1 Andhra Pradesh 61.2 63.5 23.9 18.3 61.11 70.85 51.17 38.5
2 Assam 56.6 57.1 27.8 21.7 64.28 71.93 56.03 49.6
3 Bihar 60.4 58.4 23.8 18.8 47.53 60.32 33.57 24.8
4 Gujarat 60.9 62.9 24.4 20.2 69.97 80.50 58.60 55.9
5 Haryana 63.7 64.6 24.6 19.8 68.59 79.25 56.31 48.9
6 Karnataka 61.6 64.9 26.7 20.1 67.04 76.29 57.45 50.9
7 Kerala 70.4 75.9 27.9 21.5 90.92 94.20 87.86 88.0
8 Madhya Pradesh 55.6 55.2 23.5 18.9 64.11 76.80 50.28 40.0
9 Maharashtra 64.1 66.6 25.3 19.8 77.27 86.27 67.51 60.4
10 Orissa 57.1 57.0 26.6 21.2 63.61 75.95 50.97 46.1
11 Punjab 66.7 68.8 25.7 22.1 69.95 75.63 63.55 52.9
12 Rajasthan 59.1 60.1 22.3 18.3 61.03 76.46 44.34 35.5
13 Tamil Nadu 63.2 65.1 26.6 20.9 73.47 82.33 64.55 57.0
14 Uttar Pradesh 58.1 56.9 23.3 19.0 57.36 70.23 42.98 38.6
15 West Bengal 62.2 63.6 26.2 19.6 69.22 77.58 60.22 56.2
India 60.4 61.8 24.9 19.7 65.38 75.85 54.16 48.5
Source: (1) Cols 21 & 22: Statistical Report, 1998 of SRS.(2) Cols 23 & 24: NFHS-2, 1998–99.(3) Cols 25 to 28: Population Census, 2001.
Annexure Tables 153

Key IndicatorsTable 1 (concluded)
Interstate Comparison of Key Indicators
Sr.No. State
Per CapitaNSDP
1998–99
Percentage of Households with Amenities–1991
ElectricitySafe Drinking
Water Toilets PuccaSemi-Pucca
Katcha
1 2 29 30 31 32 33 34 35
1 Andhra Pradesh 13853 46.30 55.08 18.40 38.41 22.58 39.01
2 Assam 8,700 18.74 45.86 37.43 14.62 15.16 70.22
3 Bihar 5,923 12.57 58.76 11.75 30.18 36.00 33.82
4 Gujarat 18,792 65.93 69.78 30.69 56.93 39.01 4.06
5 Haryana 19,773 70.35 74.32 22.45 50.14 35.73 14.13
6 Karnataka 15,889 52.47 71.68 24.13 42.55 40.90 16.55
7 Kerala 17,756 48.43 18.89 51.28 55.97 19.13 24.90
8 Madhya Pradesh 10,147 43.30 53.51 15.07 30.97 64.87 4.66
9 Maharashtra 20,644 69.4 68.49 29.56 57.93 32.24 9.83
10 Orissa 8,719 23.54 39.07 9.81 18.71 22.06 59.23
11 Punjab 20,834 82.31 92.74 33.18 76.97 11.07 11.96
12 Rajasthan 11,045 35.03 58.96 19.57 56.13 22.94 20.93
13 Tamil Nadu 17,525 54.74 67.42 23.13 45.54 18.03 36.44
14 Uttar Pradesh 9,261 21.91 62.24 18.02 41.03 30.34 28.63
15 West Bengal 12,961 32.90 81.98 31.51 32.61 29.38 38.01
India 14,712 42.37 62.30 23.70 41.61 30.95 27.44
Source: (1) Col. 29: Directorate of Economics and Statistics of respective States and C.S.O., New Delhi.(2) Cols 30 to 35: Population Census–1991.
Population: Tables 2 – 12 →
← Contents
154 Human Development Report Maharashtra 2002

PopulationTable 2
District-wise Population of Persons Males and Females andDecadal Growth Rate for the Years 1961, 1971, 1981, 1991 and 2001
Sr.No. District
Total Population
1961 1971 1981
Persons Males Females Persons Males Females Persons Males Females
1 2 3 4 5 6 7 8 9 10 11 1 Mumbai # 4152056 2496176 1655880 5970575 3478378 2492197 8243405 4652646 3590759 2 Thane 1652678 861117 791561 2281664 1204855 1076809 3351562 1779645 1571917 3 Raigad 1058855 514534 544321 1263003 614278 648725 1486452 726512 759940 4 Ratnagiri 1827203 816804 1010399 1990583 886995 1103588 2111311 943395 1167916 5 Sindhudurg – – – – – – – – – 6 Nashik 1855246 953531 901715 2369221 1221419 1147802 2991739 1544532 1447207 7 Dhule 1351236 686942 664294 1662181 849601 812580 2050294 1043140 1007154 8 Nandurbar – – – – – – – – – 9 Jalgaon 1765047 902001 863046 2123121 1089840 1033281 2618274 1342963 127531110 Ahmednagar 1775969 905313 870656 2269117 1160205 1108912 2708309 1382632 132567711 Pune 2466880 1268710 1198170 3178029 1643864 1534165 4164470 2150088 201438212 Satara 1430105 698555 731550 1727376 848092 879284 2038677 989122 104955513 Sangli 1230716 628754 601962 1539820 790165 749655 1831212 931187 90002514 Solapur 1860119 960655 899464 2253840 1165927 1087913 2610144 1344147 126599715 Kolhapur 1596493 811693 784800 2048049 1045474 1002575 2506330 1273881 123244916 Aurangabad 1532341 781635 750706 1971006 1014481 956525 2433420 1249632 118378817 Jalna – – – – – – – – –18 Parbhani 1206236 611787 594449 1506771 768662 738109 1829378 929638 89974019 Hingoli – – – – – – – – –20 Beed 1001466 508827 492639 1286121 658204 627917 1486030 755971 73005921 Nanded 1079674 547974 531700 1397762 714820 682942 1749334 892417 85691722 Osmanabad 1477656 758235 719421 1896687 975484 921203 2230620 1139197 109142323 Latur – – – – – – – – –24 Buldhana 1059698 541026 518672 1262978 646303 616675 1508777 770833 73794425 Akola 1189354 613832 575522 1501478 773569 727909 1826952 937824 88912826 Washim – – – – – – – – –27 Amaravati 1232780 637861 594919 1541209 798073 743136 1861410 961564 89984628 Yavatmal 1098470 557010 541460 1423677 726072 697605 1737423 887236 85018729 Wardha 634277 322894 311383 779562 400040 379522 926618 475696 45092230 Nagpur 1512807 784161 728646 1942688 1010911 931777 2588811 1345377 124343431 Bhandara 1268286 635174 633112 1585580 798072 787508 1837577 920159 91741832 Gondia – – – – – – – – –33 Chandrapur 1238070 623681 614389 1640137 832567 807570 2055642 1045692 100995034 Gadchiroli – – – – – – – – –
Maharashtra 39553718 20428882 19124836 50412235 26116351 24295884 62784171 32415126 30369045
# Includes Mumbai City and Mumbai Suburban District.Source: Population Census.
Annexure Tables 155

PopulationTable 2 (continued)
District-wise Population of Persons Males and Females andDecadal Growth Pate for the Years 1961, 1971, 1981, 1991 and 2001
Sr.No. District
1991 2001* Decadal Growth Rate
Persons Males Females Persons Males Females 1961–71 1971–81 1981–91 1991–2001
1 2 12 13 14 15 16 17 18 19 20 21 1 Mumbai # 9925891 5460145 4465746 11914398 6577902 5336496 (+)43.80 (+)38.07 (+)20.41 (+)20.03
2 Thane 5249126 2792874 2456252 8128833 4377806 3751027 (+)38.06 (+)46.89 (+)56.62 (+)54.86
3 Raigad 1824816 907907 916909 2205972 1116821 1089151 (+)19.28 (+)17.69 (+)22.76 (+)20 .89
4 Ratnagiri 1544057 700190 843867 1696482 794431 902051 (+)8.94 (+)6.06 (+)11.92 (+)9.85
5 Sindhudurg 832152 389384 442768 861672 414900 446772 – – (+)6.56 (+)3.55
6 Nashik 3851352 1984973 1866379 4987923 2591980 2395943 (+)27.70 (+)26.28 (+)28.73 (+)29.51
7 Dhule 1473170 757268 715902 1708993 878538 830455 (+)23.01 (+)23.35 (+)23.68 (+)16.01
8 Nandurbar 1062545 538020 524525 1309135 662764 646371 – – – (+)23.21
9 Jalgaon 3187634 1642873 1544761 3679936 1904437 1775499 (+)20.29 (+)23.32 (+)21.75 (+ )15.44
10 Ahmednagar 3372935 1730609 1642326 4088077 2106501 1981576 (+)27.77 (+)19.36 (+)24.54 (+)21.20
11 Pune 5532532 2861460 2671072 7224224 3768001 3456223 (+)28.83 (+)31.04 (+)32.85 (+)30.58
12 Satara 2451372 1208375 1242997 2796906 1402301 1394605 (+)20.79 (+)18.02 (+)20.24 (+)14.10
13 Sangli 2209488 1128521 1080967 2581835 1319267 1262568 (+)25.12 (+)18.92 (+)20.66 (+)16.85
14 Solapur 3231057 1670516 1560541 3855383 1990661 1864722 (+)21.17 (+)15.81 (+)23.79 (+)19.32
15 Kolhapur 2989507 1524732 1464775 3515413 1803746 1711667 (+)28.28 (+)22.38 (+)19.28 (+)17.59
16 Aurangabad 2213779 1151693 1062086 2920548 1521632 1398916 (+)28.63 (+)23.46 (+)39.60 (+)31.93
17 Jalna 1364425 696798 667627 1612357 825977 786380 – – (+)32.45 (+)18.17
18 Parbhani 1293104 661700 631404 1491109 761937 729172 (+)24.92 (+)21.41 (+)15.72 (+)15.31
19 Hingoli 823931 422094 401837 986717 505188 481529 – – – (+)19.76
20 Beed 1822072 937410 884662 2159841 1120664 1039177 (+)28.42 (+)15.54 (+)22.61 (+)18.54
21 Nanded 2330374 1197876 1132498 2868158 1476301 1391857 (+)29.46 (+)25.15 (+)33.21 (+ )23.08
22 Osmanabad 1276327 658896 617431 1472256 762947 709309 (+)28.36 (+)17.61 (+)23.95 (+)15.35
23 Latur 1676641 863203 813438 207237 1074321 1003916 – – (+)29.38 (+)23.95
24 Buldhana 1886299 966017 920282 2226328 1144314 1082014 (+)19.18 (+)19.46 (+)25.02 (+)18.03
25 Akola 1351959 699012 652947 1629305 840883 788422 (+)26.24 (+)21.68 (+)21.20 (+)21.51
26 Washim 862312 443136 419176 1019725 525806 493919 – – – (+)18.25
27 Amaravati 2200057 1136314 1063743 2606063 1343572 1262491 (+)25.02 (+)20.78 (+)18.1 9 (+)18.45
28 Yavatmal 2077144 1064422 1012722 2460482 1267117 1193365 (+)29.61 (+)22.04 (+)19.55 (+)18.46
29 Wardha 1067357 550370 516987 1230640 635751 594889 (+)22.91 (+)18.86 (+)15.19 (+)15.30
30 Nagpur 3287139 1710404 1576735 4051444 2095489 1955955 (+)28.79 (+)33.26 (+)26.97 (+ )23.25
31 Bhandara 1021408 515772 505636 1135835 573184 562651 (+)24.59 (+)15.89 (+)14.70 (+)11.20
32 Gondia 1086221 544503 541718 1200151 598447 601704 – – (+)10.49
33 Chandrapur 1771994 909787 862207 2077909 1059875 1018034 (+)32.48 (+)25.33 (+)25.06 (+)17.26
34 Gadchiroli 787010 398364 388646 969960 490809 479151 – – (+)23.48 (+)23.25
Maharashtra 78937187 40825618 38111569 96752247 50334270 46417977 (+)27.45 (+)24.54 (+)25.73 (+)22.57
* Figures are provisional. # Includes Mumbai City and Mumbai Suburban District.
Source: Population Census.
156 Human Development Report Maharashtra 2002

PopulationTable 3
District-wise Density and Sex-Ratio for the Years 1961, 197l, 1981, 1991 and 2001
Sr.No. District
Density Sex Ratio (per thousand males)
1961 1971 1981 1991 2001* 1961 1971 1981 1991 2001*
1 2 3 4 5 6 7 8 9 10 11 12 1 Mumbai # 9486 9901 13644 16461 19759 663 716 772 818 811 2 Thane 180 239 349 549 850 919 894 883 879 857 3 Raigad 151 175 208 255 308 1058 1057 1047 1010 975 4 Ratnagiri 142 153 167 188 207 1237 1244 1258 1205 1135 5 Sindhudurg – – 148 160 165 – – 1204 1137 1077 6 Nashik 119 152 192 248 321 946 940 938 940 924 7 Dhule 108 126 156 193 212 967 956 966 958 945 8 Nandurbar – – – – 260 – – – – 975 9 Jalgaon 155 180 223 271 313 957 948 950 940 93210 Ahmednagar 106 133 159 198 240 962 956 959 949 94111 Pune 158 203 266 354 462 944 933 938 933 91712 Satara 137 165 195 234 267 1047 1037 1061 1029 99513 Sangli 143 180 213 258 301 957 949 967 958 95714 Solapur 124 150 174 217 259 936 933 942 934 93715 Kolhapur 193 254 323 389 457 967 959 963 961 94916 Aurangabad 92 122 173 219 289 960 943 936 922 91917 Jalna – – 119 177 209 – – 970 958 95218 Parbhani 96 121 149 192 229 972 960 967 953 95719 Hingoli – – – – 218 – – – – 95320 Beed 92 115 133 170 202 968 954 965 944 92721 Nanded 104 133 166 221 272 970 955 960 945 94322 Osmanabad 104 134 137 169 195 949 945 958 937 93023 Latur – – 175 234 290 – – 959 942 93424 Buldhana 109 130 156 195 230 959 955 957 953 94625 Akola 112 142 173 209 300 938 940 949 939 93826 Washim – – – – 198 – – – – 93927 Amaravati 101 126 152 180 213 933 931 937 936 94028 Yavatmal 81 102 128 153 181 972 961 959 951 94229 Wardha 101 124 147 169 195 964 949 948 939 93630 Nagpur 152 196 260 332 413 929 922 925 922 93331 Bhandara 135 172 199 226 292 997 987 997 988 98232 Gondia – – – – 221 – – – – 100533 Chandrapur 47 64 135 155 182 985 969 959 948 96134 Gadchiroli – – 41 55 67 – – 981 976 976
Maharashtra 129 164 204 257 314 936 930 937 934 922
* Figures are provisional. # Includes Mumbai City and Mumbai Suburban District.
Source: Population Census.
Annexure Tables 157

PopulationTable 4
District-wise Scheduled Castes Population and Percentage to the Total Populationfor the Years 1961, 1971, 1981 and 1991
Sr.No. District
Scheduled Castes Percentage
1961 1971 1981 1991 1961 1971 1981 1991
1 2 3 4 5 6 7 8 9 10 1 Mumbai # 123527 210497 399076 646914 2.98 3.53 4.84 6.52 2 Thane 22722 36170 83825 271797 1.37 1.59 2.50 5.18 3 Raigad 13887 15401 25182 50999 1.31 1.22 1.69 2.79 4 Ratnagiri 37939 42986 45132 27385 2.08 2.16 2.14 1.77 5 Sindhudurg – – – 42435 – – – 5.10 6 Nashik 67845 96097 185859 326755 3.66 4.06 6.21 8.48 7 Dhule 48054 61506 85735 134359 3.56 3.70 4.18 5.30 8 Nandurbar – – – – – – – – 9 Jalgaon 61319 87708 154227 295047 3.47 4.13 5.89 9.2510 Ahmednagar 157500 211443 287707 418479 8.97 9.32 10.62 12.4111 Pune 121237 175402 313797 631063 4.91 5.52 7.54 11.4112 Satara 74875 93103 126630 233014 5.24 5.39 6.21 9.5013 Sangli 102080 150687 204352 277458 8.29 9.79 11.16 12.5614 Solapur 238863 320319 373083 497913 12.84 14.21 14.29 15.4115 Kolhapur 181779 232537 302649 381029 11.39 11.35 12.08 12.7516 Aurangabad 92715 108389 150436 305246 6.05 5.50 6.18 13.7917 Jalna – – – 176452 – – – 12.9318 Parbhani 83976 84938 106466 233323 6.96 5.64 5.82 11.0219 Hingoli – – – – – – – –20 Beed 135272 161174 170482 244281 13.51 12.53 11.47 13.4121 Nanded 118879 127170 197709 422942 11.01 9.10 11.30 18.1522 Osmanabad 197892 285320 342461 208609 13.39 15.04 15.35 16.3423 Latur – – – 319568 – – – 19.0624 Buldhana 56214 68326 93227 216687 5.30 5.41 6.18 11.4025 Akola 55866 71571 100616 264554 4.70 4.77 5.51 11.9526 Washim – – – – – – – –27 Amaravati 48702 65447 112754 384499 3.95 4.25 6.06 17.4828 Yavatmal 42523 55894 85985 226820 3.87 3.93 4.95 10.9229 Wardha 15143 23570 36412 149975 2.39 3.02 3.93 14.0530 Nagpur 54388 80287 182395 619226 3.60 4.13 7.05 18.8431 Bhandara 31074 82965 179244 355484 2.45 5.23 9.75 16.8732 Gondia – – – – – – – –33 Chandrapur 42643 76854 134322 299533 3.44 4.69 6.53 16.9034 Gadchiroli – – – 95996 – – – 12.20
Maharashtra 2226914 3025761 4479763 8757842 5.63 6.00 7.14 11.09
# Includes Mumbai City and Mumbai Suburban District.Source: Population Census.
158 Human Development Report Maharashtra 2002

PopulationTable 5
District-wise Scheduled Tribes Population and Percentage to the Total Populationfor the Years 1961, 1971,1981 and 1991
Sr.No. District
Scheduled Tribes Percentage
1961 1971 1981 1991 1961 1971 1981 1991
1 2 3 4 5 6 7 8 9 10 1 Mumbai # 22455 30016 84073 103775 0.54 0.50 1.02 1.05 2 Thane 500558 579538 729424 951205 30.29 25.40 21.76 18.12 3 Raigad 95354 113502 190210 233953 9.01 8.99 12.80 12.82 4 Ratnagiri 3101 10066 31746 14847 0.17 0.51 1.50 0.96 5 Sindhudurg – – – 3893 – – – 0.47 6 Nashik 453707 561202 701647 931069 24.45 23.69 23.45 24.18 7 Dhule 513344 615801 831064 1036491 37.99 37.05 40.53 40.87 8 Nandurbar – – – – – – – – 9 Jalgaon 98710 125026 216009 313551 5.59 5.89 8.25 9.8410 Ahmednagar 109827 145783 187656 240141 6.18 6.42 6.93 7.1211 Pune 89913 108405 158705 216336 3.64 3.41 3.81 3.9112 Satara 2417 3610 13060 18342 0.17 0.21 0.64 0.7513 Sangli 595 2425 15535 10784 0.05 0.16 0.85 0.4914 Solapur 9089 8608 51577 48352 0.49 0.38 1.98 1.5015 Kolhapur 1518 3809 27311 14789 0.10 0.19 1.09 0.4916 Aurangabad 24455 32300 75663 83502 1.60 1.64 3.11 3.7717 Jalna – – – 28300 – – – 2.0718 Parbhani 34838 42101 78577 111470 2.89 2.79 4.30 5.2619 Hingoli – – – – – – – –20 Beed 2367 4394 13405 20515 0.24 0.34 0.90 1.1321 Nanded 40597 56309 178238 275972 3.76 4.03 10.19 11.8422 Osmanabad 393 2604 52013 22463 0.03 0.14 2.33 1.7623 Latur – – – 37527 – – – 2.2424 Buldhana – – 66457 95389 – – 4.40 5.0625 Akola – – 114759 155695 – – 6.28 7.0326 Washim – – – – – – – –27 Amaravati 54881 79371 241704 316448 4.45 5.15 12.98 14.3828 Yavatmal 155609 197977 370116 445840 14.17 13.91 21.30 21.4629 Wardha – – 142244 166391 – – 15.35 15.5930 Nagpur – – 353303 457715 – – 13.65 13.9231 Bhandara – – 298039 309822 – – 16.22 14.7032 Gondia – – – – – – – –33 Chandrapur 183431 231402 549503 349169 14.82 14.11 26.73 19.7034 Gadchiroli – – – 304535 – – – 38.70
Maharashtra 2397159 2954249 5772038 7318281 6.06 5.86 9.19 9.27
# Includes Mumbai City and Mumbai Suburban District.Source: Population Census.
Annexure Tables 159

PopulationTable 6
District-wise Number of Main Workers and Work Participation Rate as per 1961 Census
Sr.No. District
Total Main Workers Work Participation Rate
Total Rural Urban All
Persons Females Persons Females Persons Females Persons Females
1 2 3 4 5 6 7 8 9 10 1 Mumbai # 1686668 145807 – – 1686668 145807 40.62 8.81 2 Thane 777756 289547 605034 265505 172722 24042 47.06 36.58 3 Raigad 495825 222834 460275 214900 35550 7934 46.83 40.94 4 Ratnagiri 820776 426145 773831 414628 46945 11517 44.92 42.18 5 Sindhudurg – – – – – – – – 6 Nashik 914057 378574 747983 340332 166074 38242 49.27 41.98 7 Dhule 638848 259399 565899 240579 72949 18820 47.28 39.05 8 Nandurbar – – – – – – – – 9 Jalgaon 813373 329695 681546 298262 131827 31433 46.08 38.2010 Ahmednagar 892801 372248 832872 360406 59929 11842 50.27 42.7511 Pune 1053143 382540 763085 338165 290058 44375 42.69 31.9312 Satara 692495 332335 641420 319250 51075 13085 48.42 45.4313 Sangli 531478 194771 466198 178010 65280 1676 43.18 32.3614 Solapur 815253 282629 641603 241035 173650 41594 43.83 31.4215 Kolhapur 728531 287660 631577 270483 96954 17177 45.63 36.6516 Aurangabad 810824 343711 739272 328399 71552 15312 52.91 45 7917 Jalna – – – – – – – –18 Parbhani 624274 245983 563526 231284 60748 14699 51.75 41.3819 Hingoli – – – – – – – –20 Beed 542045 232988 507544 223860 34501 9128 54.13 47.2921 Nanded 563170 228422 508052 214952 55118 13470 52.16 42.9622 Osmanabad 769319 313347 712993 298230 56326 15117 52.06 43.5623 Latur – – – – – – – –24 Buldhana 543586 231725 479194 214842 64392 16883 51.30 44.8825 Akola 585261 229395 494677 211575 90584 17820 49.21 39.8626 Washim – – – – – – – –27 Amaravati 578073 214922 463447 187962 114626 26960 46.89 36.1328 Yavatmal 595060 259395 545961 247756 49099 11639 54.17 47.9129 Wardha 316638 130384 267708 119772 48930 10612 49.92 41.8730 Nagpur 702970 262806 423492 196932 279478 65874 46.47 36.0731 Bhandara 740997 357649 683910 338402 57087 19247 58.43 56.4932 Gondia – – – – – – – –33 Chandrapur 715260 331306 680855 322993 34405 8313 57.77 53.9234 Gadchiroli – – – – – – – –
Maharashtra 18948481 7286217 14881954 6618514 4066527 667703 47.91 38.10
# Includes Mumbai City and Mumbai Suburban District.Source: Population Census.
160 Human Development Report Maharashtra 2002

PopulationTable 7
District-wise Number of Main Workers and Work Participation Rate as per 1971 Census
Sr.No. District
Total Main Workers Work Participation Rate
Total Rural Urban All
Persons Females Persons Females Persons Females Persons Females
1 2 3 4 5 6 7 8 9 10 1 Mumbai # 2198098 192370 – – 2198098 192370 36.82 7.72 2 Thane 853672 200354 583409 173823 270263 26531 37.41 18.61 3 Raigad 453175 152263 406690 145649 46485 6614 35.88 23.47 4 Ratnagiri 697174 310980 652372 302369 44802 8611 35.02 28.18 5 Sindhudurg – – – – – – – – 6 Nashik 897917 272155 707239 241195 190678 30960 37.90 23.71 7 Dhule 594691 160594 516542 148094 78149 12500 35.78 19.76 8 Nandurbar – – – – – – – – 9 Jalgaon 766412 230198 628690 209391 137722 20807 36.10 22.2810 Ahmednagar 803846 213626 729739 202983 74107 10643 35.43 19.2611 Pune 1036422 224576 645867 178652 390555 45924 32.61 14.6412 Satara 541330 145944 480179 137620 61151 8324 31.34 16.6013 Sangli 478698 80332 399082 71165 79616 9167 31.09 10.7214 Solapur 759263 159154 586264 130944 172999 28210 33.69 14.6315 Kolhapur 696319 158127 573466 146754 122853 11373 34.00 15.7716 Aurangabad 730677 202545 642480 192330 88197 10215 37.07 21.1817 Jalna – – – – – – – –18 Parbhani 563714 148090 496683 139623 67031 8467 37.41 20.0619 Hingoli – – – – – – – –20 Beed 453139 110521 413336 105049 39803 5472 35.23 17.6021 Nanded 497553 118419 434235 110257 63318 8162 35.60 17.3422 Osmanabad 640848 139991 577648 131735 63200 8256 33.79 15.2023 Latur – – – – – – – –24 Buldhana 530196 190778 465214 178595 64982 12183 41.98 30.9425 Akola 600142 196629 497958 180583 102184 16046 39.97 27.0126 Washim – – – – – – – –27 Amaravati 592907 179084 466851 156828 126056 22256 38.47 24.1028 Yavatmal 603034 210015 546416 200214 56618 9801 42.36 30.1129 Wardha 304835 97717 252657 89306 52178 8411 39.10 25.7530 Nagpur 689276 183767 392260 138782 297016 44985 35.48 19.7231 Bhandara 742445 303451 683196 287870 59249 15581 46.82 38.5332 Gondia – – – – – – – –33 Chandrapur 664496 205567 615301 199226 49195 6341 40.51 25.4634 Gadchiroli – – – – – – – –
Maharashtra 18390279 4787247 13393774 4199037 4996505 588210 36.48 18.33
# Includes Mumbai City and Mumbai Suburban District.Source: Population Census.
Annexure Tables 161

PopulationTable 8
District-wise Number of Main Workers and Work Participation Rate as per 1981 Census
Sr.No. District
Total Main Workers Work Participation Rate
Total Rural Urban All
Persons Females Persons Females Persons Females Persons Females
1 2 3 4 5 6 7 8 9 10 1 Mumbai # 2860054 307506 – – 2860054 307506 34.70 8.56 2 Thane 1267771 300391 777895 248372 489876 52019 37.83 19.11 3 Raigad 555728 200366 488497 189560 67231 10806 37.39 26.37 4 Ratnagiri 719150 313405 673435 305653 45715 7752 34.06 26.83 5 Sindhudurg – – – – – – – – 6 Nashik 1219868 420198 942072 377868 277796 42330 40.77 29.04 7 Dhule 779326 236577 672310 220274 107016 16303 38.01 23.49 8 Nandurbar – – – – – – – – 9 Jalgaon 1035988 349160 855151 322431 180837 26729 39.57 27.3810 Ahmednagar 1125377 403704 1016276 385417 109101 18287 41.55 30.4511 Pune 1455460 384944 861875 298121 593585 86823 34.95 19.1112 Satara 684172 218388 609513 206143 74659 12245 33.56 20.8113 Sangli 625479 143014 510141 125990 115338 17024 34.16 15.8314 Solapur 983022 277218 751863 228340 231159 48878 37.66 21.9015 Kolhapur 921304 252454 737731 232417 183573 20037 36.76 20.4816 Aurangabad 1003159 339029 855527 317287 147632 21742 41.22 28.6417 Jalna – – – – – – – –18 Parbhani 810830 278617 707158 259695 103672 18922 44.32 30.9719 Hingoli – – – – – – – –20 Beed 599764 191216 536626 181684 63138 9532 40.36 26.1921 Nanded 710174 222335 620567 207979 89607 14356 40.60 25.9522 Osmanabad 866981 255476 772320 240347 94661 15129 38.87 23.4123 Latur – – – – – – – –24 Buldhana 708653 284102 623871 267302 84782 16800 46.97 38.5025 Akola 778502 278609 650617 258989 127885 19620 42.61 31.3426 Washim – – – – – – – –27 Amaravati 753281 244552 596545 218347 156736 26205 40.47 27.1828 Yavatmal 799914 312051 726828 299580 73086 12471 46.04 36.7029 Wardha 397282 143003 335386 133235 61896 9768 42.87 31.7130 Nagpur 921316 260484 518752 198788 402564 61696 35.59 20.9531 Bhandara 839489 356502 766843 337631 72646 18871 45.68 38.8632 Gondia – – – – – – – –33 Chandrapur 879749 308894 808738 299977 71011 8917 42.80 30.5934 Gadchiroli – – – – – – – –
Maharashtra 24301793 7282195 17416537 6361427 6885256 920768 38.71 23.98
# Includes Mumbai City and Mumbai Suburban District.Source: Population Census.
162 Human Development Report Maharashtra 2002

PopulationTable 9
District-wise Number of Main Workers and Work Participation Rate as per 1991 Census
Sr.No. District
Total Main Workers Work Participation Rate
Total Rural Urban All
Persons Females Persons Females Persons Females Persons Females
1 2 3 4 5 6 7 8 9 10 1 Mumbai # 3434732 468650 – – 3434732 468650 34.60 10.49 2 Thane 1961704 449016 814447 301380 1147257 147636 37.37 18.28 3 Raigad 720103 263488 614618 246989 105485 16499 39.46 28.74 4 Ratnagiri 575756 256157 535806 248790 39950 7367 37.29 30.36 5 Sindhudurg 318491 132201 300190 128495 18301 3706 38.27 29.86 6 Nashik 1584002 586380 1183798 521414 400204 64966 41.13 31.42 7 Dhule 1004884 351117 866441 330835 138443 20282 39.63 28.31 8 Nandurbar – – – – – – – – 9 Jalgaon 1279877 461632 1032732 422683 247145 38949 40.15 29.8810 Ahmednagar 1432411 556890 1262944 521968 169467 34922 42.47 33.9111 Pune 2051679 608891 1179727 457276 871952 151615 37.08 22.8012 Satara 896395 308146 805126 292010 91269 16136 36.57 24.7913 Sangli 814726 223190 659190 196087 155536 27103 36.87 20.6514 Solapur 1248343 400660 969310 338772 279033 61888 38.64 25.6715 Kolhapur 1169735 360963 926761 328522 242974 32441 39.13 24.6416 Aurangabad 886480 324263 681971 291228 204509 33035 40.04 30.5317 Jalna 599819 241142 534220 230808 65599 10334 43.96 36.1218 Parbhani 890306 337742 759857 316272 130449 21470 42.05 32.6919 Hingoli – – – – – – – –20 Beed 758589 296607 669914 282008 88675 14599 41.63 33.5321 Nanded 926583 338938 790177 314568 136406 24370 39.76 29.9322 Osmanabad 529425 194507 474794 183907 54631 10600 41.48 31.5023 Latur 656243 235868 569251 225139 86992 10729 39.14 29.0024 Buldhana 844348 348560 728131 325606 116217 22954 44.76 37.8825 Akola 923191 343627 741781 313935 181410 29692 41.69 32.0526 Washim – – – – – – – –27 Amaravati 887892 297036 677510 261120 210382 35916 40.36 27.9228 Yavatmal 923250 368576 821263 350852 101987 17724 44.45 36.3929 Wardha 450539 165801 371501 153003 79038 12798 42.21 32.0730 Nagpur 1167907 331157 588047 238003 579860 93154 35.53 21.0031 Bhandara 965020 419468 881566 398605 83454 20863 45.79 40.0532 Gondia – – – – – – – –33 Chandrapur 745116 275624 604058 254009 41058 21615 42.05 31.9734 Gadchiroli 358563 141271 335519 135191 23044 6080 45.56 36.35
Maharashtra 31006109 10087568 21380650 8609475 9625459 1478093 39.28 26.47
# Includes Mumbai City and Mumbai Suburban District.Source: Population Census.
Annexure Tables 163

PopulationTable 10
District-wise Number of Main Workers and Work Participation Rate as per 2001* Census
Sr.No. District
Total Main Workers Work Participation Rate
Total Rural Urban All
Persons Females Persons Females Persons Females Persons Females
1 2 3 4 5 6 7 8 9 10 1 Mumbai # 4272899 668517 – – 4272899 668517 35.86 12.53 2 Thane 2825024 560500 853687 307245 1971337 253255 34.75 14.94 3 Raigad 685113 200161 522749 177889 162364 22272 31.06 18.38 4 Ratnagiri 578013 239462 519181 229283 58832 10179 34.07 26.55 5 Sindhudurg 241598 81304 218291 77304 23307 4000 28.04 18.20 6 Nashik 1949487 683739 1368681 594297 580806 89442 39.08 28.54 7 Dhule 589191 187988 473875 173708 115316 14280 34.48 22.64 8 Nandurbar 461999 165914 407066 158543 54933 7371 35.29 25.67 9 Jalgaon 1337571 456529 1058907 420720 278664 35809 36.35 25.7110 Ahmednagar 1676906 650726 1430568 604809 246338 45917 41.02 32.8411 Pune 2735269 820515 1385396 570197 1349873 250318 37.86 23.7412 Satara 1074097 395088 957609 373550 116488 21538 38.40 28.3313 Sangli 978742 312459 786941 277824 191801 34635 37.91 24.7514 Solapur 1507619 540407 1125733 444337 381886 96070 39.10 28.9815 Kolhapur 1430971 489663 1106283 441833 324688 47830 40.71 28.6116 Aurangabad 1068688 369258 773960 324752 294728 44506 36.59 26.4117 Jalna 629217 244860 550477 234172 78740 10688 39.02 31.1418 Parbhani 564757 209441 450957 191319 113800 18122 37.87 28.7219 Hingoli 422687 179373 382656 172661 40031 6712 42.84 37.2520 Beed 853562 348241 757970 334755 95592 13486 39.52 33.5121 Nanded 992251 350991 822973 326647 169278 24344 34.60 25.2222 Osmanabad 563684 209496 505441 200026 58243 9470 38.29 29.5423 Latur 733623 240307 612703 225246 120920 15061 35.30 23.9424 Buldhana 931746 375155 802761 354961 128985 20194 41.85 34.6725 Akola 594236 185312 421375 160804 172861 24508 36.47 23.5026 Washim 405611 158107 357175 150778 48436 7329 39.78 32.0127 Amaravati 932655 284450 681177 247235 251478 37215 35.79 22.5328 Yavatmal 963635 365045 849773 346099 113862 18946 39.16 30.5929 Wardha 444685 143119 359298 131767 85387 11352 36.13 24.0630 Nagpur 1299554 333442 578990 222890 720564 110552 32.08 17.0531 Bhandara 377586 140069 331565 130595 46021 9474 33.24 24.8932 Gondia 402876 150806 362433 142362 40443 8444 33.57 25.0633 Chandrapur 708152 237212 534442 212756 173710 24456 34.08 23.3034 Gadchiroli 352676 138104 334736 134729 17940 3375 36.36 28.82
Maharashtra 35586380 11115760 22685829 9096093 12900551 2019667 36.78 23.95
* Figures are provisional. # Includes Mumbai City and Mumbai Suburban District.
Source: Population Census.
164 Human Development Report Maharashtra 2002

PopulationTable 11
Participation Rate of Male and Female Among Main Workers and Marginal Workersas per Population Census 2001*
Sr.No. District
Total Main and Marginal Workers Participation Rate
Male Female Persons Male Female
1 2 3 4 5 6 7 1 Mumbai # 3781747 746176 4527923 83.52 16.48 2 Thane 2451526 772613 3224139 76.04 23.96 3 Raigad 589339 345111 934450 63.07 36.93 4 Ratnagiri 407318 376265 783583 51.98 48.02 5 Sindhudurg 227183 185548 412731 55.04 44.96 6 Nashik 1366011 857777 2223788 61.43 38.57 7 Dhule 455874 301599 757473 60.18 39.82 8 Nandurbar 344871 269295 614166 56.15 43.85 9 Jalgaon 977952 622837 1600789 61.09 38.9110 Ahmednagar 1110428 814724 1925152 57.68 42.3211 Pune 2049147 1000099 3049246 67.20 32.8012 Satara 756899 575654 1332553 56.80 43.2013 Sangli 742061 503493 1245554 59.58 40.4214 Solapur 1054043 712917 1766960 59.65 40.3515 Kolhapur 1020895 667772 1688667 60.46 39.5416 Aurangabad 756495 463216 1219711 62.02 37.9817 Jalna 415215 318493 733708 56.59 43.4118 Parbhani 378070 271516 649586 58.20 41.8019 Hingoli 259842 209938 469780 55.31 44.6920 Beed 548480 431202 979682 55.99 44.0121 Nanded 719447 508539 1227986 58.59 41.4122 Osmanabad 389195 275884 665079 58.52 41.4823 Latur 525502 334736 860238 61.09 38.9124 Buldhana 595682 442243 1037925 57.39 42.6125 Akola 436231 223506 659737 66.12 33.8826 Washim 267244 198807 466051 57.34 42.6627 Amaravati 724124 396344 1120468 64.63 35.3728 Yavatmal 675136 475229 1150365 58.69 41.3129 Wardha 348280 215122 563402 61.82 38.1830 Nagpur 1087405 465858 1553263 70.01 29.9931 Bhandara 303357 245887 549244 55.23 44.7732 Gondia 319247 271658 590905 54.03 45.9733 Chandrapur 568039 388452 956491 59.39 40.6134 Gadchiroli 272477 240055 512532 53.16 46.84
Maharashtra 26924762 15128565 42053327 64.03 35.97
* Figures are provisional. # Includes Mumbai City and Mumbai Suburban District.
Source: Population Census.
Annexure Tables 165
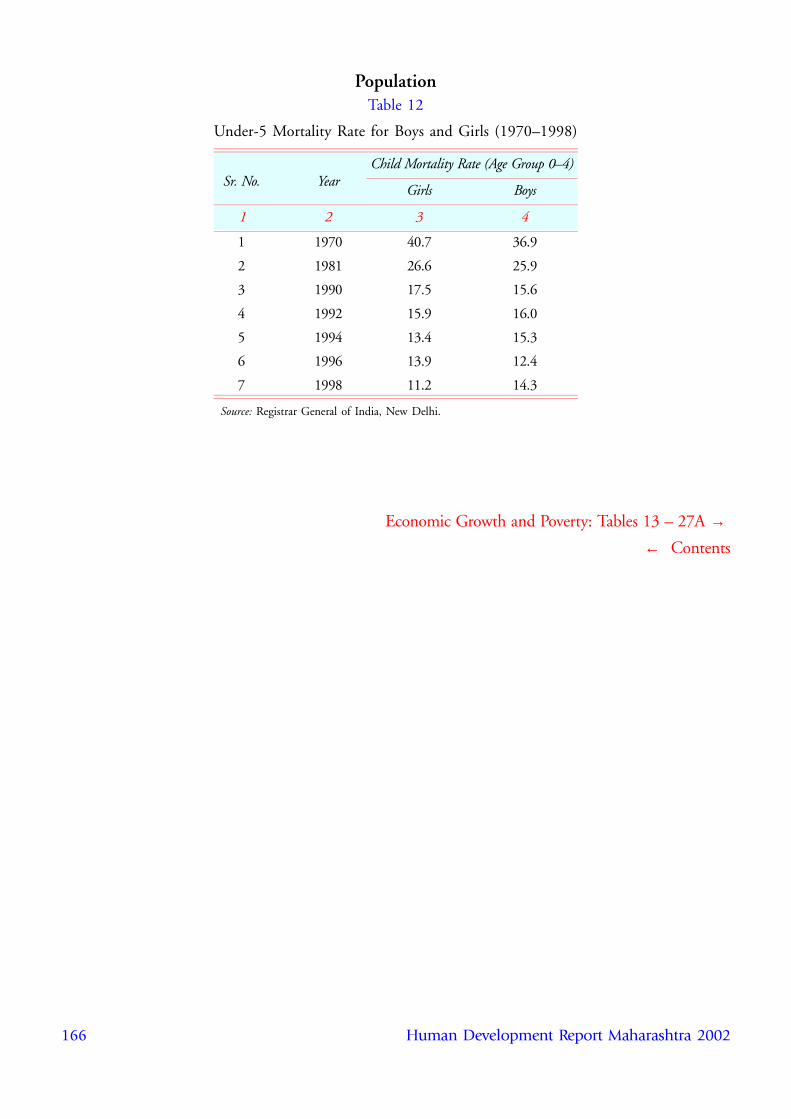
PopulationTable 12
Under-5 Mortality Rate for Boys and Girls (1970–1998)
Sr. No. YearChild Mortality Rate (Age Group 0–4)
Girls Boys
1 2 3 4
1 1970 40.7 36.9
2 1981 26.6 25.9
3 1990 17.5 15.6
4 1992 15.9 16.0
5 1994 13.4 15.3
6 1996 13.9 12.4
7 1998 11.2 14.3
Source: Registrar General of India, New Delhi.
Economic Growth and Poverty: Tables 13 – 27A →
← Contents
166 Human Development Report Maharashtra 2002

Economic Growth and PovertyTable 13
Persondays Created under EGS for the Years 1990–91, 1995–96 and 1999–2000
Persondays in lakhs
Sr.No. District
Persondays 1990–91 Persondays 1995–96 Persondays 1999–2000
Total Women Total Women Total Women
1 2 3 4 5 6 7 8 1 Mumbai # – – – – – – 2 Thane 24.70 15.27 31.15 17.87 54.01 32.41 3 Raigad 4.16 0.21 12.28 – 19.72 11.83 4 Ratnagiri 22.19 4.60 22.34 9.48 48.27 22.96 5 Sindhudurg 9.70 1.49 13.59 5.27 15.61 9.37 6 Nashik 41.45 11.73 20.65 6.09 55.11 33.07 7 Dhule 35.75 13.86 14.19 1.77 8.46 5.08 8 Nandurbar – – – – 18.67 11.20 9 Jalgaon 14.73 2.81 4.56 0.33 37.17 22.3010 Ahmednagar 56.32 16.84 110.88 32.16 29.09 17.4511 Pune 34.66 14.27 69.75 37.21 13.32 7.9912 Satara 16.07 3.79 18.82 8.87 12.95 7.7713 Sangli 11.57 1.96 8.02 3.05 8.40 5.0414 Solapur 45.27 9.44 165.48 43.09 25.76 15.4615 Kolhapur 16.66 3.35 10.05 5.21 12.37 7.4216 Aurangabad 30.33 12.84 52.89 27.97 38.39 23.0317 Jalna 36.11 8.05 36.42 21.76 54.98 32.9918 Parbhani 35.82 8.71 23.65 12.69 11.51 6.9119 Hingoli – – – – 4.49 2.6920 Beed 32.26 14.21 54.20 30.67 67.35 20.4121 Nanded 48.07 13.93 44.75 18.18 46.91 28.1522 Osmanabad 42.28 7.98 59.10 28.83 50.08 30.0523 Latur 33.81 11.72 40.35 14.87 45.53 27.3224 Buldhana 27.38 7.23 17.04 4.82 30.44 18.2625 Akola 16.17 4.08 10.22 1.86 11.59 6.9526 Washim – – – – 9.67 5.8127 Amaravati 28.51 9.09 24.52 6.94 34.71 20.8328 Yavatmal 32.65 5.06 21.46 1.41 23.25 13.9529 Wardha 11.14 5.11 4.17 0.56 8.83 5.3030 Nagpur 34.07 13.17 13.13 3.57 20.24 12.1431 Bhandara 96.60 33.65 36.74 14.80 45.95 27.5732 Gondia – – – – 22.67 13.6033 Chandrapur 40.20 14.82 20.43 5.96 45.19 27.1134 Gadchiroli 20.31 8.17 9.33 2.91 18.70 11.22
Maharashtra 898.94 277.44 970.16 368.20 949.39 543.64
# Includes Mumbai City and Mumbai Suburban District.Note: Figures for newly formed districts i.e. Nandurbar, Hingoli, Washim and Gondia are not available hence combined figures are given
for undivided districts viz. Dhule, Parbhani, Akola and Bhandara respectively.Source: Planning Department, Mantralaya, Mumbai.
Annexure Tables 167

Economic Growth and PovertyTable 14
District Income at Current Prices for the Years 1993–94, 1997–98, and 1998–99
Sr. No. District
Income (NDDP) (Rs in lakhs) Per Capita Income (Rs)1993–94 1997–98 1998–99 1993–94 1997–98 1998–99
1 2 3 4 5 6 7 8 1 Mumbai # 2532707 4448969 5115400 24352 40044 45471 2 Thane 975214 1754466 2001295 17521 29471 33200 3 Raigad 386989 567528 628601 20245 27758 30364 4 Ratnagiri 143137 225671 250346 8888 13102 14354 5 Sindhudurg 116998 162869 188148 13480 17544 20016 6 Nashik 446856 812825 903770 115050 18792 20636 7 Dhule 180581 307830 339249 6796 10831 11789 8 Nandurbar – – – – – – 9 Jalgaon 287218 502122 594605 8605 14065 1644910 Ahmednagar 278208 479972 583980 7868 12692 1525111 Pune 876155 1511127 1764358 15058 24282 2800012 Satara 221430 368018 432366 8632 13413 1556313 Sangli 240075 415367 511178 10381 16793 2041114 Solapur 292151 511313 663616 8628 14118 1809715 Kolhapur 361702 603312 708633 11567 18038 2092516 Aurangabad 252465 400771 490746 10789 16013 1936517 Jalna 102066 143436 188174 7077 9298 1204718 Parbhani 179317 261818 331160 8110 11071 1382719 Hingoli – – – – – –20 Beed 143647 248195 316304 7526 12158 1530321 Nanded 179016 298747 346951 7304 11394 1306822 Osmanabad 94788 141859 187561 7063 9883 1290523 Latur 130035 200892 261136 7376 10654 1367724 Buldhana 148032 224924 296084 7485 10633 1382325 Akola 208449 323625 403398 8992 13053 1606926 Washim – – – – – –27 Amaravati 221059 429089 427676 9610 17441 1716828 Yavatmal 172901 258777 314921 7957 11134 1338229 Wardha 96321 183354 204615 8642 15381 1695230 Nagpur 465780 938906 1071256 13504 25450 2867831 Bhandara 172897 304841 344742 7858 12953 1446732 Gondia – – – – – –33 Chandrapur 202695 372803 388625 10912 18765 1932534 Gadchiroli 97220 131272 153139 11784 14876 17140
Maharashtra 10206108 17534696 20412031 12326 19799 22763
Note: (1) Figures for newly formed districts i.e. Nandurbar, Hingoli, Washim and Gondia are not available hence, combined figures are given for undivided districts viz. Dhule, Parbhani, Akola and Bhandara respectively.
(2) Due to the paucity of data, use of indicators for allocation and various limitations of estimation procedure, the district domesticproducts are to be accepted with a margin of error and can be used to have a broad judgement on the level of income in the districts.
# Includes Mumbai City and Mumbai Suburban District.Source: Directorate of Economics and Statistics, Mumbai.
168 Human Development Report Maharashtra 2002

Economic Growth and PovertyTable 15
District Income at Constant Prices for the Years 1993–94, 1997–98 and 1998–99
Sr.No. District
District Income (NDDP) (Rs in lakhs) Per Capita Income (Rs)1993–94 1997–98 1998–99 1993–94 1997–98 1998–99
1 2 3 4 5 6 7 8 1 Mumbai # 2532707 3347103 3591126 24382 30126 31922 2 Thane 975214 1306632 1420028 17521 21948 23558 3 Raigad 386989 424855 458174 20245 20780 22132 4 Ratnagiri 143137 183048 190549 8888 10627 10926 5 Sindhudurg 116998 149813 150567 13480 16138 16018 6 Nashik 446856 565789 635268 11050 13081 14505 7 Dhule 180581 221393 235836 6796 7790 8195 8 Nandurbar – – – – – – 9 Jalgaon 287218 361852 401662 8605 10136 1111210 Ahmednagar 278208 349093 402522 7868 9231 1051211 Pune 876155 1119960 1236893 15058 1799612 Satara 221430 276879 303659 8632 10091 1093013 Sangli 240075 311874 362552 10381 12609 1447614 Solapur 292151 369143 423852 8628 10193 1155815 Kolhapur 361702 453495 509728 11567 13559 1505116 Aurangabad 252465 295379 334082 10789 11802 1318317 Jalna 102066 102718 125716 7077 6659 804918 Parbhani 179317 186793 222074 8110 7898 927219 Hingoli – – – – – –20 Beed 143647 163159 197815 7526 7993 955021 Nanded 179016 206262 233330 7304 7867 878822 Osmanabad 94788 103238 130270 7063 7192 896323 Latur 130035 145186 174298 7376 7700 912924 Buldhana 148032 157964 189532 7485 7467 884925 Akola 208449 226911 261137 8992 9152 1040226 Washim – – – – – – 27 Amaravati 221059 249404 284122 9610 10137 1140528 Yavatmal 172901 181186 211554 7957 7796 899029 Wardha 96321 127529 140751 8642 10698 1166130 Nagpur 465780 666851 741829 13504 18076 1985931 Bhandara 172897 223598 238027 7858 9501 998932 Gondia – – – – – – 33 Chandrapur 202695 244386 261482 10912 12301 1300334 Gadchiroli 97220 93883 103958 11784 10639 11635
Maharashtra 10206108 12815376 14172393 12326 14470 15804
Note: (1) Figures for newly formed districts i.e. Nandurbar, Hingoli, Washim and Gondia are not available hence, combined figures are given for undivided districts viz. Dhule, Parbhani, Akola and Bhandara respectively.
(2) Due to the paucity of data, use of indicators for allocation and various limitations of estimation procedure, the district domestic products are to be accepted with a margin of error and can be used to have a broad judgement on the level of income in the districts.
# Includes Mumbai City and Mumbai Suburban District.Source: Directorate of Economics and Statistics, Mumbai.
Annexure Tables 169

Economic Growth and PovertyTable 16
Percentage Share of District Income (NDDP) to State Income at Current and Constant Prices
Sr.No. District
At Current Prices At Constant (1993–94) Prices1993–94 1995–96 1997–98 1998–99 1993–94 1995–96 1997–98 1998–99
1 2 3 4 5 6 7 8 9 10 1 Mumbai # 24.82 24.76 25.37 25.06 24.82 24.72 26.12 25.34 2 Thane 9.56 9.87 10.01 9.80 9.56 9.84 10.20 10.02 3 Raigad 3.79 3.75 3.24 3.08 3.79 3.82 3.32 3.23 4 Ratnagiri 1.40 1.40 1.29 1.23 1.40 1.42 1.43 1.34 5 Sindhudurg 1.15 1.13 0.93 0.92 1.15 1.15 1.17 1.06 6 Nashik 4.38 4.34 4.64 4.43 4.38 4.43 4.41 4.48 7 Dhule 1.77 1.63 1.76 1.66 1.77 1.61 1.73 1.66 8 Nandurbar – – – – – – – – 9 Jalgaon 2.81 2.76 2.86 2.91 2.81 2.70 2.82 2.8310 Ahmednagar 2.73 2.80 2.74 2.86 2.73 2.83 2.72 2.8411 Pune 8.58 8.99 8.62 8.64 8.58 9.15 8.74 8.7312 Satara 2.17 2.10 2.10 2.12 2.17 2.22 2.16 2.1413 Sangli 2.35 2.39 2.37 2.50 2.35 2.47 2.43 2.5014 Solapur 2.86 2.82 2.92 3.25 2.86 2.78 2.88 2.9915 Kolhapur 3.54 3.50 3.44 3.47 3.54 3.63 3.54 3.6016 Aurangabad 2.47 2.55 2.29 2.40 2.47 2.57 2.30 2.3617 Jalna 1.00 0.87 0.92 0.82 0.92 0.85 0.80 0.8918 Parbhani 1.76 1.70 1.49 1.62 1.76 1.63 1.46 1.5719 Hingoli – – – – – – – –20 Beed 1.41 1.55 1.42 1.55 1.41 1.42 1.27 1.4021 Nanded 1.75 1.67 1.70 1.70 1.75 1.64 1.61 1.6522 Osmanabad 0.93 0.87 0.81 0.92 0.93 0.85 0.81 0.9223 Latur 1.27 1.27 1.15 1.28 1.27 1.25 1.13 1.2324 Buldhana 1.45 1.35 1.28 1.45 1.45 1.29 1.23 1.3425 Akola 2.04 1.95 1.85 1.98 2.04 1.88 1.77 1.8426 Washim – – – – – – – –27 Amaravati 2.17 1.99 2.45 2.10 2.17 1.89 1.95 2.0028 Yavatmal 1.69 1.55 1.48 1.54 1.69 1.50 1.41 1.4929 Wardha 0.94 1.06 1.05 1.00 0.94 1.04 1.00 0.9930 Nagpur 4.56 4.75 5.35 5.25 4.56 4.76 5.20 5.2331 Bhandara 1.69 1.79 1.74 1.69 1.69 1.79 1.74 1.6832 Gondia – – – – – – – –33 Chandrapur 1.99 1.95 2.13 1.90 1.99 1.96 1.91 1.8534 Gadchiroli 0.95 0.89 0.75 0.75 0.95 0.91 0.73 0.73
Maharashtra 100.00 100.00 100.00 100.00 100.00 100.00 100.00 100.00
Note: (1) Figures for newly formed districts i.e. Nandurbar, Hingoli, Washim and Gondia are not available hence, combined figures given for undivided districts viz. Dhule, Parbhani, Akola and Bhandara respectively.
(2) Due to the paucity of data, use of indicators for allocation and various limitations of estimation procedure, the district domestic products are to be accepted with a margin of error and can be used to have a broad judgement on the level of income in the districts.
# Includes Mumbai City and Mumbai Suburban District.Source: Directorate of Economics and Statistics, Mumbai.
170 Human Development Report Maharashtra 2002

Economic Growth and PovertyTable 17
Sector-wise Percentage Share in Total District Income at Current Prices
Sr. No. District
Primary Sector Secondary Sector Tertiary Sector1993–94 1997–98 1998–99 1993–94 1997–98 1998–99 1993–94 1997–98 1998–99
1 2 3 4 5 6 7 8 9 10 11 1 Mumbai # 1.27 1.78 1.90 37.63 35.48 34.17 61.10 62.73 63.92 2 Thane 6.02 5.33 4.92 45.36 46.28 44.32 48.62 48.39 50.76 3 Raigad 11.09 10.40 9.47 68.98 62.61 61.88 19.93 26.99 28.65 4 Ratnagiri 40.95 30.54 29.18 22.79 25.24 25.12 36.25 44.22 45.70 5 Sindhudurg 61.46 46.47 47.31 10.36 15.39 14.73 28.18 38.14 37.96 6 Nashik 29.92 30.34 27.78 33.99 33.59 33.23 36.09 36.07 38.99 7 Dhule 33.98 29.14 26.39 16.18 16.86 16.94 49.21 54.00 56.67 8 Nandurbar – – – – – – – – – 9 Jalgaon 36.31 34.19 34.50 20.96 22.11 20.62 42.74 43.69 44.8810 Ahmednagar 29.62 24.85 29.21 25.60 26.98 24.62 44.78 48.17 46.1811 Pune 13.45 10.10 1.77 42.02 42.52 40.00 44.53 47.39 48.2312 Satara 35.46 31.97 33.29 22.29 21.55 20.28 42.25 46.48 46.4313 Sangli 35.71 30.77 35.53 18.47 21.18 19.00 45.82 48.05 45.4614 Solapur 27.84 23.90 32.06 23.13 25.33 21.55 49.04 50.77 46.3915 Kolhapur 30.75 25.00 27.79 24.75 25.74 24.19 44.50 49.27 48.0216 Aurangabad 21.81 15.02 21.30 40.45 41.09 36.84 37.74 43.89 41.8617 Jalna 46.85 28.70 37.89 12.86 17.65 14.87 40.28 53.65 47.2318 Parbhani 46.13 33.60 39.20 12.90 15.64 13.72 40.97 50.76 47.0819 Hingoli – – – – – – – – –20 Beed 43.27 38.20 44.17 13.73 16.07 14.03 43.00 45.74 41.8121 Nanded 33.90 27.99 29.05 17.56 18.91 18.03 48.55 53.10 52.9222 Osmanabad 49.01 35.24 44.45 13.22 17.25 14.45 37.77 47.52 41.1023 Latur 36.95 26.07 34.55 15.11 16.74 14.28 47.94 57.19 51.1724 Buldhana 37.29 24.59 34.10 12.02 14.86 12.52 50.69 60.55 53.3925 Akola 33.09 24.38 29.18 13.64 14.34 12.79 53.27 61.28 58.0326 Washim – – – – – – – – –27 Amaravati 44.19 47.02 38.31 12.64 11.94 13.32 43.17 41.03 48.3728 Yavatmal 44.67 31.09 35.30 14.33 17.90 16.28 41.00 51.01 48.4329 Wardha 36.44 37.11 34.01 17.74 19.77 19.57 45.81 43.12 46.4230 Nagpur 17.61 17.10 15.67 26.33 33.16 32.04 56.06 49.74 52.2931 Bhandara 40.81 33.82 32.97 24.46 30.08 29.34 34.72 36.10 37.6832 Gondia – – – – – – – – –33 Chandrapur 45.05 47.30 41.96 22.05 19.82 21.08 32.91 32.88 36.9534 Gadchiroli 73.28 64.09 64.48 6.82 9.62 9.16 19.90 26.29 26.36
Maharashtra 21.29 17.98 19.12 31.29 31.80 30.11 47.42 50.21 50.77
Note: (1) Figures for newly formed districts i.e. Nandurbar, Hingoli, Washim and Gondia are not available hence, combined figures given for undivided districts viz. Dhule, Parbhani, Akola and Bhandara respectively.
(2) Due to the paucity of data, use of indicators for allocation and various limitations of estimation procedure, the district domestic products are to be accepted with a margin of error and can be used to have a broad judgement on the level of income in the districts.
# Includes Mumbai City and Mumbai Suburban District.Source: Directorate of Economics and Statistics, Mumbai.
Annexure Tables 171

Economic Growth and PovertyTable 18
Sector-wise Percentage Share in Total District Income at Constant (1993–94) Prices
Sr. No. District
Primary Sector Secondary Sector Tertiary Sector1993–94 1997–98 1998–99 1993–94 1997–98 1998–99 1993–94 1997–98 1998–99
1 2 3 4 5 6 7 8 9 10 11 1 Mumbai # 1.27 1.50 1.63 37.63 36.25 36.37 61.10 62.26 62.00 2 Thane 6.02 5.29 5.25 45.36 47.31 46.41 48.62 47.40 48.34 3 Raigad 11.09 10.28 9.97 68.98 63.71 62.81 19.98 26.01 27.22 4 Ratnagiri 40.95 38.32 35.56 22.79 23.25 24.11 36.25 38.43 40.33 5 Sindhudurg 61.46 57.94 54.73 10.36 12.45 13.44 28.18 29.61 31.83 6 Nashik 29.92 25.34 27.47 33.99 37.20 35.49 36.09 37.46 37.04 7 Dhule 33.98 28.84 27.75 16.81 17.44 17.77 49.21 53.72 54.48 8 Nandurbar – – – – – – – – – 9 Jalgaon 36.31 32.25 32.74 20.96 23.16 22.40 42.74 44.60 44.8710 Ahmednagar 29.62 24.58 29.00 25.60 27.96 26.39 44.78 47.46 44.6111 Pune 13.45 10.62 11.86 42.02 43.79 42.56 44.53 45.59 45.5812 Satara 35.46 34.27 34.61 22.29 21.61 21.29 42.25 44.12 44.1013 Sangli 35.71 32.81 37.80 18.47 21.04 19.52 45.82 46.15 42.6714 Solapur 27.84 22.94 27.09 23.13 25.89 24.44 49.04 51.17 48.4815 Kolhapur 30.75 27.54 30.91 24.75 25.55 24.59 44.50 46.91 44.5016 Aurangabad 21.81 14.85 19.02 40.45 42.74 40.37 37.74 42.71 40.6117 Jalna 46.85 27.80 37.02 12.86 18.32 16.21 40.28 53.87 46.7718 Parbhani 46.13 32.54 38.94 12.90 15.97 14.68 40.97 51.49 46.3819 Hingoli – – – – – – – – –20 Beed 43.27 31.60 39.57 13.73 18.15 16.25 43.00 50.25 44.1821 Nanded 33.90 24.35 28.53 17.56 20.07 19.32 48.55 55.57 52.1522 Osmanabad 49.01 35.97 45.78 13.22 17.46 15.06 37.77 46.58 39.1723 Latur 36.95 25.98 33.96 15.11 17.08 15.49 47.94 56.94 50.5424 Buldhana 37.29 21.58 30.81 12.02 15.63 14.13 50.69 62.79 55.0625 Akola 33.09 21.08 26.84 13.64 15.07 14.21 53.27 63.85 58.9526 Washim – – – – – – – – –27 Amaravati 44.19 34.31 37.43 12.64 15.07 14.40 43.17 50.62 48.1728 Yavatmal 44.67 28.92 34.79 14.33 18.86 17.55 41.00 52.22 47.6629 Wardha 36.44 33.92 34.56 17.74 21.06 20.58 45.81 45.02 44.8630 Nagpur 17.61 14.21 16.07 26.33 35.02 33.88 56.06 50.78 50.0631 Bhandara 40.81 33.18 31.73 24.46 31.47 31.98 34.72 35.35 36.2932 Gondia – – – – – – – –33 Chandrapur 45.05 41.19 40.63 22.05 22.68 22.91 32.91 36.13 36.4634 Gadchiroli 73.28 63.62 64.82 6.82 10.08 9.91 19.90 26.30 25.27
Maharashtra 21.29 16.84 18.80 31.29 33.05 32.13 47.42 50.11 49.07
Note: (1) Figures for newly formed districts i.e. Nandurbar, Hingoli; Washim and Gondia are not available hence, combined figures are given for undivided districts viz. Dhule, Parbhani, Akola and Bhandara respectively.
(2) Due to the paucity of data, use of indicators for allocation and various limitations of estimation procedure, the district domestic products are to be accepted with a margin of error and can be used to have a broad judgement on the level of income in the districts.
# Includes Mumbai City and Mumbai Suburban District.Source: Directorate of Economics and Statistics, Mumbai.
172 Human Development Report Maharashtra 2002

Economic Growth and PovertyTable 19
Employment in Central Government, State Government and Local Bodies for 2000
Sr. No. District
Central Government 2000 State Government 2000 Local Bodies 2000Total Female Total Female Total Female
1 2 3 4 5 6 7 8 1 Mumbai # 179946 21589 78456 13335 172748 37542 2 Thane 8930 1230 30379 3916 42064 13875 3 Raigad 2730 209 9114 838 10562 3237 4 Ratnagiri 1150 235 9346 1129 12431 4548 5 Sindhudurg 1560 151 5879 535 6604 2646 6 Nashik 23070 1442 25370 2238 25942 7483 7 Dhule 1938 118 16486 1507 13679 3516 8 Nandurbar – – – – – – 9 Jalgaon 35059 1693 12436 900 20228 462210 Ahmednagar 5328 692 18386 1151 20083 533711 Pune 54307 8264 46574 6784 51565 1706312 Satara 2947 280 13425 960 16133 499813 Sangli 2155 269 11847 1248 14110 452114 Solapur 16288 835 16632 1608 22254 517615 Kolhapur 3038 319 12682 1087 22514 558016 Aurangabad 3867 301 18262 2117 14966 374917 Jalna 232 12 6332 246 9456 216218 Parbhani 152 29 11504 592 12827 165619 Hingoli – – – – – –20 Beed 1228 31 14729 2714 15402 251921 Nanded 1737 68 17260 1179 16592 293222 Osmanabad 1471 31 7443 519 13783 462823 Latur 370 34 7328 433 11124 262824 Buldhana 1112 36 9535 643 13699 317025 Akola 1877 108 10293 902 16426 397926 Washim – – – – – –27 Amaravati 1466 120 20288 1851 17905 499928 Yavatmal 0 0 13636 672 14996 244329 Wardha 2557 141 7903 661 8792 247630 Nagpur 57525 3648 35450 4893 23196 798731 Bhandara 4465 266 8823 694 14537 298032 Gondia – – – – – –33 Chandrapur 7202 335 11954 1068 11926 330234 Gadchiroli 112 – 10512 1434 7065 1375
Maharashtra 423822 42490 518269 57860 673616 173137
Note: (1) Figures for newly formed districts i.e. Nandurbar, Hingoli, Washim and Gondia are not available, hence combined figures are given for undivided districts viz. Dhule, Parbhani, Akola and Bhandara respectively.
(2) Due to the paucity of data, use of indicators for allocation and various limitations of estimation procedure, the district domestic products are to be accepted with a margin of error and can be used to have a broad judgement on the level of income in the districts.
# Includes Mumbai City and Mumbai Suburban District.Source: Commissioner, Employment and Self Employment, Navi Mumbai.
Annexure Tables 173

Economic Growth and PovertyTable 20
Employment in Central Government Quasi and State Government Quasi for 2000
Sr. No. District
Central Government Quasi 2000 State Government Quasi 2000
Total Female Total Female
1 2 3 4 5 6 1 Mumbai # 248483 44891 16528 2830 2 Thane 10084 3022 15687 834 3 Raigad 11601 934 5844 143 4 Ratnagiri 1904 217 6994 204 5 Sindhudurg 1223 152 4677 315 6 Nashik 13138 1389 16225 616 7 Dhule 3180 160 7212 124 8 Nandurbar – – – – 9 Jalgaon 3558 235 12530 23310 Ahmednagar 2603 321 8667 15911 Pune 25052 6341 20220 247012 Satara 2500 339 8868 29213 Sangli 2163 245 9169 19314 Solapur 3856 337 12375 63115 Kolhapur 3456 492 11946 33816 Aurangabad 4268 607 11541 43417 Jalna 528 45 2896 2918 Parbhani 848 44 6194 12219 Hingoli – – – –20 Beed 1032 52 7300 9521 Nanded 2639 135 7412 15922 Osmanabad 576 27 3812 6623 Latur 1023 43 5552 16424 Buldhana 978 43 5255 7725 Akola 3786 397 7133 23226 Washim – – – –27 Amaravati 3595 270 8588 23728 Yavatmal 3535 130 6410 14429 Wardha 2513 145 5320 19330 Nagpur 38323 3212 23796 112831 Bhandara 3343 463 3813 15632 Gondia – – – –33 Chandrapur 21426 784 8663 22334 Gadchiroli 285 17 1226 46
Maharashtra 421499 65489 271853 12887
Note: Figures for newly formed districts i.e. Nandurbar, Hingoli, Washim and Gondia are not available, hence combined figures are given for undivided districts viz. Dhule, Parbhani, Akola and Bhandara respectively.
# Includes Mumbai City and Mumbai Suburban District.Source: Commissioner, Employment and Self Employment, Navi Mumbai.
174 Human Development Report Maharashtra 2002

Economic Growth and PovertyTable 21
Number of Families Below Poverty Line for 1997–98
Sr. No. District Total Families BPL Families Percentage
1 2 3 4 5 1 Mumbai # – – – 2 Thane 402169 209524 52.10 3 Raigad 340366 97584 28.67 4 Ratnagiri 326096 119669 36.70 5 Sindhudurg 170772 63628 37.26 6 Nashik 538214 211157 39.23 7 Dhule 259731 131013 50.44 8 Nandurbar 221137 166799 75.43 9 Jalgaon 597900 229150 38.3310 Ahmednagar 602305 150825 25.0411 Pune 545983 106604 19.5312 Satara 467166 75817 16.2313 Sangli 362854 51386 14.1613 Solapur 499206 134329 26.9115 Kolhapur 476983 81858 17.1616 Aurangabad 293555 76342 26.0117 Jalna 256848 69797 27.1717 Parbhani 364859 112489 30.8319 Hingoli – – –20 Beed 368707 95282 25.8421 Nanded 378020 110741 29.30 21 Osmanabad 269077 58031 21.5723 Latur 303322 85406 28.16 24 Buldhana 361639 150589 41.6425 Akola 222727 99136 44.51 25 Washim 192038 92842 48.3527 Amaravati 360658 184932 51.28 28 Yavatmal 423641 184801 43.6229 Wardha 182000 80840 44.42 30 Nagpur 324165 111253 34.3231 Bhandara 443998 229102 51.60 31 Gondia – – –33 Chandrapur 316892 148697 46.92 34 Gadchiroli 180117 99389 55.18
Maharashtra 11053145 3819012 34.55
Note: Figures for newly formed districts i.e. Nandurbar, Hingoli, Washim and Gondia are not available, hence combined figures are given for undivided districts viz. Dhule, Parbhani, Akola and Bhandara respectively.
# Includes Mumbai City and Mumbai Suburban District.Source: Below Poverty Line Survey for 1997-98 by Rural Development Department, Mantralaya, Mumbai.
Annexure Tables 175

Economic Growth and PovertyTable 22
Agricultural Wage Rate per Day for Males and Females
In Rupees
Sr. No. Month
Wage Rates (Ploughing)
1997 1998 1999 2000
Male Female Male Female Male Female Male Female
1 2 3 4 5 6 7 8 9 10
1 January 39.39 – 41.33 – 49.31 – 56.29 –
2 February 39.58 – 42.56 – 50.36 – 55.12 –
3 March 39.24 – 42.00 – 50.25 – 55.10 –
4 April 38.23 – 41.96 – 48.73 – 54.01 –
5 May 40.17 – 41.98 – 47.08 – 53.58 –
6 June 39.28 – 44.08 – 50.86 – 57.01 –
7 July 40.94 – 46.06 – 51.45 – 58.90 –
8 August 39.94 – 46.12 – 52.00 – 59.19 –
9 September 41.10 – 49.04 – 52.37 – 60.95 –
10 October 42.09 – 49.04 – 53.45 – 62.78 –
11 November 42.22 – 48.61 – 53.86 – 62.78 –
12 December 41.69 – 49.81 – 54.39 – 62.78 –
In Rupees
Sr. No. Month
Wage Rates (Sowing)
1997 1998 1999 2000
Male Female Male Female Male Female Male Female
1 2 3 4 5 6 7 8 9 10
1 January 36.60 25.65 41.07 28.72 46.11 35.05 46.84 31.75
2 February 37.33 26.69 41.32 30.40 48.89 38.00 46.79 29.25
3 March 37.17 26.69 45.77 32.00 49.71 40.36 50.83 36.56
4 April 38.24 27.33 45.00 38.83 51.67 34.62 53.95 37.50
5 May 38.66 27.50 45.00 32.50 49.64 33.75 54.12 38.18
6 June 37.37 26.20 42.07 29.06 46.95 33.71 51.51 39.36
7 July 40.13 27.56 42.25 29.64 48.33 32.50 51.58 30.88
8 August 39.01 26.51 42.72 30.91 46.25 30.50 53.16 32.37
9 September 40.65 27.25 45.62 34.63 54.23 30.71 54.35 31.88
10 October 41.63 28.03 45.78 34.63 47.92 31.67 53.70 30.00
11 November 41.37 28.11 44.67 33.41 48.03 30.51 52.87 30.70
12 December 41.52 28.58 44.39 33.76 46.96 31.13 52.42 30.67
176 Human Development Report Maharashtra 2002

Economic Growth and PovertyTable 22 (continued)
Agricultural Wage Rate per day for Males and Females
In Rupees
Sr. No. Month
Wage Rates (Harvesting)
1997 1998 1999 2000
Male Female Male Female Male Female Male Female
1 2 3 4 5 6 7 8 9 10
1 January 34.50 23.82 39.75 27.21 43.73 32.43 48.03 30.93
2 February 35.28 24.61 40.87 27.22 41.37 28.20 46.84 32.10
3 March 35.88 24.24 39.75 26.71 41.72 27.42 47.57 32.14
4 April 37.42 24.69 39.75 27.92 41.43 28.28 46.99 31.57
5 May 38.11 25.57 39.08 26.44 41.18 28.82 47.85 32.81
6 June 37.89 24.90 40.00 29.79 40.91 29.00 50.75 33.68
7 July 37.80 24.45 – – – – 37.50 –
8 August 37.63 22.88 – – – – 57.92 35.71
9 September 38.83 24.42 38.55 26.78 48.21 33.33 54.48 34.12
10 October 39.85 27.25 42.25 31.29 45.13 31.78 50.26 34.83
11 November 39.39 26.96 42.65 32.05 47.47 33.42 47.95 33.64
12 December 40.70 27.88 44.69 33.49 47.97 34.31 48.11 34.05
In Rupees
Sr. No. Month
Wage Rates (Threshing)
1997 1998 1999 2000
Male Female Male Female Male Female Male Female
1 2 3 4 5 6 7 8 9 10
1 January 34.93 24.07 40.44 26.05 41.18 31.82 43.64 30.50
2 February 34.27 23.18 40.19 25.50 43.93 35.46 44.00 –
3 March 36.69 23.26 39.82 25.75 43.00 34.23 43.82 29.62
4 April 37.73 24.32 40.48 26.56 40.94 30.93 43.75 31.25
5 May 37.12 23.85 40.29 28.57 – – 44.50 –
6 June 38.30 23.83 – – – – – –
7 July – 24.10 – – – – – –
8 August – – – – – – – –
9 September – – – – – – – –
10 October 43.13 26.54 41.67 – – – 51.00 –
11 November 40.46 26.37 41.84 – 40.33 – 51.54 –
12 December 41.36 26.84 41.56 – 41.50 – 52.50 –
Source: National Sample Survey Organisation Data Processing Division Headquarters, Kolkata.
Annexure Tables 177

Economic Growth and PovertyTable 23
Employment in Central Government, State Government and Local Bodies (1996–2000)
Sr. No. Year
Employment in
Central Government State Government Local BodiesCentral Government
QuasiState Government
Quasi
Total Female Total Female Total Female Total Female Total Female
1 2 3 4 5 6 7 8 9 10 11 12
1 1996 453553 41654 530737 54712 665481 167470 421499 65489 271853 12887
2 1997 447708 41496 527946 54464 679279 171412 424166 66779 267170 12295
3 1998 432834 42279 531249 55885 682962 171825 416439 66128 268078 12624
4 1999 427350 42300 522334 57304 679120 171571 412703 67180 263854 12292
5 2000 423819 42486 518264 57854 673609 173129 412148 67564 262087 11959
Source: Commissioner, Employment and Self-Employment, Navi Mumbai.
178 Human Development Report Maharashtra 2002

Economic Growth and PovertyTable 24
Selected Indicators of Human Development
StateLiteracy (%) (Reference Year—1991) Life Expectancy
at Birth (Years)1991–95
Per Capita SDP(Rs at Current Prices)
1998–99Male Female Total
1 2 3 4 5 6
Andhra Pradesh 55.13 32.72 44.09 61.80 13,853
Assam 61.87 43.03 52.89 55.70 8,700
Bihar 52.49 22.89 38.48 59.30 5,923
Gujarat 73.13 48.64 61.29 61.00 18,792
Haryana 69.10 40.47 55.85 63.40 19,773
Karnataka 67.26 44.34 56.04 62.50 15,889
Kerala 93.62 86.17 89.81 72.90 17,756
Madhya Pradesh 58.42 28.85 44.20 54.70 10,147
Maharashtra 76.56 52.32 64.87 64.80 20,644
Orissa 63.09 34.68 49.09 56.50 8,719
Punjab 65.66 50.41 58.51 67.20 20,834
Rajasthan 54.99 20.44 38.55 59.10 11,045
Tamil Nadu 73.75 51.33 62.66 63.30 17,525
Uttar Pradesh 55.73 25.31 41.60 56.80 9,261
West Bengal 67.81 46.56 57 70 62.10 12,961
All-India 64.13 39.29 52.21 60.30 14,712
Source: Government of Maharashtra (2001a).
Annexure Tables 179

Economic Growth and PovertyTable 25
Estimates of Per Capita Intake of Calories, Protein and Fat per Diem by Decile Groups:Urban Maharashtra
DecileGroup
Calorie (cal.) Protein (gm.) Fat (gm.)
1972–73 1983 1993–94 1972–73 1983 1993–94 1972–73 1983 1993–94
1 2 3 4 5 6 7 8 9 10
0–10 1197.00 1400.22 1471.97 32.43 41.34 42.78 14.24 18.03 21.70
10–20 1513.24 1592.57 1644.80 59.15 47.35 47.03 22.82 24.06 30.04
20–30 1676.00 1719.90 1765.37 51.10 50.01 49.83 28.60 29.02 34.87
30–40 1726.91 1788.68 1850.75 51.42 52.03 52.01 30.91 32.12 38.90
40–50 1778.39 1886.00 1879.85 51.61 54.00 52.63 33.17 39.00 43.00
50–60 1919.00 1999.84 1949.32 52.00 57.48 53.95 39.30 44.21 47.49
60–70 1993.75 2049.21 2089.00 53.95 58.53 58.70 43.41 47.12 53.60
70–80 2181.97 2217.71 2227.16 58.81 61.47 60.99 53.27 58.04 60.38
80–90 2609.00 2695.69 2379.50 69.20 70.22 65.15 66.90 75.03 67.40
90–100 3114.74 2930.16 2632.28 73.34 67.55 71.93 86.39 83.35 81.63
All 1971.00 2028.00 1989.00 55.30 56.00 55:50 41.90 45.00 47.90
Source: Based on NSSO (1983, 1986 & 1997).
Estimates of Per Capita Intake of Calories, Protein and Fat per Diem by Decile Groups:Rural Maharashtra
DecileGroup
Calorie (cal.) Protein (gm.) Fat (gm.)
1972–73 1983 1993–94 1972–73 1983 1993–94 1972–73 1983 1993–94
1 2 3 4 5 6 7 8 9 10
0–10 1063.41 1540.20 1333.80 32.12 45.31 40.87 10.28 15.13 16.79
10–20 1420.23 1737.40 1532.24 43.14 50.34 43.95 14.26 18.89 21.82
20–30 1588.21 1851.10 1662.20 47.35 53.58 47.64 15.44 21.19 24.70
30–40 1695.00 1920.00 1765.40 49.70 56.00 50.26 17.70 23.00 27.24
40–50 1818.82 2064.20 1854.20 52.42 59.78 52.34 22.48 25.27 30.85
50–60 1959.00 2155.90 1921.22 55.50 61.75 53.97 27.90 27.89 33.17
60–70 2056.27 2230.00 2028.14 58.47 63.00 56.78 28.56 31.00 35.88
70–80 2152.00 2337.80 2110.50 61.40 66.46 58.85 29.20 34.46 38.23
80–90 2370.71 2544.20 2299.87 67.87 72.82 31.92 41.50 44.14 –
90–100 2826.35 3059.10 2882.43 79.03 90.96 79.02 46.27 61.68 62.19
All 1895.00 2144.00 1939.00 54.70 62.00 54.80 24.40 30.00 33.50
Source: Based on NSSO (1983, 1986, 1989 and 1997a).
180 Human Development Report Maharashtra 2002

Economic Growth and PovertyTable 25A
Monthly Per Capita Cereal Consumption (Kg) by Select Decile Groups: Maharashtra
YearRural Sector Population Decile Group (per cent) Urban Population Decile Group (per cent)
0–10 10–20 20–30 30–40 40–50 All 0–10 10–20 20–30 30–40 40–50 All
1 2 3 4 5 6 7 8 9 10 11 12 13
1961–62 13.36 11.61 12.59 14.55 13.96 16.07 9.57 10.08 11.22 11.41 11.27 10.81
1972–73 7.72 10.19 11.55 12.09 12.53 12.64 7.71 9.42 9.77 9.54 9.45 8.99
1973–74 9.50 11.20 12.08 12.84 13.53 13.48 8.74 9.86 9.63 9.31 9.35 9.26
1977–78 9.61 11.15 12.09 12.82 13.07 13.57 9.32 10.44 10.32 10.26 10.43 10.01
1983 11.06 12.24 12.80 13.08 13.85 13.83 9.27 9.79 10.15 10.23 10.11 10.00
1986–87 7.92 10.27 10.80 11.97 12.37 11.88 8.27 8.68 9.12 10.20 10.34 9.29
1987–88 10.36 11.57 12.37 12.94 13.35 13.06 9.99 10.56 10.48 10.63 9.98 10.23
1993–94 9.03 9.96 10.61 11.10 11.27 11.41 9.43 9.54 9.75 9.83 9.44 9.41
1999–00 9.69 10.35 10.98 11.38 11.80 11.47 7.92 9.48 9.51 10.38 9.70 9.45
Source: Author’s estimates based on various issues of Sarvekshana.
Annexure Tables 181

Economic Growth and PovertyTable 26
Growth in State Domestic Product at Factor Cost by Sector, Maharashtra, 1960–2000
Sector
Share inSDP ’60–’61 (%)
Growth’61–’70(% perannum)
Share inSDP ’70–’71 (%)
Growth’71–’80(% perannum)
Share inSDP ’80–’81 (%)
Growth’81–’90(% perannum)
Share inSDP ’90–’91 (%)
Growth’90–’00(% perannum)
Share inSDP ’99–’00 (%)
Growth’61–’00(% perannum)
1 2 3 4 5 6 7 8 9 10 11
Agriculture 36.20 –0.85 24.40 6.64* 23.65 3.28 19.59 4.38 15.52 2.93
Forestry & logging 4.89 –0.73 4.36 0.05 2.57 1.52 1.90 –3.06 0.86 0.17
Fishing 0.67 3.55 0.60 6.36* 0.75 1.93 0.49 5.22 0.40 3.63*
Mining & quarrying 0.37 7.45* 0.49 5.46* 0.73 4.43 0.91 3.29 0.66 6.10*
Sub Total: Primary 42.14 –0.67 29.86 5.77* 27.69 3.12 22.88 3.83 17.44 2.74*
Registered Manufacturing
9.91 5.90* 14.12 7.15* 16.66 6.98* 18.91 5.28* 16.56 5.94*
Unregistered Manufacturing
7.01 2.40* 6.90 4.77* 7.21 4.73* 6.14 9.45* 8.06 4.91*
Construction 8.68 3.55* 9.53 1.26* 7.28 3.60* 5.89 4.75* 5.35 2.82*
Electricity, gas &water supply
0.53 10.92* 1.15 5.46* 1.40 9.68* 1.96 8.05* 2.15 8.35*
Sub Total: Secondary 26.13 4.42* 31.70 5.77* 32.56 5.91* 32.90 6.30* 32.11 5.05*
Railways 0.97 3.95* 1.05 5.26* 0.96 4.66* 0.90 5.58* 0.83 3.90*
Transport by othermeans & storage
1.86 8.50* 3.23 3.76* 3.18 7.59* 3.98 8.61* 4.53 6.59*
Communications 0.93 11.04* 1.66 7.28* 2.28 6.06* 2.19 16.02* 4.53 7.50*
Trade, hotels & restaurants
12.34 2.30* 11.59 6.49* 12.77 5.65* 13.36 7.86* 13.93 5.07*
Banking & insurance 2.72 1.53 4.24 5.92* 4.47 10.71* 7 87 6.76 9.96 9.15*
Real estate, ownershipof dwellings & building services
6.87 4.95* 8.52 3.28* 7.94 3.23* 6.21 4.36* 5.27
Public administration 1.05 9.06* 2.16 8.59* 3.24 7.55* 3.52 –2.22 4.33 7.93*
Other services 4.99 4.72* 5.99 2.10* 4.91 6.90 6.19 7.18* 7.08 5.03*
Sub Total: Tertiary 31.73 4.31* 38.44 5.03* 39.75 6.42* 44.21 7.56* 50.45 5.82*
Net State DomesticProduct
100.00 2.52* 100.00 5.23* 100.00 5.42* 100.00 6.40* 100.00 4.73*
Per Capita SDP (Rs) 0.06 2.94* 3.05* 4.64* 2.43*
* Significant at 1 % level for a two-tail test.Note: Growth rates worked out from Ordinary Least Squares semi-log trend functions.Source: Based on data at 1993–94 prices provided by the Directorate of Economics & Statistics, Government of Maharashtra.
182 Human Development Report Maharashtra 2002

Economic Growth and PovertyTable 27
EGS: A Statistical Profile
Year
TotalExpenditure(Rs millionat current
prices)
TotalExpenditure(Rs millionat 1993–94 prices)
Proportionof total
Expenditureon Wages
(%)
PersondaysGenerated(Million)
Cost perPersonday
(Rs atcurrentprices)
Cost perPersonday
(Rs at1993–94
prices)
AverageLabour
Attendanceper day
(Million)
AverageWage perPersonday
(Rs atcurrentprices)
AverageWage perPersonday
(Rs at1960–61
prices)
1 2 3 4 5 6 7 8 9 10
1972–73 18.8 107.26 – 4.50 4.18 23.84 – – –
1973–74 18.9 93.38 – 5.10 3.71 18.31 – – –
1974–75 137.2 582.71 – 48.10 2.85 12.11 – – –
1975–76 346.1 1461.76 90.95 109.50 3.16 13.35 0.33 – –
1976–77 511.0 2029.56 75.04 136.50 3.74 14.87 0.46 2.81 0.91
1977–78 515.4 1958.65 73.98 117.30 4.39 16.70 0.39 3.25 1.01
1978–79 741.7 2700.41 79.58 163.50 4.54 16.52 0.55 3.61 1.16
1979–80 1092.3 3514.17 81.89 205.40 5.32 17.11 0.69 4.36 1.24
1980–81 1221.2 3419.90 75.90 171.50 7.12 19.94 0.57 5.40 1.41
1981–82 1261.7 3275.18 77.74 156.00 8.09 20.99 0.52 6.28 1.36
1982–83 1309.3 3292.33 76.20 128.00 10.23 25.72 0.47 7.80 1.74
1983–84 1849.8 4309.05 75.34 164.50 11.24 26.19 0.55 8.41 1.68
1984–85 2320.4 5097.24 63.68 178.00 13.04 28.64 0.60 8.30 1.61
1985–86 2722.4 5568.63 66.85 189.50 14.37 29.39 0.63 9.60 1.79
1986–87 2434.3 4699.60 63.47 187.60 12.98 25.05 0.63 8.23 1.44
1987–88 2883.1 5045.16 53.19 133.30 21.63 37.85 0.46 9.11 1.46
1988–89 2542.3 4080.72 50.00 81.30 31.27 50.19 0.27 15.02 2.21
1989–90 2392.8 3581.11 53.30 78.00 30.68 45.91 0.28 15.53 2.07
1990–91 2389.2 3228.30 57.37 89.80 26.61 35.95 0.18 15.02 1.97
1991–92 3199.2 3816.37 63.14 119.40 26.79 31.96 0.26 16.91 1.71
1992–93 4527.2 4987.51 60.30 148.00 30.59 33.70 0.38 18.45 1.60
1993–94 3473.4 3473.40 52.69 98.40 35.30 35.30 0.22 18.60 1.80
1994–95 3840.9 3420.11 69.92 94.20 40.77 36.31 0.19 28.51 2.29
1995–96 4437.5 3632.09 63.00 97.00 45.75 37.44 0.19 28.82 1.93
1996–97 3667.5 2836.11 70.00 90.10 40.70 31.48 0.10 28.49 1.90
1997–98 3530.0 2584.87 73.00 90.00 39.22 28.72 0.10 28.63 1.88
1998–99 4566.6 3166.02 71.00 91.90 49.69 34.45 0.12 35.28 2.09
1999–2000 4939.7 3253.38 75.00 94.90 52.05 34.28 0.12 39.04 2.23
Total 62889.9 89214.98 3271.30 – – – – – –
Average – – 66.95 20.71 27.94 15.23 1.69 – –
Note: Estimates of total expenditure on the EGS at constant 1993–94 prices are obtained using implicit state domestic product deflator and those of wages at constant 1960–61 prices are obtained using the Consumer Price Index for Agricultural Labourers.
Source: Planning Department, Mantralaya, Mumbai.
Annexure Tables 183

Economic Growth and PovertyTable 27A
Sectoral Growth Performance during different Five Year Plan Periods—Maharashtra and All India (Average Growth Rate: Per Cent Per Annum)
Maharashtra All-India
PlanPrimarySector
SecondarySector
TertiarySector
TotalSector
PrimarySector
SecondarySector
TertiarySector
TotalSector
1 2 3 4 5 6 7 8 9
III Plan (1961–66) –2.84 4.54 4.34 1.77 –0.46 6.50 5.22 2.47
Annual Plan (1966–69) 5.36 4.58 4.38 4.76 4.08 3.21 3.92 3.72
IV Plan (1969–74) –0.18 2.56 3.59 2.19 2.51 3.07 4.05 3.20
V Plan (1974–79) 3.52 7.67 6.78 6.02 3.33 6.41 5.65 4.80
Annual Plan (1979–80) –0.22 1.56 1.59 1.05 –13.09 –4.86 1.63 –6.23
VI Plan (1980–85) 1.00 3.04 6.16 3.77 5.69 5.61 5.47 5.47
VII Plan (1985–90) 1.00 7.10 7.00 8.25 3.24 7.52 8.07 6.03
Annual Plan (1990–92) –18.73 0.31 2.19 –0.67 1.46 2.25 5.06 3.12
VIII Plan (1992–97) 5.23 6.87 5.37 6.73 4.64 7.04 7.55 6.44
Note: Sectoral growth rates worked out on the basis of net domestic product estimates at 1993–94 prices.Source: Based on data at 1993–94 prices provided by the Directorate of Economics and Statistics, Mumbai.
Health and Nutrition: Tables 28 – 53 →
← Contents
184 Human Development Report Maharashtra 2002

Health and NutritionTable 28
Number of Medical Institutions* for 1961, 1971, 1981, 1991 and 2000,and Annual Growth Ratio for 1961 to 2000 and 1991 to 2000
Sr. No. District
Number of Government Medical Institution Annual Growth Rate
1961 1971 1981 1991 2000 1961–2000 1991–2000
1 2 3 4 5 6 7 8 9 1 Mumbai # 129 191 245 267 747 14.48 0.19 2 Thane 5 9 27 42 48 24.00 11.43 3 Raigad 7 7 13 21 22 7.86 10.48 4 Ratnagiri 4 7 9 14 14 8.75 10.00 5 Sindhudurg – – – 9 12 0.00 13.33 6 Nashik 4 12 25 41 56 35.00 13.66 7 Dhule 5 6 15 23 29 14.50 12.61 8 Nandurbar – – – – – – – 9 Jalgaon 3 7 15 34 38 31.67 11.1810 Ahmednagar 6 6 20 30 32 13.33 10.6711 Pune 15 21 47 90 96 16.00 10.6712 Satara 5 7 15 20 23 11.50 11.5013 Sangli 2 5 12 21 22 27.50 10.4814 Solapur 9 16 22 42 44 12.22 10.4815 Kolhapur 3 9 16 18 24 20.00 13.3316 Aurangabad 1 11 17 17 19 47.50 11.1817 Jalna – – – 8 9 – 11.2518 Parbhani 1 3 5 13 18 45.00 13.8519 Hingoli – – – – – – –20 Beed 2 4 5 12 13 16.25 10.8321 Nanded 4 5 8 21 24 15.00 11.4322 Osmanabad 1 6 5 12 13 32.50 10.8323 Latur – – – 11 13 – 11.8224 Buldhana 14 14 15 18 20 3.57 11.1125 Akola 5 12 19 22 27 13.50 12.2726 Washim – – – – – – –27 Amaravati 14 15 28 45 50 8.93 11.1128 Yavatmal 14 14 18 20 22 3.93 11.0029 Wardha 8 10 14 18 19 5.94 10.5630 Nagpur 21 25 39 43 44 5.24 10.2331 Bhandara 9 10 10 17 20 5.56 11.7633 Chandrapur 7 8 13 20 22 7.86 11.0034 Gadchiroli – – – 8 13 – 16.25
Maharashtra 298 440 677 977 1553 13.03 15.90
Note: Figures for newly formed districts i.e. Nandurbar, Hingoli, Washim and Gondia are not available hence, combined figures are given for undivided districts viz. Dhule, Parbhani, Akola and Bhandara respectively.
* Excluding private institutions. # Includes Mumbai City and Mumbai Suburban District.
Source: Directorate of Health Services, Mumbai.
Annexure Tables 185

Health and NutritionTable 29
Population per Government Medical Institution* and Number of Medical Institutionsper lakh population for 1961, 1971, 1981, 1991 and 2000
Sr. No. District
Population per Government Medical Institution Number of Medical Institutionsper lakh population
1961 1971 1981 1991 2000 1961 1971 1981 1991 2000 1 2 3 4 5 6 7 8 9 10 11 12 1 Mumbai # 32186 31260 33647 37176 15950 3.1 3.2 3.0 2.7 6.3 2 Thane 330536 253518 124132 124979 149588 0.3 0.4 0.8 0.8 0.7 3 Raigad 151265 180429 114342 86896 99002 0.7 0.6 0.9 1.2 1.0 4 Ratnagiri 456801 284369 234690 110290 71280 0.2 0.4 0.4 0.9 0.8 5 Sindhudurg – – – 92461 138692 – – – 1.1 1.4 6 Nashik 463812 197435 119870 93935 84659 0.2 0.5 0.8 1.1 1.2 7 Dhule 270247 277030 136686 110248 104884 0.4 0.4 0.7 0.9 1.0 8 Nandurbar – – – – – – – – – – 9 Jalgaon 588349 303303 174652 93754 99557 0.2 0.3 0.6 1.1 1.010 Ahmednagar 295995 378186 135115 112431 127020 0.3 0.3 0.7 0.9 0.811 Pune 164459 151335 88606 61473 72315 0.6 0.7 1.1 1.6 1.412 Satara 119175 75103 63709 27544 30686 0.3 0.4 0.7 0.8 0.813 Sangli 615358 307964 162601 105214 118458 0.2 0.3 0.7 1.0 0.814 Solapur 206680 140865 118643 76930 88138 0.5 0.7 0.8 1.3 1.115 Kolhapur 532164 227561 156646 166084 145739 0.2 0.4 0.6 0.6 0.716 Aurangabad 1532341 179182 143142 130222 106235 0.1 0.6 0.7 0.8 0.917 Jalna – – – 170553 303206 – – – 0.6 0.518 Parbhani 1206226 502257 265376 162849 134610 0.1 0.2 0.3 0.6 0.719 Hingoli – – – – – – – – – –20 Beed 500733 321530 297206 151839 167152 0.2 0.3 0.3 0.7 0.621 Nanded 269918 279552 210687 119970 122038 0.4 0.4 0.5 0.9 0.822 Osmanabad 1477556 316116 446124 106361 96488 0.1 0.3 0.2 0.9 0.923 Latur – – – 152422 257945 – – – 0.7 0.624 Buldhana 75693 90213 75439 125753 126606 1.3 1.1 1.3 0.8 0.825 Akola 237871 125123 96155 100649 97032 0.4 0.8 1.0 1.0 1.026 Washim – – – – – – – – – –27 Amaravati 88056 102747 60479 48890 51146 1.1 1.0 1.5 2.0 2.028 Yavatmal 78462 101691 96524 102857 110647 1.3 1.0 1.0 1.0 0.929 Wardha 79285 77956 66487 59298 64072 1.3 1.3 1.5 1.7 1.630 Nagpur 72038 77738 66380 76445 91167 1.4 1.3 1.5 1.3 1.131 Bhandara 140921 158558 183758 123978 119603 0.7 0.6 0.5 0.8 0.832 Gondia – – – – – – – – – –33 Chandrapur 176867 205017 158126 88600 68586 0.6 0.5 0.6 1.1 1.034 Gadchiroli – – – 98376 121078 – – – 1.0 1.4
Maharashtra 202295 178481 120134 97611 10451148 0.5 0.6 0.8 1.0 1.0
Note: Figures for newly formed districts i.e. Nandurbar, Hingoli, Washim and Gondia are not available hence, combined figures are given for undivided districts viz. Dhule, Parbhani, Akola and Bhandara respectively.
* Excluding private institutions. # Includes Mumbai City and Mumbai Suburban District.
Source: Directorate of Health Services, Mumbai.
186 Human Development Report Maharashtra 2002

Health and NutritionTable 30
Number of PHCs, Population per PHC, and Number of PHCsper lakh population for 1961, 1971, 1981, 1991 and 2000
Sr. No. District
District-wise Growth of Primary Health Centres1961 1971 1981
PHCsPopulationper PHC
No. of PHCsper lakh
population PHCsPopulationper PHC
No. of PHCsper lakh
population PHCsPopulationper PHC
No. of PHCsper lakh
population 1 2 3 4 5 6 7 8 9 10 11 1 Mumbai # – – – – – – – – – 2 Thane 6 192225 0.5 17 85583 1.2 24 77723 1.3 3 Raigad 5 190435 0.5 15 74028 1.4 18 70921 1.4 4 Ratnagiri 12 139945 0.7 24 75975 1.3 18 107800 0.9 5 Sindhudurg – – – – – – – – – 6 Nashik 6 230044 0.4 17 99456 1.0 22 93800 1.1 7 Dhule 7 162197 0.6 14 98175 1.0 21 78577 1.3 8 Nandurbar – – – – – – – – – 9 Jalgaon 7 195404 0.5 18 90054 1.1 22 89092 1.110 Ahmednagar 6 264776 0.4 16 126101 0.8 18 130941 0.811 Pune 7 218139 0.5 19 97277 1.0 24 88475 1.112 Satara 7 181668 0.6 16 93757 1.1 17 104287 1.013 Sangli 7 148327 0.7 11 113902 0.9 12 119760 0.814 Solapur 6 223374 0.4 15 109153 0.9 16 115161 0.915 Kolhapur 3 429573 0.2 15 107187 0.9 16 117769 0.816 Aurangabad 3 438543 0.2 14 172353 0.9 14 117268 0.617 Jalna – – – – – – – – –18 Parbhani 6 173256 0.6 13 97295 1.0 13 114350 0.919 Hingoli – – – – – – – – –20 Beed 6 189470 0.8 7 128974 0.5 13 96635 1.021 Nanded 7 131972 0.8 11 106326 0.9 13 109345 0.922 Osmanabad 4 330348 0.3 14 118550 0.8 7 269626 0.423 Latur – – – – – – – – –24 Buldhana 6 147377 0.7 12 86764 1.2 13 94599 1.125 Akola 9 102947 1.0 12 95677 1.0 13 105561 0.926 Washim – – – – – – – – –27 Amaravati 10 91059 1.1 13 85887 1.2 14 94065 1.128 Yavatmal 8 119993 0.8 13 94594 1.1 17 86782 1.229 Wardha 5 96852 1.0 7 84066 1.2 8 86889 1.230 Nagpur 6 120851 0.8 12 73944 1.4 13 86118 1.831 Bhandara 7 161718 0.6 13 108082 0.9 16 99801 1.032 Gondia – – – – – – – – –33 Chandrapur 3 380793 0.3 17 86649 1.2 13 137993 0.734 Gadchiroli – – – – – – – – –
Maharashtra 159 167995 0.6 355 981325 1.0 395 94479 1.1Note: Figures for newly formed districts i.e. Nandurbar, Hingoli, Washim and Gondia are not available hence, combined figures are given
for undivided districts viz. Dhule, Parbhani, Akola and Bhandara respectively. # Includes Mumbai City and Mumbai Suburban District.
Source: Directorate of Health Services, Mumbai.
Annexure Tables 187

Health and NutritionTable 30 (continued)
Number of PHCs, Population per PHC and Number of PHCsper lakh population for 1961, 1971, 1981, 1991 and 2000
Sr. No. District
District-wise Growth of Primary Health Centres1991 2000
PHCsPopulationper PHC
No. of PHCs perlakh population PHCs
Populationper PHC
No. of PHCs perlakh population
1 2 12 13 14 15 16 17 1 Mumbai # – – – – – – 2 Thane 73 25424 3.9 77 24223 4.1 3 Raigad 53 28230 3.5 54 32010 3.1 4 Ratnagiri 67 20985 4.4 67 13299 4.0 5 Sindhudurg 38 20237 4.6 38 40474 4.3 6 Nashik 91 27278 3.7 100 29216 3.4 7 Dhule 81 24887 4.0 90 26646 3.8 8 Nandurbar – – – – – – 9 Jalgaon 76 30434 3.3 80 33569 3.010 Ahmednagar 88 32267 3.1 89 37590 2.711 Pune 82 33238 3.0 86 38940 2.612 Satara 69 30950 3.2 71 35435 2.813 Sangli 57 29943 3.3 59 33751 3.014 Solapur 66 34872 2.9 68 40866 2.415 Kolhapur 67 32873 3.0 72 35271 2.816 Aurangabad 43 38066 2.6 47 46228 2.217 Jalna 33 41289 2.4 38 45555 2.218 Parbhani 51 32165 3.1 51 35474 2.819 Hingoli – – – – – –20 Beed 45 33225 3.0 47 37160 2.721 Nanded 58 31452 3.2 64 35019 2.922 Osmanabad 41 31021 3.2 42 36216 2.823 Latur 44 38024 2.6 46 45266 2.224 Buldhana 47 31872 3.1 52 34201 2.925 Akola 52 30383 3.3 55 32751 3.126 Washim – – – – – –27 Amaravati 54 27462 3.6 56 29681 3.428 Yavatmal 59 29156 3.4 62 31934 3.129 Wardha 27 29031 3.4 27 32575 3.130 Nagpur 45 27916 3.6 48 29252 3.431 Bhandara 64 28621 3.5 72 28925 3.532 Gondia – – – – – –33 Chandrapur 59 29982 3.3 58 36780 2.734 Gadchiroli 42 18705 5.3 45 20842 4.8
Maharashtra 1672 28495 3.5 1761 32071 3.1Note: Figures for newly formed districts i.e. Nandurbar, Hingoli, Washim and Gondia are not available, hence combined figures are given
for undivided districts viz. Dhule, Parbhani, Akola and Bhandara respectively. # Includes Mumbai City and Mumbai Suburban District.
Source: Directorate of Health Services, Mumbai.
188 Human Development Report Maharashtra 2002

Health and NutritionTable 31
Number of Sub-Centres, Population per Sub-Centre and Sub-Centre per lakh populationfor 1991 and 2000
Sr. No. District
1991 2000Number ofSub-Centres
Population perSub-Centre*
Sub-Centre perlakh population*
Number ofSub-Centres
Population perSub-Centre*
Sub-Centre perlakh population*
1 2 3 4 5 6 7 8 1 Mumbai # – – – – – – 2 Thane 456 4070 25 470 3968 25 3 Raigad 277 5401 19 277 6240 16 4 Ratnagiri 374 3759 27 374 2382 42 5 Sindhudurg 246 3126 32 246 6252 16 6 Nashik 517 4801 21 530 5512 18 7 Dhule 315 6400 16 431 5564 18 8 Nandurbar – – – – – – 9 Jalgaon 376 6152 16 397 6765 1510 Ahmednagar 485 5855 17 485 6898 1411 Pune 501 5440 18 501 6684 1512 Satara 309 6911 14 309 8142 1213 Sangli 270 6322 16 270 7375 1414 Solapur 329 6996 14 329 8446 1215 Kolhapur 371 5937 17 371 6845 1516 Aurangabad 248 6003 17 248 4437 2317 Jalna 171 6630 15 171 7487 818 Parbhani 345 4755 21 351 5154 1919 Hingoli – – – – – –20 Beed 253 5910 17 253 6903 1421 Nanded 333 5478 18 374 5993 1722 Osmanabad 204 5306 19 204 4530 6923 Latur 234 5704 18 234 6408 924 Buldhana 265 5653 18 265 6711 1525 Akola 326 4846 21 326 5525 1826 Washim – – – – – –27 Amaravati 287 5167 19 320 5194 1928 Yavatmal 356 4832 21 374 5294 1929 Wardha 164 4780 21 180 4886 2030 Nagpur 300 4187 24 300 4680 2131 Bhandara 427 4290 23 427 4877 2132 Gondia – – – – – –33 Chandrapur 276 4620 22 336 2305 4334 Gadchiroli 349 2059 49 372 3863 26
Maharashtra 9364 5168 19 9725 5807 17
Note: (1) * Rural Population.(2) Figures for newly formed districts i.e. Nandurbar, Hingoli, Washim and Gondia are not available, hence combined figures are
given for undivided districts viz. Dhule, Parbhani, Akola and Bhandara respectively. # Includes Mumbai City and Mumbai Suburban District.
Source: Directorate of Health Services, Mumbai.
Annexure Tables 189

Health and NutritionTable 32
Number of Beds in Medical Institutions* for 1961, 1971, 1981, 1991 and 2000,and Annual Growth Rate for 1961 to 2000 and 1981 to 2000
Sr. No. District
Number of Beds in Medical Institutions Annual Growth Rate1961 1971 1981 1991 2000 1961–2000 1981–2000
1 2 3 4 5 6 7 8 9 1 Mumbai # – – – – – – – 2 Thane 445 2474 5063 4256 5057 0.29 0.05 3 Raigad 365 553 1077 803 833 0.05 0.05 4 Ratnagiri 276 691 958 981 981 0.10 0.06 5 Sindhudurg – – – 490 580 0.84 0.08 6 Nashik 601 711 2071 2135 2764 0.13 0.08 7 Dhule 116 285 1022 1358 1518 0.33 0.09 8 Nandurbar – – – – – – – 9 Jalgaon 173 507 1245 1371 1677 0.25 0.0810 Ahmednagar 92 252 1883 2009 2046 0.50 0.0611 Pune 4244 6504 2367 11326 11790 0.07 0.0712 Satara 240 629 1316 980 1046 0.05 0.0513 Sangli 606 958 1836 1648 1698 0.05 0.0514 Solapur 687 1074 2794 2414 2518 0.10 0.0515 Kolhapur 498 724 1350 1350 1397 0.09 0.0616 Aurangabad 65 807 1568 1441 1460 0.53 0.0517 Jalna – – – 480 510 0.28 0.1218 Parbhani 184 447 591 639 894 0.14 0.0919 Hingoli – – – – – – –20 Beed 410 479 912 966 1016 0.07 0.0721 Nanded 173 596 826 1439 1592 0.08 0.1122 Osmanabad 169 288 400 580 610 0.11 0.1023 Latur – – – 480 670 3.94 0.1324 Buldhana 462 479 773 883 970 0.06 0.0825 Akola 510 765 1465 1678 2765 0.14 0.1026 Washim – – – – – – –27 Amaravati 526 1547 2866 3103 3274 0.15 0.0628 Yavatmal 526 526 1103 1278 1356 0.08 0.0729 Wardha 593 593 1888 2444 2520 0.11 0.0830 Nagpur 1667 3363 5378 5554 5614 0.09 0.0531 Bhandara 444 444 1033 1017 1107 0.08 0.0732 Gondia – – – – – – –33 Chandrapur 118 316 1117 1492 15552 0.35 0.0834 Gadchiroli – – – 310 460 0.16 0.19
Maharashtra 14190 26012 42902 54905 74275 0.11 0.07
Note: Figures for newly formed districts i.e. Nandurbar, Hingoli, Washim and Gondia are not available, hence combined figures are given for undivided districts viz. Dhule, Parbhani, Akola and Bhandara respectively.
* Excluding private institutions. # Includes Mumbai City and Mumbai Suburban District.Source: Directorate of Health Services, Mumbai.
190 Human Development Report Maharashtra 2002

Health and NutritionTable 33
Population per Bed, and Beds per lakh population* for the Years 1961, 1971, 1981, 1991 and 2000
Sr. No. District
1961 1971 1981 1991 2000Popul.per bed
Beds perlakh popul.
Popul.per bed
Beds perlakh popul.
Popul.per bed
Beds perlakh popul.
Popul.per bed
Beds perlakh popul.
Popul.per bed
Beds perlakh popul.
1 2 3 4 5 6 7 8 9 10 11 12 1 Mumbai # – – – – – – – – – – 2 Thane 3714 27 922 108 663 151 1233 81 1420 70 3 Raigad 3460 52 1915 29 1880 72 2272 44 2615 38 4 Ratnagiri 6620 15 2881 35 2204 45 1574 64 1017 98 5 Sindhudurg – – – – – – 1608 59 2569 35 6 Nashik 3087 32 3332 30 1445 69 1804 55 1715 58 7 Dhule 11649 9 5832 17 2006 50 1867 54 2004 50 8 Nandurbar – – – – – – – – – – 9 Jalgaon 10203 10 3556 28 2103 48 2325 43 2256 4410 Ahmednagar 19304 5 9004 11 1438 70 1679 60 1987 5011 Pune 581 172 480 205 449 223 488 205 539 17012 Satara 7197 44 2274 14 1640 65 2501 40 2758 3613 Sangli 2941 78 1285 39 997 100 1341 75 1536 6514 Solapur 2708 37 2999 48 934 107 1338 75 1540 6515 Kolhapur 3206 31 2520 36 1857 55 2214 45 2504 4016 Aurangabad 23674 4 2197 46 1652 64 1636 65 1374 7317 Jalna – – – – – – 2243 35 2351 1918 Parbhani 10250 15 6556 10 3095 32 3313 30 2710 3719 Hingoli – – – – – – – – – –20 Beed 2443 41 2685 37 1820 61 1848 54 2130 4721 Nanded 8080 55 1812 12 2118 47 1619 62 1840 5422 Osmanabad 8744 11 7969 13 5677 18 2201 45 1564 7723 Latur – – – – – – 3493 29 3005 2024 Buldhana 2294 44 2637 38 1952 51 2136 47 2349 4325 Akola 2332 43 1963 51 1247 80 3120 76 948 10626 Washim – – – – – – – – – –27 Amaravati 2344 48 996 100 649 154 709 141 761 12828 Yavatmal 2088 48 2707 37 1575 63 1625 62 1795 5629 Wardha 1070 93 1315 76 519 182 437 229 483 20730 Nagpur 965 104 578 173 481 208 592 169 715 14031 Bhandara 2557 35 3571 28 1770 56 2072 48 2164 4632 Gondia – – – – – – – – – –33 Chandrapur 10492 10 5198 19 1810 54 1188 84 972 10334 Gadchiroli – – – – – – 2539 39 3422 29
Maharashtra 2270 44 1815 55 1075 93 1256 80 1304 72
Note: Figures for newly formed districts i.e. Nandurbar, Hingoli, Washim and Gondia are not available, hence combined figures are given for undivided districts viz. Dhule, Parbhani, Akola and Bhandara respectively.
* Excluding private institutions. # Includes Mumbai City and Mumbai Suburban District.Source: Directorate of Health Services, Mumbai.
Annexure Tables 191

Health and NutritionTable 34
Total ANC Registered and Total Deliveries Conducted by Various Attentions for 2000–01
Sr. No. District
Deliveries Conducted by Various Attentions for 2000–01 % ofDeliveries
against col. 3Total A.N.C.
RegisteredUntrained
DaiTrained
DaiA.N.M./Doctors
Institutions TotalDeliveries
1 2 3 4 5 6 7 8 9 1 Mumbai # – – – – – – – 2 Thane 110207 9082 28505 3875 47311 88773 80.55 3 Raigad 53404 3878 10887 2922 24173 41860 78.38 4 Ratnagiri 43048 1539 8528 5931 16533 32531 75.57 5 Sindhudurg 18871 376 1293 1663 15009 18341 97.19 6 Nashik 103068 5191 27445 12376 40300 85312 82.77 7 Dhule 45626 3249 13164 5266 10939 33068 72.48 8 Nandurbar 36365 2930 17961 5099 3308 29298 80.57 9 Jalgaon 95963 6612 23683 12381 25012 67688 70.5410 Ahmednagar 99470 11274 13854 13656 35183 73967 74.3611 Pune 116020 2812 16967 7748 56954 84481 72.8212 Satara 69983 3841 5278 5187 38811 53117 75.9013 Sangli 51658 2163 6169 5774 27434 41540 80.4114 Solapur 77004 12781 12456 10956 11987 48180 62.5715 Kolhapur 71771 1221 8216 5784 34444 49665 69.2016 Aurangabad 52060 5163 11985 7883 9780 34811 66.8717 Jalna 48133 2723 13893 5982 11146 33744 70.1118 Parbhani 70865 3888 18132 13237 10925 46182 65.1719 Hingoli – – – – – – –20 Beed 56457 3774 12775 7281 16686 40516 71.7621 Nanded 76582 5972 22461 8779 54289 91501 119.4822 Osmanabad 37675 2691 9544 7489 9826 29550 78.4323 Latur 56262 4319 16812 6274 8322 35727 63.5024 Buldhana 55573 3066 18170 4415 14838 40489 72.8625 Akola 48753 1280 7855 2574 24935 36644 75.1626 Washim 26407 1213 9612 1067 7026 18918 71.6427 Amaravati 48945 2407 11000 4163 24470 42040 85.8928 Yavatmal 61488 1312 18940 8638 14730 43620 70.9429 Wardha 26862 114 5669 1783 12870 20436 76.0830 Nagpur 50166 355 12532 4266 17114 34267 68.3131 Bhandara 61772 2162 21184 5738 13911 42995 69.6032 Gondia – – – – – – –33 Chandrapur 59247 2051 15633 4108 16350 38142 64.3834 Gadchiroli 22362 1799 10551 6840 3522 22712 101.57
Maharashtra 1852067 111238 431154 199135 658138 1400115 75.60
Note: Figures for newly formed districts i.e. Hingoli and Gondia are not available, hence combined figures are given for undivided districts viz. Parbhani and Bhandara respectively.
# Includes Mumbai City and Mumbai Suburban District.Source: Directorate of Health Services, Mumbai.
192 Human Development Report Maharashtra 2002

Health and NutritionTable 35
Infant and Children’s Immunisation Programme for the Year 2000–01
Sr. No. District
Infant Care for 2000–01
DPT-3 Polio-3 BCG Measles Vit. ‘A’-1
1 2 3 4 5 6 7 1 Mumbai # 231762 232459 225397 201679 114030 2 Thane 163400 163379 169653 156247 138909 3 Raigad 53710 53753 59878 52139 48831 4 Ratnagiri 41412 41412 41802 42663 43251 5 Sindhudurg 17357 17357 18021 17329 17326 6 Nashik 118753 120272 125751 116827 108210 7 Dhule 43829 43429 45792 45101 44307 8 Nandurbar 36257 36257 33889 36170 36230 9 Jalgaon 88103 88566 91590 86263 8074510 Ahmednagar 96822 96687 100008 96449 9118711 Pune 168782 171203 179642 155121 14007512 Satara 68420 68420 68736 65930 6225113 Sangli 59688 59673 61689 58785 5588214 Solapur 96156 96478 99681 94939 9449615 Kolhapur 82135 82135 81552 79811 7391816 Aurangabad 78809 79116 77683 74690 6876817 Jalna 43282 43611 45918 40048 4079418 Parbhani 65022 67178 66591 64795 6450319 Hingoli – – – – –20 Beed 59212 59157 60686 52915 5205821 Nanded 76078 81264 78019 76983 7130922 Osmanabad 33974 33964 33563 33712 3195323 Latur 51109 51109 51598 49920 4583724 Buldhana 55755 54755 54821 53191 4937325 Akola 39092 38577 46433 38663 3739526 Washim 26482 26132 26088 25467 2462227 Amaravati 56371 57148 55350 56533 5646728 Yavatmal 60253 61091 58711 56988 5402829 Wardha 27503 28254 30303 27568 2565130 Nagpur 84070 83911 95499 88997 8226531 Bhandara 55622 55886 57982 60453 5940632 Gondia – – – – –33 Chandrapur 55124 55583 53987 52756 5427534 Gadchiroli 22917 23617 23827 22734 22734
Maharashtra 2257261 2271833 2320140 2181866 1991086
Note: Figures for newly formed districts i.e. Hingoli and Gondia are not available, hence combined figures are given for undivided districts viz. Parbhani and Bhandara respectively.
# Includes Mumbai City and Mumbai Suburban District.Source: Directorate of Health Services, Mumbai.
Annexure Tables 193

Health and NutritionTable 35 (continued)
Infant and Children’s Immunisation Programme for the Year 2000–01
Sr. No. District
Children Fully Immunised for 2000–01
Below 5 years DPT-B Polio-B TT 5 years TT 10 years TT 16 years
1 2 3 4 5 6 7 1 Mumbai # 187971 190093 152566 176463 151083 2 Thane 148965 148965 145731 155377 141351 3 Raigad 53110 53106 49959 53815 45898 4 Ratnagiri 35570 35524 42155 40998 35475 5 Sindhudurg 16987 17005 19723 21102 18687 6 Nashik 108002 108945 107737 106338 94093 7 Dhule 41428 40531 56004 46675 40712 8 Nandurbar 27956 31241 31701 32870 29351 9 Jalgaon 83557 83189 86055 85545 7822210 Ahmednagar 88644 88574 88011 91880 7781611 Pune 146116 154182 147933 154730 14608412 Satara 63359 63359 63314 63935 5846113 Sangli 55461 56261 59095 58714 5325314 Solapur 89452 90416 87872 91634 8726515 Kolhapur 75765 75853 76427 75165 7133816 Aurangabad 65469 65547 66482 70400 5942317 Jalna 36735 36952 40922 40944 3563918 Parbhani 62448 62572 60139 86774 5398619 Hingoli – – – – –20 Beed 49344 50162 46980 56015 4972621 Nanded 67763 69458 61808 61198 5383622 Osmanabad 33913 33913 34505 34739 3142023 Latur 47481 47481 46435 46370 4236124 Buldhana 51318 51318 52101 50910 4718725 Akola 40292 35693 35445 38618 3486826 Washim 23471 22932 24133 24497 2072327 Amaravati 54285 54512 58651 60196 5433228 Yavatmal 52039 51651 67799 62295 5417429 Wardha 24033 25340 27265 28126 2529230 Nagpur 78307 78801 76265 78351 6842231 Bhandara 48366 45969 55384 51232 4902132 Gondia – – – – –33 Chandrapur 52660 52497 52511 51997 3550134 Gadchiroli 21471 21471 22381 23241 30217
Maharashtra 2031738 2043513 2043489 2121144 1875217
Note: Figures for newly formed districts i.e. Hingoli and Gondia are not available, hence combined figures are given for undivided districts viz. Parbhani and Bhandara respectively.
# Includes Mumbai City and Mumbai Suburban District.Source: Directorate of Health Services, Mumbai.
194 Human Development Report Maharashtra 2002

Health and NutritionTable 36
AIDS Cases Surveillance for the period—August 1986 to February 2001
Sr. No. District
AIDS Cases Surveillance–August 1986 to February 2001
AIDS Cases AIDS Deaths
Male Female Total Male Female Total
1 2 3 4 5 6 7 8 1 Mumbai # 2432 520 2952 164 36 200 2 Thane 79 16 95 5 2 7 3 Raigad 57 10 67 4 1 5 4 Ratnagiri 14 5 19 0 0 0 5 Sindhudurg 5 2 7 3 1 4 6 Nashik 4 1 5 1 1 2 7 Dhule 1 1 2 0 1 1 8 Nandurbar – – – – – 9 Jalgaon 12 9 21 1 1 210 Ahmednagar 9 12 21 1 1 211 Pune 216 159 375 14 39 5312 Satara 280 100 380 24 2 2613 Sangli 1461 616 2077 198 69 26714 Solapur 8 5 13 1 1 215 Kolhapur 231 83 314 81 32 11316 Aurangabad 30 10 40 0 0 017 Jalna 7 1 8 0 0 018 Parbhani 6 0 6 0 0 019 Hingoli – – – – –20 Beed 9 0 9 0 0 021 Nanded 1 0 1 0 0 022 Osmanabad 0 0 0 0 0 023 Latur 4 2 6 1 1 224 Buldhana 3 0 3 1 0 125 Akola 78 14 92 0 0 026 Washim – – – – –27 Amaravati 2 0 2 0 0 028 Yavatmal 1 1 2 0 1 129 Wardha 0 0 0 0 0 030 Nagpur 7 3 10 5 3 831 Bhandara 0 0 0 0 0 033 Chandrapur 95 21 116 0 0 034 Gadchiroli 1 0 1 0 0 0
Maharashtra 5053 1591 6644 504 192 696
Note: Figures for newly formed districts i.e. Nandurbar, Hingoli, Washim and Gondia are not available, hence combined figures are given for undivided districts viz. Dhule, Parbhani, Akola and Bhandara respectively.
# Includes Mumbai City and Mumbai Suburban District.Source: Directorate of Health Services, Mumbai.
Annexure Tables 195

Health and NutritionTable 37
Reproductive and Child Health Indicators–1997
(In per cent)
Sr. No. District
Reproductive and Child Health IndicatorsGirls mar-ried below18 years
Births ofOrder 3 and
above
ReceivingcompleteA.N.C.
InstitutionalDeliveries
Total unmetneed for
Contraception
Current usersof Contra-
ception
UsingSpacingMethods
Children receiv-ing CompleteImmunisation
1 2 3 4 5 6 7 8 9 10 1 Mumbai # 8.00 29.90 81.30 93.10 13.80 63.20 16.00 90.50 2 Thane 19.70 34.90 57.40 71.10 23.40 56.30 10.30 84.80 3 Raigad 15.90 28.70 63.20 55.90 22.50 56.90 6.00 87.30 4 Ratnagiri 13.00 32.30 71.00 51.70 12.40 58.30 1.80 94.10 5 Sindhudurg 3.80 28.00 78.90 76.60 27.90 48.40 4.40 92.50 6 Nashik 32.10 35.90 30.00 54.50 9.90 56.50 9.50 68.60 7 Dhule 40.00 37.20 33.70 31.00 11.90 58.30 4.30 69.40 8 Nandurbar – – – – – – – – 9 Jalgaon 46.00 35.70 40.90 44.10 21.10 62.40 7.60 78.5010 Ahmednagar 40.80 33.90 52.00 60.00 10.90 64.60 6.80 89.7011 Pune 30.40 27.10 56.00 75.00 9.20 65.70 7.80 74.3012 Satara 21.90 28.10 60.00 60.90 5.90 69.10 3.30 92.5013 Sangli 25.60 20.70 65.30 68.70 17.00 63.40 4.00 87.3014 Solapur 41.80 38.30 48.60 57.00 8.60 63.10 3.10 84.1015 Kolhapur 18.40 18.80 59.80 73.70 18.50 65.30 4.00 76.2016 Aurangabad 50.90 42.20 39.70 49.60 30.50 50.00 10.40 59.2017 Jalna 55.60 44.00 40.20 27.90 13.20 51.70 6.00 78.3018 Parbhani 46.60 47.00 38.00 32.30 26.30 55.70 6.40 67.2019 Hingoli – – – – – – – –20 Beed 59.40 41.60 40.30 42.70 26.40 55.80 6.10 63.0021 Nanded 36.70 43.50 46.80 29.90 30.50 52.00 9.20 71.3022 Osmanabad 46.50 35.60 47.50 36.40 10.00 58.20 4.10 79.3023 Latur 58.10 39.50 43.90 40.70 10.30 60.00 4.90 89.3024 Buldhana 33.50 43.90 47.20 43.90 13.80 55.30 9.10 78.7025 Akola 38.20 41.40 59.10 49.30 24.80 57.50 7.50 81.5026 Washim – – – – – – – –27 Amaravati 10.20 36.60 46.60 52.90 9.12 63.80 9.30 71.5028 Yavatmal 27.10 37.90 53.10 37.10 19.90 59.30 5.50 74.3029 Wardha 12.30 24.10 64.10 62.80 6.50 69.70 5.20 90.3030 Nagpur 11.30 29.80 52.00 67.20 14.20 63.80 4.60 76.0031 Bhandara 9.30 38.00 43.70 24.60 8.50 59.60 1.90 78.9032 Gondia – – – – – – – –33 Chandrapur 25.70 31.10 62.10 41.00 16.90 65.80 4.60 92.7031 Gadchiroli 26.80 35.90 67.70 16.40 23.50 58.20 2.80 85.70
Maharashtra 28.80 33.90 54.50 58.50 16.00 60.40 7.70 80.30
Note: Figures for newly formed districts i.e. Nandurbar, Hingoli, Washim and Gondia are not available, hence combined figures are given for undivided districts viz. Dhule, Parbhani, Akola and Bhandara respectively.
# Includes Mumbai City and Mumbai Suburban District.Source: Directorate of Health Services, Mumbai.
196 Human Development Report Maharashtra 2002

Health and NutritionTable 38
Fertility and Child Mortality Indicators–1991
Sr. No. District
Fertility and Child Mortality Indicators–1991
TFR IMR (per 1000) CMR (per 1000)
1 2 3 4 5
1 Mumbai # 3.00 37 50 2 Thane 3.39 46 54 3 Raigad 3.75 63 87 4 Ratnagiri 3.66 75 90 5 Sindhudurg 3.28 70 87 6 Nashik 4.14 79 88 7 Dhule 4.22 73 95 8 Nandurbar – – – 9 Jalgaon 3.89 71 8410 Ahmednagar 3.81 47 6011 Pune 3.21 52 7012 Satara 3.30 51 6113 Sangli 2.95 41 5314 Solapur 3.48 68 8315 Kolhapur 2.94 55 7416 Aurangabad 4.62 56 8117 Jalna 4.47 76 9418 Parbhani 4.54 50 9519 Hingoli – – –20 Beed 4.37 52 8021 Nanded 4.58 68 8722 Osmanabad 3.87 70 9623 Latur 4.32 57 7124 Buldhana 4.47 82 9725 Akola 4.59 101 115 26 Washim – – –27 Amaravati 3.95 94 114 28 Yavatmal 3.86 124 143 29 Wardha 3.49 88 104 30 Nagpur 3.51 75 101 31 Bhandara 3.77 81 115 32 Gondia – – –33 Chandrapur 3.81 96 137 34 Gadchiroli 3.96 106 144
Maharashtra 3.72 74 91
Note: Figures for newly formed districts i.e. Nandurbar, Hingoli, Washim and Gondia are not available, hence combined figures are given for undivided districts viz. Dhule, Parbhani, Akola and Bhandara respectively.
# Includes Mumbai City and Mumbai Suburban District.Source: Cols 3 and 4 Reproductive and Child Health Project Rapid Household Survey Phase-I and Phase-II and cols 5 to 7 RG1, 1997.
Annexure Tables 197

Health and NutritionTable 39
Average Population covered by PHCs, CHCs and Sub-Centres
Sr. No. State
Average Population covered by(as on 31–3–1991)
Average Population covered by(as on 30–6–1999)
Sub-Centre PHC CHC Sub-Centre PHC CHC
1 2 3 4 5 6 7 8
1 Andhra Pradesh 6175 37995 10.5 4949 31972 2.2
2 Gujarat 3793 30888 1.8 4116 30964 1.4
3 Haryana 5400 31427 3.0 6303 36136 2.3
4 Karnataka 3988 27430 2.1 4201 20409 1.4
5 Kerala 4204 23509 4.0 4384 23212 2.8
6 Maharashtra 5167 29379 1.7 5401 30913 1.7
7 Punjab 5012 7022 2.1 2693 32978 1.5
8 Tamil Nadu 4234 25721 5.0 4494 27168 5.4
9 West Bengal 6269 31966 5.7 6818 44287 5.6
India 4753 28011 3.2 5164 30854 2.4
Source: Computation based on data from Rural Health Statistics (1992 and 2000) and Expert Committee on Population Projection (1996).
198 Human Development Report Maharashtra 2002

Health and NutritionTable 40
Prevalence Rate of Leprosy and Malaria Eradication Programmes
Sr. No. District
Prevalence Rate of Leprosy Malaria Eradication during 2000–01
1985–86 1990–91 1995–96 2000–01Total B.S.Collected
TotalExamination
PositiveR.T.
TotalR.T.
1 2 3 4 5 6 7 8 9 10 1 Mumbai # 56.5 27.2 3.7 2.1 430645 430645 10346 10209 2 Thane 6.2 19.4 6.0 5.5 827795 818883 5587 5584 3 Raigad 60.0 43.4 8.9 5.3 317675 317675 3498 3497 4 Ratnagiri 21.2 13.5 2.5 1.9 297325 296621 675 675 5 Sindhudurg 19.5 12.4 1.7 2.1 191215 191188 256 256 6 Nashik 20.0 13.3 3.9 3.1 706381 722260 477 477 7 Dhule 30.3 18.2 2.6 3.2 303152 305617 1311 1311 8 Nandurbar – – – – 221150 220117 949 938 9 Jalgaon 54.6 29.6 3.4 3.3 760226 627592 1126 112010 Ahmednagar 30.2 19.0 2.3 1.6 663144 683503 981 97711 Pune 22.1 14.9 2.2 2.0 825436 834989 1405 140512 Satara 59.8 20.9 4.5 3.0 470550 440823 982 97813 Sangli 38.9 25.0 2.3 1.3 429571 425551 479 47514 Solapur 76.2 12.6 3.0 2.2 534571 473606 1892 189215 Kolhapur 36.5 22.7 1.9 1.2 409186 407162 260 26016 Aurangabad 21.0 18.6 2.0 1.7 388272 388272 1802 180217 Jalna 41.2 19.0 2.7 1.9 294291 294291 314 31418 Parbhani 69.6 42.1 5.3 3.2 396957 394057 834 83319 Hingoli – – – – – – – –20 Beed 60.2 33.4 4.2 2.2 444045 454045 1668 166821 Nanded 108.9 14.5 3.0 3.5 525077 525077 1169 116922 Osmanabad 98.6 13.3 3.3 3.4 216733 216733 469 46823 Latur 111.8 19.5 3.9 2.9 319277 319277 783 78324 Buldhana 65.3 30.2 2.6 2.1 412054 412054 737 73725 Akola 70.5 23.0 4.5 3.0 292383 292383 894 89426 Washim – – – – 190391 190391 609 60927 Amaravati 40.9 9.5 2.7 2.9 551930 551930 1700 170028 Yavatmal 98.8 13.5 6.2 5.1 609291 609291 3751 373529 Wardha 48.4 15.9 3.8 4.1 265397 265397 1156 115630 Nagpur 74.7 12.0 2.7 3.3 661390 661391 2378 237831 Bhandara 74.0 20.6 4.6 6.4 1165081 1135909 5065 506532 Gondia – – – – – – – –33 Chandrapur 147.6 19.9 8.0 7.1 656179 656179 3498 349834 Gadchiroli 129.5 29.4 7.4 6.3 731435 731435 17697 17697
Maharashtra 58.3 19.6 3.7 3.1 15508205 15294344 74748 74650
Note: Figures for newly formed districts i.e. Nandurbar, Hingoli, Washim and Gondia are not available, hence combined figures are given for undivided districts viz. Dhule, Parbhani, Akola and Bhandara respectively.
# Includes Mumbai City and Mumbai Suburban District.Source: Directorate of Health Services, Mumbai.
Annexure Tables 199

Health and NutritionTable 41
District-wise Beneficiaries Covered Under ICDS Programme for the Year 2000–01
Sr. No. District
Pregnant Women Nursing Women
No. of Aws. Eligible Enrolled Benefited Eligible Enrolled Benefited
1 2 3 4 5 6 7 8 9 1 Mumbai # 731 – – – – – –
2 Thane 2256 20876 17192 13997 22998 18153 14466
3 Raigad 1652 10036 7374 6759 11347 8137 7452 4 Ratnagiri 728 3817 2046 1318 5014 2611 1671
5 Sindhudurg 565 2608 1506 611 3272 1769 721 6 Nashik 2569 33751 21740 17819 32890 21946 17897
7 Dhule 809 9469 8032 6552 10363 8703 7048
8 Nandurbar 1004 13281 11786 11020 14872 13175 11741 9 Jalgaon 2381 24426 18763 13830 27652 20539 15047
10 Ahmednagar 2232 21776 14932 11267 22914 16509 11538
11 Pune 1960 12404 4751 2955 13308 5077 310512 Satara 1017 8780 2270 1160 9808 2484 1210
13 Sangli 1390 10229 2814 1119 11170 2957 108814 Solapur 1392 19376 9257 2614 16441 8557 3734
15 Kolhapur 1030 7231 3174 1688 8712 3750 1636
16 Aurangabad 1559 20573 14700 12564 22815 15290 1309517 Jalna 674 10379 7258 3608 9646 7192 3414
18 Parbhani 999 11578 8995 7802 12967 10058 8758
19 Hingoli – – – – – – –20 Beed 1652 20107 12896 10743 20987 13198 10803
21 Nanded 2021 22190 18158 16244 23428 18858 1676122 Osmanabad 1219 13562 11685 10394 14561 11931 10339
23 Latur 1293 16969 12078 11172 17087 11952 11082
24 Buldhana 744 7128 5733 5150 8207 6628 580825 Akola 973 9251 7484 6511 9230 7240 6225
26 Washim 755 8915 6851 6204 9048 7006 6205
27 Amaravati 1866 14188 12646 9454 15810 14192 1080828 Yavatmal 2069 19390 14735 13564 20702 15309 14188
29 Wardha 525 3980 3335 2527 3865 3174 235830 Nagpur 1605 10869 8662 7928 11880 9439 8576
31 Bhandara 1973 16996 14208 8875 19655 16611 10438
32 Gondia – – – – – – –33 Chandrapur 2068 12313 9213 6203 11315 8740 6113
34 Gadchiroli 1274 7996 7434 6506 9114 8626 7498
Maharashtra 44985 424444 301708 238158 451078 319811 250823
Note: Figures for newly formed districts i.e. Hingoli and Gondia are not available, hence combined figures are given for undivided districts viz. Parbhani and Bhandara respectively.
# Includes Mumbai City and Mumbai Suburban District.
200 Human Development Report Maharashtra 2002

Health and NutritionTable 41 (continued)
District-wise Beneficiaries Covered Under ICDS Programme for the Year 2000-01
Sr. No. District
Children (6 months–1 year) Children (1–3 years) Children (3–6 years)
Eligible Enrolled Benefited Eligible Enrolled Benefited Eligible Enrolled Benefited
1 2 10 11 12 13 14 15 16 17 18 1 Mumbai # – – – – – – – – –
2 Thane 31638 26740 23351 94210 77141 63453 126631 111217 91965
3 Raigad 14374 10874 10463 48794 36049 33324 70669 57929 53557 4 Ratnagiri 14299 5994 5852 20716 10308 7003 31624 28038 19158
5 Sindhudurg 4595 3007 2215 13836 7496 4949 22256 15965 6749 6 Nashik 43291 33124 30224 126973 91780 77636 176135 131936 116073
7 Dhule 14335 11722 10215 43280 35548 29650 56877 47257 39699
8 Nandurbar 18611 16844 15512 56092 51210 47652 72843 63374 58798 9 Jalgaon 30723 25067 22254 106557 82355 66202 154415 138114 11082
10 Ahmednagar 26090 21778 18920 83954 65206 50950 115322 88699 73325
11 Pune 18660 15699 14507 56268 18905 10717 87530 64867 4653612 Satara 12844 370 149 39442 2586 1670 62490 39312 31777
13 Sangli 13974 2307 1867 44967 2947 2714 69044 56849 4168314 Solapur 21665 17515 16901 56033 17225 15527 83792 59036 25335
15 Kolhapur 12051 10241 6350 34678 3345 2544 54603 48595 42314
16 Aurangabad 24717 19653 17597 75802 57811 50492 108790 86853 7667617 Jalna 11971 10646 9695 37991 32147 17433 52162 46215 22716
18 Parbhani 17869 14259 11650 50331 38897 33599 67211 63004 50078
19 Hingoli – – – – – – – – –20 Beed 25695 13250 11122 78938 26210 22544 117729 75121 66065
21 Nanded 30364 27083 25815 99454 80765 72976 139747 128167 11141722 Osmanabad 15603 13319 12202 54479 47660 42750 72299 63409 57664
23 Latur 21799 11387 10813 61224 29082 27500 89646 70842 65759
24 Buldhana 11118 9357 8771 32677 26617 24644 43003 40264 3684225 Akola 11043 9728 9101 39132 32745 30547 53193 45108 40071
26 Washim 21074 9812 9038 38203 28646 26022 50328 38082 33601
27 Amaravati 17617 16110 12882 68492 63240 49775 83189 81177 6362828 Yavatmal 27622 20340 17637 84207 64594 60934 114419 89272 82518
29 Wardha 4527 4024 3479 17659 14828 12473 24777 23635 2024830 Nagpur 13563 11433 10989 49886 41252 39396 71158 59997 57487
31 Bhandara 24903 20776 14271 80850 68643 46300 108896 93684 64225
32 Gondia – – – – – – – – –33 Chandrapur 14795 10428 7601 54220 39244 28185 80063 73627 54842
34 Gadchiroli 12131 11256 9978 40113 37644 33795 58434 55662 48867
Maharashtra 583561 434143 381421 1789458 1232126 1033356 2519275 2085307 1710555
Note: Figures for newly formed districts i.e. Hingoli and Gondia are not available, hence combined figures are given for undivided districts viz. Parbhani and Bhandara respectively.
# Includes Mumbai City and Mumbai Suburban District.
Annexure Tables 201

Health and NutritionTable 41 (concluded)
District-wise Beneficiaries Covered under ICDS Programme for the Year 2000–01
Sr. No. District
Pregnant Women Nursing Women
Eligible Enrolled Benefited Eligible Enrolled Benefited
1 2 19 20 21 22 23 24 1 Mumbai # – – – – – – 2 Thane 20876 17192 13997 22998 18153 14466 3 Raigad 10036 7374 6759 11347 8137 7452 4 Ratnagiri 3817 2046 1318 5014 2611 1671 5 Sindhudurg 2608 1508 611 3272 1769 721 6 Nashik 33751 21740 17819 32890 21946 17897 7 Dhule 9469 8032 6552 10363 8703 7048 8 Nandurbar 13281 11786 11020 14872 13175 11741 9 Jalgaon 24426 81763 13830 27652 20539 1504710 Ahmednagar 21776 14932 11267 22914 16509 1153811 Pune 12404 4751 2955 13308 5077 310512 Satara 8780 2270 1160 9808 2484 121013 Sangli 10229 2814 1119 11170 2957 108814 Solapur 19376 9257 2614 16441 8557 373415 Kolhapur 7231 3174 1688 8712 3750 163616 Aurangabad 20537 14700 12564 22815 15290 1309517 Jalna 10379 7258 3608 9646 7192 341418 Parbhani 11578 8995 7802 12967 10058 875819 Hingoli – – – – – –20 Beed 20101 12896 10743 20987 13198 1080321 Nanded 22190 18158 16244 23428 18858 1676122 Osmanabad 13562 11685 10394 14561 11931 1033923 Latur 16969 12078 11172 17087 11952 1108224 Buldhana 7128 5733 5150 8207 6628 580825 Akola 9251 7484 6511 9230 7240 622526 Washim 8915 6851 6204 9048 7006 620527 Amaravati 14188 12646 9454 15810 14192 1080828 Yavatmal 19390 14735 13564 20702 15309 1418829 Wardha 3980 3335 2527 3865 3174 235830 Nagpur 10869 8662 7928 11880 9439 857631 Bhandara 16996 14208 8875 19655 16611 1043832 Gondia – – – – – –33 Chandrapur 12313 9213 6203 11315 8740 611334 Gadchiroli 7996 7434 6505 9114 8626 7498
Maharashtra 424402 364710 238157 451078 319811 250823
Note: Figures for newly formed districts i.e. Nandurbar, Hingoli, Washim and Gondia are not available, hence combined figures are given for undivided districts viz. Dhule, Parbhani, Akola and Bhandara respectively.
# Includes Mumbai City and Mumbai Suburban District.Source: Commissioner of ICDS, Navi Mumbai.
202 Human Development Report Maharashtra 2002

Health and NutritionTable 42
District-wise Unnatural Deaths and Number of Unnatural Deathsper lakh population for the Year 1999
Sr. No. District
Total Unnatural Deaths Number of Unnatural Deaths per lakh population
Males Females Total Males Females
1 2 3 4 5 6 7 1 Mumbai # 5028 2651 7679 82 53 2 Thane 982 464 1446 25 13 3 Raigad 361 154 515 35 15 4 Ratnagiri 291 143 434 39 16 5 Sindhudurg 132 58 190 32 12 6 Nashik 974 643 1617 41 29 7 Dhule 331 166 497 22 12 8 Nandurbar 127 61 188 0 0 9 Jalgaon 732 318 1050 39 1810 Ahmednagar 792 467 1259 39 2411 Pune 2103 1222 3325 60 3712 Satara 751 446 1197 55 3213 Sangli 541 233 774 42 1914 Solapur 516 191 707 27 1115 Kolhapur 529 268 797 31 1616 Aurangabad 479 281 760 31 2017 Jalna 187 130 317 20 1518 Parbhani 278 200 478 24 1819 Hingoli – – – – –20 Beed 256 126 382 24 1221 Nanded 438 309 747 30 2222 Osmanabad 341 199 540 42 2623 Latur 446 326 772 42 3324 Buldhana 412 249 661 37 2325 Akola 342 288 630 26 2426 Washim 194 95 289 0 027 Amaravati 671 551 1222 53 4728 Yavatmal 491 268 759 41 2429 Wardha 466 329 795 78 5930 Nagpur 914 476 1390 45 2631 Bhandara 505 165 670 44 1532 Gondia – – – – –33 Chandrapur 511 260 771 48 2634 Gadchiroli 171 101 272 37 22
Maharashtra 21292 11838 33130 44 26
Note: Figures for newly formed districts i.e. Hingoli and Gondia are not available, hence combined figures are given for undivided districts viz. Parbhani and Bhandara respectively.
# Includes Mumbai City and Mumbai Suburban District.Source: Directorate of Health Services, Mumbai.
Annexure Tables 203

Health and NutritionTable 43
Rural-Urban Differentials in Availability of Medical Manpower, Maharashtra, 1981 and 1991
Category of Medical Manpower
1981 1991
No. ofPersonnel
Number per lakh population No. ofPersonnel
Number per lakh population
Total Rural Urban Total Rural Urban
1 2 3 4 5 6 7 8 9
1. Physicians and Surgeons 61932 99 47 195 91795 116 53 216
Allopathic 28967 46 15 103 36315 46 14 97
Ayurvedic 5776 9 7 14 7973 10 6 17
Homeopathic 2300 4 3 5 7358 9 6 15
Unani 496 1 0 2 1787 2 1 4
Dental Surgeons 1280 2 0 5 2072 3 0 6
Veterinarians 3177 5 – – 5090 6 6 7
Pharmacists 15034 24 11 48 16864 21 9 42
Dieticians and Nutritionists 0 0 0 0 159 0 0 0
Public Health Physicians 2997 5 4 7 5109 6 4 10
Physicians & Surgeons n.e.c. 1808 3 2 5 9068 11 7 18
2. Nursing and Medical Health Professionals
75327 120 62 227 129376 164 84 291
Vaccinators, Innoculators, Medical Assistants
5696 9 8 11 7058 9 7 11
Dental Assistants 185 0 0 1 474 1 0 1
Veterinary Assistants 1971 3 3 3 2290 3 3 2
Pharmaceutical Assistants 1270 2 1 4 4714 6 3 1
Nurses 26892 43 14 97 46599 59 25 112
Midwives and HV’s 4953 8 6 11 3522 4 3 8
X-Ray Technicians 1367 2 1 5 2072 3 1 6
Optometrists and Opticians 258 0 0 1 999 1 1 2
Physio/Occupational Therapists 228 0 0 1 334 0 0 1
Nursing, Sanitary, other medical and health technicians
32509 52 29 94 61314 78 41 136
n.e.c.= not elsewhere classified.Source: Census of India 1981 (B series, table B-18) and Census of India 1991 (B Series table B-19).
204 Human Development Report Maharashtra 2002

Health and NutritionTable 44
Percentage of Couples Effectively Protected by Various Family Planning Methods 2000–01
Sr. No. District
Per Cent of Sterilisation Number of E.C.E.P. by Various Methods
Vasectomy Tubectomy Sterilisation IUD C.C. O.P. Users Total
1 2 3 4 5 6 7 8 9 1 Mumbai # 0.57 99.43 25.2 26.8 15.1 8.7 76.0 2 Thane 0.48 99.52 34.8 4.3 3.4 2.2 44.7 3 Raigad 0.12 99.88 39.5 4.3 4.5 3.8 52.1 4 Ratnagiri 0.36 99.64 35.8 5.9 5.2 3.4 50.3 5 Sindhudurg 0.48 99.52 33.3 8.8 5.6 4.0 51.7 6 Nashik 2.71 97.29 42.4 4.6 4.3 3.0 54.3 7 Dhule 3.82 96.18 46.9 4.6 4.4 2.9 58.8 8 Nandurbar 4.03 95.97 – – – – 9 Jalgaon 0.47 99.53 46.4 6.5 3.8 3.3 60.010 Ahmednagar 0.08 99.92 45.4 7.3 4.0 3.8 60.511 Pune 1.18 98.82 47.7 7.2 5.1 3.8 63.812 Satara 0.16 99.84 45.1 7.9 4.7 3.9 61.613 Sangli 0.12 99.88 47.6 7.9 4.3 3.8 63.614 Solapur 0.02 99.98 47.6 7.9 5.2 5.0 65.715 Kolhapur 0.08 99.92 49.3 8.0 5.3 3.9 66.516 Aurangabad 0.13 99.87 36.5 5.6 5.1 3.6 50.817 Jalna 0.15 99.85 34.5 6.8 4.6 4.0 49.918 Parbhani 0.03 99.97 33.4 7.0 4.0 5.7 50.119 Hingoli 0.00 0.00 – – – –20 Beed 0.18 99.82 38.7 7.3 4.7 3.4 54.121 Nanded 0.01 99.99 31.8 5.2 4.0 3.6 44.622 Osmanabad 0.10 99.90 37.4 8.2 5.0 4.8 55.423 Latur 0.06 99.94 36.2 6.4 3.8 2.9 49.324 Buldhana 1.59 98.41 39.3 7.7 4.9 4.3 56.225 Akola 4.16 95.84 46.2 8.5 5.2 3.9 63.826 Washim 0.75 99.25 – – – – –27 Amaravati 3.98 96.02 51.5 8.5 5.9 3.9 69.828 Yavatmal 0.15 99.85 46.5 8.8 4.1 4.0 63.429 Wardha 5.20 94.80 47.9 8.5 4.7 4.1 65.230 Nagpur 0.61 99.39 48.0 8.6 4.9 4.0 65.531 Bhandara 17.57 82.43 39.1 6.7 4.1 3.9 53.832 Gondia 9.06 90.94 – – – –33 Chandrapur 1.23 98.77 43.8 5.6 4.6 3.9 57.934 Gadchiroli 23.63 76.37 53 3 8.5 5.2 4.3 71.3
Maharashtra 1.63 98.37 42.4 6.7 4.2 3.3 56.6
# Includes Mumbai City and Mumbai Suburban District.Source: Directorate of Health Services, Mumbai.
Annexure Tables 205

Health and NutritionTable 45
Number of Beneficiaries under Supplementary Nutrition Programme (ICDS Programme)in the Month of March 1996–2000
YearTotal Number Percentage
EnrolledPercentageBenefitedEligible Enrolled Benefited
1 2 3 4 5 6
Pregnant Women1996 292332 234425 182625 80.19 62.471997 357950 283364 223832 79.16 62.531998 409269 312573 239448 76.37 58.511999 433343 321995 258022 74.30 59.542000 465368 338655 282532 72.77 60.712001 424444 301708 238158 71.08 56.11
Nursing Women1996 325707 261204 201024 80.20 61.721087 385951 302371 236183 78.34 61.201998 454510 347406 264084 76.44 58.101999 436798 323208 254115 73.99 58.182000 492184 355195 295168 72.17 59.972001 451078 319811 250823 70.90 55.61
Children (6 months – 1 Year) 1996 435731 281167 211209 64.53 48.471997 531196 351567 276980 66.18 52.141998 568997 376650 308440 66.20 54.211999 603032 401398 322055 66.56 53.412000 569641 397739 335829 69.82 58.952001 583561 434143 381421 74.40 65.36
Children (1 – 3 Years) 1996 1238555 836250 659417 67.52 53.241997 1503453 1037233 833694 68.99 55.451998 1642818 1133602 922946 69.00 56.181999 1755536 1182010 979304 67.33 55.782000 1824368 1226887 1067161 67.25 58.492001 1789458 12.32126 1033356 68.85 57.75
Children (3 – 6 Years)1996 1736405 1499180 1205198 86.34 69.411997 2136310 1837695 1512311 86.02 70.791998 2351404 1993105 1572807 84.76 66.891999 2509380 2114106 1733811 84.25 69.092000 2562906 2140523 1795951 83.52 70.072001 2519275 2085307 1710555 82.77 67.90
Total Children1996 3410691 2616597 2075824 76.72 60 861997 4170959 3226495 2622985 77.36 62.891998 4563219 3503357 2804193 76.77 61.451999 4867948 3697514 3035170 75.96 62.352000 4956915 3765149 3198941 75.96 64.532001 4892294 3751576 3125332 76.68 63.88
Source: Commissioner of ICDS, Navi Mumbai.
206 Human Development Report Maharashtra 2002

Health and NutritionTable 46
Selected District-wise Child Health Indicators, Maharashtra, 1998–99
Sr. No. District
Percentage of Children
Anaemic Given Colostrum Having Diarrhoea Breathing Problems
1 2 3 4 5 6
1 Mumbai # 16.9 68.4 29.2 5.0
2 Thane *** 63.6 36.6 48.1
3 Raigad *** 50.6 23.8 44.7
4 Ratnagiri 9.6 34.5 34.4 19.0
5 Sindhudurg *** 44.0 18.7 49.0
6 Nashik 10.6 31.0 31.9 32.5
7 Dhule 7.2 32.4 27.1 24.4
8 Jalgaon *** 29.2 26.0 52.9
9 Ahmednagar 16.2 28.2 44.6 24.9
10 Pune 18.7 37.1 37.9 22.2
11 Satara 9.8 29.3 26.6 18.0
12 Sangli *** 36.2 21.0 43.8
13 Solapur 8.5 29.1 32.0 33.4
14 Kolhapur *** 47.0 30.1 60.8
15 Aurangabad *** 31.3 19.6 48.5
16 Jalna 2.8 17.5 34.3 34.0
17 Parbhani *** 43.8 17.9 36.9
18 Beed *** 42.7 22.5 44.7
19 Nanded *** 40.5 29.9 46.1
20 Osmanabad 6.2 22.8 37.5 38.5
21 Latur 2.5 29.0 24.0 36.8
22 Buldhana 8.2 23.6 25.5 44.6
23 Akola *** 43.0 25.1 54.2
24 Amaravati 9.6 37.5 15.9 56.5
25 Yavatmal *** 33.8 32.5 58.7
26 Wardha 5.3 37.9 22.8 55.1
27 Nagpur *** 61.9 26.6 61.3
28 Bhandara 4.8 32.7 20.4 50.9
29 Chandrapur *** 47.3 28.3 58.9
30 Gadchiroli *** 46.3 25.6 48.2
Note: ‘ *** ’ Information on anaemia not collected in districts which were covered in Phase-I. # Includes Mumbai City and Mumbai Suburban District.
Source: Reproductive and Child Health—Rapid Household Survey 1998–99.
Annexure Tables 207

Health and NutritionTable 47
Percentage of Males and Females having at least one of RTI/STI Symptoms, Maharashtra
Sr. No. District Female Male
1 2 3 4
1 Mumbai # 22.0 4.2
2 Thane 25.1 9.6
3 Raigad 17.7 9.0
4 Ratnagiri 23.0 3.6
5 Sindhudurg 19.7 5.8
6 Nashik 25.5 7.6
7 Dhule 24.5 9.2
8 Jalgaon 27.6 8.4
9 Ahmednagar 21.1 6.4
10 Pune 21.8 8.9
11 Satara 18.9 4.9
12 Sangli 19.0 4.9
13 Solapur 20.3 5.9
14 Kolhapur 16.7 10.6
15 Aurangabad 29.5 8.5
16 Jalna 36.5 9.2
17 Parbhani 24.8 11.9
18 Beed 23.6 7.3
19 Nanded 37.6 13.2
20 Osmanabad 26.0 7.4
21 Latur 23.9 7.0
22 Buldhana 28.1 11.7
23 Akola 43.4 11.7
24 Amravati 32.1 14.7
25 Yavatmal 28.4 14.6
26 Wardha 31.8 14.8
27 Nagpur 27.9 8.8
28 Bhandara 28.1 16.8
29 Chandrapur 34.8 13.7
30 Gadchiroli 34.1 13.9
Maharashtra 27.1 10.2
Refers to three months prior to the survey. # Includes Mumbai City and Mumbai Suburban District.
Source: Reproductive and Child Health Project Rapid Household Survey—1998–99. Phase-I and Phase-II.
208 Human Development Report Maharashtra 2002

Health and NutritionTable 48
Health Care Indicators across Selected States in India
Sr.No.
Type of Health Facility/Indicator Ref. Year
AndhraPradesh Gujarat Haryana
Kar-nataka Kerala
Maha-rashtra Punjab
TamilNadu
WestBengal
AllIndia
1 2 3 4 5 6 7 8 9 10 11 12 131 Health Facilities
Population perhospital
1995 23675 17722 234848 168410 14806 25921 101668 133903 186910 61881
Population per bed 1995 11 1526 706 2584 1283 391 1023 1509 1120 1351
Registered doctorsper lakh population
1997 36.4 61.2 4.9 94.5 81.5 75.3 127.9 95.0 61.2 51.8
Registered nurses perlakh population
1997 58.1 146.6 22.8 100.2 79.2 112.9 138.6 132.5 45.6 63.6
2 Fertility and Mortality IndicatorsCrude Birth Rate: 1998–99 21.4 24.3 23.1 20.4 18.8 23.0 19.1 21.4 20.8 24.8
Total Fertility Rate 1998–99 2.25 2.72 2.88 2.13 1.96 2.52 2.21 2.19 2.29 2.85
Crude Death Rate 1998–99 10.7 8.0 8.1 7.9 6.0 9.0 8.4 10.8 8.3 9.7
Neonatal MortalityRate
1998–99 43.8 39.6 34.9 37.1 13.8 32.0 34.3 34.8 31.9 43.4
Post NeonatalMortality Rate
1998–99 22.1 23.0 21.9 14.4 2.5 11.7 22.8 13.3 16.8
Infant Mortality Rate 1998–99 65.8 62.6 56.8 51.5 16.3 43.7 57.1 48.2 48.7 67.6
Under five mortality 1998–99 85.5 85.1 76.8 69.8 18.8 58.1 72.1 63.3 67.6 94.9
Life expectancy atbirth:
1992-96
Males 60.8 60.5 63.4 61.1 70.2 63.8 66.4 62.8 61.8 60.1
Females 63.0 62.5 64.3 64.5 75.8 66.2 68.6 64.8 63.1 61.4
3 Reproductive and Child Health IndicatorsPercentage ofwomen aged 20-24years married before18 years: 1998–99
1998–99 64.3 40.7 41.5 46.3 17.0 47.7 11.6 24.9 45.9 50.0
Percentage whoreceived at least 3ANC check ups
1998–99 80.1 60.2 37.4 71.4 98.3 65.4 57.0 91.4 57.0 43.8
Percentage ofInstitutionaldeliveries
1998–99 49.8 36.3 22.4 51.1 93.0 52.6 37.5 79.3 40.1 33.6
Percentage currentlyusing FP Methods
1998–99 59.6 59.0 62.4 58.3 63.7 60.9 66.7 52.1 66.6 48.2
Any Modern Method 1998–99 58.9 53.3 53.2 56.5 56.1 59.9 53.8 50.3 47.3 42.8
Spacing methods(pill, IUD andCondom)
1998–99 1.8 8.1 12.5 4.4 5.1 7.6 23.0 4.3 13.5 6.8
Full immunizationof children (12–23months)
1998–99 58.7 53.0 62.7 60.0 79.7 78.4 72.1 88.8 43.8 42.0
Annexure Tables 209

Health and NutritionTable 48 (continued)
Health Care Indicators across Selected States in India
Sr.No.
Type of Health Facility/Indicator Ref. Year
AndhraPradesh Gujarat Haryana
Kar-nataka Kerala
Maha-rashtra Punjab
TamilNadu
WestBengal
AllIndia
1 2 3 4 5 6 7 8 9 10 11 12 134 Morbidity Rate (per 1 lakh population)
Leprosy (pointprevalence)
1994 63 30 – n.a. – 65 – 83 22 57
Diarrhoea (in 30 days)(per 1000 popn)
1994 36 9 29 n.a. 6 14 16 19 45 31
Asthma (pointprevalence)
1998-99 4292 1979 1922 1733 4806 2524 1308 1546 2593 2468
Tuberculosis (pointprevalence)
1998-99 592 438 358 269 526 282 207 479 492 544
Jaundice (pointprevalence)
1998-99 1571 1109 993 373 528 1534 976 1142 2381 1361
Malaria (in last 3months)
1998-99 4851 4449 2093 600 56 4098 1082 380 1482 3697
Prevalence of ailmentsin last 15 days (perthousand population)
1995-96
Rural 64 46 61 45 118 52 76 52 65 55Urban 61 36 63 40 88 48 85 58 65 54
Prevalence ofhospitalisation in last 1year (perthousand population)
1995-96
Rural 14 14 25 14 70 19 14 18 11 13Urban 17 21 25 18 65 26 17 23 22 20
Nutritional StatusPercentage of childrenof age with anaemia 6–36 months
1998–99 72.3 74.5 83.9 70.6 43 9 76.0 80.0 69.0 78.3 74.3
Percentage of ever-married women of 15–49 years with anaemia
1998–99 49.8 46.3 47.0 42.4 22.7 48.5 41.4 56.5 62.7 51.8
Percentage of house-holds with per capitacalorie intake level ofbelow 2700 Kcal.
1993–94
Rural 40.9 46.4 25.9 42.7 45.7 49.7 24.4 51.3 32.2 36.9Urban 48.1 41.0 41.6 44.7 47.6 45.9 40.4 52.9 35.7 41.6
Average exp onoutpatient care (in Rs)
1995–96
Rural 165 157 189 122 136 165 175 102 131 176Urban 172 218 414 172 120 185 162 129 137 194
Average exp oninpatient care (in Rs)
1995–96
Rural 6428 2663 3224 2997 2293 3089 4988 2840 1957 3202Urban 4886 3327 6537 3593 1927 3997 5712 3934 3217 3921
210 Human Development Report Maharashtra 2002

Health and NutritionTable 49
Availability of Health Care Infrastructure Facilities in Maharashtra by Districts
Sr. No. District
Population served per % in Public Sector % in Urban Areas*
Hospi-tal**
Dispen-sary** ISM†
All Medi-cal Inst. Beds
Hospi-tals**
Dispen-saries**
Hospi-tals**
Dispen-saries** Beds
1 2 3 4 5 6 7 8 9 10 11 12 1 Mumbai # 13764 5251 65617 3593 355 8.0 100.0 100.0 100.0 100.0 2 Thane 21468 3720 73562 3040 662 42.9 47.2 97.1 50.8 90.9
3 Raigad 20192 12296 200000 7378 1062 18.1 5.9 96.5 96.4 99.2
4 Ratnagiri 34529 324577 300000 28472 1234 15.7 10.7 88.4 95.5 66.0 5 Sindhudurg 20337 7110 9016 3325 694 22.0 47.5 79.3 100.0 81.8
6 Nashik 21192 8144 44975 5203 837 18.3 13.2 87.8 100.0 69.3 7 Dhule 14809 12227 63466 6058 1385 15.9 2.9 95.0 100.0 69.0
8 Jalgaon 6742 17453 63224 4516 665 7.9 6.3 71.7 95.3 76.8
9 Ahmednagar 25691 12892 31940 6766 838 7.8 7.8 87.7 99.6 60.710 Pune 11163 17257 300000 6631 373 19.7 100.0 90.4 100.0 67.9
11 Satara 13703 184016 100000 11710 615 33.7 11.6 95.1 99.5 83.4
12 Sangli 11438 12093 22542 4662 618 10.0 17.6 74.5 100.0 68.513 Solapur 19631 26124 200000 10514 575 8.6 100.0 14.0 3.3 35.8
14 Kolhapur 36544 14755 42470 8426 1155 24.4 3.8 84.9 3.8 39.715 Aurangabad 21350 2502 200000 2212 757 27.7 100.0 72.5 26.5 73.1
16 Jalna 25152 477897 89606 18864 1086 19.7 13.8 82.5 66.7 75.3
17 Parbhani 23672 21192 42792 8865 1284 25.7 10.7 80.0 100.0 55.318 Beed 26973 36134 23355 9297 1469 18.6 11.4 88.7 100.0 56.7
19 Nanded 27212 17876 44528 8685 1058 16.0 5.7 98.1 61.9 93.4
20 Osmanabad 38320 47900 41912 14118 1316 17.8 12.4 92.1 99.4 76.821 Latur 28896 440670 62953 18954 1157 12.8 2.5 93.4 100.0 73.5
22 Buldhana 27533 12957 17089 5813 1124 16.1 7.8 93.1 94.8 76.323 Akola 22815 8619 47492 5528 833 11.7 2.4 92.2 92.2 76.8
24 Amaravati 11064 7557 7812 2851 418 16.8 10.3 94.7 87.9 71.9
25 Yavatmal 26303 19492 41191 8803 1011 64.7 43.2 85.4 52.5 53.426 Wardha 27354 19009 86270 9925 438 19.4 7.3 96.9 99.5 91.8
27 Nagpur 9624 41130 29279 6159 471 22.8 100.0 44.7 84.3 69.9
28 Bhandara 52755 79132 29154 15176 1458 22.5 5.5 61.9 47.2 51.429 Chandrapur 20027 9701 16630 4692 856 7.6 4.2 81.7 67.2 64.7
30 Gadchiroli 48659 22357 22357 9090 1020 11.3 23.1 47.1 56.8 14.8Maharashtra 161191 9972 40811 5435 642 13.4 8.9 86.7 90.2 61.7
** Includes only allopathic medical institutions. † Includes Ayurvedic, Unani and Homeopathic institutions. * Includes infrastructure facilities in public and private sectors. # Includes Mumbai City and Mumbai Suburban District.
Source: Computed on the basis of information in Statistical Abstract of Maharashtra State 1993-94 & 1994-95, Directorate of Economics and Statistics, Government of Maharashtra, Mumbai.
Annexure Tables 211

Health and NutritionTable 50
Number of Hospitals, Dispensaries, Beds, Doctors and Nurses per 1,00,000 populationin Selected States 1981–1995/1997
Year AndhraPradesh
Gujarat Haryana Karna-taka
Kerala Maha-rashtra
Punjab TamilNadu
WestBengal
All India
1 2 3 4 5 6 7 8 9 10 11
Hospitals
1981 1.14 2.43 0.66 0.63 2.98 1.60 1.51 0.78 0.75 0.99
1986 1.03 3.78 0.52 0.61 1.20 2.18 1.44 0.78 0.67 1.02
1991 1.75 4.34 0.48 0.64 7.02 2.67 1.14 0.73 0.61 1.32
1995 4.10 5.60 0.40 0.60 6.60 3.60 1.00 0.70 0.50 1.60
(N)* (2950) (2528) (79) (293) (2040) (3115) (220) (408) (399) (15097
Dispensaries
1981 1.32 1.38 1.93 3.85 2.95 5.58 8.85 1.38 0.77 2.45
1986 1.32 9.47 1.60 3.68 5.48 10.30 9.69 1.29 0.90 3.38
1991 0.27 15.20 1.32 1.88 6.04 11.70 7.12 0.92 0.81 3.25
1995 0.40 16.10 1.20 1.70 6.40 9.50 6.60 0.90 0.70 310
(N)* (303) (7255) (217) (830) (1951) (8143) (1462) (512) (551) (28225)
Beds
1981 63.70 97.70 62.30 86.30 176.00 116.00 119.00 85.20 88.90 73.60
1986 61.20 111.00 51.30 86.60 220.00 133.00 120.00 86.40 87.20 77.80
1991 64.60 146.00 45.40 78.30 263.00 145.00 102.00 88.20 80.10 78.70
1995 78.50 175.70 60.20 112.80 283.30 148.50 113.20 103.50 92.30 94.40
(N)* (56) (72) (11) (55) (87) (127) (37) (61) (68) (870)
Doctors
1981 43.10 43.00 – 51.10 46.00 65.40 128.00 65.70 60.20 31.90
1991 49.70 53.00 – 98.60 56.70 62.70 135.00 81.90 61.40 47.20
1997 36.90 61.20 4.90 94.50 81.50 75.30 127.90 95.00 61.20 51.80
(N)* (27541) (28415) (925) (50576) (25644) (66477) (29170) (5905) (47358) (507313)
Nurses
1981 20.30 14.50 14.00 13.90 37.50 54.00 94.60 51.80 16.20 22.00
1991 23.30 59.00 20.70 52.20 78.40 48.60 116.00 60.50 25.30 36.90
1997 58.10 146.60 22.80 100.20 79.20 112.90 138.00 132.50 45.60 63.56
(N)* (42659) (68045) (4344) (50371) (24914) (99676) (31487) (79881) (34701) (607396)
* Total number of hospitals, dispensaries, beds, doctors and nurses presented are related to latest year.Source: Duggal et al. 1995; CSO 2000.
212 Human Development Report Maharashtra 2002
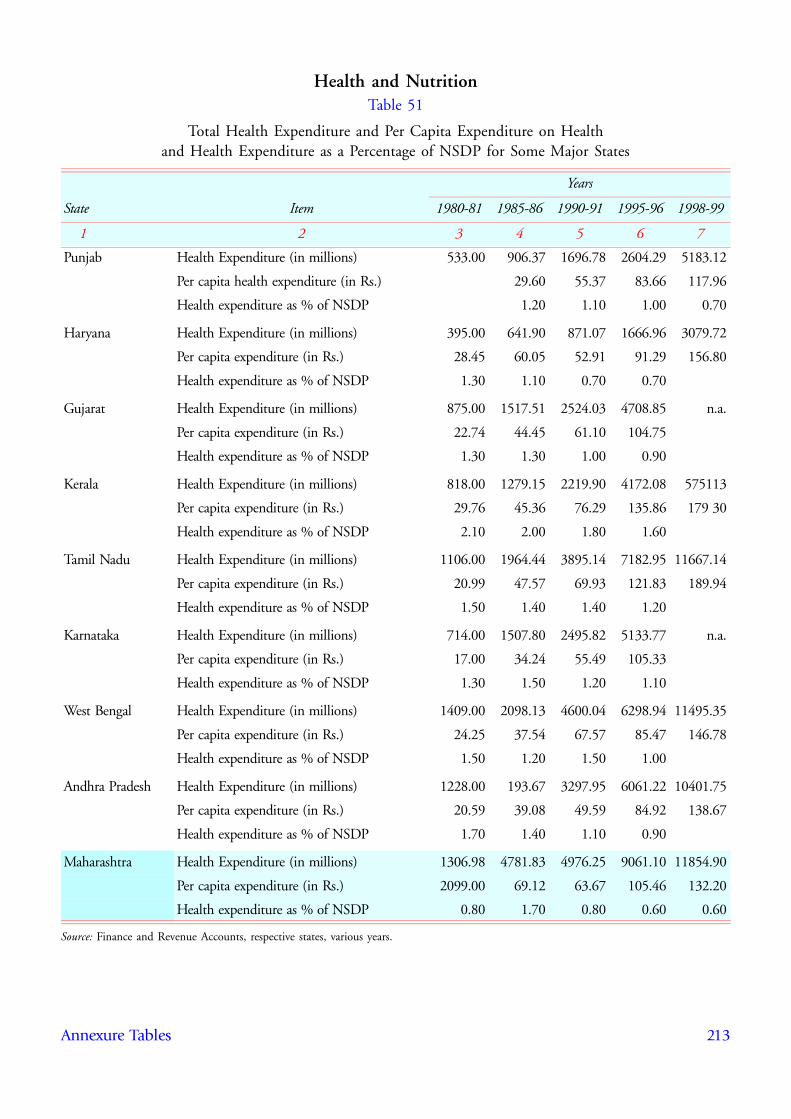
Health and NutritionTable 51
Total Health Expenditure and Per Capita Expenditure on Healthand Health Expenditure as a Percentage of NSDP for Some Major States
Years
State Item 1980-81 1985-86 1990-91 1995-96 1998-99
1 2 3 4 5 6 7
Punjab Health Expenditure (in millions) 533.00 906.37 1696.78 2604.29 5183.12
Per capita health expenditure (in Rs.) 29.60 55.37 83.66 117.96
Health expenditure as % of NSDP 1.20 1.10 1.00 0.70
Haryana Health Expenditure (in millions) 395.00 641.90 871.07 1666.96 3079.72
Per capita expenditure (in Rs.) 28.45 60.05 52.91 91.29 156.80
Health expenditure as % of NSDP 1.30 1.10 0.70 0.70
Gujarat Health Expenditure (in millions) 875.00 1517.51 2524.03 4708.85 n.a.
Per capita expenditure (in Rs.) 22.74 44.45 61.10 104.75
Health expenditure as % of NSDP 1.30 1.30 1.00 0.90
Kerala Health Expenditure (in millions) 818.00 1279.15 2219.90 4172.08 575113
Per capita expenditure (in Rs.) 29.76 45.36 76.29 135.86 179 30
Health expenditure as % of NSDP 2.10 2.00 1.80 1.60
Tamil Nadu Health Expenditure (in millions) 1106.00 1964.44 3895.14 7182.95 11667.14
Per capita expenditure (in Rs.) 20.99 47.57 69.93 121.83 189.94
Health expenditure as % of NSDP 1.50 1.40 1.40 1.20
Karnataka Health Expenditure (in millions) 714.00 1507.80 2495.82 5133.77 n.a.
Per capita expenditure (in Rs.) 17.00 34.24 55.49 105.33
Health expenditure as % of NSDP 1.30 1.50 1.20 1.10
West Bengal Health Expenditure (in millions) 1409.00 2098.13 4600.04 6298.94 11495.35
Per capita expenditure (in Rs.) 24.25 37.54 67.57 85.47 146.78
Health expenditure as % of NSDP 1.50 1.20 1.50 1.00
Andhra Pradesh Health Expenditure (in millions) 1228.00 193.67 3297.95 6061.22 10401.75
Per capita expenditure (in Rs.) 20.59 39.08 49.59 84.92 138.67
Health expenditure as % of NSDP 1.70 1.40 1.10 0.90
Maharashtra Health Expenditure (in millions) 1306.98 4781.83 4976.25 9061.10 11854.90
Per capita expenditure (in Rs.) 2099.00 69.12 63.67 105.46 132.20
Health expenditure as % of NSDP 0.80 1.70 0.80 0.60 0.60
Source: Finance and Revenue Accounts, respective states, various years.
Annexure Tables 213

Health and NutritionTable 52
Summary of Information on Studies Covering Morbidity and Utilisation of Health Care Servicesfrom the Private Sector and on Medical Expenditure in Maharashtra
Reference
Morbidity Rates(per 1000 population)
Utilisation of Services from Public/PrivateHealth Care Sector*
Recall Rural Urban
Period Rural Urban Public Private Total Public Private Total
1 2 3 4 5 6 7 8 9 10
FRCH 1984 (Jesani et al 1996) – – – 33.10 58.40 91.50 – – –
NSSO 1986-87 (1992)
Inpatient care – – 26.32 73.68 100.00 25.02 74.27 99.29
Outpatient care – – – – – – – – –
Duggal and Amin (1989) 1 month 154.00 145.00 10.43 79.82 90.35 15.99 73.95 89.94
NCAER (1992) 2 weeks 70.46 54.82 38.67 61.33 100.00 45.49 54.51 100.00
NCAER (1993)
Non-hospitalised ailments— 30 days 66.80 78.60 – – – – – –
Males – 65.40 77.80 46.10 51.30 97.40 30.00 68.00 98.00
Females – 68.40 79.50 41.60 55.00 96.60 35.10 62.40 97.50
Hospitalisation 1 year 5.50 14.10 30.50 69.50 100.00 58.80 51.20 100.00
NSSO—1995–96 (1998)
Hospitalisation 1 year 19.00 26.00 31.20 68.80 100.00 31.80 68.20 100.00
Ailments 15 days 52.00 48.00 16.00 73.00 89.00 17.00 77.00 94.00
Nandraj et al (1998) 30 days – 363.00 – – – 10.00 84.00 –
Madhiwala et al (2000)— 30 days – – 22.60 63.50 86.10 10.30 71.70 82.00
Male – 868.00 247.00 – – – – – –
Female – 1355.00 457.00 – – – – – –
Inpatient care – – – – – – – – –
Outpatient care – – – – – – – – –
* Percentage may not add up to hundred in some cases since some have not sought treatment or might have gone for self-treatment.
214 Human Development Report Maharashtra 2002

Health and NutritionTable 52 (continued)
Summary of Information on Studies Covering Morbidity and Utilisation of Health Care Servicesfrom the Private Sector and on Medical Expenditure in Maharashtra.
Reference
Average Medical Expenditure (Rupees) per Ailment/Episode
Rural Urban
Public Private Total Public Private Total
1 11 12 13 14 15 16
FRCH 1984 (Jesani et al 1996) 28.00 87.08 56.99 – – –
NSSO 1986-87 (1992)
Inpatient care 438.80 901.36 841.80 400.10 1929.00 1499.00
Outpatient care 52.10 99.40 86.50 83.80 153.10 131.90
Duggal and Amin (1989) – – 103.60 – – 100.40
NCAER (1992) 97.50 227.26 172.60 129.50 201.86 175.10
NCAER (1993)
Non-hospitalised ailments— 30.19 240.64 171.50 74.10 169.85 136.60
Males – – – – – –
Females – – – – – –
Hospitalisation 664.90 112.72 981.50 462.00 1976.30 1086.00
NSSO—1995–96 (1998)
Hospitalisation 1529.00 3836.00 3089.00 1439.00 5345.00 3997.00
Ailments 129.00 158.00 147.00 125.00 195.00 185.00
Nandraj et al (1998) – – – 179.90 134.46 134.00
Madhiwala et al (2000)—
Male – – – – – –
Female – – – – – –
Inpatient care 16.00 118.00 97.00 12.00 128.00 98.00
Outpatient care 332.00 2188.00 – 1938.00 2188.00 –
Annexure Tables 215

Health and NutritionTable 53
Per cent Utilising Health Care Services from Private Sector for Selected RCH Servicesby Districts, Maharashtra, 1998–99
Sr. No. District
AntenatalCare
ForDelivery #
PregnancyCompli-cations
Post DeliveryComplications
Side Effectsof Steril-isation
Treatmentof RTI/STI
Immun-ization Diarrhoea Pneumonia
1 2 3 4 5 6 7 8 9 10 11 1 Mumbai † 53.6 51.7 62.5 60.7 50.0 83.9 33.2 79.6 90.9
2 Thane 47.8 61.0 63.3 60.5 69.3 67.4 30.5 68.1 48.8 3 Raigad 37.8 56.4 60.9 64.0 58.3 60.8 22.7 67.0 72.5
4 Ratnagiri 41.4 55.8 64.7 65.1 57.1 77.1 8.1 61.4 54.7
5 Sindhudurg 26.3 32.2 37.1 43.7 41.6 69.6 4.1 55.5 65.4 6 Nashik 33.2 54.5 69.3 71.4 65.7 78.8 14.8 66.6 73.6
7 Dhule 22.6 44.8 60.4 69.0 – 67.7 13.3 47.7 55.5 8 Jalgaon 32.6 59.3 73.4 74.5 72.0 75.6 12.4 74.1 67.9
9 Ahmednagar 44.4 69.7 82.2 67.2 81.7 83.7 11.1 68.8 80.8
10 Pune 50.0 57.6 61.5 64.3 65.1 76.3 25.1 68.6 79.311 Satara 53.4 62.1 68.5 64.4 72.2 81.2 8.5 62.9 66.6
12 Sangli 46.9 60.3 73.3 63.9 68.5 73.2 3.4 76.3 75.0
13 Solapur 44.3 65.3 76.2 73.9 63.6 83.3 26.0 63.8 76.514 Kolhapur 58.2 63.6 74.7 75.7 50.0 75.2 9.5 69.8 78.9
15 Aurangabad 30.1 49.7 68.5 73.4 98.8 74.5 13.9 59.3 65.016 Jalna 24.8 59.6 61.6 75.1 58.1 74.1 25.9 62.3 61.0
17 Parbhani 27.2 46.0 62.7 62.2 55.4 72.9 12.4 68.0 62.9
18 Beed 23.5 45.5 51.5 59.6 42.4 38.9 12.2 58.8 58.619 Nanded 26.3 53.8 58.6 61.2 66.0 61.1 15.8 60.7 70.1
20 Osmanabad 30.9 39.2 69.2 67.5 65.4 73.6 17.0 52.1 64.1
21 Latur 35.0 57.1 77.7 68.5 65.8 85.7 29.8 52.0 58.222 Buldhana 30.9 45.2 66.1 69.4 57.8 84.9 – 51.9 67.1
23 Akola 32.7 47.3 61.4 61.6 63.0 70.8 14.7 71.0 71.024 Amaravati 28.2 43.4 50.0 64.6 53.0 66.3 23.3 71.0 61.1
25 Yavatmal 23.8 34.0 62.1 63.8 67.1 82.6 10.5 64.1 76.6
26 Wardha 38.5 31.7 62.1 51.9 68.1 78.1 20.9 37.2 54.427 Nagpur 32.1 31.8 50.2 39.3 56.3 68.9 17.6 69.6 69.7
28 Bhandara 21.7 21.1 66.1 69.4 63.7 68.6 24.2 40.0 50.3
29 Chandrapur 31.8 43.9 60.3 58.0 100.0 59.0 11.6 51.4 63.730 Gadchiroli 8.9 19.5 30.7 32.2 32.0 36.5 23.4 31.7 35.3
Maharashtra 38.3 51.3 63.8 63.8 59.6 67.4 17.4 65.3 68.5
* Figures based on phase one survey. # Only institutional deliveries were considered. † Includes Mumbai City and Mumbai Suburban District.
Source: Based on CORT (1998 and 1999), RCH-RHS Survey reports, various district reports.
Education: Tables 54 – 89 →
← Contents
216 Human Development Report Maharashtra 2002
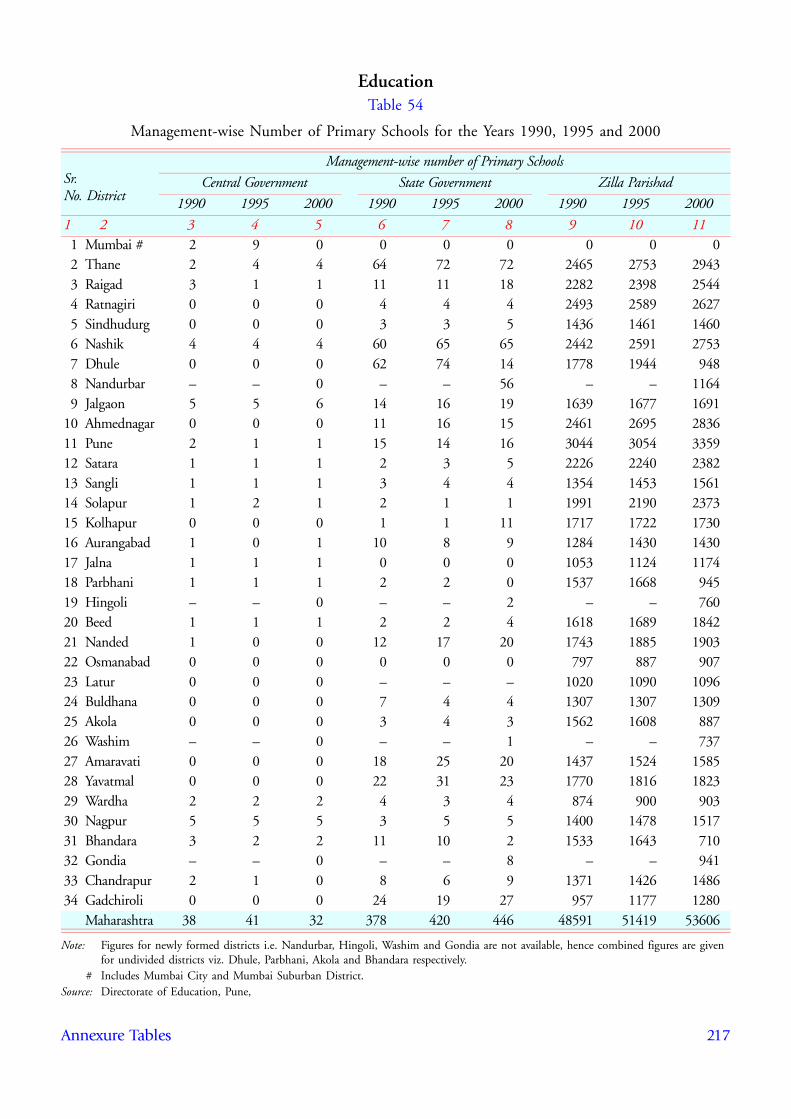
EducationTable 54
Management-wise Number of Primary Schools for the Years 1990, 1995 and 2000
Sr. No. District
Management-wise number of Primary Schools
Central Government State Government Zilla Parishad
1990 1995 2000 1990 1995 2000 1990 1995 2000
1 2 3 4 5 6 7 8 9 10 11 1 Mumbai # 2 9 0 0 0 0 0 0 0 2 Thane 2 4 4 64 72 72 2465 2753 2943 3 Raigad 3 1 1 11 11 18 2282 2398 2544 4 Ratnagiri 0 0 0 4 4 4 2493 2589 2627 5 Sindhudurg 0 0 0 3 3 5 1436 1461 1460 6 Nashik 4 4 4 60 65 65 2442 2591 2753 7 Dhule 0 0 0 62 74 14 1778 1944 948 8 Nandurbar – – 0 – – 56 – – 1164 9 Jalgaon 5 5 6 14 16 19 1639 1677 169110 Ahmednagar 0 0 0 11 16 15 2461 2695 283611 Pune 2 1 1 15 14 16 3044 3054 335912 Satara 1 1 1 2 3 5 2226 2240 238213 Sangli 1 1 1 3 4 4 1354 1453 156114 Solapur 1 2 1 2 1 1 1991 2190 237315 Kolhapur 0 0 0 1 1 11 1717 1722 173016 Aurangabad 1 0 1 10 8 9 1284 1430 143017 Jalna 1 1 1 0 0 0 1053 1124 117418 Parbhani 1 1 1 2 2 0 1537 1668 94519 Hingoli – – 0 – – 2 – – 76020 Beed 1 1 1 2 2 4 1618 1689 184221 Nanded 1 0 0 12 17 20 1743 1885 190322 Osmanabad 0 0 0 0 0 0 797 887 90723 Latur 0 0 0 – – – 1020 1090 109624 Buldhana 0 0 0 7 4 4 1307 1307 130925 Akola 0 0 0 3 4 3 1562 1608 88726 Washim – – 0 – – 1 – – 73727 Amaravati 0 0 0 18 25 20 1437 1524 158528 Yavatmal 0 0 0 22 31 23 1770 1816 182329 Wardha 2 2 2 4 3 4 874 900 90330 Nagpur 5 5 5 3 5 5 1400 1478 151731 Bhandara 3 2 2 11 10 2 1533 1643 71032 Gondia – – 0 – – 8 – – 94133 Chandrapur 2 1 0 8 6 9 1371 1426 148634 Gadchiroli 0 0 0 24 19 27 957 1177 1280
Maharashtra 38 41 32 378 420 446 48591 51419 53606
Note: Figures for newly formed districts i.e. Nandurbar, Hingoli, Washim and Gondia are not available, hence combined figures are given for undivided districts viz. Dhule, Parbhani, Akola and Bhandara respectively.
# Includes Mumbai City and Mumbai Suburban District.Source: Directorate of Education, Pune,
Annexure Tables 217

EducationTable 54 (continued)
Management-wise Number of Primary Schools for the Years 1990, 1995 and 2000
Sr. No. District
Management-wise Number of Schools
Municipal Councils Private (Aided) Private (Non-aided) Total
1990 1995 2000 1990 1995 2000 1990 1995 2000 1990 1995 2000
1 2 12 13 14 15 16 17 18 19 20 21 22 23 1 Mumbai # 1310 1266 1188 320 355 342 547 616 580 2179 2246 2110 2 Thane 249 388 391 252 309 382 227 435 496 3259 3961 4288 3 Raigad 55 75 75 14 25 29 21 30 71 2386 2540 2738 4 Ratnagiri 20 20 20 7 9 16 15 24 31 2539 2646 2698 5 Sindhudurg 0 0 0 28 26 25 3 6 15 1470 1496 1505 6 Nashik 313 292 278 84 121 165 54 73 74 2957 3146 3339 7 Dhule 108 95 60 91 139 135 41 49 27 2080 2301 1184 8 Nandurbar – – 32 – – 71 – – 25 – – 1348 9 Jalgaon 140 138 133 62 91 129 46 57 79 1906 1984 205710 Ahmednagar 74 71 62 60 82 92 28 40 66 2634 2904 307111 Pune 371 393 418 121 183 203 124 215 241 3677 3860 423812 Satara 68 62 58 42 47 70 32 41 63 2371 2394 257913 Sangli 97 96 95 47 64 89 24 47 74 1526 1665 182414 Solapur 173 173 148 157 201 246 55 61 69 2379 2628 283815 Kolhapur 150 153 152 159 104 125 73 56 70 2100 2036 208816 Aurangabad 82 103 100 64 114 148 72 106 125 1513 1761 181317 Jalna 19 19 21 25 36 63 8 19 27 1106 1199 128618 Parbhani 1 17 17 56 99 80 30 43 29 1627 1830 107219 Hingoli – – 2 – – 38 0 0 26 – – 82820 Beed 0 0 0 36 51 87 38 64 69 1695 1807 200321 Nanded 8 11 11 103 203 252 164 106 112 2031 2222 229822 Osmanabad 20 28 29 33 45 89 12 12 30 862 972 105523 Latur 16 34 23 55 137 196 55 77 52 1146 1338 136724 Buldhana 76 81 83 18 34 46 17 23 41 1425 1449 148325 Akola 120 121 114 29 43 37 32 62 70 1746 1838 111126 Washim – – 22 0 0 29 – – 27 – – 81627 Amaravati 127 119 113 49 73 96 41 41 57 1672 1782 187128 Yavatmal 85 94 91 45 74 95 29 32 56 1951 2047 208829 Wardha 67 71 63 28 30 46 25 28 35 1000 1034 105330 Nagpur 336 354 346 176 301 334 212 271 263 2132 2414 247031 Bhandara 62 64 31 39 79 83 156 161 38 1804 1959 86632 Gondia – – 32 – – 66 – – 40 –– 108733 Chandrapur 93 96 96 32 42 38 47 63 105 1553 1634 173434 Gadchiroli 6 0 0 23 29 50 8 24 23 1018 1249 1380
Maharashtra 4246 4434 4304 2255 3146 3992 2236 2882 3206 57744 62342 65586
Note: Figures for newly formed districts i.e. Nandurbar, Hingoli, Washim and Gondia are not available, hence combined figures are given for undivided districts viz. Dhule, Parbhani, Akola and Bhandara respectively.
# Includes Mumbai City and Mumbai Suburban District.Source: Directorate of Education, Pune.
218 Human Development Report Maharashtra 2002

EducationTable 55
Number of Preprimary Schools, their Enrolment and Number of Teachers for the Years 1990 and 2000
Sr. No. District
Number of Schools Total Enrolment Number of Teachers
1990 2000 1990 2000 1990 2000
Total Girls Total Girls Total Female Total Female
1 2 3 4 5 6 7 8 9 10 11 12 1 Mumbai # 76 300 18097 8076 15485 7048 521 520 300 300 2 Thane 43 2348 7888 3618 218775 106711 164 161 4694 4694 3 Raigad 100 2322 2579 1271 122640 61153 101 101 2338 2338 4 Ratnagiri 7 952 512 225 24381 11884 19 19 1018 1018 5 Sindhudurg 53 1106 1115 545 26556 13003 53 53 1107 1094 6 Nashik 11 385 1797 872 4368 1869 44 44 385 385 7 Dhule 35 1106 3524 1654 58755 28557 53 53 1102 1102 8 Nandurbar – 1204 – – 106367 52453 – – 1287 1287 9 Jalgaon 39 2364 3124 1334 129768 63367 78 72 2365 236510 Ahmednagar 2 2755 455 206 137014 58527 8 8 2900 288811 Pune 32 2685 4950 2333 66425 31884 131 130 2657 265712 Satara 17 2334 2412 1100 90523 43724 62 62 2320 232013 Sangli 23 1360 2921 1185 61928 28189 70 69 1360 136014 Solapur 20 2017 3651 1848 84234 41012 77 77 2017 201715 Kolhapur 67 1929 5381 2417 86754 41253 143 138 1897 189716 Aurangabad 32 2139 3773 1821 140508 60432 75 75 2245 224517 Jalna 6 501 716 286 22374 10435 13 13 527 52718 Parbhani 16 453 2150 883 18149 489 33 33 453 45319 Hingoli – 1657 – – 64330 30577 – – 1657 165720 Beed 9 638 1005 466 21190 10091 20 20 638 63821 Nanded 29 503 3052 1292 13027 6047 57 55 503 50322 Osmanabad 2 1411 333 150 116389 56485 8 8 1411 141123 Latur 2 235 438 165 7473 3156 9 9 235 23524 Buldhana 8 553 538 228 17997 8890 15 14 564 56425 Akola 15 1656 1224 588 85787 43424 33 33 1667 166726 Washim – 887 – – 26610 8937 – – 887 88727 Amaravati 70 970 4828 2247 23912 10867 111 111 970 97028 Yavatmal 29 2207 2400 1180 199152 96054 52 51 2225 222529 Wardha 8 932 1504 686 24639 11031 42 42 932 93230 Nagpur 88 813 6035 3032 34521 15370 162 162 702 70231 Bhandara 5 999 547 250 52579 26060 12 12 992 99232 Gondia – 1010 – – 41316 20792 – – 1010 100433 Chandrapur 13 1981 1149 539 23597 11543 23 23 1987 198734 Gadchiroli – 1361 – – 120402 60308 – – 1362 1362
Maharashtra 857 46073 88098 40497 2287925 1081622 2189 2168 48714 48683
Note: Figures for newly formed districts i.e. Nandurbar, Hingoli, Washim and Gondia are not available, hence combined figures are given for undivided districts viz. Dhule, Parbhani, Akola and Bhandara respectively.
# Includes Mumbai City and Mumbai Suburban District.Source: Directorate of Education, Pune.
Annexure Tables 219

EducationTable 56
Number of Lower Primary Schools and their Enrolment for the Years 1990, 1995 and 2000
Sr. No. District
1990 1995 2000
No. ofSchools
Enrolment No. ofSchools
Enrolment No. ofSchools
Enrolment
Total Girls Total Girls Total Girls
1 2 3 4 5 6 7 8 9 10 11 1 Mumbai # 1349 565173 269542 1382 585197 270510 1234 544106 246580 2 Thane 2199 253878 115486 2609 314979 148977 2635 282972 134099 3 Raigad 1574 103703 50975 1739 118427 57637 1946 138073 67286 4 Ratnagiri 1484 68723 33538 1521 64184 31492 1590 65692 32464 5 Sindhudurg 840 31379 15419 898 30534 15135 943 29951 14645 6 Nashik 2116 260876 120485 2238 269688 126015 2365 285094 136125 7 Dhule 1747 197986 90206 1991 226885 108201 976 139362 66008 8 Nandurbar – – – – – – 1137 101339 48656 9 Jalgaon 1247 197736 88072 1309 219575 99591 1390 227954 10598310 Ahmednagar 2006 242814 111998 2283 288136 143436 2416 283115 13668011 Pune 2387 280585 135665 2489 311426 150791 2788 298768 14269312 Satara 1522 129103 62208 1509 130165 62948 1699 130069 6249813 Sangli 912 112230 56135 1009 117769 58501 1159 115958 5696914 Solapur 1528 176508 79189 1735 219294 104930 1954 217559 10588815 Kolhapur 1158 159751 74837 1082 139660 68533 1088 125310 5914416 Aurangabad 998 130093 56348 1043 165089 72415 975 151851 7394117 Jalna 799 86816 34503 755 92457 41371 574 73058 3459318 Parbhani 1165 107576 46636 961 114024 46490 547 79807 3645319 Hingoli – – – – – – 372 46287 2356020 Beed 1229 110104 48182 1262 122820 58882 1243 126479 6239821 Nanded 1399 144799 64927 1183 121542 58939 1160 118426 5898322 Osmanabad 482 55453 24830 464 69132 32691 457 62259 2900223 Latur 658 88111 40945 658 100596 49239 648 97656 5049324 Buldhana 1005 135137 62547 928 136160 64178 919 131344 6313425 Akola 1200 150977 69801 1221 162120 76999 733 108138 4911726 Washim – – – – – – 515 64843 3092027 Amaravati 1202 168584 79300 1214 193845 90713 1195 146997 7262328 Yavatmal 1290 116752 51848 1266 126268 59979 1286 128805 6147029 Wardha 779 85556 42260 782 83185 40271 768 70354 3462530 Nagpur 1596 243757 119438 1712 219698 107360 1739 218252 10695631 Bhandara 1250 128634 63213 1291 122285 61530 600 57574 2769732 Gondia – – – – – – 675 51525 2630033 Chandrapur 1152 130432 61655 1120 120575 58421 968 102036 4956134 Gadchiroli 813 50181 22963 945 54652 28256 973 48147 23265
Maharashtra 39086 4713407 2193151 40599 5040367 2394431 41667 4869160 2330809
Note: Figures for newly formed districts i.e. Nandurbar, Hingoli, Washim and Gondia are not available, hence combined figures are givenfor undivided districts viz. Dhule, Parbhani, Akola and Bhandara respectively.# Includes Mumbai City and Mumbai Suburban District.Source: Directorate of Education, Pune.
220 Human Development Report Maharashtra 2002

EducationTable 57
Number of Upper Primary Schools and their Enrolment for the Years 1990, 1995 and 2000
Sr. No. District
1990 1995 2000
No. ofSchools
Enrolment No. ofSchools
Enrolment No. ofSchools
Enrolment
Total Girls Total Girls Total Girls
1 2 3 4 5 6 7 8 9 10 11 1 Mumbai # 830 564986 271575 864 598280 299528 815 529791 265121 2 Thane 1060 434625 198123 1352 551096 257193 1653 636446 299666 3 Raigad 812 166332 78984 801 168593 81722 792 161256 78366 4 Ratnagiri 1055 159109 75868 1125 168450 81478 1108 158061 76899 5 Sindhudurg 630 85178 41791 598 74773 36888 562 65068 32068 6 Nashik 841 262345 122008 908 280108 133575 974 319618 153742 7 Dhule 333 91709 40198 310 88441 38463 208 56347 25907 8 Nandurbar – – – – – – 211 58478 25506 9 Jalgaon 659 224747 100047 675 219235 100117 667 227284 10830310 Ahmednagar 628 192832 86041 621 206801 94139 655 208012 10040511 Pune 1290 426877 201325 1371 489714 237473 1450 475234 22746912 Satara 849 201491 95752 885 208777 100815 880 194394 9473513 Sangli 614 200927 91409 656 214189 99635 665 202112 9313714 Solapur 851 285579 122912 893 289587 134881 884 292666 13816715 Kolhapur 942 270213 127355 954 282082 136539 1000 280954 13520116 Aurangabad 515 170871 73307 718 260353 118688 838 317238 15044017 Jalna 307 84776 32487 444 128527 56581 712 201434 9756618 Parbhani 462 147104 61161 869 255527 124399 525 186301 9031319 Hingoli – – – – – – 456 123998 5959220 Beed 466 141961 59363 545 169087 77107 760 240902 11467421 Nanded 632 209604 91289 1039 301419 144226 1138 328117 16075822 Osmanabad 380 107907 50018 508 137794 68420 598 153088 7699123 Latur 488 147820 71426 680 215294 107495 719 234255 11196524 Buldhana 420 121529 50377 521 156649 69788 564 173863 8326025 Akola 546 148966 66311 617 174066 81919 378 111621 5357726 Washim – – – – – – 301 83739 4017027 Amaravati 470 139626 63744 568 159201 73112 676 180650 8508828 Yavatmal 661 173374 78667 781 208656 95483 802 231387 11072529 Wardha 221 55630 25951 252 59546 28026 285 61357 2878830 Nagpur 536 173437 81195 702 219543 103779 731 231756 11138631 Bhandara 554 166657 78927 668 183939 88405 266 78760 3865632 Gondia – – – – – – 412 112435 5458933 Chandrapur 401 103284 47641 514 136040 66275 766 162299 8016334 Gadchiroli 205 48699 20957 304 71331 31829 407 94064 45239
Maharashtra 18658 5708195 2606209 21743 6677098 3167978 23919 7172985 3448632
Note: Figures for newly formed districts i.e. Nandurbar, Hingoli, Washim and Gondia are not available, hence combined figures are given for undivided districts viz. Dhule, Parbhani, Akola and Bhandara respectively.
# Includes Mumbai City and Mumbai Suburban District.Source: Directorate of Education, Pune.
Annexure Tables 221

EducationTable 58
Number of Total Primary Schools and their Enrolment for the Years 1990, 1995 and 2000
Sr. No. District
1990 1995 2000
No. ofSchools
Enrolment No. ofSchools
Enrolment No. ofSchools
Enrolment
Total Girls Total Girls Total Girls
1 2 3 4 5 6 7 8 9 10 11 1 Mumbai # 2179 1130159 541117 2246 1183477 570038 2110 1073897 511701 2 Thane 3259 688503 313609 3961 866075 406170 4288 919418 433765 3 Raigad 2386 270035 129959 2540 287020 139359 2738 299329 145652 4 Ratnagiri 2539 227832 109406 2646 232634 112970 2698 223753 109363 5 Sindhudurg 1470 116557 57210 1496 105307 52023 1505 95019 46713 6 Nashik 2957 523221 242493 3146 549796 259590 3339 604712 289867 7 Dhule 2080 289695 130404 2301 315326 146664 1184 195709 91915 8 Nandurbar – – – – – – 1348 159817 74162 9 Jalgaon 1906 422483 188119 1984 438810 199708 2057 455238 21428610 Ahmednagar 2634 435646 198039 2904 494937 237575 3071 491127 23708511 Pune 3677 707462 336990 3860 801140 388264 4238 774002 37016212 Satara 2371 330594 157960 2394 338942 163763 2579 324463 15723313 Sangli 1526 313157 147544 1665 331958 158136 1824 318070 15010614 Solapur 2379 462087 202101 2628 508881 239811 2838 510225 24405515 Kolhapur 2100 429964 202192 2036 421742 205072 2088 406264 19434516 Aurangabad 1513 300964 129655 1761 425442 191103 1813 469089 22438117 Jalna 1106 171592 66990 1199 220984 97952 1286 274492 13215918 Parbhani 1627 254680 107797 1830 369551 170889 1072 266108 12676619 Hingoli – – – – – – 828 170285 8315220 Beed 1695 252065 107545 1807 291907 135989 2003 367381 17707221 Nanded 2031 354403 156216 2222 422961 203165 2298 446543 21974122 Osmanabad 862 163360 74848 972 206926 101111 1055 215347 10599323 Latur 1146 235931 112371 1338 315890 156734 1367 331911 16245824 Buldhana 1425 256666 112924 1449 292809 133966 1483 305207 14639425 Akola 1746 299943 136112 1838 336186 158918 1111 219759 10269426 Washim – – – – – – 816 148582 7109027 Amaravati 1672 308210 143044 1782 353046 163825 1871 327647 15771128 Yavatmal 1951 290126 130515 2047 334924 155462 2088 360192 17219529 Wardha 1000 141186 68211 1034 142731 68297 1053 131711 6341330 Nagpur 2132 417194 200633 2414 439241 211139 2470 450008 21834231 Bhandara 1804 295291 142140 1959 306224 149935 866 136334 6635332 Gondia – – – – – – 1087 163960 8088933 Chandrapur 1553 233716 109296 1634 256615 124696 1734 264335 12972434 Gadchiroli 1018 98880 43920 1249 125983 60085 1380 142211 68504
Maharashtra 57744 10421602 4799360 62342 11717465 5562409 65586 12042145 5779441
Note: Figures for newly formed districts i.e. Nandurbar, Hingoli, Washim and Gondia are not available, hence combined figures are given for undivided districts viz. Dhule, Parbhani, Akola and Bhandara respectively.
# Includes Mumbai City and Mumbai Suburban District.Source: Directorate of Education, Pune.
222 Human Development Report Maharashtra 2002

EducationTable 59
Number of Teachers in Lower and Upper Primary Schools and Teacher-Pupil Ratio for the Year 1990
Sr. No. District
Lower Primary Upper Primary Total Primary Teacher-Pupil Ratio
Total Female Total Female Total Female Lower Upper Total
1 2 3 4 5 6 7 8 9 10 11 1 Mumbai # 16749 11757 12575 8288 29324 20045 34 45 39 2 Thane 6181 3367 9534 6056 15715 9423 41 46 44 3 Raigad 3170 1299 4721 1955 7891 3254 33 35 34 4 Ratnagiri 2489 858 5871 2582 8360 3440 28 27 27 5 Sindhudurg 1322 576 3333 1423 4655 1999 24 26 25 6 Nashik 6681 2555 6272 2392 12953 4947 39 42 40 7 Dhule 5340 1546 2575 684 7915 2230 37 36 37 8 Nandurbar – – – – – – – – – 9 Jalgaon 4854 1336 6105 2085 10959 3421 41 37 3910 Ahmednagar 5955 1976 5234 1642 11189 3618 41 37 3911 Pune 6931 3414 10899 5810 17830 9224 40 39 4012 Satara 3667 1412 6628 2264 10295 3676 35 30 3213 Sangli 2976 1063 5824 2225 8800 3288 38 34 3614 Solapur 4381 1436 7064 2152 11445 3588 40 40 4015 Kolhapur 3692 1436 8685 2583 12377 4019 43 31 3516 Aurangabad 2762 926 3732 1383 6494 2309 47 46 4617 Jalna 1650 308 1767 321 3417 629 53 48 5018 Parbhani 2503 391 3328 672 5831 1063 43 44 4419 Hingoli – – – – – – – – –20 Beed 2505 328 3343 760 5848 1088 44 42 4321 Nanded 3244 498 4566 1115 7810 1613 45 46 4522 Osmanabad 1378 232 2809 407 4187 639 40 38 3923 Latur 1986 426 3732 526 5718 952 44 40 4124 Buldhana 2949 526 3166 417 6115 943 46 38 4225 Akola 3304 1002 3858 976 7162 1978 46 39 4226 Washim – – – – – – – – –27 Amaravati 3996 1482 3739 1092 7735 2574 42 37 4028 Yavatmal 2789 581 4388 1203 7177 1784 42 40 4029 Wardha 2202 796 1637 468 3839 1264 39 34 3730 Nagpur 6125 3591 4316 2239 10441 5830 40 40 4031 Bhandara 3614 955 4593 1055 8207 2010 36 36 3632 Gondia – – – – – – – – –33 Chandrapur 3189 963 2780 559 5969 1522 41 37 3934 Gadchiroli 1443 242 1221 223 2664 465 35 40 37
Maharashtra 120027 47278 148295 55557 268322 102835 39 38 39
Note: Figures for newly formed districts i.e. Nandurbar, Hingoli, Washim and Gondia are not available, hence combined figures are given for undivided districts viz. Dhule, Parbhani, Akola and Bhandara respectively.
# Includes Mumbai City and Mumbai Suburban District.Source: Directorate of Education, Pune.
Annexure Tables 223

EducationTable 60
Number of Teachers in Lower and Upper Primary Schools and Teacher-Pupil Ratio for the Year 1995
Sr. No. District
Lower Primary Upper Primary Total Primary Teacher-Pupil Ratio
Total Female Total Female Total Female Lower Upper Total
1 2 3 4 5 6 7 8 9 10 11 1 Mumbai # 14272 10920 15028 10129 29300 21049 41 39 40 2 Thane 7706 4471 12375 8313 20081 12784 41 44 43 3 Raigad 3690 1647 4801 2173 8491 3820 32 40 34 4 Ratnagiri 2874 1132 5881 2481 8755 3613 22 29 27 5 Sindhudurg 1582 799 3150 1543 4732 2342 19 24 22 6 Nashik 7252 3485 6564 2163 13816 5648 37 43 40 7 Dhule 6049 1887 2658 864 8707 2751 37 33 36 8 Nandurbar – – – – – – – – – 9 Jalgaon 5376 1592 6535 2143 11911 3735 41 33 3710 Ahmednagar 7041 2566 4994 1874 12035 4440 41 41 4111 Pune 7135 3770 13488 7588 20623 11358 44 36 3912 Satara 4100 1725 6354 2383 10454 4108 32 33 3213 Sangli 3272 1243 6082 2579 9354 3822 36 35 3614 Solapur 4615 1543 6887 2412 11502 3955 48 42 4415 Kolhapur 3859 1483 7553 2348 11412 3831 36 37 3716 Aurangabad 3143 1002 4536 1772 7679 2774 52 57 5517 Jalna 1863 440 2507 427 4370 867 50 51 5118 Parbhani 3084 780 5635 1137 8719 1917 37 45 4219 Hingoli – – – – – – – – –20 Beed 3072 597 4244 986 7316 1583 40 40 4021 Nanded 3773 736 5884 1337 9657 2073 32 51 4422 Osmanabad 1765 401 3326 549 5091 950 39 41 4123 Latur 2518 864 5624 1222 8142 2086 40 38 3924 Buldhana 3405 621 3913 612 7318 1233 40 40 4025 Akola 4044 1384 4288 1327 8332 2711 40 41 4026 Washim – – – – – – – – –27 Amaravati 4084 1608 4499 1674 8583 3282 47 35 4128 Yavatmal 3497 957 5018 1491 8515 2448 36 42 3929 Wardha 2394 976 1672 540 4066 1516 35 36 3530 Nagpur 6456 3830 7066 4555 13522 8385 34 31 3231 Bhandara 3515 1038 5079 1315 8594 2353 35 36 3632 Gondia – – – – – – – – –33 Chandrapur 3030 936 3932 1231 6962 2167 40 35 3734 Gadchiroli 1921 364 2259 386 4180 750 28 32 30
Maharashtra 130387 54797 171832 69554 302219 124351 39 39 39
Note: Figures for newly formed districts i.e. Nandurbar, Hingoli, Washim and Gondia are not available, hence combined figures are given for undivided districts viz. Dhule, Parbhani, Akola and Bhandara respectively.
# Includes Mumbai City and Mumbai Suburban District.Source: Directorate of Education, Pune.
224 Human Development Report Maharashtra 2002

EducationTable 61
Number of Teachers in Lower and Upper Primary Schools and Teacher-Pupil Ratio for the Year 2000
Sr. No. District
Lower Primary Upper Primary Total Primary Teacher-Pupil Ratio
Total Female Total Female Total Female Lower Upper Total
1 2 3 4 5 6 7 8 9 10 11 1 Mumbai # 12892 10964 12379 8005 25271 18969 42 43 42 2 Thane 7053 3943 14793 10402 21846 14345 40 43 42 3 Raigad 4286 1981 4695 2312 8981 4293 32 34 33 4 Ratnagiri 2900 1220 5729 2532 8629 3752 23 28 26 5 Sindhudurg 1655 872 2857 1347 4512 2219 18 23 21 6 Nashik 7608 2921 7729 3334 15337 6255 37 41 39 7 Dhule 3771 1518 1493 569 5264 2087 37 38 37 8 Nandurbar 2963 740 1431 324 4394 1064 34 41 36 9 Jalgaon 5854 1898 6022 2034 11876 3932 39 38 3810 Ahmednagar 7911 2979 5040 1855 12951 4834 36 41 3811 Pune 9471 5493 11724 6745 21195 12238 32 41 3712 Satara 4483 2135 6058 2354 10541 4489 29 32 3113 Sangli 3543 1427 5752 2569 9295 3996 33 35 3414 Solapur 5977 2158 7434 2775 13411 4933 36 39 3815 Kolhapur 3820 1596 7458 2473 11278 4069 33 38 3616 Aurangabad 4288 1965 5258 1796 9546 3761 35 60 4917 Jalna 1576 429 3754 616 5330 1045 46 54 5118 Parbhani 2087 395 3549 1012 5636 1407 38 52 4719 Hingoli 1038 208 2638 411 3676 619 45 47 4620 Beed 3360 649 5244 1466 8604 2115 38 46 4321 Nanded 3199 784 7204 1507 10403 2291 37 46 4322 Osmanabad 2106 503 3666 757 5772 1260 30 42 3723 Latur 2713 360 5246 1390 7959 1750 36 45 4224 Buldhana 3276 715 4250 757 7526 1472 40 41 4125 Akola 2642 1237 2622 1061 5264 2298 41 43 4226 Washim 1547 375 1933 355 3480 730 42 43 4327 Amaravati 4150 1824 4716 1793 8866 3617 35 38 3728 Yavatmal 3151 895 5384 1765 8535 2660 41 43 4229 Wardha 2240 1009 1942 739 4182 1748 31 32 3130 Nagpur 6102 3683 6919 4400 13021 8083 36 33 3531 Bhandara 1692 747 2389 936 4081 1683 34 33 3332 Gondia 1657 461 3153 773 4810 1234 31 36 3433 Chandrapur 3582 1194 4319 1218 7901 2412 28 38 3334 Gadchiroli 1813 323 2470 497 4283 820 27 38 33
Maharashtra 136406 59601 177250 72879 313656 132480 36 40 38
Note: Figures for newly formed districts i.e. Nandurbar, Hingoli, Washim and Gondia are not available, hence combined figures are given for undivided districts viz. Dhule, Parbhani, Akola and Bhandara respectively.
# Includes Mumbai City and Mumbai Suburban District.Source: Directorate of Education, Pune.
Annexure Tables 225

EducationTable 62
Number of Secondary and Higher Secondary Schools and their Enrolment for 1990
Sr. No. District
Secondary Higher Secondary Total Sec. and Higher Sec.
TotalSchools
Enrolment TotalSchools
Enrolment TotalSchools
Enrolment
Total Girls Total Girls Total Girls
1 2 3 4 5 6 7 8 9 10 11 1 Mumbai # 885 610207 271909 141 197346 74121 1026 807553 346030 2 Thane 382 226377 97007 79 109330 46931 461 335707 143938 3 Raigad 177 70029 27517 48 57457 22729 225 127486 50246 4 Ratnagiri 212 59574 21541 28 25413 9412 240 84987 30953 5 Sindhudurg 126 36329 14919 35 27550 11179 161 63879 26098 6 Nashik 351 181204 75118 66 105305 38168 417 286509 113286 7 Dhule 243 95278 39427 79 97316 33685 322 192594 73112 8 Nandurbar – – – – – – – – – 9 Jalgaon 270 138683 50056 76 94976 34496 346 233659 8455210 Ahmednagar 340 159930 56839 76 100711 35274 416 260641 9211311 Pune 416 221089 91041 143 217870 82257 559 438959 17329812 Satara 313 131057 51521 64 73318 26597 377 204375 7811813 Sangli 283 107283 44478 53 52415 17007 336 159698 6148514 Solapur 335 134255 48191 55 64645 17776 390 198900 6596715 Kolhapur 366 149417 55469 42 50430 15714 408 199847 7118316 Aurangabad 238 111627 39279 19 12521 3851 257 124148 4313017 Jalna 104 42986 10588 12 12343 3951 116 55329 1453918 Parbhani 168 83763 21306 21 25331 9675 189 109094 3098119 Hingoli – – – – – – – – –20 Beed 262 88956 29188 32 23759 6787 294 112715 3597521 Nanded 237 89217 28698 51 50408 13122 288 139625 4182022 Osmanabad 172 67888 26027 23 24240 7211 195 92128 3323823 Latur 237 110061 40186 37 30927 10522 274 140988 5070824 Buldhana 159 61900 21974 52 59141 18769 211 121041 4074325 Akola 264 96594 40938 78 73446 27217 342 170040 6815526 Washim – – – – – – – – –27 Amaravati 326 117121 58318 78 81669 31070 404 198790 8938828 Yavatmal 229 72723 28570 57 57713 21097 286 130436 4966729 Wardha 137 51430 26925 55 60289 25777 192 111719 5270230 Nagpur 434 205650 102756 115 133507 54050 549 339157 15680631 Bhandara 276 101962 47499 94 78664 31228 370 180626 7872732 Gondia – – – – – – – – –33 Chandrapur 177 81300 36594 43 53492 21908 220 134792 5850234 Gadchiroli 81 19451 7402 20 19247 6262 101 38698 13664
Maharashtra 8200 3723341 1511281 1772 2070779 757843 9972 5794120 2269124
Note: Figures for newly formed districts i.e. Nandurbar, Hingoli, Washim and Gondia are not available, hence combined figures are given for undivided districts viz. Dhule, Parbhani, Akola and Bhandara respectively.
# Includes Mumbai City and Mumbai Suburban District.Source: Directorate of Education, Pune.
226 Human Development Report Maharashtra 2002

EducationTable 63
Number of Secondary and Higher Secondary Schools and their Enrolment for 1995
Sr. No. District
Secondary Higher Secondary Total Sec. and Higher Sec.
TotalSchools
Enrolment TotalSchools
Enrolment TotalSchools
Enrolment
Total Girls Total Girls Total Girls
1 2 3 4 5 6 7 8 9 10 11 1 Mumbai # 948 693554 313696 191 241657 96606 1139 935211 410302 2 Thane 566 318307 144336 103 141145 59609 669 459452 203945 3 Raigad 222 78774 34278 65 81476 34470 287 160250 68748 4 Ratnagiri 233 55677 22371 49 40373 16250 282 96050 38621 5 Sindhudurg 138 36452 16317 41 29767 13074 179 66219 29391 6 Nashik 513 211768 95458 118 148514 57861 631 360282 153319 7 Dhule 315 105810 46976 113 130671 50483 428 236481 97459 8 Nandurbar – – – – – – – – – 9 Jalgaon 386 153051 61368 97 125410 44509 483 278461 10587710 Ahmednagar 438 196306 85100 116 151370 56213 554 347676 14131311 Pune 641 284417 125179 192 274217 106783 833 558634 23196212 Satara 388 139155 60114 87 97848 39698 475 237003 9981213 Sangli 326 113976 52276 89 84380 33419 415 198356 8569514 Solapur 459 171540 62785 110 92755 29959 569 264295 9274415 Kolhapur 472 160079 66635 82 94516 37274 554 254595 10390916 Aurangabad 309 116357 47474 46 51118 19259 355 167475 6673317 Jalna 150 53710 16377 28 32265 10348 178 85975 2672518 Parbhani 242 79863 24746 31’ 42125 17460 273 121988 4220619 Hingoli – – – – – – – – –20 Beed 323 104359 38392 53 43785 16873 376 148144 5526521 Nanded 278 113759 43407 74 80577 25454 352 194336 6886122 Osmanabad 231 67407 28672 41 37929 13816 272 105336 4248823 Latur 368 85897 36426 97 45833 16619 465 131730 5304524 Buldhana 196 70880 28875 68 81812 29909 264 152692 5878425 Akola 316 105523 46921 114 109629 43380 430 215152 9030126 Washim – – – – – – – – –27 Amaravati 374 129784 65331 91 91844 36037 465 221628 10136828 Yavatmal 294 80294 33942 76 70889 30131 370 151183 6407329 Wardha 157 54131 28182 61 65456 29273 218 119587 5745530 Nagpur 505 228126 115690 145 158412 65972 650 386538 18166231 Bhandara 277 106181 53431 170 146154 66432 447 252335 11986332 Gondia – – – – – – – – –33 Chandrapur 244 91192 43860 68 75844 32932 312 167036 7679234 Gadchiroli 123 30933 12543 45 34779 14233 168 655712 26776
Maharashtra 10432 4237262 1851158 2661 2902550 1144336 13093 7139812 2995494
Note: Figures for newly formed districts i.e. Nandurbar, Hingoli, Washim and Gondia are not available, hence combined figures are given for undivided districts viz. Dhule, Parbhani, Akola and Bhandara respectively.
# Includes Mumbai City and Mumbai Suburban District.Source: Directorate of Education, Pune.
Annexure Tables 227
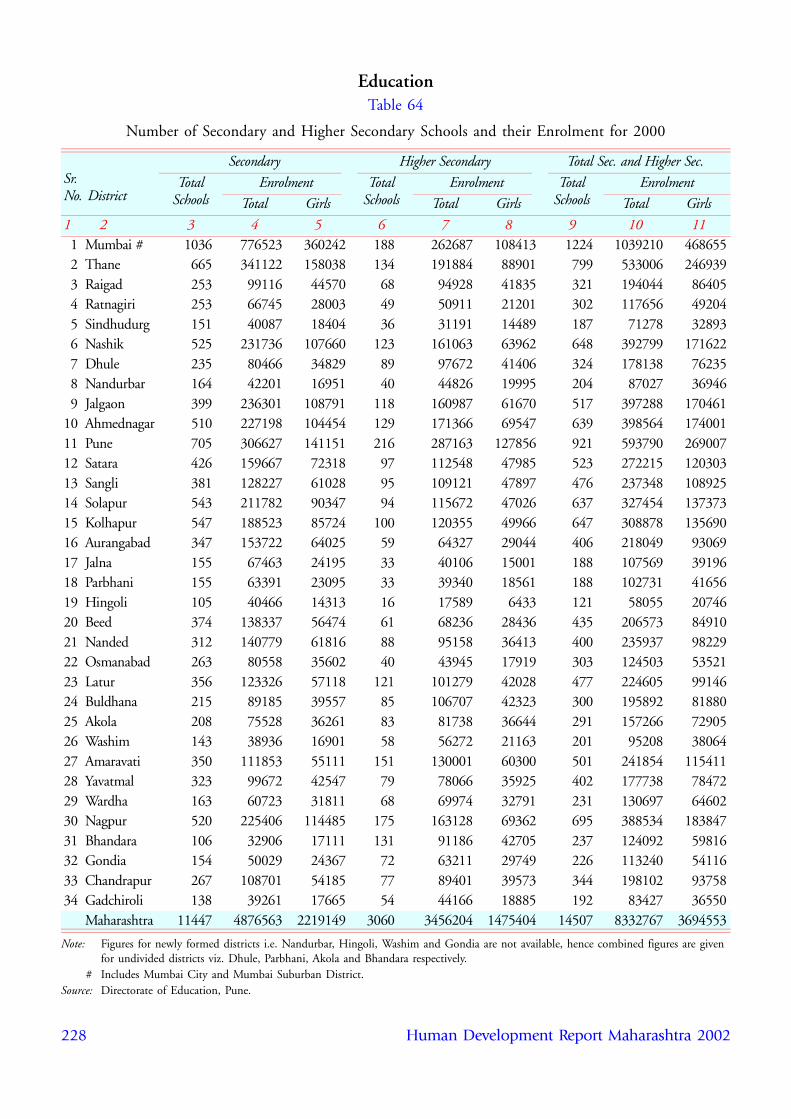
EducationTable 64
Number of Secondary and Higher Secondary Schools and their Enrolment for 2000
Sr. No. District
Secondary Higher Secondary Total Sec. and Higher Sec.
TotalSchools
Enrolment TotalSchools
Enrolment TotalSchools
Enrolment
Total Girls Total Girls Total Girls
1 2 3 4 5 6 7 8 9 10 11 1 Mumbai # 1036 776523 360242 188 262687 108413 1224 1039210 468655 2 Thane 665 341122 158038 134 191884 88901 799 533006 246939 3 Raigad 253 99116 44570 68 94928 41835 321 194044 86405 4 Ratnagiri 253 66745 28003 49 50911 21201 302 117656 49204 5 Sindhudurg 151 40087 18404 36 31191 14489 187 71278 32893 6 Nashik 525 231736 107660 123 161063 63962 648 392799 171622 7 Dhule 235 80466 34829 89 97672 41406 324 178138 76235 8 Nandurbar 164 42201 16951 40 44826 19995 204 87027 36946 9 Jalgaon 399 236301 108791 118 160987 61670 517 397288 17046110 Ahmednagar 510 227198 104454 129 171366 69547 639 398564 17400111 Pune 705 306627 141151 216 287163 127856 921 593790 26900712 Satara 426 159667 72318 97 112548 47985 523 272215 12030313 Sangli 381 128227 61028 95 109121 47897 476 237348 10892514 Solapur 543 211782 90347 94 115672 47026 637 327454 13737315 Kolhapur 547 188523 85724 100 120355 49966 647 308878 13569016 Aurangabad 347 153722 64025 59 64327 29044 406 218049 9306917 Jalna 155 67463 24195 33 40106 15001 188 107569 3919618 Parbhani 155 63391 23095 33 39340 18561 188 102731 4165619 Hingoli 105 40466 14313 16 17589 6433 121 58055 2074620 Beed 374 138337 56474 61 68236 28436 435 206573 8491021 Nanded 312 140779 61816 88 95158 36413 400 235937 9822922 Osmanabad 263 80558 35602 40 43945 17919 303 124503 5352123 Latur 356 123326 57118 121 101279 42028 477 224605 9914624 Buldhana 215 89185 39557 85 106707 42323 300 195892 8188025 Akola 208 75528 36261 83 81738 36644 291 157266 7290526 Washim 143 38936 16901 58 56272 21163 201 95208 3806427 Amaravati 350 111853 55111 151 130001 60300 501 241854 11541128 Yavatmal 323 99672 42547 79 78066 35925 402 177738 7847229 Wardha 163 60723 31811 68 69974 32791 231 130697 6460230 Nagpur 520 225406 114485 175 163128 69362 695 388534 18384731 Bhandara 106 32906 17111 131 91186 42705 237 124092 5981632 Gondia 154 50029 24367 72 63211 29749 226 113240 5411633 Chandrapur 267 108701 54185 77 89401 39573 344 198102 9375834 Gadchiroli 138 39261 17665 54 44166 18885 192 83427 36550
Maharashtra 11447 4876563 2219149 3060 3456204 1475404 14507 8332767 3694553
Note: Figures for newly formed districts i.e. Nandurbar, Hingoli, Washim and Gondia are not available, hence combined figures are given for undivided districts viz. Dhule, Parbhani, Akola and Bhandara respectively.
# Includes Mumbai City and Mumbai Suburban District.Source: Directorate of Education, Pune.
228 Human Development Report Maharashtra 2002

EducationTable 65
Management-wise Number of Secondary and Higher Secondary Schools (1990)
Sr. No. District
CentralGovernment
StateGovernment
ZillaParishad
MunicipalCouncils
PrivateTotal(Aided) (Unaided)
1 2 3 4 5 6 7 8 9 1 Mumbai # 9 2 0 51 623 341 1026 2 Thane 4 17 2 6 285 147 461 3 Raigad 1 3 0 1 163 57 225 4 Ratnagiri 0 0 1 0 171 68 240 5 Sindhudurg 0 0 0 0 142 19 161 6 Nashik 4 24 2 4 313 70 417 7 Dhule 1 20 0 4 243 54 322 8 Nandurbar – – – – – – – 9 Jalgaon 2 5 1 9 285 44 34610 Ahmednagar 1 7 0 1 281 126 41611 Pune 12 10 0 29 378 130 55912 Satara 1 1 1 1 283 90 37713 Sangli 0 0 0 1 265 70 33614 Solapur 1 1 1 8 282 97 39015 Kolhapur 0 1 5 3 308 91 40816 Aurangabad 1 8 55 0 136 57 25717 Jalna 1 0 33 0 56 26 11618 Parbhani 2 3 77 0 55 52 18919 Hingoli – – – – – – –20 Beed 1 0 60 0 112 121 29421 Nanded 1 4 71 0 126 86 28822 Osmanabad 1 0 51 0 87 56 19523 Latur 0 0 50 0 152 72 27424 Buldhana 1 0 35 8 142 25 21125 Akola 0 2 16 6 223 95 34226 Washim – – – – – – –27 Amaravati 1 7 23 10 233 130 40428 Yavatmal 0 13 34 3 221 15 28629 Wardha 2 2 2 7 135 44 19230 Nagpur 5 3 15 18 375 133 54931 Bhandara 3 2 54 12 189 110 37032 Gondia – – – – – – –33 Chandrapur 3 3 20 2 125 67 22034 Gadchiroli 0 14 10 0 36 41 101
Maharashtra 58 152 619 184 6425 2534 9972
Note: Figures for newly formed districts i.e. Nandurbar, Hingoli, Washim and Gondia are not available, hence combined figures are given for undivided districts viz. Dhule, Parbhani, Akola and Bhandara respectively.
# Includes Mumbai City and Mumbai Suburban District.Source: Directorate of Education, Pune.
Annexure Tables 229

EducationTable 66
Management-wise Number of Secondary and Higher Secondary Schools (1995)
Sr. No. District
CentralGovernment
StateGovernment
ZillaParishad
MunicipalCouncils
PrivateTotal(Aided) (Unaided)
1 2 3 4 5 6 7 8 9 1 Mumbai # 9 2 0 51 706 371 1139 2 Thane 4 23 2 8 341 291 669 3 Raigad 2 3 0 2 177 103 287 4 Ratnagiri 0 0 1 0 219 62 282 5 Sindhudurg 0 0 0 0 154 25 179 6 Nashik 4 29 2 4 444 148 631 7 Dhule 1 28 0 4 302 93 428 8 Nandurbar 0 0 0 0 0 0 0 9 Jalgaon 2 14 1 9 367 90 48310 Ahmednagar 1 10 0 1 374 168 55411 Pune 7 10 0 35 519 262 83312 Satara 2 1 1 1 344 126 47513 Sangli 0 0 0 1 319 95 41514 Solapur 1 1 1 8 401 157 56915 Kolhapur 1 1 5 3 401 143 55416 Aurangabad 1 8 55 0 180 111 35517 Jalna 1 0 32 0 71 74 17818 Parbhani 2 3 73 0 111 84 27319 Hingoli 0 0 0 0 0 0 020 Beed 1 3 57 0 240 75 37621 Nanded 1 8 71 0 200 72 35222 Osmanabad 1 0 50 0 128 93 27223 Latur 0 0 50 0 314 101 46524 Buldhana 1 0 35 8 163 57 26425 Akola 1 2 16 6 295 110 43026 Washim 0 0 0 0 0 027 Amaravati 1 8 24 11 252 169 4628 Yavatmal 1 16 35 8 215 95 37029 Wardha 2 2 2 7 152 53 21830 Nagpur 5 4 17 30 442 152 65031 Bhandara 3 7 54 12 250 121 44732 Gondia 0 0 0 0 0 0 033 Chandrapur 3 6 22 4 193 84 31234 Gadchiroli 1 23 10 0 74 60 168
Maharashtra 59 212 616 213 8348 3645 13093
Note: Figures for newly formed districts i.e. Nandurbar, Hingoli, Washim and Gondia are not available, hence combined figures are given for undivided districts viz. Dhule, Parbhani, Akola and Bhandara respectively.
# Includes Mumbai City and Mumbai Suburban District.Source: Directorate of Education, Pune.
230 Human Development Report Maharashtra 2002

EducationTable 67
Management-wise Number of Secondary and Higher Secondary Schools (2000)
Sr. No. District
CentralGovernment
StateGovernment
ZillaParishad
MunicipalCouncils
PrivateTotal(Aided) (Unaided)
1 2 3 4 5 6 7 8 9 1 Mumbai # 9 2 0 51 759 403 1224 2 Thane 3 38 2 10 427 319 799 3 Raigad 1 7 0 4 239 70 321 4 Ratnagiri 0 0 1 0 257 44 302 5 Sindhudurg 0 0 0 0 168 19 187 6 Nashik 4 29 2 3 447 163 648 7 Dhule 0 23 0 2 275 24 324 8 Nandurbar 1 49 0 2 119 33 204 9 Jalgaon 2 14 1 9 414 77 51710 Ahmednagar 4 14 0 1 449 171 63911 Pune 11 12 0 34 629 235 92112 Satara 2 1 1 1 424 94 52313 Sangli 0 0 0 1 386 89 47614 Solapur 1 1 1 8 474 152 63715 Kolhapur 1 1 4 3 484 154 64716 Aurangabad 2 9 55 0 245 95 40617 Jalna 1 0 32 0 115 40 18818 Parbhani 2 0 42 0 121 23 18819 Hingoli 0 3 30 0 50 38 12120 Beed 1 6 57 0 273 98 43521 Nanded 1 9 71 0 266 53 40022 Osmanabad 1 0 50 0 190 62 30323 Latur 0 0 50 0 371 56 47724 Buldhana 1 0 35 8 208 48 30025 Akola 0 1 11 3 220 56 29126 Washim 1 1 5 3 156 35 20127 Amaravati 1 11 24 12 397 56 50128 Yavatmal 1 18 35 7 270 71 40229 Wardha 2 4 2 7 183 33 23130 Nagpur 5 3 16 24 513 134 69531 Bhandara 1 2 32 5 170 27 23732 Gondia 1 11 22 6 150 36 22633 Chandrapur 3 12 21 4 247 57 34434 Gadchiroli 1 32 10 0 122 27 192
Maharashtra 64 313 612 268 10218 3092 14507
# Includes Mumbai City and Mumbai Suburban District.Source: Directorate of Education, Pune.
Annexure Tables 231

EducationTable 68
Number of Teachers in Secondary and Higher Secondary Schools and Teacher-Pupil Ratio (1990)
Sr. No. District
Secondary Higher Secondary Total Teacher-Pupil Ratio
Total Female Total Female Total Female Sec. High. Sec. Total
1 2 3 4 5 6 7 8 9 10 11 1 Mumbai # 19379 12828 6085 3540 25464 16368 31 32 32 2 Thane 6885 3640 3107 1505 9992 5145 33 35 34 3 Raigad 2559 733 1999 623 4558 1356 27 29 23 4 Ratnagiri 2311 478 839 183 3150 661 26 30 27 5 Sindhudurg 1479 344 912 184 2391 528 25 30 27 6 Nashik 5727 1674 2969 666 8696 2340 32 35 33 7 Dhule 3289 573 2944 406 6233 979 29 33 31 8 Nandurbar – – – – – – – – – 9 Jalgaon 4357 671 2739 461 7096 1132 32 35 3310 Ahmednagar 5032 1017 2934 558 7966 1575 32 34 3311 Pune 6874 3101 6363 2527 13237 5628 32 34 3312 Satara 4629 1072 2404 443 7033 1515 28 30 2913 Sangli 3633 747 1627 271 5260 1018 30 32 3014 Solapur 4451 905 2019 359 6470 1264 30 32 3115 Kolhapur 4953 930 1460 259 6413 1189 30 35 3116 Aurangabad 3346 1058 315 59 3661 1117 33 40 3417 Jalna 1348 211 326 66 1674 277 32 38 3318 Parbhani 2556 379 708 162 3264 541 33 36 3319 Hingoli – – – – – – – – –20 Beed 3013 451 683 73 3696 524 30 35 3021 Nanded 2790 443 1380 188 4170 631 32 37 3322 Osmanabad 2266 341 755 95 3021 436 30 32 3023 Latur 3671 467 970 132 4641 599 30 32 30,24 Buldhana 1948 221 1685 207 3633 428 32 35 3325 Akola 3223 751 2114 305 5337 1056 30 35 3226 Washim – – – – – – – – –27 Amaravati 3586 1004 2362 532 5948 1536 33 35 3328 Yavatmal 2323 395 1620 268 3943 663 31 36 3329 Wardha 1615 439 1676 310 3291 749 32 36 3430 Nagpur 6773 2783 3995 1431 10768 4214 30 33 3131 Bhandara 3346 587 2346 419 5692 1006 30 34 3232 Gondia – – – – – – – – –33 Chandrapur 2453 518 1433 331 3886 849 33 37 3534 Gadchiroli 702 111 556 83 1258 194 28 35 31
Maharashtra 120517 38872 61325 16646 181842 55518 28 35 32
Note: Figures for newly formed districts i.e. Nandurbar, Hingoli, Washim and Gondia are not available, hence combined figures are given for undivided districts viz. Dhule, Parbhani, Akola and Bhandara respectively.
# Includes Mumbai City and Mumbai Suburban District.Source: Directorate of Education, Pune.
232 Human Development Report Maharashtra 2002

EducationTable 69
Number of Teachers in Secondary and Higher Secondary Schools and Teacher-Pupil Ratio (1995)
Sr. No. District
Secondary Higher Secondary Total Teacher-Pupil Ratio
Total Female Total Female Total Female Sec. High. Sec. Total
1 2 3 4 5 6 7 8 9 10 11 1 Mumbai # 21257 14474 7379 4306 28636 18780 33 33 33 2 Thane 10411 5596 3531 1559 13942 7155 31 40 33 3 Raigad 2837 911 2523 820 5360 1731 28 32 30 4 Ratnagiri 2057 434 1255 266 3312 700 27 32 29 5 Sindhudurg 1383 326 1039 195 2422 521 26 29 27 6 Nashik 6252 1913 3896 767 10148 2680 34 38 36 7 Dhule 3709 653 3751 545 7460 1198 29 35 32 8 Nandurbar – – – – – – – – – 9 Jalgaon 4604 788 3563 581 8167 1369 33 35 3410 Ahmednagar 5847 1319 3914 726 9761 2045 34 39 3611 Pune 7339 3261 7218 2883 14557 6144 39 38 3812 Satara 4723 1089 2942 597 7665 1686 29 33 3113 Sangli 3715 820 2533 586 6248 1406 31 33 3214 Solapur 6859 1922 2683 554 9542 2476 25 35 2815 Kolhapur 5109 1022 2615 462 7724 1484 31 36 3316 Aurangabad 3072 909 1210 380 4282 1289 38 42 3917 Jalna 1550 239 676 120 2226 359 35 48 3918 Parbhani 2803 339 951 211 3754 550 28 44 3219 Hingoli – – – – – – – – –20 Beed 3862 520 1365 232 5227 752 27 32 2821 Nanded 3256 557 1932 257 5188 814 35 42 3722 Osmanabad 2470 282 1221 155 3691 437 27 31 2923 Latur 3037 337 1448 135 4485 472 28 32 2924 Buldhana 2189 253 2082 305 4271 558 32 39 3625 Akola 3230 724 2958 502 6188 1226 33 37 3526 Washim – – – – – – – – –27 Amaravati 3871 1115 3513 762 7384 1877 34 26 3028 Yavatmal 2587 479 2025 417 4612 896 31 35 3329 Wardha 1802 469 1883 435 3685 904 30 35 3230 Nagpur 7603 3184 4685 1764 12288 4948 30 34 3131 Bhandara 3436 713 3685 692 7121 1405 31 40 3532 Gondia – – – – – – – – –33 Chandrapur 2734 607 2218 582 4952 1189 33 34 3434 Gadchiroli 1134 168 1058 169 2192 337 27 33 30
Maharashtra 134738 45423 81752 21965 216490 67388 31 36 34
Note: Figures for newly formed districts i.e. Nandurbar, Hingoli, Washim and Gondia are not available, hence combined figures are given for undivided districts viz. Dhule, Parbhani, Akola and Bhandara respectively.
# Includes Mumbai City and Mumbai Suburban District.Source: Directorate of Education, Pune.
Annexure Tables 233

EducationTable 70
Number of Teachers in Secondary and Higher Secondary Schools and Teacher-Pupil Ratio (2000)
Sr. No. District
Secondary Higher Secondary Total Teacher-Pupil Ratio
Total Female Total Female Total Female Sec. High. Sec. Total
1 2 3 4 5 6 7 8 9 10 11 1 Mumbai # 22321 14778 7663 4501 29984 19279 35 34 35 2 Thane 9210 4885 4510 2217 13720 7102 37 43 39 3 Raigad 3100 946 2583 783 5683 1729 32 37 34 4 Ratnagiri 2314 530 1431 312 3745 842 29 36 31 5 Sindhudurg 1495 369 958 209 2453 578 27 33 29 6 Nashik 6390 1940 3965 894 10355 2834 36 41 38 7 Dhule 2835 467 2806 472 5641 939 28 35 32 8 Nandurbar 1503 166 1252 225 2755 391 28 36 32 9 Jalgaon 6906 1037 3926 606 10832 1643 34 41 3710 Ahmednagar 6297 1303 4556 913 10853 2216 36 38 3711 Pune 9384 3552 7529 3014 16913 6566 33 38 3512 Satara 5217 1239 3260 740 8477 1979 31 35 3213 Sangli 4006 960 2804 699 6810 1659 32 39 3514 Solapur 6097 1165 2881 550 8978 1715 35 40 3615 Kolhapur 5846 1293 3113 592 8959 1885 32 39 3416 Aurangabad 4199 1252 1457 501 5656 1753 37 44 3917 Jalna 1810 253 935 177 2745 430 37 43 3918 Parbhani 1820 248 1008 240 2828 488 35 39 3619 Hingoli 1204 105 452 63 1656 168 34 39 3520 Beed 4097 574 1626 212 5723 786 34 42 3621 Nanded 3813 640 2313 327 6126 967 37 41 3922 Osmanabad 2513 305 1180 157 3693 462 32 37 3423 Latur 3702 631 2717 343 6419 974 33 37 3524 Buldhana 2325 267 2593 359 4918 626 38 41 4025 Akola 2204 644 2129 457 4333 1101 34 38 3626 Washim 1119 164 1304 174 2423 338 35 43 3927 Amaravati 3422 1036 3604 1072 7026 2108 33 36 3428 Yavatmal 2897 558 2015 499 4912 1057 34 39 3629 Wardha 1935 544 1949 516 3884 1060 31 36 3430 Nagpur 7250 3238 4911 1749 12161 4987 31 33 3231 Bhandara 1084 172 2424 548 3508 720 30 38 3532 Gondia 1726 334 1595 274 3321 608 29 40 3433 Chandrapur 3112 807 2366 581 5478 1388 35 38 3634 Gadchiroli 1283 190 1239 169 2522 359 31 36 33
Maharashtra 144436 46592 91054 25145 235490 71737 34 38 35
# Includes Mumbai City and Mumbai Suburban District.Source: Directorate of Education, Pune.
234 Human Development Report Maharashtra 2002
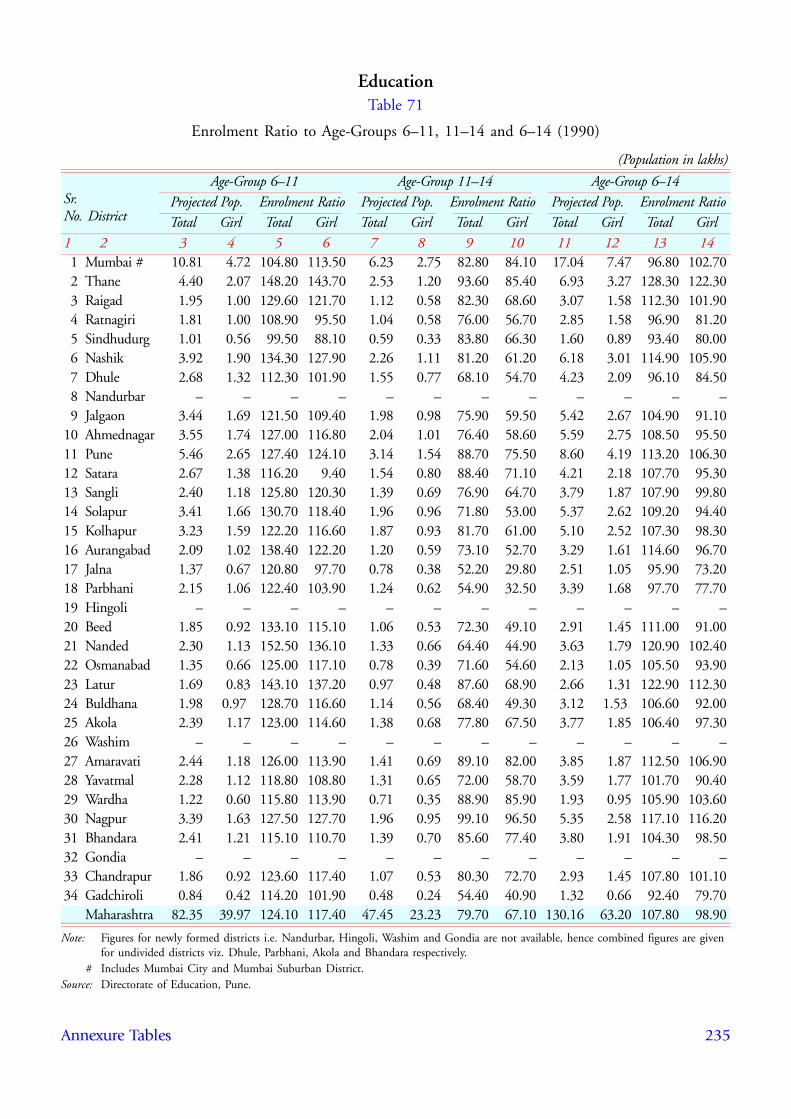
EducationTable 71
Enrolment Ratio to Age-Groups 6–11, 11–14 and 6–14 (1990)
(Population in lakhs)
Sr. No. District
Age-Group 6–11 Age-Group 11–14 Age-Group 6–14Projected Pop. Enrolment Ratio Projected Pop. Enrolment Ratio Projected Pop. Enrolment RatioTotal Girl Total Girl Total Girl Total Girl Total Girl Total Girl
1 2 3 4 5 6 7 8 9 10 11 12 13 14 1 Mumbai # 10.81 4.72 104.80 113.50 6.23 2.75 82.80 84.10 17.04 7.47 96.80 102.70 2 Thane 4.40 2.07 148.20 143.70 2.53 1.20 93.60 85.40 6.93 3.27 128.30 122.30 3 Raigad 1.95 1.00 129.60 121.70 1.12 0.58 82.30 68.60 3.07 1.58 112.30 101.90 4 Ratnagiri 1.81 1.00 108.90 95.50 1.04 0.58 76.00 56.70 2.85 1.58 96.90 81.20 5 Sindhudurg 1.01 0.56 99.50 88.10 0.59 0.33 83.80 66.30 1.60 0.89 93.40 80.00 6 Nashik 3.92 1.90 134.30 127.90 2.26 1.11 81.20 61.20 6.18 3.01 114.90 105.90 7 Dhule 2.68 1.32 112.30 101.90 1.55 0.77 68.10 54.70 4.23 2.09 96.10 84.50 8 Nandurbar – – – – – – – – – – – – 9 Jalgaon 3.44 1.69 121.50 109.40 1.98 0.98 75.90 59.50 5.42 2.67 104.90 91.1010 Ahmednagar 3.55 1.74 127.00 116.80 2.04 1.01 76.40 58.60 5.59 2.75 108.50 95.5011 Pune 5.46 2.65 127.40 124.10 3.14 1.54 88.70 75.50 8.60 4.19 113.20 106.3012 Satara 2.67 1.38 116.20 9.40 1.54 0.80 88.40 71.10 4.21 2.18 107.70 95.3013 Sangli 2.40 1.18 125.80 120.30 1.39 0.69 76.90 64.70 3.79 1.87 107.90 99.8014 Solapur 3.41 1.66 130.70 118.40 1.96 0.96 71.80 53.00 5.37 2.62 109.20 94.4015 Kolhapur 3.23 1.59 122.20 116.60 1.87 0.93 81.70 61.00 5.10 2.52 107.30 98.3016 Aurangabad 2.09 1.02 138.40 122.20 1.20 0.59 73.10 52.70 3.29 1.61 114.60 96.7017 Jalna 1.37 0.67 120.80 97.70 0.78 0.38 52.20 29.80 2.51 1.05 95.90 73.2018 Parbhani 2.15 1.06 122.40 103.90 1.24 0.62 54.90 32.50 3.39 1.68 97.70 77.7019 Hingoli – – – – – – – – – – – –20 Beed 1.85 0.92 133.10 115.10 1.06 0.53 72.30 49.10 2.91 1.45 111.00 91.0021 Nanded 2.30 1.13 152.50 136.10 1.33 0.66 64.40 44.90 3.63 1.79 120.90 102.4022 Osmanabad 1.35 0.66 125.00 117.10 0.78 0.39 71.60 54.60 2.13 1.05 105.50 93.9023 Latur 1.69 0.83 143.10 137.20 0.97 0.48 87.60 68.90 2.66 1.31 122.90 112.3024 Buldhana 1.98 0.97 128.70 116.60 1.14 0.56 68.40 49.30 3.12 1.53 106.60 92.0025 Akola 2.39 1.17 123.00 114.60 1.38 0.68 77.80 67.50 3.77 1.85 106.40 97.3026 Washim – – – – – – – – – – – –27 Amaravati 2.44 1.18 126.00 113.90 1.41 0.69 89.10 82.00 3.85 1.87 112.50 106.9028 Yavatmal 2.28 1.12 118.80 108.80 1.31 0.65 72.00 58.70 3.59 1.77 101.70 90.4029 Wardha 1.22 0.60 115.80 113.90 0.71 0.35 88.90 85.90 1.93 0.95 105.90 103.6030 Nagpur 3.39 1.63 127.50 127.70 1.96 0.95 99.10 96.50 5.35 2.58 117.10 116.2031 Bhandara 2.41 1.21 115.10 110.70 1.39 0.70 85.60 77.40 3.80 1.91 104.30 98.5032 Gondia – – – – – – – – – – – –33 Chandrapur 1.86 0.92 123.60 117.40 1.07 0.53 80.30 72.70 2.93 1.45 107.80 101.1034 Gadchiroli 0.84 0.42 114.20 101.90 0.48 0.24 54.40 40.90 1.32 0.66 92.40 79.70
Maharashtra 82.35 39.97 124.10 117.40 47.45 23.23 79.70 67.10 130.16 63.20 107.80 98.90
Note: Figures for newly formed districts i.e. Nandurbar, Hingoli, Washim and Gondia are not available, hence combined figures are given for undivided districts viz. Dhule, Parbhani, Akola and Bhandara respectively.
# Includes Mumbai City and Mumbai Suburban District.Source: Directorate of Education, Pune.
Annexure Tables 235

EducationTable 72
Enrolment Ratio to Age-Groups 6–11, 11–14 and 6–14 (1995)
(Population in lakhs)
Sr. No. District
Age-Group 6–11 Age-Group 11–14 Age-Group 6–14Projected Pop. Enrolment Ratio Projected Pop. Enrolment Ratio Projected Pop. Enrolment RatioTotal Girl Total Girl Total Girl Total Girl Total Girl Total Girl
1 2 3 4 5 6 7 8 9 10 11 12 13 14 1 Mumbai # 91.58 5.58 102.2 900.2 7.28 3.43 133.7 81.3 18.86 9.01 95.1 93.0 2 Thane 8.25 4.07 101.2 95.3 5.10 2.43 65.1 63.0 13.35 6.50 87.4 83.2 3 Raigad 2.72 1.38 102.2 87.1 1.75 0.86 62.3 57.0 4.47 2.24 86.6 81.7 4 Ratnagiri 2.01 1.01 98.0 95.0 1.54 0.76 59.1 52.6 3.55 1.77 81.1 76.8 5 Sindhudurg 1.12 0.56 82.1 80.4 0.83 0.41 57.8 56.1 1.95 0.97 71.8 70.1 6 Nashik 5.74 2.77 95.5 92.8 3.76 1.78 62.8 58.4 9.50 4.55 82.5 79.3 7 Dhule 3.95 1.93 85.2 80.8 2.49 1.18 48.6 44.1 6.44 3.11 71.0 66.9 8 Nandurbar – – – – – – – – – – – – 9 Jalgaon 4.56 2.19 96.7 90.9 3.13 1.49 53.4 46.3 7.69 3.68 79.1 72.810 Ahmednagar 4.97 2.46 105.4 101.6 3.44 1.68 57.8 50.6 8.41 4.14 86.0 80.911 Pune 7.92 3.84 99.5 98.4 5.34 2.59 67.0 61.4 13.26 6.43 86.4 83.512 Satara 3.43 1.68 93.3 91.7 2.41 1.19 66.0 59.7 5.84 2.87 82.0 78.413 Sangli 3.06 1.51 103.6 100.0 2.22 1.10 60.8 55.5 5.28 2.61 85.6 81.214 Solapur 4.68 2.31 106.2 100.0 3.24 1.57 52.8 41.4 7.92 3.88 84.3 76.315 Kolhapur 6.24 3.06 61.4 60.1 2.94 1.44 63.9 58.3 9.18 4.50 62.2 59.616 Aurangabad 3.39 1.65 118.3 110.9 2.24 1.07 46.7 65.0 5.63 2.72 93.6 85.717 Jalna 2.16 1.06 98.6 89.6 1.42 0.69 43.3 30.4 3.58 1.75 76.5 66.318 Parbhani 4.18 2.09 83.7 78.0 3.02 1.46 31.8 24.0 7.20 3.55 61.9 55.819 Hingoli – – – – – – – – – – – –20 Beed 2.82 1.41 102.5 95.7 1.97 0.95 48.2 40.0 4.79 2.36 80.2 73.321 Nanded 4.01 1.98 103.7 100.5 2.66 1.30 46.2 37.7 6.67 3.28 80.8 75.622 Osmanabad 1.89 0.95 104.2 101.1 1.34 0.65 54.5 47.7 3.23 1.60 83.6 79.423 Latur 2.55 1.28 118.4 115.6 1.80 0.89 51.1 46.1 4.35 2.17 90.6 87.124 Buldhana 2.67 1.31 108.6 101.5 1.87 0.92 52.4 42.4 4.54 2.23 85.5 77.125 Akola 3.15 1.57 104.1 98.7 2.31 1.14 58.0 51.8 5.46 2.71 84.6 79.026 Washim – – – – – – – – – – – –27 Amaravati 2.94 1.44 120.1 113.9 2.22 1.10 62.2 58.2 5.16 2.54 95.2 89.828 Yavatmal 3.17 1.58 98.1 91.8 2.19 1.09 50.2 44.0 5.36 2.67 78.5 72.329 Wardha 1.36 0.67 106.6 103.3 1.02 0.51 65.7 64.7 2.38 1.18 89.1 86.430 Nagpur 4.62 2.27 98.7 96.5 3.25 1.59 67.7 65.4 7.87 3.86 85.9 83.731 Bhandara 2.98 1.48 98.3 97.3 1.89 0.93 79.9 78.5 4.87 2.41 91.2 90.032 Gondia – – – – – – – – – – – –33 Chandrapur 2.75 1.39 90.5 86.3 1.75 0.87 62.9 59.8 4.50 2.26 79.8 76.134 Gadchiroli 1.21 0.61 101.7 96.7 0.79 0.39 54.4 46.2 2.00 1.00 83.0 77.0
Maharashtra 116.08 57.09 98.7 94.7 77.21 37.46 60.4 54.7 193.29 94.55 83.4 78.9
Note: Figures for newly formed districts i.e. Nandurbar, Hingoli, Washim and Gondia are not available, hence combined figures are given for undivided districts viz. Dhule, Parbhani, Akola and Bhandara respectively.
# Includes Mumbai City and Mumbai Suburban District.Source: Directorate of Education, Pune.
236 Human Development Report Maharashtra 2002

EducationTable 73
Enrolment Ratio to Age-Groups 6–11, 11–14 and 6–14 (2000)
(Population in lakhs)
Sr. No. District
Age-Group 6–11 Age-Group 11–14 Age-Group 6–14Projected Pop. Enrolment Ratio Projected Pop. Enrolment Ratio Projected Pop. Enrolment RatioTotal Girl Total Girl Total Girl Total Girl Total Girl Total Girl
1 2 3 4 5 6 7 8 9 10 11 12 13 14 1 Mumbai # 11.77 5.70 94.00 92.30 6.41 3.05 97.50 94.10 18.18 3.75 95.30 92.90 2 Thane 8.77 4.25 97.00 93.90 4.22 1.99 88.20 86.40 12.99 6.24 94.10 91.50 3 Raigad 2.55 1.60 113.30 111.10 1.35 0.62 89.60 90.30 3.90 1.88 105.10 104.20 4 Ratnagiri 1.93 0.97 99.50 96.90 1.19 0.57 83.20 78.90 3.12 1.54 93.30 89.60 5 Sindhudurg 0.98 0.48 86.70 85.40 0.51 0.25 92.10 92.00 0.14 0.73 89.30 87.70 6 Nashik 6.42 3.11 98.10 95.80 3.09 1.46 87.00 82.90 9.51 4.57 94.40 91.70 7 Dhule 4.15 2.02 91.80 89.10 1.96 0.94 70.90 65.90 6.11 2.96 85.10 81.80 8 Nandurbar – – – – – – – – – – – – 9 Jalgaon 5.01 2.39 95.20 91.60 2.45 1.16 89.40 84.50 7.46 3.55 93.30 89.0010 Ahmednagar 5.12 2.51 102.90 100.80 2.51 1.20 86.80 80.80 7.63 3.71 97.80 94.3011 Pune 8.08 3.96 94.00 92.20 4.10 2.00 92.90 88.50 12.18 5.96 93.70 91.1012 Satara 3.27 1.62 98.20 95.10 1.93 0.91 84.40 82.40 5.20 2.53 93.00 90.5013 Sangli 3.01 1.46 97.90 92.90 1.45 0.71 102.00 98.20 4.46 2.17 102.00 98.2014 Solapur 5.00 2.42 101.20 99.60 2.28 1.09 91.20 82.60 7.28 3.51 98.00 94.3015 Kolhapur 3.19 1.92 97.50 94.30 2.16 1.04 92.60 89.40 6.06 2.96 95.90 92.9016 Aurangabad 4.06 1.95 107.90 107.70 1.72 0.80 96.50 93.80 5.78 2.75 104.30 103.6017 Jalna 2.78 1.39 94.60 91.30 1.10 0.51 69.00 60.80 3.88 1.90 87.40 83.2018 Parbhani 3.39 1.68 122.40 117.20 1.40 0.65 90.00 81.50 4.79 2.33 112.90 107.7019 Hingoli – – – – – – – – – – – –20 Beed 2.97 1.47 116.80 114.30 1.24 0.58 100.00 91.40 4.21 2.05 111.90 107.8021 Nanded 4.36 2.15 103.90 100.50 1.77 0.82 83.60 82.90 6.13 2.97 98.40 95.6022 Osmanabad 1.99 0.98 102.50 101.00 0.94 0.45 88.30 84.40 0.29 0.14 97.90 95.8023 Latur 2.86 1.44 113.30 113.90 1.38 0.65 92.00 92.30 4.24 2.09 106.40 107.2024 Buldhana 2.96 1.46 103.00 100.00 1.48 0.69 82.40 76.80 4.44 2.15 96.00 93.0025 Akola 3.28 1.60 111.30 107.50 1.68 0.80 91.10 87.50 4.96 2.40 104.40 100.8026 Washim – – – – – – – – – – – –27 Amaravati 2.90 1.42 138.30 137.30 1.61 0.78 95.00 91.00 4.51 2.20 122.80 120.9028 Yavatmal 3.19 1.54 103.40 101.30 1.54 0.75 80.50 74.70 4.73 2.29 96.00 93.0029 Wardha 1.38 0.67 98.50 98.50 0.68 0.35 101.40 97.10 2.06 1.02 99.50 98.3030 Nagpur 4.45 2.17 102.20 101.40 2.50 1.23 92.00 91.10 6.95 3.14 98.60 97.6031 Bhandara 2.73 1.34 101.80 101.50 1.51 0.75 92.00 90.70 4.24 2.09 9.30 97.6032 Gondia – – – – – – – – – – – –33 Chandrapur 2.50 1.19 100.40 102.50 1.31 0.65 98.30 87.70 3.81 1.84 96.60 97.3034 Gadchiroli 1.19 0.60 107.60 101.70 0.63 0.31 80.90 77.40 1.82 0.91 98.90 93.40
Maharashtra 117.00 57.12 101.90 99.70 58.10 27.76 90.60 85.80 175.10 84.88 97.80 95.20
Note: Figures for newly formed districts i.e. Nandurbar, Hingoli, Washim and Gondia are not available, hence combined figures are given for undivided districts viz. Dhule. Parbhani, Akola and Bhandara respectively.
# Includes Mumbai City and Mumbai Suburban District.Source: Directorate of Education, Pune.
Annexure Tables 237

EducationTable 74
Senior Colleges, their Enrolment and Number of Teachers
Sr. No. District
Enrolment Teachers
No. of Colleges Total Girls Total Females
1 2 3 4 5 6 7 1 Mumbai # 80 218372 109097 5853 3231 2 Thane 27 51864 24592 1376 567 3 Raigad 12 8876 3102 335 37 4 Ratnagiri 5 7164 3066 215 38 5 Sindhudurg 6 6393 2527 237 19 6 Nashik 25 49779 14530 1383 140 7 Dhule 18 44469 12236 970 107 8 Nandurbar – – – – – 9 Jalgaon 24 32415 7194 1272 16010 Ahmednagar 22 41352 9697 1327 24011 Pune 48 83637 32463 2345 70212 Satara 23 32657 8518 1218 15113 Sangli 26 26755 8645 1117 19014 Solapur 25 35380 9805 1131 14915 Kolhapur 35 41256 10741 1524 23516 Aurangabad 23 34069 7867 1054 27517 Jalna 5 5972 1312 198 2118 Parbhani 12 14742 2595 522 4619 Hingoli – – – – –20 Beed 18 21444 3862 661 6921 Nanded 19 27258 4684 743 9522 Osmanabad 13 11930 2165 442 3223 Latur 14 21961 3931 701 6024 Buldhana 12 11023 2626 313 3425 Akola 19 26271 8192 681 15626 Washim – – – – –27 Amaravati 25 31874 11981 1018 26428 Yavatmal 18 17469 5283 537 7829 Wardha 12 14332 5434 352 5630 Nagpur 43 60693 26091 1845 65731 Bhandara 14 15023 5062 396 8832 Gondia – – – – –33 Chandrapur 17 21822 5845 531 7034 Gadchiroli 10 3776 627 105 3
Maharashtra 650 1020028 353770 30402 7970
Note: Figures for newly formed districts i.e. Nandurbar, Hingoli, Washim and Gondia are not available, hence combined figures are given for undivided districts viz. Dhule, Parbhani, Akola and Bhandara respectively.
# Includes Mumbai City and Mumbai Suburban District.Source: Directorate of Education, Pune.
238 Human Development Report Maharashtra 2002

EducationTable 75
Senior Colleges, their Enrolment and Number of Teachers (1995)
Sr. No. District
No. ofColleges
Enrolment Teachers
Total Girls S.C. S.T. Total Female
1 2 3 4 5 6 7 8 9 1 Mumbai # 83 136069 69703 7507 663 3682 1938 2 Thane 30 40535 21001 2517 1055 1124 450 3 Raigad 17 10514 4300 514 95 376 56 4 Ratnagiri 8 4683 2243 315 1 178 23 5 Sindhudurg 7 5125 2325 263 5 190 17 6 Nashik 33 40850 15622 3338 1897 1166 250 7 Dhule 28 18742 6603 1513 2639 944 110 8 Nandurbar – – – – – – – 9 Jalgaon 32 23405 8627 1805 506 1256 20510 Ahmednagar 27 31166 9482 2844 680 1040 8211 Pune 61 69250 29805 6409 907 2168 63512 Satara 29 27108 9688 2382 30 992 13613 Sangli 30 19383 7626 1817 54 930 17014 Solapur 30 28662 8403 3336 130 959 15615 Kolhapur 44 33155 10996 2923 104 1340 19016 Aurangabad 24 23173 6282 4577 450 611 14617 Jalna 8 5594 1249 568 37 199 3118 Parbhani 14 12536 2784 1946 264 399 2319 Hingoli – – – – – – –20 Beed 22 18901 4107 2765 55 534 6021 Nanded 22 31808 6062 7729 1815 738 7622 Osmanabad 15 11432 2488 1777 79 393 2723 Latur 19 16436 3452 2837 152 584 4324 Buldhana 14 6841 1971 1000 95 233 3125 Akola 22 16281 6309 2765 459 482 8926 Washim – – – – – – –27 Amaravati 36 24406 10640 4217 650 728 18728 Yavatmal 22 13489 4582 2107 667 420 7129 Wardha 16 13975 5932 2822 651 326 5530 Nagpur 54 40818 20471 9488 2994 1335 48031 Bhandara 22 13187 4329 3351 877 436 10332 Gondia – – – – – – –33 Chandrapur 21 14677 5147 3851 1063 440 6934 Gadchiroli 13 3881 1045 934 574 130 11
Maharashtra 803 756082 293274 90217 19648 24333 5920
Note: Figures for newly formed districts i.e. Nandurbar, Hingoli, Washim and Gondia are not available, hence combined figures are given for undivided districts viz. Dhule, Parbhani, Akola and Bhandara respectively.
# Includes Mumbai City and Mumbai Suburban District.Source: Directorate of Education, Pune.
Annexure Tables 239

EducationTable 76
Junior and Senior Colleges, their Enrolment and Number of Teachers (2000)
Sr. No. District
No. ofColleges
Enrolment
Total Girls S.C. S.T. Total Female
1 2 3 4 5 6 7 8 9 1 Mumbai # 88 269582 150070 15843 1892 6083 3569
2 Thane 39 73421 38898 4749 1642 1739 770
3 Raigad 20 15500 6976 1128 299 575 124 4 Ratnagiri 14 11574 5182 937 10 392 76
5 Sindhudurg 9 7498 3489 493 10 285 27 6 Nashik 34 65867 25272 5548 2937 1650 333
7 Dhule 23 21157 7466 1782 1503 875 116
8 Nandurbar 12 10483 3182 980 3108 430 39 9 Jalgaon 33 56995 21058 4365 1177 1763 269
10 Ahmednagar 28 53870 18384 5030 1193 1765 201
11 Pune 64 112676 50965 10224 1832 3691 113012 Satara 31 47103 17872 4161 174 1445 265
13 Sangli 32 36702 15212 3557 65 1446 28314 Solapur 31 45004 14383 5948 232 1286 175
15 Kolhapur 48 60055 21164 5597 56 1930 364
16 Aurangabad 26 52247 17075 10546 821 1227 41117 Jalna 10 11341 2324 1468 102 293 41
18 Parbhani 14 13999 4186 1994 178 539 42
19 Hingoli 3 4566 1004 745 128 138 2320 Beed 23 39766 10033 6083 263 1019 124
21 Nanded 22 25616 6918 6060 1795 869 10722 Osmanabad 16 22415 6268 3431 336 716 61
23 Latur 21 23462 6817 3881 286 941 96
24 Buldhana 18 13215 4409 2282 242 339 4825 Akola 15 22869 9646 3992 845 541 133
26 Washim 9 7760 2109 2847 728 622 119
27 Amaravati 39 33267 16487 6240 1332 1025 29728 Yavatmal 22 23138 8806 2497 959 196 17
29 Wardha 18 13928 6900 2943 1221 317 6730 Nagpur 59 73739 37289 17713 4596 1889 733
31 Bhandara 12 13125 5180 3284 943 268 46
32 Gondia 10 10495 4360 2141 538 230 6333 Chandrapur 23 29549 11445 8714 2105 769 135
34 Gadchiroli 14 6015 2187 1384 1159 195 22
Maharashtra 880 1327999 563016 158587 34707 37488 10326
# Includes Mumbai City and Mumbai Suburban District.Source: Directorate of Education, Pune.
240 Human Development Report Maharashtra 2002

EducationTable 77
District-wise Literacy Percentage for the Years 1961, 1971, 1981, 1991 and 2001
Sr. No. District
l961 1971 1991
Persons Males Females Persons Males Females Persons Males Females
1 2 3 4 5 6 7 8 9 10 11 1 Mumbai # 56.60 65.10 48.81 63.84 69.65 55.72 68.18 73.19 60.75 2 Thane 30.54 41.09 19.06 40.65 50.34 29.80 50.50 59.64 40.15 3 Raigad 24.56 36.37 13.40 35.32 47.25 24.03 45.59 57.42 34.27 4 Ratnagiri 28.49 42.16 17.44 39.83 52.52 29.64 47.75 59.62 38.15 5 Sindhudurg – – – – – – – – – 6 Nashik 26.89 39.36 13.71 36.30 48.45 23.37 44.36 56.09 31.85 7 Dhule 25.15 37.43 12.45 31.89 42.96 20.30 37.51 48.61 26.01 8 Nandurbar – – – – – – – – – 9 Jalgaon 34.01 49.32 18.02 45.24 58.44 31.32 48.14 61.19 34.3910 Ahmednagar 26.45 39.36 13.03 36.23 48.97 22.91 43.16 56.51 29.2411 Pune 34.31 46.18 21.74 44.62 56.30 32.10 54.03 65.16 42.1412 Satara 33.98 47.41 21.16 38.32 52.38 24.77 48.15 61.39 35.6713 Sangli 28.07 21.88 13.64 37.48 50.98 23.24 46.87 59.70 33.6014 Solapur 25.15 36.89 12.60 33.90 46.40 20.49 40.68 53.61 26.9615 Kolhapur 26.30 40.09 12.04 35.37 49.78 20.34 45.36 59.45 30.7916 Aurangabad 17.88 28.65 6.67 28.49 42.14 14.02 35.80 50.80 19.9617 Jalna – – – – – – – – –18 Parbhani 15.37 25.27 5.19 24.31 36.85 11.25 30.33 44.67 15.5319 Hingoli – – – – – – – – –20 Beed 15.09 24.60 5.27 24.01 36.25 11.17 31.79 45.82 17.2721 Nanded 15.14 24.83 5.16 22.78 34.64 10.36 29.78 43.32 15.6722 Osmanabad 17.05 27.52 6.02 27.88 40.34 14.70 35.36 48.73 21.4023 Latur – – – – – – – – –24 Buldhana 26.99 41.15 12.22 37.34 51.33 22.68 44.64 58.68 29.9725 Akola 31.20 44.81 16.69 39.55 51.84 26.48 47.82 59.54 35.4526 Washim – – – – – – – – –27 Amaravati 33.68 45.91 25.07 42.36 52.28 31.69 51.82 60.50 42.5528 Yavatmal 23.48 35.34 11.27 31.60 42.87 19.88 39.29 51.21 26.8629 Wardha 30.45 43.44 16.98 41.71 52.55 30.29 51.05 61.01 40.5330 Nagpur 35.15 48.06 21.26 45.26 56.09 33.51 54.56 63.74 44.6231 Bhandara 24.07 39.90 8.19 35.40 50.01 20.59 53.92 58.31 29.4932 Gondia – – – – – – – – –33 Chandrapur 17.27 28.58 5.79 26.77 38.63 14.54 34.69 46.73 22.2234 Gadchiroli – – – – – – – – –
Maharashtra 29.82 42.04 16.76 39.13 51.04 26.43 47.18 58.74 34.79
Note: Figures for newly formed districts i.e. Sindhudurg, Jalna, Latur, Gadchiroli, Nandurbar, Hingoli, Washim and Gondia are not available, hence combined figures are given for undivided districts viz. Ratnagiri, Aurangabad, Osmanabad, Chandrapur, Dhule, Parbhani, Akola and Bhandara respectively.
# Includes Mumbai City and Mumbai Suburban District.Source: Population Census.
Annexure Tables 241

EducationTable 77 (continued)
District-wise Literacy Percentage for the Years 1961, 1971, 1981, 1991 and 2001
Sr. No. District
1991 2001Persons Males Females Persons Males Females
1 2 12 13 14 15 16 17 1 Mumbai # 82.50 87.87 75.80 86.82 89.95 82.71 2 Thane 69.54 77.56 60.28 81.00 86.06 75.00 3 Raigad 63.95 75.94 52.20 77.32 86.40 68.06 4 Ratnagiri 62.70 76.64 15.61 75.35 86.28 65.98 5 Sindhudurg 75.81 86.23 55.87 80.52 90.21 71.67 6 Nashik 62.33 73.98 49.89 75.10 85.19 64.16 7 Dhule 51.22 63.13 38.78 72.08 81.90 61.76 8 Nandurbar – – – 56.06 66.32 45.55 9 Jalgaon 64.30 77.46 50.34 76.06 86.53 64.9510 Ahmednagar 61.03 75.30 45.99 75.82 86.21 64.8811 Pune 71.05 81.56 59.77 80.78 88.55 72.3212 Satara 66.67 80.61 53.35 78.52 88.45 68.7113 Sangli 62.61 74.83 49.94 76.70 86.25 66.8814 Solapur 56.39 70.08 41.73 71.50 82.28 60.6715 Kolhapur 66.94 80.33 53.08 77.23 87.67 66.3816 Aurangabad 58.98 72.93 39.64 73.63 85.07 61.2817 Jalna 46.25 64.43 27.30 64.52 79.17. 49.2518 Parbhani 47.58 64.90 29.41 67.04 80.58 52.9819 Hingoli – – – 66.86 81.11 51.9620 Beed 49.82 66.34 32.34 68.48 80.69 55.3821 Nanded 48.17 64.38 30.96 68.52 81.14 55.1222 Osmanabad 54.27 68.39 39.16 70.24 82.03 57.5523 Latur 55.57 70.47 39.74 72.34 83.63 60.2824 Buldhana 61.69 76.53 46.13 76.14 87.17 64.5525 Akola 65.83 77.63 53.28 81.77 89.22 73.8226 Washim – – – 74.03 86.01 61.3227 Amaravati 70.06 78.40 61.13 82.96 89.28 76.2128 Yavatmal 57.96 70.45 44.81 74.06 84.47 63.0129 Wardha 69.95 78.33 61.02 80.50 87.70 72.8030 Nagpur 73.64 81.79 52.74 84.18 90.25 77.6531 Bhandara 64.69 78.82 50.44 78.68 89.11 68.1132 Gondia – – – 78.65 89.54 67.8933 Chandrapur 59.41 71.30 46.81 73.07 83.19 62.5634 Gadchiroli 42 89 56.56 28.87 60.29 69.72 50.64
Maharashtra 64.87 76.56 52.32 77.27 86.27 67.51
Note: Figures for newly formed districts i.e. Nandurbar, Hingoli, Washim and Gondia are not available, hence combined figures are given for undivided districts viz. Dhule, Parbhani, Akola and Bhandara respectively.
# Includes Mumbai City and Mumbai Suburban District.Source: Population Census.
242 Human Development Report Maharashtra 2002

EducationTable 78
S.S.C. and H.S.C. Examination Results, March 2000
Sr. No. District
S.S.C.ExaminationAppeared Passed (per cent)
Boys Girls Total Boys Girls Total1 2 3 4 5 6 7 8 1 Mumbai # 89833 70711 160544 55.45 59.82 57.37 2 Thane 54103 41699 95802 52.54 56.90 54.43 3 Raigad 17172 11265 28437 42.69 44.05 43.23 4 Ratnagiri 12507 7735 20242 45.97 46.27 46.09 5 Sindhudurg 7599 5937 13536 42.95 41.87 42.48 6 Nashik 40860 25793 66653 52.06 60.59 55.36 7 Dhule 16317 9317 25634 55.78 65.91 59.46 8 Nandurbar 8164 4724 12888 65.38 72.08 67.84 9 Jalgaon 35610 18969 54579 50.31 61.47 54.1910 Ahmednagar 35851 20034 55885 50.37 57.08 52.7811 Pune 60042 41787 101829 49.04 54.97 51.4712 Satara 28510 17408 45918 50.42 55.87 52.4913 Sangli 24132 14338 38470 50.48 57.60 53.1314 Solapur 31184 15289 46473 48.63 55.79 50.9915 Kolhapur 35592 20453 56045 52.23 60.49 55.2516 Aurangabad 29507 15388 44895 43.30 56.84 47.9417 Jalna 12883 4861 17744 45.63 58.44 49.1418 Parbhani 20175 8508 28683 38.22 47.18 40.8719 Hingoli – – – – – –20 Beed 21162 10706 31868 61.18 72.21 64.8921 Nanded 24886 12825 37711 53.17 60.03 55.5122 Osmanabad 13885 7361 21246 40.50 45.10 42.0923 Latur 20435 11651 32086 33.91 94.44 55.8924 Buldhana 19381 9867 29248 45.48 49.68 46.9025 Akola 17599 12153 29752 41.45 48.88 44.4826 Washim 10305 5036 15341 59.13 64.81 60.9927 Amaravati 25501 21495 46996 40.37 46.27 43.0728 Yavatmal 20483 13851 34334 40.41 45.30 42.3829 Wardha 15996 13313 29309 29.83 33.62 31.5530 Nagpur 42886 40273 83159 37.15 36.35 36.7731 Bhandara 29219 24459 53678 37.45 37.48 37.4632 Gondia – – – – – –33 Chandrapur 22812 18239 41051 32.76 31.65 32.2734 Gadchiroli 9515 6151 15666 44.60 42.85 43.92
Maharashtra 854106 561596 1415702 47.45 53.34 49.78
Note: Figures for newly formed districts i.e. Hingoli and Gondia are not available, hence combined figures are given for undivided districts viz. Parbhani and Bhandara respectively.
# Includes Mumbai City and Mumbai Suburban District.Source: Population Census.
Annexure Tables 243

EducationTable 78 (continued)
S.S.C. and H.S.C. Examination Results, March 2000
Sr. No. District
H.S.C.ExaminationAppeared Passed (per cent)
Boys Girls Total Boys Girls Total1 2 9 10 11 12 13 14 1 Mumbai # 57176 48353 105529 71.33 80.57 75.57 2 Thane 23454 20187 43641 68.92 80.35 74.21 3 Raigad 7315 4871 12186 56.04 69.18 61.29 4 Ratnagiri 4162 2762 6924 66.10 76.03 70.06 5 Sindhudurg 3180 2444 5624 73.24 82.04 77.06 6 Nashik 23332 13538 36870 56.09 69.18 60.90 7 Dhule 11295 6171 17466 61.61 69.65 64.45 8 Nandurbar 6535 3091 9626 56.33 67.13 59.80 9 Jalgaon 18471 9374 27845 55.66 65.82 59.0810 Ahmednagar 17507 9477 26984 61.73 75.26 66.4811 Pune 32584 24098 56682 66.10 81.34 72.5812 Satara 14794 8384 23178 57.96 72.76 63.3113 Sangli 12447 7084 19531 59.04 75.61 65.0514 Solapur 16113 7437 23550 59.32 74.30 64.0515 Kolhapur 19427 9856 29283 60.33 77.35 66.0616 Aurangabad 19109 8195 27304 43.15 56.34 47.1117 Jalna 6447 2243 8690 43.43 57.24 47.0018 Parbhani 8945 3750 12695 44.63 55.12 47.7319 Hingoli – – – – – –20 Beed 15142 6221 21363 63.60 73.38 66.4521 Nanded 17586 7176 24762 52.22 58.67 54.0922 Osmanabad 8288 3541 11829 43.86 52.27 46.3823 Latur 14446 6395 20841 57.44 65.77 60.0024 Buldhana 10259 4222 14481 45.16 58.69 49.1125 Akola 10046 6373 16419 48.08 63.02 53.8826 Washim 6854 2470 9324 63.83 74.29 66.6027 Amaravati 15164 11566 26730 44.09 55.07 48.8428 Yavatmal 10256 6310 16566 36.44 47.07 40.4929 Wardha 9703 7297 17000 34.54 39.98 36.8730 Nagpur 26225 21695 47920 48.21 58.40 52.8031 Bhandara 17599 11484 29083 39.39 43.23 40.9132 Gondia – – – – – –33 Chandrapur 13528 7865 21393 38.73 47.86 42.0934 Gadchiroli 5966 2878 8844 40.55 42.18 41.08
Maharashtra 483355 296808 780163 55.92 68.02 60.53
Note: Figures for newly formed districts i.e. Hingoli and Gondia are not available, hence combined figures are given for undivided districts viz. Parbhani and Bhandara respectively.
# Includes Mumbai City and Mumbai Suburban District.Source: Population Census.
244 Human Development Report Maharashtra 2002

EducationTable 79
School Attendance Rate of Boys and Girls for the Age Group 6–14 years (2000)
Sr. No. District
Population School Attendance Attendance RateBoys Girls Total Boys Girls Total Boys Girls Total
1 2 3 4 5 6 7 8 9 10 11 1 Mumbai # 921337 855550 1776887 589042 541117 3130159 63.93 63.25 63.60 2 Thane 571909 528781 1100690 374894 313609 688503 65.55 59.31 62.55 3 Raigad 221195 206738 427933 140076 129959 270035 63.33 62.86 63.10 4 Ratnagiri 178245 175480 353725 118426 109406 227832 66.44 62.35 64.41 5 Sindhudurg 86114 82403 168517 59347 57210 116557 68.92 69.43 69.17 6 Nashik 497940 462588 960528 280728 242493 523221 56.38 52.42 54.47 7 Dhule 331568 309664 641232 159291 130404 289695 48.04 42.11 45.18 8 Nandurbar – – – – – – – – – 9 Jalgaon 416541 376276 792817 234364 188119 422483 56.26 49.99 53.2910 Ahmednagar 417596 392337 809933 237607 198039 435646 56.90 50.48 53.7911 Pune 604801 575678 1180479 370472 336990 707462 61.26 58.54 59.9312 Satara 289660 271354 561014 172634 157960 330594 59.60 58.21 58.9313 Sangli 247466 234936 482402 165613 147544 313157 66.92 62.80 64.9214 Solapur 398343 364437 762780 259986 202101 462087 65.27 55.46 60.5815 Kolhapur 336818 316642 653460 227772 202192 429964 67.62 63.86 65.8016 Aurangabad 288593 262579 551172 171309 129655 300964 59.36 49.38 54.6017 Jalna 177836 165771 343607 104602 66990 171592 58.82 40.41 49.9418 Parbhani 274525 252468 526993 146883 107797 254680 53.50 42.70 48.3319 Hingoli – – – – – – – – –20 Beed 232536 213973 446509 144520 107545 252065 62.15 50.26 56.4521 Nanded 316961 293384 610345 198187 156216 354403 62.53 53.25 58.0722 Osmanabad 160687 149977 310664 88512 74848 163360 55.08 49.91 52.5823 Latur 216047 204955 421002 123560 112371 235931 57.19 54.83 56.0424 Buldhana 239999 225546 465545 143742 112924 256666 59.89 50.07 55.1325 Akola 271712 255417 527129 163831 136112 299943 60.30 53.29 56.9026 Washim – – – – – – – – –27 Amaravati 254540 242454 496994 165166 143044 308210 64.89 59.00 62.0128 Yavatmal 264058 249642 513700 159611 130515 290126 60.45 52.28 56.4829 Wardha 119323 116471 235794 72975 68211 141186 61.16 58.56 59.8830 Nagpur 353241 340129 693370 217749 201609 419358 61.64 59.27 60.4831 Bhandara 240921 234178 475099 153151 142140 295291 63.57 60.70 62.1532 Gondia – – – – – – – – –33 Chandrapur 207279 198118 405397 124420 109296 233716 60.03 55.17 57.6534 Gadchiroli 96283 93901 190184 54960 43920 98880 57.08 46.77 51.99
Maharashtra 9234074 8651827 17885901 5623430 4800336 10423766 60.90 55.48 58.28
Note: Figures for newly formed districts i.e. Nandurbar, Hingoli, Washim and Gondia are not available, hence combined figures are given for undivided districts viz. Dhule, Parbhani, Akola and Bhandara respectively.
# Includes Mumbai City and Mumbai Suburban District.Source: Population Census.
Annexure Tables 245

EducationTable 80
Percentage of Population Completed at least Middle Level (Upto VII Std.)—1991
Sr. No. District Boys Girls Total 1 2 3 4 5 1 Mumbai # 17.90 16.87 19.16 2 Thane 12.38 12.13 12.66 3 Raigad 3.59 3.88 4 Ratnagiri 1.67 1.85 1.51 5 Sindhudurg 1.32 1.43 1.23 6 Nashik 7.96 8.00 7.91 7 Dhule 4.74 4.81 4.66 8 Nandurbar – – – 9 Jalgaon 6.09 6.13 6.0410 Ahmednagar 3.29 3.30 3.2711 Pune 9.77 9.71 9.8412 Satara 2.65 2.91 2.4113 Sangli 4.44 4.52 4.3614 Solapur 6.10 6.11 6.0815 Kolhapur 5.23 5.30 5.1716 Aurangabad 7.21 7.28 7.1417 Jalna 3.88 3.96 3.8018 Parbhani 5.25 5.37 5.1319 Hingoli – – –20 Beed 4.01 4.07 3.9521 Nanded 5.19 5.28 5.1022 Osmanabad 3.46 3.47 3.4423 Latur 4.68 4.71 4.6424 Buldhana 4.51 4.54 4.4825 Akola 6.22 6.23 6.2026 Washim – – –27 Amaravati 6.85 6.90 6.8128 Yavatmal 3.85 3.86 3.8429 Wardha 5.45 5.30 5.6130 Nagpur 12.32 12.11 12.5431 Bhandara 2.69 2.81 2.5732 Gondia – – –33 Chandrapur 5.97 5.92 6.0334 Gadchiroli 1.87 1.88 1.85
Maharashtra 7.67 7.68 7.65
Note: Figures for newly formed districts i.e. Nandurbar, Hingoli, Washim and Gondia are not available, hence combined figures are given for undivided districts viz. Dhule, Parbhani, Akola and Bhandara respectively.
# Includes Mumbai City and Mumbai Suburban District.Source: Population Census 1991.
246 Human Development Report Maharashtra 2002

EducationTable 81
District-wise Distribution of Educational Institutions during 1970–2000
Sr. No. District
1970 1980 1990 2000(E) Ratio: Pri. School for One Sec. School
Primary Sec. Primary Sec. Primary Sec. Primary Sec. 1970 1980 1990 20001 2 3 4 5 6 7 8 9 10 11 12 13 14 1 Mumbai # 1611 679 2036 765 2179 1026 2135 1238 2.4 2.7 2.1 1.7 2 Thane 2086 184 2498 246 3259 461 4338 808 11.3 10.2 7.1 5.4 3 Raigad 1815 113 2226 140 2386 225 2771 324 16.1 15.9 10.6 8.6 4 Ratnagiri 2759 226 3501 264 2539 240 2730 305 12.2 13.3 10.6 9.0 5 Sindhudurg – – – – 1470 161 1523 189 – – 9.1 8.1 6 Nashik 2076 226 2573 281 2957 417 3379 785 9.2 9.2 7.1 4.3 7 Dhule 1635 147 1817 182 2080 322 1198 328 11.1 10.0 6.5 3.7 8 Nandurbar – – – – – – 1364 206 – – – 6.6 9 Jalgaon 1657 207 1774 246 1906 346 2082 513 8.0 7.2 5.5 4.110 Ahmednagar 2063 213 2465 265 2634 416 3108 646 9.7 9.3 6.3 4.811 Pune 2301 315 3287 379 3677 559 4285 931 7.3 8.7 6.6 4.612 Satara 1743 236 2134 258 2371 377 2610 529 7.4 8.3 6.3 4.913 Sangli 1281 200 1312 232 1526 336 1846 485 6.4 5.7 4.5 3.814 Solapur 1825 198 1900 230 2379 390 2871 644 9.2 8.3 6.1 4.515 Kolhapur 1820 230 1944 239 2100 408 2113 655 7.9 8.1 5.1 3.216 Aurangabad 1970 184 2220 227 1513 257 1835 410 10.7 9.8 5.9 4.517 Jalna – – – – 1106 116 1301 190 – – 9.5 6.818 Parbhani 1497 119 1710 126 1627 189 1085 190 12.6 13.6 8.6 5.719 Hingoli – – – – – – 838 122 – – – 6.920 Beed 1446 141 1619 151 1695 294 2027 440 10.3 10.7 5.8 4.621 Nanded 1586 153 1709 155 2031 288 2326 405 10.4 11.0 7.1 5.722 Osmanabad 1636 225 1739 254 862 195 1068 306 7.3 6.8 4.4 3.523 Latur – – – – 1146 274 1383 482 – – 4.2 2.924 Buldhana 1246 132 1341 152 1425 211 1501 304 9.4 8.8 6.8 4.925 Akola 1504 159 1636 183 1746 342 1124 293 9.5 8.9 5.1 3.826 Washim – – – – – – 826 180 – – – 4.627 Amaravati 1418 209 1519 227 1672 404 1893 506 6.8 6.7 4.1 3.728 Yavatmal 1670 156 1845 173 1951 286 2113 407 10.7 10.7 6.8 5.229 Wardha 863 106 932 120 1000 192 1066 234 8.1 7.8 5.2 4.630 Nagpur 1763 286 1796 303 2132 549 2500 703 6.2 5.9 3.9 3.631 Bhandara 1250 146 1389 168 1804 370 876 239 8.6 8.3 4.9 3.732 Gondia – – – – – – 1100 229 – – – 4.833 Chandrapur 2014 123 2123 153 1553 226 1755 348 16.4 13.9 6.9 5.034 Gadchiroli – – – – 1018 101 1397 193 – – 10.1 7.2
Maharashtra 44535 5313 51045 6119 57744 9978 66367 14767 8.4 8.3 5.8 4.5
Note: Figures for newly formed districts i.e. Nandurbar, Hingoli, Washim and Gondia are not available, hence combined figures are given for undivided districts viz. Dhule, Parbhani, Akola and Bhandara respectively.
# Includes Mumbai City and Mumbai Suburban District.Source: Directorate of Education, Pune.
Annexure Tables 247

EducationTable 82
Number of Students at Different Levels of Education for every one lakh population—1998–99
Sr. No. District Primary School Secondary School Junior College Senior College 1 2 3 4 5 6 1 Mumbai # 9719 8896 980 1241 2 Thane 12936 6976 349 670 3 Raigad 14314 8684 122 566 4 Ratnagiri 13768 6704 256 324 5 Sindhudurg 10804 7728 192 542 6 Nashik 14232 8418 515 903 7 Dhule 12221 9177 259 685 8 Nandurbar – – – – 9 Jalgaon 12604 10446 481 75510 Ahmednagar 12796 9544 479 75711 Pune 11782 8772 549 111912 Satara 14670 9376 691 110813 Sangli 12984 8742 479 85314 Solapur 13804 8183 471 74415 Kolhapur 12339 8831 647 96516 Aurangabad 16848 7872 732 94217 Jalna 14744 5255 188 37018 Parbhani 19110 6540 399 46719 Hingoli – – – –20 Beed 16881 9335 672 115121 Nanded 15858 8137 239 51322 Osmanabad 14610 7880 480 85023 Latur 15799 9939 564 68324 Buldhana 14283 8253 186 37725 Akola 14768 9887 404 64926 Washim – – – –97 Amaravati 16623 9396 407 91028 Yavatmal 15355 7044 379 52529 Wardha 11445 10774 542 88730 Nagpur 11652 10203 592 119431 Bhandara 13047 9449 203 73232 Gondia – – – –33 Chandrapur 12669 8905 408 78334 Gadchiroli 14994 8624 203 403
Maharashtra 13265 8633 503 835
Note: Figures for newly formed districts i.e. Nandurbar, Hingoli, Washim and Gondia are not available, hence combined figures are given for undivided districts viz. Dhule, Parbhani, Akola and Bhandara respectively.
# Includes Mumbai City and Mumbai Suburban District.Source: District-wise Educational Progressive Indicators 1998–1999, Directorate of Education, Pune.
248 Human Development Report Maharashtra 2002

EducationTable 83
Children’s Primary Activity
Total Child Population Percentage of Children
Year Age Group Boys Girls Total
AttendingSchool and
NotWorking
AttendingSchool andWorking
Not Attend-ing Schooland NotWorking
Not Attend-ing School
andWorking
1 2 3 4 5 6 7 8 9
1971 6 to 10 3801522 3708590 7510112 – – – –
11 to 14 2381729 2120202 4501931 – – – –
1981 6 to 10 4459473 4361746 8821219 63.2 0.1 33.6 3.1
11 to 14 3147849 2886986 6034835 60.2 0.5 18.7 20.6
1991 6 to 10 5097130 4865698 9962828 68.8 0.3 28.9 2.0
11 to 14 3419225 3114134 6533359 74.7 1.1 12.5 11.7
Source: Census of India, 1971, 1981, 1991; Maharashtra Social and Cultural Tables.
Annexure Tables 249

EducationTable 84
Schools, Teachers and Students Ratio-Time Series
Sr. No. Item 1970 1980 1990 2000
1 2 3 4 5 61 PRIMARY SCHOOL
Total number of primary schools 44535 51045 57744 66370Total number of primary school teachers 177946 222070 268302 316322Total Primary school enrolment 6199325 8392356 10423766 12694398
2 SECONDARY SCHOOLTotal number of secondary schools 5313 6119 9972 14767Total number of secondary school teachers 74685 114065 181842 236301Total secondary school enrolment 2077127 3309333 5794120 8274750
3 PRIMARY SCHOOL RATIOSNumber of teachers per school 4.0 4.4 4.6 4.8Number of students per school 139.2 164.4 180.5 191.3Number of students per teacher 34.8 37.8 38.9 40.1
4 SECONDARY SCHOOL RATIOSNumber of teachers per school 14.1 18.6 18.2 16.0Number of students per school 391.0 540.8 581.0 560.4Number of students per teacher 27.8 29.0 31.9 35.0
5 PRIMARY SCHOOL INCREASEPercentage increase in last 10 years:Number of primary schools – 14.6 13.1 14.9Number of primary school teachers – 24.8 20.8 17.9Number of children in primary school – 35.4 24.2 21.8
6 SECONDARY SCHOOL INCREASEPercentage increase in last 10 years:
Number of secondary schools – 15.2 63.0 48.1Number of secondary school teachers – 52.7 59.4 29.9Number of children in secondary school – 59.3 75.1 42.8
Source: Directorate of Education, Pune.
250 Human Development Report Maharashtra 2002
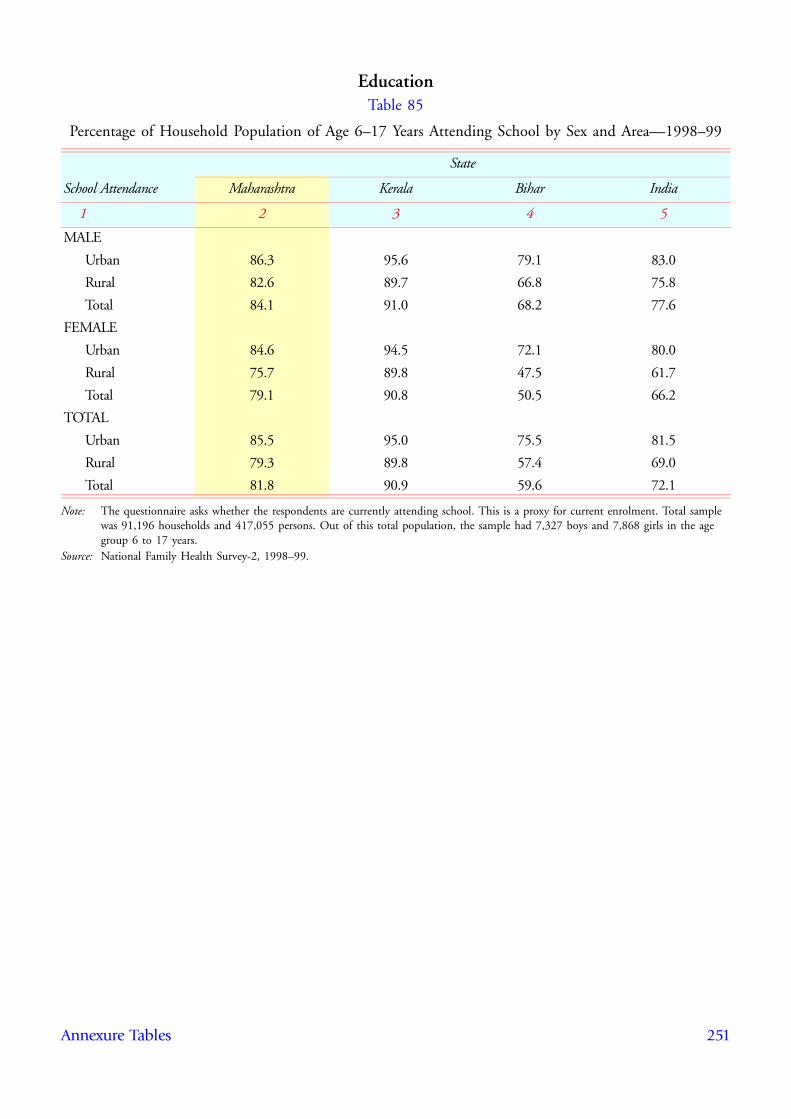
EducationTable 85
Percentage of Household Population of Age 6–17 Years Attending School by Sex and Area—1998–99
State
School Attendance Maharashtra Kerala Bihar India
1 2 3 4 5
MALE
Urban 86.3 95.6 79.1 83.0
Rural 82.6 89.7 66.8 75.8
Total 84.1 91.0 68.2 77.6
FEMALE
Urban 84.6 94.5 72.1 80.0
Rural 75.7 89.8 47.5 61.7
Total 79.1 90.8 50.5 66.2
TOTAL
Urban 85.5 95.0 75.5 81.5
Rural 79.3 89.8 57.4 69.0
Total 81.8 90.9 59.6 72.1
Note: The questionnaire asks whether the respondents are currently attending school. This is a proxy for current enrolment. Total sample was 91,196 households and 417,055 persons. Out of this total population, the sample had 7,327 boys and 7,868 girls in the age group 6 to 17 years.
Source: National Family Health Survey-2, 1998–99.
Annexure Tables 251

EducationTable 86
Stage-wise Enrolment: Total and Girls Primary and Secondary Schools (1985–1999)
I to IV V to VII VIII to X XI to XII
YearTotal(‘000)
Girls(‘000) % Girls
Total(‘000)
Girls(‘000) % Girls
Total(‘000)
Girls(‘000) % Girls
Total(‘000)
Girls(‘000) % Girls
1 2 3 4 5 6 7 8 9 10 11 12 13
1985–86 7890 3575 45.3 3610 1444 40.0 2220 754 34.0 577 177 30.7
1986–87 7978 3649 45.7 3812 1547 40.6 2372 817 34.4 586 185 31.6
1987–88 8086 3727 46.1 3943 1622 41.1 2505 875 34.9 646 207 32.0
1988–89 8228 3801 46.2 4033 1683 41.7 2670 961 36.0 704 230 32.7
1989–90 8398 3885 46.3 4122 1739 42.2 2809 1030 36.7 724 239 33.0
1990–91 8595 3991 46.4 4264 1823 42.8 2925 1099 37.6 800 273 34.1
1991–92 8809 4078 46.3 4426 1915 43.3 3015 1151 38.2 898 313 34.9
1992–93 8958 4197 46.9 4621 2017 43.6 3117 1217 39.0 922 324 35.1
1993-94 9179 4332 47.2 4896 2155 44.0 3242 1282 39.5 982 355 36.2
1994–95 9330 4419 47.4 5101 2268 44.5 3366 1365 40.6 1045 382 36.6
1995-96 9496 4522 47.6 5276 2369 44.9 3466 1428 41.2 1094 419 38.3
1996–97 9674 4612 47.7 5418 2460 45.4 3620 1521 42.0 1102 432 39.2
1997–98 9761 4675 47.9 5637 2591 46.0 3882 1653 42.6 1072 429 40.0
1998–99 9764 4685 48.0 5794 2699 46.6 4063 1758 43.3 1133 463 40.9
Source: Directorate of Education, Pune.
252 Human Development Report Maharashtra 2002

EducationTable 87
Standard-wise Enrolment: Total and Girls Primary, Secondary Schools and Colleges, 1998–99
Enrolment inPrimary Schools
Enrolment inSecondary Schools
Enrolment inJunior Colleges
Girls as %of Total
Enrolmentin Primary
Schools
Girls as %of Total
Enrolmentin Second-ary SchoolsStandard Total Girls Total Girls Total Girls
1 2 3 4 5 6 7 8 9
I 2499249 1197329 16544 6828 – – 47.9 41.3
II 2388676 1152872 17091 7237 – – 48.3 42.3
III 2517494 1214880 15973 6717 – – 48.3 42.1
IV 2273205 1084000 14867 5982 – – 47.7 40.2
V 1042411 501753 708623 329028 – – 48.1 46.4
VI 847593 406988 673625 317705 – – 48.0 47.2
VII 722423 345772 637508 295974 – – 47.9 46.4
VIII – – 1041228 467871 – – – 44.9
IX – – 926367 409241 – – – 44.2
X – – 696484 303819 – – – 43.6
XI – – – – 245445 98290 – –
XII – – – – 220273 87481 – –
Source: Directorate of Education, Pune.
Annexure Tables 253

EducationTable 88
Retention Rates at Different Stages
Sr. No. District
Std. IV (1998–99) Std. VII (1998–99) Std. X (1998–99)
Boys Girls Boys Girls Boys Girls
1 2 3 4 5 6 7 8 1 Mumbai # 85 86 85 78 49 45 2 Thane 79 81 66 67 38 39 3 Raigad 67 64 58 55 37 31 4 Ratnagiri 85 86 91 81 51 35 5 Sindhudurg 85 86 93 85 68 63 6 Nashik 99 96 80 75 41 31 7 Dhule 80 81 56 54 48 38 8 Jalgaon 85 84 72 69 52 49 9 Ahmednagar 86 77 62 56 46 3410 Pune 88 87 77 73 52 4811 Satara 93 93 85 79 66 5012 Sangli 87 85 71 66 44 3513 Solapur 91 87 64 61 40 2814 Kolhapur 85 86 90 88 67 5115 Aurangabad 79 85 65 61 58 4716 Jalna 73 74 53 45 35 2017 Parbhani 85 82 57 49 34 2118 Beed 79 78 59 50 44 3019 Nanded 74 77 49 46 36 2220 Osmanabad 85 81 63 57 46 3121 Latur 74 86 69 61 46 3522 Buldhana 86 85 66 60 43 2923 Akola 96 88 66 66 56 4624 Amaravati 83 86 60 70 44 4525 Yavatmal 71 76 54 53 38 3426 Wardha 63 66 67 71 54 5527 Nagpur 94 91 79 80 63 6628 Bhandara 85 87 71 72 55 5229 Chandrapur 84 88 72 73 45 4530 Gadchiroli 78 78 63 71 49 43
Maharashtra 85 86 69 66 47 40
# Includes Mumbai City and Mumbai Suburban District.Source: Directorate of Education, Pune
254 Human Development Report Maharashtra 2002
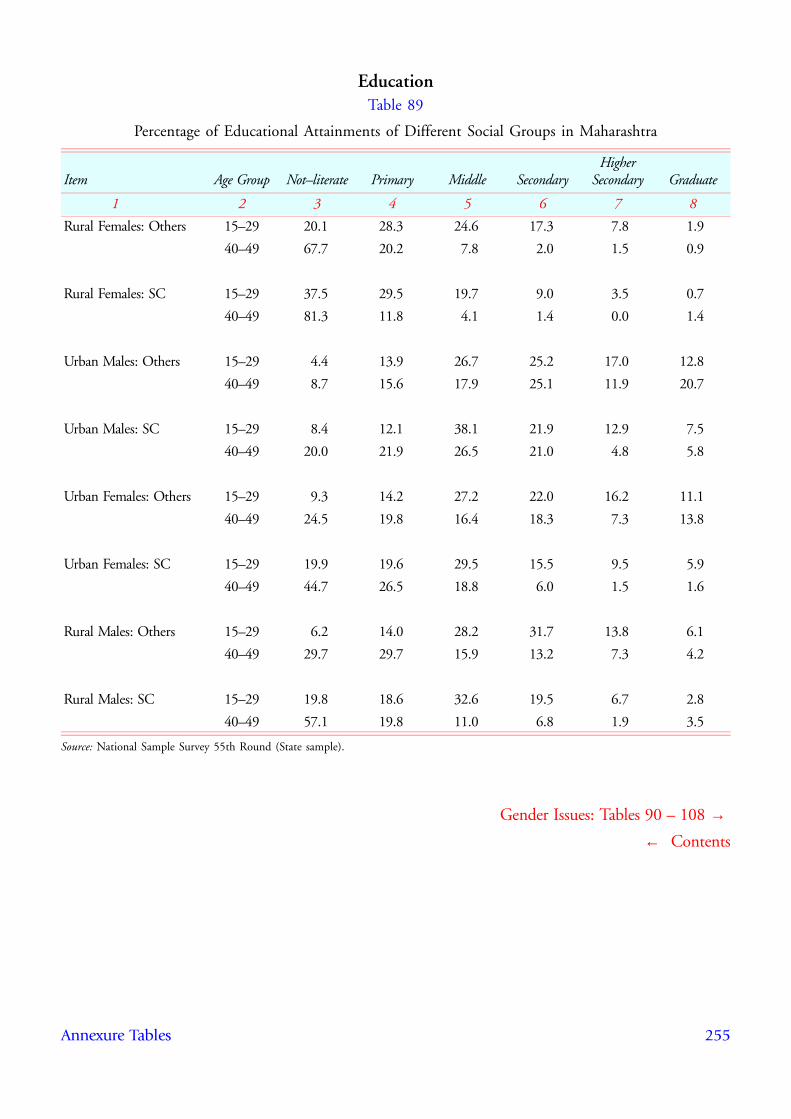
EducationTable 89
Percentage of Educational Attainments of Different Social Groups in Maharashtra
Item Age Group Not–literate Primary Middle SecondaryHigher
Secondary Graduate
1 2 3 4 5 6 7 8
Rural Females: Others 15–29 20.1 28.3 24.6 17.3 7.8 1.9
40–49 67.7 20.2 7.8 2.0 1.5 0.9
Rural Females: SC 15–29 37.5 29.5 19.7 9.0 3.5 0.7
40–49 81.3 11.8 4.1 1.4 0.0 1.4
Urban Males: Others 15–29 4.4 13.9 26.7 25.2 17.0 12.8
40–49 8.7 15.6 17.9 25.1 11.9 20.7
Urban Males: SC 15–29 8.4 12.1 38.1 21.9 12.9 7.5
40–49 20.0 21.9 26.5 21.0 4.8 5.8
Urban Females: Others 15–29 9.3 14.2 27.2 22.0 16.2 11.1
40–49 24.5 19.8 16.4 18.3 7.3 13.8
Urban Females: SC 15–29 19.9 19.6 29.5 15.5 9.5 5.9
40–49 44.7 26.5 18.8 6.0 1.5 1.6
Rural Males: Others 15–29 6.2 14.0 28.2 31.7 13.8 6.1
40–49 29.7 29.7 15.9 13.2 7.3 4.2
Rural Males: SC 15–29 19.8 18.6 32.6 19.5 6.7 2.8
40–49 57.1 19.8 11.0 6.8 1.9 3.5
Source: National Sample Survey 55th Round (State sample).
Gender Issues: Tables 90 – 108 →
← Contents
Annexure Tables 255

Gender IssuesTable 90
Percentage of Child Population and Sex Ratio in Age Group 0–6 as per 1991 and 2001
Sr. No. District
Percentage of Child Population Sex-Ratio in Age Group 0–6
1991 2001 1991 2001
Persons Females Persons Females Total Rural Urban Total Rural Urban
1 2 3 4 5 6 7 8 9 10 11 1 Mumbai # 13.60 14.59 11.02 11.75 933 0 933 913 – 913 2 Thane 16.87 17.58 13.71 14.34 952 973 939 933 971 915 3 Raigad 16.77 16.36 13.79 13.56 961 967 933 943 952 914 4 Ratnagiri 15.43 13.83 13.56 12.44 961 961 958 954 959 911 5 Sindhudurg 13.09 12.07 11.75 11.01 963 963 961 946 948 925 6 Nashik 18.83 18.97 15.35 15.46 954 961 941 936 948 916 7 Dhule 18.11 18.13 14.36 14.06 960 968 927 907 914 888 8 Nandurbar – – 16.83 16.85 – – – 966 976 895 9 Jalgaon 17.31 17.17 13.90 13.37 925 929 915 867 865 87110 Ahmednagar 18.23 18.23 13.91 13.51 949 951 941 890 892 87811 Pune 16.17 16.25 12.83 12.74 943 943 942 906 912 90012 Satara 16.20 15.49 12.57 11.83 941 945 910 884 888 85713 Sangli 15.85 15.56 12.56 11.80 924 927 911 850 850 85114 Solapur 17.97 17.98 14.20 13.89 935 935 932 897 890 91415 Kolhapur 15.32 15.07 12.49 11.85 931 938 911 859 870 83216 Aurangabad 20.30 20.42 14.72 14.42 933 954 888 884 886 88217 Jalna 21.45 21.38 15.60 15.27 951 953 945 914 913 91718 Parbhani 21.05 21.07 16.05 15.78 955 957 947 926 931 91519 Hingoli – – 16.38 16.22 – – – 935 938 91920 Beed 20.74 20.69 14.96 14.71 939 941 930 898 897 89821 Nanded 21.04 21.20 16.01 16.02 960 961 958 944 948 92922 Osmanabad 19.10 19.21 14.93 14.91 947 946 953 927 933 89523 Latur 20.20 20.25 15.17 15.07 947 951 930 923 926 91224 Buldhana 19.21 19.13 14.83 14.57 945 948 934 915 921 89025 Akola 18.10 18.05 14.04 14.02 934 940 918 936 941 92726 Washim – – 15.38 15.23 – – – 921 917 94527 Amaravati 16.33 16.45 13.32 13.37 950 952 948 947 953 93528 Yavatmal 17.74 17.83 14.61 14.61 961 965 936 942 948 91029 Wardha 15.03 15.13 12.21 12.20 952 951 956 934 946 89830 Nagpur 15.86 16.12 12.60 12.71 951 958 946 949 964 93931 Bhandara 16.10 15.96 11.20 13.07 971 975 939 958 961 93932 Gondia – – 13.95 13.66 – – – 964 966 94633 Chandrapur 16.51 16.67 13.07 12.95 965 970 951 944 965 89734 Gadchiroli 17.98 18.02 15.62 15.60 980 983 941 974 976 941
Maharashtra 17.11 17.23 13.63 13.59 946 953 936 917 923 908
# Includes Mumbai City and Mumbai Suburban District.Note: (1) Figures for newly formed districts i.e. Nandurbar, Hingoli, Washim and Gondia are not available, hence combined figures are
given for undivided districts viz. Dhule, Parbhani, Akola and Bhandara respectively.(2) Figures for 2001 are provisional.
Source: Population Census-1991 and 2001.
256 Human Development Report Maharashtra 2002

Gender IssuesTable 91
Number of Primary Schools, High Schools and Colleges for Girls—1995
Sr. No. District
Primary Secondary Higher Secondary JuniorColleges
SeniorCollegesSchools Enrolment Schools Enrolment Schools Enrolment
1 2 3 4 5 6 7 8 9 10 1 Mumbai # 100 70096 98 79458 10 13033 10 11 2 Thane 34 15492 14 9759 4 5209 0 4 3 Raigad 25 7077 6 3999 1 1208 0 1 4 Ratnagiri 19 4429 6 1704 0 0 0 0 5 Sindhudurg 8 1071 2 280 0 0 0 0 6 Nashik 131 46640 26 22886 4 8379 1 3 7 Dhule 90 24431 28 13372 11 11190 2 2 8 Nandurbar – – – – – – – – 9 Jalgaon 183 54007 39 14490 3 6167 4 510 Ahmednagar 38 13719 36 19487 4 6568 0 111 Pune 276 146265 34 30118 15 26406 3 412 Satara 37 10212 25 8690 4 6094 0 313 Sangli 168 49572 47 14207 11 9743 5 714 Solapur 103 28748 29 14362 4 5541 0 415 Kolhapur 160 56709 44 9772 11 10178 3 316 Aurangabad 43 19311 37 15399 3 3433 2 217 Jalna 17 7666 7 2283 2 1438 0 118 Parbhani 45 17885 6 2091 7 6343 0 119 Hingoli – – – – – – – –20 Beed 53 15358 20 7066 5 4032 4 421 Nanded 45 18004 33 10306 5 1528 0 222 Osmanabad 38 12991 25 6800 2 1947 0 023 Latur 43 15464 41 5375 8 1713 0 124 Buldhana 58 16704 19 5769 3 1992 0 025 Akola 77 23325 30 13653 9 6256 1 226 Washim – – – – – – – –27 Amaravati 95 31778 60 21939 9 6806 0 428 Yavatmal 54 16698 25 6824 10 9427 2 229 Wardha 67 12653 18 5874 8 4945 1 130 Nagpur 114 32806 66 38328 15 16221 4 831 Bhandara 57 13485 25 9125 11 9968 1 332 Gondia – – – – – – – –33 Chandrapur 44 10942 16 8671 6 6101 0 234 Gadchiroli 23 4772 6 1148 4 2078 1 1
Maharashtra 2245 798310 868 403235 189 193944 44 82
# Includes Mumbai City and Mumbai Suburban District.Note: Figures for newly formed districts i.e. Nandurbar, Hingoli, Washim and Gondia are not available, hence combined figures are given
for undivided districts viz. Dhule, Parbhani, Akola and Bhandara respectively.Source: Directorate of Education, Pune.
Gender Issues 257

Gender IssuesTable 92
Number of Primary Schools, High Schools and Colleges for Girls—2000
Sr. No. District
Primary Secondary Higher Secondary JuniorColleges
SeniorCollegesSchools Enrolment Schools Enrolment Schools Enrolment
1 2 3 4 5 6 7 8 9 10 1 Mumbai # 63 25612 96 75309 9 14359 13 11 2 Thane 37 16434 15 10107 9 8795 0 5 3 Raigad 21 5531 7 4487 1 3668 0 1 4 Ratnagiri 16 3002 6 2251 0 0 0 0 5 Sindhudurg 6 781 2 325 0 0 0 0 6 Nashik 120 42275 20 18325 5 11338 1 3 7 Dhule 62 16351 22 9502 9 11287 2 2 8 Nandurbar 27 13436 7 2496 3 3343 0 0 9 Jalgaon 175 55099 37 19739 4 5728 0 510 Ahmednagar 38 14338 37 20374 5 6628 0 111 Pune 208 82205 32 25499 15 24085 4 412 Satara 39 9462 28 10692 5 7069 0 313 Sangli 170 44121 53 16164 11 11661 5 714 Solapur 90 26025 27 12428 8 9791 0 415 Kolhapur 164 53311 52 17344 14 13618 3 416 Aurangabad 44 16871 31 16727 14 10720 2 217 Jalna 18 8901 7 3114 2 1823 0 118 Parbhani 24 9318 6 3180 7 7659 0 119 Hingoli 21 5234 3 1604 2 1177 0 020 Beed 53 16913 20 10691 8 5254 4 421 Nanded 47 19217 35 12754 5 12750 0 222 Osmanabad 38 11878 23 6363 2 1582 0 023 Latur 38 14864 26 11306 16 8331 0 124 Buldhana 56 15798 16 6661 3 2400 0 025 Akola 67 16522 19 10265 10 6850 1 226 Washim 13 3691 20 3375 2 2143 0 027 Amaravati 82 23710 43 12776 8 4225 2 428 Yavatmal 52 17440 23 7088 11 10708 2 229 Wardha 62 10008 16 6610 7 4949 1 130 Nagpur 94 27408 60 34868 20 14522 5 831 Bhandara 17 4169 9 2298 5 4501 1 332 Gondia 36 7960 7 3081 6 3631 0 033 Chandrapur 45 10635 20 10303 4 6062 0 234 Gadchiroli 21 3852 8 2271 2 1106 1 1
Maharashtra 2064 652372 833 410377 232 241763 47 84
# Includes Mumbai City and Mumbai Suburban District.Note: Figures for newly formed districts i.e. Nandurbar, Hingoli, Washim and Gondia are not available, hence combined figures are given
in undivided districts viz. Dhule, Parbhani, Akola and Bhandara respectively.Source: Directorate of Education, Pune.
258 Human Development Report Maharashtra 2002

Gender IssuesTable 93
Women’s Literacy Rate as per 1961, 1971, 1981, 1991 and 2001 Censuses
Sr. No. District
1961 1971 1981
Total Rural Urban Total Rural Urban Total Rural Urban
1 2 3 4 5 6 7 8 9 10 11 1 Mumbai # 48.81 – 48.81 55.72 – 55.72 60.75 – 60.75 2 Thane 19.06 9.93 41.99 29.80 18.74 50.89 40.15 27.01 57.73 3 Raigad 13.40 10.62 39.90 24.03 20.82 49.39 34.27 30.66 58.20 4 Ratnagiri 17.44 15.71 39.53 29.64 27.79 51.97 38.15 36.29 61.77 5 Sindhudurg – – – – – – – – – 6 Nashik 13.71 8.02 31.19 23.67 16.27 41.57 31.85 23.50 51.15 7 Dhule 12.45 9.31 29.51 20.30 16.10 41.06 26.01 20.79 48.24 8 Nandurbar – – – – – – – – – 9 Jalgaon 18.02 14.46 30.60 31.32 27.93 42.49 34.39 29.86 48.1010 Ahmednagar 13.03 10.36 36.70 22.91 20.11 46.65 29.24 25.91 52.6111 Pune 21.74 9.96 42.21 32.10 19.35 50.99 42.14 28.91 57.7512 Satara 21.16 18.86 41.09 24.77 21.70 46.95 35.67 32.77 56.7313 Sangli 13.64 10.63 30.38 23.24 19.53 40.08 33.60 29.41 49.3914 Solapur 12.60 7.78 25.25 20.49 15.23 34.66 26.96 21.03 41.3415 Kolhapur 12.04 7.19 30.52 20.34 14.52 42.70 30.79 24.31 51.5116 Aurangabad 6.67 3.73 25.31 14.02 9.97 35.37 19.96 13.62 43.2417 Jalna – – – – – – – – –18 Parbhani 5.19 3.20 17.92 11.25 8.22 27.53 15.53 11.07 35.2819 Hingoli – – – – – – – – –20 Beed 5.27 3.79 19.18 11.17 8.96 28.81 17.27 13.63 37.8121 Nanded 5.16 3.12 17.68 10.36 7.42 26.03 15.67 11.15 35.8022 Osmanabad 6.02 4.47 19.47 14.70 12.83 28.25 21.40 18.48 38.0023 Latur – – – – – – – – –24 Buldhana 12.22 9.30 27.53 22.68 19.15 39.82 29.97 25.77 48.8725 Akola 16.69 12.73 31.25 26.48 21.80 42.12 35.45 30.57 50.4326 Washim – – – – – – – – –27 Amaravati 20.57 16.75 31.73 31.69 27.26 43.63 42.55 37.80 54.1428 Yavatmal 11.27 8.56 30.74 19.88 16.73 40.52 26.86 22.82 50.2929 Wardha 16.98 12.11 33.23 30.29 25.45 45.67 40.53 35.27 56.5430 Nagpur 21.26 8.28 33.75 33.51 19.60 45.54 44.62 29.88 56.0331 Bhandara 8.19 6.20 25.45 20.59 18.23 39.56 29.49 26.25 51.4732 Gondia – – – – – – – – –33 Chandrapur 5.79 4.24 25.31 14.54 12.12 37.17 22.22 18.67 47.5034 Gadchiroli – – – – – – – – –
Maharashtra 16.76 9.34 37.90 26.43 17.84 47.33 34.79 24.88 54.65
# Includes Mumbai City and Mumbai Suburban District.Note: Figures for newly formed districts i.e. Nandurbar, Hingoli, Washim and Gondia are not available, hence combined figures are given
for undivided districts viz. Dhule, Parbhani, Akola and Bhandara respectively.Source: Population Census, 1961, 1971, 1981, 1991 and 2001.
Gender Issues 259

Gender IssuesTable 93 (continued)
Women’s Literacy Rate as per 1961, 1971, 1981, 1991 and 2001 Censuses
Sr. No. District
1991 2001
Total Rural Urban Total Rural Urban
1 2 12 13 14 15 16 17 1 Mumbai # 75.80 – 75.80 81.03 – 81.03 2 Thane 60.28 37.68 73.26 75.00 57.76 81.74 3 Raigad 52.20 48.21 71.32 68.06 64.01 81.50 4 Ratnagiri 51.61 49.33 77.2.5 65.98 63.73 85.37 5 Sindhudurg 66.87 65.67 82.44 71.67 70.28 85.49 6 Nashik 49.89 38.94 69.83 64.16 56.35 76.60 7 Dhule 45.75 38.96 67.26 61.76 55.93 78.34 8 Nandurbar 29.15 18.88 53.16 45.55 40.50 72.46 9 Jalgaon 50.34 44.55 65.63 64.95 60.23 76.6610 Ahmednagar 45.99 42.03 67.01 64.88 61.77 77.6611 Pune 59.77 46.28 73.02 72.32 60.98 80.5912 Satara 53.35 50.75 71.58 68.71 66.79 80.6213 Sangli 49.94 45.69 64.57 66.88 63.68 76.7414 Solapur 41.73 35.61 56.32 60.07 56.33 67.8115 Kolhapur 53.08 47.25 69.84 66.38 61.07 79.0516 Aurangabad 39.64 28.39 63.11 61.28 53.24 75.0717 Jalna 27.30 21.86 54.14 49.25 45.17 66.7918 Parbhani 29.41 22.80 52.32 52.98 46.22 67.0419 Hingoli – – – 51.96 49.02 67.8120 Beed 32.34 26.99 57.29 55.38 51.82 71.5721 Nanded 30.96 24.29 54.88 55.12 50.67 69.2122 Osmanabad 39.16 35.80 58.27 57.55 54.87 71.7023 Latur 39.74 35.35 57.44 60.28 56.60 72.2924 Buldhana 46.13 41.45 64.09 64.55 61.46 75.9825 Akola 53.28 46.88 69.10 73.82 69.65 80.3926 Washim – – – 61.32 58.39 75.0927 Amaravati 61.13 54.94 73.82 76.21 71.57 84.8528 Yavatmal 44.81 39.75 68.91 63.01 58.94 80.2829 Wardha 61.02 55.63 75.75 72.80 69.02 83.1830 Nagpur 64.74 50.39 73.55 77.65 66.73 83.5831 Bhandara 50.44 47.26 71.60 68.11 65.50 82.1632 Gondia – – – 67.89 65.88 82.6033 Chandrapur 46.81 39.55 66.12 62.56 56.44 75.0834 Gadchiroli 28.87 26.12 59.26 50.64 48.77 75.33
Maharashtra 52.32 40.96 70.87 67.51 59.12 79.25
# Includes Mumbai City and Mumbai Suburban District.Note: Figures for newly formed districts i.e. Nandurbar, Hingoli, Washim and Gondia are not available, hence combined figures are given
for undivided districts viz. Dhule, Parbhani, Akola and Bhandara respectively.Source: Population Census, 1961, 1971, 1981, 1991 and 2001.
260 Human Development Report Maharashtra 2002

Gender IssuesTable 94
Women’s Participation in Local Bodies as on 1 April 2001
Sr. No. District
Municipal Corporation Municipal Council Zilla Parishad
% of WomenCorporators
% of WomenChairpersons in
StandingCommittees
% of MunicipalMembers
% of WomenChairpersons in
StandingCommittees
% of WomenZ.P. Members
% of WomenChairpersons in
StandingCommittees
1 2 3 4 5 6 7 8 1 Mumbai # 34.07 50.00 0.00 0.00 0.00 0.00 2 Thane 33.23 20.69 31.04 30.26 34.21 10.00 3 Raigad 0.00 0.00 33.48 33.87 33.90 30.00 4 Ratnagiri 0.00 0.00 32.58 38.10 28.79 25.00 5 Sindhudurg 0.00 0.00 35.29 28.57 34.00 40.00 6 Nashik 32.22 20.00 31.49 18.37 33.80 25.00 7 Dhule 0.00 0.00 30.97 30.00 32.76 11.11 8 Nandurbar – – 30.30 32.00 22.81 18.18 9 Jalgaon 0.00 0.00 32.30 35.44 33.82 20.0010 Ahmednagar 0.00 0.00 33.18 9.80 34.25 10.0011 Pune 34.13 18.18 32.00 35.71 33.33 10.0012 Satara 0.00 0.00 34.39 40.00 52.27 10.0013 Sangli 30.14 37.50 30.59 33.33 28.99 30.0014 Solapur 33.33 0.00 36.81 20.00 34.85 20.0015 Kolhapur 32.47 40.00 24.17 36.84 32.84 20.0016 Aurangabad 31.82 16.67 29.31 17.86 31.03 10.0017 Jalna 0.00 0.00 31.19 16.67 32.73 20.0018 Parbhani 0.00 0.00 30.10 50.00 0.00 0.0019 Hingoli – – 29.17 0.00 0.00 0.0020 Beed 0.00 0.00 18.52 12.50 28.81 11.1121 Nanded 33.85 0.00 5.21 13.73 35.48 10.0022 Osmanabad 0.00 0.00 30.67 35.00 33.33 10.0023 Latur 0.00 0.00 29.17 21.05 32.76 10.0024 Buldhana 0.00 0.00 29.64 15.94 32.76 10.0025 Akola 0.00 0.00 30.22 20.00 32.76 10.0026 Washim – – 31.11 20.00 34.00 28.5727 Amaravati 30.38 20.00 33.02 27.08 25.86 33.3328 Yavatmal 0.00 0.00 29.61 18.60 34.43 30.0029 Wardha 0.00 0.00 35.46 21.05 33.33 40.0030 Nagpur 33.58 7.69 32.34 41.30 33.33 11.1131 Bhandara 0.00 0.00 34.33 16.67 34.62 20.0032 Gondia – – 33.93 16.67 32.69 10.0033 Chandrapur 0.00 0.00 27.69 21.74 33.93 10.0034 Gadchiroli 0.00 0.00 35.29 30.00 34.00 20.00
Maharashtra 24.54 21.90 18.70 72.38 55.64 21.61
# Includes Mumbai City and Mumbai Suburban District.Note: Figures for newly formed districts i.e. Nandurbar, Hingoli, Washim and Gondia are not available, hence combined figures are given
for undivided districts viz. Dhule, Parbhani, Akola and Bhandara respectively.Source: Directorate of Economics and Statistics, Mumbai.
Gender Issues 261

Gender IssuesTable 94 (continued)
Women’s Participation in Local Bodies as on 1 April 2001
Sr. No. District
Panchayat Samitis Gram Panchayats
% of Women PanchayatSamiti Members
% of Women Chairper-sons in Panchayat Samitis
% of Women GramPanchayat Members
% of Women Sarpanchesin Gram Panchayats
1 2 9 10 11 12
1 Mumbai # – – – –
2 Thane 32.03 58.33 26.79 12.66 3 Raigad 32.46 57.14 31.11 35.19
4 Ratnagiri 32.76 33.33 27.86 27.20
5 Sindhudurg 33.00 28.57 44.86 28.50 6 Nashik 30.28 23.08 26.66 24.87
7 Dhule 33.33 25.00 20.64 23.22
8 Nandurbar 35.58 16.67 27.42 12.45 9 Jalgaon 32.35 30.77 26.60 38.36
10 Ahmednagar 33.11 15.38 17.39 16.51
11 Pune 34.97 46.15 27.16 31.77
12 Satara 34.09 63.64 26.38 20.5513 Sangli 35.25 37.50 31.20 33.43
14 Solapur 34.09 27.27 29.05 30.09
15 Kolhapur 33.58 25.00 31.74 32.7516 Aurangabad 32.76 37.50 22.76 33.33
17 Jalna 32.73 80.00 31.01 39.67
18 Parbhani 33.82 28.57 30.50 36.3019 Hingoli 34.55 0.00 29.02 34.16
20 Beed 19.49 0.00 28.59 28.47
21 Nanded 33.06 37.50 24.74 21.1322 Osmanabad 25.00 33.33 30.21 35.24
23 Latur 33.62 40.00 31.54 38.80
24 Buldhana 33.62 23.08 29.73 25.8125 Akola 31.37 30.77 26.64 19.04
26 Washim 34.00 0.00 28.57 24.14
27 Amaravati 34.48 38.46 31.02 41.73
28 Yavatmal 33.61 35.71 32.89 31.0129 Wardha 34.31 50.00 24.84 27.61
30 Nagpur 34.21 61.54 29.90 41.16
31 Bhandara 32.69 15.38 31.21 34.8332 Gondia 32.69 0.00 29.55 0.00
33 Chandrapur 34.23 50.00 33.06 33.29
34 Gadchiroli 34.00 75.00 30 75 36.40Maharashtra 32.72 39.73 28.12 29.40
# Includes Mumbai City and Mumbai Suburban District.Source: Directorate of Economics and Statistics, Mumbai.
262 Human Development Report Maharashtra 2002
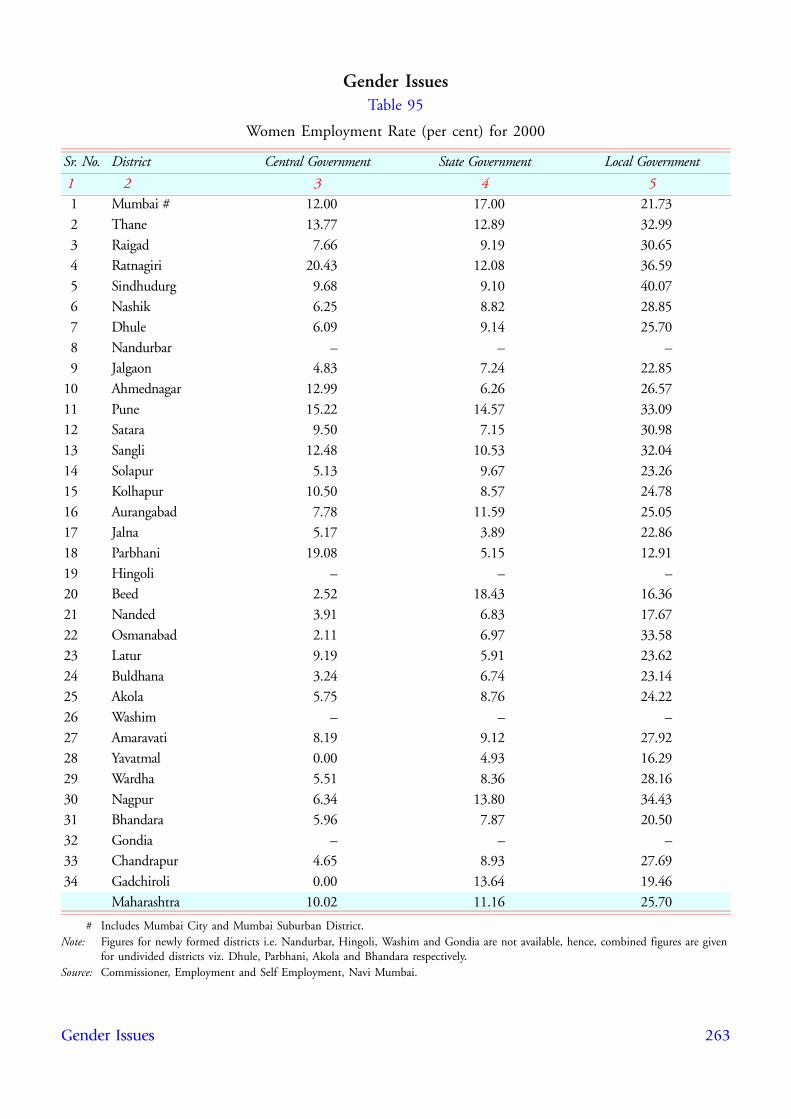
Gender IssuesTable 95
Women Employment Rate (per cent) for 2000
Sr. No. District Central Government State Government Local Government
1 2 3 4 5 1 Mumbai # 12.00 17.00 21.73
2 Thane 13.77 12.89 32.99
3 Raigad 7.66 9.19 30.65 4 Ratnagiri 20.43 12.08 36.59
5 Sindhudurg 9.68 9.10 40.07
6 Nashik 6.25 8.82 28.85 7 Dhule 6.09 9.14 25.70
8 Nandurbar – – – 9 Jalgaon 4.83 7.24 22.85
10 Ahmednagar 12.99 6.26 26.57
11 Pune 15.22 14.57 33.0912 Satara 9.50 7.15 30.98
13 Sangli 12.48 10.53 32.04
14 Solapur 5.13 9.67 23.2615 Kolhapur 10.50 8.57 24.78
16 Aurangabad 7.78 11.59 25.0517 Jalna 5.17 3.89 22.86
18 Parbhani 19.08 5.15 12.91
19 Hingoli – – –20 Beed 2.52 18.43 16.36
21 Nanded 3.91 6.83 17.67
22 Osmanabad 2.11 6.97 33.5823 Latur 9.19 5.91 23.62
24 Buldhana 3.24 6.74 23.1425 Akola 5.75 8.76 24.22
26 Washim – – –
27 Amaravati 8.19 9.12 27.9228 Yavatmal 0.00 4.93 16.29
29 Wardha 5.51 8.36 28.16
30 Nagpur 6.34 13.80 34.4331 Bhandara 5.96 7.87 20.50
32 Gondia – – –33 Chandrapur 4.65 8.93 27.69
34 Gadchiroli 0.00 13.64 19.46
Maharashtra 10.02 11.16 25.70
# Includes Mumbai City and Mumbai Suburban District.Note: Figures for newly formed districts i.e. Nandurbar, Hingoli, Washim and Gondia are not available, hence, combined figures are given
for undivided districts viz. Dhule, Parbhani, Akola and Bhandara respectively.Source: Commissioner, Employment and Self Employment, Navi Mumbai.
Gender Issues 263

Gender IssuesTable 96
Crimes Against Women
Sr. No. Head of Crime
Years
1994 1995 1996 1997 1998 1999 2000
1 2 3 4 5 6 7 8 9
1 Rape 1303 1364 1443 1243 1155 1317 1308
2 Molestation 3080 3477 3231 3117 2941 2761 2799
3 Kidnapping and Abduction 912 960 940 968 981 1104 961
4 Eve-teasing 541 703 950 974 905 1146 1222
5 Dowry murder by burning 50 63 67 57 73 62 56
6 Dowry murder by other means 75 67 74 48 54 53 71
7 Dowry attempt to commit murder by burning 22 28 25 33 31 22 25
8 Dowry attempt to commit murder by other means 14 17 19 19 28 18 31
9 Dowry attempt to commit suicide by burning 50 58 9 23 22 59 37
10 Dowry attempt to commit suicide by other means 79 39 26 19 20 64 82
11 Death U/S 304-B IPC by burning 163 142 116 120 125 97 79
12 Death U/S 304-B I PC by other means 231 230 215 159 181 137 191
13 Cruelty by husband or relatives of husband 498-A IPC
7105 8208 8589 7610 7006 6352 6091
14 Abetment of suicide (If victim is woman) 1097 1350 1372 1468 1580 1552 1293
15 Importing of girls (upto 21 years) 41 13 17 0 0 6 20
16 Immoral Traffic Prevention Act 163 181 206 1401 398 313 149
17 Indecent presentation of women (Prohibited) 5 1 9 5 150 2 27
Total 14931 16901 17308 17264 15650 15065 14442
Source: Director General of Police, Maharashtra State, Mumbai,
264 Human Development Report Maharashtra 2002

Gender IssuesTable 97
Performance of States with Respect to Different Measures of Gender Development
Sr. No. States
Hirway & Mahadevia 1 Shivkumar 2
GDM Index Rank Value of GDI Rank Rank
1 2 3 4 5 6
1 Andhra Pradesh 0.4411 10 0.371 8
2 Assam 0.4579 9 0.347 10
3 Bihar 0.3280 12 0.306 14
4 Gujarat 0.5444 6 0.437 3
5 Haryana 0.5485 5 0.370 9
6 Karnataka 0.4893 7 0.417 5
7 Kerala 0.6955 1 0.565 1
8 Madhya Pradesh 0.2891 14 0.312 12
9 Maharashtra 0.5596 4 0.492 2
10 Orissa 0.2998 13 0.329 11
11 Punjab 0.6366 2 0.424 4
12 Rajasthan 0.2865 15 0.309 13
13 Tamil Nadu 0.5763 3 0.402 6
14 Uttar Pradesh 0.3561 11 0.293 15
15 West Bengal 0.4776 8 0.399 7
India 0.4441 0.388
1. The authors have used 30 variables among which figure demographic ones, housing, water, work participation rate, non-farm work, accidental deaths, suicides, political participation, female male sex ratio. They thus incorporate various social environmental factors in addition to the conventional ones used by the UNDP.
2. The indices and ranks compiled by Shivkumar for major States for 1992 include fewer variables. They give us a higher rank for Maharashtra.
Source: Hirway and Mahadevia (1996) ‘Critique of Gender Development Index. Towards an Alternative’, Economic and Political Weekly, 26 October. Shivkumar, A.K. (1996) ‘UNDP’s Gender Related Development Index. A Comparison for Indian States’, Economic and Political Weekly, 16 April.
Gender Issues 265

Gender IssuesTable 98
Some Important Demographic Indicators–2001, India and Maharashtra
Sr. No. Indicator Maharashtra India
1 2 3 4
1 Population (2001) million† 96.75 1027
Males 50.33 531
Females 46.42 496
2 Percentage Decadal Growth of Population 1991–2001 22.57 21.34
3 Children 0-6 years (million)† 13.19 158
Males 6.88 82
Females 6.31 76
4 Natural Growth Rate 1991–2001 13.6 17.4
5 Overall Sex Ratio 2001† 922 933
6 Child Sex Ratio (CSR) 2001† 917 927
7 Sex Ratio at Birth: SRB 1998–99* 914 901
8 Crude Birth Rate: 1998–99‡ 21.1 26.1
9 Crude Death Rate: 1998–99‡ 7.5 8.7
Male 8.2 9
Female 6.7 8.3
10 Infant Mortality Rate (IMR) (per 1000 live births) 1999 48 70
Male 48 70
Female 49 71
11 Life Expectancy 2001 (years)**
Male 65 62
Female 68 65
† Population Census 2001 (Provisional) * SRS, 1996 ‡ SRS Bulletin, April, 2001 ** Population projection for Indian States (Estimated)
Source: ‘Missing Girl Child’, Economic and Political Weekly, 26 May 2001.
266 Human Development Report Maharashtra 2002

Gender IssuesTable 99
Singulate Mean Age at Marriage
Sr. No. State 1991 Census
NFHS-2 (1998–99)
Urban Rural Total
Male Female Male Female Male Female Male Female
1 2 3 4 5 6 7 8 9 10
1 India 24.0 19.3 26.5 21.5 24.2 19.0 24.9 19.7
2 Delhi 24.2 20.6 26.0 22.1 24.1 19.9 25.8 21.9
3 Haryana 22.8 18.8 25.2 21.4 24.3 19.2 24.6 19.8
4 Himachal Pradesh 24.5 20.3 27.2 23.7 26.6 21.9 26.7 22.1
5 Jammu & Kashmir U U 29.1 24.5 26.5 21.9 27.1 22.5
6 Punjab 24.3 21.0 26.4 23.2 25.5 21.6 25.7 22.1
7 Rajasthan 21.3 17.5 24.1 19.9 21.6 17.8 22.3 18.3
8 Madhya Pradesh 21.7 17.8 26.0 20.9 22.4 18.2 23.5 18.9
9 Uttar Pradesh 21.9 18.0 26.2 21.5 22.4 18.3 23.3 19.0
10 Bihar 22.1 17.5 26.3 20.9 23.5 18.5 23.8 18.8
11 Orissa 25.0 20.2 27.7 22.8 26.4 21.0 26.6 21.2
12 West Bengal 25.9 19.7 29.0 22.4 25.2 18.7 26.2 19.6
13 Arunachal Pradesh 25.1 20.1 23.9 21.9 25.3 21.6 25.1 21.6
14 Assam U U 29.3 23.6 27.7 21.5 27.8 21.7
15 Manipur 28.1 24.7 28.7 25.9 28.6 25.0 28.6 25.4
16 Meghalaya 25.8 21.4 27.8 25.0 26.7 22.2 27.0 23.0
17 Mizoram 26.7 22.4 27.5 24.7 26.3 23.2 27.0 24.1
18 Nagaland 28.9 24.9 28.4 23.4 27.3 22.9 27.6 23.0
19 Sikkim 25.8 21.4 24.7 23.0 26.5 21.7 26.2 21.9
20 Goa 29.4 24.2 30.3 25.2 30.1 24.4 30.2 24.8
21 Gujarat 23.4 19.9 25.0 21.1 23.8 19.6 24.4 20.2
22 Maharashtra 24.8 19.7 26.0 21.3 24.6 18.6 25.3 19.8
23 Andhra Pradesh 23.5 18.3 25.8 20.3 23.1 17.6 23.9 18.3
24 Karnataka 26.2 20.1 27.8 21.5 26.1 19.4 26.7 20.1
25 Kerala 27.7 22.2 28.9 22.7 27.6 21.2 27.9 21.5
26 Tamil Nadu 26.4 20.9 27.1 21.7 26.4 20.4 26.6 20.9
Note: Table is based on the de jure population U: not available.
Source: NFHS-2, IIPS, Mumbai, 1998–99, p. 21.
Gender Issues 267

Gender IssuesTable 100
Percentages of Family Planning Acceptors by Various Methods
Sr. No. Year
Sterilisation I.U.D.Insertion
EquivalentC.C. Users
EquivalentOCP Users
Total AcceptorsNumber
Vasectomy Tubectomy
1 2 3 4 5 6 7 8
1 1980–81 15.67 44.29 7.29 30.84 1.91 520133
2 1985–86 6.44 25.52 23.98 34.14 9.92 1739962
3 1986–87 4.46 24.43 21.89 38.17 11.05 1922251
4 1987–88 2.11 23.05 21.51 39.81 13.52 1830796
5 1988–89 1.83 24.16 20.23 41.06 12.72 1962556
6 1989–90 1.04 23.10 19.96 41.98 13.91 2180152
7 1990–91 0.89 20.64 18.40 43.29 16.78 2564871
8 1991–92 0.64 21.10 18.90 44.02 15.34 2475197
9 1992–93 0.66 22.71 19.65 46.29 10.69 2401893
10 1993–94 0.43 19.60 16.81 49.56 13.60 2694540
11 1994–95 0.38 20.17 16.80 47.89 14.75 2834411
12 1995–96 0.31 19.67 16.61 48.05 15.36 2833431
13 1996–97 0.23 22.25 19.40 41.82 16.28 2306800
14 1997–98 0.26 28.92 21.41 30.25 19.16 1957000
15 1998–99 0.27 28.08 21.38 31.17 19.10 1880000
Source: Director General of Health Services, Mumbai.
268 Human Development Report Maharashtra 2002

Gender IssuesTable 101
Indicators of Reproductive and Child Health in Maharashtra
(Percentage)
Sr. No. District
GirlsMarriedbelow 18
Birth Orderof 3+
Women aged15–44
knowingAll FP
CPR UsingAny Modern
Method
Total UnmetNeeds forContra-ceptions
ReceivingANC
ReceivingFull ANC
InstitutionalDeliveries
1 2 3 4 5 6 7 8 9 10
1 Mumbai # 8.0 29.9 88.1 54.9 18.4 96.8 81.8 93.2
2 Thane 19.7 34.9 84.5 52.6 23.4 93.0 57.4 71.2
3 Raigad 15.9 28.7 78.8 55.3 22.5 95.3 63.2 56.0
4 Ratnagiri 13.0 30.9 63.4 49.8 14.1 96.4 75.7 51.8
5 Sindhudurg 3.8 28.0 64.7 47.1 27.9 99.5 79.0 76.7
6 Nashik 32.1 35.6 53.5 55.1 20.9 64.4 31.5 54.5
7 Dhule 40.0 39.6 46.4 57.5 22.3 69.9 35.2 31.0
8 Jalgaon 46.0 35.7 54.9 62.2 21.1 83.7 41.0 44.2
9 Ahmednagar 40.8 33.4 63.7 62.6 12.8 91.3 54.9 60.0
10 Pune 30.4 27.7 53.8 63.8 13.2 90.9 57.6 75.0
11 Satara 21.9 27.5 72.3 68.1 10.1 87.0 61.3 60.9
12 Sangli 25.6 20.7 48.8 63.3 17.0 95.7 65.3 68.8
13 Solapur 41.8 38.6 62.2 61.9 15.9 84.9 50.7 57.1
14 Kolhapur 18.4 18.8 33.0 65.3 18.5 90.7 59.9 73.7
15 Aurangabad 50.9 42.2 54.6 49.9 30.5 81.6 39.8 49.7
16 Jalna 55.6 44.0 51.7 50.6 24.2 77.0 41.5 28.0
17 Parbhani 46.6 47.0 41.6 55.5 26.3 76.8 38.1 32.4
18 Beed 59.4 41.6 33.4 55.8 26.4 73.6 40.3 42.8
19 Nanded 63.7 43.5 48.7 51.4 30.5 85.3 46.9 29.9
20 Osmanabad 46.5 33.3 55.5 57.4 19.1 79.8 50.2 36.5
21 Latur 58.1 40.2 62.5 59.3 19.2 86.6 44.6 40.8
22 Buldhana 33.5 42.8 56.7 54.3 22.3 86.3 49.2 44.0
23 Akola 38.2 41.0 80.5 56.5 24.7 92.4 59.1 49.3
24 Amaravati 10.2 37.6 42.0 63.0 18.7 87.8 50.0 53.0
25 Yavatmal 27.1 37.9 58.9 59.2 19.9 91.3 53.2 37.1
26 Wardha 12.3 22.9 70.0 68.6 14.5 98.7 65.9 62.8
27 Nagpur 11.3 29.8 80.8 62.3 14.2 97.0 52.1 67.3
28 Bhandara 9.3 37.9 39.2 58.9 21.8 86.0 45.6 24.6
29 Chandrapur 25.7 31.1 78.3 65.5 16.9 96.3 62.2 41.0
30 Gadchiroli 26.8 35.9 55.5 57.9 23.5 95.5 67.8 16.5
Maharashtra 30.9 34.6 62.6 58.3 19.6 87.8 54.8 57.1
# Includes Mumbai City and Mumbai Suburban District.Source: Rapid household survey under RCH project 1998–99, IIPS Mumbai.
Gender Issues 269
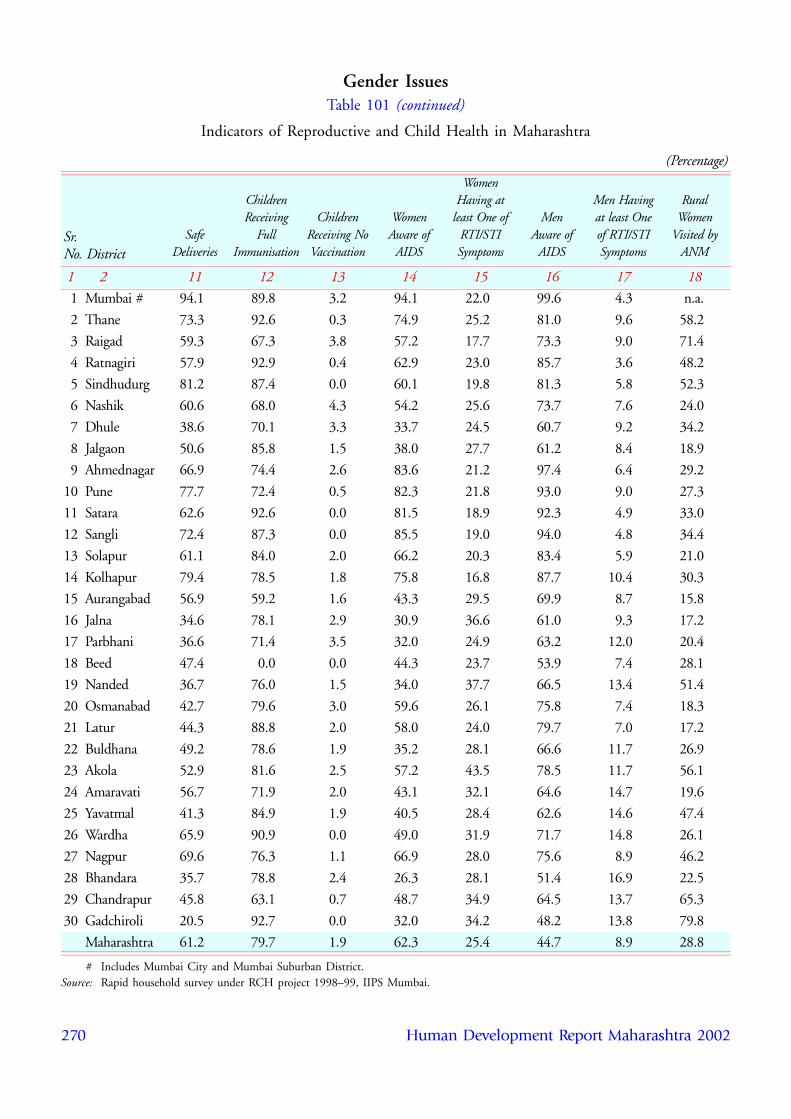
Gender IssuesTable 101 (continued)
Indicators of Reproductive and Child Health in Maharashtra
(Percentage)
Sr. No. District
SafeDeliveries
ChildrenReceiving
FullImmunisation
ChildrenReceiving NoVaccination
WomenAware of
AIDS
WomenHaving at
least One ofRTI/STISymptoms
MenAware of
AIDS
Men Havingat least Oneof RTI/STISymptoms
RuralWomen
Visited byANM
1 2 11 12 13 14 15 16 17 18
1 Mumbai # 94.1 89.8 3.2 94.1 22.0 99.6 4.3 n.a.
2 Thane 73.3 92.6 0.3 74.9 25.2 81.0 9.6 58.2
3 Raigad 59.3 67.3 3.8 57.2 17.7 73.3 9.0 71.4
4 Ratnagiri 57.9 92.9 0.4 62.9 23.0 85.7 3.6 48.2
5 Sindhudurg 81.2 87.4 0.0 60.1 19.8 81.3 5.8 52.3
6 Nashik 60.6 68.0 4.3 54.2 25.6 73.7 7.6 24.0
7 Dhule 38.6 70.1 3.3 33.7 24.5 60.7 9.2 34.2
8 Jalgaon 50.6 85.8 1.5 38.0 27.7 61.2 8.4 18.9
9 Ahmednagar 66.9 74.4 2.6 83.6 21.2 97.4 6.4 29.2
10 Pune 77.7 72.4 0.5 82.3 21.8 93.0 9.0 27.3
11 Satara 62.6 92.6 0.0 81.5 18.9 92.3 4.9 33.0
12 Sangli 72.4 87.3 0.0 85.5 19.0 94.0 4.8 34.4
13 Solapur 61.1 84.0 2.0 66.2 20.3 83.4 5.9 21.0
14 Kolhapur 79.4 78.5 1.8 75.8 16.8 87.7 10.4 30.3
15 Aurangabad 56.9 59.2 1.6 43.3 29.5 69.9 8.7 15.8
16 Jalna 34.6 78.1 2.9 30.9 36.6 61.0 9.3 17.2
17 Parbhani 36.6 71.4 3.5 32.0 24.9 63.2 12.0 20.4
18 Beed 47.4 0.0 0.0 44.3 23.7 53.9 7.4 28.1
19 Nanded 36.7 76.0 1.5 34.0 37.7 66.5 13.4 51.4
20 Osmanabad 42.7 79.6 3.0 59.6 26.1 75.8 7.4 18.3
21 Latur 44.3 88.8 2.0 58.0 24.0 79.7 7.0 17.2
22 Buldhana 49.2 78.6 1.9 35.2 28.1 66.6 11.7 26.9
23 Akola 52.9 81.6 2.5 57.2 43.5 78.5 11.7 56.1
24 Amaravati 56.7 71.9 2.0 43.1 32.1 64.6 14.7 19.6
25 Yavatmal 41.3 84.9 1.9 40.5 28.4 62.6 14.6 47.4
26 Wardha 65.9 90.9 0.0 49.0 31.9 71.7 14.8 26.1
27 Nagpur 69.6 76.3 1.1 66.9 28.0 75.6 8.9 46.2
28 Bhandara 35.7 78.8 2.4 26.3 28.1 51.4 16.9 22.5
29 Chandrapur 45.8 63.1 0.7 48.7 34.9 64.5 13.7 65.3
30 Gadchiroli 20.5 92.7 0.0 32.0 34.2 48.2 13.8 79.8
Maharashtra 61.2 79.7 1.9 62.3 25.4 44.7 8.9 28.8
# Includes Mumbai City and Mumbai Suburban District.Source: Rapid household survey under RCH project 1998–99, IIPS Mumbai.
270 Human Development Report Maharashtra 2002

Gender IssuesTable 102
Division-wise Distribution of Literate and Non-literate in Maharashtra
(figures in millions)
Sr. No. Division
Population aged 7+ Literate Non-Literate
Persons Males Females Persons Males Females Persons Males Females
1 2 3 4 5 6 7 8 9 10 11
1 Konkan 10.60 5.89 4.71 9.23 5.41 3.82 1.37 0.48 0.89
2 Nashik 16.96 8.93 8.03 12.93 7.53 5.39 4.03 1.40 2.64
3 Pune 15.03 7.74 7.28 11.59 6.69 4.90 3.44 1.05 2.38
4 Kolhapur 9.65 4.97 5.04 7.74 4.35 3.40 1.91 0.62 1.64
5 Aurangabad 13.19 6.71 6.39 9.17 5.57 3.59 4.02 1.14 2.80
6 Amaravati 8.52 4.39 4.13 6.66 3.83 2.83 1.86 0.56 1.30
7 Nagpur 9.26 4.74 4.53 7.25 4.10 3.15 2.01 0.64 1.38
Maharashtra 83.67 43.46 40.11 64.57 37.49 27.08 19.00 6.97 13.03
Note: Details may not add up to totals due to rounding-off.Source: Derived from Table 4, Census 2001, Maharashtra, Paper 1, p. 59, 60.
Gender Issues 271

Gender IssuesTable 103
Number of Women Engaged in Household Duties (Principal Status) and alsoParticipating in Specified Additional Activities per 1000 Women Engaged in Household Duties
Sr. No. Specified Additional Activities Rural Urban
1 2 3 4
1 Maintenance of kitchen garden 47 16
2 Work in household poultry/dairy etc. 205 16
3 Either item 1 or 2 223 30
4 Free collection of fish etc. 89 6
5 Free collection of firewood etc. 344 27
6 Either item 4 or 5 352 29
7 Any of items 1, 2, 4 or 5 433 55
8 Husking of (own) paddy 23 0
9 Grinding of (own) food grains 14 1
10 Preparation of gur 0 0
11 Preservation of meat 1 0
12 Making of baskets 3 1
13 Any of items 8–12 33 1
14 Any of items 1, 2, 4, 5, 8–12 437 57
15 Husking of (acquired) paddy 11 2
16 Grinding of (acquired) food grains 10 2
17 Preparation of gur (acquired) 7 1
18 Preservation of meat (acquired) 8 1
19 Making of baskets (acquired) 9 1
20 Any items 15–19 16 3
21 Any of items 1, 2, 4, 5, 8–12, 15–19 442 59
22 Preparation of cow-dung cakes 344 27
23 Sewing, Tailoring 64 137
24 Tutoring of (own) children 44 100
25 Bringing water from outside household premises 608 234
26 Bringing water from outside village 46 0
27 Any items 1, 2, 4, 5, 8–12, 15–19, 22–26 789 418
Source: NSS Report 416 (1993–94).
272 Human Development Report Maharashtra 2002
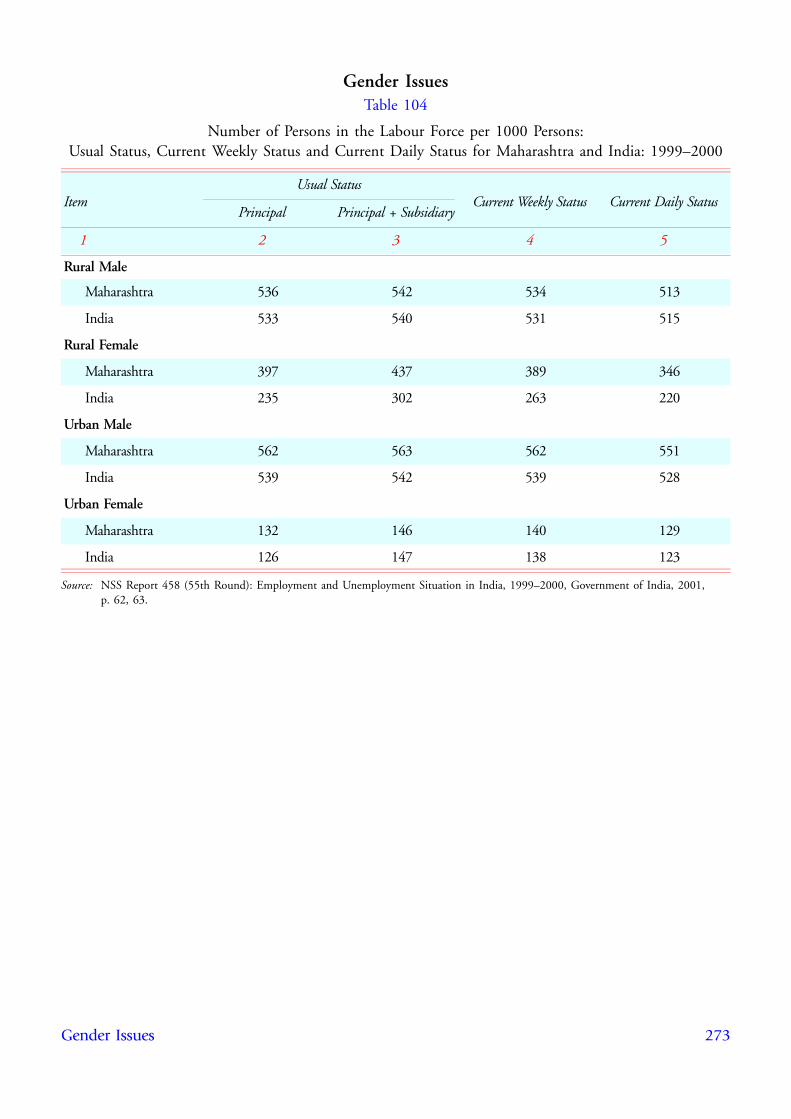
Gender IssuesTable 104
Number of Persons in the Labour Force per 1000 Persons:Usual Status, Current Weekly Status and Current Daily Status for Maharashtra and India: 1999–2000
ItemUsual Status
Current Weekly Status Current Daily StatusPrincipal Principal + Subsidiary
1 2 3 4 5
Rural Male
Maharashtra 536 542 534 513
India 533 540 531 515
Rural Female
Maharashtra 397 437 389 346
India 235 302 263 220
Urban Male
Maharashtra 562 563 562 551
India 539 542 539 528
Urban Female
Maharashtra 132 146 140 129
India 126 147 138 123
Source: NSS Report 458 (55th Round): Employment and Unemployment Situation in India, 1999–2000, Government of India, 2001, p. 62, 63.
Gender Issues 273
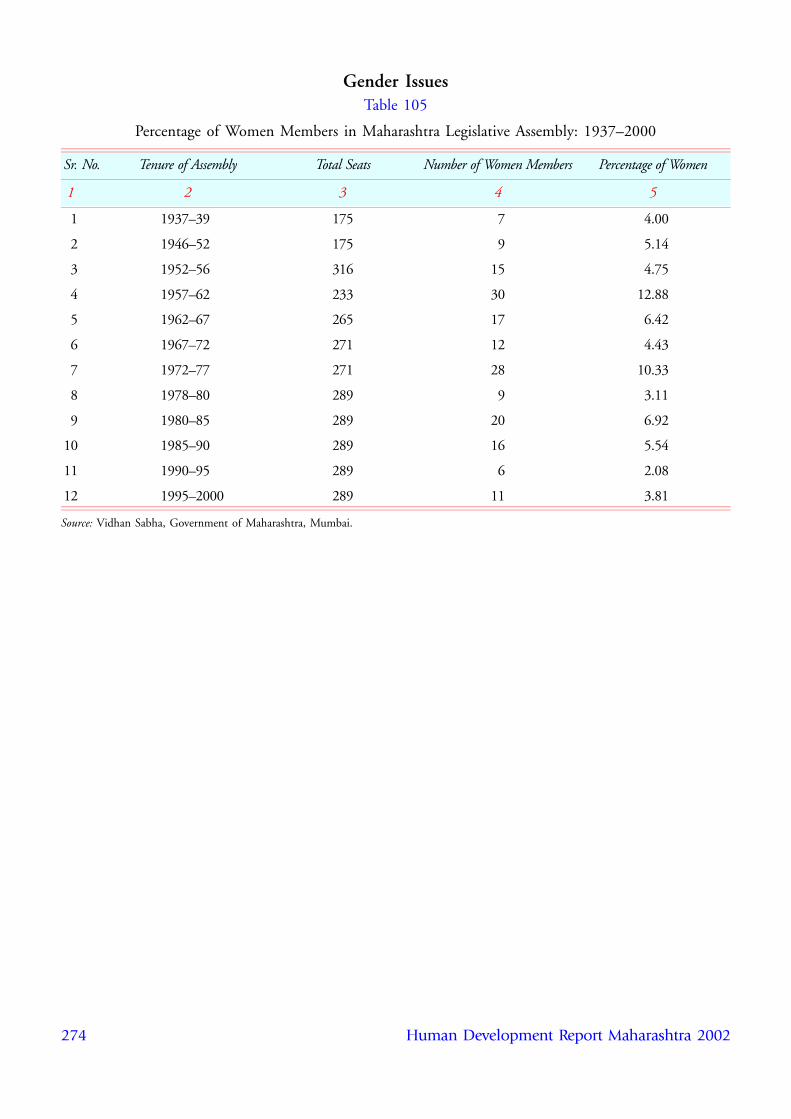
Gender IssuesTable 105
Percentage of Women Members in Maharashtra Legislative Assembly: 1937–2000
Sr. No. Tenure of Assembly Total Seats Number of Women Members Percentage of Women
1 2 3 4 5
1 1937–39 175 7 4.00
2 1946–52 175 9 5.14
3 1952–56 316 15 4.75
4 1957–62 233 30 12.88
5 1962–67 265 17 6.42
6 1967–72 271 12 4.43
7 1972–77 271 28 10.33
8 1978–80 289 9 3.11
9 1980–85 289 20 6.92
10 1985–90 289 16 5.54
11 1990–95 289 6 2.08
12 1995–2000 289 11 3.81
Source: Vidhan Sabha, Government of Maharashtra, Mumbai.
274 Human Development Report Maharashtra 2002

Gender IssuesTable 106
Percentage of Women Members in Maharashtra Legislative Council: 1937–1996
Sr. No. Tenure of Council Total Seats Number of Women Members Percentage of Women
1 2 3 4 5
1 1937–39 30 1 3.33
2 1940–46 29 1 3.45
3 1946–52 29 2 6.90
4 1952–58 72 10 13.89
5 1958–64 72 4 5.56
6 1962–68 78 3 3.85
7 1964–70 78 3 3.85
8 1968–74 78 2 2.56
9 1974–80 78 3 3.85
10 1978–84 78 5 6.41
11 1980–85 78 6 7.69
12 1987–92 78 4 5.13
13 1992–94 78 – –
14 1994–96 78 7 8.97
Source: General Administrative Department, Government of Maharashtra, Mumbai.
Gender Issues 275
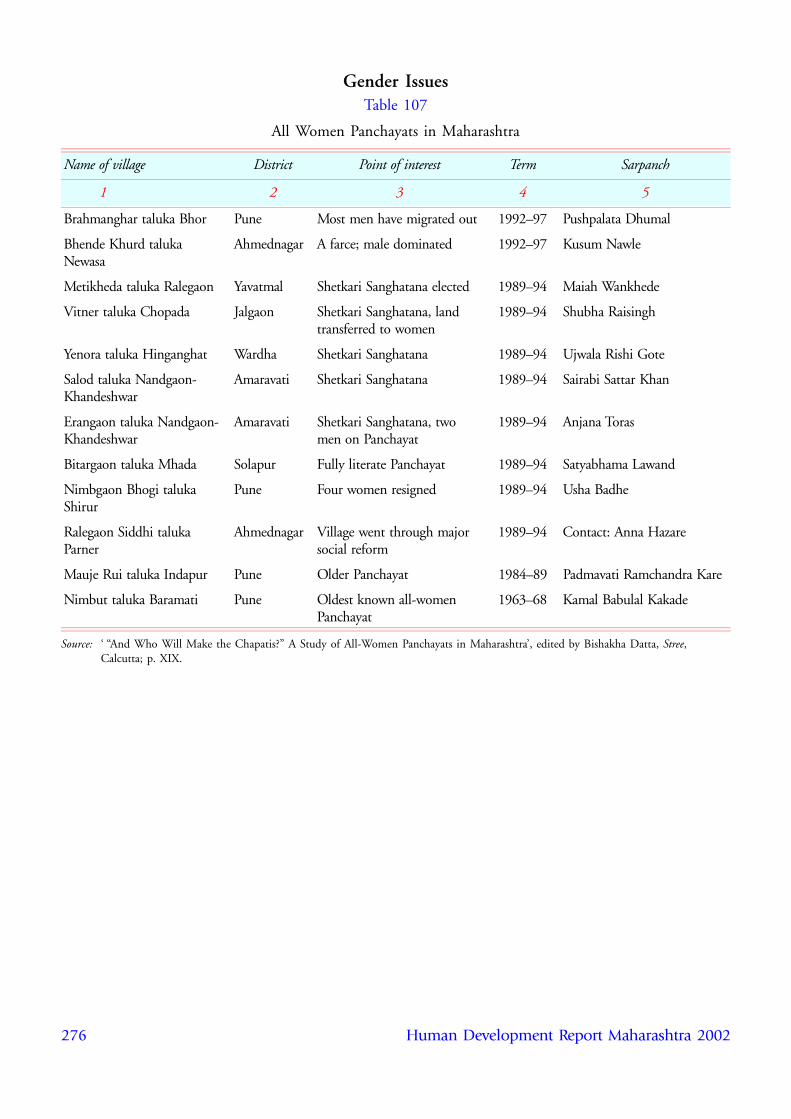
Gender IssuesTable 107
All Women Panchayats in Maharashtra
Name of village District Point of interest Term Sarpanch
1 2 3 4 5
Brahmanghar taluka Bhor Pune Most men have migrated out 1992–97 Pushpalata Dhumal
Bhende Khurd taluka Newasa
Ahmednagar A farce; male dominated 1992–97 Kusum Nawle
Metikheda taluka Ralegaon Yavatmal Shetkari Sanghatana elected 1989–94 Maiah Wankhede
Vitner taluka Chopada Jalgaon Shetkari Sanghatana, landtransferred to women
1989–94 Shubha Raisingh
Yenora taluka Hinganghat Wardha Shetkari Sanghatana 1989–94 Ujwala Rishi Gote
Salod taluka Nandgaon-Khandeshwar
Amaravati Shetkari Sanghatana 1989–94 Sairabi Sattar Khan
Erangaon taluka Nandgaon-Khandeshwar
Amaravati Shetkari Sanghatana, twomen on Panchayat
1989–94 Anjana Toras
Bitargaon taluka Mhada Solapur Fully literate Panchayat 1989–94 Satyabhama Lawand
Nimbgaon Bhogi talukaShirur
Pune Four women resigned 1989–94 Usha Badhe
Ralegaon Siddhi talukaParner
Ahmednagar Village went through majorsocial reform
1989–94 Contact: Anna Hazare
Mauje Rui taluka Indapur Pune Older Panchayat 1984–89 Padmavati Ramchandra Kare
Nimbut taluka Baramati Pune Oldest known all-womenPanchayat
1963–68 Kamal Babulal Kakade
Source: ‘ “And Who Will Make the Chapatis?” A Study of All-Women Panchayats in Maharashtra’, edited by Bishakha Datta, Stree, Calcutta; p. XIX.
276 Human Development Report Maharashtra 2002

Gender IssuesTable 107A
Percentage Distribution of Population by Marital Status and Age in Maharashtra, 1996
Sr. No. Age GroupNever Married Married Widowed/Divorced/Separated
Female Male Total Female Male Total Female Male Total
1 2 3 4 5 6 7 8 9 10 11
1 1–10 22.9 23.2 23.0 0 0 0 0 0 0
2 10–14 11.1 11.4 11.3 0 0 0 0 0 0
3 15–19 6.5 9.3 7.9 2.3 0.3 1.3 0 0 0
4 20–24 2.0 6.3 4.2 6.6 2.6 4.6 0.1 0 0.1
5 25–29 0.5 2.2 1.4 8.1 6.2 7.1 0.3 0.1 0.2
6 30–34 0.1 0.4 0.3 7.2 6.7 6.9 0.4 0.1 0.2
7 35–39 0.1 0.1 0.1 6.5 6.9 6.7 0.5 0.1 0.3
8 40–44 0 0.1 0.1 4.7 5.5 5.1 0.6 0.1 0.3
9 45–49 0 0.1 0.1 3.9 4.6 4.2 0.7 0.1 0.4
10 50–54 0 0 0 2.8 3.4 3.1 0.8 0.2 0.5
11 55–59 0 0 0 2.4 2.7 2.6 0.9 0.2 0.6
12 60+ 0 0 0 3.2 5.8 4.5 4.8 1.3 3.0
13 All Ages 43.3 53.2 48.4 47.6 44.7 46.1 9.1 2.1 5.0
Source: Sample Registration System, Statistical Report, 1996.
Gender Issues 277

Gender IssuesTable 108
Gender Dimensions in Educational Attainment
Sr. No. District
Literacy Rate (Age 7+) 2001 (%)Dropout Rate (per 100), 1998–997th Std. 10th Std.
Males Females Boys Girls Boys Girls 1 2 3 4 5 6 7 8 1 Mumbai 89.95 82.71 15 23 51 55 2 Mumbai (Suburban) 92.65 80.39 n.a. n.a. n.a. n.a. 3 Thane 86.06 75.00 44 33 62 61 4 Raigad 86.40 68.06 41 55 63 69 5 Ratnagiri 86.28 65.98 19 19 49 65 6 Sindhudurg 90.12 71.67 15 15 32 37 7 Nashik 85.19 64.16 20 25 59 69 8 Dhule 81.90 61.76 44 46 52 62 9 Nandurbar 66.32 45.55 n.a. n.a. n.a. n.a.10 Jalgaon 86.53 64.95 28 32 48 5111 Ahmednagar 86.21 64.88 36 43 54 64 12 Pune 88.55 72.32 33 28 48 5213 Satara 88.45 68.71 15 21 34 5014 Sangli 86.25 66.88 29 34 56 6515 Solapur 82.28 60.07 34 39 60 7116 Kolhapur 87.67 66.38 10 12 33 4917 Aurangabad 85.07 61.28 35 39 52 6218 Jalna 79.17 49.25 47 55 65 80 19 Parbhani 80.58 52.98 43 51 66 7920 Hingoli 81.11 51.96 n.a. n.a. n.a. n.a.21 Beed 80.69 55.38 41 50 56 7022 Nanded 81.14 55.12 51 54 64 7823 Osmanabad 82.03 57.55 37 43 54 6924 Latur 83.63 60.28 31 39 54 6525 Buldhana 87.17 64.55 34 41 57 7126 Akola 89.22 73.82 34 34 44 5427 Washim 86.01 61.32 n.a. n.a. n.a. n.a.28 Amaravati 89.28 76.21 40 30 56 5529 Yavatmal 84.57 63.01 46 47 62 6430 Wardha 87.70 72.80 33 29 46 4631 Nagpur 90.25 77.65 21 20 37 3432 Bhandara 89.11 68.11 29 28 45 4833 Gondia 89.54 67.89 n.a. n.a. n.a. n.a.34 Chandrapur 83.19 62.56 28 27 45 4535 Gadchiroli 69.72 50.64 37 29 51 57
Maharashtra 8627 6751 34 32 60 56
Note: (1) Figures for newly formed districts i.e. Nandurbar, Hingoli, Washim and Gondia are not available, hence combined figures are given for undivided districts viz. Dhule, Parbhani, Akola and Bhandara respectively.
Source: (1) Population Census-2001.(2) Directorate of Education, Pune.
Human Development Indicators: Tables 109 – 117 →
← Contents
278 Human Development Report Maharashtra 2002

Human Development IndicatorsTable 109
Infant Mortality Rate and Child Mortality Rate—1991
Sr. No. District
Infant Mortality Rate Child Mortality Rate
Total Female Male Total Female Male
1 2 3 4 5 6 7 8 1 Mumbai # 37 35 39 50 49 51
2 Thane 46 41 44 54 51 56
3 Raigad 63 56 74 87 75 101 4 Ratnagiri 75 62 81 90 81 94
5 Sindhudurg 70 61 74 87 82 89 6 Nashik 79 55 88 88 90 87
7 Dhule 73 78 56 95 94 96
8 Nandurbar – – – – – 9 Jalgaon 71 70 72 84 88 81
10 Ahmednagar 47 42 52 60 60 60
11 Pune 52 44 59 70 56 7412 Satara 51 49 52 61 62 64
13 Sangli 41 31 50 53 50 5514 Solapur 68 60 74 83 77 85
15 Kolhapur 55 47 61 74 64 76
16 Aurangabad 56 58 51 81 83 7917 Jalna 76 76 77 94 95 92
18 Parbhani 50 48 52 95 93 97
19 Hingoli – – – – – –20 Beed 52 52 52 80 85 75
21 Nanded 68 66 76 87 87 8722 Osmanabad 7 83 61 96 97 95
23 Latur 57 50 64 71 76 67
24 Buldhana 82 68 84 97 96 9725 Akola 101 96 103 115 112 117
27 Amaravati 94 88 101 114 107 116
28 Yavatmal 124 126 112 143 143 14429 Wardha 88 86 91 104 110 99
30 Nagpur 75 78 72 101 101 10031 Bhandara 81 76 85 115 112 118
33 Chandrapur 96 101 89 137 138 136
34 Gadchiroli 106 117 95 144 143 144Maharashtra 74 76 72 91 93 89
Note: (1) Figures for newly formed districts i.e. Nandurbar, Hingoli, Washim and Gondia are not available hence, combined figures are given for undivided districts viz. Dhule, Parbhani, Akola and Bhandara respectively.
(2) District-wise information as per 2001 is not available. However IMR and CMR for 1999 is given in table no. 1 against cols 13 and 17.
# Includes Mumbai City and Mumbai Suburban District.Source: Registrar General of India, New Delhi.
Annexure Tables 279

Human Development IndicatorsTable 110
Nutrition (below 2 years of age)—1997
Sr. No. District
Weight for Age Height for Age
Below-2 SD Below-3 SD Below-2 SD Below-3 SD
1 2 3 4 5 6 1 Mumbai n.a. n.a. n.a. n.a. 2 Mumbai (Suburban) n.a. n.a. n.a. n.a. 3 Thane 38.2 13.7 46.2 24 7 4 Raigad 30.3 7.9 38.7 18.2 5 Ratnagiri 45.9 20.1 50.8 28.0 6 Sindhudurg 29.9 11.0 44.0 20.8 7 Nashik 40.8 16.1 48.8 26.3 8 Dhule n.a. n.a. n.a. n.a. 9 Nandurbar n.a. n.a. n.a. n.a.10 Jalgaon 42.8 15.1 56.8 36.511 Ahmednagar 46.8 24.2 63.6 38.312 Pune 42.2 19.8 60.6 34.513 Satara 37.8 15.3 49.6 28.214 Sangli 33.6 13.4 49.9 23.815 Solapur 38.2 13.8 49.5 24.316 Kolhapur 31.9 10.5 42.6 18.917 Aurangabad 45.5 17.8 57.0 34.918 Jalna 32.3 14.8 59.1 32.719 Parbhani 40.9 12.5 58.0 32.220 Hingoli n.a. N.A n.a. n.a.21 Beed 43.2 19.3 55.9 37.822 Nanded 39.8 15.4 59.1 35.823 Osmanabad 31.4 7.0 55.9 31.824 Latur 31.7 12.3 52.7 27.125 Buldhana 49.9 17.9 65.9 45.026 Akola 39.8 12.0 47.5 28.927 Washim n.a. N.A n.a. n.a.28 Amaravati 49.7 20.9 64.9 42.729 Yavatmal 43.8 13.0 56.6 33.530 Wardha n.a. N.A n.a. n.a.31 Nagpur 40.4 16.8 61.7 34.232 Bhandara 48.5 20.2 68.9 45.333 Gondia n.a. N.A n.a. n.a.34 Chandrapur 51.1 25.8 60.3 40.635 Gadchiroli 50.8 21.9 50.8 29.7
Maharashtra 40.6 15.9 54.6 31.7
Note: Figures for newly formed districts i.e. Nandurbar, Hingoli, Washim and Gondia are not available, hence combined figures are given for undivided districts viz. Dhule, Parbhani, Akola and Bhandara respectively.
Source: ‘Programme for Children In Maharashtra: An Assessment’, Directorate of Health Services, Mumbai.
280 Human Development Report Maharashtra 2002

Human Development IndicatorsTable 111
HDI and Per Capita District Domestic Product (at current prices)
Sr. No. District HDI 2000 Rank PCDDP 1988–99 (Rs) Rank
1 2 3 4 5 6 1 Mumbai 1.00 2 31922 2
2 Mumbai (Suburban) 1.00 1 31922 1
3 Thane 0.83 3 23558 3 4 Raigad 0.71 6 22132 4
5 Ratnagiri 0.46 17 10926 19
6 Sindhudurg 0.64 9 16018 7 7 Nashik 0.51 13 14505 9
8 Dhule 0.36 29 8195 33 9 Nandurbar 0.20 35 8195 34
10 Jalgaon 0.49 14 11112 17
11 Ahmednagar 0.57 11 10512 2012 Pune 0.76 4 19629 6
13 Satara 0.59 10 10930 18
14 Sangli 0.68 7 14476 1015 Solapur 0.46 18 11558 15
16 Kolhapur 0.64 8 15051 817 Aurangabad 0.56 12 13183 11
18 Jalna 0.26 32 8049 35
19 Parbhani 0.42 23 9272 2620 Hingoli 0.42 24 9272 27
21 Beed 0.44 22 9570 25
22 Nanded 0.36 30 8788 3223 Osmanabad 0.38 28 8963 30
24 Latur 0.46 20 9129 2825 Buldhana 0.39 27 8849 31
26 Akola 0.42 25 10402 21
27 Washim 0.34 31 10402 2228 Amaravati 0.48 16 11405 16
29 Yavatmal 0.21 33 8990 29
30 Wardha 0.49 15 11661 1331 Nagpur 0.71 5 19859 5
32 Bhandara 0.46 19 9989 2333 Gondia 0.46 21 9989 24
34 Chandrapur 0.41 26 13003 12
35 Gadchiroli 0.20 34 11635 14Maharashtra 0.58 – 15804 –
Note: Due to the paucity of data, use of indicators for allocation and various limitations of estimation procedure, the district domestic products are to be accepted with margin of errors and can be used to have a broad judgement on the level of income in the districts.
Source: Directorate of Economics and Statistics, Mumbai.
Annexure Tables 281

Human Development IndicatorsTable 112
Literacy Rate, Mean Year of Schooling and Dropout Rate
Sr. No. District
Literacy Rate (Age 7+) Mean Years ofSchooling (Std. 1–7)
Dropout Rate (per 100)
2001 1998–99
Per Cent Rank Years Rank 7th Std. Rank 10th Std. Rank
1 2 3 4 5 6 7 8 9 10 1 Mumbai 86.82 2 5.852 6 19 4 53 13 2 Mumbai (Suburban) 87.14 1 5.852 7 19 5 53 14 3 Thane 81.00 6 5.460 13 34 16 62 24 4 Raigad 77.32 13 5.313 17 43 27 66 31 5 Ratnagiri 75.35 19 4.921 20 19 6 57 19 6 Sindhudurg 80.52 8 6.356 1 15 2 34 1 7 Nashik 75.10 20 4.151 28 23 8 64 27 8 Dhule 72.08 26 3.836 30 45 28 56 16 9 Nandurbar 56.06 35 3.836 31 45 29 56 1710 Jalgaon 76.06 17 5.131 19 29 10 50 1111 Ahmednagar 75.82 18 4.550 22 41 26 60 2212 Pune 80.78 7 5.740 9 30 13 50 1213 Satara 78.52 12 5.425 14 18 3 42 414 Sangli 76.70 15 5.600 10 31 14 60 2315 Solapur 71.50 27 4.228 26 38 24 65 3016 Kolhapur 77.23 14 5.768 8 11 1 41 317 Aurangabad 73.63 23 4.207 27 37 22 57 2018 Jalna 64.52 33 2.870 35 51 34 73 3519 Parbhani 67.04 31 3.017 33 47 31 72 3320 Hingoli 66.86 32 3.017 34 47 32 72 3421 Beed 68.48 30 4.116 29 45 30 62 2522 Nanded 68.52 29 3.507 32 53 35 69 3223 Osmanabad 70.24 28 4.249 25 40 25 62 2624 Latur 72.34 25 5.306 18 35 20 59 2125 Buldhana 76.14 16 4.305 24 37 23 64 2826 Akola 81.77 5 5.355 15 34 17 49 927 Washim 74.03 22 5.355 16 34 18 49 1028 Amaravati 82.96 4 5.586 11 35 21 56 1829 Yavatmal 74.06 21 4.263 23 47 33 64 2930 Wardha 80.50 9 6.258 3 31 15 46 631 Nagpur 54.18 3 6.286 2 19 7 36 232 Bhandara 78.68 10 6.104 4 29 11 47 733 Gondia 78.65 11 6.104 5 29 12 47 834 Chandrapur 73.07 24 5.551 12 27 9 45 535 Gadchiroli 60.29 34 4.872 21 34 19 54 15
Maharashtra 77.27 – 4.970 – 31 – 53 –
Source: Population Census 2001.Directorate of Education, Pune.
282 Human Development Report Maharashtra 2002

Human Development IndicatorsTable 113
Achievement and Improvement Indices for Literacy (1991–2001)
Sr. No. District AIL* 1991 Rank AIL 2000 Rank IIL** 1991–2001 Rank
1 2 3 4 5 6 7 8 1 Mumbai 0.8056 1 0.8536 2 0.0630 32
2 Mumbai (Suburban) 0.8056 2 0.8571 1 0.0685 31
3 Thane 0.6616 8 0.7889 6 0.1049 14 4 Raigad 0.5994 16 0.7480 13 0.1030 17
5 Ratnagiri 0.5856 17 0.7261 19 0.0921 24
6 Sindhudurg 0.7312 3 0.7836 8 0.0481 34 7 Nashik 0.5814 19 0.7233 20 0.0920 25
8 Dhule 0.4580 28 0.6898 26 0.1240 3 9 Nandurbar 0.4580 29 0.5118 35 0.0232 35
10 Jalgaon 0.6033 15 0.7340 17 0.0888 28
11 Ahmednagar 0.5670 21 0.7313 18 0.1061 1012 Pune 0.6783 5 0.7864 7 0.0910 27
13 Satara 0.6297 10 0.7613 12 0.0976 19
14 Sangli 0.5846 18 0.7411 15 0.1051 1315 Solapur 0.5154 25 0.6833 27 0.0945 22
16 Kolhapur 0.6327 9 0.7470 14 0.0829 2917 Aurangabad 0.5220 24 0.7070 23 0.1088 8
18 Jalna 0.4028 34 0.6058 33 0.0923 23
19 Parbhani 0.4176 32 0.6338 31 0.1031 1620 Hingoli 0.4176 33 0.6318 32 0.1019 18
21 Beed 0.4424 30 0.6498 30 0.1033 15
22 Nanded 0.4241 31 0.6502 29 0.1108 723 Osmanabad 0.4919 27 0.6693 28 0.0955 21
24 Latur 0.5063 26 0.6927 25 0.1053 1125 Buldhana 0.5743 20 0.7349 16 0.1052 12
26 Akola 0.6203 11 0.7974 5 0.1396 1
27 Washim 0.6203 12 0.7114 22 0.0610 3328 Amaravati 0.6673 6 0.8107 4 0.1253 2
29 Yavatmal 0.5329 23 0.7118 21 0.1073 9
30 Wardha 0.6661 7 0.7833 9 0.0961 2031 Nagpur 0.7071 4 0.8242 3 0.1135 4
32 Bhandara 0.6077 13 0.7631 10 0.1121 533 Gondia 0.6077 14 0.7628 11 0.1118 6
34 Chandrapur 0.5490 22 0.7008 24 0.0912 26
35 Gadchiroli 0.3654 35 0.5588 34 0.0808Maharashtra 0.6097 – 0.7474 – 0.0968 –
* Achievement indices for literacy. ** Improvement indices for literacy.
Source: Population Census 1991 and 2001.
Annexure Tables 283

Human Development IndicatorsTable 114
Achievement and Improvement Indices for IMR (1981–1991)
Sr. No. District AIMR* 1981 Rank AIMR 1991 Rank IIMR** 1981–1991 Rank
1 2 3 4 5 6 7 8 1 Mumbai # 0.6554 1 0.7908 1 0.1354 29 2 Thane 0.2885 14 0.6838 3 0.3953 3 3 Raigad 0.1633 23 0.5459 12 0.3825 4 4 Ratnagiri 0.3386 6 0.4697 19 0.1311 30 5 Sindhudurg 0.3386 7 0.5000 15 0.1614 26 6 Nashik 0.2929 13 0.4466 22 0.1537 28 7 Dhule 0.2841 16 0.4816 18 0.1975 22 8 Nandurbar 0.0000 0 0.0000 0 0.0000 0 9 Jalgaon 0.2094 18 0.4938 17 0.2844 1510 Ahmednagar 0.3433 5 0.6740 4 0.3307 611 Pune 0.4245 2 0.6292 7 0.2047 2012 Satara 0.3199 8 0.6377 6 0.3178 1013 Sangli 0.4191 3 0.7378 2 0.3187 914 Solapur 0.3199 9 0.5127 13 0.1927 2315 Kolhapur 0.3675 4 0.6047 9 0.2372 1916 Aurangabad 0.2885 15 0.5969 10 0.3084 1317 Jalna 0.1822 20 0.4638 21 0.2816 1618 Parbhani 0.1822 21 0.6464 5 0.4642 119 Hingoli 0.0000 0 0.0000 0 0.0000 020 Beed 0.3199 10 0.6292 8 0.3093 1221 Nanded 0.1977 19 0.5127 14 0.3150 1122 Osmanabad 0.3108 11 0.5000 16 0.1892 2423 Latur 0.3108 12 0.5892 11 0.2784 1724 Buldhana 0.1056 25 0.4299 24 0.3243 725 Akola 0.1784 22 0.3339 28 0.1554 2726 Washim 0.0000 0 0.0000 0 0.0000 027 Amaravati 0.1633 24 0.3675 26 0.2042 2128 Yavatmal 0.0679 27 0.2335 30 0.1656 2529 Wardha 0.0780 26 0.3979 25 0.3199 830 Nagpur 0.2254 17 0.4697 20 0.2443 1831 Bhandara 0.0285 28 0.4354 23 0.4069 232 Gondia 0.0000 0 0.0000 0 0.0000 033 Chandrapur 0.0253 29 0.3577 27 0.3324 534 Gadchiroli 0.0253 30 0.3108 29 0.2855 14
Maharashtra 0.2542 0.4756 0.2214
* Achievement Indices for Infant Mortality Rate. ** Improvement Indices for Infant Mortality Rate. # Includes Mumbai City and Mumbai Suburban District.
Note: Figures for newly formed districts i.e. Nandurbar, Hingoli, Washim and Gondia are not available hence, combined figures are given for undivided districts viz. Dhule, Parbhani, Akola and Bhandara respectively.
Source: Registrar General of India, New Delhi.
284 Human Development Report Maharashtra 2002

Human Development IndicatorsTable 115
District-wise Classification of Village Amenities
Sr. No. District
Total numberof Villages
Number of Villages with Facilities Available–2001
Post Office Bank Pucca Road Telephones
1 2 3 4 5 6 7 1 Mumbai – – – – –
2 Mumbai (Suburban) – – – – –
3 Thane 1746 250 111 1475 412 4 Raigad 1919 335 86 1455 1105
5 Ratnagiri 1543 677 124 1327 821 6 Sindhudurg 743 339 97 645 266
7 Nashik 1931 612 207 1484 573
8 Dhule 681 238 88 571 265 9 Nandurbar 947 166 49 721 151
10 Jalgaon 1522 524 282 1394 1306
11 Ahmednagar 1581 649 294 1286 112812 Pune 1860 542 201 1545 934
13 Satara 1730 649 224 1505 75414 Sangli 724 372 192 657 590
15 Solapur 1148 505 186 1102 665
16 Kolhapur 1217 446 231 1009 65017 Aurangabad 1344 326 146 998 356
18 Jalna 971 189 80 739 255
19 Parbhani 840 158 62 738 16220 Hingoli 710 475 60 121 92
21 Beed 1365 914 100 118 32622 Nanded 1611 851 295 1073 439
23 Osmanabad 735 621 83 130 261
24 Latur 945 799 98 329 29225 Buldhana 1466 376 118 875 587
26 Akola 988 218 178 684 191
27 Washim 802 160 44 444 18828 Amaravati 2004 427 123 1149 738
29 Yavatmal 2131 346 120 1358 26130 Wardha 1382 197 65 729 446
31 Nagpur 1869 270 99 1205 685
32 Bhandara 872 114 48 368 50533 Gondia 952 131 43 392 563
34 Chandrapur 1791 310 108 920 195
35 Gadchiroli 1679 170 51 795 123Maharashtra 43749 13356 42993 29341 16285
Source: Directorate of Economics and Statistics, Mumbai.
Annexure Tables 285
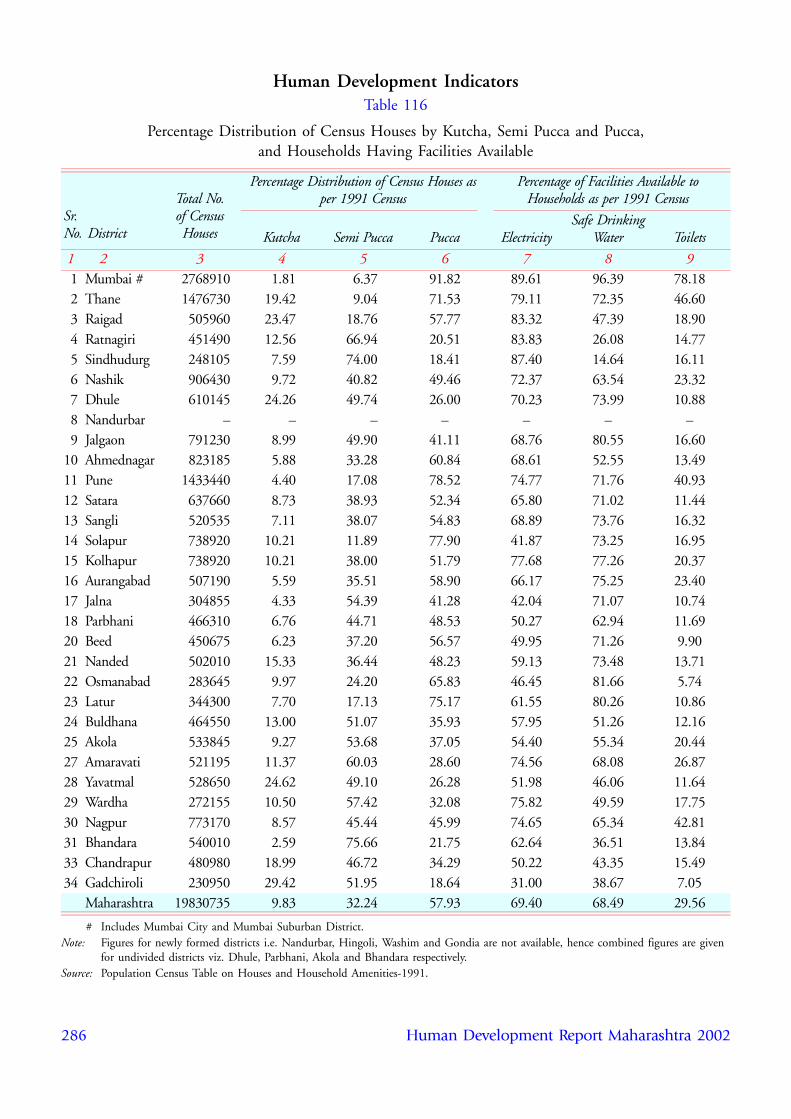
Human Development IndicatorsTable 116
Percentage Distribution of Census Houses by Kutcha, Semi Pucca and Pucca,and Households Having Facilities Available
Sr. No. District
Total No.of CensusHouses
Percentage Distribution of Census Houses asper 1991 Census
Percentage of Facilities Available toHouseholds as per 1991 Census
Kutcha Semi Pucca Pucca ElectricitySafe Drinking
Water Toilets
1 2 3 4 5 6 7 8 9 1 Mumbai # 2768910 1.81 6.37 91.82 89.61 96.39 78.18 2 Thane 1476730 19.42 9.04 71.53 79.11 72.35 46.60 3 Raigad 505960 23.47 18.76 57.77 83.32 47.39 18.90 4 Ratnagiri 451490 12.56 66.94 20.51 83.83 26.08 14.77 5 Sindhudurg 248105 7.59 74.00 18.41 87.40 14.64 16.11 6 Nashik 906430 9.72 40.82 49.46 72.37 63.54 23.32 7 Dhule 610145 24.26 49.74 26.00 70.23 73.99 10.88 8 Nandurbar – – – – – – – 9 Jalgaon 791230 8.99 49.90 41.11 68.76 80.55 16.6010 Ahmednagar 823185 5.88 33.28 60.84 68.61 52.55 13.4911 Pune 1433440 4.40 17.08 78.52 74.77 71.76 40.9312 Satara 637660 8.73 38.93 52.34 65.80 71.02 11.4413 Sangli 520535 7.11 38.07 54.83 68.89 73.76 16.3214 Solapur 738920 10.21 11.89 77.90 41.87 73.25 16.9515 Kolhapur 738920 10.21 38.00 51.79 77.68 77.26 20.3716 Aurangabad 507190 5.59 35.51 58.90 66.17 75.25 23.4017 Jalna 304855 4.33 54.39 41.28 42.04 71.07 10.7418 Parbhani 466310 6.76 44.71 48.53 50.27 62.94 11.6920 Beed 450675 6.23 37.20 56.57 49.95 71.26 9.9021 Nanded 502010 15.33 36.44 48.23 59.13 73.48 13.7122 Osmanabad 283645 9.97 24.20 65.83 46.45 81.66 5.7423 Latur 344300 7.70 17.13 75.17 61.55 80.26 10.8624 Buldhana 464550 13.00 51.07 35.93 57.95 51.26 12.1625 Akola 533845 9.27 53.68 37.05 54.40 55.34 20.4427 Amaravati 521195 11.37 60.03 28.60 74.56 68.08 26.8728 Yavatmal 528650 24.62 49.10 26.28 51.98 46.06 11.6429 Wardha 272155 10.50 57.42 32.08 75.82 49.59 17.7530 Nagpur 773170 8.57 45.44 45.99 74.65 65.34 42.8131 Bhandara 540010 2.59 75.66 21.75 62.64 36.51 13.8433 Chandrapur 480980 18.99 46.72 34.29 50.22 43.35 15.4934 Gadchiroli 230950 29.42 51.95 18.64 31.00 38.67 7.05
Maharashtra 19830735 9.83 32.24 57.93 69.40 68.49 29.56
# Includes Mumbai City and Mumbai Suburban District.Note: Figures for newly formed districts i.e. Nandurbar, Hingoli, Washim and Gondia are not available, hence combined figures are given
for undivided districts viz. Dhule, Parbhani, Akola and Bhandara respectively.Source: Population Census Table on Houses and Household Amenities-1991.
286 Human Development Report Maharashtra 2002

Human Development IndicatorsTable 117
HDI, AIL, AIIMR, IIL and IIIMR
Sr. No. District HDI 2000 AIL 2001 AIIMR 1991
IIL1991–2001
IIIMR1981–1991
BackwardDistricts
1 2 3 4 5 6 7 8 1 Mumbai, High High High High Low Low 2 Mumbai (Suburban) High High High Low Low 3 Thane High High High High 4 Raigad High High High 5 Ratnagiri Low Low Backward 6 Sindhudurg High High Low Low Backward 7 Nashik Medium Low Low 8 Dhule Low Low High Low Backward 9 Nandurbar Low Low Low Low10 Jalgaon Medium Low11 Ahmednagar Medium High High12 Pune High High High Low13 Satara High High High14 Sangli High High High15 Solapur Low Low Low16 Kolhapur High High High Low17 Aurangabad Medium High High18 Jalna Low Low Backward19 Parbhani Low Low High High Backward20 Hingoli Low Low High21 Beed Low Low High Backward22 Nanded Low Low High Backward23 Osmanabad Low Low Low Backward24 Latur Low Low High Backward25 Buldhana Low Low High Backward26 Akola Low High Low High Low Backward27 Washim Low Low Low Low28 Amaravati Medium High Low High Low Backward29 Yavatmal Low Low High Low Backward30 Wardha Medium High Low Backward31 Nagpur High High High32 Bhandara Low High Low High High Backward33 Gondiya Low High Low High High34 Chandrapur Low Low Low Backward35 Gadchiroli Low Low Low Low Backward
HDI – Human Development Indices; AIL – Achievement Indices for Literacy; AIIMR – Achievement Indices for Infant Mortality Rate; IIL – Improvement Indices for Literacy; IIIMR – Improvement Indices for Infant Mortality Rate.
Note: High, Medium, Low, Backward as reported in Government of Maharashtra (1997).High AIL, 2001: 0.75 to 1.00; High AIIMR, 1991: 0.60 to 1.00Low AIL, 2001: 0.70 and below; Low AIIMR, 1991: 0.45 and below.High IIL, 1991 to 2001: 0.11 to 0.14; High IIIMR, 1981 to 1991: 0.4 to 0.5;Low IIL, 1991 to 2001: 0.02 and below; Low IIIMR, 1981 to 1991: 0.20 and below.
References →
← Contents
Annexure Tables 287

References
Acharya, Sarthi V.G. Panwalker (1988), The EmploymentGuarantee Scheme in Maharashtra: Impact on Menand Women Workers, Regional Research Paper, ThePopulation Council, Bangkok.
Acharya, Sarthi (1997), Costs and Utilisation of Education:Empirical Explorations from Maharashtra, Discus-sion Paper Series 26, Project of the United NationsDevelopment Programme, UNDP/GoI/IDRC Re-search Project, Centre for Development Studies,Thiruvananthapuram.
Agnes, F. (1988), ‘Violence in the Family: Wife Beating’,in R. Ghadially (edited) ‘Women in Indian Society,A Reader’, Sage, New Delhi.
Agnihotri, Satish B. (2001), ‘Declining Infant and ChildMortality in India: How do Girl Child Fare?’, Eco-nomic and Political Weekly, 20 January.
Ahluwalia, M.S. (2000), ‘Economic Performance ofStates in Post-Reforms Period’, Economic and Politi-cal Weekly, Vol. XXXV, No. 19, pp. 1637–48.
Ahuja, Ram (1998), Violence against Women, Rawat Pub-lications, New Delhi.
Banerji, Rukmini (2000), ‘Poverty and Primary School-ing, Field Studies from Mumbai and Delhi’, Eco-nomic and Political Weekly, 4–10 March.
Bang, Rani undated, ‘Child Deaths in the Tribal Areas inVidarbha: The Problem and the Possible Solutions’,Report to the Governor of Maharashtra, VidarbhaStatutory Development Board.
Banthia, J.K. (2001), Census of India 2001, Series-1, In-dia, Provisional Population Totals, Paper 1 of 2001,New Delhi.
Basu, Kaushik, James E. Foster and S. Subramanian(2000), ‘Isolated and Proximate Illiteracy and WhyThese Concepts Matter in Measuring Literacy andin Designing Educational Programmes’, Economicand Political Weekly, 8–14 January.
Bhat, Mari P.N. (1996), ‘Contours of Fertility Decline inIndia: A District-level Study Based on the 1991Census’, in Population Policy and ReproductiveHealth, edited by K. Srinivasan, Population Foun-dation of India, Hindustan Publishing Corpora-tion, New Delhi.
Bhatia, M. and A. Mills (1997), ‘Contracting Out DietaryServices by Public Hospitals in Mumbai’, in Bennet,McPake and Mills eds, Private Health Providers inDeveloping Countries, Zed Books, London.
Bhatty, Kiran (1998), ‘Educational Deprivation in India:
A Survey of Field Investigations’, Economic and Po-litical Weekly, 11 July.
Bhende, M.J., T.S. Walkar, S.S. Lieberman, and J.V.Venkataram (1990), The EGS and The Poor:Evidence from Longitudinal Village Studies, Interna-tional Crops Research Institute for the Semi-AridTropics, Hyderabad.
Birdsall, Nancy (1993), Social Development Is EconomicDevelopment, WPS 1123, World Bank, WashingtonD.C.
Biswas, Samir Kumar (2001), ‘Provisional Population To-tals Paper–1 of 2001’, Census of India 2001, Series-28, Maharashtra, Director of Census Operations,Maharashtra.
Biswas, S.K. (2001), Census of India 2001, Series-28,Maharashtra, Provisional Population Tables, Paper2 of 2001, Rural-Urban Distribution of Population,New Delhi.
—— (2001), Census of India 2001, Maharashtra Series-28, Provision Population Totals, Paper 1 of 2001,New Delhi.
Bose, Ashish (2001), ‘Census of India 2001 and After’,Economic and Political Weekly, 19 May.
Central Bureau of Health Intelligence (CBHI) (1998),‘Health Information of India 1995–96’, CBHI, Di-rectorate General of Health Services, Governmentof India, New Delhi.
Central Statistical Organisation (CSO) (1997), StatisticalAbstract of India 1997, Ministry of Planning andProgramme Implementation, New Delhi, India.
—— (1998), Government of India, Selected Socio-Eco-nomic Statistics, 1998, New Delhi, India.
—— (2000), Statistical Abstract of India 1999, Ministryof Planning and Programme Implementation, Gov-ernment of India, New Delhi.
Centre for Operational Research and Training (CORT)(1998 and 1999), Rapid House Hold Survey RCHProject Phase I and Phase II) (all districts), CORT,Baroda.
Centre for Operations Research and Training, Vadodaraand International Institute for Population Sciences,Mumbai (2000), National Family Health Survey(1998–99), Maharashtra Preliminary Report,Mumbai.
Chatterjee, G.S. and N. Bhattacharya (1974), ‘BetweenState Variations in Consumer Prices and Per CapitaHousehold Consumption in Rural India’, in P.K.
References 289

Bardhan and T.N. Srinivasan (eds), Poverty and In-come Distribution in India, Statistical PublishingSociety, Calcutta, pp. 337–68.
Committee on the Status of Women in India (1974),‘Towards Equality, Department of Social Welfare’,Government of India, New Delhi.
D’Lima, H. (1983), Women in Local Government, A Studyof Maharashtra, Concept Publishing Company,Delhi.
Dandekar, Kumudini and Manju Sathe (1980), ‘Employ-ment Guarantee Scheme: An Employment Oppor-tunity for Women’, Economic and Political Weekly,Vol. XV, No. 15, pp. 707–13.
Datta, Bishakha (1998) ed., ‘And Who Will Make TheChapatis? A Study of All-Women Panchayats inMaharashtra’, Stree, Calcutta, p. XIX.
Davar, Bhargavi V. (1985), ‘Mental Illness among IndianWomen’, Economic and Political Weekly, 11 Novem-ber.
De, Anuradha, Claire Noronha and Meera Samson(2001), ‘India: Private Schools and Universal Ele-mentary Education, South Asia Education Sector,Technical Working Paper No. 3’, The World Bank,New Delhi.
Deaton, Angus and J. Muellbauer (1988), Economics andConsumer Behaviour, Cambridge University Press,Cambridge.
Deshpande, R.S. (1998), ‘Land Reforms and AgrarianStructure in Maharashtra’, Journal of Indian Schoolof Political Economy, Vol. 10, No. 1, pp. 1–23.
Deshpande, Sudha L. (2000), ‘Population and Demo-graphic Features in Socio-Economic Review of Bri-hanmumbai (1997–98)’, Centre for Research andDevelopment, Mumbai.
Deshpande, Sudha L. and L.K. Deshpande (1990), ‘La-bour Mobility in Bombay’s Manufacturing Sector’,International Labour Organisation/Asian RegionalTeam for Employment Promotion, New Delhi.
Diewert, Erwin (1976), ‘Exact and Superlative IndexNumbers’, Journal of Econometrics, Vol. 4, No. 2,pp. 115–45.
Directorate General of Health Services (DGHS) (2000),Bulletin on Rural Health Statistics in India June 2000,DGHS, Ministry of Health And Family Welfare,Government of India, New Delhi.
Directorate of Census Operations Maharashtra (2001),Census of India Series-28 Maharashtra, Directorateof Census Operations, Mumbai.
Directorate of Economics and Statistics (1997), StatisticalAbstract of Maharashtra State 1991–92 and 1992–93, Government of Maharashtra, Mumbai.
—— (2000), Statistical Abstract of Maharashtra State
1993–94 and 1994–95, Government of Maha-rashtra, Mumbai.
—— (2001), District Domestic Product of Maharashtra,Government of Maharashtra, Mumbai.
Dixit, Rekha (2001), ‘Strong Arm Tactics in Birth Con-trol May Backfire’, Times of India, 10 July.
—— (2001), ‘Population Miseries Multiply as the “C”Word Remains Taboo’, Times of India, 11 July.
—— (2001), ‘Twist to the Census Tale: Should StatesScript Their Own Population Policy?’, Times of In-dia, 8 July.
Drèze, Jean (1990), ‘Famine Prevention in India’, in JeanDrèze and Amartya Sen (eds) The Political Economyof Hunger, Famine Prevention Volume 2, Oxford Uni-versity Press, Oxford, pp. 13-122.
Drèze, Jean and Amartya Sen (1995), India: EconomicDevelopment and Social Opportunity, Oxford Uni-versity Press, New Delhi.
Duggal, R.S., Nandraj and A. Vadair (1995a), ‘HealthExpenditure across States——Part-1’, Economicand Political Weekly, 30(15), pp. 834–44.
Duggal, Ravi and Sucheta Amin (1989), ‘Cost of HealthCare: A Household Survey in Community Health’,Foundation for Research in Community Health(Mimeograph), Mumbai.
Dutta, Bhaskar, Manoj Panda and Wilima Wadhwa(1997), ‘Human Development in India’, in (ed.) S.Subramaniam, Measurement of Inequality and Pov-erty, Oxford University Press.
Dutta, K.K. (1990), ‘Mortality Patterns amongst RuralPregnant Women in Alwar, Rajasthan—A CohortStudy’, Health Population Perspective, Volume 3.
Economic and Political Weekly (1999), ‘Impact of Irriga-tion Management Transfer in Maharashtra’, EPWReview of Agriculture, 27 March–2 April.
—— (2001), Editor, ‘Behind the Population Numbers’,31 March.
Faujdar, Ram and T.K. Roy (1997), ‘Fertility Transitionin Maharashtra and Its Future Prospects’, Paper pre-sented at the Conference organized by Institute ofHealth Management, Pune.
Friedrich Ebert Stiftung (1992), ‘Woman in Politics:Forms and Processes’, Delhi.
Fukuzawa, H. (1982), ‘Agrarian Relations in WesternIndia’, in Cambridge Economic History of India,Volume II c, 1757-c, 1970, edited by Dharma Ku-mar and Meghnad Desai, Orient Longman, NewDelhi.
Gait, E.A. (1913), Census of India 1911 India, Vol. I, PartII-Tables, Calcutta.
Geetha, S. and M.H. Suryanarayana (1993), ‘Revamping
290 Human Development Report Maharashtra 2002

PDS: Some Issues and Implications’, Economic andPolitical Weekly, Vol. XXVIII, No. 41, pp. 2207–13.
George, Alex, I. Shah and S. Nandraj (1193), HouseholdExpenditure in Madhta Prasesh, Foundation for Re-search in Community Health, Pune/Mumbai.Goodkind, D. (1996), ‘On Substituting Sex Prefer-ence Strategies in East Asia: Does Prenatal Sex Se-lection Redap. Postnatal Discrimination?’,Population and Development Review, 22(1).
Gopalan, C. (1995), ‘Towards Food and Nutrition Secu-rity’, Economic and Political Weekly, 30 December.
Government of India (1979), Report of the Task Force onProjections of Minimum Needs and Effective Con-sumption Demand, Perspective Planning Division,Planning Commission, New Delhi.
—— (1993), Report of the Expert Group on Estimation ofProportion and Number of Poor, Perspective Plan-ning Division, Planning Commission, New Delhi.
—— (1997), Focus on the Poor, Ministry of Civil Supplies,Consumer Affairs and Public Distribution, NewDelhi.
—— (2000), Ninth Five Year Plan 1997–2002 Volume-I,Development Goals, Strategy and Policies and VolumeII Thematic Issues and Sectoral Programmes, VidhiPublishing Private Limited, New Delhi.
—— (2000), National Population Policy 2000, as re-printed in the Yojana, August 2000.
—— (2001a), Census of India 2001, Maharashtra Popu-lation Data, Directorate of Census Operations, Ma-harashtra, Mumbai.
—— (2001b), Poverty Estimates for 1999–2000, PressInformation Bureau, New Delhi.
—— (2001c), Economic Survey: 2000–2001, Ministry ofFinance, New Delhi.
—— (2001d), Report of the Task Force on EmploymentOpportunities, Planning Commission, New Delhi.
Government of Maharashtra (1980), Joint Evaluation Re-port on Employment Guarantee Scheme of Maha-rashtra, Directorate of Economics and Statistics,Mumbai.
—— (1984), Report of the Fact Finding Committee onRegional Imbalance in Maharashtra, Planning De-partment, Mumbai.
—— (1996), A Report on Household Consumer Expendi-ture (Schedule 1.0) Based on National Sample Survey43rd Round (July 1997 to June 1988), Directorateof Economics and Statistics, Mumbai.
—— (1997), ‘Maharashtra Health System DevelopmentProject Proposal 1997’, Mumbai, GoM.
—— (1997), Relative Levels of Development, Backlog andRemoval of Regional Imbalances, Volume I, Reportof the Indicators and Backlog Committee, Mumbai.
—— (1998), ‘Women and Men in Maharashtra’ (1995),Directorate of Economics and Statistics, PlanningDepartment, Mumbai.
—— (2000), Economic Survey of Maharashtra, Director-ate of Economics and Statistics, Planning Depart-ment.
—— (2000), Maharashtra State Population Policy, 2000,Mumbai.
—— (2000), Statistical Abstract of Maharashtra 1993–94and 1994–95, Directorate of Economics and Statis-tics, Government of Maharashtra, Mumbai.
—— (Not dated), Selected Indicators for Districts inMaharashtra and the States of India 1997–98, Di-rectorate of Economics and Statistics, Planning De-partment, Mumbai.
—— Finance and Revenue Accounts, Mumbai, Govern-ment of Maharashtra (various years).
—— Economic Survey of Maharashtra 2000–2001, Direc-torate of Economics and Statistics, Planning De-partment, Government of Maharashtra.
—— (2001), District Domestic Product of Maharahstra1993–94 to 1998–99, Directorate of Economicsand Statistics, Planning Department, Mumbai.
—— Lokarajya, May 1985.—— Mahatma Phule, Samagra Vanymaya, published by
the Sahitya Sanskritik Mandal.Gupte, Manisha and Anita Borkar (1987), Women’s
Work, Fertility and Access to Health Care, ReportSubmitted to the Task Force on Health, Nationalon Self-Employed Women and Women in the Un-organized Sector, Mumbai.
International Institute for Population Science (1999), Na-tional Family Health Survey (1998–99), India Re-port, Mumbai.
—— (2000), Reproductive and Child Health Project PhaseI Rapid Household Survey 1998, International Insti-tute for Population Sciences, Mumbai.
—— (2001a), Reproductive and Child Health: RapidHousehold Survey Project Phase-I and Phase II, Inter-national Institute for Population Sciences, Mumbai.
—— (2001b), Reproductive and Child Health Project Fa-cility Survey Report, International Institute for Popu-lation Sciences, Mumbai.
International Institute for Population Sciences andMEASURE DHS+, ORC-MACRO (2000), Na-tional Family Health Survey (NFHS-2), 1998–99,Mumbai, India.
Iyengar, Chandra (1997), ‘Women in Politics: The Maha-rashtra Experience’ in Veena Poonacha (edited)‘Women, Empowerment and Political Participa-tion’, Research Centre for Women’s Studies,S.N.D.T Women’s University.
References 291

Jandhyala, Tilak B.G. (2000), Education Poverty in India,NIEPA Occasional Paper 29, National Institute ofEducational Planning and Administration, NewDelhi.
—— (1995), ‘Costs and Financing of Education in India:A Review of Issues, Problems and Prospects’, Dis-cussion of Paper Series No. 5, Centre for Develop-ment Studies, Trivandrum.
Jesani, A., R. Duggal and M. Gupte (1996), NGOs inRural Healthcare, FRCH, Pune.
Kakwani, N. (1993), ‘Performance in Living Standards:AnInternational Comparison’, Journal of Develop-ment Economics,41, pp. 307–36.
Kamdar, Sangita (2001), Economic Growth and HumanDevelopment: A Study of Maharashtra, Dissertationsubmitted for Ph.D. Degree, Department of Eco-nomics, University of Mumbai.
Ketkar, Kumar, Katha Swatantryachi.Kishwar, Madhu (1988), ‘Nature of Women’s Mobilisa-
tion in Rural India’, Economic and Political Weekly,24–31 December.
—— (1995), ‘When Daughters are Unwanted: Sex De-termination Tests, India’, Manushi (86), January–February.
Kulkarni, Sanjeev (1986), ‘Prenatal Sex DeterminationTests and Female Foeticide in Bombay City: AStudy’, FRCH, Mumbai.
Kumari, Ranjana (1995), ‘Rural Female Adolescence: In-dian Scenario’, Social Change, 25, Nos. 2 and 3,June–September.
Labour Market Intervention, International Labour Organ-isation, Asian Regional Team for Employment Pro-motion, New Delhi.
Lieberman, S.S. (1985), ‘Field-Level Perspectives on Ma-harashtra’s Employment Guarantee Scheme’, PublicAdministration and Development, Vol. 5, No. 2, pp.109–27.
Lingam, Lakshmi (1999), ‘Women’s Occupational andReproductive Health: Research Evidences andMethodological Health’, Centre for Health Studies,Tata Institute of Social Sciences, Mumbai and In-ternational Labour Organisation, New Delhi.
Madhiwala, N., S. Nandraj and R. Sinha (2000), HealthHouseholds and Women’s Lives: A Study of Illness andChild Bearing among Women in Nashik District,Centre for Enquiry into Health and Allied Themes,Mumbai.
Maharashtra State Commission for Women (1997),‘Status of Women in Maharashtra, A SituationalAnalysis’, 1981–95, Mumbai.
Mahendra, Premi (2001), ‘The Missing Girl Child’, Eco-nomic and Political Weekly, 26 May.
Malini, Karkal (2001), Paper prepared for a Seminar,‘Interrogating Disciplines/Disciplining Gender? To-ward a History of Women’s Studies in India’, 19–22February, New Delhi. Mehandale, G.B., Shree RalaShivachattrapati, Volume I (1st Book).
Minhas, B.S. and M.G. Sardana (1990), ‘Note on Poolingof Central and State Samples Data of National Sam-ple Survey’, Sarvekshana, Vol. XIV, No. 1, Issue No.44, pp. 1–4.
Minhas, B.S., S.M. Kansal and L.R. Jain (1992), ‘TheIncidence of Urban Poverty in States (1970–1 to1983)’, in Barbara Harriss, S. Guhan and R.H.Cassen (eds), Poverty in India: Research and Policy,Oxford University Press, Mumbai, pp. 142–70.
Ministry of Finance (MOF) (2000), Economic Survey1999–2000, Economic Division, Ministry of Fi-nance, Government of India, New Delhi.
Ministry of Health and Family Welfare (MOHFW)(1999), Family Welfare Programme in India: YearBook, 1997–98, Department of Family Welfare,MOHFW, Government of India, New Delhi.
Ministry of Health and Family Welfare (1999), FamilyWelfare Year Book, Government of India, NewDelhi.
Mitra, Nishi and Meera Gopichandran (2000), Combat-ing Violence, A Select Bibliography with Annota-tions, Unit for Women’s Studies, TISS Mumbai,India.
Mulay, Sanjeevanee (1999), ‘Demographic Transition inMaharashtra, 1980–93’, in Economic and PoliticalWeekly, Vol. XXXIV, Nos. 42 and 43, 16–22/23–29October, Mumbai.
Nanda, A.R. (1992), Final Population Totals: Brief Analysisof Primary Census Abstract of India 1991, Series I,India, Paper 2 of 1992, Registrar General and Cen-sus Commissioner, India.
Nandraj, S, N. Madhiwala, R. Sinha, and A. Jesani(1998), ‘Women and Health Care in Mumbai—AStudy of Morbidity, Utilisation and Expenditure onHealthcare in the Metropolis’, CEHAT, Mumbai.
Nandraj, S. and R. Duggal (1996), ‘Physical Standardsin Private Health Care Sector’, Radical Journal ofHealth, II(2 and 3), pp. 141–84.
National Alliance for the Fundamental Right to Educa-tion (2001), Draft-National Status Report on Edu-cation, National Convention, April 2001.
National Council for Applied Economic Research(NCAER) (1992), Household Survey of MedicalCare, NCAER, New Delhi. National Council forEducational Research and Training (NCERT)(1998), Sixth All-India Educational Survey, NCERT,New Delhi.
292 Human Development Report Maharashtra 2002

National Council for Applied Economic Research(NCAER) (1993), ‘Results on Participation in Edu-cation for Remainig 8 Major States’, Sarvekshana,NSS 42nd Round, July 1986–87, 56th Issue, Vol.XVII (1), Department of Statistics, Ministry ofPlanning, Government of India, New Delhi.
National Sample Survey Organisation (1983), ‘SurveyResults: Per Capita Per Diem Intake of Nutrients,NSS 27th Round, October 1972–September 1973’,Sarvekshana, Vol. VI, Nos. 3–4, Issue No. 18, pp.S1–S88.
—— (1986), ‘Results on the Third Quinquennial Surveyon Consumer Expenditure, NSS 38th Round’,Sarvekshana, Vol. IX, No. 4, pp. S1–S102.
—— (1989), ‘Results on Per Capita Consumption ofCereals for Various Sections of Population, NSS38th Round (1983)’, Sarvekshana, Vol. XIII, No. 2,pp. S-1–S–176.
—— (1992), ‘Morbidity and Utilisation of Medical Serv-ices, NSS 42nd Round July 1986–June 1987’,Sarvekshana, April 1992, pp. 55–75, pp. S-1–S-134.
—— (1993), ‘A Note on Fourth Quinquennial Surveyon Consumer Expenditure, NSS 43rd Round (July1987–June 1988)-Sub Sample 1 and 2 Results, (c)Proportions of Households Benefiting from Speci-fied Poverty Alleviation Programmes by Socio-Eco-nomic Status’, Sarvekshana, Vol. XVII, No. 2, pp.100–12.
—— (1997a), ‘Survey Results on Nutritional Intake inIndia-NSS 50th Round (July 1993–June 1994)’,Sarvekshana, Vol. XXI, No. 2, pp. S-1–S-214.
—— (1997b), Operational Land Holdings in India, 1991–92, Salient Features, Department of Statistics, Min-istry of Planning and Programme Implementation,New Delhi.
—— (1998), ‘A Note on IRDP Assistance and Participa-tion in Public Works, 1993–94, NSS 50th Round(July 93–June 94)’, Sarvekshana, Vol. XXI, No. 4,pp. 55–74.
—— (1998a), Morbidity and Treatment of Ailments ReportNo. 441, NSSO, Department of Statistics, Govern-ment of India, New Delhi.
—— (1998b), ‘Changing Pattern of Consumption Ex-penditure in India’, Sarvekshana Analytical ReportNo. 2, NSSO, Department of Statistics, Govern-ment of India, New Delhi.
—— (1998c), ‘Housing Conditions in India’, Report No.429, NSSO, Department of Statistics, Governmentof India, New Delhi.
—— (2000), ‘How Real Is the Secular Decline in RuralPoverty?’, Economic and Political Weekly, Vol.XXXV, No. 25, pp. 2129–40.
Nisonoff, Laurie (1997), Introduction to Part 3, in NaliniVishvanathan (edited) ‘The Women and Develop-ment Reader’, Zed Books Ltd.
Ortemeyer, L.E. (1979), ‘Female’s Natural Advantage? OrThe Unhealthy Environment of Males? The Statusof Sex Mortality Differentials’, Women’s Health,4(2), pp. 121–33.
Pai, Madhuri (1999), ‘Inclusive Education of Childrenin Dharavi: A Case Study’, Indian Journal of Pedi-atrics, Mumbai.
Palanidurai, K.V. (2000), Draft Chapter on Per CapitaIncome—State and Districts, State Planning Com-mission, Government of Tamil Nadu, Chennai.
Panikar, P.G.K. (1980), ‘Inter-Regional Variation in Calo-rie Intake’, Economic and Political Weekly, Vol. XV,Nos. 41, 42 and 43, pp. 1803–14.
Parasuraman, Sulabha et al (2001), Rapid HouseholdSurvey Phase I and II, 1998–99, Reproductive andChild Health Project, International Institute forPopulation Sciences, Mumbai.
Parish, William, Rukmini Banerji and Nidhi Mehrotra(1994), ‘Gender Wage Gap in Malaysia and Tai-wan’, Population Research Center, Discussion PaperSeries, NORC/University of Chicago, Chicago.
Patankar, Indumati (1984), ‘Confronting Male Power: AllWomen Panel Contests Panchayat Election’,Manushi No. 25.
Phadke, Y.D., Visavya Shatakatil Maharashtra, VolumeIV, Planning Division, Government of Ma-harashtra, (1992), ‘Maharashtra’s Population Prob-lem Study Committee’s Report’, 1992, Mumbai.
Poonacha, Veena (1997), (ed.) Women, Empowermentand Political Participation, Research Centre forWomen’s Studies, S.N.D.T. Women’s University.
Population Foundation of India (2001), District Profile:Maharashtra, New Delhi.
Population Research Centre, Gokhale Institute of Politicsand Economics, Pune and International Institutefor Population Sciences, Mumbai (1994), NationalFamily Health Survey (MCH and Family Plan-ning), Maharashtra, 1992–93, Mumbai.
Prabhu, Seeta K. (1992), ‘Regional Dimensions of Hu-man Development in India: Implications for theEighth Plan’, Paper presented at the seminar, ‘IssuesPertaining to the Eighth Plan’, University of Mum-bai, 16 April, mimeo.
—— (1997), Structural Adjustment and Human Develop-ment: A Study of Two Indian States, Prepared for theUNDP Research Project on Strategies and Financ-ing for Human Development, Thiruvananthapu-ram.
—— (2000), Economic Reform and Social Sector Develop-ment: A Study of Two Indian States, Sage, New Delhi.
References 293

Prabhu, Seeta K. and P.C. Sarkar (1992), ‘Identificationof Levels of Development: Case of Maharashtra’,Economic and Political Weekly, Vol. XXVII, No. 36,pp. 1927–37.
Prabhu, Seeta K. and Sangita Kamdar (1999), Maha-rashtra’s Social Sectors: Growth without Human De-velopment, Wo r k i n g Pa p e r 9 9 / 1 , Ma r c h ,Department of Economics, University of Mumbai,Mumbai.
Prabhu, Seeta, K. and Somnath Chatterjee (1993), SocialSectors Expenditures and Human Development: AStudy of Indian States, Development ResearchGroup, Study No. 6, Reserve Bank of India, Mum-bai.
Rajasekaran, N. (1998), ‘Land Reforms in Maharashtra:A Regional Analysis’, Review of Development andChange, Vol. III(2), July–December, pp. 238–63.
——Rajasekaran, N. ‘Trends in Operational Holdings inMaharashtra: An Analysis of Determinants’, pub-lished by Gokhale Institute of Politics and Econom-ics.
Raju, Saraswati (1991), ‘Gender and Deprivation: ATheme Revisited with a Geographical Perspective’,Economic and Political Weekly, 7 December.
Ramachandran, Vimala, Subir Shukla, Philip Cohen,Robin Alexander and Malcolm Mercer (2001), Re-flections on Equity, Quality and Local Planning inthe District Primary Education Programme, Occa-sional Papers, The European Commission, NewDelhi.
Rao, Mohan (2001), Times of India, (interview with RupaChinai), July 1.
Rao, Mohan and Devaki Jain (2001), ‘National Popula-tion Policy 2000: Re-examining Critical Issues’,Economic and Political Weekly, 21–7 April, p. 1299.
Ravallion, Martin (1991), ‘Reaching the Rural Poorthrough Public Employment: Arguments, Evi-dence, and Lessons from South Asia’, The WorldBank Research Observer, Vol. 6, No. 2, pp. 153–75.
Ravallion, Martin, Gaurav Datt and Shubham Chaud-huri (1993), ‘Does Maharashtra’s EmploymentGuarantee Scheme Guarantee Employment? Effectsof the 1988 Wage Increase’, Economic Developmentand Cultural Change, Vol. 41, No. 2, pp. 251–75.
Ravindra, R.P. (1991), Fighting Female Foeticide—A LongWay to Go, The Lawyers Collectives, Mumbai, Au-gust.
Registrar General, India (RGI) (1997), ‘District LevelEstimates of Fertility and Mortality for 1991 andTheir Inter Relation with Other Variables’, Occa-sional Paper No 1 of 1997, Registrar General, India,New Delhi.
—— (1998), Maharashtra State District Profile 1991,Registrar General, India, New Delhi.
—— (1999), SRS Bulletin, Sample Registration System,New Delhi.
—— (1998), Medical Certification of Cause of Death,1993, Registrar General, India, New Delhi.
—— (1999), Compendium of India’s Fertility and Mor-tality Indicators, 1971–1997, Based on the SampleRegistration System’, Registrar General, India, NewDelhi.
—— (1999), Medical Certification of Cause of Death,1994, Registrar General, India, New Delhi.
Registrar General, India, Census of India (2001), Indiaand Maharashtra, Provisional Population Totals, Pa-per I of 2001, Registrar General, New Delhi.
Sakhalkar, Eknath and Subhash Bhende, MaharashtrachiManachinhe, Volume I and II.
Saldanha, Denzil (1999), Residual Illiteracy and UnevenDevelopment I, II and III, Economic and PoliticalWeekly, 3–9, 10–16, and 17–23 July.
Salunke, S.R., S.S. Narvekar, V.T. Godbole, M.A. Talwal-kar (1997), Program For Children in Maharashtra:An Assessment, Directorate of Health Services, Ma-harashtra, UNICEF, Mumbai.
Santappa, V. (1996), ‘Estimates of District Income inKarnataka’, The Journal of Income and Wealth, Vol.18, No. 1, pp. 7–28.
Schultz, T.P. (1968), ‘Transforming Traditional Agricul-ture’, University of Chicago Press, Chicago.
Sen, Amartya (1984), Resources, Values and Development,Oxford University Press, New Delhi.
—— (1987), ‘The Standard of Living: Lecture II, Livesand Capabilites’, in Amartya Sen, John Muellbauer,Ravi Kanbur, Keith Hart and Bernard Williams,The Standard of Living, The Tanner Lectures, 1985,Cambridge Universitv Press, Cambridge, pp. 20–38.
—— (1990), ‘More than 100 Million Women are Miss-ing’, The New York Review, 20 December.
—— (1992), Inequality Reexamined, Russell Sage Foun-dation, Clarendon Press, Oxford, New York.
—— (1993), ‘Capability and Well-Being’ in (eds) MarthaNussbaum and Amartya Sen, The Quality of Life, AStudy Prepared for the World Institute for Devel-opment Economics Research (WIDER) of theUnited Nation University, Oxford University Press,New Delhi, pp. 30–53.
Shah, Nandita and Nandita Gandhi (1997), The QuotaQuestion: Women and Electoral Seats in Veena,Poonacha (edited) ‘Women, Empowerment and Po-litical Participation’, Research Centre for Women’sStudies, S.N.D.T. Women’s University.
294 Human Development Report Maharashtra 2002

Shariff, Abusaleh (1999), Human Development Report: AProfile of Indian States, Oxford, Delhi.
Shiratsuka, Shigenori (1999), ‘Measurement Errors in theJapanese Consumer Price Index’, Monetary and Eco-nomic Studies, pp. 69–101.
Shiva Kumar, K. (1991), ‘Human Development Index forIndian States’, Economic and Political Weekly,pp. 2243–44.
Shiva, Mira, Omita Goyal and Poonam Krishnan (1992),State of India’s Health, Voluntary Health Associationof India, Delhi.
Sonpar, Shobna and Ravi Kapur (2001), ‘Non-Conven-tional Indicators: Gender Disparities under Struc-tural Reforms’, Economic and Political Weekly, 6January.
Sujan, bi-monthly published by Yuva Shakti Pratishthan,A mouthpiece of Voluntary Organisations, Issuespublished in January 1991, March 1991, May 1991and August 1991.
Sundar, Ramamani (1995), ‘Household Survey of HealthCare Utilisation and Expenditure’, Working PaperNo. 53, National Council for Applied EconomicResearch, New Delhi.
Sundaram, K. (2001), ‘Employment-UnemploymentSituation in the Nineties: Some Results from NSS55th Round Survey’, Economic and Political Weekly,17 March.
Suryanarayana, M.H. (1996), ‘Food Security and CalorieAdequacy Across States: Implications for Reform’,Journal of Indian School of Political Economy,Vol. VIII, No. 2, pp. 203–65.
Tata Institute of Social Sciences, ‘Impact of the Ma-harashtra Rural Credit Programme in Phase I’, Dis-trict-Study conducted in January 2000.
Thakkar, Usha and Rohini Gawankar (1997), Reservation
of Seats and the Empowerment of Women: EmergingIssues in Veena Poonacha (edited) ‘Women, Empow-erment and Political Participation’, Research Centrefor Women’s Studies, S.N.D.T. Women’s University.
UNDP (1997), Human Development Report, Publishedfor UNDP—Oxford University Press, New York.
Uplekar, M. and S. Rangan (1996), Tackling TB, Foun-dation for Research in Community Health, Pune.
Vaidyanathan, A. (1986), ‘Labour Use in Rural India: AStudy of Spatial and Temporal Variations’, Economicand Political Weekly, Review of Agriculture,Vol. XXI, No. 52. pp. A–130-A–146.
Vanaik, Achin (1986), ‘Female Foeticide in India’, TheTimes of India, 20 June.
Vetticad, Anna M.M. and Ramesh Vinayak (2001), ‘TheGender Gestapo’, India Today, 16 July.
Visaria, Leela (1999), ‘Deficit of Women in India: Mag-nitude, Trends, Regional Variations and Determi-nants’, in Bharati Ray and Aparna Basu (eds) FromIndependence Towards Freedom: Indian Women Since1947, Oxford University Press, New Delhi.
Walker, Thomas S. and James G. Ryan (1990), Villageand Household Economies in India’s Semi-Arid Trop-ics, Johns Hopkins University Press, Baltimore.
Walker, Thomas S., R.P. Singh, and M. Asokan (1986),‘Risk, Benefits, Crop Insurance and Dryland Agri-culture’, Economic and Political Weekly, Vol. XXI,Nos. 25 and 26, pp. A81–A88.
World Bank (1990), World Development Report 1990:Poverty, Oxford University Press, Oxford.
—— (1997), ‘India: Achievements and Challenges inReducing Poverty’, A World Bank Country Study,World Bank, Washington DC.
—— (2001), World Development Report 2000–2001, ‘At-tacking Poverty’, Oxford University Press, NewYork.
← Contents
References 295