Coastal slope instability in contrasting geoenvironmental conditions
Tanzania Journal of Health Research Doi: http://dx.doi.org/10.4314/thrb.v16i3.2Volume 16, Number 3, July 2014
1
Human activity spaces and plague risks in three contrasting landscapes in LushotoDistrict, Tanzania
PROCHES HIERONIMO1, HUBERT GULINCK2, DIDAS N. KIMARO1*, LOTH S. MULUNGU3, NGANGA I. KIHUPI1,BALTHAZAR M. MSANYA5, HERWIG LEIRS4 and JOZEF A. DECKERS2
1Department of Agricultural Engineering and Land Planning, Sokoine University of Agriculture, P.O. Box 3003,Morogoro, Tanzania2Department of Earth and Environmental Sciences, University of Leuven, Celestijnenlaan 200E, Leuven, Belgium3Pest Management Centre, Sokoine University of Agriculture, P.O. Box 3110, Morogoro, Tanzania4Evolutionary Ecology Group, Universiteit Antwerpen, Groenenborgerlaan 171, B-2020 Antwerpen, Belgium5Department of Soil Science, Sokoine University of Agriculture, P.O. Box 3008, Morogoro, Tanzania_________________________________________________________________________________________Abstract: Since 1980 plague has been a human threat in the Western Usambara Mountains in Tanzania.However, the spatial-temporal pattern of plague occurrence remains poorly understood. The mainobjective of this study was to gain understanding of human activity patterns in relation to spatialdistribution of fleas in Lushoto District. Data were collected in three landscapes differing in plagueincidence. Field survey coupled with Geographic Information System (GIS) and physical sample collectionswere used to collect data in wet (April to June 2012) and dry (August to October 2012) seasons. Dataanalysis was done using GIS, one-way ANOVA and nonparametric statistical tools. The degree of spatial co-occurrence of potential disease vectors (fleas) and humans in Lushoto focus differs significantly (p ≤ 0.05)among the selected landscapes, and in both seasons. This trend gives a coarse indication of the possibleassociation of the plague outbreaks and the human frequencies of contacting environments with fleas. Thestudy suggests that plague surveillance and control programmes at landscape scale should consider theexistence of plague vector contagion risk gradient from high to low incidence landscapes due to humanpresence and intensity of activities._________________________________________________________________________________________Keywords: plague, human activity spaces, risk gradient, flea index, Tanzania
Introduction
Human plague caused by Yersinia pestis has been a recurring public health threat in WestUsambara Mountains in Lushoto District, Tanzania since the first outbreak in 1980. Despiteintensive past biological and medical research, the question as to why plague kept emerging inthe same set of villages remains unanswered. Different studies have been conducted in WestUsambara Mountains and elsewhere in eastern Africa to explain the presence and the recurrenceof plague. Some of these studies include those on persistence and continued outbreaks of plague(Kilonzo et al., 1997), and on diversity, ecology and status of its potential hosts and vectors(Laudisoit et al., 2009a,b) and contribution of flea diversity in plague persistence (Eisen et al.,2012). Other studies dealt with the influence of rainfall patterns on plague occurrence (Debien etal., 2010) and the modelling of plague at various scales in relation to factors such as altitude, soilsand climate (Neerinckx et al., 2010). Still other studies included land use and human activitypatterns at coarse scale (Hubeau, 2010). Some studies considered the importance of humanpresence in disease transmission (Kilonzo et al., 1997; Kamugisha et al., 2007; Makundi et al.,2008; Ben Ari et al., 2011). A number of studies have already found a link between flea index andplague outbreak and persistence (Kilonzo et al., 1992; Makundi et al., 2008).
Knowing the social and spatial conditions that promote disease transmission is vital forbetter prediction and prevention of the emergence of vector borne diseases (Stoddard et al.,2009; Randolph et al., 2010; Vanwambeke et al., 2011). Human movement is a critical (Zimba et al.,2011) but understudied behavioural component underlying the transmission dynamics of manyvector-borne pathogens (Stoddard et al., 2009; Randolph et al., 2010). Land use patterns andchanges are drivers of human movements. Detailed knowledge of human flows in the landscape,and the human activities performed during such movements may be a valuable contribution to
* Correspondence: Didas Kimaro; Email: [email protected]

Tanzania Journal of Health Research Doi: http://dx.doi.org/10.4314/thrb.v16i3.2Volume 16, Number 3, July 2014
2
the understanding and the control of many vector-borne diseases (Linard et al., 2007;Vanwambeke et al., 2011; Stoddard et al., 2009; Arinaminpathy et al., 2009) including the spatial-temporal pattern of plague occurrence that remains poorly understood.
The main objective of this study was to gain understanding of people’s activity patterns intheir landscape in relation to spatial areas where fleas are present. The specific objectives were:(i) to determine the frequency of people’s movements from home(s) to sampled activitydestination(s); (ii) to model people’s movements in order to assess chances of their exposure toplague in space and time; and (iii) to examine spatial variation of human-rodent fleas co-occurrence levels among the three landscapes varying in plague incidence rates. It ishypothesized in this study that different plague incidence levels correspond to differences inspatial co-occurrence of the potential plague vectors (fleas) on one hand, and people on theother hand. Where this spatial co-occurrence is higher, the exposure risk to plague will also behigher.
Materials and Methods
Study areaThe study was conducted in West Usambara Mountains, Lushoto District in north-easternTanzania. The selected study area was between Universal Transverse Mercator (UTM)coordinates 400000 m E and 430000 m E and between 9480000 m N and 9500000 m N, Zone37M, covering about 34,000ha (Figure 1). The altitude varies from 480 to 2,271m. The area has abimodal rainfall pattern with an annual total ranging from 600-1,200mm. The study area ischaracterized by a mix of different farming systems. Rainfed agriculture is the most important,followed by irrigated agriculture, livestock keeping and some off farm activities (Msita et al.,2010). Other land uses include natural forests, plantation forests and utility woodlots (Kaoneka &Solberg, 1994).
Figure 1: Study area showing the Shume, Lukozi and Mwangoi landscapes

Tanzania Journal of Health Research Doi: http://dx.doi.org/10.4314/thrb.v16i3.2Volume 16, Number 3, July 2014
3
Study sites were selected to reflect a geographic gradient in plague incidence in the period 1980-2004, based on results from previous research on rodents, fleas and plague casualties in the area(Njunwa et al., 1989; Kilonzo et al., 1997; Davis et al., 2006; Kamugisha et al., 2007; Laudisoit et al.,2007, 2009a, b; Neerinckx et al., 2010). These studies defined zones of high incidence (villageswith 4.17–10.46 plague cases/1000 inhabitants), medium incidence (1.91–4.17 plague cases/1000inhabitants) and low incidence (0.02–1.91 plague cases/1000 inhabitants). Other criteria todifferentiate the study landscapes were land use and human activity diversity, landformcharacteristics (plain, escarpment, plateau dissected at different levels and valleys) and climaticconditions.
On the basis of these criteria, 3 sample landscape areas were selected. These included theShume landscape (high plague incidence) on the plateau edge bordering the escarpment(irregularly shaped 500m deep with slopes up to 68 degrees and rock outcrops (Pfeiffer, 1990),located in the cold dry zone (average temperature 15-190C, elevation 953-2,040m and averageannual rainfall 500-800mm); and 10.46 plague cases/1,000 inhabitants (Davis et al., 2006); theLukozi landscape (medium plague incidence) which lies on a strongly dissected plateau,characterised by deep soils also situated in the cold dry zone (average annual temperature 18-230C, elevation of 1,750-2,205m, and average annual rainfall of 1,000mm (Pfeiffer, 1990; Kaoneka& Solberg, 1997); and the Mwangoi landscape (low plague incidence) located in a sunken part ofthe plateau with a hot and dry climate (average temperature 220C, elevation of 1,346-2,002m,annual rainfall of 500–800mm) (Pfeiffer, 1990) and 0.57 plague cases/1,00 inhabitants (Davis etal., 2006).
Human activities data collection procedureTwenty four observation sites of 100m x100m were established per sample landscape area. Datacollected from each observation site covered land use at farm level, associated human activities,and fleas from rodents. Stratified random sampling procedure based on broad land cover typesand topography was used to locate the observation sites in each sample landscape area. Decisionof the number of observation sites considered representative sample size, time and humanresources availability. Data collection was done in the wet season (April-June 2012) and in the dryseason (August-October 2012).
In each observation site, land use types were identified and mapped and the name of themain owner/user was recorded. In observation sites located within the public or government lande.g. natural forest, the hamlets surrounding it were recorded as owner/user. The ownershipstatus was provided by key informants. The main user of an observation site was visited at his/herhome and interviewed on the key outdoor activities linked to each land use type mapped, andabout the whereabouts of other fellow users/owners of that same observation site, if any. Alsorecorded were the number of people involved, the number of days per week per activity, thetime spent, and the routes from the residence to the activity site. For the observation siteslocated within public or government land, the hamlet leaders and village chairpersons wereinterviewed. Data for wet (masika) and dry (kiangazi) season activities were recorded separately.
The home of the main user of the observation site and the hamlet centres of otheruser(s) were georeferenced using Global Positioning System (GPS) receivers. The hamlet centresfor the users of sites located within public or government lands were also georeferenced. Theroutes from home(s) to destination were also GPS-tracked.
Rodent flea data collection and calculation of flea indexSmall mammals were captured from the established observation sites using Sherman LFA livetraps (7.5x9.0x23cm; HB Sherman Traps, Tallahassee, USA) baited with peanut butter and maizeflour. A total of 49 traps spaced at 10m apart were set in a grid, per trapping site (observationsite) and for each trapping session.. For the sites in natural forests, additionally two wire cageswere used to capture somewhat bigger mammals like squirrels. Each trapping session lasted 3

Tanzania Journal of Health Research Doi: http://dx.doi.org/10.4314/thrb.v16i3.2Volume 16, Number 3, July 2014
4
nights. Each trap was inspected every morning and traps with captured animals were replaced byempty traps. The rodents were identified to genus level or to species level where possible (Eisenet al., 2012) and carefully combed for fleas. The flea index, which is the average number of fleasper animals recorded, was calculated per observation site. In this study it was interpreted as anindicator of plague transmission risk. This index was used as a response variable in the Analysis ofVariance (ANOVA).
Analysis of route useThe human activities frequencies for each observation site per season were aggregated and anoverall frequency (person-days) associated with each observation site established. This is thefrequency of route (road/footpath) usage per observation site. These usage frequencies wereobtained from the main users of observation sites, or from hamlet leaders for the sites withinpublic/government lands. Each GPS-tracked route (road/footpath) segment was assigned itsoverall usage frequency in the attribute tables. Google earth images, SPOT image and existingmaps were also used in the establishment of the network of routes. This was generated for bothwet and dry seasons.
Activity space generationAn activity space can be defined as the area within which people move or travel to complete theirdaily activities (Newsome et al., 1998). Spatial approximations of human activity spaces weregenerated by ARCGIS 9.3 software using the kernel density tool of the spatial analyst extension.The output map is a raster of density surface in kilometres per square kilometres. Two importantvariables were considered when generating a kernel density surface in ARCGIS 9.3 software:‘population field’ and ‘search radius’. A population field is the count or quantity to be spreadacross the landscape to create a continuous raster density surface. The search radius determinesthe size of the search neighbourhood.
During construction of activity space, a distance of 200 m off the pathway was used assearch radius. This determines a strip at either road side for various purposes including collectinglivestock fodder and firewood, and possibility for bypass opportunities on either side of theroute, as observed during field work and as witnessed by key informants (Perchoux et al., 2013).This should not be considered an extra burden in terms of travel time for an average agent(Schönfelder & Axhausen, 2002). The total route usage frequency (person-days/season) whichwas assigned to each route segment was used as population field inside a kernel density tooldialog box. When the route usage frequency is used as a population field, the length of routesegment concerned becomes its actual length multiplied by the value of the population field forthat route segment (ESRI, 2006).
A smoothly curved value surface is fitted over each line (road axis). The value is greateston the line and diminishes as one moves away from the line, reaching zero at the end of thesearch radius from the line. A total of 144 kernel density surfaces maps (72 per season) weregenerated and maximum density surfaces in kilometres per square kilometre for each wererecorded. The 144 kernel density surfaces maps were vectorised in order to obtain activity spacevector maps. The activity space vector maps are polygons encompassing all none zero cells of theoriginal kernel density surfaces raster map.
Generation of interpolated flea index surfacesInverse Distance Weighting (IDW) technique was used to generate interpolated flea indexsurfaces. The IDW produces surfaces by interpolation of scatter points and has been employed instudies on vector borne diseases and pest management (Beckler et al., 2005; Naish et al., 2011;Bhunia et al., 2013). Prior to IDW, Spatial autocorrelation analysis was performed to checkwhether the flea index was distributed randomly over space and, if not, to evaluate any identifiedflea index cluster for statistical significance (Meng et al., 2010; Naish et al., 2011). The Moran’s I
Tanzania Journal of Health Research Doi: http://dx.doi.org/10.4314/thrb.v16i3.2Volume 16, Number 3, July 2014
5
statistics (ESRI, 2006; Bhunia et al., 2013) was used to evaluate autocorrelation. A value close to‘0’ indicates spatial randomness. A value near 1.0 indicates perfect clustering while an index valuenear -1.0 indicates perfect dispersion (ESRI, 2006; Meng et al., 2010). The Z-score and the p-valueassociated with Moran’s I which indicates the likelihood that a point pattern is a result of randomchance were also computed. The spatial autocorrelation analysis was carried out in ARCGIS 9.3software and a confidence level of 95% (ESRI, 2006) was selected. The IDW analysis was alsocarried out using ARCGIS 9.3 software. The most commonly used, and default, power value of 2and the default variable search radius, with 12 input points were chosen to allow for variablesearch neighbourhoods (Beckler et al., 2005).
Calculation of flea indices within human activity spaces vector mapsZonal statistics plug-in of QGIS 1.8.0 was used to calculate the average flea index which is theaverage value of the pixels that are within each activity space vector map after overlaying it withinterpolated flea index surface. The technique enables calculation of several values of the pixelsof the interpolated flea index surface including the sum, the average value and the total count ofthe pixels that are within a polygon of an activity spaces vector map. This was done for all 144activity spaces vector maps. The “average flea index” resulting from zonal statistics overlay withpolygons on raster is different from the originally calculated flea index per observation beforeinterpolation and zonal statistics operations.
Analysis of variance of flea index, average flea index and maximum density surfaces among threelandscapesThe data was first checked for normality and homogeneity prior to ANOVA (Zuur et al., 2010).Whenever normality was not fulfilled, data were log10(x+1) transformed to achieve normaldistributions where possible (Axelsson et al., 2011). In case of non success, the non-parametricANOVA on Medians (Mood’s Median test) was used. Otherwise, one-way ANOVA was used toevaluate differences in the data. The one-way ANOVA and Mood’s Median test are widely used indifferent studies including ecological studies (Brook et al., 2002; Forster et al., 2005; Nienhuis andStout, 2009; Laudisoit et al., 2009a; Coors and Fische, 2011; Axelsson et al., 2011). These analyseswere carried out using MS Excel and Minitab 14 software for which a confidence level of 95% wasselected.
Ethical considerationsThis study received approval from Directorate of Research and Post-Graduate Studies of SokoineUniversity of Agriculture, Tanzania and Flemish Inter-University Council (VLIR-UOS) of Belgium.
Results
Human activity frequencies per activity destinationIn the dry season the overall frequency of visiting the observation sites was highest in Lukozi,followed by Shume and Mwangoi, with Mwangoi having only about half the frequency of Shume.In the wet season the visiting frequency per season was also higher in Lukozi than Mwangoi andShume, in that order (Table 1).
Table 1: Summary of average frequency of human movements for each landscapeSeason Landscape Overall visit frequency (person-days)Dry season Mwangoi 6,806
Lukozi 16,904Shume 12,615
Wet season Mwangoi 14,614Lukozi 17,705Shume 13,203

Tanzania Journal of Health Research Doi: http://dx.doi.org/10.4314/thrb.v16i3.2Volume 16, Number 3, July 2014
6
Abundance of fleas and small mammalsThe results show that there were more rodent fleas in the dry season than in the wet season forall three landscapes. The absolute number of rodent fleas collected followed the plagueincidence gradient (Table 2).
Table 2: Total number and percent of fleas and small mammals collectedFleas Small mammals
Landscape Dry season Wet season Dry season Wet seasonShume 358 (53%) 179 (48%) 265(46%) 234 (45%)Lukozi 180 (27%) 124 (34%) 232 (40%) 193 (37%)Mwangoi 137 (20%) 67 (18%) 79 (14%) 93 (18%)
Figure 2: Shume flea index surface as an indicator of spatial variation of plague risks in wet and dryseasons
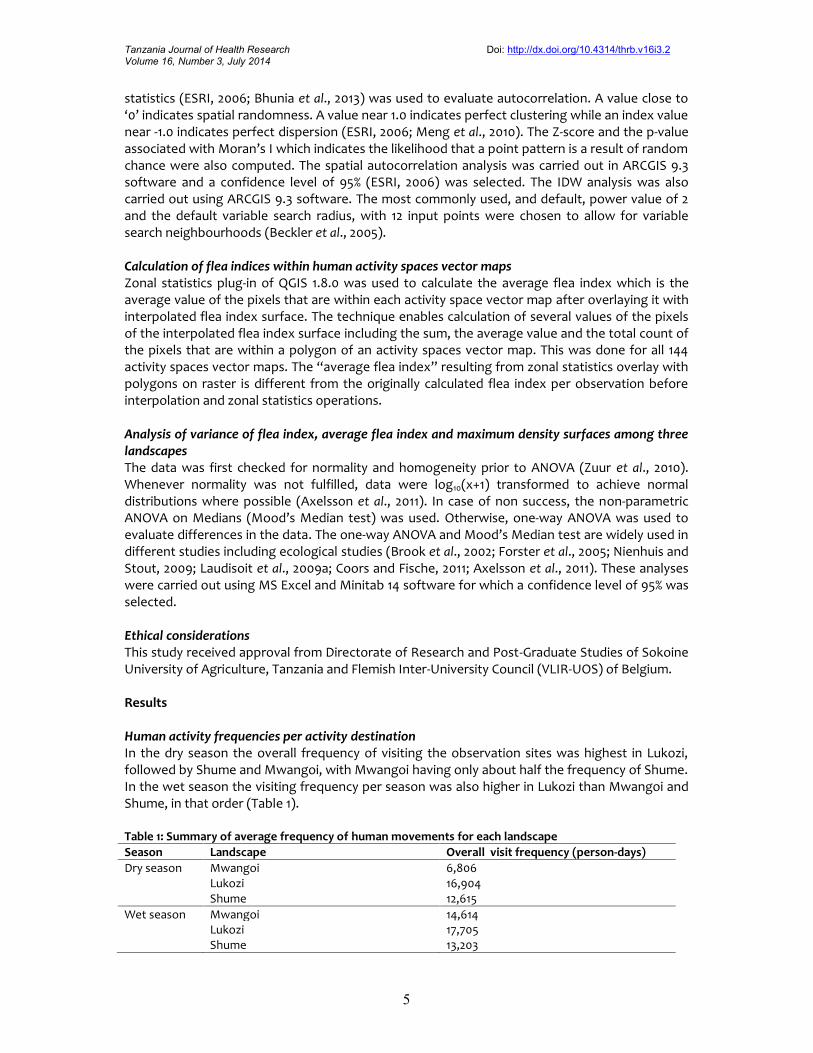
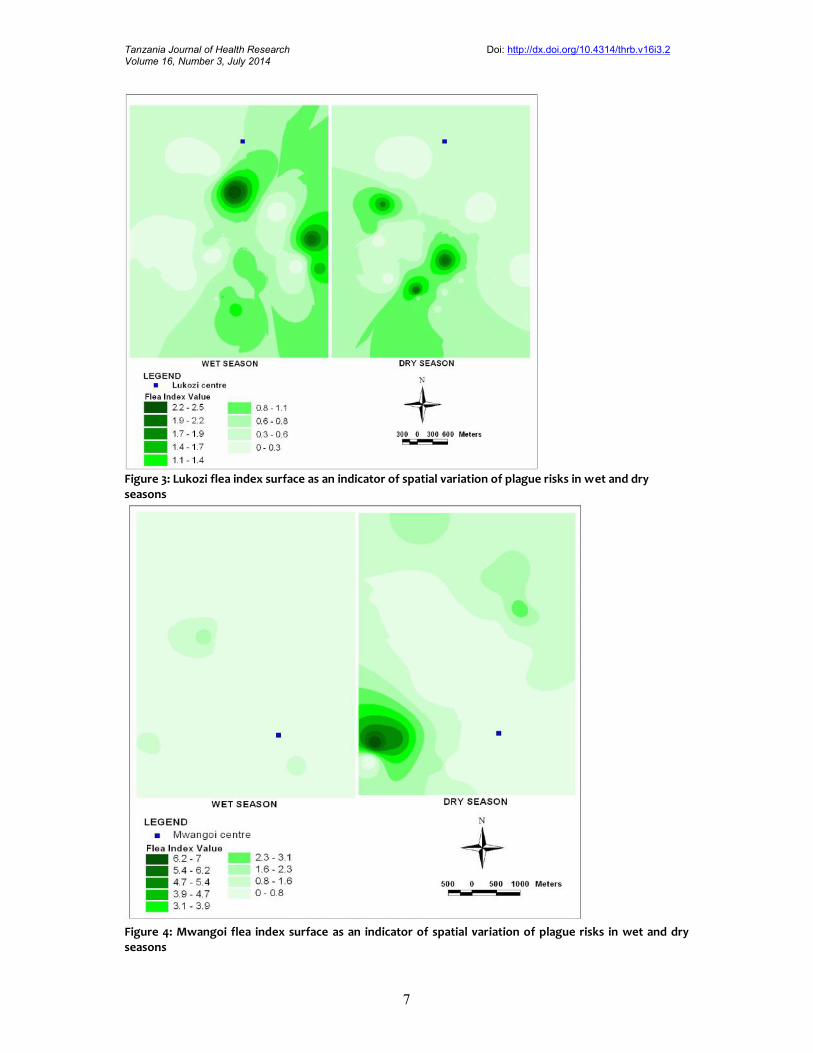
Interpolated raster surface of flea indexSix maps based on interpolation of flea index point data for Shume, Lukozi and Mwangoilandscapes are presented in Figures 2, 3 and 4, respectively. The general pattern of the mapsindicates the dry season had higher flea index values compared to the wet season ones especiallyin Shume and Mwangoi landscapes. This implies that there was more potential plague infectionrisk in the dry season than in the wet season.
Tanzania Journal of Health Research Doi: http://dx.doi.org/10.4314/thrb.v16i3.2Volume 16, Number 3, July 2014
7
Figure 3: Lukozi flea index surface as an indicator of spatial variation of plague risks in wet and dryseasons
Figure 4: Mwangoi flea index surface as an indicator of spatial variation of plague risks in wet and dryseasons
Tanzania Journal of Health Research Doi: http://dx.doi.org/10.4314/thrb.v16i3.2Volume 16, Number 3, July 2014
8
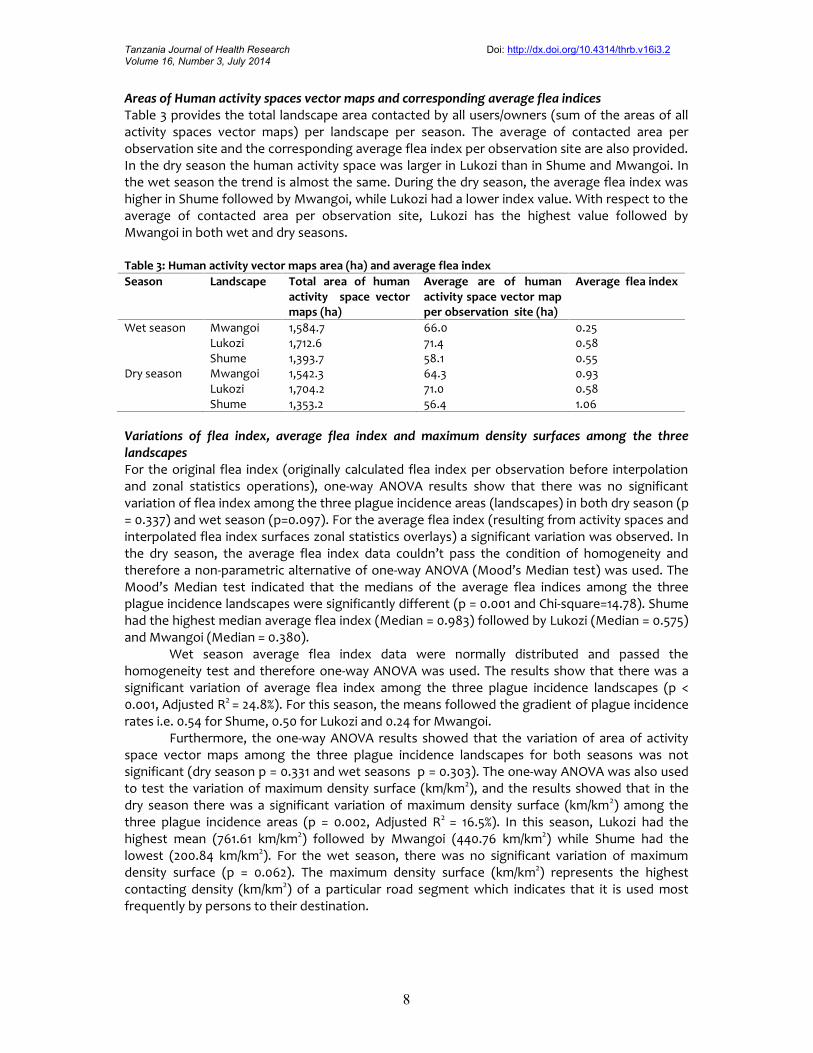
Areas of Human activity spaces vector maps and corresponding average flea indicesTable 3 provides the total landscape area contacted by all users/owners (sum of the areas of allactivity spaces vector maps) per landscape per season. The average of contacted area perobservation site and the corresponding average flea index per observation site are also provided.In the dry season the human activity space was larger in Lukozi than in Shume and Mwangoi. Inthe wet season the trend is almost the same. During the dry season, the average flea index washigher in Shume followed by Mwangoi, while Lukozi had a lower index value. With respect to theaverage of contacted area per observation site, Lukozi has the highest value followed byMwangoi in both wet and dry seasons.
Table 3: Human activity vector maps area (ha) and average flea indexSeason Landscape Total area of human
activity space vectormaps (ha)
Average are of humanactivity space vector mapper observation site (ha)
Average flea index
Wet season Mwangoi 1,584.7 66.0 0.25Lukozi 1,712.6 71.4 0.58Shume 1,393.7 58.1 0.55
Dry season Mwangoi 1,542.3 64.3 0.93Lukozi 1,704.2 71.0 0.58Shume 1,353.2 56.4 1.06
Variations of flea index, average flea index and maximum density surfaces among the threelandscapesFor the original flea index (originally calculated flea index per observation before interpolationand zonal statistics operations), one-way ANOVA results show that there was no significantvariation of flea index among the three plague incidence areas (landscapes) in both dry season (p= 0.337) and wet season (p=0.097). For the average flea index (resulting from activity spaces andinterpolated flea index surfaces zonal statistics overlays) a significant variation was observed. Inthe dry season, the average flea index data couldn’t pass the condition of homogeneity andtherefore a non-parametric alternative of one-way ANOVA (Mood’s Median test) was used. TheMood’s Median test indicated that the medians of the average flea indices among the threeplague incidence landscapes were significantly different (p = 0.001 and Chi-square=14.78). Shumehad the highest median average flea index (Median = 0.983) followed by Lukozi (Median = 0.575)and Mwangoi (Median = 0.380).
Wet season average flea index data were normally distributed and passed thehomogeneity test and therefore one-way ANOVA was used. The results show that there was asignificant variation of average flea index among the three plague incidence landscapes (p <0.001, Adjusted R2 = 24.8%). For this season, the means followed the gradient of plague incidencerates i.e. 0.54 for Shume, 0.50 for Lukozi and 0.24 for Mwangoi.
Furthermore, the one-way ANOVA results showed that the variation of area of activityspace vector maps among the three plague incidence landscapes for both seasons was notsignificant (dry season p = 0.331 and wet seasons p = 0.303). The one-way ANOVA was also usedto test the variation of maximum density surface (km/km2), and the results showed that in thedry season there was a significant variation of maximum density surface (km/km2) among thethree plague incidence areas (p = 0.002, Adjusted R2 = 16.5%). In this season, Lukozi had thehighest mean (761.61 km/km2) followed by Mwangoi (440.76 km/km2) while Shume had thelowest (200.84 km/km2). For the wet season, there was no significant variation of maximumdensity surface (p = 0.062). The maximum density surface (km/km2) represents the highestcontacting density (km/km2) of a particular road segment which indicates that it is used mostfrequently by persons to their destination.
Tanzania Journal of Health Research Doi: http://dx.doi.org/10.4314/thrb.v16i3.2Volume 16, Number 3, July 2014
9
Discussion
Generally, the results show seasonal differences in the overall frequencies of human movementsfrom home(s) to observation site(s). There was more movement in the wet season than in thedry season in all three landscapes, which may be attributed to more agricultural activities that aretaking place in the area. Furthermore, the results showed differences in movement among thethree plague incidence landscapes. In the dry season Lukozi had a higher overall activityfrequency than Shume and Mwangoi with Mwangoi having only about half that of Shume. In thewet season Lukozi ranked highest but this time followed by Mwangoi. This may be attributed tothe fact that Lukozi has a relatively good climate, more rainfall, and a good deal of fertile valleybottoms used for irrigated vegetables resulting in a higher frequency of movements than inMwangoi and Shume.
Interpolation methods are useful for transforming point-based data into smooth risksurfaces. The outcome can be used to infer risk in areas that were not sampled, and they aremost useful and reliable at fine spatial scale within the geographic area of point data sampling(Eisen & Eisen, 2011). The interpolated flea index surfaces in the current study are not spatial riskmaps per se but serve as indicators of spatial variation of plague infection risks that might occurduring epizootics. The results also show a general pattern of seasonality in flea index. The mapsin the dry season reveal larger areas dominated by higher values of flea index than those in wetseason, especially in Shume and Mwangoi landscapes. These findings are consistent with those ofLaudisoit et al. (2009a) who found that each individual small mammal harboured more fleaspecies during the dry season than during the rainy season. It is known that temperature, rainfalland relative humidity have direct effects on development and survival, as well as the behaviourand reproduction of fleas (Eisen et al., 2012; Gage et al., 2008; Ben Ari et al., 2011). The maps canalso be used as base information for selecting areas for detailed plague infection risk studies.
Results from this study indicate that there was no significant difference in the means ofarea of human activity space vector maps among the three landscapes during both dry and wetseasons. There was also no significant difference in the mean of maximum density surface(km/km2) among the three plague incidence areas (landscapes) for the wet season. The onlysignificant difference was found in the dry season for the maximum density surface (km/km2)with Lukozi (plague medium incidence landscape) having the highest mean followed by Mwangoi(plague low incidence landscape), and Shume (plague high incidence landscape) having thelowest. However, this gradient does not seem to match the plague incidence gradient. This couldbe attributed to the fact that the variation of the risk of vector zoonoses including plaguedepends on both abundance of infected vectors and the amount of human exposure to thathazard (Randolph et al., 2010; Vanwambeke et al., 2011), and not to the human movement patternper se. The spatial variation of plague incidences among the three studied landscapes may beexplained by considering not only human movement pattern or fleas in isolation but all threeimportant plague transmission components i.e. hosts, vectors, and humans together.
Activities at fine scale have been reported to affect the degree of contact betweenpeople and vectors (Randolph et al., 2010; Vanwambeke et al., 2011). For vector-borne zoonoses,human induced environmental change may affect the transmission potential of wildlife cycles,whilst human activities rather determine the potential of contact with components of thosecycles and so co-determine the risk of infection (Randolph et al., 2010; Zimba et al., 2011).The flea index (flea abundance) is reported to give useful information for the surveillance ofplague and serve as indicator of potential plague transmission (WHO, 1976; Kilonzo & Mhina,1982; Makundi et al., 2008). The results of the current study showed that there was a significantvariation of average flea index (resulting from activity spaces and interpolated flea index surfaceszonal statistics overlays) among the three landscapes for both dry and wet seasons. Thesefindings are in line with an earlier study on vector-borne diseases by Randolph et al. (2010). Theobserved significant difference of the medians of the average flea index indicates that Shume has

Tanzania Journal of Health Research Doi: http://dx.doi.org/10.4314/thrb.v16i3.2Volume 16, Number 3, July 2014
10
potentially high plague infection risk during epizootics compared to Lukozi and Mwangoi. Thetrend is the same in both wet and dry season. An earlier study in the area by Laudisoit et al.(2007), reported that abundance of human domestic flea (Pulex irritans) was correlated withplague incidence. The findings from the current study corroborate their assertion as rodent fleaswere found in abundance in environments where humans and rodent fleas are likely to get incontact. Association of plague infection risk and flea index is also supported by other studies inTanzania (Kilonzo et al., 1992; Makundi et al., 2008) and elsewhere (Pham et al., 2009).Furthermore, Zimba et al. (2011) reported that humans get infected with the causative agent ofplague when they enter zones with infected wild rodents, through activities such as cultivationand hunting.
Since all rodent fleas collected in both seasons are capable of transmitting Yersinia pestis,be it with different vector potential because of ecological and morphological factors (Eisen et al.,2006; Laudisoit, 2009; A. Laudisoit, personal communication), the three studied landscapestogether show a gradient of plague infection risk. The findings from the current study suggestthat the risk of Yersinia pestis transmission from rodents to humans during epizootics may beexplained by human movement at fine-scale i.e., people going about their regular daily activitieson the studied landscapes found to have spatially varying rodent fleas abundances.
The current study has demonstrated the importance of human activity spaces in thestudy of plague infection risks. It has shown that the spatial co-occurrence of a potential diseasevector and humans (giving “average flea index”) differs significantly among the plague incidencelandscape areas and follows the established plague incidence gradient of high, medium and lowfor both dry and wet seasons. This trend gives a coarse sign of the possible association of theplague outbreaks and the human frequencies of contacting environments with fleas. Theseresults therefore, call for plague studies adopting a complete geographic perspective thatincludes human activity dimension. Moreover, the findings are of public health relevancebecause they may guide plague surveillance, prevention and control programmes at fine scalesby advising people to avoid contact with soil, vegetation etc. in landscape units with highconcentration of rodent fleas, especially during epizootic periods.
Acknowledgements
This work was supported by the Sokoine University of Agriculture-Flemish Interuniversity Council(SUA-VLIR) Own Initiative Project - ‘Landscape-Ecological Clarification of Bubonic PlagueDistribution and Outbreaks in the Western Usambara Mountains, Tanzania’ (Acronym: LEPUS),funded by the Flemish Interuniversity Council (VLIR), Belgium. The authors greatly appreciate thecooperation of many people including farmers in the study area, staff of Lushoto District Counciland Sebastian Kolowa Memorial University.
References
Arinaminpathy, N., McLean, H.N. & Godfray, H.C.J. (2009) Future UK land use policy and the riskof infectious disease in humans, livestock and wild animals. Land Use Policy 26S, S124-S133.
Axelsson, E.P., Hjältén, J., LeRoy, C.J., Thomas G. Whitham, T.G., Julkunen-Tiitto, R. &Wennström, A. (2011) Leaf litter from insect-resistant transgenic trees causes changes inacquatic insect community composition. Journal of Applied Ecology 48, 1472-1479.
Beckler, A.A., French, B.W. & Chandler, L.D. (2005) Using GIS in Areawide Pest Management: ACase Study in South Dakota. Transactions in GIS 9(2), 109-127.
Ben Ari, B.T., Neerinckx, S., Gage, K.L., Kreppel, K., Laudsoit, A., Leirs, H. & Stenseth, N. (2011)Plague and Climate: Scale Matter. PLoS Pathogy 7(9), e1002160.

Tanzania Journal of Health Research Doi: http://dx.doi.org/10.4314/thrb.v16i3.2Volume 16, Number 3, July 2014
11
Bhunia, GS, Kesari, S, Chatterjee, N, Kumar, V. & Das, P. (2013) Spatial and temporal variation andhotspot detection of kala-azar disease in Vaishali district (Bihar), India. BMC InfectiousDiseases 13, 64.
Brook, B.W., Tonkyn, D.W., O’Grady, J.J. & Frankham, R. (2002) Contribution of Inbreeding toExtinction Risk in Threatened Species. Conservation Ecology 6 (1), 16.
Coor, A. & Frische, T. (2011) Predicting the acquatic toxicity of commercial pesticide mixtures.Environmental Sciences Europe 23, 22.
Davis, S., Makundi, R.H., Machang’u R.S. & Leirs, H. (2006) Demographic and spatio-temporalvariation in human plague at a persistent focus in Tanzania. Acta Tropica 100, 133-141.
Debien, A., Neerinckx, S., Kimaro, D. & Gulinck, H. (2010) Influence of satellite-derived rainfallpatterns on plague occurrence in northeast Tanzania. International Journal of HealthGeographics 9, 60.
Eisen, R.J., Bearden, S.W., Wilder, A.P, Montenieri, J.A., Antolin, M.F. & Gage, K.L. (2006) Earlyphase transmission of Yersinia pestis by unblocked fleas as a mechanism explainingrapidly spreading plague epizootics. Proceedings of the National Academy of Science of theUnited States 103, 15380-15385.
Eisen, R.J., Borchert, J.N., Mpanga, J.T., Atiku, L.A., MacMillan, K., Boegler, K.A., Montenieri, J.A.,Monaghan, A. & Gage, K.L. (2012) Flea diversity as an Element for Persistence of PlagueBacteria in an East African Plague Focus. PLoS One 7 (4), e35598.
Eisen, L. & Eisen, R.J. (2011) Using Geographic Information Systems and Decision Support Systemsfor the Prediction, Prevention, and Control of Vector-Borne Diseases. Annual Review ofEntomology 56, 41-61.
ESRI (2006) Using ARCGIS Desktop. ESRI, 380 New York Street, Redlands, CA, USA. 435pp.Forster, L., Hassel, H., Laubach, Z. (2005) Are indicators of nitrogen levels in springs? Journal of
Ecological Research 7, 51-56.Gage, K.L., Burkot, T.R., Eisen, R.J. & Hayes, E.B. (2008) Climate and vector borne diseases.
American Journal of Preventive Medicine 35, 436-450.Hubeau, M. (2010) Land use and human activity patterns in relation to the plague disease in the
West Usambara Mountains, Tanzania. MSc. Dissertation, K.U.Leuven, Belgium. 102pp.Johnston, K., Ver Hoef, J.M, Krivoruchko, K. & Lucas, N. (2001) Using ArcGIS Geostatistical Analyst.
ESRI press. New York Street, Redlands, CA, USA. 300pp.Kamugisha, M.L., Gesase, S., Minja, D., Mgema, S., Mlwilo, T.D., Mayala., B.K., Msigwa, S.,
Massaga, J.J. & Lemnge, M.M. (2007) Pattern and spatial distribution of plague inLushoto, north-eastern Tanzania. Tanzania Health Research Bulletin 9, 12-18.
Kaoneka, A.R.S. & Solberg, B. (1994) Forestry related land use in West Usambara mountains,Tanzania. Agriculture, Ecosystems and Environment 49, 207-215.
Kaoneka, A.R.S. & Solberg, B. (1997) Analysis of deforestation and economically sustainablefarming systems under pressure of population growth and income constraints at thevillage level in Tanzania. Agriculture, Ecosystem and Environment 62, 59-70.
Kilonzo, B.S. & Mhina, J.I. (1982) The first outbreak of human plague in Lushoto district, north-east Tanzania. Transactions of the Royal Society of Tropical Medicine and Hygiene 76, 172-177.
Kilonzo, B.S., Makundi, R.H. & Mbise, T.J. (1992) A decade of plague epidemiology and control inthe Western Usambara mountains, north-east Tanzania. Acta Tropica 50, 323-329.
Kilonzo, B.S., Mvena, Z.S.K., Machangu, R.S. & Mbise, T.J. (1997) Preliminary observations onfactors responsible for long persistence and continued outbreaks of plague in Lushotodistrict, Tanzania. Acta Tropica 68, 215-227.
Laudisoit, A. (2009) Diversity, Ecology and Status of Potential Hosts and Vectors of the PlagueBacillus Yersinia Pestis. Contribution to the Plague Epidemiology in an Endemic PlagueFocus: The Lushoto District, Tanzania. PhD Thesis, Universiteit Antwerpen, Belgium.259pp.

Tanzania Journal of Health Research Doi: http://dx.doi.org/10.4314/thrb.v16i3.2Volume 16, Number 3, July 2014
12
Laudisoit, A., Leirs, H., Makundi, R.H. & Krasnov, B. (2009a). Seasonal and habitat dependence offleas parasitic on small mammals in Tanzania. Integrative Zoology 4, 196-212.
Laudisoit, A., Leirs, H., Makundi, R.H., Van Dongen, S., Davis, S., Neerinckx, S., Deckers, J. & Libois,R. (2007) Plague and the human flea, Tanzania. Emerging Infectious Diseases 13, 687-693.
Laudisoit, A., Neerinckx, S., Makundi, R.H., Leirs, H. & Krasnov, B. (2009b) Are local plagueendemicity and ecological characteristics of vectors and reservoirs related? A case studyin north-east Tanzania. Current Zoology 55, 199-211.
Linard, C., Lamarque, P., Heyman, P., Ducofftre, G., Luyasu, V., Tersago, K., Vanwambeke, O.S. &Lambin, E.F. (2007) Determinants of the geographic distribution of Puumala virus andLyme borreliosis infection in Belgium. International Journal of Health Geographics 6, 15.
Makundi, R.H., Massawe, A.P, Mulungu, L.S, Katakweba, A, Mbise, T.J. & Mgode, G. (2008)Potential mammalian reservoirs in a bubonic plague outbreak focus in Mbulu District,northern Tanzania, in 2007. Mammalia 72, 253-257.
Meng, G., Law, J. & Thompson, M.E. (2010) Small scale health-related indicator acquisition usingsecondary data spatial interpolation. International Journal of Health Geographics 9, 50.
Naish, S., Hu, W., Mengersen, K. & Tong, S. (2011) Spatial-temporal patterns of Barmah ForestVirus Disease in Queensland, Austraria. PLoS One 6: 10, e25688.
Neerinkx, S., Peterson, A.T., Gulinck, H., Deckers, J., Kimaro, D. & Leirs, H. (2010) Predictingpotential risk areas of human plague for the Western Usambara Mountains, LushotoDistrict Tanzania. American Journal of Tropical Medicine and Hygiene 82, 492-500.
Newsome, T.H.; Walcott, W.A. & Smith, P.D. (1998) Urban activity spaces: Illustrations andapplications of a conceptual model for integrating the time and space dimension.Transportation 25, 357-377.
Nienhuis, C.M. & Stout, J.C. (2009) Effectiveness of native bumblebees as pollinators of the alieninvasive plant Impatiens Glandulifera (Balsaminaceae) in Ireland. Journal of PollinationEcology 1(1), 1-11.
Njunwa, K.J., Mwaiko, G.L., Kilonzo, B.S. & Mhina, J.I. (1989) Seasonal patterns of rodents, fleasand plague status in the Western Usambara Mountains, Tanzania. Medical and VeterinaryEntomology 3, 17-22.
Perchoux, C., Chaix, B., Cummins, S. & Kestens, Y. (2013) Conceptualization and measurement ofenvironmental exposure in epidemiology: Accounting for activity space related to dailymobility. Health & Place 21, 86-93.
Pfeffer, R. (1990) Investigating possibilities of combining fodder production with erosion controland agroforestry in the West Usambara Mountains of Tanzania. In: J. Kotchi (Ed).Ecofarming Practices for Tropical Smallholdings, 185p.
Pham, H.V., Dang, D.T., Minh, N.T., Nguyen, N.D. & Nguyen, T.V. (2009) Correlates ofenvironmental factors and human plague: an ecological study in Vietnam. InternationalJournal of Epidemiology 38, 1634-1641.
Randolph, S.E & EDEN-TBD sub-project team (2010) Human activities predominate in determiningchanging incidence of tick-borne encephalitis in Europe. Euro Surveillance 15: 24-31.
Sattenspiel, L. (2000) Tropical Environments, human activities, and the transmission of infectiousdiseases. Yearbook of Physical Anthropology 43, 3-31.
Schönfelder, S. & Axhausen, K.W. (2003) Measuring the size and structure of human activity spaces- the longitudinal perspective. Arbeitsbericht Verkehrs –und Raumplannung, 135: 49p.
Stoddard, S.T., Morrison, A.C., Vazquez-Prokopec, G.M., Paz Soldan, V., Kochel, T.J., Kitron, U.,Elder, J.P. & Scott, T.W. (2009) The Role of Human Movement in the Transmission ofVector-Borne Pathogens. PLoS Neglected Tropical Disease 3:7, e481.
Vanwambeke, S.O., Bennett, S.N. & Kapan, D.D. (2011) Spatially disaggregated diseasetransmission risk: land cover, land use and risk of dengue transmission on the Island ofOahu. Tropical Medicine and International Health 16, 174-185.
WHO (1976) Weekly Epidemiological Record. Geneva 35, 265-266.

Tanzania Journal of Health Research Doi: http://dx.doi.org/10.4314/thrb.v16i3.2Volume 16, Number 3, July 2014
13
Zimba, M., Pfukenyi, D., Loveridge, J. & Mukaratirwa, S. (2011) Seasonal abundance of plaguevector Xenopsylla brasiliensis from rodents captured in three habitat types of periurbansuburbs of Harare, Zimbabwe. Vector-Borne and Zoonotic diseases 11, 1187-1192.
Zuur, A.F, Ieno, E.N. & Elphic, C.S. (2010) A Protocol for data exploration to avoid commonstatistical problems. Methods in Ecology and Evolution 1, 3-14.
Copyright © 2022 FDOKUMEN