Huggett and Cuadros 2010 Non-marine glauconite
16
Glauconite formation in lacustrine/ palaeosol sediments, Isle of Wight (Hampshire Basin), UK J. M. HUGGETT 1,2, * AND J. CUADROS 1 1 Department of Mineralogy, The Natural History Museum, Cromwell Road, London SW7 5BD, UK, and 2 Petroclays, The Oast, Sandy Cross, Heathfield, East Sussex, TN21 8QP, UK (Received 27 August 2009; revised 23 November 2009; Editor: John Adams) ABSTRACT: The clay mineralogy and chemistry of a green lacustrine marl that has been pedogenically modified in the upper part was investigated in order to better understand the formation of low-temperature Fe-rich 10 A ˚ clay. Twelve samples in a vertical sequence have been investigated using X-ray diffraction (XRD), chemical analysis, scanning electron microscopy (SEM) and laser particle size analysis. The clay assemblage has a range of overall illite-smectite (I-S) compositions (64 100%) resulting from several I-S phases that, for the sake of modelling, have been simplified to one to three I-S phases of increasing illitic content. Where the lacustrine marl has been pedogenically modified, the smectite-rich I-S is much reduced in abundance or absent and the 10 A ˚ -rich component is both more abundant and more illitic. These assemblages are a consequence of illitization of detrital I-S in the lake and soil, and dissolution of other clays (kaolinite and chlorite) in the hypersaline lake. Interlayer K, octahedral Fe and octahedral + interlayer Mg increase with intensity of illitization (increase range 0.32 0.63, 0.68 1.67, 0.18 0.24 per O 10 (OH) 2 , respectively), first in the increasingly saline lake, and latterly as a result of wetting and drying in a gley soil. In the soil environment, reduction of Fe(III) to Fe(II) resulted in increased layer charge but, as by this stage very few smectite interlayers remained, this did not result in an equivalent increase in illite. Laser particle- size analysis, supported by SEM observation, shows the existence of a bimodal distribution of clay particle size (maxima at 0.2 and 1.5 1.8 mm) in which the finer fraction increases largely in the pedogenically affected samples, probably due to particle break-up caused by seasonal wetting and drying. This ‘dual action’ illitization, first in a hypersaline lake and latterly through wetting and drying, may be responsible for both the intensity of illitization and exceptionally high (for the Solent Group) Fe content of the authigenic illite. The chemical characteristics of the illitic I-S and the illite end-member correspond to glauconite. Hence, this is an example of onshore, non-pelletal glauconite formation. KEYWORDS: hypersaline lake, Isle of Wight, glauconite, low-temperature illitization, wetting and drying. The Solent Group (Isle of Wight, Fig. 1) is a succession of brackish and freshwater clays, sands and thin freshwater limestones of Late Eocene to Early Oligocene age, with a maximum thickness of 200 m, preserved only in the central part of the Hampshire Basin, in southern Hampshire and the Isle of Wight. The Solent Group represents the youngest Palaeogene strata present onshore in the UK. An extensive review of previous work on the Tertiary deposits of the Isle of Wight has been published by Daley (1999) and detailed accounts of the sections exposed at Whitecliff Bay are given in Gale et al. (2006). * E-mail: [email protected] DOI: 10.1180/claymin.2010.045.1.35 Clay Minerals, (2010) 45, 35–49 # 2010 The Mineralogical Society
Transcript of Huggett and Cuadros 2010 Non-marine glauconite

Glauconite formation in lacustrine/palaeosol sediments, Isle of Wight
(Hampshire Basin), UK
J. M. HUGGETT1 , 2 , * AND J . CUADROS1
1 Department of Mineralogy, The Natural History Museum, Cromwell Road, London SW7 5BD, UK, and2 Petroclays, The Oast, Sandy Cross, Heathfield, East Sussex, TN21 8QP, UK
(Received 27 August 2009; revised 23 November 2009; Editor: John Adams)
ABSTRACT: The clay mineralogy and chemistry of a green lacustrine marl that has been
pedogenically modified in the upper part was investigated in order to better understand the formation
of low-temperature Fe-rich 10 A clay. Twelve samples in a vertical sequence have been investigated
using X-ray diffraction (XRD), chemical analysis, scanning electron microscopy (SEM) and laser
particle size analysis. The clay assemblage has a range of overall illite-smectite (I-S) compositions
(64�100%) resulting from several I-S phases that, for the sake of modelling, have been simplified to
one to three I-S phases of increasing illitic content. Where the lacustrine marl has been pedogenically
modified, the smectite-rich I-S is much reduced in abundance or absent and the 10 A-rich component
is both more abundant and more illitic. These assemblages are a consequence of illitization of detrital
I-S in the lake and soil, and dissolution of other clays (kaolinite and chlorite) in the hypersaline lake.
Interlayer K, octahedral Fe and octahedral + interlayer Mg increase with intensity of illitization
(increase range 0.32�0.63, 0.68�1.67, 0.18�0.24 per O10(OH)2, respectively), first in the
increasingly saline lake, and latterly as a result of wetting and drying in a gley soil. In the soil
environment, reduction of Fe(III) to Fe(II) resulted in increased layer charge but, as by this stage very
few smectite interlayers remained, this did not result in an equivalent increase in illite. Laser particle-
size analysis, supported by SEM observation, shows the existence of a bimodal distribution of clay
particle size (maxima at 0.2 and 1.5�1.8 mm) in which the finer fraction increases largely in thepedogenically affected samples, probably due to particle break-up caused by seasonal wetting and
drying. This ‘dual action’ illitization, first in a hypersaline lake and latterly through wetting and
drying, may be responsible for both the intensity of illitization and exceptionally high (for the Solent
Group) Fe content of the authigenic illite. The chemical characteristics of the illitic I-S and the illite
end-member correspond to glauconite. Hence, this is an example of onshore, non-pelletal glauconite
formation.
KEYWORDS: hypersaline lake, Isle of Wight, glauconite, low-temperature illitization, wetting and drying.
The Solent Group (Isle of Wight, Fig. 1) is a
succession of brackish and freshwater clays, sands
and thin freshwater limestones of Late Eocene to
Early Oligocene age, with a maximum thickness of
200 m, preserved only in the central part of the
Hampshire Basin, in southern Hampshire and the
Isle of Wight. The Solent Group represents the
youngest Palaeogene strata present onshore in the
UK. An extensive review of previous work on the
Tertiary deposits of the Isle of Wight has been
published by Daley (1999) and detailed accounts of
the sections exposed at Whitecliff Bay are given in
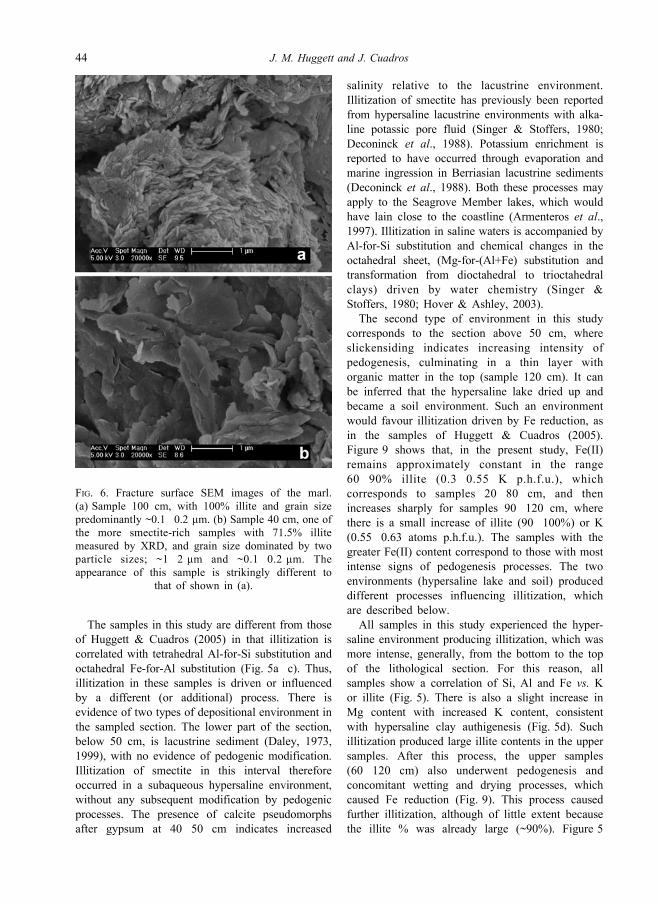
Gale et al. (2006).* E-mail: [email protected]: 10.1180/claymin.2010.045.1.35
ClayMinerals, (2010) 45, 35–49
# 2010 The Mineralogical Society
The Headon Hill Formation (the oldest part of
the Solent Group) is conspicuously cyclic; each
cycle includes: (a) laminated, shelly silts and silty
clays deposited in quasi-marine, brackish and
fluviatile environments, overlain by (b) units
including numerous palaeosols developed in fresh-
water silts and silty clays (Daley, 1973, 1999;
Huggett et al., 2001; Gale et al., 2006). The interval
described here is the youngest of these cycles. Most
of the Headon Hill Formation palaeosols are gleys
that have latterly undergone seasonal wetting and
drying. The interval described in this study is the
marl at the top of the Seagrove Member of the
Headon Hill. It differs from the older palaeosols in
that it consists of lacustrine marl (Daley, 1973,
1999), deposited close to the shoreline (Armenteros
et al., 1997) and affected by pedogenesis only in
the upper part. The lower part, up to 40 cm, has a
faint lamination, indicating sub-aqueous deposition.
At 40�50 cm, calcite pseudomorphs after gypsum
are present. Gypsum would have formed during
periods when evaporation exceeded precipitation
(White, 1997, p. 29). From 50�100 cm, slick-
ensiding that increases in intensity towards the top
is present. Slickensiding is an indicator of
pedogenic modification caused by movement of
peds (a block or crumb of soil) during wetting and
drying (Fitzpatrick, 1980, p. 180). Hence wetting
and drying increases in intensity through this
section. The marl ends with an organic-rich layer
a few cm thick that may indicate plant colonization
of the sediment, though no in situ roots were
observed. The colour of the marl changes from
green to grey at 110 cm. Calcite nodules are present
throughout the clay marl.
Authigenic clay minerals formed at or close to the
Earth’s surface are likely to be sensitive indicators
of the geochemical environment of deposition and
authigenesis. The spatial and temporal distribution of
pre-burial authigenic clay minerals in continental
settings is an important record of palaeoenviron-
mental and palaeoclimatic conditions (e.g. Singer,
1984; Singer & Stoffers, 1980; Gale et al., 2006).
The mechanism inferred for smectite illitization in
palaeosols (Robinson & Wright, 1987; Huggett et
al., 2001) is one of seasonal wetting and drying.
This has been proposed based on experimental work
(e.g. Mamy & Gaultier, 1975; Eberl et al., 1986;
Sucha & Siranova, 1991) where smectite subjected
to wetting and drying in the presence of K, NH4 or
Cs has been shown to undergo partial layer collapse.
Abundant slikensides in the Solent Group palaeosols
indicate that wetting and drying has occurred, while
red-green mottling indicates partial oxidation or
reduction which may be a consequence of wetting
and drying cycles (Huggett et al., 2001), reflecting
wetter winters and drier summers (Gale et al., 2006).
In a previous study (Huggett & Cuadros, 2005)
of authigenic illite-rich illite-smectite (I-S) from
pedogenically modified sediments from the Headon
Hill Formation we demonstrated that the driving
mechanism for what appears to be irreversible
Fe(III) reduction is wetting (reducing) and drying
(oxidizing) cycles in gley soil. However, the
FIG. 1. Location map of the Isle of Wight and the sampled section at Whitecliff Bay (WB). Only the late Tertiary
outcrop is shown.
36 J. M. Huggett and J. Cuadros

samples from this study were from several sections
and we were not able to detect clearly any
intermediate stages in the illitization process. Our
study also included one sample (named ‘44 m’ in
the previous study) significantly more Fe-rich and
more illitic than any other. Dating of this clay
(Huggett et al., 2001) indicates that it formed at
around the time of deposition (~34 Ma).
Consequently, for the detailed study of the
illitization process and the cause of the large Fe
enrichment, we selected a 1.1 m thick interval of
marl at the boundary of the Seagrove Member and
the overlying Bembridge Limestone Formation (this
is also the Eocene-Oligocene boundary) that
includes this highly illitic sample. The chemical
characterization of the illitic end-member in the
sequence shows it to be glauconite.
MATER IALS AND METHODS
Samples
Eleven samples of unweathered material were
taken at 10 cm intervals over a 1.1 m section of
marl at the very top of the Headon Hill Formation
between a limestone with green-grey clay laminae
and the Bembridge Limestone Formation (Fig. 2).
The lowest sample is 20 cm (0 cm is an arbitrary
datum), the highest 120 cm. A sample analysed
previously from a height of 97 cm above the base
of the marl (sample 44 m of Huggett et al., 2001,
and Huggett & Cuadros, 2005) proved to have the
most intense illitization and highest Fe content of
any of the Solent Group samples analysed at that
time; because of this, this sample was also included
in the present study, making the total number of
samples 12.
XRD and sample treatment
The untreated, whole-rock samples were analysed
by means of X-ray powder diffraction (XRD) to
determine their mineral composition. They were
ground with acetone in a rod mill, dried and gently
ground in an agate mortar before being side-packed
into sample holders and scanned at a rate of 1 s per
0.02º step width, using 0.3 mm slits from 5 to
65º2y. For further analysis, calcite was removed
with 30% acetic acid and the insoluble residue
washed three times with distilled water. The <2 mm
FIG. 2. Lithological log of the sampled section with sample positions (distance in cm to an arbitrary datum) and
their ‘illite’ content shown graphically.
Glauconite from lacustrine/palaeosol sediments 37

fraction was separated using centrifugation. The
sodium dithionite method (Smith, 1994) was used
to remove possible Fe or Al (oxyhydr)oxide.
Oriented mounts for XRD were prepared by
allowing a few drops of the clay slurry to dry on
a glass slide. Samples were analysed in the range
2�50º2y in a Philips PW1710 diffractometer at
45 kV and 40 mA using a Cu anode, a graphite
secondary monochromator, fixed slit and a 0.1 mm
receiving slit. The samples were scanned at
0.015º2y step size and 8 s/step. The analyses were
carried out in an air-dry state (20�25ºC, 50�60%relative humidity) and after overnight glycolation at
60ºC in a glycol atmosphere.
XRD modelling
The traces of the glycolated, oriented mounts
were modelled with NEWMOD (Reynolds &
Reynolds, 1996; Moore & Reynolds, 1997), a
programme that allows calculation of 00l profiles
for end-members and mixed-layer phyllosilicates
with different interlayer complexes. The NEWMOD
calculations included I-S of different compositions
and illite. The variables used to obtain the best
match with the experimental patterns were % illite
layers in the I-S phases, layer ordering (R) in the
I-S stacking sequence, Fe and K abundance, and
size of the coherent scattering domain. The
orientation of the particles was set at s* = 30º by
best match with the experimental patterns, where
s* is the standard deviation from a 0º angle (layers
perfectly parallel to the substrate) in a Gaussian
distribution.
Inductively coupled plasma atomic emission
spectrometry (ICP-AES)
Major and minor elements were analysed by ICP-
AES, after first removing Fe and Al oxides by the
sodium dithionite method. Powdered samples were
fused with LiBO2, then dissolved in dilute HNO3.
The concentrations of selected major and trace
elements were determined using a Varian Vista Pro
spectrometer with a CCD detector. Analytical errors
vary between 0.4 and 5% of measured values.
Fe(II) analysis
A split of the calcite- and oxide-free <2 mmfraction was also analysed for structural Fe(II). For
this, samples were digested in HF/H2SO4 and the
resulting solution titrated against potassium
permanganate.
Scanning electron microscopy (SEM) and
energy dispersive X-ray analysis (EDX)
Fresh, gold-coated, fracture surfaces of each rock
sample were examined in a Philips Field Emission
LV30 Scanning Electron Microscope (SEM) to
observe any changes in particle morphology with
illitization. For two samples (20 cm and 97 cm)
quantitative EDX analyses were collected from the
carbon-coated <2 mm fraction mounted on carbon
stickers on a glass slide, using a JEOL 5900LV
equipped with an Oxford Instruments INCA EDX
detector. Chemical analyses were calibrated using
mineral standards. The EDX analyses were
performed because these two samples showed Na
contamination, possibly from NaCl. Due to a lack
of samples for further ICP-AES analyses, EDX
analyses were obtained, which confirmed low-Na
contents, and these values were used in the
subsequent calculations.
Structural formulae
Bulk and EDX chemical analyses were trans-
formed into structural formulae on the O10(OH)2basis (per half formula unit: p.h.f.u.). Some Al was
assigned to the tetrahedral sheet so Si + Al = 4.
This provides accurate results given that quartz
contamination in the <2 mm fraction is always
minor. The remaining Al, Fe, Mn, Ti and Mg were
assigned to the octahedral sheet, up to a maximum
of two atoms. If this resulted in more than two
atoms, the necessary Mg was assigned to the
interlayer, with K, Na and Ca.
Laser particle size analysis (LPSA)
Particle size analysis was carried out on the
insoluble residue after calcite removal and prior to
<2 mm fraction separation, on all samples except
20 cm and 97 cm. Samples were dispersed in
deionized water and further dispersed in an ultrasound
bath for 1 min. They were analysed using a Malvern
Masters izer 2000 version, in the range
0.02�2000 mm. Relative proportions of particle-size
ranges were quantified by measuring the areas under
the size distribution maxima. The areas were
measured by curve-fitting procedures. As the experi-
mental distribution peaks have irregular shapes,
38 J. M. Huggett and J. Cuadros

several peaks were used to fit each experimental peak
to obtain a good coverage of the area.
Infrared analysis
All samples except 97 cm were analysed using a
Perkin Elmer Spectrum One FTIR spectrometer in
transmission mode, in the range 4000�250 cm�1,
with a resolution of 16 cm�1, and accumulation of
eight scans per sample. The samples were prepared
as KBr pellets with 1�3 mg clay/200 mg KBr.
RESULTS
XRD qualitative analysis of powder mounts
The whole-rock mineralogy is predominantly
calcite, plus clays and minor quartz. Goethite was
only detected in the illite-rich samples from 70 to
110 cm inclusive, and potassium feldspar is present
in samples 20�60 cm inclusive.
XRD analysis of oriented mounts
The experimental and simulated patterns of the
glycolated oriented mounts (<2 mm fraction, after
calcite removal) are shown in Fig. 3. The calculated
background intensity in the low-angle region is
greater than the experimental one due to the
dependence of the effective size of the coherent
scattering domain on the diffracting angle (Plancon,
2002), a feature that NEWMOD does not
incorporate. We found that the sensitivity of the
calculations to Fe content in the I-S phases
decreased with illite proportion, and thus we do
not attach great significance to the calculated Fe
contents of the smectite-rich I-S phases. The only
clays present are illite and I-S, and traces of
kaolinite in sample 110 cm. Goethite is frequently
present (peak at 21º2y), whereas calcite (peak at
29.5º2y) and quartz (sharp peaks at 21 and 26.7º2y)appear in sample 97 cm. We modelled the patterns
using a limited number of components (Table 1)
TABLE 1. Parameters in the best fits of the NEWMOD calculations of oriented, glycolated mounts.
Sample Phase %I Fe N Nave Wt.% Tot %I
120 cm I-S 95 0.25 1-14 7 92 91I-S 40 0.7 1-6 4 8
110 cm I-S 95 0.4 1-14 7 94 92I-S 40 0.7 1-6 4 6
100 cm Illite 100 0.8 1-15 8 100 10097 cm I-S 70 0.8 1-7 4 12 96
Illite 100 0.8 1-5 2 15Illite 100 0.8 1-18 15 73
90 cm I-S 95 0.7 1-14 7 100 9580 cm I-S 95 0.7 1-14 7 100 9570 cm I-S 93 0.7 1-14 7 100 9360 cm I-S 90 0.6 1-14 7 80 80
I-S 40 0.7 1-6 4 2050 cm I-S 87 0.25 1-14 7 50 64
I-S 40 0.7 1-6 4 5040 cm I-S 85 0.25 1-14 7 70 72
I-S 40 0.7 1-6 4 3030 cm I-S 85 0.25 1-14 7 70 72
I-S 40 0.7 1-6 4 3020 cm I-S 85 0.25 1-14 7 85 78
I-S 40 0.7 1-6 4 15
%I, Tot %I = percent illite layers in the phase and the sample, respectivelyFe = in the corresponding phase per O10(OH)2N, Nave = range of number of layers and average number of layers in the coherent scattering domainOther parameters: R0, K in illite = 0.8 per O10(OH)2, illite d value = 9.98 A, smectite d-value = 16.9 A
Glauconite from lacustrine/palaeosol sediments 39

FIG. 3. Experimental and calculated XRD patterns of the oriented, glycolated clay mounts.
40 J. M. Huggett and J. Cuadros

but we believe that the samples consist of a mixture
of numerous I-S phases, within the range of
smectite and illite compositions given in Table 1.
Our model is not intended as a completely accurate
description of the complex samples but it is a good
approximation to their clay mineral composition. As
demonstrated previously for I-S from the Solent
Group (Huggett & Cuadros, 2005), R0 ordering
predominates in the entire range of I-S composition,
which points to a low-temperature illitization
process, as opposed to burial diagenesis illitization
that commonly results in R>1 for illite >~60%. The
modelled smectite-rich component has 40% illite
layers, while the illite-rich component has
85�100% illite layers. Where the lacustrine marl
has been pedogenically modified the smectite-rich
I-S is much reduced in abundance or absent, and
the illite-rich component is, on average, both more
abundant and more illitic (Table 1). The features of
the XRD traces of the air-dry mounts (not shown)
are perfectly compatible with the results obtained
from the glycolated mounts.
All samples with goethite have >90% illite.
Quartz is present in all bulk samples (powder
XRD) but the ratio of illite:quartz increases with %
illite in the clay fraction by more than an order of
magnitude from ~ 2 to 14. This implies that the
proportion of quartz is smallest in the most illitized
samples.
Chemical analyses
The chemical analyses confirm that the clay is
Fe-rich, and that K is the principal interlayer cation
(Table 2). The K content correlates well with the
illite content determined from XRD (Fig. 4). There
is a good negative correlation between K and Si
(Fig. 5a), indicating that illitization produces an
increase of the tetrahedral charge (from 0.24 to 0.58
p.h.f.u.). There is also a good negative correlation
between K and octahedral Al (Fig. 5b), mirrored by
a positive correlation between K and total (ferric +
ferrous) Fe (Fig. 5c). Thus, illitization was accom-
panied by Fe-for-Al substitution in the octahedral
sheet. There is a broad increase in total Mg
(octahedral + interlayer) with increasing K content
(Fig. 5d). Layer charge and K are also well
correlated (Fig. 5e). There is therefore more K,
Fe(II) and total Fe in the pedogenically modified
samples than in the lacustrine samples. It was noted
that the only two samples that were not green in the
bulk sample (110 and 120 cm) became green after
removal of Fe and Al oxides from the <2 mmfraction. From this we infer that colour in these
sediments is not related to clay composition. The
octahedral occupancy is 1.96�2.00 ions and R3+ is
1.65�1.74. The calculated charge of the interlayer
cations is 0.59�0.89 p.h.f.u. and is balanced by thelayer charge.
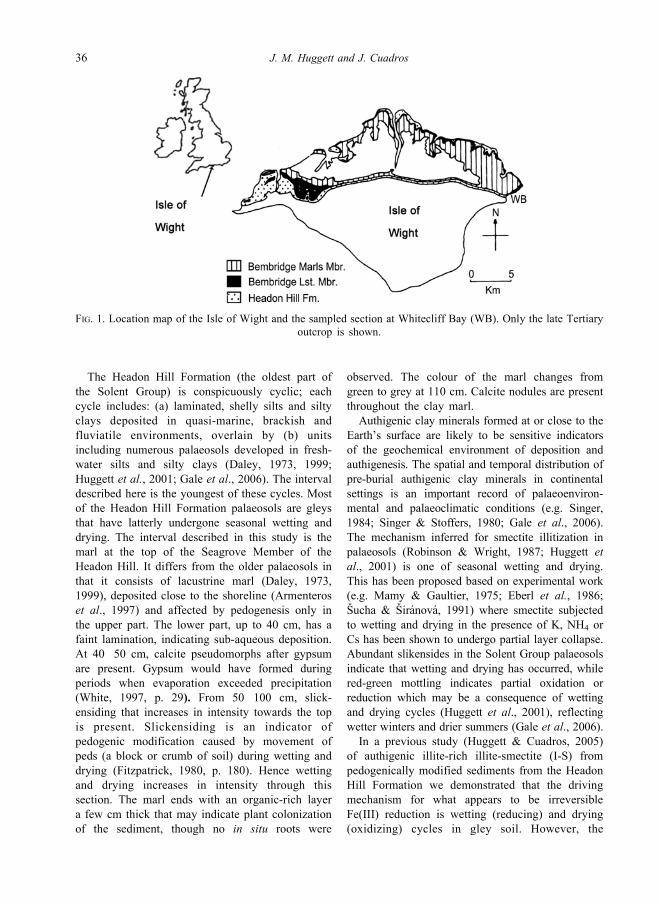
SEM and LPSA analysis
Assessment of the lateral size of individual
particles in SEM images suggests that the most
illite-rich samples (70�120 cm) are dominated by
particles ~0.1�0.2 mm (Fig. 6a). The more smec-
tite-rich samples appear to be dominated by two
particle sizes; ~0.1�0.2 mm and ~1�2 mm(Fig. 6b). Given that this SEM assessment is a
visual estimate of the clay particle dimensions, it is
remarkable that the LPSA data (Fig. 7) are quite
consistent with the SEM observations. The LPSA
particle-size distributions are bimodal, with maxima
at ~0.2 and 1.5�1.8 mm (Fig 7). Both maxima have
shapes approaching that of log-normal distributions,
much broader for the larger particle-size maximum.
IR analysis
The IR spectra are typical of dioctahedral Fe-rich
I-S. They show no evidence of interlayer NH4+ (no
band at 1450 cm�1). The OH-stretching region does
not provide usable information due to overlap with
a very prominent OH band from hydration water.
FIG. 4. Potassium vs. illite content in the clay samples.
The correlation corresponds to a 95% confidence
interval.
Glauconite from lacustrine/palaeosol sediments 41

The OH-bending region displays features that
confirm the chemical results. The samples have
bands at the following approximate frequencies:
918 cm�1 (Al2OH), 875 cm�1 (AlFeOH) and
817 cm�1 (Fe2OH; Fig. 8). Also, a weak doublet
appears in some samples at ~795 and 775 cm�1,
corresponding to quartz. These band assignments
are fairly well established (Russell & Fraser, 1994).
The intensity of the Al2OH band in samples
20�60 cm is greater than that of Fe2OH.
However, for samples 70�120 cm (97 cm not
analysed) the Fe2OH band is more intense than
Al2OH. The AlFeOH band is always intense. These
results are in agreement with the chemical results,
as there is a sharp Fe increase and Al decrease in
samples 70�120 cm (Table 2). Figure 8 shows an
example of each sample group. The OH-bending
bands are wide, a typical characteristic of illitic clay
(Russell & Fraser, 1994).
D I SCUSS ION
The illitization
Huggett & Cuadros (2005) found that, for samples
from the Solent Group as a whole, all of which have
medium to large amounts of Fe, illite was formed in
soils subjected to seasonal wetting and drying that
caused Fe reduction during the wet periods, a
process that has been described in modern soils
(Siyuan & Stucki, 1994; Stucki, 1997). As complete
Fe re-oxidation did not occur during the dry seasons,
there was a net process of progressive reduction.
This conclusion was supported by analysis of Fe(II),
TABLE 2. Chemical composition of the <2 mm fraction of the studied samples and structural formulae calculated
on the basis of O10(OH)2.
Sample 120 110 100 97 90 80 70 60 50 40 30 20
% illite by XRD 91 92 100 96 95 95 93 80 64 72 72 78SiO2 45.10 43.45 43.00 44.70 43.75 44.77 44.44 45.42 44.90 45.31 46.04 45.96Al2O3 8.55 8.97 8.30 9.60 8.32 8.50 9.73 11.80 12.70 12.70 13.20 14.95MgO 2.07 1.93 1.75 2.11 1.78 1.73 1.67 1.61 1.58 1.62 1.51 1.75Fe2O3 24.12 23.67 22.33 22.81 25.28 23.05 22.24 15.20 10.97 10.63 10.36 9.82FeO 1.33 2.97 2.40 2.99 2.72 2.58 1.17 1.02 1.03 1.53 1.26 1.29MnO 0.02 0.01 0.01 0.01 0.01 0.01 0.01 0.01 0.01 0.01 0.01 0.01TiO2 0.39 0.19 0.17 0.10 0.18 0.18 0.18 0.27 0.32 0.34 0.36 0.22CaO 0.12 0.49 0.39 0.19 0.34 0.56 0.64 0.91 1.23 1.17 1.31 1.17Na2O 0.18 0.18 0.15 0.15 0.18 0.28 0.18 0.19 0.23 0.18 0.22 0.25K2O 5.38 5.82 5.93 6.39 5.74 5.82 5.26 4.34 3.43 3.65 3.11 4.00
Sum 87.27 87.69 84.43 89.05 88.30 87.47 85.51 80.77 76.41 77.14 77.37 79.41
Structural formulaeSi 3.52 3.42 3.50 3.45 3.43 3.51 3.51 3.66 3.74 3.75 3.76 3.68Al tet. 0.48 0.58 0.50 0.55 0.57 0.49 0.49 0.34 0.26 0.25 0.24 0.32Al oct. 0.30 0.26 0.30 0.33 0.20 0.30 0.42 0.78 0.99 0.98 1.04 1.09Mg oct. 0.17 0.13 0.16 0.15 0.11 0.16 0.17 0.19 0.20 0.20 0.18 0.21Fe(III) 1.42 1.41 1.37 1.33 1.49 1.36 1.32 0.92 0.69 0.66 0.64 0.59Fe(II) 0.09 0.20 0.16 0.19 0.18 0.17 0.08 0.07 0.07 0.11 0.09 0.09Mn 0.00 0.00 0.00 0.00 0.00 0.00 0.00 0.00 0.00 0.00 0.00 0.00Ti 0.02 0.01 0.01 0.01 0.01 0.01 0.01 0.02 0.02 0.02 0.02 0.01Mg intl 0.07 0.10 0.05 0.10 0.09 0.04 0.03 0.00 0.00 0.00 0.00 0.00Ca 0.01 0.04 0.03 0.02 0.03 0.05 0.05 0.08 0.11 0.10 0.11 0.10Na 0.03 0.03 0.02 0.02 0.03 0.04 0.03 0.03 0.04 0.03 0.04 0.04K 0.54 0.59 0.62 0.63 0.58 0.58 0.53 0.45 0.36 0.39 0.32 0.41Sum oct. 2.00 2.00 2.00 2.00 2.00 2.00 2.00 1.98 1.96 1.97 1.96 1.99Total Fe 1.50 1.60 1.53 1.52 1.67 1.53 1.40 0.99 0.76 0.77 0.72 0.68Oct charge 0.24 0.32 0.31 0.33 0.28 0.32 0.24 0.29 0.36 0.37 0.35 0.32Intl charge 0.72 0.89 0.81 0.88 0.85 0.81 0.72 0.63 0.62 0.62 0.59 0.65
42 J. M. Huggett and J. Cuadros

which increased with illite content. The chemical
data also confirmed that there is no evidence of the
usual process of Al-for-Si substitution in the
tetrahedral sheet, or Mg-for-(Al+Fe) substitution in
the octahedral sheet in the sample suite then
analysed, both of which processes could have
produced the layer charge increase necessary for
illitization. Modelling of oriented mount XRD
patterns by Huggett & Cuadros (2005) produced
several I-S phases of varying illite content. Their
results required the most illitic I-S phase in each
sample to have a smaller Fe content than the less
illitic components. The exception to this result was
the sample from the Seagrove Member (greatest Fe
content among samples from Huggett & Cuadros,
2005), where Fe is high and the same for all I-S
phases, for which result there was no explanation.
The present data allow a more complete view of the
processes producing illitization in the Solent Group,
explain the ‘anomalous’ sample of Seagrove
Member marl from the previous studies, its high
degree of illitization, the large Fe content of the
illitic clay and the absence of detrital kaolinite and
chlorite.
FIG. 5. Chemical correlations in the studied clays, indicating chemical modification accompanying illitization.
The only weak correlation is that of Mg vs. K (d).
Glauconite from lacustrine/palaeosol sediments 43
The samples in this study are different from those
of Huggett & Cuadros (2005) in that illitization is
correlated with tetrahedral Al-for-Si substitution and
octahedral Fe-for-Al substitution (Fig. 5a�c). Thus,illitization in these samples is driven or influenced
by a different (or additional) process. There is
evidence of two types of depositional environment in
the sampled section. The lower part of the section,
below 50 cm, is lacustrine sediment (Daley, 1973,
1999), with no evidence of pedogenic modification.
Illitization of smectite in this interval therefore
occurred in a subaqueous hypersaline environment,
without any subsequent modification by pedogenic
processes. The presence of calcite pseudomorphs
after gypsum at 40�50 cm indicates increased
salinity relative to the lacustrine environment.
Illitization of smectite has previously been reported
from hypersaline lacustrine environments with alka-
line potassic pore fluid (Singer & Stoffers, 1980;
Deconinck et al., 1988). Potassium enrichment is
reported to have occurred through evaporation and
marine ingression in Berriasian lacustrine sediments
(Deconinck et al., 1988). Both these processes may
apply to the Seagrove Member lakes, which would
have lain close to the coastline (Armenteros et al.,
1997). Illitization in saline waters is accompanied by
Al-for-Si substitution and chemical changes in the
octahedral sheet, (Mg-for-(Al+Fe) substitution and
transformation from dioctahedral to trioctahedral
clays) driven by water chemistry (Singer &
Stoffers, 1980; Hover & Ashley, 2003).
The second type of environment in this study
corresponds to the section above 50 cm, where
slickensiding indicates increasing intensity of
pedogenesis, culminating in a thin layer with
organic matter in the top (sample 120 cm). It can
be inferred that the hypersaline lake dried up and
became a soil environment. Such an environment
would favour illitization driven by Fe reduction, as
in the samples of Huggett & Cuadros (2005).
Figure 9 shows that, in the present study, Fe(II)
remains approximately constant in the range
60�90% illite (0.3�0.55 K p.h.f.u.), which
corresponds to samples 20�80 cm, and then
increases sharply for samples 90�120 cm, where
there is a small increase of illite (90�100%) or K(0.55�0.63 atoms p.h.f.u.). The samples with the
greater Fe(II) content correspond to those with most
intense signs of pedogenesis processes. The two
environments (hypersaline lake and soil) produced
different processes influencing illitization, which
are described below.
All samples in this study experienced the hyper-
saline environment producing illitization, which was
more intense, generally, from the bottom to the top
of the lithological section. For this reason, all
samples show a correlation of Si, Al and Fe vs. K
or illite (Fig. 5). There is also a slight increase in
Mg content with increased K content, consistent
with hypersaline clay authigenesis (Fig. 5d). Such
illitization produced large illite contents in the upper
samples. After this process, the upper samples
(60�120 cm) also underwent pedogenesis and
concomitant wetting and drying processes, which
caused Fe reduction (Fig. 9). This process caused
further illitization, although of little extent because
the illite % was already large (~90%). Figure 5
FIG. 6. Fracture surface SEM images of the marl.
(a) Sample 100 cm, with 100% illite and grain size
predominantly ~0.1�0.2 mm. (b) Sample 40 cm, one ofthe more smectite-rich samples with 71.5% illite
measured by XRD, and grain size dominated by two
particle sizes; ~1�2 mm and ~0.1�0.2 mm. The
appearance of this sample is strikingly different to
that of shown in (a).
44 J. M. Huggett and J. Cuadros

shows that data points are divided in two groups;
corresponding to those that experienced only
hypersaline clay authigenesis of lower intensity (K
< 0.5 atoms p.h.f.u.) and those that experienced
FIG. 7. Plots of the particle-size distribution measured by laser granulometry. The change of the area proportions
of the two peaks in the bimodal distribution correlates with the occurrence of pedogenic activity at the upper part
of the sequence.
Glauconite from lacustrine/palaeosol sediments 45

more intense hypersaline clay authigenesis and
wetting and drying (K > 0.5 atoms p.h.f.u.). The
latter data points have a slightly increased dispersion
in Fig. 5a, b and e. This is probably due to the
overprinting of illitization driven by Fe reduction
over hypersaline clay authigenesis. In Fe-reduction
illitization there is no Al-for-Si substitution and the
illitization process is a very heterogeneous one
occurring in the solid state (Huggett & Cuadros,
2005), which slightly blurs the trends produced by
hypersaline clay authigenesis. In summary, the ‘dual
action’ illitization, first in a hypersaline lake and
latterly through wetting and drying, may be
responsible for the intensity of illitization and
exceptionally high (for the Solent Group) Fe
content of the authigenic illite. Consistent with
this, dating of the illite from the sample at 97 cm
indicated that all the illite was formed at around the
time of deposition (Huggett et al., 2001).
Clays of the mica family formed at low
temperature are characterized by large Fe contents
(e.g. Odin, 1988; Huggett, et al., 2001, and
references therein; Huggett, 2005). Most low-
temperature Fe-rich clay is marine but there are a
few accounts of neoformed ferric illite in lacustrine
or lagoonal environments (Singer & Stoffers, 1980;
Deconinck et al., 1988; Hay et al., 1991) and
palaeosols (Robinson & Wright, 1987; Ingles &
Ramos-Guerrero, 1995). However it is not apparent
from the published literature whether hypersaline
lakes or soils provide a more favourable environ-
ment for Fe fixation. The distribution of data points
in two clusters correlating with the hypersaline lake
and the palaeosol in Fig. 5 suggests that a second
phase of Fe and K increase took place in the soil
environment, at the top of the section. This is
consistent with our observation that the data point
with an intermediate Fe-content value (0.99 atoms
p.h.f.u.) was the first that was affected by
pedogenesis, and that the low intensity of slick-
ensiding indicates that pedogenesis for this sample
was less intense than in the overlying Fe-rich clay.
If the Fe-enrichment process happened entirely
within the lacustrine environment, with salinity
increasing with time, a continuous trend in the data
points might be expected, rather than two data
clusters on a trend (Fig. 5c). Thus, Fe enrichment
was probably produced in the lake and soil
environments and it is not possible to assess their
relative contribution to this process.
Further evidence that two processes operated in
the transformation of these samples is provided by
the particle-size data. The very wide maximum at
1.5�1.8 mm suggests a detrital component, with a
longer and more complex history, whereas the
narrow maximum at ~0.2 mm suggests a specific
event (Fig. 7). Up to 60 cm the I-S particle size
distribution is overwhelmingly dominated by the
maximum at 1.5�1.8 mm. Above 60 cm the
maximum at 0.2 mm becomes more prominent.
This sample marks the transition to samples
overprinted with soil processes. Precisely, wetting
and drying causes particle rupture and generates
smaller crystals. Besson et al. (1983) found that Cs-
FIG. 8. Part of the IR spectra of two selected samples,
showing the OH-bending bands corresponding to
AlOHAl (918 cm�1), AlOHFe (875 cm�1) and
FeOHFe (817 cm�1). There is a change in the relativeintensities of the AlOHAl and FeOHFe bands that
match their different Al and Fe contents.
FIG. 9. Illite and K content vs. Fe(II) content. Fe(II)
increases in the samples with the greatest illite content,
corresponding to those which suffered pedogenesis.
The implication is that the final stage of illitization in
these samples was caused by Fe reduction.
46 J. M. Huggett and J. Cuadros

and K-smectite affected by wetting and drying
cycles had particles more than one order of
magnitude smaller than before the treatment.
Huggett & Cuadros (2005) also found evidence of
reduced lateral dimensions (a and b crystallographic
dimensions) of I-S crystals from palaeosols in the
Solent Group. Thus, seasonal wetting and drying in
a soil environment can explain the different
particle-size distribution below and above 60 cm.
Particle size provides further insight by comparison
with illite % (Fig. 10). A plot of the area under the
0.2 mm maximum (finer fraction) vs. illite % shows
a shallow slope in the range 64�100 % illite and
then a sharp increase with no illitization.
Tentatively, the plot can be interpreted as the
result of two processes occurring in the two
environments experienced by the samples. In the
hypersaline lake, neoformation of illite or illite-rich
I-S may have generated the finer fraction and
caused a slight increase of this fraction towards the
top, as the salinity of the waters increased. Then, in
the soil environment, particle break-up caused the
large increase of the fine fraction. Alternatively, the
dual particle-size distribution below 60 cm may be
that of the pre-illitized clay.
The absence of K feldspar above 60 cm suggests
that it has been dissolved in the pedogenic
environment and has provided K for the final
illitization that occurred in this environment
(resulting in 90�100% illite clay). Dissolution of
K feldspar in the soil is very likely because, in the
wet season, porewater would have been of small
ionic content (relative to the hypersaline lake). The
proportions of this mineral (<5 wt.% by XRD semi-
quantitative analysis) present in the lower part of
the section may be indicative of what was formerly
present above 60 cm.
The Seagrove Member marl has the only clay
assemblage in the formation that comprises only
illite and I-S. Throughout the rest of the Headon
Hill Formation, minor amounts of kaolinite and
chlorite occur in the clay assemblage. The absence
of these minerals from the Seagrove Member marl
may be a consequence of dissolution of these
detrital clays. Kaolinite may have dissolved in the
hypersaline lake because it is destabilized by high-
pH and ion concentration. Chlorite may have also
been dissolved in the lake, although chemical
conditions in hypersaline waters are probably not
far from the chlorite stability field (Garrels &
Christ, 1965; their Fig. 10.8). Chamley (1989)
points out that chlorite is usually absent or scarce
in evaporative environments not subjected to burial
diagenesis, from which it may be inferred that they
are outside the stability field of chlorite.
Defining the clay
Previously, Fe-rich 10 A clay from the brackish
and freshwater sediments of the Headon Hill
Formation have been described as Fe-rich illite
(Huggett et al., 2001). As a result of this study of
Seagrove Member marl, we have been able to
identify an interval with illite as the only clay
(~100 cm). This is conveniently also the interval
with least quartz contamination of the clay, and
therefore the best suited to correctly identifying
precisely the Fe-rich clay on the basis of chemistry
and charge distribution. Glauconite is defined by
Bailey (1980) as an Fe-rich dioctahedral clay with
tetrahedral Al usually >0.2 atoms per O10(OH)2,
octahedral R3+ >1.2 atoms, with Fe3+>>Al +
Mg>>Fe2+, and d060 >1.510 A. The structural
formulae in this work and previous measurement
of d060 (Huggett & Cuadros, 2005) indicate that all
these conditions are met by the Seagrove Member
10 A clay. The clay also conforms to the layer
charge and octahedral charge requirements for
glauconite. The 10 A clay in the Seagrove
Member marl has an interlayer charge of
0.80�0.89 and an octahedral charge of
0.30�0.33 p.h.f.u. (assessments from values in
Table 2). These values are within the chemical
FIG. 10. Relative proportion of the area under the peak
corresponding to the finer fraction (from laser
granulometry) vs. the illite percent.
Glauconite from lacustrine/palaeosol sediments 47

and charge fields of glauconite as plotted by
Weiszburg et al. (2004; their fig. 9). For charge
0.8�0.85 p.h.f.u., our samples are glauconite
according to the definitions of both the AIPEA
(Bailey, 1980, 1986) and IMA (Rieder et al., 1998);
for charge >0.85 our samples are glauconite
according to the AIPEA and ‘unclassified’
according to the IMA. In situ pelletal authigenic
glauconite has previously been reported from very
shallow marine (Huggett & Gale, 1997) and
lagoonal environments (El Albani et al., 2005),
but we are not aware of any reports of glauconite,
pelletal or non-pelletal from a lacustrine setting.
The illite in the Seagrove Member is therefore a
rare occurrence of non-marine glauconite.
CONCLUS IONS
The lacustrine marl has a clay assemblage with a
range of I-S compositions that, for the sake of
modelling, has been simplified to one to three I-S
phases of increasing illite (more specifically,
glauconite) composition. Where the lacustrine
marl has been pedogenically modified the smec-
tite-rich mixed-layer clay is much reduced in
abundance or absent, and the illite-rich component
is both more abundant and more illitic. In one
sample (100 cm) the clay is pure glauconite. These
assemblages are a consequence of illitization of
detrital illite-smectite and dissolution of other clays
(kaolinite and chlorite) in the hypersaline waters.
Throughout the marl, the following processes
occurred in one or two of the geological
environments (hypersaline lake and soil) experi-
enced by the clays: increased layer charge through
Al substitution for Si in the tetrahedral sheet (lake),
slight Mg-for-Al substitution in the octahedral sheet
(lake), octahedral Fe-for-Al substitution (lake and
soil), K fixation in interlayer sites (lake and soil),
and reduction of Fe(III) to Fe(II) (soil). This ‘dual
mechanism’ has resulted in the most ‘illitic’, Fe-
rich neoformed clay in the Headon Hill Formation.
Following several nomenclature recommendations
(Bailey, 1980, 1986; Rieder et al., 1998) the Fe-rich
neoformed clay is glauconite. This is therefore a rare
occurrence of non-marine glauconite.
ACKNOWLEDGMENTS
Andy Gale from the University of Portsmouth is
thanked for assistance with sampling and David Wray
from the University of Greenwich is thanked for
carrying out the LPSA. Jean Francois Deconinck and
an anonymous reviewer are thanked for reviewing the
manuscript and their comments.
REFERENCES
Armenteros I., Daley B. & Garcia E. (1997) Lacustrine
and palustrine facies in the Bembridge Limestone
(late Eocene, Hampshire Basin) of the Isle of Wight,
s o u t h e r n E n g l a n d . P a l a e o g e o g r a p h y ,
Palaeoclimatology, Palaeoecology, 128, 111�132.Bailey S.W. (1980) Summary of recommendations of
AIPEA nomenclature committee. Clays and Clay
Minerals, 28, 73�78.Bailey S.W. (1986) Report of AIPEA Nomenclature
Committee. Supplement to AIPEA Newsletter No.
22.
Besson G., Glaeser R. & Tchoubar C. (1983) Le cesium
revelateur de structure des smectites. Clay Minerals,
18, 11�19.Chamley H. (1989) Clay and geodynamics. Pp.
527�561 in: Clay Sedimentology. Springer-Verlag.
New York, USA.
Daley B. (1973) The palaeoenvironment of the
Bembridge Marls (Oligocene) of the Isle of Wight.
Proceedings of the Geologists Association, 84,
83�93.Daley B. (1999) Palaeogene sections on the Isle of
Wight. A revision of their description and signifi-
cance in the light of research undertaken over recent
decades. Tertiary Research, 19, 1�69.Deconinck J.F., Strasser A. & Debrabant P. (1988)
Formation of illitic minerals at surface temperatures
in Purbeckian sediments (lower Berriasian, Swiss
and French Jura). Clay Minerals, 23, 91�103.Eberl D., Srodon J. & Northrop R. (1986) Potassium
fixation in smectite by wetting and drying. Pp.
296�326 in: ACS Symposium Series 323 (J.A. Davis
& K.F. Hayes, editors). American Chemical Society,
Washington DC, USA.
El Albani A., Meunier A. & Fursich F. (2005) Unusual
occurrence of glauconite in a shallow marine
lagoonal environment (Lower Cretaceous, northern
Aquitaine Basin, SW France). Terra Nova, 17,
537�544.Fitzpatrick E.A. (1980) Soils, their Formation,
Classification and Distribution. Longman, London.
Gale A.S., Huggett J.M., Palike H., Laurie E., Hailwood
E., Hardenbol J. & Jeffrey P. (2006) Correlation of
Eocene-Oligocene marine and continental records:
orbital cyclicity, magneto- and sequence stratigraphy
of the Solent Group, Isle of Wight, UK. Journal of
the Geological Society, 163, 401�413.Garrells R.M. & Christ C.L. (1965) Solutions, Minerals,
and Equilibria. Harper and Row, New York, USA.
48 J. M. Huggett and J. Cuadros
Hay R.L., Guldman S.G., Mathews J.C., Lander R.H.,
Duffin M.E. & Kyser T.K. (1991) Clay mineral
diagenesis in core km-3 of Searles Lake, California.
Clays and Clay Minerals, 39, 84�96.Hover V.C. & Ashley G.M. (2003) Geochemical
signatures of paleodepositional and diagenetic en-
vironments: a STEM/AEM study of authigenic clay
minerals from an arid rift basin, Olduvai Gorge,
Tanzania. Clays and Clay Minerals, 51, 231�251.Huggett J.M. (2005) Glauconites. Pp. 542�548 in:
Encyclopedia of Geology Vol. 3. (R.C. Selley,
L.R.M. Cocks & I.R. Plimer, editors). Elsevier.
Amsterdam, The Netherlands.
Huggett J.M. & Cuadros J. (2005) Low-temperature
illitization of smectite in the late Eocene and early
Oligocene of the Isle of Wight (Hampshire basin),
UK. American Mineralogist, 90, 1192�1202.Huggett J.M. & Gale A.S. (1997) Petrology and
palaeoenvironmental significance of glaucony in
the Eocene succession at Whitecliff Bay,
Hampshire Basin, UK. Journal of the Geological
Society, 154, 897�912.Huggett J.M., Gale A.S. & Clauer N. (2001) Nature and
origin of non-marine 10 A clay from the Late Eocene
and Early Oligocene of the Isle of Wight (Hampshire
Basin), UK. Clay Minerals, 36, 447�464.I ng l e s M . & Ramos -Gue r r e r o E . ( 1 995 )
Sedimentological control on the clay mineral
distribution in the marine and non-marine
Palaeogene deposits of Mallorca (Western
Mediterranean). Sedimentary Geology, 94, 229�243.Mamy J. & Gaultier J.P. (1975) Etude de l’evolution de
l’ordre cristallin dans la montmorillonite en relation
avec la diminution d’echangeabilite du potassium
(Abstract). Proceedings of the 5th International Clay
Conference, Mexico City, Mexico, 149�155.Moore D.M. & Reynolds R.C. (1997) X-ray Diffraction
and the Identification and Analysis of Clay Minerals,
378 pp. Oxford University Press, Oxford.
Odin G. (1988) Green Marine Clays. Developments in
Sedimentology 45, Elsevier, Amsterdam, The
Netherlands.
Plancon A. (2002) New modeling of X-ray diffraction
by disordered lamellar structures, such as phyllosi-
licates. American Mineralogist, 87, 1672�1677.Reynolds R.C. Jr. & Reynolds R.C. III (1996)
NEWMOD: The Calculation of One-Dimensional
X-ray Diffraction Patterns of Mixed-Layered Clay
Minerals. Computer Program. 8 Brook Road,
Hanover, New Hampshire, USA.
Rieder M., Cavazzini G., D’Yakonov Y.S., Frank-
Kamenetskii V.A., Gottardi G., Guggenheim S.,
Koval P.V., Muller G., Neiva A.M.R., Radoslovich
E.W., Robert J.L., Sassi F.P., Takeda H., Weiss Z. &
Wones D.R. (1998) Nomenclature of the micas. The
Canadian Mineralogist, 36, 905�912.Robinson D. & Wright V.P. (1987) Ordered illite-
smectite and kaolinite-smectite: pedogenic minerals
in a lower Carboniferous paleosol sequence, South
Wales? Clay Minerals, 22, 109�118.Russell J.D. & Fraser A.R. (1994) Infrared methods. Pp.
11�67 in: Clay Mineralogy: Spectroscopic and
Chemical Determinative Methods, (M.J. Wilson,
editor), Chapman & Hall, London.
Singer A. (1984) The paleoclimatic interpretation of
clay minerals in sediments � a review. Earth-
Science Reviews, 21, 251�293.Singer A. & Stoffers P. (1980) Clay mineral diagenesis
in two East African lake sediments. Clay Minerals,
15, 291�307.Siyuan S. & Stucki J. (1994) Effects of iron oxidation
state on the fate and behaviour of potassium in soils.
Pp. 173�185 in: Soil Testing: Prospects for
Improving Nutrient Recommendations. Soil Science
Society of America Special Publication 40.
Smith B. (1994) Characterization of poorly ordered
minerals by selective chemical methods. Pp.
333�357 in: Clay Mineralogy: Spectroscopic and
Chemical Determinative Methods (M.J. Wilson,
editor), Chapman & Hall, London.
Stucki J. (1997) Redox processes in smectites: Soil
environmental s ignif icance. Advances in
GeoEcology, 30, 395�406.Sucha V. & Siranova V. (1991) Ammonium and
potassium fixation in smectite by wetting and drying.
Clays and Clay Minerals, 39, 556�559.Weiszburg T.G., Toth E. & Beran A. (2004) Celadonite,
the 10A green clay mineral of the manganese
carbonate ore, Urkut, Hungary. Acta Mineralogica
Petrographica, 45, 65�80.White R.E. (1997) Principles and Practice of Soil
Science. Blackwell Science Ltd., Oxford.
Glauconite from lacustrine/palaeosol sediments 49