Alcoholism: Piecing Together Research to Consider Single Parent Households
Upload
independentCategory
view
2download
0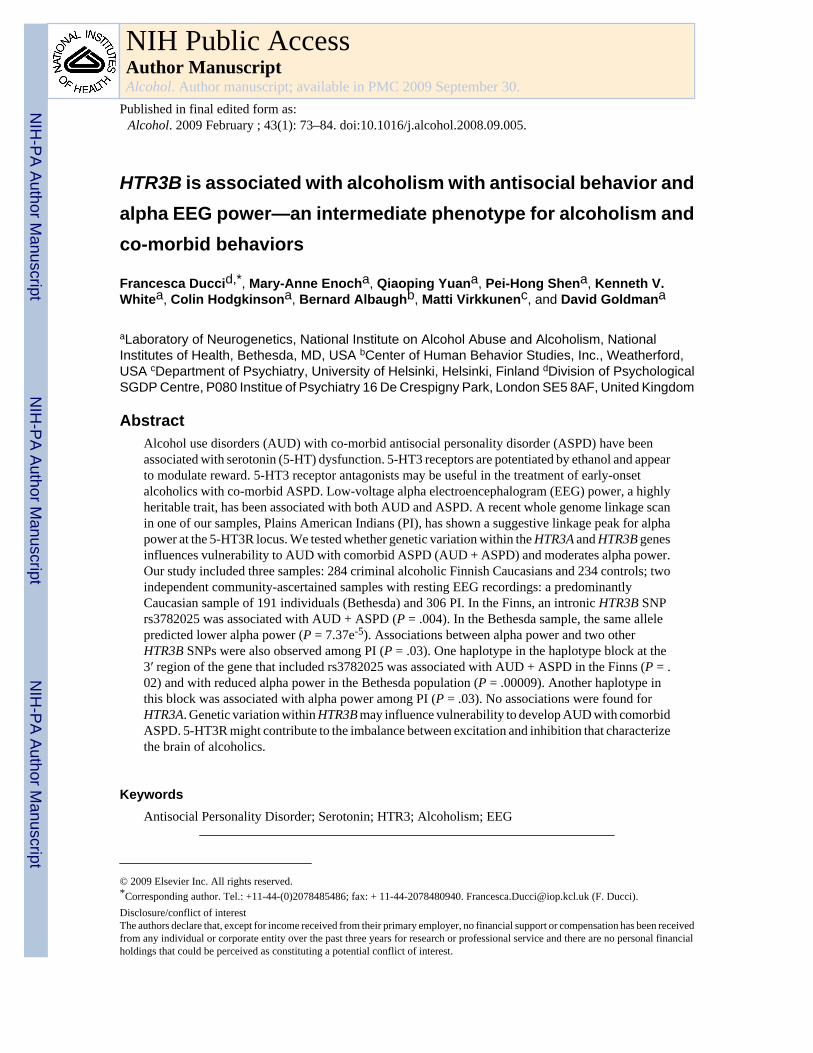
HTR3B is associated with alcoholism with antisocial behavior andalpha EEG power—an intermediate phenotype for alcoholism andco-morbid behaviors
Francesca Duccid,*, Mary-Anne Enocha, Qiaoping Yuana, Pei-Hong Shena, Kenneth V.Whitea, Colin Hodgkinsona, Bernard Albaughb, Matti Virkkunenc, and David Goldmana
aLaboratory of Neurogenetics, National Institute on Alcohol Abuse and Alcoholism, NationalInstitutes of Health, Bethesda, MD, USA bCenter of Human Behavior Studies, Inc., Weatherford,USA cDepartment of Psychiatry, University of Helsinki, Helsinki, Finland dDivision of PsychologicalSGDP Centre, P080 Institue of Psychiatry 16 De Crespigny Park, London SE5 8AF, United Kingdom
AbstractAlcohol use disorders (AUD) with co-morbid antisocial personality disorder (ASPD) have beenassociated with serotonin (5-HT) dysfunction. 5-HT3 receptors are potentiated by ethanol and appearto modulate reward. 5-HT3 receptor antagonists may be useful in the treatment of early-onsetalcoholics with co-morbid ASPD. Low-voltage alpha electroencephalogram (EEG) power, a highlyheritable trait, has been associated with both AUD and ASPD. A recent whole genome linkage scanin one of our samples, Plains American Indians (PI), has shown a suggestive linkage peak for alphapower at the 5-HT3R locus. We tested whether genetic variation within the HTR3A and HTR3B genesinfluences vulnerability to AUD with comorbid ASPD (AUD + ASPD) and moderates alpha power.Our study included three samples: 284 criminal alcoholic Finnish Caucasians and 234 controls; twoindependent community-ascertained samples with resting EEG recordings: a predominantlyCaucasian sample of 191 individuals (Bethesda) and 306 PI. In the Finns, an intronic HTR3B SNPrs3782025 was associated with AUD + ASPD (P = .004). In the Bethesda sample, the same allelepredicted lower alpha power (P = 7.37e-5). Associations between alpha power and two otherHTR3B SNPs were also observed among PI (P = .03). One haplotype in the haplotype block at the3′ region of the gene that included rs3782025 was associated with AUD + ASPD in the Finns (P = .02) and with reduced alpha power in the Bethesda population (P = .00009). Another haplotype inthis block was associated with alpha power among PI (P = .03). No associations were found forHTR3A. Genetic variation within HTR3B may influence vulnerability to develop AUD with comorbidASPD. 5-HT3R might contribute to the imbalance between excitation and inhibition that characterizethe brain of alcoholics.
KeywordsAntisocial Personality Disorder; Serotonin; HTR3; Alcoholism; EEG
© 2009 Elsevier Inc. All rights reserved.*Corresponding author. Tel.: +11-44-(0)2078485486; fax: + 11-44-2078480940. [email protected] (F. Ducci).Disclosure/conflict of interestThe authors declare that, except for income received from their primary employer, no financial support or compensation has been receivedfrom any individual or corporate entity over the past three years for research or professional service and there are no personal financialholdings that could be perceived as constituting a potential conflict of interest.
NIH Public AccessAuthor ManuscriptAlcohol. Author manuscript; available in PMC 2009 September 30.
Published in final edited form as:Alcohol. 2009 February ; 43(1): 73–84. doi:10.1016/j.alcohol.2008.09.005.
NIH
-PA Author Manuscript
NIH
-PA Author Manuscript
NIH
-PA Author Manuscript
IntroductionThe inability to defer the immediate pursuit of pleasurable stimuli is a core feature of severalpsychiatric disorders, including alcoholism and antisocial personality disorder (ASPD).Alcohol use disorders (AUD: alcohol dependence and abuse) and ASPD are common andetiologically complex diseases. According to the National Epidemiological Survey on Alcoholand Related Conditions (NESARC), lifetime prevalences of AUD and ASPD in the UnitedStates are 30% and 3.6%, respectively (Compton et al., 2005). These disorders often co-existwithin individuals (Compton et al., 2005) and have been shown to share genetic (Kendler etal., 2003) and environmental etiologic factors (Robin et al., 1997). AUD with comorbidantisocial behavior appears to represent a subtype of alcoholism characterized by early onsetof substance abuse, family history of alcoholism, increased novelty seeking (Cloninger et al.,1981), increased harm avoidance (Ducci et al., 2007a), polydrug use, and poorer prognosis(Babor et al., 1992). Strong evidence supports a role of serotonergic dysfunction in the etiologyof this type of alcoholism. Cerebrospinal fluid levels of the serotonin (5-HT) metabolite 5-hydroxyindoleacetic acid are reduced in alcoholics with comorbid ASPD compared to healthycontrols (Fils-Aime et al., 1996; Virkkunen et al., 1996). Reduced 5-HT was also found to beassociated with impulsivity-aggression and excessive alcohol intake in nonhuman primates(Higley et al., 1996). Genetic variation within genes belonging to the 5-HT system, such as the5-HT receptor 1B, 5-HT transporter, and monoamine oxidase A has been associated withalcoholism with comorbid ASPD (Ducci et al., 2007b; Hallikainen et al., 1999; Lappalainenet al., 1998). The 5-HT3 receptor (5-HT3R) is of special interest in the context of AUD andASPD because of its role in reward and because 5-HT3R is one of several receptors that areresponsive to alcohol at concentrations frequently found in drinkers (Lovinger and White,1991).
5-HT3R is a ligand-gated ion channel whose activation results in rapid neuronal depolarization.Two subunits of 5-HT3R (5-HT3A and 5-HT3B) have been characterized so far (Davies et al.,1999; Maricq et al., 1991). These subunits are approximately 44% identical in amino acidsequence and are encoded by two genes (HTR3A and HTR3B) that are co-localized within a90-Kb region on chromosome 11q23.1. 5-HT3A and 5-HT3B are expressed in several brainregions, including the amygdala, caudate, and hippocampus (Davies et al., 1999). Functional5-HT3R receptors may be 5HT3A homopentamers or may be 5-HT3A/5-HT3Bheteropentamers. When expressed as a homomer, HTR3A is a functional receptor but displaysrather weak conductance. However, heteromeric assemblies, including both 5-HT3A and 5-HT3B subunits, display a large single-channel conductance and electrophysiological propertiesthat more closely resemble 5-HT3Rs found naturally in brain (Dubin et al., 1999).Electrophysiological and microdialysis studies indicate that 5-HT3R might have a significantrole in regulating reward. 5-HT3R antagonists reduce the number of spontaneously activedopamine (DA) neurons in the ventral tegmental area (VTA) (Minabe et al., 1991; Rasmussenet al., 1991), whereas local application of a 5-HT3R agonist stimulates somatodendritic releaseof DA (Campbell et al., 1996). 5-HT3R antagonists block both alcohol-stimulated (Campbelland McBride, 1995; Campbell et al., 1996) and morphine-stimulated (Imperato and Angelucci,1989) DA release in the VTA. Furthermore, ethanol potentiates the activation of 5-HT3R(Lovinger and White, 1991). Recent findings support the efficacy of the 5-HT3R antagonistondansetron in the treatment of early-onset alcoholism (Johnson et al., 2000, 2002), suggestingthat this receptor might be particularly relevant to the physiopathology of this subtype ofalcoholism.
Intermediate phenotypes are mediating factors for behaviors that are more heritable andgenetically less complex than clinical phenotypes. Their use can enhance the ability to detectgenetic effects on complex behaviors (Ducci and Goldman, 2008; Goldman et al., 2005). Theresting electroencephalogram (EEG) accesses spontaneous brain electrical activity. Alpha
Ducci et al. Page 2
Alcohol. Author manuscript; available in PMC 2009 September 30.
NIH
-PA Author Manuscript
NIH
-PA Author Manuscript
NIH
-PA Author Manuscript
(8-13 Hz) power is the predominant EEG rhythm in the resting conscious state. Alpha poweris a stable trait through healthy adulthood and is highly heritable (0.80) (Van Baal et al.,1996; van Beijsterveldt et al., 1996). Alcoholics appear to have reduced alpha power (Arentsen& Sindrup, 1963; Coger et al., 1978; Ehlers & Phillips, 2007; Enoch et al., 1999; Jones &Holmes, 1976). In a group of Finnish criminal alcoholics recruited from the same sourcepopulation as one of the three samples within this study, an overall reduction in alpha powerwas observed in the waking EEG of participants with ASPD compared with age and gender-matched healthy controls (Lindberg et al., 2005). Similarly, in a mainly Caucasian community-ascertained data set that is included in this report (Bethesda population), alcoholics displayedreduced alpha power (Enoch et al., 1999). Finally, in a recent whole genome linkage scanconducted in a Plains American Indian sample that is also included in this study, a suggestivepeak (LOD score = 2.2) for alpha power was found on chromosome 11, in the region wherethe HTR3A and HTR3B genes are located, although no peak was observed in the same regionfor AUD (Enoch et al., submitted for publication). The association between alpha power andAUD was not detected in this population (M.-A. Enoch, personal communication).
The aim of this study was to evaluate whether genetic variation within HTR3A and HTR3Binfluence vulnerability to AUD with comorbid ASPD in a large case-control Finnish Caucasiandata set that is enriched with early-onset alcoholics with antisocial behavior. To test whetherHTR3A and HTR3B influences an EEG intermediate phenotype for AUD, we evaluated theassociation of these two genes with resting alpha EEG power, measured in two large andindependent datasets including a predominantly Caucasian sample and a sample of PlainsAmerican Indians. We hypothesize that genetic variation within HTR3A/B genes mightspecifically moderate the risk of developing AUD with comorbid ASPD and might influencebrain electrical activities measured by resting alpha EEG power.
Materials and methodsThere were three independent samples in this study, all of whom had lifetime DSM-III-Rpsychiatric diagnoses: a Caucasian sample from Finland, a predominantly Caucasian samplerecruited in Bethesda, Maryland, United States, and a population of Plains American Indians.Resting EEG recordings were available for the Bethesda sample and for the Plains Indians.
Informed consent was obtained according to human research protocols approved by the humanresearch committees of the National Institute on Alcohol Abuse and Alcoholism (NIAAA) forthe Plains American Indians and Bethesda samples and the University of Helsinki for theFinnish sample. For the American Indian sample, the Tribal Council also gave approval.
Finns (N = 518; males = 100%)—This sample consists of criminal alcoholics and controlscollected from the same Caucasian source population in Finland (for a more detaileddescription, see Lappalainen et al., 1998). The alcoholics were 284 unrelated male criminalswho underwent forensic psychiatric examinations at the time of their initial incarceration; 159were affected by both AUD and ASPD. The controls were 234 unrelated male volunteers whowere recruited by advertisements in local newspapers and were compensated for theirparticipation. The mean (standard error [S.E.]) age was 37.53 years (0.56). Mean age of onset(S.E.) of AUD was 19.4 years (0.5) among alcoholics with ASPD and 22.7 (0.5) amongalcoholics without ASPD.
Bethesda (N = 191; males = 45%)—Volunteers were recruited from the general population ofthe Washington, DC/Baltimore, Maryland area by newspaper advertisements (Enoch et al.,1999). The only inclusion criterion for probands was that they had to have two living parentsand at least two siblings who would, if required, be able to participate in the study. Ethnic
Ducci et al. Page 3
Alcohol. Author manuscript; available in PMC 2009 September 30.
NIH
-PA Author Manuscript
NIH
-PA Author Manuscript
NIH
-PA Author Manuscript

origin was self-identified. There were 175 Caucasians and 16 African-Americans. The mean(S.E.) age was 42.6 years (1.0) (for a more detailed description see Enoch et al., 1999).
Plains American Indians (N = 306; males = 42%)—Volunteers were recruited from a PlainsAmerican Indian community. Probands were initially ascertained at random from the tribalregister, and the families of alcoholic probands were extended. Although most participantsderived from one large, multigenerational pedigree, the average sharing of descent was only0.3%. The average Plains Indian ancestry in our sample was 87% (S.D.: 21%); however, themedian and modal values were >99%. The mean (S.E.) age was 42.09 years (0.61) (for a moredetailed description see Enoch et al., 2006a).
Exclusion criteria for both the Bethesda and Plains Indian samples were as follows: a historyof brain trauma, neurological disease, or recent use (in the past two weeks) of psychotropicdrugs that might affect the EEG. Exclusion criteria at the time of testing were a positive breathtest for alcohol, signs of alcohol withdrawal, or a positive urine test for psychoactive drugs.
Psychiatric assessmentAll analyses used lifetime psychiatric diagnoses that were based on DSM-III-R criteria andassessed using semi-structured psychiatric interviews. The Schedule for Affective Disordersand Schizophrenia-Lifetime Version (SADS-L) (Endicott & Spitzer, 1978) was used in theBethesda and Plains Indian samples. A clinical social worker (B.A.) experienced in the PlainsIndian tribal customs and culture conducted the SADS-L interviews. The Structured ClinicalInterview for DSM-IIIR (SCID) (Spitzer et al., 1990a, 1990b, 1990c) was used in the Finnishsample.
Within the Finnish population, 284 participants had a lifetime diagnosis of an AUD and 86%of these had alcohol dependence. One hundred fifty-nine participants had both ASPD andAUD. All subjects with ASPD were also affected by AUD. Controls (N = 234) were non-ASPDand nonalcoholic.
In the Bethesda sample, 41 participants had a diagnosis of AUD (68% with alcoholdependence). Only two individuals had AUD comorbid with ASPD. One hundred eighty-twoof the 306 Plains Indians had AUD (92% with alcohol dependence); 32 of the alcoholics hadcomorbid ASPD.
EEG acquisition and analysisResting EEG was recorded in the Bethesda and Plains Indians samples. The methods for EEGacquisition and analysis have already been fully described (Enoch et al., 1999, Enoch et al,submitted for publication). In the Bethesda sample, data were recorded from gold-platedelectrodes applied to 19 scalp sites identified in the International 10-20 System and at twomastoid sites, all with reference to balanced sternovertebral electrodes. In the Plains Indians,EEG signals were recorded from a customized fitted electrode cap (Electro-Cap InternationalInc., Eaton, OH) with pure tin electrodes in a six-channel montage: FZ, P3, PZ, P4, O1, andO2 with reference to balanced sternovertebral electrodes. Electrode impedance was alwaysbelow 5 kΩ. Resting EEG was recorded continuously for 3 min with eyes closed. EEG signalswere continuously digitized at a sampling rate of 200 Hz and quantitative spectral analysis wasperformed (Coppola, 1979). Data records were partitioned into consecutive 512-point subunits(2.56 s each). Fast-Fourier transformation of filtered partitions yielded power spectrumestimates in 0.39 Hz steps. Artifact-free data were averaged to yield a composite powerspectrum spanning three frequency domains; theta (3-8 Hz), alpha (8-13 Hz), and beta (13-30Hz). All analyses in this report have been conducted using alpha power recorded posteriorlybecause alpha power is known to be maximal posteriorly under conditions of relaxed
Ducci et al. Page 4
Alcohol. Author manuscript; available in PMC 2009 September 30.
NIH
-PA Author Manuscript
NIH
-PA Author Manuscript
NIH
-PA Author Manuscript
wakefulness and is also more heritable posteriorly than anteriorly (Zietsch et al., 2007).Moreover, alpha power measures recorded at different scalp regions were highly correlated(pairwise correlations range: 0.89-0.97 in the Bethesda population and 0.60-0.91 amongAmerican Indians).
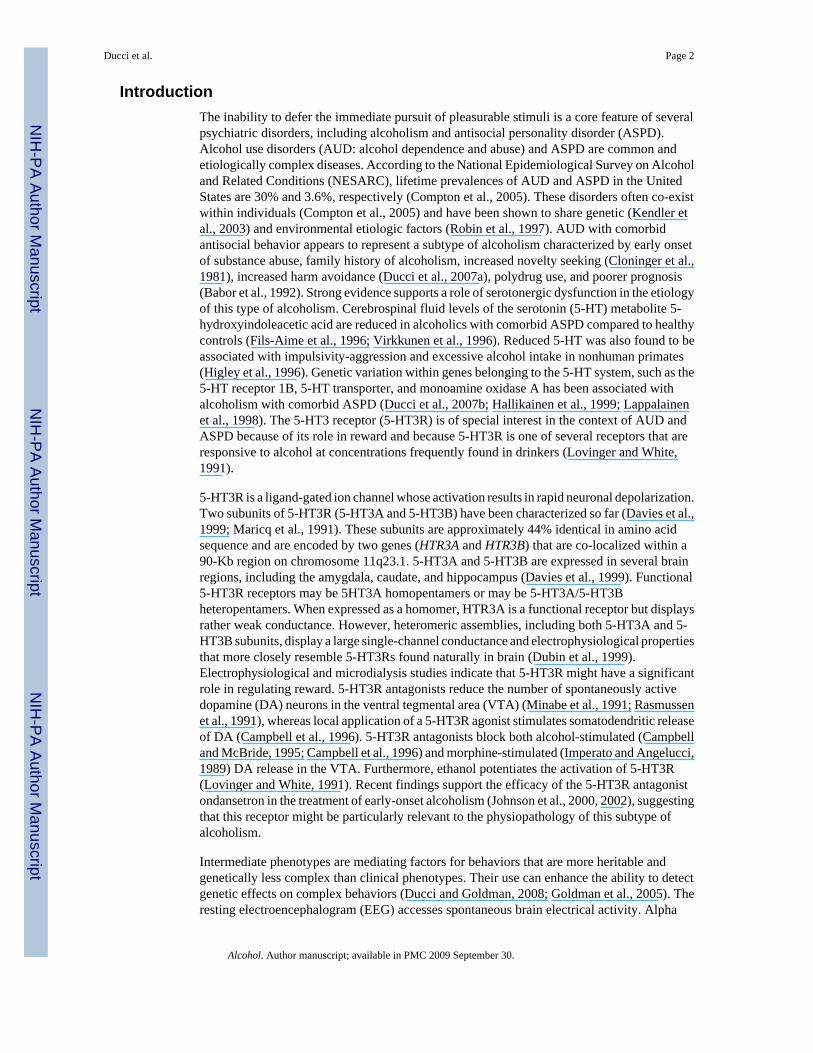
GenotypingSixteen SNPs spanning a 90-Kb region within which both HTR3A and HTR3B genes arelocated, were selected from the HapMap Project Public Release and genotyped using theIllumina GoldenGate Assay (see web sources listed in the Appendix). The two genes areseparated by approximately 30 Kb. We selected SNPs to tag haplotypes in the most diverseHapMap population (African) and to tag all haplotypes with a frequency of at least 0.5% usinga double classification tree search algorithm (Zhang et al., 2004). Several polymorphisms foundwithin the coding sequences were forced into the tagging: rs1176744 (HTR3B Ser129Tyr);rs17116138 (HTR3B Ile183Val); rs1176713 (HTR3A Leu459Leu). Within HTR3A threemarkers (rs897692, rs1176724, rs897687) were monomorphic among Caucasians anddisplayed MAF < 0.005 among Plains American Indians. Therefore, these markers wereexcluded from all the analyses. Locations of the remaining 13 SNPs are shown in Fig. 1.
Statistical analysesIn the Finnish sample, allele/genotype/haplotype frequencies were compared betweenindividuals with AUD + ASPD versus controls (non-AUD, non-ASPD) using the χ2 test. Thesame test was also performed to compare allele/genotype frequencies between alcoholicswithout ASPD (AUD, no ASPD) and controls across al three datasets.
Genetic association with alpha EEG power was evaluated in the Bethesda and Plains Indiancommunity samples. Absolute resting EEG power was log-transformed to reach normality andcompared across genotype/diplotype groups using analysis of variance.
Hardy-Weinberg Equilibrium (HWE) for each locus and linkage disequilibrium (LD) betweeneach pair of markers were computed using Haploview v3.32 (Barrett et al., 2005). Diplotypeswere assigned to each individual using PHASE 2.02 (Stephens et al., 2001). Becausefrequencies of rare haplotypes computed with Phase are imprecise, carriers of haplotypes withfrequency lower than 1% were excluded from the analyses.
All statistical analyses were conducted using JMP software v5.1 (SAS Institute, Cary, NorthCarolina). Criterion for statistical significance was set at 0.05.
Assessment of population stratification using ancestry informative markers (AIMS)The Finnish and Plains Indian populations are considered to be population isolates, whereasthe Bethesda population is more diverse. To characterize each individual for ethnic origin, 186ancestry informative (AIMS) markers were selected as previously described (Enoch et al.,2006b). In brief, each AIM was a genetically independent HapMap SNP that differed in allelefrequency by at least 0.7- and 10-fold between any two continental populations (from amongCaucasians, Africans, and Asians). The AIMS were selected to be equally informative for allthree continental populations. Genotyping was performed using the same Illumina GoldenGateAssay array described previously. The AIMs were genotyped in the Finnish, Bethesda, andPlains Indians samples but also in the 52 worldwide populations represented in the HGDP-CEPH Human Genome Diversity Cell Line Panel. This includes 1,051 individuals (see websources listed in the Appendix).
Structure 2.2 (see web sources listed in the Appendix) was used to identify populationsubstructure and compute individual ethnic factor scores. Structure was run simultaneously
Ducci et al. Page 5
Alcohol. Author manuscript; available in PMC 2009 September 30.
NIH
-PA Author Manuscript
NIH
-PA Author Manuscript
NIH
-PA Author Manuscript
using the AIMS genotypes from all three populations as well as the 52 populations representedin the HGDP-CEPH Panel. This “anchored” approach was preferred to the unanchored “withinpopulation” approach, because it yields a stable and interpretable ethnic factor structure.Number of ethnic clusters (k) was defined by running the data with different K values andcomputing the probability of K = n. The seven-factor solution was optimal. To evaluate thepotential impact of ethnic substructure on our association results, ethnic factor scores werecompared between cases and controls in the Finnish population using the χ2 test. In the Finnishpopulation, cases and controls did not differ in ethnic composition (df = 6; χ2 = 0.368; P = .99). In the Plains Indian and Bethesda populations, alpha power was correlated with ethnicfactor scores modeled as a continuous variable using the Spearman ρ correlation. There wereno significant correlations with any of the seven ethnic factors (range of P values in Bethesda= 0.21-0.99; range of P values among Plains Indians = 0.3-0.94). These results indicate thatethnic substructure is unlikely to have an impact on our association analyses and thereforefurther corrections were not undertaken, nor were the 16 African-Americans in the Bethesdasample excluded from the study.
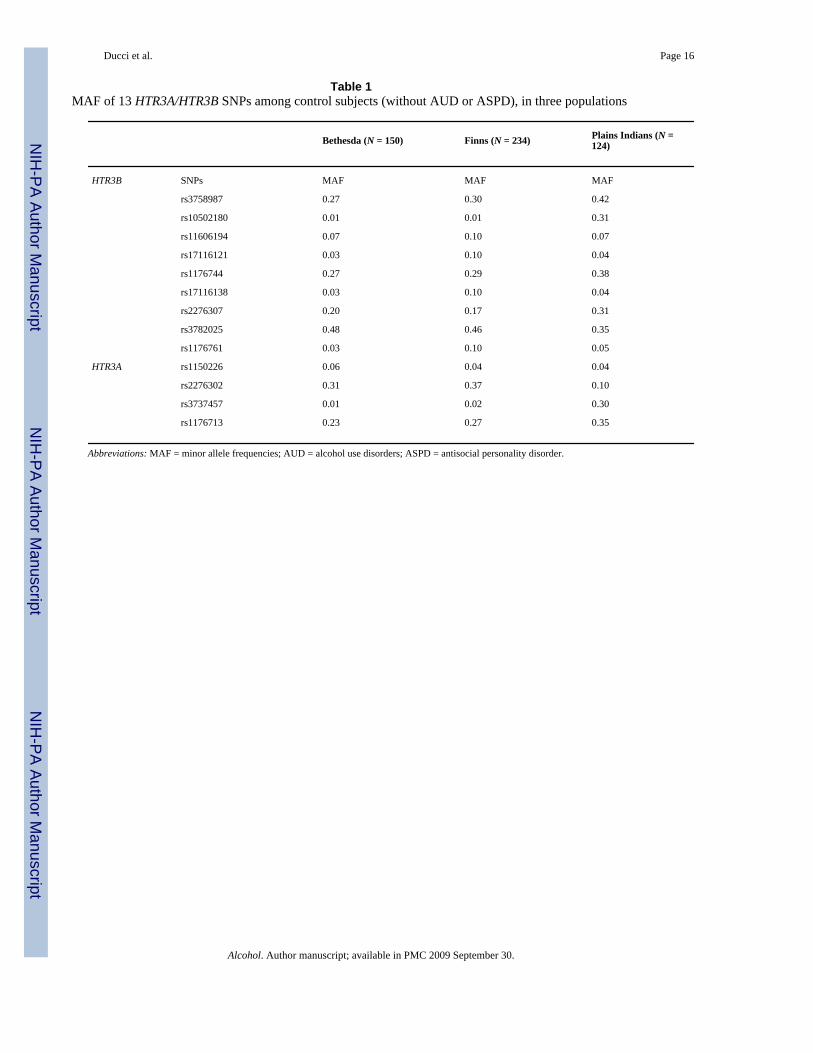
ResultsBehavioral associations of 13 HTR3A/HTR3B SNPs were studied in three populations, totaling1,015 individuals. Allele frequencies differed across populations, especially betweenCaucasians and Plains Indians as shown in Table 1, where frequencies are given for controls(no ASPD, no AUD). Genotypes at all markers were in Hardy-Weinberg equilibrium.
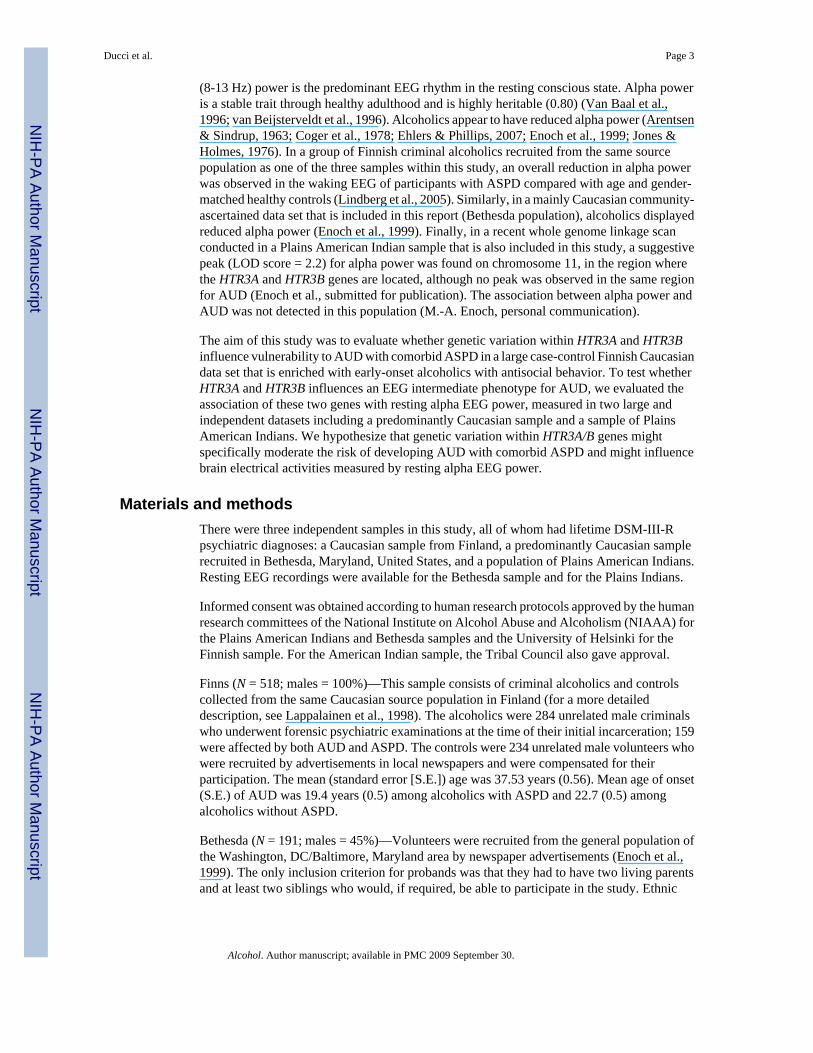
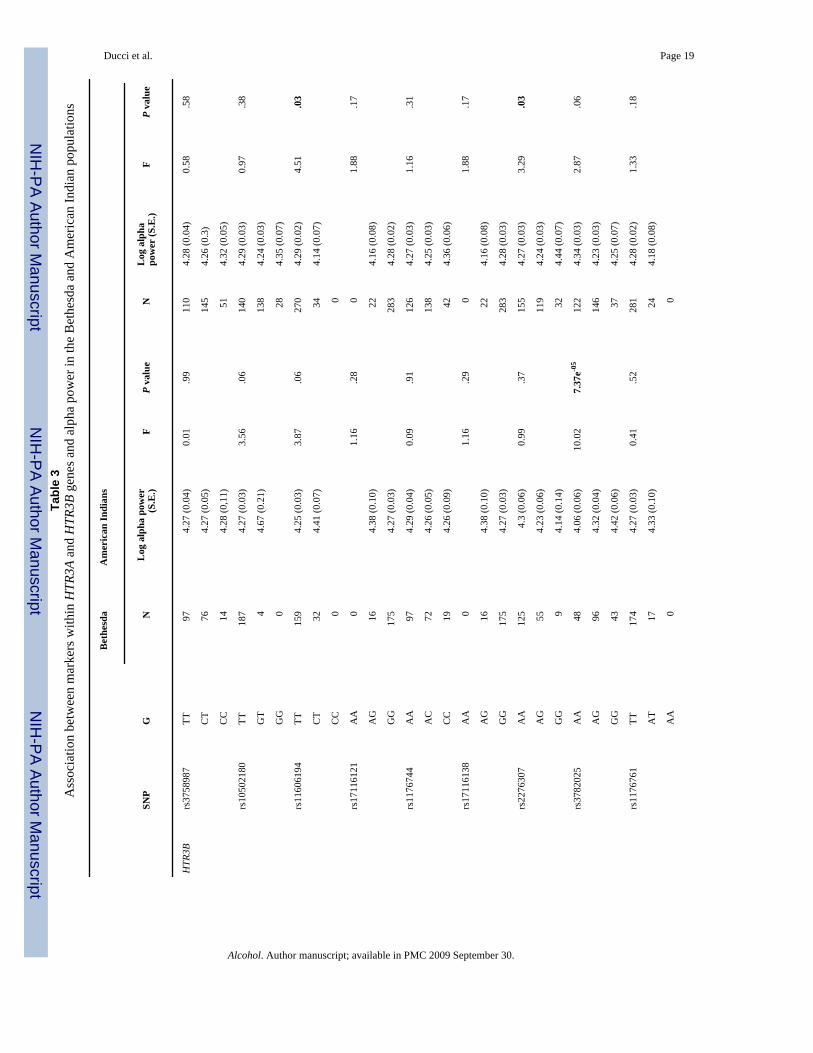
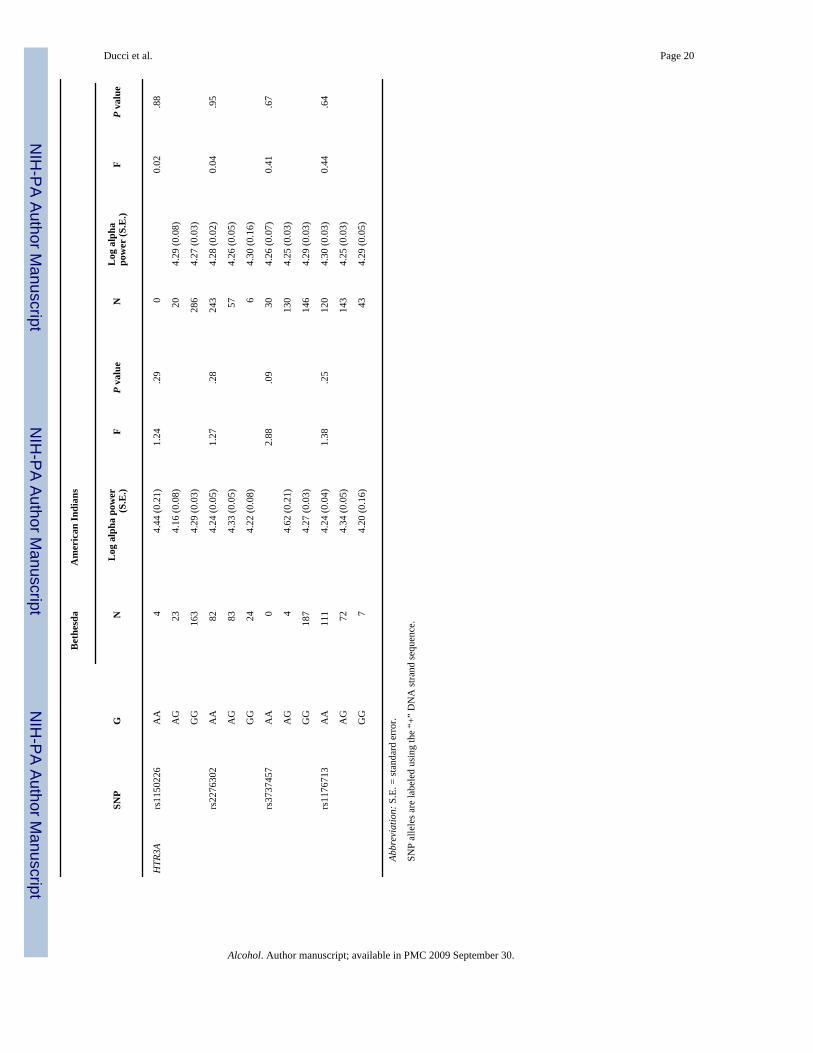
Single marker association analyses between HTR3A/B SNPs and AUD + ASPD (in the Finnishpopulation) and with alpha EEG power (in the Bethesda and Plains Indian populations) areshown in Tables 2 and 3. For easy interpretation, results are also summarized in Fig. 2.
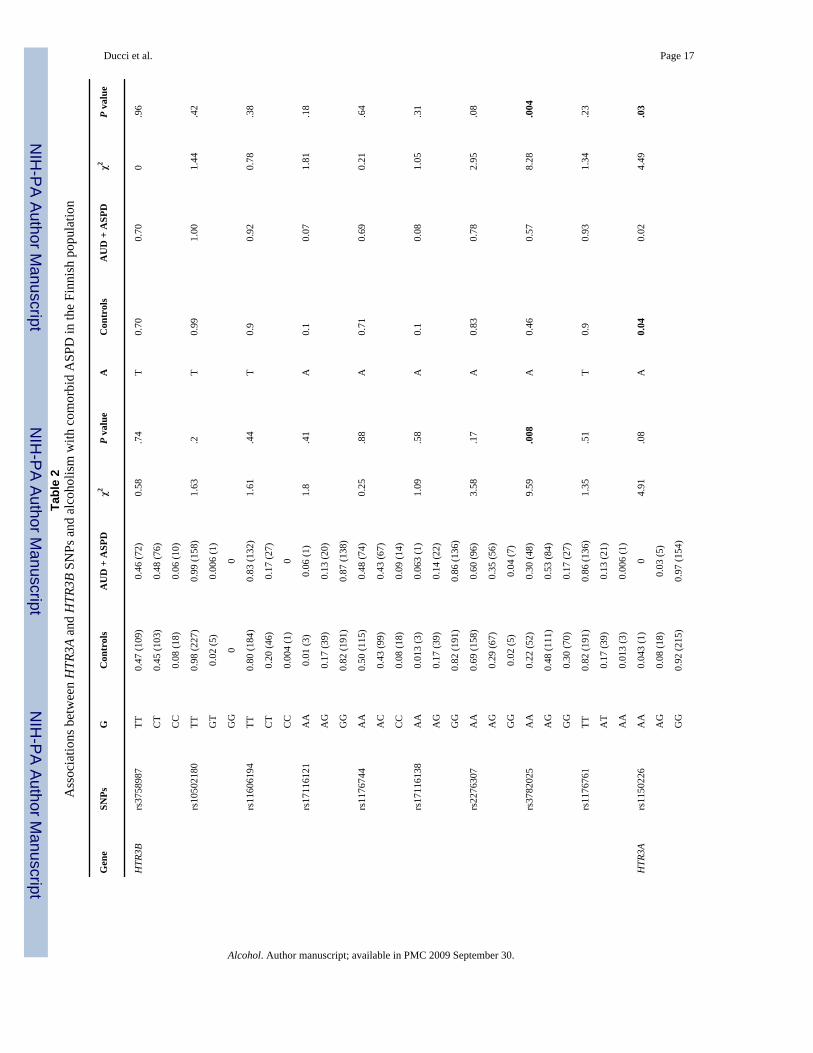
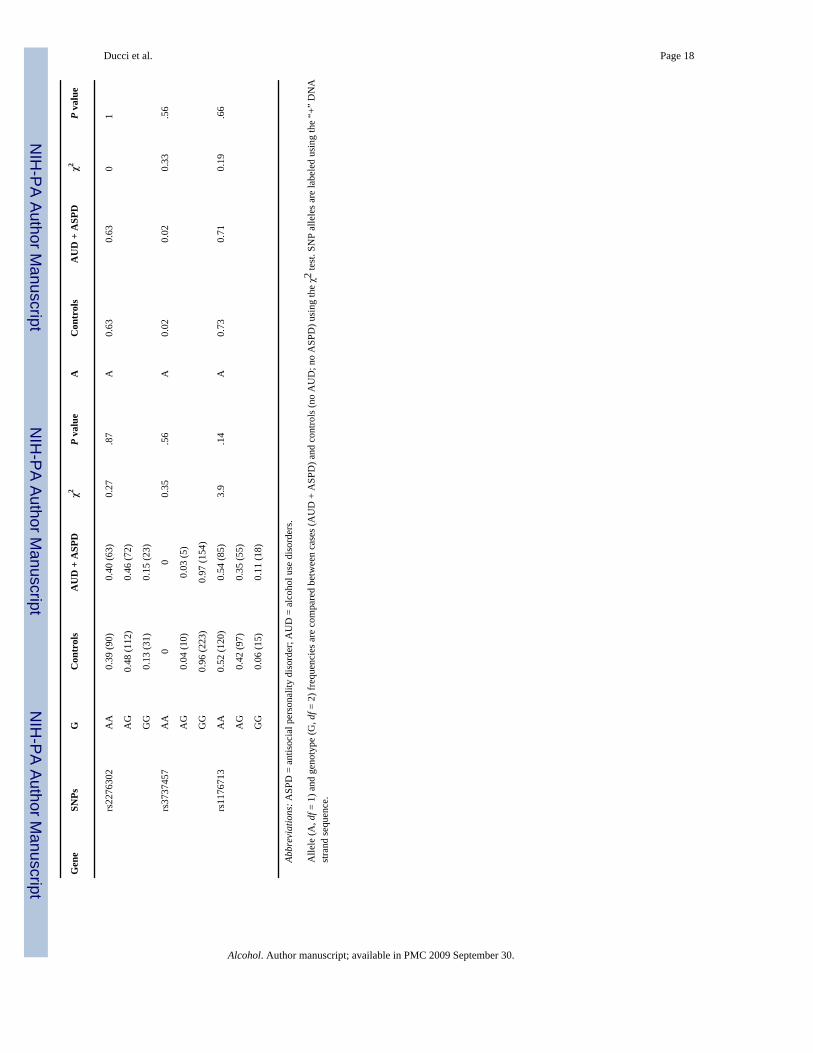
Association of HTR3A and HTR3B with AUD comorbid with ASPD (single marker analyses)Genotype and allele frequencies were compared between controls (no AUD, no ASPD) andalcoholics with comorbid ASPD (AUD + ASPD) in the Finnish population (see Table 2 andFig. 2). The intronic HTR3B SNP rs3782025 was significantly associated with AUD + ASPDboth at the genotype (df = 2; χ2 = 9.59, P = .008) and allele level (df = 1; χ2 = 8.28, P = .004).Within HTR3A, rs1150226 was significantly associated with AUD + ASPD at the allele level(df = 1; χ2 = 4.49, P = .03), although the frequency was low (only five heterozygotes).
Consistent with our a priori hypothesis that 5-HT3 is specifically involved in the pathogenesisof AUD with comorbid ASPD, there were no significant differences in genotype frequenciesbetween controls and alcoholics without ASPD (AUD, no ASPD) across all the datasets: lowestP value: Finns: P = .13; Bethesda: P = .10, Plains: P = .18.
Association between HTR3A and HTR3B and alpha EEG power (single marker analyses)Mean log10 alpha power was compared across the three genotype groups for each SNP in theBethesda and Plains Indian populations (see Table 3 and Fig. 2).
At HTR3B SNP rs3782025, the same allele that associated with AUD + ASPD (allele A) inthe Finnish population was also associated with reduced alpha power in the Bethesdapopulation (F = 10.02; P = 7.32e-5) (see Fig. 2).
Among Plains Indians, SNPs rs2276307 (df = 2; F = 3.29, P = .03), adjacent to rs3782025, andrs11606194 (df = 1, F = 4.51, P = .03) were significantly associated with alpha power. SNPrs3782025 was not significantly associated with alpha power among Plains Indians (Table 3).
Ducci et al. Page 6
Alcohol. Author manuscript; available in PMC 2009 September 30.
NIH
-PA Author Manuscript
NIH
-PA Author Manuscript
NIH
-PA Author Manuscript
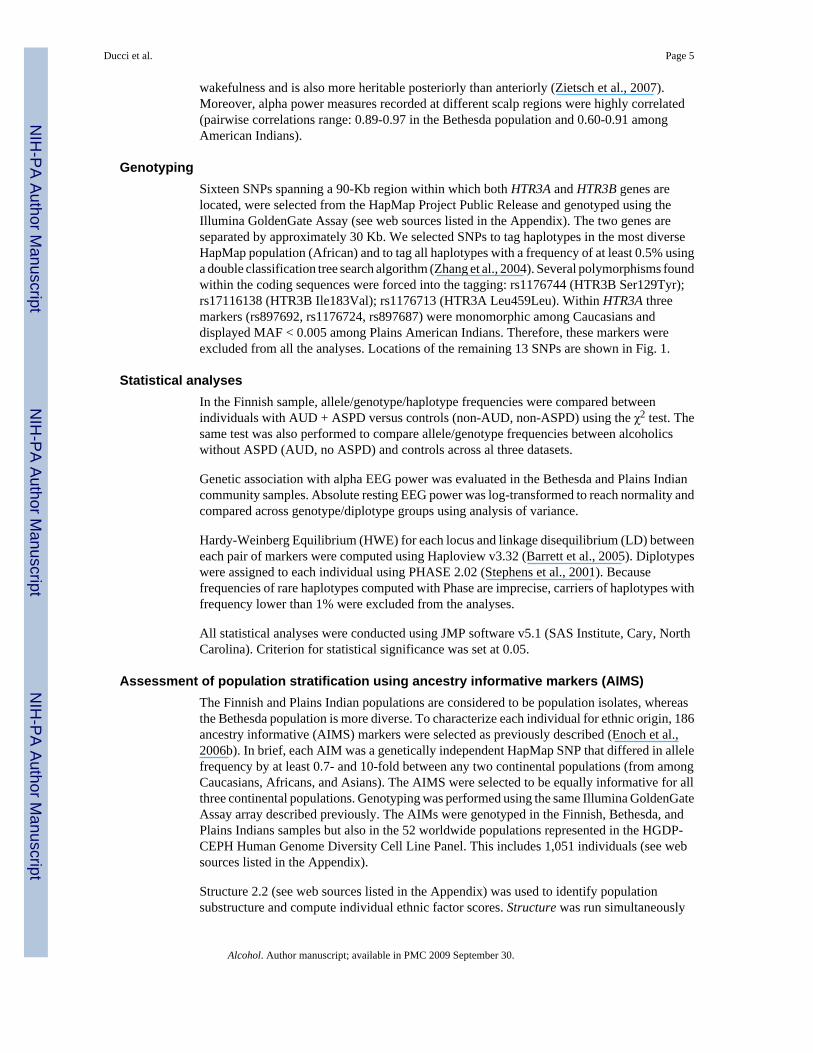
Haplotype-based analysesHTR3A and HTR3B linkage disequilibrium structure is shown in Fig. 3, where pairwise LDvalues are given. Across populations, within HTR3B we identified two regions of relativelyreduced recombination: a 5′-block including five SNPs and a second block located at the 3′ ofthe gene and including four SNPs. In contrast, low D′ values were detected between pairs ofmarkers within HTR3A and between the two genes.
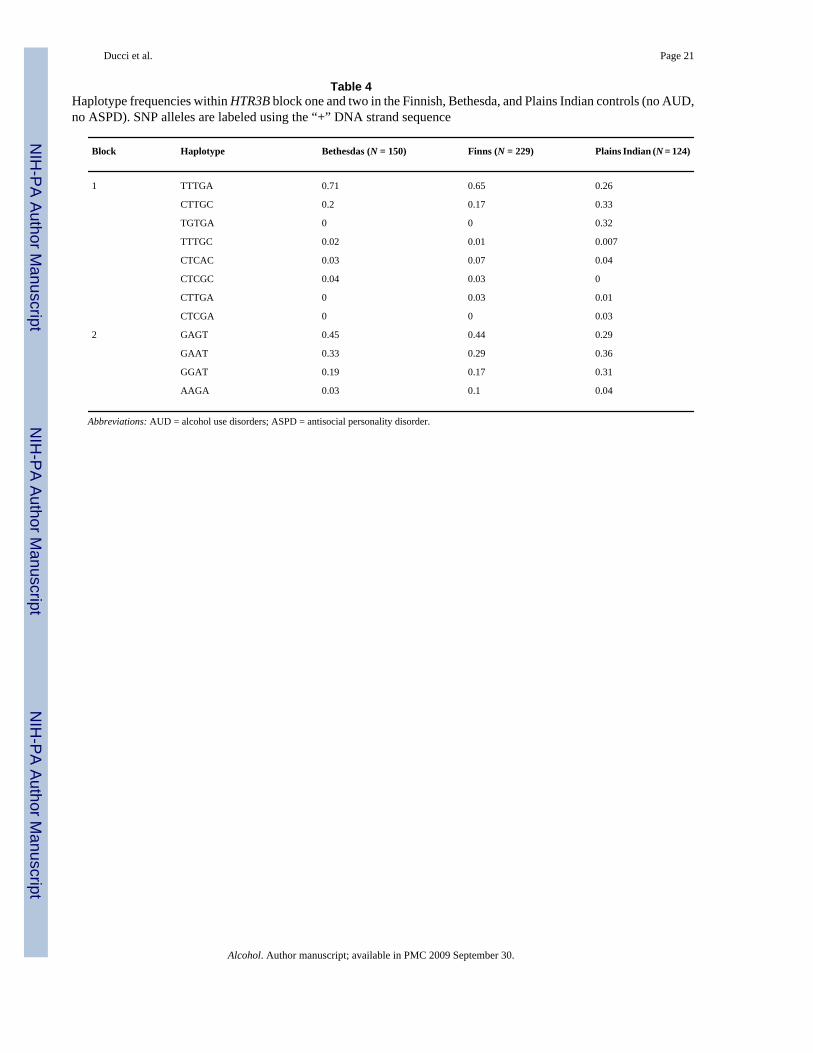
Haplotype frequencies were computed within HTR3B. Haplotype frequencies differed betweenCaucasians and the Plains Indians (Table 4). In the first haplotype-block, two major haplotypes(TTTGA, CTTGC), accounted for between 91% and 82% of haplotype diversity in the Finnishand Bethesda populations, respectively. Among American Indians, haplotypes TTTGA,CTTGC, and TGTGA accounted for 90% of haplotype diversity. In the second haplotype block,three major haplotypes (GAGT, GAAT, GGAT), accounted for more than 90% of haplotypediversity across all three populations.
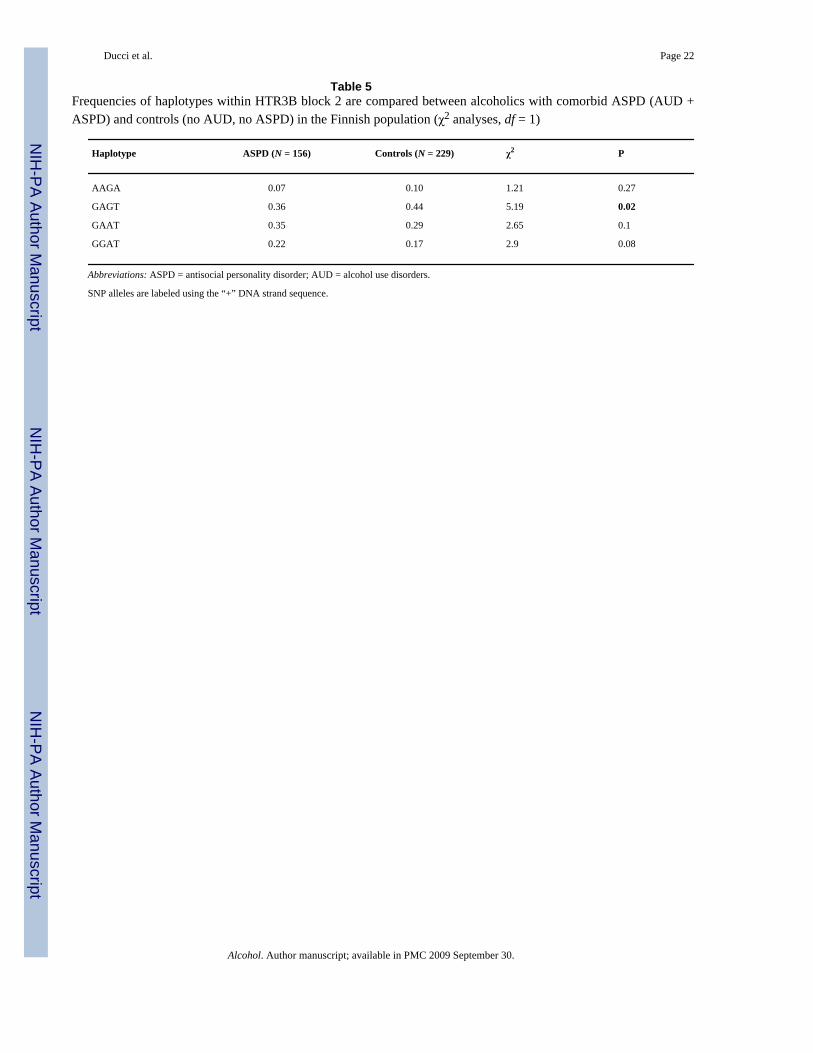
Association between HTR3B and AUD with comorbid ASPD (haplotype-based analyses)Haplotype frequencies were compared between alcoholics with comorbid ASPD (AUD +ASPD) and controls (no AUD; no ASPD) in the Finnish population. Within the secondHTR3B block, haplotype frequencies were overall significantly different between cases andcontrols (df = 4; χ2 = 10.72; P = .02). Haplotypes GAAT (df = 1; χ2 = 2.56; P = 0.10) andGGAT (df = 1; χ2 = 2.98; P = .08) were more abundant in ASPD + AUD (df = 1, χ2 = 2.95 P= .08) and haplotypes AAGA (df = 1; χ2 = 1.21, P = .27), and GAGT (df = 1; χ2 = 5.19; P = .02) were more abundant among controls. However, the signal of association appeared to bedriven by SNP rs3782025 (Table 5).
No differences in haplotype frequencies were detected when controls were compared to non-ASPD alcoholics (Finns: df = 4; χ2 = 3.09; P = .37; Bethesda: df = 4, χ2 = 5.39; P = .24; Plains:df = 4; χ2 = 2.043; P = .72).
No differences in haplotype frequencies were detected between cases and controls within thefirst HTR3B block.
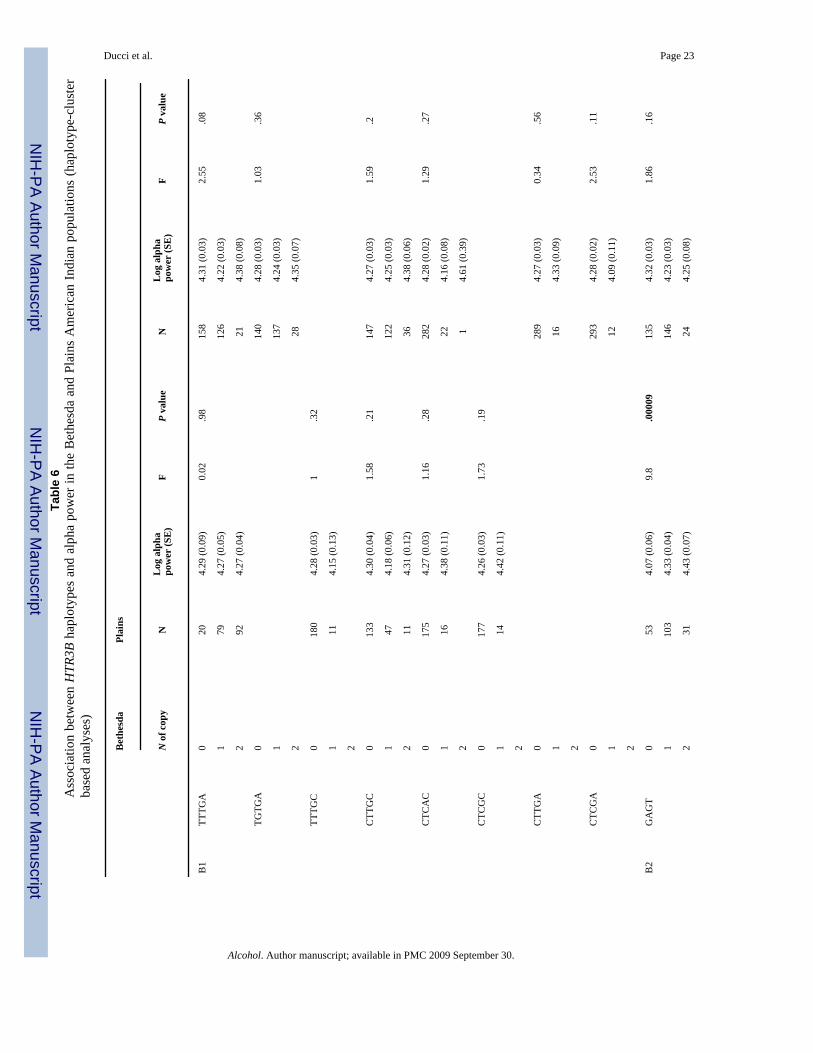
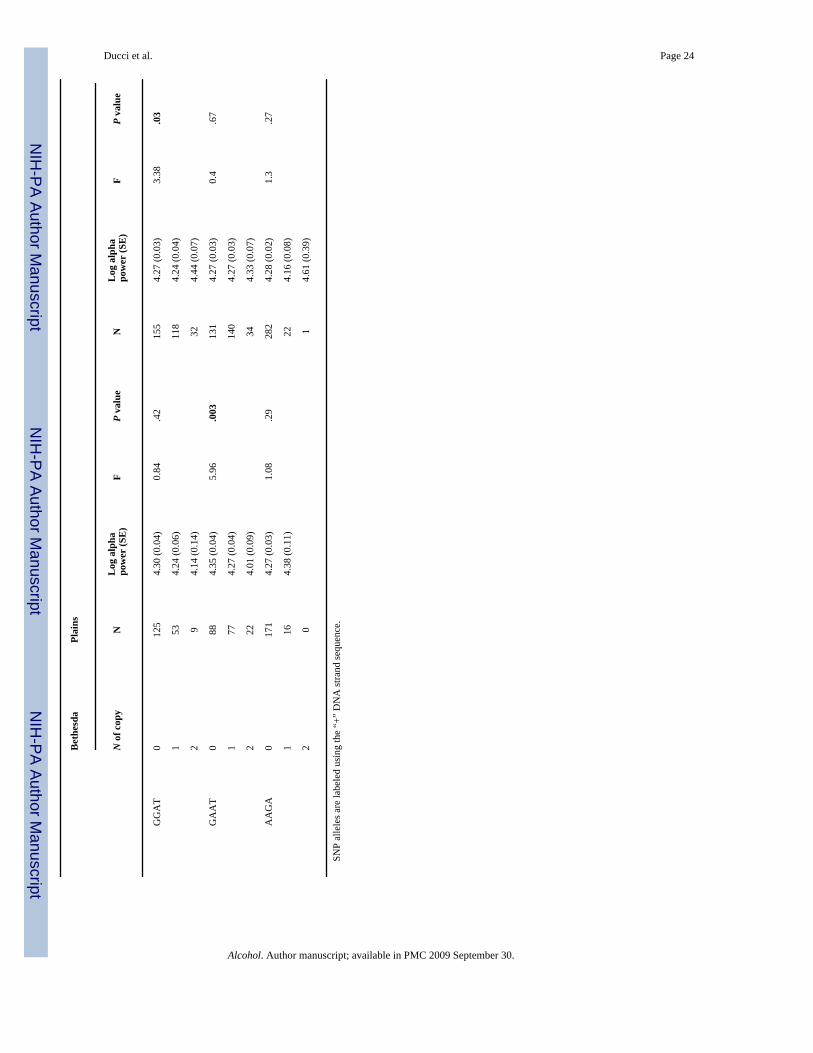
Association between HTR3B and alpha power in the Bethesda and Plains Indian populations(haplotype-based analyses)
Mean Log10 alpha power was compared across groups of individuals carrying two, one, or zerocopies of each haplotype for each block (see Table 6). Significant differences were detectedwithin the second HTR3B block. In the Bethesda population, carriers of two copies of GAAThad significantly reduced alpha power compared with subjects with zero copies and carriersof one copy had intermediate values (df = 2, F = 5.96; P = .003, Table 6). Conversely, carriersof two copies of GAGT had elevated alpha power compared to subjects with zero copies andone copy was associated with intermediate values (df = 2; F = 9.8; P = .00009). HaplotypeGGAT was associated with increased alpha power among American Indians (df = 2; F = 3.38;P = 0.03).
No differences in alpha power were detected for haplotypes located in the first HTR3B block.
DiscussionOur study has shown that genetic variation within HTR3B is associated with AUD comorbidwith ASPD in the Finnish population. Consistently with our a priori hypothesis, no significantdifferences emerged when controls were compared with non-ASPD alcoholics, indicating that5-HTR3 receptor might be specifically involved in the etiology of early onset alcoholics with
Ducci et al. Page 7
Alcohol. Author manuscript; available in PMC 2009 September 30.
NIH
-PA Author Manuscript
NIH
-PA Author Manuscript
NIH
-PA Author Manuscript
antisocial behavior. HTR3B markers were also significantly associated with alpha power inboth the Bethesda and Plains Indians populations. Among both of the two mainly Caucasianpopulations (United States and Finnish), most of the signal appeared to come from an intronicHTR3B SNP, namely rs3782025. This SNP significantly predicted AUD with comorbid ASPDin the Finnish population. In the Bethesda population, the same allele was also stronglyassociated with low alpha power and accounted for 8% of the variance of this resting EEGtrait. Significant associations between alpha power and HTR3B markers were found amongPlains Indians but with different SNPs as compared to Caucasians. No significant findingswere reported for HTR3A.
Our findings suggest that genetic variation within HTR3B may influence vulnerability todevelop AUD with comorbid ASPD. Consistent with this idea, the 5-HTR3R antagonistondansetron appears to be effective in the treatment of early onset alcoholics who frequentlyhave ASPD. In a 12-week double-blind, placebo-controlled clinical trial conducted in 321alcohol-dependent subjects, ondansetron was effective in reducing alcohol consumption andcraving in early onset alcoholics (<25 years) but not in late onset (Johnson et al., 2000). Also,ondansetron has been shown to reduce alcohol-heightened aggressive behavior in mice(McKenzie-Quirk et al., 2005). Genetic variation within HTR3B has been shown to influencevulnerability to bipolar disorder (Frank et al., 2004) and major depression (Yamada et al.,2006), but to our knowledge this is the first time that an association between AUD with co-morbid ASPD and the HTR3B gene has been reported. Most of the in vitro electrophysiologicalstudies conducted so far on 5-HT3R have focused on the A subunit. However, more recently,two studies have explored the roles of both subunits and have found that ethanol enhances theactivation of HTR3A homomeric receptors, but has no effect on HT3A/B hetoromeric receptors(Hayrapetyan et al., 2005; Stevens et al., 2005). Thus, genetic variation within HTR3B mightinfluence level of expression of this subunit and in turn the proportion of HTR3A homomericVs HTR3A/B heteromeric receptors. Alteration in the subunit composition of 5-HTR3R in thebrain could in turn affect risk of developing alcoholism moderating ethanol response via thisreceptor that is known to regulate reward to alcohol and other drugs (Minabe et al., 1991;Rasmussen et al., 1991). Interestingly, a deletion within HTR3B has been shown to moderateresponse to ondansetron in the treatment of nausea (Tremblay et al., 2003). Similarly, one couldspeculate that genetic variation within HTR3B might moderate response to ondansetron in thetreatment of alcoholism.
Alterations in brain electrical activity have been described in both alcoholics and ASPDpatients (Arentsen and Sindrup, 1963; Coger et al., 1978; Ehlers and Phillips, 2007; Enoch etal., 1999; Jones and Holmes, 1976, Lindberg et al., 2005). In this report, HTR3B was found tobe associated with low alpha power in the resting EEG, an intermediate phenotype for AUDand ASPD (Lindberg et al., 2005). Our finding indicates that genetic variation withinHTR3B might be a modulator of neuronal electrical activity and might contribute to theimbalance between excitation and inhibition that characterizes the brain of alcoholics.Consistently, in a whole genome linkage study recently conducted in the Plains Indians sample,an LOD score (2.2) suggestive of linkage to alpha power was found in the same chromosomeregion where HTR3A and HTR3B genes are located (Enoch et al., submitted for publication).5-HT3R is an ion-channel receptor whose activation results in rapid neuronal depolarization.One of the possible mechanisms through which 5-HT3R might influence resting EEG isthrough the modulation of GABAergic neurons. 5-HT3R is expressed in the subpopulation ofGABAergic interneurons that are located within the neocortex, hippocampus, and amygdala(Bloom and Morales, 1998). Activation of GABAergic interneurons via 5-HT3R has beenshown to result in a GABA-mediated inhibition of pyramidal cell of the rat hippocampus(Ropert and Guy, 1991) and similar mechanisms are likely to exist in other brain regions.
Ducci et al. Page 8
Alcohol. Author manuscript; available in PMC 2009 September 30.
NIH
-PA Author Manuscript
NIH
-PA Author Manuscript
NIH
-PA Author Manuscript
Associations that we found with both ASPD and alpha power were strongest with markerrs3782025, and stronger than associations with any haplotype. However, a significantassociation was reported also at the haplotype level. Haplotype GAGT, located in the secondHTR3B block, was less frequent among alcoholics with ASPD in the Finnish population andwas associated with increased alpha power in the Bethesda population. Our results suggest thatthe HTR3B association signal originates from the 3′ end of the HTR3B gene, which is alsoupstream of the HTR3A gene. Interestingly, SNP rs3782025 is located in a region which appearsto be highly conserved across species.
A significant association between HTR3B and alpha power was also found among PlainsIndians. However, the signal in this case came from different SNPs, namely rs2276307 that isin LD with rs3782025 and rs11606194 that is in haplotype block 1. Also, among Plains Indianshaplotype GGAT was significantly associated with reduced alpha power. This result overallsupports the idea that genetic variation within HTR3B might be important in moderating alphapower. However, the pattern of association among Plains Indians appears to be different fromthat observed in the Bethesda and Finnish populations. A possible explanation for thesediscrepancies might be related to differences in the ascertainment of the Bethesda/Finnishsamples as compared to the Plains Indian population. In the latter population, family membersof alcoholics’ probands were also recruited. As a consequence, many nonalcoholics had afamily history of alcoholism, and alcoholism was not associated with alpha power in thispopulation (Enoch et al., submitted for publication). In contrast, association between alphapower and alcoholism were found both in the Finnish (Lindberg et al., 2005) and Bethesda(Enoch et al., 1999) populations. Another possible explanation might be related to geneticheterogeneity; therefore, functional polymorphisms might be different across differentpopulations.
This study has strengths as well as important limitations. Strengths include the use of threerelatively large and independent samples, use of clinical phenotypes as well as intermediatephenotypes to increase power to detect gene effects (Goldman and Ducci 2007), and use ofancestry informative markers to rule out ethnic stratification, Limitations include the lack ofone large population with measures of both alpha EEG power and a sufficient number ofantisocial alcoholics to perform case-control analysis. P values presented in the present studywere not corrected for multiple testing. Nevertheless, the same SNP and haplotypes wereassociated with two related phenotypes (ASPD and alpha power) in the same direction in twoindependent samples of Caucasians. Furthermore, even after applying Bonferroni correctionfor the number of SNPs tested (n = 13), associations between rs3782025 with AUD + ASPDin the Finns and alpha power in the Bethesda population remain significant. Of note, applyingBonferroni correction for the number of SNPs is a very conservative approach because theSNPs tested were not independent (see Fig. 3).
In conclusion, our findings indicate that genetic variation within HTR3B may influencevulnerability to alcoholism with comorbid ASPD and may contribute to the low alpha powertrait detected among alcoholics as a group. Further research is needed to confirm these findingsand, if confirmed, to identify a functional locus or loci in the HTR3B/HTR3A region and toexplore the molecular biological mechanisms whereby 5-HT3R influences alpha power andvulnerability to disease.
AcknowledgmentsThis research was supported by the Intramural Program of the National Institute on Alcohol Abuse and Alcoholism,NIH, and in part by the Office of Research on Minority Health.
Ducci et al. Page 9
Alcohol. Author manuscript; available in PMC 2009 September 30.
NIH
-PA Author Manuscript
NIH
-PA Author Manuscript
NIH
-PA Author Manuscript
Appendix
AppendixWeb resources
Illumina GoldenGate Assay: http://www.illumina.com/products/prod_snp.ilmn).
HapMap Project: http://www.hapmap.org/
HGDP-CEPH Human Genome Diversity Cell Line Panel:http://www.cephb.fr/HGDP-CEPH-Panel
R: http://www.r-project.org
Structure2.2:http://pritch.bsd.uchicago.edu/software.html
ReferencesArentsen K, Sindrup E. Electroencephalographic investigation of alcoholics. Acta. Psychiatr. Scand
1963;39:371–383. [PubMed: 14130289]Babor TF, Hofmann M, DelBoca FK, Hesselbrock V, Meyer RE, Dolinsky ZS, et al. Types of alcoholics,
I. Evidence for an empirically derived typology based on indicators of vulnerability and severity. Arch.Gen. Psychiatry 1992;49:599–608. [PubMed: 1637250]
Barrett JC, Fry B, Maller J, Daly MJ. Haploview: analysis and visualization of LD and haplotype maps.Bioinformatics 2005;21:263–265. [PubMed: 15297300]
van Beijsterveldt CE, Molenaar PC, de Geus EJ, Boomsma DI. Heritability of human brain functioningas assessed by electroencephalography. Am. J. Hum. Genet 1996;58:562–573. [PubMed: 8644716]
Bloom FE, Morales M. The central 5-HT3 receptor in CNS disorders. Neurochem. Res 1998;23:653–659. [PubMed: 9566603]
Campbell AD, McBride WJ. Serotonin-3 receptor and ethanol-stimulated dopamine release in the nucleusaccumbens. Pharmacol. Biochem. Behav 1995;51:835–842. [PubMed: 7675866]
Campbell AD, Kohl RR, McBride WJ. Serotonin-3 receptor and ethanol-stimulated somatodendriticdopamine release. Alcohol 1996;13:569–574. [PubMed: 8949951]
Cloninger CR, Bohman M, Sigvardsson S. Inheritance of alcohol abuse. Cross-fostering analysis ofadopted men. Arch. Gen. Psychiatry 1981;38:861–868. [PubMed: 7259422]
Coger RW, Dymond AM, Serafetinides EA, Lowenstam I, Pearson D. EEG signs of brain impairmentin alcoholism. Biol. Psychiatry 1978;13:729–739. [PubMed: 737260]
Compton WM, Conway KP, Stinson FS, Colliver JD, Grant BF. Prevalence, correlates, and comorbidityof DSM-IV antisocial personality syndromes and alcohol and specific drug use disorders in the UnitedStates: results from the national epidemiologic survey on alcohol and related conditions. J. Clin.Psychiatry 2005;66:677–685. [PubMed: 15960559]
Coppola R. Isolating low frequency activity EEG spectrum analysis. Electroencephalogr. Clin.Neurophysiol 1979;46:224–226. [PubMed: 86431]
Davies PA, Pistis M, Hanna MC, Peters JA, Lambert JJ, Hales TG, et al. The 5-HT3B subunit is a majordeterminant of serotonin-receptor function. Nature 1999;397:359–363. [PubMed: 9950429]
Dubin AE, Huvar R, D’Andrea MR, Pyati J, Zhu JY, Joy KC, et al. The pharmacological and functionalcharacteristics of the serotonin 5-HT(3A) receptor are specifically modified by a 5-HT(3B) receptorsubunit. J. Biol. Chem 1999;274:30799–30810. [PubMed: 10521471]
Ducci F, Goldman D. Genetic approaches to addiction: genes and alcohol. Addiction. 2008Ducci F, Enoch MA, Funt S, Virkkunen M, Albaugh B, Goldman D. Increased anxiety and other
similarities in temperament of alcoholics with and without antisocial personality disorder across threediverse populations. Alcohol 2007a;41:3–12. [PubMed: 17452294]
Ducci et al. Page 10
Alcohol. Author manuscript; available in PMC 2009 September 30.
NIH
-PA Author Manuscript
NIH
-PA Author Manuscript
NIH
-PA Author Manuscript
Ducci F, Enoch MA, Hodgkinson C, Xu K, Catena M, Robin RW, et al. Interaction between a functionalMAOA locus and childhood sexual abuse predicts alcoholism and antisocial personality disorder inadult women. Mol. Psychiatry. 2007b
Ehlers CL, Phillips E. Association of EEG alpha variants and alpha power with alcohol dependence inMexican American young adults. Alcohol 2007;41:13–20. [PubMed: 17452295]
Endicott J, Spitzer RL. A diagnostic interview: the schedule for affective disorders and schizophrenia.Arch. Gen. Psychiatry 1978;35:837–844. [PubMed: 678037]
Enoch MA, Schwartz L, Albaugh B, Virkkunen M, Goldman D. Dimensional anxiety mediates linkageof GABRA2 haplotypes with alcoholism. Am. J. Med. Genet. B Neuropsychiatr. Genet 2006a;141:599–607.
Enoch MA, Shen PH, Ducci F, Hodgkinson C, Yuan Q, Liu J, et al. Genomewide linkage scan for restingEEG phenotypes; convergence of linkage peaks on chromosome 5q and association with candidategene, CRH-BP. Mol. Psychiatry. submitted for publication
Enoch MA, Shen PH, Xu K, Hodgkinson C, Goldman D. Using ancestry-informative markers to definepopulations and detect population stratification. J Psychopharmacol 2006b;20:19–26. [PubMed:16785266]
Enoch MA, White KV, Harris CR, Robin RW, Ross J, Rohrbaugh JW, et al. Association of low-voltagealpha EEG with a subtype of alcohol use disorders. Alcohol. Clin. Exp. Res 1999;23:1312–1319.[PubMed: 10470973]
Fils-Aime ML, Eckardt MJ, George DT, Brown GL, Mefford I, Linnoila M. Early-onset alcoholics havelower cerebrospinal fluid 5-hydroxyindoleacetic acid levels than late-onset alcoholics. Arch. Gen.Psychiatry 1996;53:211–216. [PubMed: 8611057]
Frank B, Niesler B, Nothen MM, Neidt H, Propping P, Bondy B, et al. Investigation of the humanserotonin receptor gene HTR3B in bipolar affective and schizophrenic patients. Am. J. Med. Genet.B Neuropsychiatry Genet 2004;131:1–5.
Goldman D, Ducci F. Deconstruction of Vulnerability to complex disease: enhanced effect sizes andpower of Intermediate phenotypes. Scientific World J 2007;7:124–130.
Goldman D, Oroszi G, Ducci F. The genetics of addictions: uncovering the genes. Nat. Rev. Genet2005;6:521–532. [PubMed: 15995696]
Hallikainen T, Saito T, Lachman HM, Volavka J, Pohjalainen T, Ryynanen OP, et al. Tiihonen J.Association between low activity serotonin transporter promoter genotype and early onset alcoholismwith habitual impulsive violent behavior. Mol. Psychiatry 1999;4:385–388. [PubMed: 10483057]
Hayrapetyan V, Jenschke M, Dillon GH, Machu TK. Co-expression of the 5-HT(3B) subunit with the 5-HT(3A) receptor reduces alcohol sensitivity. Brain Res. Mol. Brain Res 2005;142:146–150.[PubMed: 16257471]
Higley JD, Suomi SJ, Linnoila M. A nonhuman primate model of type II excessive alcohol consumption?Part 1. Low cerebrospinal fluid 5-hydroxyindoleacetic acid concentrations and diminished socialcompetence correlate with excessive alcohol consumption. Alcohol. Clin. Exp. Res 1996;20:629–642. [PubMed: 8800378]
Imperato A, Angelucci L. 5-HT3 receptors control dopamine release in the nucleus accumbens of freelymoving rats. Neurosci. Lett 1989;101:214–217. [PubMed: 2549462]
Johnson BA, Roache JD, Javors MA, DiClemente CC, Cloninger CR, Prihoda TJ, et al. Ondansetron forreduction of drinking among biologically predisposed alcoholic patients: a randomized controlledtrial. JAMA 2000;284:963–971. [PubMed: 10944641]
Johnson BA, Roache JD, Ait-Daoud N, Zanca NA, Velazquez M. Ondansetron reduces the craving ofbiologically predisposed alcoholics. Psychopharmacol (Berl) 2002;160:408–413.
Jones FW, Holmes DS. Alcoholism, alpha production, and biofeedback. J Consult. Clin. Psychol1976;44:224–228. [PubMed: 1254755]
Kendler KS, Prescott CA, Myers J, Neale MC. The structure of genetic and environmental risk factorsfor common psychiatric and substance use disorders in men and women. Arch. Gen. Psychiatry2003;60:929–937. [PubMed: 12963675]
Lappalainen J, Long JC, Eggert M, Ozaki N, Robin RW, Brown GL, et al. Linkage of antisocialalcoholism to the serotonin 5-HT1B receptor gene in 2 populations. Arch. Gen. Psychiatry1998;55:989–994. [PubMed: 9819067]
Ducci et al. Page 11
Alcohol. Author manuscript; available in PMC 2009 September 30.
NIH
-PA Author Manuscript
NIH
-PA Author Manuscript
NIH
-PA Author Manuscript
Lindberg N, Tani P, Virkkunen M, Porkka-Heiskanen T, Appelberg B, Naukkarinen H, et al. Quantitativeelectroencephalographic measures in homicidal men with antisocial personality disorder. PsychiatryRes 2005;136:7–15. [PubMed: 16026854]
Lindgren KA, Larson CL, Schaefer SM, Abercrombie HC, Ward RT, Oakes TR, et al. Thalamic metabolicrate predicts EEG alpha power in healthy control subjects but not in depressed patients. Biol.Psychiatry 1999;45:943–952. [PubMed: 10386175]
Lovinger DM, White G. Ethanol potentiation of 5-hydroxytryptamine3 receptor-mediated ion current inneuroblastoma cells and isolated adult mammalian neurons. Mol. Pharmacol 1991;40:263–270.[PubMed: 1715016]
Maricq AV, Peterson AS, Brake AJ, Myers RM, Julius D. Primary structure and functional expressionof the 5HT3 receptor, a serotonin-gated ion channel. Science 1991;254:432–437. [PubMed: 1718042]
McKenzie-Quirk SD, Girasa KA, Allan AM, Miczek KA. 5-HT(3) receptors, alcohol and aggressivebehavior in mice. Behav. Pharmacol 2005;16:163–169. [PubMed: 15864071]
Minabe Y, Ashby CR Jr. Wang RY. The effect of acute and chronic LY 277359, a selective 5-HT3receptor antagonist, on the number of spontaneously active midbrain dopamine neurons. Eur. J.Pharmacol 1991;209:151–156. [PubMed: 1797560]
Rasmussen K, Stockton ME, Czachura JF. The 5-HT3 receptor antagonist zatosetron decreases thenumber of spontaneously active A10 dopamine neurons. Eur. J. Pharmacol 1991;205:113–116.[PubMed: 1811993]
Robin RW, Chester B, Rasmussen JK, Jaranson JM, Goldman D. Prevalence, characteristics, and impactof childhood sexual abuse in a Southwestern American Indian tribe. Child Abuse Negl 1997;21:769–787. [PubMed: 9280382]
Ropert N, Guy N. Serotonin facilitates GABAergic transmission in the CA1 region of rat hippocampusin vitro. J. Physiol 1991;441:121–136. [PubMed: 1687746]
Schreckenberger M, Lange-Asschenfeldt C, Lochmann M, Mann K, Siessmeier T, Buchholz HG, et al.The thalamus as the generator and modulator of EEG alpha rhythm: a combined PET/ EEG studywith lorazepam challenge in humans. Neuroimage 2004;22:637–644. [PubMed: 15193592]
Spitzer, RL.; William, JBW.; Gibbon, M.; First, MB. Structured Clinical Interview for DSM-III-R PatientEdition (with Psychotic Screen-W/Psychotic Screen)-Version 1.0. American Psychiatry Press;Washington, DC: 1990a.
Spitzer, RL.; William, JBW.; Gibbon, M.; First, MB. Structured Clinical Interview for DSM-III-R Nonpatient Edition (SCID-NP, Version 1.0). American Psychiatry Press; Washington, DC: 1990b.
Spitzer, RL.; William, JBW.; Gibbon, M.; First, MB. Structured Clinical Interview for DSM-III-RPersonality Disorder SCID-II (Version .01). American Psychiatry Press; Washington, DC: 1990c.
Stephens M, Smith NJ, Donnelly P. A new statistical method for haplotype reconstruction frompopulation data. Am. J. Hum. Genet 2001;68:978–989. [PubMed: 11254454]
Stevens R, Rusch D, Solt K, Raines DE, Davies PA. Modulation of human 5-hydroxytryptamine type3AB receptors by volatile anesthetics and n-alcohols. J. Pharmacol. Exp. Ther 2005;314:338–345.[PubMed: 15831437]
Tremblay PB, Kaiser R, Sezer O, Rosler N, Schelenz C, Possinger K, et al. Variations in the 5-hydroxytryptamine type 3B receptor gene as predictors of the efficacy of antiemetic treatment incancer patients. J. Clin. Oncol 2003;21:2147–2155. [PubMed: 12775740]
Van Baal GC, De Geus EJ, Boomsma DI. Genetic architecture of EEG power spectra in early life.Electroencephalogr. Clin. Neurophysiol 1996;98:502–514. [PubMed: 8763510]
Virkkunen M, Goldman D, Linnoila M. Serotonin in alcoholic violent offenders. Ciba Found. Symp1996;194:168–177. [PubMed: 8862876]discussion 177-182
Yamada K, Hattori E, Iwayama Y, Ohnishi T, Ohba H, Toyota T, et al. Distinguishable haplotype blocksin the HTR3A and HTR3B region in the Japanese reveal evidence of association of HTR3B withfemale major depression. Biol. Psychiatry 2006;60:192–201. [PubMed: 16487942]
Zhang P, Sheng H, Uehara R. A double classification tree search algorithm for index SNP selection. BMCBioinformatics 2004;5:89. [PubMed: 15238162]
Zietsch BP, Hansen JL, Hansell NK, Geffen GM, Martin NG, Wright MJ. Common and specific geneticinfluences on EEG power bands delta, theta, alpha, and beta. Biol. Psychol 2007;75:154–164.[PubMed: 17316957]
Ducci et al. Page 12
Alcohol. Author manuscript; available in PMC 2009 September 30.
NIH
-PA Author Manuscript
NIH
-PA Author Manuscript
NIH
-PA Author Manuscript
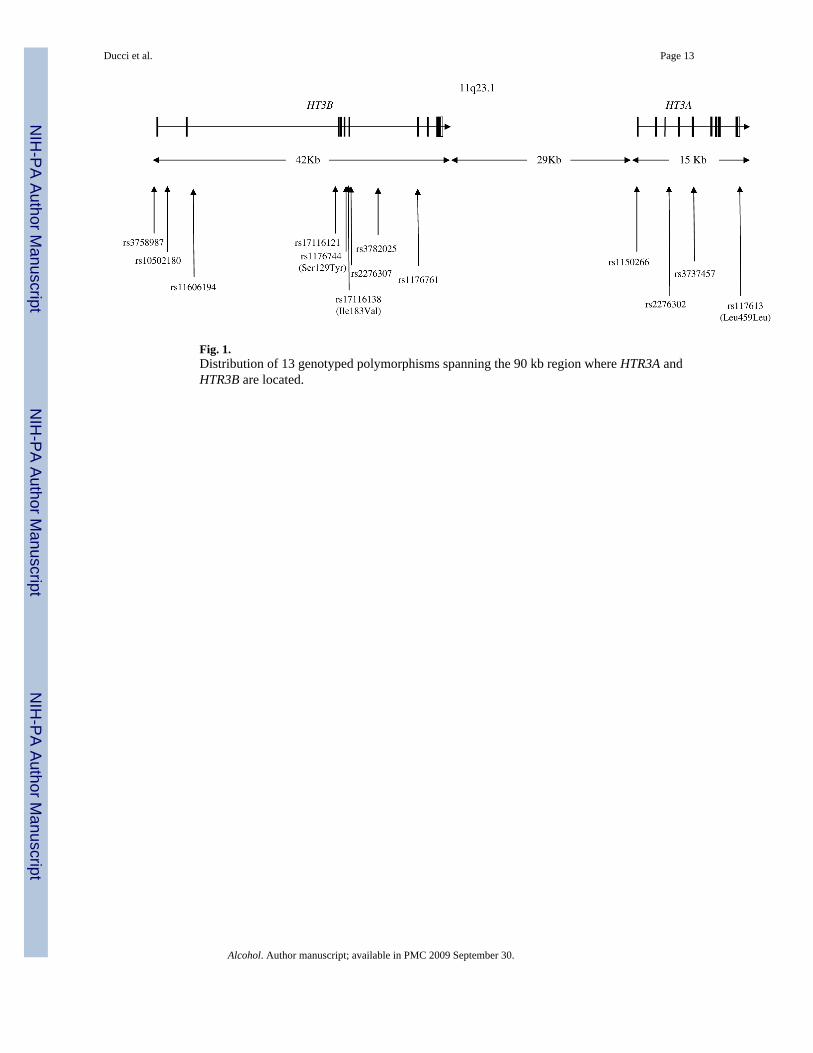
Fig. 1.Distribution of 13 genotyped polymorphisms spanning the 90 kb region where HTR3A andHTR3B are located.
Ducci et al. Page 13
Alcohol. Author manuscript; available in PMC 2009 September 30.
NIH
-PA Author Manuscript
NIH
-PA Author Manuscript
NIH
-PA Author Manuscript
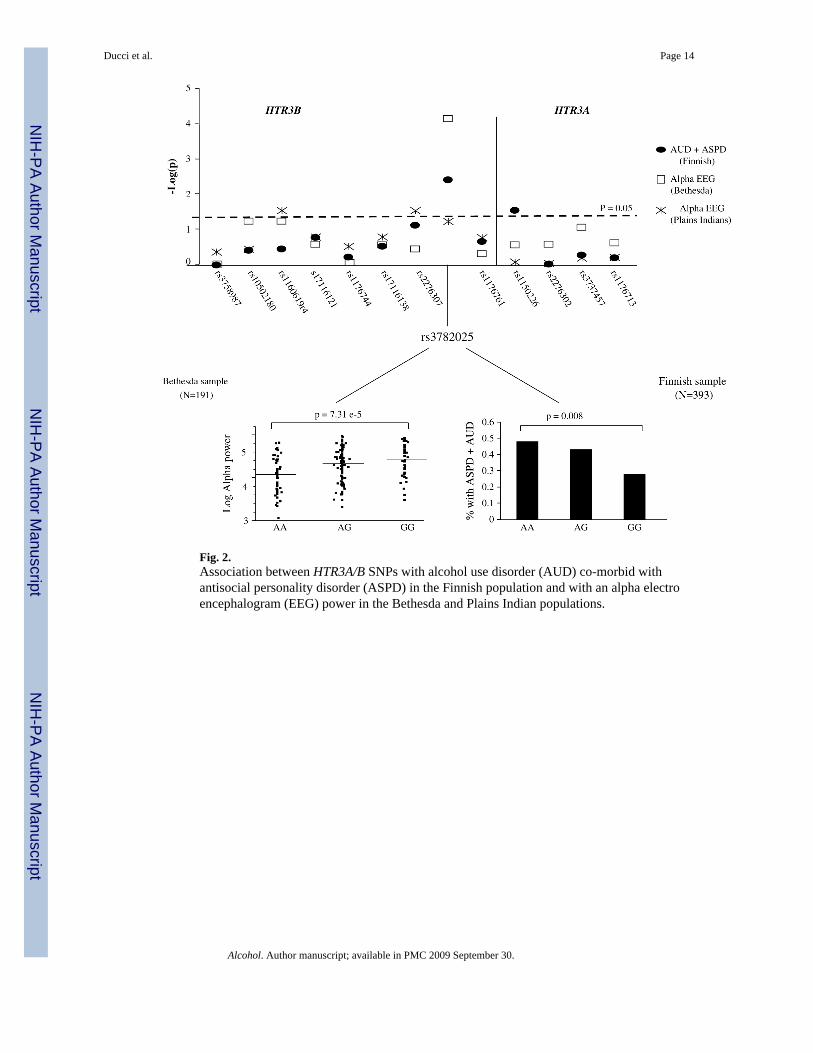
Fig. 2.Association between HTR3A/B SNPs with alcohol use disorder (AUD) co-morbid withantisocial personality disorder (ASPD) in the Finnish population and with an alpha electroencephalogram (EEG) power in the Bethesda and Plains Indian populations.
Ducci et al. Page 14
Alcohol. Author manuscript; available in PMC 2009 September 30.
NIH
-PA Author Manuscript
NIH
-PA Author Manuscript
NIH
-PA Author Manuscript
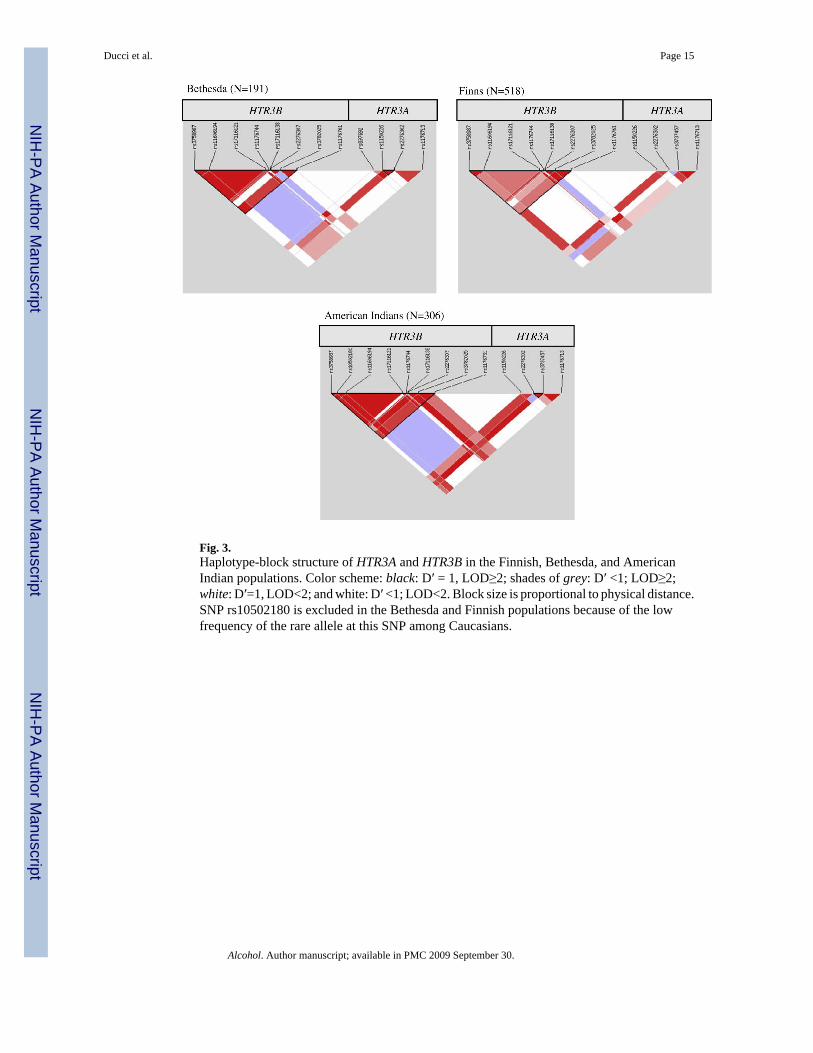
Fig. 3.Haplotype-block structure of HTR3A and HTR3B in the Finnish, Bethesda, and AmericanIndian populations. Color scheme: black: D′ = 1, LOD≥2; shades of grey: D′ <1; LOD≥2;white: D′=1, LOD<2; and white: D′ <1; LOD<2. Block size is proportional to physical distance.SNP rs10502180 is excluded in the Bethesda and Finnish populations because of the lowfrequency of the rare allele at this SNP among Caucasians.
Ducci et al. Page 15
Alcohol. Author manuscript; available in PMC 2009 September 30.
NIH
-PA Author Manuscript
NIH
-PA Author Manuscript
NIH
-PA Author Manuscript
NIH
-PA Author Manuscript
NIH
-PA Author Manuscript
NIH
-PA Author Manuscript
Ducci et al. Page 16
Table 1MAF of 13 HTR3A/HTR3B SNPs among control subjects (without AUD or ASPD), in three populations
Bethesda (N = 150) Finns (N = 234) Plains Indians (N =124)
HTR3B SNPs MAF MAF MAF
rs3758987 0.27 0.30 0.42
rs10502180 0.01 0.01 0.31
rs11606194 0.07 0.10 0.07
rs17116121 0.03 0.10 0.04
rs1176744 0.27 0.29 0.38
rs17116138 0.03 0.10 0.04
rs2276307 0.20 0.17 0.31
rs3782025 0.48 0.46 0.35
rs1176761 0.03 0.10 0.05
HTR3A rs1150226 0.06 0.04 0.04
rs2276302 0.31 0.37 0.10
rs3737457 0.01 0.02 0.30
rs1176713 0.23 0.27 0.35
Abbreviations: MAF = minor allele frequencies; AUD = alcohol use disorders; ASPD = antisocial personality disorder.
Alcohol. Author manuscript; available in PMC 2009 September 30.
NIH
-PA Author Manuscript
NIH
-PA Author Manuscript
NIH
-PA Author Manuscript
Ducci et al. Page 17Ta
ble
2A
ssoc
iatio
ns b
etw
een
HTR
3A a
nd H
TR3B
SN
Ps a
nd a
lcoh
olis
m w
ith c
omor
bid
ASP
D in
the
Finn
ish
popu
latio
n
Gen
eSN
PsG
Con
trol
sA
UD
+ A
SPD
χ2P
valu
eA
Con
trol
sA
UD
+ A
SPD
χ2P
valu
e
HTR
3Brs
3758
987
TT0.
47 (1
09)
0.46
(72)
0.58
.74
T0.
700.
700
.96
CT
0.45
(103
)0.
48 (7
6)
CC
0.08
(18)
0.06
(10)
rs10
5021
80TT
0.98
(227
)0.
99 (1
58)
1.63
.2T
0.99
1.00
1.44
.42
GT
0.02
(5)
0.00
6 (1
)
GG
00
rs11
6061
94TT
0.80
(184
)0.
83 (1
32)
1.61
.44
T0.
90.
920.
78.3
8
CT
0.20
(46)
0.17
(27)
CC
0.00
4 (1
)0
rs17
1161
21A
A0.
01 (3
)0.
06 (1
)1.
8.4
1A
0.1
0.07
1.81
.18
AG
0.17
(39)
0.13
(20)
GG
0.82
(191
)0.
87 (1
38)
rs11
7674
4A
A0.
50 (1
15)
0.48
(74)
0.25
.88
A0.
710.
690.
21.6
4
AC
0.43
(99)
0.43
(67)
CC
0.08
(18)
0.09
(14)
rs17
1161
38A
A0.
013
(3)
0.06
3 (1
)1.
09.5
8A
0.1
0.08
1.05
.31
AG
0.17
(39)
0.14
(22)
GG
0.82
(191
)0.
86 (1
36)
rs22
7630
7A
A0.
69 (1
58)
0.60
(96)
3.58
.17
A0.
830.
782.
95.0
8
AG
0.29
(67)
0.35
(56)
GG
0.02
(5)
0.04
(7)
rs37
8202
5A
A0.
22 (5
2)0.
30 (4
8)9.
59.0
08A
0.46
0.57
8.28
.004
AG
0.48
(111
)0.
53 (8
4)
GG
0.30
(70)
0.17
(27)
rs11
7676
1TT
0.82
(191
)0.
86 (1
36)
1.35
.51
T0.
90.
931.
34.2
3
AT
0.17
(39)
0.13
(21)
AA
0.01
3 (3
)0.
006
(1)
HTR
3Ars
1150
226
AA
0.04
3 (1
)0
4.91
.08
A0.
040.
024.
49.0
3
AG
0.08
(18)
0.03
(5)
GG
0.92
(215
)0.
97 (1
54)
Alcohol. Author manuscript; available in PMC 2009 September 30.
NIH
-PA Author Manuscript
NIH
-PA Author Manuscript
NIH
-PA Author Manuscript
Ducci et al. Page 18
Gen
eSN
PsG
Con
trol
sA
UD
+ A
SPD
χ2P
valu
eA
Con
trol
sA
UD
+ A
SPD
χ2P
valu
e
rs22
7630
2A
A0.
39 (9
0)0.
40 (6
3)0.
27.8
7A
0.63
0.63
01
AG
0.48
(112
)0.
46 (7
2)
GG
0.13
(31)
0.15
(23)
rs37
3745
7A
A0
00.
35.5
6A
0.02
0.02
0.33
.56
AG
0.04
(10)
0.03
(5)
GG
0.96
(223
)0.
97 (1
54)
rs11
7671
3A
A0.
52 (1
20)
0.54
(85)
3.9
.14
A0.
730.
710.
19.6
6
AG
0.42
(97)
0.35
(55)
GG
0.06
(15)
0.11
(18)
Abbr
evia
tions
: ASP
D =
ant
isoc
ial p
erso
nalit
y di
sord
er; A
UD
= a
lcoh
ol u
se d
isor
ders
.
Alle
le (A
, df =
1) a
nd g
enot
ype
(G, d
f = 2
) fre
quen
cies
are
com
pare
d be
twee
n ca
ses (
AU
D +
ASP
D) a
nd c
ontro
ls (n
o A
UD
; no
ASP
D) u
sing
the χ2
test
. SN
P al
lele
s are
labe
led
usin
g th
e “+
” D
NA
stra
nd se
quen
ce.
Alcohol. Author manuscript; available in PMC 2009 September 30.
NIH
-PA Author Manuscript
NIH
-PA Author Manuscript
NIH
-PA Author Manuscript
Ducci et al. Page 19Ta
ble
3A
ssoc
iatio
n be
twee
n m
arke
rs w
ithin
HTR
3A a
nd H
TR3B
gen
es a
nd a
lpha
pow
er in
the
Bet
hesd
a an
d A
mer
ican
Indi
an p
opul
atio
ns
Bet
hesd
aA
mer
ican
Indi
ans
SNP
GN
Log
alp
ha p
ower
(S.E
.)F
P va
lue
NL
og a
lpha
pow
er (S
.E.)
FP
valu
e
HTR
3Brs
3758
987
TT97
4.27
(0.0
4)0.
01.9
911
04.
28 (0
.04)
0.58
.58
CT
764.
27 (0
.05)
145
4.26
(0.3
)
CC
144.
28 (0
,11)
514.
32 (0
.05)
rs10
5021
80TT
187
4.27
(0.0
3)3.
56.0
614
04.
29 (0
.03)
0.97
.38
GT
44.
67 (0
.21)
138
4.24
(0.0
3)
GG
028
4.35
(0.0
7)
rs11
6061
94TT
159
4.25
(0.0
3)3.
87.0
627
04.
29 (0
.02)
4.51
.03
CT
324.
41 (0
.07)
344.
14 (0
.07)
CC
00
rs17
1161
21A
A0
1.16
.28
01.
88.1
7
AG
164.
38 (0
.10)
224.
16 (0
.08)
GG
175
4.27
(0.0
3)28
34.
28 (0
.02)
rs11
7674
4A
A97
4.29
(0.0
4)0.
09.9
112
64.
27 (0
.03)
1.16
.31
AC
724.
26 (0
.05)
138
4.25
(0.0
3)
CC
194.
26 (0
.09)
424.
36 (0
.06)
rs17
1161
38A
A0
1.16
.29
01.
88.1
7
AG
164.
38 (0
.10)
224.
16 (0
.08)
GG
175
4.27
(0.0
3)28
34.
28 (0
.03)
rs22
7630
7A
A12
54.
3 (0
.06)
0.99
.37
155
4.27
(0.0
3)3.
29.0
3
AG
554.
23 (0
.06)
119
4.24
(0.0
3)
GG
94.
14 (0
.14)
324.
44 (0
.07)
rs37
8202
5A
A48
4.06
(0.0
6)10
.02
7.37
e-05
122
4.34
(0.0
3)2.
87.0
6
AG
964.
32 (0
.04)
146
4.23
(0.0
3)
GG
434.
42 (0
.06)
374.
25 (0
.07)
rs11
7676
1TT
174
4.27
(0.0
3)0.
41.5
228
14.
28 (0
.02)
1.33
.18
AT
174.
33 (0
.10)
244.
18 (0
.08)
AA
00
Alcohol. Author manuscript; available in PMC 2009 September 30.
NIH
-PA Author Manuscript
NIH
-PA Author Manuscript
NIH
-PA Author Manuscript
Ducci et al. Page 20
Bet
hesd
aA
mer
ican
Indi
ans
SNP
GN
Log
alp
ha p
ower
(S.E
.)F
P va
lue
NL
og a
lpha
pow
er (S
.E.)
FP
valu
e
HTR
3Ars
1150
226
AA
44.
44 (0
.21)
1.24
.29
00.
02.8
8
AG
234.
16 (0
.08)
204.
29 (0
.08)
GG
163
4.29
(0.0
3)28
64.
27 (0
.03)
rs22
7630
2A
A82
4.24
(0.0
5)1.
27.2
824
34.
28 (0
.02)
0.04
.95
AG
834.
33 (0
.05)
574.
26 (0
.05)
GG
244.
22 (0
.08)
64.
30 (0
.16)
rs37
3745
7A
A0
2.88
.09
304.
26 (0
.07)
0.41
.67
AG
44.
62 (0
.21)
130
4.25
(0.0
3)
GG
187
4.27
(0.0
3)14
64.
29 (0
.03)
rs11
7671
3A
A11
14.
24 (0
.04)
1.38
.25
120
4.30
(0.0
3)0.
44.6
4
AG
724.
34 (0
.05)
143
4.25
(0.0
3)
GG
74.
20 (0
.16)
434.
29 (0
.05)
Abbr
evia
tion:
S.E
. = st
anda
rd e
rror
.
SNP
alle
les a
re la
bele
d us
ing
the
“+”
DN
A st
rand
sequ
ence
.
Alcohol. Author manuscript; available in PMC 2009 September 30.
NIH
-PA Author Manuscript
NIH
-PA Author Manuscript
NIH
-PA Author Manuscript
Ducci et al. Page 21
Table 4Haplotype frequencies within HTR3B block one and two in the Finnish, Bethesda, and Plains Indian controls (no AUD,no ASPD). SNP alleles are labeled using the “+” DNA strand sequence
Block Haplotype Bethesdas (N = 150) Finns (N = 229) Plains Indian (N = 124)
1 TTTGA 0.71 0.65 0.26
CTTGC 0.2 0.17 0.33
TGTGA 0 0 0.32
TTTGC 0.02 0.01 0.007
CTCAC 0.03 0.07 0.04
CTCGC 0.04 0.03 0
CTTGA 0 0.03 0.01
CTCGA 0 0 0.03
2 GAGT 0.45 0.44 0.29
GAAT 0.33 0.29 0.36
GGAT 0.19 0.17 0.31
AAGA 0.03 0.1 0.04
Abbreviations: AUD = alcohol use disorders; ASPD = antisocial personality disorder.
Alcohol. Author manuscript; available in PMC 2009 September 30.
NIH
-PA Author Manuscript
NIH
-PA Author Manuscript
NIH
-PA Author Manuscript
Ducci et al. Page 22
Table 5Frequencies of haplotypes within HTR3B block 2 are compared between alcoholics with comorbid ASPD (AUD +ASPD) and controls (no AUD, no ASPD) in the Finnish population (χ2 analyses, df = 1)
Haplotype ASPD (N = 156) Controls (N = 229) χ2 P
AAGA 0.07 0.10 1.21 0.27
GAGT 0.36 0.44 5.19 0.02
GAAT 0.35 0.29 2.65 0.1
GGAT 0.22 0.17 2.9 0.08
Abbreviations: ASPD = antisocial personality disorder; AUD = alcohol use disorders.
SNP alleles are labeled using the “+” DNA strand sequence.
Alcohol. Author manuscript; available in PMC 2009 September 30.
NIH
-PA Author Manuscript
NIH
-PA Author Manuscript
NIH
-PA Author Manuscript
Ducci et al. Page 23Ta
ble
6A
ssoc
iatio
n be
twee
n H
TR3B
hap
loty
pes
and
alph
a po
wer
in th
e B
ethe
sda
and
Plai
ns A
mer
ican
Indi
an p
opul
atio
ns (h
aplo
type
-clu
ster
base
d an
alys
es)
Bet
hesd
aPl
ains
N o
f cop
yN
Log
alp
hapo
wer
(SE
)F
P va
lue
NL
og a
lpha
pow
er (S
E)
FP
valu
e
B1
TTTG
A0
204.
29 (0
.09)
0.02
.98
158
4.31
(0.0
3)2.
55.0
8
179
4.27
(0.0
5)12
64.
22 (0
.03)
292
4.27
(0.0
4)21
4.38
(0.0
8)
TGTG
A0
140
4.28
(0.0
3)1.
03.3
6
113
74.
24 (0
.03)
228
4.35
(0.0
7)
TTTG
C0
180
4.28
(0.0
3)1
.32
111
4.15
(0.1
3)
2
CTT
GC
013
34.
30 (0
.04)
1.58
.21
147
4.27
(0.0
3)1.
59.2
147
4.18
(0.0
6)12
24.
25 (0
.03)
211
4.31
(0.1
2)36
4.38
(0.0
6)
CTC
AC
017
54.
27 (0
.03)
1.16
.28
282
4.28
(0.0
2)1.
29.2
7
116
4.38
(0.1
1)22
4.16
(0.0
8)
21
4.61
(0.3
9)
CTC
GC
017
74.
26 (0
.03)
1.73
.19
114
4.42
(0.1
1)
2
CTT
GA
028
94.
27 (0
.03)
0.34
.56
116
4.33
(0.0
9)
2
CTC
GA
029
34.
28 (0
.02)
2.53
.11
112
4.09
(0.1
1)
2
B2
GA
GT
053
4.07
(0.0
6)9.
8.0
0009
135
4.32
(0.0
3)1.
86.1
6
110
34.
33 (0
.04)
146
4.23
(0.0
3)
231
4.43
(0.0
7)24
4.25
(0.0
8)
Alcohol. Author manuscript; available in PMC 2009 September 30.
NIH
-PA Author Manuscript
NIH
-PA Author Manuscript
NIH
-PA Author Manuscript
Ducci et al. Page 24
Bet
hesd
aPl
ains
N o
f cop
yN
Log
alp
hapo
wer
(SE
)F
P va
lue
NL
og a
lpha
pow
er (S
E)
FP
valu
e
GG
AT
012
54.
30 (0
.04)
0.84
.42
155
4.27
(0.0
3)3.
38.0
3
153
4.24
(0.0
6)11
84.
24 (0
.04)
29
4.14
(0.1
4)32
4.44
(0.0
7)
GA
AT
088
4.35
(0.0
4)5.
96.0
0313
14.
27 (0
.03)
0.4
.67
177
4.27
(0.0
4)14
04.
27 (0
.03)
222
4.01
(0.0
9)34
4.33
(0.0
7)
AA
GA
017
14.
27 (0
.03)
1.08
.29
282
4.28
(0.0
2)1.
3.2
7
116
4.38
(0.1
1)22
4.16
(0.0
8)
20
14.
61 (0
.39)
SNP
alle
les a
re la
bele
d us
ing
the
“+”
DN
A st
rand
sequ
ence
.
Alcohol. Author manuscript; available in PMC 2009 September 30.
Copyright © 2022 FDOKUMEN