
HSE Monitoring Overview
19
HSE Monitoring and Reporting Standard Rev 04 UNCLASSIFIED Document 0000-S-90-04-O-0009-00-E Appendix 6 Revision 04 Printed copy uncontrolled p1 of 19 APPENDIX 6 HSE Monitoring Overview 1. Purpose Sakhalin Energy has a systematic approach to management of HSE and Social Performance designed to ensure compliance with the law and achieve continuous performance improvement. Hence, the Company has determined the key characteristics of activities that can have a significant HSE impact and are required to be monitored and measured. These include characteristics that are: required for monitoring under Permits, Licences and other Legal or regulatory requirements of the Russian Federation, covenanted requirements under the terms of Sakhalin Energy’s Loan agreement, adopted shareholder requirements, other adopted international requirements, necessary to determine the extent to which Sakhalin Energy’s HSE objectives are met in line with the HSE Plan. Significant overlap exists between the above-listed requirements. To ensure that the company can meet its obligations efficiently and effectively, it is necessary to collectively evaluate the various requirements and to create unified monitoring plans and protocols wherever possible. The purpose of this document is to provide an overview of Sakhalin Energy’s unified HSE and Social Performance monitoring programmes applicable to the key characteristics of Sakhalin Energy operations with Significant HSE Risk 1 , with reference to the relevant documentation. The company maintains separate and specific Industrial Environmental monitoring programs for each relevant facility, and Strategy documents and Scopes of Work for each Local Monitoring programme. 2. Who is this for? Directors; Managers; HSE Professionals. Public disclosure. 3. What situations are covered? This document applies to the operational phase (only) of all Sakhalin Energy Assets, Facilities, operations, Projects and activities, including activities undertaken by contractors on behalf of the Company. Sakhalin-2 Phase 2 HSESAP monitoring requirements for the construction phase can be found on Sakhalin Energy website (HSESAP Revision 2 Annex C). Future construction monitoring programmes shall be developed based on outcomes of the Impact Assessment process, considering RF and adopted international requirements. 4. Background to the development of HSE monitoring programmes TEO-C. Environmental monitoring requirements for the Sakhalin-2 Phase 2 Project were planned in the Technical and Economic Substantiation for Construction (TEO-C) in Volume 3, Book 8. The proposed plan set out in the TEO-C had several primary monitoring objectives including: Assessment of the environmental effects and recovery through all stages (construction, operation, and abandonment); Assessment of the efficacy of mitigation measures; Refinement and improvement of mitigation measures where practicable; Timely identification of the sources of potential environmental impacts; Regular acquisition of scientific data on the current state of areas affected by the Project; 1 Italicized terms in this document are included in the Sakhalin Energy HSE Glossary.
-
Upload
khangminh22 -
Category
Documents
-
view
2 -
download
0
Transcript of HSE Monitoring Overview

HSE Monitoring and Reporting Standard Rev 04
UNCLASSIFIED Document 0000-S-90-04-O-0009-00-E Appendix 6 Revision 04 Printed copy uncontrolled p1 of 19
APPENDIX 6
HSE Monitoring Overview
1. Purpose
Sakhalin Energy has a systematic approach to management of HSE and Social Performance designed to ensure compliance with the law and achieve continuous performance improvement. Hence, the Company has determined the key characteristics of activities that can have a significant HSE impact and are required to be monitored and measured.
These include characteristics that are:
required for monitoring under Permits, Licences and other Legal or regulatory requirements of the Russian Federation,
covenanted requirements under the terms of Sakhalin Energy’s Loan agreement,
adopted shareholder requirements,
other adopted international requirements,
necessary to determine the extent to which Sakhalin Energy’s HSE objectives are met in line with the HSE Plan.
Significant overlap exists between the above-listed requirements. To ensure that the company can meet its obligations efficiently and effectively, it is necessary to collectively evaluate the various requirements and to create unified monitoring plans and protocols wherever possible.
The purpose of this document is to provide an overview of Sakhalin Energy’s unified HSE and Social Performance monitoring programmes applicable to the key characteristics of Sakhalin Energy operations with Significant HSE Risk
1, with reference to the relevant documentation. The company maintains separate and
specific Industrial Environmental monitoring programs for each relevant facility, and Strategy documents and Scopes of Work for each Local Monitoring programme.
2. Who is this for?
Directors; Managers; HSE Professionals. Public disclosure.
3. What situations are covered?
This document applies to the operational phase (only) of all Sakhalin Energy Assets, Facilities, operations, Projects and activities, including activities undertaken by contractors on behalf of the Company.
Sakhalin-2 Phase 2 HSESAP monitoring requirements for the construction phase can be found on Sakhalin Energy website (HSESAP Revision 2 Annex C). Future construction monitoring programmes shall be developed based on outcomes of the Impact Assessment process, considering RF and adopted international requirements.
4. Background to the development of HSE monitoring programmes
TEO-C. Environmental monitoring requirements for the Sakhalin-2 Phase 2 Project were planned in the Technical and Economic Substantiation for Construction (TEO-C) in Volume 3, Book 8. The proposed plan set out in the TEO-C had several primary monitoring objectives including:
Assessment of the environmental effects and recovery through all stages (construction, operation, and abandonment);
Assessment of the efficacy of mitigation measures;
Refinement and improvement of mitigation measures where practicable;
Timely identification of the sources of potential environmental impacts;
Regular acquisition of scientific data on the current state of areas affected by the Project;
1 Italicized terms in this document are included in the Sakhalin Energy HSE Glossary.
HSE Monitoring and Reporting Standard Rev 04
UNCLASSIFIED Document 0000-S-90-04-O-0009-00-E Appendix 6 Revision 04 Printed copy uncontrolled p2 of 19
Assessment of compliance with environmental permits and licenses;
Verification of predicted impacts; and
Submission of annual reports on monitoring results to state bodies with jurisdiction over the environment.
The program focused on certain indicator parameters (i.e. those parameters that react markedly to environmental degradation or improvement), since monitoring every possible environment variable is neither physically nor economically practicable.
Refer Impact Assessment.
EMP. The TEO-C recommended development of an Industrial Environmental Control and Local Monitoring Project (referred to as the EMP) to combine the monitoring chapters from the Environmental Protection Books of TEO-C. Sakhalin Energy’s EMP was approved by the SEER (State Environmental Expert Review) under the Russian Federation Ministry of Natural Resources (MNR) on 5 June 2007, and consequently constitutes requirements under Russian law for environmental monitoring during the operations phase of Sakhalin-2 Phase 2 Project. The EMP states that monitoring programmes can be revised based on changes in legal requirements, changes in the Sakhalin-2 project, and based on analysis of monitoring results. The EMP document itself is not required to be revised. As stated above, Sakhalin Energy’s current HSE Monitoring programmes are summarised in this HSE Monitoring Overview document and detailed in Industrial Environmental monitoring programs for each relevant facility, and Strategy documents and Scopes of Work for each Local Monitoring programme.
HSESAP. The HSE and Social Action Plan (HSESAP) Revision 2 Annex C documented the environmental monitoring programmes that were committed under the Loan Agreement with the Sakhalin-2 Phase 2 project Lender group. Annex C included monitoring requirements identified by the Environmental Social and Health Impact Assessment (ESHIA). Annex C was generally consistent with the EMP, however Annex C included several additional Onshore and Offshore Biodiversity Commitments and several items related to international standards. In Revision 3 of the HSESAP, the previous Annex C was updated and renamed to become this HSE Monitoring Overview document.
RemAP. A Pre-Signing Remedial Action Plan was agreed between the Company and the Lenders, which included monitoring requirements for Rivers and Wetlands. These monitoring requirements were included in HSESAP Revision 2 Annex C and, where applicable to current activities, continue to be included in this HSE Monitoring Overview document.
BAP. Sakhalin Energy’s Biodiversity Action Plan (BAP) sets out the company’s priorities for management and conservation of biodiversity interests, as required by the Biodiversity Standard (Lender commitments) and as guided by the National Strategy for the Conservation of Biodiversity in the Russian Federation (2002), and various legislation of the Russian Federation that affords protection to rare (Red Data Book, RDB) species and to their habitats. Monitoring requirements derived from the BAP are also summarised in this HSE Monitoring Overview document.
5. Revision of monitoring requirements
In line with the systematic approach employed by Sakhalin Energy to manage and monitor its aspects and impacts, the company regularly analyses monitoring results and based on this analysis reassesses and, where appropriate, adapts monitoring programmes to provide adequate information for management of Significant HSE Risks. The original monitoring programmes specified in the EMP, RemAP, HSESAP and BAP have been reviewed based on operational experience and monitoring outcomes, to ensure their appropriateness and effectiveness.
Where monitoring indicates no significant impact, or where monitoring indicates that implemented controls are sufficient to manage risk to a level that is As Low As Reasonably Practicable, then monitoring frequencies may be reduced and/or parameters and programmes may be significantly modified. Conversely, monitoring results or other information may necessitate greater monitoring effort based on increase in assessed risk.
As stated above, an overview of Sakhalin Energy’s current HSE Monitoring programmes are provided in this document and in the referenced HSESAP documents. This overview reflects current Permits and Licences, current Local Monitoring programmes, and has been reviewed against adopted international requirements as

HSE Monitoring and Reporting Standard Rev 04
UNCLASSIFIED Document 0000-S-90-04-O-0009-00-E Appendix 6 Revision 04 Printed copy uncontrolled p3 of 19
documented in the International Requirements and Standards Comparison appendices that form part of HSESAP.
This document is subject to future review in case of significant changes in regulatory requirements (such as Permits and Licences), Project activities, or adopted international or other requirements, or based on analysis of monitoring results and operational experience.
For simplification, where practicable, the Company shall seek to unify Industrial Environmental Control monitoring programmes, i.e. to have a single programme per facility that incorporates identical Permit/Licence and Lender requirements. Where this is not practicable, this document should indicate differences in scope.
Any change in Permits and Licences is clearly subject to the normal regulatory approvals process, and any changes in the monitoring requirements identified in this document are subject to approval of the Phase 2 Senior Lenders.
6. Industrial Control
Industrial Control programmes include monitoring requirements for emissions to air, water and land, waste management, and occupational hygiene requirements. The programmes consider monitoring parameters, monitoring locations and frequency, and sampling and analysis methods. These five year programmes are prepared for each Asset based on approved permits and authority decisions, and updated in case of any relevant changes.
Industrial Control programmes are in place as follows:
Platform Piltun Astokh Alpha (PA-A)
Platform Piltun Astokh Bravo (PA-B)
Platform Lunskoye Alpha (LUN-A)
Onshore Processing Facility (OPF)
Onshore Pipelines (Pipeline Maintenance Depots PMDs, and Booster Station 2 BS2)
Prigorodnoye Liquefied Natural Gas Plant (LNG), Tanker Loading Unit (TLU), Oil Export Terminal (OET) and Materials Offloading Facility (MOF)
Yuzhno Facilities Management (FM)
6.1 Emissions to Air
Sakhalin Energy has developed and implements monitoring programmes for emissions to air, considering RF requirements, adopted international standards, and outcomes of the Impact Assessment process. Monitoring programmes are in place for each asset and include parameters such as Sulfur Dioxide (SO2), Nitrogen Oxides (NOx), Hydrocarbons, and Greenhouse Gases (CO2, CH4). The parameters monitored depend on the emission source.
The Air Emissions and Energy Management Standard Comparison provides an overview of monitoring programmes, considering the adopted international and EC Standards, TEO-C and EMP. Refer document 0000-S-90-04-O-0257-00-E Appendix 4. Note that Permits may include additional parameters which are monitored in accordance with RF requirements.
6.2 Water Use
In relation to effluent water quality control, Sakhalin Energy has developed and implemented monitoring
programmes considering RF requirements, adopted international standards, and outcomes of the Impact
Assessment process. Monitoring programmes are in place for each asset and include parameters such as
Biological Oxygen Demand (BOD), Oil and grease, Suspended Solids, Ammonia nitrogen, phosphorus, Coliform
bacteria, Temperature and pH (amongst others). The parameters monitored depend on the source of effluent.
The Water Use Standard Comparison provides an overview of monitoring programmes, considering the adopted international and EC Standards, TEO-C and EMP. Refer document 0000-S-90-04-O-0255-00-E Appendix 5.

HSE Monitoring and Reporting Standard Rev 04
UNCLASSIFIED Document 0000-S-90-04-O-0009-00-E Appendix 6 Revision 04 Printed copy uncontrolled p4 of 19
Note that Licences/Decisions may include additional parameters which are monitored in accordance with RF requirements.
6.3 Waste Management
Waste generation, transport and disposal are monitored in accordance with the Waste Management Standard (0000-S-90-04-O-0258-00-E), in particular Appendix 8 Approved Waste Storage and Accumulation Facilities, Appendix 11 Waste Tracking and Reporting and Appendix 12 Waste Management Assurance. Appendix 5 Waste Management Standards Comparison provides an overview of conformance to the adopted international and EC Standards.
6.4 Hazardous Materials
Hazardous Materials are managed in accordance with the Chemicals Management Specification (0000-S-90-04-O-0270-00, Appendix 10) and requirements of RF law and HSESAP. Inspections are undertaken at all Assets covering the handling, storage and disposal of hazardous materials including chemical storage, oil storage and fuel storage areas. Key items to address include presence of applicable MSDS forms, adequate RF approved labelling, spill prevention and response capabilities, effective function of all interceptors, spill response equipment, and fuel handling operations. Outcomes of inspections are recorded in logbooks or checklists as appropriate.
6.5 Occupational Hygiene (Sanitary Monitoring Programme, SMP)
The Industrial Control Programme for Compliance with Hygiene Regulations and Implementation of Anti-epidemic (preventative) Measures (SMP) is required by RF legislation. SMPs are developed based on the outcomes of Health Risk Assessment and in compliance with regulatory and adopted international requirements. SMPs focus on monitoring of specific workplace exposures, drinking water and food quality, accommodation conditions, and conditions at Sanitary Protection Zones. The following parameters are included.
Workplaces: Various activity-specific monitoring is undertaken depending on sources of exposure identified via Health Risk Assessment and in compliance with RF regulations.
Groundwater abstraction wells: Quantity abstracted (daily), and parameters (quarterly) including total mineralization, total hardness, permanganate value, hydrocarbons, phenols, synthetic surfactants, organoleptic indices, and annual measurement of radioactivity. In addition, well technical condition is inspected annually (casings, well intake, pump equipment, well depth). The SPZ of water intake is reviewed annually, considering economic activity, presence / absence of potential sources of groundwater pollution, and general sanitary evaluation of the area.
Noise: Noise levels are measured once a year according to SMP requirements at workplaces and at SPZ. In addition, one additional monitoring point is included in the dacha area nearest point to LNG plant (monitored monthly during dacha season).
Sanitary Protection Zones: Air monitoring is conducted at SPZs as follows.
o OPF: Quarterly, 2 sampling points, NO2, SO2, CO, soot, hydrocarbons, methyl benzene
o PMDs: Twice per year, 2 sampling points, NO2
o BS2: Twice per year, 4 sampling points, NO2, CO, methane
o LNG: Quarterly at 5 sampling points at the border of SPZ and 6 times per year in the warm period at the border of local residential zone, NO2, SO2, CO, soot, formaldehyde, benzapyrene.
7. Social Performance
Social performance monitoring is implemented to track and evaluate the Project’s progress in realisation of measures specified in the HSESAP, with the ultimate aim of measuring the performance and effectiveness of the Project’s social management system and to monitor compliance against Company social commitments. The Social Performance Monitoring Specification provides an overview of monitoring programmes. Refer document 0000-S-90-01-O-0021-00-E Appendix 11.
HSE Monitoring and Reporting Standard Rev 04
UNCLASSIFIED Document 0000-S-90-04-O-0009-00-E Appendix 6 Revision 04 Printed copy uncontrolled p5 of 19
8. Biodiversity Local Monitoring
Onshore monitoring programmes are in place to outline the applicable monitoring activities, originally based on EMP and BAP. Strategy Reports are prepared for each of the following programmes
2 (excluding Whales and
Geology which are covered by separate documentation) summarising business risks, requirements (IEC, BAP), effects assessment, and scope of work for future years. Below is a summary of the current scope of each programme adjusted based on monitoring results to date. 8.1 Red Data Book Birds
The objectives of local monitoring of rare and protected bird species at the operation stage of production facilities include: assessment of the protected bird species populations status and their habitats within the areas important for protected bird species conservation; and assessment of the existing impact on the protected bird species and, if required, development of recommendations and corrective measures aimed to eliminate such impact.
Post-construction monitoring commenced 2008. Current monitoring scope (2012-2014) consists of:
Chaivo: (covering wetlands, lagoon and the sea shore): Monitoring conducted annually in the 2 km pipeline ROW corridor, as well as along the whole bar, at the sea shore and in the adjacent areas of the Chaivo Lagoon.
OPF: Continue monitoring at OPF area in 2012 in 4 km range. If no concerns are revealed OPF area will be monitored once every three years after 2012
Pipeline route. Areas of concern will be monitored in 2012 (No. 2 and No. 3). If no adverse impacts are identified, monitoring may be performed once in 3 years.
BS-2: Based on the results of 3-year monitoring cycle a decision will be made regarding further continuation of monitoring in 2014.
LNG/OET: Monitor in 2013 in 4 km range, and continue once every three years.
Survey scope includes:
description of environmental conditions, landscape characteristics and the status of ornithological complexes, identification of human-induced factors at the territory adjacent to the production facilities;
mapping of rare and protected species’ encounters, collection of initial data on species and gender attributes, density, behaviour and character of territory use;
identification of nests and nesting sites, the most important feeding and accumulation areas within the area of potential impact;
creation and keeping of the geo-information database on protected bird species;
survey of the key sites important in terms of protected species’ nesting, census of nesting couples, reproduction progress assessment;
identification of the population status and of regular changes in the number of rare and protected bird species in different habitats;
performance of comparative analysis based on the results obtained in the course of baseline surveys and monitoring at the construction stage, aimed to identify changes and to assess existing impact on the avifauna;
in the case of identification of negative changes, development of recommendation and measures aimed to mitigate the impact and to preserve the protected species population.
In addition at Platforms and OPF, cases of bird mortality shall be logged and the species identified. 8.2 Steller’s Sea Eagle Monitoring is undertaken to study the Steller’s sea eagle and white-tailed eagle population status in the north-eastern part of Sakhalin Island, and to develop measures for mitigation of impact on eagle populations during the operation of production facilities. The monitoring programme commenced in 2004 and includes the following scope:
2 A voluntary program to monitor Taimen in a typical river basin crossed by the right of way was carried out in 2011. This programme formed part of the BAP (but not the HSESAP or EMP) and is described in a strategy report. However, it is not included in this HSEMO as the future scope and/or continuation of the program is currently under review. If continued, the program will form part of future revisions of this HSEMO.

HSE Monitoring and Reporting Standard Rev 04
UNCLASSIFIED Document 0000-S-90-04-O-0009-00-E Appendix 6 Revision 04 Printed copy uncontrolled p6 of 19
assessment of the current abundance level of Steller’s sea eagles and white-tailed eagles in the north-eastern part of the Sakhalin island;
mapping of nests and nesting sites and analysing the status of eagle habitats;
identification of the main natural and human-induced factors having influence upon eagle populations stability including assessment of impact posed by bears;
development of measures for mitigation of impact on eagles in the north-eastern part of Sakhalin during the operation of production facilities;
studying of migrations and spatial connections of eagles by chicks labelling with the use of standard radio transmitters;
comparison of eagles’ reproduction performance indicators in the impact zone and control zone and assessment of impact posed by production facilities on the eagle population during the nesting period; and
conducting of comparative analysis using results obtained in different years and identification of trends in changes of population biological characteristics.
The current survey scope (2012-2014) includes sites located within the two-kilometre zone along the pipeline route, sites adjacent to the OPF within a radius of four kilometres, and a control site at Lunskiy Bay. The monitoring conducted annually in the late nesting period (July-August). 8.3 Mammals
In accordance with the EMP small mammals are considered as indicators of cumulative negative impact on environment in the vicinity of operation sites, due to having a rapid response to any environmental changes. The main goal of this program is to assess cumulative negative changes in environment in the vicinity of operation sites on the basis of monitoring of small mammal communities within permanent sampling areas, and monitoring of condition of indicator species of small mammals. Programme shall be implemented annually for first 5 years of operations, thereafter periodicity may extend to once in 3, depending on findings during first 5 years.
Scope of the programme (2008-2013) is as follows:
For communities of small mammals: species structure of community (individual share of species); relative abundance of species; and parameters of species diversity.
For indicator species of small mammals: abundance; morphological and physiological parameters (weight, body size, tail length, ear height, foot length, head length, testicles size); and demographic parameters (sex and age structure; share of this year’s brood, share of reproductive males, share of pregnant females, quantity of embryos, quantity of resorbing embryos).
Locations: OPF and LNG/OET - 3 control and 3 testing sites, and BS2 – 2 control and 2 testing sites.
8.4 Vegetation
The overall goal of the Vegetation monitoring programme is timely identification of onshore assets negative impact on the environment by studying the condition and dynamics of vegetation and flora at control sites along the pipeline route as well as near LNG Plant and Oil Export terminal (LNG/OET) and Onshore Processing Facility (OPF). The programme was implemented from 2009. The current programme scope 2012-2014 is described below.
Location Scope Parameters
LNG/OET
Monitoring of vegetation and protected species Annually:
21 plots;
localities of protected species;
chemical parameters if chloroses, necroses or defoliation are recorded
General Flora:
Woody layer (composition, density, height, diameter, growth class, revegetation, age, etc.),
shrub layer (degree of homogeneity, composition, abundance of species, height, condition etc.),
herbaceous layer (herbage composition, projective covering, abundance of species, condition etc.),
moss-lichen layer (appearance, distribution on site, characteristic by

HSE Monitoring and Reporting Standard Rev 04
UNCLASSIFIED Document 0000-S-90-04-O-0009-00-E Appendix 6 Revision 04 Printed copy uncontrolled p7 of 19
Location Scope Parameters
groups etc.),
extra-layer vegetation (abundance of species, height, vitality),
calculation of all trees at sampling area by the status categories, availability and intensity of chlorosis, necrosis, parasitic affection and defoliation development, wood resources, floristic contrast factor
Biogeochemical parameters (to be determined only when chlorosis, necrosis or defoliation development is detected)
Content of chemical elements (S, Cu, Pb, Zn, Cd, Cr, Hg) in accumulator plants, concentration exceeding rate of chemical elements over background data, parameters of total pollution
Protected Species as above, additional:
Habitat (location and description),
abundance and age structure of cenopopulations,
density of cenopopulations (number of specimen per unit of area),
horizontal structure of cenopopulation (random, regular, group),
change of distribution upon the territory, sizes, mean number of vegetative and generative bines, vitality, method and success of reproduction.
Inside Onshore Pipeline RoW
12 plots out of 105 plots situated within the ROW will be monitored annually for quality of restoration of vegetation cover. When the restoration of vegetation cover will reach 80% such areas will be excluded from monitoring scope and the focus will be on the areas with slower restoration progress.
Woody layer condition (composition, density, height, diameter, growth class, revegetation, age, etc.),
Shrub layer condition (degree of homogeneity, composition, abundance of species, height, condition, etc.)
Grass-shrub layer condition (composition, projective covering, abundance of species, condition, productivity etc.)
Moss-lichen layer condition (appearance, distribution on site, characteristic by groups etc.)
Extra-layer vegetation condition (abundance of species, height, vitality)
Calculation of all trees at a sampling area by categories of condition
Incidence and intensity of chlorosis, necrosis, parasitic infection and defoliation
Wood resources and grass-stand productivity
Floristic contrast factor
Along Onshore Pipeline Footprint
Monitoring of vegetation at the 93 permanent plots (out of 105 plots) in 2014 and once every three years thereafter (in line with the EMP)
Along Onshore Pipeline Footprint (Protected Species)
Monitoring of protected species at the 18 permanent plots and in prescribed localities along the pipeline route, annually (in line with the EMP) (Appendix 6).
If new localities of protected species are identified then they will be included in the monitoring scope
Habitat (coordinates, location and description)
Abundance and ages of cenopopulations
Changes in distribution
Condition of vegetation
In the OPF footprint
Monitor vegetation at 12 permanent plots once every 2 years (even years) extending to the west, north, east, and south from the OPF.
Monitor protected species (9 plots) on an annual basis.
In 2012 and 2014 the focus shall be put also on the
General Flora:
Habitat type (including relief, altitude, soil conditions),
Predominant vegetation (including, where appropriate, specification of each subordinate layer, coverage, average height of plants, list of species (Latin names) and abundance
Status of chlorosis, necrosis, parasitic disease, defoliation. Where these are detected, then measurements of S, Cu, Pb, Zn, Cd, Cr, Hg concentrations in healthy and unhealthy accumulator plants.
Rare and Protected Flora:

HSE Monitoring and Reporting Standard Rev 04
UNCLASSIFIED Document 0000-S-90-04-O-0009-00-E Appendix 6 Revision 04 Printed copy uncontrolled p8 of 19
Location Scope Parameters
areas (16 plots out of 37 established in 2006) to the
west and east of OPF footprint.
Habitat location and description
Abundance and age structure of cenopopulations
Density of cenopopulations
Lateral structure of cenopopulations
Change of distribution within plot
Sizes, mean number of vegetative and generative bines
Plant condition
Method and success of reproduction.
Aerial surveys are undertaken in accordance with the Soil and Groundwater Operational Controls specification, and site-specific surveys are directed as required according to the results of the aerial surveys. Where aerial surveys indicate that closer inspections are required (e.g. vegetation disturbance), site-specific surveys are directed to those areas. During site specific surveys, observations are made of the following:
Forest fires and effects
Condition of floodplain forests and forests along rivers and streams
Change of structure and composition of vegetation communities
Presence and size of windfall
Presence and size of water-logged areas
Recovery of vegetation in disturbed areas
Presence of alien plants within disturbed areas; condition of the populations of rare and protected plants where possible
8.5 Wetlands
The main goals of the Wetands Monitoring Programme are to monitor the processes of wetland recovering within ROW and in adjacent areas; assess potential negative impact on wetlands generated by the construction and operation of pipelines; and develop mitigation measures if necessary. To achieve the listed goals, the Programme is focusing on solving the following tasks: study of vegetation, soil and hydrological regime at the transects and plots; carry out analyses of soil and water samples; compare new data with the results obtained in previous years, and analyze changes in flora, vegetation, soil cover and hydrological regime of wetlands if any; analyze wetland recovery on and adjacent to the onshore pipeline right of way; if required, advise on additional mitigation measures required to facilitate wetland recovery.
The programme was implemented from 2008. The recognized lengthy recovery period for wetlands is expected to necessitate long term monitoring. For locations that have demonstrated a positive recovery trend based on 2008-2012 data, the ongoing annual change can be expected to be minimal. On this basis, a practicable monitoring frequency should be established for the long term.
The current programme scope includes monitoring of vegetation and soil (145 plots, 30 transects) in 2012. For 2013-2014, identify plots with positive recovery trend of natural vegetation (steady progress towards the eventual 80% target) and reduce monitoring frequency for those plots to once per two years. As soon as the trend of natural vegetation on the controlled plots reaches 80%, attention will be focused on the wetlands areas with slower restoration progress.
Monitoring parameters include:
Hydrology: pH, electroconductivity and redox potential.
Soil: Morphological description of soil column from a borehole. Sampling of peat, organic and mineral horizons for further determination of their composition and physical and chemical characteristics; pH of water solution, pH of salt solution, Water content, Hydrolytical acidity, (Ca2+) content, (Mg2+) content, Total N, Total P, Total K, Degree of organic decomposition (for peat soils only), Grain size analysis (for mineral soils only).
Vegetation Descriptions:
o for a tree layer – timber stock, sum of tree-trunk cross-sections, species composition, canopy density, number of trees, average height, diameter and age, density of tree regeneration etc.;
o for a shrub layer – general coverage, species composition, abundance of species, height, etc.;
o for a herb-shrublet layer – general coverage, species composition, abundance of species, height, etc.;

HSE Monitoring and Reporting Standard Rev 04
UNCLASSIFIED Document 0000-S-90-04-O-0009-00-E Appendix 6 Revision 04 Printed copy uncontrolled p9 of 19
o for a moss-lichen layer – general coverage, abundance of species groups, height, etc.
A ‘pilot study’ of an additional 10 sites will be conducted in 2012 to assess the need for additional sites to be monitored in the future
8.6 River Hydrology
Post construction monitoring of rivers commenced in 2009. The list of rivers to be monitored is revised
annually in accordance with the current situation (excluding stable rivers, including rivers that cause concern in
relation to RoW impact or potential impact on the pipeline).
Potential impact of production facilities on the waterways may cause the following consequences:
deterioration of water quality: contamination with hydrocarbons, increased content of suspended and dissolved mineral and biogenic substances entering water bodies as a result of erosion progressing;
siltation of bottom sediments and spawning grounds due to erosion progressing;
re-location of the riverbeds, which, may affect the integrity of engineering structures Note that along with anthropogenic impact on a water body, there is some influence caused by natural factors. Watercourses are selected taking into account on-site surveys, including at least 10% of watercourses related to Group II-III classification. Also, inclusion of the watercourses in the monitoring programme is based on the following criteria:
Carrying out of repair and restoration activities affecting the channel itself or banks of the watercourses, as well as repair of bank protection structures;
Identification of major deformation of the banks or a channel in the course of visual inspections (by the representatives of the Contractor-pipelines operator, Sakhalin Energy representatives-Pipelines Operation Manager, Environmental Specialists, Hydrologists, Geologists, etc., helicopter observations);
Identification of major deformation of the banks or a channel in the course of remote sensing methods implementation (satellite images of high resolution), instrumental control (topographic survey), etc.;
Identification of channel deformations upstream the crossing, which could result in significant changing of hydrological or hydro-chemical parameters in the crossing site;
Identification of chemicals or oil spills within the water protection zone, identification of the areas of major washout of silt directly to a watercourse in the crossing site or 50 m upstream the crossing site.
The scope of the Programme is as follows:
general description of watercourses’ hydro-morphology;
water sampling for chemical testing;
bottom sediments sampling for chemical testing;
measurement of hydrological parameters (depth, width, flow velocity, and water flow rate);
analysis of the obtained data;
water quality assessment based on the obtained data;
creation of information database;
field work in the watercourses (quantity and names of rivers will change depending on the results of monitoring work performed during the year preceding the projected one; plans of repair work; visual observations by Pipeline Line Operators and other observations of water bodies);
installation or replacement of network reference points (marks) in cross-sections;
collection, analysis and summarizing of archive information; and laboratory processing of samples collected.
Monitoring parameters and frequency are as follows:
Watercourses in the pipelines influence area. Here, either full monitoring programme 1 or reduced monitoring programme 2 are conducted depending on the spawning grounds downstream of the pipeline crossing, as well as on erosion hazard. Monitoring programme 1 (full) covers watercourses with spawning grounds of more than 30.000 m2 area downstream the pipeline crossing and watercourses with active stream erosion. Monitoring programme 2 (reduced) covers watercourses with spawning grounds of the area ranging from 10.000 to 30.000 m2 downstream the pipeline crossing and watercourses with active stream erosion. During monitoring of the pipeline influence area sampling will
HSE Monitoring and Reporting Standard Rev 04
UNCLASSIFIED Document 0000-S-90-04-O-0009-00-E Appendix 6 Revision 04 Printed copy uncontrolled p10 of 19
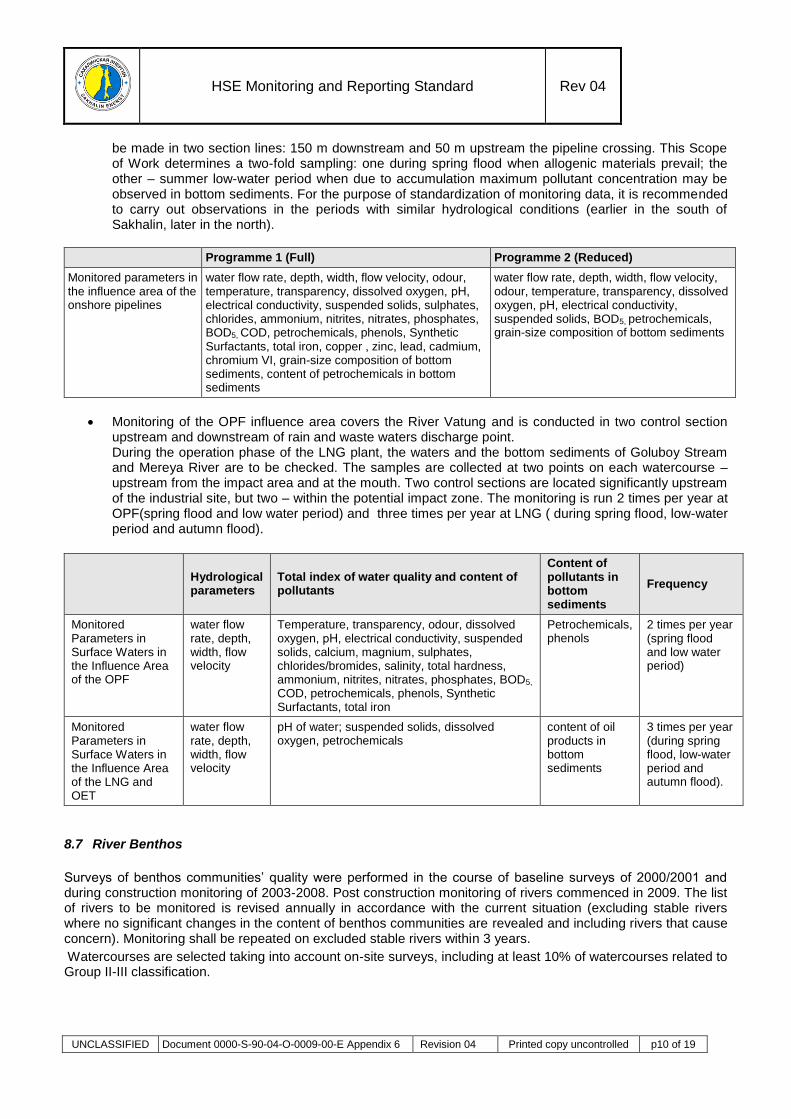
be made in two section lines: 150 m downstream and 50 m upstream the pipeline crossing. This Scope of Work determines a two-fold sampling: one during spring flood when allogenic materials prevail; the other – summer low-water period when due to accumulation maximum pollutant concentration may be observed in bottom sediments. For the purpose of standardization of monitoring data, it is recommended to carry out observations in the periods with similar hydrological conditions (earlier in the south of Sakhalin, later in the north).
Programme 1 (Full) Programme 2 (Reduced)
Monitored parameters in the influence area of the onshore pipelines
water flow rate, depth, width, flow velocity, odour, temperature, transparency, dissolved oxygen, рН, electrical conductivity, suspended solids, sulphates, chlorides, ammonium, nitrites, nitrates, phosphates, BOD5, COD, petrochemicals, phenols, Synthetic Surfactants, total iron, copper , zinc, lead, cadmium, chromium VI, grain-size composition of bottom sediments, content of petrochemicals in bottom sediments
water flow rate, depth, width, flow velocity, odour, temperature, transparency, dissolved oxygen, рН, electrical conductivity, suspended solids, BOD5, petrochemicals, grain-size composition of bottom sediments
Monitoring of the OPF influence area covers the River Vatung and is conducted in two control section upstream and downstream of rain and waste waters discharge point. During the operation phase of the LNG plant, the waters and the bottom sediments of Goluboy Stream and Mereya River are to be checked. The samples are collected at two points on each watercourse – upstream from the impact area and at the mouth. Two control sections are located significantly upstream of the industrial site, but two – within the potential impact zone. The monitoring is run 2 times per year at OPF(spring flood and low water period) and three times per year at LNG ( during spring flood, low-water period and autumn flood).
Hydrological parameters
Total index of water quality and content of pollutants
Content of pollutants in bottom sediments
Frequency
Monitored Parameters in Surface Waters in the Influence Area of the OPF
water flow rate, depth, width, flow velocity
Temperature, transparency, odour, dissolved oxygen, рН, electrical conductivity, suspended solids, calcium, magnium, sulphates, chlorides/bromides, salinity, total hardness, ammonium, nitrites, nitrates, phosphates, BOD5,
COD, petrochemicals, phenols, Synthetic Surfactants, total iron
Petrochemicals, phenols
2 times per year (spring flood and low water period)
Monitored Parameters in Surface Waters in the Influence Area of the LNG and OET
water flow rate, depth, width, flow velocity
pH of water; suspended solids, dissolved oxygen, petrochemicals
content of oil products in bottom sediments
3 times per year (during spring flood, low-water period and autumn flood).
8.7 River Benthos
Surveys of benthos communities’ quality were performed in the course of baseline surveys of 2000/2001 and during construction monitoring of 2003-2008. Post construction monitoring of rivers commenced in 2009. The list of rivers to be monitored is revised annually in accordance with the current situation (excluding stable rivers where no significant changes in the content of benthos communities are revealed and including rivers that cause concern). Monitoring shall be repeated on excluded stable rivers within 3 years.
Watercourses are selected taking into account on-site surveys, including at least 10% of watercourses related to Group II-III classification.

HSE Monitoring and Reporting Standard Rev 04
UNCLASSIFIED Document 0000-S-90-04-O-0009-00-E Appendix 6 Revision 04 Printed copy uncontrolled p11 of 19
The scope of the Programme is as follows:
general description of hydrological and morphological parameters of the watercourses;
description of biotopes on the control sections;
benthos sampling;
assessment of the size and biomass of species;
creating a monitoring database;
reporting of analysis of data;
field work in selected rivers;
collection, analysis and summary of archived data;
laboratory analyses of collected samples;
office studies and analyses of monitoring data.
Monitoring parameters and frequency are as follows:
During monitoring of the pipeline influence area sampling should be made in two control sections: 150 m downstream and 50 m upstream of the pipeline crossing. This Scope of Work should determine a two-fold sampling: during summer low-water period and autumn flood. For the purpose of standardization of monitoring data, observations should be carried out in the periods with similar hydrological conditions (earlier in the south of Sakhalin, later in the north).
Monitoring of the OPF influence area should cover the River Vatung and should be conducted in two control sections upstream and downstream of rain and waste waters discharge point. Work should be conducted during summer low-water period and autumn flood.
During the operation phase of the LNG, the water of Goluboy Stream and Mereya River should be controlled. The material should be gathered at the same points where monitoring was done during the construction phase. Control points of zoobenthos should be located in the downstream flow and upstream flow of Goluboy Stream, and also at the mouth of Mereya River at the same points where hydrological and hydro-chemical observations were carried out: Goluboy Stream and Mereya River. During biological monitoring in the proximity of and at the territory of LNG plant, the biological observations should be carried out 2 times a year in the course of implementation of local environmental monitoring program (low-water period and autumn flood).
Monitoring of macro-zoobenthos shall consist of the parameters accepted by the Unified National System of Environmental Monitoring and Control (GOST 17.1.3.07-82): total population, spcs./m2; total biomass, g/m2; total number of species; number of groups according to the standard (Exhibit 3 of the said GOST standard); number of species in a group; biomass of main groups, g/m2; population of main groups, spcs./m2; dominant species – indicators of saprobity (name of species, % of total mass, saprobity).
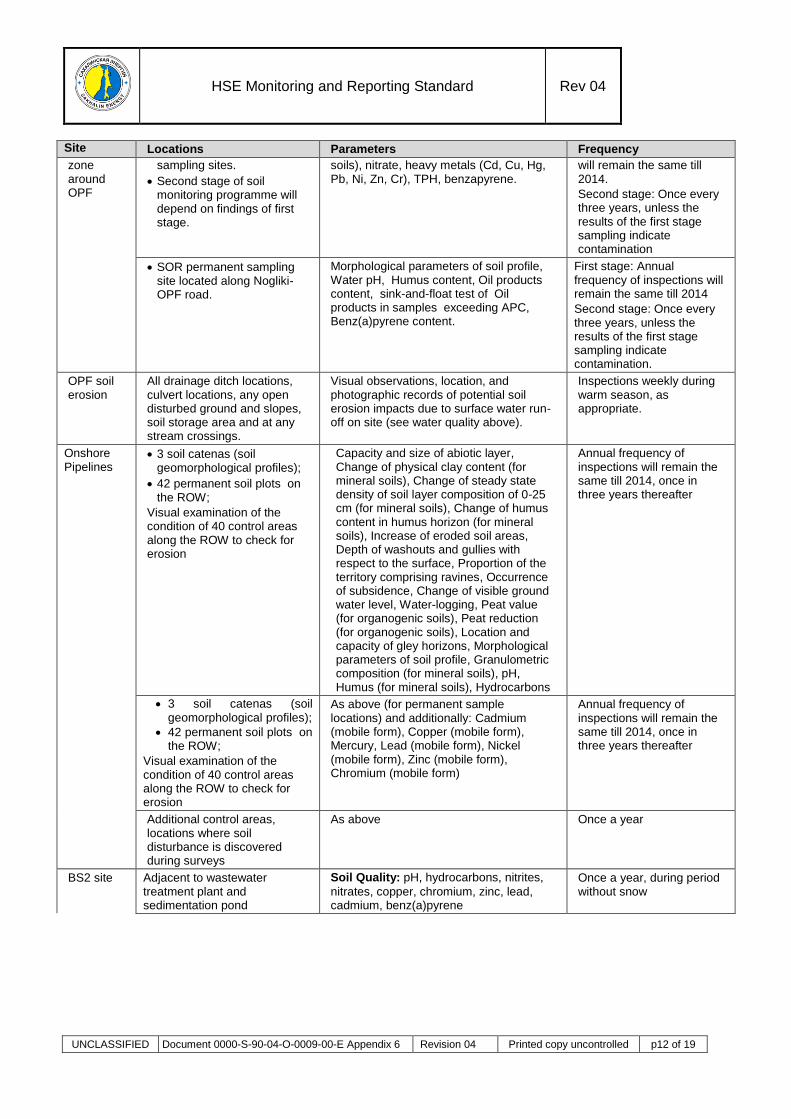
8.8 Soils The current scope of the soils monitoring programme is as follows. Site Locations Parameters Frequency
OPF inside boundary
Areas not occupied by buildings or flooring
Visual observations, location, and photographic records:
Spillage of process liquids on surface soils (location, area, penetration depth)
Mechanical breaches of surface soils (location and area)
Near the waste collection sites
Near the fuel storage tanks
Near the temporary treatment facilities
Near the snow disposal areas
If visual inspection will indentify envinronmental incident (like spillage) than taking sample and make analysys including: pH, hydrocarbons, nitrite, nitrate, ethylene glycol, copper, chrome, zinc, lead, cadmium
Once per year
Potential impact
First stage of soil monitoring programme includes 16
Morphological parameters of soil profile, pH, granulometric composition (mineral
First stage: Annual frequency of inspections
HSE Monitoring and Reporting Standard Rev 04
UNCLASSIFIED Document 0000-S-90-04-O-0009-00-E Appendix 6 Revision 04 Printed copy uncontrolled p12 of 19
Site Locations Parameters Frequency
zone around OPF
sampling sites.
Second stage of soil monitoring programme will depend on findings of first stage.
soils), nitrate, heavy metals (Cd, Cu, Hg, Pb, Ni, Zn, Cr), TPH, benzapyrene.
will remain the same till 2014.
Second stage: Once every three years, unless the results of the first stage sampling indicate contamination
SOR permanent sampling site located along Nogliki-OPF road.
Morphological parameters of soil profile, Water pH, Humus content, Oil products content, sink-and-float test of Oil products in samples exceeding APC, Benz(a)pyrene content.
First stage: Annual frequency of inspections will remain the same till 2014
Second stage: Once every three years, unless the results of the first stage sampling indicate contamination.
OPF soil erosion
All drainage ditch locations, culvert locations, any open disturbed ground and slopes, soil storage area and at any stream crossings.
Visual observations, location, and photographic records of potential soil erosion impacts due to surface water run-off on site (see water quality above).
Inspections weekly during warm season, as appropriate.
Onshore Pipelines
3 soil catenas (soil geomorphological profiles);
42 permanent soil plots on the ROW;
Visual examination of the condition of 40 control areas along the ROW to check for erosion
Capacity and size of abiotic layer, Change of physical clay content (for mineral soils), Change of steady state density of soil layer composition of 0-25 cm (for mineral soils), Change of humus content in humus horizon (for mineral soils), Increase of eroded soil areas, Depth of washouts and gullies with respect to the surface, Proportion of the territory comprising ravines, Occurrence of subsidence, Change of visible ground water level, Water-logging, Peat value (for organogenic soils), Peat reduction (for organogenic soils), Location and capacity of gley horizons, Morphological parameters of soil profile, Granulometric composition (for mineral soils), pH, Humus (for mineral soils), Hydrocarbons
Annual frequency of inspections will remain the same till 2014, once in three years thereafter
3 soil catenas (soil geomorphological profiles);
42 permanent soil plots on the ROW;
Visual examination of the condition of 40 control areas along the ROW to check for erosion
As above (for permanent sample locations) and additionally: Cadmium (mobile form), Copper (mobile form), Mercury, Lead (mobile form), Nickel (mobile form), Zinc (mobile form), Chromium (mobile form)
Annual frequency of inspections will remain the same till 2014, once in three years thereafter
Additional control areas, locations where soil disturbance is discovered during surveys
As above Once a year
BS2 site Adjacent to wastewater treatment plant and sedimentation pond
Soil Quality: pH, hydrocarbons, nitrites,
nitrates, copper, chromium, zinc, lead, cadmium, benz(a)pyrene
Once a year, during period without snow
HSE Monitoring and Reporting Standard Rev 04
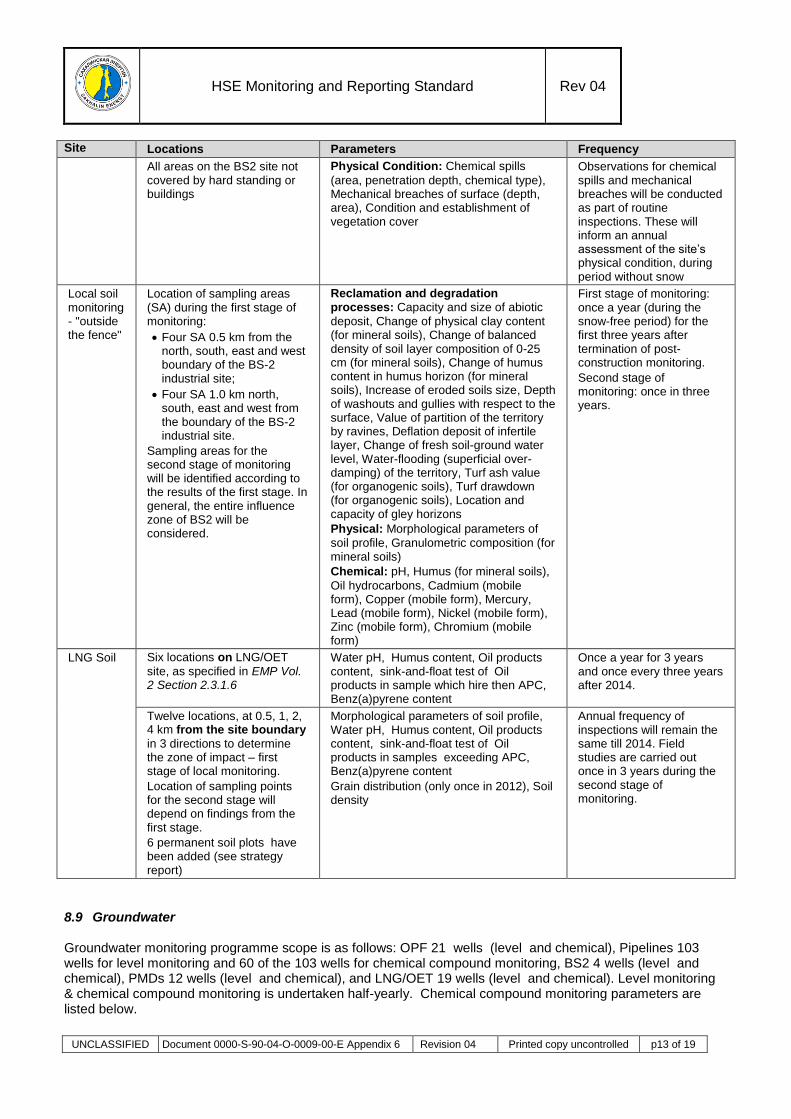
UNCLASSIFIED Document 0000-S-90-04-O-0009-00-E Appendix 6 Revision 04 Printed copy uncontrolled p13 of 19
Site Locations Parameters Frequency
All areas on the BS2 site not covered by hard standing or buildings
Physical Condition: Chemical spills
(area, penetration depth, chemical type), Mechanical breaches of surface (depth, area), Condition and establishment of vegetation cover
Observations for chemical spills and mechanical breaches will be conducted as part of routine inspections. These will inform an annual assessment of the site’s physical condition, during period without snow
Local soil monitoring - "outside the fence"
Location of sampling areas (SA) during the first stage of monitoring:
Four SA 0.5 km from the north, south, east and west boundary of the BS-2 industrial site;
Four SA 1.0 km north, south, east and west from the boundary of the BS-2 industrial site.
Sampling areas for the second stage of monitoring will be identified according to the results of the first stage. In general, the entire influence zone of BS2 will be considered.
Reclamation and degradation processes: Capacity and size of abiotic
deposit, Change of physical clay content (for mineral soils), Change of balanced density of soil layer composition of 0-25 cm (for mineral soils), Change of humus content in humus horizon (for mineral soils), Increase of eroded soils size, Depth of washouts and gullies with respect to the surface, Value of partition of the territory by ravines, Deflation deposit of infertile layer, Change of fresh soil-ground water level, Water-flooding (superficial over-damping) of the territory, Turf ash value (for organogenic soils), Turf drawdown (for organogenic soils), Location and capacity of gley horizons
Physical: Morphological parameters of
soil profile, Granulometric composition (for mineral soils)
Chemical: pH, Humus (for mineral soils),
Oil hydrocarbons, Cadmium (mobile form), Copper (mobile form), Mercury, Lead (mobile form), Nickel (mobile form), Zinc (mobile form), Chromium (mobile form)
First stage of monitoring: once a year (during the snow-free period) for the first three years after termination of post-construction monitoring.
Second stage of monitoring: once in three years.
LNG Soil Six locations on LNG/OET
site, as specified in EMP Vol. 2 Section 2.3.1.6
Water pH, Humus content, Oil products content, sink-and-float test of Oil products in sample which hire then APC, Benz(a)pyrene content
Once a year for 3 years and once every three years after 2014.
Twelve locations, at 0.5, 1, 2, 4 km from the site boundary
in 3 directions to determine the zone of impact – first stage of local monitoring.
Location of sampling points for the second stage will depend on findings from the first stage.
6 permanent soil plots have been added (see strategy report)
Morphological parameters of soil profile, Water pH, Humus content, Oil products content, sink-and-float test of Oil products in samples exceeding APC, Benz(a)pyrene content
Grain distribution (only once in 2012), Soil density
Annual frequency of inspections will remain the same till 2014. Field studies are carried out once in 3 years during the second stage of monitoring.
8.9 Groundwater Groundwater monitoring programme scope is as follows: OPF 21 wells (level and chemical), Pipelines 103 wells for level monitoring and 60 of the 103 wells for chemical compound monitoring, BS2 4 wells (level and chemical), PMDs 12 wells (level and chemical), and LNG/OET 19 wells (level and chemical). Level monitoring & chemical compound monitoring is undertaken half-yearly. Chemical compound monitoring parameters are listed below.

HSE Monitoring and Reporting Standard Rev 04
UNCLASSIFIED Document 0000-S-90-04-O-0009-00-E Appendix 6 Revision 04 Printed copy uncontrolled p14 of 19
Controled chemical index Assets
RoW Pipeline
LNG&OET OPF BS-2 PMD
pH + + + + +
Possible polutant (Oil products) + + + + +
Possible polutant (Synthetic surfactants) – + + + +
Possible polutant (Phenols) – + + + –
Possible polutant (Formaldehyde) – + + – –
Possible polutant (Toluene) – + + – –
Possible polutant (Ethylbenzene) – + + – –
Possible polutant (Benzol) – + + – –
Possible polutant (Xylol) – + + – –
Possible polutant (sulfolane) – + – – –
Possible polutant (Diisopropylamine) – + – – –
Possible polutant (monoethyleneglycol) – + + – –
Possible polutant (Phosphate) – + + – +
BOD – + + + +
COD – + – – –
Organoleptical properties + + + + +
Coliform index – + + + +
Suspended material – – +
Note: 1) All PMD included which have biological treatment station (Nogliki, Yasnoye, Sovetskoye). 2) Parameters will be specified based on location of wells. 3) Planned parameters can be changed based on risk assessment and previous monitoring results.
Re-injection wells:
At the platforms all produced water is re-injected into the production reservoirs.
At OPF produced/process waters are discharged to dedicated injection wells. Monitored parameters are: suspended solids, pH, phenols, H2S, oil products, MEG, Total Fe, Methanol, mineralization, dissolved oxygen.
8.10 Geology and RoW Inspections The following tables summarise inspection and monitoring programmes relating to geology and exogenous processes. In addition to the on-site inspection and monitoring programmes identified below, satellite remote sensing is also applied.
Location Parameters Frequency
Geology Onshore Pipelines
Locations approved by RF MNR in EMP Vol. 3, Appendix 7, Table 2: 27
locations for monitoring landslides, mudflows, erosion, and avalanches along the onshore pipelines route
Landslides:
Microtopography (morphological features) of the landslide slope
Fractures in breaks (indicators of a landslide process)
Quantity, shape and sizes of emerging fractures, both at landslide body and the slope not affected by the landslide process
Vegetation and its condition at areas with high landslide risk
Twice a year in periods without snow
As soon as practicable after snowmelt
As soon as practicable after heavy rainfall
Mudflows:
Quantity and frequency of mudflows
Volumes and range of mudflow masses
Composition and shape of mudflow formations
After mudflows identified during surveys of the pipeline, as defined in Onshore Pipelines Right of Way Specification 1000-S-90-04-O-0004-00-E Appendix 5.
Avalanches:
Effect of avalanches
After snowmelt

HSE Monitoring and Reporting Standard Rev 04
UNCLASSIFIED Document 0000-S-90-04-O-0009-00-E Appendix 6 Revision 04 Printed copy uncontrolled p15 of 19
Location Parameters Frequency
Erosion:
Quantity of emerging washouts (pc. / unit of surface length)
Dimensions (length, depth and width) of washouts / gullies formed (m)
Morphological features of washouts (tortuosity, degree of washout's bifurcation)
Subsidence:
Elevation, location and volume of subsidence
on rivers with “medium” and “high” geological
risk
Twice a year in periods without snow
As soon as practicable after snowmelt
As soon as practicable after heavy rainfall
Freeze-Thaw Processes:
Elevation, location and size of frost mounds and thermokarst funnels
Twice a year in periods without snow
0.5-1.5 weeks after snowmelt
At the end of summer
Soil and Vegetation Industrial Environmental Control
The entire right of way Process liquids spills (length, depth, if necessary pollutants content)
Checks will be made by personnel whenever on pipeline right of way for routine maintenance activities
Hydrological processes Industrial Environmental Control
Locations approved by RF MNR in EMP Vol. 3, Appendix 7, Table 1: 236 locations for pipeline crossing of waterbodies
The morphology of submerged river crossings shall be visually inspected. Characteristics of any deformations, including depth and displacement of the banks, shall be determined
Ground-based inspections shall be conducted at least once every 10 years. Fly-over inspections shall be conducted as defined in Onshore Pipelines Right of Way Specification.
Groundwater conditions (length, width, and depth) at swamp and valley crossings shall be monitored
Twice a year: after the snow cover melts and at the end of summer. Fly-over inspections shall be conducted as defined in Onshore Pipelines Right of Way Specification.
Where groundwater seepage occurs along the pipeline over rough terrain (e.g. hillsides and gullies), the length, width, and area of the seep shall be monitored
Twice a year: after the snow cover melts and after heavy rainfall
All pipeline inspections shall also check for oil leakage
All above inspections

HSE Monitoring and Reporting Standard Rev 04
UNCLASSIFIED Document 0000-S-90-04-O-0009-00-E Appendix 6 Revision 04 Printed copy uncontrolled p16 of 19
Location Parameters Frequency
Landscape ecological and geological monitoring
At locations approved by RF MNR in EMP Vol. 3 Section 3.12.3.2, and in EMP Vol. 3 Table 3.12.3, at least 100m on both sides of the entire right-of-way.
Particular attention will be given to:
Eight areas in Makarov district where potential for landslides is high, and to
Fourteen areas of rivers in the Dolinskiy, Makarovskiy, Poronayskiy, Smirnykhovskiy, Tymovskiy and Noglikskiy districts, where active meandering, more intensive washout of the floodplain, and movement of the riverbed towards the pipeline right-of-way is possible
Observations of:
Exogenous processes on the banks of watercourses being crossed
Condition of vegetation on the banks of watercourses being crossed
Exogenous processes on slopes directed towards the pipeline route, including the condition of retaining walls
Condition of vegetation in the pipeline right-of-way
Condition of vegetation and soil at remediation sites (until complete recovery has occurred)
Visual condition of forests along the pipeline route
Visual condition of forests along the industrial access roads
Determination of swamping processes (presence of open water or sheens from water surface in forestlands)
Boundaries of exogenous processes along the pipeline route and along access roads
Qualitative assessment of exogenous processes
Snow cover along the pipeline route and on the slopes directed towards the pipeline route (only during special, additional works in winter)
Aero-visual surveys are carried out
at least twice a year:
During spring (middle – end of May) – after snow cover is thawed and snow flood is passed
During pre-winter period (middle – end of October)
MOF beach areas
Pipeline Landfall LNG/OET
Monitoring of seashore and cliffs morpho-dynamics by photo and video survey including spatial location, beach width and profile.
Geodetic and topographic surveys of the landfall profile
Composition and properties of beach deposits are monitored only when warranted by effects.
Routine inspections – monthly (where required by Water Use Decisions).
Full assessments –once a year during the snow-free period
Gully and erosion processes on the slopes of watercourses –Goluboy Stream, Mereya River
Visual observations for erosion processes during surveys. Should erosion be identified, the following parameters will be recorded:
quantity of occurring scours
size: length, width, depth
morphologic features of scours and gullies - sinuosity, thalweg inclination angle
Routine inspections – once a month (where required by Water Use Decisions)- Goluboy stream.
Full assessments –once a year during the snow-free period – Mereya River
8.11 Offshore The objective of the Offshore monitoring program is to monitor potential impact from operation activities on local
marine ecosystem and timely identification of any environmental effects at the area of offshore production
units/Assets.
The Offshore Environmental Monitoring Programme does not include monitoring or control of risks to the
Western Gray Whale or other marine mammals. Those items are covered by the Sakhalin Energy Marine
Mammals Specification (Document 0000-S-90-04-O-0259-00-E Appendix 6).

HSE Monitoring and Reporting Standard Rev 04
UNCLASSIFIED Document 0000-S-90-04-O-0009-00-E Appendix 6 Revision 04 Printed copy uncontrolled p17 of 19
Scope of the Programme
The Offshore Environmental Monitoring Programme is conducted once a year from survey vessel and focused
mainly on naturally stable parameters such as sediment physical and chemical characteristics and bottom biota
quality. Hydrology, hydrochemistry and hydrobiology are studied at some locations only due to high dynamic of
water column characteristics.
The Programme consist several sub programmes, which include:
1. Ecological monitoring of post-construction and operation effects (sediment stabilization) along Piltun,
Lunskoye, and Aniva pipelines;
2. Ecological monitoring of post-construction and operation effects around platforms PA-A, PA-B, and LUN-A;
3. Monitoring of the potential impact zone of the LNG loading berth and Oil Export Terminal (OET) in Aniva
Bay;
4. Monitoring of the potential impact zone at LNG and tanker loading unit (TLU) in Aniva Bay;
5. Ecological monitoring of dredging and dumping areas in Aniva Bay.
Location Parameters Sampling Stations Frequency
Subprogram 1: Offshore Pipelines
Piltun-Astokh
Bottom sediment grain size composition,
chemistry (total hydrocarbons, heavy
metals), and
benthos (species /communities
compositions, quantitative characteristics)
35 sampling points Once a year in July for 3 years, thereafter once every 2 or 3 years depends on results
Lunskoye 15 sampling points
Aniva Bay 42 sampling points
Subprogram 2: Offshore Assets
PA-A, PA-B, LUN-A
Bottom sediments: visual observations, grain size, metals content (12 elements), PAH, total hydrocarbons, phenols, surfactants, sediment toxicity, alkenes, benthos diversity, abundance and biomass,
Total of 19 sediment sampling points location at NESW from platform :125, 250, 500, 1000m, and REF 10000m;
Once a year, autumn season during wells construction period
Sea water: visual observations, CTD profile: salinity, temperature, pH, TSS, dissolved oxygen, nutrients (nitrite/-ate, phosphate, silicates), detergents (surfactants), phenols, metals (12 elements), and plankton
Total of 11 water stations including: 8 stations NSEW at 250m, 1000m, 3 REF10000m; SALM of PA-A
LNG/TLU Bottom Sediment: macroscopic description,
odour, grain size, metals content (12 elements), total hydrocarbons, phenols, detergents, organic carbon, aliphatic hydrocarbons, and sediment toxicity, benthos diversity, abundance and biomass
19 stations in total: NESW at 125, 250, 500, 1000, 3 REF stations 2000m E of the TLU
Once a year in September during operation phase
Sea Water: visual observations, odour, CTD profile: salinity, temperature, pH, TSS,dissolved oxygen, nutrients (nitrite/-nitrate,ammonia NH4 phosphate, silicates), detergents, phenols, TPH, metals (12 elements), current direction / velocity, and plankton
LNG/OET Bottom Sediment: macroscopic description, grain size, metals content (9 elements), total hydrocarbons, phenols, detergents, PAH and aliphatic hydrocarbons, toxicity of bottom sediment in case of pollutants increase (5 stations OET section and 2 control points to the west & east of the transects), marine hydrobionts(benthos (micro-zoo & micro-phyto) diversity, abundance and biomass and structure characteristics (size-age structure of common species population))
14 stations in total (7 for LNG & 7 for OET) for seawater and sediments quality analysis (in relation to Aniva Bay effluent outlets)
Once a year in September during operation phase
Sea water: visual observations, depth, current direction, velocity, odor, CTD profile: salinity,

HSE Monitoring and Reporting Standard Rev 04
UNCLASSIFIED Document 0000-S-90-04-O-0009-00-E Appendix 6 Revision 04 Printed copy uncontrolled p18 of 19
Location Parameters Sampling Stations Frequency
temperature, pH, TSS; dissolved oxygen, nutrients (nitrite/-ate, phosphate, silicates, ammonia), detergents, phenols, metals (9 elements), hydrocarbons
Dredging and dumping points in Aniva Bay
Bottom Sediment: grain size, metals content (9 elements) total hydrocarbons, benthos
Scope was canceled and will be continued only in case of new dredging and dumping operations under implementation of MOF expansion Project
Operational Monitoring
Oil spills Entire pipeline Observations for offshore oil sheen / leak
Flights are undertaken in accordance with 0000-S-90-04-O-0255-00-E Appendix 6.
Entire pipeline Flow, pressure, and temperature changes in pipeline monitored by ATMOS leak detection system to determine probability whether leaks are present.
Continuous
Geological Monitoring
Seabed condition near platform
All Platforms: Radial traverses from the platform.
Hydro-acoustic measurements and video of seabed condition
As required
Seabed and sediments - morpho-litho-dynamiс processes
Offshore pipelines in the areas of Piltun-Astokhskoye and Lunskoye fields and in Aniva Bay.
Velocity of large accumulative seabed forms (e.g. sand bars, waves) crossing the pipelines route.
Rate and magnitude of seabed washout along the pipelines route.
Rate and magnitude of coastal accretion or retrogression within the shoreline area related to the pipelines route.
ROV: Once a year, during the ice-free period, July-August
Seabed and seashores - geological processes
Offshore pipelines in the areas of Piltun-Astokhskoye and Lunskoye fields and in Aniva Bay.
Changes in relief of the seabed and, if necessary, the structure and characteristics of bottom sediments;
Spatial position of dune, width and profile of the beach, structure and characteristics of beach deposits.
ROV: Once a year, during the ice-free period, July-August
Littoral monitoring: Once every six months, May and October

HSE Monitoring and Reporting Standard Rev 04
UNCLASSIFIED Document 0000-S-90-04-O-0009-00-E Appendix 6 Revision 04 Printed copy uncontrolled p19 of 19
8.12 Ballast Waters Ballast Water monitoring programme scope is as follows. Topic Locations Parameters Frequency
Ballast water
The ballast water of all ships berthed or in transit
When taking on or discharging ballast water, the dates, geographical locations, ship’s tank(s) and cargo holds, ballast water temperature and salinity as well as the amount of ballast water loaded or discharged shall be logged / recorded
Every ship
Ballast water discharge – Aniva Bay
The ballast water of all ships berthed for loading at the LNG/TLU terminal prior to discharge
Oil in water, Salinity, Colored Dissolved Organic Material (CDOM) , Plankton
Every ship (where technically possible) during April - November
Ballast water effects - marine flora and fauna
Three stations along each of 3 transects extending in southerly directions from the shore at the LNG-OET. Stations located at 5, 15, and 30m isobaths.
Plankton: Species
composition, structure, quantitative characteristics and seasonal changes in phytoplankton and zooplankton, including larval plankton and ichthyoplankton.
Plankton samples are taken every month during period April to November.
Five stations along each of 3 transects extending in southerly directions from the shore at the LNG-OET. Stations located at 3, 5, 10, 15, and 20m isobaths.
(Information from “marine hydrobionts” monitoring around TLU, see above, will provide relevant data near the 30m isobath).
Benthos – general:
composition, structure and quantitative characteristics of benthos communities
Once a year in autumn
Three stations along each of 3 transects extending in southerly directions from the shore at the LNG. Stations located at 3, 5, and 10m isobaths.
Benthos – cysts:
diversity and quantity of microalgae cysts in bottom sediments
Once a year in autumn
One station, located on nearest rocky shore habitat, west of LNG/OET.
Benthos – littoral – rocky shores:
Composition, structure and quantitative characteristics of littoral communities
Once a year in autumn
LNG jetty and MOF underwater facilities. Marine growth - periphyton:
Composition, quantitative characteristics and structure of marine growth communities at berthing facilities in Prigorodnoye Port area.
Twice a year (in spring and autumn) divers to collect marine growth from 0, 1, 3, 6 m depth horizons of LNG jetty leg and west/east sides of MOF.