HPTLC FINGER PRINT ANALYSIS OF PHYTOPHENOLS OF PAEDERIA FOETIDA UNDER DIFFERENT EXTRACTION REGIMEN
8
N Save Nature to Survive 8(2): 603-609, 2013 (Supplement on Medicinal plants) www.thebioscan.in 603 HPTLC FINGER PRINT ANALYSIS OF PHYTOPHENOLS OF PAEDERIA FOETIDA UNDER DIFFERENT EXTRACTION REGIMEN M. R. SENAPATI, P. C. BEHERA*, P. C. BISOI, A. MAITY AND S. C. PARIJA Department of Veterinary Biochemistry, College of Veterinary Science and Animal Husbandry, Orissa University of Agriculture and Technology, Bhubanewswar - 753 003, Odisha, INDIA e-mail: [email protected] INTRODUCTION The scientific world, in recent era of medicine emphasizes on phyto-constituents as lead molecules in development of future generation safe drugs. This is because, large diversity of phytophnols and flavonoids lack adverse effects and possess free radical scavenging activity to reduce risks of cancer, cardiovascular disease, diabetes, inflammation, bacterial disease and ageing related diseases (Kumar and Surh, 2008). Phyto-constituents vary in chemical characteristics, polarities and distribution in the plant matrix (Sultana et al., 2009) and their recovery depends on extraction techniques and the nature/ volume of solvent (Turkmen et al., 2006). Conventional extraction techniques with water as solvent recover less constituent and is time consuming. On the other hand, advanced technique of microwave assisted extraction with polar solvents consumes less time and solvent and claims to extract even thermo-labile constituents also (Mandal et al., 2007). The qualitative and quantitative analysis of phyto- constituents by different methods exhibits the efficacy of the technique and the solvent of extraction (Behera et al., 2012b). High Pressure Thin Layer Chromatography (HPTLC) finger print is a step ahead of such analysis with constitutional details. So, screening of these techniques and solvents on recovery of different phyto-constituents by HPTLC finger print is more suitable than the traditional qualitative and quantitative estimation (Behera et al., 2012a). Water being non-polar solvent fails to extract all active principles and thereby potency of the phyto-constituent suffers to be suppressed. Sometimes, conventional extraction method with water is equally responsible for low potency of herbal formulations. The plants may have some more components to be extracted for better performance. So, there is a need to compare the constituents recovered in different methods and solvents for potency augmentation of phyto-medicines. Paederia foetida (shunk vine) of Rubiaceae family is an aromatic perennial climbing shrub. It is native to eastern Asia and grown in grassy hillsides, forests, river banks, waste grounds, roadsides on fences and urban areas of Assam, Bihar, Bengal and Odisha. It is a well known medicinal shrub for its antibacterial (Senapati et al., 2013a), Cytotoxic (Morshed et al ., 2012), anthelmintic (Dey and Pal, 2011), anti- hyperglycemic (Khan et al., 2011), hepato-protective (Uddin et al., 2011), anti-fungal (Majumdar et al., 2011), anti-ulcer (Reddy et al., 2011), antioxidative (Osman et al., 2009) and anti-diarrhoeal (Afroz et al., 2006) activities in several countries. Indian tribes of Orissa province use aqueous paste of this shrub traditionally for treatment of rheumatoid arthritis, hepatic disorders, piles, diabetes, asthma, coughs, body ache, itches, wounds, stomach-ache, diarrhoea, dysentery, flatulency and toothache. Therefore, the present study aims to screen the phenolic components of Paederia foetida shoot extracted in different groups of solvents following the methods of Cold Percolation (CP) and Microwave Assisted Extraction (MAE) through qualitative, quantitative and HPTLC finger print analysis with an objective to advocate the suitable technique and solvent for better extraction of phyto-constituents. ABSTRACT To detect and estimate the phenolics and flavonoids of Paederia foetida in different solvents under CP, MAE system and by HPTLC finger print analysis. Phenolic components in chlorophyll free extracts in different solvent groups were qualitatively detected by chemical tests and total polyphenols and flavonoids were quantitatively estimated following standard protocol. Distinct chemo-profile of the components was analyzed by HPTLC technique with CAMAG win CATS planar chromatography manager software. Among two methods of extraction more components of polyphenols were detected and significantly higher (p<0.05) contents of phenolics and flavonoids were estimated in MAE method than CP method. Out of five solvent types, organic solvent mixtures recovered significantly higher polyphenols (p<0.05) and flavonoids (p<0.001) in comparison to aqueous solvent. CP Method exhibits 12, 14, 14, 14 and 16 peaks for Gr-A, B, C, D and E solvents respectively. In MAE method the numbers of peaks in these respective solvent groups are 15, 21, 19, 18 and 22. Phyto-chemicals can be better screened qualitatively and estimated quantitatively in organic solvent extracts under MAE system by HPTLC finger print analysis than the aqueous solvent and CP method. Abbreviations: CP: Cold Percolation, MAE: Microwave-Assisted Extraction, R f : Retention factor, HPTLC: High Pressure Thin layer Liquid Chromatography. KEYWORDS Paederia foetida HPTLC finger printing polyphenol Flavonoid Received on : 21.03.2013 Accepted on : 29.05.2013 *Corresponding author
Transcript of HPTLC FINGER PRINT ANALYSIS OF PHYTOPHENOLS OF PAEDERIA FOETIDA UNDER DIFFERENT EXTRACTION REGIMEN

NSave Nature to Survive
8(2): 603-609, 2013 (Supplement on Medicinal plants)www.thebioscan.in
603
HPTLC FINGER PRINT ANALYSIS OF PHYTOPHENOLS OF
PAEDERIA FOETIDA UNDER DIFFERENT EXTRACTION REGIMEN
M. R. SENAPATI, P. C. BEHERA*, P. C. BISOI, A. MAITY AND S. C. PARIJA
Department of Veterinary Biochemistry, College of Veterinary Science and Animal Husbandry,
Orissa University of Agriculture and Technology, Bhubanewswar - 753 003, Odisha, INDIA
e-mail: [email protected]
INTRODUCTION
The scientific world, in recent era of medicine emphasizes on
phyto-constituents as lead molecules in development of future
generation safe drugs. This is because, large diversity of
phytophnols and flavonoids lack adverse effects and possess
free radical scavenging activity to reduce risks of cancer,
cardiovascular disease, diabetes, inflammation, bacterial
disease and ageing related diseases (Kumar and Surh, 2008).
Phyto-constituents vary in chemical characteristics, polarities
and distribution in the plant matrix (Sultana et al., 2009) and
their recovery depends on extraction techniques and the
nature/ volume of solvent (Turkmen et al., 2006). Conventional
extraction techniques with water as solvent recover less
constituent and is time consuming. On the other hand,
advanced technique of microwave assisted extraction with
polar solvents consumes less time and solvent and claims to
extract even thermo-labile constituents also (Mandal et al.,
2007). The qualitative and quantitative analysis of phyto-
constituents by different methods exhibits the efficacy of the
technique and the solvent of extraction (Behera et al., 2012b).
High Pressure Thin Layer Chromatography (HPTLC) finger
print is a step ahead of such analysis with constitutional details.
So, screening of these techniques and solvents on recovery of
different phyto-constituents by HPTLC finger print is more
suitable than the traditional qualitative and quantitative
estimation (Behera et al., 2012a).
Water being non-polar solvent fails to extract all active
principles and thereby potency of the phyto-constituent suffers
to be suppressed. Sometimes, conventional extraction method
with water is equally responsible for low potency of herbal
formulations. The plants may have some more components
to be extracted for better performance. So, there is a need to
compare the constituents recovered in different methods and
solvents for potency augmentation of phyto-medicines.
Paederia foetida (shunk vine) of Rubiaceae family is an
aromatic perennial climbing shrub. It is native to eastern Asia
and grown in grassy hillsides, forests, river banks, waste
grounds, roadsides on fences and urban areas of Assam, Bihar,
Bengal and Odisha. It is a well known medicinal shrub for its
antibacterial (Senapati et al., 2013a), Cytotoxic (Morshed et
al., 2012), anthelmintic (Dey and Pal, 2011), anti-
hyperglycemic (Khan et al., 2011), hepato-protective (Uddin
et al., 2011), anti-fungal (Majumdar et al., 2011), anti-ulcer
(Reddy et al., 2011), antioxidative (Osman et al., 2009) and
anti-diarrhoeal (Afroz et al., 2006) activities in several countries.Indian tribes of Orissa province use aqueous paste of thisshrub traditionally for treatment of rheumatoid arthritis, hepaticdisorders, piles, diabetes, asthma, coughs, body ache, itches,wounds, stomach-ache, diarrhoea, dysentery, flatulency andtoothache.
Therefore, the present study aims to screen the phenoliccomponents of Paederia foetida shoot extracted in differentgroups of solvents following the methods of Cold Percolation(CP) and Microwave Assisted Extraction (MAE) through
qualitative, quantitative and HPTLC finger print analysis with
an objective to advocate the suitable technique and solvent
for better extraction of phyto-constituents.
ABSTRACTTo detect and estimate the phenolics and flavonoids of Paederia foetida in different solvents under CP, MAE
system and by HPTLC finger print analysis. Phenolic components in chlorophyll free extracts in different solvent
groups were qualitatively detected by chemical tests and total polyphenols and flavonoids were quantitatively
estimated following standard protocol. Distinct chemo-profile of the components was analyzed by HPTLC
technique with CAMAG win CATS planar chromatography manager software. Among two methods of extraction
more components of polyphenols were detected and significantly higher (p<0.05) contents of phenolics and
flavonoids were estimated in MAE method than CP method. Out of five solvent types, organic solvent mixtures
recovered significantly higher polyphenols (p<0.05) and flavonoids (p<0.001) in comparison to aqueous
solvent. CP Method exhibits 12, 14, 14, 14 and 16 peaks for Gr-A, B, C, D and E solvents respectively. In MAE
method the numbers of peaks in these respective solvent groups are 15, 21, 19, 18 and 22. Phyto-chemicals can
be better screened qualitatively and estimated quantitatively in organic solvent extracts under MAE system by
HPTLC finger print analysis than the aqueous solvent and CP method.
Abbreviations: CP: Cold Percolation, MAE: Microwave-Assisted Extraction, Rf: Retention factor, HPTLC: High
Pressure Thin layer Liquid Chromatography.
KEYWORDS
Paederia foetida
HPTLC finger printing
polyphenol
Flavonoid
Received on :
21.03.2013
Accepted on :
29.05.2013
*Corresponding
author
604
M. R. SENAPATI et al.,
MATERIALS AND METHODS
Plant sample
Paederia foetida collected from different regions of Khurdha
districts of Odisha Province was identified and classified
following the description of Saxena and Brahman (1995). The
whole shoot of the plant was collected at pre-flowering stage,
cleaned, dried under shade and ground into fine structure for
preparation of extracts.
Solvents
Organic and aqueous solvents and their mixtures were
classified under Gr-A: Distilled and deionised water @100 %,
Gr-B: Methanol: Water, Gr-C: Ethanol: Water and Gr-D:
Acetone: Water @ 80:20 % each and Gr-E: Methanol: ethanol:
acetone: water @ 30:30:30:10 %.
Extraction
Extraction of polyphenols and flavonoids was conducted in
two trials. In trial-I, extraction of phyto-constituents was done
in MAE system by Multiwave 3000-801V (Anton Paar)
digestion system following the method of Eskilsson and
Bjorklund (2000). 2g of ground powder in 20mL of solvent
was heated at 80ºC for 25 minutes followed by 15 minutes
cooling. In trial-II, the extraction of was done by cold
percolation following the method as described by Senapati et
al. (2013b). 2g of ground sample in 40mL of solvent was kept
on magnetic stirrer at 10ºC temperature for 24h followed by
filtration of the extract.
Hexane treatment
Equal volumes of filtered crude extract and hexane were mixed
and kept for 2 minutes. The supernatant was aspirated
carefully to obtain chlorophyll free extract.
Qualitative detection of phyto-constituents
The phenolic components in shoot extracts were detected by
specific chemical tests as detailed below.
(a)Salkowski’s Test for Terpenoids: 1mL of extract + 2mL of
chloroform + 1 mL of concentrated H2SO
4. Reddish brown
colour at the interface indicates positive result.
(b)Ferric Chloride’s Test for Tannins: 1 mL extract + 1 mL of
0.1% FeCl3. Brown-green/ blue black colour indicates
positive result.
(c)Shinoda’s Test for Flavonoids: 2 mL extract + few drops of
1% NH3 solution. Yellow colour indicates positive result.
(d)Killer-killani’s Test for Cardiac glycosides: 5 mL of extract +
2 mL of glacial CH3COOH containing 1 drop of 0.1% FeCl
3
+ 1 mL of concentrated H2SO
4. Brown colour ring at the
interface indicates positive result.
(e)Frothing Test for Saponins: 10 mL of extract + 5 mL of
distilled water. The shaked froth was mixed with 3 drops of
olive oil. Formation of emulsion indicates positive result.
(f) Liebermann-Burchard’s Test for Steroids: 1 mL of extract +
2 mL of acetic anhydride + 2 mL of concentrated H2SO
4.
Colour change from violet to green indicates positive result.
(g)Wagner’s Test for Alkaloids: 5 mL of extract + 2 mL of
Wagner’s reagent (Iodine in Potassium Iodide). Formation
of brown/ reddish precipitate indicates positive result.
Qunantitative estimation of Phenolics and flavonoids
The shoot extracts in different solvents were estimated for total
polyphenols (Singh et al., 2002) and flavonoids (Mimica-Dukic,
1992) by chemical exposure followed by spectro-photometric
assessment of optical absorbance.
HPTLC Finger printing of phenolic components
Distinct chemo-profile of the extract was studied by HPTLC
technique following the method of Stahl (2007). The silica gel
TLC plates (EMerck, Germany) of 60F254
(20x10x 0.0002cm)were spotted with 5 μL of extracts in the form of band withHPTLC glass syringe and dried at 60-700C by CAMAG TLCplate Heater-III for 60-90 seconds. The CAMAG AutomaticDeveloping Chamber-2 (ADC-2) was saturated with the 50mL. of mobile phase (Toluene: Ethyl acetate: Formic acid (8.5:1.0: 0.5) for 10 min at room temperature (25 ± 2ºC). Theplates were exposed to mobile phase in the ADC-2 tillmovement of solvent occurs up to 95% of the plate. Then theplates, after air drying for 10 minutes, were scanned byCAMAG-TLC scanner-3 in remission-absorbance mode at254nm using optical filter K400, under control of Camag win
CATS planar chromatography manager software with specificslit dimension of 5× 0.45mm, the sample track and spot
spectrum scanning speed @ 20 mm/ sec, band length of 5mm
and tracks distance of 8.9mm.
Statistical analysis
The data was subjected to analysis of variance to test the
significance of difference of mean values between different
groups according to Snedecor and Cochran (1994) and by
using Instat-3 software.
RESULTS
Detection of phenolic compounds
The qualitative detection of phenolic compounds in
chlorophyll free shoot extracts of Paederia foetida in five
different solvents (Table 1) reveals that flavonoid, terpenoid,
steroid and alkaloid are absent in CP method where as all the
constituents under study present in MAE method except
terpenoid and alkaloid at Gr-A. Organic solvent mixtures at
Gr-B, C, D and E extract all the components in MAE method
but CP method excludes terpenoids, saponins and alkaloids
in the extract. MAE method and solvent mixture at Gr-E depicts
presence of more phyto-constituents as compared to their
counter groups.
Estimation of phenolics and flavonoids by different methods
Table 2 compares the contents of total phenolics and
flavonoids extracted in five different solvents under MAE and
CP methods. MAE method extracts significantly higher contents
(p<0.05) of total phenolics in all the solvents and the maximum
concentration (3.98 ± 0.31) is recovered in Gr-E solvent
followed by Gr-B (3.72 ± 0.29), C (3.58 ± 0.21), D (3.42 ±
0.22) and A (2.93 ± 0.18) than those extracted under CP
method. In addition, flavonoids extracted in MAE method
depicts significantly higher contents (p<0.05) in all the groups
but solvent mixture in Gr-E extracts the maximum
concentration (1.05 ± 0.10) followed by Gr-C (0.93 ± 0.06),
B (0.78 ± 0.07), D (0.69 ± 0.08) and A (0.49 ± 0.05) in
comparison to the corresponding contents observed in CP
method. MAE method extracts significantly higher contents of

605
Table 1: Detection of phenolic constituents of Paederia foetida shoot extracted in different solvents
Methods CP MAE CP MAE CP MAE CP MAE CP MAE
Solvent groups Gr-A Gr-B Gr-C Gr-D Gr-E
Tannin + + + ++ + + + + + +
Flavonoid - + + ++ + + + + + ++
Terpenoid - - - + - ++ + + ++
Cardiac glycosides + + + + - + + + + +
Saponins + ++ - + - + - - - +
Steroids - + + ++ + ++ - + - +
Alkaloids - - - + - + - + - ++
“+”and “–” denote presence and absence of the concerned components respectively.
Table 2: Total phenolics (mg of GAE / g of sample ± SE) and flavonoids (mg of RE / g of sample ± SE) in chlorophyll free shoot extracts of
Paederia foetida in different methods
Solvents Total polyphenols (mg of GAE / g of sample ± SE) Total Flavonoid (mg of RE / g of sample ± SE)
MAE CP MAE CP
Gr-A 2.93 a ± 0.18 2.07 b ± 0.14 0.49 a ± 0.05 0.27 b ± 0.04
Gr-B 3.72 a ± 0.29 2.22 b ± 0.20 0.78 a ± 0.07 0.46 b ± 0.05
Gr-C 3.58 a ± 0.21 2.76 b ± 0.16 0.93 a ± 0.06 0.52 b ± 0.07
Gr-D 3.42 a ± 0.22 2.47 b ± 0.13 0.69 a ± 0.08 0.36 b ± 0.06
Gr-E 3.98 a ± 0.31 3.10 b ± 0.21 1.05 a ± 0.10 0.71 b ± 0.08
Different superscripts between columns shows significant difference (p<0.05) within a group
Different superscripts between columns shows significant difference (*p<0.05, **p<0.01, ***p<0.001) within a row.
Table 3: Total phenolics (mg of GAE / g of sample ± SE) and flavonoids (mg of RE / g of sample ± SE) in chlorophyll free shoot extracts of
Paederia foetida in different solvents
Gr-A Gr-B Gr-C Gr-D Gr-E
MAE Total polyphenols 2.93 ± 0.18 3.72 ± 0.29 3.58 ± 0.21 3.42 ± 0.22 3.98 * ± 0.31
Total Flavonoid 0.49 ± 0.05 0.78 ± 0.07 0.93 ** ± 0.06 0.69 ± 0.08 1.05 *** ± 0.10
CP Total polyphenols 2.07 ± 0.14 2.22 ± 0.20 2.76 ± 0.16 2.47 ± 0.13 3.10 ** ± 0.21
Total Flavonoid 0.27 ± 0.04 0.46 ± 0.05 0.52 ± 0.07 0.36 ± 0.06 0.71 ** ± 0.08
Table 4: Rf values (Start and End Position) of peaks in different solvent extracts of Paederia foetida under CP method of extraction
Peaks Gr-A Gr-B Gr-C Gr-D Gr-E
Start End Start End Start End Start End Start End
1 0.02 0.09 0.01 0.04 0.01 0.03 0.01 0.03 0.01 0.03
2 0.09 0.12 0.04 0.07 0.03 0.07 0.03 0.04 0.03 0.07
3 0.14 0.16 0.10 0.13 0.09 0.12 0.04 0.07 0.07 0.09
4 0.17 0.18 0.14 0.17 0.12 0.16 0.07 0.08 0.18 0.23
5 0.18 0.22 0.18 0.22 0.19 0.22 0.15 0.16 0.23 0.24
6 0.25 0.28 0.26 0.28 0.25 0.28 0.26 0.27 0.29 0.33
7 0.44 0.47 0.33 0.34 0.34 0.36 0.40 0.43 0.38 0.40
8 0.53 0.56 0.35 0.39 0.43 0.47 0.60 0.62 0.40 0.41
9 0.57 0.61 0.44 0.47 0.51 0.53 0.64 0.68 0.46 0.49
10 0.64 0.68 0.47 0.53 0.57 0.59 0.70 0.72 0.51 0.54
11 0.85 0.87 0.66 0.69 0.61 0.63 0.72 0.77 0.55 0.57
12 0.88 0.92 0.73 0.78 0.69 0.71 0.78 0.81 0.57 0.62
13 - - 0.84 0.86 0.73 0.78 0.84 0.88 0.65 0.69
14 - - 0.88 0.93 0.83 0.94 0.89 0.95 0.71 0.74
15 - - - - - - - - 0.76 0.82
16 - - - - - - - - 0.83 0.96
phenolics and flavonoids than the traditional CP method in
all the solvent groups.
Quantitative estimation of phenolics and flavonoids in
different solvents
Higher content of total phenolics in Gr-E organic solventextracts is significant in MAE (p<0.05) and CP method(p<0.01) in comparison to Gr-A aqueous solvent. The contentsin rest of solvent groups are non-significant even though theyexhibit more concentration in both the methods. The totalflavonoids in MAE method is observed significantly higher atGr-C (p<0.01) and Gr-E (p<0.001) but the value in CP method
is found significant (p<0.01) only for Gr-E solvent (Table 3).Group E solvent mixture extracts significantly higher contentsof total phenolics and flavonoids in both CP and MAE methodsof extraction.
HPTLC analysis of polyphenols and flavonoids
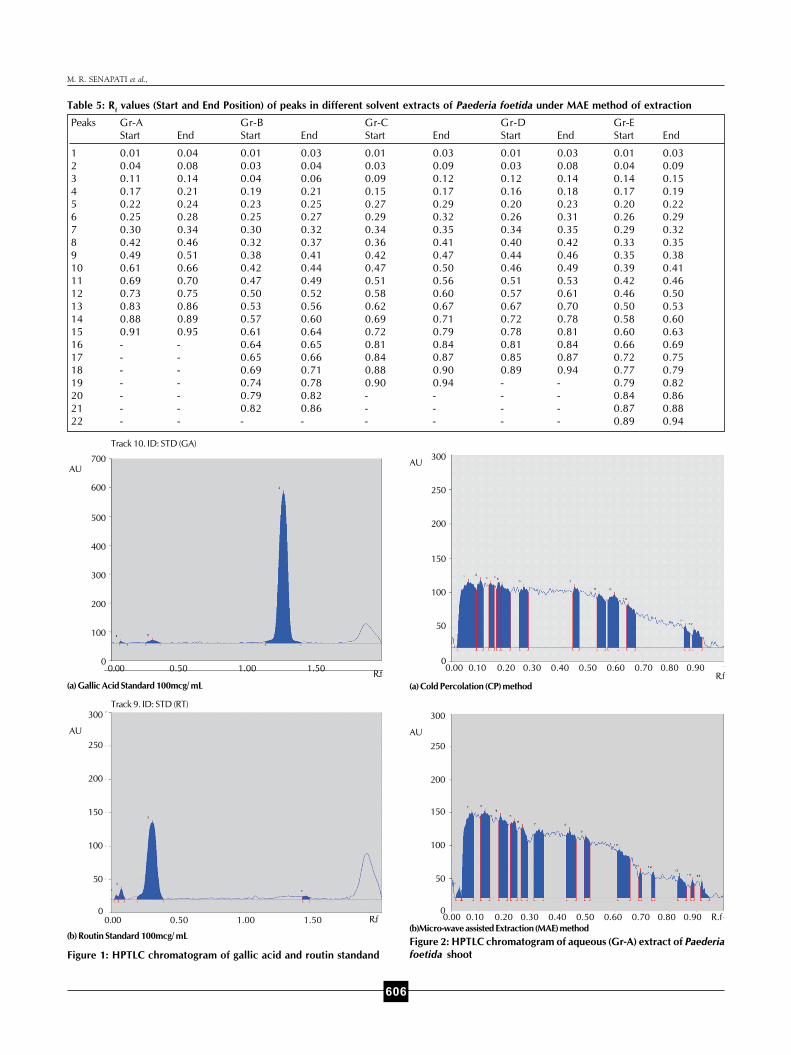
The chromatogram at Fig. 1a and 1b presents the spots of
Gallic Acid (Rf 1.19-1.35) and Rutin (R
f 0.23-0.35) standards
for polyphenols and flavonoids respectively. The shoot extracts
of Paederia foetida under HPTLC depict variable number of
peaks under MAE and CP method in different solvents. CP
Method exhibits 12 (Rf 0.02- 0.92), 14 (R
f 0.01- 0.93), 14 (R
f
HPTLC FINGER PRINT OF PAEDERIA FOETIDA POLYPHENOLS
606
Table 5: Rf values (Start and End Position) of peaks in different solvent extracts of Paederia foetida under MAE method of extraction
Peaks Gr-A Gr-B Gr-C Gr-D Gr-E
Start End Start End Start End Start End Start End
1 0.01 0.04 0.01 0.03 0.01 0.03 0.01 0.03 0.01 0.03
2 0.04 0.08 0.03 0.04 0.03 0.09 0.03 0.08 0.04 0.09
3 0.11 0.14 0.04 0.06 0.09 0.12 0.12 0.14 0.14 0.15
4 0.17 0.21 0.19 0.21 0.15 0.17 0.16 0.18 0.17 0.19
5 0.22 0.24 0.23 0.25 0.27 0.29 0.20 0.23 0.20 0.22
6 0.25 0.28 0.25 0.27 0.29 0.32 0.26 0.31 0.26 0.29
7 0.30 0.34 0.30 0.32 0.34 0.35 0.34 0.35 0.29 0.32
8 0.42 0.46 0.32 0.37 0.36 0.41 0.40 0.42 0.33 0.35
9 0.49 0.51 0.38 0.41 0.42 0.47 0.44 0.46 0.35 0.38
10 0.61 0.66 0.42 0.44 0.47 0.50 0.46 0.49 0.39 0.41
11 0.69 0.70 0.47 0.49 0.51 0.56 0.51 0.53 0.42 0.46
12 0.73 0.75 0.50 0.52 0.58 0.60 0.57 0.61 0.46 0.50
13 0.83 0.86 0.53 0.56 0.62 0.67 0.67 0.70 0.50 0.53
14 0.88 0.89 0.57 0.60 0.69 0.71 0.72 0.78 0.58 0.60
15 0.91 0.95 0.61 0.64 0.72 0.79 0.78 0.81 0.60 0.63
16 - - 0.64 0.65 0.81 0.84 0.81 0.84 0.66 0.69
17 - - 0.65 0.66 0.84 0.87 0.85 0.87 0.72 0.75
18 - - 0.69 0.71 0.88 0.90 0.89 0.94 0.77 0.79
19 - - 0.74 0.78 0.90 0.94 - - 0.79 0.82
20 - - 0.79 0.82 - - - - 0.84 0.86
21 - - 0.82 0.86 - - - - 0.87 0.88
22 - - - - - - - - 0.89 0.94
M. R. SENAPATI et al.,
Figure 2: HPTLC chromatogram of aqueous (Gr-A) extract of Paederia
foetida shoot
(a) Gallic Acid Standard 100mcg/ mL
AU
Track 10. ID: STD (GA)
0.00 0.50 1.00 1.50R.f
700
600
500
400
300
200
100
0
AU
Track 9. ID: STD (RT)300
250
200
150
100
50
0
(a) Cold Percolation (CP) method
AU300
250
200
150
100
50
00.00 0.10 0.20 0.30 0.40 0.50 0.60 0.70 0.80 0.90
R.f
(b)Micro-wave assisted Extraction (MAE) method
AU
300
250
200
150
100
50
00.00 0.10 0.20 0.30 0.40 0.50 0.60 0.70 0.80 0.90 R.f
Figure 1: HPTLC chromatogram of gallic acid and routin standand
(b) Routin Standard 100mcg/ mL
0.00 0.50 1.00 1.50 R.f

607
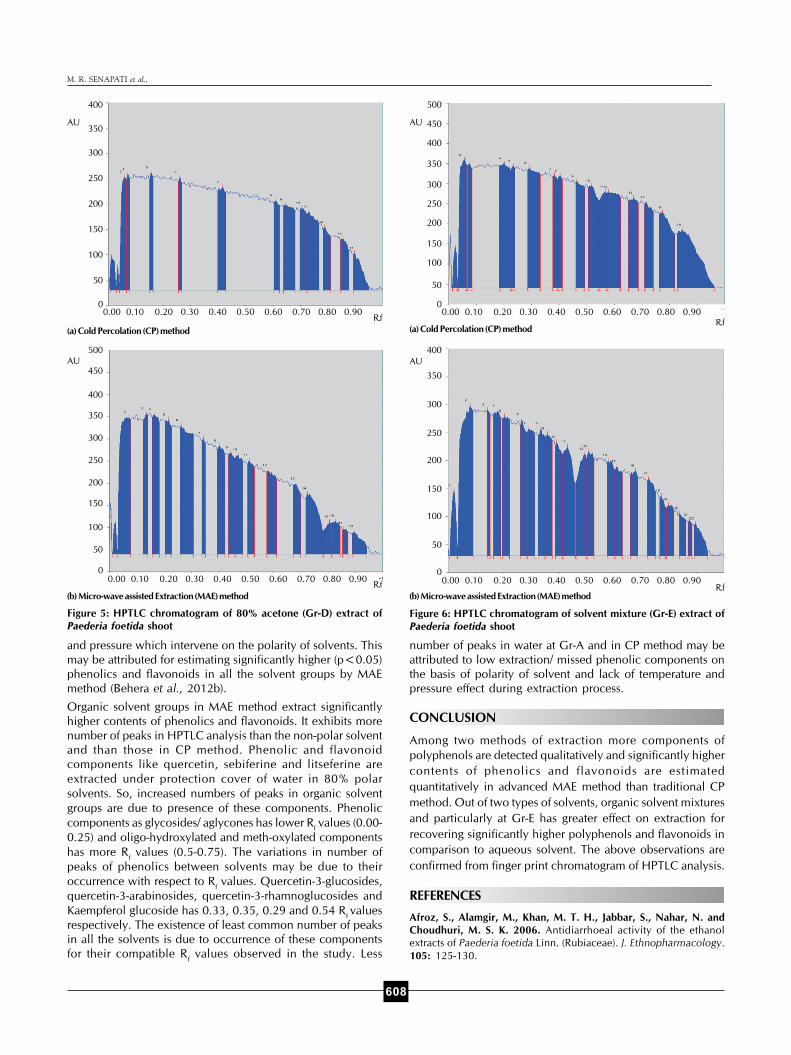
0.01- 0.94), 14 (Rf 0.01- 0.95) and 16 peaks (R
f 0.01- 0.96) for
Gr-A, B, C, D and E solvents (Table 4 and Fig. 2a, 3a, 4a, 5a
and 6a) respectively. The peaks in respective solvent groups
in MAE method (Table 5) are 15 (Rf 0.01- 0.95), 21 (R
f 0.01-
0.86), 19 (Rf 0.01- 0.94), 18 (R
f 0.01- 0.94) and 22 (R
f 0.01-
0.94) as presented in Fig. 2b, 3b, 4b, 5b and 6b. MAE method
and organic solvent groups depict more number of peaks for
polyphenols and flavonoids than their respective counter
groups.
DISCUSSION
Phyto-polyphenols are secondary metabolites/ their
derivatives/ isomers of flavones, isoflavones, flavonols,
catechins and phenolic acids. More than 8,000 structural
variants of polyphenols and 3,000 flavonoids are distributed
in different parts of plants. Since, phenolic components vary
in structure, physical and chemical properties, their solubility
becomes different according to polarity of solvents. Most of
the phenolic components are soluble in organic polar solvents
for which methanol, ethanol, acetone, solvent mixture in Gr-
B, C, D and E extract more principles from herb shoot and
water at Gr-A being non-polar solvent fails to recover all the
phenolic compounds in qualitative detection (Palanisamy and
Natesan, 2012). Presence of more components in Gr-E solvent
may be due to blending of polar and non-polar solvents
together where the efficacy of extraction increases. Absence
of certain phenolic constituents may be attributed to variation
in physical and chemical behaviour of specific component in
a particular solvent (Subramanian and Ramakrishnan, 2011
and Behera et al., 2012a).
The polarity of solvents and physical/ chemical properties of
active components play a crucial role on quantity of phenoliccompounds during extraction. Method of extraction andphysical conditions of exposure add to the yield. CP methodinvolves exposure of the solvent at 10ºC for 24h. Additionaleffects of more temperature and pressure on physical andchemical properties of solvent is absent. So, CP method failsto recover more phenolics and flavonoids in all the polar andnon-polar solvents and therefore, significantly lower (p<0.05)total polyphenol and flavonoids are estimated in all the solvent
extracts in comparison to MAE method. MAE method is an
advanced technique of extraction of bio-active compounds
and is associated with solvent type and concentration
(Turkmen et al., 2006, Yilmaz and Toledo, 2006). The process
of extraction involves microwave energy, higher temperature
HPTLC FINGER PRINT OF PAEDERIA FOETIDA POLYPHENOLS
(a) Cold Percolation (CP) method
AU
500
450
400
350
300
250
200
150
100
50
00.00 0.10 0.20 0.30 0.40 0.50 0.60 0.70 0.80 0.90
R.f
Figure 3: HPTLC chromatogram of 80% methanol (Gr-B) extract of
Paederia foetida shoot
(b) Micro-wave assisted Extraction (MAE) method
AU
400
350
300
250
200
150
100
50
00.00 0.10 0.20 0.30 0.40 0.50 0.60 0.70 0.80 0.90
R.f
(a) Cold Percolation (CP) method
AU
500
450
400
350
300
250
200
150
100
50
00.00 0.10 0.20 0.30 0.40 0.50 0.60 0.70 0.80 0.90
R.f
Figure 4: HPTLC chromatogram of 80% ethanol (Gr-C) extract of
Paederia foetida shoot
(b) Micro-wave assisted Extraction (MAE) method
AU
500
450
400
350
300
250
200
150
100
50
00.00 0.10 0.20 0.30 0.40 0.50 0.60 0.70 0.80 0.90
R.f
608
(b) Micro-wave assisted Extraction (MAE) method
and pressure which intervene on the polarity of solvents. This
may be attributed for estimating significantly higher (p<0.05)
phenolics and flavonoids in all the solvent groups by MAE
method (Behera et al., 2012b).
Organic solvent groups in MAE method extract significantly
higher contents of phenolics and flavonoids. It exhibits more
number of peaks in HPTLC analysis than the non-polar solvent
and than those in CP method. Phenolic and flavonoid
components like quercetin, sebiferine and litseferine are
extracted under protection cover of water in 80% polar
solvents. So, increased numbers of peaks in organic solvent
groups are due to presence of these components. Phenolic
components as glycosides/ aglycones has lower Rf values (0.00-
0.25) and oligo-hydroxylated and meth-oxylated components
has more Rf values (0.5-0.75). The variations in number of
peaks of phenolics between solvents may be due to their
occurrence with respect to Rf values. Quercetin-3-glucosides,
quercetin-3-arabinosides, quercetin-3-rhamnoglucosides and
Kaempferol glucoside has 0.33, 0.35, 0.29 and 0.54 Rf values
respectively. The existence of least common number of peaks
in all the solvents is due to occurrence of these components
for their compatible Rf values observed in the study. Less
number of peaks in water at Gr-A and in CP method may be
attributed to low extraction/ missed phenolic components on
the basis of polarity of solvent and lack of temperature and
pressure effect during extraction process.
CONCLUSION
Among two methods of extraction more components of
polyphenols are detected qualitatively and significantly higher
contents of phenolics and flavonoids are estimated
quantitatively in advanced MAE method than traditional CP
method. Out of two types of solvents, organic solvent mixtures
and particularly at Gr-E has greater effect on extraction for
recovering significantly higher polyphenols and flavonoids in
comparison to aqueous solvent. The above observations are
confirmed from finger print chromatogram of HPTLC analysis.
REFERENCES
Afroz, S., Alamgir, M., Khan, M. T. H., Jabbar, S., Nahar, N. and
Choudhuri, M. S. K. 2006. Antidiarrhoeal activity of the ethanol
extracts of Paederia foetida Linn. (Rubiaceae). J. Ethnopharmacology.
105: 125-130.
M. R. SENAPATI et al.,
(a) Cold Percolation (CP) method
AU
400
350
300
250
200
150
100
50
00.00 0.10 0.20 0.30 0.40 0.50 0.60 0.70 0.80 0.90
R.f(a) Cold Percolation (CP) method
AU
500
450
400
350
300
250
200
150
100
50
00.00 0.10 0.20 0.30 0.40 0.50 0.60 0.70 0.80 0.90
R.f
Figure 6: HPTLC chromatogram of solvent mixture (Gr-E) extract of
Paederia foetida shoot
(b) Micro-wave assisted Extraction (MAE) method
AU
400
350
300
250
200
150
100
50
00.00 0.10 0.20 0.30 0.40 0.50 0.60 0.70 0.80 0.90
R.f
Figure 5: HPTLC chromatogram of 80% acetone (Gr-D) extract of
Paederia foetida shoot
AU500
450
400
350
300
250
200
150
100
50
00.00 0.10 0.20 0.30 0.40 0.50 0.60 0.70 0.80 0.90
R.f

609
Behera, P. C., Bisoi, P. C. and Parija, S. C. 2012a. HPTLC detection
of polyphenols and flavonoids of Careya arborea leaves and study of
antimicrobial effect. Int. J. Phytopharmacology. 3(1): 36-41.
Behera, P. C., Senapati, M. R. and Parija, S. C. 2012b. Effect of
Solvents on Extraction of Certain Medicinal plant Polyphenols. Am. J.
Pharm Tech Research. 2(6): 428-434.
Dey, Y. N. and Pal, M. K. 2011. Evaluation of anthelmintic activity of
leaves of Paederia foetida. Int. J. Pharma Bio Sciences. 2(1): 227-231.
Eskilsson, C. S. and Bjorklund, E. 2000. Analytical-scale microwave-
assisted extraction. J. Chromatography. 902: 227-250.
Khan, S., Zahan, D., Das, R., Nasrin, D., Ahsan, S., Ahmed, R.,
Sadat, A. F. M. N., Bashar, A. B. M. A., Nahar, N. and Rahmatullah,
M. 2011. Antihyperglycemic Activity Studies with Methanol Extract
of Madhuca Indica J.F. Gmel. Leaves and Paederia Foetida L. Stems in
Mice. Advances in Natural and Applied Sciences. 5(2): 122-126.
Kumar, J. and Surh, Y. 2008. Cancer chemopreventive and therapeutic
potential of resveratrol: Mecha-nistic perspectives. Cancer. Lett. 269:
243-246.
Majumdar, T. Deb, B., Das, A., Chakraborty, A. and Goswami, B. B.
2011. Isolation of antimicrobially active compounds from the leaf of
tribal edible plants of Tripura: Momordica charantia L. and Paederia
foetida L. J. Nat. Prod. Plant Resour. 1(4): 108-116.
Mandal, V., Mohan, Y. and Hemalatha, S. 2007. Microwave Assisted
Extraction- An Innovative and Promising Extraction Tool for Medicinal
Plant Research. Pharmacogn. Rev. 1(1): 7-18.
Mimica-Dukic, N. 1992. Investigation on secondary biomolecules in
some Mentha species. Ph. D. Thesis, University of Novisad.
Morshed, H., Islam, Md. S., Parvin, S., Ahmed, M. U., Islam, M. S.,
Mostofa, A. G. M. and Sayeed, M. S. B. 2012. Antimicrobial and
Cytotoxic Activity of the Methanol Extract of Paederia foetida Linn.
(Rubiaceae). J. Appl. Pharmaceu. Science. 02(01): 77-80.
Osman, H., Rahim, A. A., Isa, N. M. and Bakhir, N. M. 2009.
Antioxidant Activity and Phenolic Content of Paederia foetida and
Syzygium aqueum. Molecules. 14: 970-978.
Palanisamy, H. and Natesan, R. 2012. Chromatographic finger print
analysis of Rumex vesicarius L. by HPTLC technique. Asian Pac. J.
Trop. Biomedicine. 2(4): 57-63.
Reddy, K. S., Kumar, A. S. and Ganapaty, S. 2011. Evaluation of anti-
ulcer activity of Paederia foetida root extracts in experimentally induced
gastric ulcer in rats. Int. J. Res. In Ayur. Pharmacy. 2(5): 1556-1559.
Saxena, H. O. and Brahman, M. 1995. The flora of Orissa. Vol. II:
Orissa Forest Development Corporation Ltd., Bhubaneswar.
Senapati, M. R., Behera, P. C., Sarangi, L. N., Parija, S. C, Maity, A.
and Bisoi, P. C. 2013a. Antibacterial effect of the polyphenols of
Paederia foetida and Artimisia nilagirica herbs of coastal Odisha.
Anim. Sci. Repoter. 7(1): 3-8.
Senapati, M. R., Behera, P. C. and Bisoi, P. C. 2013b. Extraction
Techniques for Phenolic Contents of Artimisia nilagirica. Indian Vet.
J. 90(2): 77-79.
Singh, R. P., Murthy, K. N. C. and Jayaprakasha, G. K. 2002. Studies
on antioxidant activity of pomegranate (Punica granatum) peel and
seed extracts using in vitro models. J. Agric. Food Chemistry. 50: 81-
86.
Snedecor, G. W. and Cochran, W. G. 1994. Statistical Methods, 6th
ed., Oxford and IBH Publishing Co. New Delhi.
Stahl, E. 2007. Thin Layer Chromatography: A Laboratory Handbook.
2nd ed., New York: Springer-Verlag Berlin Heidelberg. 60-102.
Subramanian, S. and Ramakrishnan, N. 2011. Chromatographic finger
print analysis of Naringi crenulata by HPTLC technique. Asian Pac. J.
Trop. Biomedicine. 1(10): 195-198.
Sultana, B., Anwar, F. and Ashraf, M. 2009. Effect of extraction solvent/
technique on the antioxidant activity of selected medicinal plant
extracts. Molecules. 14: 2167-2180.
Turkmen, N., Sari, F. and Velioglu, Y. S. 2006. Effect of extraction
solvents on concentration and antioxidant activity of black and
blackmate polyphenols determined by ferrous tartarate and Folin-
ciocalteu methods. Food Chemistry. 99: 838-841.
Uddin, B., Nahar, T., Basunia, M. A. and Hossain, S. 2011. Paederia
Foetida Protects Liver Against Hepatotoxin-Induced Oxidative
Damage. Adv. Biol. Research. 5(5): 267-272.
Yilmaz, Y. and Toledo, R. T. 2006. Oxygen radical absorption
capacities of grapewine industry by-products and effect of solvent
type on extraction of grape seed polyphenols. J. Food Compost.
Analysis. 19: 41-48.
HPTLC FINGER PRINT OF PAEDERIA FOETIDA POLYPHENOLS

610