Quantification and method optimization for optimum recovery of Bergenin and Gallic acid in Bergenia...
7
Ph ton 238 The Journal of Phytochemistry. Photon 114 (2013) 238-244 https://sites.google.com/site/photonfoundationorganization/home/the-journal-of-phytochemistry Original Research Article. ISJN: 4172-8352 The Journal of Phytochemistry Ph ton Quantification and method optimization for optimum recovery of Bergenin and Gallic acid in Bergenia ciliata using HPTLC Nishi Srivastava a,b, , Amit Srivastava a , Sharad Srivastava a , Abdul Rahman Khan b , Ajay Kumar Singh Rawat a* a Pharmacognosy and Ethnopharmacology Division, CSIR-National Botanical Research Institute, Lucknow- 226001, India b Chemistry Division, Integral University, Lucknow-226001, India Article history: Received: 04 September, 2013 Accepted: 06 September, 2013 Available online: 19 November, 2013 Keywords: HPTLC, Bergenin, Gallic acid; Bergenia ciliata Abbreviations: HPTLC: High performance thin layer chromatography Corresponding Author: Rawat A.K.S.* Senior Principal Scientist Email: [email protected] Phone: +9152222978161 Fax No: +915222207219 Srivastava N. Senior Research Fellow Email: [email protected] Phone: +919450601959 Srivastava A. Research Associate Email: [email protected] Phone: +918858905070 Srivastava S. Senior Scientist Email: [email protected] Phone: +919415082210 Khan A.R. Professor and Dean of Applied Sciences Email: [email protected] Phone: +919450156047 Abstract Aim of the study is to quantify Bergenin and Gallic acid in Bergenia ciliata using HPTLC along with method optimization to recover maximum quantity of Bergenin and Gallic acid in three accession of Bergenia ciliata collected from small variation in altitudes between Taluka and Osla, Uttarakhand India. High performance thin layer chromatography method was developed to achieve quantitative study in all three accessions. Separation of metabolites before and after hydrolysis was achieved using TLC silica Gel Merck 60F257 plate and mobile phase Toluene/ethyl acetate/formic acid (3.5:5.5:1 v/v/v). The quantification of metabolites was carried out using densitometry absorption mode at 250 and 280nm. The linear regression analysis of data obtained from the correlation plots showed good linearity over the concentration range 200-600ng/spot of Bergenin, 200-600ng/spot of Gallic acid with correlation coefficients (r) 0.998 and 0.996 respectively. Results showed that Bergenin content was enhanced by acid hydrolysis due to cleavage of glycoside bond and Gallic acid content was lowered due to its esterification into Gallicin. Acid hydrolysis provides a practical method to accurate quantification as well as to recover maximum amount of Bergenin and derivatization of Gallic acid into Gallicin on industrial level. Citation: Srivastava N., Srivastava A., Srivastava S., Khan A.R., Rawat A.K.S., 2013. Quantification and method optimization for optimum recovery of Bergenin and Gallic acid in Bergenia ciliata using HPTLC. The Journal of Phytochemistry. Photon 114, 238-244. 1. Introduction 1.1 Plant History The plant Bergenia (Saxifragraceae) is widely distributed in the central and East Asia (The Merck Index, 1989). It is popularly known as Paashaanbhed in Indian system of medicine. Biologically active metabolites from Bergenia have been investigated which include Bergenin (Figure 1), (+) Catechin and Gallic acid (Figure 1) are important secondary metabolites present in considerable amount (Tucci et al., 1969, 1999). Due to medicinal properties the plant Bergenia have been used since centuries for the treatment of kidney, bladder stone dissolution (Frick et al., 1991, 1948), as antioxidant (Pozharitskaya, 2007), anti-microbial (Nadkarni, 1976; Sinha et al., 2001), anti-tussive, in pulmonary infections (Sinha, et al., 2001).
Transcript of Quantification and method optimization for optimum recovery of Bergenin and Gallic acid in Bergenia...
Ph ton 238
The Journal of Phytochemistry. Photon 114 (2013) 238-244 https://sites.google.com/site/photonfoundationorganization/home/the-journal-of-phytochemistry Original Research Article. ISJN: 4172-8352
The Journal of Phytochemistry Ph ton Quantification and method optimization for optimum recovery of Bergenin and Gallic acid in Bergenia ciliata using HPTLC Nishi Srivastavaa,b,, Amit Srivastavaa, Sharad Srivastavaa , Abdul Rahman Khanb, Ajay Kumar Singh Rawata* a Pharmacognosy and Ethnopharmacology Division, CSIR-National Botanical Research Institute, Lucknow- 226001, India b Chemistry Division, Integral University, Lucknow-226001, India Article history: Received: 04 September, 2013 Accepted: 06 September, 2013 Available online: 19 November, 2013 Keywords: HPTLC, Bergenin, Gallic acid; Bergenia ciliata Abbreviations: HPTLC: High performance thin layer chromatography Corresponding Author: Rawat A.K.S.* Senior Principal Scientist Email: [email protected] Phone: +9152222978161 Fax No: +915222207219 Srivastava N. Senior Research Fellow Email: [email protected] Phone: +919450601959 Srivastava A. Research Associate Email: [email protected] Phone: +918858905070 Srivastava S. Senior Scientist Email: [email protected] Phone: +919415082210 Khan A.R. Professor and Dean of Applied Sciences Email: [email protected] Phone: +919450156047
Abstract Aim of the study is to quantify Bergenin and Gallic acid in Bergenia ciliata using HPTLC along with method optimization to recover maximum quantity of Bergenin and Gallic acid in three accession of Bergenia ciliata collected from small variation in altitudes between Taluka and Osla, Uttarakhand India. High performance thin layer chromatography method was developed to achieve quantitative study in all three accessions. Separation of metabolites before and after hydrolysis was achieved using TLC silica Gel Merck 60F257 plate and mobile phase Toluene/ethyl acetate/formic acid (3.5:5.5:1 v/v/v). The quantification of metabolites was carried out using densitometry absorption mode at 250 and 280nm. The linear regression analysis of data obtained from the correlation plots showed good linearity over the concentration range 200-600ng/spot of Bergenin, 200-600ng/spot of Gallic acid with correlation coefficients (r) 0.998 and 0.996 respectively. Results showed that Bergenin content was enhanced by acid hydrolysis due to cleavage of glycoside bond and Gallic acid content was lowered due to its esterification into Gallicin. Acid hydrolysis provides a practical method to accurate quantification as well as to recover maximum amount of Bergenin and derivatization of Gallic acid into Gallicin on industrial level. Citation: Srivastava N., Srivastava A., Srivastava S., Khan A.R., Rawat A.K.S., 2013. Quantification and method optimization for optimum recovery of Bergenin and Gallic acid in Bergenia ciliata using HPTLC. The Journal of Phytochemistry. Photon 114, 238-244.
1. Introduction
1.1 Plant History The plant Bergenia (Saxifragraceae) is widely distributed in the central and East Asia (The Merck Index, 1989). It is popularly known as Paashaanbhed in Indian system of medicine. Biologically active metabolites from Bergenia have been investigated which include Bergenin (Figure 1), (+) Catechin and Gallic acid (Figure 1) are important secondary metabolites present in considerable amount
(Tucci et al., 1969, 1999). Due to medicinal properties the plant Bergenia have been used since centuries for the treatment of kidney, bladder stone dissolution (Frick et al., 1991, 1948), as antioxidant (Pozharitskaya, 2007), anti-microbial (Nadkarni, 1976; Sinha et al., 2001), anti-tussive, in pulmonary infections (Sinha, et al., 2001).
Ph ton 239
Figure 1: Chemical structure of Bergenin and Gallic acid
2. Objective of Research HPTLC method development and extraction method optimization for accurate quantification and maximum recovery of targeted secondary metabolites viz. Bergenin and Gallic acid in Bergenia ciliata. Stability of metabolites drastically varies in variable extraction conditions. Therefore, sensitivity assessment of these metabolites is prior in extraction process selection. The whole study is designed to evaluate the efficacy of cold percolation and role of acid hydrolysis in quantification of Bergenin, Gallic acid and subsequently assessment of their impact on stability of these metabolites. It has already been established that hydrolysis conditions is always needed when phenolic acids are quantified from fruits or other plant materials (Lee et al., 1996). Ample of evidence from qualitative and quantitative research data provides that there is enormous changes appeared in the secondary metabolites in such varied conditions. In the past few years, researcher from variety of scientific discipline and industries have tried to find practical ways to obtain maximum quantity of these metabolites via extraction, often as first step towards isolating and identifying specific compounds responsible for the biological activity of the plant. Therefore, biological potency of the drug of same quantity may vary due to more or less expression of active metabolites according to the extraction method employed. This report promotes us to undertake an investigation of Bergenin and Gallic acid stability during extraction and consequently monitor the changes occurred in the metabolites content using high performance thin layer chromatography.
From literature survey and to best our knowledge no such kind of study has been done in the plant Bergenia. Therefore it becomes important to establish quality parameter of the plant and optimization of various factors which promote more expression of desired active metabolites or diminishes its synthesis in the plant. Various validation aspects of the analysis as calibration curve linearity, specificity, recovery, limit of detection (LOD) and limit of quantification (LOQ) have been measured. 3. Materials and Methods 3.1 Work Plan In context to quantify targeted secondary metabolites viz. Bergenin and Gallic acid in Bergenia ciliata, HPTLC analytical method was targeted to develop for good separation of Bergenin and Gallic acid in extract. After optimization of good separation and best scanning wavelength for individual metabolites, extract was further subjected to acid hydrolysis to obtain maximum Bergenin and Gallic acid content in the same amount of extract. Through literature search it was found that hydrolysis provides a practical method to quantify phenolic compounds in plants. These compounds are medicinally important and to meet their maximum recovery on industrial level the present study was designed and analyzed by using HPTLC. 3.2 Plant materials Three accession of Bergenia ciliata were collected from Uttrakhand (India) during the winter season. Voucher specimens were deposited at repository CSIR-NBRI Lucknow (voucher specimen no. 254001, 254003 and 254002). 3.3 Chemicals All the solvents used were of analytical grade and purchased from Qualigens fine Chemicals, Mumbai, India. Before use, solvents were filtered and sonicated for 15min. HPTLC plates 20 × 10 cm, precoated with silica Gel Merck 60F257 was used as a stationary phase for optimization of analytical methods. Standard Compounds Bergenin (Purity: 98% w/w) and Gallic acid (Purity: 99% w/w) were purchased from Sigma-Aldrich USA. 3.4 Extraction and various stress degradation of plant material Air dried 100 gm each plant rhizome was crushed and exhaustively extracted at room temperature (25±5° C) with MeOH (250 ml×4
Ph ton 240
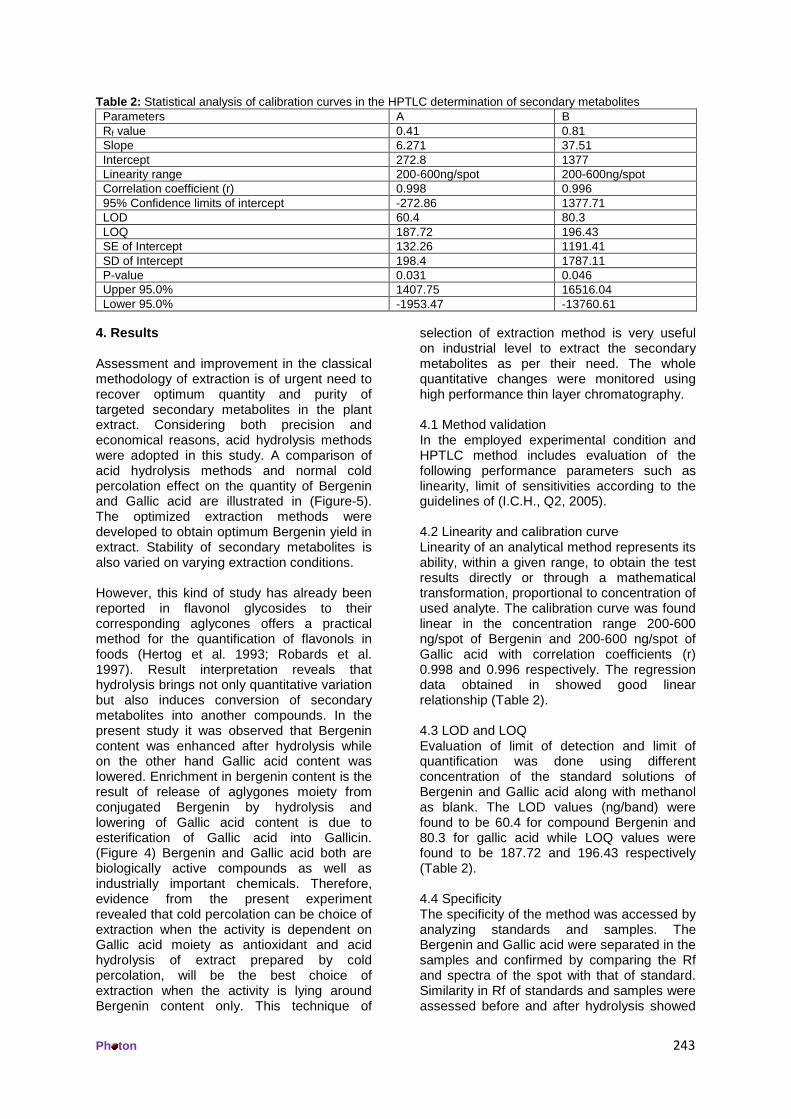
times). The suspension was filtered through filter paper (whatman no. 4), and ethanol was removed by using rotator evaporator. The combined extracts were concentrated under vacuums to yield 17 gm, 15 gm and 18gm of dark brown residue. Out of three accessions extract accession 1 were further subject to acid catalyzed hydrolysis (Figure 5). 3.4.1 Acid catalyzed hydrolysis To 2gm dry MeOH extract, 10 ml of 2N HCl in methanol was added. These mixtures were refluxed in a thermostatically controlled water bath linked magnetic stirrer with continuously stirring at 80° C for 45 min. The samples were cooled at room temperature and dry over vacuums to yield solid residue and work up with ethyl acetate. Ten µl of each solution (10mg/ml) was applied on the plate and chromatograms were run at 250 and 280nm. 3.5 Standard stock solution and sample preparation Standard stock solutions of Bergenin and Gallic acid were prepared by dissolving 1mg/ml of pure compounds in methanol for calibration studies. Sample solution preparation was done with dilution of MeOH extract of Bergenia in the solvent used in the extraction. All the sample solutions before and after hydrolysis were re-dissolved in the suitable solvents to obtain stock solution of concentration 10mg/ml and sonicated for 10 minutes. Different volumes from stock solution were applied for HPTLC analysis and quantified (Table 1, Figure 2). 3.6 Apparatus
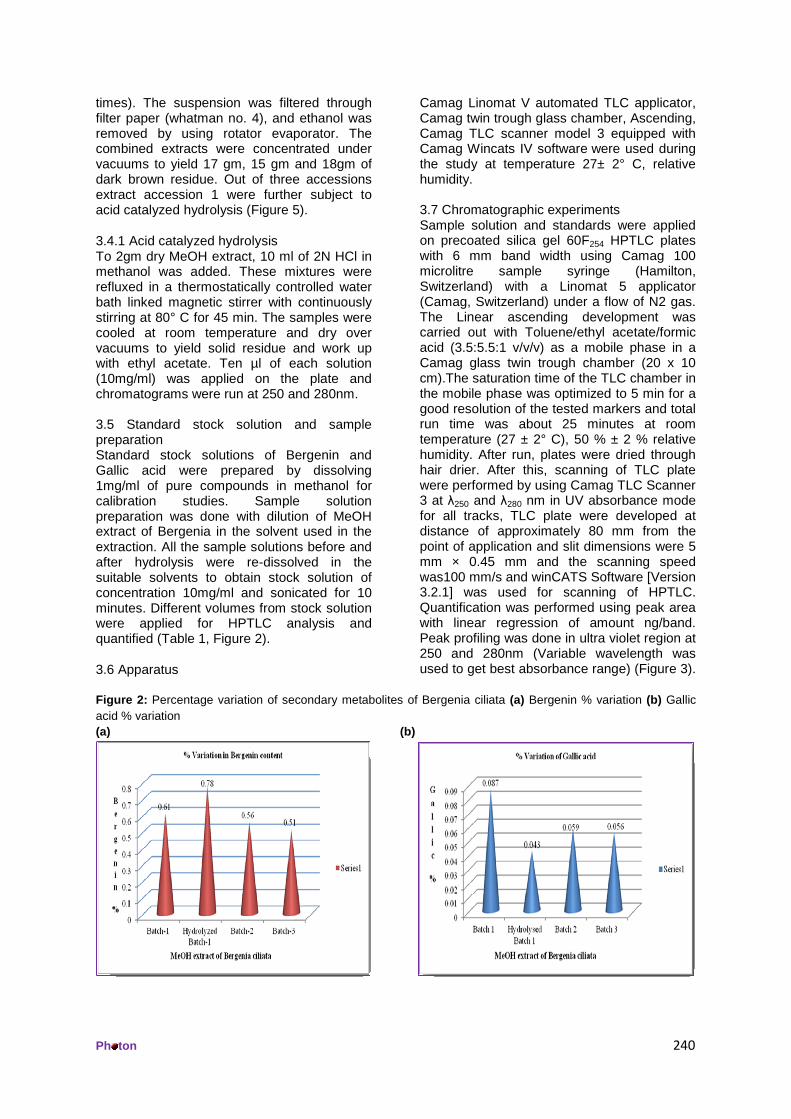
Camag Linomat V automated TLC applicator, Camag twin trough glass chamber, Ascending, Camag TLC scanner model 3 equipped with Camag Wincats IV software were used during the study at temperature 27± 2° C, relative humidity. 3.7 Chromatographic experiments Sample solution and standards were applied on precoated silica gel 60F254 HPTLC plates with 6 mm band width using Camag 100 microlitre sample syringe (Hamilton, Switzerland) with a Linomat 5 applicator (Camag, Switzerland) under a flow of N2 gas. The Linear ascending development was carried out with Toluene/ethyl acetate/formic acid (3.5:5.5:1 v/v/v) as a mobile phase in a Camag glass twin trough chamber (20 x 10 cm).The saturation time of the TLC chamber in the mobile phase was optimized to 5 min for a good resolution of the tested markers and total run time was about 25 minutes at room temperature (27 ± 2° C), 50 % ± 2 % relative humidity. After run, plates were dried through hair drier. After this, scanning of TLC plate were performed by using Camag TLC Scanner 3 at λ250 and λ280 nm in UV absorbance mode for all tracks, TLC plate were developed at distance of approximately 80 mm from the point of application and slit dimensions were 5 mm × 0.45 mm and the scanning speed was100 mm/s and winCATS Software [Version 3.2.1] was used for scanning of HPTLC. Quantification was performed using peak area with linear regression of amount ng/band. Peak profiling was done in ultra violet region at 250 and 280nm (Variable wavelength was used to get best absorbance range) (Figure 3).
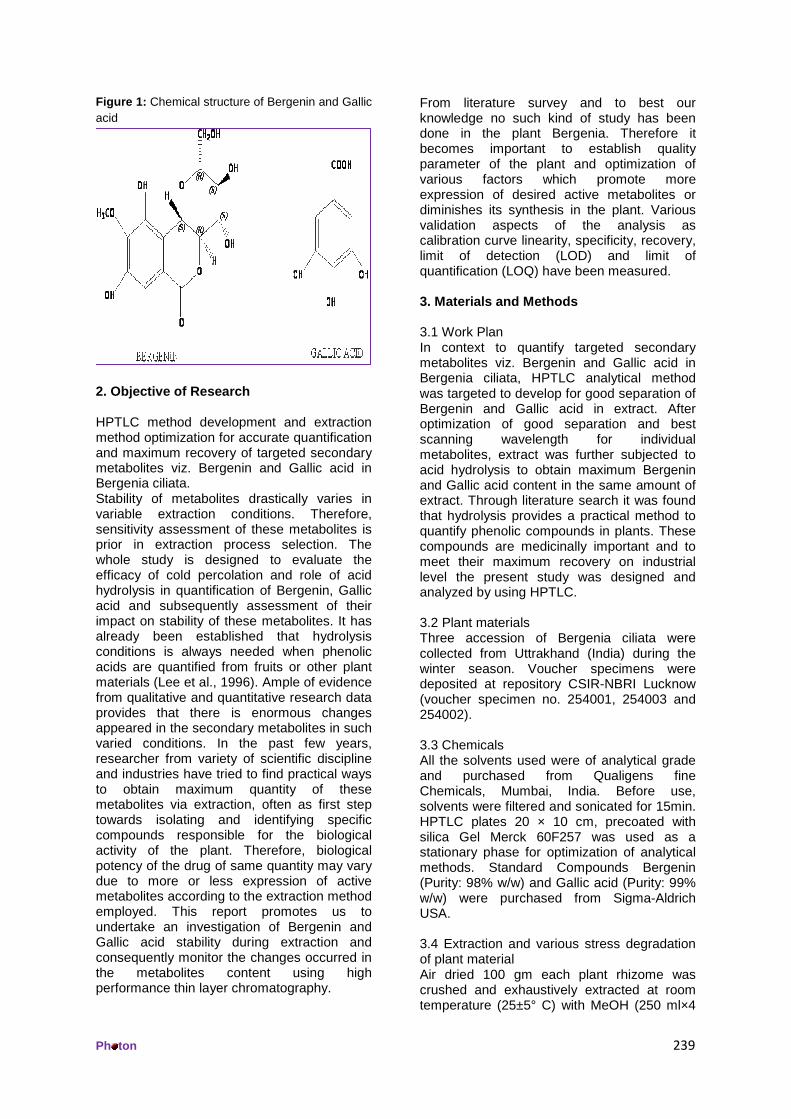
Figure 2: Percentage variation of secondary metabolites of Bergenia ciliata (a) Bergenin % variation (b) Gallic acid % variation (a) (b)
Ph ton 241
Table 1: Amount of secondary metabolites quantified in three accession of Bergenia ciliata before and after acid hydrolysis
Accession 1,2,3 Quantification Line Extract (MeOH) Applied sample volume Content of Phytochemicals; %
10mg/ml; 10µl Bergenin Gallic acid Line 1 Batch 1 10 µl 0.61 0.087 Line2 Hydrolysed Batch 1 10 µl 0.78 0.043 Line 3 Batch 2 10 µl 0.56 0.059 Line 4 Batch 3 10 µl 0.51 0.056
Figure 3: HPTLC chromatogram of extract; (A) Bergenin separation and scanning at wavelength 250nm (B) Gallic acid scanning at wavelength 280nm
Ph ton 242
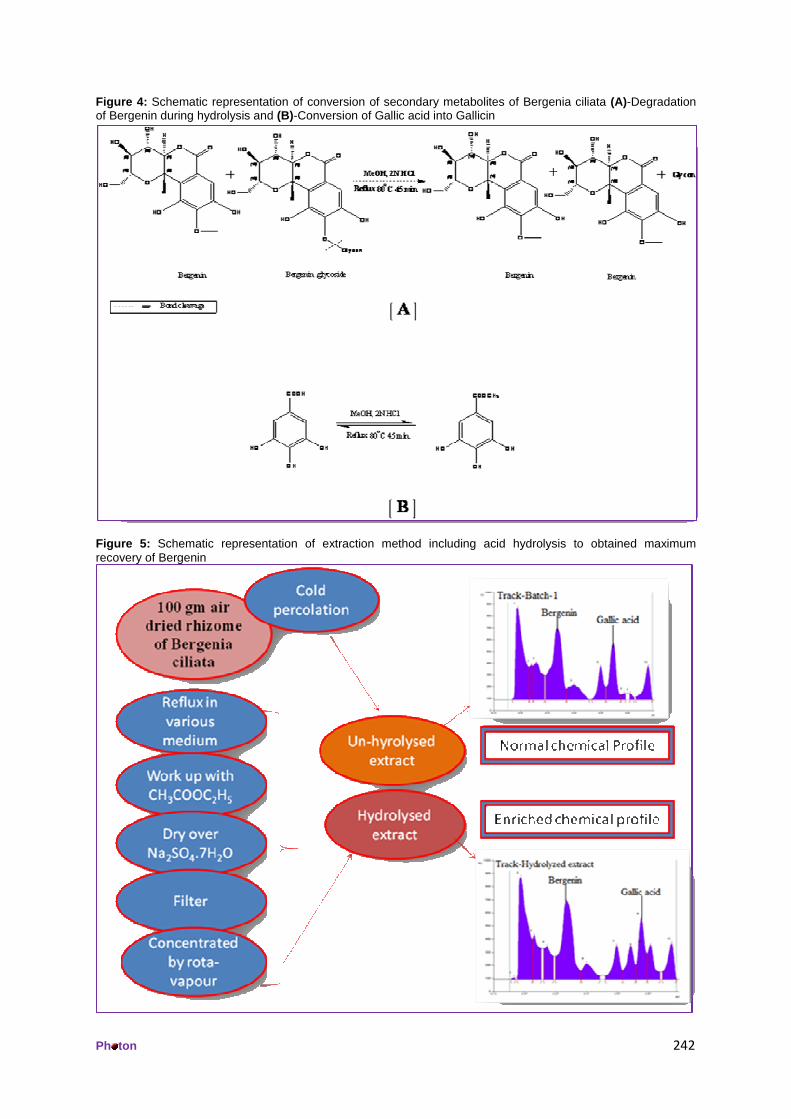
Figure 4: Schematic representation of conversion of secondary metabolites of Bergenia ciliata (A)-Degradation of Bergenin during hydrolysis and (B)-Conversion of Gallic acid into Gallicin
Figure 5: Schematic representation of extraction method including acid hydrolysis to obtained maximum recovery of Bergenin
Ph ton 243
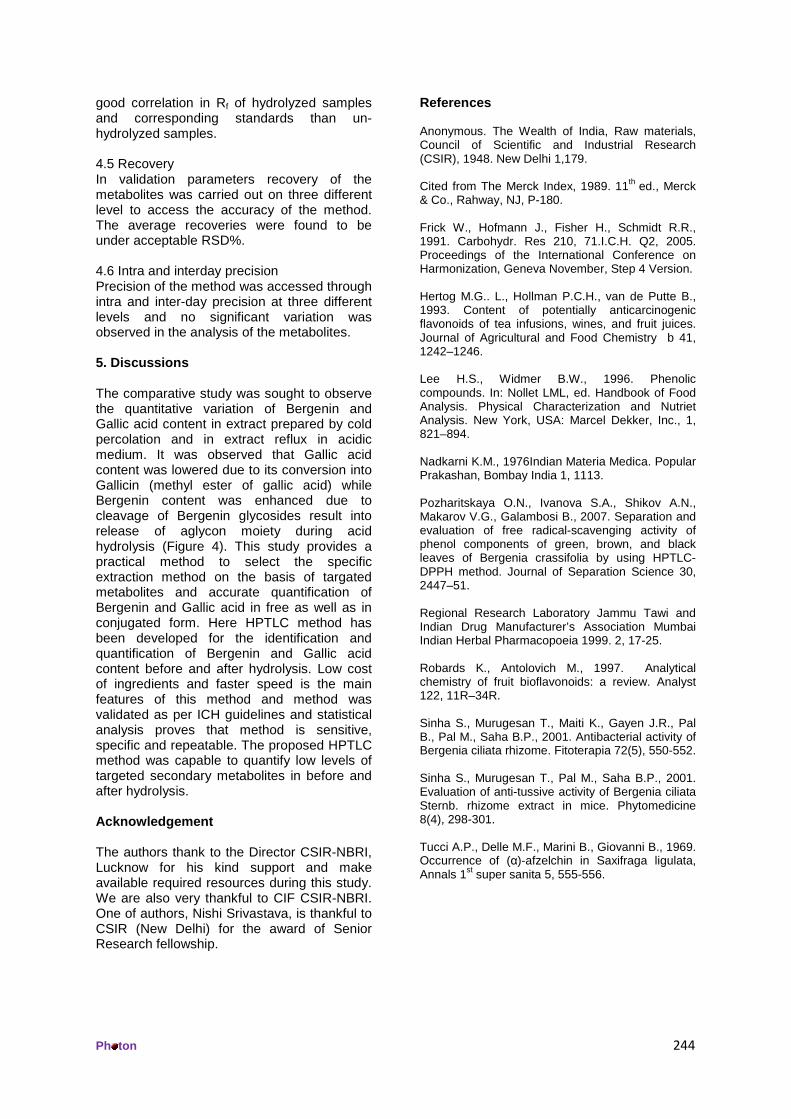
Table 2: Statistical analysis of calibration curves in the HPTLC determination of secondary metabolites Parameters A B Rf value 0.41 0.81 Slope 6.271 37.51 Intercept 272.8 1377 Linearity range 200-600ng/spot 200-600ng/spot Correlation coefficient (r) 0.998 0.996 95% Confidence limits of intercept -272.86 1377.71 LOD 60.4 80.3 LOQ 187.72 196.43 SE of Intercept 132.26 1191.41 SD of Intercept 198.4 1787.11 P-value 0.031 0.046 Upper 95.0% 1407.75 16516.04 Lower 95.0% -1953.47 -13760.61
4. Results Assessment and improvement in the classical methodology of extraction is of urgent need to recover optimum quantity and purity of targeted secondary metabolites in the plant extract. Considering both precision and economical reasons, acid hydrolysis methods were adopted in this study. A comparison of acid hydrolysis methods and normal cold percolation effect on the quantity of Bergenin and Gallic acid are illustrated in (Figure-5). The optimized extraction methods were developed to obtain optimum Bergenin yield in extract. Stability of secondary metabolites is also varied on varying extraction conditions. However, this kind of study has already been reported in flavonol glycosides to their corresponding aglycones offers a practical method for the quantification of flavonols in foods (Hertog et al. 1993; Robards et al. 1997). Result interpretation reveals that hydrolysis brings not only quantitative variation but also induces conversion of secondary metabolites into another compounds. In the present study it was observed that Bergenin content was enhanced after hydrolysis while on the other hand Gallic acid content was lowered. Enrichment in bergenin content is the result of release of aglygones moiety from conjugated Bergenin by hydrolysis and lowering of Gallic acid content is due to esterification of Gallic acid into Gallicin. (Figure 4) Bergenin and Gallic acid both are biologically active compounds as well as industrially important chemicals. Therefore, evidence from the present experiment revealed that cold percolation can be choice of extraction when the activity is dependent on Gallic acid moiety as antioxidant and acid hydrolysis of extract prepared by cold percolation, will be the best choice of extraction when the activity is lying around Bergenin content only. This technique of
selection of extraction method is very useful on industrial level to extract the secondary metabolites as per their need. The whole quantitative changes were monitored using high performance thin layer chromatography. 4.1 Method validation In the employed experimental condition and HPTLC method includes evaluation of the following performance parameters such as linearity, limit of sensitivities according to the guidelines of (I.C.H., Q2, 2005). 4.2 Linearity and calibration curve Linearity of an analytical method represents its ability, within a given range, to obtain the test results directly or through a mathematical transformation, proportional to concentration of used analyte. The calibration curve was found linear in the concentration range 200-600 ng/spot of Bergenin and 200-600 ng/spot of Gallic acid with correlation coefficients (r) 0.998 and 0.996 respectively. The regression data obtained in showed good linear relationship (Table 2). 4.3 LOD and LOQ Evaluation of limit of detection and limit of quantification was done using different concentration of the standard solutions of Bergenin and Gallic acid along with methanol as blank. The LOD values (ng/band) were found to be 60.4 for compound Bergenin and 80.3 for gallic acid while LOQ values were found to be 187.72 and 196.43 respectively (Table 2). 4.4 Specificity The specificity of the method was accessed by analyzing standards and samples. The Bergenin and Gallic acid were separated in the samples and confirmed by comparing the Rf and spectra of the spot with that of standard. Similarity in Rf of standards and samples were assessed before and after hydrolysis showed
Ph ton 244
good correlation in Rf of hydrolyzed samples and corresponding standards than un-hydrolyzed samples. 4.5 Recovery In validation parameters recovery of the metabolites was carried out on three different level to access the accuracy of the method. The average recoveries were found to be under acceptable RSD%. 4.6 Intra and interday precision Precision of the method was accessed through intra and inter-day precision at three different levels and no significant variation was observed in the analysis of the metabolites. 5. Discussions The comparative study was sought to observe the quantitative variation of Bergenin and Gallic acid content in extract prepared by cold percolation and in extract reflux in acidic medium. It was observed that Gallic acid content was lowered due to its conversion into Gallicin (methyl ester of gallic acid) while Bergenin content was enhanced due to cleavage of Bergenin glycosides result into release of aglycon moiety during acid hydrolysis (Figure 4). This study provides a practical method to select the specific extraction method on the basis of targated metabolites and accurate quantification of Bergenin and Gallic acid in free as well as in conjugated form. Here HPTLC method has been developed for the identification and quantification of Bergenin and Gallic acid content before and after hydrolysis. Low cost of ingredients and faster speed is the main features of this method and method was validated as per ICH guidelines and statistical analysis proves that method is sensitive, specific and repeatable. The proposed HPTLC method was capable to quantify low levels of targeted secondary metabolites in before and after hydrolysis. Acknowledgement The authors thank to the Director CSIR-NBRI, Lucknow for his kind support and make available required resources during this study. We are also very thankful to CIF CSIR-NBRI. One of authors, Nishi Srivastava, is thankful to CSIR (New Delhi) for the award of Senior Research fellowship.
References Anonymous. The Wealth of India, Raw materials, Council of Scientific and Industrial Research (CSIR), 1948. New Delhi 1,179. Cited from The Merck Index, 1989. 11th ed., Merck & Co., Rahway, NJ, P-180. Frick W., Hofmann J., Fisher H., Schmidt R.R., 1991. Carbohydr. Res 210, 71.I.C.H. Q2, 2005. Proceedings of the International Conference on Harmonization, Geneva November, Step 4 Version. Hertog M.G.. L., Hollman P.C.H., van de Putte B., 1993. Content of potentially anticarcinogenic flavonoids of tea infusions, wines, and fruit juices. Journal of Agricultural and Food Chemistry b 41, 1242–1246. Lee H.S., Widmer B.W., 1996. Phenolic compounds. In: Nollet LML, ed. Handbook of Food Analysis. Physical Characterization and Nutriet Analysis. New York, USA: Marcel Dekker, Inc., 1, 821–894. Nadkarni K.M., 1976Indian Materia Medica. Popular Prakashan, Bombay India 1, 1113. Pozharitskaya O.N., Ivanova S.A., Shikov A.N., Makarov V.G., Galambosi B., 2007. Separation and evaluation of free radical-scavenging activity of phenol components of green, brown, and black leaves of Bergenia crassifolia by using HPTLC-DPPH method. Journal of Separation Science 30, 2447–51. Regional Research Laboratory Jammu Tawi and Indian Drug Manufacturer’s Association Mumbai Indian Herbal Pharmacopoeia 1999. 2, 17-25. Robards K., Antolovich M., 1997. Analytical chemistry of fruit bioflavonoids: a review. Analyst 122, 11R–34R. Sinha S., Murugesan T., Maiti K., Gayen J.R., Pal B., Pal M., Saha B.P., 2001. Antibacterial activity of Bergenia ciliata rhizome. Fitoterapia 72(5), 550-552. Sinha S., Murugesan T., Pal M., Saha B.P., 2001. Evaluation of anti-tussive activity of Bergenia ciliata Sternb. rhizome extract in mice. Phytomedicine 8(4), 298-301. Tucci A.P., Delle M.F., Marini B., Giovanni B., 1969. Occurrence of (α)-afzelchin in Saxifraga ligulata, Annals 1st super sanita 5, 555-556.