How should we teach tree-thinking? An experimental test of two hypotheses
11
RESEARCH ARTICLE Open Access How should we teach tree-thinking? An experimental test of two hypotheses Sarah L Eddy * , Alison J Crowe, Mary Pat Wenderoth and Scott Freeman Abstract Background: Phylogenies are ubiquitous in college-level biology textbooks, yet many college students continue to struggle to interpret them correctly. Multiple activities and frameworks for teaching phylogenies have been proposed to address this problem. In an introductory biology course for majors, we tested two contrasting hypotheses about the best way for students to learn the basic principles of ‘tree-thinking’. Methods: We constructed two 30-minute, pencil-and-paper-based guided group activities: one focused on using a character matrix to build a tree and one focused on analyzing an existing tree. Groups of three students completed one of these activities during one class session of a large lecture course. All students completed an identical assessment the night of the activity. Results: We confirmed that students in the two groups were of equal academic ability, and found that students in the ‘build your own tree’ treatment performed significantly better on the assessment than students in the ‘analyze an existing tree’ treatment. We also had first-year graduate students in a Biology PhD program complete the assessment, without doing the activity beforehand. The scores of undergraduates who had done a modified version of the tree building activity were indistinguishable from those of the graduate students. Conclusion: We recommend simple tree-building activities be a standard part of training for tree-thinking in introductory biology. Keywords: Tree-thinking, Reading trees, Phylogeny, Active learning, Scientific teaching Background Student acceptance of evolution is influenced by their un- derstanding of the history of life (Nadelson and Southerland 2010). Comprehending long-term evolution- ary change, in turn, requires a grasp of speciation, the ori- gin of major innovations, and deep evolutionary time. Unfortunately, students often come to biology with naïve ideas about the evolution of species. For example, many students believe that new species appear when one species evolves into another, rather than when one lineage splits in two (Novick and Catley 2007). This misconception can lead to confusion and a de-valuing of the available evidence for evolution (Padian and Angielczyk 2007). One way to address these naïve student understandings is to teach tree-thinking at the introductory level. Phylogenetic trees - representations of evolutionary relationships among a set of taxa - can be used in the classroom to illustrate the pat- terns and timescale of evolutionary change (Catley and Novick 2009; Mead 2009). Because of their usefulness in depicting patterns of evolutionary relationships, phylogenies permeate the sci- entific literature and biology textbooks (Catley and Novick 2008). Unfortunately, many students find them difficult to interpret and have trouble determining which features of trees contain pertinent information and which do not (Sandvik 2008; Halverson 2011). Some of the most commonly reported misconceptions about trees include: interpreting species relatedness using branch tip proximity (Baum et al. 2005; Meir et al. 2007); orienting time incorrectly relative to the tree (for example, identifying some tips as ancestors) (Meir et al. 2007; Omland et al. 2008); * Correspondence: sleddy@uw Department of Biology, University of Washington, Box 355320, Seattle WA 98195, USA © 2013 Eddy et al.; licensee Springer. This is an Open Access article distributed under the terms of the Creative Commons Attribution License (http://creativecommons.org/licenses/by/2.0), which permits unrestricted use, distribution, and reproduction in any medium, provided the original work is properly cited. Eddy et al. Evolution: Education and Outreach 2013, 6:13 http://www.evolution-outreach.com/content/6/1/13
-
Upload
washington -
Category
Documents
-
view
3 -
download
0
Transcript of How should we teach tree-thinking? An experimental test of two hypotheses

Eddy et al. Evolution: Education and Outreach 2013, 6:13http://www.evolution-outreach.com/content/6/1/13
RESEARCH ARTICLE Open Access
How should we teach tree-thinking? Anexperimental test of two hypothesesSarah L Eddy*, Alison J Crowe, Mary Pat Wenderoth and Scott Freeman
Abstract
Background: Phylogenies are ubiquitous in college-level biology textbooks, yet many college students continue tostruggle to interpret them correctly. Multiple activities and frameworks for teaching phylogenies have been proposedto address this problem. In an introductory biology course for majors, we tested two contrasting hypotheses about thebest way for students to learn the basic principles of ‘tree-thinking’.
Methods: We constructed two 30-minute, pencil-and-paper-based guided group activities: one focused on using acharacter matrix to build a tree and one focused on analyzing an existing tree. Groups of three students completedone of these activities during one class session of a large lecture course. All students completed an identicalassessment the night of the activity.
Results: We confirmed that students in the two groups were of equal academic ability, and found that students in the‘build your own tree’ treatment performed significantly better on the assessment than students in the ‘analyze anexisting tree’ treatment. We also had first-year graduate students in a Biology PhD program complete the assessment,without doing the activity beforehand. The scores of undergraduates who had done a modified version of the treebuilding activity were indistinguishable from those of the graduate students.
Conclusion: We recommend simple tree-building activities be a standard part of training for tree-thinking inintroductory biology.
Keywords: Tree-thinking, Reading trees, Phylogeny, Active learning, Scientific teaching
BackgroundStudent acceptance of evolution is influenced by their un-derstanding of the history of life (Nadelson andSoutherland 2010). Comprehending long-term evolution-ary change, in turn, requires a grasp of speciation, the ori-gin of major innovations, and deep evolutionary time.Unfortunately, students often come to biology with naïveideas about the evolution of species. For example, manystudents believe that new species appear when one speciesevolves into another, rather than when one lineage splits intwo (Novick and Catley 2007). This misconception canlead to confusion and a de-valuing of the available evidencefor evolution (Padian and Angielczyk 2007). One way toaddress these naïve student understandings is to teachtree-thinking at the introductory level. Phylogenetic trees -representations of evolutionary relationships among a set
* Correspondence: sleddy@uwDepartment of Biology, University of Washington, Box 355320, SeattleWA 98195, USA
© 2013 Eddy et al.; licensee Springer. This is anAttribution License (http://creativecommons.orin any medium, provided the original work is p
of taxa - can be used in the classroom to illustrate the pat-terns and timescale of evolutionary change (Catley andNovick 2009; Mead 2009).Because of their usefulness in depicting patterns of
evolutionary relationships, phylogenies permeate the sci-entific literature and biology textbooks (Catley andNovick 2008). Unfortunately, many students find themdifficult to interpret and have trouble determining whichfeatures of trees contain pertinent information andwhich do not (Sandvik 2008; Halverson 2011). Some ofthe most commonly reported misconceptions abouttrees include:
� interpreting species relatedness using branch tipproximity (Baum et al. 2005; Meir et al. 2007);
� orienting time incorrectly relative to the tree (forexample, identifying some tips as ancestors) (Meiret al. 2007; Omland et al. 2008);
Open Access article distributed under the terms of the Creative Commonsg/licenses/by/2.0), which permits unrestricted use, distribution, and reproductionroperly cited.

Eddy et al. Evolution: Education and Outreach 2013, 6:13 Page 2 of 11http://www.evolution-outreach.com/content/6/1/13
� counting intervening nodes to determine relatedness(Meir et al. 2007);
� identifying lineages that split off earlier in time orthat have fewer extant taxa as more basal orprimitive (Crisp and Cook 2005; Omland et al.2008); and
� believing that no evolutionary change occurs on astraight line (Novick and Catley 2007; Meir et al. 2007).
In addition to identifying multiple student misconcep-tions about trees, these studies also documented thatsome college-level students do not know how to use treesto determine relationships. In cases like this, students willsimply ignore the tree and instead rely on their priorknowledge of the characteristics of the organisms involved(Gregory 2008; Halverson et al. 2011). The overall conclu-sion from these studies is that students do not enter col-lege biology courses understanding how to read treescorrectly. They need instruction and deliberate practice.Many researchers have proposed strategies for teaching
students how to read trees. Some of these approachesfocus on how the trees themselves should be representedin the classroom and in textbooks. For example, studentunderstanding is improved by drawing trees as bracketsrather than diagonal lines (Novick and Catley 2007; Baumand Offner 2008) and including synapomorphies on thebranches (Catley et al. 2010; Novick et al. 2010a).Other educators have focused on designing activities
to develop students’ tree-thinking skills. These activitiesinvolve the students either building trees or analyzingexisting trees. The majority of published activities fo-cusing on phylogenies require students to build treesbased on a given dataset (Gendron 2000; Singer et al.2001; Goldsmith 2003; Julius and Schoenfuss 2006;Lents et al. 2010). Although not explicitly stated, theseinterventions appear to be based on the hypothesis thatstudents will understand phylogenies better if theylearn by building them. In contrast to this hypothesis,Halverson (2011) argues that the skills necessary to buildtrees are different from the skills necessary to read trees,and that combining the two tasks adds an unnecessarylayer of complexity to the already difficult problem ofinterpreting trees. Through interviews and analysis of stu-dent assignments, Halverson found that students developtree-reading skills prior to tree-building skills. This phil-osophy, of having students analyze existing trees prior tobuilding them, is reflected in the design of Catley andNovick’s (2012) activity.We proposed to test whether a student’s initial ability to
read and interpret trees is best-developed in the context oftree reading or tree building. Should students be intro-duced to tree-thinking by analyzing an existing tree, asproposed by Halverson et al. (2011), or creating a treebased on evidence?
Establishing tree-thinking benchmarksTwo of the challenges in studies like this one are deter-mining how best to measure student achievement andhow to determine when an intervention leads to ‘goodenough’ achievement. Pre-/post-tests can evaluate studentlearning gains, but these gains need to be compared to arelevant benchmark to evaluate an intervention’s educa-tional impact. Although learning gains observed in otherstudies offer one potential benchmark, cross-study com-parisons can be difficult. Many factors can create variationin the magnitude of gains documented in pre-/post-test-ing, including the topic being tested and the time intervalbetween the pre- and post-test. In the literature on phy-logenies, several alternative benchmarks have beenemployed to put student gains into context. Novick et al.(2010b) compared gains in tree-thinking between (a) 2.5hours of lecture instruction on reading phylogenies and(b) simply adding synapomorphies to tree diagrams. Theyfound that adding synapomorphies to a tree led to thesame gains in student learning as the lecturing. Althoughappropriate for their study design, (because they were test-ing a visualization vs. instruction), in general it is notuseful to contrast learning gains from a lecture with re-sults from an activity. Education research has alreadyestablished that exercises where students are actively en-gaged lead to greater average learning gains than listeningto lecture (Dirks 2011; Ruiz-Primo et al. 2011). Thus, ex-periments based on teaching a topic through a particularactivity versus a lecture confound the impact of activelearning with the effect that researchers may be most in-terested in: whether a particular conceptual approach toteaching the topic (for example, building trees) helps stu-dents more than an alternative one (for example, analyzingtrees). Therefore, a more informative comparison is toevaluate learning gains from contrasting activities. Thismethod allows researchers to evaluate competing hypoth-eses about how students learn best for a specific topic,within the constructivist context of an active learning ex-ercise. Perry et al. (2008) employed this method to com-pare learning gains in tree-thinking between two activities:a computer simulation and a pencil-and-paper activity andfound the two methods produced equivalent learninggains.In addition, even though comparing learning gains
across studies can provide a framework for comparinghypotheses, they cannot help us assess whether an inter-vention has had a significant impact on student learning - unless we define what significant means. In bio-logical research, results are grounded in physiologicallyor ecologically relevant effects. In education researchwe need an analogous evaluation of educationallyrelevant effects. Part of accomplishing this task isestablishing a target - a level of understanding that is ac-ceptable for students at a particular stage in their
Eddy et al. Evolution: Education and Outreach 2013, 6:13 Page 3 of 11http://www.evolution-outreach.com/content/6/1/13
training. Three readily assessable options for bench-marks to compare introductory biology students’ under-standing to could be:
1. Advanced undergraduate understanding.Performance of students in upper-level biologyclasses could be used as a benchmark. The onlytree-thinking study looking at upper level collegestudents found that, as compared to introductorystudent, these upper division students showed onlysmall improvements in their tree-thinking skills(Meir et al. 2007).
2. Expert level understanding. A few studies in thethree-thinking literature have compared studentperformance (after one term of phylogenyinstruction) to the understanding displayed byresearchers in the field (Halverson et al. 2011;Novick and Catley 2007). No students reached theexpert level of understanding in either study, whichmay not be surprising given the disparity in trainingand experience. Expert-level understanding maysimply be setting the bar too high.
3. First year graduate students’ understanding. Wepropose that a more realistic comparison would be first-year graduate students. Although this comparison hasnot been previously made in the phylogeny literature,physics education researchers have frequently used thelevel of understanding exhibited by entering graduatestudents as a benchmark (for example, Shaffer andMcDermott 2005). This ‘target’ is ambitious comparedto upper level undergraduates but is educationallyrelevant for instructors preparing students for graduateor professional school.
The purpose of this study is to assess whether tree-building or tree-analyzing leads to greater student progresson these learning objectives. To evaluate the level of studentunderstanding recorded after our tree-thinking intervention,we compared student tree-thinking skills between the twotreatments and to those of first-year graduate students.
MethodsCourse description and activity designPhylogenies are introduced in the first quarter of athree-quarter introductory sequence for biology majorsat the University of Washington. The initial course,Bio180, covers evolution, Mendelian genetics, and ecol-ogy, along with a brief survey of the diversity of life.Each week students attend four 50-minute lectures andone 2-hour lab. The course is offered every quarter; 600-700 students enroll each term during the academic year.This study spanned two quarters - Spring and Fall of
2011 - each of which had a different instructor. To con-trol for instructor differences, we made comparisons
within each quarter only. The majority of students in thecourse were sophomores, and approximately 15% of stu-dents each term were enrolled in the Education Oppor-tunity Program (EOP), meaning that they had beenidentified by the Admissions Office as economically oreducationally disadvantaged.
Tree-thinking guided group activitiesFor students who are just being introduced to tree-thinking,our learning objectives are similar to those suggested byBaum et al. (2006) and address several common misconcep-tions about interpreting phylogenies. After our intervention,we wanted our students to be able to:
� Use trees to determine ancestor-descendantrelationships and degrees of relatedness among taxa;
� Map where particular traits evolved on the branchesof trees and diagnose homoplasy;
� Use shared, derived characters to place taxa on a tree;� Recognize that traits do not necessarily evolve in a
progressive manner;� Recognize that a species cannot be considered
higher or lower than others (tree- vs. progressivist/ladder-of-life thinking);
� Recognize that extant traits can be considered basal,but that extant species cannot.
In the classic backwards design tradition (McTighe &Wiggins 1999), these learning outcomes were used todesign our post-intervention assessment and the twoguided group activities that would be used in class.The initial guided group activities were based on exam
questions, clicker questions, and problems for informalgroup work that one of the authors (SF) had used in sev-eral previous iterations of the course. The scenarios andquestions were modified based on input from students,teaching assistants, and the instructor, and then re-written for inclusion in the guided group activities. Theactivities were completed by small groups of students(2-3) who worked through a single 8½ × 11 sheet ofquestions, copied both sides. Each activity started with aset of unique questions that guided the students throughtheir assigned task (either building or analyzing a tree).Students then used the tree the built or analyzed tocomplete a set of short answer questions shared acrossthe two activities focused on common misconceptionsabout interpreting trees - including how to determinerelative relatedness and whether one species can bemore advanced or primitive than another.Activity 1: Building Trees. Students in this treatment
constructed a tree of six major groups of chordates usinga table of morphological characters (Additional file 1:Supplement 1).

Eddy et al. Evolution: Education and Outreach 2013, 6:13 Page 4 of 11http://www.evolution-outreach.com/content/6/1/13
Activity 2: Analyzing Trees. Students in this treatmentmapped morphological characters on an existing treerepresenting six major groups of chordates (Additionalfile 1: Supplement 2). They also were asked to draw analternative representation of the tree which maintainedthe given relationships.
Experiment 1: is student ability to interpret phylogeniesmaximized by introducing tree-thinking through buildinga tree or analyzing an existing tree?In Spring 2011, students were assigned an initial readingassignment on phylogenies from the textbook requiredfor the course. In class, the instructor briefly introducedtree-thinking in an approximately 10-minute mini-lecture. Students (n = 314) in the lecture hall were theninstructed to work in groups of two to three on one of thetwo randomly-assigned tree-thinking activities. The activ-ities took approximately 30 minutes for students tocomplete. During the activity, teaching assistants (one TAper 50 students) and the instructor walked around theroom and engaged student groups who had questions.After students turned in their activities, the instructorended the class session with a 10-minute wrap-up lecture.Students earned two course points for participating in theexercise (approximately 0.25% of their final grade). Stu-dents were not given feedback on their activity answersbefore the post-class assessment (but were provided a keyto the activities after the assessment was due). Activitieswere later scored for correctness, but this score did not in-fluence student grades.
Assessment development and implementationThe night of the classroom activities, students com-pleted a post-activity assessment consisting of eightmultiple-choice questions (Additional file 1: Supplement3). We used a night of assessment to isolate the impactof the in-class activity versus any influence of additionalreading or instruction in other class sessions or labs.This assessment was intended as a formative assessmentthat provided students an opportunity for deliberatepractice on concepts that one of the authors (SF) hadobserved to be challenging in previous terms and thathave been identified in the literature (Baum and Offner2008). The questions were written with the intent ofdocumenting whether students had mastered the keyconcepts of tree-thinking, not to identify students ofvarying ability. (Stated another way, we hoped that themajority of students would get the questions right afterinstruction). The assessment questions developed wereexamined for content validity by three additional in-structors who have taught tree-thinking in introductoryand upper-level biology courses. These instructors con-firmed that all the questions addressed their associatedlearning goals.
In this assessment, students used an existing tree tomake conclusions about relative relatedness, location ofsynapomorphies, homology vs. homoplasy, and whetherany species were more advanced or primitive than another.Students earned two course points for completing this as-sessment (approximately 0.25% of their final grade) andthe majority of students did so (87.9% of the class).
Statistical analysesIn addition to qualitative measures, assessment validity andreliability were explored using item response theory. Todocument construct reliability, a Person Separation Reli-ability Index (analogous to Cronbach’s alpha; Bond andFox 2001) was calculated in Winsteps (Linacre 2012). Per-son Separation Reliability measures the replicability of theordering of persons (by ability) if they were given anotherinstrument measuring the same construct (in this casetree-thinking skills). To test the assumption that eachquestion was valid, we assessed item fit (Bond and Fox2001) using the eRM package in R (Mair and Hatzinger2007). Item fit measures whether each item is measuringthe same construct as the rest of the items on the exam(that is, tree-thinking skills vs. reading comprehension orsome other skill). Significant P values for item fit indicatean item is not measuring tree-thinking. To explore therelative challenge of the assessment questions, we createdWright Maps using the eRM package in R. This alsoallowed us to determine how well our questions were ableto parse out differences in student ability and to rank thequestions by difficulty (Lim et al. 2009).We analyzed two aspects of student achievement in
this experiment. Our first goal was to assess whetherstudents, with minimal instructor contribution (approxi-mately 10 minutes of lecture), could correctly reasonthrough questions on the in-class activity that addressedcommon misconceptions about reading phylogenies. Todo so, we quantified the proportion of student groupsthat correctly answered each question on the two activ-ities. Exam scores in this course typically range from65% to 72%, so on average we would expect about 70%of the class to be able to answer each question in the ac-tivities correctly. To evaluate whether students did wellor poorly on the activity questions, we used a more con-servative threshold of 80%. Our cutoff is more stringentbecause the clicker literature demonstrates that studentresponses improve when they are allowed to discusstheir answers with each other over when they workalone (Smith et al. 2011) and the activities encouragedstudents to work together on the questions.Our second goal was to determine whether there was a
difference between the two activities in their effectivenessat improving student ability to interpret phylogenies.Therefore, we compared student post-activity assessmentscores (out of a possible 8 points) between the two activity
Sarah
Highlight
Sarah
Highlight

Eddy et al. Evolution: Education and Outreach 2013, 6:13 Page 5 of 11http://www.evolution-outreach.com/content/6/1/13
types. The first two questions on the post-activity assess-ment had students place a clade on a tree similar to thetree-building activity, which could have biased the assess-ment results in favor of the tree building activity. To con-trol for this potential bias towards the building treesactivity, we ran a second analysis with a reduced set of as-sessment questions that did not include questions 1 and 2.Student scores on the post-activity assessment were
highly left skewed, bounded on both sides (ranging onlyfrom 0 to 8 or 0 to 6) and discrete (no partial credit wasgiven for incorrect answers). Thus, we could not meetthe data normality assumption of most parametric tests.We therefore employed a proportional-odds logistic re-gression, which is an extension of standard logistic re-gression (Moutinho and Hutcheson 2011; Antione andHarrell 2000), implemented in R with the package MASS(Venables and Ripley 2002). For our full analysis witheight questions, this regression models the effect of ourexplanatory variables (including activity type and studentability - described more below) on our ordered,categorical-response variable (the total number of ques-tions on the assessment answered correctly) through aseries of seven dichotomous comparisons: getting onequestion correct versus two, three, four, five, six, seven,or eight questions correct; getting one or two questionscorrect versus three, four, five, six, seven, or eight cor-rect, and so on. (There were no 0s on the assessment, sothe 0 versus 8 comparison was not included). The effectof the explanatory variables is then averaged across allseven comparisons. The betas in this model can thus beinterpreted as the effect that a change in the explanatoryvariable has on the log-odds that the score on the assess-ment will be in a higher rather than lower category (forexample, eight correct vs. seven). The same test wasperformed with the reduced set of six questions.To control for potential differences in the academic abil-
ity of students assigned to the two activity types, we in-cluded the predicted grade for each student in the course,calculated from college GPA and SAT scores (see Freeman2007), as an explanatory variable along with the activitytype (building or analyzing a tree). We were particularlyinterested in documenting whether EOP studentsperformed better or worse than non-EOP students on thistask, so EOP status was the third explanatory variable in-cluded in the model. This comparison was of interest be-cause EOP students historically perform worse onassessments in this course than non-EOP students, butclassroom activities like the activities tested here have beenshown to reduce the achievement gap (Haak et al. 2011).We used a likelihood ratio test to determine the signifi-
cance of our explanatory variables. This test compares afull model, including the variable of interest, to a modelwithout the variable of interest but retaining the other twoexplanatory variables. For example, we compared a full
model with EOP status, predicted grade and activity typeto a reduced model with just EOP status and predictedgrade. If this reduced model was a significantly worse fitto our data, then we concluded that the variable of interestwas significant (Fox and Weisberg 2011). This test wasimplemented in R using the car package (Fox andWeisberg 2011).
Experiment 2: is a student’s ability to interpretphylogenies after the tree-building activity comparable tothat of a graduate student in biology?This experiment occurred in Fall 2011. As in Spring2011, students (n = 491) were instructed to read a chap-ter on phylogenies before class; they also took a readingquiz focused on tree vocabulary and basic concepts be-fore class. At the start of the class session, the instructorintroduced tree-thinking with a clicker question andthen students worked in groups to complete a modifiedversion of the tree-building activity (Additional file 1:Supplement 4). The decision to focus on the tree-building activity was made based on the results from Ex-periment 1.
AssessmentThe night of the classroom activity, students completedan assessment consisting of 13 multiple-choice questionseach worth 1 point (Additional file 1: Supplement 5).Eight of the questions were identical to those found inthe Spring 2011 assessment. Five new questions wereadded in fall, drawn from a tree-thinking concept inven-tory developed by Naegle (2009). The addition of thesefive questions was done to increase our ability to dis-criminate between students of different ability levels (aresponse to our Spring 2011 results). Students earnedtwo points for completing the assessment (0.25% of theirfinal grade). In Spring 2012, 12 biology graduate stu-dents completing their first year of graduate school com-pleted the same 13-question assessment. These graduatestudents were from a heterogeneous biology departmentwith four students in molecular, cellular, and develop-mental biology, seven in evolution, ecology, and conser-vation biology, and one from physiology, behavior, andbiomechanics. These graduate students were blind to thepurpose of the experiment.
Statistical analysesWe used a randomization test to determine whetherundergraduate and graduate student scores on the post-activity assessment were equivalent. The randomizationtest was necessary because we had a much smaller sam-ple of graduate student responses (n = 12) compared toundergraduate (n = 491). To test whether graduate stu-dent understanding was significantly different fromundergraduate understanding, we randomly drew 12

Eddy et al. Evolution: Education and Outreach 2013, 6:13 Page 6 of 11http://www.evolution-outreach.com/content/6/1/13
scores from a pooled sample containing both graduateand undergraduate scores and calculated a median forthat sample. This sampling method was iterated 100,000times to create a distribution of median scores. Fromthis distribution we calculated a median and 95% confi-dence interval for the pooled scores. If <5% of the sam-ples had a median equal to or more extreme than thegraduate student median, then we would conclude thatthe graduate student median was significantly differentthan the undergraduate median at the P = 0.05 level.Conversely, if >95% of the draws had graduate studentslower than undergraduates, this would imply that under-graduates may have significantly outperformed thegraduate students. We assessed differences in total scoreon the assessment as well as on each of the 13questions.
ResultsExperiment 1: is student ability to interpret phylogeniesmaximized by introducing tree-thinking through buildinga tree or analyzing an existing tree?In Spring 2011, 167 students (87 groups) completed thebuilding version while 147 students (69 groups) com-pleted the analyzing version of the tree-thinking activity.Each activity had a set of unique and a set of sharedquestions. Over 80% of the student groups that did thebuilding-trees activity answered all of the questionsunique to that worksheet - questions focused on actuallybuilding the phylogeny - correctly (Figure 1). On thequestions unique to the analyzing-trees activity, resultswere mixed. Over 80% of the groups were able to suc-cessfully map characters onto the tree and reorient thetree (Figure 1), but only 26% correctly identified related-ness on the provided tree. The shared questions in the
0.0
0.2
0.4
0.6
0.8
1.0
Bu 1 Bu 2 Bu 3 Bu 4 An 1 An 2
Questions on t
% a
nsw
erin
g co
rrec
tly
Figure 1 Proportion of groups that correctly answered each questionto each activity: the building (Bu) and analyzing (An) questions and five questio>80% of student groups answered the question correctly. The actual questionsSupplement 2.
activities focused on common misconceptions abouttrees. Over 80% of all student groups were able to an-swer three of the five questions correctly (Figure 1), butthey struggled with questions asking them to evaluate rela-tive relatedness (72% answered correctly) and how longspecies have been evolving (50% answered correctly).A total of 276 students completed the post-activity assess-
ment. The median grade was 8/8 questions correct for stu-dents (n = 143) who participated in the tree-buildingactivity; the median grade was 7/8 for students (n = 133)who completed the analyzing a tree activity (Figure 2).From item fit scores, all the questions appeared to measurethe same construct (that is, were not influenced by outsidefactors like reading comprehension or other challenges un-related to tree thinking; Additional file 1: Table S1) and thuswere useful questions. We had a relatively low Person Sep-aration Reliability index (0.34 for the group analyzing a treeand 0.44 for the group building a tree) implying that wehad too few questions and too many students of high abilityto closely parse out student ability (Bond and Fox 2007; seeAdditional file 1: Figure S1 and Additional file 1: Figure S2).This is not surprising, given that we were hoping studentswould master these concepts after the intervention. For thereduced assessment, that excluded the first two questionsbiased towards the building-trees activity, the median gradefor the students in the tree-building activity was 6/6 and forstudents in the tree-analyzing activity was 5/6.In the full assessment, only activity type and predicted
grade significantly improved the fit of the model (χ2 =8.85, P = 0.003, and χ2 = 30.6, P < 0.001 respectively).Including EOP status in our model had no significantimpact on fit (χ2 = 0.296, P = 0.59). Predicted grade hadthe largest effect on the number of questions answeredcorrectly on the post-activity assessment (β = 0.94 ±
An 4 An 5 Bo 5/3 Bo 6 Bo 7 Bo 8 Bo 9
ree thinking tutorials
on two in-class tree-thinking activities. Four questions were uniquens were present in both (Bo). If the bars cross the dotted red line, thenare provided in Additional file 1: Supplement 1 and Additional file 1:

Figure 2 Student scores on an identical eight-question post-activity assessment. Students were randomly assigned to either anAnalyzing Trees or Building Trees activity.
Figure 3 The relationship between predicted grade and the numberassessment under the two activity types: analyzing (0) or building (1)less point on the assessment and one additional point (that is, the lowest lthe line) and a 5 (above the line) on the assessment). The red dotted linesshort vertical bars at the bottom of the figure are the actual student predic
Eddy et al. Evolution: Education and Outreach 2013, 6:13 Page 7 of 11http://www.evolution-outreach.com/content/6/1/13
0.18; Figure 3). Specifically, a one-point increase on a 4-point grade scale in predicted grade meant that a stu-dent was 2.6 times more likely to answer one additionalquestion correctly on the post-test assessment (all elsebeing held equal). In comparison, completing the tree-building activity rather than the tree-analysis activitymeant that a student was 2.0 times as likely to answerone additional question correctly on the post test(β = 0.68 ± 0.23; Figure 3). Thus, the increase in studentscore on the post-activity assessment attributable tocompleting the tree-building activity rather than thetree-analyzing activity was equivalent to a 0.66 increasein predicted grade.A similar pattern is observed on the reduced assess-
ment. Of the three explanatory variables tested, only ac-tivity type and predicted grade significantly improvedthe fit of the model (χ2 = 6.7, P = 0.01, and χ2 = 28.6,P < 0.001 respectively). Including EOP status in ourmodel had no significant impact on fit (χ2 = 0.49,P = 0.48). Predicted grade had the largest effect on thenumber of questions answered correctly on the post-activity assessment (β = 0.90 ± 0.18). Just as in the fullassessment, with a 1-point increase in predicted grade, astudent was 2.5 times as likely to answer an additionalquestion correctly on the assessment. Completing the
of questions answered correctly on the post-interventiontrees. The horizontal lines mark the transition between earning oneines, labeled 4 to 5, mark the transitions between getting a 4 (belowindicate the 95% point-wise confidence envelope for the model. Theted grades observed in the course.

Eddy et al. Evolution: Education and Outreach 2013, 6:13 Page 8 of 11http://www.evolution-outreach.com/content/6/1/13
tree-building activity rather than the tree-analysis activ-ity meant that a student was 1.8 times as likely to answerone additional question correctly on the six-questionpost-test (β =0.60 ± 0.23).
Experiment 2: is a student’s ability to interpretphylogenies after the classroom intervention comparableto that of a graduate student in biology?In Fall 2011, 491 undergraduates and 12 graduate studentscompleted a modified version of the post-activity assess-ment with 13 questions (each worth 1 point). The under-graduates completed the tree-building activity prior to theassessment; the graduate students did not. This assess-ment had a higher Person Reliability Index (0.69) andwas better able to distinguish students by their ability(Additional file 1: Figure S3). The median graduate stu-dent score on the assessment was 80.7 ± 4.3% (Figure 4).The median undergraduate score was 84.6 ± 0.64%. Usinga randomization test to account for the large difference insample sizes, we found that the scores of the graduate stu-dents and undergraduate students were not significantlydifferent (Figure 4b, P = 0.373). The median of the medianscore for all 10,000 draws of 12 students was 80.7 ±0.0002% which is the same as the median of the graduatestudent scores. Overall, the graduate student median scorewas greater than the pooled sample in only 62.7% of the100,000 draws. Also, undergraduate scores on individualquestions were never significantly lower than graduatestudent scores (all P >0.20; Table 1). The higher mediansand high P values reported in Table 1 for questions 7 and8 suggest that the undergraduates may actually have had
Figure 4 (a) Number of post-activity assessment questionsanswered correctly in Fall 2011, out of 13, by undergraduatestudents after the tree-building activity (n = 491) and graduatestudents without the activity (n = 12).
a better understanding of at least two of the conceptstested - that two taxa may be equally closely related to athird taxon, and that groups that retain some ancestraltraits are not lower than groups with derived versions ofthose traits (see Additional file 1: Supplement 5).
DiscussionIn this study, student performance on a tree-thinking as-sessment improved when they completed a tree-buildingversus a tree-analyzing activity in class, and studentscores on an assessment after a tree-building activitywere statistically indistinguishable from those of a groupof first-year graduate students in biology. Thus, our find-ings do not support Halverson’s (2011) hypothesis thatasking students to build trees when they are initially in-troduced to phylogenies complicates the task and re-duces their ability to read trees. The data reported heresupport the hypothesis that building trees actually im-proves student understanding of how to read trees andfurther reinforces the efforts that several authors havemade to create introductory activities based on buildingtrees (Gendron 2000; Singer et al. 2001; Goldsmith 2003;Julius and Schoenfuss 2006; Lents et al. 2010).Why is creating trees from data so beneficial? Our hy-
pothesis is that it forces students to grapple with what eachelement in a tree diagram actually represents, asrecommended by Baum and Offner (2008). As a result, stu-dents begin interpreting trees through an evolutionary lensrather than simply as a diagram (Novick and Catley 2007;Novick et al. 2010a, b). This ability can help them parse theinformation available in a tree and determine which infor-mation is biologically relevant. Thus, reading phylogeniesmay be a similar problem to interpreting schematics inphysics (Chi et al. 1981) or mathematic problems (Silver1979), where experts readily parse out which aspects of thefigure/question are relevant for problem solving becausethey know and understand the concepts underlying theproblem, while novices are distracted by superficial features.Although cognitively more challenging than reading trees(Halverson 2011), the extra effort necessary to build treesmay be worthwhile if this exercise helps students grasp theunderlying biological concepts of trees more readily.A second key finding of our study is that, with min-
imal instruction prior to the activity - a reading assign-ment and approximately 4 minutes devoted to a clickerquestion - introductory biology students are able to suc-cessfully tackle challenging questions about trees. Inaddition, as the activity presented in this paper replacedlecture, teaching tree-thinking via an activity did not re-quire any additional course time over the time tradition-ally allocated to it in the course. This course structure,where the activity replaces lecture, differentiates our ac-tivity from all but one of the previously published phyl-ogeny activities (Goldsmith 2003). In the other cases,
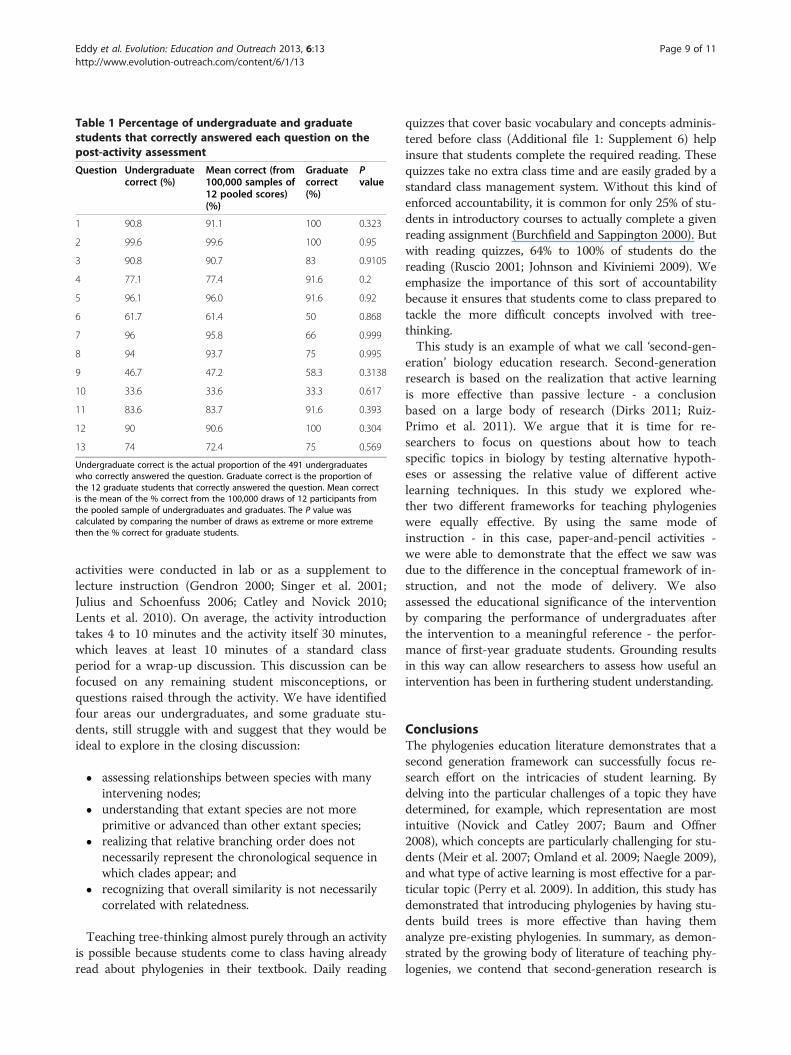
Table 1 Percentage of undergraduate and graduatestudents that correctly answered each question on thepost-activity assessment
Question Undergraduatecorrect (%)
Mean correct (from100,000 samples of12 pooled scores)(%)
Graduatecorrect(%)
Pvalue
1 90.8 91.1 100 0.323
2 99.6 99.6 100 0.95
3 90.8 90.7 83 0.9105
4 77.1 77.4 91.6 0.2
5 96.1 96.0 91.6 0.92
6 61.7 61.4 50 0.868
7 96 95.8 66 0.999
8 94 93.7 75 0.995
9 46.7 47.2 58.3 0.3138
10 33.6 33.6 33.3 0.617
11 83.6 83.7 91.6 0.393
12 90 90.6 100 0.304
13 74 72.4 75 0.569
Undergraduate correct is the actual proportion of the 491 undergraduateswho correctly answered the question. Graduate correct is the proportion ofthe 12 graduate students that correctly answered the question. Mean correctis the mean of the % correct from the 100,000 draws of 12 participants fromthe pooled sample of undergraduates and graduates. The P value wascalculated by comparing the number of draws as extreme or more extremethen the % correct for graduate students.
Eddy et al. Evolution: Education and Outreach 2013, 6:13 Page 9 of 11http://www.evolution-outreach.com/content/6/1/13
activities were conducted in lab or as a supplement tolecture instruction (Gendron 2000; Singer et al. 2001;Julius and Schoenfuss 2006; Catley and Novick 2010;Lents et al. 2010). On average, the activity introductiontakes 4 to 10 minutes and the activity itself 30 minutes,which leaves at least 10 minutes of a standard classperiod for a wrap-up discussion. This discussion can befocused on any remaining student misconceptions, orquestions raised through the activity. We have identifiedfour areas our undergraduates, and some graduate stu-dents, still struggle with and suggest that they would beideal to explore in the closing discussion:
� assessing relationships between species with manyintervening nodes;
� understanding that extant species are not moreprimitive or advanced than other extant species;
� realizing that relative branching order does notnecessarily represent the chronological sequence inwhich clades appear; and
� recognizing that overall similarity is not necessarilycorrelated with relatedness.
Teaching tree-thinking almost purely through an activityis possible because students come to class having alreadyread about phylogenies in their textbook. Daily reading
quizzes that cover basic vocabulary and concepts adminis-tered before class (Additional file 1: Supplement 6) helpinsure that students complete the required reading. Thesequizzes take no extra class time and are easily graded by astandard class management system. Without this kind ofenforced accountability, it is common for only 25% of stu-dents in introductory courses to actually complete a givenreading assignment (Burchfield and Sappington 2000). Butwith reading quizzes, 64% to 100% of students do thereading (Ruscio 2001; Johnson and Kiviniemi 2009). Weemphasize the importance of this sort of accountabilitybecause it ensures that students come to class prepared totackle the more difficult concepts involved with tree-thinking.This study is an example of what we call ‘second-gen-
eration’ biology education research. Second-generationresearch is based on the realization that active learningis more effective than passive lecture - a conclusionbased on a large body of research (Dirks 2011; Ruiz-Primo et al. 2011). We argue that it is time for re-searchers to focus on questions about how to teachspecific topics in biology by testing alternative hypoth-eses or assessing the relative value of different activelearning techniques. In this study we explored whe-ther two different frameworks for teaching phylogenieswere equally effective. By using the same mode ofinstruction - in this case, paper-and-pencil activities -we were able to demonstrate that the effect we saw wasdue to the difference in the conceptual framework of in-struction, and not the mode of delivery. We alsoassessed the educational significance of the interventionby comparing the performance of undergraduates afterthe intervention to a meaningful reference - the perfor-mance of first-year graduate students. Grounding resultsin this way can allow researchers to assess how useful anintervention has been in furthering student understanding.
ConclusionsThe phylogenies education literature demonstrates that asecond generation framework can successfully focus re-search effort on the intricacies of student learning. Bydelving into the particular challenges of a topic they havedetermined, for example, which representation are mostintuitive (Novick and Catley 2007; Baum and Offner2008), which concepts are particularly challenging for stu-dents (Meir et al. 2007; Omland et al. 2009; Naegle 2009),and what type of active learning is most effective for a par-ticular topic (Perry et al. 2009). In addition, this study hasdemonstrated that introducing phylogenies by having stu-dents build trees is more effective than having themanalyze pre-existing phylogenies. In summary, as demon-strated by the growing body of literature of teaching phy-logenies, we contend that second-generation research is

Eddy et al. Evolution: Education and Outreach 2013, 6:13 Page 10 of 11http://www.evolution-outreach.com/content/6/1/13
both stimulating and fruitful - not only for tree-thinking,but across the entire breadth of biology.
Additional file
Additional file 1: Table S1. Fit statistics for eight-question assessmentused in Spring 2011. Scores depend on students taking assessment, sopresented separately for Analyzing and Building groups. In the Analyzetreatment all the students answered question 2 correctly, so fit statisticscould not be calculated. Figure S1. Person-Item Map for eight-questionassessment for students in the Analyzing a Tree Treatment. Questions aresorted by their relative difficulty. No students got question 2 wrong andso it was not placed on this figure. Figure S2. Person Item Map foreight-question assessment for students in the Building a Tree Treatment.Questions are sorted by their relative difficulty. Figure S3. Wright Map of13-question assessment. Questions are sorted by their relative difficulty.Supplement 1: Tree-building activity (Spring 2011 version). Supplement2: Tree-analysis activity (Spring 2011 version). Supplement 3: Spring2011 Assessment. Supplement 4: Tree-building activity (Autumn 2011version). Supplement 5: Tree-thinking assessment (Autumn 2011version). Supplement 6: Tree-thinking Reading Quiz (Autumn 2011version).
Competing interestsThe authors declare that they have no competing interests.
Authors’ contributionsSE did all data analysis and figure preparation and contributed to manuscriptpreparation. AC, MPW, and SF contributed to experimental design, datacollection, and manuscript preparation, and SF wrote the assessmentquestions. All authors read and approved the final manuscript.
AcknowledgementsWe are grateful to Roddy Theobald for statistical advice, Veronica Di Stilio forpermission to perform an experiment in her class, the 1st-year graduatestudents in the University of Washington’s Department of Biology forcompleting the tree-thinking assessment, and John Parks, Dozie Okoroafor,and Mikhail Koval for logistical support. The project was funded by theNational Science Foundation (DUE-0942215).
Received: 9 April 2013 Accepted: 10 April 2013Published: 19 June 2013
ReferencesAntione, G, & Harrell, FE. (2000). Ordinal response regression models in ecology.
Journal of Vegetation Science, 11(5), 617–626.Baum, DA, & Offner, S. (2008). Phylogenies and tree-thinking. American Biology
Teacher, 70(4), 222–229.Baum, DA, Smith, SD, & Donovan, S. (2005). The tree-thinking challenge. Science,
310(5750), 979–980.Baum, DA, Smith, SD, Donovan, SS (2006). Comment on Tree-thinking (Science
Online, 22 March). AAAS Science. Magazine: Published E-Letter responses, 310,979-980. [http://www.sciencemag.org/content/310/5750/979.short/reply#sci_el_3420]. Accessed 21 August 2012.
Bond, TG, & Fox, CM. (2001). Applying the Rasch Model: Fundamental measurementin the Human Sciences. Mahwah, NJ: Lawrence Erlbaum Associates.
Burchfield, C, & Sappington, J. (2000). Compliance with required readingassignments. Teaching of Psychology, 27(1), 58–60.
Catley, KM, & Novick, LR. (2012). Phylogenetics Laboratory: ReconstructingEvolutionary History Instructors' Guide and Answer Key (version 2.2).Unpublishedlaboratory instructors' guide. Nashville, TN: Department of Psychology and HumanDevelopment, Vanderbilt University. [http://www.vanderbilt.edu/peabody/novick/evol_diagrams.html]. Accessed 21 August 2012.
Catley, KM, & Novick, LR. (2009). Digging deep: Exploring college students’ knowledgeof macroevolutionary time. Journal of Research in Science Teaching, 46(3), 311–332.
Catley, KM, & Novick, LR. (2008). Seeing the wood for the trees: An analysis ofevolutionary diagrams in biology textbooks. BioScience, 58(10), 976–987.
Catley, KM, Novick, LR, & Shade, CK. (2010). Interpreting evolutionary diagrams:When topology and process conflict. Journal of Research in Science Teaching,47(7), 861–882.
Chi, MTH, Feltovich, PJ, & Glaser, R. (1981). Categorization and representation ofphysics problems by experts and novices. Cognitive Science, 5(2), 121–152.
Crisp, MD, & Cook, LG. (2005). Do early branching lineages signify ancestral traits?Trends in Ecology and Evolution, 20(3), 122–128.
Dirks, C (2011). The current status and future direction of biology education research.National Research Council Commissioned Paper. [http://sites.nationalacademies.org/dbasse/bose/dbasse_080124#.UbjWi5xroZ5]. Accessed 21 August 2012.
Fox, J, & Weisberg, S. (2011). An R Companion to Applied Regression (2nd ed.).Thousand Oaks, CA: Sage.
Gendron, RP. (2000). The classification and evolution of caminalcules. AmericanBiology Teacher, 62(8), 570–576.
Goldsmith, DW. (2003). The Great Clade Race: presenting cladistic thinking tobiology majorsand general science students. American Biology Teacher,65(9), 679–682.
Gregory, TR. (2008). Understanding evolutionary trees. Evolution: Education andOutreach, 1(2), 121–137.
Halverson, KL, Pires, CJ, Abel, SK. (2011). Exploring the complexity of tree thinkingexpertise in an undergraduate systematics course. Science Education, 95(5),794–823.
Halverson, KL. (2011). Improving tree-thinking one learnable skill at a time.Evolution: Education and Outreach, 4(1), 95–106.
Johnson, BC, & Kiviniemi, MT. (2009). The effect of online chapter quizzes on examperformance in an undergraduate social psychology course. Teaching ofPsychology, 36(1), 3–37.
Julius, ML, & Schoenfuss, HL. (2006). Phylogenetic reconstruction as a broadlyapplicable teaching tool in the biology classroom: The value of data inestimating likely answers. Journal of College Science Teaching, 35(7), 40–45.
Lents, NH, Cifuentes, OE, & Carpi, A. (2010). Teaching the process of molecularphylogeny and systematics: a multi-part inquiry-based exercise. CBE-LifeSciences Education, 9(4), 513–523.
Lim, SM, Rodger, S, & Brown, T. (2009). Using Rasch analysis to establish constructvalidity of rehabilitation assessment tools. International Journal of Therapyand Rehabilitation, 16(5), 251–260.
Linacre, JM. (2012). Winsteps® Rasch measurement computer program. Beaverton,OR: Winsteps.com. Accessed 8 March 2012.
Mair, P, & Hatzinger, R. (2007). Extended Rasch modeling: The eRm package forthe application of IRT models in R. Journal of Statistical Software, 20(9), 1–20.
Mead, LS. (2009). Transforming our thinking about transitional forms. Evolution:Education and Outreach, 2(2), 310–314.
Meir, E, Perry, J, Herron, JC, & Kingsolver, J. (2007). College students’ misconceptionsabout evolutionary trees. American Biology Teacher, 69(7), e71–e76.
McTighe, J, & Wiggins, G. (1999). The Understanding by Design Handbook.Alexandra, VA: Association for Supervision and Curriculum Development.
Nadelson, LS, & Southerland, SA. (2010). Examining the interaction of acceptanceand understanding: How does the relationship change with a focus onmacroevolution? Evolution: Education and Outreach, 3(1), 82–88.
Novick, LR, & Catley, KM. (2007). Understanding phylogenies in biology: Theinfluence of a Gestalt perceptual principle. Journal of Experimental Psychology:Applied, 13(4), 197–223.
Novick, LR, Catley, KM, & Schreiber, EG. (2010a). Understanding Cladograms: AnIntroduction to Tree Thinking (version 3) (Unpublished instructional booklet).Nashville, TN: Department of Psychology and Human Development,Vanderbilt University.
Novick, LR, Catley, KM, & Funk, DJ. (2010b). Characters are key: the effect ofsynapomorphies on cladogram comprehension. Evolution: Education andOutreach, 3(4), 539–547.
Omland, KE, Cook, LG, & Crisp, MD. (2008). Tree thinking for all biology: the problemwith reading phylogenies as ladders of progress. BioEssays, 30(9), 854–867.
Padian, K, & Angielczyk, KD. (2007). “Transitional” forms versus transitionalfeatures. In AJ Petto & LR Godfrey (Eds.), Scientists Confront Intelligent Designand Creationism (pp. 197–230). New York, NY: Norton.
Perry, J, Meir, E, Herron, JC, Maruca, S, & Stal, D. (2008). Evaluating twoapproaches to helping college students understand evolutionary treesthrough diagramming tasks. CBE-Life Sciences Education, 7(2), 193–201.
Ruiz-Primo, MA, Briggs, D, Iverson, H, Talbot, R, & Shepard, LA. (2011). Impact ofundergraduate science course innovations on learning. Science, 331(6022), 1269.
Ruscio, J. (2001). Administering quizzes at random to increase students’ reading.Teaching of Psychology, 28(3), 204–206.

Eddy et al. Evolution: Education and Outreach 2013, 6:13 Page 11 of 11http://www.evolution-outreach.com/content/6/1/13
Sandvik, H. (2008). Tree thinking cannot be taken for granted: challenges forteaching phylogenetics. Theory in Biosciences, 127(1), 45–51.
Shaffer, PS, & McDermott, LC. (2005). A research-based approach to improvingstudent understanding of the vector nature of kinematical concepts.American Journal of Physics, 73(10), 921–931.
Silver, EA. (1979). Student perception of relatedness among verbal problems.Journal for Research in Mathematics Education, 10(3), 195–210.
Singer, F, Hagen, JB, & Sheehy, RR. (2001). The comparative method, hypothesistesting andphylogenetic analysis - an introductory laboratory. AmericanBiology Teacher, 63(7), 518–523.
Smith, MK, Wood, WB, Krauter, K, & Knight, JK. (2011). Combining peer discussionwith instructor explanation increases student learning from in-class conceptquestions. CBE-Life Sciences Education, 10(1), 55–63.
Venables, WN, & Ripley, BD. (2002). Modern Applied Statistics with S (4th ed.). NewYork, NY: Springer.
doi:10.1186/1936-6434-6-13Cite this article as: Eddy et al.: How should we teach tree-thinking? Anexperimental test of two hypotheses. Evolution: Education and Outreach2013 6:13.
Submit your manuscript to a journal and benefi t from:
7 Convenient online submission
7 Rigorous peer review
7 Immediate publication on acceptance
7 Open access: articles freely available online
7 High visibility within the fi eld
7 Retaining the copyright to your article
Submit your next manuscript at 7 springeropen.com