How Selective Are V1 Cells for Pop-Out Stimuli
15
Transcript of How Selective Are V1 Cells for Pop-Out Stimuli


Behavioral/Systems/Cognitive
How Selective Are V1 Cells for Pop-Out Stimuli?
Jay Hegde1,2 and Daniel J. Felleman1
1Department of Neurobiology and Anatomy, University of Texas Medical School, Houston, Texas 77030, and 2Vision Center Laboratory, The Salk Institutefor Biological Studies, La Jolla, California 92037
Many neurons in visual area V1 respond better to a pop-out stimulus, such as a single vertical bar among many horizontal bars, than toa homogeneous stimulus, such as a stimulus with all vertical bars. Many studies have suggested such cells represent neural correlates ofpop-out, or more generally figure– ground segregation. However, preference for pop-out stimuli over homogeneous stimuli could alsoarise from a nonspecific selectivity for feature discontinuities between the target and the background, without any specificity for pop-outper se. To distinguish between these two confounding scenarios, we compared the responses of V1 neurons to pop-out stimuli with theresponses to “conjunction-target” stimuli, which have more complex feature discontinuities between the target and the surround, as ina stimulus with a blue vertical bar among blue horizontal bars and yellow vertical bars. The target in conjunction-target stimuli does notpop out, which we psychophysically verified. V1 cells in general responded similarly to pop-out and conjunction-target stimuli, and onlya small minority of cells (�2% by one measure) distinguished the pop-out and conjunction-target stimuli from each other and fromhomogeneous stimuli. Nevertheless, the responses of approximately 50% of the cells were significantly modulated across all center-surround stimuli, indicating that V1 cells can convey information about the feature discontinuities between the center and the surroundas part of a network of neurons, although individual cells by themselves fail to explicitly represent pop-out. In light of our results,unambiguous pop-out selectivity at the level of individual cells remains to be demonstrated in V1 or elsewhere in the visual cortex.
Key words: binding; center-surround summation; contextual modulation; feature integration; figure– ground segregation; serial search;striate cortex; surround modulation; visual search
IntroductionA blue vertical bar is easy to recognize among a background ofyellow horizontal bars. It “pops out”. In general, pop-out occurswhen a target substantially differs from the background, or dis-tractors, in terms of one or more visual features. But when thetarget is defined by a unique conjunction of features, such as ablue vertical bar target among yellow vertical and blue horizontaldistractors, the time it takes to find the target, or reaction time,generally depends on the number of distractors (Treisman, 1980,1988; Wolfe, 1994). By contrast, reaction time for pop-out isgenerally short, on the order of a few hundred milliseconds, andis independent of the number of distractors in the stimulus (Tre-isman, 1980, 1988). Psychophysical studies of pop-out and the“conjunction-target” stimuli have yielded important insightsinto the perceptual mechanisms of figure– ground segregationand feature integration (or binding), and are central to manyinfluential models of visual object recognition (Julesz, 1984; Tre-isman, 1988; Wolfe, 1994; Palmer et al., 2000; Hochstein andAhissar, 2002) (also see September 1999 special issue of Neuron).
Neural mechanisms of the pop-out phenomenon have been
studied in many visual areas, and especially intensively in visualarea V1 (for review, see Albright and Stoner, 2002). Because V1classical receptive fields (CRFs) tend to be small with relativelylarge nonclassical surrounds, the selectivity for pop-out has gen-erally been studied in terms of center-surround modulation, withthe target centered on the CRF (or the “center”) and the distrac-tors in the surround. Previous studies have shown that many V1cells distinguish pop-out stimuli from the corresponding homo-geneous stimuli (i.e., stimuli with the same texture elements inthe center and the surround), when the pop-out is based oncenter-surround differences in orientation (Knierim and Van Es-sen, 1992; Lamme, 1995; Zipser et al., 1996; Li et al., 2000; Noth-durft et al., 2000), motion (Lamme, 1995), color, stereoscopicdisparity (Zipser et al., 1996), or luminance (Zipser et al., 1996;Levitt and Lund, 1997; Polat et al., 1998; Lee et al., 2002). Somestudies have argued that such patterns of surround modulationrepresent neural correlates of the pop-out phenomenon (Kastneret al., 1997; Nothdurft et al., 1999) or, more generally, figure–ground segregation (Lamme, 1995; Zipser et al., 1996).
However, selectivity for pop-out stimuli relative to homoge-neous stimuli could also arise from a nonspecific selectivity forfeature discontinuities between the target and the background,rather than a selectivity for pop-out per se. Because pop-out stim-uli necessarily contain the center-surround feature discontinuityand homogeneous stimuli do not, it is impossible to distinguishselectivity for the feature discontinuity from genuine selectivitypop-out stimuli using these two types of stimuli alone. Additionalstimuli that dissociate the existence of feature discontinuitiesfrom pop-out are needed.
Conjunction-target stimuli are useful for this purpose, because
Received May 25, 2003; revised Sept. 8, 2003; accepted Sept. 11, 2003.This work was supported in part by a Fight for Sight Postdoctoral Fellowship to J.H., by National Institutes of
Health Grant EY 08372 to D.J.F., and by Vision Core Grant P30-EY-10618 to the University of Texas Health SciencesCenter. We are grateful to Dr. John Maunsell for advice and help throughout this project. We thank Drs. RobertDesimone and Andrew Mitz for useful software, Dr. Thomas Albright for the use of psychophysical experimentalfacilities, Dr. Jonathan Hill for useful discussions, and Drs. John Maunsell, Lawrence Snyder, and Gene Stoner forhelpful comments on this manuscript.
Correspondence should be addressed to Jay Hegde, Vision Center Laboratory, The Salk Institute for BiologicalStudies, 10010 North Torrey Pines Road, La Jolla, CA 92037. E-mail: [email protected] © 2003 Society for Neuroscience 0270-6474/03/239968-13$15.00/0
9968 • The Journal of Neuroscience, November 5, 2003 • 23(31):9968 –9980
they also contain feature discontinuities between the center and thesurround, but do not pop out. Because pop-out and conjunction-target stimuli differ in the precise nature of the discontinuities andthe perceptual effects they elicit, neurons that are genuinely selectivefor pop-out stimuli or the pop-out percept should distinguish be-tween the two types of stimuli. On the other hand, cells that aremerely selective for the existence of center-surround discontinuitiesregardless of the nature of the discontinuities should respond simi-larly to pop-out and conjunction-target stimuli, but distinguishthem both from the homogeneous stimuli.
We compared the responses of V1 cells to the three types ofstimuli. We found that most V1 cells failed to explicitly distin-guish among the three stimulus types by any of the responsemeasures used. Our results suggest that area V1 is unlikely tocontain explicit representations of visual pop-out, or even theprecise nature of center-surround feature discontinuities. None-theless, V1 cells do signal the existence of feature discontinuitiesbetween the center and the surround and may play an importantrole in the analysis of center-surround feature differences as apart of a distributed network.
Materials and MethodsNeurophysiologyAnimal subjects and surgical procedures. The neurophysiological experi-ments were performed in alert, fixating macaques. Two adult macaques(Macaca mulatta, one male and one female) were used as subjects. Beforefixation training, each animal was implanted with a headpost and ascleral search coil using sterile surgical procedures. After recovery, theanimals were trained in the fixation task, after which another surgicalprocedure was performed in which a craniotomy 2.5 cm in diameter wasmade over opercular V1, and a recording chamber was implanted overthe craniotomy. All animal-related protocols were approved by The Uni-versity of Texas Health Sciences Center Animal Welfare Committee inaccordance with National Institutes of Health guidelines.
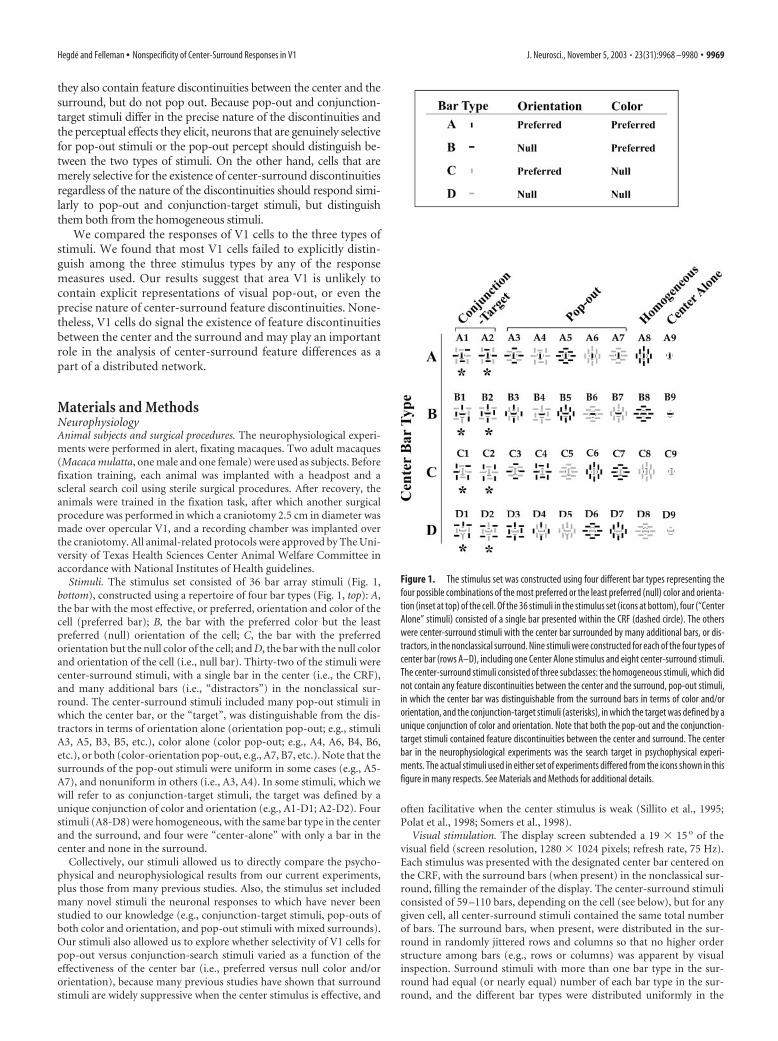
Stimuli. The stimulus set consisted of 36 bar array stimuli (Fig. 1,bottom), constructed using a repertoire of four bar types (Fig. 1, top): A,the bar with the most effective, or preferred, orientation and color of thecell (preferred bar); B, the bar with the preferred color but the leastpreferred (null) orientation of the cell; C, the bar with the preferredorientation but the null color of the cell; and D, the bar with the null colorand orientation of the cell (i.e., null bar). Thirty-two of the stimuli werecenter-surround stimuli, with a single bar in the center (i.e., the CRF),and many additional bars (i.e., “distractors”) in the nonclassical sur-round. The center-surround stimuli included many pop-out stimuli inwhich the center bar, or the “target”, was distinguishable from the dis-tractors in terms of orientation alone (orientation pop-out; e.g., stimuliA3, A5, B3, B5, etc.), color alone (color pop-out; e.g., A4, A6, B4, B6,etc.), or both (color-orientation pop-out, e.g., A7, B7, etc.). Note that thesurrounds of the pop-out stimuli were uniform in some cases (e.g., A5-A7), and nonuniform in others (i.e., A3, A4). In some stimuli, which wewill refer to as conjunction-target stimuli, the target was defined by aunique conjunction of color and orientation (e.g., A1-D1; A2-D2). Fourstimuli (A8-D8) were homogeneous, with the same bar type in the centerand the surround, and four were “center-alone” with only a bar in thecenter and none in the surround.
Collectively, our stimuli allowed us to directly compare the psycho-physical and neurophysiological results from our current experiments,plus those from many previous studies. Also, the stimulus set includedmany novel stimuli the neuronal responses to which have never beenstudied to our knowledge (e.g., conjunction-target stimuli, pop-outs ofboth color and orientation, and pop-out stimuli with mixed surrounds).Our stimuli also allowed us to explore whether selectivity of V1 cells forpop-out versus conjunction-search stimuli varied as a function of theeffectiveness of the center bar (i.e., preferred versus null color and/ororientation), because many previous studies have shown that surroundstimuli are widely suppressive when the center stimulus is effective, and
often facilitative when the center stimulus is weak (Sillito et al., 1995;Polat et al., 1998; Somers et al., 1998).
Visual stimulation. The display screen subtended a 19 � 15 o of thevisual field (screen resolution, 1280 � 1024 pixels; refresh rate, 75 Hz).Each stimulus was presented with the designated center bar centered onthe CRF, with the surround bars (when present) in the nonclassical sur-round, filling the remainder of the display. The center-surround stimuliconsisted of 59 –110 bars, depending on the cell (see below), but for anygiven cell, all center-surround stimuli contained the same total numberof bars. The surround bars, when present, were distributed in the sur-round in randomly jittered rows and columns so that no higher orderstructure among bars (e.g., rows or columns) was apparent by visualinspection. Surround stimuli with more than one bar type in the sur-round had equal (or nearly equal) number of each bar type in the sur-round, and the different bar types were distributed uniformly in the
Figure 1. The stimulus set was constructed using four different bar types representing thefour possible combinations of the most preferred or the least preferred (null) color and orienta-tion (inset at top) of the cell. Of the 36 stimuli in the stimulus set (icons at bottom), four (“CenterAlone” stimuli) consisted of a single bar presented within the CRF (dashed circle). The otherswere center-surround stimuli with the center bar surrounded by many additional bars, or dis-tractors, in the nonclassical surround. Nine stimuli were constructed for each of the four types ofcenter bar (rows A–D), including one Center Alone stimulus and eight center-surround stimuli.The center-surround stimuli consisted of three subclasses: the homogeneous stimuli, which didnot contain any feature discontinuities between the center and the surround, pop-out stimuli,in which the center bar was distinguishable from the surround bars in terms of color and/ororientation, and the conjunction-target stimuli (asterisks), in which the target was defined by aunique conjunction of color and orientation. Note that both the pop-out and the conjunction-target stimuli contained feature discontinuities between the center and surround. The centerbar in the neurophysiological experiments was the search target in psychophysical experi-ments. The actual stimuli used in either set of experiments differed from the icons shown in thisfigure in many respects. See Materials and Methods for additional details.
Hegde and Felleman • Nonspecificity of Center-Surround Responses in V1 J. Neurosci., November 5, 2003 • 23(31):9968 –9980 • 9969

surround. For any given stimulus, the location of the surround bars wasrandomly shuffled from one repetition to the next. This, together withthe random spatial jittering of the bar locations and fixation jitter, min-imized the likelihood that a given subregion of the surround was consis-tently stimulated by the same bar across repetitions. All stimuli, includ-ing those used during the initial receptive field mapping, were presentedagainst a uniform gray background. All bars and the background had aluminance of 30 cd/m 2, as measured by Tektronix J17 photometer(“equiluminant condition”), except where noted otherwise.
Recording procedures. The experiments were controlled and the datacollected using the CORTEX software package (courtesy of Dr. RobertDesimone, National Institute of Mental Health). After a cell was isolatedfor study, the CRF of the cell was mapped, and its receptive field prefer-ences were determined using a mouse-driven bar on the display of thecomputer. The preferred and null orientations were determined inde-pendently of each other at a resolution of 5 o each. The preferred and nullcolors were selected from a repertoire of six equiluminant colors. Thecells in our sample in general had crisply delineated CRF boundaries, sothat the center-surround distinction was clear and robust. The CRF di-ameters (range, 1–1.8 o; mean, 1.2 o; median, 1.3 o) varied with the eccen-tricities (range, 1– 6.2 o; mean, 1.8 o; median, 2.2 o) as expected from pre-vious studies (Van Essen and Zeki, 1978; Snodderly and Gur, 1995). Toensure that no surround bar stimulated the CRF during fixation, stimuliwere constructed so that the closest points of any two bars were �1.2 CRFdiameters or �1.2 o apart, whichever was greater. The eye position of theanimal was monitored throughout the trial using a scleral search coil, andthe trial was aborted if the eye deviated by �0.5 o from the fixation pointat any time during the trial. Single-unit recording was performed usingstandard procedures. Recording coordinates were randomly chosenfrom within the craniotomy. Stimuli were presented one per trial for 1 seceach while the animal fixated for a juice reward at the end of the trial. Werecorded from a total of 106 cells from three hemispheres of two monkeysduring this experiment.
We also performed a “contrast effect experiment”, which was identicalto the main neurophysiological experiment described above except thatonly stimuli A1-A9 and B1-B9 were used in this experiment. Each ofthese 18 stimuli was presented at two different stimulus-backgroundcontrasts (Weber contrast, �I/I ) of 33 or 0%. The contrasts wereachieved by setting the luminance of the background to either 30 or 20.1cd/m 2 (“equiluminant” and “higher contrast” conditions, respectively)while maintaining the luminance of all bars at 30 cd/m 2 (the same as inthe main experiment). We recorded from a total of 21 cells from onemonkey during this experiment.
Analyses of neurophysiological data. Data analyses were performed us-ing custom written S-Plus (Seattle, WA) or Matlab (Natick, MA) pro-grams. For each cell, the response to a given stimulus was averaged fromthe net firing rate of the cell across 10 correct repetitions. The net firingrate was determined by subtracting the background firing rate, calculatedusing a 200 msec time window immediately preceding the stimulus on-set, from the evoked response of the cell. We systematically tested manydifferent time windows for calculating the evoked response (windowwidths of 50 –1000 msec, starting at 0 –950 msec after the stimulus onset).The results were qualitatively similar across a wide range of windowparameters (data not shown), although the differences among the vari-ous stimulus types were progressively less prominent with larger timewindows, because of the fact that the effects of surround modulationwere most prominent during the first 150 msec after the stimulus onset,and the overall response usually decayed rapidly after the initial responsetransient. For the data presented in this report, evoked responses werecalculated using a 200 msec window starting 30 msec after the stimulusonset. We tested each of the 127 cells recorded during both experimentsto determine whether the stimulus-evoked responses significantly dif-fered from the background firing rate (two-tailed t test; p � 0.05). Eighty-five cells from the main experiment and 21 cells from the contrast effectexperiment met this criterion and were used in this study.
Given the fact that stimuli were not directly comparable across differ-ent center bars (because both the center and surround bar types variedacross rows, see Fig. 1), we generally analyzed the responses to stimuli
with each of the four center bars separately, except where it was appro-priate to do otherwise, as noted.
Tests of significance. All tests of significance were performed usingrandomization. A test of significance using randomization consists ofdetermining whether the value of a user-defined test statistic calculatedfrom the actual data differs significantly from the distribution of the sametest statistic calculated from randomized data (for review, see Manly,1991). Briefly, an appropriate test statistic was first calculated using theactual data. The data were then randomized in a manner appropriate forthe given test, and the test statistic was recalculated using the randomizeddata. The randomization process was repeated 10 6 times (10 3 times incase of dendrogram analyses), and the proportion of times the random-ized test statistic exceeded the actual test statistic constituted the one-tailed probability p that the value of actual test statistic was indistinguish-able from chance.
To perform a conventional test of significance using randomization,the corresponding test statistic [e.g., t statistic for t test, F ratio forANOVA, and the q statistic for Tukey’s honestly significant difference(HSD) test, etc.] calculated from the original data were compared withthose calculated from the randomized data, and the p value was deter-mined as described above. This procedure effectively corrects for devia-tions of data set from normality (Manly, 1991). To determine the statis-tical significance of a user-defined index (see next paragraph), therandomization procedure was repeated using the given index as the teststatistic. To correct for multiple comparison artifacts, we used Tukey’sHSD test (S-Plus function multicomp).
Neurophysiological indices. The pop-out stimulus selectivity index(PSI) for a given center bar was calculated as (Rhomogeneous � Rpop-out)/Rhomogeneous, where Rhomogeneous was the response of the cell to the ho-mogeneous stimulus, and Rpop-out was the response to a given pop-outstimulus, the response to which differed most from (i.e., most suppressedor enhanced relative to) Rhomogeneous. We used this (unsigned) magni-tude of difference rather than either suppression or enhancement aloneas the criterion, because the responses to the pop-out stimuli were sup-pressed in some cases and enhanced in others relative to the homoge-neous stimulus with the same center. Note that either relative enhance-ment or suppression can potentially help distinguish between the twotypes of stimuli. Similarly, we calculated the corresponding conjunction-target stimulus selectivity index (CSI) as (Rhomogeneous � Rconjunction-
target)/Rhomogeneous, where Rconjunction-target was the response of the cell toa given conjunction-target stimulus (with the same center bar) the re-sponse to which deviated most (i.e., most suppressed or enhanced) rela-tive to Rhomogeneous. For each cell, we calculated the PSI and CSI values foreach of the four center bars, indicated in the subscript of the index by theappropriate center bar designation (e.g., PSIpref and PSInull denote PSIvalues calculated for the preferred and null center bars, respectively).
The pop-out preference index (PPI) for a given center directly com-pared the response of a cell to its most effective pop-out stimulus with itsresponse to its most effective conjunction-target stimulus with the samecenter bar. The PPI for the preferred bar in the center was defined byPPIpref � (POpref � CTpref)/(POpref � CTpref), where POpref and CTpref
are the responses of the cell to its most effective pop-out andconjunction-target stimuli, respectively, with the preferred bar in thecenter. The PPI values with the other three center bar types were alsocalculated in a similar manner.
The response variation index (RVI) measured the modulation (i.e.,variation) of given responses of a cell across a given subset of pop-outstimuli or conjunction-target stimuli with a given center bar. RVIpref,po
measured the modulation of the responses of the cell across the fivepop-out stimuli with the preferred center bar (stimuli A3-A7). To calcu-late RVIpref,po, we fist calculated the conventional F ratio (Snedecor andCochran, 1989) of the responses of the cell across the five stimuli, definedas F � MSbetween/MSwithin, where MSbetween was the stimulus-to-stimulus variance, and MSwithin was the average trial-to-trial variance.RVIpref,po was defined as the F ratio calculated from the actual data di-vided by the average F ratio calculated from 10 6 rounds of randomiza-tion. RVIpref,ct similarly measured the response modulation across thetwo conjunction-target stimuli with the preferred center bar (i.e., stimuliA1 and A2). RVIpo and RVIct values for the other three center bars were
9970 • J. Neurosci., November 5, 2003 • 23(31):9968 –9980 Hegde and Felleman • Nonspecificity of Center-Surround Responses in V1

also calculated similarly. Note that a given RVIpo had much greater sta-tistical power than the corresponding RVIct (df � 4 for RVIpo vs df � 1for RVIct). The response modulation comparison test was essentially arandomized version of a two-way ANOVA with stimulus type (i.e., pop-out vs conjunction-target) and stimuli (i.e., of either type) as the twofactors, used for determining whether the patterns of response signifi-cantly varied between pop-out and conjunction-target stimuli with agiven center bar (Manly, 1991; p. 69). To pass this test for a given centerstimulus, a cell had to have p � 0.05 for the stimulus type factor, theinteraction factor, or both.
The average surround modulation index (ASM) was calculated foreach cell as
�i�1
n
[(Si � Ci/Ci)]/n,
where Si and Ci are, respectively, the responses of the cell to the ithcenter-surround stimulus and the corresponding center alone stimulus.We calculated the absolute, and not the signed, difference between Si and Ci
because most cells in our sample were suppressed by some center-surround stimuli and enhanced by others.
The response modulation index (RMI) wascalculated in the same manner as the RVIsabove, except that the response modulation wasmeasured across all 32 center-surround stimuli,instead of just the pop-out or conjunction-target stimuli with a given center bar.
Population analyses. To analyze patterns ofresponse correlation across the population, weused hierarchical cluster analysis (HCA) (forreview, see Kachigan, 1991). We used HCA (S-Plus routine agnes) to derive a graphical binarytree, or “dendrogram”, of the stimulus set, sothat stimuli that elicited similar responsesacross the V1 cells population were clusteredcloser together on nearby branches, and thosewhich elicited disparate responses were sepa-rated on distant branches.
We also analyzed the population responsedata using metric multidimensional scaling (S-Plus routine cmdscale), which plots the data sothat the distances between the data points, inour case the stimuli, represents the similarity ofthe responses of V1 cells to the stimuli (Kruskaland Wish, 1978).
To construct the population average peris-timulus time histograms (PSTHs), 10 msec binsspanning the 1400 msec interval around thestimulus presentation (with the stimulus onsetand offset at 0 and 1000 msec, respectively)were used. For each cell, a PSTH was con-structed separately for each of the 36 stimuliusing these bins. The 36 PSTHs for each cellwere then normalized, so that the bin duringwhich the firing rate of the cell was maximal(for any stimulus/stimuli) had a value of 1.0.The normalized PSTHs were averaged foreach stimulus individually across all cells.
Human psychophysicsHuman psychophysical experiments were iden-tical to the neurophysiological experiments ex-cept as noted. All stimuli were displayed on a 19inch Sony Multiscan E500 monitor (but usingthe same screen settings). The luminance of thestimuli were adjusted to be the same as thatused in the physiological experiments using aPhotoResearch PR650 Photometer. The colorand orientation values used for constructing thepsychophysical stimuli were either the same as
those actually used for selected V1 cells or a random combination ofvalues from the repertoire used for all cells. Not all parameter values weretested for all subjects, and only a representative subset of stimuli weretested for some subjects.
Trials were performed as previously described (Hegde and Felleman,1999) with minor modifications. Briefly, the subjects were instructed tosearch the stimulus for a single unique bar (“the odd man out”) and pressa designated key when the search target was found. Stimuli were pre-sented one per trial. Forty percent of the trials contained a pop-outstimulus, another 40% contained a conjunction-target stimulus, and theremaining 20% of the trials contained no target (catch trials). Subjectsindicated the lack of target using a different key. No feedback was pro-vided in any of the trials, and the “incorrect” trials were not repeated.Each subject performed at �95% across trials (data not shown).
Reaction time was measured for each stimulus type over four, five, orseven different bar array sizes, depending on the experiment. Each subjectperformed several practice trials, the data from which were discarded.
The “stimulus-background contrast experiment” was identical tomain psychophysical experiment, except that stimulus-background con-trast varied systematically from one condition to the next, whereas the
Figure 2. Reaction times for selected stimuli. Each of the 28 stimuli with non-homogeneous surrounds was tested in a visualsearch experiment in which human subjects searched for a single target among varying numbers of distractors (see Materials andMethods for details). In this figure, average reaction times ( within-group SEM) for eight selected stimuli (A1-A8) are shown asa function of the number of distractors for each stimulus for an individual subject ( A) or for all subjects ( B). For the data shown, thecolor and the orientation values used were the same as those for the exemplar cell shown in Figure 4 A; the number of distractorsused for that cell is denoted by the arrow. Similar results were obtained for each of the many other combinations of color andorientation values tested (data not shown).
Figure 3. Effect of stimulus-background contrast on visual search. Representative pop-out and conjunction-target stimuliwere retested at systematically varying stimulus-background contrasts (icons; see Materials and Methods for details). The result-ing average reaction times ( within-group SEM) are shown for each contrast level as a function of the number of distractors inthe given stimulus for an individual subject ( A) or for all subjects ( B). For the data shown, the color and the orientation values usedwere the same as those in the exemplar cell shown in Figure 11 A; the arrow denotes the number of distractors in the stimuliused for that cell. Similar results were obtained for each of the many other combinations of color and orientation values tested(data not shown).
Hegde and Felleman • Nonspecificity of Center-Surround Responses in V1 J. Neurosci., November 5, 2003 • 23(31):9968 –9980 • 9971
bars remained equiluminant with each other. Inthe “non-equiluminant” conditions, the lumi-nance of the background was 33, 67, 133, or167% of that of the bars, corresponding to aWeber contrast of �33, �67, �33, or �67%,respectively, between the stimuli and the back-ground. In the “equiluminant” condition, thestimulus-background had a Weber contrast of0%, as in the main experiment.
Analyses of reaction times. The reaction timefor each stimulus was averaged across 40 repe-titions presented over four sessions. We mea-sured the dependence of reaction time t on thenumber of distractors n using either the Spear-man’s correlation coefficient or the monotonicincrement index (MII). To calculate MII, wefirst calculated MIIraw from the actual data, de-fined as MIIraw � � �t/�n, where �t was incre-ment in reaction time in milliseconds when thenumber of distractors increased by �n. We thenrecalculated this index using data points fromindividual repetitions of given stimulus with agiven number of distractors and calculated theroot mean squared deviation between MIIraw
from the actual data and the randomized data.We calculated the average of these differences,MIIRMS, from 10 6 rounds of randomization.MII was defined as MIIraw/MIIRMS, and its sta-tistical significance was determined as de-scribed for the neurophysiological indicesabove. Note that MII explicitly takes trial-to-trial variations, including those caused bychance and/or practice effects, into account.
ResultsPsychophysical testing ofcenter-surround stimuliThe stimulus set included a representativecollection of putative pop-out and con-junction-target stimuli (Fig. 1). To verifythat these stimuli were able to produce the expected perceptualeffects under our experimental conditions, we tested them in avisual search experiment using human subjects under experi-mental conditions similar to those used in the neurophysiologicalstudies (see Materials and Methods). Figure 2A illustrates thereaction times of an individual subject to eight pop-out andconjunction-target stimuli with the same center bar, all presentedat equiluminance. As expected from previous studies (Treisman,1980, 1988; Wolfe, 1994), the reaction times for the conjunction-target stimuli (A1 and A2) increased monotonically with thenumber of distractors (Spearman’s correlation coefficient rs �0.92; p � 0.05). The MII (see Materials and Methods) value forthese stimuli collectively was 56.1, indicating that the reactiontime increased at an average rate of �56 msec per distractor,when random variations in reaction time were accounted for.The MII value was statistically significant ( p � 0.05) in each case.By contrast, the reaction time for pop-out stimuli (stimuli A3-A7) remained short and statistically unchanged as the number ofdistractors increased (rs � 0.06, MII � 0.004; p � 0.05 in bothcases). The results were similar for each of the other five subjectsindividually, and for the average response of all six subjects (Fig.2B) (three-way ANOVA, subjects � search type � number ofdistractors, p � 0.05 for subjects). Similar results were alsoobtained with the other three types of center bar (bar types B,C, and D), and many different combinations of bar color andorientation (data not shown). These results confirm that our
pop-out and conjunction-target stimuli were able to elicit theexpected perceptual effects. They also demonstrate that thepop-out and conjunction-target effects persist for color and/ororientation at equiluminance (Luschow and Nothdurft, 1993).
Effects of stimulus-background contrast on visual searchAs noted earlier, the neurophysiological experiments were per-formed under both the equiluminant and non-equiluminantconditions. To compare the reaction times elicited by pop-outand conjunction-target stimuli under the two types of condi-tions, we conducted a stimulus-background contrast experiment,in which we systematically varied the stimulus-background con-trast while maintaining all stimulus elements at equiluminance(see Materials and Methods for details). Figure 3A shows thereaction times of a naive subject to a representative pop-out andconjunction-target stimulus each at five different stimulus-background contrasts. The reaction times to the pop-out stimu-lus (thin lines) were statistically indistinguishable across variouscontrasts (two-way ANOVA, luminance � number of distrac-tors, p � 0.05 for both factors and interaction), indicating thatpop-out was not significantly affected by variations in stimulus-background contrast. On the other hand, for the conjunction-target stimuli (thick lines), the reaction times increased signifi-cantly faster for the equiluminant condition than for any of thenon-equiluminant conditions (Tukey’s HSD test; p � 0.05), al-though the non-equiluminant conditions were indistinguishableamong themselves (two-way ANOVA, conditions � number of
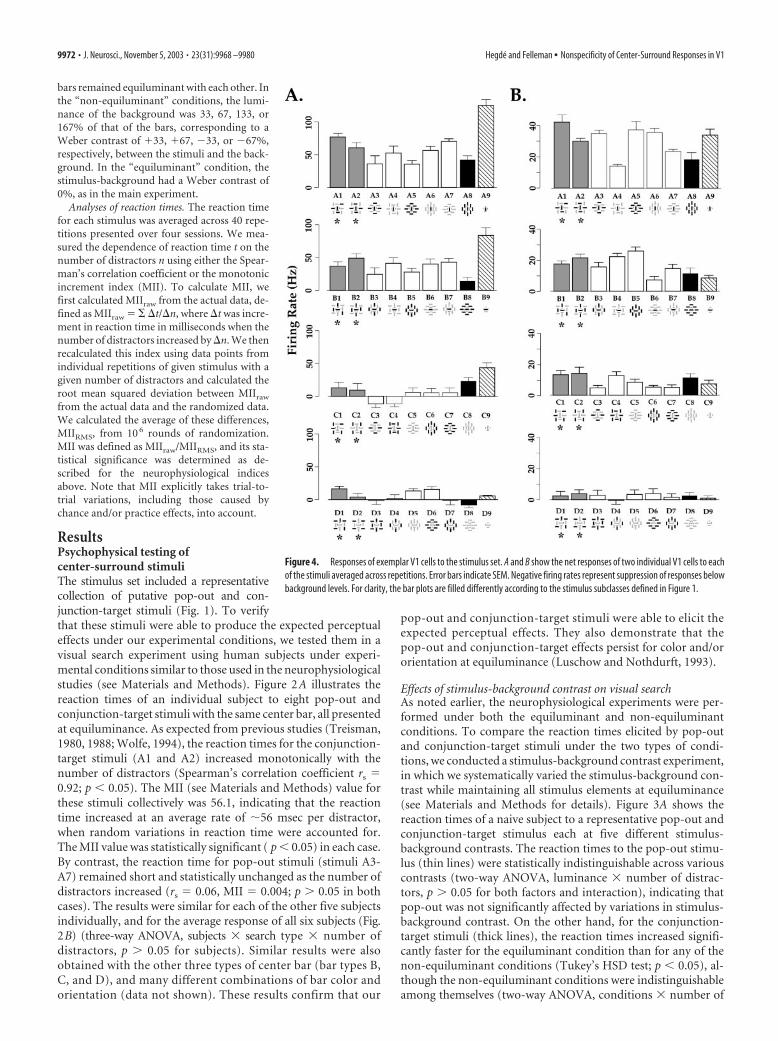
Figure 4. Responses of exemplar V1 cells to the stimulus set. A and B show the net responses of two individual V1 cells to eachof the stimuli averaged across repetitions. Error bars indicate SEM. Negative firing rates represent suppression of responses belowbackground levels. For clarity, the bar plots are filled differently according to the stimulus subclasses defined in Figure 1.
9972 • J. Neurosci., November 5, 2003 • 23(31):9968 –9980 Hegde and Felleman • Nonspecificity of Center-Surround Responses in V1

distractors, p � 0.05 for condition). We obtained similar resultsfor the each of two other naive subjects (data not shown), and forall four subjects in the study together (Fig. 3B), but not for the onenon-naive subject in the study (J.H., one of the authors), forwhom the reaction times for the equiluminant condition wereindistinguishable from those for the non-equiluminant condi-tions (Tukey’s HSD test; p � 0.05; data not shown). Together,these results indicate that the psychophysical distinction betweenthe pop-out and conjunction-target stimuli were at least as prom-inent, often more prominent, at equiluminance as at non-equiluminance. Thus, neurophysiological differences betweenthe two sets of stimuli, if any, can be expected to be most evidentunder equiluminant conditions.
Neuronal responses to center-surround stimuliWe studied the responses of 85 cells from area V1 of two alert,fixating macaques to each of the 36 stimuli presented under equi-luminant conditions (see Materials and Methods). Figure 4shows the responses of two V1 cells to the stimuli. The cell shownin Figure 4A was selective for both color and orientation of thecenter bar (compare A9 vs B9 vs C9 vs D9; Tukey’s HSD test; p �0.05). For each of the four center bars (rows), the responses of thecell to the center-surround stimuli were mostly (but not always)suppressed relative to the corresponding center-alone stimulus,regardless of whether the center-surround stimuli wereconjunction-target (asterisks) or pop-out type. The modulationof responses among the center-surround stimuli was significantfor stimuli with each of the four center bars (one-way ANOVAs;p � 0.05 in each case).
There are many computationally meaningful ways of assess-ing the selectivity this cell for pop-out stimuli. As indicated ear-lier, many previous studies have compared the responses to agiven pop-out stimulus with the responses to the correspondinghomogeneous stimulus (Knierim and Van Essen, 1992; Lamme,1995; Zipser et al., 1996; Nothdurft et al., 1999, 2000). We per-formed similar analyses, with corrections for multiple compari-sons where appropriate, which took into account the fact that ourstimulus set contained many more pop-out stimuli than homo-geneous stimuli (see Materials and Methods). For each of the fourcenter bars, the response of the cell to the homogeneous stimuluswas statistically distinguishable from at least one pop-out stimu-lus with the same center bar (e.g., A8 vs A7; D8 vs D6, etc.;Tukey’s HSD test; p � 0.05). Furthermore, the most effectivestimulus of the cell with the null center bar was a pop-out stim-ulus (D6), as was the stimulus that elicited the largest surroundsuppression (C3). Thus, when the comparison is limited to pop-out and homogeneous stimuli, and conjunction target stimuliwere excluded from the analysis, this cell was selective for one ormore pop-out stimuli by many potentially meaningful criteria.Note, however, that none of these analyses distinguishes betweenselectivity for the pop-out per se and a mere selectivity for theexistence of center-surround feature discontinuities in pop-outstimuli, absent from homogeneous stimuli.
A very different picture of the selectivity of the cell emergeswhen the responses to the conjunction-target stimuli are takeninto account. In general, the cell responded similarly to manypop-out and conjunction-target stimuli, so that if the responsesto the pop-out stimuli were excluded from the analysis, the cellcould be judged to be selective for conjunction-target stimuli bymany of the same criteria as those used to infer pop-out selectiv-ity above. For instance, for every pop-out stimulus that elicited aresponse distinct from the response to the corresponding homo-geneous stimulus (e.g., stimuli A7 vs A8, D6 vs D8), there was aconjunction-target stimulus that elicited a similar response (A1and D1, respectively; Tukey’s HSD test; p � 0.05). Nonetheless,the response of the cell to each of these conjunction-target stimuliwas distinguishable from the corresponding homogeneous stim-uli (Tukey’s HSD test; p � 0.05). The fact that the cell respondedsimilarly to two stimuli that both contained center-surrounddiscontinuities but differed in terms of the nature of the dis-continuities indicates that the responses of the cell likelyreflected only a selectivity for the existence of the center-surround discontinuities.
The cell in Figure 4B illustrates some additional complexitiesof center-surround responses in V1 and the methodological chal-lenges they pose for the analyses of pop-out selectivity. Like manycells in our sample, the responses of this cell were enhanced bysome center-surround stimuli and suppressed by others, so thatthe cell was selective for either pop-out stimuli or conjunction-target stimuli depending on whether surround enhancement orsurround suppression was the criterion used. For instance, aconjunction-target stimulus (A1) elicited the largest surroundenhancement, whereas a pop-out stimulus (A4) elicited the larg-est surround suppression with the same center (A9). When onlythe magnitude of surround modulation was considered and thesign of the modulation was disregarded, the pop-out stimulus A4elicited the largest surround modulation. However, the responsemodulation by the conjunction-target stimulus A1 had the larg-est magnitude when measured against the homogeneous stimu-lus, A8 (instead of the center-alone stimulus A9). Note that thesame set of comparisons result in different conclusions for stim-uli with the other three center bars (centers B-D). Thus, whether
Figure 5. Population average response. The response of each neuron was normalized to amaximum of 1.0 and averaged across all cells, so that each bar represents the mean populationresponse ( cell-to-cell SEM) to the corresponding stimulus. For clarity, the bar plots are filleddifferently according to the stimulus subclasses.
Hegde and Felleman • Nonspecificity of Center-Surround Responses in V1 J. Neurosci., November 5, 2003 • 23(31):9968 –9980 • 9973

a particular cell could be classified aspop-out-selective or conjunction-target-selective depended on the criterion used.
Figure 5 shows the average response ofall 85 V1 cells to each stimulus. Note thatV1 cells on average were surround-suppressed with the preferred bar in thecenter (top row), although with weakerbars in the center (rows 2– 4), the sur-round modulation was generally, albeitmodestly, facilitative, consistent with earlierresults (Polat et al., 1998; Somers et al.,1998). Nevertheless, the population re-sponse to pop-out versus conjunction-targetstimuli was indistinguishable for each of thefour center bars (pairwise t tests; p � 0.05 inall cases). Although this analysis does notrule out the possibility that V1 contains asubpopulation of pop-out-selective cells,this scenario is unlikely, since the cell-to-cellvariations (Fig. 5, error bars) were no largerfor pop-out stimuli than for other stimuli(one way ANOVA across center-surroundstimuli; p � 0.05).
Distinguishing pop-out selectivity fromselectivity for center-surroundfeature discontinuitiesAs indicated above, pop-out-selective cellsmust, at a minimum, be able to distinguishpop-out stimuli from both homogeneousstimuli and conjunction-target stimuli. Todetermine the extent to which V1 cells cando this, we compared the response of eachcell to a given homogeneous stimulus bothwith its response to a selected pop-outstimulus and with its response to a selectedconjunction-target stimulus. To measurethe selectivity of V1 cells to pop-out stim-uli relative to homogeneous stimuli, wecalculated a PSI for each of the four centerbars for each cell (see Materials and Meth-ods for details). The distribution of PSIvalues with the preferred bar in the center,PSIpref, is shown in the x-axis histogram ofFigure 6. For about six-tenths of the cells(50 of 85, 59%) the PSI values were negative, indicating that forthese cells a pop-out stimulus elicited a larger response than thecorresponding homogeneous stimulus did. For the remainingfour-tenths of the cells (41%), the response to the pop-out stim-ulus was lower than the response to the homogeneous stimulus(i.e., positive PSI values). The difference between the responses topop-out versus homogeneous stimuli was statistically significantfor approximately one-third of the cells (28 of 85, 33%; Tukey’sHSD test; p � 0.05; filled bars), indicating that these cells wereselective for pop-out or, alternatively, for the existence of thecenter-surround discontinuities. About two-thirds of the cells(59 of 85, 69%) were selective for a pop-out stimulus by thiscriterion for at least one of the four center bars (data not shown).
We similarly calculated a CSI (see Materials and Methods) foreach center bar, which measured the selectivity of the cell for aconjunction-target stimulus relative to the homogeneous stimu-lus with the same center bar. The CSI values were statistically signif-
icant for �44% of the cells (37 of 85; Tukey’s HSD test, p � 0.05;filled bars in the y-axis histogram), indicating that these cells wereable to distinguish between conjunction-target versus homogeneousstimuli.
The PSIpref and CSIpref values were moderately, but signifi-cantly, correlated with each other (r � 0.48; df � 84; p � 0.05),indicating that V1 cells tended to respond similarly to the givenpop-out and conjunction-target stimuli. Only about two-fifths ofthe cells (18 of 85; 21%) were able to distinguish the homoge-neous stimulus from both the corresponding pop-out andconjunction-target stimuli (Fig. 6, triangles in the scatterplot),but only two of these 18 cells were also able to distinguish betweenthe corresponding conjunction-target and pop-out stimuli(Tukey’s HSD test; p � 0.05), indicating that these cells weregenuinely selective for the pop-out stimuli (color and orientationpop-out in each case; data not shown) with the preferred bar atcenter. Note that if pop-out selectivity were defined based solelyon the basis of pop-out versus homogeneous stimulus compari-
Figure 6. Comparison of responses to pop-out versus conjunction-target stimuli. The selectivity of each cell for pop-out orconjunction-target stimuli with the preferred bar in the center was measured using the selectivity indices PSIpref and CSIpref ,respectively, as described in Materials and Methods. In the scatterplot, the PSI value (x-axis) of each cell is plotted against its CSIvalue ( y-axis) according to whether the value of either index was statistically significant (see inset). Outliers with index values�1were normalized to 1. The histogram on either axis shows the distribution of the corresponding index values. The filled and openbars denote the cells for which the value of the corresponding index was statistically significant ( p � 0.05) or insignificant,respectively. The filled and open arrows denote the corresponding sample means, calculated before the outliers were normalized.Note that negative values of PSIpref and CSIpref represent a preference for, and not response suppression by, pop-out andconjunction-search stimuli respectively, relative to the homogeneous stimuli. In this and subsequent figures, the cells shown inFigure 4, A and B, are denoted by the corresponding letters.
9974 • J. Neurosci., November 5, 2003 • 23(31):9968 –9980 Hegde and Felleman • Nonspecificity of Center-Surround Responses in V1

son, a substantially larger proportion of cells (denoted collec-tively by squares and triangles in the scatter plot, correspondingto the filled bars in the x-axis histogram) would be designated aspop-out-selective.
We obtained qualitatively similar results when we repeatedthe above analyses using only the responses that were either sup-pressed or enhanced relative to the response to the homogeneousstimulus, although the selectivity for the various stimulus types,as expected, was generally more modest (data not shown). Theresults were also similar when we directly compared the re-sponses of the cell to its most effective pop-out stimulus with itsresponse to its most effective conjunction-target stimulus withthe same center using the PPI (see Materials and Methods). Thedistribution of the PPI values for the 85 cells in this experimentwill be presented later in a different context (see Fig. 12A).
Preferred center-surround stimuli of V1 cellsTo determine the relative preponderance of selectivities for vari-ous types of stimuli in V1, we classified the cells according to theirmost effective center-surround stimulus with a given center bar.The distribution of the 85 cells that preferred each of the eightcenter-surround stimuli with the preferred bar in the center(stimuli A1-A8) are shown in Figure 7A. The proportions of cellswhich preferred different stimuli was indistinguishable from ran-dom (Kolmogorov–Smirnov test for Goodness of Fit; p � 0.05),
indicating that none of the eight stimuliwas disproportionately effective for V1cells. Although pop-out stimuli were themost effective subclass of stimuli, elicitingpreferred responses from about two-thirdsof the cells (58 of 85; 68%), this was statis-tically indistinguishable from that ex-pected from the fact that five of the eightstimuli (62.5%) were pop-out stimuli (bi-nomial proportions test; p � 0.05). Theproportion of cells that preferred a stimu-lus from the other two subclasses of stim-uli, the conjunction-target or homoge-neous stimuli, were also similarlyindistinguishable from random (20 and9% cells, respectively; binomial propor-tions test, p � 0.05). Across all eight stim-uli, the response to the given preferredstimulus was significantly larger than theresponses to the most effective stimulifrom the other two subclasses for only asmall minority of cells, with correction formultiple comparison effects (Tukey’s HSDtest; p � 0.05; hatched bars) or without (ttest; p � 0.05; gray bars). Importantly, theproportion of cells with p � 0.05 by eithermethod was indistinguishable from thatexpected from chance at 5% significancelevel (i.e., probability of type I error � �0.05). Similar results were obtained forstimuli with the other three types of centerbars (Fig. 7B–D). Together, these resultsindicate that V1 cells show no pronouncedpreference for any particular type ofcenter-surround stimuli, including pop-out stimuli. Furthermore, the fact that fewcells unambiguously prefer any given typeof center-surround stimulus over others isconsistent with a distributed, rather than
local (i.e., explicit) coding of center-surround discontinuities.
Response modulation across pop-out versusconjunction-target stimuliGiven that individual V1 cells are unlikely to explicitly representpop-out, we studied the extent to which the response profiles ofV1 cells convey information about center-surround stimuli ingeneral. To do this, we compared the response variation acrosspop-out stimuli versus across conjunction-search stimuli usingthe RVIs based on the conventional F ratio (see Materials andMethods). The x-axis histogram in Figure 8 shows the distribu-tion of RVIpref,po values, which measured the response modula-tion of V1 cells across the five pop-out stimuli with the preferredcenter (stimuli A3-A7). The average RVIpref,po value was 1.78,indicating that the average response modulation across the fivepop-out stimuli was �1.78-fold larger than that expected fromchance. However, the response modulation was statistically sig-nificant for only a small number of cells (10 of 85, 12%; filledbars). The response modulation across the conjunction-searchstimuli with the same center bar (stimuli A1 and A2), as mea-sured by RVIpref,ct was also significant for only a few cells (9 of 85,11%; filled bars in the y-axis histogram). The response modula-tion was significant for both sets of stimuli for five cells (6%;denoted by the overlapping filled triangles in the top righthand
Figure 7. Preferred center-surround stimuli of V1 cells. V1 cells were classified according to their most effective center-surround stimulus with the given center bar. A–D show the results for each of the four center bars. The cells for which the responseto the most effective stimulus with the given center bar was statistically distinguishable from the responses to the most effectivestimuli from the other two stimulus subclasses with correction for multiple comparison artifacts (two-tailed Tukey’s HSD test; p �0.05; hatched bars) and without (two-tailed t test; p � 0.05; gray bars) are indicated. No cells had p � 0.05 using the Bonferronicorrection for multiple comparison. See Materials and Methods for details.
Hegde and Felleman • Nonspecificity of Center-Surround Responses in V1 J. Neurosci., November 5, 2003 • 23(31):9968 –9980 • 9975

corner of the scatterplot). The response modulation between thetwo sets of stimuli significantly differed for about one-quarter ofthe cells (22 of 85, 26%) of the cells, as measured by the responsemodulation comparison test, equivalent to a two-way ANOVAwith stimulus type � stimuli as the two factors (see Materials andMethods). Collectively, these results indicate that V1 cells conveya modest amount of information about center-surround stimuli.
Hierarchical cluster analysis of the population responseTo determine whether V1 cells distinguish pop-out stimuli fromconjunction-target stimuli at the population level, we used hier-archical cluster analysis, which groups the stimuli which elicitsimilar responses from the V1 cell population closer togetherthan those that elicit dissimilar responses (see Materials andMethods for details). Figure 9 shows the results of this analysis ina dendrogram format, where the vertical distance between anytwo stimuli is a measure of how closely the population responsesthey elicited were correlated. Each of the four primary clusterscontained all (and only) the stimuli with the same center bar type,indicating that the center bar was the most important determi-nant of the population response and the surround stimuli onlyplayed a modulatory role. Within the individual clusters, the seg-regation of the pop-out and the conjunction-target stimuli fromeach other was clearest for the stimuli with the preferred bar atcenter (far left branch), in that the vertical distance between thetwo conjunction-target stimuli (stimuli A1 and A2) was less thanhalf the vertical distance to the nearest pop-out stimulus (stimu-lus A3; distances of 0.09 vs 0.23 U; data not shown). However, thisseparation was statistically insignificant ( p � 0.05) as measuredby D ratio, which measured the ratio of between-subcluster dis-
tances to within-subcluster distances in a manner similar toANOVA (Hegde and Van Essen, 2003). Moreover, the homoge-neous stimulus (A8) elicited responses closest to the orientationpop-out (A5) stimulus. The separation of pop-out vsconjunction-target stimuli was statistically insignificant ( p �0.05) for the other three clusters as well. Similar results (data notshown) were obtained when the population response was ana-lyzed using multidimensional scaling (MDS) (see Materials andMethods). Together, these results indicate that V1 cells as a pop-ulation did not distinguish between the pop-out versusconjunction-target stimuli.
These results could, in principle, result from a scenario wheredifferent subpopulations of V1 cells are selective for pop-out ver-sus conjunction-target stimuli, and these distinctions betweenthe subpopulations average out across the overall population.However, both HCA and MDS failed to reveal any significantclustering among V1 cells based on center surround responsesin general and differential responses to pop-out versusconjunction-target stimuli in particular (data not shown). Asnoted earlier, no such clustering was evident in the distributionsof any of the index values either (Figs. 6, 8). Together, theseobservations indicate that the lack of pronounced pop-out selec-tivity in the overall V1 population was not because such selectiv-ity was confined to a small but distinct subpopulation of pop-out-selective cells.
Time course of responses to pop-out versusconjunction-target stimuliBecause a defining psychophysical distinction between pop-outand conjunction-target stimuli is the reaction time, we studiedwhether the temporal dynamics of the corresponding neuronalresponses also have distinguishing temporal characteristics. Weperformed two different analyses, one at the level of individualcells and the other at the population level.
Figure 10, A and B, shows the time course of the responses ofthe exemplar cell illustrated in Figure 4A to the nine stimuli withthe preferred bar at center. The response time courses of the mosteffective conjunction-target versus pop-out stimuli (stimuli A1and A7 respectively) (Fig. 4A) were statistically distinguishable(two-tailed tailed Kolmogorov–Smirnov test for goodness of fit;p � 0.05) for this cell. The same was true, for at least one of thefour center bars, for 23 (27%) of the 85 cells (data not shown).However, for all but two (2%) of the cells, the surround modu-lation (i.e., suppression or enhancement relative to the corre-sponding center bar alone) was evident in earlier bins for theconjunction-target stimulus than for the pop-out stimulus, con-trary to what would be expected if the shorter reaction times forpop-out were correlated with shorter latencies for surroundmodulation.
The results were qualitatively similar when we repeated theseanalyses at the population level. Figure 10C shows the averagetime course of the V1 cell responses to the nine stimuli with thepreferred bar in the center during �20 to 200 msec, spanning theinterval during which the responses were most distinctive fromeach other. Whereas the responses to the center surround stimulias a group were distinguishable from the responses to the centeralone during each bin within the 40 –150 interval (binwise t tests;p � 0.05 in all cases), the responses to the center-surround stim-uli among themselves were not (binwise one-way ANOVAs; p �0.05 in all cases). Furthermore, the time courses of responses tothe most effective conjunction-target and pop-out stimuli for theV1 cell population (stimuli A2 and A7, respectively) (Fig. 5) werestatistically indistinguishable from each other during any bin within
Figure 8. Response modulation across pop-out stimuli versus conjunction-target stimuli.For each cell, the response variation across all five pop-out stimuli with the preferred center barwas calculated using a response variation index (RVIpref,po) as described in Materials and Meth-ods. The corresponding index for the conjunction-target stimuli, RVIpref,ct, was similarly calcu-lated. The two indices are plotted against each other here using the same conventions as inFigure 6. The averages for the filled bars in the x- and the y-axis histograms were out of thehistogram range at 8.56 and 13.84, respectively (data not shown).
9976 • J. Neurosci., November 5, 2003 • 23(31):9968 –9980 Hegde and Felleman • Nonspecificity of Center-Surround Responses in V1

the �200 to 1200 msec interval (two-tailed Kolmogorov–Smirnovtest for goodness of fit; p � 0.05; data not shown). With the null barin the center (Fig. 10D), the results were similar, except that both theresponse onset and the modulatory effects were less pronounced inmagnitude and had a slightly longer latency, although the timecourse of responses to the various stimuli were statistically indistin-guishable from each other (binwise one-way ANOVAs, p � 0.05 inall cases). Similar results were obtained for stimuli with the other tworemaining center bar types (data not shown). Together, the aboveresults indicate that the differences in the psychophysical reactiontimes for pop-out versus conjunction-target stimuli are not reflectedin the temporal dynamics of the V1 center-surround responses.
ControlsThe degree of surround modulationIn principle, the lack of pronounced selectivity for pop-out stim-uli could arise from a lack of surround modulation, such that thesurround stimuli were too ineffectual to elicit distinct responses
to pop-out stimuli. To address this issue,we measured the average surround modu-lation of all V1 cells using the ASM. Theaverage ASM value of V1 cells was 0.24(excluding outliers with ASM �1.0 [n �82]; average ASM for all 85 cells, 1.73; datanot shown), indicating that the response ofV1 cells to center-surround stimuli was onaverage about one-quarter larger orsmaller (depending on the stimulus) thanthe corresponding center stimulus alone.Importantly, the ASM values of the cellswere not correlated with their pop-out se-lectivity as measured by the PPI (r � 0.04;data not shown), indicating that the lack ofpop-out selectivity was not a result of lackof surround modulation.
Response modulation across allcenter-surround stimuliTo ascertain that the responses of V1 cellsin our sample were modulated acrossthe various center-surround stimuli, wecalculated the RMI for each cell, whichmeasured the non-random variation inthe responses of the cell across all 32center-surround stimuli (see Materialsand Methods). The average responsemodulation was 1.34, indicating that theresponse of V1 cells was modulated on
average 1.34-fold above chance levels. The response modulationwas statistically significant ( p � 0.05) for approximately one-halfof the cells (46 of 85, 54%; data not shown).
We also tested whether the lack of observed selectivity for thepop-out stimuli was attributable to high levels of noise (i.e., trial-to-trial variation) in the data. We found that the noise levels inour data were comparable to, and frequently lower than, thosereported for V1 cells by many previous studies (Dean, 1981; Vo-gels and Orban, 1991; Gur et al., 1997; data not shown). More-over, the noise levels were indistinguishable between the re-sponses to pop-out versus conjunction-target stimuli (two-tailedt test; p � 0.05; data not shown), indicating that the lack ofpronounced selectivity for pop-out stimuli was not attributableto larger noise levels in the pop-out responses. More importantly,this means that the lack of pop-out selectivity is unlikely to havebeen a consequence of lack of statistical power in our dataset,because increasing the power, i.e., sampling the neuronal re-
Figure 9. Analysis of population response patterns. Hierarchical cluster analysis was used to arrange the stimuli in a dendrogram so that the vertical distance between any two (sets of) stimuliis a measure of the similarity of responses they elicit from the V1 cell population. See Materials and Methods for details.
Figure 10. The time course of surround modulation. A, B, Response PSTHs of the exemplar cell illustrated in Figure 4 A forselected stimuli (inset). C, D, The normalized population average PSTHs. In all cases, the stimulus onset and offset were at 0 and1000 msec, respectively. B–D show 0 –200 msec interval of this period (as illustrated for the exemplar cell by the double arrowsbetween A and B), during which the distinction among the PSTHs was most prominent for both the exemplar cell and for thepopulation. Using larger time windows did not qualitatively alter the results. See Materials and Methods for details.
Hegde and Felleman • Nonspecificity of Center-Surround Responses in V1 J. Neurosci., November 5, 2003 • 23(31):9968 –9980 • 9977

sponses over a larger number of repeti-tions, is likely to improve the observedoverall selectivity of V1 cells to both pop-out and conjunction-target stimuli.
Effects of stimulus-background contrast onsurround modulationThus far, we have described neuronal re-sponses to center-surround stimuli pre-sented against an equiluminant back-ground. As described earlier (Fig. 3), thepsychophysical distinction between thepop-out and the conjunction-target stim-uli is usually more prominent when thestimuli are presented against an equilumi-nant background than when presentedagainst a higher-contrast background.Thus, if the activity of a given V1 cell re-flected a genuine selectivity for pop-outstimuli, this selectivity may be expected todiminish under conditions that diminishthe perceptual distinction between thepop-out and the conjunction-targetstimuli.
To explore this possibility, we per-formed a second experiment, the contrasteffect experiment (see Materials andMethods), in which we recorded the re-sponses of an additional 21 V1 cells to 18selected stimuli (Fig. 1, rows A and B, stimuli A1-A9 and B1-B9)presented at two stimulus-background contrasts: 0% (or equilu-minant condition, as in the main experiment) or 33% contrast(higher contrast condition). The 21 cells we studied during thisexperiment were indistinguishable from the 85 cells in the mainexperiment in terms their average firing rate during the equilu-minant conditions and average surround-modulation as mea-sured by the ASM index (t tests, p � 0.05 in each case; data notshown), indicating that two sets of cells sampled the same parentpopulation.
Figure 11A–C shows the responses of three individual V1 cellsto each of the 18 stimuli in the equiluminant and high contrastconditions (open and filled bars, respectively). For each cell, theresponses were significantly modulated across the center-surround stimuli with either center bar under either contrastcondition (one-way ANOVAs; p � 0.05 in all cases). Relative tothe responses in the equiluminant condition, the responses in thehigher contrast condition were generally enhanced for the cell inA, generally suppressed for the cell in B, and enhanced for somestimuli and suppressed for other stimuli for the cell in C. How-ever, none of the three cells was selective for pop-out stimuli byany of the criteria outlined above for the main experiment. Acrossall 21 cells (D), the responses to stimuli under equiluminantversus higher contrast conditions were statistically indistin-guishable (two-way ANOVA, conditions � stimuli, usingnon-normalized data, not shown; p � 0.05 for condition andinteraction factors), although the responses were modulatedsignificantly across the stimuli under both conditions ( p � 0.05for the stimulus factor), indicating that the neuronal responses ingeneral did not reflect the psychophysical distinction between thetwo conditions. These results also indicate that the lack of unam-biguous pop-out selectivity in the main experiment was not anartifact of low stimulus-background contrast.
To compare the selectivity of a given cell for pop-out stimuli
under the equiluminant (eq) versus higher contrast (hc) condi-tions, we calculated a PPI for either condition with the preferredbar at center (PPIpref,eq and PPIpref,hc, respectively). The PPIpref,eq
values of these 21 cells were indistinguishable from the corre-sponding PPIpref,eq values for the 85 cells in the main experimentcalculated in an identical manner (t test; p � 0.05) (Fig. 12A),indicating that observed pop-out selectivity in the two experi-ments was similar under equiluminant conditions. For the 21cells in the contrast effect experiment, PPIpref,eq and PPIpref,hc
values were poorly correlated with each other (Fig. 12B) (corre-lation coefficient r � �0.12; p � 0.05), and were statisticallyindistinguishable from each other (paired t test; p � 0.05), indi-cating that the selectivity of individual neurons for pop-out stim-uli did not vary with the stimulus-background contrast, contraryto what would be expected if the responses of these cells reflecteda genuine selectivity for the pop-out stimuli or the pop-outpercept.
DiscussionSelectivity of V1 cells to pop-out andconjunction-target stimuliWe have found that V1 cells typically respond similarly to pop-out and conjunction-target stimuli. The responses to the twotypes of stimuli were widely indistinguishable from each other byany of the many response measures. The inability of V1 cells torobustly distinguish between the two types of stimuli is not at-tributable to a lack of responsiveness to center-surround stimulior to a lack of surround modulation itself. Our results indicatethat center-surround responses in V1 do not provide a strong,explicit representation of pop-out in particular, or of figure–ground segregation in general.
On the other hand, the responses of V1 cells were substantiallymodulated among center-surround stimuli, indicating that in-formation about many types of center-surround is representedcollectively across the V1 cell population. Furthermore, the pro-
Figure 11. Effects of stimulus-background contrast on center-surround responses in V1. Stimuli A1-A9 and B1-B9 were pre-sented against equiluminant or higher-contrast backgrounds (0 or 33% contrast, respectively). A–C show the responses of threeindividual cells. D shows the normalized population average of all 21 cells in this experiment. See Materials and Methods fordetails.
9978 • J. Neurosci., November 5, 2003 • 23(31):9968 –9980 Hegde and Felleman • Nonspecificity of Center-Surround Responses in V1

portions of cells that preferred different types of center-surroundstimuli were comparable, consistent with a distributed represen-tation of many different types of feature discontinuities. Furtherprocessing of the feature discontinuity information, presumablyin higher visual areas, is likely needed before an explicit represen-tation of pop-out emerges.
Previous studies of pop-out selectivity in V1Our results differ from previous studies of pop-out selectivity inarea V1 in many important ways. Some previous studies have
suggested that pop-out-selective cells in V1 represent neural cor-relates of perceptual pop-out and, more generally, of figure–ground segregation (Lamme, 1995; Zipser et al., 1996; Kastner etal., 1997; Nothdurft et al., 1999, 2000). For the reasons outlinedabove, our results suggest this is not likely to be the case (Hoch-stein and Ahissar, 2002).
On a more sensory level, a large number studies have reportedthat V1 cells are selective for pop-out stimuli (Knierim and VanEssen, 1992; Lamme, 1995; Zipser et al., 1996; Kastner et al., 1997;Nothdurft et al., 1999, 2000) (for review, see Albright and Stoner,2002). Our results find little evidence for this. We believe thediscrepancy may be in large part attributable to the fact that manyof these studies assessed the selectivity for pop-out stimuli rela-tive to the homogeneous stimuli. We show that this comparison,taken by itself as evidence of pop-out selectivity, tends to greatlyoverestimate the preponderance of pop-out selectivity, because itdoes not account for the proportion of cells which are selectivefor the existence of feature discontinuities in general, withoutbeing specifically selective for pop-out. We found that most V1cells fail to distinguish pop-out stimuli from conjunction-targetstimuli, even when they distinguish both from homogeneousstimuli.
The above observations underscore the importance of differ-entiating nonspecific selectivity for center-surround feature dis-continuities from selectivity for pop-out per se. The two issuescannot be clearly distinguished using discontinuities in singlefeature (e.g., orientation only), as most of the previous studies ofpop-out selectivity have done, because in this case, feature dis-continuity by itself results in pop-out. Two or more visual fea-tures are needed (e.g., orientation and color), so that the figureshares one of the features with some background elements andother feature(s) with other background elements. This strategy ofseparating pop-out from feature discontinuity is novel to ourstudy.
Another possible explanation for the discrepancy between ourresults and those from many earlier studies is the fact that ouranimals passively viewed the stimuli, as opposed to performing avisual search task. However, we believe this is unlikely to havebeen a contributing factor, for three main reasons. First, previousstudies have shown that behavioral tasks do not alter the ability ofV1 neurons to differentiate between pop-out versus non-pop-out stimuli (Rossi et al., 2001; Marcus and Van Essen, 2002).Second, many studies have reported pop-out selectivity in areaV1 of passively fixating or even anesthetized animals (Lamme etal., 1998; Nothdurft et al., 1999, 2000). Third, as we indicatethroughout this report, pop-out stimuli are distinguishable fromconjunction-target stimuli at a purely sensory level in terms of thenature of the feature discontinuities between the center and thesurround. Thus, a cell selective for pop-out stimuli without re-flecting the pop-out percept can still be expected to distinguishbetween pop-out and conjunction-target stimuli at a purely sen-sory level. Collectively, these observations indicate that center-surround responses in V1 do not explicitly represent pop-outstimuli at a purely sensory level either.
Recently, Rossi et al. (2001) re-examined the selectivity of V1cells for figure– ground discontinuities of the type reported byLamme (1995) using similar stimulus conditions and found littleevidence of selectivity when the figure– ground border was �1 o
away from the CRF. When the figural border was closer toor within the CRF, however, many V1 cells distinguishedorientation-defined figure– ground borders from uniform tex-tures. Similar selectivity for feature discontinuities located near orwithin the CRF has been reported many others as well (Lee et al.,
Figure 12. Preference for pop-out stimuli with equiluminant versus high contrast back-grounds. A, The responses to pop-out versus conjunction-target stimuli with the preferred barat center at equiluminance was compared for each cell using a pop-out preference index(PPIpref,eq) as described in Materials and Methods. The joint distribution of PPIpref,eq values fromthe cells in the main experiment (open bars) and the contrast effect experiment (filled bars) isshown. The open and the filled arrows denote the corresponding sample means. B, Comparisonof pop-out selectivity under equiluminant versus high stimulus-background contrasts. For eachof the 21 cells in the contrast effect experiment, a PPI value was calculated under equiluminantversus high stimulus-background contrasts (PPIpref,eq and PPIpref,hc, respectively) and plottedagainst each other in this plot using different symbols according to whether one or both PPIvalues were statistically significant ( p � 0.05) for a given cell. The exemplar cells shown inFigure 11 A–C are denoted by the corresponding lowercase letters a, b, and c. Note that in eitherpanel, negative PPI values represent a preference for pop-out stimuli over conjunction-targetstimuli, and not response suppression by pop-out stimuli.
Hegde and Felleman • Nonspecificity of Center-Surround Responses in V1 J. Neurosci., November 5, 2003 • 23(31):9968 –9980 • 9979
1998; Das and Gilbert, 1999). But as noted earlier, although theseresults clearly represent selectivity for feature discontinuity betweenthe center and the surround, it is unclear whether they necessarilyreflect a selectivity for pop-out. In light of our results, unambiguousselectivity for pop-out, near or away from the CRF, still remains to bedemonstrated in V1 or elsewhere in the visual cortex.
Psychophysical studies of pop-outMechanisms of pop-out and conjunction target search have alsobeen addressed by many psychophysical models of visual search(Treisman, 1985, 1988, 1999; Treisman and Gormican, 1988;Duncan and Humphreys, 1989; Treisman and Sato, 1990; Cohenand Ivry, 1991; Cohen and Rafal, 1991; Wolfe, 1994, 1999). Un-fortunately, it is difficult to determine specific implications of ourresults for any of these models (or vice versa), because none of themodels propose (or for that matter claim to propose) specific,falsifiable hypotheses about how pop-out is represented neuro-physiologically in V1 or elsewhere in the visual system. However,it is worth noting that some of the models, most notably those ofTreisman (1985, 1988, 1999) and Wolfe (1994, 1999), appear torely critically on local (as opposed to distributed) representationsof feature values called “feature maps”. Feature discontinuities,such as those in a pop-out stimulus, are explicit from this map,because “pop-out for a target defined by a single distinctive fea-ture is mediated by the unique activity it generates in the relevantfeature map” (Treisman, 1988, p. 205; Wolfe, 1994, p. 204). Noneural correlates of feature maps have been found (Treisman,1999). More importantly for the present context, this mechanismof pop-out appears incompatible with a distributed representa-tion of pop-out in V1 or elsewhere. Given the computationalfeasibility and neurophysiological plausibility of distributed rep-resentation of feature-discontinuities (our results; Rossi et al.,2001; Marcus and Van Essen, 2002), it is worth re-examiningwhether explicit representations of feature discontinuities are aprerequisite for pop-out to occur.
In conclusion, the notion that area V1 contains correlates ofpop-out or figure– ground segregation is likely too simplistic. Amore nuanced perspective may be that V1 plays an importantrole in the early processing of the feature discontinuities as a partof distributed network.
ReferencesAlbright TD, Stoner GR (2002) Contextual influences on visual processing.
Annu Rev Neurosci 25:339 –379.Cohen A, Ivry RB (1991) Density effects in conjunction search: evidence for
a coarse location mechanism of feature integration. J Exp Psychol HumPercept Perform 17:891–901.
Das A, Gilbert CD (1999) Topography of contextual modulations mediatedby short range interactions in primary visual cortex. Nature 399:655– 661.
Dean AF (1981) The variability of discharge of simple cells in the cat striatecortex. Exp Brain Res 44:437– 440.
Duncan J, Humphreys GW (1989) Visual search and stimulus similarity.Psychol Rev 96:433– 458.
Gur M, Beylin A, Snodderly DM (1997) Response variability of neurons inprimary visual cortex (V1) of alert monkeys. J Neurosci 17:2914 –2920.
Hegde J, Felleman DJ (1999) The pop-out in some conjunction searches isdue to perceptual grouping. NeuroReport 10:143–148.
Hegde J, Van Essen DC (2003) Strategies of shape representation in primatevisual area V2. Vis Neurosci 20:313–328.
Hochstein S, Ahissar M (2002) View from the top: hierarchies and reversehierarchies in the visual system. Neuron 36:791– 804.
Julesz B (1984) A brief outline of the texton theory of human vision. TrendsNeurosci 7:41– 48.
Kachigan SK (1991) Multivariate statistical analysis. New York: Radius.Kastner S, Nothdurft H-C, Pigarev N (1997) Neuronal correlates of pop-out
in cat striate cortex. Vision Res 37:371–376.
Knierim JJ, Van Essen DC (1992) Neuronal responses to static texture pat-terns in area V1 of the alert macaque monkey. J Neurophysiol 67:961–980.
Kruskal JB, Wish M (1978) Multidimensional scaling. Newbury Park, CA:Sage Publications.
Lamme VAF (1995) The neurophysiology of figure– ground segregation inprimary visual cortex. J Neurosci 15:1605–1615.
Lamme VAF, Zipser K, Spekreijse H (1998) Figure– ground activity in pri-mary visual cortex is suppressed by anesthesia. Proc Natl Acad Sci USA95:3263–3268.
Lee TS, Mumford D, Romero R, Lamme VA (1998) The role of the primaryvisual cortex in higher level vision. Vision Res 38:2429 –2454.
Lee TS, Yang CF, Romero RD, Mumford D (2002) Neural activity in earlyvisual cortex reflects behavioral experience and higher-order perceptualsaliency. Nat Neurosci 5:589 –597.
Levitt JB, Lund JS (1997) Contrast dependence of contextual effects in pri-mate visual cortex. Nature 387:73–76.
Li W, Thier P, Wehrhahn C (2000) Contextual influence on orientationdiscrimination of humans and responses of neurons in V1 of alert mon-keys. J Neurophysiol 83:941–954.
Luschow A, Nothdurft HC (1993) Pop-out of orientation but no pop-out ofmotion at isoluminance. Vision Res 33:91–104.
Manly BFJ (1991) Randomization and Monte Carlo methods in biology.New York: Chapman and Hall.
Marcus DS, Van Essen DC (2002) Scene segmentation and attention in pri-mate cortical areas V1 and V2. J Neurophysiol 88:2648 –2658.
Nothdurft H-C, Gallant JL, Van Essen DC (1999) Response modulation bytexture surround in primate area V1: correlates of “popout” under anes-thesia. Vis Neurosci 16:15–34.
Nothdurft HC, Gallant JL, Van Essen DC (2000) Response profiles to tex-ture border patterns in area V1. Vis Neurosci 17:421– 436.
Palmer J, Verghese P, Pavel M (2000) The psychophysics of visual search.Vision Res 40:1227–1268.
Polat U, Mizboe K, Pettet MW, Kasamatsu T, Norcia AM (1998) Collinearstimuli regulate visual responses depending on cell’s contrast threshold.Nature 391:580 –584.
Rossi AF, Desimone R, Ungerleider LG (2001) Contextual modulation inprimary visual cortex of macaques. J Neurosci 21:1698 –1709.
Sillito AM, Cudeiro J, Murphy PC (1995) Visual cortical mechanisms de-tecting focal discontinuities. Nature 378:492– 496.
Snedecor GW, Cochran WG (1989) Statistical methods. Ames, IA: IowaState UP.
Snodderly DM, Gur M (1995) Organization of striate cortex of alert, trainedmonkeys (Macaca fascicularis): ongoing activity, stimulus selectivity, andwidths of receptive field activating regions. J Neurophysiol 74:2100 –2125.
Somers DC, Todorov EV, Siapas AG, Toth LJ, Kim DS, Sur M (1998) A localcircuit approach to understanding integration of long-range inputs inprimary visual cortex. Cereb Cortex 8:204 –217.
Treisman A (1980) A feature-integration theory of attention. Cognit Psy-chol 12:97–136.
Treisman A (1985) Preattentive processing in vision. Comput VisionGraphics Image Processing 31:156 –177.
Treisman A (1988) Features and objects: the fourteenth Bartlett memoriallecture. Q J Exp Psychol 40A:201–237.
Treisman A (1999) Solutions to the binding problem: progress throughcontroversy and convergence. Neuron 24:105- 110:111–125.
Treisman A, Gormican S (1988) Feature analysis in early vision: Evidencefrom search asymmetries. Psychol Rev 95:15– 48.
Treisman A, Sato S (1990) Conjunction search revisited. J Exp Psychol16:459 – 478.
Van Essen DC, Zeki S (1978) The topographic organisation of rhesus mon-key prestriate cortex. J Physiol (Lond) 277:193–226.
Vogels R, Orban GA (1991) Quantitative study of striate single unit re-sponses in monkeys performing an orientation discrimination task. ExpBrain Res 84:1–11.
Wolfe JM (1994) Guided search 2.0: a revised model of visual search. Psy-chon Bull Rev 1:202–238.
Wolfe JM (1999) The psychophysical evidence for a binding problem inhuman vision. Neuron 24:11–17;111–125.
Zipser J, Lamme VAF, Schiller P (1996) Contextual modulation in primaryvisual cortex. J Neurosci 16:7376 –7389.
9980 • J. Neurosci., November 5, 2003 • 23(31):9968 –9980 Hegde and Felleman • Nonspecificity of Center-Surround Responses in V1