How much of a socialist legacy? The re-emergence of entrepreneurship in the East German...
30
JENA ECONOMIC RESEARCH PAPERS # 2012 – 042 How Much of a Socialist Legacy? The Reemergence of Entrepreneurship in the East German Transformation to a Market Economy by Michael Fritsch Elisabeth Bublitz Alina Rusakova Michael Wyrwich www.jenecon.de ISSN 1864-7057 The JENA ECONOMIC RESEARCH PAPERS is a joint publication of the Friedrich Schiller University and the Max Planck Institute of Economics, Jena, Germany. For editorial correspondence please contact [email protected]. Impressum: Friedrich Schiller University Jena Max Planck Institute of Economics Carl-Zeiss-Str. 3 Kahlaische Str. 10 D-07743 Jena D-07745 Jena www.uni-jena.de www.econ.mpg.de © by the author.
Transcript of How much of a socialist legacy? The re-emergence of entrepreneurship in the East German...
JENA ECONOMIC RESEARCH PAPERS
# 2012 – 042
How Much of a Socialist Legacy? The Reemergence of Entrepreneurship in the East German Transformation to a Market
Economy
by
Michael Fritsch Elisabeth Bublitz Alina Rusakova
Michael Wyrwich
www.jenecon.de
ISSN 1864-7057
The JENA ECONOMIC RESEARCH PAPERS is a joint publication of the Friedrich Schiller University and the Max Planck Institute of Economics, Jena, Germany. For editorial correspondence please contact [email protected]. Impressum: Friedrich Schiller University Jena Max Planck Institute of Economics Carl-Zeiss-Str. 3 Kahlaische Str. 10 D-07743 Jena D-07745 Jena www.uni-jena.de www.econ.mpg.de © by the author.
How Much of a Socialist Legacy? The Reemergence of
Entrepreneurship in the East German Transformation to a Market
Economy1
Michael Fritscha,b, Elisabeth Bublitza, Alina Rusakovaa, and Michael Wyrwicha
a) Friedrich Schiller University Jena, School of Economics and Business Administration, Carl-Zeiss-Str. 3, D-07743 Jena, Germany, [email protected], [email protected], [email protected], [email protected]
b) German Institute for Economic Research (DIW Berlin), and Halle Institute for Economic Research (IWH), Germany
July 2012
Abstract
The 40 years of socialist regime in East Germany were characterized by a massive anti-entrepreneurship policy. We investigate the reemergence of entrepreneurship in East Germany during its transformation to a market economy following the collapse of the East German state in 1989. It took about 15 years until self-employment levels in East Germany reached those of West Germany. Despite this catch up, we find a number of peculiarities in East German self-employment that appear to be a continuing legacy of the socialist period. In particular, older and better-educated East Germans have a relatively low propensity for starting an own business. Moreover, East German workers tend to have a lower variety of skills than their West German counterparts, which could explain a lower propensity for start up in the early years after reunification. Despite this socialist imprint, we also find considerable continuity in the levels of self-employment in the 1920s and those after transition to a market economy, suggesting the existence of a long-lasting regional entrepreneurship culture.
Keywords: Entrepreneurship, self-employment, new business formation, transformation, East Germany
JEL classification: L26, O11
1 This paper summarizes an important part of our research in the framework of the Collaborative
Research Center “Social Developments in Post-Socialist Societies—Discontinuity, Tradition, Structural Formation” at the universities of Halle and Jena, Germany. We are indebted to the German Research Foundation (DFG) for financial support.
Jena Economic Research Papers 2012 - 042
1
JEL code:
1. The East German Transformation Process
After the collapse of the socialist East German state, the German
Democratic Republic (GDR), in 1990, the region experienced a
turbulent transformation process to a market economy. Because of the
abrupt changes in framework conditions—for example, the ready-made
formal institutional framework of West Germany was adopted practically
overnight—this transformation process can be characterized as a
“shock treatment” (see, e.g., Brezinski and Fritsch, 1995; Hall and
Ludwig, 1995). Introduction of a market economic system that replaced
the centrally planned economy induced massive structural change
accompanied by an almost complete replacement of incumbent firms.
Between 1989 and 1991, the share of manufacturing employment in
East Germany dropped from 48.7 percent to 16.0 percent (Hall and
Ludwig, 1995) and unemployment rose from virtually zero in 1989 to
more than 15 percent in 1992 (Burda and Hunt, 2001).
This paper analyzes the emergence of new business formation
and entrepreneurship during East Germany’s transformation from a
socialist system to a Western-type market economy. Our main interest
is in discovering to what extent the socialist legacy influenced this
development. New business formation and entrepreneurship in
transitional East Germany is of particular interest because the socialist
GDR regime perceived entrepreneurship as a bourgeois anachronism
and strongly favored collectivist values (e.g., Pickel, 1992; Thomas,
1996). Hence, the socialist government adopted a rigorous anti-
entrepreneurship strategy and made numerous attempts to eradicate
entrepreneurship and private-sector firms. This included massive
socialization of private enterprises and intensive control, if not
suppression, of the few remaining private-sector activities that were
officially tolerated (for details, see Brezinski, 1987; Pickel, 1992). Even
in light of the GDR’s massive anti-entrepreneurship policy, however, in
1989, 1.8 percent of the population aged between 18 and 64 years
Jena Economic Research Papers 2012 - 042
2
were self-employed (Statistik der Deutschen Demokratischen Republik,
1990). This was about 20 percent of the West German level at that time
(Fritsch, Kritikos, and Rusakova, 2012).
In the remainder of this paper, we first describe development of
the overall level of self-employment in East Germany (Section 2).
Based on the overall picture, we then analyze individual determinants of
self-employment in East and West Germany (Section 3). Section 4
deals with regional differences. Finally, we draw conclusions and
suggest some promising and important avenues for further research
(Section 5).
2. New Business Formation and Self-Employment in East and West Germany During the Transformation Process
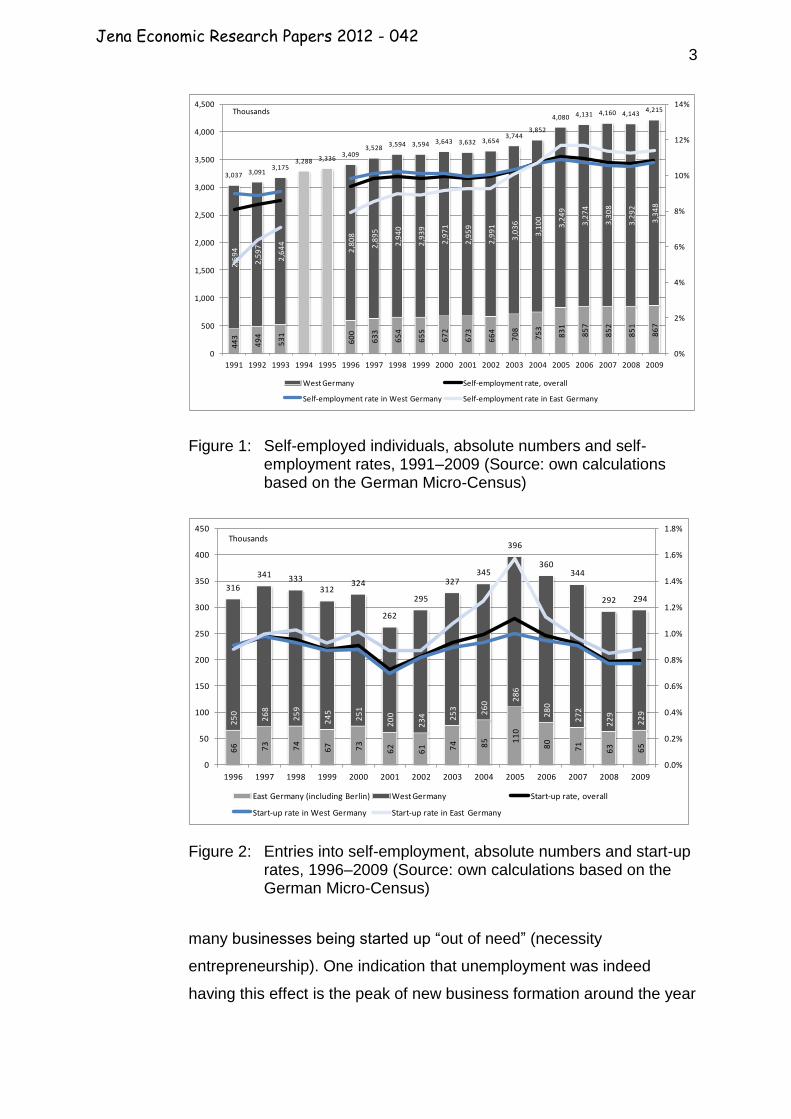
The opening of markets and the switch to a market economic system in
1990 induced a start-up boom in East Germany that clearly
demonstrated the willingness of many East Germans to be self-
employed. According to the German Micro-Census,2 the self-
employment rate—the share of self-employed persons over the working
population aged between 18 and 65 years—rose from about 1.8
percent at the end of the socialist period in 1989 to more than 5 percent
in 1991 (Figure 1).3 During the 1990s, the self-employment rate in East
Germany grew rapidly and reached the West German level in 2004.
Indeed, shortly after the turn of the century, the start-up rate (share of
founders over the working population) in East Germany was higher than
that of West Germany (Figure 2). One explanation for the persistent
high level of new business formation in East Germany could be the
relatively high level of unemployment there that may have resulted in
2 The German Micro-Census, conducted by the Federal Statistical Office, has a
general sampling fraction of 1 percent of the total population living in Germany, providing information about 820,000 individuals in each wave (Statistisches Bundesamt, 2009).
3 This rise in the self-employment rate is a slight overestimation caused by the
decreasing employment that is the denominator of the self-employment rate.
Jena Economic Research Papers 2012 - 042
3
Figure 1: Self-employed individuals, absolute numbers and self-employment rates, 1991–2009 (Source: own calculations based on the German Micro-Census)
Figure 2: Entries into self-employment, absolute numbers and start-up rates, 1996–2009 (Source: own calculations based on the German Micro-Census)
many businesses being started up “out of need” (necessity
entrepreneurship). One indication that unemployment was indeed
having this effect is the peak of new business formation around the year
44
3
49
4
53
1
60
0
63
3
65
4
65
5
67
2
67
3
66
4
70
8
75
3
83
1
85
7
85
2
85
1
86
7
2,5
94
2,5
97
2,6
44
2,8
08
2,8
95
2,9
40
2,9
39
2,9
71
2,9
59
2,9
91
3,0
36
3,1
00
3,2
49
3,2
74
3,3
08
3,2
92
3,3
48
3,037 3,0913,175
3,288 3,3363,409
3,5283,594 3,594 3,643 3,632 3,654
3,7443,852
4,080 4,131 4,160 4,1434,215
0%
2%
4%
6%
8%
10%
12%
14%
0
500
1,000
1,500
2,000
2,500
3,000
3,500
4,000
4,500
1991 1992 1993 1994 1995 1996 1997 1998 1999 2000 2001 2002 2003 2004 2005 2006 2007 2008 2009
West Germany Self-employment rate, overall
Self-employment rate in West Germany Self-employment rate in East Germany
Thousands
66 73
74
67 73
62
61 74 85 1
10
80
71
63 65
25
0
26
8
25
9
24
5
25
1
20
0
23
4 25
3 26
0 28
6
28
0
27
2
22
9
22
9
316
341 333312
324
262
295
327345
396
360344
292 294
0.0%
0.2%
0.4%
0.6%
0.8%
1.0%
1.2%
1.4%
1.6%
1.8%
0
50
100
150
200
250
300
350
400
450
1996 1997 1998 1999 2000 2001 2002 2003 2004 2005 2006 2007 2008 2009
East Germany (including Berlin) West Germany Start-up rate, overall
Start-up rate in West Germany Start-up rate in East Germany
Thousands
Jena Economic Research Papers 2012 - 042
4
2005 that is presumably due to the labor market reforms and the
massive extension of public support for startups by unemployed
persons (for details, see Caliendo and Kritikos, 2010).
Although there was a relatively large number of start-ups in East
Germany during this period, the new firms were on average smaller (for
details, see IWH, 2010) and less successful compared to their West
German counterparts (Brixy and Grotz, 2004). It is also remarkable that
a relatively high share of the newly emerging businesses in East
Germany were in industries such as retailing or hotels and restaurants,
which are characterized by low entry barriers in terms of financial
resources and required qualifications (for details, see Fritsch, Kritikos,
and Rusakova, 2012).
3. Differences in Personal Determinants of Startups in East and West Germany
There are good reasons to assume that East Germany’s socialist
legacy negatively affected its people’s attitudes toward
entrepreneurship and their willingness and ability to start an own firm.
One source of such a negative effect is the sharp decrease in
entrepreneurship during the socialist regime, which implies reduced
opportunities for contact with entrepreneurial role models. Second, the
anti-capitalistic propaganda, particularly indoctrination during education,
may have resulted in entrepreneurship being viewed negatively, thereby
reducing the willingness of East Germans to become self-employed
(Bauernschuster et al., 2009; Fritsch and Rusakova, 2012). Third, since
East Germans had relatively few incentives or opportunities to
accumulate capital, they have on average much fewer available
resources than their West German counterparts. Fourth, people who
have been educated and have worked in a socialist centrally planned
economy may lack a number of skills that are necessary for or at least
conducive to successful entrepreneurship. Thus, there might be
differences between East and West Germans with respect to the
individual determinants of becoming self-employed.
Jena Economic Research Papers 2012 - 042
5
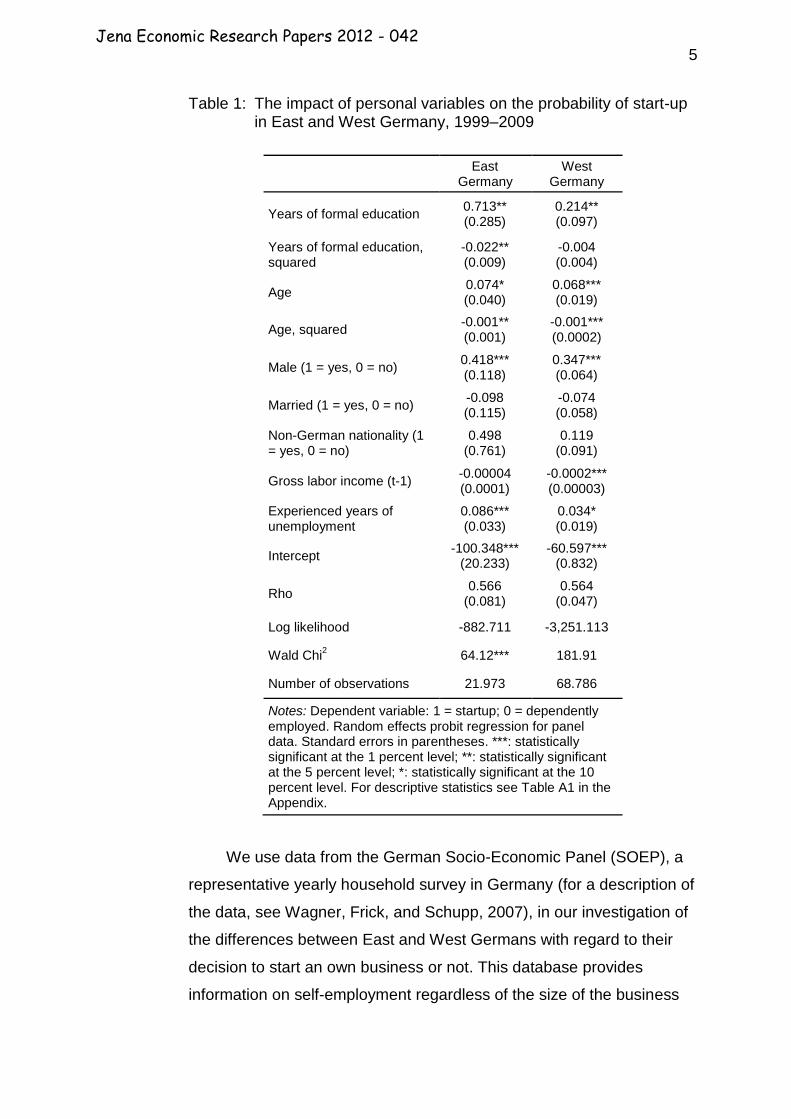
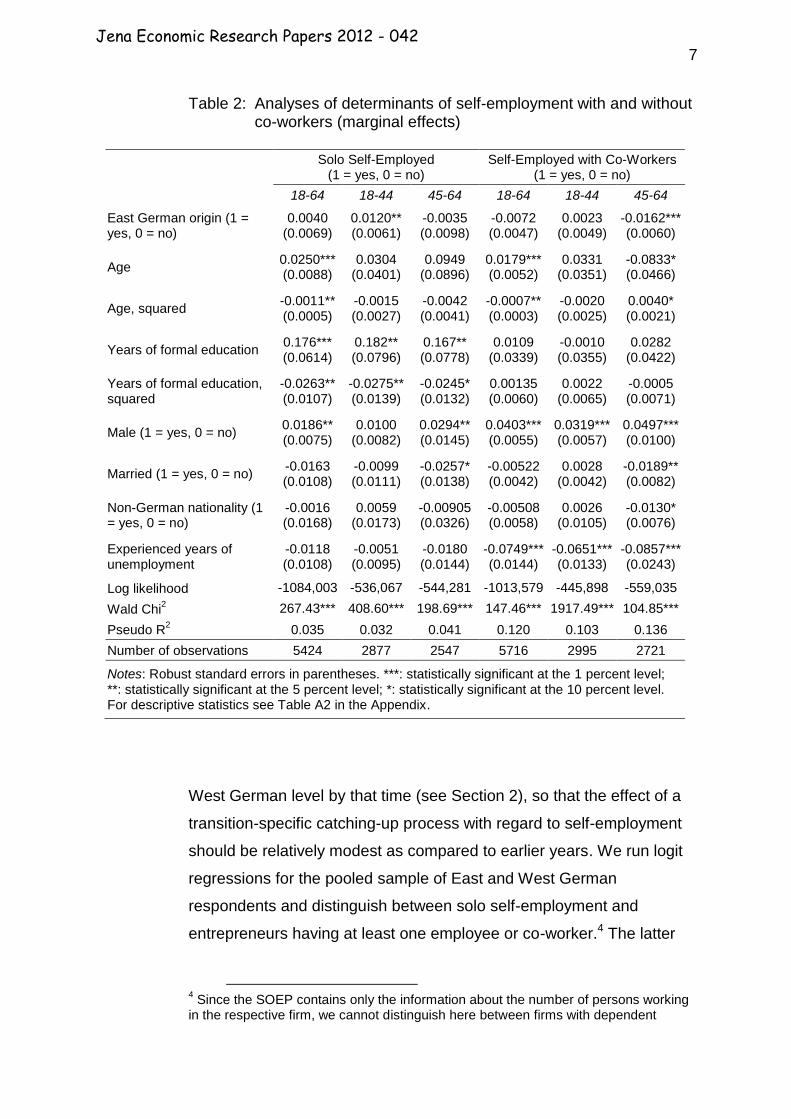
Table 1: The impact of personal variables on the probability of start-up in East and West Germany, 1999–2009
East Germany
West Germany
Years of formal education 0.713** (0.285)
0.214** (0.097)
Years of formal education, squared
-0.022** (0.009)
-0.004 (0.004)
Age 0.074* (0.040)
0.068*** (0.019)
Age, squared -0.001** (0.001)
-0.001*** (0.0002)
Male (1 = yes, 0 = no) 0.418*** (0.118)
0.347*** (0.064)
Married (1 = yes, 0 = no) -0.098 (0.115)
-0.074 (0.058)
Non-German nationality (1 = yes, 0 = no)
0.498 (0.761)
0.119 (0.091)
Gross labor income (t-1) -0.00004 (0.0001)
-0.0002*** (0.00003)
Experienced years of unemployment
0.086*** (0.033)
0.034* (0.019)
Intercept -100.348***
(20.233) -60.597***
(0.832)
Rho 0.566
(0.081) 0.564
(0.047)
Log likelihood -882.711 -3,251.113
Wald Chi2 64.12*** 181.91
Number of observations 21.973 68.786
Notes: Dependent variable: 1 = startup; 0 = dependently employed. Random effects probit regression for panel data. Standard errors in parentheses. ***: statistically significant at the 1 percent level; **: statistically significant at the 5 percent level; *: statistically significant at the 10 percent level. For descriptive statistics see Table A1 in the Appendix.
We use data from the German Socio-Economic Panel (SOEP), a
representative yearly household survey in Germany (for a description of
the data, see Wagner, Frick, and Schupp, 2007), in our investigation of
the differences between East and West Germans with regard to their
decision to start an own business or not. This database provides
information on self-employment regardless of the size of the business
Jena Economic Research Papers 2012 - 042
6
and therefore includes solo entrepreneurs who do not have any
employees. Our analysis is based on the waves 1999 to 2009 of the
SOEP, a period of relative tranquility compared to the pronounced
turbulence of the first phase of the transition process.
We find several differences between East and West Germans with
regard to the propensity to set up an own business (Table 1). One
significant difference is that the effect of formal education (measured in
years) on the propensity to become a business founder is rather linear
in West Germany but is inversely u-shaped among East Germans,
indicating a relatively high propensity of East Germans with a medium
level of education to found an own business. A possible reason for the
relatively low willingness of highly educated East Germans to set up an
own business could be that higher education in the GDR system
included massive anti-capitalistic indoctrination that may have had an
enduring negative effect on entrepreneurial attitudes (see Fritsch and
Rusakova, 2012). A second reason could be that the rather high level of
unemployment in East Germany had an especially strong effect of
forcing those with low and medium level qualifications into necessity
entrepreneurship, whereas people with high levels of human capital had
comparatively better chances of finding work as dependently employed.
This second argument is supported by our finding that having
experienced unemployment has a significantly stronger effect on the
probability of starting a firm in East Germany than in West Germany.
However, there are also some similarities among East and West
Germans, such as the inversely u-shaped relationship between age and
start up indicating that in both regions the highest propensity for starting
a firm is among middle-aged persons. Also true of both parts of the
country is that men are significantly more likely to start an own business
than are women.
In a next step, we investigate the determinants of self-employment
in East Germany using SOEP data for the year 2004. This year was
chosen because self-employment in East Germany had reached the
Jena Economic Research Papers 2012 - 042
7
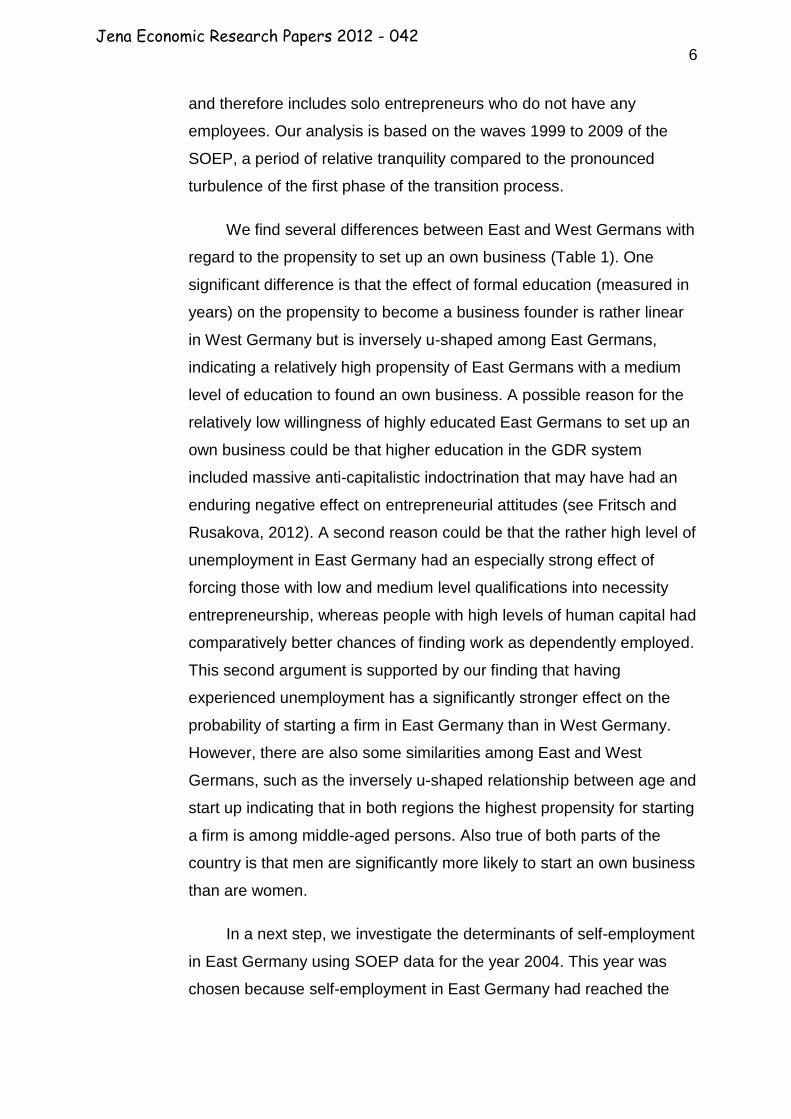
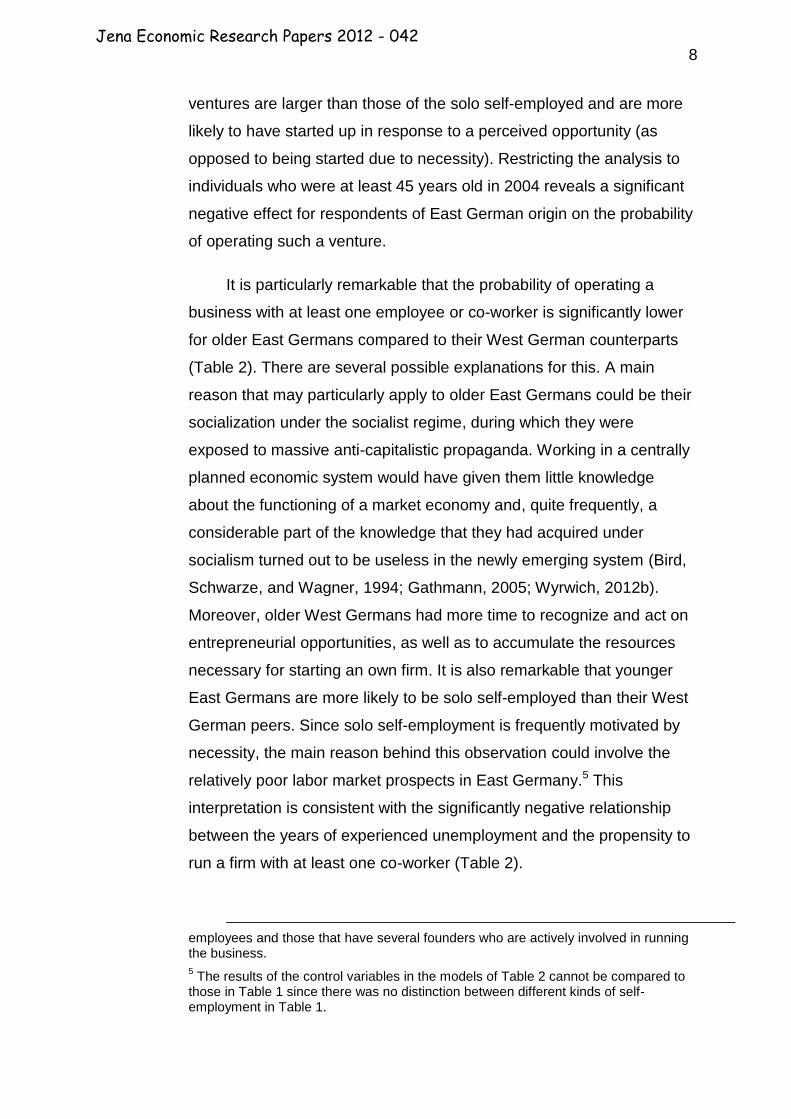
Table 2: Analyses of determinants of self-employment with and without co-workers (marginal effects)
Solo Self-Employed
(1 = yes, 0 = no) Self-Employed with Co-Workers
(1 = yes, 0 = no)
18-64 18-44 45-64 18-64 18-44 45-64
East German origin (1 = yes, 0 = no)
0.0040 (0.0069)
0.0120** (0.0061)
-0.0035 (0.0098)
-0.0072 (0.0047)
0.0023 (0.0049)
-0.0162*** (0.0060)
Age 0.0250*** (0.0088)
0.0304 (0.0401)
0.0949 (0.0896)
0.0179*** (0.0052)
0.0331 (0.0351)
-0.0833* (0.0466)
Age, squared -0.0011** (0.0005)
-0.0015 (0.0027)
-0.0042 (0.0041)
-0.0007** (0.0003)
-0.0020 (0.0025)
0.0040* (0.0021)
Years of formal education 0.176*** (0.0614)
0.182** (0.0796)
0.167** (0.0778)
0.0109 (0.0339)
-0.0010 (0.0355)
0.0282 (0.0422)
Years of formal education, squared
-0.0263** (0.0107)
-0.0275** (0.0139)
-0.0245* (0.0132)
0.00135 (0.0060)
0.0022 (0.0065)
-0.0005 (0.0071)
Male (1 = yes, 0 = no) 0.0186** (0.0075)
0.0100 (0.0082)
0.0294** (0.0145)
0.0403*** (0.0055)
0.0319*** (0.0057)
0.0497*** (0.0100)
Married (1 = yes, 0 = no) -0.0163 (0.0108)
-0.0099 (0.0111)
-0.0257* (0.0138)
-0.00522 (0.0042)
0.0028 (0.0042)
-0.0189** (0.0082)
Non-German nationality (1 = yes, 0 = no)
-0.0016 (0.0168)
0.0059 (0.0173)
-0.00905 (0.0326)
-0.00508 (0.0058)
0.0026 (0.0105)
-0.0130* (0.0076)
Experienced years of unemployment
-0.0118 (0.0108)
-0.0051 (0.0095)
-0.0180 (0.0144)
-0.0749*** (0.0144)
-0.0651*** (0.0133)
-0.0857*** (0.0243)
Log likelihood -1084,003 -536,067 -544,281 -1013,579 -445,898 -559,035
Wald Chi2 267.43*** 408.60*** 198.69*** 147.46*** 1917.49*** 104.85***
Pseudo R2
0.035 0.032 0.041 0.120 0.103 0.136
Number of observations 5424 2877 2547 5716 2995 2721
Notes: Robust standard errors in parentheses. ***: statistically significant at the 1 percent level; **: statistically significant at the 5 percent level; *: statistically significant at the 10 percent level. For descriptive statistics see Table A2 in the Appendix.
West German level by that time (see Section 2), so that the effect of a
transition-specific catching-up process with regard to self-employment
should be relatively modest as compared to earlier years. We run logit
regressions for the pooled sample of East and West German
respondents and distinguish between solo self-employment and
entrepreneurs having at least one employee or co-worker.4 The latter
4 Since the SOEP contains only the information about the number of persons working
in the respective firm, we cannot distinguish here between firms with dependent
Jena Economic Research Papers 2012 - 042
8
ventures are larger than those of the solo self-employed and are more
likely to have started up in response to a perceived opportunity (as
opposed to being started due to necessity). Restricting the analysis to
individuals who were at least 45 years old in 2004 reveals a significant
negative effect for respondents of East German origin on the probability
of operating such a venture.
It is particularly remarkable that the probability of operating a
business with at least one employee or co-worker is significantly lower
for older East Germans compared to their West German counterparts
(Table 2). There are several possible explanations for this. A main
reason that may particularly apply to older East Germans could be their
socialization under the socialist regime, during which they were
exposed to massive anti-capitalistic propaganda. Working in a centrally
planned economic system would have given them little knowledge
about the functioning of a market economy and, quite frequently, a
considerable part of the knowledge that they had acquired under
socialism turned out to be useless in the newly emerging system (Bird,
Schwarze, and Wagner, 1994; Gathmann, 2005; Wyrwich, 2012b).
Moreover, older West Germans had more time to recognize and act on
entrepreneurial opportunities, as well as to accumulate the resources
necessary for starting an own firm. It is also remarkable that younger
East Germans are more likely to be solo self-employed than their West
German peers. Since solo self-employment is frequently motivated by
necessity, the main reason behind this observation could involve the
relatively poor labor market prospects in East Germany.5 This
interpretation is consistent with the significantly negative relationship
between the years of experienced unemployment and the propensity to
run a firm with at least one co-worker (Table 2).
employees and those that have several founders who are actively involved in running the business.
5 The results of the control variables in the models of Table 2 cannot be compared to
those in Table 1 since there was no distinction between different kinds of self-employment in Table 1.
Jena Economic Research Papers 2012 - 042
9
Analyses of the survival of new businesses in East and West
Germany show a higher risk of failure for start-ups in East Germany
(Brixy and Grotz, 2004). Moreover, the surviving East German start-ups
in which West Germans are involved tend to grow more than other East
German start-ups (Wyrwich, 2010). This could be an indication that the
relevant entrepreneurial abilities of many East German founders are
comparatively low.
Analyzing the qualification of workers and self-employed with
regard to the diversity and structure of their skills, we find pronounced
differences between East and West Germany. According to the theory
of “balanced skills” (Lazear, 2004, 2005), successful entrepreneurship
requires a variety of skills. Furthermore, the skills should be “balanced”
because the success of a firm may depend on whether the weakest skill
becomes a bottleneck. The observation that many founders have
worked in small firms before starting a business (Wagner, 2004; Parker,
2009) suggests that there is a connection between firm size and the
skill balance of employees. With regard to measuring skill balance, it is
often assumed that an increase in the number of skills implies an
increase in skill balance. However, if a person already has acquired
skills in a number of fields, an additional skill may be of limited value as
there might be a maximum number of necessary skills. For this reason,
we define a maximum number of skills for the measurement of skill
balance. If this maximum number of skills is reached, a skill set is
regarded as balanced.
We use data from the BIBB/BAuA employment survey 20066 in
analyzing the factors that may determine the skill balance in East and
West Germany. This survey contains information on a representative
sample of about 20,000 dependently employed and self-employed
people. The indicator for skill balance is the number of expert skills that
6 The survey was conducted by the Federal Institute for Vocational Education and
Training (BIBB) and the Federal Institute for Occupational Safety (BAuA) in 2005 and 2006.
Jena Economic Research Papers 2012 - 042
10
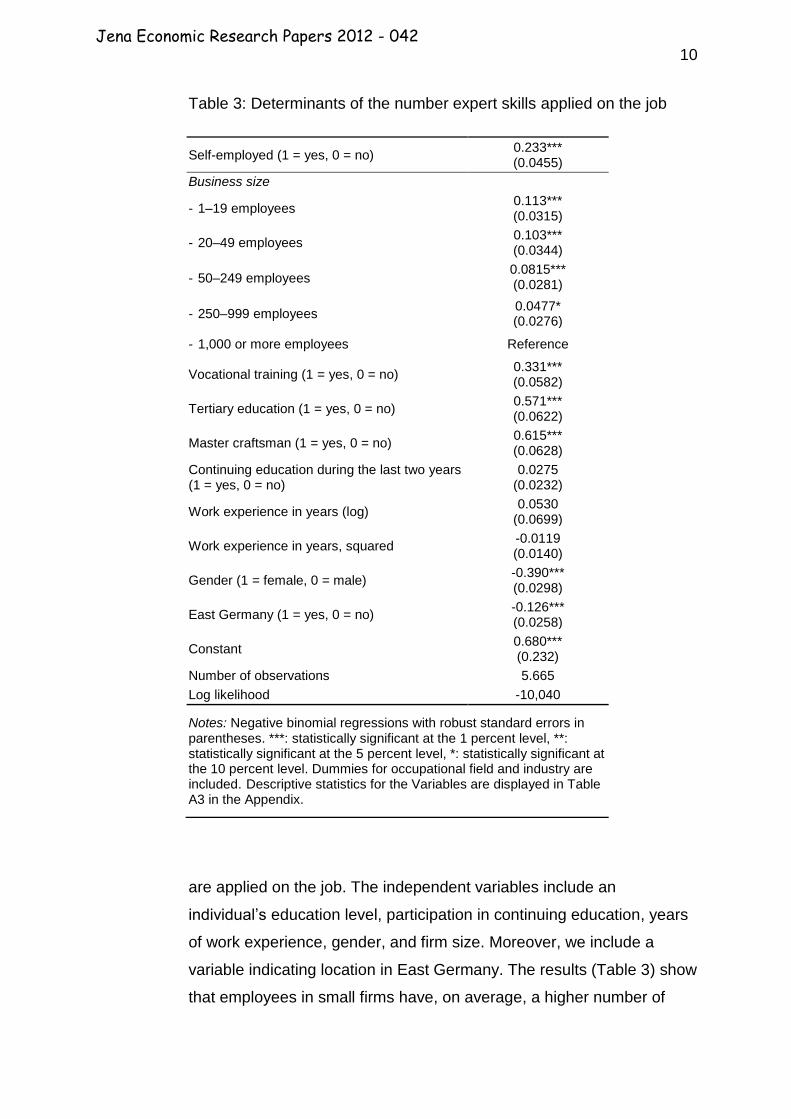
Table 3: Determinants of the number expert skills applied on the job
Self-employed (1 = yes, 0 = no) 0.233*** (0.0455)
Business size
- 1–19 employees 0.113*** (0.0315)
- 20–49 employees 0.103*** (0.0344)
- 50–249 employees 0.0815*** (0.0281)
- 250–999 employees 0.0477* (0.0276)
- 1,000 or more employees Reference
Vocational training (1 = yes, 0 = no) 0.331*** (0.0582)
Tertiary education (1 = yes, 0 = no) 0.571*** (0.0622)
Master craftsman (1 = yes, 0 = no) 0.615*** (0.0628)
Continuing education during the last two years (1 = yes, 0 = no)
0.0275 (0.0232)
Work experience in years (log) 0.0530
(0.0699)
Work experience in years, squared -0.0119 (0.0140)
Gender (1 = female, 0 = male) -0.390*** (0.0298)
East Germany (1 = yes, 0 = no) -0.126*** (0.0258)
Constant 0.680*** (0.232)
Number of observations 5.665
Log likelihood -10,040
Notes: Negative binomial regressions with robust standard errors in parentheses. ***: statistically significant at the 1 percent level, **: statistically significant at the 5 percent level, *: statistically significant at the 10 percent level. Dummies for occupational field and industry are included. Descriptive statistics for the Variables are displayed in Table A3 in the Appendix.
are applied on the job. The independent variables include an
individual’s education level, participation in continuing education, years
of work experience, gender, and firm size. Moreover, we include a
variable indicating location in East Germany. The results (Table 3) show
that employees in small firms have, on average, a higher number of
Jena Economic Research Papers 2012 - 042
11
expert skills than employees in larger firms (for details, see Bublitz and
Noseleit, 2011). East Germans have on average a significantly lower
number of expert skills than their West German counterparts.
There are at least two possible explanations for the relatively
strong specialization of workers in East Germany. First, the fact that a
large number of East German firms are branches of West German
companies might turn these establishments into “extended work
benches” where workers need relatively few skills. Second, studies
show (see, e.g., Wagner, 1993) that in the past, employees in the East
German economy rarely changed jobs and thus needed relatively few
skills. Since the skill balance in terms of the number of expert
qualifications has a positive effect on the success of start-ups, a low
diversity of skills could be another explanation for the relatively low
economic success of East German firms and the relatively low start-up
rate right after reunification.
4. Regional Differences in Entrepreneurship
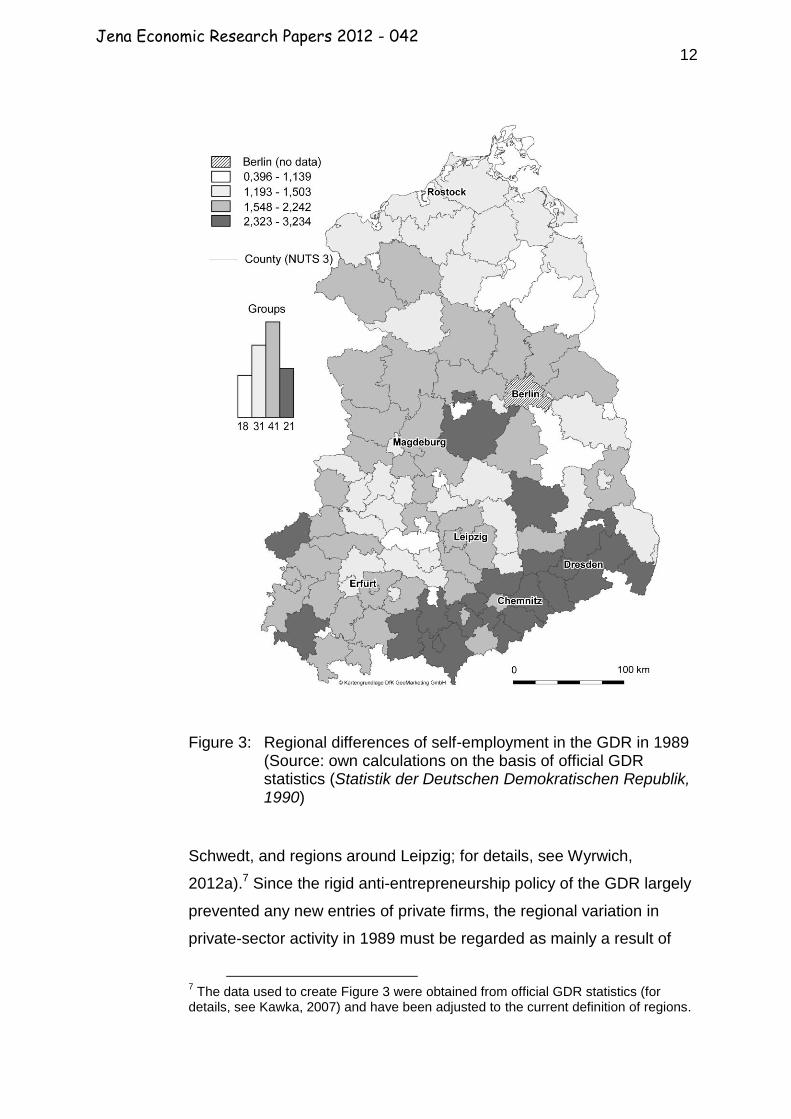
Looking at the regional distribution of self-employment, we find
significant differences, indicating that region-specific factors play a
prominent role. In fact, even in September 1989, after 40 years of
socialist regime and just before the East German transition to a market
economic system, large regional differences are observed with regard
to the share of self-employed in the GDR. At that time, the self-
employment rate varied between 0.4 and 3.2 percent (Figure 3).
Specifically, regions in the southern part of the GDR, such as Chemnitz,
Zwickau, and Dresden, had a considerably above average level of self-
employment, whereas self-employment rates were especially low in
regions with a high employment share in agriculture and in those areas
where local industry was strongly shaped by socialist industrial policy
and regional planning (e.g., Bitterfeld, Eisenhüttenstadt, Hoyerswerda,
Jena Economic Research Papers 2012 - 042
12
Figure 3: Regional differences of self-employment in the GDR in 1989 (Source: own calculations on the basis of official GDR statistics (Statistik der Deutschen Demokratischen Republik, 1990)
Schwedt, and regions around Leipzig; for details, see Wyrwich,
2012a).7 Since the rigid anti-entrepreneurship policy of the GDR largely
prevented any new entries of private firms, the regional variation in
private-sector activity in 1989 must be regarded as mainly a result of
7 The data used to create Figure 3 were obtained from official GDR statistics (for
details, see Kawka, 2007) and have been adjusted to the current definition of regions.
Jena Economic Research Papers 2012 - 042
13
variation in private initiative or of different levels of resistance to political
attempts to abolish private firms. Hence, on the eve of the transition to a
market economy, there was considerable variation across East German
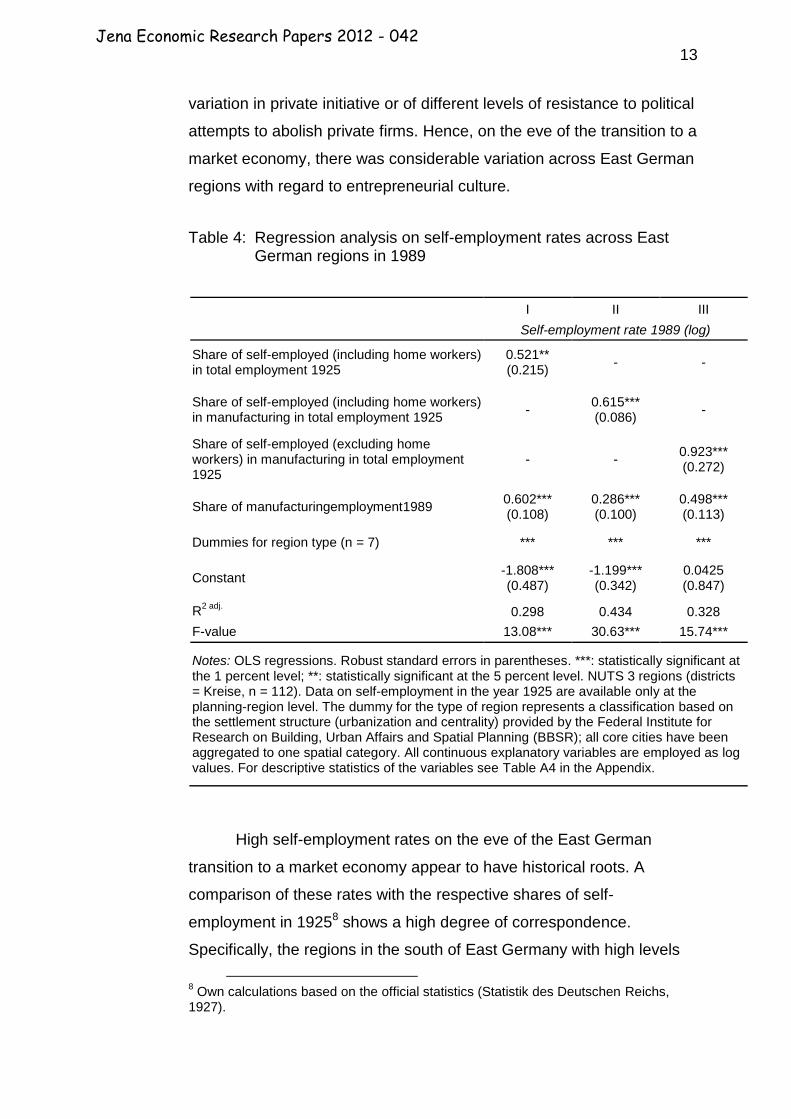
regions with regard to entrepreneurial culture.
Table 4: Regression analysis on self-employment rates across East German regions in 1989
I II III
Self-employment rate 1989 (log)
Share of self-employed (including home workers) in total employment 1925
0.521** (0.215)
- -
Share of self-employed (including home workers) in manufacturing in total employment 1925
- 0.615*** (0.086)
-
Share of self-employed (excluding home workers) in manufacturing in total employment 1925
- - 0.923*** (0.272)
Share of manufacturingemployment1989 0.602*** (0.108)
0.286*** (0.100)
0.498*** (0.113)
Dummies for region type (n = 7) *** *** ***
Constant -1.808*** (0.487)
-1.199*** (0.342)
0.0425 (0.847)
R2 adj.
0.298 0.434 0.328
F-value 13.08*** 30.63*** 15.74***
Notes: OLS regressions. Robust standard errors in parentheses. ***: statistically significant at the 1 percent level; **: statistically significant at the 5 percent level. NUTS 3 regions (districts = Kreise, n = 112). Data on self-employment in the year 1925 are available only at the planning-region level. The dummy for the type of region represents a classification based on the settlement structure (urbanization and centrality) provided by the Federal Institute for Research on Building, Urban Affairs and Spatial Planning (BBSR); all core cities have been aggregated to one spatial category. All continuous explanatory variables are employed as log values. For descriptive statistics of the variables see Table A4 in the Appendix.
High self-employment rates on the eve of the East German
transition to a market economy appear to have historical roots. A
comparison of these rates with the respective shares of self-
employment in 19258 shows a high degree of correspondence.
Specifically, the regions in the south of East Germany with high levels
8 Own calculations based on the official statistics (Statistik des Deutschen Reichs,
1927).
Jena Economic Research Papers 2012 - 042
14
of self-employment in 1989 also had high self-employment rates more
than 60 years earlier, in 1925. Regression models for explaining the
regional level of self-employment in East German regions in 1989 that
control for regional conditions such as population density and share of
manufacturing employment reveal a significant positive effect of the
self-employment rate in 1925 (Table 4). This result clearly suggests that
a number of severe historical shocks, such as World War II and
separation of the country into an eastern and a western part, as well as
four decades of socialism, could not completely eradicate the regional
culture of entrepreneurship that existed in the presocialist period.
The effect of self-employment in 1925 is even more pronounced
when restricting the measure to the manufacturing sector and it is even
stronger if home workers are excluded (Table 4). The stronger effect of
manufacturing self-employment can be explained with the on average
larger firm size in this sector, which may require a higher level of
entrepreneurial ability to overcome entry barriers compared to, for
example, a business in small-scale services.9 Thus, self-employment in
manufacturing might be an especially well-suited indicator of the
historical geography of entrepreneurial talent and culture. We conclude
that self-employment has survived the socialist period especially in
those regions that had an entrepreneurial tradition in the manufacturing
sector before the socialist GDR regime came into existence.
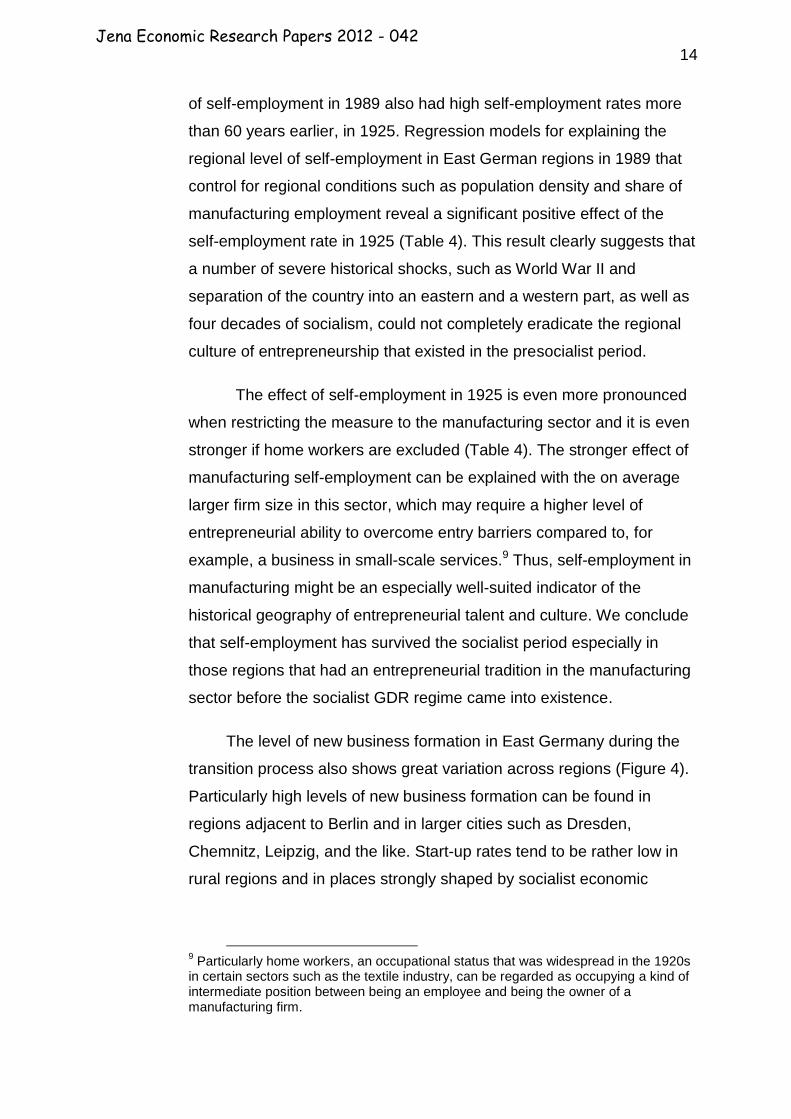
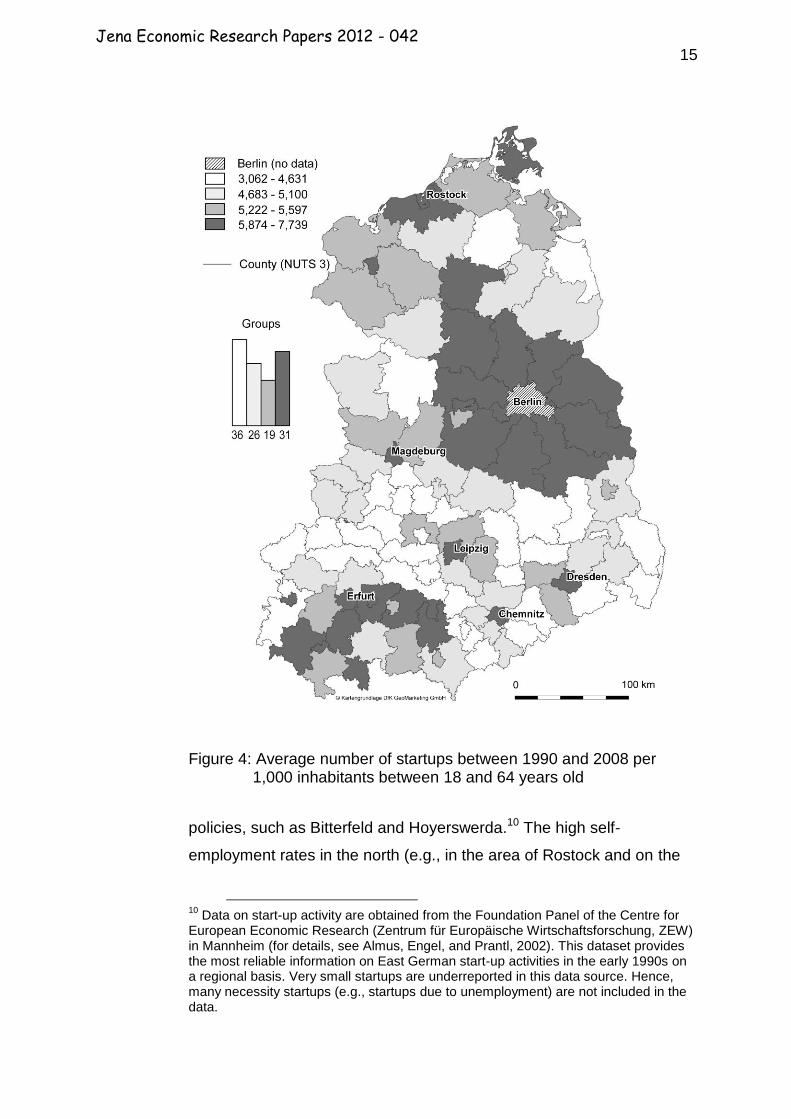
The level of new business formation in East Germany during the
transition process also shows great variation across regions (Figure 4).
Particularly high levels of new business formation can be found in
regions adjacent to Berlin and in larger cities such as Dresden,
Chemnitz, Leipzig, and the like. Start-up rates tend to be rather low in
rural regions and in places strongly shaped by socialist economic
9 Particularly home workers, an occupational status that was widespread in the 1920s
in certain sectors such as the textile industry, can be regarded as occupying a kind of intermediate position between being an employee and being the owner of a manufacturing firm.
Jena Economic Research Papers 2012 - 042
15
Figure 4: Average number of startups between 1990 and 2008 per 1,000 inhabitants between 18 and 64 years old
policies, such as Bitterfeld and Hoyerswerda.10 The high self-
employment rates in the north (e.g., in the area of Rostock and on the
10
Data on start-up activity are obtained from the Foundation Panel of the Centre for European Economic Research (Zentrum für Europäische Wirtschaftsforschung, ZEW) in Mannheim (for details, see Almus, Engel, and Prantl, 2002). This dataset provides the most reliable information on East German start-up activities in the early 1990s on a regional basis. Very small startups are underreported in this data source. Hence, many necessity startups (e.g., startups due to unemployment) are not included in the data.
Jena Economic Research Papers 2012 - 042
16
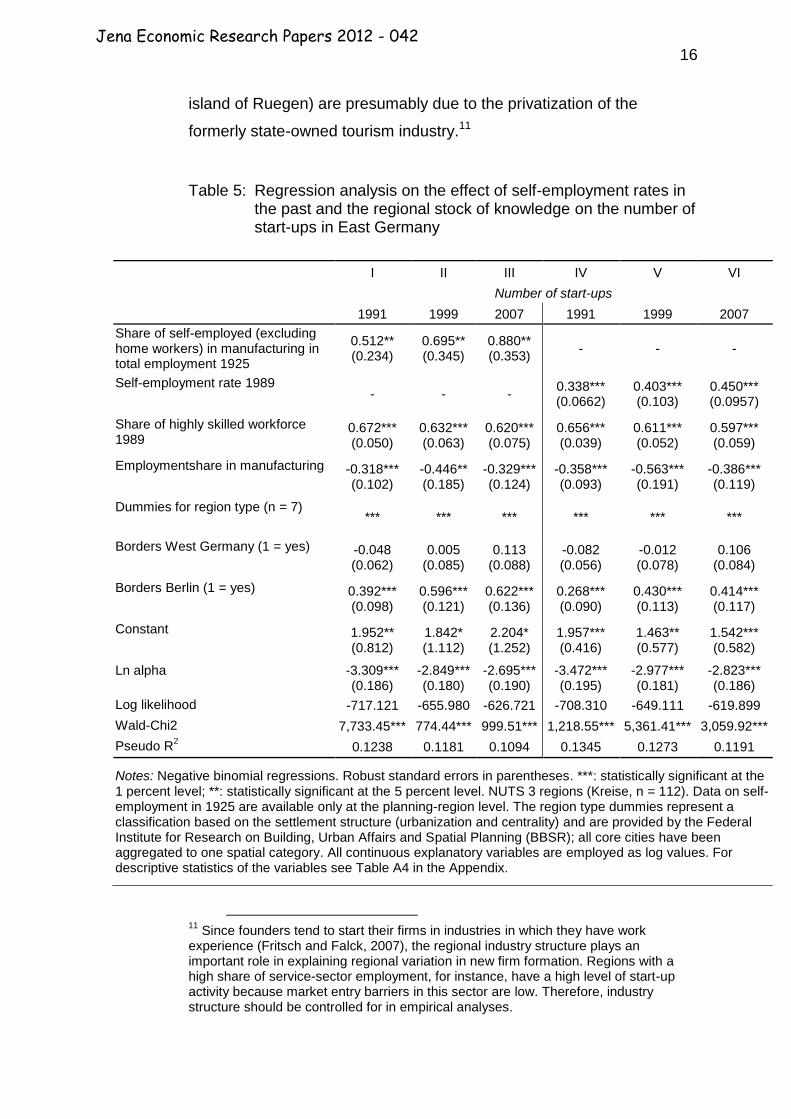
island of Ruegen) are presumably due to the privatization of the
formerly state-owned tourism industry.11
Table 5: Regression analysis on the effect of self-employment rates in the past and the regional stock of knowledge on the number of start-ups in East Germany
I II III IV V VI
Number of start-ups
1991 1999 2007 1991 1999 2007
Share of self-employed (excluding home workers) in manufacturing in total employment 1925
0.512** (0.234)
0.695** (0.345)
0.880** (0.353)
- - -
Self-employment rate 1989 - - -
0.338*** (0.0662)
0.403*** (0.103)
0.450*** (0.0957)
Share of highly skilled workforce 1989
0.672*** (0.050)
0.632*** (0.063)
0.620*** (0.075)
0.656*** (0.039)
0.611*** (0.052)
0.597*** (0.059)
Employmentshare in manufacturing -0.318*** (0.102)
-0.446** (0.185)
-0.329*** (0.124)
-0.358*** (0.093)
-0.563*** (0.191)
-0.386*** (0.119)
Dummies for region type (n = 7) *** *** *** *** *** ***
Borders West Germany (1 = yes) -0.048 (0.062)
0.005 (0.085)
0.113 (0.088)
-0.082 (0.056)
-0.012 (0.078)
0.106 (0.084)
Borders Berlin (1 = yes) 0.392*** (0.098)
0.596*** (0.121)
0.622*** (0.136)
0.268*** (0.090)
0.430*** (0.113)
0.414*** (0.117)
Constant 1.952** (0.812)
1.842* (1.112)
2.204* (1.252)
1.957*** (0.416)
1.463** (0.577)
1.542*** (0.582)
Ln alpha -3.309*** (0.186)
-2.849*** (0.180)
-2.695*** (0.190)
-3.472*** (0.195)
-2.977*** (0.181)
-2.823*** (0.186)
Log likelihood -717.121 -655.980 -626.721 -708.310 -649.111 -619.899
Wald-Chi2 7,733.45*** 774.44*** 999.51*** 1,218.55*** 5,361.41*** 3,059.92***
Pseudo R2 0.1238 0.1181 0.1094 0.1345 0.1273 0.1191
Notes: Negative binomial regressions. Robust standard errors in parentheses. ***: statistically significant at the 1 percent level; **: statistically significant at the 5 percent level. NUTS 3 regions (Kreise, n = 112). Data on self-employment in 1925 are available only at the planning-region level. The region type dummies represent a classification based on the settlement structure (urbanization and centrality) and are provided by the Federal Institute for Research on Building, Urban Affairs and Spatial Planning (BBSR); all core cities have been aggregated to one spatial category. All continuous explanatory variables are employed as log values. For descriptive statistics of the variables see Table A4 in the Appendix.
11
Since founders tend to start their firms in industries in which they have work experience (Fritsch and Falck, 2007), the regional industry structure plays an important role in explaining regional variation in new firm formation. Regions with a high share of service-sector employment, for instance, have a high level of start-up activity because market entry barriers in this sector are low. Therefore, industry structure should be controlled for in empirical analyses.
Jena Economic Research Papers 2012 - 042
17
Regression analyses with the number of regional start-ups as the
dependent variable reveal two effects of regional conditions in 1989 on
start-up activity (Table 5). First, the self-employment rate in 1989 as
well as the share of self-employed in manufacturing industries in total
employment in 1925 have a significant positive effect on start-up rates
after the transition even when industry structure and further potential
influences (e.g., common border with Berlin or West Germany, share of
highly-skilled workforce) are controlled for (for details, see Wyrwich,
2012a). This clearly indicates that regions with a long tradition in self-
employment have higher start-up rates in the 1990–2007 period.
Interestingly, the effect of past self-employment becomes stronger over
time. This might be explained by “transition noise” and turbulence in
start-up activity in the early 1990s, which might interfere with the
positive long-term effect of the historic entrepreneurial culture. A second
main finding is that the share of employees with a tertiary degree in
1989 has a significant positive effect on start-up activity in all regression
models. This suggests that regional knowledge is an important factor in
explaining new business formation (Acs et al., 2010) even when this
knowledge was acquired under socialism.
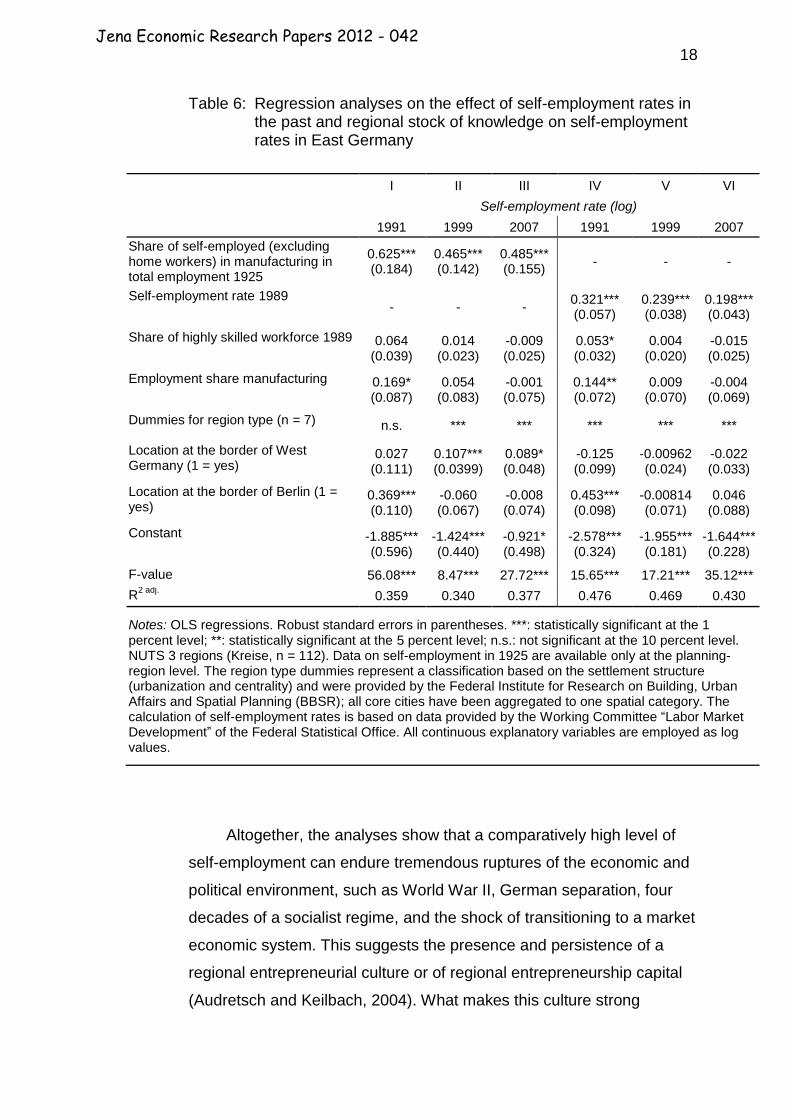
Against the background of the significant positive effect of self-
employment rates in 1925 and 1989 on start-up activity after the
transition, it is not surprising that there is also a positive relationship
with regional self-employment rates after reunification (Table 6).
Regions with high self-employment in the past show a remarkable
increase in self-employment during the early stage of the transition
process. The actual self-employment rate results from the difference
between market entries and exits. Thus, a comparatively strong
increase in self-employment in a region indicates that a relatively high
share of the entries survived market competition for a longer period of
time. That the share of highly skilled employees has only a relatively
weak effect in these estimates corresponds to the low propensity to
start a business that we found for East Germans who hold a university
degree (Section 3).
Jena Economic Research Papers 2012 - 042
18
Table 6: Regression analyses on the effect of self-employment rates in the past and regional stock of knowledge on self-employment rates in East Germany
I II III IV V VI
Self-employment rate (log)
1991 1999 2007 1991 1999 2007
Share of self-employed (excluding home workers) in manufacturing in total employment 1925
0.625*** (0.184)
0.465*** (0.142)
0.485*** (0.155)
- - -
Self-employment rate 1989 - - -
0.321*** (0.057)
0.239*** (0.038)
0.198*** (0.043)
Share of highly skilled workforce 1989 0.064 (0.039)
0.014 (0.023)
-0.009 (0.025)
0.053* (0.032)
0.004 (0.020)
-0.015 (0.025)
Employment share manufacturing 0.169* (0.087)
0.054 (0.083)
-0.001 (0.075)
0.144** (0.072)
0.009 (0.070)
-0.004 (0.069)
Dummies for region type (n = 7) n.s. *** *** *** *** ***
Location at the border of West Germany (1 = yes)
0.027 (0.111)
0.107*** (0.0399)
0.089* (0.048)
-0.125 (0.099)
-0.00962 (0.024)
-0.022 (0.033)
Location at the border of Berlin (1 = yes)
0.369*** (0.110)
-0.060 (0.067)
-0.008 (0.074)
0.453*** (0.098)
-0.00814 (0.071)
0.046 (0.088)
Constant -1.885*** (0.596)
-1.424*** (0.440)
-0.921* (0.498)
-2.578*** (0.324)
-1.955*** (0.181)
-1.644*** (0.228)
F-value 56.08*** 8.47*** 27.72*** 15.65*** 17.21*** 35.12***
R2 adj.
0.359 0.340 0.377 0.476 0.469 0.430
Notes: OLS regressions. Robust standard errors in parentheses. ***: statistically significant at the 1 percent level; **: statistically significant at the 5 percent level; n.s.: not significant at the 10 percent level. NUTS 3 regions (Kreise, n = 112). Data on self-employment in 1925 are available only at the planning-region level. The region type dummies represent a classification based on the settlement structure (urbanization and centrality) and were provided by the Federal Institute for Research on Building, Urban Affairs and Spatial Planning (BBSR); all core cities have been aggregated to one spatial category. The calculation of self-employment rates is based on data provided by the Working Committee “Labor Market Development” of the Federal Statistical Office. All continuous explanatory variables are employed as log values.
Altogether, the analyses show that a comparatively high level of
self-employment can endure tremendous ruptures of the economic and
political environment, such as World War II, German separation, four
decades of a socialist regime, and the shock of transitioning to a market
economic system. This suggests the presence and persistence of a
regional entrepreneurial culture or of regional entrepreneurship capital
(Audretsch and Keilbach, 2004). What makes this culture strong
Jena Economic Research Papers 2012 - 042
19
enough to survive disruptive change and historical shocks? Three
different mechanisms are highlighted in the literature (for an overview,
see Andersson and Koster, 2011):
First, entrepreneurs act as role models, which triggers the adoption
of entrepreneurial behavior by other local actors (e.g., Fornahl, 2003;
Minniti, 2005).Several empirical investigations find that the presence
of entrepreneurs in a region has a positive effect on decisions to start
a firm (e.g., Mueller, 2006). A common explanation for this result is
that observing entrepreneurs in the local environment provides an
opportunity to learn about entrepreneurship and the type of personal
attributes necessary for success. In other words, social interaction
with entrepreneurs may allow potential founders to assess their own
ability to start and operate a venture (Bosma et al., 2012).
Second, it can be presumed that a high level of self-employment in a
region indicates high social acceptance and legitimacy of
entrepreneurial behavior in that region (Etzioni, 1987). This should
have a positive effect on entrepreneurial choice and the aggregate
level of start-up activity.
Third, high levels of start-up activity can lead to an infrastructure
supportive of entrepreneurship (e.g., consulting and finance services)
that enhances the overall entrepreneurial climate of a region.
The results of our analyses of self-employment in the GDR
suggest that in some areas individuals were more resistant to the anti-
entrepreneurship policies of the socialist government than in others.
This implies that in some regions, the regime’s albeit limited tolerance
for private-sector economic activity was taken advantage to a greater
degree than in other regions. Data on the proportion of craftsmen who
joined socialist handicraft cooperatives (Produktionsgenossenschaften
des Handwerks = PG) do indeed show lower shares in regions with a
pronounced entrepreneurial tradition (Wyrwich, 2012a).Furthermore,
empirical evidence indicates that there was a considerable degree of
Jena Economic Research Papers 2012 - 042
20
intergenerational continuity in self-employment in the GDR (Pickel,
1992). Thus, entrepreneurial attitudes might have been passed on from
generation to generation, which then explains the persistence of self-
employment and the survival of entrepreneurial culture.
5. Summary and Conclusions
Our analyses of self-employment in East Germany after 40 years of a
socialist regime lead to several remarkable results. After having been
suppressed for a long period of time, self-employment and
entrepreneurship in East Germany seem to have recovered. However, it
took 15 years for the self-employment rate in East Germany to reach
that of West Germany. Forty years of socialism as well as the
subsequent shock transformation to a market economy left their marks
on East Germany, as evidenced by the propensity of East Germans to
start an own business. Socialization under and work experience in a
centrally planned socialist economy had a negative effect on the
propensity to found an own business and on being self-employed,
especially for older and better-educated East Germans. We also find
that East Germans tend to have a fewer skills than their West German
counterparts, which could have a negative affect on the propensity to
found a start-up and possibly also on the success of a newly founded
businesses. There is also strong indication that the high unemployment
rate during the East German transformation to a market economy led to
a relatively high share of start-ups, especially of firms without any co-
workers (solo entrepreneurship), where a necessity motivation played a
significant role. These results indicate that the socialist legacy, as well
as the shock transformation to a market economy, resulted in a specific
kind of regional growth regime in East Germany (Audretsch and Fritsch,
2002; Fritsch, 2004). Hence, the drivers of growth in this region have
been and may still be different from those in the western part of the
country.
Jena Economic Research Papers 2012 - 042

21
Another important finding from our analyses was that regional
differences in the level of self-employment seem to be persistent over
time. In particular, we show a significant positive relationship between
the current regional self-employment rate, the self-employment level at
the end of the GDR in 1989, and the level of self-employment prior to
World War II. This indicates a long-term regional imprinting that may be
regarded as a regional entrepreneurial culture.
Our analyses raise a number of questions that should be
investigated by future research. For example, it is highly important to
better understand the regional culture of entrepreneurship. What
creates such a culture? How does it begin and then evolve? How is it
transferred across generations? Do different entrepreneurial cultures
have different degrees of persistence and, if so, why? A particularly
important question has to do with the effect of entrepreneurship and,
particularly, a long-persistent culture of entrepreneurship on economic
development. We show that regions with high levels of self-employment
at the end of the GDR regime and those that had high levels prior to
World War II also experienced a quick recovery of entrepreneurship
during the transformation process so that they tend to have high levels
of self-employment today. This might be an indication that these
entrepreneurial regions also managed the challenges of the
transformation process quite well (Kawka, 2007). However, further
research is necessary before we can definitively answer this important
question. Fortunately, past and continuing developments in East and
West Germany provide many opportunities for further analyses of such
questions.
Jena Economic Research Papers 2012 - 042
22
References
Acs, Zoltan J., David B. Audretsch, Bo Carlsson, and Pontus Braunerhjelm (2010): The missing link: Knowledge diffusion and entrepreneurship in endogenous growth. Small Business Economics, 34, 93–104.
Almus, Matthias, Dirk Engel, and Susanne Prantl (2002): Mannheimer Gründungspanels des Zentrums für Europäische Wirtschaftsforschung GmbH (ZEW). In Michael Fritsch and Reinhold Grotz (eds.): Das Gründungsgeschehen in Deutschland – Darstellung und Vergleich der Datenquellen,Heidelberg: Physica, 79–102.
Andersson, Martin, and Sierdjan Koster (2011): Sources of persistence in regional start-up rates—Evidence from Sweden. Journal of Economic Geography, 11, 179–201.
Audretsch, David B., and Michael Fritsch (2002): Growth regimes over space and time. Regional Studies, 36, 113–124.
Audretsch, David B., and Max Keilbach (2004): Entrepreneurship capital and economic performance. Regional Studies, 38, 949–959.
Bauernschuster, Stephan, Oliver Falck, Robert Gold, and Stephan Heblich (2009): The shadows of the past: Implicit institutions and entrepreneurship. Jena Economic Research Papers, 2009-044, Friedrich Schiller University and Max Planck Institute of Economics Jena.
Bird, Edward J., Johannes Schwarze, and Gert G. Wagner (1994): Wage effects of the move toward free markets in East Germany. Industrial and Labor Relations Review, 47, 390–400.
Bosma, Niels, Jolanda Hessels, Veronique Schutjens, Mirjam van Praag, and Ingrid Verheul (2012): Entrepreneurship and role models. Journal of Economic Psychology, 33, 410–424.
Brezinski, Horst (1987): The second economy in the GDR: Pragmatism is gaining ground. Studies in Comparative Communism, XX, 85–101.
Brezinski, Horst, and Fritsch, Michael (1995): Transformation: The shocking German way. Moct-Most, 5, 1–25.
Brixy, Udo, and Reinhold Grotz (2004): Differences of the economic performance of newly founded firms in West- and East Germany. In Michael Dowling, Jürgen Schmude, and Dodo zuKnyphausen-Aufsess (eds.), Advances in Interdisciplinary European Entrepreneurship Research, Muenster: Lit, 143–152.
Jena Economic Research Papers 2012 - 042
23
Bublitz, Elisabeth, and Florian Noseleit (2011): The skill balancing act: Determinants of and returns to balanced skills. Jena Economic Working Papers 25-2011, Friedrich Schiller University and Max Planck Institute of Economics, Jena.
Caliendo, Marco, and Alexander Kritikos (2010): Start-ups by the unemployed: Characteristics, survival and direct employment effects. Small Business Economics, 35, 71–92
Etzioni, Amitai (1987): Entrepreneurship, adaptation and legitimation. Journal of Economic Behavior and Organization, 8, 175–199.
Fornahl, Dirk (2003): Entrepreneurial activities in a regional context. In Dirk Fornahl And Thomas Brenner (Eds.), Cooperation, Networks, and Institutions in Regional Innovation Systems. Northhampton: Edward Elgar, 38–57.
Fritsch, Michael (2004): Entrepreneurship, entry and performance of new businesses compared in two growth regimes: East and West Germany. Journal of Evolutionary Economics, 14, 525–542.
Fritsch, Michael, and Oliver Falck (2007): New business formation by industry over space and time: A multi-dimensional analysis. Regional Studies, 41, 157–172.
Fritsch, Michael, Alexander Kritikos, and Alina Rusakova (2012): Who starts a business and who is self-employed in Germany? Jena Economic Research Paper 2012-001, Friedrich Schiller University and Max Planck Institute of Economics, Jena.
Fritsch, Michael, and Alina Rusakova (2012): Self-employment after socialism: Intergenerational links, entrepreneurial values, and human capital. Jena Economic Research Paper 2012-022, Friedrich Schiller University and Max Planck Institute of Economics, Jena.
Gathmann, Christina (2005): The skill loss of older East Germans after re-unification. Schmollers Jahrbuch, 125, 7–16.
IWH (2010): Ostdeutschlands Transformation seit 1990 im Spiegel wirt-schaftlicher und sozialer Indikatoren, 2. aktualisierte und verbes-serte Auflage, Institut für Wirtschaftsforschung: Halle.
Kawka, Rupert (2007): Regional disparities in the GDR: Do they still matter? In Sebastian Lentz (ed.), German Annual of Spatial Research and Policy: Restructuring Eastern Germany. Berlin: Springer, 111–122.
Lazear, Edward P. (2004): Balanced skills and entrepreneurship. American Economic Review, 94, 208–211.
Lazear, Edward P. (2005): Entrepreneurship. Journal of Labor Economics, 23, 649–680.
Minniti, Maria (2005): Entrepreneurship and network externalities. Journal of Economic Behavior and Organization, 57, 1–27.
Jena Economic Research Papers 2012 - 042
24
Mueller, Pamela (2006): Entrepreneurship in the region: Breeding ground for nascent entrepreneurs? Small Business Economics, 27, 41–58.
Parker, Simon C. (2009): Why do small firms produce the entrepreneurs? Journal of Socio-Economics, 38, 484–494.
Pickel, Andreas (1992): Radical Transitions: The Survival and Revival of Entrepreneurship in the GDR. Boulder, CO: Westview Press.
Statistik der Deutschen Demokratischen Republik (1990): Statistisches Jahrbuch der DDR. Staatsverlag: Berlin.
Statistik des Deutschen Reichs (1927): Volks-, Berufs- und Betriebszählung vom 16. Juni 1925: Die berufliche und soziale Gliederung der Bevölkerung in den Ländern und Landesteilen.
Band 403–Band 405), Berlin: Reimar Hobbing.
Statistisches Bundesamt (2009): Handbuch zum Mikrozensus-Panel 2001–2004. Wiesbaden: Statistische Bundesamt http://www.gesis.org/download/fileadmin/missy/erhebung/Panel/2001-2004/MZP0104_Handbuch.pdf
Wagner, Gerd, Joachim R. Frick, and Jürgen Schupp (2007): The German Socio-Economic Panel Study (SOEP): Scope, evolution and enhancements. Journal of Applied Social Science Studies, 127, 139–169.
Wagner, Joachim (2004): Are young and small firms hothouses for nascent entrepreneurs? Evidence from German Micro Data. Applied Economics Quarterly, 50, 379–391.
Wagner, Karin (1993): Qualifikationsniveau in ostdeutschen Betrieben, Bestand-Bewertung-Anpassungsbedarf. Zeitschrift für Betriebswirtschaft, 63, 129–145.
Wyrwich, Michael (2010): Assessing the role of strategy and “socioe-conomic heritage” for rapidly growing firms: Evidence from Ger-many. International Journal for Entrepreneurial Venturing, 1, 245–263.
Wyrwich, Michael (2012a): Regional entrepreneurial heritage in a socialist and a post-socialist economy. Economic Geography (forthcoming).
Wyrwich, Michael (2012b): Age and entrepreneurship: Does socioeco-nomic heritage produce a lost generation? Friedrich Schiller University Jena (Mimeo).
Jena Economic Research Papers 2012 - 042
25
Appendix
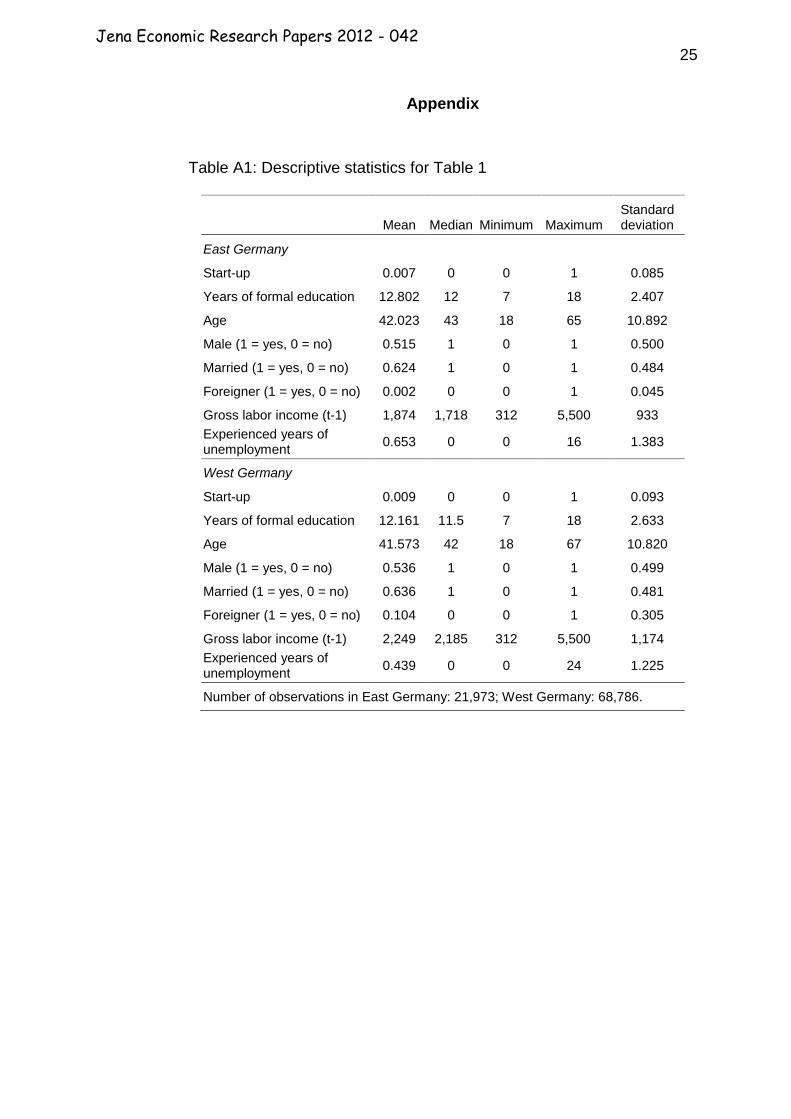
Table A1: Descriptive statistics for Table 1
Mean Median Minimum Maximum Standard deviation
East Germany
Start-up 0.007 0 0 1 0.085
Years of formal education 12.802 12 7 18 2.407
Age 42.023 43 18 65 10.892
Male (1 = yes, 0 = no) 0.515 1 0 1 0.500
Married (1 = yes, 0 = no) 0.624 1 0 1 0.484
Foreigner (1 = yes, 0 = no) 0.002 0 0 1 0.045
Gross labor income (t-1) 1,874 1,718 312 5,500 933
Experienced years of unemployment
0.653 0 0 16 1.383
West Germany
Start-up 0.009 0 0 1 0.093
Years of formal education 12.161 11.5 7 18 2.633
Age 41.573 42 18 67 10.820
Male (1 = yes, 0 = no) 0.536 1 0 1 0.499
Married (1 = yes, 0 = no) 0.636 1 0 1 0.481
Foreigner (1 = yes, 0 = no) 0.104 0 0 1 0.305
Gross labor income (t-1) 2,249 2,185 312 5,500 1,174
Experienced years of unemployment
0.439 0 0 24 1.225
Number of observations in East Germany: 21,973; West Germany: 68,786.
Jena Economic Research Papers 2012 - 042
26
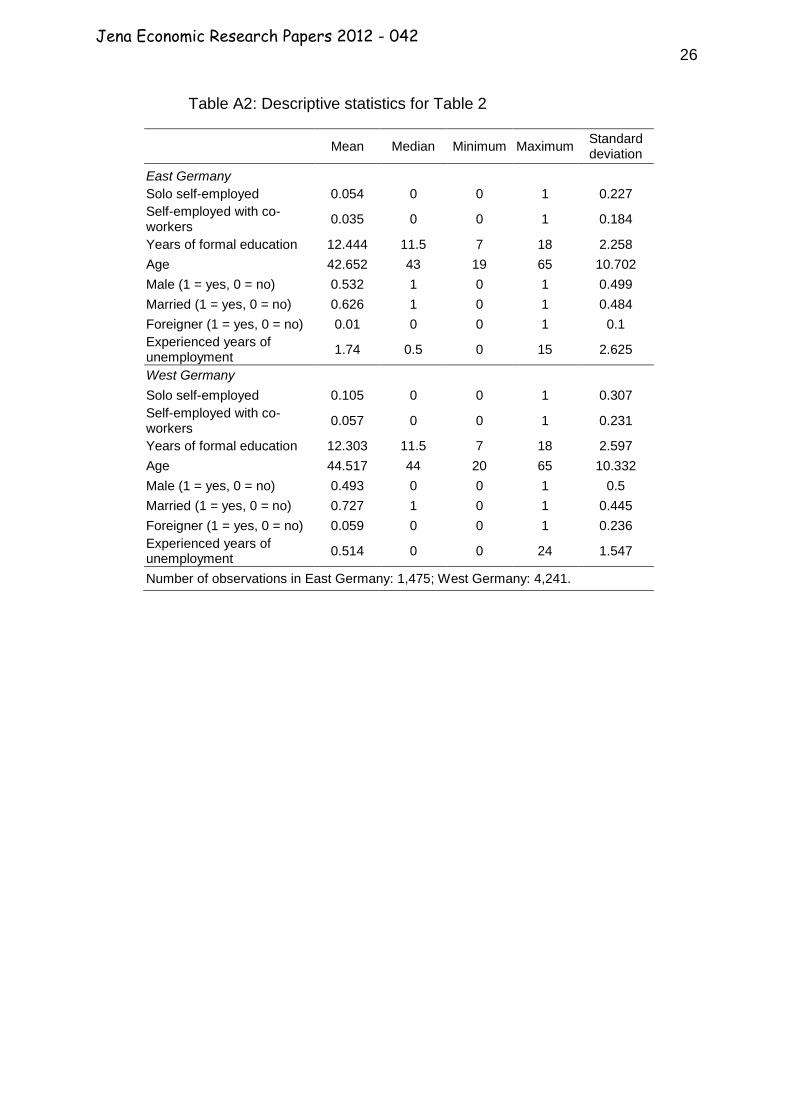
Table A2: Descriptive statistics for Table 2
Mean Median Minimum Maximum
Standard deviation
East Germany
Solo self-employed 0.054 0 0 1 0.227
Self-employed with co-workers
0.035 0 0 1 0.184
Years of formal education 12.444 11.5 7 18 2.258
Age 42.652 43 19 65 10.702
Male (1 = yes, 0 = no) 0.532 1 0 1 0.499
Married (1 = yes, 0 = no) 0.626 1 0 1 0.484
Foreigner (1 = yes, 0 = no) 0.01 0 0 1 0.1
Experienced years of unemployment
1.74 0.5 0 15 2.625
West Germany
Solo self-employed 0.105 0 0 1 0.307
Self-employed with co-workers
0.057 0 0 1 0.231
Years of formal education 12.303 11.5 7 18 2.597
Age 44.517 44 20 65 10.332
Male (1 = yes, 0 = no) 0.493 0 0 1 0.5
Married (1 = yes, 0 = no) 0.727 1 0 1 0.445
Foreigner (1 = yes, 0 = no) 0.059 0 0 1 0.236
Experienced years of unemployment
0.514 0 0 24 1.547
Number of observations in East Germany: 1,475; West Germany: 4,241.
Jena Economic Research Papers 2012 - 042
27
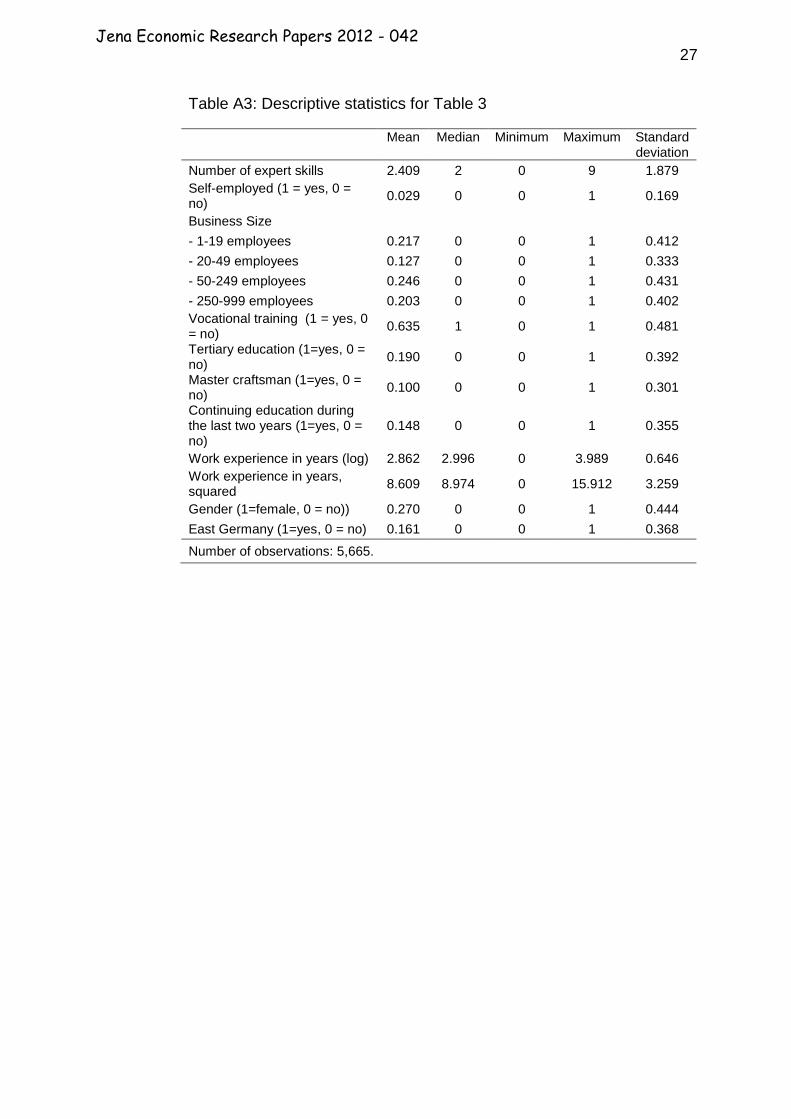
Table A3: Descriptive statistics for Table 3
Mean Median Minimum Maximum Standard deviation
Number of expert skills 2.409 2 0 9 1.879
Self-employed (1 = yes, 0 = no)
0.029 0 0 1 0.169
Business Size
- 1-19 employees 0.217 0 0 1 0.412
- 20-49 employees 0.127 0 0 1 0.333
- 50-249 employees 0.246 0 0 1 0.431
- 250-999 employees 0.203 0 0 1 0.402
Vocational training (1 = yes, 0 = no)
0.635 1 0 1 0.481
Tertiary education (1=yes, 0 = no)
0.190 0 0 1 0.392
Master craftsman (1=yes, 0 = no)
0.100 0 0 1 0.301
Continuing education during the last two years (1=yes, 0 = no)
0.148 0 0 1 0.355
Work experience in years (log) 2.862 2.996 0 3.989 0.646
Work experience in years, squared
8.609 8.974 0 15.912 3.259
Gender (1=female, 0 = no)) 0.270 0 0 1 0.444
East Germany (1=yes, 0 = no) 0.161 0 0 1 0.368
Number of observations: 5,665.
Jena Economic Research Papers 2012 - 042
28
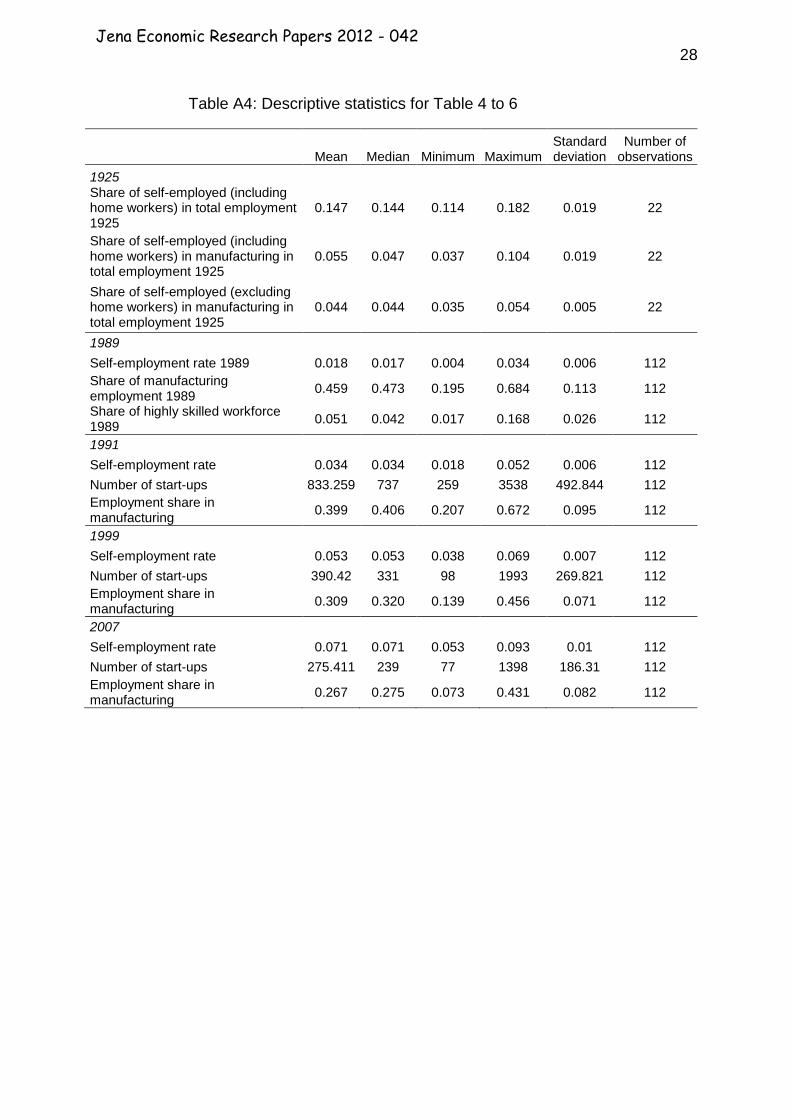
Table A4: Descriptive statistics for Table 4 to 6
Mean Median Minimum Maximum Standard deviation
Number of observations
1925 Share of self-employed (including home workers) in total employment 1925
0.147 0.144 0.114 0.182 0.019 22
Share of self-employed (including home workers) in manufacturing in total employment 1925
0.055 0.047 0.037 0.104 0.019 22
Share of self-employed (excluding home workers) in manufacturing in total employment 1925
0.044 0.044 0.035 0.054 0.005 22
1989
Self-employment rate 1989 0.018 0.017 0.004 0.034 0.006 112
Share of manufacturing employment 1989
0.459 0.473 0.195 0.684 0.113 112
Share of highly skilled workforce 1989
0.051 0.042 0.017 0.168 0.026 112
1991
Self-employment rate 0.034 0.034 0.018 0.052 0.006 112
Number of start-ups 833.259 737 259 3538 492.844 112
Employment share in manufacturing
0.399 0.406 0.207 0.672 0.095 112
1999
Self-employment rate 0.053 0.053 0.038 0.069 0.007 112
Number of start-ups 390.42 331 98 1993 269.821 112
Employment share in manufacturing
0.309 0.320 0.139 0.456 0.071 112
2007
Self-employment rate 0.071 0.071 0.053 0.093 0.01 112
Number of start-ups 275.411 239 77 1398 186.31 112
Employment share in manufacturing
0.267 0.275 0.073 0.431 0.082 112
Jena Economic Research Papers 2012 - 042