How Much Can a Family Afford? - National Low Income ...
34
Getting to the Heart of Housing’s Fundamental Question: How Much Can a Family Afford? A Primer on Housing Affordability Standards in U.S. Housing Policy Danilo Pelletiere, Ph.D. February 2008 N ATIONAL L OW I NCOME H OUSING C OALITION
-
Upload
khangminh22 -
Category
Documents
-
view
0 -
download
0
Transcript of How Much Can a Family Afford? - National Low Income ...

Getting to the Heart of
Housing’s Fundamental Question: How Much Can a Family Afford?
A Primer on Housing Affordability Standards in U.S. Housing Policy
Danilo Pelletiere, Ph.D.
February 2008
NA
TIO
NA
L LO
W IN
CO
ME
HO
USI
NG
CO
ALI
TIO
N

NLIHC Board of Directors 2007-2008 Mark Allison, Supportive Housing Coalition of New Mexico, Albuquerque, NM Nancy Andrews, Low Income Investment Fund, San Francisco, CA William Apgar, Joint Center for Housing Studies, Harvard University, Cambridge, MA Nancy Bernstine, National AIDS Housing Coalition, Washington, DC Gail Burks, Nevada Fair Housing Center, Las Vegas, NV Maria Cabildo, East Los Angeles Community Corporation, Los Angeles, CA DeDe Carney, Carney & Company Team, Greenville, NC Donald Chamberlain, AIDS Housing of Washington, Seattle, WA Telissa Dowling, Guttenberg, NJ Charles Elsesser, Jr., Florida Legal Services, Miami, FL Bill Faith, Coalition on Housing and Homelessness in Ohio, Columbus, OH Tim Funk, Crossroads Urban Center, Salt Lake City, UT Charles Gardner, Affordable Housing Coalition of South Carolina, Greenville, SC Chip Halbach, Minnesota Housing Partnership, St. Paul, MN Joy Johnson, Public Housing Association of Residents, Charlottesville, VA Moises Loza, Housing Assistance Council, Washington, DC Tim Moran, Northgate Residents Association, Burlington, VT Regina Morgan, Peoria Housing Authority, Peoria, IL George Moses, Housing Alliance of Pennsylvania, Pittsburgh, PA Rey Ocañas, Wachovia Bank, San Francisco, CA Barbara Sard, Center on Budget and Policy Priorities, Brookline, MA Lydia Tom, Enterprise Foundation, New York, NY John Zirker, Nashville Homeless Power Project, Nashville, TN Established in 1974 by Cushing N. Dolbeare, the National Low Income Housing Coalition is dedicated solely to ending America’s affordable housing crisis. NLIHC educates, organizes and advocates to ensure decent, affordable housing within healthy neighborhoods for everyone. NLIHC provides up-to-date information, formulates policy, and educates the public on housing needs and the strategies for solutions. Support for this research was provided by the John D. and Catherine T. MacArthur Foundation. National Low Income Housing Coalition (NLIHC) 727 15th Street NW, 6th Floor Washington, D.C. 20005 202/662-1530 202/393-1973 [email protected] www.nlihc.org

Executive Summary The following primer by National Low Income Housing Coalition Research Director Danilo Pelletiere tackles one of the most perplexing problems in the affordable housing field: How much should a family pay for housing? The operative word is should. Replace should with can, and the question gets answered in an entirely different way, because what a family can afford for housing (the amount that can be wrung out of a limited budget) is not necessarily what that family should be paying. As families pay more for housing than they should, less money is available for education, job training, transportation to employment, and other necessities that can lift a family into a higher standard of living. The most common rule of thumb for housing affordability is 30% of income. But this rule does not take into account a family’s certain and specific realities, such as medical needs and family size to name two. As the paper shows, the 30% rule of thumb does have one powerful argument on its side. It has been around so long and is so easy to apply that it has achieved widespread recognition if not acceptance. Indeed, we are not suggesting that the rule of thumb should be thrown out. Rather, we would like to see it updated and supplemented. The Depression-era guideline of a week’s wage for the month’s rent, which led to the 30% affordability rule of thumb, might have made sense in the 1930s, but a more nuanced set of guidelines is needed now. Pelletiere points out the important distinction between using the 30% rule of thumb as a standard or as an indicator. The 30% rule of thumb can, of course, be used as an indicator of affordability. But the 30% guideline or any other single housing cost-to-income ratio (HCIR) is inadequate in and of itself to establish a standard of a family’s ability to pay or a level of subsidy the family should receive. The conclusion reached is that while the 30% guideline is easy to understand and widely applied, in many cases, it simply does not work (by itself) well enough for enough families. We must be able to supplement and nuance the 30% percent rule of thumb with other criteria and guidelines, including the use of a continuous or categorical HCIR, that enable us to define housing affordability more accurately and reliably for any given family. --Sheila Crowley, MSW, Ph.D. President and CEO National Low Income Housing Coalition

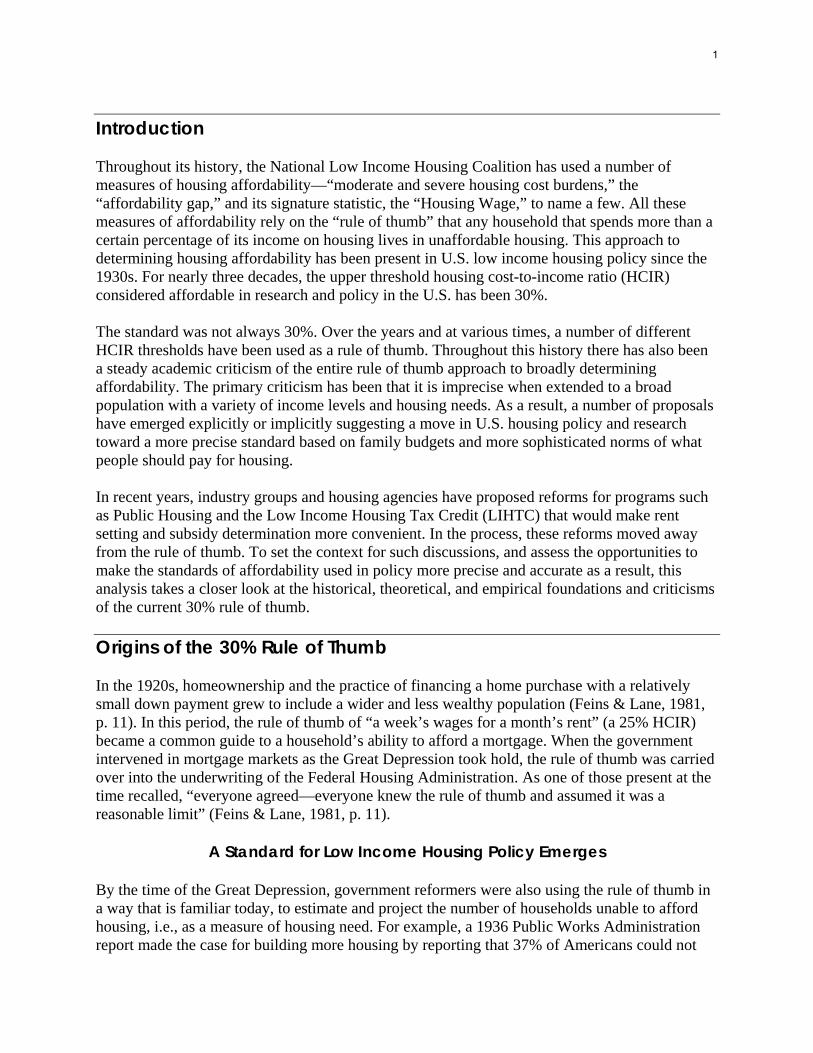
Introduction Throughout its history, the National Low Income Housing Coalition has used a number of measures of housing affordability—“moderate and severe housing cost burdens,” the “affordability gap,” and its signature statistic, the “Housing Wage,” to name a few. All these measures of affordability rely on the “rule of thumb” that any household that spends more than a certain percentage of its income on housing lives in unaffordable housing. This approach to determining housing affordability has been present in U.S. low income housing policy since the 1930s. For nearly three decades, the upper threshold housing cost-to-income ratio (HCIR) considered affordable in research and policy in the U.S. has been 30%. The standard was not always 30%. Over the years and at various times, a number of different HCIR thresholds have been used as a rule of thumb. Throughout this history there has also been a steady academic criticism of the entire rule of thumb approach to broadly determining affordability. The primary criticism has been that it is imprecise when extended to a broad population with a variety of income levels and housing needs. As a result, a number of proposals have emerged explicitly or implicitly suggesting a move in U.S. housing policy and research toward a more precise standard based on family budgets and more sophisticated norms of what people should pay for housing. In recent years, industry groups and housing agencies have proposed reforms for programs such as Public Housing and the Low Income Housing Tax Credit (LIHTC) that would make rent setting and subsidy determination more convenient. In the process, these reforms moved away from the rule of thumb. To set the context for such discussions, and assess the opportunities to make the standards of affordability used in policy more precise and accurate as a result, this analysis takes a closer look at the historical, theoretical, and empirical foundations and criticisms of the current 30% rule of thumb. Origins of the 30% Rule of Thumb In the 1920s, homeownership and the practice of financing a home purchase with a relatively small down payment grew to include a wider and less wealthy population (Feins & Lane, 1981, p. 11). In this period, the rule of thumb of “a week’s wages for a month’s rent” (a 25% HCIR) became a common guide to a household’s ability to afford a mortgage. When the government intervened in mortgage markets as the Great Depression took hold, the rule of thumb was carried over into the underwriting of the Federal Housing Administration. As one of those present at the time recalled, “everyone agreed—everyone knew the rule of thumb and assumed it was a reasonable limit” (Feins & Lane, 1981, p. 11).
A Standard for Low Income Housing Policy Emerges
By the time of the Great Depression, government reformers were also using the rule of thumb in a way that is familiar today, to estimate and project the number of households unable to afford housing, i.e., as a measure of housing need. For example, a 1936 Public Works Administration report made the case for building more housing by reporting that 37% of Americans could not
1
afford the prevailing rents without paying more than 20% to 25% of their incomes on rent (Feins & Lane, 1981, p. 44). The rule of thumb was already part of the nation’s housing policy, and the various studies, by revealing that a third of the nation was ill housed, were galvanizing support for the federal government’s involvement in housing. Therefore, it is not surprising that the rule of thumb had a strong presence at the birth of federal low income housing policy in 1937. Initially, the rule was to be used to define housing need. As part of the new public housing program, units were to be provided to households whose net incomes did not exceed five times the rental price of the units, determined by the costs of construction and operation, and including heat, light, water, and cooking fuel. In most housing authorities, however, a separate policy, based on the rule of thumb as it was traditionally used, excluded families who could not pay the established rents with 25% or less of their income. In other words, in the early policy context, the rule of thumb was used in two different ways using similar HCIR standards, first to determine need and then limiting eligibility to those with the ability to pay (Vale, 2000, p. 196; Feins & Lane, 1981, p. 46). This tortured application of the rule of thumb was in part the result of cost concerns in the Congress. According to testimony at the time, institutions other than public housing were to care for the truly destitute (Feins & Lane, 1981, pp. 45-46). Thus, the rule of thumb was used to limit access to public housing to a fairly limited population that was judged neither too well off nor too destitute to benefit from the assistance (Vale, 2000, pp. 161-182, 194-197). Moreover, once a tenant moved in, 25% was the minimum contribution that a household could make toward its rent; in future years, the rent could increase based on costs and without regard for ability to pay. The result? As maintenance and operating costs rose in subsequent years, rents continued to increase, and, by the late 1960s, public housing tenants were paying as much as 80% of income for housing. Moreover, as units were built or became available, it was not only the very poor who were excluded from moving in, but also a sizable number of the working poor and those on fixed incomes. In 1965, the administrator of the Housing and Home Finance Agency proposed that the income ceiling for its program be set at the level where a family could rent a standard apartment in the local market and still have four-fifths of its income available for other needs. If a family earned less than that threshold, the government would provide the difference to property owners as a subsidy. Again, cost concerns, and pressure from the National Association of Real Estate Boards, led to a final policy that a family pay 25% (rather than 20%) of income and no less than 30% of “fair market rents” (Feins & Lane, 1981, p. 47). That same year, Congress established the U.S. Department of Housing and Urban Development (HUD) to handle a number of new housing initiatives and to consolidate existing housing programs. The late 1960s provided a rapidly changing political environment for urban policy and an opportunity for reform. The “rule of thumb” was scrutinized and advocates began to look at alternatives.1 In 1968, the President’s Committee on Urban Housing concluded that in determining when a family needs subsidy, “no flat percentage can be equitable for all” (Stone, 2006b, p.165).
1 Stone (2006b) notes a 1966 pamphlet authored by NLIHC founder Cushing Dolbeare.
2

In 1969, a much more liberal policy was extended to the public housing program, but the rule of thumb approach remained. To move public housing rents back into an “acceptable relationship” with income, the Brooke Amendment to the Housing and Urban Development Act of 1969, named after Senator Edward Brooke (R-MA), required that public housing tenants pay not more than 25% of their income for their housing, a complete reversal of the usual practice described above, which had set 25% as the floor rather than the ceiling for tenant contributions. As previously proposed for the Housing and Home Finance Agency programs, the government would subsidize the difference between operating costs for housing authorities and the tenants’ rents, which were set at between 15% and 25% of income depending on household characteristics (Feins & Lane, 1981, pp. 45-46).
The Standard Defined
In 1973, with the release of the interim report, “Housing in the Seventies,” which criticized production programs and the inequity of current subsidies, outgoing HUD secretary George Romney called for a moratorium on new commitments for nearly all federal housing and community development programs, stating there was an “urgent need for a broad and extensive evaluation of the entire Rube Goldberg structure of our community development statutes and regulations” (Garr, 1998). The inequity cited in the report was that subsidies reached only a limited number of those eligible, excluded all single people under 62 years of age, and most programs except public housing and the low rent supplement program were not deeply targeted enough to serve the low income families most in need. That same year, the Joint Center for Housing Studies, then at MIT and Harvard, used a 25% to 35% HCIR as one guideline for determining that 13.1 million Americans lived in dwellings that were unsafe, overcrowded, or too expensive (Birch, 1973). On February 22, 1974, Senator John Sparkman, chairman of the Senate Banking, Housing, and Urban Affairs Committee, in responding to the report and the moratorium, argued against cutting production programs as proposed, and stated that the accusation of the inequity of existing programs was meaningless because no realistic alternative was presented. Though the report’s call for tenant-based assistance suggested a quadrupling of funding to reach all who would be eligible, the Administration had made no such budget proposal (Congressional Research Service [CRS], 2004, p. 171-172). A major initiative that emerged from the moratorium was a significant shift to tenant-based assistance, primarily the Section 8 housing certificate program. Based on the Experimental Housing Allowance Program of 1970, this program retained the rule of thumb as a definition of affordability and subsidy. In the Housing and Community Development Act of 1974, the “very low income” income category was defined as 50% of the area median income (AMI) to better target those most in need of housing.2 Households with incomes below that limit would pay 25% of income toward private housing and the government would pay the difference between that and the “Fair Market Rent.” It was left to HUD to determine how fair market rents were set. The 2 During the negotiations of this standard, a variety of standards were suggested. For example, on May 15, 1974, “groups concerned with low income housing” asked that “low income households” be defined as those “below the poverty threshold,” “lower income households” be defined as those “with incomes below the BLS standard (or, alternatively, below some % of median – e.g. 50%)” (C. N. Dolbeare, Memorandum for Groups Concerned with Low Income Housing: Call to Action, May 15,1974).
3

rules around the HCIR that would regulate federal programs were a significant cause among advocates at the time, who sought, with some success, to lower the standard to below 25% in general or for particular populations considered more vulnerable. Eventually, for example, larger families had their maximum contribution set at 15%.3 By the early 1970s, the migration of the rule of thumb was complete: from an empirical norm of behavior to a predictor of ability to pay to a measure of affordability to a standard of affordability and finally to a guide for government subsidy for targeted populations. By the 1970s, the rule of thumb was being used largely as it is today, with all the elements of the current policy in place. The significant difference is that in the 1970s explicitly different HCIRs were used for different categories of households in different situations, largely as the result of the advocacy of the Groups Concerned with Low Income Housing coalition (e.g. Dolbeare’s 1974 Call to Action memorandum). The stage was set for various proposals for reform of this system, which have played out in the 40 years since.
The Standard Simplified
In 1979, the rural low income homeownership program established a 25% HCIR to make the affordability standard in its programs similar to the HUD low income rental housing programs. The Housing and Community Development Amendments of 1979 increased the permissible tenant contributions in public housing and in the certificate program to 30% of adjusted income for households other than the very low income. The maximum for very low income households remained at 25%. The 1981 Amendments limited occupancy of units in public housing and with Section 8 subsidies to households between 50% and 80% AMI to 5% of new contracts and 10% of existing units that were re-rented. While lowering the income targeting of the units it also raised the tenant contribution for all families to the higher of 30% of adjusted income, 10% of gross income, or welfare payment designated for housing. Thus, in this Act, two countervailing trends surface: the raising of the HCIR of tenant contributions and the deep targeting of housing subsidies to serve those most in need but also, somewhat ironically, those least likely to be able to afford a higher HCIR. The Housing and Urban-Rural Recovery Act of 1983 added preferences for those experiencing an actual HCIR of over 50%. The 1983 Act also specified the deductions public housing
3 The negotiations around the 1974 Act were the precursors to the eventual formation of NLIHC. Concerns about the HCIR applied in the programs were central to the Ad Hoc Low Income Housing Coalition, of which future NLIHC president Cushing Dolbeare was the founder and executive secretary. In responding to “Proposed Policies and Procedures for Housing Assistance Payment Programs,” the Coalition concluded, “We would urge that this [an HCIR of 25%] be for small families without exceptional medical or other expenses, and that the norm rent-income ratio under this program be 20%” (Ad Hoc Low Income Housing Coalition, Memorandum to Rules Docket Clerk, Docket No. R-74-308, December 20, 1974). The Coalition also coordinated a response from Capitol Hill. Responding to the same call for comments, then representative Ed Koch, and seven other representatives, similarly called on HUD Secretary James T. Lynn, stating, “To conform with the legislative history and our amendment [to the Housing and Community Development Act of 1974], the regulations must state no one will pay more than 20% of income at initial occupancy… 25% should be … a last resort to prevent evictions” (E. Koch, J. M. Hanley, S. B. McKinney, J. M. Parren, J. Moakley, T. M. Rees, P. Stark, & A. Young, memo to James Lynn. November 7, 1974).
4
authorities (PHAs) should take from gross income, thus, by adjusting a household’s income, it effectively adjusted the HCIR being applied for individual family circumstances. 4 In terms of serving those most in need, however, there was a trade-off. Not only did the Housing and Urban-Rural Recovery Act of 1983 make more units available to those earning 50% to 80% of the AMI (again raising their access to units coming available, now to 25%), it also made the 30% rule of thumb applicable to all current rental housing assistance programs. The 1980s saw the transition from a more variable set of HCIR affordability standards with a maximum tenant contribution of 25%, to today’s universally applied 30% and standardized system of income deductions. In 1988, the National Housing Task Force was formed at the request of Congress, specifically Senator Alphonse D’Amato, (R-NY), the ranking member of the Senate Subcommittee on Housing and Urban Affairs, to “reexamine America’s housing policy.” Citing the move to a single 30% HCIR in 1982, the Task Force recommended a “more flexible definition of reasonable rent burden,” going on to say:
Applying a single rent-to-income standard across the board to poverty-level households can produce serious inequities. A single person living alone, with an income toward the upper end of the eligible range, clearly can afford to pay a higher proportion of income for rent than a large family with children and an income at the lower end of the scale. Current law recognizes this by providing adjustments for minor children, but more should be done. Accordingly, the Task Force recommends that Congress consider requiring a sliding scale of tenant payments based upon family size and income. Larger families with lower incomes would pay a smaller proportion of income; small, relatively better-off households would pay a larger proportion. (National Housing Task Force, 1988, p. 44)
The need for reform was echoed elsewhere (Leonard, Dolbeare, & Lazare, 1989). Reacting to the level of consensus around the appropriateness of a continuous or categorical HCIR in U.S. housing policy, Burchell (1991) foretold that the HCIR used as a payment standard in the Voucher Program would be a sliding scale based on income level by 2010. Today, however, 30% of income is the formal standard of housing affordability that dominates across federal housing programs (Table 1, next page). 5
4 See HUD (2002) for a description of income and rent determinations for public housing and the voucher program. See Appendix A for an illustration of how these adjustments to income affect the effective HCIR of various types of families. 5 One other notable development in the early 1990s was the focus that emerged in Congress on so-called “worst case needs” households. Reflecting the federal preferences for admission to housing programs of the time, these were defined as unsubsidized households with an HCIR of more than 50% and/or severely substandard housing. The Senate appropriations housing subcommittee staff director asked HUD to quantify the number of households most in need of housing and model how their needs might be met by turnover and additional units. HUD presented estimates of need based on the 1981 and 1983 American Housing Surveys and in 1990, the Senate appropriations committee directed HUD to compile annually a worst case housing needs survey along the lines of these reports (HUD, 1991, p. 1).
5
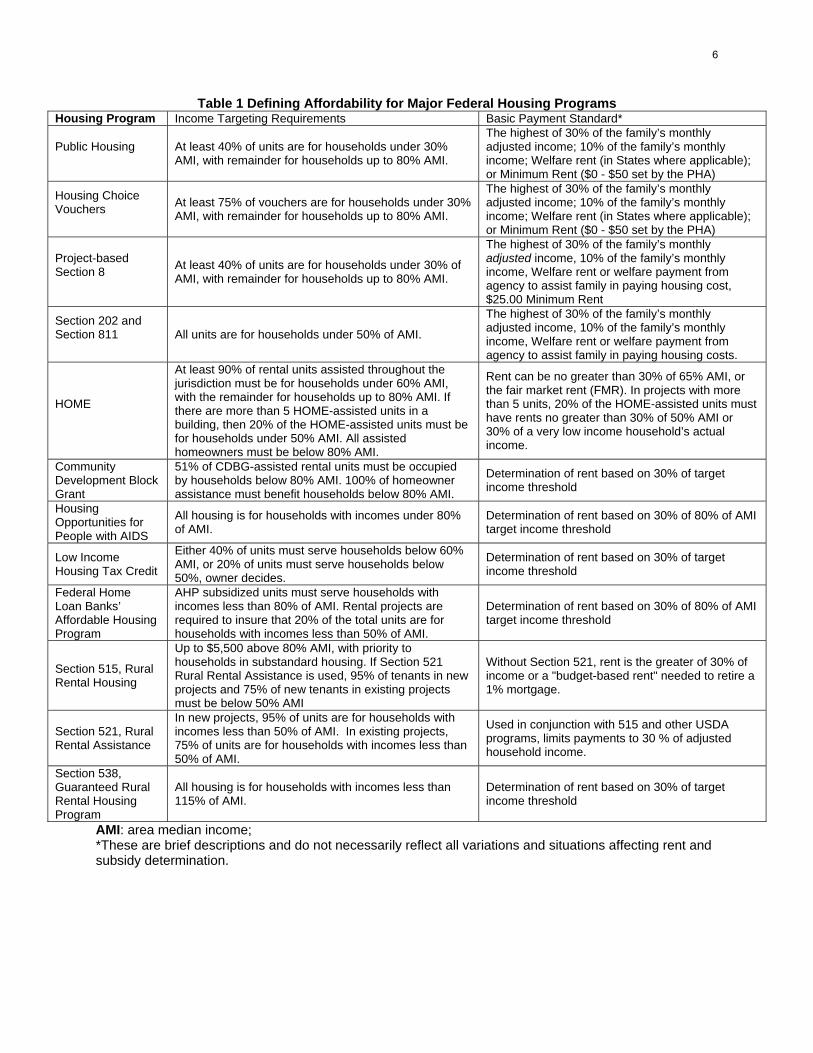
Table 1 Defining Affordability for Major Federal Housing Programs Housing Program Income Targeting Requirements Basic Payment Standard*
Public Housing
At least 40% of units are for households under 30% AMI, with remainder for households up to 80% AMI.
The highest of 30% of the family’s monthly adjusted income; 10% of the family’s monthly income; Welfare rent (in States where applicable); or Minimum Rent ($0 - $50 set by the PHA)
Housing Choice Vouchers
At least 75% of vouchers are for households under 30% AMI, with remainder for households up to 80% AMI.
The highest of 30% of the family’s monthly adjusted income; 10% of the family’s monthly income; Welfare rent (in States where applicable); or Minimum Rent ($0 - $50 set by the PHA)
Project-based Section 8
At least 40% of units are for households under 30% of AMI, with remainder for households up to 80% AMI.
The highest of 30% of the family’s monthly adjusted income, 10% of the family’s monthly income, Welfare rent or welfare payment from agency to assist family in paying housing cost, $25.00 Minimum Rent
Section 202 and Section 811
All units are for households under 50% of AMI.
The highest of 30% of the family’s monthly adjusted income, 10% of the family’s monthly income, Welfare rent or welfare payment from agency to assist family in paying housing costs.
HOME
At least 90% of rental units assisted throughout the jurisdiction must be for households under 60% AMI, with the remainder for households up to 80% AMI. If there are more than 5 HOME-assisted units in a building, then 20% of the HOME-assisted units must be for households under 50% AMI. All assisted homeowners must be below 80% AMI.
Rent can be no greater than 30% of 65% AMI, or the fair market rent (FMR). In projects with more than 5 units, 20% of the HOME-assisted units must have rents no greater than 30% of 50% AMI or 30% of a very low income household’s actual income.
Community Development Block Grant
51% of CDBG-assisted rental units must be occupied by households below 80% AMI. 100% of homeowner assistance must benefit households below 80% AMI.
Determination of rent based on 30% of target income threshold
Housing Opportunities for People with AIDS
All housing is for households with incomes under 80% of AMI.
Determination of rent based on 30% of 80% of AMI target income threshold
Low Income Housing Tax Credit
Either 40% of units must serve households below 60% AMI, or 20% of units must serve households below 50%, owner decides.
Determination of rent based on 30% of target income threshold
Federal Home Loan Banks’ Affordable Housing Program
AHP subsidized units must serve households with incomes less than 80% of AMI. Rental projects are required to insure that 20% of the total units are for households with incomes less than 50% of AMI.
Determination of rent based on 30% of 80% of AMI target income threshold
Section 515, Rural Rental Housing
Up to $5,500 above 80% AMI, with priority to households in substandard housing. If Section 521 Rural Rental Assistance is used, 95% of tenants in new projects and 75% of new tenants in existing projects must be below 50% AMI
Without Section 521, rent is the greater of 30% of income or a "budget-based rent" needed to retire a 1% mortgage.
Section 521, Rural Rental Assistance
In new projects, 95% of units are for households with incomes less than 50% of AMI. In existing projects, 75% of units are for households with incomes less than 50% of AMI.
Used in conjunction with 515 and other USDA programs, limits payments to 30 % of adjusted household income.
Section 538, Guaranteed Rural Rental Housing Program
All housing is for households with incomes less than 115% of AMI.
Determination of rent based on 30% of target income threshold
AMI: area median income; *These are brief descriptions and do not necessarily reflect all variations and situations affecting rent and subsidy determination.
6
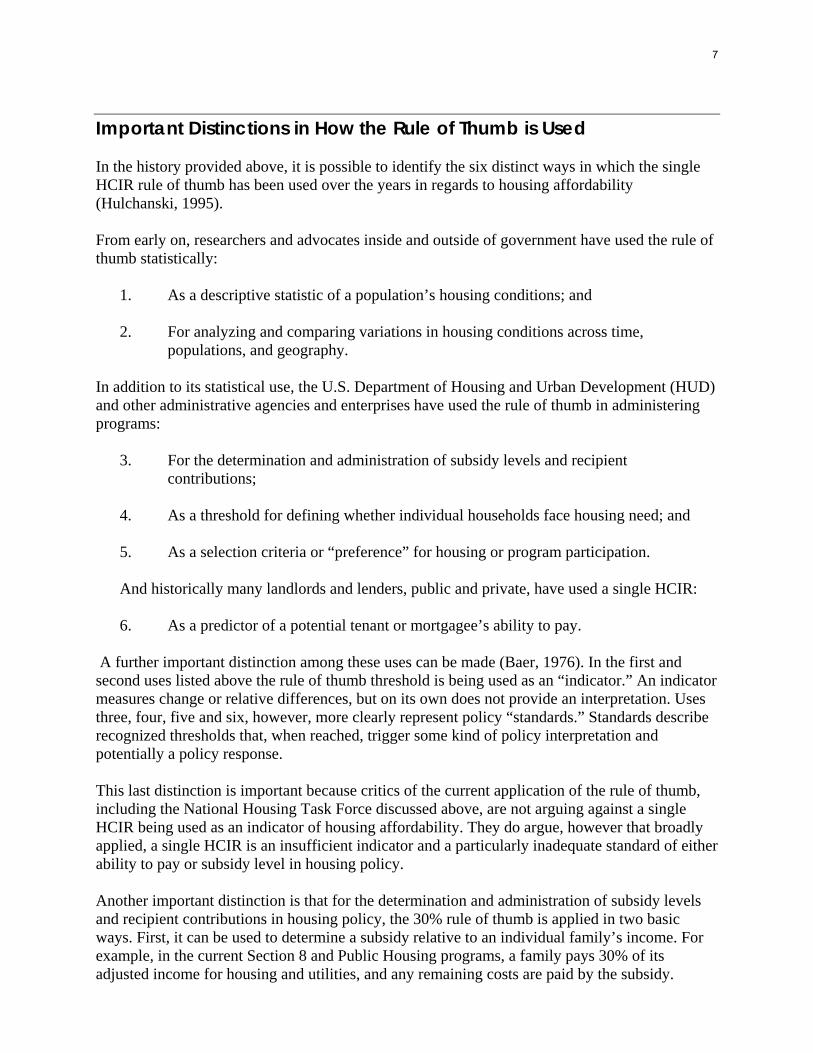
Important Distinctions in How the Rule of Thumb is Used In the history provided above, it is possible to identify the six distinct ways in which the single HCIR rule of thumb has been used over the years in regards to housing affordability (Hulchanski, 1995). From early on, researchers and advocates inside and outside of government have used the rule of thumb statistically:
1. As a descriptive statistic of a population’s housing conditions; and 2. For analyzing and comparing variations in housing conditions across time,
populations, and geography. In addition to its statistical use, the U.S. Department of Housing and Urban Development (HUD) and other administrative agencies and enterprises have used the rule of thumb in administering programs:
3. For the determination and administration of subsidy levels and recipient contributions;
4. As a threshold for defining whether individual households face housing need; and
5. As a selection criteria or “preference” for housing or program participation. And historically many landlords and lenders, public and private, have used a single HCIR: 6. As a predictor of a potential tenant or mortgagee’s ability to pay.
A further important distinction among these uses can be made (Baer, 1976). In the first and second uses listed above the rule of thumb threshold is being used as an “indicator.” An indicator measures change or relative differences, but on its own does not provide an interpretation. Uses three, four, five and six, however, more clearly represent policy “standards.” Standards describe recognized thresholds that, when reached, trigger some kind of policy interpretation and potentially a policy response. This last distinction is important because critics of the current application of the rule of thumb, including the National Housing Task Force discussed above, are not arguing against a single HCIR being used as an indicator of housing affordability. They do argue, however that broadly applied, a single HCIR is an insufficient indicator and a particularly inadequate standard of either ability to pay or subsidy level in housing policy. Another important distinction is that for the determination and administration of subsidy levels and recipient contributions in housing policy, the 30% rule of thumb is applied in two basic ways. First, it can be used to determine a subsidy relative to an individual family’s income. For example, in the current Section 8 and Public Housing programs, a family pays 30% of its adjusted income for housing and utilities, and any remaining costs are paid by the subsidy.
7

Second, allowable costs can be set as a proportion of some threshold income, such as the AMI. For example, low income units in the LIHTC program have maximum monthly rents that are 30% of 60% of the local monthly AMI. While both uses can serve to maintain the affordability of a home, in the first instance a family is virtually guaranteed to not pay more than the standard HCIR. In the second, the HCIR that a family actually pays can vary considerably since the rent is set as a proportion of a threshold income and not the family’s actual income. In practice the threshold income level is likely to be considerably higher than the actual income level; therefore, the HCIR that participating families face is considerably higher than the current 30% standard. Both applications have been used historically, and federal housing policy today uses a mix of both (Table 1). Criticisms and Alternatives Since affordability is fundamentally about the relationship between costs and income, any measure of housing affordability implies using the concept of an HCIR. At issue is how the affordability of a specific HCIR is determined and for whom. Before looking at these criticisms, it is worth noting that there are a number of practical reasons to use the HCIR as it is used in research and policy today.
1. Using a single HCIR to judge affordability broadly has been common in the housing finance industry since at least the beginning of the twentieth century, with roots into the nineteenth century (details to follow).
2. The 30% rule of thumb is easy to determine and can be applied using a number of
data sets. 3. As with many things both simple and familiar, today the rule of thumb requires little
justification or explanation when it is used. 4. And most importantly, perhaps, today all federal housing programs rely on the broad
application of the 30% rule of thumb (Table 1).
But there are many good reasons to be critical of the current broad application of the 30% rule of thumb that become apparent from a review of the intellectual history and foundations of housing affordability standards.
Early Empirical Family Budget Research
In the 1860s, Ernst Engel of Saxony appears to be the first to have statistically analyzed housing cost data to address issues of affordability (Stigler, 1954). 6 In a striking precursor to much of the
6 Earlier empirical studies of consumer behavior were designed for advocacy. In the 1790s David Davies, a clergyman in England, collected 127 budgets of agricultural laborers “from the poorest families, and he used the data only to solicit sympathy and assistance for them” (Stigler, 1954 p. 96). Sir Frederick Morton Eden carried this work forward collecting budgets himself and from other clergy, and employing a person to collect responses to a questionnaire he had designed to elicit this information. Later summaries of the data suggested 70% or more of a
8
analysis used today, Engel first looked at the expenses of three types of families: those receiving public assistance, those just getting by without assistance, and those who were “comfortable.” The primary conclusion Engel seems to have drawn is that the better off a family is, the less it spends proportionately on food and the more on education, religion, health, recreation, insurance, and tools and work supplies. Engel’s data also showed that households in all three categories spent roughly 14% of income on heat, light, and rent, though he apparently did not emphasize this point. Engel’s research was loosely translated in the United States in 1875 by Carrol Wright, the Labor Statistics Commissioner in Massachusetts, who emphasized Engel’s findings on rent and utilities. Wright’s interpretation of “Engel’s Law” had a number of distinct propositions, one of which was that the proportion of income spent on housing “is approximately the same, whatever the income.” Wright, however, used this proposition as a straw man, showing it could be “plainly disproved” (quoted in Stigler, 1954, p. 99). Wright based his own conclusion, that lower income households spent a higher proportion of their income on housing, on data from Massachusetts that showed families with smaller budgets spent nearly 26% of income on rent and fuel. This proportion trended down to roughly 15% for the households with the largest budgets. This finding matched the work of Herman Schwabe in Berlin, who concluded, “the poorer anyone is, the greater the amount relative to income that he must spend for housing” (Stigler, 1954, p. 100). This statement, which became known as Schwabe’s Law, was confirmed by an ever-growing number of household budget studies. For example, the Bureau of Labor statistics carried this work forward in the U.S. in the 20th Century. Studies in 1905 and 1918 indicated a range of average HCIRs. A 1912 study using data from 1875 in Lowell, MA concluded that the average weekly wage for a one-worker household was $11.81 and the average monthly rent was $11.33.(Feins & Lane, 1981, p. 8). Few families in these studies paid more than 25% of their income for housing, while most higher-income families paid considerably less. Two conclusions drawn from this history are particularly relevant.7 The first is that around the turn of the last century an empirical consensus had emerged that it was the norm for working class households specifically to spend roughly a quarter of their income for housing and utilities, the likely origin of the rule of thumb, “a week’s wages for a month’s rent” (Feins & Lane, 1981, p. 9). The second conclusion, related to the first, is that the common formulation of Engel’s law, i.e. that households spend a similar proportion on housing no matter their income, was never widely accepted. 8
poor household’s budget was spent on food and around 8% was spent on rent and fuel (Stigler, 1954, Tables 1 and 2). 7 Though surveys such as the Consumer Expenditure Survey and applied research into household budgets continue to this day, by the mid-twentieth century, the search for empirical “laws of consumption” had petered out in the U.S. Stigler’s 1954 article appears to be something of an obituary for this discipline within the field of economics. Economists have, however, continued to investigate the related concept of the elasticity of the demand for housing. While not specifying any “affordable” level of spending on housing, just as in the earlier studies, the clear result of this literature has been the conclusion that the share of housing in family budgets declines as income rises, indicating “inelastic demand.” The 30% standard implies an income elasticity of 1. (See Green & Malpezzi, 2003, pp. 9-11, for a recent review). 8 Oddly, citing the American translator Wright, Engel appears to have for a period adopted “Engel’s Law” himself. Later, Engel reanalyzed the data directly by income rather than the broad social categories he had used previously and found that the proportion of income spent on rent, lighting, and fuel fell as incomes rose (Stigler, 1954).
9

Affordability as a Normative Standard
To the degree there is a scientific basis for the current affordability standards, it is empirical studies of family budgets from the late 19th and early 20th centuries. The benefit of deriving a standard from observed behavior is that if the observations are accurate and done in a timely manner, the analysis will reflect the actual trade-offs that consumers are making given current prices, budget constraints, tastes and the stock of housing they encounter. Clearly, the HCIR standard has not been set or adjusted based on any timely empirical research.9 Beyond any concerns about the currency of the standard, however, a more general concern has been that a statistical norm of what people are paying may say little about what they can afford. While a strict empirical approach can indicate the actual expenses and trade-offs families face, there is no assurance that the result actually represents the threshold of what is “affordable” for any specific household in that population or even that affordable housing is the norm for that population.10 Rather than simply observing and reporting housing costs and income, an alternative normative approach is for an analyst to determine the housing and/or other needs of the population of interest and calculate what they cost in the current market. In this “quantity based budgeting” approach (Stone, 1993, p. 324), actual incomes and expenditures are then compared to these normative data to determine how divergent a specific family’s budget and/or consumption is from what the experts have determined to be a bare or desired minimum threshold. In the U.S., the most common quantity-based budgets proposed for use in studying the question of housing affordability are the Bureau of Labor Statistics (BLS) budgets (Feins & Lane, 1981; Stone 1993; Nelson & Redburn, 1994; Stone, 2006b). These budgets, which had their origins at the turn of the 20th Century and were discontinued in 1983, with the release of the 1981 data, were developed for a four-person family and a retired couple as “estimates of the dollar amount required to maintain these two types of households at three levels of living, according to the prevailing standards of what is needed for the maintenance of health and social well-being and participation in community activities” (Feins & Lane, 1981, p. 60). These “levels of living” were represented by budgets for “lower,” “intermediate,” and “higher” living levels. As Feins and Lane (1981) emphasize, the budgets do not describe the actual expenditures of American families or the actual trade-offs they make, but are instead “the sum of the cost of all goods and services to maintenance of a modest but adequate standard of living” (p. 60).11 Those interested in creating policy minimum standards of housing affordability have used the lower
9 The growing availability of consumer and housing related credit, particularly to lower income consumers, and the subsequent growing debt levels among U.S. households is one obvious change in family budgets since the standard was set. 10 A strict economic interpretation might be that if a household pays for its housing, it does so because it can “afford” to do so. This does not mean, however, that it would not be desirable to the individual or the society that it pay less or that there can not be any improvement in its situation through policy (Green & Malpezzi, 2003, p. 136) 11 It should be noted, however, that the lower family budget was based on consumption expenditures reported in the 1960-61 Consumer Expenditure Survey so to some extent the budgets may in fact be based on empirical studies of what families were spending on what. By 1981 the BLS judged them to be hopelessly out of date, and without sufficient funding to establish a new basis for the standard, they discontinued the series (Ruggles, 1990 p. 49).
10

budget. Stone (1994, 2006b) and others (e.g. Nelson & Redburn, 1994) continued to update the BLS budgets after 1981 using the corresponding components of the Consumer Price Index (CPI). In recent years, perhaps in part due to the perceived obsolescence of the BLS budgets, other quantity based budgets have been proposed (Thalmann, 2003; Allegretto, 2005; Kutty, 2005; Pearce, 2005).12 Also, there has been an increased interest in redefining poverty and then defining income and the costs and benefits of housing and other goods within this framework (National Research Council [NRC], 2005). In summary, rather than reflecting what people are earning and spending, quantity based budgets operate on the assumption that it is possible to determine a priori what people should have to spend, i.e. the prices they need to pay and how much income overall they should have at their disposal to pay for all they need. Beyond the inherent technical difficulty of actually assembling a normative budget, there are two other frequently cited critical problems with this approach (Ruggles, 1990: 48-49). First, there is the concern that if the thresholds are to be used as policy standards, the experts creating and updating the standards will be politically influenced, for example to include the goods and services produced or advocated by special interests. Second, budgets set according to independent technical, scientific, or social criteria and relatively detached from economic reality may not reflect the actual choices that consumers are able to make in their local markets to meet their current needs, making the theoretical budgets unworkable practically. It is also important to keep in mind that while the determination of standards can be highly technical, their eventual acceptance and use are fundamentally social and political rather than scientific. Assuming, however, that the budget is sufficiently well-crafted and flexible to be workable across markets and time and the determination is not significantly corrupted and is based on sound science and logic, the resulting budgets are policy standards by design and should better reflect what is “affordable” than simple statistical norms of current consumer behavior.
Academic Proposals for Reform
While the current U.S. housing policy system tends to target fairly specific populations,13 it formally applies a single HCIR in assessing affordability and determining subsidy levels. As discussed above, however, both studies of current consumer behavior and normative assessments have long suggested a categorical or continuous application of the HCIR based on income and other characteristics for purposes of determining or achieving housing affordability. Proposals for reform have largely applied a normative standard using quantity based budgets in a “residual
12 These are discussed in greater detail below as proposals for reform. 13 Most U.S. housing subsidy programs are targeted at low income households in one way or another (Table 1). Programs that target only the lowest income households are considered “deeply targeted” programs while those that are more inclusive, including higher income households, have “shallow” targeting. The current definition of low income is 80% of the area median income (AMI) with deeply targeted programs targeted at those earning 50% (very low income) or even 30% (extremely low income) of AMI.
11
income” approach to determine what a household or a broader population can afford (Goodman, Belsky, & Drew, 2005). Depending on what priority housing is given, the residual income approach to housing affordability can be formulated in two ways (Feins & Lane, 1981, p. 67). In the approach championed by Stone (1993), housing enters the equation last and thereby receives the greatest policy priority. The second approach, as presented, for example, by Feins and Lane (1981), uses the quantity based budget to determine the “norm” ratios of income to the various expenditures in the budget, including housing. These norm ratios are then used to determine whether there is sufficient income to pay for all necessary expenditures, and, if there is not, which costs specifically are unaffordable. In the first approach, necessary non-shelter expenses, determined as part of a quantity based budget, are met first. The income remaining after paying for the non-housing items is considered the amount of money that a household has available for housing. Comparing this “residual” to the household’s gross income reveals the HCIR that is affordable. But of course this residual amount might not be enough to secure decent housing. By comparing this affordable HCIR to the household’s actual HCIR, the family’s level of housing need is revealed; further comparisons to the cost of decent, appropriate housing available locally might indicate whether the household’s need is due to a shortage of such housing where it lives. In Stone’s formulation, a household that faces housing costs above the affordable HCIR is in “shelter poverty” and requires a housing subsidy or some other housing intervention to make its housing affordable. In the second approach, if a household’s housing costs exceed the norm for housing for its family type (as determined by the normative budget), 14 and the family also does not have sufficient residual income to afford other necessities, its housing costs are a significant problem. This is a family that can be helped directly by some form of housing policy intervention. If, however, the family’s income is insufficient to purchase all the items in its budget, but its housing costs are at or below the budget’s norm, housing costs are not implicated as the problem. While a housing subsidy might help the household’s overall budget through the fungibility of income, support in another area of its budget or general income supports would likely provide more direct and efficient relief. Thus, while the two approaches are fundamentally similar,15 they have significantly different policy implications. In Stone’s approach, housing is the ultimate expenditure and therefore if a family’s budget is short, its housing cost is unaffordable, thus calling for housing policy interventions. Feins and Lane’s approach suggests housing is an expense much like any other and housing policy is just one of the potential interventions to help a family that cannot meet its needs. This approach fits with other attempts to integrate housing affordability into the more
14 As with Stone, Feins and Lane (1981) use the BLS budget. 15 In emphasizing the residual income approach as distinct from traditional “ratio approach” in his writing, Stone (2006b) obscures the fact that his preferred method is also based on a ratio standard. In his approach, if a family is found to be paying more for housing than the residual left when the costs of other necessities in its quantity based budget are subtracted from its income, it has three choices: It can move to less expensive decent housing (if it is available); it can increase its income (receive a subsidy) toward the costs of its current housing, or move to a new unit based on the provision of a subsidy for that unit. Either way, the housing costs it pays out of its own pocket will be brought to a specific point relative to its income (i.e., an HCIR affordable to the specific household or household type).
12

general notion of poverty rather than presenting it as a problem to be considered separately (Carr, 1998; NRC, 2005). In support of housing as a priority, Stone (2006b) argues that housing is “unique” as an economic good within the family budget given housing’s size, importance, cost, and location-specific attributes and its role in determining health and social standing. Thus, the discussion of housing affordability standards can be seen in the context of the broader debate over whether there is a right to housing separate from broader economic and welfare rights (Carr, 1998; Hartman, 1998, 2006; Salinas, 1998). Stone posits further that while it is possible to establish a physical standard for housing, relative to other goods in a family’s budget, it is more difficult to establish “a precise monetary standard” to be applied across housing markets and types. In recent years, there have been other attempts to define a residual income approach for policy using budgets other than the BLS budgets. The Family Self Sufficiency Standard (Pearce, 2005; Wider Opportunities for Women, 2007) is a quantity based budget that creates separate family budgets for many different types of households for specific localities. A study in Washington State, for example, produced more than 70 different types of households. Costs are determined using data from the USDA’s “low-cost food plan” (a step above the Economy plan), a statewide survey of childcare costs, estimates of public transportation (in Seattle) and car costs, the National Medical Expenditure Survey, tax forms, and fair market rents (FMRs).16 These costs, along with an additional 15% for miscellaneous items, determine the budgets for specific families and locations. Under the Family Self Sufficiency Standard, if a family earns less than the budget for its family type, that family is not considered “self sufficient” and requires assistance. The FMR for the appropriate size unit is the measure of housing affordability. A household requires housing assistance if one, its unit costs more than the appropriate FMR, and two, its income is inadequate to meet the standards in all the other areas of the self sufficiency budget. Thus, Pearce’s approach attempts to define what might be seen as a more current alternative to the BLS, i.e., a more comprehensive, more generous standard than the current rule of thumb or poverty level. As Stone (2006b) notes, however, much of the apparent generosity of the Self Sufficiency Budget is due to an explicit child care allowance rather than increased levels of spending on housing or other items included in the BLS budget. Kutty (2005) uses what she defines as the “non-shelter portion” of the official poverty budget and observed shelter costs to determine whether a family can afford its non-shelter necessities once it has paid for its housing.17 By using the poverty threshold, Kutty is suggesting a more conservative measure of need as opposed to a more liberal definition of unaffordability represented by the BLS budget. Stone initially rejected the poverty standard on the grounds that the economy (or thrifty) food plan, on which the poverty level is based, was meant as a temporary, emergency level of food consumption (Stone, 1993, p. 323). He adds that since the
16 While empirically based, FMRs are based on a number of assumptions and are adjusted in a variety of ways to create a normative standard for HUD of the local cost of modest, safe rental housing. 17 An earlier paper by Combs, Combs and Ziebarth (1995) uses a similar measure they refer to as “housing burden,” which uses the poverty threshold and determines that if a household spends more than 30% of its income on housing and has less than 70% of the poverty budget remaining it is in need of housing assistance. It does not appear the efforts are related.
13
poverty level is simply the economy food plan multiplied by three, it does not take into account the true cost of other goods in other areas of the budget. These and other criticisms of the poverty threshold are well known (Ruggles, 1990, pp. 35-38; NRC, 2005, pp. 2-4). Sidestepping Stone’s second criticism, Kutty uses the common assumption that the “multiplication by three” used to derive the poverty standard means that along with one-third of income to food, one third goes to housing (a claim often bolstered by references to the 30% rule of thumb), and one third goes to healthcare and other necessities.18 Working from this assumption, Kutty designates the “non-shelter” poverty basket of goods to cost two-thirds of the poverty level into which a household would fall based on its family characteristics. If, after paying for housing, a family has less than two-thirds of the poverty level income threshold remaining to spend, the family is in “housing-induced poverty.” If, however, a household that has a total income below the poverty level but has more than two-thirds of its poverty threshold income remaining to spend after housing costs are considered, according to Kutty the household is in housing-induced “lack of poverty.” In other words, the family’s ability to find lower cost housing is keeping it out of poverty. Kutty sees a number of clear advantages in her approach in comparison to Stone’s Shelter Poverty or other standards. First, as a residual approach, housing poverty is a clear improvement over a single HCIR; second, the current poverty measure is better known than the BLS or similar budgets on which other residual approaches are based; third, it is already updated annually and available for immediate use; and finally, in an era of tight budgets and shrinking social policy ambitions, the poverty threshold may have a greater chance of policy success as a less liberal national standard. Other proposals combine targeting with variations in the HCIR. For example, Nelson and Redburn (1994) used a sensitivity analysis around the definition of priority or “worst case” housing needs to advocate a move toward a residual income approach that calculated need and provided preference for admittance to federal programs with an explicit consideration of household size, as well as location variables. In an ambitious effort, Combs, Combs and Ziebarth (1995) used data from the Panel Study of Income Dynamics in a regression analysis to compare three measures of affordability, the 30% HCIR norm, shelter poverty (which they refer to as “housing poverty”), and a measure they refer to as “housing burden” similar to Kutty’s (2005) housing induced poverty. While a number of authors have provided comparative statistics (Kutty, 2005; Stone 1993, 2006b), what makes their effort ambitious is their wish to use these results to provide policy makers with practical advice on how “to select the [housing affordability] measure most appropriate to meet their desired goals” (p.193). If the goal is to reduce the effects of poverty “in general” through housing, then the housing poverty measure might be used. Housing burden is recommended for policies that seek to identify households that need housing specifically to escape poverty. They also conclude that high housing burden, by their measure, might indicate when housing problems are due to a housing shortage, requiring one kind of policy response, while high housing poverty might suggest the problem lies elsewhere than with the supply of housing. The 30% HCIR norm is only to be recommended for its simplicity. 18 Responding, Stone (2006b) rejects Kutty’s approach and Budding’s (1980) suggestion, in reporting on the Experimental Housing Demand Study, calling the three-quarters of the poverty threshold an “arbitrary” threshold (p. 169).
14
Between the empirical studies of current behavior and the more strictly normative budget approaches, there is a final mixed approach that bears mentioning. A series of papers (e.g. Lerman & Reeder, 1987; Thalmann, 2003) use hedonic regression to develop indicators of minimum, appropriate, or average quality housing units and representative rents from market data, which are then used in a residual income approach to develop standards. Hedonic regression is simply a method to estimate the “price” of individual attributes of a single good, in this case a house, within markets: Prices for specific locations, amenities, sizes, and so forth would be estimated based on multivariate analysis of the entire relevant stock of housing. Assessing an individual household’s housing according to these attributes allows a determination of whether it is over- or underpaying based on the attributes of the unit. This approach is also referred to as a “quality adjusted” affordability measure (Bogdon & Can, 1997). In determining standards of what a household should pay based on observing what people are paying for housing attributes, this research is akin to the early, less normative family budget research. Thalmann (2003) goes a step further, explicitly using the hedonically derived norms to determine “who needs general income support and who needs specifically housing aid,” a policy application similar to that suggested by Kutty (2005), Pearce (2005), and Feins and Lane (1981). The Current Environment: Income Adjustments and Other Issues Stone (2006b) finds the first reference to a “residual approach” to housing affordability for the poor in a paper that NLIHC founder Cushing N. Dolbeare wrote for the Philadelphia Housing Association in 1966, and as noted in the history above, there was clearly considerable activism around this standard of affordability throughout the 1970s. By and large, however, calls to adopt a more precise and explicitly normative affordability standard have come primarily from outside the advocacy world. The history of U.S. policy suggests that despite the unanimity and the extent of these academic criticisms, over the years, budget constraints and political expediency in distributing scarce resources, not concerns about precision, have played the greatest role in determining the standard and any changes to it. One reason for this has been that while the Housing and Urban-Rural Recovery Act of 1983 applied a 30% rule of thumb for rent and subsidy determinations for all federal programs, there also emerged a formalized system of income adjustments for determining income eligibility and tenant contributions. Exclusions in the calculation of adjusted income for income sources such as Food Stamps and Earned Income Tax Credits (EITC) can greatly reduce the effective HCIR applied to some of the poorest families. Many deductions, however, have been diminishing in real terms. The dependent deduction, for example, was raised to $480 and the elderly/disabled deduction was set at $400 in 1983, where they remain today. As a result of these various adjustments, in programs such as Public Housing, Section 8 Project-based, and Housing Choice Vouchers, where rent levels are set according to household income, most families ultimately pay 30% of their adjusted income but effectively less than 30% of their gross income for housing (see Appendix). By lowering the effective HCIRs families pay based on family characteristics, this system results in a structure of categorical HCIR standards analogous to what might be achieved by quantity based budget reforms, and it reduces the pressure to modify the formal standard of affordability
15
from the current broad application of the 30% rule of thumb. However, this approach differs and is limited in a couple of important ways. First, unlike a residual income approach, the current system is not explicitly progressive in regards to income. Families with greater needs due to age and disability, for example, regardless of income receive the same deductions. This means that the households with the characteristics to trigger these deductions and lower incomes pay lower proportions of their income for housing than similar households with higher incomes. Income exclusions, however, can work in the opposite direction, lowering the effective HCIR of higher income households. And without any deductions or exclusions, lower income households pay the same proportion of income as higher income households, a regressive outcome. Second, in programs where the Brooke Rule applies, and tenant contributions are limited to 30% of income, these income reductions can help all affected households. However, in programs such as the LIHTC where the rule of thumb is used to set rents based on some threshold income, the HCIR reducing effects are limited to better off families at the margin that are only able to qualify for units because adjustments reduce their income sufficiently to fall below the threshold. Conversely, there is no explicit consideration of whether households can affordably pay more than 30% of income for housing, as there would be in the residual income approach. Beyond these two basic criticisms there are further concerns that the existing system is highly complicated and not in the least transparent, requiring significant additional resources to administer and police. It is this last criticism of the current approach to rent determination that has motivated recent proposals for “rent simplification” reforms. There is agreement that the system of deductions and exclusions could be updated, improved, and streamlined. Recent Reform Proposals Do Not Seek Greater Precision Proposals and demonstrations to change how it is determined how much rent a tenant should pay in various federal low income housing programs have emerged in recent years. None are motivated by desire to achieve greater precision in determining affordability. Cost remains a driving factor, both to reduce the overall cost of programs, as well as to cover operating costs of federally assisted units in projects within tighter budgets, lagging median incomes, and existing programmatic restraints. In the past year, for example, there has been activity aimed at using tax reform legislation to change rent and income limit determinations in the LIHTC program to provide greater assurance that rent limits rise to allow operators to cover rising costs and the financing of projects (Bridegam, 2007; Emrath, 2007; Lawson, 2007). Another primary motivator of reform has been the need to make the rent determination process less cumbersome and error prone. The term “rent simplification,” particularly in the Housing Choice Voucher, Section 8 Project-based, and Public Housing programs, has gained currency in recent years (Jackson, 2005; NLIHC, 2005; Public Housing Directors Association, 2005). The idea is to reduce the administrative costs of these programs by having a less complicated, more streamlined, income verification process and rent determination formula. Some proposals posit benefits from loosening the link to income in determining the rent that a tenant will pay in the process of rent reform that go beyond saved administrative costs.
16

Proponents suggest that if rent does not increase when a household’s income rises, more adult tenants will seek employment or report income they currently do not report to avoid rent increases.19 A minimum payment that tenants must make no matter how low their income, is an example of a policy in the dual rent simplification and incentive to work vein that PHAs can currently implement. While so-called “minimum rents” can push a tenant’s HCIR above 30%, proponents suggest that they provide an incentive to find employment for those who are not working. Moreover, by implicitly presuming that working age households with almost no income are under-reporting income, they can also lift some of the administrative burden that PHAs face to disprove tenants’ claims of almost no income in order to receive rent (Benjamin, 2007). Testing the effectiveness and impacts of alternative approaches to determining tenant rents was one of the rationales of a HUD demonstration project launched in 1996 called “Moving to Work (MTW).”20 The 32 PHA MTW sites are allowed to test the impact of setting their own alternative rent structures without being limited by the standard 30% of HCIR based rules. While these agencies can use this flexibility to implement a residual income based approach or otherwise improve the precision of their affordability determinations, it appears that thus far no agency has done so, with most opting instead for more simplified and less precise policies in the name of reducing costs and fraud, and encouraging work.21 Advocates and policy makers agree that there is a need for rent simplification to reduce the rate of error (ORC Macro, 2006; NLIHC, 2005) and that housing programs should provide incentives for earned income. However, by moving away from an HCIR- based standard and eliminating many of the deductions and income exclusions now provided in law, some proposed rent rules essentially put in place formulas similar to those in use before the Housing and Urban Development Act of 1969 and the implementation of the Brooke Rule. “Affordability” stops being the guiding principle and objective of federal rental assistance. Thus, despite arguments for reform, advocates remain concerned that reform “will fuel demands for the repeal of Brooke” (Center for Budget and Policy Priorities [CBPP]& NLIHC, 2007).22
19 Such disincentives to report income are present in any policy where income determines the size of the benefit or penalty, e.g., the income tax system. HUD studies have shown, however, that though misreported income or expense components make up the majority of errors in rent determination, there are a rough equal number of cases of both over and underpayment of rent under the current complicated rent determination system. Specifically, 19 percent of all households paid in excess of $5.00 less than they should have, with an average error of $63.00 per month; 18 percent paid in excess of $5.00 more than they should, with an average error of $39.00 per month (ORC Macro, 2006). 20 Moving to Work (MTW) allows a limited number of PHAs to be exempted from existing public housing and tenant-based Housing Choice Voucher rules and to pool operating, capital, and tenant-based assistance funds to develop a more flexible budget. According to HUD, " The statutory purposes of MTW are to give HAs the flexibility to design and test various approaches for providing and administering housing assistance that reduce cost and achieve greater cost effectiveness; provide work incentives to promote resident self-sufficiency; and increase housing choices for low-income families" (See www.hud.gov/offices/pih/programs/ph/mtw/background.cfm retrieved February 4, 2008). While PHAs are given considerable flexibility under the program initiatives under MTW, they must be approved by HUD and the PHA must submit regular reports to HUD. PHAs must apply to be accepted into the program. 21 This conclusion is drawn from a review of the available individual site MTW plans in January 2008. MTW plans and reports submitted to HUD by participating sites can be reviewed here www.hud.gov/offices/pih/programs/ph/mtw/plansandreportsgrant.cfm (retrieved February 4, 2008). 22 In a joint letter to U.S. Representative Barney Frank, Chair of the House Financial Services Committee, CBPP and NLIHC commented on options for setting tenant rent contributions for public housing and vouchers proposed for the Section 8 Voucher Reform Act. They asserted that the proposal would allow housing agencies to choose a
17

In 2004, the Bush Administration proposed and enacted a number of changes to the Housing Choice Voucher Program that rocked the foundations of the program. In order to develop a consensus in ways to preserve and improve the program, NLIHC convened 60 plus housing voucher stakeholders with diverse perspectives at a two day summit.23 Among the many issues addressed at the summit was rent simplification. Principles on rent-simplification in the proposal that emerged out of the 2005 Voucher Summit consensus document include:
• Changes to current rent policy should not result in lower income families paying a disproportionately higher percent of their income for rent than higher income families.
• Rent policy should encourage increased earned income.
• Rent policy should remain largely the same across HUD programs, including the Housing
Choice Voucher Program, public housing, and project-based Section 8 (NLIHC, 2005). While some of the consensus recommendations from the summit are reflected in H.R. 1851, the Section 8 Voucher Reform Act of 2007 (SEVRA), that passed the U.S. House of Representatives on July 16, 2007, there is no explicit attempt in the bill to make the setting of rents or rent burdens more precisely affordable. Nominally, however, the bill certainly could open the door wider to such reforms. The size of the Moving to Work program, for example, would be doubled to allow 60 agencies to participate, and again some might elect to implement more precise standards of affordability. More to the point, in the House passed bill, agencies outside the Moving to Work program would also be able to set alternative rent structures for nonelderly and nondisabled families, but only if the resulting rent for each individual family affected does not exceed rent they would pay under the current rules (Sard & Fischer, 2007). This additional restriction might increase the potential for any resulting rent rules to be more precise in determining affordability, though again this is not the express intention of the proposal. Along with concerns about moving away from the Brooke rule and the potential for worsening affordability, however, such local rent setting measures seem to run counter to the objective of rent simplification. Advocates are concerned that moves in this direction have the potential to make rent structures more complicated and add administrative uncertainty and costs that would be born both by administering agencies and local tenants and advocates (CBPP & NLIHC, 2007). The final statement of the Voucher Summit called for “additional analysis …to assess the possible effects and trade-offs of different rent simplification proposals, and their impacts on tenant groups and program costs” (NLIHC, 2005, p. 4). To date, there has been no serious independent and comprehensive consideration of what the proposed reforms and various alternatives would mean for current and future subsidy recipients. HUD has presented little in the way of persuasive analysis of its own proposals and has made public very little data on the new rent-setting framework and charge the resident the new rent if it is lower than 30% of income. The concern arises because the proposal complicates the rent setting process for individual tenants. 23 HUD and OMB officials, Congressional staff, tenants, tenant and low income housing advocates, city and state officials, voucher administrators entities, lenders, developers, landlords, researchers, advocates for the homeless, advocates for people with disabilities, civil rights advocates, and representatives of faith-based organizations.
18

current utilization of income adjustments and other program data. This lack of information limits the assessment of whether the changes will in fact yield the cost savings and efficiency benefits that are the public motivations given for the most recent proposals. The Moving to Work demonstration, despite its stated purpose, has not been subject to any rigorous evaluation, leaving observers to draw conclusions from relatively ad hoc examples and circumstantial evidence (e.g. Benjamin, 2007). To address this, SEVRA proposes greater reporting requirements on rent burden. The House bill requires HUD to report annually on the percentage of families with HCIRs above 30% and 40%, which will be used to hold PHAs accountable for reducing rent burden, and provides funding and the direction for a full evaluation of the Moving to Work program. Looking Forward Today, most administrating agencies continue to see rent reform as rent simplification, and a means to encourage greater employment and self sufficiency among program participants. Both serve the ultimate goal of reducing program costs. Advocates for low income tenants recognize the need for simplification, but are unwilling to relinquish the Brooke Rule in the absence of any prospects for otherwise maintaining a focus on affordability in housing assistance programs. There is no opportunity to implement a more precise standard of affordability or even, lacking greater precision, to increase the level of assistance households receive by reversing the upward trend in the HCIR since the 1970s. With the discussion of rent and subsidy determination reform stuck defending the status quo, and with little current empirical data to test the impact of alternatives on current and future recipients and program finances, no policy space exists to consider alternatives. This has left the residual income approach sidelined in policy discussions, largely because it has little to offer in the context of the current debate. Any system that determines rents and subsidies based on residual income, whether it is determined on an individual household budget basis or by assigning households to specific categories, is not likely to be less complicated than the current system of income adjustments, though it is also perhaps no more complicated. Also, as with the Brooke rule itself, on its own, the residual income approach does not provide an intuitive response to those motivated by incentives for work on the one hand and disincentives for fraud on the other. Finally, while the current policy deadlock does not preclude the use of more precise residual income and more normative quantity based budgeting results as standards of affordability in research and advocacy,24 the lack of a policy mandating the use of such standards is a barrier to the creation of a special purpose public data set and a consensus quantity based budget and in general a barrier to their broad acceptance.
24 There are a number of efforts along these lines, for example, Stone (2006a) and Wider Opportunities for Women (2007).
19
Conclusion There has long been a recognition that using a single HCIR as a broad rule of thumb standard of housing affordability, even in income limited programs, is imprecise and likely to lead to a large number of people paying too much for their housing while some pay less than they might reasonably be expected to pay. Yet reforms to make the standard more precise and based on explicit norms of affordability have never gained traction. With the current policy directed at increased simplicity and away from improved affordability, the policy statements calling for a move to a more rational affordability standard and bold predictions that this would be achieved “by 2010” (Burchell, 1991) look increasingly overoptimistic.
Author Danilo Pelletiere is research director at the National Low Income Housing Coalition. He can be contacted at [email protected] or 202-662-1530 x237. The author thanks Michael E. Stone for useful information and guidance and Amy Bogdon, Linda Couch, Sheila Crowley, Will Fischer, Kathy Nelson, Rebecca Warden, Coleen McHugh, Morgan Hargrave, Megan DeCrappeo and Keith Wardrip for reading earlier drafts. A special thanks to Meghan Henry who helped get this project started. An earlier version of this paper was presented at the 2005 Association for Public Policy Analysis and Management (APPAM) conference. Any errors remain the author’s.
20

Appendix – An Illustration of Effective HCIRs in Current HUD Programs Currently, HUD programs that use the 30% rule of thumb for subsidy determination also operate with a number of mandatory and “permissive” deductions and income exclusions. 25 Reducing the income used in determining a tenant’s contribution to rent and utilities in this way effectively reduces the HCIR that a household pays. This section illustrates the relationship between the 30% rule of thumb and the effective HCIR for such programs.26 We begin by looking at three types of families that might participate in the Housing Choice Voucher program (Table A1). These households can take at least one of HUD’s mandatory deductions from income.27 Table A1 Three Hypothetical Assisted Households
Household 1 (HH1)
Household 2 (HH2)
Household 3 (HH3)
Elderly/disabled Yes No Yes Number of children 0 3 2
Annual health care costs $2,000
Less than 3% of income
$2,000
Childcare expenses 0 0 $1,000 The mandatory deductions provided for by HUD are:
• $480 for each member of the family (excluding head of household or spouse) who is less than 18 years of age or who is a student or person with a disability;
• $400 for any elderly family or disabled family; • The sum of the following to the extent the sum exceeds 3% of annual family income:
o Unreimbursed medical expenses of any elderly family or disabled family. o Unreimbursed reasonable attendant care and auxiliary apparatus expenses for
disabled family member(s) to allow family member(s) to work. This deduction may not exceed the income received.
o • Any reasonable childcare expenses (children under 13 years old) necessary to enable a
member of the family to be employed or to further his or her education. (HUD, 2002) Therefore, household 1 qualifies for a $400 deduction for being elderly and may qualify for a deduction for health expenses depending on its income level and expenses (in this case assumed 25 See HUD (2002) for a full description of income and rent determinations for public housing and the voucher program. 26 It should be noted that in programs where tenants pay rents set at 30% of some threshold income (income limit) (see Table 1) the HCIR of qualifying tenants will necessarily be 30% of adjusted income or more. Based on unadjusted income it will be lower and might be more, less, or equal to 30%. 27 In HUD terminology total income includes all income, annual income is without income exclusions, and adjusted income takes allowable income deductions. The adjusted income in this analysis does not directly address the issue of income exclusions, such as adoption assistance payments, stipends for HUD programs, and the like. Total Annual Income expressly includes reported income from assets, businesses, child support, TANF, wage, general assistance, Indian trust, pension, Social Security and SSI, unemployment, and other public assistance.
21
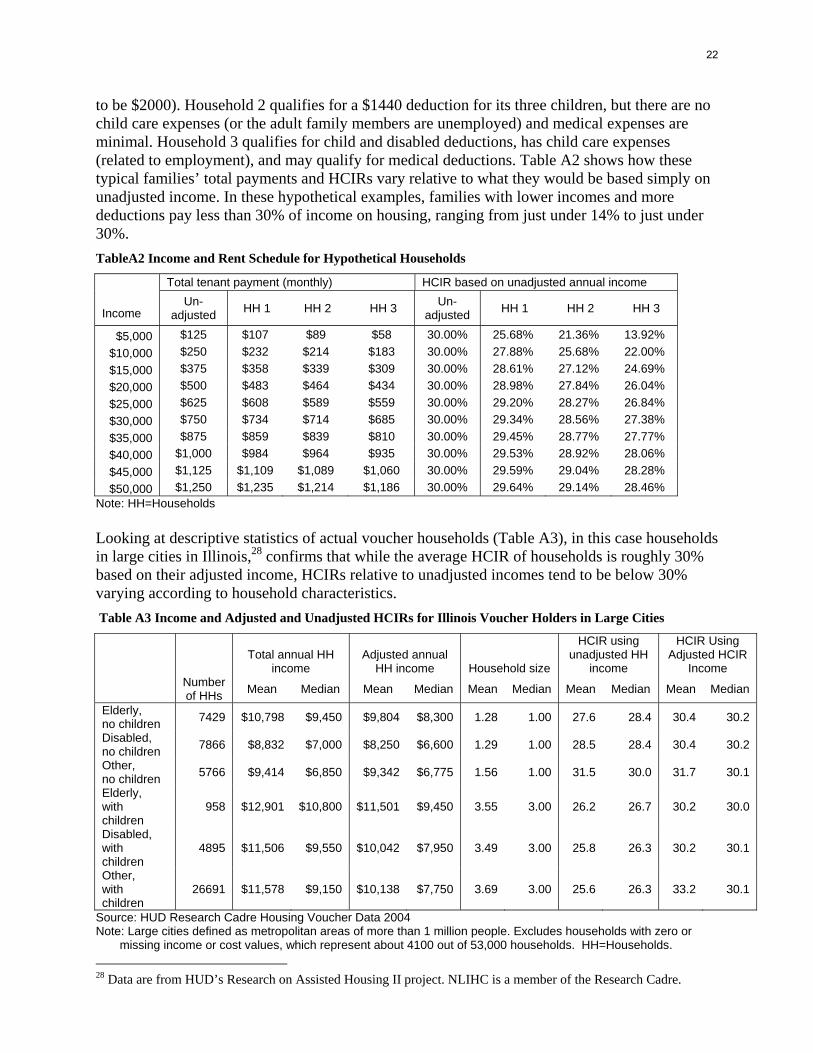
to be $2000). Household 2 qualifies for a $1440 deduction for its three children, but there are no child care expenses (or the adult family members are unemployed) and medical expenses are minimal. Household 3 qualifies for child and disabled deductions, has child care expenses (related to employment), and may qualify for medical deductions. Table A2 shows how these typical families’ total payments and HCIRs vary relative to what they would be based simply on unadjusted income. In these hypothetical examples, families with lower incomes and more deductions pay less than 30% of income on housing, ranging from just under 14% to just under 30%. TableA2 Income and Rent Schedule for Hypothetical Households
Total tenant payment (monthly) HCIR based on unadjusted annual income Income
Un-adjusted HH 1 HH 2 HH 3 Un-
adjusted HH 1 HH 2 HH 3
$5,000 $125 $107 $89 $58 30.00% 25.68% 21.36% 13.92% $10,000 $250 $232 $214 $183 30.00% 27.88% 25.68% 22.00% $15,000 $375 $358 $339 $309 30.00% 28.61% 27.12% 24.69% $20,000 $500 $483 $464 $434 30.00% 28.98% 27.84% 26.04% $25,000 $625 $608 $589 $559 30.00% 29.20% 28.27% 26.84% $30,000 $750 $734 $714 $685 30.00% 29.34% 28.56% 27.38% $35,000 $875 $859 $839 $810 30.00% 29.45% 28.77% 27.77% $40,000 $1,000 $984 $964 $935 30.00% 29.53% 28.92% 28.06% $45,000 $1,125 $1,109 $1,089 $1,060 30.00% 29.59% 29.04% 28.28% $50,000 $1,250 $1,235 $1,214 $1,186 30.00% 29.64% 29.14% 28.46%
Note: HH=Households Looking at descriptive statistics of actual voucher households (Table A3), in this case households in large cities in Illinois,28 confirms that while the average HCIR of households is roughly 30% based on their adjusted income, HCIRs relative to unadjusted incomes tend to be below 30% varying according to household characteristics. Table A3 Income and Adjusted and Unadjusted HCIRs for Illinois Voucher Holders in Large Cities
Total annual HH
income Adjusted annual
HH income Household size
HCIR using unadjusted HH
income
HCIR Using Adjusted HCIR
Income
Number of HHs Mean Median Mean Median Mean Median Mean Median Mean Median
Elderly, no children 7429 $10,798 $9,450 $9,804 $8,300 1.28 1.00 27.6 28.4 30.4 30.2
Disabled, no children 7866 $8,832 $7,000 $8,250 $6,600 1.29 1.00 28.5 28.4 30.4 30.2
Other, no children 5766 $9,414 $6,850 $9,342 $6,775 1.56 1.00 31.5 30.0 31.7 30.1
Elderly, with children
958 $12,901 $10,800 $11,501 $9,450 3.55 3.00 26.2 26.7 30.2 30.0
Disabled, with children
4895 $11,506 $9,550 $10,042 $7,950 3.49 3.00 25.8 26.3 30.2 30.1
Other, with children
26691 $11,578 $9,150 $10,138 $7,750 3.69 3.00 25.6 26.3 33.2 30.1
Source: HUD Research Cadre Housing Voucher Data 2004 Note: Large cities defined as metropolitan areas of more than 1 million people. Excludes households with zero or
missing income or cost values, which represent about 4100 out of 53,000 households. HH=Households. 28 Data are from HUD’s Research on Assisted Housing II project. NLIHC is a member of the Research Cadre.
22
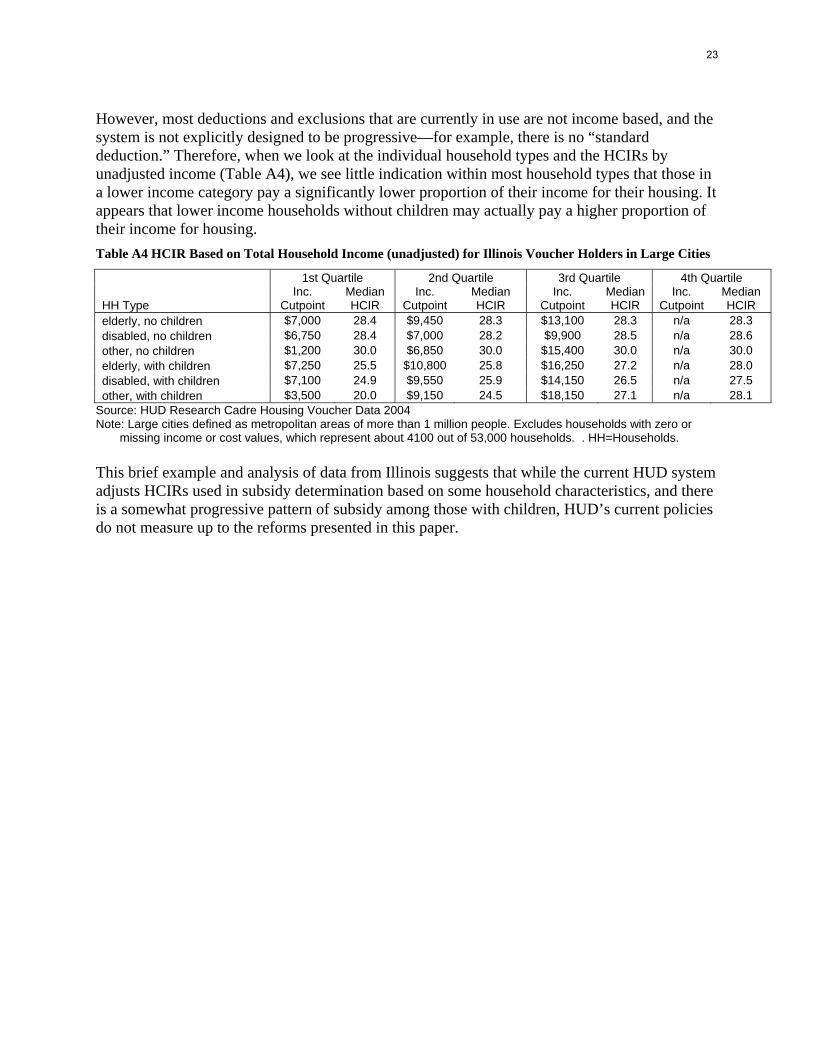
However, most deductions and exclusions that are currently in use are not income based, and the system is not explicitly designed to be progressive—for example, there is no “standard deduction.” Therefore, when we look at the individual household types and the HCIRs by unadjusted income (Table A4), we see little indication within most household types that those in a lower income category pay a significantly lower proportion of their income for their housing. It appears that lower income households without children may actually pay a higher proportion of their income for housing. Table A4 HCIR Based on Total Household Income (unadjusted) for Illinois Voucher Holders in Large Cities
1st Quartile 2nd Quartile 3rd Quartile 4th Quartile
HH Type Inc.
Cutpoint Median HCIR
Inc. Cutpoint
Median HCIR
Inc. Cutpoint
Median HCIR
Inc. Cutpoint
Median HCIR
elderly, no children $7,000 28.4 $9,450 28.3 $13,100 28.3 n/a 28.3 disabled, no children $6,750 28.4 $7,000 28.2 $9,900 28.5 n/a 28.6 other, no children $1,200 30.0 $6,850 30.0 $15,400 30.0 n/a 30.0 elderly, with children $7,250 25.5 $10,800 25.8 $16,250 27.2 n/a 28.0 disabled, with children $7,100 24.9 $9,550 25.9 $14,150 26.5 n/a 27.5 other, with children $3,500 20.0 $9,150 24.5 $18,150 27.1 n/a 28.1
Source: HUD Research Cadre Housing Voucher Data 2004 Note: Large cities defined as metropolitan areas of more than 1 million people. Excludes households with zero or
missing income or cost values, which represent about 4100 out of 53,000 households. . HH=Households. This brief example and analysis of data from Illinois suggests that while the current HUD system adjusts HCIRs used in subsidy determination based on some household characteristics, and there is a somewhat progressive pattern of subsidy among those with children, HUD’s current policies do not measure up to the reforms presented in this paper.
23

References Ad Hoc Low Income Housing Coalition (1974, December 20). Memo to Rules Docket Clerk
(docket No. R-74-308). Allegretto, S. (2005). Basic family budgets. Briefing Paper No. 165. Washington, DC: Economic
Policy Institute. Retrieved March 5, 2007, from http://www.epinet.org/briefingpapers/165/bp165.pdf
Baer, W. C. (1976). The evolution of housing indicators and housing standards: Some lessons for the future. Public Policy, 24(3), 361-393.
Benjamin, R. (2007) Tulare has it right. Journal of Housing and Community Development, 64 (6), 6-13.
Birch, D. L. (1973). America’s housing needs, 1970 to 1980. Cambridge: Joint Center for Urban Studies of the Massachusetts Institute of Technology and Harvard University.
Bogdon, A. S., & Can, A. (1997). Indicators of local housing affordability: Comparative and spatial approaches. Real Estate Economics, 25(1), 43-80.
Bridegam, M. (2007, September). AMI figures plummet, freeze rents. Affordable Housing Finance. Retrieved February 4, 2008 from www.housingfinance.com/ahf/articles/2007/sept/AMI0907.htm
Budding, D. W. (1980). Housing deprivation among enrollees in the housing allowance demand experiment. Cambridge: Abt Associates, Inc.
Burchell, R. W. (1991). Preservation actors—past and present a trip through the players: From 1960 to 2000—and beyond. Housing Policy Debate, 2(2), 413-438.
Carr, J. H. (1998). Comment on Chester Hartman’s “The case for a right to housing”: The right to “Poverty with a roof”—A response to Hartman. Housing Policy Debate, 9(2), 247-257.
Center for Budget and Policy Priorities. (2007, June 14). Letter to U.S. Representative Barney Frank, Chair of the House Financial Services Committee, commenting on options for setting tenant rent contributions for public housing and vouchers proposed for the Section 8 Voucher Reform Act.
Combs, E.R, Combs, B.A. & Ziebarth, A.C. (1995). Housing affordability: A comparison of measures. Consumer Interests Annual, 41, 188-194.
Congressional Research Service. (2004). A chronology of housing legislation and selected executive actions, 1892-2003. Washington, DC: U.S. Government Printing Office.
Emrath, P. (2007, July 20). The problem of stagnant rents in tax credit properties. Tax Notes. Retrieved February 4, 2008, from www.nahb.org/fileUpload_details.aspx?contentID=81190
Feins, J. D., & Lane, T. S. (1981). How much for housing? Cambridge: Abt Books. Garr, D. J. (1998). Moratorium on federally assisted housing programs. In W. van Vliet (Ed.),
The Encyclopedia of Housing. (pp. 362-363). Thousand Oaks: Sage Publications. Goodman, J., Belsky, E., & Drew, R. (2005). Measuring the nation’s rental housing affordability
problems. Cambridge: Harvard University, Joint Center for Housing Studies. Green, R. K., & Malpezzi, S. (2003). A primer on U.S. housing markets and policy. Washington,
DC: Urban Institute Press. Hartman, C. (2006). The case for a right to housing. In R. G. Bratt, M. E. Stone, & C. Hartman
(Eds.), A right to housing: Foundation for a new social agenda. (pp. 177-192). Philadelphia: Temple University Press.
Hartman, C. (1998). The case for a right to housing. Housing Policy Debate, 9(2), 223-246. Hulchanski, J. D. (1995). The concept of housing affordability: Six contemporary uses of the
housing expenditure-to-income ratio. Housing Studies, 10(4), 471-492.
24

Jackson, Alfonso (2005). Statement of the Honorable Alphonso Jackson, Secretary, United States Department of Housing and Urban Development, before the United States House of Representatives, Committee on Financial Services, May 11, 2005. Retrieved March 7, 2007, from http://www.hud.gov/offices/cir/test051105J.cfm
Koch, E.; Hanley, J. M.; McKinney, S. B.; Parren, J. M.; Moakley, J.; Rees, T. M.; Stark, P. & Young, A. (1974, November 7). Memo to James Lynn.
Kutty, N. K. (2005). A new measure of housing affordability: Estimates and analytical results. Housing Policy Debate, 16(1), 113-142.
Lawson, S. (2007, May 24). Testimony on behalf of the National Association of Home Builders, Virginia Beach, Virginia. Testimony before the Subcommittee on Select Revenue Measures of the House Committee on Ways and Means..
Leonard, P. A., Dolbeare, C. N., & Lazare, E. A. (1989). A place to call home: The crisis in housing for the poor. Washington, DC: Center for Budget and Policy Priorities and Low Income Housing Information Service.
Lerman, D. L., & Reeder, W. J. (1987). The affordability of adequate housing. The Journal of the American Real Estate and Urban Economics Association, 15(4), 389-404.
National Housing Task Force. (1988). A decent place to live: The report of the national housing task force. Washington, DC: Author.
National Research Council. (2005). Experimental poverty measures: Summary of a workshop. Washington, DC: The National Academies Press.
National Low Income Housing Coalition. (2005). National housing voucher summit 2005: Final statement, recommendations, and options. Washington, DC: Author. Retrieved January 11, 2008 from www.nlihc.org/doc/vsfinalstatement.pdf
Nelson, K. P., & Redburn, F. S. (1994). Rethinking priority needs for rental assistance: Limitations of worst case needs. Paper presented at the mid-year meeting of the American Real Estate and Urban Economics Association, Washington, DC.
ORC Macro. (2006). Quality control for rental assistance subsidies determinations. Washington, DC: U.S. Department of Housing and Urban Development.
Pearce, D. (2005). The self-sufficiency standard for the Washington, D.C. metropolitan area 2005. Prepared for Wider Opportunities for Women. Retrieved October 30, 2007, from www.sixstrategies.org/includes/productviewdetailsinclude.cfm?productID=497&strProductType=resource
Public Housing Authorities Directors Association. (2005). Rent reform: Fair and simple solutions. Washington, DC: Author.
Ruggles, P. (1990). Drawing the line: Alternative poverty measures and their implications for public policy. Washington, DC: The Urban Institute Press.
Salinas, P.D. (1998). Comment on Chester Hartman’s “The case for a right to housing”: Housing is a right? Wrong! Housing Policy Debate, 9(2), 259-266.
Sard, B. & Fischer, W. (2007). Comparison of major provisions of bipartisan house Section 8 voucher reform act with current law. Washington, D.C.: Center for Budget and Policy Priorities Retrieved January 14, 2008, from www.cbpp.org/5-4-07hous-app.pdf.
Stigler, G. J. (1954). The early history of empirical studies of consumer behavior. The Journal of Political Economy, 62(2), 95-113.
Stone, M. E. (2006a). Housing affordability for households of color in Massachusetts. Boston: University of Massachusetts at Boston.
Stone, M. E. (2006b). What is housing affordability? The case for the residual income approach. Housing Policy Debate, 17(1), 151-183.
25

Stone, M.E. (1993). Shelter poverty: New ideas on housing affordability. Philadelphia: Temple University Press.
Thalmann, P. (2003). ‘House poor’ or simply ‘poor’? Journal of Housing Economics, 12, 291-213.
U.S. Department of Housing and Urban Development. (2002). How your rent is determined” for public housing and housing choice voucher programs. Retrieved May 9, 2007, from http://www.hud.gov/offices/pih/programs/ph/rhiip/rhiip_factsheet.pdf
Vale, L. J. (2000). From the puritans to the projects: Public housing and public neighbors. Cambridge: Harvard University Press.
Wider Opportunities for Women. (2007). The self-sufficiency standard. Retrieved May 29, 2007, from http://www.sixstrategies.org/sixstrategies/selfsufficiencystandard.cfm
26

727 15th Street NW, 6th Floor
Washington, DC 20005
(202)662-1530 (202)393-1973 fax
www.nlihc.org
National Low Income Housing CoalitionNew Membership/Renewal Application
NLIHC is dedicated solely to ending America’s affordable housing crisis.
1. Choose one: I am o Joining NLIHC o Renewing My Membership
2. Provide your member information (please print) Name _____________________________________________________ Primary Contact: (if organization) __________________________________ Title ______________________________________________________
Address ______________________________________________________________________________________________________________ City _____________________________ State _____ ZIP _____________ Telephone _________________________ Fax ______________________ Email _____________________________________________________ I would prefer to receive Memo by: o Email o Mail
Organizations may list names, titles, and email addresses of up to 10 additionalcontact people who will receive Memo. Use separate sheet if necessary.______________________________________________________________________________________________________________________________________________________________________________
3. Choose a membership type: Category Amount (suggested)Low income individual/Student $3Individual $100Low income resident association $10Organization <$250,000 (operating budget) $200Organization $250K-499,999 $350Organization $500K-999,999 $500Organization $1-2million $1000Organization >$2 million $2000
4. Choose a payment type: o Check Enclosed o Visa o Mastercard
Credit card number ______________________________ Exp date _______ Cardholder Signature__________________________________________________________
Benefits of Membership Memo to MembersMembers receive this much admired weekly newsletter by e-mail or fax. Calls To ActionMembers are notified through e-mail or fax notification of significant policy developments requiring constituent calls to Congress. Shelterforce Subscription Discounted Conference FeesNLIHC hosts an annual policy conference and leadership reception in Washington, DC. The conference draws advocates, researchers, academics, low income individuals and government experts together to provide expertise and updates to attendees on current federal housing policy initiatives. Free or Discounted PublicationsNLIHC produces a number of publications, including the Advocates’ Guide and Out of Reach. All NLIHC publications are available for free or at a reduced rate to our members. Telephone resource referrals with linkage to state and regional networks Participation in policy-setting decisions of the Coalition
Dues and gifts are taxexempt under Section 501c3 of the IRS code, except $15 for production costs.

NLIHC STAFF Leo Barrera, Outreach/Policy Intern, Bonnie Caldwell, Senior Legislative Director Angela Chen, Administrative Assistant Linda Couch, Deputy Director Sheila Crowley, President and CEO Megan DeCrappeo, Research Intern Danna Fischer, Policy Analyst Ed Gramlich, Outreach Director Elisha Harig-Blaine, Outreach Associate Jake Kirsch, Outreach Associate Nicole Letourneau, Communications Director Erika Lewis, Website and Publications Manager Taylor Materio, Communications Assistant Danilo Pelletiere, Research Director Christian Pulley, Outreach Associate Kim Schaffer, Special Advisor to the President La’Teashia Sykes, Legislative Intern Michelle Goodwin, Thompson Director of Finance & Information Technology Keith Wardrip, Research Analyst Diane Yentel, Housing Policy Analyst

727 15th Street NW, 6th Floor Washington, D.C. 20005 202/662-1530 202/393-1973 (fax) [email protected] www.nlihc.org