How does travel satisfaction sum up? An exploratory analysis ...
28
Transportation https://doi.org/10.1007/s11116-018-9860-0 1 3 How does travel satisfaction sum up? An exploratory analysis in decomposing the door‑to‑door experience for multimodal trips Roberto F. Abenoza 1 · Oded Cats 2,3 · Yusak O. Susilo 1 © The Author(s) 2018. This article is an open access publication Abstract Understanding how satisfaction with individual trip legs aggregates to the over- all travel experience for different types of trips will enable the identification of the trip legs that are most impactful. For this purpose we analyze data on retrospective evaluations of entire multi-modal trip experiences and satisfaction with individual trip legs. We formu- late and describe alternative aggregation rules and underpin them in theory and previous empirical findings. The results of a series of regression models show that for a large num- ber of multi-modal trip configurations normative rules can better reproduce overall travel satisfaction than heuristic rules. This indicates that all trip legs need to be considered when evaluating the overall travel experience, especially for trips legs involving waiting and/or transferring time. In particular, weighting satisfaction with individual trip legs with per- ceived trip leg durations yielded the best predictor of overall travel satisfaction. No evi- dence for a disproportional effect of the last or most exceptional part of the trip was found. However, a larger dataset would be needed in order to replicate this work and potentially generalize the results. This research contributes to the literature on combining multi-epi- sodic experiences and provides novel empirical evidence in the transport domain. Keywords Customer satisfaction · Public transport · Trip legs · Multimodal trips * Roberto F. Abenoza [email protected] Oded Cats [email protected] Yusak O. Susilo [email protected] 1 Department of Urban Planning and Environment, Royal Institute of Technology (KTH), Teknikringen 72, S-100 44 Stockholm, Sweden 2 Department of Transport and Planning, Delft University of Technology, P.O. Box 5048, 2600 GA Delft, The Netherlands 3 Department of Civil and Architectural Engineering, Royal Institute of Technology (KTH), Teknikringen 10, 1st, 2nd & 3rd floors, S-100 44 Stockholm, Sweden
-
Upload
khangminh22 -
Category
Documents
-
view
0 -
download
0
Transcript of How does travel satisfaction sum up? An exploratory analysis ...
Transportationhttps://doi.org/10.1007/s11116-018-9860-0
1 3
How does travel satisfaction sum up? An exploratory analysis in decomposing the door‑to‑door experience for multimodal trips
Roberto F. Abenoza1 · Oded Cats2,3 · Yusak O. Susilo1
© The Author(s) 2018. This article is an open access publication
Abstract Understanding how satisfaction with individual trip legs aggregates to the over-all travel experience for different types of trips will enable the identification of the trip legs that are most impactful. For this purpose we analyze data on retrospective evaluations of entire multi-modal trip experiences and satisfaction with individual trip legs. We formu-late and describe alternative aggregation rules and underpin them in theory and previous empirical findings. The results of a series of regression models show that for a large num-ber of multi-modal trip configurations normative rules can better reproduce overall travel satisfaction than heuristic rules. This indicates that all trip legs need to be considered when evaluating the overall travel experience, especially for trips legs involving waiting and/or transferring time. In particular, weighting satisfaction with individual trip legs with per-ceived trip leg durations yielded the best predictor of overall travel satisfaction. No evi-dence for a disproportional effect of the last or most exceptional part of the trip was found. However, a larger dataset would be needed in order to replicate this work and potentially generalize the results. This research contributes to the literature on combining multi-epi-sodic experiences and provides novel empirical evidence in the transport domain.
Keywords Customer satisfaction · Public transport · Trip legs · Multimodal trips
* Roberto F. Abenoza [email protected]
Oded Cats [email protected]
Yusak O. Susilo [email protected]
1 Department of Urban Planning and Environment, Royal Institute of Technology (KTH), Teknikringen 72, S-100 44 Stockholm, Sweden
2 Department of Transport and Planning, Delft University of Technology, P.O. Box 5048, 2600 GA Delft, The Netherlands
3 Department of Civil and Architectural Engineering, Royal Institute of Technology (KTH), Teknikringen 10, 1st, 2nd & 3rd floors, S-100 44 Stockholm, Sweden
Transportation
1 3
Introduction
Increasing the modal share of transit services is of large importance to cities worldwide where there are: growing mobility needs to reach workplaces, services and leisure activi-ties, an aspiration for achieving a healthier lifestyle, and of attaining a socially equalitar-ian and environmentally sustainable society. Transit’s share can be increased by improving travelers’ perception of the quality of the services offered. Transit traveler’s satisfaction can be defined as the overall level of fulfillment with traveler’s expectations (Tyrinopoulos and Antoniou 2008). The existing link between transit traveler’s satisfaction, ridership and loyalty prove the relevance of improving overall trip satisfaction (e.g. Van Lierop and El-Geneidy 2016; Nathanail 2008; Fellesson et al. 2009). There is a large body of literature on the impact of main travel mode’s service attributes on overall satisfaction. However, a large number of transit trips consists of multiple legs; including access, main and egress trip legs. The composition of these door-to-door trips along with their added complexity, including different travel modes and duration has been largely overlooked despite their potential impact on the overall trip satisfaction. The increasing emphasis on integrated transport planning and the policy objective to create seamless door-to-door mobility for all (European Commission 2011) calls for the investigation and deeper understanding of the determinants of travelers’ multimodal travel satisfaction.
In order to address the aforementioned limitations, this study aims to answer the ques-tion “how do travelers combine memories of a series of pleasant and unpleasant episodes of their multi-leg trips to construct the evaluation of their overall experience?”. Therefore the objective is to investigate the relative importance of satisfaction with access, main and egress legs for the whole travel experience of the combined trip.
A trip can be defined as a continuous sequence of legs from an origin to a destination and with a single main purpose (Axhausen 2007). A trip leg is a continuous movement with one mode of transport which includes any waiting times (and transfer times, if appli-cable) immediately before or during that movement. Thus, multi-modal door-to-door trips have an origin and a destination, are composed of two or more modes, consist of two or more trip legs of which one is identified as the main trip leg, and at least one as an access or egress leg.
We focus on exploring whether trip leg’s relative weight on the overall travel experience varies as a function of trip composition (trips with access, main and egress stages, and with main and either access or egress), trip complexity (two, three and four or more legs), the duration of the trip legs (both waiting and in-vehicle/walking times), in regard to different combinations of transit modes (metro, train and bus), for trips with and without transfers and for different trip purposes (commuting and non-commuting).
Using a modest sample size, this study deepens and expands the very limited knowledge on door-to-door trips (Susilo and Cats 2014; Ettema et al. 2016) and on the aggregation of retrospective multi-episode experiences in the transport field. To the best of our knowl-edge, only Suzuki et al. (2014) explored this topic when they tested the goodness of fit of a number of rules for the last normal trip (i.e. without any disruption). Their analysis was limited to commuters and did not distinguish between in-vehicle and waiting times.
Understanding how satisfaction with individual trip legs aggregates to the overall travel experience for different types of trips will enable stakeholders to identify which particular trip segment(s) need(s) to be improved. Therefore, it will allow practitioners to better eval-uate the different parts of a trip and cater for travelers’ needs by supporting the allocation of resources and prioritization of measures. In addition, this research will allow making a
Transportation
1 3
more fair assessment of public transport operators’ roles in contributing to overall travel satisfaction when different stages of the trip are provided by different operators.
In order to address the abovementioned issues, we first provide a review on how travel satisfaction is conceptualized, measured and previous findings on its underlying determi-nants in “Literature review”. “Satisfaction aggregation rules” details the satisfaction aggre-gation measures used in this study. This is followed by a description of survey design and independent variables in “Survey description”. Results of the analysis are then provided in “Analysis and results” including the estimation of: the overall aggregated experience, of multivariate travel satisfaction models, of correlation analyses between overall and leg spe-cific satisfaction evaluations and of generalized aggregation models. In “Discussion” and “Conclusion”, discussion and conclusions are presented, respectively.
Literature review
All trip legs, as part of a multi-episode experience, are believed to contribute to the overall trip experience. Susilo and Cats (2014) argued that access and egress trip legs influence satisfaction with the main leg, which is strongly correlated with overall satisfaction, and thus might be indirectly reflected through it. Similarly, Ettema et al. (2016) found that there was a significant amount of variance in overall satisfaction that could not be explained by the correlation with the satisfaction with the main mode only.
The level of accessibility to/from the transit mode, which has direct consequences for the access and egress legs, is believed to impact on the overall evaluation of the multi-modal trip. In accordance with the latter, Givoni and Rietveld (2007) found that the quality of the station and the access and egress facilities influence the overall perception of the trip. More specifically, the availability of parking at the workplace, proximity to transit stations and the availability of shopping and entertainment activities in the surrounding areas are regarded to positively influence one’s perceived accessibility (Woldeamanuel and Cyganski 2011).
A fundamental component of multi-modal trips are transfers, and the associated trans-ferring times. Satisfaction with trips with a large number of legs such as metro, train and trips with 4 or more legs is expected to depend on satisfaction with the transfer experi-ence. Generally, transfers have a negative effect on the overall travel satisfaction (De Abreu e Silva and Bazrafshan 2013) and thus reduce demand for travel (Lythgoe and Wardman 2002).
The main trip leg’s service attributes determining transit overall satisfaction consist of, for example, station environment, ease of transfer and on-board comfort (Susilo and Cats 2014); operational attributes such as reliability, travel speed and frequency (Mouwen 2015; Cats et al. 2015); and customer interface (Cats et al. 2015). Tyrinopoulos and Antoniou (2008) found that besides service frequency, vehicle cleanliness, waiting conditions, trans-fer distance and network coverage were the most important attributes influencing the qual-ity of the service with PT in different Greek cities. Furthermore, these determinants may vary depending on user, trip and mode characteristics. For example, researchers found that feeling safe while waiting was more important for women than men (Susilo and Cats 2014) while ride comfort was found important for students (Abenoza et al. 2017) and the elderly (Dell’Olio et al. 2011). Considering transport modes, Iseki and Smart (2012) found that information was of relevance for heavy-rail users while accessibility in and to the station together with reliability of the service were more significant to bus and light rail users.
Transportation
1 3
Trip complexity is defined in its broad sense as the number of trip legs and travel modes that the trip is comprised of. Susilo and Cats (2014) found that trips which consist of a larger number of legs are associated with a lower overall satisfaction. Similarly, the char-acteristics of the main travel mode of the trip influence travel satisfaction. This is true not only for broad travel mode categories (soft, private and transit modes) but also amongst different transit modes which have distinct characteristics in terms of comfort, coverage, punctuality or frequency. Overall satisfaction ratings by mode vary from study to study and were found highest for: rail (Ory and Mokhtarian 2005; St-Louis et al. 2014; for commut-ing trips), metro (e.g. Cao et al. 2015) or bus based trips (Mouwen 2015).
Different trip purposes may influence traveler´s perception. While commuting trips are repetitive, exposed to rush hour crowding and dominated by temporal constraints, non-commuting trips are less frequent and are characterized by a more flexible travel time budget (Li 2003). Some researchers postulate that frequent travelers (Abenoza et al. 2017) and those with a seasonal ticket (and thus it is assumed frequent users) are overall more satisfied (Woldeamanuel and Cygansky 2011) because their trips are more stable and less exposed to salient events (Suzuki et al. 2014). In contrast, other findings indicate that regu-lar users are more exposed to negative critical incidents than occasional users and thereby their satisfaction will be lower (Van’t Hart 2012).
Travel time perception varies as a result of the activities carried out while traveling or waiting. Mokhtarian et al. (2015) found that listening to music/radio diminishes mental fatigue and increases trip pleasantness. In addition, they indicated that talking to others increases the probabilities of perceiving a trip as pleasant. Ettema et al. (2012) also indi-cated a positive effect of talking to others on satisfaction with travel scale for commute trips from work. In the same vein, working or studying on-board increases the utility of the in-vehicle time (Susilo et al. 2012) which may in turn be reflected in higher travel evaluations.
Traveler’s perceptions can be conceptualized in terms of utilities. Kahneman et al. (1997) distinguishes between instant utility and remembered utility. The first is the basic unit of experience that is aggregated over time to form a total utility while the second is defined as the retrospective evaluation about the pleasure and pain associated with a past experiences. In turn, experienced utility is the satisfaction with the outcome of a choice whereas decision utility is “the degree to which the outcome is desired when the choice is made” (Suzuki et al. 2014). The results of a study (Sprumont et al. 2017) indicated that decision utility and stated satisfaction, as proxy of remembered utility, were significantly correlated.
The present work deals with retrospective evaluations of an experience, the multi-modal trip. These retrospective evaluations are believed to encapsulate what is learned from the experience and may affect future behavior and decisions taken by the traveler; including recommendation, complaints and service repurchase (Carmon and Kahneman 1996). In addition, these evaluations might be affected by travelers’ feelings at the time of taking the survey. Ariely and Carmon (2000) theorized that evaluations of past events are affected by feelings at the time of evaluation. Feelings have been operationalized in some travel sur-veys in the affective measures, i.e. positive deactivation and activation, of the satisfaction with travel scale, which was conceptualized by Ettema et al. (2011).
The mental process of arriving at an overall evaluation of a certain experience remains largely unknown. While it might be assumed that the overall experience is a simple average of the experience’s individual components, a large number of studies in different domains of experience provide contrary evidence (Suzuki et al. 2014; Carmon and Kahneman 1996; Fredrickson and Kahneman 1993; Miron-Shatz 2009; Bruine de Bruin 2005; Ariely 1998). It is therefore presumed that memory is not constructed in a continuous fashion. Instead,
Transportation
1 3
only selected key aspects of the experience are remembered (Ariely 1998). To the best of the authors’ knowledge, Suzuki et al. (2014) conducted the only study in the transport field insofar. They found that the overall trip satisfaction of commuters can be modelled as a weighted average of the satisfaction with individual legs, where legs were weighted by their respective duration.
Taking into consideration all the aforementioned aspects, this study hypothesizes that accounting for travel behavioral phenomena such as the perception of different legs, modes, travel time components, as well as psychological effects such as recency and sali-ence can better explain overall travel satisfaction than assuming a simple averaging rule. In the following, we formulate and describe alternative aggregation rules and underpin them in theory and previous empirical findings.
Satisfaction aggregation rules
There are various approaches for defining how door-to-door trips’ satisfaction is aggregated in relation to each trip leg satisfaction. These approaches can be categorized into normative (equal average, moving duration weighted, complex duration weighted) and heuristic rules (peak, end, peak-and-end, serial position). Normative rules (rules 1–3), hypothesize that travelers consider all trip legs in creating an overall trip evaluation. The main difference between them stems from the strength of the influence that each of the trip legs exert on the composition of the overall trip evaluation. Equal-weighted average rules assume that all trip legs have the same weight. In turn, duration weighted moving (rule 2) and duration weighted complex (rule 3) hypothesize that the magnitude of the influence of each trip leg is given by their duration. Rule 2 considers trip leg’s IVT/walking time only while rule 3 add to this the waiting and/or transferring times.
In contrast, Heuristic rules (rules 4–9), hypothesize that travelers consider one or two trip legs exclusively in composing an overall trip evaluation. The trip legs considered are determined based on theory from the psychological domain. These rules postulate that travelers only recall certain legs of their trips (i.e. last, most salient events) when compos-ing their overall trip evaluation, thus neglecting some trip legs.
A trip j is defined as a sequence of trip legs j ={lj,1, lj,2,… , lj,|j|
} . The corresponding
travel satisfaction values are sj for the overall trip and slj,i i = 1,… , |j| for the trip legs.
Equal‑weighted averaging rule
This rule is based on the idea that a simple average of all trip legs can provide a good esti-mate for the whole trip satisfaction.
Duration‑weighted averaging rules
Duration-weighted moving (DWM), considers in-vehicle/walking times only. Therefore these rules neglect the importance of waiting times in constructing an overall evaluation metric for the trip. Miron-Shatz (2009) and Suzuki et al. (2014) in sociology and transport
(1)sj =
∑i∈j slj,i
�j�
Transportation
1 3
fields respectively found that the summation of instant utilities made by means of the dura-tion weighted rule provided the best fit.
where tmlj,i
is in-vehicle/walking time for leg lj,i.
Duration-weighted complex (DWC) embeds to Eq. 2 traveler’s waiting times.
where twlj,i
is waiting travel time for leg lj,i and � is the multiplier applied to each waiting
time as a penalty.Duration-weighted Complex can vary with respect to the weight or penalty assigned to
the waiting times. Queue waiting negatively impacts overall perception of the trip (Smidts and Pruyn 1994), however the magnitude of the influence is still controversial. Hine et al. (2001) found that traveler’s perception of waiting times varied amongst travel modes being higher for train than for buses. Some other authors range traveler’s perception of waiting times between 1.52 and 4.4 times longer than in-vehicle time (Mishalani et al. 2006; Dzie-kan and Kottenhoff 2007). Therefore waiting time weights, ω, of 1, 2, 3 and 4 are specified in this work.
End rule
This rule tests whether the last trip experience, the one associated with the last trip leg, alone explains overall travelers’ evaluation. Previous studies report contradictory results concerning whether end-effect exists and have a significant impact on the overall experi-ence. For example, Finn (2010) in an experiment involving a learning experience, Diener et al. (2001) in an experiment that explored how the ending of a life influenced the desir-ability of that life; and Carmon and Kahneman (1996) in an experiment related to queuing experiences provided evidence supporting their existence. However, Miron-Shatz (2009) for common activities undertaken during a day, and Tully and Meyvis (2016) for sound stimuli and an obstacle race, did not find evidence for the existence of end effects.
Hence, overall satisfaction is determined by the last trip leg.
Serial position rule
This rule asserts that the sequential order in which an experience is presented affects how it is evaluated. The first and last episodes of an experience, primacy and recency effects, are the better remembered parts of an experience and the ones that solely impact the overall evaluation of the experience. These effects were proven by Page and Page (2010) studying the evaluation of a TV show; by Miller and Krosnick (1998) for the impact of candidate
(2)sj =
∑i∈j slj,i t
mlj,i∑
i∈j tmlj,i
(3)sj =
∑i∈j slj,i
�tmlj,i+ � ⋅ tw
lj,i
�
∑i∈j
�tmlj,i+ � ⋅ tw
lj,i
�
(4)s = slj,|j|
Transportation
1 3
name order on elections outcomes; and by Bruin de Bruin (2005) when evaluating end-of-sequence and step-by-step evaluation procedures used in Eurovision song contest.
Peak rules
This rule examines whether the most salient experience is the most representative of the whole trip. An exceptional episode can be caused by a wide variety of events such as: extreme on-board crowding, severe weather conditions which make the waiting time at a stop unpleasant, being able to find a seat in rush hour, feeling unsafe or experiencing longer or shorter travel times than expected. The rule is defined as the satisfaction with the trip leg with the largest deviation from the average overall satisfaction:
This salient event is the one employed by Suzuki et al. (2014).The deviation can be either positive or negative depending on whether the episode is
pleasant or unpleasant (Fredrickson and Kahneman 1993). The latter contradicts the find-ings made by Friman et al. (2001) who concluded that negative episodes, or as they call them negative critical incidents, have a higher impact on overall and attribute specific cumulative satisfaction, than positive ones.
Given that satisfaction evaluations are partly based on expectations (Parasuraman et al. 1991; Grönroos 1994) and that travel time is one of the main components for the evalua-tion of a trip (Ettema et al. 2016), deviation from expected travel time is the salient event presented in the next rule:
where t̂mlj,i
and t̂wlj,i
are the expected in-vehicle or walking time (moving time) and waiting
time, respectively, on a given trip leg. Given that both, moving and waiting times might be perceived very negatively when delays are present (Carrel et al. 2015). The deviation can be either positive or negative. If no deviation from the expected time is observed then the equal-weighted averaging rule is applied.
Peak‑end rules
This rule asserts that the recollection of a past overall experience is best aggregated by averaging only two distinct moments; the most salient event (peak) and the latest experi-ence (end). Therefore, the effects of the duration of an experience upon retrospective evalu-ation are neglected (Fredrickson and Kahneman 1993; Ariely and Loewenstein 2000).
A large amount of empirical evidence in different fields supports the peak-end rule. For example, Fredrickson and Kahneman (1993) demonstrated it for film watching, Redelmeier and Kahneman (1996) for painful medical practices, and Baumgartner et al. (1997) for rat-ing film and television commercials. However, Miron-Shatz (2009) did not reach the same
(5)s =(slj,1 + slj,|j|
)∕2
(6)sj = maxi∈j
�����slj,i −
∑i∈j slj,i
�j������
(7)sj = argmaxi∈j
(|||tmlj,i+ tw
lj,i− t̂m
lj,i− t̂w
lj,i
|||)
Transportation
1 3
conclusions for day-long experiences. A peak_max-end rule is formed by the combination Eqs. 4 and 6:
And the peak_exp-end is formed by the combination of Eqs. 4 and 7:
The success of either of these rules may have the following implications for stake-holders. A better goodness-of-fit of the equal-weighted averaging rule may signify that improvements should be equally distributed over all parts of the travel experience. The suc-cess of the duration-weighted moving rule may imply that travel experience aspects of the modes, when in movement, should be prioritized. Travel experience aspects may include instrumental and non-instrumental variables. The implications of a successful duration-weighted complex rule might be interpreted as the largest importance given to trip legs comprising waiting and/or transferring times, and thus of those involving transit modes. The higher the waiting time penalty the higher the importance attached to transit legs. In this case, the corresponding stakeholders should focus on improving interchange facilities and reducing and uplifting the waiting time perception. The success of the end rule may suggest that stakeholders need to care only about ensuring that travelers have a pleasant and satisfactory experience in the final leg of their door-to-door trip. In a typical 3-leg trip this implies focusing on last-mile facilities. In line with the former, the success of the serial position rule may suggest that first- and last-mile facilities should be prioritized. Travel time reliability and adhering to expected travel times should be targeted if peak-exp travel time (rule 9) is found to better explain overall travel satisfaction. The negative effect that disruptions and negative salient events have on overall satisfaction may indicate the need to focus on them if peak-max satisfaction rule obtains the highest goodness-of-fit.
Example
The abovementioned satisfaction aggregation rules are illustrated using an example. Fig-ure 1 displays an example of a door-to-door trip including all the relevant data needed to aggregate trip leg satisfactions into overall travel satisfaction evaluations. The door-to-door trip received a reported overall satisfaction of 4, in a five-point likert scale (Fig. 1a). The trip comprises three trip legs and three stages (access, main and egress), each of them shown with its respective reported satisfaction value in the labels (2, 5 and 3 for access, main and egress respectively). The passenger walks from and to bus stops. The perceived travel time of the entire trip is 36 min including 4 waiting time minutes, while traveler expected travel time (T.T) for this trip was 31 min. The percentage time difference shows the percentage difference of the perceived travel time compared to the expected travel time. The latter is calculated at a trip leg level and as specified in Eq. 7. The percentage satisfac-tion dev. is the ratio of the trip leg satisfaction value to the simple average of all trip legs’ satisfaction values, as specified in Eq. 6.
Using the example data shown in Fig. 1a, 1b displays the values obtained when applying the twelve satisfaction aggregation rules defined in the previous sub-sections. For instance,
(8)sj =
�maxi∈j
�����slj,i −
∑i∈j slj,i
�j������+ slj,�j�
�∕2
(9)sj =
(arg max
i∈j�slj,|j|
(|||tmlj,i+ tw
lj,i− t̂m
lj,i− t̂w
lj,i
|||)+ slj,|j|
)∕2

Transportation
1 3
the calculation of duration-weighted complex with a penalty of 3 moving minutes per waiting and/or transferring minute is calculated as follows: ((5*2) + (((4*3) + (20))*5) + (7*3))/ 36 = 4.34.
Survey description
We analyze data collected in a survey that was conducted as part of the METPEX (A Measurement Tool to determine the quality of the Passenger EXperience) FP7 EU project,
Overall Sat.
Trip leg Sat.
Leg 1 - Access Leg 2 – Main mode Leg 3 - Egress
Travel time
Expected T.T .
% Time dev. 67% 14% 0%
10%
1
1.5
2
2.5
3
3.5
4
4.5
5
Sa�s
fac�
on
(1: V
ey D
issa�
sfied
-5:
Ver
y Sa
�sfie
d)
21 min. 7 min.3 min.
20 min. 7 min.4 m.5 min.
352
4
Door -to -door
Trip
(A)
(B)
Fig. 1 a Example of a door-to-door trip with all the trip components; b Expected overall travel satisfaction evaluations when applying the 12 satisfaction aggregation rules
Transportation
1 3
which aimed to develop a Pan-European standardised measurement tool to measure trave-ler’s experience across door-to-door trips. See METPEX (2013, 2014) for a more detailed description of METPEX project and project tool devised to empirically estimate which variables are most relevant for different groups of travelers and travel modes (Susilo and Cats 2014; METPEX 2014).
The survey was simultaneously carried out in spring 2013 in eight European cities: Bucharest (Romania), Coventry (United Kingdom), Dublin (Ireland), Rome (Italy), Stock-holm (Sweden), Turin (Italy), Valencia (Spain) and Vilnius (Lithuania). These sites repre-sent a diverse combination of city sizes, climates, transport infrastructures, urban fabric, culture and quality of the public transport service delivered.
The recruitment strategy included both on-site and retrospective surveys. Therefore depending on the nature of the survey, there were self-administered interviews distributed by email, phone, social network and online; and assisted interviews where travelers were approached on main streets and squares, on-board, at stations, in shopping centres and uni-versities. Of the various on-site recruitment locations, on-board vehicles seemed to have worked best, mainly because the respondents were not in a position to rush somewhere else. The length of the whole questionnaire was between 20 and 30 min. In some of the data collection sites (i.e. Coventry and Stockholm) incentives to take the survey such as money or a cinema ticket were offered.
Two versions (on-site and retrospective) of a revealed preference questionnaire were translated into local languages. The on-site version focused on the trip currently being undertaken while the retrospective version focused on the main trip of the given day. The questionnaire was designed to address the entire door-to-door trip and different travel modes, and thus facilitate the analysis of overall travel satisfaction and how it varies as a function of the satisfaction with individual attributes, travel characteristics, trip legs and service factors.
The questionnaire consisted of five sections: (a) Traveler information—socio-demo-graphic, mobility behavior and mode usage; (b) Attitudes—travel preferences and travel—related opinions; (c) Travel satisfaction with overall trip, individual trip legs and respective service attributes; (d) Underlying travel aspects—familiarity, adaptation and past experi-ence, and; (e) Contextual variables—including trip purpose, weather conditions, subjective well-being. For more detailed information on the survey design, see Susilo et al. (2015).
In order to study how overall satisfaction relates to satisfaction with individual trip legs, we employ the following variables collected in sections (a), (c) and (e):
• Leg-specific and overall satisfaction with the trip: Likert scale measurement from 1 (very dissatisfied) to 5 (very satisfied);
• Trip purpose: categorized into commuting to work or education, business, shopping, leisure or other;
• Transport modes used in each trip-leg: including walk, bicycle, car as driver and as passenger, motorcycle, underground, train, tram/trolleybus, bus, special transport;
• Perceived duration of waiting times and on-board/walking times: given in minutes and for transit modes only;
• Expected time spent waiting and on-board/walking if everything goes as planned: given in minutes and for transit modes only. In the retrospective surveys, the expected travel time might be biased as respondents may adjust their expectations based on what they actually experienced;
• Trip complexity: number of trip legs.
Transportation
1 3
In addition, in Sect. 5, selected socio-demographic and familiarity variables from sec-tions (a) and (d) are used to characterize the dataset. These include gender, age, disability, frequency of travel by PT, income and access to private vehicle and bicycle.
In total, 554 responses were collected during the pilot survey, of which 363 records con-tain multi-leg trips. Multi-leg trips are defined as those trips involving at least two trip legs (i.e. an access or egress and a main trip leg). After the dataset was cleaned and verified for completeness, consistency and reliability across the different parts of the survey used, the sample size was reduced to 156. The remaining records were primarily collected in five sites; Stockholm, Bucharest, Dublin, Turin and Coventry, which together account for 89% of the data. Reported trips were distributed almost evenly between the retrospective and on-site formats. The main trip leg of the trip was not explicitly stated by the respondent. Instead, it was determined by summing on-board/walking times and waiting times for each trip leg and defining the longest one as the main leg.
Analysis and results
This section, presents descriptive statistics (Sect. 5.1). The following three Sects. (5.2–5.4) serve to a different and complementary purpose. First, investigating how travelers combine memories of their door-to-door trip to construct and overall evaluation of their trip. Then, identifying the strength of the relationships between overall trip satisfaction and the satis-faction with different trip stages, as well as studying the extent to which the trip stages are inter-correlated. At last, estimating generalized aggregation models which provide the rela-tive weight that each trip stage has on the overall travel satisfaction.
Descriptive analysis and satisfaction aggregation rules
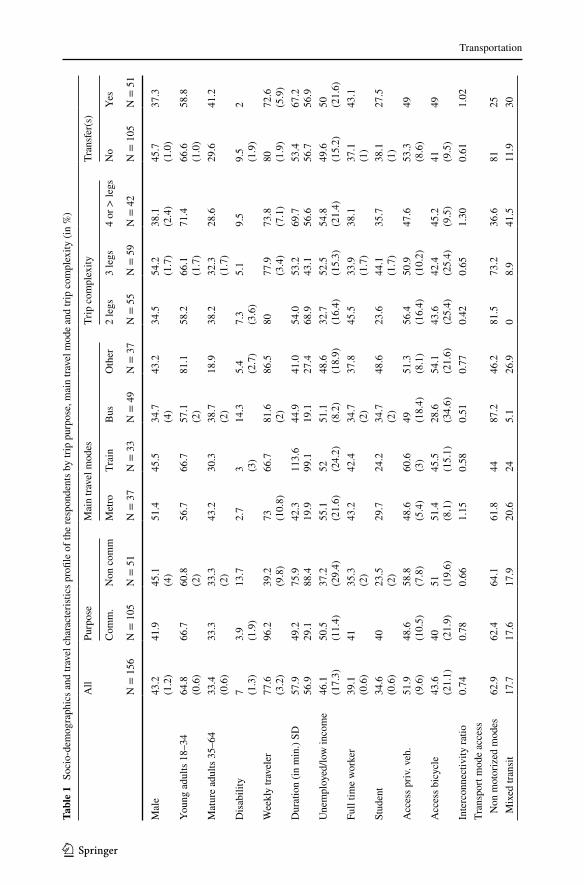
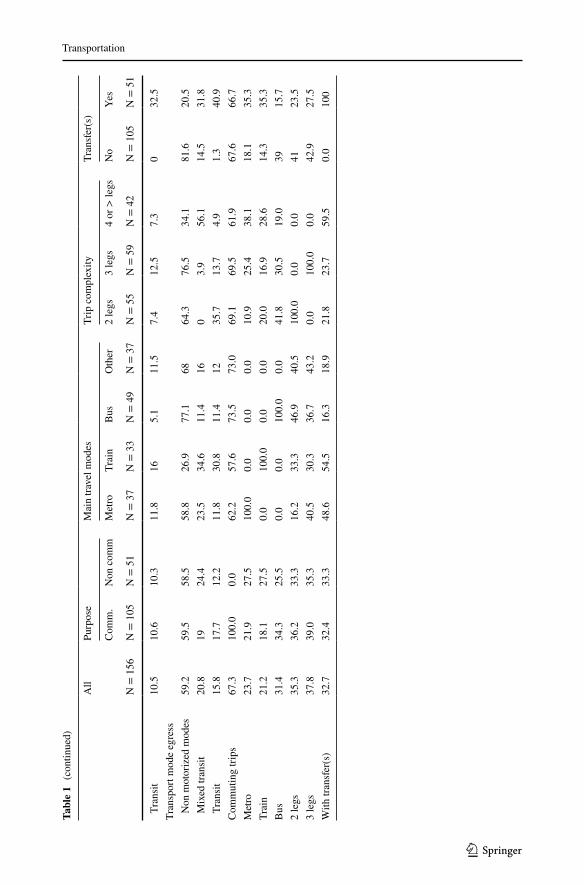
Table 1 presents the summary statistics of the socio-demographic characteristics and mobility patterns of the survey sample by purpose, main travel mode and trip complex-ity. The percentage of respondents per category is shown in bold and the share of missing values and non-responses is displayed in brackets. Data of respondents with missing values were used only in the exploratory stage and were excluded in the model estimation phase.
Approximately two thirds of the respondents are young adults (65%)—age 18–34, who report their commuting trip (67%). In addition, young adults use more frequently than oth-ers private vehicle or non-motorised modes (other) as their main travel mode. About 7% of travelers reported to have some type of disability, and their share doubles when consider-ing only non-commuting or bus trips (14% each). Compared to the average duration of all trips (58 min), trips travelled by train (114 min) and non-commuting trips (76 min) have longer average duration and larger variation in trip duration (see SD in the duration row in Table 1). This might be explained by the conjunction of a wider diversity of non-commut-ing trip purposes, and by the prominence of train (suburban, regional and inter-city) as the main mode. The unexpected high share of unemployed and low income commuters results from the large share of students within this group (40%). Bus is the main mode for 42% of the trips that consist of 2 legs, while metro is the main mode for 84% of the most complex trips comprising of at least 3 legs.
A modification of the interconnectivity ratio proposed by Krygsman et al. (2004), which we define as the proportion of access and egress times to the main leg travel time, is employed in this paper to further characterize the trips by showing the ratio of time spent
Transportation
1 3
Tabl
e 1
Soc
io-d
emog
raph
ics a
nd tr
avel
cha
ract
erist
ics p
rofil
e of
the
resp
onde
nts b
y tri
p pu
rpos
e, m
ain
trave
l mod
e an
d tri
p co
mpl
exity
(in
%)
All
Purp
ose
Mai
n tra
vel m
odes
Trip
com
plex
ityTr
ansf
er(s
)
Com
m.
Non
com
mM
etro
Trai
nB
usO
ther
2 le
gs3
legs
4 or
> le
gsN
oYe
s
N =
156
N =
105
N =
51
N =
37
N =
33
N =
49
N =
37
N =
55
N =
59
N =
42
N =
105
N =
51
Mal
e43
.2(1
.2)
41.9
45.1
(4)
51.4
45.5
34.7
(4)
43.2
34.5
54.2
(1.7
)38
.1(2
.4)
45.7
(1.0
)37
.3
Youn
g ad
ults
18–
3464
.8(0
.6)
66.7
60.8
(2)
56.7
66.7
57.1
(2)
81.1
58.2
66.1
(1.7
)71
.466
.6(1
.0)
58.8
Mat
ure
adul
ts 3
5–64
33.4
(0.6
)33
.333
.3(2
)43
.230
.338
.7(2
)18
.938
.232
.3(1
.7)
28.6
29.6
41.2
Dis
abili
ty7 (1
.3)
3.9
(1.9
)13
.72.
73 (3
)14
.35.
4(2
.7)
7.3
(3.6
)5.
19.
59.
5(1
.9)
2
Wee
kly
trave
ler
77.6
(3.2
)96
.239
.2(9
.8)
73 (10.
8)66
.781
.6(2
)86
.580
77.9
(3.4
)73
.8(7
.1)
80 (1.9
)72
.6(5
.9)
Dur
atio
n (in
min
.) SD
57.9
56.9
49.2
29.1
75.9
88.4
42.3
19.9
113.
699
.144
.919
.141
.027
.454
.068
.953
.243
.169
.756
.653
.456
.767
.256
.9U
nem
ploy
ed/lo
w in
com
e46
.1(1
7.3)
50.5
(11.
4)37
.2(2
9.4)
55.1
(21.
6)52 (2
4.2)
51.1
(8.2
)48
.6(1
8.9)
32.7
(16.
4)52
.5(1
5.3)
54.8
(21.
4)49
.6(1
5.2)
50 (21.
6)Fu
ll tim
e w
orke
r39
.1(0
.6)
4135
.3(2
)43
.242
.434
.7(2
)37
.845
.533
.9(1
.7)
38.1
37.1
(1)
43.1
Stud
ent
34.6
(0.6
)40
23.5
(2)
29.7
24.2
34.7
(2)
48.6
23.6
44.1
(1.7
)35
.738
.1(1
)27
.5
Acc
ess p
riv. v
eh.
51.9
(9.6
)48
.6(1
0.5)
58.8
(7.8
)48
.6(5
.4)
60.6
(3)
49 (18.
4)51
.3(8
.1)
56.4
(16.
4)50
.9(1
0.2)
47.6
53.3
(8.6
)49
Acc
ess b
icyc
le43
.6(2
1.1)
40 (21.
9)51 (1
9.6)
51.4
(8.1
)45
.5(1
5.1)
28.6
(34.
6)54
.1(2
1.6)
43.6
(25.
4)42
.4(2
5.4)
45.2
(9.5
)41 (9
.5)
49
Inte
rcon
nect
ivity
ratio
0.74
0.78
0.66
1.15
0.58
0.51
0.77
0.42
0.65
1.30
0.61
1.02
Tran
spor
t mod
e ac
cess
Non
mot
oriz
ed m
odes
62.9
62.4
64.1
61.8
4487
.246
.281
.573
.236
.681
25 M
ixed
tran
sit
17.7
17.6
17.9
20.6
245.
126
.90
8.9
41.5
11.9
30
Transportation
1 3
Tabl
e 1
(con
tinue
d)
All
Purp
ose
Mai
n tra
vel m
odes
Trip
com
plex
ityTr
ansf
er(s
)
Com
m.
Non
com
mM
etro
Trai
nB
usO
ther
2 le
gs3
legs
4 or
> le
gsN
oYe
s
N =
156
N =
105
N =
51
N =
37
N =
33
N =
49
N =
37
N =
55
N =
59
N =
42
N =
105
N =
51
Tra
nsit
10.5
10.6
10.3
11.8
165.
111
.57.
412
.57.
30
32.5
Tran
spor
t mod
e eg
ress
Non
mot
oriz
ed m
odes
59.2
59.5
58.5
58.8
26.9
77.1
6864
.376
.534
.181
.620
.5 M
ixed
tran
sit
20.8
1924
.423
.534
.611
.416
03.
956
.114
.531
.8 T
rans
it15
.817
.712
.211
.830
.811
.412
35.7
13.7
4.9
1.3
40.9
Com
mut
ing
trips
67.3
100.
00.
062
.257
.673
.573
.069
.169
.561
.967
.666
.7M
etro
23.7
21.9
27.5
100.
00.
00.
00.
010
.925
.438
.118
.135
.3Tr
ain
21.2
18.1
27.5
0.0
100.
00.
00.
020
.016
.928
.614
.335
.3B
us31
.434
.325
.50.
00.
010
0.0
0.0
41.8
30.5
19.0
3915
.72
legs
35.3
36.2
33.3
16.2
33.3
46.9
40.5
100.
00.
00.
041
23.5
3 le
gs37
.839
.035
.340
.530
.336
.743
.20.
010
0.0
0.0
42.9
27.5
With
tran
sfer
(s)
32.7
32.4
33.3
48.6
54.5
16.3
18.9
21.8
23.7
59.5
0.0
100
Transportation
1 3
by travelers with regard to the main leg. The interconnectivity ratio provides an insight on the distribution of travel time between (primarily) non-motorised modes and the main travel mode. It is expected that most of the travel time is spent in the main mode, and thus yielding ratios below 1. With the exceptions of trips by metro (1.15), 4-leg trips (1.30) and trips with transfers (1.02), generally travelers spend less time in access and egress legs together than in the main mode. A visual examination of the modes used in the access and egress legs displays the importance of non-motorised modes (60–63%) which are followed by a combination of non-motorised modes and transit modes (mixed transit, 18–21%), and exclusively transit modes (11–16%). Non-motorised modes only are particularly prepon-derant at bus and 2-leg trips, while their presence is much smaller in trips with 4 or more legs, with a transfer and with train as the main mode.
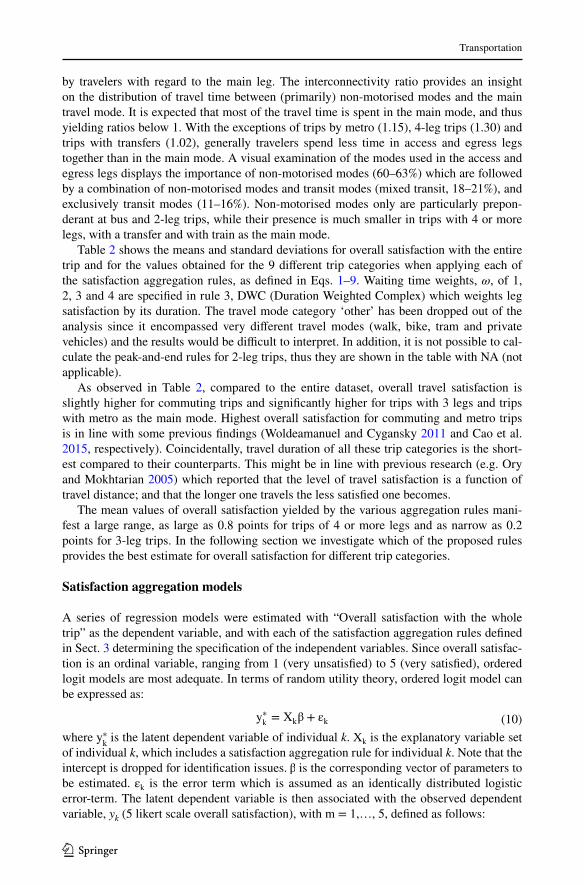
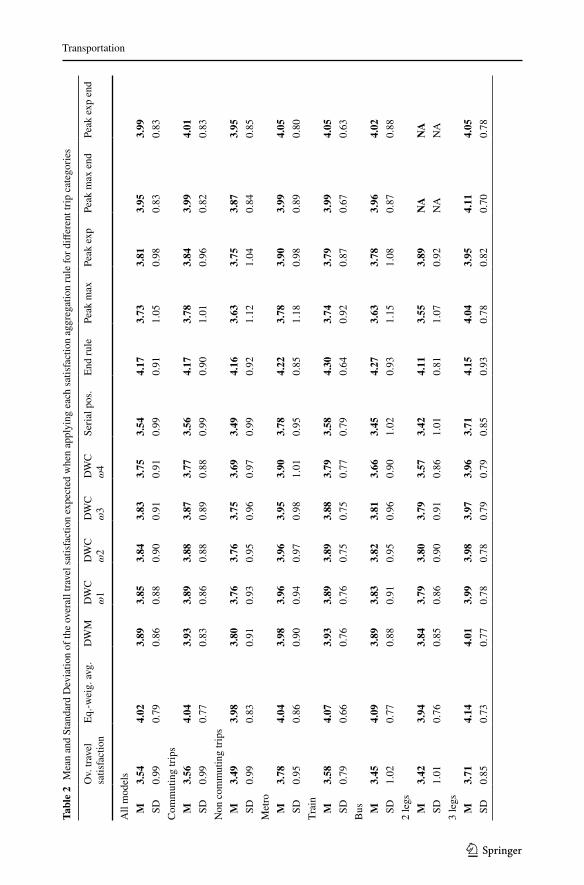
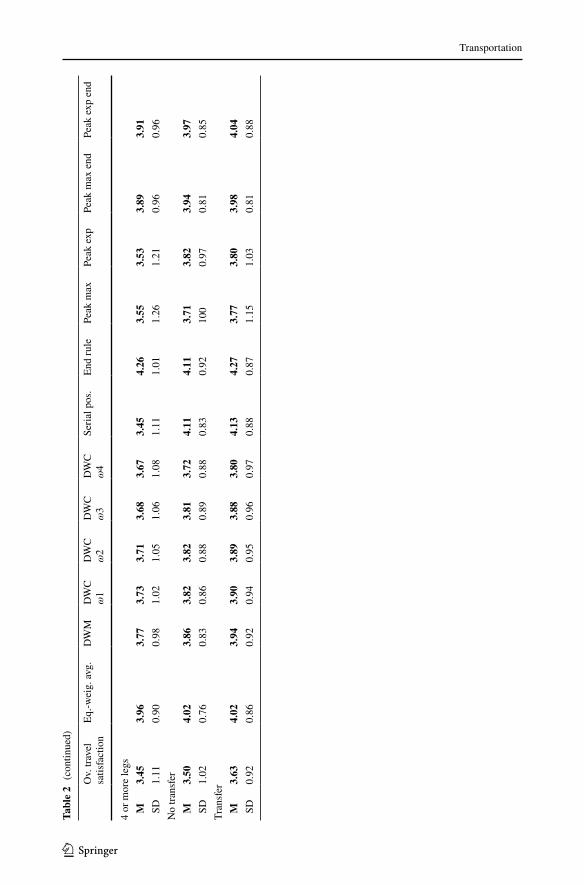
Table 2 shows the means and standard deviations for overall satisfaction with the entire trip and for the values obtained for the 9 different trip categories when applying each of the satisfaction aggregation rules, as defined in Eqs. 1–9. Waiting time weights, ω, of 1, 2, 3 and 4 are specified in rule 3, DWC (Duration Weighted Complex) which weights leg satisfaction by its duration. The travel mode category ‘other’ has been dropped out of the analysis since it encompassed very different travel modes (walk, bike, tram and private vehicles) and the results would be difficult to interpret. In addition, it is not possible to cal-culate the peak-and-end rules for 2-leg trips, thus they are shown in the table with NA (not applicable).
As observed in Table 2, compared to the entire dataset, overall travel satisfaction is slightly higher for commuting trips and significantly higher for trips with 3 legs and trips with metro as the main mode. Highest overall satisfaction for commuting and metro trips is in line with some previous findings (Woldeamanuel and Cygansky 2011 and Cao et al. 2015, respectively). Coincidentally, travel duration of all these trip categories is the short-est compared to their counterparts. This might be in line with previous research (e.g. Ory and Mokhtarian 2005) which reported that the level of travel satisfaction is a function of travel distance; and that the longer one travels the less satisfied one becomes.
The mean values of overall satisfaction yielded by the various aggregation rules mani-fest a large range, as large as 0.8 points for trips of 4 or more legs and as narrow as 0.2 points for 3-leg trips. In the following section we investigate which of the proposed rules provides the best estimate for overall satisfaction for different trip categories.
Satisfaction aggregation models
A series of regression models were estimated with “Overall satisfaction with the whole trip” as the dependent variable, and with each of the satisfaction aggregation rules defined in Sect. 3 determining the specification of the independent variables. Since overall satisfac-tion is an ordinal variable, ranging from 1 (very unsatisfied) to 5 (very satisfied), ordered logit models are most adequate. In terms of random utility theory, ordered logit model can be expressed as:
where y∗k is the latent dependent variable of individual k. Xk is the explanatory variable set
of individual k, which includes a satisfaction aggregation rule for individual k. Note that the intercept is dropped for identification issues. β is the corresponding vector of parameters to be estimated. εk is the error term which is assumed as an identically distributed logistic error-term. The latent dependent variable is then associated with the observed dependent variable, yk (5 likert scale overall satisfaction), with m = 1,…, 5, defined as follows:
(10)y∗k= Xkβ + εk
Transportation
1 3
Tabl
e 2
Mea
n an
d St
anda
rd D
evia
tion
of th
e ov
eral
l tra
vel s
atis
fact
ion
expe
cted
whe
n ap
plyi
ng e
ach
satis
fact
ion
aggr
egat
ion
rule
for d
iffer
ent t
rip c
ateg
orie
s
Ov.
trav
el
satis
fact
ion
Eq.-w
eig.
avg
.D
WM
DW
Cω
1D
WC
ω2
DW
Cω
3D
WC
ω4
Seria
l pos
.En
d ru
lePe
ak m
axPe
ak e
xpPe
ak m
ax e
ndPe
ak e
xp e
nd
All
mod
els
M3.
544.
023.
893.
853.
843.
833.
753.
544.
173.
733.
813.
953.
99 S
D0.
990.
790.
860.
880.
900.
910.
910.
990.
911.
050.
980.
830.
83C
omm
utin
g tri
ps M
3.56
4.04
3.93
3.89
3.88
3.87
3.77
3.56
4.17
3.78
3.84
3.99
4.01
SD
0.99
0.77
0.83
0.86
0.88
0.89
0.88
0.99
0.90
1.01
0.96
0.82
0.83
Non
com
mut
ing
trips
M3.
493.
983.
803.
763.
763.
753.
693.
494.
163.
633.
753.
873.
95 S
D0.
990.
830.
910.
930.
950.
960.
970.
990.
921.
121.
040.
840.
85M
etro
M3.
784.
043.
983.
963.
963.
953.
903.
784.
223.
783.
903.
994.
05 S
D0.
950.
860.
900.
940.
970.
981.
010.
950.
851.
180.
980.
890.
80Tr
ain
M3.
584.
073.
933.
893.
893.
883.
793.
584.
303.
743.
793.
994.
05 S
D0.
790.
660.
760.
760.
750.
750.
770.
790.
640.
920.
870.
670.
63B
us M3.
454.
093.
893.
833.
823.
813.
663.
454.
273.
633.
783.
964.
02 S
D1.
020.
770.
880.
910.
950.
960.
901.
020.
931.
151.
080.
870.
882
legs
M3.
423.
943.
843.
793.
803.
793.
573.
424.
113.
553.
89N
AN
A S
D1.
010.
760.
850.
860.
900.
910.
861.
010.
811.
070.
92N
AN
A3
legs
M3.
714.
144.
013.
993.
983.
973.
963.
714.
154.
043.
954.
114.
05 S
D0.
850.
730.
770.
780.
780.
790.
790.
850.
930.
780.
820.
700.
78
Transportation
1 3
Tabl
e 2
(con
tinue
d)
Ov.
trav
el
satis
fact
ion
Eq.-w
eig.
avg
.D
WM
DW
Cω
1D
WC
ω2
DW
Cω
3D
WC
ω4
Seria
l pos
.En
d ru
lePe
ak m
axPe
ak e
xpPe
ak m
ax e
ndPe
ak e
xp e
nd
4 or
mor
e le
gs M
3.45
3.96
3.77
3.73
3.71
3.68
3.67
3.45
4.26
3.55
3.53
3.89
3.91
SD
1.11
0.90
0.98
1.02
1.05
1.06
1.08
1.11
1.01
1.26
1.21
0.96
0.96
No
trans
fer
M3.
504.
023.
863.
823.
823.
813.
724.
114.
113.
713.
823.
943.
97 S
D1.
020.
760.
830.
860.
880.
890.
880.
830.
9210
00.
970.
810.
85Tr
ansf
er M
3.63
4.02
3.94
3.90
3.89
3.88
3.80
4.13
4.27
3.77
3.80
3.98
4.04
SD
0.92
0.86
0.92
0.94
0.95
0.96
0.97
0.88
0.87
1.15
1.03
0.81
0.88
Transportation
1 3
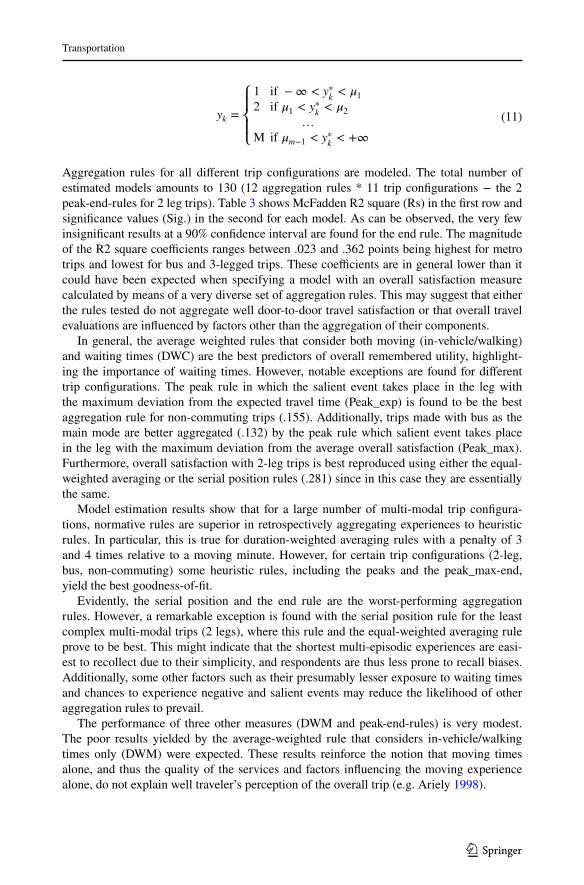
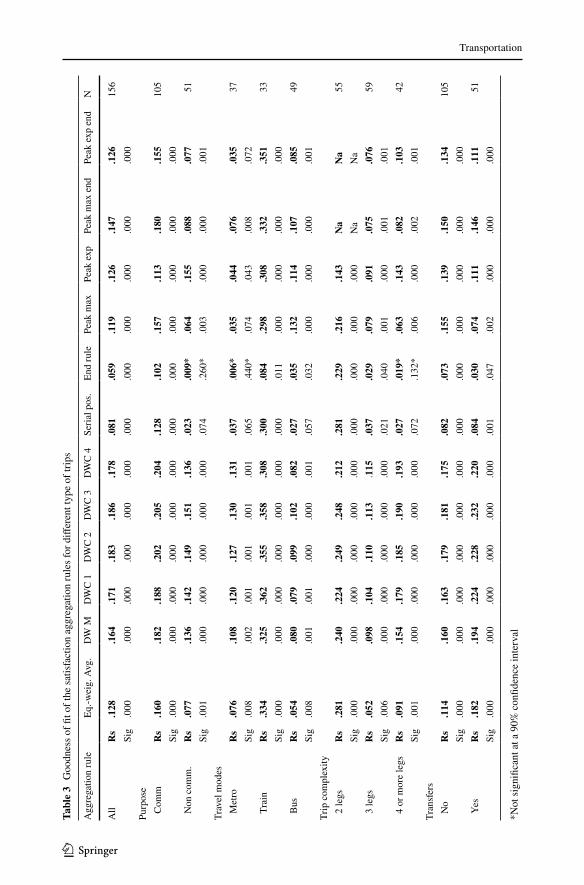
Aggregation rules for all different trip configurations are modeled. The total number of estimated models amounts to 130 (12 aggregation rules * 11 trip configurations − the 2 peak-end-rules for 2 leg trips). Table 3 shows McFadden R2 square (Rs) in the first row and significance values (Sig.) in the second for each model. As can be observed, the very few insignificant results at a 90% confidence interval are found for the end rule. The magnitude of the R2 square coefficients ranges between .023 and .362 points being highest for metro trips and lowest for bus and 3-legged trips. These coefficients are in general lower than it could have been expected when specifying a model with an overall satisfaction measure calculated by means of a very diverse set of aggregation rules. This may suggest that either the rules tested do not aggregate well door-to-door travel satisfaction or that overall travel evaluations are influenced by factors other than the aggregation of their components.
In general, the average weighted rules that consider both moving (in-vehicle/walking) and waiting times (DWC) are the best predictors of overall remembered utility, highlight-ing the importance of waiting times. However, notable exceptions are found for different trip configurations. The peak rule in which the salient event takes place in the leg with the maximum deviation from the expected travel time (Peak_exp) is found to be the best aggregation rule for non-commuting trips (.155). Additionally, trips made with bus as the main mode are better aggregated (.132) by the peak rule which salient event takes place in the leg with the maximum deviation from the average overall satisfaction (Peak_max). Furthermore, overall satisfaction with 2-leg trips is best reproduced using either the equal-weighted averaging or the serial position rules (.281) since in this case they are essentially the same.
Model estimation results show that for a large number of multi-modal trip configura-tions, normative rules are superior in retrospectively aggregating experiences to heuristic rules. In particular, this is true for duration-weighted averaging rules with a penalty of 3 and 4 times relative to a moving minute. However, for certain trip configurations (2-leg, bus, non-commuting) some heuristic rules, including the peaks and the peak_max-end, yield the best goodness-of-fit.
Evidently, the serial position and the end rule are the worst-performing aggregation rules. However, a remarkable exception is found with the serial position rule for the least complex multi-modal trips (2 legs), where this rule and the equal-weighted averaging rule prove to be best. This might indicate that the shortest multi-episodic experiences are easi-est to recollect due to their simplicity, and respondents are thus less prone to recall biases. Additionally, some other factors such as their presumably lesser exposure to waiting times and chances to experience negative and salient events may reduce the likelihood of other aggregation rules to prevail.
The performance of three other measures (DWM and peak-end-rules) is very modest. The poor results yielded by the average-weighted rule that considers in-vehicle/walking times only (DWM) were expected. These results reinforce the notion that moving times alone, and thus the quality of the services and factors influencing the moving experience alone, do not explain well traveler’s perception of the overall trip (e.g. Ariely 1998).
(11)yk =
⎧⎪⎨⎪⎩
1 if −∞ < y∗k< 𝜇1
2 if 𝜇1 < y∗k< 𝜇2
…
M if 𝜇m−1 < y∗k< +∞
Transportation
1 3
Tabl
e 3
Goo
dnes
s of fi
t of t
he sa
tisfa
ctio
n ag
greg
atio
n ru
les f
or d
iffer
ent t
ype
of tr
ips
*Not
sign
ifica
nt a
t a 9
0% c
onfid
ence
inte
rval
Agg
rega
tion
rule
Eq.-w
eig.
Avg
.D
W M
DW
C 1
DW
C 2
DW
C 3
DW
C 4
Seria
l pos
.En
d ru
lePe
ak m
axPe
ak e
xpPe
ak m
ax e
ndPe
ak e
xp e
ndN
All
Rs
.128
.164
.171
.183
.186
.178
.081
.059
.119
.126
.147
.126
156
Sig
.000
.000
.000
.000
.000
.000
.000
.000
.000
.000
.000
.000
Purp
ose
Com
mR
s.1
60.1
82.1
88.2
02.2
05.2
04.1
28.1
02.1
57.1
13.1
80.1
5510
5Si
g.0
00.0
00.0
00.0
00.0
00.0
00.0
00.0
00.0
00.0
00.0
00.0
00 N
on c
omm
.R
s.0
77.1
36.1
42.1
49.1
51.1
36.0
23.0
09*
.064
.155
.088
.077
51Si
g.0
01.0
00.0
00.0
00.0
00.0
00.0
74.2
60*
.003
.000
.000
.001
Trav
el m
odes
Met
roR
s.0
76.1
08.1
20.1
27.1
30.1
31.0
37.0
06*
.035
.044
.076
.035
37Si
g.0
08.0
02.0
01.0
01.0
01.0
01.0
65.4
40*
.074
.043
.008
.072
Tra
inR
s.3
34.3
25.3
62.3
55.3
58.3
08.3
00.0
84.2
98.3
08.3
32.3
5133
Sig
.000
.000
.000
.000
.000
.000
.000
.011
.000
.000
.000
.000
Bus
Rs
.054
.080
.079
.099
.102
.082
.027
.035
.132
.114
.107
.085
49Si
g.0
08.0
01.0
01.0
00.0
00.0
01.0
57.0
32.0
00.0
00.0
00.0
01Tr
ip c
ompl
exity
2 le
gsR
s.2
81.2
40.2
24.2
49.2
48.2
12.2
81.2
29.2
16.1
43N
aN
a55
Sig
.000
.000
.000
.000
.000
.000
.000
.000
.000
.000
Na
Na
3 le
gsR
s.0
52.0
98.1
04.1
10.1
13.1
15.0
37.0
29.0
79.0
91.0
75.0
7659
Sig
.006
.000
.000
.000
.000
.000
.021
.040
.001
.000
.001
.001
4 o
r mor
e le
gsR
s.0
91.1
54.1
79.1
85.1
90.1
93.0
27.0
19*
.063
.143
.082
.103
42Si
g.0
01.0
00.0
00.0
00.0
00.0
00.0
72.1
32*
.006
.000
.002
.001
Tran
sfer
s N
oR
s.1
14.1
60.1
63.1
79.1
81.1
75.0
82.0
73.1
55.1
39.1
50.1
3410
5Si
g.0
00.0
00.0
00.0
00.0
00.0
00.0
00.0
00.0
00.0
00.0
00.0
00 Y
esR
s.1
82.1
94.2
24.2
28.2
32.2
20.0
84.0
30.0
74.1
11.1
46.1
1151
Sig
.000
.000
.000
.000
.000
.000
.001
.047
.002
.000
.000
.000
Transportation
1 3
Cross‑correlations of trip legs and overall satisfaction
This section studies the strength of the relationship between overall satisfaction and the dif-ferent trip legs and aims to unveil the most relevant leg for bus and non-commuting trips.
A correlation matrix was constructed in order to identify the strength of the relation-ships between overall trip satisfaction and the satisfaction with different trip stages, as well as to study the extent to which the trip stages are inter-correlated. Multimodal transit trips consist of two or three stages: a main leg and an access and/or egress stage. Access and egress stages can be comprised of a single or various legs before or after the main leg respectively. Trip legs are aggregated into stages by means of simple average of the trip legs.
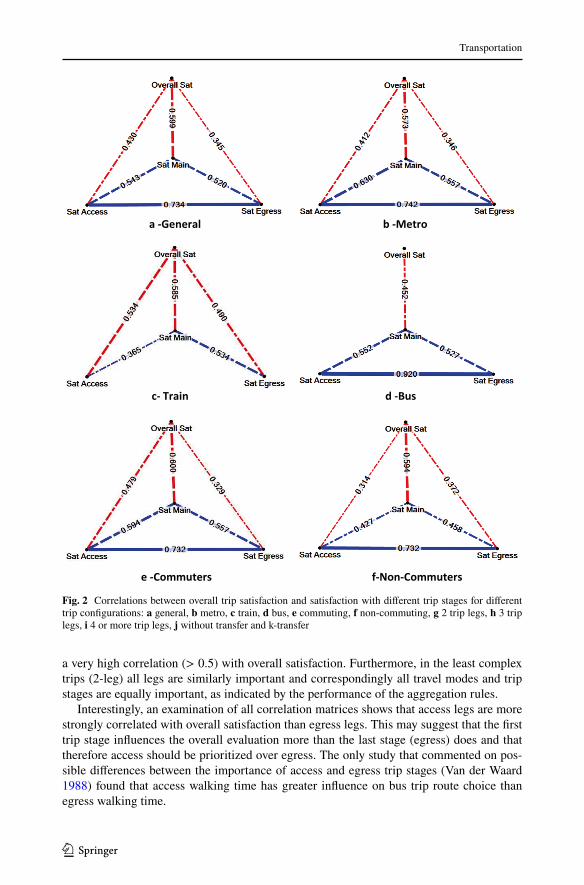
Figure 2 and Table 4 present cross-correlation matrices for different trip configurations with regard to their purpose, travel mode, trip complexity and presence of transfers, with each satisfaction item represented as a node and the correlation between two items illus-trated by a link. The cross-correlation graphs were visualized using the NodeXL excel add-in and offer an intuitive glimpse of the relationships between the various factors. In Fig. 2, correlations with the overall trip satisfaction are highlighted using red lines while correla-tions among trip stages are displayed in blue. The line thickness corresponds to the degree of correlation as follows; correlations above 0.7 are shown with a solid line, those between 0.5 and 0.7 with a dashed line and those between 0.3 and 0.5 with a dash and dot line. The coefficients shown are at a 90% confidence interval and are always positive.
A number of general trends can be observed in Fig. 2. When compared to access and egress legs, the main trip leg is more strongly and consistently correlated (> 0.5) with overall trip satisfaction. In some of the trip configurations where DWC measures are best aggregating the travel experiences (Fig. 2: a-General, e-Commuter, b-Metro, c-Train, i-4 legs and k-Transfers), this higher correlation could be due to the extensive share (84.6%) of transit modes used in the main trip leg. Transit modes which generally consist of wait-ing times which in turn are perceived with a higher weight than moving times. In the remaining trip configurations with successful DWC rules, however, the lack of significance and the weakest correlations existing between access/egress legs and overall satisfaction (Fig. 2: j-Without transfers and h-3 leg trips) might be attributed to the very large share of non-motorised modes used in the access (73 and 81%) and egress legs (64 and 82%) respectively. Being non-motorised modes are characterized by their lack of waiting time and their travel time reliability.
While peak rules were found to be most adequate for explaining satisfaction with bus and non-commuting trips, the impactful leg associated with the peak experience remained unknown. Cross-correlations, however, allow to determine the most probable impactful leg. For bus trips, the main leg is identified as the leg with the maximum deviation from the average satisfaction since this is the only leg showing a moderate but significant corre-lation coefficient (d-Bus) with overall trip satisfaction. For non-commuting trips, the main leg´s correlation is 0.59, far over the 0.37 of access or egress legs and thus the former should be considered as the most deviant and relevant one. Commuting and non-commut-ing trips show very similar correlation coefficients: very strong correlation between access and egress stages and between main and overall satisfaction. The main difference pertains to the weaker correlations found for non-commuting trips between access and egress stages and main and overall satisfaction. This may indicate that commuters perceive their door-to-door trip as a more integrated experience.”
Similar weights attributed to the main and access/egress legs in constructing an overall evaluation of the trips with transfers is made evident in Fig. 2c-Train, where all legs exhibit
Transportation
1 3
a very high correlation (> 0.5) with overall satisfaction. Furthermore, in the least complex trips (2-leg) all legs are similarly important and correspondingly all travel modes and trip stages are equally important, as indicated by the performance of the aggregation rules.
Interestingly, an examination of all correlation matrices shows that access legs are more strongly correlated with overall satisfaction than egress legs. This may suggest that the first trip stage influences the overall evaluation more than the last stage (egress) does and that therefore access should be prioritized over egress. The only study that commented on pos-sible differences between the importance of access and egress trip stages (Van der Waard 1988) found that access walking time has greater influence on bus trip route choice than egress walking time.
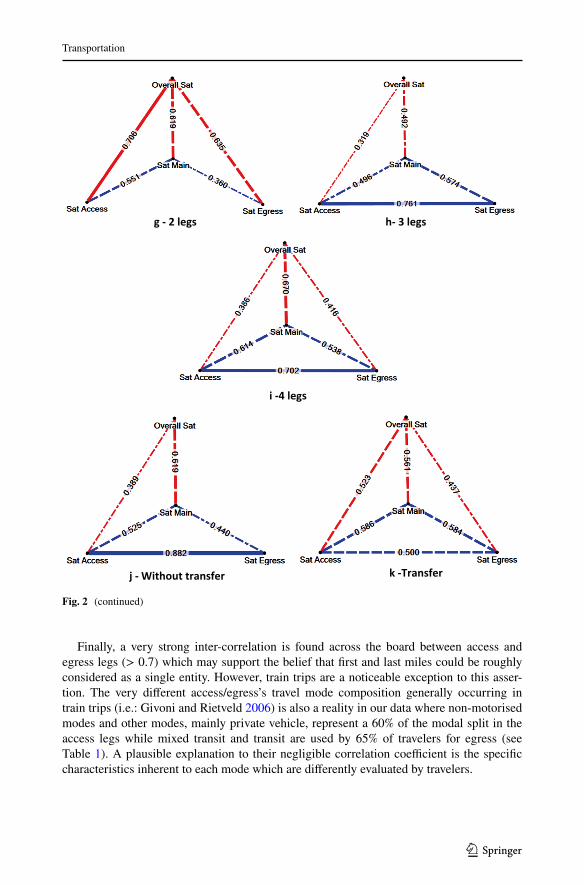
Fig. 2 Correlations between overall trip satisfaction and satisfaction with different trip stages for different trip configurations: a general, b metro, c train, d bus, e commuting, f non-commuting, g 2 trip legs, h 3 trip legs, i 4 or more trip legs, j without transfer and k-transfer
Transportation
1 3
Finally, a very strong inter-correlation is found across the board between access and egress legs (> 0.7) which may support the belief that first and last miles could be roughly considered as a single entity. However, train trips are a noticeable exception to this asser-tion. The very different access/egress’s travel mode composition generally occurring in train trips (i.e.: Givoni and Rietveld 2006) is also a reality in our data where non-motorised modes and other modes, mainly private vehicle, represent a 60% of the modal split in the access legs while mixed transit and transit are used by 65% of travelers for egress (see Table 1). A plausible explanation to their negligible correlation coefficient is the specific characteristics inherent to each mode which are differently evaluated by travelers.
Fig. 2 (continued)
Transportation
1 3
Trip stages and overall satisfaction
By creating generalized aggregation models the present section aspires to go a step further into the study of the strength of the relationship between overall travel satisfaction and the trips stages. This is done by considering the normative rules only in aggregating individual trip legs’ satisfaction into trip stages’ satisfaction since they include all trip legs. These generalized aggregation models would assist stakeholders in better evaluating the percent relative weight on overall travel satisfaction assigned to each trip stage.
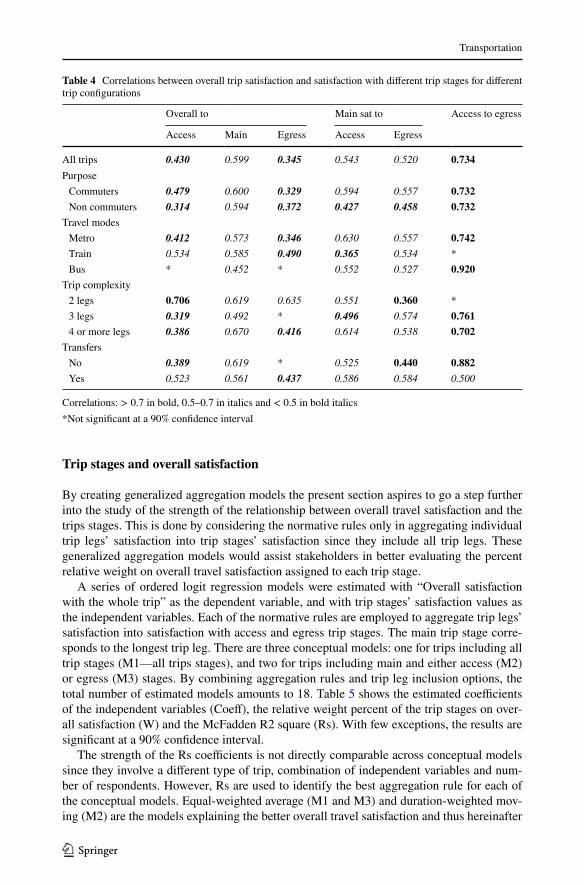
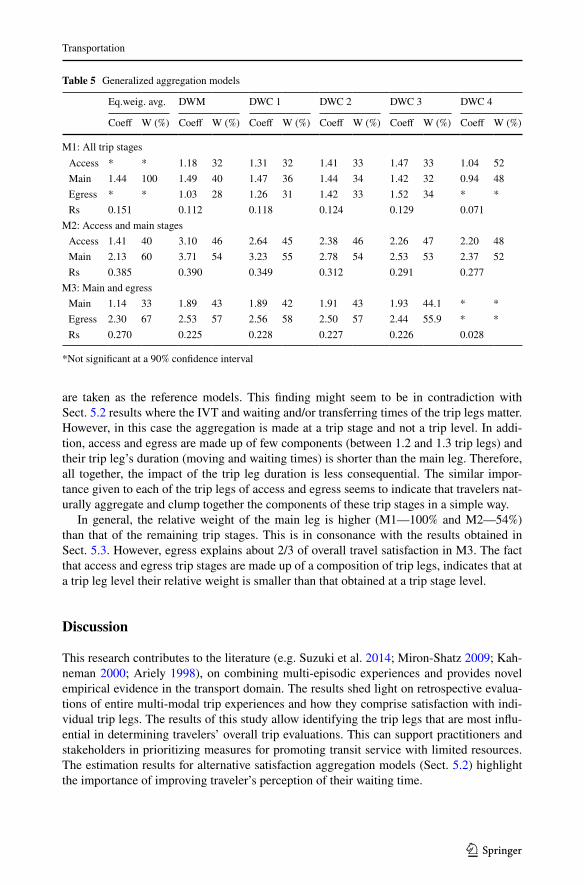
A series of ordered logit regression models were estimated with “Overall satisfaction with the whole trip” as the dependent variable, and with trip stages’ satisfaction values as the independent variables. Each of the normative rules are employed to aggregate trip legs’ satisfaction into satisfaction with access and egress trip stages. The main trip stage corre-sponds to the longest trip leg. There are three conceptual models: one for trips including all trip stages (M1—all trips stages), and two for trips including main and either access (M2) or egress (M3) stages. By combining aggregation rules and trip leg inclusion options, the total number of estimated models amounts to 18. Table 5 shows the estimated coefficients of the independent variables (Coeff), the relative weight percent of the trip stages on over-all satisfaction (W) and the McFadden R2 square (Rs). With few exceptions, the results are significant at a 90% confidence interval.
The strength of the Rs coefficients is not directly comparable across conceptual models since they involve a different type of trip, combination of independent variables and num-ber of respondents. However, Rs are used to identify the best aggregation rule for each of the conceptual models. Equal-weighted average (M1 and M3) and duration-weighted mov-ing (M2) are the models explaining the better overall travel satisfaction and thus hereinafter
Table 4 Correlations between overall trip satisfaction and satisfaction with different trip stages for different trip configurations
Correlations: > 0.7 in bold, 0.5–0.7 in italics and < 0.5 in bold italics*Not significant at a 90% confidence interval
Overall to Main sat to Access to egress
Access Main Egress Access Egress
All trips 0.430 0.599 0.345 0.543 0.520 0.734Purpose Commuters 0.479 0.600 0.329 0.594 0.557 0.732 Non commuters 0.314 0.594 0.372 0.427 0.458 0.732
Travel modes Metro 0.412 0.573 0.346 0.630 0.557 0.742 Train 0.534 0.585 0.490 0.365 0.534 * Bus * 0.452 * 0.552 0.527 0.920
Trip complexity 2 legs 0.706 0.619 0.635 0.551 0.360 * 3 legs 0.319 0.492 * 0.496 0.574 0.761 4 or more legs 0.386 0.670 0.416 0.614 0.538 0.702
Transfers No 0.389 0.619 * 0.525 0.440 0.882 Yes 0.523 0.561 0.437 0.586 0.584 0.500
Transportation
1 3
are taken as the reference models. This finding might seem to be in contradiction with Sect. 5.2 results where the IVT and waiting and/or transferring times of the trip legs matter. However, in this case the aggregation is made at a trip stage and not a trip level. In addi-tion, access and egress are made up of few components (between 1.2 and 1.3 trip legs) and their trip leg’s duration (moving and waiting times) is shorter than the main leg. Therefore, all together, the impact of the trip leg duration is less consequential. The similar impor-tance given to each of the trip legs of access and egress seems to indicate that travelers nat-urally aggregate and clump together the components of these trip stages in a simple way.
In general, the relative weight of the main leg is higher (M1—100% and M2—54%) than that of the remaining trip stages. This is in consonance with the results obtained in Sect. 5.3. However, egress explains about 2/3 of overall travel satisfaction in M3. The fact that access and egress trip stages are made up of a composition of trip legs, indicates that at a trip leg level their relative weight is smaller than that obtained at a trip stage level.
Discussion
This research contributes to the literature (e.g. Suzuki et al. 2014; Miron-Shatz 2009; Kah-neman 2000; Ariely 1998), on combining multi-episodic experiences and provides novel empirical evidence in the transport domain. The results shed light on retrospective evalua-tions of entire multi-modal trip experiences and how they comprise satisfaction with indi-vidual trip legs. The results of this study allow identifying the trip legs that are most influ-ential in determining travelers’ overall trip evaluations. This can support practitioners and stakeholders in prioritizing measures for promoting transit service with limited resources. The estimation results for alternative satisfaction aggregation models (Sect. 5.2) highlight the importance of improving traveler’s perception of their waiting time.
Table 5 Generalized aggregation models
*Not significant at a 90% confidence interval
Eq.weig. avg. DWM DWC 1 DWC 2 DWC 3 DWC 4
Coeff W (%) Coeff W (%) Coeff W (%) Coeff W (%) Coeff W (%) Coeff W (%)
M1: All trip stages Access * * 1.18 32 1.31 32 1.41 33 1.47 33 1.04 52 Main 1.44 100 1.49 40 1.47 36 1.44 34 1.42 32 0.94 48 Egress * * 1.03 28 1.26 31 1.42 33 1.52 34 * * Rs 0.151 0.112 0.118 0.124 0.129 0.071
M2: Access and main stages Access 1.41 40 3.10 46 2.64 45 2.38 46 2.26 47 2.20 48 Main 2.13 60 3.71 54 3.23 55 2.78 54 2.53 53 2.37 52 Rs 0.385 0.390 0.349 0.312 0.291 0.277
M3: Main and egress Main 1.14 33 1.89 43 1.89 42 1.91 43 1.93 44.1 * * Egress 2.30 67 2.53 57 2.56 58 2.50 57 2.44 55.9 * * Rs 0.270 0.225 0.228 0.227 0.226 0.028
Transportation
1 3
The better goodness of fit of some aggregation measures confirms our assumption that the recollection of retrospective evaluations varies for different travel categories. Hence, trip characteristics should be considered when multi-modal trips are investigated.
In general, normative rules were found better predictors of retrospectively aggregat-ing experiences than heuristic rules. These findings resonate with previous research (e.g. Suzuki et al. 2014; Miron-Shatz 2009) and indicate that no trip leg can be neglected since all of them have an impact on overall travel satisfaction. The average weighted rule that considers both moving (in-vehicle/walking) and waiting times (DWC) performed particu-larly well, especially when applying a waiting time weight of 3 or 4 times in-vehicle or walking time (DWC3 and DWC4). Nevertheless, trips with train as the main mode are a notable exception, presumably because waiting times at train stations are more tolerable because of the higher service reliability and the availability of station amenities. This state-ment concurs with Fan et al. (2016) who demonstrated that perceived waiting times dimin-ish for stops that have amenities such as benches and shelters. Furthermore, other studies have shown that travel time perception at stations and stops can be reduced by making the stay more comfortable including aspects of external and internal design, increasing safety and improving how time can be used while interchanging (Hernandez and Monzon 2016; Yoh et al. 2012).
The negative impacts that transfers exert on overall satisfaction found by De Abreu e Silva and Bazrafshan (2013) are not manifested in our study. In fact, trips involving trans-fers have higher than average overall satisfaction levels (see Table 2). However, the good performance of DWC3 and DWC4 rules for these trip configurations may suggest that improving the perception of waiting time, including when transferring, is important. Previ-ous research showed that the degree to which satisfaction is negatively affected by transfers depends on aspects related to the service offered and the quality of the interchanges includ-ing: signposting of facilities, their internal design, safety, security (Hernandez et al. 2014) and their cleanliness and maintenance (De Abreu e Silva and Bazrafshan 2013); aspects that therefore should be enhanced by practitioners.
Unlike findings from other domains (Fredrickson and Kahneman 1993; Redelmeier and Kahneman 1996; Baumgartner et al. 1997; Varey and Kahneman 1992; Schäfer et al. 2014), none of the peak-end-rules show a good performance for any of the trip configu-rations. This might either indicate that recency effects are not present in the context of travel satisfaction, that our experiment is very different in nature to the ones previously car-ried out, or that there are a larger number of trips in our database that lack salient events.1 The absence of a strong end effect does not necessarily imply that the egress leg is not impactful since this leg is embodied in some of the other successful rules. In addition, the egress leg is found to have a higher percent relative weight in certain types of trips (main and egress trips) than the main mode. However, compared to many of the previous experi-ments, our study is applied to delimited experiences containing very few instant utilities and the overall memory recollection is done completely in retrospect.
M1 results from Sect. 5.4 may suggest that access and egress have no influence at all on overall satisfaction. However, this is conflicting with findings from Sect. 5.2 and incon-sistent with the relative weight distribution yielded in the remaining normative models. A plausible explanation to this might be the indirect influence that access and egress exert on
1 23 and 40% of the trips lack a salient event related to deviance with regard to expected travel time and to the average satisfaction values, respectively.
Transportation
1 3
overall travel satisfaction through the main trip leg, as observed in the strength of the cor-relations between the access/egress and main stages (Sect. 5.3).
Conclusion
This work aimed to investigate how travelers aggregate different door-to-door travel experi-ences into an overall evaluation. In addition, this work investigates the relative weight of trip legs on overall satisfaction. It can be concluded that, as shown by the predominant success of DWC rules, all trip legs are found to be relevant in influencing the overall trip’s evaluation. However, the main trip leg together with legs including waiting and transferring times have a higher influence. This partially diverges from Susilo and Cats (2014) find-ings when they argued that access and egress trip legs influence satisfaction with the main leg. The analysis was performed using a modest sample size and the generalization of the results should be therefore done with caution. Therefore, to be able to generalize this work results the experiment should be replicated with a larger dataset in multiple geographical contexts. In any event, the results set a precedent in the transport domain regarding how retrospective evaluations of different door-to-door trips are constructed, and can be used as a benchmark point for future studies. In addition, this work provides a useful method that can be applied to different datasets for investigating which leg(s) of a certain type of trip is (are) more consequential. Given the possible gap between what travelers actually perceived and memory-based experienced utility, it is recommended to collect instant utilities during the experience or to use methods such as ecological momentary assessment (Stone et al. 1998) or daily reconstruction (Miron-Shatz 2009; Kahneman et al. 2004) that have been proven to elicit recall bias-free instant utilities.
Future research should focus on investigating how the satisfaction aggregation measures work for different main transport modes (private vehicle, soft and other transit modes). Integrating the underlying causes for satisfaction with trip leg, service attributes of indi-vidual legs, into a single model of overall satisfaction with multi-modal trips, will allow investigating the trade-offs between different trip elements. Including a set of instrumen-tal variables such as socio-demographic and travel characteristics in the regression mod-els will allow studying their influence on travelers’ individual legs’ perceptions. In addi-tion, measuring waiting and transferring times’ satisfaction as separate episodes within the multi-modal trip would allow to better single out their impact. Finally, exploring the cor-relation between satisfaction and different leg composition with supply and infrastructure conditions will allow anchoring the relation between travelers’ perceptions and objective measures of service provision.
Acknowledgements The authors would like to thank Stockholm County’s (SLL) Research Development Funding in supporting the authors’ research activities.
Compliance with ethical standards
Conflict of interest On behalf of all authors, the corresponding author states that there is no conflict of interest.
Open Access This article is distributed under the terms of the Creative Commons Attribution 4.0 Inter-national License (http://creat iveco mmons .org/licen ses/by/4.0/), which permits unrestricted use, distribution, and reproduction in any medium, provided you give appropriate credit to the original author(s) and the source, provide a link to the Creative Commons license, and indicate if changes were made.

Transportation
1 3
References
Abenoza, R.F., Cats, O., Susilo, Y.O.: Travel satisfaction with public transport: determinants, user classes, regional disparities and their evolution. Transp. Res. Part A 95, 64–84 (2017)
Ariely, D.: Combining experiences over time: the effects of duration, intensity changes and on-line measure-ments on retrospective pain evaluations. J. Behav. Decis. Mak. 11, 19–45 (1998)
Ariely, D., Carmon, Z.: Gestalt characteristics of experiences: the defining features of summarized events. J. Behav. Decis. Mak. 13, 191–201 (2000)
Ariely, D., Loewenstein, G.: When does duration matter in judgment and decision making? J. Exp. Psychol. Gen. 129, 508–523 (2000)
Axhausen, K.: Definition of movement and activity for transport modelling. In: Hensher, D.A., Button, K.J. (eds.) Handbook of Transport Modelling, 2nd edn. Emerald Publishing Group, Bingley (2007)
Baumgartner, H., Sujan, M., Padgett, D.: Patterns of affective reactions to advertisements: the integration of moment-to-moment responses into overall judgments. J. Mark. Res. 34(2), 219–232 (1997)
Bruine de Bruin, W.: W.: Save the last dance for me: unwanted serial position effects in jury evaluations. Acta Physiol. (Oxf.) 118, 245–260 (2005)
Cao, J., Cao, X., Zhang, C., Huang, X.: The gaps in satisfaction with transit services among BRT, metro, and bus riders: evidence from Guangzhou. J. Transp. Land Use 9, 97–109 (2015)
Carmon, Z., Kahneman, D.: The experienced utility of queuing: experience profiles and retrospective evalu-ations of simulated queues. Fuqua School, Duke University, Durham, NC (1996)
Carrel, A., Mishalani, R.G., Sengupta, R., Walker, J.L.: In pursuit of the happy transit rider: dissecting satis-faction using daily surveys and tracking data. In: 94th Annual Meeting of the Transportation Research Board, Washington, DC (2015)
Cats, O., Abenoza, R.F., Liu, C., Susilo, Y.O.: Evolution of Satisfaction with public transport and its deter-minants in Sweden identifying priority areas. Transp. Res. Rec. 2538, 86–95 (2015)
De Abreu e Silva, J., Bazrafshan, H.: User satisfaction of intermodal transfer facilities in Lisbon, Portugal: analysis with structural equations modeling. Transp. Res. Rec. 2350, 102–110 (2013)
Dell’Olio, L., Ibeas, A., Cecin, P.: The quality of service desired by public transport users. Transp. Policy 18, 217–227 (2011)
Diener, E., Wirtz, D., Oishi, S.: End effects of rated life quality: the James Dean Effect. Psychol. Sci. 12, 124–128 (2001)
Dziekan, K., Kottenhoff, K.: Dynamic at-stop real-time information displays for public transport: effects on customers. Transp. Res. Part A 41, 489–501 (2007)
Ettema, D., Gärling, T., Eriksson, L., Friman, M., Olsson, L.E., Fujii, S.: Satisfaction with travel and subjec-tive well-being: development and test of a measurement tool. Transp. Res. Part F 14, 167–175 (2011)
Ettema, D., Friman, M., Gärling, T., Olsson, L.E., Fujii, S.: How in-vehicle activities affect work commut-ers’ satisfaction with public transport. J. Transp. Geogr. 24, 215–222 (2012)
Ettema, D., Abenoza, R.A., Susilo, Y.O.: Satisfaction with intermodal trips in Stockholm: How do service attributes influence satisfaction with the main mode and with the journey as a whole? Paper submitted for presentation at the 95th Annual Meeting of the Transportation Research Board, Washington, DC (2016)
European Commission: Roadmap to a single European transport area. Towards a competitive and resource-efficient transport system, White paper on transport. COM (2011)
Fan, Y., Guthrie, A., Levinson, D.: Waiting time perceptions at transit stops and stations: effects of basic amenities, gender, and security. Transp. Res. Part A 88, 251–264 (2016)
Fellesson, M., Seppo, H., Margareta, F., Leite, M. E., Lovén, L., Vihervuori, M.: The relationship between objective and customer satisfaction. BEST—Benchmarking in European Service of Public Transport (2009)
Finn, B.: Ending on a high note: adding a better end to effortful study. J. Exp. Psychol. Learn. Mem. Cogn. 36, 1548–1553 (2010)
Fredrickson, B.L., Kahneman, D.: Duration neglect in retrospective evaluations of affective episodes. J. Pers. Soc. Psychol. 65, 45–55 (1993)
Friman, M., Edvardsson, B., Gärling, T.: Frequency of negative critical incidents and satisfaction with pub-lic transport services. I. J. Retail. Consum. Serv. 8, 95–104 (2001)
Givoni, M., Rietveld, P.: The access journey to the railway station and its role in passengers’ satisfaction with rail travel. Transp. Policy 14, 357–365 (2007)
Givoni, M., Rietveld, P.: Access to railway stations in The Netherlands. Presented at the 46th Congress of the European Regional Science Association, Volos, Greece (2006)
Grönroos, C.: From scientific management to service management: a management perspective for the age of service competition. Int. J. Serv. Ind. Manag. 5, 5–20 (1994)

Transportation
1 3
Hernandez, S., Monzon, A.: Key factors for defining an efficient urban transport interchange: users’ percep-tions. Cities 50, 158–167 (2016)
Hernandez, S., Monzon, A., De Oña, R.: Urban transport interchanges: importance-performance analysis for evaluating perceived quality. In: Conference Proceedings: XVIII Congreso Panamericano de Ingeniería de Tránsito, Transporte y Logística (2014)
Hine, J.P., Wardman, M., Stradling, S.: Interchange and Travel Choice, vol. 2. Report for the Scottish Execu-tive by the Institute for Transport Studies at the University of Leeds and the Transport Research Insti-tute at Napier University (2001)
Iseki, H., Smart, M.J.: How do people perceive service attributes at transit facilities. Transp. Res. Rec. 2274, 164–174 (2012)
Kahneman, D., Wakker, P.P., Sarin, R.: Back to bentham? Explorations of experienced utility. Q. J. Econ. 112, 375–406 (1997)
Kahneman, D.: Evaluation by moments: past and future. In: Kahneman, D., Tversky, A. (eds.) Choices, Val-ues, and Frames, pp. 693–708. Cambridge University Press, New York (2000)
Kahneman, D., Krueger, A.B., Schkade, D.A., Schwarz, N., Stone, A.A.: A survey method for characteriz-ing daily life experience: the day reconstruction method. Science 306, 1776–1780 (2004)
Krygsman, S., Dijst, M., Arentze, T.: Multimodal public transport: an analysis of travel time elements and the interconnectivity ratio. Transp. Policy 11, 265–275 (2004)
Li, Y.: Evaluating the urban commute experience: a time perception approach. J. Public Trans. 6, 41–67 (2003)
Lythgoe, W.F., Wardman, M.: Demand for rail travel to and from airports. Transportation 29, 125–143 (2002)
METPEX: Identification of user requirements concerning the definition of variables to be measured by the METPEX tool (Deliverable 2.3 of the METPEX project), EU Commissions (2013)
METPEX: Report on survey and data collection processes at each location (Deliverable of the METPEX project), EU Commissions (2014)
Miller, J.M., Krosnick, J.A.: The impact of candidate name order on election outcomes. Public. Opin. Q. 62, 291–330 (1998)
Miron-Shatz, T.: Evaluating multiepisode events: boundary conditions for the peak-end rule. Emotion 9, 206–213 (2009)
Mishalani, R., McCord, M., Wirtz, J.: Passenger wait time perceptions at bus stops: empirical results and impact on evaluating real-time bus arrival information. J. Public Trans. 9, 89–106 (2006)
Mokhtarian, P., Papon, F.P., Goulard, M., Diana, M.: What makes travel pleasant and/or tiring? An investi-gation based on the French National Travel Survey. Transportation 42(6), 1103–1128 (2015)
Mouwen, A.: Drivers of customer satisfaction with public transport services. Transp. Res. Part A 78, 1–20 (2015)
Nathanail, E.: Measuring the quality of service for passengers on the Hellenic railways. Transp. Res. Part A 42, 48–66 (2008)
Ory, D.T., Mokhtarian, P.L.: When is getting there half the fun? Modeling the liking for travel. Transp. Res. Part A 39, 97–123 (2005)
Page, L., Page, K.: Last shall be first: a field study of biases in sequential performance evaluation on the Idol series. J. Econ. Behav. Organ. 73, 186–198 (2010)
Parasuraman, A., Berry, L.L., Zeithmal, V.A.: Understanding customer expectations of service. Sloan Manag. Rev. 32(3), 39–48 (1991)
Redelmeier, D.A., Kahneman, D.: Patients’ memories of painful medical treatments: real-time and retro-spective evaluations of two minimally invasive procedures. Pain 66, 3–8 (1996)
Schäfer, T., Zimmermann, D., Sedlmeier, P.: How we remember the emotional intensity of past musical experiences. Front. Psychol. 5, 9111 (2014)
Smidts, A., Pruyn, A.: How waiting affects customer satisfaction with the service: the role of subjective variables. In: Management of Services: A Multidisciplinary Approach (3rd Conference), pp. 677–696 (1994)
Sprumont, F., Astegiano, P., Viti, F.: On the consistency between commuting satisfaction and traveling util-ity: the case of the University of Luxembourg. Eur. J. Transp. Infrastruct. Res. 17, 248–262 (2017)
St-Louis, E., Manaugh, K., van Lierop, D., El-Geneidy, A.: The happy commuter: a comparison of com-muter satisfaction across modes. Transp. Res. Part F 26, 160–170 (2014)
Stone, A.A., Schwartz, J.E., Neale, J.M., Shiffman, S., Marco, C.A., Hickcox, M., Paty, J., Porter, L.S., Cruise, L.J.: A comparison of coping assessed by ecological momentary assessment and retrospective recall. J. Pers. Soc. Psychol. 74, 1670–1680 (1998)
Susilo, Y.O., Cats, O.: Exploring key determinants of travel satisfaction for multi-modal trips by different traveler groups. Transp. Res. Part A 67, 366–380 (2014)
Transportation
1 3
Susilo, Y.O., Cats, O., Diana, M., Hrin, G.R., Woodcock, A.: Implementing a behavioural pilot survey for the stage-based study of the whole journey traveller experience. Transp. Res. Procedia 11, 172–184 (2015)
Susilo, Y.O., Lyons, G., Jain, J., Atkins, S.: Great Britain rail passengers’ time use and journey satisfaction: 2010 findings with multivariate analysis. The 91st Transportation Research Board Annual Meeting, Washington, DC (2012)
Suzuki, H., Fujii, S., Gärling, T., Ettema, D., Olsson, L.E., Friman, M.: Rules for aggregated satisfaction with work commutes. Transportation 41, 495–506 (2014)
Tully, S., Meyvis, T.: Questioning the end effect: endings are not inherently over-weighted in retrospective evaluations of experiences. J. Exp. Psychol. Gen. 145, 630–642 (2016)
Tyrinopoulos, Y., Antoniou, C.: Public transit user satisfaction: variability and policy implications. Transp. Policy 15(4), 260–272 (2008)
Van Lierop, D., El-Geneidy, A.: Enjoying loyalty: the relationship between service quality, customer satis-faction, and behavioral intentions in public transit. Res. Transp. Econ. Compet. Ownersh. Land Pas-seng. Transp. 59, 50–59 (2016)
Van’t Hart, J.: Increasing customer satisfaction with public transport. Master Thesis, TU Delft (2012). http://www.ovkla ntenb arome ter.nl/Porta ls/0/Maste r%20the sis%20Inc reasi ng%20cus tomer %20sat isfac tion%20wit h%20pub lic%20tra nspor t%20Jor rit%20van %20’t%20Har t%20(300%20dpi )%20(1)%20e-book.pdf. Accessed 6 Feb 2017
Varey, C., Kahneman, D.: Experiences extended across time: evaluation of moments and episodes. J. Behav. Decis. Mak. 5, 169–185 (1992)
van der Waard, J.: The relative importance of public transport trip-time attributes in route choice: paper prepared for the PTRC Summer Annual Meeting 1988, Bath, England. Delft University of Technology, Faculty of Civil Engineering, Department of Transportation Planning & Highway Engineering, Delft (1988)
Woldeamanuel, M.G., Cygansky R.: Factors affecting traveler’s satisfaction with accessibility to public transportation. In: European Transport Conference, Glasgow (2011)
Yoh, A., Iseki, H., Smart, M., Taylor, B.D.: Hate to Wait Effects of Wait Time on Public Transit Travelers’ Perceptions. Transp. Res. Rec. 2216, 116–124 (2012)
Roberto F. Abenoza is a Phd student at the Royal Institute of Technology, Stockholm, Sweden. His research interests include perceived quality of the Public Transport service, door-to-door trips, safety per-ceptions and transport for women-only.
Oded Cats is an Assistant Professor at Delft University of Technology, the Netherlands, and a Guest Researcher at the Royal Institute of Technology, Stockholm, Sweden. His research interests include public transport planning, policy and operations, travel behaviour, and transport network modelling.
Yusak O. Susilo is a Full Professor at the Royal Institute of Technology, Stockholm, Sweden. His research interest is in travel behaviour, activity-based analysis, land use and transport, and transportation in develop-ing countries.