How does angular resolution affect diffusion imaging measures?
15
How does angular resolution affect diffusion imaging measures? Liang Zhan a , Alex D. Leow a , Neda Jahanshad a , Ming-Chang Chiang a , Marina Barysheva a , Agatha D. Lee a , Arthur W. Toga a , Katie L. McMahon b , Greig I. de Zubicaray b , Margaret J. Wright c , Paul M. Thompson a, ⁎ a Laboratory of Neuro Imaging, Department of Neurology, UCLA School of Medicine, 635 Charles E. Young Drive South, Suite 225E, Los Angeles, CA 90095-7332, USA b University of Queensland Center for Magnetic Resonance, Brisbane, Australia c Genetic Epidemiology Laboratory, Queensland Institute of Medical Research, Brisbane, Australia abstract article info Article history: Received 5 June 2009 Revised 24 August 2009 Accepted 24 September 2009 Available online xxxx Keywords: High-angular resolution diffusion imaging Anisotropy Generalized fractional anisotropy Tensor Signal-to-noise ratio Kullback-Leibler divergence A key question in diffusion imaging is how many diffusion-weighted images suffice to provide adequate signal-to-noise ratio (SNR) for studies of fiber integrity. Motion, physiological effects, and scan duration all affect the achievable SNR in real brain images, making theoretical studies and simulations only partially useful. We therefore scanned 50 healthy adults with 105-gradient high-angular resolution diffusion imaging (HARDI) at 4T. From gradient image subsets of varying size (6 ≤ N ≤ 94) that optimized a spherical angular distribution energy, we created SNR plots (versus gradient numbers) for seven common diffusion anisotropy indices: fractional and relative anisotropy (FA, RA), mean diffusivity (MD), volume ratio (VR), geodesic anisotropy (GA), its hyperbolic tangent (tGA), and generalized fractional anisotropy (GFA). SNR, defined in a region of interest in the corpus callosum, was near-maximal with 58, 66, and 62 gradients for MD, FA, and RA, respectively, and with about 55 gradients for GA and tGA. For VR and GFA, SNR increased rapidly with more gradients. SNR was optimized when the ratio of diffusion-sensitized to non-sensitized images was 9.13 for GA and tGA, 10.57 for FA, 9.17 for RA, and 26 for MD and VR. In orientation density functions modeling the HARDI signal as a continuous mixture of tensors, the diffusion profile reconstruction accuracy rose rapidly with additional gradients. These plots may help in making trade-off decisions when designing diffusion imaging protocols. © 2009 Elsevier Inc. All rights reserved. Introduction A common question in diffusion imaging is how many gradient images should be collected to provide adequate signal-to-noise ratio (SNR) for studies of fiber integrity in the brain. To maximize the information collected, several research groups have proposed high- angular resolution diffusion imaging (HARDI)—a powerful extension of MRI—that applies diffusion-sensitized gradients to the brain in a large number of directions (Tuch, 2004). Diffusion-weighted images are collected by applying a magnetic field gradient in a specific orientation to quantify water diffusion in that direction. By studying anisotropy (directional dependency) in these diffusion profiles, one can gain exquisite insight into local fiber orientation and integrity in living tissues such as the brain and heart. Most early diffusion anisotropy studies used the diffusion tensor model (Basser and Pierpaoli, 1996), which describes the anisotropy of water diffusion in tissues by estimating the 3 × 3 covariance matrix of a Gaussian distribution from a set of K diffusion-sensitized images. Each voxel's signal intensity in the k-th image is decreased by water diffusion according to the Stejskal-Tanner equation (Stejskal and Tanner, 1965): S k =S 0 exp [-bg k T D g k ], where S 0 is the non-diffusion- weighted signal intensity, D is the 3 × 3 diffusion tensor, g k is the direction of the applied diffusion gradient, and b is the instrumental scaling factor containing information on the pulse sequence, gradient strength, and physical constants (LeBihan 1990a,b). Seven gradients (6 diffusion-sensitized gradients and one diffusion non-sensitized gradient) are mathematically sufficient to determine the diffusion tensor, but MRI protocols with higher angular and radial resolution (e.g. HARDI) are commonly used to resolve more complex diffusion geometries that a single tensor fails to model, e.g., fiber crossings and intermixing of tracts. The greater angular resolution is useful when examining fiber trajectories using tractography (Lenglet et al., 2008). Routine clinical studies of fiber integrity may also benefit from HARDI, as DTI-derived measures of anisotropy are biased (too low) in the ∼40% of white matter voxels where more than one dominant fiber direction is detectable (Zhan et al., 2009; Leow et al., 2009). Recent technical advances have made HARDI more practical. A 14 min scan can typically sample over 100 angles (with 2 mm voxels at 4 T). HARDI's improved signal-to-noise ratio can be used to infer fiber pathways in the brain, identifying anatomical features, connections, and disease biomarkers not seen with conventional MRI. If more angular detail is available, fiber orientation distribution functions (ODFs) may be reconstructed from the raw HARDI signal using several alternative methods: q-ball reconstruction based on NeuroImage xxx (2009) xxx–xxx ⁎ Corresponding author. Fax: +1 310 206 5518. E-mail address: [email protected] (P.M. Thompson). YNIMG-06606; No. of pages: 15; 4C: 6, 7, 12 1053-8119/$ – see front matter © 2009 Elsevier Inc. All rights reserved. doi:10.1016/j.neuroimage.2009.09.057 Contents lists available at ScienceDirect NeuroImage journal homepage: www.elsevier.com/locate/ynimg ARTICLE IN PRESS Please cite this article as: Zhan, L., et al., How does angular resolution affect diffusion imaging measures?, NeuroImage (2009), doi:10.1016/j. neuroimage.2009.09.057
Transcript of How does angular resolution affect diffusion imaging measures?

NeuroImage xxx (2009) xxx–xxx
YNIMG-06606; No. of pages: 15; 4C: 6, 7, 12
Contents lists available at ScienceDirect
NeuroImage
j ourna l homepage: www.e lsev ie r.com/ locate /yn img
ARTICLE IN PRESS
How does angular resolution affect diffusion imaging measures?
Liang Zhan a, Alex D. Leow a, Neda Jahanshad a, Ming-Chang Chiang a, Marina Barysheva a, Agatha D. Lee a,Arthur W. Toga a, Katie L. McMahon b, Greig I. de Zubicaray b, Margaret J. Wright c, Paul M. Thompson a,⁎a Laboratory of Neuro Imaging, Department of Neurology, UCLA School of Medicine, 635 Charles E. Young Drive South, Suite 225E, Los Angeles, CA 90095-7332, USAb University of Queensland Center for Magnetic Resonance, Brisbane, Australiac Genetic Epidemiology Laboratory, Queensland Institute of Medical Research, Brisbane, Australia
⁎ Corresponding author. Fax: +1 310 206 5518.E-mail address: [email protected] (P.M. Thom
1053-8119/$ – see front matter © 2009 Elsevier Inc. Adoi:10.1016/j.neuroimage.2009.09.057
Please cite this article as: Zhan, L., et al., Howneuroimage.2009.09.057
a b s t r a c t
a r t i c l e i n f oArticle history:Received 5 June 2009Revised 24 August 2009Accepted 24 September 2009Available online xxxx
Keywords:High-angular resolution diffusion imagingAnisotropyGeneralized fractional anisotropyTensorSignal-to-noise ratioKullback-Leibler divergence
A key question in diffusion imaging is how many diffusion-weighted images suffice to provide adequatesignal-to-noise ratio (SNR) for studies of fiber integrity. Motion, physiological effects, and scan duration allaffect the achievable SNR in real brain images, making theoretical studies and simulations only partiallyuseful. We therefore scanned 50 healthy adults with 105-gradient high-angular resolution diffusion imaging(HARDI) at 4T. From gradient image subsets of varying size (6≤N≤94) that optimized a spherical angulardistribution energy, we created SNR plots (versus gradient numbers) for seven common diffusion anisotropyindices: fractional and relative anisotropy (FA, RA), mean diffusivity (MD), volume ratio (VR), geodesicanisotropy (GA), its hyperbolic tangent (tGA), and generalized fractional anisotropy (GFA). SNR, defined in aregion of interest in the corpus callosum, was near-maximal with 58, 66, and 62 gradients for MD, FA, andRA, respectively, and with about 55 gradients for GA and tGA. For VR and GFA, SNR increased rapidly withmore gradients. SNR was optimized when the ratio of diffusion-sensitized to non-sensitized images was 9.13for GA and tGA, 10.57 for FA, 9.17 for RA, and 26 for MD and VR. In orientation density functions modelingthe HARDI signal as a continuous mixture of tensors, the diffusion profile reconstruction accuracy roserapidly with additional gradients. These plots may help in making trade-off decisions when designingdiffusion imaging protocols.
© 2009 Elsevier Inc. All rights reserved.
Introduction
A common question in diffusion imaging is how many gradientimages should be collected to provide adequate signal-to-noise ratio(SNR) for studies of fiber integrity in the brain. To maximize theinformation collected, several research groups have proposed high-angular resolution diffusion imaging (HARDI)—a powerful extensionof MRI—that applies diffusion-sensitized gradients to the brain in alarge number of directions (Tuch, 2004). Diffusion-weighted imagesare collected by applying a magnetic field gradient in a specificorientation to quantify water diffusion in that direction. By studyinganisotropy (directional dependency) in these diffusion profiles, onecan gain exquisite insight into local fiber orientation and integrity inliving tissues such as the brain and heart. Most early diffusionanisotropy studies used the diffusion tensor model (Basser andPierpaoli, 1996), which describes the anisotropy of water diffusion intissues by estimating the 3×3 covariance matrix of a Gaussiandistribution from a set of K diffusion-sensitized images. Each voxel'ssignal intensity in the k-th image is decreased by water diffusionaccording to the Stejskal-Tanner equation (Stejskal and Tanner,
pson).
ll rights reserved.
does angular resolution affe
1965): Sk=S0 exp [-bgkT D gk], where S0 is the non-diffusion-weighted signal intensity, D is the 3×3 diffusion tensor, gk is thedirection of the applied diffusion gradient, and b is the instrumentalscaling factor containing information on the pulse sequence, gradientstrength, and physical constants (LeBihan 1990a,b). Seven gradients(6 diffusion-sensitized gradients and one diffusion non-sensitizedgradient) are mathematically sufficient to determine the diffusiontensor, but MRI protocols with higher angular and radial resolution(e.g. HARDI) are commonly used to resolve more complex diffusiongeometries that a single tensor fails to model, e.g., fiber crossings andintermixing of tracts. The greater angular resolution is useful whenexamining fiber trajectories using tractography (Lenglet et al., 2008).Routine clinical studies of fiber integrity may also benefit fromHARDI,as DTI-derived measures of anisotropy are biased (too low) in the∼40% of white matter voxels where more than one dominant fiberdirection is detectable (Zhan et al., 2009; Leow et al., 2009).
Recent technical advances have made HARDI more practical. A14 min scan can typically sample over 100 angles (with 2 mm voxelsat 4 T). HARDI's improved signal-to-noise ratio can be used to inferfiber pathways in the brain, identifying anatomical features,connections, and disease biomarkers not seen with conventionalMRI. If more angular detail is available, fiber orientation distributionfunctions (ODFs) may be reconstructed from the raw HARDI signalusing several alternative methods: q-ball reconstruction based on
ct diffusion imaging measures?, NeuroImage (2009), doi:10.1016/j.

2 L. Zhan et al. / NeuroImage xxx (2009) xxx–xxx
ARTICLE IN PRESS
the Funk-Radon transform (Tuch 2004; Hess et al., 2006), thePersistent Angular Structure technique and Maximum EntropySpherical Deconvolution (MESD) (Jansons and Alexander, 2003;Anderson, 2005), the DOT transform (Özarslan et al., 2006),deconvolution-based techniques (Tournier et al., 2004; Alexander,2005; Kaden et al., 2007), or by fitting continuous mixtures of tensors(Leow et al., 2009; Jian and Vemuri, 2007). Recent work on stochastictractography (Pichon et al., 2005; Jbabdi et al., 2007) has exploited theincreased angular detail in HARDI, and fluid registrationmethods havebeen designed to align HARDI ODFs using specialized Riemannianmetrics, such as the Fisher-Rao metric, to quantify the discrepancybetween density functions (Chiang et al., 2008).
The question “how many gradients are sufficient for diffusionimaging” has been studied theoretically and using computer-simulated models of signals. Papadakis et al. (2000) analyzed theperformance of various DT-MRI angular sampling schemes in terms ofthe variance of different anisotropy measurements, and concludedthat the minimum number of unique encoding directions N(bx)required for robust anisotropy estimation was around 18–21. Even so,Hasan et al. (2001) found that more than 6 sampling orientationsprovided little added benefit when computing tensor-derivedmeasures, so long as the selected orientations were optimized topoint to the vertices of an icosahedron. These findings received latersupport from the work of Batchelor (2002) but were challenged byJones (2004). Jones found, in his simulation experiments, that at least20 unique sampling orientations are necessary to estimate anisotropyrobustly, and at least 30 unique sampling orientations are required toestimate tensor orientation and ADC robustly.
These guidelines are useful and highly cited, but many priorstudies have been based on theoretical models or simulations of signaland noise, and may not reflect the achievable SNR in real humansubjects. Initial studies by Landman et al. (2007a,b) and Farrell et al.(2007) have begun to examine FA, MD, and principal eigenvector(PEV) accuracy, precision, and reproducibility in real human data at1.5T, by scanning a single subject with many alternative protocols(see Discussion for details). Here we extend these analyses to study aDTI protocol with more directions (94 rather than 30) and also inmore subjects (50 rather than 1, although the one subject studied byLandman et al., 2007a,b, and Farrell et al., 2007, was scanned usingmany protocols). In addition, we report SNR analysis for a HARDI-typeindex, GFA. GFA is derived from the full set of diffusion gradients anddoes not rely on fitting a diffusion tensor model to the signals. We alsostudied the recently introduced metric of geodesic anisotropy. Ourstudy is the first, to our knowledge, to study DTI SNR at 4T, as priorstudies were conducted at 1.5T (Landman et al., 2007a,b; Farrell et al.,2007). A very recent study of DTI SNR in 13 subjects (Zhu et al., 2009;also at 1.5T) appeared since this paper was submitted, and we nowsummarize that paper in the Discussion.
In real brain images, the achievable SNR is affected by motion,susceptibility-related distortions, physiological effects on the MRsignal, and even scan duration. With these additional sources of error,the achievable SNRmay asymptote more quickly than predicted, withrespect to the gradient numbers, andmay even depend on the subject.As such, a population-based study scanning a reasonably largenumber of subjects (here N=50) can help to assess whether realdata follow theoretical predictions, whether SNR profiles depend onthe subject scanned, and whether some DTI-derived measures aremore robust than others when there is only enough time to collectlimited numbers of gradients. Prior simulation studies focused on afew standard DTI-derived measures (FA, ADC, MD, and the principaleigenvector direction, PEV; Landman et al., 2007a,b; Farrell et al.,2007). Here we also examined several other popular tensor-derivedparameters, including RA, VR, GA, and tGA, which have beensomewhat widely used in clinical studies, and generalized fractionalanisotropy (GFA). GFA is computed from the full gradient set (withoutfitting a tensor) and has been advocated as one possible HARDI analog
Please cite this article as: Zhan, L., et al., How does angular resolution affneuroimage.2009.09.057
of DTI-derived FA. We also assessed the optimal ratio of diffusion-sensitized to non-sensitized images, N(bx)/N(b0), to maximize SNR.Finally, to support our premise that the higher SNR protocols are alsomore accurate, we illustrated how the reconstruction accuracy of thediffusion orientation density function (ODF) depends on the appliedgradient set.
Although the optimal trade-off between SNR and scan timedepends on the time available and the need for angular precision,our goal was to provide useful graphical plots suggesting how todetermine optimal gradient numbers for tensor-derived diffusionindices including mean diffusivity (MD), fractional anisotropy (FA),relative anisotropy (RA), volume ratio (VR), hyperbolic tangent ofgeodesic anisotropy (tGA), as well as the generalized fractionalanisotropy (GFA) derived from the ODF.
Materials and methods
Subject description and image acquisition
Three-dimensional structural brain MRI scans and diffusion-weighted scans were acquired from 50 healthy adult participants(mean age: 22.6 years, S.D.: 2.1, 25 men/25 women) on a 4T BrukerMedspec MRI scanner using an optimized diffusion tensor sequence(Zhan et al., 2009a, in press). None of the subjects reported a historyof significant head injury, a neurological or psychiatric illness,substance abuse or dependence, or had a first-degree relative witha psychiatric disorder. In addition, all subjects were screened, using adetailed neurocognitive evaluation (see de Zubicaray et al., 2008 foran overview), to exclude cases of pathology known to affect brainstructure.
Imaging parameters were TE/TR 92.3/8250 ms, 55×2 mmcontiguous slices, and FOV=23 cm. One hundred and five gradientimages were collected: 11 baseline (b0) images with no diffusionsensitization (i.e., T2-weighted images) and 94 diffusion-weightedimages (b-value: 1159 s/mm2) in which gradient directions wereevenly distributed on the hemisphere (Jones et al., 1999). Thereconstruction matrix was 128×128, yielding a 1.8×1.8 mm2 in-plane resolution. Total scan time was 14.5 min.
Sampling subsets of the gradient set
Since each gradient image is applied in a direction that may berepresented as one point i (1≤ i≤94) on the surface of the unit sphere(Fig. 1a), the optimality of a gradient direction set is typically definedusing PDEs based on electrostatic repulsion, or angular distributionenergy (see Hasan et al., 2001, for an excellent review). Theparameterized normalized analytical set encoding gradient directions[gx, gy, gz] may be written as in Eq. (1) (Wong and Roos, 1994)
gz nð Þ = 2n − Ne − 1Ne
gx = cos gzffiffiffiffiffiffiffiffiffiNeπ
p� � ffiffiffiffiffiffiffiffiffiffiffiffiffiffiffi1− g2z
qgy =
ffiffiffiffiffiffiffiffiffiffiffiffiffiffiffiffiffiffiffiffiffiffiffiffiffiffiffi1− g2z − g2x
qN = 1;2;:::;NEð Þ
8>>>>>><>>>>>>:
ð1Þ
In each of these encoding directions, the diffusion-sensitizedmagnetic field gradient is applied. If the number of diffusion-sensitized gradients is large enough, the placement of points shouldbe spaced nearly uniformly on the sphere. To evaluate the effect ofvarying the number of diffusion-sensitized gradients, N(bx), a seriesof subsets, of size 6≤N≤94, were chosen from among the original 94diffusion-sensitized gradients, to maximize the total angular distri-bution energy. The angular distribution energy, Eij, of a pair of points, iand j, on the unit sphere may be defined as the inverse of the sum ofthe squares of (1) the least spherical distance between point i and
ect diffusion imaging measures?, NeuroImage (2009), doi:10.1016/j.
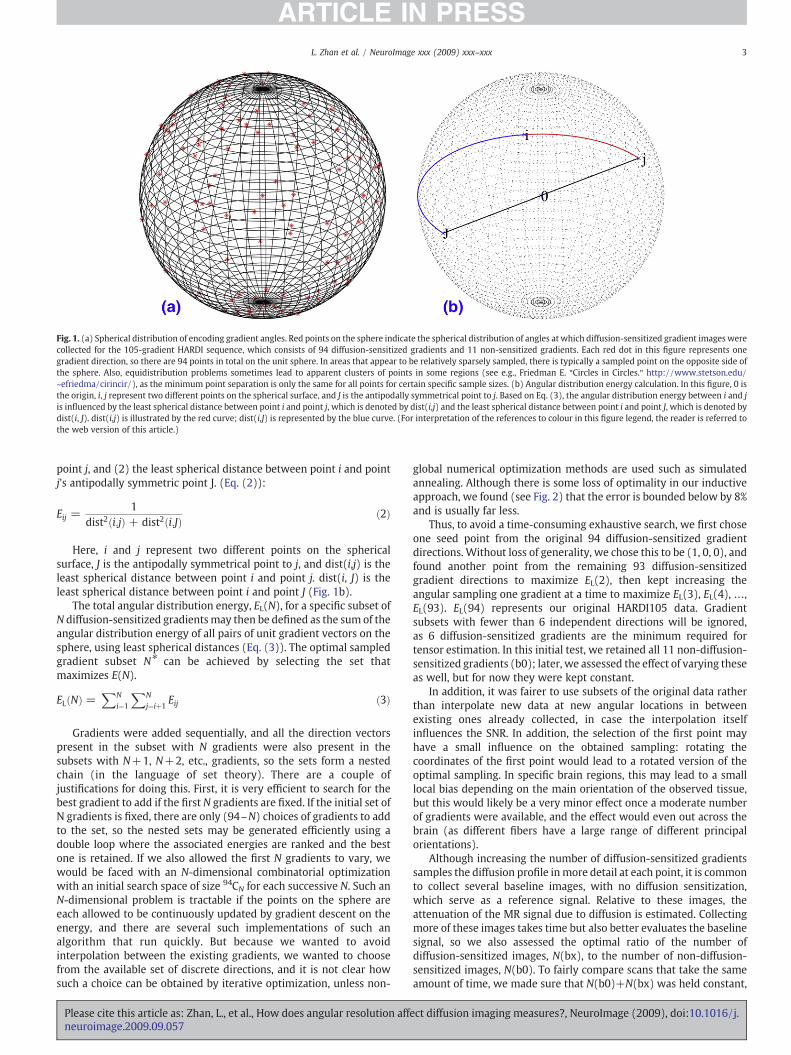
Fig. 1. (a) Spherical distribution of encoding gradient angles. Red points on the sphere indicate the spherical distribution of angles at which diffusion-sensitized gradient images werecollected for the 105-gradient HARDI sequence, which consists of 94 diffusion-sensitized gradients and 11 non-sensitized gradients. Each red dot in this figure represents onegradient direction, so there are 94 points in total on the unit sphere. In areas that appear to be relatively sparsely sampled, there is typically a sampled point on the opposite side ofthe sphere. Also, equidistribution problems sometimes lead to apparent clusters of points in some regions (see e.g., Friedman E. qCircles in Circles.q http://www.stetson.edu/~efriedma/cirincir/), as the minimum point separation is only the same for all points for certain specific sample sizes. (b) Angular distribution energy calculation. In this figure, 0 isthe origin, i, j represent two different points on the spherical surface, and J is the antipodally symmetrical point to j. Based on Eq. (3), the angular distribution energy between i and jis influenced by the least spherical distance between point i and point j, which is denoted by dist(i,j) and the least spherical distance between point i and point J, which is denoted bydist(i, J). dist(i,j) is illustrated by the red curve; dist(i,J) is represented by the blue curve. (For interpretation of the references to colour in this figure legend, the reader is referred tothe web version of this article.)
3L. Zhan et al. / NeuroImage xxx (2009) xxx–xxx
ARTICLE IN PRESS
point j, and (2) the least spherical distance between point i and pointj's antipodally symmetric point J. (Eq. (2)):
Eij =1
dist2 i;jð Þ + dist2 i;Jð Þ ð2Þ
Here, i and j represent two different points on the sphericalsurface, J is the antipodally symmetrical point to j, and dist(i,j) is theleast spherical distance between point i and point j. dist(i, J) is theleast spherical distance between point i and point J (Fig. 1b).
The total angular distribution energy, EL(N), for a specific subset ofN diffusion-sensitized gradientsmay then be defined as the sum of theangular distribution energy of all pairs of unit gradient vectors on thesphere, using least spherical distances (Eq. (3)). The optimal sampledgradient subset N⁎ can be achieved by selecting the set thatmaximizes E(N).
EL Nð Þ =XN
i¼1
XNj¼iþ1
Eij ð3Þ
Gradients were added sequentially, and all the direction vectorspresent in the subset with N gradients were also present in thesubsets with N+1, N+2, etc., gradients, so the sets form a nestedchain (in the language of set theory). There are a couple ofjustifications for doing this. First, it is very efficient to search for thebest gradient to add if the first N gradients are fixed. If the initial set ofN gradients is fixed, there are only (94–N) choices of gradients to addto the set, so the nested sets may be generated efficiently using adouble loop where the associated energies are ranked and the bestone is retained. If we also allowed the first N gradients to vary, wewould be faced with an N-dimensional combinatorial optimizationwith an initial search space of size 94CN for each successive N. Such anN-dimensional problem is tractable if the points on the sphere areeach allowed to be continuously updated by gradient descent on theenergy, and there are several such implementations of such analgorithm that run quickly. But because we wanted to avoidinterpolation between the existing gradients, we wanted to choosefrom the available set of discrete directions, and it is not clear howsuch a choice can be obtained by iterative optimization, unless non-
Please cite this article as: Zhan, L., et al., How does angular resolution affeneuroimage.2009.09.057
global numerical optimization methods are used such as simulatedannealing. Although there is some loss of optimality in our inductiveapproach, we found (see Fig. 2) that the error is bounded below by 8%and is usually far less.
Thus, to avoid a time-consuming exhaustive search, we first choseone seed point from the original 94 diffusion-sensitized gradientdirections. Without loss of generality, we chose this to be (1, 0, 0), andfound another point from the remaining 93 diffusion-sensitizedgradient directions to maximize EL(2), then kept increasing theangular sampling one gradient at a time to maximize EL(3), EL(4), …,EL(93). EL(94) represents our original HARDI105 data. Gradientsubsets with fewer than 6 independent directions will be ignored,as 6 diffusion-sensitized gradients are the minimum required fortensor estimation. In this initial test, we retained all 11 non-diffusion-sensitized gradients (b0); later, we assessed the effect of varying theseas well, but for now they were kept constant.
In addition, it was fairer to use subsets of the original data ratherthan interpolate new data at new angular locations in betweenexisting ones already collected, in case the interpolation itselfinfluences the SNR. In addition, the selection of the first point mayhave a small influence on the obtained sampling: rotating thecoordinates of the first point would lead to a rotated version of theoptimal sampling. In specific brain regions, this may lead to a smalllocal bias depending on the main orientation of the observed tissue,but this would likely be a very minor effect once a moderate numberof gradients were available, and the effect would even out across thebrain (as different fibers have a large range of different principalorientations).
Although increasing the number of diffusion-sensitized gradientssamples the diffusion profile inmore detail at each point, it is commonto collect several baseline images, with no diffusion sensitization,which serve as a reference signal. Relative to these images, theattenuation of the MR signal due to diffusion is estimated. Collectingmore of these images takes time but also better evaluates the baselinesignal, so we also assessed the optimal ratio of the number ofdiffusion-sensitized images, N(bx), to the number of non-diffusion-sensitized images, N(b0). To fairly compare scans that take the sameamount of time, we made sure that N(b0)+N(bx) was held constant,
ct diffusion imaging measures?, NeuroImage (2009), doi:10.1016/j.

Fig. 2. Evaluation of subsampled subsets from original gradient sets. (a) Total angular distribution energy EL(N) vs.N(bx). (b) Ratio of angular distribution energy calculated from ourmethod to the theoretically optimal energy achievable using the optimized method in Eq. (1).
4 L. Zhan et al. / NeuroImage xxx (2009) xxx–xxx
ARTICLE IN PRESS
and this constant was set to 21, 41, 61, and 81, in our experiments. Byvarying N(b0) from 1 to 11, we were able to associate each baselineset of images with a corresponding optimized subset of N(bx)=N−N(b0) diffusion-sensitized images, based on maximizing the totalangular distribution energy, EL(N(bx)).
Calculation of diffusion anisotropy indices
For each gradient subset, a diffusion tensor was fitted to the rawdiffusion-weighted data at each voxel. The diffusion tensor wasestimated usingMedINRIA, which is a DTI analysis programdevelopedby the INRIA research project Asclepios (http://www-sop.inria.fr/asclepios/software/MedINRIA) (Pennec et al., 2004). Based on theestimated tensors, several commonlyused scalarmeasures of diffusionanisotropy were computed from the tensors' eigenvalues (λ1, λ2, λ3),including fractional nisotropy (FA), relative anisotropy (RA), meandiffusivity (MD), volume ratio (VR), geodesic anisotropy (GA), and itshyperbolic tangent (tGA; it is common to apply this transform to GA sothat the transformed values have the same ranges as the morecommonly used measures, i.e., 0 to 1 for FA). All these scalarparameters were defined using the formulae listed in Table 1.
Orientation distribution functions (ODF) for water diffusion werealso computed voxelwise from the HARDI signals using the Funk-
Table 1Definition of diffusion-related parameters derived from the diffusion tensor and its eigenva
Parameter
Fractional anisotropy
Mean diffusivity
Relative anisotropy
Volume ratio
Geodesic anisotropy
Hyperbolic tangent ofgeodesic anisotropy
λ̂
Generalized fractional anisotropya
a Here, ui, 1≤i≤n, are n gradient directions, and bΨN is the mean of the ODF with respec
Please cite this article as: Zhan, L., et al., How does angular resolution affneuroimage.2009.09.057
Radon transform (FRT) (Tuch, 2004). We used Descoteaux's method(2007), which first expands the HARDI signals as a sphericalharmonic (SH) series, simplifying the FRT to a linear matrix operationon the coefficients. To estimate the SH coefficients, we set the orderof the SH series to 6. A generalized fractional anisotropy (GFA) map(Tuch, 2004) was constructed from the ODF (the formula is given inTable 1).
Estimating signal-to-noise for maps of diffusion anisotropy indices
To assess the image SNR in a consistent region of the brain acrossall subjects, we used a region of interest (ROI) approach. As noted inLandman et al. (2007a,b), the SNR for in vivo studies varies spatially,due to differences in coil sensitivity, and is tissue-dependent(depending on tissue T1, T2, and PD). To define a region that wouldbe consistent with past studies (e.g., Landman et al., 2007a,b) andwould cover a region that is the target of many DTI studies, we chose asmall region of interest in the corpus callosum, the main interhemi-spheric fiber tract. To define the ROI as consistently as possible acrossall 50 subjects, we first registered all 50 subjects' b0 images to acommon image template since these T2-weighted (b0) images arecollected in perfect register with the diffusion tensor data. A singlesubject's T2-weighted scan was randomly selected to serve as the
lues.
Formulae
FA =
ffiffiffiffiffiffiffiffiffiffiffiffiffiffiffiffiffiffiffiffiffiffiffiffiffiffiffiffiffiffiffiffiffiffiffiffiffiffiffiffiffiffiffiffiffiffiffiffiffiffiffiffiffiffiffiffiffiffiffiffiffiffi32 ððλ1 − λ̂Þ2 + ðλ2 − λ̂Þ2 + ðλ3 − λ̂Þ2
λ21 + λ2
2 + λ23
Þr
MD = λ1 + λ2 + λ33
RA =ffiffiffiffiffiffiffiffiffiffiffiffiffiffiffiffiffiffiffiffiffiffiffiffiffiffiffiffiffiffiffiffiffiffiffiffiffiffiffiffiffiffiffiffiffiffiffiffiffiffiffiffiffiffiffiffiffiffiffiffiffiλ1 −λ2ð Þ2 + λ1 −λ3ð Þ2 + λ2 −λ3ð Þ2
2 λ1 + λ2 + λ3ð Þ2
r
VR = λ1λ2λ3
λ̂3
GA =ffiffiffiffiffiffiffiffiffiffiffiffiffiffiffiffiffiffiffiffiffiffiffiffiffiffiffiffiffiffiffiffiffiffiffiffiffiffiffiffiffiffiffiffiffiffiffiffiffiffiffiffiffiffiffiffiffiffiffiffiffiffiffiffiffiffiffiffiffiffiffiffiffiffiffiffiffiffiffiffiffiffiffiffiffiffiffiffiffiffiffiffiffiffiffiffiffiffiffiffiffiffiffiðlog λ1
λ1λ2λ3ð Þ13Þ2 + ðlog λ2
λ1λ2λ3ð Þ13Þ2 + ðlog λ3
λ1λ2λ3ð Þ13Þ2
r
tGA = eGA − e−GA
eGA + e−GA
λ̂= λ1 + λ2 + λ33
GFA =
ffiffiffiffiffiffiffiffiffiffiffiffiffiffiffiffiffiffiffiffiffiffiffiffiffiffiffiffiffiffiffiffiffiffiffiffiffiffiffiffiffinPn
i = 1W uið Þ−bWNð Þ2
n − 1ð ÞPn
i = 1W uið Þ2
� �s
t to spherical angle.
ect diffusion imaging measures?, NeuroImage (2009), doi:10.1016/j.

5L. Zhan et al. / NeuroImage xxx (2009) xxx–xxx
ARTICLE IN PRESS
registration target for all subjects. All other subjects' T2-weighted(b0) images were aligned to this template using the publicly availableFLIRT registration software (http://fsl.fmrib.ox.ac.uk/fsl/flirt), using9-parameter linear registration and a correlation ratio cost function.Once linearly aligned, further registration was performed using a 3DNavier-Stokes-based fluid warping technique enforcing diffeo-morphic mappings, using least-squares intensity differences as acost function (Leporé et al., 2008). Registration parameters, includingthe number of time steps, were optimized for the T2-weightedcontrast images. Transformation matrices from the linear registrationand deformation fields from the fluid registration were retained andwere applied to all subjects' diffusion anisotropy index maps. Afterregistration, a small ROI (10×10×10 mm3) was manually traced inthe middle of the corpus callosum (CC) on the common templateusing the “erosion with a 3D diamond” tool in the BrainSuite softwarepackage (Shattuck and Leahy, 2002), to obtain a small and relativelyhomogeneous region. In this way, the biological variation in diffusionsignals across the brain does not confound the assessment of SNRwithrespect to the number of gradients.
We computed SNR for all diffusion anisotropy indices, for all50 subjects and for all angular sampling schemes EL(6) to EL(94). Assimulation studies indicate that SNR tends to increase with thenumber of diffusion-sensitized gradients, we first plotted SNR againstgradient numbers for all the parameter maps, by using all optimizedgradient subsets. Although other definitions are possible, each map'sSNR was defined as the ratio of the mean voxel value to the standarddeviation of the voxel values in the ROI. We preferred this methodinstead of estimating the noise from a background region of interestbecause it made more sense to estimate the signal and noise from thesame region, and also the eigenvalues estimated from outside thebrain are more likely to be negative, which is not consistent withphysical models of diffusion.
Simulation study
We also assessed ODF reconstruction accuracy for our differentgradient subsets, using a computer simulation to define ground truth.This part of the study was intended to illustrate the effects of angularsampling on the ODF, and to help explain the slightly unexpectedbehavior of SNR versus gradient numbers for the GFA measures,which were derived from the full ODF and not from the single-tensorapproximation.
We created 1000 different models of two-fiber systems, crossingat 90° with equal volume fractions (w1=w2=0.5). Here we choseλ1=10×10−10 m2 s−1 and λ2=2×10⁻¹⁰ m2 s−1 as the eigenva-lues for each individual tensor (FA=0.77, typical for white matter)to generate simulations using discrete mixtures of Gaussiandistributions:
S qð ÞS 0ð Þ =
X2i = 1
wiexp −tqTDiq� �
ð4Þ
Using the gradient subsets mentioned in the Sampling subsets ofthe gradient set section, we subsampled the simulated HARDI datawith 94 values for S(q)/S(0), and the tensor distribution function(TDF)method (Leow et al., 2009) was used to analyze the subsampleddata. The TDF method is essentially a deconvolution method, whichwe recently proposed, that estimates the angular distribution of theunderlying fibers. We denote the space of symmetric positive definitethree-by-three matrices by D ̅. The probabilistic ensemble of tensors,as represented by a tensor distribution function (TDF) P, is defined onthe tensor space that best explains the observed diffusion-weightedimages:
Scalculated qð Þ =ZDaD
P Dð Þexp −tqtDq� �
dD ð5Þ
Please cite this article as: Zhan, L., et al., How does angular resolution affeneuroimage.2009.09.057
To solve for an optimal TDF P⁎, we use the multiple diffusion-sensitized gradient directions qi and arrive at P⁎ using the least-squares principle:
P⁎ = argminp
XiSobs qið Þ−Scalculated qið Þð Þ2 ð6Þ
From the TDF, the orientation density function (ODF) (Descoteauxet al., 2007) may be computed analytically, from Eq. (7):
ODF x ̃� �
= CZDaD
P Dð Þ det Dð Þx ̃tD−1x ̃� �1
2dD ð7Þ
These ODFs were rendered using 642 point samples, determinedusing a seventh-order icosahedral approximation of the unit sphere.To assess how accurately the diffusion profiles could be reconstructedin situations based on different angular sampling schemes, thesymmetrized form of the Kullback-Leibler (KL) divergence, acommonly used measure from information theory, was used tomeasure the discrepancy between the reconstructed and ground truthODFs. Reconstruction error was calculated from Eq. (8), in which p(x)is the ODF derived from the subsampled schemes, and q(x) is theoriginal ODF derived from the ground truth data:
sKL p; qð Þ = 12
ZX
p xð Þlog p xð Þq xð Þ
+ q xð Þlog q xð Þ
p xð Þ � �
dx ð8Þ
Results and discussion
Evaluation of subsampling
In picking sequences with fewer directions than the total numberacquired (94), we were faced with a dilemma: either we would haveto re-scan people with a new energy-optimal direction set for eachlower value of N (too time-consuming), or we would have to find anew energy-optimal direction set and interpolate the data, on thesphere, from the initially acquired directions. As the latter approachwould require some interpolation, and therefore smoothing, whichmight affect the SNR relative to the data initially acquired, we wantedto take a simpler approach that inductively removed or addedgradients in the initial set. As this set was very dense on the sphere,the approximation of the remaining subsets to an energy-optimal setis relatively close, given other considerations. Even so, it is possiblethat the subsampling of gradients from a given set would give somedeviation from the theoretically optimal gradient set, and that theerror might be different for each number selected, and reduced as thenumber increases (see Landman et al., 2007a,b, for a discussion of thiseffect). This is an important consideration, as the SNR gains withincreasing gradient numbers need to be not entirely attributable tothe deviations from optimal sampling. Fig. 2 shows that even forgradient sets with very low numbers of directions (6), the energydeviation between the theoretically optimal and generated subsets isless than 8%, and is only around 3–4% when there are more than 25directions. As such, we acknowledge that suboptimal sampling mayplay a minor role in the SNR gains with respect to gradient numbers.Even so, the gradient sets were verified (in Fig. 2) as being close tooptimal, and as well-distributed as could be achieved withoutacquiring additional gradient sets in new directions.
We note that other subsets of gradients could be selected based onalternative criteria—there are numerical optimization equations(based on variational calculus) for uniformly sampling a sphere,such as Minimum Force (MF), Minimum Energy (ME) (King, 1993),and Minimum Condition Number (MC), and Minimum Total Variance(MV) (Papadakis et al., 1999) (see Hasan, 2000; Hasan et al., 2001, fora review of these). The advantage of our optimizationmethod is firstlythat the angular distribution energy is monotonically increasing as the
ct diffusion imaging measures?, NeuroImage (2009), doi:10.1016/j.
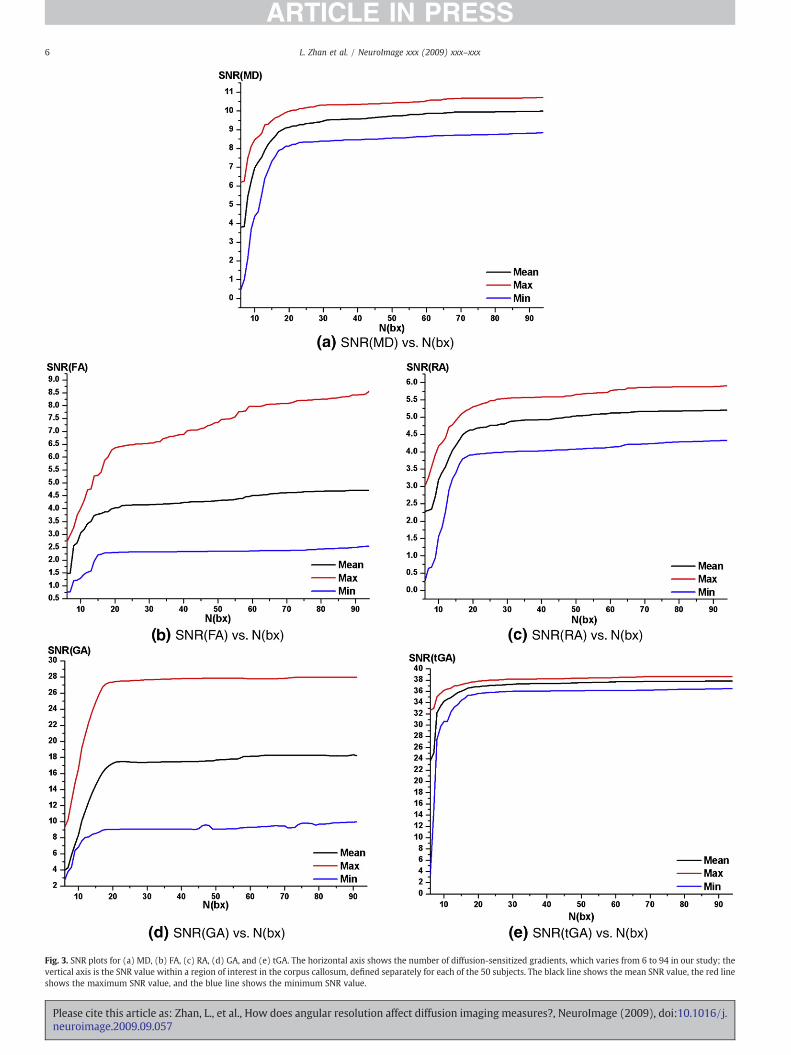
Fig. 3. SNR plots for (a) MD, (b) FA, (c) RA, (d) GA, and (e) tGA. The horizontal axis shows the number of diffusion-sensitized gradients, which varies from 6 to 94 in our study; thevertical axis is the SNR value within a region of interest in the corpus callosum, defined separately for each of the 50 subjects. The black line shows the mean SNR value, the red lineshows the maximum SNR value, and the blue line shows the minimum SNR value.
6 L. Zhan et al. / NeuroImage xxx (2009) xxx–xxx
ARTICLE IN PRESS
Please cite this article as: Zhan, L., et al., How does angular resolution affect diffusion imaging measures?, NeuroImage (2009), doi:10.1016/j.neuroimage.2009.09.057

Table 2Number of gradients needed for SNR to saturate, for MD, FA, RA, GA, and tGA.
Anisotropy index MD FA RA GA tGA
Saturation number 58 66 62 56 55
A moderate number of diffusion-sensitized gradients (58–66) is needed for MD and FAto come within 1% of the maximal SNR obtained in this study. The geodesic anisotropy(GA), and its hyperbolic tangent (tGA), reach 99% of their maximal SNR when around55 diffusion-sensitized gradients are used. This may be because GA can use informationon the full fitted tensor, but FA relies on estimates of the eigenvalues only, which maybe relatively noisy. In these estimates, the 11 baseline gradients are not included.
7L. Zhan et al. / NeuroImage xxx (2009) xxx–xxx
ARTICLE IN PRESS
number of angular sampling points increases (Fig. 2a). In addition, byincluding antipodally opposite points, we consider the distribution ofthe directions on the sphere rather than in just one hemisphere. Thus,our optimization method may be regarded as related to the MinimumEnergy (ME) method (Hasan, 2000). Also, to evaluate the associatederrors for each subset generated from our optimization criteria, weplotted the total angular distribution energy for our inductivelygenerated subsets (denoted by EL(N)) versus the total angulardistribution energy for the corresponding optimal subsets (denotedby Eo(N)) calculated from Eq. (1). The ratio of EL(N) to Eo(N) is plottedin Fig. 2b. From Fig. 2b, we can see that the error associated with ourgenerated subsets relative to the theoretically optimal sampling is lessthan 8% even when gradient numbers are very small, and is less thanaround 3–4% when there are more than 25 directions.
SNR gains with increasing numbers of diffusion-sensitized images
In Fig. 3, SNR curves are shown for MD, FA, RA, GA, and tGA, as thenumber of diffusion-sensitized gradients, N(bx), increases from 6 to94. For these experiments, the number of diffusion-sensitized images,N(b0), was held constant at 11 (this assumption is relaxed later).These plots may also be interpreted as plots of SNR versus acquisitiontime, as the scan time is proportional to the number of gradients,taking 14.5 min on our system for the full set of 105. In the plots, themean SNR across all 50 subjects is shown, as is the SNR plot for thesubject with the least SNR (blue curve) and for the subject with thehighest SNR (red curve). SNR curves for the individuals resembledthose for the population mean. As expected, there was a clear
Fig. 4. SNR plots for (a) VR and (b) GFA. The vertical axis shows the SNR value, and the horizon94 for VR, and from 28 to 94 for GFA. This is because GFA was calculated from a spherical harmrequired to fit this series, the total number of diffusion-sensitized gradients should be no lat N(bx)=28. The black line shows the mean SNR value, the red line shows the maxim
Please cite this article as: Zhan, L., et al., How does angular resolution affeneuroimage.2009.09.057
tendency for the SNR for all these five parameters to become saturatedwhen the number of diffusion-sensitized gradients reached aparticular level. Later, we define SNR convergence statistically, butfor now we consider a simple measure of convergence, defined as thesmallest number of gradients for which SNR comes within 1% of itsmaximal value. Table 2 shows this saturation number for each of theseDTI-derived parameters.
As expected, SNR plots all rise initially as additional gradientscollect more information for fitting the diffusion tensor. Rician noisein the gradient images leads to noisy estimates of the 3 tensoreigenvalues. SNR plots and saturation numbers differ for each DTI-derived parameter. This is because arithmetical operations on theeigenvalues such as addition and subtraction can cancel noise to someextent, whereas multiplication and division of eigenvalues tend toboost the noise level, and different types of arithmetic operations areused to calculate each DTI-derived parameter.
The saturation number was 58 for MD which is defined as theaverage of the 3 eigenvalues, whereas the FA and RA, which aredefined as multiplication and division of tensor eigenvalues, bothsaturate only with higher numbers of gradients (66 and 62,respectively). Moreover, the GA (and its transform, tGA), which arecalculated from logarithm and/or exponentiation on the tensoreigenvalues, both saturate with fewer gradients (55/56). Even so, thehyperbolic tangent transformation can enhance SNR because, ingeneral, mean SNR(tGA)Nmean SNR(GA) (see Figs. 3d and e). Thissupports the promise of tGA for clinical studies; our prior statisticalmaps comparing tGA with FA in a group of 90 twin subjects (Lee etal., 2008) found that tGA can provide slightly higher effect sizes thanFA, perhaps because it accounts for the tensor manifold structurewhen computing differences and similarities between tensors.
Slower convergence for VR and GFA
Fig. 4 shows the 50 subjects' gains in SNR versus the number ofdiffusion-sensitized gradients for 2 additional measures of diffusionanisotropy: VR and GFA. The general tendency of mean SNR for thesetwo parameters is to monotonically increase with the number ofdiffusion-sensitized gradients. SNR should eventually converge as theadded value of new gradients diminishes, but convergence has not yetoccurred even with 94 gradients—the highest angular sampling
tal axis shows the number of diffusion-sensitized gradients, which varies here from 6 toonic (SH) series expansion of order 6, so based on the number of independent samples
ess than (order+1)(order+2)/2, which is 28 in our study. The SNR(GFA) plot startsum SNR value, and the blue line shows the minimum SNR value.
ct diffusion imaging measures?, NeuroImage (2009), doi:10.1016/j.

8 L. Zhan et al. / NeuroImage xxx (2009) xxx–xxx
ARTICLE IN PRESS
examined here—and there are gradual increases in SNR over the entirerange. VR is computed from the eigenvalues of the fitted tensor, so itshould eventually converge as N(bx) increases, but the numberrequired to reach this plateau may be larger than 94. As seen in theformulae in Table 1, VR is expected to be noisier since it involvesproducts of the 3 eigenvalues. Products of noisy variables tend toboost noise while the operations of addition and averaging tend toreduce it, and this can be confirmed from the curve of SNR(VR), whichis more erratic than other SNR plots. In general, our empirical findingsare in line with theoretical predictions from error propagationanalysis, in which measures that rely on products of eigenvaluestend to be noisier than summations where partially independentnoise distributions can partially cancel each other out (Poonawallaand Zhou, 2004; Koay et al., 2007). This can also be validated by thefollowing simulation. Firstly, three positive eigenvalues were
Fig. 5. Effects on SNR of adding more gradients. Paired t test results for (a) MD, (b) FA, (c) Rdesigned to show whether adding one more gradient is beneficial to the SNR. The horizonadditional gradient are assessed using a paired t test on gradient subsets of size N and N−1, sto 94.The vertical axis shows the logarithm of the probability that such a t value would be oadding one more gradient provided some incremental value. The black curve is the logarithmset as the threshold in our study. If the black curve is below the red line, SNR significanincremental improvement in SNR can be shown for the Nth added gradient, usually it is also tpopulation variability in SNR, which is erratic for GFA when N is low. In these experiments,subjects, at the point where adding onemore gradient makes no difference. This was 0.0023%VR. While these numbers at first sight seem remarkably small, we note that the paired t test iand the pairing (and the fact that inter-subject variance has very little influence) leads to exapproach. (For interpretation of the references to colour in this figure legend, the reader is
Please cite this article as: Zhan, L., et al., How does angular resolution affneuroimage.2009.09.057
randomly produced between 0 and 1, and independent noise wasadded into the three eigenvalues, with σ(noise)=0.05. In comparingthe DTI-derived indices before and after adding the noise, weconfirmed that σ(MD) was the smallest (0.0781), while σ(VR) wasthe highest (4.5755), in linewith the trajectories observed for the SNR.
Fig. 4b shows that the mean SNR(GFA) has a generally increasingtrend from 28 to 94 diffusion-sensitized gradients, but its SNR doesnot show evidence of saturation untilN(bx) is close to 94. It is perhapssurprising how erratic this curve is compared to the others, especiallywhen GFA has been advocated as a possible analog of FA for HARDI-based studies of fiber integrity. We note that GFA is the only index weexamined that is computed from the orientation density function(ODF) rather than by first fitting a tensor. As such, it uses more of theinformation in the full set of diffusion gradients, and may onlysaturate when the number of gradients is very high (over 100). The
A, (d) VR, (e) GA, (f) tGA, and (g) GFA. These plots, for each DTI-derived parameter, aretal axis shows the number of diffusion-sensitized gradients. The effects of adding oneo the horizontal scale runs from 7 to 94, except in the case of GFA, where it runs from 29btained by chance; values below the red line mean that there was some evidence thatof probability for (SNRNNSNRN−1) and the red line is the logarithm of 0.05, which we
tly increases when increasing the number of gradients, N(bx), from N−1 to N. If anrue for all prior gradients; even so, whether there is power to detect this depends on theit is useful to know what is the minimal % difference in SNR that is detectable, with 50for MD, 0.0069% for FA, 0.0063% for RA, 0.0069% for GA, 0.0001% for tGA, and 0.018% fors set up to assess the effect of adding onemore gradient on the mean SNR in 50 subjects,tremely high power. So, even very small increments in SNR can be detected using thisreferred to the web version of this article.)
ect diffusion imaging measures?, NeuroImage (2009), doi:10.1016/j.

Fig. 5 (continued).
9L. Zhan et al. / NeuroImage xxx (2009) xxx–xxx
ARTICLE IN PRESS
GFA is calculated from the ODF, which is conventionally approxi-mated by a spherical harmonic series (SH). In an SH seriesexpansion of order k (here 6), the number of independent SHcoefficients is (k+1)(k+2)/2, or 28 in our study. At least 28independent diffusion-sensitized gradients are required to uniquelydetermine these 28 unknown SH coefficients, using least-squaresfitting. As a large number of gradients is required to estimate the SHseries stably, the many oscillations in the SNR plot for GFA mayresult from errors in the SH approximation. Intriguingly, in priorwork using a 94-gradient HARDI sequence, we also found that FAprovided better effect sizes than GFA did for correlations with IQ(intelligence quotient) in 92 normal subjects, although bothmeasures were strongly correlated with IQ (Chiang et al., 2008,2009). This is perhaps because the SNR is suboptimal for GFA unlessmore than 100 gradients are used. In addition, GFA is calculatedfrom the ODFs, which are known to be noisy. To address this,additional ODF regularization and/or sharpening techniques havebeen proposed (Descoteaux et al., 2007, Goh et al., 2009a,b) tosmooth the signal and better detect the angular maxima. Althoughthese post-processing operations may make it possible to smooththe erratic nature of the SNR (GFA) curve, here we just aim to givethe reader a general impression of the SNR (GFA) curve withoutdetailed subsequent post-processing.
Please cite this article as: Zhan, L., et al., How does angular resolution affeneuroimage.2009.09.057
Statistical analysis of SNR trends
To better understandwhether SNR had converged, we performed apaired Student's t test on SNR values, assessing the effects of addingone additional gradient from N−1 to N in all 50 subjects. If the t testresult is declared significant (pb0.05), then this test confirms thatadding one more gradient does indeed lead to better SNR. When this ttest is not significant, there is no evidence that adding one moregradient to the acquisition protocol is helpful, so the signalmay be saidto be saturated. This result of this test clearly depends on the numberof subjects (here 50), however, this is a reasonable and intuitiveoperational definition of saturation for practical purposes. We notethat this test could be slightly improved by incorporating a multiplecomparison correction into the p-value, to control the false discoveryrate, but we did not do so as the tests were intended as a heuristic tocompare successive increments in gradient numbers. Fig. 5 shows thepaired t test results for MD, FA, RA, VR, GA, tGA, and GFA.
Fig. 5 shows the paired t test results for assessing the hypothesisthat the SNR improves when adding one more gradient (i.e.,SNRNNSNRN−1) for all the DTI-derived parameters. From Figs. 5a–cand e–f, the SNR increases with increasing N(bx) is statisticallysignificant, and then after some number is reached, the SNR oscillatesand no longer shows a statistically significant improvement,
ct diffusion imaging measures?, NeuroImage (2009), doi:10.1016/j.
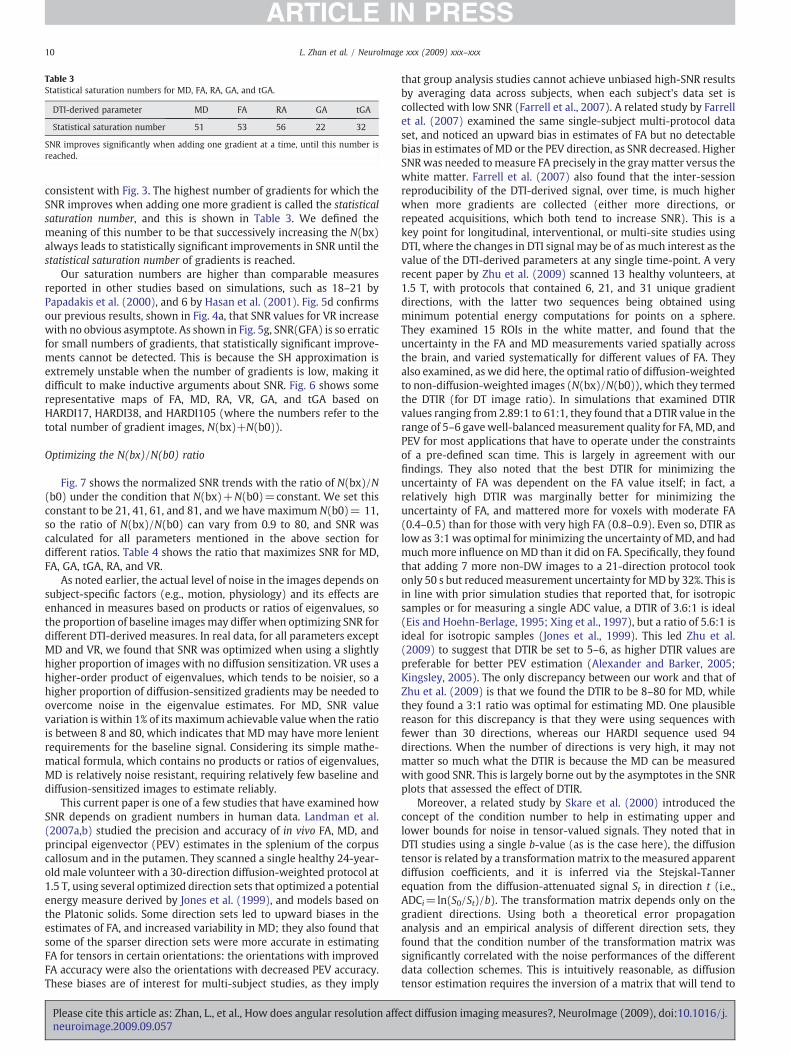
Table 3Statistical saturation numbers for MD, FA, RA, GA, and tGA.
DTI-derived parameter MD FA RA GA tGA
Statistical saturation number 51 53 56 22 32
SNR improves significantly when adding one gradient at a time, until this number isreached.
10 L. Zhan et al. / NeuroImage xxx (2009) xxx–xxx
ARTICLE IN PRESS
consistent with Fig. 3. The highest number of gradients for which theSNR improves when adding one more gradient is called the statisticalsaturation number, and this is shown in Table 3. We defined themeaning of this number to be that successively increasing the N(bx)always leads to statistically significant improvements in SNR until thestatistical saturation number of gradients is reached.
Our saturation numbers are higher than comparable measuresreported in other studies based on simulations, such as 18–21 byPapadakis et al. (2000), and 6 by Hasan et al. (2001). Fig. 5d confirmsour previous results, shown in Fig. 4a, that SNR values for VR increasewith no obvious asymptote. As shown in Fig. 5g, SNR(GFA) is so erraticfor small numbers of gradients, that statistically significant improve-ments cannot be detected. This is because the SH approximation isextremely unstable when the number of gradients is low, making itdifficult to make inductive arguments about SNR. Fig. 6 shows somerepresentative maps of FA, MD, RA, VR, GA, and tGA based onHARDI17, HARDI38, and HARDI105 (where the numbers refer to thetotal number of gradient images, N(bx)+N(b0)).
Optimizing the N(bx)/N(b0) ratio
Fig. 7 shows the normalized SNR trends with the ratio of N(bx)/N(b0) under the condition that N(bx)+N(b0)=constant. We set thisconstant to be 21, 41, 61, and 81, and we have maximum N(b0)= 11,so the ratio of N(bx)/N(b0) can vary from 0.9 to 80, and SNR wascalculated for all parameters mentioned in the above section fordifferent ratios. Table 4 shows the ratio that maximizes SNR for MD,FA, GA, tGA, RA, and VR.
As noted earlier, the actual level of noise in the images depends onsubject-specific factors (e.g., motion, physiology) and its effects areenhanced in measures based on products or ratios of eigenvalues, sothe proportion of baseline images may differ when optimizing SNR fordifferent DTI-derived measures. In real data, for all parameters exceptMD and VR, we found that SNR was optimized when using a slightlyhigher proportion of images with no diffusion sensitization. VR uses ahigher-order product of eigenvalues, which tends to be noisier, so ahigher proportion of diffusion-sensitized gradients may be needed toovercome noise in the eigenvalue estimates. For MD, SNR valuevariation is within 1% of its maximum achievable value when the ratiois between 8 and 80, which indicates that MD may have more lenientrequirements for the baseline signal. Considering its simple mathe-matical formula, which contains no products or ratios of eigenvalues,MD is relatively noise resistant, requiring relatively few baseline anddiffusion-sensitized images to estimate reliably.
This current paper is one of a few studies that have examined howSNR depends on gradient numbers in human data. Landman et al.(2007a,b) studied the precision and accuracy of in vivo FA, MD, andprincipal eigenvector (PEV) estimates in the splenium of the corpuscallosum and in the putamen. They scanned a single healthy 24-year-old male volunteer with a 30-direction diffusion-weighted protocol at1.5 T, using several optimized direction sets that optimized a potentialenergy measure derived by Jones et al. (1999), and models based onthe Platonic solids. Some direction sets led to upward biases in theestimates of FA, and increased variability in MD; they also found thatsome of the sparser direction sets were more accurate in estimatingFA for tensors in certain orientations: the orientations with improvedFA accuracy were also the orientations with decreased PEV accuracy.These biases are of interest for multi-subject studies, as they imply
Please cite this article as: Zhan, L., et al., How does angular resolution affneuroimage.2009.09.057
that group analysis studies cannot achieve unbiased high-SNR resultsby averaging data across subjects, when each subject's data set iscollected with low SNR (Farrell et al., 2007). A related study by Farrellet al. (2007) examined the same single-subject multi-protocol dataset, and noticed an upward bias in estimates of FA but no detectablebias in estimates of MD or the PEV direction, as SNR decreased. HigherSNRwas needed tomeasure FA precisely in the graymatter versus thewhite matter. Farrell et al. (2007) also found that the inter-sessionreproducibility of the DTI-derived signal, over time, is much higherwhen more gradients are collected (either more directions, orrepeated acquisitions, which both tend to increase SNR). This is akey point for longitudinal, interventional, or multi-site studies usingDTI, where the changes in DTI signal may be of as much interest as thevalue of the DTI-derived parameters at any single time-point. A veryrecent paper by Zhu et al. (2009) scanned 13 healthy volunteers, at1.5 T, with protocols that contained 6, 21, and 31 unique gradientdirections, with the latter two sequences being obtained usingminimum potential energy computations for points on a sphere.They examined 15 ROIs in the white matter, and found that theuncertainty in the FA and MD measurements varied spatially acrossthe brain, and varied systematically for different values of FA. Theyalso examined, as we did here, the optimal ratio of diffusion-weightedto non-diffusion-weighted images (N(bx)/N(b0)), which they termedthe DTIR (for DT image ratio). In simulations that examined DTIRvalues ranging from 2.89:1 to 61:1, they found that a DTIR value in therange of 5–6 gavewell-balancedmeasurement quality for FA, MD, andPEV for most applications that have to operate under the constraintsof a pre-defined scan time. This is largely in agreement with ourfindings. They also noted that the best DTIR for minimizing theuncertainty of FA was dependent on the FA value itself; in fact, arelatively high DTIR was marginally better for minimizing theuncertainty of FA, and mattered more for voxels with moderate FA(0.4–0.5) than for those with very high FA (0.8–0.9). Even so, DTIR aslow as 3:1 was optimal for minimizing the uncertainty of MD, and hadmuchmore influence on MD than it did on FA. Specifically, they foundthat adding 7 more non-DW images to a 21-direction protocol tookonly 50 s but reducedmeasurement uncertainty for MD by 32%. This isin line with prior simulation studies that reported that, for isotropicsamples or for measuring a single ADC value, a DTIR of 3.6:1 is ideal(Eis and Hoehn-Berlage, 1995; Xing et al., 1997), but a ratio of 5.6:1 isideal for isotropic samples (Jones et al., 1999). This led Zhu et al.(2009) to suggest that DTIR be set to 5–6, as higher DTIR values arepreferable for better PEV estimation (Alexander and Barker, 2005;Kingsley, 2005). The only discrepancy between our work and that ofZhu et al. (2009) is that we found the DTIR to be 8–80 for MD, whilethey found a 3:1 ratio was optimal for estimating MD. One plausiblereason for this discrepancy is that they were using sequences withfewer than 30 directions, whereas our HARDI sequence used 94directions. When the number of directions is very high, it may notmatter so much what the DTIR is because the MD can be measuredwith good SNR. This is largely borne out by the asymptotes in the SNRplots that assessed the effect of DTIR.
Moreover, a related study by Skare et al. (2000) introduced theconcept of the condition number to help in estimating upper andlower bounds for noise in tensor-valued signals. They noted that inDTI studies using a single b-value (as is the case here), the diffusiontensor is related by a transformationmatrix to the measured apparentdiffusion coefficients, and it is inferred via the Stejskal-Tannerequation from the diffusion-attenuated signal St in direction t (i.e.,ADCi=ln(S0/St)/b). The transformation matrix depends only on thegradient directions. Using both a theoretical error propagationanalysis and an empirical analysis of different direction sets, theyfound that the condition number of the transformation matrix wassignificantly correlated with the noise performances of the differentdata collection schemes. This is intuitively reasonable, as diffusiontensor estimation requires the inversion of a matrix that will tend to
ect diffusion imaging measures?, NeuroImage (2009), doi:10.1016/j.

Fig. 6. SNR increases for all 6 DTI-derived scalar measures as the number of HARDI gradients is steadily increased. Rows 1–6 show axial slices through the FA map, MDmap, RAmap,VR map, GA map, and tGA map. Column 1 is computed from HARDI17 (i.e., the 11 b0 and 6 non-b0 images), column 2 is from HARDI38 (i.e., 27 non-b0 images), and column 3 is fromHARDI105 (the full protocol of 94 non-b0 images).
11L. Zhan et al. / NeuroImage xxx (2009) xxx–xxx
ARTICLE IN PRESS
Please cite this article as: Zhan, L., et al., How does angular resolution affect diffusion imaging measures?, NeuroImage (2009), doi:10.1016/j.neuroimage.2009.09.057

Fig. 7. SNR plot for different ratios of the number of diffusion-sensitized gradients,N(bx), to the number of diffusion non-sensitized gradients, N(b0).
12 L. Zhan et al. / NeuroImage xxx (2009) xxx–xxx
ARTICLE IN PRESS
amplify noise in the gradient data when its condition number is high.In other words, when the condition number is large, the relative errorin the estimated diffusion tensor elements is several times larger thanthe relative errors in measuring the ADC along each direction. Incomparing various schemes (including tetrahedral, decahedral,tetraorthogonal, and Jones' electrostatic repulsion arrangements),Skare et al. (2000) noted that, if other factors are equal, direction setswith smaller condition numbers should be favored where possible.They also proposed a new gradient optimization scheme (downhillsimplex minimization; DSM) that optimized the condition number ofgradient sets. In our current paper, the sequential optimization ofenergy for the nested gradient sets is intended to lead to gradientarrangements that tend to be uniformly distributed in 3D space, as faras possible given the constraints.
Eddy current corrections are sometimes necessary to correct fordistortions between images with different diffusion gradient direc-tions. Eddy currents can arise in DTI as the diffusion gradients changerapidly (Zhuang et al., 2006), and these can lead to distortion in thephase-encoding direction, slight blurring of GM/WM boundaries, andmisregistration between individual diffusion-weighted (DW) images.In this study,we explicitly reduced eddy-current induced distortions inour scans by using single-shot echo planar imaging with a twice-refocused spin echo sequence (Reese et al., 2003). In addition, wereported SNR from a small, relatively homogeneous region in thecorpus callosum, so the effects of slight spatial shifts among thegradient images should be relatively low, at least compared with theoverall spatial autocorrelation (coherence) in the diffusion signals inthis relatively homogeneous region.
As in most DTI studies, and as in the other in vivo studies of SNRin DTI (Landman et al., 2007a,b; Farrell et al., 2007; Zhu et al., 2009),we used only a single b-value of 1159 s/mm2. However, therestriction of DTI to a single b-value results in a bias toward a lowbandwidth (in q-space) for the ODF. As noted by Kuo et al. (2008),angular resolution is also a function of the q-space bandwidth. Ourongoing work using multiple b-value acquisitions at 7 T (also known
Table 4Optimal ratio for N(bx)/N(b0).
DTI-derived parameter MD FA RA VR GA tGA
N(bx)/N(b0) 26 10.57 9.17 26 9.13 9.13
Here we found that for most anisotropy measures, SNR is optimized when using aslightly higher proportion of images with no diffusion sensitization.
Please cite this article as: Zhan, L., et al., How does angular resolution affneuroimage.2009.09.057
as diffusion spectrum imaging) has found that the ODF reconstruc-tion error tends to be greater at higher b-values, but also falls withincreasing angular resolution (Zhan et al., 2009a,b, in press).
Reconstruction error in the spherical diffusion profile decreases asN(bx) increases
To support the validity of our experiments, we also sought toconfirm that the reconstruction error in resolving the diffusion profilewas truly decreasingwhen using gradient sets with higher numbers ofgradients. Fig. 8 shows one example of this simulation. As expected,the sKL decreasedwith increasing SNR andwhen usingmore scanningdirections (Fig. 9). This result confirms the premise of this paper,namely that greater angular resolution leads to more accurate ODFrecovery and less reconstruction error in HARDI. For these calcula-tions, the ODF used is that derived analytically from the tensordistribution function (TDF) (Leow et al., 2009), rather than from theregularized ODF framework proposed by Descoteaux et al. (2007).Further work is necessary to fully understand how ODF accuracydepends on gradient numbers; recently, Cho et al. (2008) haveexamined the SNR needed to resolve fibers crossing at 45° inphantoms scanned with different b-values (Cho et al., 2008). Asshown here, Cho et al. also noted that the accuracy and the angularresolution of q-ball imaging to define fiber orientations stronglydepends on diffusion imaging parameters.
Conclusions
Optimizing diffusion imaging sequences for examining fiberintegrity in the brain is a key issue in neuroscience and radiologyresearch. Past studies based on mathematical theory and computersimulations suggested that around 18–21 gradients might suffice foraccurate estimation of FA (Papadakis et al., 2000), but differentstudies disagree somewhat on the number of gradients needed toreliably estimate anisotropy indices. Here we improved upon paststudies, by studying SNR profiles empirically in a relatively largenumber of normal subjects. We found that the SNR profiles andtendency to saturate depended on the DTI parameter of interest, eachhaving a different profile of dependency on the scan time. Even so, adirect comparison of different studies is not possible, because thestudies by Papadakis and Hasan used simulated data, for which noiseis defined mathematically, and we used empirical data instead. Thereare also differences in the SNR definitions across studies, in that weincluded the biological variability of the signal over the region ofinterest, when taking into account the overall profile of variance.
The current study has three main conclusions. The number ofdiffusion-sensitized gradients affects the signal-to-noise ratio indifferent ways, for various DTI-derived parameters. For FA and RA,near-optimal SNR was achieved with 62–66 diffusion-sensitizedgradients; for MD, this number was 58 and for GA and tGA, thisnumber was about 55, while for VR, SNR increased well beyond 94gradients. Our SNR plots, for a range of common anisotropy indices,may be useful in designing future acquisition protocols. Very highnumbers of gradients were more beneficial when estimating para-meters based on high-order products of tensor eigenvalues, whichtend to be noisier. Differences in robustness for different DTI-derivedmeasures derive from the arithmetic canceling or boosting of noise inthe formulae for each index. The generalized fractional anisotropy(GFA), for example, required very large numbers of gradients toestimate reliably, and its SNR plot had not stabilized even with 100gradients. Although GFA has been advocated as a good replacementfor FA when large numbers of gradients are available, it requires thefitting of a spherical harmonic series expansion to the diffusionprofile, which can be unstable unless very high angular sampling isavailable. Third, we confirmed that there is a special ratio of non-diffusion-sensitized images,N(bx)/N(b0), that should also be collected
ect diffusion imaging measures?, NeuroImage (2009), doi:10.1016/j.

13L. Zhan et al. / NeuroImage xxx (2009) xxx–xxx
ARTICLE IN PRESS
to optimize SNR. Interestingly, this optimal ratio is also parameter-dependent, with values around 26 for VR, 10.57 for FA, 9.17 for RA, 9.13for GA, and tGA. This ratiowas higher for some anisotropy indices (VR),lower for others (FA, RA, GA, and tGA), and was not relevant at all formeasuringmean diffusivity (MD), which is a relatively robustmeasure,which tends to cancel noise somewhat as the average of the diffusion
Fig. 8. Angular resolution effects on the HARDI ODF for a simulated two-fiber system crossinweighed images affects the recovered orientation density function (ODF), calculated in thefrom sets of progressively greater numbers of gradients, using subsets of directions that optimtruth ODF; and (c) ODF recovered from different angular resolutions (27–94 gradients). Tharound 80 gradients are used; the number of 80 gradients also seems to coincide with the
Please cite this article as: Zhan, L., et al., How does angular resolution affeneuroimage.2009.09.057
tensor eigenvalues. Compared to other parameters, MD had relativehigher noise resistance, needing fewer gradients to estimate, and fewerbaseline signals.
The saturation number of each index should not be considered as ameasure of the quality of each index for assessing biologicalcharacteristics of the white matter, such as fiber integrity. In our
g at 90°. This figure illustrates how the angular resolution (sampling) of the diffusion-TDF framework based on Eq. (6) with min–max normalization. ODFs are reconstructedize the angular distribution energy (Eqs. 1 and 2): (a) simulated phantom; (b) ground
ere are clear errors and biases in the estimation of the dominant fiber directions untilflattening of the graph plotting KL versus N (Fig. 9) at around NN80.
ct diffusion imaging measures?, NeuroImage (2009), doi:10.1016/j.

Fig. 9. Reconstruction error (sKL) vs. angular resolution. For each angular resolutionscheme, 1000 simulations of two-tensor systems (equal volume fractions; 90° crossing)were computed. As expected, the sKL divergence (reconstruction error) decreases withhigher angular resolution sampling schemes. The accuracy of the computed ODFimproves as the angular resolution increases.
14 L. Zhan et al. / NeuroImage xxx (2009) xxx–xxx
ARTICLE IN PRESS
past studies, we found that FA outperformed GFA in terms of itscorrelation with IQ scores, even in 94-gradient scans that wereexpected to be sufficient to allow an accurate measure of GFA (Chianget al., 2008, 2009); we also found that genetic influences on fibercharacteristics were marginally more evident with tGA than FA,perhaps partly because the geodesic anisotropy takes into account themanifold structure of the diffusion tensors, when comparing them(Lee et al., 2008). Ultimately, even if over 100 gradients areinsufficient to reliably estimate GFA, it may not be any more usefulfor certain time-limited applications, even if it carries potentiallydifferent information not provided by other anisotropy indices.
Furthermore, there are several caveats regarding this study. Paststudies relied mainly on computer simulations, which may not fullyreflect the true sources of noise in a human subject's scan. Even so, theachievable SNR in empirical data will also inevitably depend on thescanner, the magnetic field strength (here 4 T), the spatial resolution,and circumstantial factors such as the amount of subject motion in thescanner. The issue of subject-specific variations was somewhatalleviated in the current study, as we examined 50 subjects' scans,deriving plots for the minimum and maximum SNR achieved, as wellas its mean profile, in a representative group of subjects. Even so, caremay be needed in extrapolating our results to other scanners and fieldstrengths. Second, if a study is designed to detect group differences inDTI (e.g., comparing patients with Alzheimer's disease to groups ofnormal subjects), the image SNR is not the only relevant source ofvariation to consider—biological variability may be very high orrelatively low, or the available sample sizes may be very high, so otherconsiderations may supervene, and outweigh the need for very highSNR in each scan. Although our current study focuses on SNRimprovement, whether or not this increased SNR translates intosmaller minimal sample sizes to detect clinically relevant effectsdepends on the biological variation in these measures across subjects.Landman et al. (2007a,b) also noted that the estimated orientation ofthe diffusion tensor (principal eigenvector) depends not just on theangular sampling, but also on patient motion, field inhomogeneity,and EPI-related distortions. Thus, further studies of scanner fieldstrength, spatial resolution, tolerability, motion artifacts, test/re-testreliability, and clinical effect sizes are needed to evaluate the addedbenefit of HARDI's SNR for radiologic and neuroscientific studies.
Please cite this article as: Zhan, L., et al., How does angular resolution affneuroimage.2009.09.057
Finally, in considering the trade-off between SNR and scan time,alternative uses of the scan timemust also be taken into account, suchas acquiring other potentially interesting MRI sequences (e.g.,spectroscopy or FLAIR scans), minimizing patient burden, andminimizing the risk of non-compliance with longer scan times (i.e.,losing the scan altogether). High-angular resolution acquisitions aretime-consuming to collect, but it must be conceded that they mayprovide new insight into fiber architecture and connectivity thatcannot be achieved, even in principle, using smaller numbers ofgradients. Tractography studies, for example, derive angular infor-mation on local fiber trajectories, and tend to benefit from higherangular resolution well beyond the sampling limits where the SNRprofiles for scalar anisotropy measures are saturated. Even so, thesecalibration plots may be of interest in designing future DTI protocolsfor assessing fiber integrity in the living brain.
Acknowledgments
This work was supported by NIH grant R01 HD050735 andNational Health and Medical Research Council, Australia grant496682. Algorithm development was also supported by NIH grantsEB007813, EB008281, EB008432, HD050735, and AG020098 (to P.T.).
References
Alexander, D.C., 2005. Maximum entropy spherical deconvolution for diffusion MRI.Proceedings of the 19th International Conference on Information Processing inMedical Imaging (IPMI) 19, 76–87.
Alexander, D.C., Barker, G.J., 2005. Optimal imaging parameters for fiber-orientationestimation in diffusion MRI. NeuroImage 27 (2), 357–367.
Anderson, A.W., 2005. Measurement of fiber orientation distributions using highangular resolution diffusion imaging. Magn. Reson. Med. 54, 1194–1206.
Basser, P.J., Pierpaoli, C., 1996. Microstructural and physiological features of tissueselucidated by quantitative diffusion tensor MRI. J. Magn. Reson. Series B 111 (3),209–219.
Batchelor, P., 2002. Optimization of direction schemes for diffusion tensor imaging.Proceedings of the workshop on diffusion MRI: biophysical issues (What can wemeasure?), St. Malo, France.
Chiang, M.C., Barysheva, M., Lee, A.D., Madsen, S.K., Klunder, A.D., Toga, A.W., McMahon,K.L., de Zubicaray, G.I., Meredith, M., Wright, M.J., Srivastava, A., Balov, N.,Thompson, P.M., 2008. Mapping genetic influences on brain fiber architecturewith high angular resolution diffusion imaging (HARDI). 5th InternationalSymposium on Biomedical Imaging: From Nano to Macro (ISBI2008) pp. 871–874.
Chiang, M.C., Barysheva, M., Lee, A.D., Madsen, S.K., Klunder, A.D., Toga, A.W., McMahon,K.L., de Zubicaray, G.I., Wright, M.J., Srivastava, A., Balov, N., Thompson, P.M., 2009.Genetics of brain fiber architecture and intelligence. J. Neurosci. 29 (7), 2212–2224.
Cho, K.H., Yeh, C.H., Tournier, J.D., Chao, Y.P., Chen, J.H., Li, C.P., 2008. Evaluation of theaccuracy and angular resolution of q-ball imaging. NeuroImage 42 (1), 262–271.
de Zubicaray, G.I., Chiang, M.C., McMahon, K.L., Shattuck, D.W., Toga, A.W., Martin, N.G.,Wright, M.J., Thompson, P.M., (2008) Meeting the challenges of neuroimaginggenetics. Brain Imaging Behav, Special Issue (ed.: J.D. van Horn et al.), publishedonline, August 2008.
Descoteaux, M., Angelino, E., Fitzgibbons, S., Deriche, R., 2007. Regularized, fast androbust analytical q-ball imaging. Magn. Reson. in Med. 58 (3), 497–510.
Eis, M., Hoehn-Berlage, M., 1995. Correction of gradient crosstalk and optimization ofmeasurement parameters in diffusion MR imaging. J. Magn. Reson. 107, 222–234.
Farrell, J.A.D., Landman, B.A., Jones, C.K., Smith, S.A., Prince, J.L., van Zijl, P.C.M., Mori, S.,2007. Effects of signal-to-noise ratio on the accuracy and reproducibility ofdiffusion tensor imaging-derived fractional anisotropy, mean diffusivity, andprincipal eigenvector measurements at 1.5T. J. Magn. Reson. Imaging. 26, 756–767.
Goh, A., Lenglet, C., Thompson, P.M., Vidal, R., 2009a. A nonparametric Riemannianframework for processing high angular resolution diffusion images (HARDI).Computer Vision and Pattern Eecognition (CVPR09) 2496–2503.
Goh, A., Lenglet, C., Thompson, P.M., Vidal, R., 2009b. Estimating orientationdistributions with probability density constraints and spatial regularity, MedicalImage Computing and Computer Assisted Intervention (MICCAI2009), London, UK,Sept. 2009.
Hasan, K.M., 2000. Analysis, optimization and evaluation of water spin self-diffusiontensor imaging encoding and acquisition schemes. PhD Dissertation, Department ofPhysics: Salt Lake City, University of Utah, 216 pp.
Hasan, K.M., Parker, D.L., Alexander, A.L., 2001. Comparison of gradient encodingschemes for diffusion-tensor MRI. J. Magn. Reson. Imaging 13, 769–780.
Hess, C.P., Mukherjee, P., Han, E.T., Xu, D., Vigneron, D.B., 2006. Q-ball reconstruction ofmultimodal fiber orientations using the spherical harmonic basis. Magn. Reson.Med. 56, 104–117.
Jansons, K.M., Alexander, D.C., 2003. Persistent angular structure: new insights fromdiffusion magnetic resonance imaging data. Inverse Probl. 19, 1031–1046.
Jbabdi, S., Woolrich, M.W., Andersson, J.L.R., Behrens, T.E.J., 2007. A Bayesian frameworkfor global tractography. NeuroImage 37, 116–129.
ect diffusion imaging measures?, NeuroImage (2009), doi:10.1016/j.

15L. Zhan et al. / NeuroImage xxx (2009) xxx–xxx
ARTICLE IN PRESS
Jian, B., Vemuri, B.C., 2007. A unified computational framework for deconvolution toreconstruct multiple fibers from diffusion weighted MRI. IEEE Trans. Med. Imaging26 (11), 1464–1471.
Jones, D.K., 2004. The effect of gradient sampling schemes on measures derived fromdiffusion tensor MRI: a Monte Carlo study. Magn. Reson. Med. 51 (4), 807–815.
Jones, D.K., Horsfield, M.A., Simmons, A., 1999. Optimal strategies for measuringdiffusion in anisotropic systems by magnetic resonance imaging. Magn. Reson.Med. 42 (3), 515–525.
Kaden, E., Knösche, T.R., Anwander, A., 2007. Parametric spherical deconvolution:inferring anatomical connectivity using diffusion MR imaging. NeuroImage 37,474–488.
King, R.B., 1993. Applications of graph theory and topology in inorganic cluster andcoordination chemistry. CRC Press, Boca Raton, Florida, pp. 47–69.
Kingsley, P.B., (2005). Optimization of DTI acquisition parameters. In: Proceedings ofthe 13th Annual Meeting of ISMRM, Miami Beach FL, USA, 2005 (Abstract 1294).
Koay, C.G., Chang, L.C., Pierpaoli, C., Basser, P.J., 2007. Error propagation framework fordiffusion tensor imaging via diffusion tensor representations. IEEE Trans. Med.Imaging 26 (8), 1017–1034.
Kuo, L.W., Chen, J.H., Wedeen, V.J., Tseng, W.Y.I., 2008. Optimization of diffusionspectrum imaging and q-ball imaging on clinical MRI system. NeuroImage 41 (1),7–18.
Landman, B.A., Farrell, J.A.D., Jones, C.K., Smith, S.A., Prince, J.L., Mori, S., 2007a. Effects ofdiffusion weighting schemes on the reproducibility of DTI-derived fractionalanisotropy, mean diffusivity, and principal eigenvector measurements at 1.5T.NeuroImage 36, 1123–1138.
Landman, B.A., Farrell, J.A.D., Smith, S.A., Mori, S., Prince, J.L., 2007b. Tradeoffs betweentensor orientation and anisotropy in DTI: impact of diffusion weighting scheme.International Society for Magnetic Resonance in Medicine, 15th Scientific Meeting,Berlin.
LeBihan, D., 1990a. IVIM method measures diffusion and perfusion. Diagn. Imaging(San Franc.) 12 (6), 133–136.
LeBihan, D., 1990b. Magnetic resonance imaging of perfusion. Magn. Reson. Med. 14 (2),283–292.
Lee, A.D., Lepore, N., Barysheva, M., Chou, Y.Y., Brun, C.A., Madsen, S.K., McMahon, K.L.,de Zubicaray, G.I., Meredith, M., Wright, M.J., Toga, A.W., Thompson, P.M., 2008.Comparison of fractional and geodesic anisotropy in diffusion tensor images of 90monzygotic and dizygotic twins. IEEE International Symposium on BiomedicalImaging: From Nano to Macro (ISBI2008).
Lenglet, C., Campbell, J.S.W., Descoteaux, M., Haro, G., Savadjiev, P., Wassermann, D.,Anwander, A., Deriche, R., Pike, G.B., Sapiro, G., Siddiqi, K., Thompson, P.M., 2008.Mathematical methods for diffusion MRI processing. NeuroImage - Special Issue onMathematics in Brain Imaging (Epub ahead of print).
Leow, A.D., Zhu, S., Zhan, L., de Zubicaray, G.I., Meredith, M., Wright, M., Toga, A.W.,Thompson, P.M., 2009. The tensor distribution function. Magn. Reson. Med. 61 (1),205–214.
Leporé, N., Chou, Y.Y., Lopez, O.L., Aizenstein, H.J., Becker, J.T., Toga, A.W., Thompson,P.M., 2008. Fast 3D fluid registration of brain magnetic resonance images. SPIE2008.
Özarslan, E., Shepherd, T., Vemuri, B.C., Blackband, S., Mareci, T., 2006. Resolution ofcomplex tissue microarchitecture using the diffusion orientation transform (DOT).NeuroImage 31 (3), 1083–1106.
Papadakis, N.G., Xing, D., Huang, C.L., Hall, L.D., Carpenter, T.A., 1999. A comparativestudy of acquisition schemes for diffusion tensor imaging using MRI. J. Magn.Reson. 137, 67–82.
Please cite this article as: Zhan, L., et al., How does angular resolution affeneuroimage.2009.09.057
Papadakis, N.G., Murrills, C.D., Hall, L.D., Huang, C.L.H., Carpenter, T.A., 2000. Minimalgradient encoding for robust estimation of diffusion anisotropy. Magn. Reson.Imaging 18, 671–679.
Pennec, X., Fillard, P., Ayache, N., 2004. A Riemannian framework for tensor computing.Int. J. Comput. Vis. 66 (1), 41–66.
Pichon, E., Westin, C., Tannenbaum, A., 2005. A Hamilton-Jacobi-Bellman approach tohigh angular resolution diffusion tractography. Eighth International Conferenceon Medical Image Computing and Computer-Assisted Intervention (MICCAI05)pp. 180-197.
Poonawalla, A.H., Zhou, X.H., 2004. Analytical error propagation in diffusion Anisotropycalculations. J. Magn. Reson. Imaging 19, 489–498.
Reese, T.G., Heid, O., Weisskoff, R.M., Wedeen, V.J., 2003. Reduction of eddy-current-induced distortion in diffusion MRI using a twice-refocused spin echo. Magn.Reson. Med. 49, 177–182.
Shattuck, D.W., Leahy, R.M., 2002. BrainSuite: an automated cortical surfaceidentification tool. Med. Image Anal. 6 (2), 129–142.
Skare, S., Hedehus, M., Moseley, M.E., Li, T.Q., 2000. Condition Number as a Measure ofNoise Performance of Diffusion Tensor Data Acquisition Schemes withMRI. J. Magn.Reson. Imaging 147, 340–352.
Stejskal, E.O., Tanner, J.E., 1965. Spin diffusion measurements: spin echoes in thepresence of a time-dependent field gradient. J. Chem. Phys. 42, 288–292.
Tournier, J.D., Calamante, F., Gadian, D., Connelly, A., 2004. Direct estimation of the fiberorientation density function from diffusion-weighted MRI data using sphericaldeconvolution. NeuroImage 23, 1176–1185.
Tuch, D.S., 2004. Q-ball imaging. Magn. Reson. Med. 52, 1358–1372.Wong, S.T.S., Roos, M.S., 1994. A strategy for sampling on a sphere applied to 3D
selective RF pulse design. Magn. Reson. Med. 32, 778–784.Xing, D., Papadakis, N.G., Huang, C.L., Lee, V.M., Carpenter, T.A., Hall, L.D., 1997.
Optimized diffusion-weighting for measurement of apparent diffusion coefficient(ADC) in human brain. Magn. Reson. Imaging 15, 771–784.
Zhan, L., Leow, A.D., Zhu, S., Chiang, M.C., Barysheva, M., Toga, A.W., McMahon, K.L., deZubicaray, G.I., Wright, M.J., Thompson, P.M., 2009a. Analyzing multi-fiberreconstruction in high angular resolution diffusion imaging using the tensordistribution function, 6th IEEE International Symposium on Biomedical Imaging:From Nano to Macro (ISBI 2009), Boston, MA.
Zhan, L., Leow, A.D., Barysheva, M., Feng, A., Toga, A.W., Sapiro, G., Harel, N., Lim, K.O.,Lenglet, C., McMahon, K.L., de Zubicaray, G.I., Wright, M.J., Thompson, P.M.,2009b. Investigating the uncertainty in multi-fiber estimation in high angularresolution diffusion imaging, Medical Image Computing and Computer AssistedIntervention (MICCAI2009), Workshop on Probabilistic Modeling in MedicalImage Analysis (PMMIA), ed. Kilian Pohl, Sarang Joshi, Sandy Wells, London, UK,Sept. 2009 (12 pages).
Zhan, L., Leow, A.D., Zhu, S., Hageman, N., Chiang, M.C., Barysheva, M., Toga, A.W.,Thompson, P.M., 1993. What does fractional anisotropy (FA) really measure?Medical Image Computing and Computer Assisted Intervention (MICCAI2009),London, UK, pp. 845–852, Sept. 2009.
Zhu, T., Liu, X., Gaugh, M.D., Connelly, P.R., Ni, H., Ekholm, S., Schifitto, G., Zhong, J., 2009.Evaluation of measurement uncertainties in human diffusion tensor imaging (DTI)-derived parameters and optimization of clinical DTI protocols with a wild bootstrapanalysis. J. Magn. Reson. Imaging 29 (2), 422–435.
Zhuang, J., Hrabe, J., Kangarlu, A., Xu, D., Bansal, R., Branch, C.A., Peterson, B.S., 2006.Correction of Eddy-current distortions in diffusion tensor images using the knowndirections and strengths of diffusion gradients. J. Magn. Reson. Imaging 24 (5),1188–1193 (November).
ct diffusion imaging measures?, NeuroImage (2009), doi:10.1016/j.