How different are higher education institutions in the UK, US and Australia? The significance of...
35
This is the pre-peer reviewed version of the article which has been published in final form at: Moodie, Gavin (2014) How different are higher education institutions in the UK, US and Australia? The significance of government involvement, Higher Education Quarterly, DOI: 10.1111/hequ.12052. Abstract Most empirical analyses of the diversity of higher education systems use categorical variables, which shape the extent of diversity found. This study examines continuous variables of institutions’ enrolment size and proportions of postgraduate, fulltime and international students to find the extent of variation amongst doctoral granting and all higher education institutions in the UK, US and Australia. The study finds that there is less variety amongst all higher education institutions in the UK than in Australia, which in turn has much less variety than the US. This suggests that the extent of government involvement in higher education isn’t so important for institutional variety as the form which it takes. More tentatively, the paper suggests that the more limited the range of institutions for which government funding is available the stronger government involvement is needed to have variety among the limited range of institutions for which government financial support is available. Gavin Moodie is adjunct professor of education at RMIT, Melbourne. He is interested in the relations between vocational and higher education.
Transcript of How different are higher education institutions in the UK, US and Australia? The significance of...

This is the pre-peer reviewed version of the article which has been published in final form at:
Moodie, Gavin (2014) How different are higher education institutions in the UK, US and Australia? The significance of government involvement, Higher Education Quarterly, DOI: 10.1111/hequ.12052.
Abstract
Most empirical analyses of the diversity of higher education systems use categorical variables, which shape the extent of diversity found. This study examines continuous variables of institutions’ enrolment size and proportions of postgraduate, fulltime and international students to find the extent of variation amongst doctoral granting and all higher education institutions in the UK, US and Australia. The study finds that there is less variety amongst all higher education institutionsin the UK than in Australia, which in turn has much less variety than the US. This suggests that the extent of government involvement in higher education isn’t so important for institutional variety as the form which it takes. More tentatively, the paper suggests that the more limited the rangeof institutions for which government funding is available the stronger government involvement is needed to have variety amongthe limited range of institutions for which government financial support is available.
Gavin Moodie is adjunct professor of education at RMIT, Melbourne. He is interested in the relations between vocationaland higher education.

How different are higher education institutions in theUK, US and Australia? The significance of government involvement
Gavin Moodie, RMIT, [email protected]
Keywords: differentiation, diversity, government planning, UK,
US, Australia.
Introduction
Huisman (1995) notes that higher education scholars adopted the terms ‘differentiation’ and ‘diversity’ from biology and more specifically from ecology which studies amongst other things the diversity, distribution, mass and number of organisms (The British Ecological Society, 2013). A key conceptand basic unit of analysis in biology and ecology is the species, which is commonly defined as a group of organisms thatcan reproduce with one another in nature and produce fertile offspring (Nature Education, 2013). Huisman (1995, p. 7) arguesthat these terms should be used in higher education precisely. He defines ‘differentiation’ as ‘a process indicating an increase of the number of entities’ or ‘a process in which a specific entity emerges (in a larger unit)’, deriving this definition from biological differentiation which is a process in which different structures or functions develop from a formerly integrated whole. Huisman gives as an example of differentiation a university department which used to integrateteaching and research but which now separates them. Huisman (1995, p. 8) defines ‘diversity’ as ‘the variety of types and dispersion of entities across these types’ and ‘diversification’ as ‘an increase in the number of types and/ordispersion of entities across these types’ or as ‘an increase of differences between entities or types’.
On this understanding biology’s species becomes higher education’s type and just as species is a fundamental taxonomic
1

unit of biological classification so type of higher education unit is fundamental to considering higher education’s diversityand diversification. Yet while there is a precise definition ofspecies based on organisms’ biological nature, there is (as yet) no such precise definition of type of higher educational institution based on their nature. As Huisman (2000, p. 43) observes ‘it all boils down to the question of how to define species in higher education’. Analysts define institutional types from what seem salient characteristics. Two methods have been commonly used. One is to group institutions by similarities in their statistical properties. Cluster analysis is commonly used, but other techniques are available. Stanley and Reynolds (1994, p. 366) applied cluster analysis to ratingsof Australian universities in 1993 and conducted another analysis of statistics on Australian universities in 1993. Theyfound that ‘it is not possible to obtain consistent simple clusterings for the majority of universities’, and that the clusters they found did not reflect ‘a natural grouping of the universities based on the history of their establishment’ (Stanley and Reynolds, 1994, p. 363). Andrews, Aungles, Baker and Sarris (1998, p. 18) used principal components analysis to reduce eleven variables of Australian higher education institutions to four summary factors. They used these summary factors of 1997 data to group 43 institutions into six clusters(Andrews, Aungles, Baker and Sarris, 1998, p. 22). Again, Andrews and colleagues’ groupings of universities did not have face validity and neither theirs nor Stanley and Reynolds’ clusters have been used extensively if at all in subsequent analyses of Australian universities.
Another way of identifying types of higher education institutions is to choose characteristics that seem important or distinctive of higher education institutions and group institutions by those characteristics. For example, Birnbaum (1983) found 141 types of institutions from various combinations of their control, size of enrolments, sex of students, programme, highest level of degree offered and proportion of minority enrollment. This approach is subject to the way categories are specified and thus as Huisman (1995, p. 27) observes ‘. . . the classification results are largely determined by the choice of the indicators or variables . . .’. For example, for their analysis of the diversity of higher education institutions in ten OECD countries Huisman, Meek and Wood (2007, p. 567) considered five categories of enrolment
2

size: fewer than 101 students, 101–500 students, 501–3,000 students, 3,001–10,000 students and 10,000 or more students. They state that ‘These categories were established to reflect the view that students probably will not experience the difference between institutes of 11,000 and 25,000 students, but will notice the difference between higher education institutions of 70 and 800 students’ (Huisman, Meek and Wood, 2007, p. 567). This may be true, but they offer no evidence in support. Conway, Zhao and Montgomery (2011, pp. 17-18) report that while the size of institutions affects some dimensions of the national survey of student engagement, it does not effect other dimensions. They classified institutions into three size categories: small (fewer than 6,500), medium (12,000 to 21,000)and large (24,500 plus) (Conway, Zhao and Montgomery, 2011, p. 46) which are rather different from and markedly bigger than Huisman, Meek and Wood’s categories of institutions’ size. Morphew (2009, p. 253) seeks to reduce the element of judgementin defining categories by establishing categories at ‘natural cut points’, but natural cut points in some series may not coincide with any natural cut points in other series. In 2007 all but five of Australia’s 40 universities were in Huisman, Meek and Wood’s biggest size category, suggesting low diversityon this criterion. However, as we shall see later, using a rather different method finds that Australian doctoral grantinginstitutions are somewhat diverse by enrolment size.
This study avoids the limitations and perhaps somewhat arbitrary nature of the categorical variables that have been used in many analyses of higher education institutions’ diversity by using a different method, the relative standard deviation. The relative standard deviation is a continuous variable: it does not rely on identifying institutional types, either by statistical analysis or by designating categories that seem salient. This paper uses the relative standard deviation to find the level of variation amongst institutions in a system and compares this with relative standard deviationsin other systems to form a view of how varied systems are. Thisis used to test Birnbaum’s (1983, pp. 149-182) argument that government planning inhibits institutional diversity, which Huisman (1995, p. 12) notes has not been tested.
Relative standard deviation
3

The relative standard deviation is illustrated by examining enrolments in Russell Group universities, shown in table 1. Themean of the Russell Group universities’ total domestic enrolments in 2010/11 was 17,867 students. The median or mid point of Russell Group’s total enrolments was 17,955 students, which is close to the mean. This indicates a fairly even distribution of institutions by this measure.
Table 1: domestic higher education enrolments of Russell Group universities by broad level, 2010/11
Institution Postgrad
Undergrad Total
Pgradas %
oftotal
Cardiff University 4,945 18,400 23,345 21.2Imperial College 3,500 5,645 9,145 38.3King’s College London 6,250 13,010 19,260 32.5LSE 1,010 2,215 3,225 31.3Queen Mary and Westfield College 1,885 8,900 10,785 17.5The Queen’s University of Belfast 4,240 17,450 21,690 19.5The University of Birmingham 7,260 17,005 24,265 29.9The University of Bristol 3,435 12,355 15,790 21.8The University of Cambridge 4,110 10,200 14,310 28.7The University of Edinburgh 4,475 14,020 18,495 24.2The University of Exeter 2,875 10,685 13,560 21.2The University of Glasgow 3,725 18,220 21,945 17.0The University of Leeds 4,685 22,125 26,810 17.5The University of Liverpool 2,390 14,565 16,955 14.1The University of Manchester 6,645 23,275 29,920 22.2The University of Newcastle 3,245 12,515 15,760 20.6The University of Nottingham 5,450 21,135 26,585 20.5The University of Oxford 3,730 14,565 18,295 20.4The University of Sheffield 4,525 15,460 19,985 22.6The University of 3,780 14,175 17,955 21.1
4

Institution Postgrad
Undergrad Total
Pgradas %
oftotal
SouthamptonThe University of Warwick 5,770 13,825 19,595 29.4The University of York 2,610 10,190 12,800 20.4University College London 6,550 8,780 15,330 42.7University of Durham 2,780 10,220 13,000 21.4 Mean 4,161 13,706 17,867 23.3Standard deviation 1,611 5,049 6,103 7.1Relative standard deviation 39 37 34 30
Source: extracted from Higher Education Statistics Agency Limited) (2012) Students in higher education institutions 2010/11. http://www.hesa.ac.uk/component/option,com_pubs/Itemid,286/task,show_year/pubId,1/versionId,25/yearId,265/, Table 1 - all students by HE institution, level of study, mode of study and domicile 2010/11, last accessed 16 July 2012.
The standard deviation of the Russell Group’s total enrolmentswas 6,103, which is only just over a third of the mean. This indicates that there wasn’t much variation in Russell Group total enrolments. A formal comparison of the mean and standard deviation and hence of variation in values is the coefficient of variation, which is the ratio of the standard deviation to the mean or the standard deviation divided by the mean. The variation coefficient expressed as a percentage is the relativestandard deviation (RSD) –
(1) Relative standard deviation(RSD) =
Standarddeviation
X100
Mean 1
A relative standard deviation of less than 50 indicates very little dispersion, a coefficient of around 100 indicates
5

moderate dispersion and an RSD of more than 100 indicates considerable dispersion of values. It will be noted from Table 1 that in 2010/11 Russell Group universities were homogenous not only in their total number of domestic enrolments but also in their number and proportion of postgraduate enrolments.
The paper compares enrolment data in the UK, the US and Australia. These countries not only have different data collections, but different understandings of key terms such as ‘higher education’ and ‘university’. For the purposes of this paper ‘higher education’ is defined as bachelor program or above, which is consistent with the international standard classification of education (UNESCO, 2006; OECD, 2013, pp. 32-51). Because of differences in the definitions and even understandings of what is a university in the UK, Australia andin different states of the USA, the paper considers not universities but doctoral granting institutions. Doctoral granting institutions are somewhat and differently broader thanuniversities in the UK and Australia but are narrower than universities in the US. Each US doctoral program includes extensive coursework and advanced seminars which most institutions cannot afford to mount without an intake of at least five to ten new students in each field each year. In addition, several US states do not regulate the university title as restrictively as Australia and even the UK’s recently relaxed requirements, so several US universities do not offer doctoral programs. In the latest years for which data are available doctoral granting institutions enrolled 99 per cent of all higher education students in the UK, 94 per cent of higher education students in Australia but only 43 per cent of higher education students in the US.
We now consider the relative standard deviation of some basicenrolment data for UK higher education institutions which we will later compare with the same measure of similar data for USand Australian higher education institutions to form a view on the extent of differences in higher education institutions in the UK, US and Australia.
United Kingdom
The Higher Education Statistics Agency Limited publishes standard statistics on higher education enrolments in the UK. Data on domestic undergraduate and postgraduate enrolments in 2010/11 for each institution reported by the Agency as offering
6

a bachelor degree or above are summarized in Table 2. Institutions were analysed as the Agency listed them, although as the agency notes, 19 institutions are members of the University of London ‘confederation’, including King’s College London, LSE (London School of Economics and Political Science),Queen Mary and Westfield College, and University College Londonwhich are members of the Russell Group in their own right.
The relative standard deviation for the 154 UK doctoral granting institutions’ undergraduate enrolments in 2010/11 was 149. This is a very high value and indicates very considerable variation in the undergraduate size of UK doctoral granting institutions. This is because the UK has six doctoral granting agricultural and creative arts institutes with small undergraduate enrolments of around 500 or fewer, four universities with only postgraduate enrolments such as Cranfield and the London School of Hygiene and Tropical Medicine, as well as the very big Open University with 194,940 undergraduates. The RSD for UK doctoral granting institutions’ postgraduate enrolments is a modest 86, indicating relatively little variation in the size of postgraduate enrolments. Accordingly the RSD for proportion of postgraduates is also a relatively homogenous 84. The relative standard deviation for total enrolments of UK doctoral granting institutions was 133, which still indicates considerable variation in total institutional enrolments. However, the RSD for total enrolmentsof 133 is somewhat less than the RSD for undergraduate enrolments of 149, indicating that the variation in the size oftotal enrolments was moderated by the low variation of 86 in postgraduate enrolments.
Only ten UK higher education institutions don’t grant doctorates, most of which are creative arts academies, and two non doctoral granting academies supervise doctorates awarded bycollaborating universities. Non doctoral granting institutions increase UK institutions’ relative standard deviations by around 5 points, indicating that because of their small number they don’t add much to this measure of variation amongst UK higher education institutions.
Table 2: summary statistics on UK institutions’ domestic highereducation enrolments by broad level, 2010/11
7

Type of institution (number)
Postgrad
Undergrad Total
Postgradas % of
totalDoctoral granting institutions (154)
Total 374,0601,690,78
02,064,8
40 18Mean 2,429 10,979 13,408 23Standard deviation 2,097 16,364 17,773 19Relative standard deviation 86 149 133 84All institutions (164)
Total 375,0301,698,04
02,073,0
70 18Mean 2,287 10,354 12,641 23Standard deviation 2,108 16,044 17,482 19Relative standard deviation 92 155 138 85
Source: extracted from Higher Education Statistics Agency Limited) (2012) Students in higher education institutions 2010/11, retrieved 16 July 2012 from http://www.hesa.ac.uk/component/option,com_pubs/Itemid,286/task,show_year/pubId,1/versionId,25/yearId,265/, Table 1 - all students by HE institution, level of study, mode of study and domicile 2010/11
We now compare the variation amongst institutions by broad study load – whether their students study full time or part time (Table 3). Table 3 summarizes figures for all students studying onshore including international students, not just thedomestic students reported in Table 2. The inclusion of onshoreinternational students reduces the RSD for total enrolments in doctoral granting and non doctoral granting institutions from 133 and 138 to 113 and 119. This indicates that there is a moreeven distribution of international onshore students than domestic students, which might be the result of earlier government decisions to allocate places for domestic students preferentially to some institutions such as public universitiesand colleges.
The relative standard deviation for all UK higher education institutions’ number of part time students is a very high 325. This is because of the Open University which enrolled 208,705
8

onshore students in 2010/11, only 305 or 0.1 per cent of whom were full time. This is illustrated by the much lower RSD of 92when the Open University is excluded from the analysis. However, the Open University should not be excluded from the analysis as an outlier because it is just this significantly distinctive provision which the analysis is seeking to consider. There is reasonably low variation in the size of UK institutions’ onshore full time enrolments.
Table 3: summary statistics of UK higher education institutions’ onshore students by broad study load, 2010/11
Type of institution Full time Parttime Total
Full timeas % of
totalDoctoral granting institutions
Total 1,668,360 823,055 2,491,415 67
Mean 10,834 5,345 16,178 73Standard deviation 7,452 16,823 18,347 16Relative standard deviation 69 315 113 22
All institutions
Total 1,677,345 823,9552,501,30
0 67Mean 10,228 5,024 15,252 75Standard deviation 7,604 16,348 18,146 16Relative standard deviation 74 325 119 22All institutions without OU
Total 1,677,015 615,5452,292,56
0 73
Mean 10,288 3,776 14,065 75Standard deviation 7,587 3,466 9,944 15Relative standard deviation 74 92 71 20
Source: extracted from Higher Education Statistics Agency Limited (2012) Students in higher education institutions 2010/11, retrieved 16 July 2012 from http://www.hesa.ac.uk/component/option,com_pubs/Itemid,286/task,show_year/pubId,1/versionId,25/yearId,265/, Table 1 - all
9

students by HE institution, level of study, mode of study and domicile 2010/11
The UK’s Higher Education Statistics Agency reports on shore students by domicile, distinguishing between international students from other European Union countries and those from nonEU countries. This distinction is important in the UK because the European Union requires member states to charge students from other EU countries the same fees as the host country’s domestic students. There are therefore grounds for including students from other EU countries with domestic students, for including other EU students with non EU international students or for excluding them from the analysis. The treatment of otherEU students isn’t crucial because they are only 5.2 per cent ofall students (Table 4). In this paper other EU students are included with non EU international students because international students from EU countries require different recruitment, cultural and language support; and because they increase the diversity of the host institution almost as much as other international students. Furthermore, institutions outside the EU compete with UK and other institutions for students from other EU countries.
Table 4: onshore UK students by domicile, 2010/11
Measure UK OtherEU Non EU
Allinternati
onalTotal
Postgraduate Students 375,030 49,795 163,890 213,685 588,720% of all postgraduates 63.7 8.5 27.8 36.3 100.0
Undergraduate
Students 1,698,040 80,320 134,220 214,540 1,912,5
80% of all undergraduates 88.8 4.2 7.0 11.2 100.0
All students
Students 2,073,070 130,115 298,110 428,225 2,501,3
00% of all students 82.9 5.2 11.9 17.1 100.0
Source: extracted from Higher Education Statistics Agency Limited (2012) Students in higher education institutions
10

2010/11, retrieved 16 July 2012 from http://www.hesa.ac.uk/component/option,com_pubs/Itemid,286/task,show_year/pubId,1/versionId,25/yearId,265/, Table 1 - all students by HE institution, level of study, mode of study and domicile 2010/11
For the first time for 2010/11 the Higher Education Statistics Agency’s standard reports include off shore enrolments by institution. Usefully, the Agency reports off shore enrolments by type of off shore provision: off shore campus, partnership, flexible learning and other arrangements (Table 5).
Table 5: UK offshore students by type of offshore provision,2010/11
Students registeredat a UK HE institution
Overseas campus of reporting
HEI
Distance, flexible or distributed
learning
Other arrangement including
collaborative
provision
Total
Students 12,315 113,060 86,670 212,045% of students registered at a UK HE institution
5.8 53.3 40.9 100.0
Students studying for an award of a UK HE institution
Overseas partner
organisation
Other arrangement Total
Students 291,595 155 291,745% of students studying for an award of a UK HE institution
99.9 0.1 100.0
All off shore Campusbased
Flexiblelearning Other Total
Students 303,910 113,060 86,825 503,790% of all off shore 60.3 22.4 17.2 100.0
Source: Higher Education Statistics Agency Limited) (2012) Students in higher education institutions 2010/11, retrieved 16July 2012 from
11

http://www.hesa.ac.uk/component/option,com_pubs/Itemid,286/task,show_year/pubId,1/versionId,25/yearId,265/, Table 21 - students studying wholly overseas by HE institution and type ofactivity 2010/11
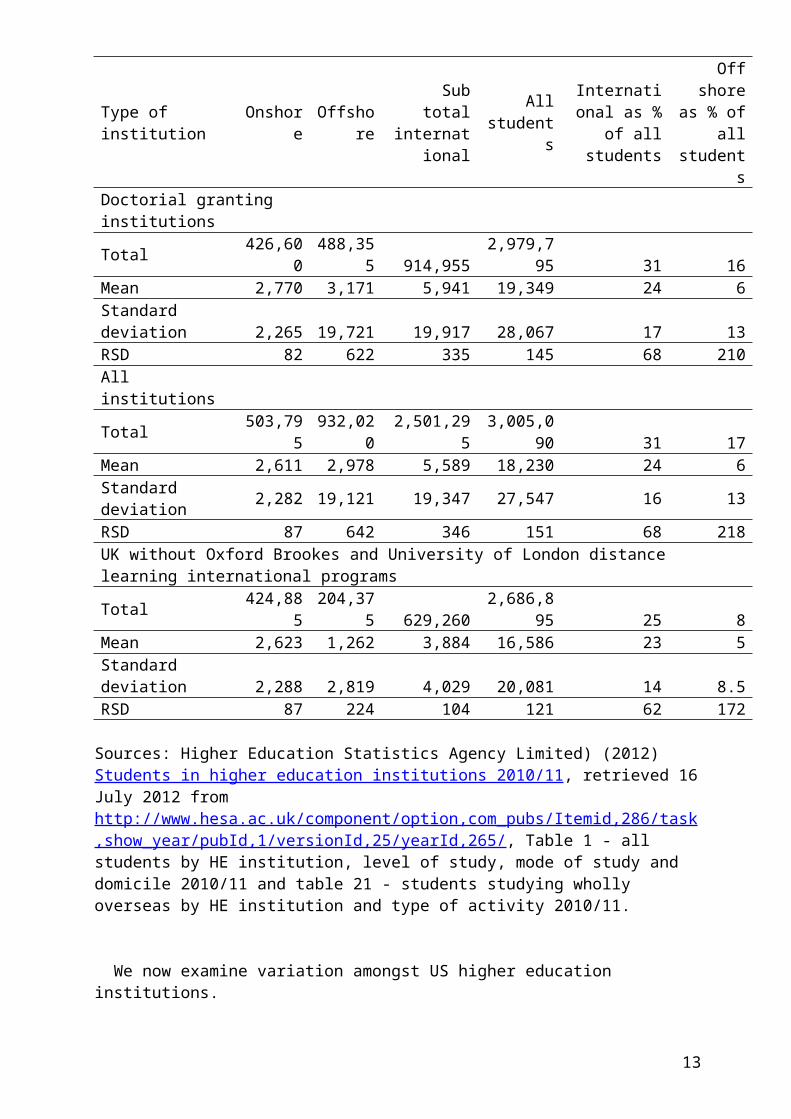
Aggregating international student enrolments at UK higher education institutions into onshore and offshore will allow us to compare them later with the figures available in standard Australian statistical reports. The aggregated summary statistics for the UK are given in Table 6. We note that the relative standard deviation (RSD) for off shore international students for all institutions is a very high 642. This is due mainly to Oxford Brookes University which enrolled 239,945 offshore international students in 2010/11, mostly with an overseas partner on Association of Chartered Certified Accountants programs. It will also be noted further that all institutions’ relative standard deviation for offshore international students as a proportion of all students is a high 218. This is due mostly to the University of London’s distance learning international programs which enrolled 44,050 international students offshore in 2010/11 but only 410 students onshore. Excluding Oxford Brookes and London’s international distance learning programs lowers UK institutions’ relative standard deviations, but again, excluding these institutions excludes the very variability thatthis analysis seeks to consider. There is little variation in UK institutions’ international students as a proportion of all students, with an RSD of 68. However, there is considerable variety in UK institutions’ proportion of off shore international students, with RSDs of 210 and 218. From this we may conclude that while many UK institutions have similar proportions of international students on shore, off shore provision is much more variable.
Table 6: summary statistics of UK institutions’ international on shore and off shore enrolments, 2010/11
12
Type of institution
Onshore
Offshore
Subtotal
international
Allstudent
s
International as %
of allstudents
Offshore
as % ofall
students
Doctorial granting institutions
Total 426,600
488,355 914,955
2,979,795 31 16
Mean 2,770 3,171 5,941 19,349 24 6Standard deviation 2,265 19,721 19,917 28,067 17 13RSD 82 622 335 145 68 210All institutions
Total 503,795
932,020
2,501,295
3,005,090 31 17
Mean 2,611 2,978 5,589 18,230 24 6Standard deviation 2,282 19,121 19,347 27,547 16 13
RSD 87 642 346 151 68 218UK without Oxford Brookes and University of London distance learning international programs
Total 424,885
204,375 629,260
2,686,895 25 8
Mean 2,623 1,262 3,884 16,586 23 5Standard deviation 2,288 2,819 4,029 20,081 14 8.5RSD 87 224 104 121 62 172
Sources: Higher Education Statistics Agency Limited) (2012) Students in higher education institutions 2010/11, retrieved 16July 2012 from http://www.hesa.ac.uk/component/option,com_pubs/Itemid,286/task,show_year/pubId,1/versionId,25/yearId,265/, Table 1 - all students by HE institution, level of study, mode of study and domicile 2010/11 and table 21 - students studying wholly overseas by HE institution and type of activity 2010/11.
We now examine variation amongst US higher education institutions.
13

United States of America
Enrolment data for US higher education institutions were obtained from the US Department of Education’s integrated postsecondary education data system. The Ipeds data center allows one to extract data on institutions on one of several variables. For this analysis data were extracted for public, private not for profit and private for profit four year institutions or above. This selected institutions which offereda baccalaureate or above.
Data were extracted for the 2,959 institutions that participated in federal financial aid programs, that is, whose students were eligible for federal grants and loans. The Department reports data on an additional 47 or 1.6 per cent of institutions which do not participate in Title IV grants. Theseweren’t included in the analysis because some US states don’t have any substantial quality assurance for higher education andTitle IV eligibility is a useful indicator of meeting minimal standards. While this reduces the heterogeneity of the US data somewhat, diploma mills and other non Title IV participating institutions are probably undesirable heterogeneity.
Some 14 or 0.5 per cent of institutions reported no enrolmentdata so the final list had 2,945 institutions. There were 295 title IV institutions which were classified in the 2010 Carnegie classification as a doctoral/research university, research university (high research activity) or research university (very high research activity). Enrolments were extracted for Fall 2010, which are like enrolments at 1 August in the UK or first semester enrolments in Australia.
Results for domestic enrolments by broad level of study are summarized in Table 7. It will be noted that while there is considerable variation amongst doctoral granting institutions with relative standard deviations around 100, they are half as heterogeneous as all higher education institutions, which have relative standard deviations around 200.
Table 7: summary statistics of institutions’ domestic higher education enrolments by broad level, Fall 2010
14

Type of institution (number)
Postgrad Undergrad TotalPostgradas % oftotal
Doctoral granting institutions (295 institutions)Total 1,421,879 4,011,616 5,433,495 26Mean 4,820 13,599 18,419 31Standard deviation 4,866 16,609 20,115 19RSD 101 122 109 62All institutions (2,945)
Total 2,659,013 10,321,078
12,980,091 21
Mean 903 3,505 4,408 23Standard deviation 2,255 7,527 9,236 31
RSD 250 215 210 135
Source: Integrated Postsecondary Education Data System (2012) Race/ethnicity, gender, attendance status, and level of student, data extracted 26 July 2012 from http://nces.ed.gov/ipeds/datacenter/, Race/ethnicity, gender, attendance status, and level of student
The results for broad study load are set out in Table 8. It will be noted that the variation in the numbers of full time, part time and total enrolments follow the pattern we have already observed, with variation amongst doctoral granting institutions, but about twice as much variation amongst all institutions. However, both doctoral granting and all four yearinstitutions are not varied by proportion of full time students, with most institutions having about 75 per cent full time students. This is because most part time higher education students are enrolled in two year or community colleges and fewfour year colleges and universities specialize in part time students.
Table 8: summary statistics of institutions’ students by broadstudy load, Fall 2010
Type of Full time Part Total Full time
15

institution time as % oftotal
Doctoral granting institutions
Total 4,649,065 1,184,745 5,833,810 80
Mean 15,760 4,016 19,776 77Standard deviation 20,036 3,712 20,907 14
RSD 127 92 106 19All institutions
Total 9,902,860 3,683,585
13,586,445 73
Mean 3,368 1,251 4,613 75Standard deviation 8,155 3,065 9,662 22
RSD 242 245 209 29
Source of US data: Integrated Postsecondary Education Data System (2012) Race/ethnicity, gender, attendance status, and level of student, data extracted 26 July 2012 from http://nces.ed.gov/ipeds/datacenter/, Race/ethnicity, gender, attendance status, and level of student
Unfortunately the US publishes data only for onshore international students. The summary statistics are shown in Table 9, which follow the patterns we have observed with domestic enrolments by broad study level.
Table 9: summary statistics of institutions’ onshore international students as a proportion of all onshore students,Fall 2010
Type of institution
Onshoreinternation
al
All onshorestudents
Onshoreinternational as
% of allstudents
Doctoral granting institutionsTotal 400,315 5,833,810 6.9Mean 1,357 19,776 7.1Standard deviation 1,428 20,907 6
16

Type of institution
Onshoreinternation
al
All onshorestudents
Onshoreinternational as
% of allstudents
RSD 105 106 86All institutionsTotal 606,354 13,586,445 4.5Mean 206 4,613 3.3Standard deviation 627 9,662 6.4
RSD 305 209 194
Source of US data: Integrated Postsecondary Education Data System (2012) Race/ethnicity, gender, attendance status, and level of student, data extracted 26 July 2012 from http://nces.ed.gov/ipeds/datacenter/, Race/ethnicity, gender, attendance status, and level of student
We now examine variation amongst Australian higher education institutions.
Australia
Unfortunately the Australian Government’s higher education statistics do not include all enrolments of all private providers. The Australian Government doesn’t collect statisticsfrom about 50 private providers whose students are not eligiblefor government guaranteed and subsidized income contingent loans for tuition fees. It seems that some private institutionsthat report statistics report only their students supported by government loans and not their domestic students who do not take out a government loan nor international students. So the figures understate private providers’ enrolments. A further methodological limit is that while the Australian Government department responsible for higher education published full enrolment data on non university providers until 2009, thereafter it has published only summary data for these institutions. So this analysis considers institutions’ enrolments for the most recent year for which the department published full enrolment data, 2009.
17

Table 10 shows summary statistics for domestic enrolments in Australian higher education institutions by broad level of program for 2009. It will be noted that as in the US, Australian non doctoral higher education institutions approximately doubled the variation in postgraduate, undergraduate and total enrolments and proportion of postgraduate enrolments.
Table 10: summary statistics for Australian institutions’ domestic higher education enrolments by broad level, 2009
Type of institution (number)
Postgrad
Undergrad Total
Postgradas % of
totalDoctoral granting institutions (48)
Total 191,573 571,361 762,934 25
Mean 3,991 11,903 15,894 28Standard deviation 3,341 8,353 11,354 18Relative standard deviation 84 70 71 65
All institutions (114 institutions)
Total 197,619 594,408 792,027 25
Mean 1,734 5,214 6,948 21
Standard deviation 2,910.3 7,877.9 10,614.0 27
Relative standard deviation 168 151 153 128
Source: extracted from Department Education, Employment and Workplace Relations (2010) Students 2009 full year, retrieved 10 December 2010 from http://www.deewr.gov.au/HigherEducation/Publications/HEStatistics/Publications/Pages/2009FullYear.aspx, Table 2.6: all domestic students by State, higher education provider and broadlevel of course, full year 2009.
In broad study load we see a similar pattern of moderate dispersion amongst doctoral granting institutions but very high
18

dispersion amongst all higher education institutions. However, for both groups there is little variation in the proportion of full time students, indicating that institutions have similar proportions of full time students whatever their type.
Table 11: summary statistics for Australian institutions bybroad study load, 2009
Type of institution (number) Full time Part
time TotalFull timeas % of
totalDoctoral granting institutions
Total 745,354 316,772 1,062,126 70
Mean 15,528 6,599 22,128 68Standard deviation 12,264 4,959 16,336 16Relative standard deviation 79 75 74 24
All institutions
Total 794,452 340,4141,134,86
6 70Mean 6,908 2,960 9,868 66Standard deviation 10,832 4,481 14,895 24Relative standard deviation 157 151 151 36
Source: extracted from Department Education, Employment and Workplace Relations (2010) Students 2009 full year, retrieved 10 December 2010 from http://www.deewr.gov.au/HigherEducation/Publications/HEStatistics/Publications/Pages/2009FullYear.aspx, Table 2.7: all students by State, higher education provider, mode of attendance, type of attendance and gender, full year 2009
We now consider variations in Australian higher education institutions’ numbers of onshore and offshore international students (Table 12). There is somewhat more variation in Australian institutions’ number of international students than
19

other measures we have considered, but there is much greater variation in the number and proportion of off shore international students than in the other measures considered. The relative standard deviation for number of off shore international students is a very high 187 for doctoral institutions, compared to these institutions’ coefficients for full time students (79) and postgraduate students (84), and similarly with proportion of offshore students. There is even greater variation in number of offshore students amongst all institutions, with a very high relative standard deviation of 304 compared with these institutions’ coefficients for full time students (157) and postgraduate students (168).
Table 12: summary statistics for Australian institutions by international on shore and off shore enrolments, 2009
Type of institution Onshore Offshor
e
Sub totalinternati
onal
International as %
of allstudents
Offshore as% of allstudents
Doctoral granting institutionsTotal 222,924 73,650 296,574 28 7Mean 4,644 1,534 6,179 25 5Standard deviation 3,895 2,874 5,599 15 7
RSD 84 187 91 61 136All institutionsTotal 245,593 75,377 320,970 29 7Mean 2,136 656 2,791 29 3Standard deviation 3,341 1,994 4,649 32 8
RSD 157 304 167 112 267
Sources: extracted from Department Education, Employment and Workplace Relations (2010) Students 2009 full year, retrieved 10 December 2010 from http://www.deewr.gov.au/HigherEducation/Publications/HEStatistics/Publications/Pages/2009FullYear.aspx, Table 2.5: all students by State, higher education provider and broad level ofcourse, full year 2009 and table 7.7: commencing and all overseas students by State, higher education provider and onshore/offshore status, full year 2009
20

We are now able to compare variations in higher education institutions in the UK, US and Australia.
Comparison of UK, US and Australian doctoral granting institutions
We first compare summary statistics for UK, US and Australiandoctoral granting institutions’ domestic higher education enrolments by broad level (Table 13). We note, first, that the average domestic enrolment of Australian doctorial granting institutions (15,894 students) is bigger than that for the UK (13,408) but less than that for the US (18,419). We next note that domestic postgraduate students are about a quarter of students at all doctoral granting institutions in Australia andthe US, but that they are rather lower in the UK (18%).
Considering numbers of postgraduate students, there is moderate variation in UK and Australian doctoral institutions, with a relative standard deviation of around 85, but US doctoral institutions are more diverse with a relative standarddeviation of 101. This is partly due to the University of Phoenix, which has 307,965 enrolments, only 18 per cent of whomare postgraduate. UK and US doctoral institutions have considerable variations in their numbers of undergraduate students (coefficients of 149 and 122), much higher than Australian doctoral granting institutions (70). In proportion of postgraduates UK doctoral institutions have somewhat more variation (coefficient of 84) than Australian (65) and US (62) institutions.
Table 13: summary statistics for Australian, UK and US doctoralgranting institutions’ domestic higher education students by broad level
21

Country Postgrad
Undergrad Total
Postgradas % of
totalAustralia, 2009 (48 institutions)Total 191,573 571,361 762,934 25Mean 3,991 11,903 15,894 28Standard deviation 3,341 8,353 11,354 18Relative standard deviation 84 70 71 65
UK, 2010/2011 (154 institutions)
Total 374,0601,690,78
02,064,8
40 18Mean 2,429 10,979 13,408 23Standard deviation 2,097 16,364 17,773 19Relative standard deviation 86 149 133 84US, Fall 2010 (295 institutions)
Total 1,421,879
4,011,616
5,433,495 26
Mean 4,820 13,599 18,419 31Standard deviation 4,866 16,609 20,115 19Relative standard deviation 101 122 109 62
Table 14 examines all enrolments of doctoral granting institutions (not just domestic students) by broad study load. UK doctoral institutions have an average total enrolment of 16,178 students, rather smaller than US (19,776 students) and much smaller than Australian (22,126) institutions. Full time students are 67 per cent of UK doctoral institutions’ total enrolments, not much different from Australia (70 per cent) butboth are much less than the US (80 per cent) where most part time students enrol in two year or community colleges. UK doctoral institutions are very varied in their total enrolments(coefficient of 113), just a little more than the US (106) and rather more than Australia (74). There is very considerable variation in UK doctoral institutions’ number of part time students (coefficient of 315) which we saw was due mostly to the UK Open University’s very big enrolment of part time students.
22

Table 14: summary statistics for Australian, UK and US doctoralinstitutions’ students by broad study load
Country Full time Parttime Total
Full timeas % of
totalAustralia, 2009 (48 institutions)
Total 745,354 316,772 1,062,126 70
Mean 15,528 6,599 22,128 68Standard deviation 12,264 4,959 16,336 16Relative standard deviation 79 75 74 24
UK, 2010/2011 (154 institutions)
Total 1,668,360 823,055 2,491,415 67
Mean 10,834 5,345 16,178 73Standard deviation 7,452 16,823 18,347 16Relative standard deviation 69 315 113 22
US, Fall 2010 (295 institutions)
Total 4,649,065 1,184,745
5,833,810 80
Mean 15,760 4,016 19,776 77Standard deviation 20,036 3,712 20,907 14Relative standard deviation 127 92 106 19
As we see from Table 15, UK doctoral institutions have an average of 2,700 on shore international students, more than double US doctoral institutions (1,357) but rather fewer than Australia (4,644). Consequentially, onshore international students are a higher proportion of all onshore students in UK doctoral institutions (17 per cent) than US institutions (6.9 per cent) but rather lower than in Australian institutions (23 per cent). UK and Australian institutions have rather less variation than US institutions in their number and proportion of onshore international students.
23

Table 15: summary statistics for Australian, UK and US doctoralgranting institutions’ onshore international students as a proportion of all onshore students
CountryOnshore
international
All onshorestudents
Onshoreinternational as
% of allstudents
Australia, 2009 (48 institutions)Total 222,924 972,485 23Mean 4,644 20,260 21Standard deviation 3,895 14,569 14
RSD 84 72 65UK, 2010/2011 (154 institutions)Total 426,600 2,491,440 17Mean 2,770 16,178 19Standard deviation 2,265 18,348 13RSD 82 113 66US, Fall 2010 (295 institutions)Total 400,315 5,833,810 6.9Mean 1,357 19,776 7.1Standard deviation 1,428 20,907 6.1
RSD 105 106 86
Next we make the same comparisons of all higher education institutions.
Comparison of UK, US and Australia: all institutions
24

All UK higher education institutions have on average 12,641 domestic students, almost three times the mean for all US institutions (4,408) and almost double the mean for all Australian institutions (6,948) (Table 16). This is because the UK has very few non doctoral granting institutions in contrast tothe US which has a large number of very small non doctoral granting institutions. Consequentially, while all UK higher education institutions had considerable variation in their total enrolments with a relative standard deviation of 138, this was rather less than Australia (153) and much less than the US (201).Similarly in domestic postgraduates as a proportion of all domestic students: the UK is not so variable with a coefficient of 85, and much less so than Australia (128) and the US (135). The UK has a large number of small institutions with substantial postgraduate enrolments, such as the performing arts academies, and has no institution with no postgraduate student. In contrast,40 or over a third of Australian institutions had no domestic postgraduate enrolment in 2009. So the UK’s proportion of domestic postgraduate students has a substantially lower relativestandard deviation
Table 16: summary statistics for Australian, UK and US higher education institutions’ domestic higher education enrolments bybroad level
Country Postgrad
Undergrad Total
Postgradas % of
totalAustralia, 2009 (114 institutions)Total 197,619 594,408 792,027 25Mean 1,734 5,214 6,948 21Standard deviation 2,910 7,878 10,614 27Relative standard deviation 168 151 153 128
UK, 2010/2011 (164 institutions)
Total 375,0301,698,04
02,073,07
0 18Mean 2,287 10,354 12,641 23Standard deviation 2,108 16,044 17,482 19Relative standard 92 155 138 85
25

Country Postgrad
Undergrad Total
Postgradas % of
totalAustralia, 2009 (114 institutions)deviationUS, Fall 2010, (2,945 institutions)
Total 2,659,013
10,321,078
12,980,091 21
Mean 903 3,505 4,408 23Standard deviation 2,255 7,527 9,236 31Relative standard deviation 250 215 210 135
The average size of all UK higher education institutions of 15,252 students is rather bigger than that for Australian higher education institutions (9,868) and much bigger than the US (4,613) (Table 17). This is because the UK has very few private institutions, which tend to be small, and the US has very many. There is reasonable variation in UK institutions’ number of full time and total students, but rather less than Australia and much less than the US. This is because all but three or 2.6 per cent of Australia’s 114 higher education institutions enrolled some part time students. In contrast 279 or 9.5 per cent of US higher education institutions enrolled only full time students. UK institutions have considerable variation by part time students because of the Open University.However, by proportion of full time students Australian institutions have more variation than both the UK and the US. This is because Australia has several private higher education institutions with only 20 per cent full time students and several more with fewer than half full time students.
Table 17: summary statistics for Australian, UK and US higher education institutions by broad study load
Country Fulltime
Parttime Total
Full timeas % of
totalAustralia, 2009 (114 institutions)
26

Total 794,452 340,4141,134,86
6 70Mean 6,908 2,960 9,868 66Standard deviation 10,832 4,481 14,895 24Relative standard deviation 157 151 151 36UK, 2010/2011 (164 institutions)
Total 1,677,345 823,955
2,501,300 67
Mean 10,228 5,024 15,252 75Standard deviation 7,604 16,348 18,146 16Relative standard deviation 74 325 119 22US, Fall 2010, (2,945 institutions)
Total 9,902,860
3,683,585
13,586,445 73
Mean 3,368 1,251 4,613 75Standard deviation 8,155 3,065 9,662 22Relative standard deviation 242 245 209 29
UK and Australian higher education institutions have an average of over 2,000 international onshore students, almost ten times the average for the US (206) (Table 18).
International onshore students are 17 per cent for all onshore students in the UK, much higher than the US (4.5 per cent) but rather lower than Australia (24 per cent). UK institutions show less variation than Australian institutions and much less variation than US institutions in number of onshore international students, number of all onshore students and proportion of international students.
Table 18: summary statistics for Australian, UK and US higher education institutions’ onshore international students as a proportion of all onshore students
27

CountryOnshore
international
Allonshorestudents
Onshoreinternational as
% of allstudents
Australia, 2009 (114 institutions)Total 245,593 1,023,406 24Mean 2,136 8,899 27Standard deviation 3,341 13,470 32Relative standard deviation 156.5 151.4 120
UK, 2010/2011 (164 institutions)Total 428,225 2,501,295 17Mean 2,611 15,252 19Standard deviation 2,282 18,146 13Relative standard deviation 87.4 119.0 66US, Fall 2010, (2,945 institutions)
Total 606,354 13,586,445 4.5
Mean 206 4,613 3.3Standard deviation 626.9 9,662.0 6.4Relative standard deviation 304.5 209.4 194
Discussion
On the statistical measures considered here there is somewhat more variation in UK doctoral granting institutions than Australian doctoral granting institutions but rather less variation than US doctoral granting institutions. While Australia has some small specialist religious doctoral grantinginstitutions, the UK has more in other specialized fields such as the creative arts and the US has several small specialized graduate doctoral granting universities. Very big and distinctive institutions such as the UK’s Open University with 208,400 part time students, Oxford Brookes University with 239,945 offshore international students and the University of Phoenix with 307,965 full time students greatly increase the statistical variation in institutions’ enrolments measured by the relative standard deviation.
28

Australia has long modelled its higher education on UK highereducation, and more recently the two countries have followed similar directions in their higher education. Australia followed the UK in establishing a binary divide between universities and non research higher education institutions (called polytechnics in the UK and colleges of advanced education in Australia) but dismantled its binary divide in 1988, some four years earlier than the UK dismantled its binarydivide in 1992. However, Australia’s dismantling was achieved by establishing a ‘unified national system’ of higher educationwhich set conditions for being funded directly by the national government and for receiving block institutional research grants. The UK national government set no such condition, and accordingly it has several universities such as Cranfield and colleges and institutes of the University of London which wouldnot have been granted full independent and research status in Australia’s unified national system.
On the other hand, many Australian private providers expanded strongly with the explosion of international education from themid 1990s. In 2005 the Australian Government extended government guaranteed and subsidized income contingent loans toprivate higher education institutions. This supported the growth of private higher education providers and their enrolments of domestic students, although it is difficult to calculate the extent of this effect because the providers were not previously required to report their enrolment data. A longitudinal study of Australia using the same method found that on the same measures considered here Australian higher education institutions became somewhat less varied from 1987, the year before the establishment of the unified national system of higher education, to 1999, a decade after the establishment of the unified national system. But by 2009 the expansion of private providers meant variation had increased onboth 1987 and 1999 levels (Moodie, 2013b, p. 75).
In contrast, the UK Government did not introduce income contingent loans until 2006. By the most recent data consideredhere the UK government had made income contingent loans accessible to students at few private institutions, and since places had been rationed to cap expenditure on tuition fee loans and student income support, income contingent loans for private providers in the UK were about as rare as Commonwealth supported places for private providers in Australia.
29

Consequently, the UK has relatively few private higher education providers.
The US federal government first established student loans in the 1950s in response to Sputnik, and hence made them availableonly in engineering, science and education. The federal government greatly broadened and extended student loans in the 1960s. The US has therefore subsidized enrolments in private institutions for much longer than Australia and the UK and accordingly it has many more private institutions. Some US state governments distinguish between different types of highereducation institutions which offer baccalaureates and the Carnegie Foundation introduced an influential categorisation ofhigher education institutions in 1973. But there has been no widespread categorization and recategorization of US higher education institutions similar to the establishment and dismantling of the binary divides in Australia and the UK.
Of course the statistical enrolment measures considered here offer a very limited and partial view of variations amongst higher education institutions. Other obvious non categorical variables that could be examined are of research performance. For example, Weingarten and colleagues (2013) included in theirdata set to inform the differentiation discussion in Ontario each institution’s number of PhDs granted, sponsored research income, number of publications, number of citations and mean standardized h score, which is a combined measure of the numberand citations of research publications (Hirsch, 2005). An author has an h index of 20 if they published 20 papers with atleast 20 citations. Since citation rates vary markedly by discipline Weingarten and colleagues (2013, p. 13) used h scores standardized by discipline.
Another important characteristics of higher education institutions are the fields in which they teach and research, and this is often understood to be distinctive of many institutions. Lepori, Baschung and Probst (2010) analysed data on students, PhDs, staff and publication of 242 higher education institutions in Finland, Italy, the Netherlands, Norway, Switzerland and the United Kingdom. Fields of teaching and research are categories and an analysis may be sensitive toits categorization of fields. Lepori, Baschung and Probst grouped fields in four broad domains of medical sciences, engineering and technology, natural sciences, and social sciences and humanities. They found five categories of
30

specialist higher education institutions and three categories of generalist institution: those with strong medicine, some medicine and no medicine (Lepori, Baschung and Probst, 2010, p.86). An analysis of Australia’s 37 public universities by ten fields’ proportion of student load and research performance found considerable variation of institutions by field and that fields of teaching concentration and research performance do not coincide for most institutions (Moodie, 2013a). But arguably even this analysis is too general: the international standard classification of education (UNESCO, 2006, p. 41) has 25 fields of education and the Frascati manual (OECD, 2002) has20 sub fields within six major fields for classifying research.
Notwithstanding its limitations this study it offers some evidence to evaluate Birnbaum’s (1983, pp. 149-182) argument that government planning inhibits institutional diversity whichHuisman (1995, p. 12) contrasts with the archetypical government regulation of higher education for diversity, the California master plan for higher education. We have seen that the variety of institutions in the US, Australia and the UK is associated with the availability of government grants and loansto help students and their parents pay for the cost of higher education. The US federal government has made its grants and loans available to students of private institutions equally with those of public institutions since the 1950s and 60s. Thishas supported a great variety of institutions by size and specialization. Australian private higher education institutions expanded greatly with the explosion of international education from the mid 1990s and were further supported with the availability of government guaranteed and subsidized loans for their students from 2005. This has supported moderate dispersion of enrolments amongst Australian institutions. There is much less variety amongst institutions in the UK where government loans and grants to students of private institutions have been much more limited.
If this is right two propositions may be suggested. First, theextent of government involvement in higher education isn’t so important for institutional variety as the form which it takes.Birnbaum observed high diversity amongst US institutions and that this didn’t change noticeably despite a great expansion ofthe sector over two decades. But of course the diversity of US institutions at the first stage of Birnbaum’s study in 1960 wassupported by federal financial aid and the expansion of the sector and the maintenance of its diversity was importantly
31

financed by extensive government involvement. More tentatively,one may suggest that the more limited the range of institutionsfor which government funding is available directly or indirectly the stronger government involvement is needed to have variety among the limited range of institutions for which government financial support is available.
References
Andrews, L., Aungles, P., Baker, S. and Sarris, A. (1998) Characteristics and performance of higher education institutions (A preliminary investigation). Canberra: DEETYA. http://citeseerx.ist.psu.edu/viewdoc/download?doi=10.1.1.86.1610&rep=rep1&type=pdf, last accessed 4 August 2013.
Birnbaum, R. (1983) Maintaining diversity in higher education. San Francisco: Jossey-Bass.
Conway, C., Zhao, H. and Montgomery, S. (2011) The NSSE national data project report. Toronto: Higher Education QualityCouncil of Ontario, http://www.heqco.ca/en-ca/research/research%20publications/Pages/Summary.aspx?link=01&title=The%20NSSE%20National%20Data%20Project%20Report, last accessed 4 August 2013.
Hirsch, J. E. (2005) An index to quantify an individual's scientific research output. Proceedings of the National Academy of Sciences of the United States of America, volume 102, pages 16569–16572.
Huisman, J. (1995) Differentiation and diversity in higher education systems. Center for Higher Education Policy Studies, University of Twente. http://www.academia.edu/280441/Differentiation_Diversity_and_Dependency_In_Higher_Education_A_Theoretical_and_Empirical_Analysis, last accessed 3 August 2013.
Huisman, Jeroen (2000) Higher education institutions: as different as chalk and cheese? Higher Education Policy, volume 13, pages 41-53.
Huisman, J., Meek, L. and Wood, F. (2007) Institutional diversity in higher education: a cross-national and longitudinal analysis. Higher Education Quarterly, 61 (4), pp. 563–577.
32

Lepori, B., Baschung, L. and Probst, C. (2010) Patterns of subject mix in higher education institutions: a first empiricalanalysis using the AQUAMETH database. Minerva, 48, pp. 73–99.Moodie, G. (2013a) Australian public universities’ diversity onshore by broad fields of education. Melbourne: Martin Institute. http://www.lhmartininstitute.edu.au/insights-blog/2013/08/141-australian-public-universities-diversity-onshore-by-broad-fields-of-education, last accessed 10 August 2013.
Moodie, G. (2013b) System uniformity, The Dawkins revolution 20 years on. Croucher, G, Marginson, S., Norton, A. and Wells, J. (eds.). Carlton: Melbourne University Press, pp. 75-90.
Morphew, C.C. (2009) Conceptualizing change in the institutional diversity of U.S. colleges and universities. The Journal of Higher Education, 80 (3), pp. 243-269.
Nature Education (2013) Glossary. http://www.nature.com/scitable/definition/species-312, last accessed 4 August 2013.
OECD (Organisation for Economic Co-operation and Development) (2002) Frascati Manual: proposed standard practice for surveys on research and experimental development, 6th edition. Retrieved 27 May 2012 from www.oecd.org/sti/frascatimanual
OECD (Organisation for Economic Co-operation and Development) (2013) Classification of tertiary programmes, Chapter A: The output of educational institutions and the impact of learning, Annex 3: Sources, methods and technical notes, Education at a Glance. OECD Indicators 2013. http://www.oecd.org/edu/eag.htm, last accessed 26 June 2013.
Stanley, G. and Reynolds, P. (1994) Similarity grouping of Australian universities. Higher Education, 27 (3), pp. 359-366.
The British Ecological Society (2013) About ecology. http://www.britishecologicalsociety.org/about-ecology/, last accessed 4 August 2013.
UNESCO (United Nations Educational, Scientific and Cultural Organization) (2006) International Standard Classification of Education. ISCED 1997.
33

http://www.uis.unesco.org/Education/Pages/international-standard-classification-of-education.aspx, last accessed 22 March 2012.
Weingarten, H. P., Hicks, M., Jonker, L. and Liu, S. (2013) Thediversity of Ontario’s universities: a data set to inform the differentiation discussion. Toronto: Higher Education Quality Council of Ontario. http://www.heqco.ca/en-CA/Research/Research%20Publications/Pages/Summary.aspx?link=108, last accessed 24 July 2013.
34