Household-level determinants of residential solid waste generation rates: a study from...
11
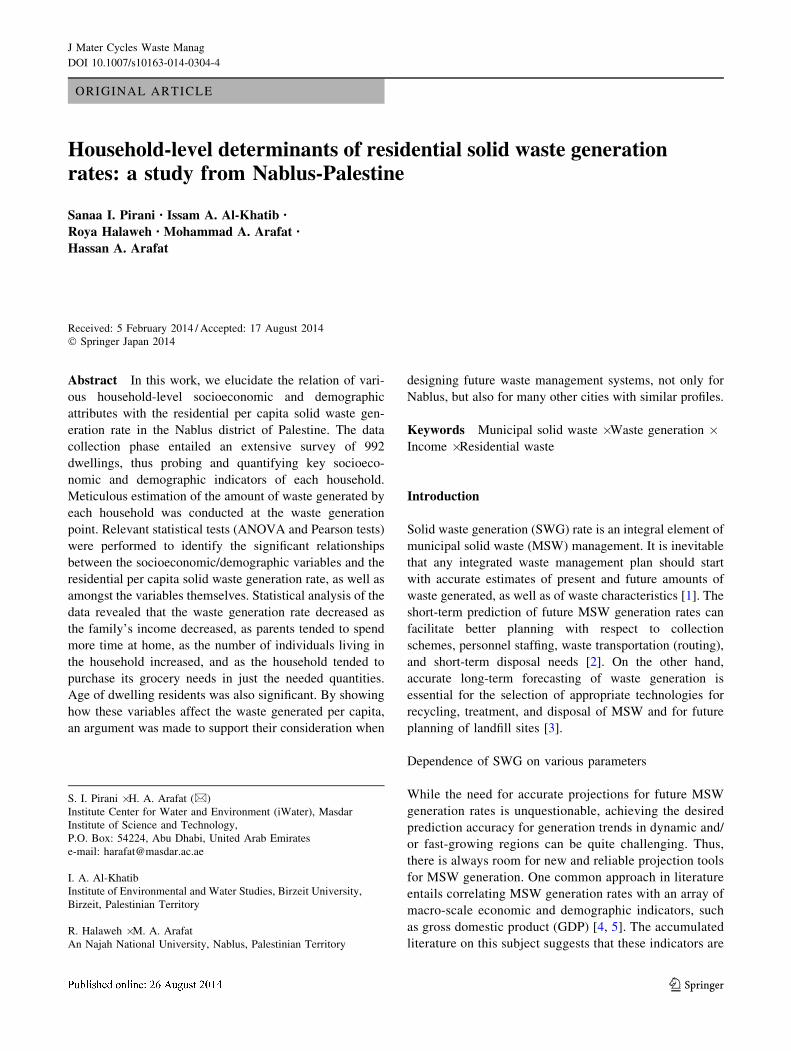
ORIGINAL ARTICLE Household-level determinants of residential solid waste generation rates: a study from Nablus-Palestine Sanaa I. Pirani • Issam A. Al-Khatib • Roya Halaweh • Mohammad A. Arafat • Hassan A. Arafat Received: 5 February 2014 / Accepted: 17 August 2014 Ó Springer Japan 2014 Abstract In this work, we elucidate the relation of vari- ous household-level socioeconomic and demographic attributes with the residential per capita solid waste gen- eration rate in the Nablus district of Palestine. The data collection phase entailed an extensive survey of 992 dwellings, thus probing and quantifying key socioeco- nomic and demographic indicators of each household. Meticulous estimation of the amount of waste generated by each household was conducted at the waste generation point. Relevant statistical tests (ANOVA and Pearson tests) were performed to identify the significant relationships between the socioeconomic/demographic variables and the residential per capita solid waste generation rate, as well as amongst the variables themselves. Statistical analysis of the data revealed that the waste generation rate decreased as the family’s income decreased, as parents tended to spend more time at home, as the number of individuals living in the household increased, and as the household tended to purchase its grocery needs in just the needed quantities. Age of dwelling residents was also significant. By showing how these variables affect the waste generated per capita, an argument was made to support their consideration when designing future waste management systems, not only for Nablus, but also for many other cities with similar profiles. Keywords Municipal solid waste Á Waste generation Á Income Á Residential waste Introduction Solid waste generation (SWG) rate is an integral element of municipal solid waste (MSW) management. It is inevitable that any integrated waste management plan should start with accurate estimates of present and future amounts of waste generated, as well as of waste characteristics [1]. The short-term prediction of future MSW generation rates can facilitate better planning with respect to collection schemes, personnel staffing, waste transportation (routing), and short-term disposal needs [2]. On the other hand, accurate long-term forecasting of waste generation is essential for the selection of appropriate technologies for recycling, treatment, and disposal of MSW and for future planning of landfill sites [3]. Dependence of SWG on various parameters While the need for accurate projections for future MSW generation rates is unquestionable, achieving the desired prediction accuracy for generation trends in dynamic and/ or fast-growing regions can be quite challenging. Thus, there is always room for new and reliable projection tools for MSW generation. One common approach in literature entails correlating MSW generation rates with an array of macro-scale economic and demographic indicators, such as gross domestic product (GDP) [4, 5]. The accumulated literature on this subject suggests that these indicators are S. I. Pirani Á H. A. Arafat (&) Institute Center for Water and Environment (iWater), Masdar Institute of Science and Technology, P.O. Box: 54224, Abu Dhabi, United Arab Emirates e-mail: [email protected] I. A. Al-Khatib Institute of Environmental and Water Studies, Birzeit University, Birzeit, Palestinian Territory R. Halaweh Á M. A. Arafat An Najah National University, Nablus, Palestinian Territory 123 J Mater Cycles Waste Manag DOI 10.1007/s10163-014-0304-4
-
Upload
independent -
Category
Documents
-
view
2 -
download
0
Transcript of Household-level determinants of residential solid waste generation rates: a study from...
ORIGINAL ARTICLE
Household-level determinants of residential solid waste generationrates: a study from Nablus-Palestine
Sanaa I. Pirani • Issam A. Al-Khatib •
Roya Halaweh • Mohammad A. Arafat •
Hassan A. Arafat
Received: 5 February 2014 / Accepted: 17 August 2014
� Springer Japan 2014
Abstract In this work, we elucidate the relation of vari-
ous household-level socioeconomic and demographic
attributes with the residential per capita solid waste gen-
eration rate in the Nablus district of Palestine. The data
collection phase entailed an extensive survey of 992
dwellings, thus probing and quantifying key socioeco-
nomic and demographic indicators of each household.
Meticulous estimation of the amount of waste generated by
each household was conducted at the waste generation
point. Relevant statistical tests (ANOVA and Pearson tests)
were performed to identify the significant relationships
between the socioeconomic/demographic variables and the
residential per capita solid waste generation rate, as well as
amongst the variables themselves. Statistical analysis of the
data revealed that the waste generation rate decreased as
the family’s income decreased, as parents tended to spend
more time at home, as the number of individuals living in
the household increased, and as the household tended to
purchase its grocery needs in just the needed quantities.
Age of dwelling residents was also significant. By showing
how these variables affect the waste generated per capita,
an argument was made to support their consideration when
designing future waste management systems, not only for
Nablus, but also for many other cities with similar profiles.
Keywords Municipal solid waste � Waste generation �Income � Residential waste
Introduction
Solid waste generation (SWG) rate is an integral element of
municipal solid waste (MSW) management. It is inevitable
that any integrated waste management plan should start
with accurate estimates of present and future amounts of
waste generated, as well as of waste characteristics [1]. The
short-term prediction of future MSW generation rates can
facilitate better planning with respect to collection
schemes, personnel staffing, waste transportation (routing),
and short-term disposal needs [2]. On the other hand,
accurate long-term forecasting of waste generation is
essential for the selection of appropriate technologies for
recycling, treatment, and disposal of MSW and for future
planning of landfill sites [3].
Dependence of SWG on various parameters
While the need for accurate projections for future MSW
generation rates is unquestionable, achieving the desired
prediction accuracy for generation trends in dynamic and/
or fast-growing regions can be quite challenging. Thus,
there is always room for new and reliable projection tools
for MSW generation. One common approach in literature
entails correlating MSW generation rates with an array of
macro-scale economic and demographic indicators, such
as gross domestic product (GDP) [4, 5]. The accumulated
literature on this subject suggests that these indicators are
S. I. Pirani � H. A. Arafat (&)
Institute Center for Water and Environment (iWater), Masdar
Institute of Science and Technology,
P.O. Box: 54224, Abu Dhabi, United Arab Emirates
e-mail: [email protected]
I. A. Al-Khatib
Institute of Environmental and Water Studies, Birzeit University,
Birzeit, Palestinian Territory
R. Halaweh � M. A. Arafat
An Najah National University, Nablus, Palestinian Territory
123
J Mater Cycles Waste Manag
DOI 10.1007/s10163-014-0304-4
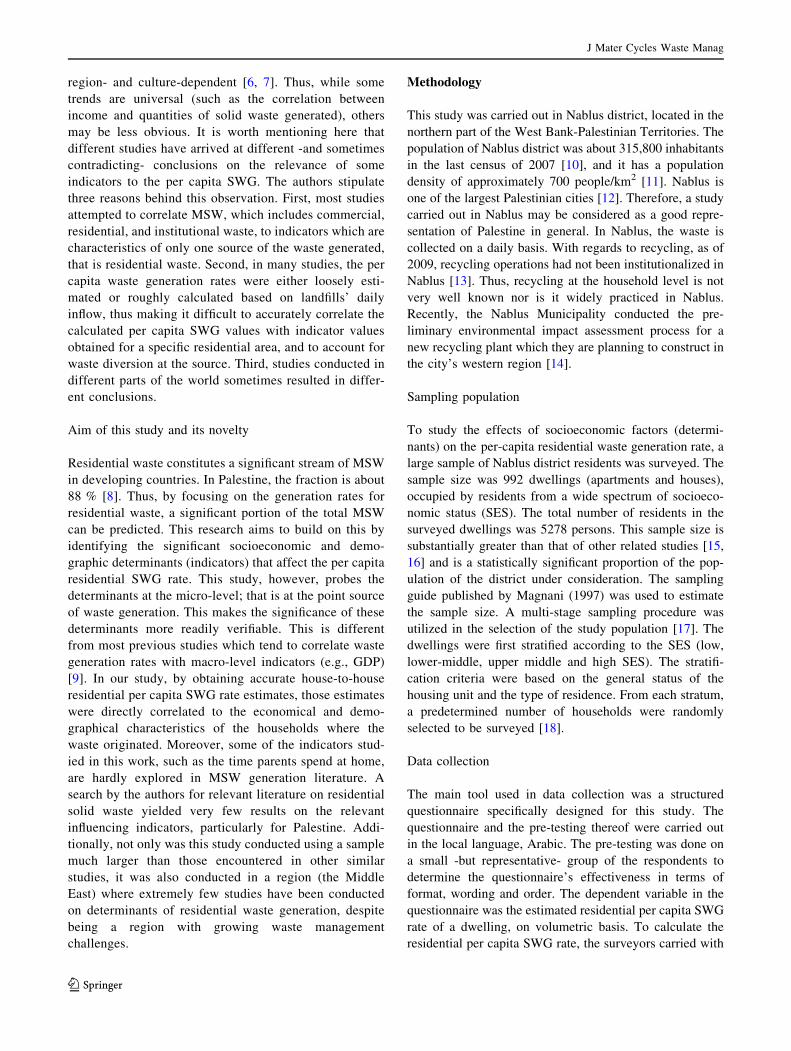
region- and culture-dependent [6, 7]. Thus, while some
trends are universal (such as the correlation between
income and quantities of solid waste generated), others
may be less obvious. It is worth mentioning here that
different studies have arrived at different -and sometimes
contradicting- conclusions on the relevance of some
indicators to the per capita SWG. The authors stipulate
three reasons behind this observation. First, most studies
attempted to correlate MSW, which includes commercial,
residential, and institutional waste, to indicators which are
characteristics of only one source of the waste generated,
that is residential waste. Second, in many studies, the per
capita waste generation rates were either loosely esti-
mated or roughly calculated based on landfills’ daily
inflow, thus making it difficult to accurately correlate the
calculated per capita SWG values with indicator values
obtained for a specific residential area, and to account for
waste diversion at the source. Third, studies conducted in
different parts of the world sometimes resulted in differ-
ent conclusions.
Aim of this study and its novelty
Residential waste constitutes a significant stream of MSW
in developing countries. In Palestine, the fraction is about
88 % [8]. Thus, by focusing on the generation rates for
residential waste, a significant portion of the total MSW
can be predicted. This research aims to build on this by
identifying the significant socioeconomic and demo-
graphic determinants (indicators) that affect the per capita
residential SWG rate. This study, however, probes the
determinants at the micro-level; that is at the point source
of waste generation. This makes the significance of these
determinants more readily verifiable. This is different
from most previous studies which tend to correlate waste
generation rates with macro-level indicators (e.g., GDP)
[9]. In our study, by obtaining accurate house-to-house
residential per capita SWG rate estimates, those estimates
were directly correlated to the economical and demo-
graphical characteristics of the households where the
waste originated. Moreover, some of the indicators stud-
ied in this work, such as the time parents spend at home,
are hardly explored in MSW generation literature. A
search by the authors for relevant literature on residential
solid waste yielded very few results on the relevant
influencing indicators, particularly for Palestine. Addi-
tionally, not only was this study conducted using a sample
much larger than those encountered in other similar
studies, it was also conducted in a region (the Middle
East) where extremely few studies have been conducted
on determinants of residential waste generation, despite
being a region with growing waste management
challenges.
Methodology
This study was carried out in Nablus district, located in the
northern part of the West Bank-Palestinian Territories. The
population of Nablus district was about 315,800 inhabitants
in the last census of 2007 [10], and it has a population
density of approximately 700 people/km2 [11]. Nablus is
one of the largest Palestinian cities [12]. Therefore, a study
carried out in Nablus may be considered as a good repre-
sentation of Palestine in general. In Nablus, the waste is
collected on a daily basis. With regards to recycling, as of
2009, recycling operations had not been institutionalized in
Nablus [13]. Thus, recycling at the household level is not
very well known nor is it widely practiced in Nablus.
Recently, the Nablus Municipality conducted the pre-
liminary environmental impact assessment process for a
new recycling plant which they are planning to construct in
the city’s western region [14].
Sampling population
To study the effects of socioeconomic factors (determi-
nants) on the per-capita residential waste generation rate, a
large sample of Nablus district residents was surveyed. The
sample size was 992 dwellings (apartments and houses),
occupied by residents from a wide spectrum of socioeco-
nomic status (SES). The total number of residents in the
surveyed dwellings was 5278 persons. This sample size is
substantially greater than that of other related studies [15,
16] and is a statistically significant proportion of the pop-
ulation of the district under consideration. The sampling
guide published by Magnani (1997) was used to estimate
the sample size. A multi-stage sampling procedure was
utilized in the selection of the study population [17]. The
dwellings were first stratified according to the SES (low,
lower-middle, upper middle and high SES). The stratifi-
cation criteria were based on the general status of the
housing unit and the type of residence. From each stratum,
a predetermined number of households were randomly
selected to be surveyed [18].
Data collection
The main tool used in data collection was a structured
questionnaire specifically designed for this study. The
questionnaire and the pre-testing thereof were carried out
in the local language, Arabic. The pre-testing was done on
a small -but representative- group of the respondents to
determine the questionnaire’s effectiveness in terms of
format, wording and order. The dependent variable in the
questionnaire was the estimated residential per capita SWG
rate of a dwelling, on volumetric basis. To calculate the
residential per capita SWG rate, the surveyors carried with
J Mater Cycles Waste Manag
123
them a set of all the standard-sized plastic bags available in
the Palestinian market and commonly used by residents for
trash collection. As the Palestinian market for these bags is
limited, there were only 7 types of trash bags in this set.
The standard fill-volume of each of these bags was deter-
mined beforehand. When the homemakers of the surveyed
residences were interviewed, they were shown the bags and
asked to identify the type(s) they use and state (to the best
of their knowledge) the frequency at which they dispose of
a trash-filled bag of each of the types they used. Addi-
tionally, the interviewees were asked to give their best
estimate of how full the bags usually were (as a percentage)
when they were disposed. The interviewer recorded the
answers on the survey sheet of the respective household
and later calculated the volumetric residential per capita
SWG rate for each household, based on the provided
information. The calculation of the residential per capita
SWG rate was done by dividing the calculated volumetric
daily waste amount of the dwelling by the number of
individuals living in that dwelling, also provided by the
interviewee.
Six independent variables were included in the survey.
These represent the socioeconomic and demographic
characteristics of the household residents. The variables
were selected based on the authors’ review of relevant
literature on macro-scale indicators (e.g., GDP), from
which the authors speculated on the potential relevant
micro-scale indicators. This does not preclude the consid-
eration of other indicator variables in future studies. The
variables considered here are: (1) average household
monthly income, in Jordanian Dinar (JD, 1 JD = $1.4
USD), (2) number of residents in the dwelling, (3) average
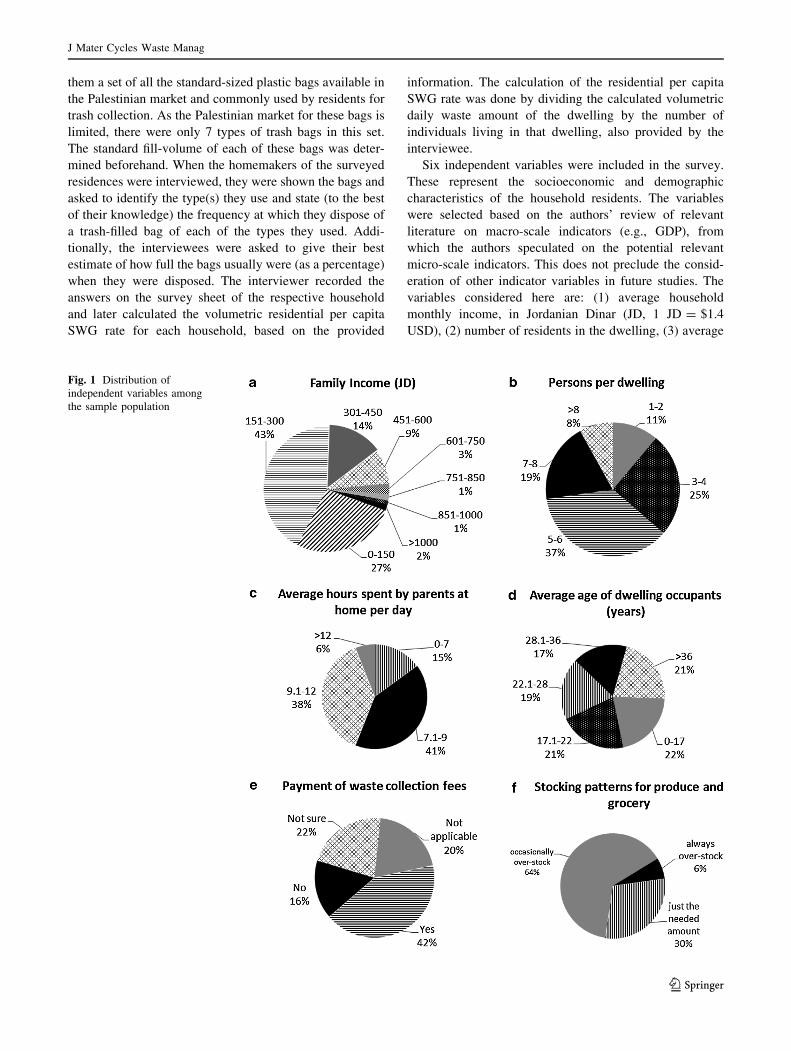
Fig. 1 Distribution of
independent variables among
the sample population
J Mater Cycles Waste Manag
123
age of dwelling residents (this was calculated by averaging
the ages of all residents as provided by the interviewee), (4)
commitment to paying municipal solid waste fees (this was
probed via the following question: ‘‘Did you pay your
municipal SW fees last year?’’, Answer: Y/N/NA), (5)
stocking pattern for grocery and produce. For this question,
three options were provided: ‘‘we buy just the needed
amounts’’, ‘‘we occasionally over-stock’’, and ‘‘we always
over-stock’’, and (6) hours spent at home per day by both
parents. Finally, the survey also included a question on the
percentage of waste reused or recycled internally within the
dwelling itself. The purpose of including this question was
to measure the diversion of generated waste from disposal,
whether through reusing in-house or external recycling. It
was not meant to study recycling per se. Both reused and
recycled waste quantities were therefore lumped under one
category for the purpose of this study and this was
explained to the respondents during the interviews. It was
found that the waste generation and disposal rates were
almost equal since diversion, via recycle or reuse, was
found to be negligible.
Data analysis
Analysis of data was performed using the Statistical Package
for Social Sciences (SPSS) software, version 12.0. The
appropriate statistical test of significance (Analysis of Vari-
ance, ANOVA) was performed using a level of significance
of P \ 0.05. Where possible (i.e., for correlations between
two numeric variables), correlation analysis was also per-
formed using Pearsons’ correlation coefficient.
The main limitation of this study is the possible bias in
self-reported data, both on the volumes of waste generated
and the independent socioeconomic and demographic vari-
ables. In consideration of this, the researchers attempted to
enhance the accuracy by allowing sufficient time to
administer and explain the questionnaire to the respondents,
and by recording the interviewees’ responses themselves.
Results and discussion
Socioeconomic and demographic profiles of the sample
population
The distribution of the six independent socioeconomic and
demographic variables among the sample population is
shown in Fig. 1. Figure 1a shows that the income of most
of the surveyed households was in the range of 151–300 JD
(43 %). These figures are representative of Palestine in
general [19]. Nablus in particular is reported to have had an
unemployment rate of 16.5 % during 2012 [20], with an
even higher rate among refugees residing in the city [21].
Figure 1b shows the sample distribution in terms of the
number of persons living in the surveyed dwellings. Most of
the dwellings (37 %), housed 5–6 individuals and this is in
Table 1 Correlations between socioeconomic indicators and the per capita residential SWG rate and amongst the indicators themselves
Residential per
capita solid waste
generation rate
Average hours spent
by parents at home
per day
Overstocking
of groceries
Payment of
solid waste
fees
Average age
of household
residents
Number of
residents per
household
Family
average
income
Family average
income
r* = ?0.26
P = 0.000
r = -0.140
P = 0.000
Correlated
(ANOVA)
P = 0.000
Correlated
(ANOVA)
P = 0.000
r = -0.141
P = 0.000
r = ? 0.097
P = 0.002
Number of residents
per household
r = -0.283
P = 0.000
r = ?0.121
P = 0.000
Correlated
(ANOVA)
P = 0.000
Correlated
(ANOVA)
P = 0.033
r = -0.483
P = 0.000
Average age of
household
residents
r = ?0.134
P = 0.000
r = ?0.172
P = 0.000
Uncorrelated
(ANOVA)
P = 0.9430
Correlated
(ANOVA)
P = 0.000
Payment of solid
waste fees
Correlated
(ANOVA)
P = 0.000
Uncorrelated
(ANOVA)
P = 0.202
Overstocking of
groceries
Correlated
(ANOVA)
P = 0.015
Uncorrelated
(ANOVA)
P = 0.754
Average hours spent
by parents at
home per day
r = -0.172
P = 0.000
* r Pearson product-moment correlation coefficient
J Mater Cycles Waste Manag
123
agreement with the census reporting an average family size of
5.5 persons in the West Bank in 2007 (Palestinian Central
Bureau of Statistics) [22]. Figure 1c shows the distribution of
the sample population in terms of the average hours spent by
parents at home per day. This value excludes sleep hours. Most
of the interviewed parents (79 %) spent between 7.1 and 12 h
at home everyday. This high value is mainly due to the high
unemployment amongst Palestinians, especially females. In
2005, the percentage of women economically active in the
Palestinian territories was reported to be only 9.5 % [23].
Figure 1d shows the distribution of the sample popula-
tion in terms of the average age of dwelling residents. The
distribution reflects roughly an equal distribution amongst
the different categories. Figure 1e shows the distribution of
the sample population in terms of whether or not the
household pays its annual waste collection fees. In Nablus
city, the annual fee for solid waste is approximately 17
USD for residential houses [24]. It is evident that less than
half the residents actually paid the fee, mainly because of
the deteriorating economic situation.
Solid waste management services in Palestine are quite
expensive due to political conditions and a lack of proper
funds and infrastructure. The cost of the services are even
higher in cities (as opposed to villages) due to the higher
population which implies the need for more waste manage-
ment employees and equipment and thus greater operational
Table 2 ANOVA results showing the correlations between some socioeconomic indicators
Correlated parameters Correlated
groups
Sum of
squares
Degree of
freedom
Mean
squares
F value P value
Payment of solid waste fees
AND
Family average income Between groups 2957391 3 985797.125 17.115 0.000
Within groups 56905875 988 57597.039
Total 59863266 991
Number of residents per household Between groups 47.528 3 15.843 2.930 0.033
Within groups 5342.532 988 5.407
Total 5390.060 991
Average age of household residents Between groups 4390.724 3 1463.575 7.297 0.000
Within groups 198161.7 988 200.568
Total 202552.4 991
Residential per capita solid waste generation rate Between groups 109.046 3 36.349 6.102 0.000
Within groups 5885.358 988 5.957
Total 5994.404 991
Average hours spent by parents at home per day Between groups 18.972 3 6.324 1.542 0.202
Within groups 4052.088 988 4.101
Total 4071.060 991
Overstocking of groceries
AND
Family average income Between groups 5907566 2 2953782.794 54.098 0.000
Within groups 53891226 987 54601.040
Total 59798792 989
Number of residents per household Between groups 154.558 2 77.279 14.569 0.000
Within groups 5235.297 987 5.304
Total 5389.855 989
Average age of household residents Between groups 24.060 2 12.030 0.059 0.943
Within groups 202280.1 987 204.944
Total 202304.2 989
Residential per capita solid waste generation rate Between groups 50.557 2 25.278 4.201 0.015
Within groups 5938.551 987 6.017
Total 5989.108 989
Average hours spent by parents at home per day Between groups 2.323 2 1.161 0.282 0.754
Within groups 4066.841 987 4.12
Total 4069.164 989
J Mater Cycles Waste Manag
123
costs for the service provider. Moreover, in villages, waste
collection vehicles can be shared among several villages,
helping in cost reduction [24]. Refugee camps are exempt
from waste fees, which explains the ‘‘Not Applicable (N/A)’’
response. The poor collection rate (42 %) is an indication of
how a serious fee-based waste management system needs to
be more forcefully implemented in Nablus. Finally, Fig. 1f
reveals the breakdown of our sample population according to
their grocery and produce shopping habits. It can be noticed
that a significant number of families occasionally overstock
their grocery and produce supplies. This can be expected in
light of the perceived savings through wholesale purchases
and the relative political instability in the Palestinian
territory.
Effects of the socioeconomic and demographic
attributes on residential SWG
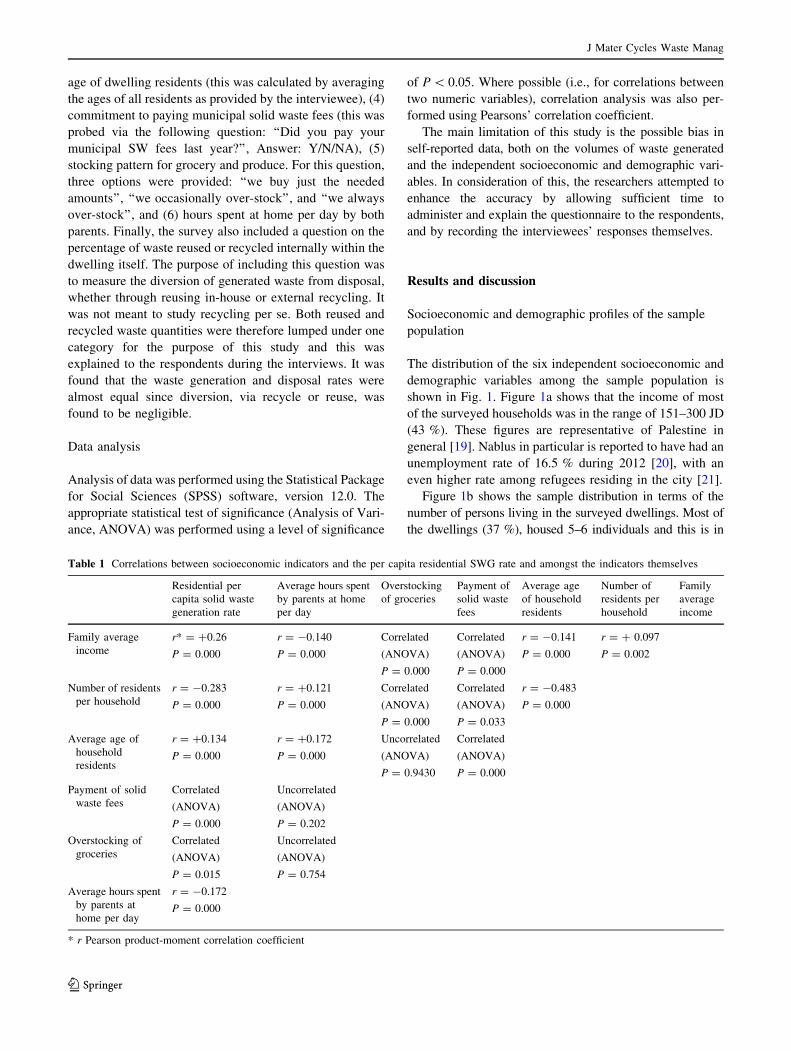
Table 1 shows a summary of all correlations between the
six socioeconomic and demographic variables and the
residential per capita SWG rate. The table also shows the
inter-correlations amongst the independent variables
themselves. In the cases where the Person correlation
coefficient could be calculated, the table also provides that
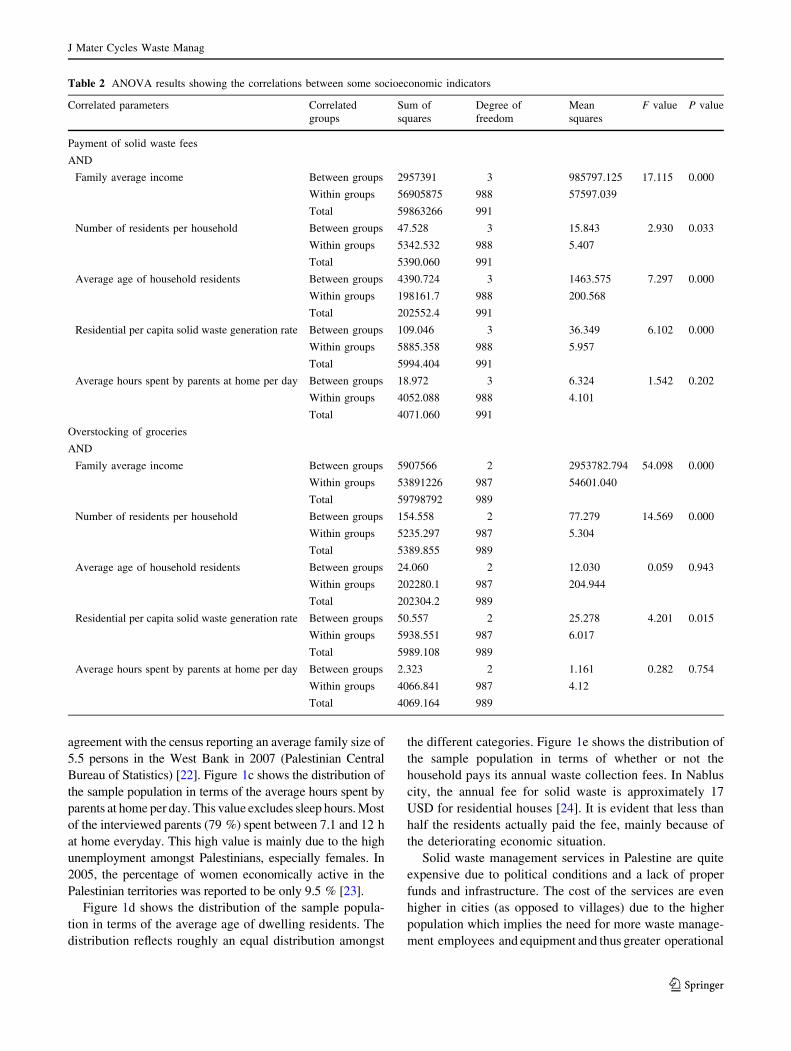
coefficient. Table 1 is complemented by Table 2, which
details the key results of the ANOVA tests. It can be seen
that all six variables are correlated to the residential per
capita SWG rate, making them determinants of it, directly
or indirectly. The only exception is the payment of waste
collection service fees, which did not have a significant
correlation with the residential per capita SWG rate. In
addition, a high degree of inter-dependence also exists
amongst the variables themselves, as will be elaborated
next.
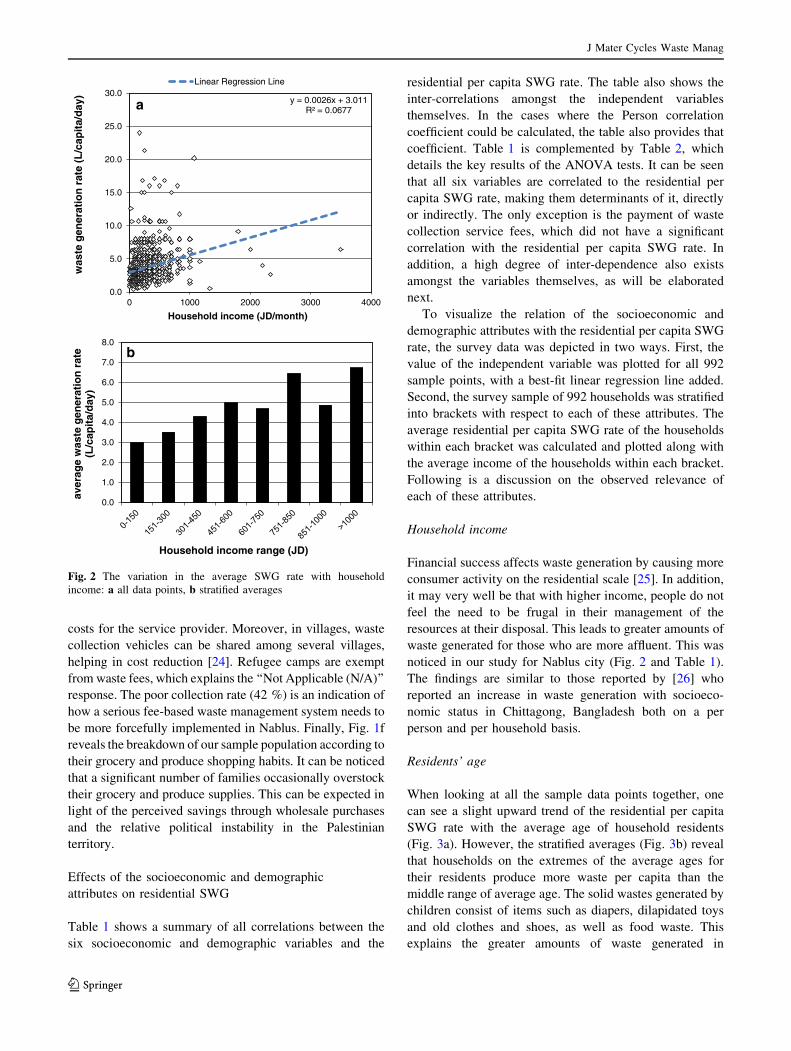
To visualize the relation of the socioeconomic and
demographic attributes with the residential per capita SWG
rate, the survey data was depicted in two ways. First, the
value of the independent variable was plotted for all 992
sample points, with a best-fit linear regression line added.
Second, the survey sample of 992 households was stratified
into brackets with respect to each of these attributes. The
average residential per capita SWG rate of the households
within each bracket was calculated and plotted along with
the average income of the households within each bracket.
Following is a discussion on the observed relevance of
each of these attributes.
Household income
Financial success affects waste generation by causing more
consumer activity on the residential scale [25]. In addition,
it may very well be that with higher income, people do not
feel the need to be frugal in their management of the
resources at their disposal. This leads to greater amounts of
waste generated for those who are more affluent. This was
noticed in our study for Nablus city (Fig. 2 and Table 1).
The findings are similar to those reported by [26] who
reported an increase in waste generation with socioeco-
nomic status in Chittagong, Bangladesh both on a per
person and per household basis.
Residents’ age
When looking at all the sample data points together, one
can see a slight upward trend of the residential per capita
SWG rate with the average age of household residents
(Fig. 3a). However, the stratified averages (Fig. 3b) reveal
that households on the extremes of the average ages for
their residents produce more waste per capita than the
middle range of average age. The solid wastes generated by
children consist of items such as diapers, dilapidated toys
and old clothes and shoes, as well as food waste. This
explains the greater amounts of waste generated in
y = 0.0026x + 3.011R² = 0.0677
0.0
5.0
10.0
15.0
20.0
25.0
30.0
0 1000 2000 3000 4000
was
te g
ener
atio
n r
ate
(L/c
apit
a/d
ay)
Household income (JD/month)
Linear Regression Line
0.0
1.0
2.0
3.0
4.0
5.0
6.0
7.0
8.0
aver
age
was
te g
ener
atio
n r
ate
(L/c
apit
a/d
ay)
Household income range (JD)
a
b
Fig. 2 The variation in the average SWG rate with household
income: a all data points, b stratified averages
J Mater Cycles Waste Manag
123
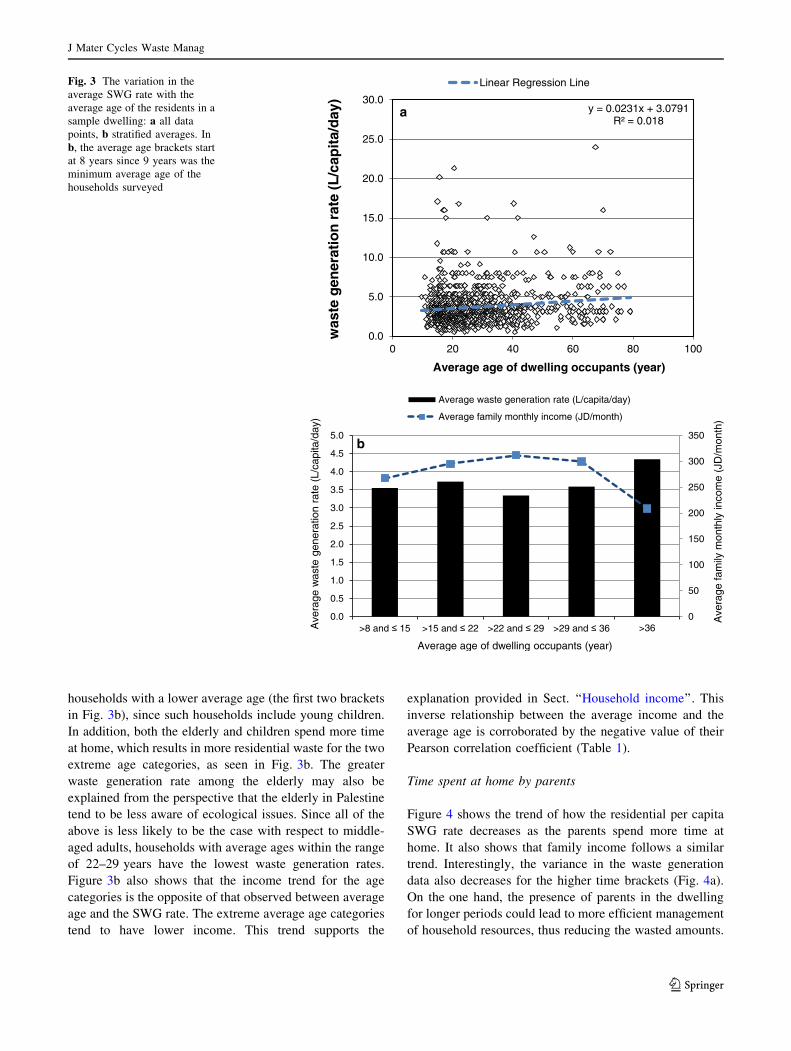
households with a lower average age (the first two brackets
in Fig. 3b), since such households include young children.
In addition, both the elderly and children spend more time
at home, which results in more residential waste for the two
extreme age categories, as seen in Fig. 3b. The greater
waste generation rate among the elderly may also be
explained from the perspective that the elderly in Palestine
tend to be less aware of ecological issues. Since all of the
above is less likely to be the case with respect to middle-
aged adults, households with average ages within the range
of 22–29 years have the lowest waste generation rates.
Figure 3b also shows that the income trend for the age
categories is the opposite of that observed between average
age and the SWG rate. The extreme average age categories
tend to have lower income. This trend supports the
explanation provided in Sect. ‘‘Household income’’. This
inverse relationship between the average income and the
average age is corroborated by the negative value of their
Pearson correlation coefficient (Table 1).
Time spent at home by parents
Figure 4 shows the trend of how the residential per capita
SWG rate decreases as the parents spend more time at
home. It also shows that family income follows a similar
trend. Interestingly, the variance in the waste generation
data also decreases for the higher time brackets (Fig. 4a).
On the one hand, the presence of parents in the dwelling
for longer periods could lead to more efficient management
of household resources, thus reducing the wasted amounts.
y = 0.0231x + 3.0791R² = 0.018
0.0
5.0
10.0
15.0
20.0
25.0
30.0
0 20 40 60 80 100
was
te g
ener
atio
n r
ate
(L/c
apit
a/d
ay)
Average age of dwelling occupants (year)
Linear Regression Line
0
50
100
150
200
250
300
350
0.0
0.5
1.0
1.5
2.0
2.5
3.0
3.5
4.0
4.5
5.0
>8 and ≤ 15 >15 and ≤ 22 >22 and ≤ 29 >29 and ≤ 36 >36
Ave
rage
fam
ily m
onth
ly in
com
e (J
D/m
onth
)
Ave
rage
was
te g
ener
atio
n ra
te (
L/ca
pita
/day
)
Average age of dwelling occupants (year)
Average waste generation rate (L/capita/day)
Average family monthly income (JD/month)
a
b
Fig. 3 The variation in the
average SWG rate with the
average age of the residents in a
sample dwelling: a all data
points, b stratified averages. In
b, the average age brackets start
at 8 years since 9 years was the
minimum average age of the
households surveyed
J Mater Cycles Waste Manag
123
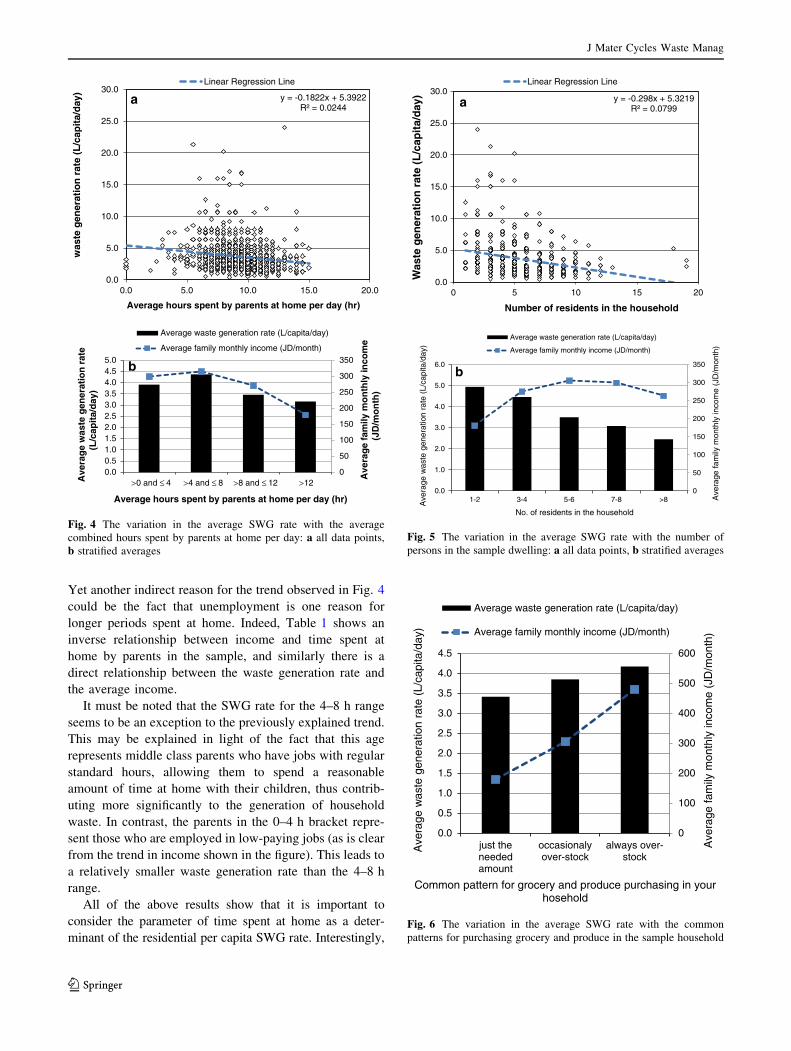
Yet another indirect reason for the trend observed in Fig. 4
could be the fact that unemployment is one reason for
longer periods spent at home. Indeed, Table 1 shows an
inverse relationship between income and time spent at
home by parents in the sample, and similarly there is a
direct relationship between the waste generation rate and
the average income.
It must be noted that the SWG rate for the 4–8 h range
seems to be an exception to the previously explained trend.
This may be explained in light of the fact that this age
represents middle class parents who have jobs with regular
standard hours, allowing them to spend a reasonable
amount of time at home with their children, thus contrib-
uting more significantly to the generation of household
waste. In contrast, the parents in the 0–4 h bracket repre-
sent those who are employed in low-paying jobs (as is clear
from the trend in income shown in the figure). This leads to
a relatively smaller waste generation rate than the 4–8 h
range.
All of the above results show that it is important to
consider the parameter of time spent at home as a deter-
minant of the residential per capita SWG rate. Interestingly,
y = -0.1822x + 5.3922R² = 0.0244
0.0
5.0
10.0
15.0
20.0
25.0
30.0
0.0 5.0 10.0 15.0 20.0
was
te g
ener
atio
n r
ate
(L/c
apit
a/d
ay)
Average hours spent by parents at home per day (hr)
Linear Regression Line
0
50
100
150
200
250
300
350
0.00.51.01.52.02.53.03.54.04.55.0
>0 and ≤ 4 >4 and ≤ 8 >8 and ≤ 12 >12
Ave
rag
e fa
mily
mo
nth
ly in
com
e (J
D/m
on
th)
Ave
rag
e w
aste
gen
erat
ion
rat
e (L
/cap
ita/
day
)
Average hours spent by parents at home per day (hr)
Average waste generation rate (L/capita/day)
Average family monthly income (JD/month)
a
b
Fig. 4 The variation in the average SWG rate with the average
combined hours spent by parents at home per day: a all data points,
b stratified averages
y = -0.298x + 5.3219R² = 0.0799
0.0
5.0
10.0
15.0
20.0
25.0
30.0
0 5 10 15 20
Was
te g
ener
atio
n r
ate
(L/c
apit
a/d
ay)
Number of residents in the household
Linear Regression Line
0
50
100
150
200
250
300
350
0.0
1.0
2.0
3.0
4.0
5.0
6.0
1-2 3-4 5-6 7-8 >8 Ave
rage
fam
ily m
onth
ly in
com
e (J
D/m
onth
)
Ave
rage
was
te g
ener
atio
n ra
te (
L/ca
pita
/day
)
No. of residents in the household
Average waste generation rate (L/capita/day)
Average family monthly income (JD/month)
a
b
Fig. 5 The variation in the average SWG rate with the number of
persons in the sample dwelling: a all data points, b stratified averages
0
100
200
300
400
500
600
0.0
0.5
1.0
1.5
2.0
2.5
3.0
3.5
4.0
4.5
just theneededamount
occasionalyover-stock
always over-stock
Ave
rage
fam
ily m
onth
ly in
com
e (J
D/m
onth
)
Ave
rage
was
te g
ener
atio
n ra
te (
L/ca
pita
/day
)
Common pattern for grocery and produce purchasing in your hosehold
Average waste generation rate (L/capita/day)
Average family monthly income (JD/month)
Fig. 6 The variation in the average SWG rate with the common
patterns for purchasing grocery and produce in the sample household
J Mater Cycles Waste Manag
123
time spent at home has been previously suggested to be an
important dimension of household waste management from
other angles. For instance, in a study by Bennagen et al.
[27], they discussed how 53 % of their study respondents
failed to segregate their residential waste due to lack of time,
and in more than 75 % of the households, the parents were
the dominant actors in waste segregation.
Family size
Sometimes people buy product quantities which amount to
more than what they actually need. For large families, most
of these quantities would be used up. In contrast, in small
families, any unplanned increase in the quantities bought
(relative to the quantity actually needed) cannot be utilized
as easily, and thus may become waste. This leads to the
higher residential waste generation rates in smaller families,
as shown in Fig. 5 and as proven by the negative Pearson
coefficient value in Table 1. Similar observations have been
reported in other studies [7, 28, 29]. Another indirect reason
for this observation is family income. Poor families in the
Middle East region tend to be larger than average [30],
which was also detected in our study (Fig. 5 and Table 1).
Therefore, the lower residential per capita SWG rates of the
larger families may be partially explained by their lower
income per capita. However, the households with the lowest
number of residents are also found to have the lowest
incomes, suggesting that the observed dependency of SWG
rates on family size is not completely income related.
Taking into consideration the decline in average
household size in the West Bank from 6.1 persons in 1997
to 5.6 in 2011 [31], and assuming that this trend continues,
the trend in Fig. 5 suggests that having more households of
smaller sizes will lead to even greater future residential per
capita SWG rates in the Palestinian cities.
Grocery and produce stocking patterns
A household that is more organized and efficient in man-
aging its resources and monitoring the amounts of products
actually needed will tend to utilize everything brought
home. This helps significantly reduce the amount of resi-
dential waste generated. This can be clearly observed in
Fig. 6. People who registered the least residential per
capita SWG rates are those who buy just the needed
amount. In fact, the effect of overstocking on waste gen-
eration can be quite significant. In a study conducted in the
UK [32], it was reported that 45 % of food waste in the UK
was due to ‘‘whole unused or part-consumed produce,
probably resulting from factors such as special offers at
supermarkets and portion sizes which are too large’’. It is
clear from Fig. 6 that households with greater incomes
have a greater tendency to overstock.
Incorporating socioeconomic and demographic profiles
into solid waste management planning
The results presented so far show that a number of socio-
economic and demographic factors act as determinants of
the residential per capita SWG rate in Nablus city. Though
Palestine is a developing country, similar factors can also
be the determinants of waste generated in developed
countries, as suggested in other references [33, 34]. In light
of these trends, one can expect that an improved economic
status will inevitably come at the price of increased waste
generation rates. Economic advancement usually leads to
smaller families, stronger purchasing power for individu-
als, shorter periods spent at home by parents (as a result of
higher employment rates), and the tendency to over-pur-
chase products. Coupled with the observed poor collection
of waste management fees observed in Nablus city, a future
economic betterment will leave Palestinian cities like Na-
blus facing serious challenges to develop and implement
effective MSW management programs.
A roadmap that can be envisaged based on the work
presented here is to utilize the proven correlations between
the various socioeconomic and demographic determinants
and the residential per capita SWG rate to predict the
future MSW generation outlook. Modeling tools can be
employed to quantify the residential waste generation rate
in terms of some or all of the socioeconomic and demo-
graphic indicators discussed here. They would also allow
one to examine if there are any redundant or superfluous
variables. Relevant modeling work has actually already
been attempted for other regions round the world [35].
Most of the dependent variable considered in this paper are
related to income, and therefore modeling methods which
have already been used in literature to predict waste gen-
eration from income levels can be utilized. The latter can
then be used to plan a spectrum of MSW management
aspects, including waste collection, recycling schemes,
landfill plans, etc. These recycling schemes may be
enforced by means such as an advanced disposal fees or a
deposit-refund program, as has recently been shown to be
the case in a study from Japan [36]. Moreover, this work
may also be expanded to see whether such correlation
exists between the variables discussed herein and the rate
of SWG in other areas of Palestine and in other countries as
well. The models which would be developed as a result
could be applied on a global scale.
Conclusions
In this study, we explored how the waste generated by the
residents of Nablus city in Palestine correlates with an
array of socioeconomic and demographic factors. Increased
J Mater Cycles Waste Manag
123
household income and the tendency to overstock on gro-
cery and produce supplies were found to increase the res-
idential per capita SWG rate, while longer periods spent by
parents at home and larger family size both reduce it. Age
of dwelling residents is also of significance. Family
members at both age extremes (very young and very old)
contribute to higher residential per capita SWG rates. A
number of interlinked reasons are behind these trends,
which were discussed in this paper. On the other hand, no
correlation was found between the payment of waste col-
lection service fees and the residential per capita SWG rate,
due to the lack of implementation of such fees structure
throughout Nablus. Therefore, to improve the waste man-
agement situation in Palestine it is imperative that such a
policy regarding the fees be applied effectively and that
execution of recycling programs become a priority.
This study deals with waste generation at the household
level, while considering a large sample of the population.
This is of much consequence since the trends observed at
the micro level amongst the individual residences that
make up a city may be masked at the macro level of a city
or a country. In the latter, the trends observed may be due
to a variety of variables, and it is only by studying the
variables at the micro level that the influence of each
variable can be assessed. As citizens are becoming an
integral part of cities’ solid waste management plans and
are demanded to work harder to reduce their waste, such
efforts can be more effectively probed and monitored
through micro-level studies such as this one.
Acknowledgments The authors would like to gratefully acknowl-
edge the Palestinian American Research Center (PARC), Washington,
DC, USA, for funding this research.
References
1. Zia H, Devadas V (2008) Urban solid waste management in
Kanpur: opportunities and perspectives. Habitat Internat
32(1):58–73
2. Matsuto T, Tanaka N (1993) Data analysis of daily collection
tonnage of residential solid waste in Japan. Waste Manag Res
11(4):333–343
3. Navarro-Esbrı J, Diamadopoulos E, Ginestar D (2002) Time
series analysis and forecasting techniques for municipal solid
waste management. Resour Conservat Recycl 35(3):201–214
4. Cherdsatirkul C (2012) ‘‘Generation and disposition of municipal
solid waste (MSW) management in Thailand.’’ Earth Engineering
Center, Columbia University
5. Zou X (2011) Municipal Solid Waste Management in China with
Focus on Waste Separation. Masters Institute for Applied Mate-
rial Flow Management (IfaS), Japan
6. Perry GDR, Williams ID (2007) The participation of ethnic
minorities in kerbside recycling: a case study. Resour Conservat
Recycl 49(3):308–323
7. Bandara NJGJ, Hettiaratchi JPA, Wirasinghe SC, Pilapiiya S
(2007) Relation of waste generation and composition to socio-
economic factors: a case study. Enviro Monitor Assess
135(1–3):31–39
8. Palestinian Central Bureau of Statistics (PCBS) (2009) ‘‘House-
hold Environmental Survey,’’ Ramallah, Palestinian Territory
9. Daskalopoulos E, Badr O, Probert SD (1998) Municipal solid
waste: a prediction methodology for the generation rate and
composition in the European Union countries and the United
States of America. Resou Conservat Recycl 24(2):155–166
10. Palestinian Central Bureau of Statistics (PCBS) (2008) ‘‘Popu-
lation, Housing and Establishment Census 2007’’
11. Nablus Municipality, ‘‘Nablus Population,’’ (2012). http://nablus.
org/en/abot_nablus_contant.php?id=18&title=%20Population.
Accessed 18 Aug 2013
12. Tomorrow’s Youth Organization (2010) ‘‘This is Nablus!,’’
13. Applied Research Institute - Jerusalem (ARIJ) (2009) ‘‘Chal-
lenges of solid waste management in the City of Nablus: a special
case study’’
14. Palestine Development and Investment Ltd. (PADICO) (2012)
‘‘PADICO Holding—Annual Report 2012’’
15. Marquez MY, Ojeda S, Hidalgo H (2008) Identification of
behavior patterns in household solid waste generation in Mexi-
cali’s city: study case. Resour Conservat Recycl
52(11):1299–1306
16. Rojas-Valencia MN, Najera-Aguilar H (2012) Analysis of the
generation of household solid wastes, household hazardous
wastes and sustainable alternative handling. Internat J Sustain
Soc 4(3):280–299
17. Fowler FJ (1984) Survey research methods. Sage Publications,
Beverly Hills
18. Scheaffer RL (1990) Elementary survey sampling, 4th edn. PWS-
Kent, Boston
19. Valev N (2011) ‘‘Palestine: Economy Indicators’’. http://www.
theglobaleconomy.com/Palestine/indicator-NY.GDP.PCAP.PP.
KD/. Accessed 05 Feb 2013
20. Palestinian Central Bureau of Statistics (PCBS), ‘‘Labour Force
Participation, Employment, Unemployment and Average Daily
Wage in NIS for Wage Employees in the Palestinian Territory by
Governorate (ILO Standards),’’ (2012). http://www.pcbs.gov.ps/
Portals/_Rainbow/Documents/Labor%20Force%20Annual.htm.
Accessed 05 Feb 2013
21. UNRWA (United Nations Relief and Works Agency) (2011)
‘‘Palestine Refugees in the West Bank: socio-economic trends
and long-term opportunities’’
22. Palestinian Central Bureau of Statistics (PCBS) (2010) ‘‘Press
Release on the Palestinians in the World’’
23. Freedom House (2005) ‘‘Women’s Rights in the Middle East and
North Africa-Palestine (Palestinian Authority and Israeli-Occu-
pied Territories)’’ UNHCR Refworld. http://www.unhcr.org/ref
world/docid/47387b6e2f.html. Accessed 05 Mar 2013
24. Al-Khatib IA, Monou M, Abu Zahra ASF, Shaheen HQ, Kassinos
D (2010) Solid waste characterization, quantification and man-
agement practices in developing countries. A case study: Nablus
district–Palestine. J Enviro Manag 91(5):1131–1138
25. Purcell M, Magette WL (2010) Attitudes and behaviour towards
waste management in the Dublin, Ireland region. Waste Manag
30(10):1997–2006
26. Sujauddin M, Huda SMS, Hoque ATMR (2008) Household solid
waste characteristics and management in Chittagong, Bangla-
desh. Waste Manag 28(9):1688–1695
27. Bennagen MEC, Nepomuceno G, Covar R (2002) Solid waste
segregation and recycling in Metro Manila: household attitudes
and behavior. economy and environment program for Southeast
Asia
28. Dennison GJ, Dodd VA, Whelan B (1996) A socio-economic
based survey of household waste characteristics in the city of
J Mater Cycles Waste Manag
123
Dublin, Ireland—II. Waste quantities. Resour Conservat Recycl
17(3):245–257
29. Ojeda-Benıtez S, Vega CA, Marquez-Montenegro MY (2008)
Household solid waste characterization by family socioeconomic
profile as unit of analysis. Resour Conservat Recycl
52(7):992–999
30. International Fund for Agricultural Development (IFAD) (2007)
‘‘Rural poverty in The West Bank and Gaza’’. http://www.rur
alpovertyportal.org/country/home/tags/gaza_and_the_west_bank.
Accessed 14 Feb 2013
31. Palestinian Central Bureau of Statistics (PCBS) (2012) ‘‘Statis-
tical review on the status of the Palestinian Population’’
32. Langley J, Yoxall A, Heppell G, Rodriguez EM, Bradbury S,
Lewis R, Luxmoore J, Hodzic A, Rowson J (2009) Food for
thought? A UK pilot study testing a methodology for composi-
tional domestic food waste analysis. Waste Manag Res
28(3):220–227
33. Jenkins RR, Martinez SA, Palmer K, Podolsky MJ (2003) The
determinants of household recycling: a material-specific analysis
of recycling program features and unit pricing. J Enviro Eco
Manag 45(2):294–318
34. Gellynck X, Jacobsen R, Verhelst P (2011) Identifying the key
factors in increasing recycling and reducing residual household
waste: a case study of the Flemish region of Belgium. J Environ
Manage 92(10):2683–2690
35. Thanh NP, Matsui Y, Fujiwara T (2010) Household solid waste
generation and characteristic in a Mekong Delta city, Vietnam.
J Enviro Manag 91(11):2307–2321
36. Kinnaman TC, Shinkuma T, Yamamoto M (2014) The socially
optimal recycling rate: evidence from Japan. J Enviro Eco Manag
68(1):54–70
J Mater Cycles Waste Manag
123