Hkkjr esa flapkbZ ifj;kstukvksa ds foRrh; igyw
245
Hkkjr esa flapkbZ ifj;kstukvksa ds foRrh; igyw INFORMATION TECHNOLOGY DIRECTORATE INFORMATION SYSTEMS ORGANISATION WATER PLANNING & PROJECTS WING CENTRAL WATER COMMISSION NEW DELHI lwpuk rduhdh funs’kky; lwpuk iz.kkyh laxBu ty vk;kstu ,oa ifj;kstuk Lda/k dsUnzh; ty vk;ksx ubZ fnYyh May, 2010 ebZ] 2010
-
Upload
khangminh22 -
Category
Documents
-
view
0 -
download
0
Transcript of Hkkjr esa flapkbZ ifj;kstukvksa ds foRrh; igyw

Hkkjr esa flapkbZ ifj;kstukvksa ds foRrh; igyw
INFORMATION TECHNOLOGY DIRECTORATE INFORMATION SYSTEMS ORGANISATION
WATER PLANNING & PROJECTS WING CENTRAL WATER COMMISSION
NEW DELHI
lwpuk rduhdh funs’kky; lwpuk iz.kkyh laxBu
ty vk;kstu ,oa ifj;kstuk Lda/k dsUnzh; ty vk;ksx
ubZ fnYyh
May, 2010 ebZ] 2010

i
Hkkjr esa flapkbZ ifj;kstukvksa
ds foRrh; igyw
FINANCIAL ASPECTS OF IRRIGATION PROJECTS IN INDIA
lwpuk rduhdh funs’kky;
lwpuk iz.kkyh laxBu
Tky vk;kstu ,oa ifj;kstuk Lda/k
dssUnzh; ty vk;ksx
INFORMATION TECHNOLOGY DIRECTORATE
INFORMATION SYSTEM ORGANISATION
WATER PLANNING and PROJECTS WING
CENTRAL WATER COMMISSION
ebZ] 2010
May, 2010

ii

iii

iv
List of Officers Associated with Publication 1. Shri D P Mondal, Advisor 2. Shri S K Das, Advisor 3. Shri R K Gupta, Dy. Director 4. Shri Deep Chand Sharma, Asstt. Director 5. Shri Thakur Singh, Private Secretary 6. Shri R.N. Singh, Sr. Statistical Officer
7. Shri A.B. Singh, Sr. Statistical Officer
8. Shri Kesho Ram, D.E.O. Gr.`B’ 9. Shri Bhim Singh, D.E.O. Gr. ‘B’ 10. Shri Jagat Singh, D.E.O. Gr. ‘B’ 11. Shri N.S. Adhikari, D.E.O. Gr.`B’
12. Smt. Harinder Kaur, D.E.O. Gr. ‘B’ 13. Shri Shree Ram Jyotishi, D.E.O. Gr. `B’ 14. Shri Gyan Chand, SMO
v
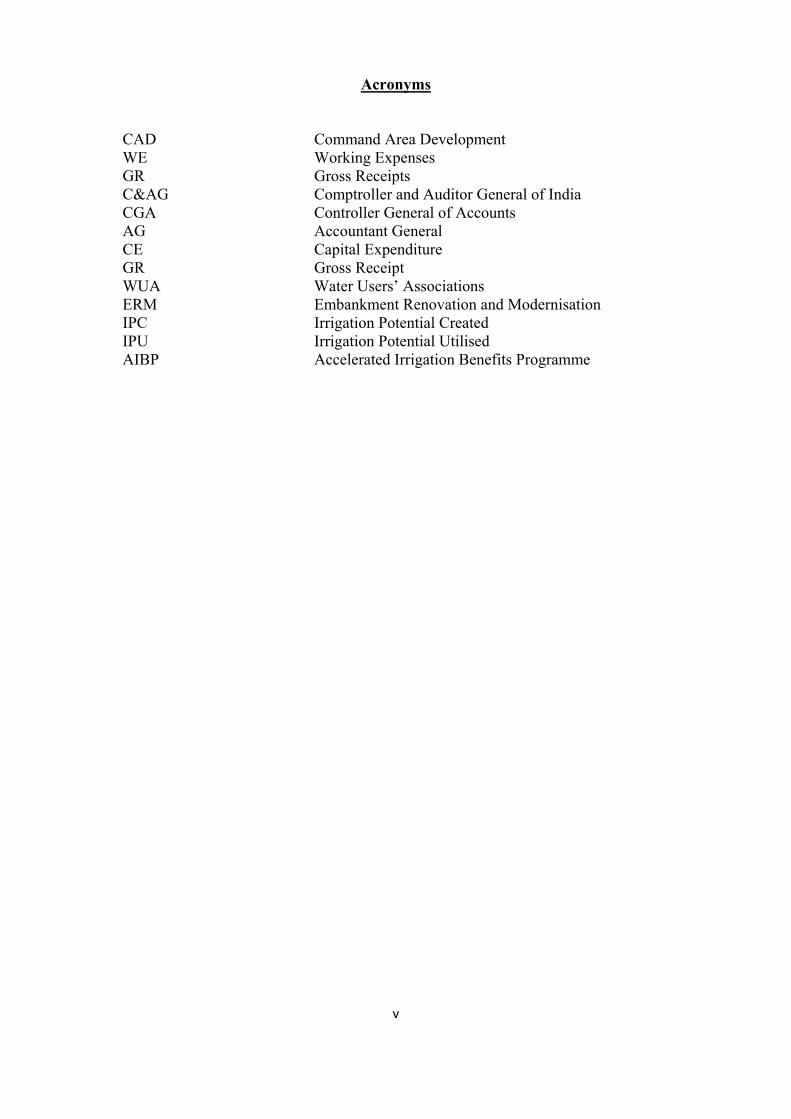
Acronyms CAD Command Area Development WE Working Expenses GR Gross Receipts C&AG Comptroller and Auditor General of India CGA Controller General of Accounts AG Accountant General CE Capital Expenditure GR Gross Receipt WUA Water Users’ Associations ERM Embankment Renovation and Modernisation IPC Irrigation Potential Created IPU Irrigation Potential Utilised AIBP Accelerated Irrigation Benefits Programme

vi
CONTENTS
Page No.
Foreword i Preface ii List of Officers Associated with the Publication iii Acronyms iv Chapter 1 Introduction 1 Chapter 2 Financial Performance of Water Resources Sector 3 Highlights: all-India Highlights: State/UT Government Highlights: Union Government Chapter 3 Infrastructure and Related Statistics 39 Chapter 4 Findings and Conclusions 42 Appendix I Methodology for Data Compilation 45 Appendix II Glossary of Terms 47 Appendix- III Statistical Tables Table (A1-A32) : Capital Expenditure, Working Expenses and Gross receipts
for Major & Medium Irrigation Projects over 1990-2007- All India and States/UT’s wise
50
Table (B1-B32) : Capital Expenditure, Working Expenses and Gross receipts for Minor Irrigation Projects over 1990-2007– All India and States/UT’s wise
82
Table (C1-C32) : Capital Expenditure, Working Expenses and Gross receipts for Command Area Development Programme over 1990-2007– All India and States/UT’s wise
114
Table D-1: Number of Major, Medium and ERM Irrigation Projects in India by State/UT
146
Table D-2: Financial Implications of completed and on-going Projects of XI Plan.
148
Table D-3: Capital Expenditure and Working Expenses during Tenth Plan Period for Major & Medium Irrigation Projects State and Project wise
154
Table D-4: State-wise Status of Accelerated Irrigation Benefits Programme (AIBP)- Central Loan Assistance (CLA)/Grant Released for Major, Medium and ERM Projects in India.
231
Table D-5 : Physical and Financial Progress of River Valley Projects and Flood Prone River (RVP and FPR) by State.
232
Table D-6: Central releases under the Command Area Development Programme by State.
234
Table D-7: Number of Water Users’ Associations (WUAs) formed and area covered by State.
236
Table D-8: Water Rates for Flow Irrigation by State. 237 Table D-9: Water Rates for Lift Irrigation by State. 238

1
Chapter 1
Introduction 1.1 Water is the prime important factor besides high yielding seeds, manures and fertility of soil in improving agricultural economy of the country. Indian economy has predominantly remained agrarian in nature since independence as more than 70% population, living in about 6 lakh villages, are solely dependent upon agriculture and its allied activities. In the absence of proper irrigation facilities, agricultural activities were largely dependent upon the vagaries of weather and precipitation of rain fall. The unpredictable behaviour of rainfall was causing severe drought in deficient rainfall areas and moderate to heavy floods where it was above normal. These floods were causing innumerable problems such as loss of agricultural produce, water logging, erosion of land, health hazards and loss of human lives in a big way. Keeping in view the above factors, Government of India introduced the concept of efficient Water Resources Management System in the country. Under the system many Major and Medium Irrigation and Multipurpose projects were started. These projects were designed mainly to augment irrigation potential in the country. In these projects, the large scale water reservoirs were developed to conserve water for planned distribution and network of canals were construction to meet the requirement of irrigation needs. Major and Medium Irrigation and Multipurpose projects were constructed to meet drinking water requirements for both rural and urban areas. In addition, these projects have also helped in containing the floods havoc in a big way.
1.2 It is more important, from user point of view, for equitable distribution and optimal utilisation of irrigated water to the field of farmers. The Command Area Development Programme was initiated by constructing field channels, drainage system and land levelling of undulating land of farmers to meet the requirement. Removal of alkalinity and salinity of land are also carried out through Command Area Development Programme and is being funded by Central as well as State Government. Conjunctive use of ground and surface water also meet the requirement of equitable distribution of water for agriculture purpose. Minor Irrigation projects, by creating check dams and bunds, are other facets of conserving water and equitable distribution of water. All such activities are funded by Central and State Governments and parts of Minor Irrigation are in the domain of private ownership to facilitate irrigated water in ultimate use of agriculture.
1.3 Development of irrigation and related facilities including those related to erosion of land, either by sea or by inland water body and protection of crops and agricultural land from floods, are very important for food security. A number of projects have been initiated for irrigation and related facilities in the country and are in operation to achieve these objectives involving huge investment. The water resources projects are largely developed executed and managed by the Government. The State Governments are primarily responsible for planning, implementation and management of the projects. However, the Central Water Commission, being the

2
apex nodal agency in water resources sector, has the overall responsibility for its development, technical clearance and monitoring of the Major and Medium projects.
1.4 In view of water resources projects being largely funded by the Government from Public funds, the financial performance analysis assumes important role in developing these projects. The financial performance analysis is also important for assessment of the economic viability and long term sustainability of the projects particularly so in the context of developing countries like India for optimal utilization of limited resources. The Major and Medium Irrigation and Multipurpose projects attract large investment out of Government exchequer and are classified as Commercial and Non-commercial projects. The Finance Accounts of Comptroller and Auditor General of India and State Accountant Generals also provide information on Commercial and Non-commercial irrigation projects separately. The financial performance analysis provides a tool for critical analysis of the Capital Expenditure and Working expenses on various components and the revenue generated from the project in operation.
1.5 Keeping in view of detailed data needs of planners, researchers and analysts interested in review and analysis of investment in the projects and in order to present all related financial data for specific projects at one place, the Information System Organisation continuously strive to collect, compile and present the data on water and related activities in the form of different publications. This publication presents data on Major and Medium Irrigation and Multipurpose projects, Minor Irrigation projects, Command Area Development scheme as available in the Finance Accounts of the Union and State Governments brought out by Comptroller and Auditor General of India and Accountant General of respective states. These accounts provide audited revenue receipts and expenditure on various economic activities of irrigation projects. These figures are approved by Comptroller and Auditor General (C&AG) of India.
1.6 The Publication has four chapters besides statistical tables, charts and graphs depicting the essence of information presented in corresponding sections. An Executive Summary on Major and Medium Irrigation and Multipurpose projects, Minor Irrigation Schemes and CAD Programmes is reported at the beginning. In Chapter 1, introduction of financial aspects in water resources sector broadly cover implication for investment on Major and Medium Irrigation and Multipurpose projects, Minor Irrigation Schemes and CAD Programmes. In Chapter 2, some analytical detail and interpretation of all–India and State-wise data on Capital Expenditure, Working Expenses and Gross Receipts have been presented separately for Major and Medium Irrigation projects, Minor Irrigation Schemes and CAD Programmes. In Chapter 3, infrastructures on water resources sector are presented for understanding of financial performance of water resources projects. In Chapter 4, observations on analysis of the data and policy implications have been summarized. Besides these chapters, this publication also contains statistical tables on financial aspects for Major and Medium projects, Minor Irrigation projects and Command Area Development programme in Appendix I and graphs depicting All-India and State/UT level data in Appendix II. In Appendix III, methodology for compilation of data and in Appendix IV, glossaries of terms for compilation of financial figures are presented.

3
Chapter 2
Financial Performance of Water Resources Sector
2.1 Financial aspects of Major and Medium Irrigation and Multipurpose projects, Minor Irrigation schemes and Command Area Development Programme across the country refers to revenue receipt and revenue & capital expenditure incurred on these projects. Now onwards Major and Medium Irrigation and Multipurpose projects, Minor Irrigation schemes and Command Area Development Programme will be termed as ‘Irrigation Projects’ in this publication. The revenue receipt and revenue & capital expenditure on irrigation projects are compiled from the Finance Accounts of Union Government as well as State Governments prepared by Comptroller and Auditor General of India (C&AG) and Accountant General (AG) of concerned States respectively. The revenue receipt and the revenue and capital expenditure of all economic activities carried out for irrigation projects are classified into 4-digit codes. In this publication, following codes are used: 0700, 0701 : Revenue Receipt on Major and Medium Irrigation Projects
0702 : Revenue Receipt on Minor Irrigation Projects
0705 : Revenue Receipt on Command Area Development
2700, 2701 : Working Expenses on Major and Medium Irrigation Projects
2702 : Working Expenses on Minor Irrigation Projects
2705 : Working Expenses on Command Area Development
4700, 4701 : Capital Expenditure on Major and Medium Irrigation Projects
4702 : Capital Expenditure on Minor Irrigation Projects
4705 : Capital Expenditure on Command Area Development
2.2 The Finance Account of C&AG and AG of concerned State follow similar coding pattern of Major Head for revenue receipt and revenue and capital expenditure uniformly across the country and compilation of financial aspects of Irrigation Projects is based on the Finance Account. 2.3 The Capital Expenditure refers to the Finance Account that represents Money spent to acquire or upgrade physical assets such as construction of concrete and masionery dams, reserviours, spillways, canals and distributory networks of the irrigation project during a financial year. The Working Expenses refer to non plan expenditure incurred on Direction and Administration, Machenery and Equipment, Training, survey and investigation, research and other expenditures during the financial year

4
on different economic activities carried out for construction of irrigation projects. The revenue expenditure was incurred on a spectrum of activities like Direction and Administration, Procurement of Machinery and Equipment, Maintenance and Repair and Extension and Improvement of Completed Projects, Survey and Investigation and Construction Activities for new projects, Training and Research and other expenditure etc. Similarly, the expenditure incurred to meet day to day affairs of projects and petty expenses were booked under Miscellaneous Account termed as General/ Other Expenditure. It is reliably understood that expenditure incurred on Maintenance and Repair and Extension and Improvement of Completed Projects and expenditure incurred on projects those are yet to be approved by competent authority of Central and State Government are also included under Other Expenditure. Besides these activities, the expenditure not appropriately booked under a specific head of accounts is kept under Suspense Account. Similarly, Gross Receipt is the revenue receipt on account of water charges and other levy as imposed by the state Government from time to time. In case of Minor Irrigation projects Working Expenses refer to a spectrum of activities like (i) construction of Water Tank, Lift Irrigation, Tribal Sub-Plan and Other Expenditures under Surface Water schemes/ projects, (ii) Survey and Investigation, construction of Tube wells/ subsidy to beneficiaries and Other Expenditures in Ground Water schemes and (iii) Direction and Administration, Procurement of Machinery and Equipments, Tribal Sub-Plan and Other Expenses in general for Minor Irrigation projects. The Working Expenses in Command Area Development Programme consist of Direction and Administration, Ayacut Development, Dry Land Development, Development of Hill Areas/ Desert Area, Tribal Area Sub-Plan and Other Expenses. The Command Area Development Programme per se take up activities like construction of field channels, lining of channels, land leveling and warabandi of small catchments areas besides removal of alkalinity and salinity of land for agriculture use. The terminology of Ayacut and Dry Land development etc. conforms to construction of field channels, land leveling and other activities as mentioned above. 2.4 The Gross Budgetary Support of the State Governments covers (i) Projects under construction, (ii) Extension, Renovation and Modernization (ERM) of projects (iii) Accelerated Irrigation Benefit Programme (AIBP) (iv) Command Area Development Programme (CAD) and its related activities undertaken by Water Users’ Association (WUA) and (v) Minor Irrigation Schemes (MIS). Although AIBP and WUA has no direct bearing on financial aspects of such projects/programme but loan and advances as well as subsidy is provided by Central and State Governments under different schemes. These programmes have indirect impact on Government Exchequer. Water Users’ Association collects revenue on behalf of the Government and is accounted for Gross Receipt under revenue head of account in respective State Governments. Similarly, loans and advances extended to beneficiaries for optimum utilization of irrigation potential and nominal interest is charged on the loan and advances. Thus the Gross Receipt in the Finance Account also includes such revenue receipt on account of water charges and other levy as imposed by the concerned state Government from time to time. 2.5 This compilation contains time series data on financial aspects of irrigation projects from 1990-1991 to 2006-07 of Union Government and state governments. The financial aspects of irrigation projects, at macro level, has been considered for

5
compilation and analysis in conformity with macro level financial data of Sub-major head and Minor head available in the Finance Account of different states. This compilation contains information from 31 States as well as Union Territories (UTs) and Union Government. 2.6 The State/UT specific data for Major and Medium irrigation projects are included in Table series A. For Minor Irrigation projects, both Surface and Ground Water schemes are included in Table series B. And, the data for Command Area Development Programmes in States/UTs are included in Table series C. The summary of findings for all-India, States/UTs and Union Government are discussed in this chapter.
2.7 All-India
2.7.1 The quinquennial distribution of Capital Expenditure, Working Expenses and Gross Receipts at all-India level by type of irrigation are presented in charts Fig. 1.1, Fig. 1.2 and Fig. 1.3. These charts show that the share of types of irrigation projects in total Capital Expenditure, or Working Expenses or Gross receipts are more or less similar. The major and medium irrigation projects account for the major portion of expenditure, followed by Minor Irrigation and then by CAD. However, the total amounts for each of these characteristics are of different
scale.
Fig 1.2: Distribution of Working Expenditure by type of irrigation projects
‐100000
100000
300000
500000
700000
900000
1100000
1300000
1500000
1990‐91 1995‐96 2000‐01 2006‐07
Rs in
lakhs
CADMinorMajor & Medium
Fig 1.3: Distribution of Gross Receipts by type of irrigation projects
‐10000
10000
30000
50000
70000
90000
110000
130000
150000
1990‐91 1995‐96 2000‐01 2006‐07
Rs in
lakhs
Minor
Major & Medium
Fig 1.1: Distribution of Capital Expenditure by type of irrigation projects
0
500000
1000000
1500000
2000000
2500000
3000000
1990‐91 1995‐96 2000‐01 2006‐07
Rs in
lakhs
CADMinorMajor & Medium

6
2.7.2 Break-up of Working Expenses into its component has not been attempted in this publication except "Direction and Adminis-tration". However to have an idea the break-up at all-India level are presented below in Charts Fig. 1.4 to Fig. 1.6 separately for each type of irrigation project. In Fig 1.4, break up of working expenses for major and medium irrigation projects on component like direction and Administration, machinery & equipments, maintenance & repair, extension & improvement, training, research, survey & investigation, suspense and other expenditure etc have been indicated for the year 2006-07. Major portion of expenditure in major and medium irrigation projects includes other expenditure i.e Extension and Improvement of Completed Projects and expenditure on unapproved projects followed by Direction & Administration and maintenance & repair in the year 2006-07.
In Fig.1.5 break up of working expenses on component like surface water, ground water, Direction & Administration, machinery & equipments, tribal sub-plan and other expenses etc for minor irrigation projects have been shown for the year 2006-07. Major portion of expenditure in minor irrigation projects includes ground water followed by other expenses i.e
Maintenance and Repair, Extension and Improvement of Completed Projects and expenditure on unapproved projects, Direction & Administration and surface water in the year 2006-07. However, tribal sub-plan also contributed expenses on working expenses.
In Fig.1.6 break up of working
expenses on component like Ayacut Development, Direction & Adminis-tration, tribal sub-plan and other expenses etc for Command Area Development Programme have been shown for the year 2006-07. Major portion of expenditure in Command Area Development Programme includes Ayacut Development followed by other expenses i.e Maintenance and Repair, Extension and Improvement of Completed Projects and expenditure on unapproved projects, Direction & Administration in the year 2006-07. However, tribal sub-plan also contributed developmental activities under working expenses.

7
2.7.3 Plan-wise breakup of working expenses for major and medium irrigation projects, minor irrigation projects and Command area development programme at all India level are also indicated in Tables 2.1 to 2.3 for each type of projects.
Table 2.1 indicates that Direction and Administration, maintenance & repair and other expenditure (i.e Extension and Improvement of Completed Projects and expenditure on unapproved projects) dominate expenses under working expenses in successive plans for major and medium irrigation projects at all India level.
Table 2.1: Break-up of Working Expenses on Major and Medium irrigation projects in India
Rs in crores Direction
and Admn
Machinery and Equipment
Mainte- nance and Repair
Training
Research Survey and Investi-gation
Suspense
Other Expendi- ture
Total
Plan VIII
1791 134 9902 61 154 248 76 9043 21409
Plan IX
5341 189 14328 72 252 370 16 17887 38455
Plan X
8888 215 874 92 328 447 15 29119 39978
Table 2.2 indicates that Direction & Administration and ground water dominate expenses under working expenses in successive plans for minor irrigation projects at all India level.
Table 2.2: Break-up of Working Expenses on Minor irrigation projects in India
Rs in crores Dir & Admn surface water Ground water Total
Plan VIII 1975 1967 3759 7701 Plan IX 3405 2819 3659 9883 Plan X 4972 2887 4023 11882
Table 2.3 indicates that Ayacut development and other expenditure (i.e
Maintenance and Repair, Extension and Improvement of Completed Projects and expenditure on unapproved projects) dominate expenses under working expenses in successive plans for command area development programme at all India level.
Table 2.3: Break-up of Working Expenses on Command Area Development
Programme in India Rs in crores
Direction & Admn
Ayacut development
Tribal Area sub-plan
Other Exp Total
PlanVIII 4 813 61 484 1363 Plan IX 6 935 53 765 1759 Plan X 135 1053 14 941 2143

8
2.8.1.1 Major and Medium Irrigation projects [Tables A1]: The Annual Capital Expenditure on major and medium irrigation projects has an increasing trend during the period 1990-91 to 2006-07. It was Rs. 284638 lakh in 1990-91 and increased to Rs. 2654223 lakh in 2006-07. Similarly, the Annual Working Expenses for major and medium irrigation projects also
depicted an increasing trend from Rs. 245219 lakh to Rs. 960443 lakh during the same period. The component "Direction and Administration" of Working Expenses also shows an increasing trend. It was only 8% in 1990-91 and increased to 25% in 2006-07. In absolute terms, the amount increased almost 12 times during the same period. The Gross Receipts from these projects on account of water charges and other economic activities are in the range of 5% to 12% of Capital Expenditure during 1990-91 to 2006-07. 2.8.1.2 Minor Irrigation Projects [Table B1]: The Capital Expenditure on minor irrigation projects shows an increasing trend over the period 1990-91 to 2006-07. During the period it has increased from Rs. 48858 Lakh to Rs. 302036 lakh. Similarly, the annual Working Expenses for minor irrigation projects also increased from Rs. 97480 lakh in 1990-91 to Rs. 293271 lakh in 2006-07. The Working Expense on Direction and Administration in 2006-07 was almost 10 times of the corresponding year in 1990-91. The expenditure incurred on Direction and Administration was 5% to 18% of Working Expenses. The Gross Receipts from minor irrigation projects on account of water charges and other levy are in the range of 6% to 15% of Capital Expenditure during 1990-91 to 2006-07.
2.8.1.3 Command Area Development Programmes [Table C1]: The annual Capital Expenditure on command area development programmes has an increasing trend. It was Rs. 6965 lakh in 1990-91 and Rs. 17295 lakh in 2006-07. Similarly, the annual Working Expenses has increased from Rs. 20498 lakh to

9
Rs. 46152 lakh during the period. The entire Working Expenses have been booked under Ayacut Development and ‘Other Expenditure’ except nominal expenses on Direction and Administration during 1990-91 to 2006-07 except 2002-03, 2005-06 and 2006-07. The Gross Receipt on account of water charges and other levy is reported Nil.
State /UT Governments 2.8.2 Andhra Pradesh 2.8.2.1 Major and Medium Irrigation projects (Tables A2]: There were a gradual increase of Annual Capital Expenditure from Rs. 24961 lakh to Rs. 759949 lakh during 1990-91 to 2006-07. The Annual Working Expenses increased from Rs. 36032 lakhs in 1990-91 to Rs. 302651 lakh in
2006-07. The Working Expense on Direction and Administration in 2006-07 was almost 8 times of the same in 1990-91. The Gross Receipt on account of water charges and other economical activities are in the range of 0.5% to 20% of Capital Expenditure during 1990-91 to 2006-07.
2.8.2.2 Minor Irrigation projects [Table B2]: There was a gradual increase of Capital Expenditure of Minor Irrigation schemes during 1990-91 to 2006-07 except in 2005-06. The Annual Capital Expenditure has increased from Rs. 4037 lakh to Rs. 47842 lakh during 1990-91 to 2006-07. The Annual Working Expenses has consistently increased from Rs. 4929 lakh to Rs.16687 lakh from 1990-91 to 2001-02 and thereafter it declined to Rs. 6891 lakh in 2006-07. It is seen that no expenditure has been incurred on Direction and Administration. It implies either the scheme was implemented without any establishment expenses or the expenditures are booked under some other accounts head. Under Minor Irrigation scheme Gross Receipt on
account of water charge and other levy has been realized from 0.3% to 25% of Capital Expenditure during 1990-91 to 2006-07. 2.8.2.3 Command Area Development Programme [Table C2]: The Capital Expenditure of Command Area

10
Development Programme was fluctuating from Rs 388 lakh to Rs 2386 lakh during 1990-91 to 2006-07. The Annual Working Expenses has increased consistently from Rs. 278.57 lakh to Rs. 751 lakh during 1990-91 to 2006-07. On an average less than 20% of Working Expenses have been incurred on Direction and Administration. 2.8.3 Arunachal Pradesh 2. 8.3.1 Major and Medium Irrigation projects [Tables A3]: Under Major
and Medium Irrigation projects, no Annual Capital Expenditure has been incurred during the period from 1990-91 to 2006-07 and the cumulative Capital Expenditure was Rs.182 lakh till the end of 1990-91 which have been repeated every year by the State Accountant General office. However, there were working expenses which was only Rs. 2.5 lakh in 1990-
91 rising to Rs. 764 lakh in 2006-07. The whole amount of working expenses was booked under the head "Direction and Administration" only. 2.8.3.2 Minor Irrigation projects [Table B3]: The Capital Expenditure in Arunachal Pradesh was nominal under Minor Irrigation Schemes. However, the Annual Working Expenses has increased from Rs. 857 lakh in 1990-91 to Rs. 5631 lakh in 2006-07. A large portion of the Working Expenses was used for Direction and Administration and this component has been up by 8.5 times in 2006-07 over 1990-91. Gross Receipts on account of levy on water charges for Surface and Ground Water have a wider variation during 1990-91 to 2006-07.
2. 8.3.3 Command Area Development Programme [Table C3]: The State of Arunachal Pradesh has not spent any Capital Expenditure under CAD Programme. However, the Annual Working Expenses increased from Rs. 9 lakh to Rs. 452 lakh during 1990-91 to 2006-07 except in the years 1996-97 and 1998-99. All the Working Expenses under CAD

11
Programme has been put under the head of accounts ‘Other Expenditure’. 2.8.4 Assam
2. 8.4.1 Major and Medium Irrigation projects [Tables A4]: There was no definite trend on Capital Expenditure during the period from 1990-91 to 2006-07. It was Rs. 2374 lakh in 1990-91 and reached its peak level in 1999-2000 at Rs. 5024 lakh and decline to its lowest level in 2005-06 at 1493 lakh. Similarly, Annual Working Expenses is increasing from Rs. 221 lakh in 1990-91 to Rs. 3856
lakh in 2006-07. The Working Expenses on Direction and Administration in 2006-07 was almost 10 times of the corresponding value in 1990-91. The utilization of Working Expenses on Direction and Administration displays a sudden increase since 2000-01 onwards. The Gross Receipt on account of levy of water charges are in the range of 0.1% to 1.8% of Capital Expenditure during 1990-91 to 2006-07. 2. 8.4.2 Minor Irrigation projects [Table B4]: There was a gradual increase of Capital Expenditure from Rs. 4219 lakh in 1990-91 to Rs. 8065 lakh in 1999-2000 and thereafter gradually decreasing to Rs. 3965 lakh in the year 2004-05. Similarly, Annual Working Expenses is increasing from Rs. 1376 lakh to Rs. 12962 lakh during the period 1990-91 to 2006-07. There was abnormal increase of expenses on Direction and Administration during 2001-02 to 2006-07. The Gross Receipt on account of water charge levied under Minor Irrigation schemes was in the range of 0.1% to 1.1% of Capital Expenditure during 1990-91 to 2006-07 (except in 1992-93 where information has not been reported).
2. 8.4.3 Command Area Development Programme [Table C4]: The Capital Expenditure was gradually declining from Rs. 553 lakh to 30 lakh during1990-91 to 2006-07. No Working Expenses has been incurred on any of the economic activity under CAD programme during 2004-05 to 2006-07.

12
2.8.5 Bihar 2.8.5.1 Major and Medium Irrigation projects [Tables A5]: There was a gradual decrease of Capital Expenditure from Rs. 25667 lakh to Rs. 15196 lakh during 1990-91 to 1994-95 and thereafter a gradual increase of Capital Expenditure to Rs. 51282 lakh in 1999-2000. The Capital Expenditure took momentum during 2002-03 to
2006-07 and rose to Rs. 45094 lakh in 2006-07. Similarly, Annual Working Expenses is increasing from Rs. 6233 lakh to Rs. 18691 lakh from 1990-91 to 2006-07. The Working Expense on Direction and Administration in 2006-07 was almost 100 times of the corresponding value in 1990-91. There is a sharp hike in the Working Expenses on Direction and Administration in 1999-2000. The
Gross Receipt on account of levy of water charges is in the range of 2.5% to 18% of Capital Expenditure during 1990-91 to 2006-07.
2.8.5.2 Minor Irrigation projects [Table B5]: There is a gradual increase of Capital Expenditure from Rs. 825 lakh to Rs. 1000 lakh during 1990-91 to 1992-93 and thereafter a gradual decrease of Capital Expenditure to Rs. 226 lakh in 1995-96. The Capital Expenditure took momentum during 1996-97 to 2006-07 and rose to Rs. 4833 lakh in 2006-07. Similarly,
Annual Working Expenses is increasing from Rs. 9588 lakh to Rs. 25386 lakh from 1990-91 to 2004-05 and thereafter decline to Rs 13591 in 2006-07. The Working Expense on Direction and Administration was nil during 1990-91 to 2006-07. The Gross Receipts under Minor Irrigation Schemes have been ranging between Rs.35 lakh to Rs. 331 lakh during 1990-91 to 2006-07 resulting 0.6% to 39% of Capital Expenditure realized on account of levy of water charges.
2.8.5.3 Command Area Development Programme [Table C5]: No Capital Expenditure incurred during 1990-91 to 2006-07 under CAD Programme. The Annual Working Expenses was intermittently increasing from Rs. 1701 lakh to Rs. 5450 lakh during 1990-91 to 2006-07. The major components of Working Expenses were Direction and Administration

13
and Ayacut Development in the State under CAD Programme. 2.8.6 Chhattisgarh
The State has come into being since the year 2000 having been carved out from the erstwhile Madhya Pradesh. 2.8.6.1 Major and Medium Irrigation projects [Tables A6]: An amount of Rs.21189 lakh and Rs.133252 lakh remain as un-apportioned Capital Expenditure between Madhya Pradesh and Chhattisgarh till the end of the year 2000-01 under Major and Medium Irrigation projects. Capital Expenditure during the year was gradually increasing from Rs. 3455 lakh to Rs. 36115 lakh since 2000-01 to 2006-07. Similarly, Annual Working Expenses is consistently increasing from Rs. 2733 lakh to Rs. 9881 lakh from 2000-01 to 2006-07. The Working Expense on Direction and Administration in 2006-07 was almost
3.5 times of the corresponding value in 2000-01. Considerably large amounts have been realized as Revenue Receipt from water charge and related activities, which was in the range of 12% to 32% of Capital Expenditure during 2000-01 to 2006-07. 2.8.6.2 Minor Irrigation projects [Table B6]: Under the Minor
Irrigation Schemes, there exists an unallocated amount of Rs.185612 lakh but an amount of Rs.6363 lakh has been transferred from Madhya Pradesh to Chhattisgarh. The Capital Expenditure has been gradually increasing from Rs. 1770 lakh to Rs. 26931 lakh during 2000-01 to 2006-07. The Gross Receipts have been increased from 3.6% to 8.6% of Capital Expenditure during the same period.
2.8.6.3 Command Area Development Programme [Table C6]: There was a gradual increase of Capital Expenditure from 38 lakh to 421 lakh during 2000-01 to 2006-07 except abnormal increase of Capital Expenditure during 2004-05 and 2005-06. Similarly, Annual Working Expenses was intermittently increasing from Rs. 48 lakh to Rs. 74
lakh during 2000-01 to 2006-07. Ayacut Development was the major items of Working Expenses under CAD Programme.

14
2.8.7 Delhi Delhi got the status of statehood from Union Territory in the year 1992-93. The budgetary allocations were covered in the Union Government budgets upto 1992-93.
As such the details of Capital Expenditure and Working Expenses of Delhi have been provided only from 1993-94 onward. 2.8.7.1 Major and Medium Irrigation projects [Tables A7]: An amount of Rs.65 lakh appears in all Finance Accounts of Delhi, as a cumulative Capital Expenditure up to the end of each year. There was neither any annual
Capital Expenditure nor corresponding Working Expenses but the Gross Receipt in NCT of Delhi indicated that the State is reaping the fruits of earlier Capital Expenditure under Major and Medium Irrigation projects. The Gross Receipts have grown from Rs. 21 lakh to Rs. 535 lakh during the year from 1993-94 to 2006-07. 2.8.7.2 Minor Irrigation projects[Table B7]: There was a gradual increase of Capital Expenditure during 1993-94 to 1995-96 from Rs. 138 lakh to Rs. 180 lakh and thereafter from Rs. 46 lakh to Rs. 108 lakh during 1996-97 to 2000-01 but decline of Capital Expenditure reported in the year 2001-02 to 2006-07. Similarly, the Annual Working Expenses shows a monotonic increase from Rs. 115 lakh to Rs. 784 lakh during 1993-94 to 2006-07. There has been a significant increase of Working Expenses on Direction and Administration during 1993-94 to 2006-07. However, major portion of Working Expenses i.e. more than 80% has been incurred on Other than Direction and Administration. The Gross Receipts of Minor Irrigation Schemes have been quite significant during the period 1999-2000 to 2006-07. The Gross Receipts have been increased from 0.4 lakh to 13 lakh. 2.8.7.3 Command Area Development Programme: There is no CAD Programme in operation at Delhi. 2.8.8 Gujarat 2.8.8.1 Major and Medium Irrigation projects [Tables A8]: The allocation of Capital Expenditure was fluctuating during 1990-91 to 2006-07 with major spurts in the year 1997-98 to 1999-2000 and 2003-04 to

15
2006-07. Similarly, Annual Working Expenses is consistently increasing from Rs. 31895 lakh to Rs. 180751 lakh from 1990-91 to 2002-03 and again it was in increasing trend from Rs 21444 lakh to Rs 32556 lakh during 2003-04 to 2006-07. The Working Expense on Direction and Administration in 2006-07 was almost 6 times of the corresponding value in 1990-91. The Gross Receipt on account of water charges and other revenues was ranging from 4.02% to 35.23% of Capital Expenditure during 1990-91 to 2006-07. Major increase in Gross Receipt is reported during 1998-99 to 2006-07. 2.8.8.2 Minor Irrigation projects [Tables B8]: There was a gradual increase of Capital Expenditure during 1990-91 to 2000-01 from Rs. 519 lakh to Rs. 16810 lakh and thereafter from Rs. 7969 lakh to Rs. 82764 lakh during 2001-02 to 2005-06 but decline of Capital Expenditure reported in the year 2006-07. Similarly, Annual Working Expenses was consistently increasing from Rs. 4942 lakh to Rs. 17853 lakh during 1990-91 to 2006-07 except in the years 1999-00 to 2000-01. The Working Expenses on Direction and Administration have gone up by 4 times during 1990-91 to 2006-07. The Direction and Administration was accounted for 10% to 25% of Working Expenses during the period. The Gross Receipt on account of water charges and other revenues was accounted for 0.6% to 29% of Capital Expenditure. Major increase of Gross Receipt for an amount of Rs. 1089 lakh was reported in the year 2003-04. 2.8.8.3 Command Area Development Programme [Tables C8]: No annual Capital Expenditure incurred for the CAD Programme during the period 1990-91 to 2006-07 and an amount of Rs.5 lakh has been repeated in the Finance Accounts published by
the Accountant General, as the cumulative amount of Capital Expenditure at the end of each year. Similarly, Annual Working Expenses was intermittently decreasing from Rs. 1488 lakh to Rs. 564 lakh during 1990-91 to 2006-07. Working Expenses have been made on Ayacut Development and Tribal Area Sub-plan in the State.

16
2.8.9 Haryana 2.8.9.1 Major and Medium Irrigation projects [Tables A9]: There was a gradual increase in allocation of Capital Expenditure during 1990-91 to 2006-07 but nominal decline of Capital Expenditure reported in the year 2002-03 and 2003-04. The Capital Expenditure during the year has increased from Rs. 4940 lakh to Rs. 49792 lakh during 1990-91 to 2006-07. Similarly, Annual Working
Expenses has increased from Rs. 11164 lakh to Rs. 49297 lakh from 1990-91 to 2006-07. The Working Expense on Direction and Administration in 2006-07 was almost 6 times of the corresponding value in 1990-91. The Gross Receipt on account of water charges has increased from Rs.1730 lakh to Rs. 8719 lakh with a major increase in the years 2003-04 and 2004-05. The Gross Receipt was in the range of 11% to 96% of Capital Expenditure during 1990-91 to 2006-07. 2.8.9.2 Minor Irrigation Projects [Table B9]: There was a gradual increase of Capital Expenditure during 1990-91 to 1995-96 from Rs. 2032 lakh to Rs. 4451 lakh and thereafter from Rs. 2192 lakh to Rs. 7400 lakh during 1997-98 to 2001-02 but Capital Expenditure has not been reported during the years 2002-03 to 2006-07. Similarly, Annual Working Expenses was intermittently decreasing from Rs. 2535 lakh to Rs. 414 lakh during 1990-91 to 2006-07except in the years 1994-95 and 2002-03. No expenditure has been incurred on Direction and Administration. The Gross Receipt for Minor Irrigation Schemes was in the range of 0.1% to 0.3% of Capital Expenditure with an exception in the year 1996-97 8.2% of Capital Expenditure.
2.8.9.3 Command Area Development Programme [Table C9]: No Capital Expenditure has been incurred on CAD Programme during 1990-91 to 2006-07. However, the Annual Working Expenses has increased from Rs. 12 lakh to Rs. 46 lakh during 1990-91 to 1996-97 and thereafter it declined to Rs 22 lakh in 1999-00. The Annual Working Expenses was intermittently increasing from Rs. 3812 lakh to Rs. 5487 lakh during 2000-01 to 2006-07. Entire Working Expenses

17
have been incurred on developmental work during 1990-91 to 2006-07. 2.8.10 Himachal Pradesh 2.8.10.1 Major and Medium Irrigation projects [Tables A10]: The Capital Expenditure during the year was consistently increasing from Rs. 214 lakh to Rs.3921 lakh during 1990-91 to 2006-07 (Table A10). Similarly, Annual Working Expenses is consistently increasing from Rs. 104 lakh to Rs. 550 lakh from 1990-91 to 2006-07. Although Gross Receipt is negligible but abnormal realization of Revenue Receipt has been reported in the year 2001-02. 2.8.10.2 Minor Irrigation projects [Table B10]: The Capital Expenditure during the year was consistently decreasing from Rs.1474 lakh to Rs. 720 lakh during 1990-
91 to 1993-94 and thereafter consistently increasing to Rs.11293 lakh during 1994-95 to 2006-07. In contrast, Annual Working Expenses has consistently increased from Rs. 1447 lakh to Rs. 12338 lakh during 1990-91 to 2006-07. While the Working Expenses on Direction and Administration rose to 30 times during 1990-91 to 2006-07, the expenses on Direction
and Administration was in the range of 20% to 80% and Gross Receipt was less than 2% of Capital Expenditure during 1990-91 to 2006-07.
2.8.10.3 Command Area Development Programmes [Table C10]: The Capital Expenditure has consistently increased from Rs 67 lakh to Rs 544 lakh during 1990-91 to 2006-07 except in the year 1998-99 and 1999-2000. Annual Working Expenses has increased from Rs. 3 lakh to Rs. 32 lakh during 1990-91 to 1995-96. Similarly, Annual Working Expenses has intermittently
increased from Rs. 18 lakh to Rs. 35 lakh during 1996-97 to 2002-03. Annual Working Expenses sharply increased to Rs 7024 lakhs in 2003-04 and thereafter declined to Rs 9 lakh in 2006-07. Ayacut development has been the sole components of Working Expenses in the State under CAD Programme.

18
2.8.11 Jammu and Kashmir 2.8.11.1 Major and Medium Irrigation projects [Tables A11]: The Capital
Expenditure during the year has consistently increased from Rs. 871 lakh to Rs. 3843 lakh during 1990-91 to 2006-07. Similarly, the Annual Working Expenses has consistently increased from Rs. 668 lakh to Rs.3487 lakh from 1990-91 to 2006-07. The Working Expense on Direction and Administra-tion in 2006-07 was almost 9.5 times of the corresponding value in 1997-98. There had been no expenditure on
Direction and Administration till 1996-97 and thereafter it has gradually increased from Rs.206 lakh to Rs. 3919 lakh. The Gross Receipt was in the range of 1.6% to 7.1% of Capital Expenditure during 1990-91 to 2006-07. 2.8.11.2 Minor Irrigation projects [Table B11]: There was no provision for Capital Expenditure during 1990-91 to 1996-97 and the Capital Expenditure was in increasing trend since 1997-98 to 2006-07 from Rs 942 to Rs 4034. However Direction and Administration was the major component of Working Expenses under Minor Irrigation Schemes in the State. About 62% to 98% of Working Expenses was spent on Direction and Administration. The Gross Receipt under Minor Irrigation Scheme was Rs. 12 lakh to Rs. 238 lakh during 1990-91 to 2006-07.
2.8.11.3 Command Area Development Programmes [Table C11]: No Capital Expenditure has been incurred under CAD Programme. However, Annual Working Expenses was consistently increasing from Rs. 385 lakh to Rs. 2278 lakh during 1990-91 to 2006-07. Working Expenses were incurred on Ayacut development in the State recording an increase of 6 times in 2006-07.

19
2.8.12 Jharkhand The State has come into being in the year 2000 having been carved out from the erstwhile Bihar. The amount of un-apportioned Capital Expenditure between Bihar and Jharkhand has been retained in Bihar as indicated in the Finance Accounts published by office of Accountant General, Bihar.
2.8.12.1 Major and Medium Irrigation projects [Table A12]: The Capital Expenditure during the year has consistently increased from Rs. 5615 lakh to Rs. 17154 lakh during 2000-01 to 2006-07. Similarly, Annual Working Expenses has increased from Rs. 328 lakh to Rs. 12650 lakh during 2000-01 to 2006-07. The Working Expense on Direction and
Administration in 2006-07 was almost 40 times of the corresponding value in 2000-01. The entire Working Expenses have been utilized on Direction and Administration except in the year 2001-02. The Gross Receipt on account of water charges was in the range of 4-30% of Capital Expenditure during 2000-01 to 2006-07.
2.8.12.2 Minor Irrigation projects [Table B12]: The Capital Expenditure during the year has consistently increased from Rs.327 lakh to Rs.4920 lakh. Similarly, Annual Working Expenses has consistently increased from Rs. 831 lakh to Rs. 3598 lakh during 2000-01 to 2006-07. There had been no expenditure on Direction and Administration from 1990-91 to 2006-07. The Gross Receipt is 0.1% to 2.8% of Capital Expenditure during 2000-01 to 2006-07.
2.8.12.3 Command Area Development Programmes [Table C12]: Neither Capital Expenditure nor Working Expenses have been incurred during 2000-01 to 2005-06 but Working Expenses was incurred to Rs 6 lakhs of which almost the entire amount was spent on Direction and Administration in 2006-07.

20
2.8.13 Karnataka 2.8.13.1 Major and Medium Irrigation projects [Tables A13]: The Capital Expenditure during the year has consistently increased from Rs. 24252 lakh to Rs. 373414 lakh during 2000-01 to 2006-07. Similarly, Annual Working Expenses is consistently increasing from Rs. 16876 lakh to Rs.65061 lakh from 1990-91 to 2000-01. The Working Expense on Direction and Administration in 2006-07 was almost 1.5 times of the corresponding value in 1990-91. The utilization of Working Expenses on Direction and Administration during 1996-97 to 2000-01 remained significantly higher as compared to other years. The Gross Receipt on account of water charges was in the range of 0.5% to 8.5% of Capital Expenditure during 2000-01 to 2006-07.
2.8.13.2 Minor Irrigation Projects [Table B13]: The Capital Expenditure during the year has consistently increased from Rs. 2017 lakh to Rs. 36051 lakh during 1990-91 to 2006-07. Similarly, Annual Working Expenses has consistently increased from Rs. 3923 lakh to Rs. 14025 lakh during 1990-91 to 2006-07. The Working Expenses on Direction and Administration rose to become 4.9 times during 1990-91 to 2006-07. The Gross Receipt on account of water charges were in the range of 1-9% of Capital Expenditure during 2000-01 to 2006-07.
2.8.13.3 Command Area Development Programmes [Table C13]: No Capital Expenditure has been incurred during 1990-91 to 2005-06 (except in 2002-03) under CAD Programme. The Capital Expenditure was Rs. 10 lakh in 2002-03 and Rs. 40 lakh in 2006-07. Annual Working Expenses has consistently increased from Rs. 2523 lakh to Rs. 7378 lakh during 1990-91 to 2006-07. Ayacut
development and Direction and Administration were the only components of Working Expenses under CAD Programme.

21
2.8.14 Kerala 2.8.14.1 Major and Medium Irrigation projects [Tables A14]: The Capital Expenditure during the year was consistently increasing from Rs. 5963 lakh to Rs. 14849 lakh during 1990-91 to 1997-98 and thereafter declined to Rs 9890 lakh till 2002-03 and again increases to Rs18841 lakh in the year 2005-06. Similarly, Annual Working Expenses is consistently increasing from Rs. 2365 lakh to Rs.10796 lakh from 1990-91 to 2006-07. Working Expenses for Direction and Administration increased from Rs 472 lakh to Rs 6711 during 1990-91 to 2006-07. The Gross Receipt on account of water charges was in the range of 2-6% Capital Expenditure during 1990-91 to 2006-07. 2.8.14.2 Minor Irrigation projects [Table B14]: The Capital Expenditure during the year was fluctuating from Rs.647 lakh to Rs. 2241 lakh during 1990-91 to 2006-07. Similarly, Annual Working Expenses has consistently increased from Rs. 2121 lakh to Rs. 8148 lakh during 1990-91 to 2005-06. There had been no expenditure on Direction and Administration from 1990-91 to 2006-07. The Gross Receipt on account of water charges was in the range of 3-29% of Capital Expenditure during 1990-91 to 2006-07.
2.8.14.3 Command Area Development Programmes [Table C14]: The State has not incurred any Capital Expenditure under CAD Programme. Annual Working Expenses was intermittently increasing from Rs. 1605 lakh to Rs. 2111 lakh during 1990-91 to 1998-99. Similarly, Annual Working Expenses has consistently decreased to Rs. 642 lakh in 2006-07.

22
2.8.15 Madhya Pradesh 2.8.15.1 Major and Medium Irrigation projects [Tables A15]: The Capital Expenditure during the year was consistently increasing from Rs.23193 lakh to Rs.106047 lakh during 1990-91 to 2006-07 (except in 2004-05) which was Rs 150014 lakh. Similarly, Annual Working Expenses has consistently increased from Rs.8031 lakh to Rs.28059 lakh from 1990-91 to 2006-07. The Working Expense on Direction and Administration in 2006-07 was almost 3 times of the corresponding year in 1990-91. The Working Expenses during 2000-01 to 2001-02 declined because of creation of Chhattisgarh. The Gross Receipts have shown an increasing trend and registered 3-24% of Capital Expenditure during 1990-91 to 2006-07. 2.8.15.2 Minor Irrigation projects [Table B15]: The Capital Expenditure during the year has consistently increased from Rs.11371 lakh to Rs. 31680 lakh during 1990-91 to 2006-07. But, Annual Working Expenses has intermittently increased from Rs. 3641 lakh to Rs. 5886 lakh during 1990-91 to 2006-07. The proportion of Working Expenses under Minor Irrigation Schemes on Direction and Administration has been negligible. The Gross Receipt on account of water charges and other receipt were in the range of 3-16% of Capital Expenditure. 2.8.15.3 Command Area Development Programmes [Table C 15]: The Capital Expenditure increased intermittently from Rs. 729 lakh to Rs. 796 lakh during 1990-
91 to 2006-07. The Annual Working Expenses has consistently increased from Rs. 1370 lakh to Rs. 4437 lakh during 1990-91 to 1995-96 and thereafter gradually declining to Rs 106 lakh in the year 2006-07. Under CAD Programme, Ayacut Development and Tribal Area Sub-plan were major components of Working Expenses during 1990-91 to 2006-07.

23
2.8.16 Maharashtra 2.8.16.1 Major and Medium Irrigation projects [Tables A16]: The Capital Expenditure during the year has consistently increased from Rs. 49977 lakh to Rs.
503482 lakh during 1990-91 to 2006-07. Similarly, Annual Working Expenses is consistently increasing from Rs. 50939 lakh to Rs. 165442 lakh from 1990-91 to 2002-03. The Working Expense on Direction and Administration in 2006-07 was almost 4.5 times of the corresponding value in 1990-91. Working Expenses on Direction and Administration and
Maintenance and Repair was very high during 1995-96 to 1997-98 and 2005-06 and 2006-07. The Gross Receipt on account of water charges and other economical activities was in the range of 2-11% of Capital Expenditure during 1990-91 to 2006-07. 2.8.16.2 Minor Irrigation projects [Table B16]: The Capital Expenditure during the year has consistently increased from Rs. 7252 lakh to Rs. 26816 lakh during 1990-91 to 2006-07. Similarly, Annual Working Expenses has consistently increased from Rs. 9499 lakh to Rs. 43710 lakh during 1990-91 to 2006-07. The Working Expenses on Direction and Administration has grown by 36.6 times during 1990-91 to 2006-07. The Gross Receipt on account of water charges and other economical activities were in the range of 2-40% of Capital Expenditure during 1990-91 to 2006-07. 2.8.16.3 Command Area Development Programmes [Table C16]: The State has
not incurred any Capital Expenditure under CAD Programme during 1990-91 to 2006-07. The Annual Working Expenses decreased intermittently from Rs. 3538 lakh to Rs. 1571 lakh during 1990-91 to 2006-07. Ayacut Development was the sole component of Working Expenses. Working Expenses has also been incurred on Direction and Administration during 2002-03 to 2006-07.

24
2.8.17 Manipur: 2.8.17.1 Major and Medium Irrigation projects [Tables A17]: The Capital Expenditure during the year has consistently increased from Rs.2764 lakh to Rs.
22007 lakh during 1990-91 to 2006-07. Similarly, Annual Working Expenses has also consistently increased from Rs.503 lakh to Rs.1931 lakh from 1990-91 to 2006-07. Direction and Administration has been the major component of Working Expenses. The Working Expense on Direction and Administration in 2006-07 was almost 5 times of the
corresponding value in 1991-92. The Gross Receipt on account of water charges and other economical activities were in the range of 0.7 to 4% of Capital Expenditure during 1990-91 to 2006-07. 2.8.17.2 Minor Irrigation projects [Table B17]: The Capital Expenditure during the year has consistently increased from Rs. 423 lakh to Rs. 2331 lakh during 1993-94 to 2006-07. Similarly, Annual Working Expenses has consistently increased from Rs. 86 lakh to Rs. 728 lakh during 1990-91 to 2005-06. Expenditure on Direction and Administration has been tremendously increased during 2001-02 to 2006-07. The Gross Receipt on account of water charges and other economical activities are in the range of 0.1% to 4.3% of Capital Expenditure during 1990-91 to 2006-07.
2.8.17.3 Command Area Development Programmes [Table C17]: For CAD Programme, no annual Capital Expenditure has been incurred (except in 2004-05 and
2005-06) by the State and as per the Finance Accounts published by the State AG office. An amount of Rs.14 lakh has been repeated during the year 1990-91 to 2002-03 as the cumulative Capital Expenditure at the end of the year. The Annual Working Expenses increased intermittently from Rs. 96 lakh to Rs. 691 lakh during 1990-91 to 2006-07. Entire Working Expenses was spent on developmental works during 1990-91

25
to 2006-07 and expenditure on Direction and Administration also reflected during 2002-03 to 2006-07. 2.8.18 Meghalaya 2.8.18.1 Major and Medium Irrigation projects [Tables A18]: The Capital Expenditure during the year has consistently increased from Rs. 56 lakh to Rs. 223 lakh during 1990-91 to 1998-99 and thereafter fluctuating during 2000-01 to 2005-06 and dropped in 2006-07. Similarly, Annual Working Expenses has consistently increased from Rs.6 lakh to Rs.22 lakh from 1990-91 to 2001-02. The Direction and Administration was the only component of Working Expenses for Major and Medium Irrigation projects. In 2001-02, the Working Expenses on Direction and Administration rose to around 3.6 times of the level in 1991-92 and thereafter start declining to zero. Although, Gross Receipts have been realized through Major and Medium Irrigation projects from the year 1992-93 onwards but it was not very significant. 2.8.18.2 Minor Irrigation projects [Table B18]: The Capital Expenditure during the year was more or less consistently increasing from Rs.121 lakh to Rs. 312 lakh during 1990-91 to 2006-07 and highest Capital Expenditure incurred in 2001-02. Similarly, Annual Working Expenses increased from Rs. 403 lakh to Rs. 1322 lakh during 1990-91 to 2006-07. However a major portion of Working Expenses was utilized on Direction and Administration registering more than 5 times hike during 1990-91 to 2006-07. The Gross Receipt on account of water charges and other economical activities were in the range of 0.4% to 1.8% of Capital Expenditure during 1990-91 to 2006-07. 2.8.18.3 Command Area Development Programmes: No Capital Expenditure or Working Expenses under CAD Programme have been reported and incurred during 1990-91 to 2006-07. 2.8.19 Mizoram 2.8.19.1 Major and Medium Irrigation projects [Tables A19]: The Capital Expenditure during the years was gradually declining from Rs. 25 lakh to Rs. 16 lakh during

26
1990-91 to 1993-94. No Annual Capital Expenditure was incurred during 1994-95 to 2006-07. Similarly, Annual Working Expenses was also quite low during 1990-91 to 2006-07. And, there was no Gross Receipts during that period. 2.8.19.2 Minor Irrigation projects [Table B19]: The Capital Expenditure during the year was more or less consistent during 1993-94 to 2002-03 except in the years 1994-95, 1995-96 and 1997-98 but highest Capital Expenditure reported during 1999-2000 and was abruptly in increasing trend during 2003-04 to 2006-07. The Annual Working Expenses increased intermittently from Rs. 277 lakh to Rs. 746 lakh during 1990-91 to 2005-06. Although there was substantial expenses during 1990-2007 on the component "Direction and Administration" of Working Expenses and there was no expenditure on this head during 1996-97 to 2000-01. The Gross Receipt on account of water charges and other economical activities were in the range of 0.3 – 6.3 lakh during the years 1990-91 to 2006-07. 2.8.19.3 Command Area Development Programmes [Table C19]: The State had
not incurred any Capital Expenditure except in the year 1997-98 for about Rs.2 lakh under CAD Programme. The Working Expenses have been reported between Rs 1.6 lakh to Rs 5 lakh during 1994-95 to 2000-01 and between Rs 16 - 38 lakh during 2001-02 to 2006-07.
2.8.20 Nagaland 2.8.20.1 Major and Medium Irrigation projects [Tables 20A]: Neither Annual Capital Expenditure nor Working Expenses has been reported for Major and Medium Irrigation projects. 2.8.20.2 Minor Irrigation projects [Table B20]: No Annual Capital Expenditure incurred by the State and the cumulative Capital Expendi-ture of Rs.187 lakh has been repeated in all the Finance Accounts published by the State AG office during the period from 1990-91 to 2001-02 and thereafter Capital Expenditure has

27
been incurred during 2002-03 to 2006-07. The Annual Working Expenses was consistently increasing from Rs. 450 lakh to Rs. 3329 lakh during 1990-91 to 2006-07. Around 4.5 times increase was recorded in Working Expenses on Direction and Administration. The Gross Receipt on account of water charges and other economical activities are in the range of 0.01% to 146% of Capital Expenditure. 2.8.20.3 Command Area Development Programmes: No Annual Capital Expenditure or Working Expenses have been incurred by the State for CAD Programme during 1990-91 to 2006-07. 2.8.21 Orissa 2.8.21.1 Major and Medium Irrigation projects [Tables A21]: The Capital Expenditure during the year is consistently increasing from 17698 lakh to 61774 lakh
during 1990-91 to 2006-07. Similarly, Annual Working Expenses has consistently increased from Rs.1662 lakh to Rs.12390 lakh from 1990-91 to 2006-07. The State has used major part of Working Expenses on Direction and Admi-nistration which became more than 10 times of the corresponding value in 1990-91. Gross Receipts during the years 2000-01 to 2006-07 have gone up. The Gross Receipt on account of water charges and other economical activities
are in the range of 1 - 10% of Capital Expenditure. 2.8.21.2 Minor Irrigation projects [Table B21]: The Capital Expenditure has consistently increased from 2452 lakh to 6340 lakh during 1990-91 to 2006-07. Similarly, Annual Working Expenses has increased from Rs. 2924 lakh to Rs. 8461 lakh over the period 1990-91 to 2006-07. As compared to the level of Working Expenses on Direction and Administration in 1990-91, there was more than 4 fold increase in 2006-07. The Gross Receipt on account of water charges and other economical activities are in the range of 3-11% of Capital
Expenditure. 2.8.21.3 Command Area Development Programmes [Table C21]: Although no Capital Expenditure incurred for CAD Programme in the State, Working Expenses were incurred on Ayacut Development and Tribal Area Sub-plan on a regular basis. The Annual Working

28
Expenses was intermittently increasing from Rs. 438 lakh to Rs. 2376 lakh during 1990-91 to 2006-07. The entire Working Expenses have been spent on Ayacut Development and increased about 4 times from 1990-91 to 2006-07.
2.8.22 Punjab 2.8.22.1 Major and Medium Irrigation projects [Table A22]: The Capital Expenditure during the year is fluctuating from 7251 lakh to 49131 lakh during 1990-91 to 2006-07. The Annual Working Expenses has consistently increased from Rs.8749 lakh to Rs.42786 lakh from 1990-91 to 2006-07. There has been a downward trend in the Working Expenses on Direction and Administration during 1990-91 to 2000-01. The position of Gross Receipts in the year 1994-95, 1995-96 and 2004-05 was much better as compared to other years. The Gross Receipt on account of water charges and other economical activities are in the range of 2-75% of Capital Expenditure during 1990-91 to 2006-07.
2.8.22.2 Minor Irrigation projects [Table B22]: The Capital Expenditure during the year has consistently increased from 796 lakh to 2685 lakh during 1990-91 to 2006-07 with a marginal decrease in the year 1995-96 and 2002-03. Similarly, Annual Working Expenses has increased from Rs. 1969 lakh to Rs. 4366 lakh during 1990-91 to 2006-07. During this period, no expenses were incurred on Direction
and Administration except 1997-2001. The Gross Receipts in the year 1997-98 was significantly higher than those in the other years. The Gross Receipt on account of water charges and other economical activities are in the range of 0.5% to 94% of Capital Expenditure during 1990-91 to 2006-07. 2.8.22.3 Command Area Development Programmes [Table C22]: Although Capital Expenditure under CAD Programme have been incurred and has consistently increased from Rs 1758 lakh to Rs 3859 lakh during 1998-99 to 2006-07 but no Working Expenses has been reported during the period.

29
2.8.23 Rajasthan 2.8.23.1 Major and Medium Irrigation projects [Tables A23]: The Capital Expenditure during the year has consistently increased from Rs.14395 lakh to Rs. 44141 lakh during 1990-91 to 1998-99 and thereafter fluctuating between Rs. 24933 to Rs 78802 lakh during 1999-2000 to 2006-07. Similarly, Annual Working Expenses has increased from Rs. 15285 lakh to Rs.88153 lakh from 1990-91 to 2006-07. During 1990-91
to 2006-07, an almost increasing trend was visible and Working Expenses on Direction and Administration has become around 29 times during the same period. The Gross Receipt on account of water charges and other economical activities are in the range of 5-15% of Capital Expenditure during 1990-91 to 2006-07. 2.8.23.2 Minor Irrigation projects [Table B23]: The Capital Expenditure during the year has consistently increased from 1978 lakh to 6337 lakh during 1990-91 to 2004-05 and thereafter abnormal increase to Rs 20051 and Rs 16215 lakhs in 2005-06 and 2006-07. Similarly, Annual Working Expenses has consistently increased from Rs. 4355 lakh to Rs. 6818 lakh during 1990-91 to 2006-07. A negligible amount of Working Expenses was spent on Direction and Administration during 1993-94 to 1998-99. The Gross Receipt on account of water charges and other economical activities were in the range of 9-62% of Capital Expenditure during 1990-91 to 2006-07.
2.8.23.3 Command Area Development Programmes [Table C23]: The Capital Expenditure during the year was in increasing trend from Rs. 4862 lakh to Rs. 11898 lakh during 1990-91 to 1996-97 and thereafter declined to Rs 4263 lakh in 2002-03. The Capital Expenditure declined from Rs 6647 lakh to Rs. 6110 lakh during 2004-05 to 2006-07. Similarly, Annual Working Expenses has consistently increased
from Rs. 2382 lakh to Rs. 8664 lakh during 1990-91 to 2001-02 and thereafter it has gradually decreased to Rs. 4409 lakh in 2006-07. Ayacut Development is the major component of Working Expenses under CAD Programme.

30
2.8.24 Sikkim 2.8.24.1 Major and Medium Irrigation projects [Tables A24]: Both Capital Expenditures and Working Expenses has not been incurred on Major and Medium Irrigation projects in Sikkim. 2.8.24.2 Minor Irrigation projects [Table B24]: No Capital Expenditure has been incurred during 1990-91 to 1995-96 but nominal Capital Expenditure was spent on Minor Irrigation Projects from 1996-97 to 1999-00, 2003-04 and 2005-06 to 2006-07. There was abnormal increase of Capital Expenditure reported during 2000-01 to 2002-03. The Annual Working Expenses has consistently increased from Rs. 194 lakh to Rs. 772 lakh during 1990-91 to 2006-07. The major share of Working Expenses was spent on Direction and Administration during 1990-91 to 2006-07. Working Expenses on Direction and Administration has increased by about 11 times during the period 1990-91 to 2006-07. The Gross Receipt on account of water charges and other economical activities were nominal during 1990-91 to 1999-2000 and thereafter Gross Receipt improved in 2000-01 and 2004-05 to 2006-07.
2.8.24.3 Command Area Development Programmes [Table C24]: no Capital Expenditure under CAD Programme during 1990-91 to 2006-07. The Annual Working Expenses intermittently decreased from Rs. 7 lakh to Rs. 5 lakh during 1992-93 to 2005-06. The main component of Working Expenses was Ayacut Development during 1992-93 to 2005-06 (except in 1997-98, 2004-05 and
2006-07) and 100% expenditure has been incurred there on during the period. 2.8.25 Tamil Nadu 2.8.25.1 Major and Medium Irrigation projects [Tables A25]: The Capital Expenditure during the year has consistently increased from Rs. 4595 lakh to Rs. 33146 lakh during 1990-91 to 1999-2000 and thereafter declined to Rs 14277 lakh in 2006-07. Similarly, Annual Working Expenses has increased from Rs.8045 lakh to

31
Rs.53709 lakh from 1990-91 to 2006-07. The Working Expense on Direction and Administration in 2006-07 was almost 9 times of the corresponding year in 1990-91. The position of Gross Receipts during 1997-1998 to 2006-07 was much better as compared to other years. The Gross Receipt on account of water charges and other economical activities are in the range of 3-30% of Capital Expenditure during 1990-91 to 2006-07. 2.8.25.2 Minor Irrigation projects [Table B25]: The Capital Expenditure during the year has consistently increased from Rs.152 lakh to Rs.11596 lakh during 1990-91 to 2006-07. Similarly, Annual Working Expenses was intermittently increasing from Rs. 3270 lakh to Rs. 4792 lakh during 1990-91 to 2006-07. A considerable amount of Working Expenses was spent on Direction and Administration during 1996-97 to 2006-07. The position of Gross Receipts has remained almost the same in all the years during 1990-91 to 2006-07. The Gross Receipt on account of water charges and other economical activities are in the range of 1-42% of Capital Expenditure during 1993-94 to 2006-07.
2.8.25.3 Command Area Development Programmes [Table C25]: No Annual Capital Expenditure has been incurred during 1990-91 to 2004-05 for CAD Programme but Capital Expenditure for Rs. 2446 lakh and Rs. 3530 lakh has been reported during 2005-06 and 2006-07 respectively. The Annual Working Expenses has consistently increased from Rs. 779 lakh to Rs. 4710 lakh during 1990-91 to 2003-04 and thereafter consistently decreased to Rs. 1723 lakh in 2006-07. Entire Working Expenses have been incurred on Ayacut Development.
2.8.26 Tripura 2.8.26.1 Major and Medium Irrigation projects [Tables A26]: The Annual Capital Expenditure was fluctuating during 1990-91 to 2006-07. No Annual Working Expenses was incurred during 1990-91 to 2006-07. The position of Gross Receipts in the years 1993-94, 1995-96 and 2002-03 was comparatively much better than those in the other years.

32
2.8.26.2 Minor Irrigation projects [Table B26: During the period from 1990-91 to 1998-99, no annual Capital Expenditure incurred under Minor Irrigation Schemes. During 1999-2000 to 2006-07, Annual Capital Expenditure was incurred for Rs. 1424 lakh to Rs. 4198 lakh, which registered almost 3 times growth in 2006-07. Similarly, Annual Working Expenses has intermittently increased from Rs. 1047 lakh to Rs. 1237 lakh during 1990-91 to 2006-07. The major part of Working Expenses has been incurred on Direction and Administration which was consistently increased from Rs. 232 lakh to Rs. 1231 lakh during 1990-91 to 2006-07. The Gross Receipt on account of water charges and other economical activities are in the range of 0.2% to 1.4% of Capital Expenditure during 1990-91 to 2006-07.
2.8.26.3 Command Area Development Programmes [Table C26]: The Capital Expenditure during the year has consistently decreased from Rs. 7 lakh to Rs. 0.1 lakh during 1990-91 to 1997-98 and no annual Capital Expenditure was incurred in CAD Programme during 1998-99 to 2005-06 but Capital Expenditure of Rs. 15 lakh has been reported in 2006-07. No annual Working Expenses was incurred
in CAD Programme during 1990-91 to 2006-07. 2.8.27 Uttar Pradesh 2.8.27.1 Major and Medium Irrigation projects [Tables A27]: The Annual Capital Expenditure during the year has consistently increased from Rs. 27373 lakh to Rs174847 lakh from 1990-91 to 2006-07. Similarly, Annual Working Expenses
has increased from Rs.36911 lakh to Rs. 122613 lakh during 1990-91 to 2006-07. No Working Expenses on Direction and Administration had been booked for five years 1991-92 to 1995-96. However, it has become significantly higher Working Expenses from 1997-98. The Working Expense on Direction and Administration in 2001-02 was almost 35 times of the corresponding

33
year in 1990-91. The Gross Receipt on account of water charges and other economical activities were in the range of 7-71% of Capital Expenditure during 1990-91 to 2006-07.
2.8.27.2 Minor Irrigation projects [Table B27]: The Capital Expenditure during the year was fluctuating during 1990-91 to 1996-97 and negative Capital Expenditure has been reported in 1995-96 and 1997-98. The Capital Expenditure has declined from Rs. 910 lakh to Rs. 223 lakh during 1998-99 to 2000-01. The Capital Expenditure has consistently increased from Rs. 1029 lakh to Rs. 5913 lakh during 2001-02 to 2004-05. The Capital Expenditure was abnormally increased during 2005-06 and 2006-07. The Annual Working Expenses has intermittently increased from Rs. 23739 lakh to Rs. 55008 lakh during 1990-91 to 2006-07. The Gross Receipt on account of water charges and other economical activities were in the range of Rs. 875 lakh to Rs.4058 lakh during 1990-91 to 2006-07.
2.7.26.3 Command Area Development Programmes [Table C27]: No Capital Expenditure has been reported during 1990-91 to 2006-07 (except in 1997-98) under CAD Programme. The Annual Working Expenses has intermittently increased from Rs. 3640 lakh to Rs. 6453 lakh during 1990-91 to 1997-98. The Annual Working Expenses has gradually increased from Rs. 4547
lakh to Rs. 14795 lakh during 1998-99 to 2002-03 but it increased intermittently from Rs. 8811 lakh to Rs. 10965 lakh during 2003-04 to 2006-07. The entire Working Expenses has been booked under ‘Other Expenditure’, which was in the range of Rs. 2386 lakh to Rs.14795 lakh. 2.8.28 Uttarakhand
2.8.28.1 Major and Medium Irrigation projects [Tables A28]: The State has come into being from the year 2000 having been carved out from the erstwhile Uttar Pradesh. An amount of Rs.26232 lakh and Rs.671893 lakh remain as un-apportioned Capital Expendi-ture between Uttar Pradesh and Uttaranchal in the year 2000-01 for Major and Medium Irrigation

34
projects. The Annual Capital Expendi-ture has consistently increased from Rs. 1251 lakh to Rs. 12791 lakh during 2000-01 to 2006-07. Similarly, Annual Working Expenses has increased from Rs. 1537 lakh to Rs.11520 lakh from 2000-01 to 2006-07. The Working Expenses have been utilized on Direction and Administration which registered 86-92% during 2000-01 to 2006-07. The Gross Receipt on account of water charges and other economical activities were in the range of 4-47% of Capital Expenditure during 2000-01 to 2006-07. 2.8.28.2 Minor Irrigation Schemes [Table B28]: Under the Minor Irrigation Schemes, there exists an unallocated amount of Rs.358 lakh and Rs.131993 lakh as un-apportioned Capital Expenditure between Uttar Pradesh and Uttaranchal in 2000-01. The Capital Expenditure during the year has consistently increased from Rs. 4098 lakh to Rs. 14004 lakh during 2003-04 to 2006-07. The Annual Working Expenses has intermittently increased from Rs. 241 lakh to Rs. 3979 lakh during 2000-01 to 2006-07. No expenditure has been incurred on Direction and Administration during 2000-01 to 2006-07. The Gross Receipt on account of water charges and other economical activities were in the range of Rs.9-120 lakh during 2000-01 to 2006-07. 2.8.28.3 Command Area Development Programmes [Table C28]: Under the Command Area Development Programmes, there exists an unallocated amount of Rs. 1195 lakh as un-apportioned Capital Expenditure between Uttar Pradesh and
Uttaranchal in 2000-01. During the period from 2000-01 to 2006-07, there was no annual Capital Expenditure incurred under Command Area Development Programmes. The Annual Working Expenses was intermittently increasing from Rs. 21 lakh to Rs. 207 lakh during 2000-01 to 2006-07. Entire Working Expenses has been booked under Other Expenses during 2000-01 to 2006-07.
2.8.29 West Bengal 2.8.29.1 Major and Medium Irrigation projects [Tables A29]: The Capital Expenditure in West Bengal does not exhibit any definite trend during the period 1990-91 to 2006-07. However, Annual Working Expenses has consistently increased from Rs. 5698 lakh to Rs.24187 lakh

35
from 1990-91 to 2006-07. The Working Expenses on Direction and Administration have grown more than 9 times during 1990-91 to 2006-07. The Gross Receipt on account of water charges and other economical activities are in the range of 2-12% of Capital Expenditure during 1990-91 to 2006-07. 2.8.29.2 Minor Irrigation projects [Table B29]: The Capital Expenditure has intermittently increased from Rs. 2382 lakh to Rs. 2712 lakh during 1990-91 to 2006-07. Similarly, Annual Working Expenses has increased from Rs. 7857 lakh to Rs. 27306 lakh during 1990-91 to 2006-07. The Working Expenses on Direction and Administration have undergone an increase by 2.8 times during1990-91 to 2006-07. The Gross Receipts from Minor Irrigation Schemes shows an increasing trend during 1990-91 to 2004-05. The Gross Receipt on account of water charges and other economical activities were in the range of 9-89% of Capital Expenditure during 1990-91 to 2006-07. 2.8.29.3 Command Area Development Programmes [Table C29]: The Capital
Expenditure was fluctuating between Rs.117 lakh to Rs. 949 lakh during 1990-91 to 2006-07. Similarly, Annual Working Expenses was gradually increasing from Rs. 108 lakh to Rs. 391 lakh during 1991-92 to 2006-07. The entire Working Expenses under CAD Programme was booked under the head ‘Other Expenditure’.
2.8.30 Goa 2.8.30.1 Major and Medium Irrigation projects [Table A30]: The Capital Expenditure was fluctuating over the period from Rs. 1084 lakh to 4590 lakh during the years 1990-91 to 2004-05 with an abnormal increase in the year 2005-06 and 2006-07. The Annual Working Expenses has consistently increased from Rs.183 lakh to Rs. 900 lakh during 1990-91 to 2006-07. In Goa, bulk of Working Expenses during the period 1990-91 to 2006-07 under Major and Medium Irrigation projects has been utilized for Direction and Administration purposes which have increased by more than 366% over the same period. Considerably a large

36
amount has been reported in the year 2001-02 and 2005-06 as Gross Receipt. The Gross Receipt on account of water charge and other revenue was ranging from 0.5-33% of Capital Expenditure during 1990-91 to 2006-07. 2.8.30.2 Minor Irrigation projects [Table B30]: No Capital Expenditure has been incurred during 1990-91 to 1993-94. The Capital Expenditure was consistently
increasing from Rs. 254 lakh to Rs. 951 lakh during 1994-95 to 2002-03. The Capital Expenditure has abnormally been increased during 2003-04 to 2006-07. Similarly, Annual Working Expenses has increased from Rs. 124 lakh to Rs. 1133 lakh during 1990-91 to 2006-07. Direction and Administration accounted for an increase from 9-26% of Working Expenses during 1990-91 to 2006-07. The Gross Receipts from Minor
Irrigation Schemes have been in the range of Rs7 lakh to Rs.1131 lakh during the period 1990-91 to 2006-07. However, major increase of Gross Receipt was reported in the year 2002-03 and thereafter a moderate increase in the year 2003-04 to 2005-06. The Gross receipt on account of water charge and other revenue was ranging from 2-12% of Capital Expenditure during 1990-91 to 2006-07 except in the years 2002-03, which was considerably higher. 2.8.30.3 Command Area Development Programme [Table C30]: The Capital Expenditure has been incurred between Rs. 51 lakh to 168 lakh during 1990-91 to 2006-07. The Annual Working Expenses was intermittently increasing from Rs. 111 lakh to Rs. 269 lakh during 1990-91 to 2006-07. No Working Expenses have been incurred on Direction and Administration. The entire amount of Working Expenses has been incurred on ‘Other Expenditure’.
2.8.31 Pondicherry 2.8.31.1 Major and Medium Irrigation projects [Tables A31]: The Capital Expenditure during the year was fluctuating during 1990-91 to 2003-04. Similarly, Annual Working Expenses has consistently increased from Rs.16 lakh to Rs.55 lakh from 1990-91 to 2003-04. The entire Working Expenses on Major and

37
Medium Irrigation projects was utilized for Direction and Administration which increased by more than 3.4 times during 1990-91 to 2003-04. The Gross Receipt on account of water charges and other economical activities were in the range of 0.2-3.7% (except in the year 1994-95) of Capital Expenditure during 1991-92 to 2003-04.
2.8.31.2 Minor Irrigation projects [Table B31]: There was no Capital Expenditure till 1998-99 under Minor Irrigation Schemes but a drastic increase in the Annual Capital Expenditure during the years 2001-02 to 2006-07. The Annual Working Expenses was consistently increasing from Rs. 247 lakh to Rs. 1654 lakh during 1990-91 to 2006-07. The Gross Receipt on account of water charges and other economical activities were in the range of Rs.6-26 lakhs during 1990-91 to 2006-07. 2.8.31.3 Command Area Development Programmes [Table C31]: No Annual Capital Expenditure or Working Expenses have been incurred by the State for CAD Programme during 1990-91 to 2006-07. 2.8.32 Union government
2.8.32.1 Major and Medium Irrigation projects [Tables A32]: The Capital Expenditure during the year was between Rs. 185 lakh and Rs.559 lakh during 1990-91 to 2002-2003 (except in 1996-97) and thereafter reduced to less than Rs. 100 lakh during 2003-04 to 2006-07. The Annual Working Expenses has increased from Rs.3638 lakh to Rs.16362 lakh from 1990-91 to 2006-07. The Working Expense on Direction and Adminis-tration in 2006-07 was almost 4 times of the corresponding year in 1990-91. The Gross Receipt on account of water charges and other economical activities were more than Capital Expenditure. The Gross Receipt on account of water charges and other economical activities were in the range of Rs. 284 lakh to Rs. 1881 lakh during 1990-91 to 2006-07.

38
2.8.32.2 Minor Irrigation projects [Table B32]: The Capital Expenditure during the year was almost consistently increasing from Rs. 109 lakh to Rs 660 lakh during 1990-91 to 1997-98 and thereafter it was declining to Rs. 87 lakh in 2000-01. Again it was consistently increasing to Rs. 481 lakh in 2006-07. The Annual Working Expenses was intermittently increasing from Rs. 3708 lakh to Rs. 11450 lakh during 1990-91 to 2006-07. Direction and Administration indicate utilization of Working Expenses. The increase in Working Expenses on Direction and Administration stood at the level of 5.5 times of 1990-91. The Gross Receipts from Minor Irrigation Schemes shows an increasing trend during 1990-91 to 2006-07. The Gross Receipt on account of water charges and other economical activities were in the range of Rs.45-208 lakh (except in the year 1997-98 which is Rs.2208 lakh) during 1990-91 to 2006-07. 2.8.32.3 Command Area Development Programmes [Table C32]: The Capital
Expenditure during the year was fluctuating between Rs.26 lakh to Rs. 69 lakh during the years 1990-91 and 1997-98 to 2006-07. Nominal Capital Expenditure incurred during the year 1992-93 to 1996-97. However, Capital Expenditure of Rs. 100 lakh was incurred in the year 1991-92. Similarly, Annual Working Expenses increased intermittently from Rs. 7 lakh to Rs. 271 lakh
during 1990-91 to 2006-07. The entire Working Expenses under CAD Programme in Union Government were booked under the head of ‘Other Expenditure’.

39
Chapter 3
Infrastructure and Related Statistics
3.1 Water Resource Sector inter-alia contains Major and Medium Irrigation projects, Minor Irrigation Schemes and Command Area Development Programmes besides Public Health Engineering, which contains drinking water supply, sanitation and other activities related to domestic consumption, industrial and commercial use of water. This section, in particular, is the compilation of infrastructure of water resource sector excluding public health engineering. The infrastructure developed through construction of Major and Medium Irrigation projects, Minor Irrigation Schemes and Command Area Development Programme have specific reference in the publication.
3.2 The financial aspects of Irrigation Projects mainly covers water resources sector and a large amount of government exchequer which had been invested for development of infrastructure to facilitate irrigation benefits for common use for agriculture and domestic consumption. At present, there are 154 major, 774 medium and 87 ERM projects completed and operationalized till IX Five Year Plan. As per available compiled information of ‘Water and Related Statistics-2009’, 48 major, 91 medium and 39 ERM projects were expected to be completed in the X Plan. Besides these projects, 166 major, 222 medium and 89 ERM projects are also spill over to XI plan. In addition to these spill over projects 78 major, 146 medium and 86 ERM new projects are proposed to be taken up in XI plan. The distribution of major, medium and ERM projects completed till X Five Year Plan and spill over to XI Five Year Plan is mentioned in Table D-1.
3.3 Among the ongoing and new projects 303 Major and Medium Irrigation projects have been accepted by Technical Advisory Committee during 1991-92 to 2007-08 and 250 projects have so far been approved by the Planning Commission since April 1990. Adequate provision of financial support is essential to complete these projects. There are166 major, 222 medium and 89 ERM projects on-going during the XI Five Year Plan, which were initiated in preceding Five Year Plans. Besides incurring expenditure of Rs 122295.25 crore up to X plan, balance amount of Rs 135073.08 crore is estimated as spill over cost in XI Plan for execution/completion of 166 major, 222 medium and 89 ERM projects. State-wise no. of on-going projects of XI Plan and its financial implications during XI Plan are given in Table D-2.
3.4 An analysis of Capital Expenditure and Working Expenses as obtained from C&AG, CGA and State AG reveals that most of the state government had incurred expenditure on Major and Medium irrigation projects. Selected States/ UTs incurring

40
Capital Expenditure and Working Expenses on number of Major and Medium projects during X plan are mentioned in Table 3.1 below:
Sl No
States/UTs Nos of Major Projects
Nos of Medium Projects
1 Andhra Pradesh 43 126 2 Assam 19 - 3 Bihar 9 78 4 Chhatisgarh 18 48 5 Gujarat 23 171 6 Haryana 31 - 7 Himachal Pradesh 5 11 8 Jammu & Kashmir 27 - 9 Karnataka 35 38 10 Kerala 23 19 11 Madhya Pradesh 33 91 12 Maharashtra 69 84 13 Manipur 4 4 14 Orissa 95 6 15 Punjab 38 - 16 Rajasthan 13 50 17 Tamil Nadu 10 125 18 Uttar Pradesh 51 84 19 Uttarakhand 33 69 20 West Bengal 15 15
Detailed list of Major and Medium irrigation projects state-wise and its Capital Expenditure and Working Expenses during Xth Plan is in Table D-3.
3.5 Under Accelerated Irrigation Benefit Programme (AIBP), optimum utilisation of irrigation potential created is considered utmost priority and central loan assistance as well as grants for infrastructure development is released to the State Governments. The State-wise status of Central loan assistance and grant released under AIBP for major, medium and ERM projects in India are given in Table D-4. The central loan assistance for Rs 16425.51 crore up to 2004-05 and grant of Rs 11982.41 crore upto 2008-09 have been released.
3.6 Under the centrally sponsored schemes of river valley project, physical and financial achievement made during the IXth Plan, Xth Plan and targeted Expenditure for 2007-08 is mentioned in Table D-5. An investment of Rs 2263.07 crore has been made in centrally sponsored schemes of river valley project till the end of X Plan. The annual financial expenditure for centrally sponsored schemes of river valley project during 2007-08 was Rs 251.61 crore and necessary financial provision for remaining years of XI Plan need to be provided.
3.7 In case of Minor Irrigation projects and Command Area Development programme, need based funding in the form of central assistance and grants are released to facilitate irrigation by constructing field channels, land levelling, warabandi, reclamation water logged area and removal of alkalinity and salinity in

41
the farmers’ field. The state-wise release of central assistance under Command Area Development programme is also highlighted in Table D-6. An amount of Rs 2450.71 crore has been released up to IX plan and Rs 830.46 crore has also been released in X Plan as central assistance under Command Area Development programme. The annual financial expenditure for centrally sponsored schemes of Command Area Development programme during 2007-08 was Rs 285.62 crore and necessary financial provision for remaining years of XI Plan need to be provided.
3.8 In order to have equitable distribution of water, Water Users’ Association were formed and subsidy has been given to the Water Users’ Association (WUA) for proper up-keep of infrastructure made under CAD programme. Majority of the states have constituted Water Users’ Association and the number of WUAs is mentioned in Table D-7. So far 56830 Water Users’ Association have been constituted in 24 states. And, they cover almost 13 million hectares of land in total.
3.9 The water charges are imposed to collect revenue for proper up-keep of infrastructure developed in water resource sector. On the recommendations of various Committees and Commissions, it was considered essential to recover at least operational and maintenance cost of the infrastructure and a percentage of capital cost investment in the water resource sector. In order to recover water charges and its further uses, most of the State Governments have fixed Water Rates for Lift and Flow irrigation besides water charges for domestic, industrial and commercial use. The Water Rates as levied by the State Governments for Flow irrigation are given in the Table D-8 and for Lift irrigation is given in the Table D-9. The Water Rate for Flow irrigation exists for almost all States except some smaller States and UTs. The Water Rate is quite high in the States of Maharashtra, Assam, Andhra Pradesh, Chhattisgarh and Dadra and Nagar Haveli. The Water Rates for Lift irrigation are also higher in those States/UTs.

42
Chapter 4
Findings and Conclusions 4.1 Given the dynamic role of water in all day-to-day human endeavors, water is of vital importance not only for all round economic development but even for the survival of our economy. In our country, Water Resources Development Projects are being largely executed, operated, managed and maintained by the Government and aimed at making availability of water for diverse uses. We have undoubtedly made a remarkable achievement in the development of Water Resources Sector (especially Major and Medium Irrigation and Multipurpose projects, Minor Irrigation projects and Command Areas Development Programme) since independence and funded by the Government from the public funds. However, there are some concern about not been able to derive optimal benefits from the projects executed due to various reasons. However, one of the important reasons is that we have not been able to effectively look after its proper operation, maintenance and management due to lack of adequate finances which the States/ Union Territories Governments are unable to provide in view of compelling necessities and requirements of other sectors as well. Ironically, even whatsoever funds is available for the operation, maintenance and management of the system, the major portion is being consumed on the establishment expenses. It has to be realized that in view of compelling economic constraints, the requisite finances for an effective operation, maintenance and management of the irrigation system have to be generated from the revenue realized on account of water charges levied for the use of service(s) availed by the users. A rational charge or levy of water rates is, therefore, imperative both in the interest of equity and efficiency in management of irrigation system. There have also been significant gaps in revenue assessed and the revenue actually realized and minimizing the existing gap is desirable between the two. 4.2 The Financial Statements of CAG and the Accountant General of the States does not present macro (State) level data on loans and advances under Accelerated Irrigation Benefit Programmes (AIBP). Keeping in view the importance of AIBP and financial requirement for optimum utilization of Irrigation Potential, it is desirable to have project wise data to programme administrators, managers, researchers and analysts, at least for large projects, published by CAG and the Accountant General of the States as Annexure to the main report. Not only funding of AIBP but also releases to end users could be accounted for at Central and State level, if published by CAG and the Accountant General of the States. 4.3 The Financial Statements of Controller General of Accounts (CGA) does not present macro (State) level data on centrally sponsored schemes and central sector schemes implemented by different Ministries/ Departments of Union Governments. The funding of central share and subsidy thereof while implementing Centrally Sponsored Schemes and Central Sector Schemes and loans and advances for completion of projects invariably form part of financial aspects of irrigation projects.

43
Gross Receipt on account of irrigation receipt and levy of water charges are the subject matter in the domain of state governments which could not form part of financial aspects of irrigation projects at Union Government level and booking of such receipt under Finance and Appropriation Account deserve review at Union Government level. 4.4 Lack of availability of adequate finance which the Government is finding difficult to provide because of pressing commitments from other sector as well is severely affecting the operation, maintenance and management of the system. As a result, it has not been possible to derive optimal benefits from the executed projects. The system has therefore to be made self sustainable by ensuring generation of equivalent revenue needed for an effective operation, maintenance and management of the system out of revenue realized from the collection of water charges or any other receipt from the users themselves without putting any burden on the public fund. The states recovering less than 3% revenue from Major and Medium and Minor Irrigation projects should give priority to this aspect. On the recommendations of various Committees and Commissions, it was considered essential to recover at least operational and maintenance cost of the infrastructure and a percentage of capital cost investment in the water resource sector. 4.5 The Establishment Expenses account for a significant proportion of the funds provided for Operation and Maintenance of the system. There is an imperative need to cut down Establishment Expenses so as to ensure availability of funds for Operation and Maintenance aspects. A review should be undertaken by all the States/ Project Authorities and suitable norms be laid down on the subject.
4.6 The expenses on Salary etc. of work charge staff/daily wagers are not included under the Establishment Expenses in the Finance Accounts of the States and these may be getting clubbed under other heads for technical reasons. In view of salary etc of work charge staff/ daily wagers constitutes a significant proportion of Establishment Expenses, these expenses should be shown separately in the Finance Accounts.
4.7 Finance Account presents the Capital Expenditure during the year and cumulative up to the end of the year. However, the period to which the cumulative Capital Expenditure figures relate to is not clear form Finance Account. It will be desirable that the specific period to which the cumulative Expenditure relates is also clearly specified in the Finance Account Statements.
4.8 The utilization of Working Expenses on Other Expenditure did not give clear picture for utilization of such fund on identified component of expenditure of Major and Medium Irrigation projects, Minor Irrigation projects and CAD projects. There may be some subhead or sub minor head which could not be identified to account for such expenditure and placed under Other Expenses. Such States may be advised to reduce this expense.
4.9 Although Working Expenses placed under suspense has been incurred but due to lack of identification for specific instrument of expenditure, the same has been booked under suspense. The Suspense Head of Accounts are operated in many states

44
resulting in unexplained use of public funding. States having more than 1% of Working Expenses as expenditure on Suspense Account are advised to keep this expenditure to the minimum and in any case not more than 1%.
4.10 The utilization of Working Expenses on developmental activities in Command Area Development Projects is considerably high but no Direction and Administration Expenses has been incurred by the State/UT Government resulting in unexplained implementation of the scheme in such States. Appropriate measure required to be taken to enforce implementation of CAD Programme in States/UTs. 4.11 It has been observed that some of the States are incurring a large percentage of Working Expenses on Repair and Maintenance. States incurring more than 40% of Working Expenses on Repair and Maintenance should be advised to have a relook at their Water Rates for enhancement. Such States are advised to give adequate attention for recovery of water charges in their States to ensure that sufficient funds are being recovered from farmers or other water users towards Operation and Maintenance of existing irrigation system. In case fund being recovered for water charges at the existing rate is not sufficient, they should have a relook on their existing water charges structure for upward enhancement.
4.12 States namely Meghalaya, Pondicherry, Assam, Jharkhand and Uttaranchal having more than 90% expenditure on Direction and Administration on major and medium irrigation projects should merge Irrigation Departments with some other departments like Power or Agriculture to reduce the cost. Those Hilly States or Small States whose expenditure on Direction and Administration constitutes more than 50% of Working Expenses should consider merger of their Irrigation Department with other related Department such as CAD, Power and Agriculture etc. to make proper use of their Staff and reduce cost on Direction and Administration. Bihar should be advised to reduce number of Command Area Development Authority in the State. This step will be required for those states that are having independent Irrigation Department with less developmental activity.
4.13 The Major, Medium Irrigation and Multipurpose Projects have been initiated since beginning of the Plan era. There are 166 major, 222 medium and 89 ERM projects spill over in XI plan and 78 major, 146 medium and 86 ERM new projects are also to be completed during XIth Plan. Several Major, Medium Irrigation and Multipurpose projects are spill over to subsequent Five Year Plans and are yet to be completed. Planning Commission has approved 250 additional Major and Medium Irrigation projects for implementation. In order to complete spill over as well as new Major and Medium Irrigation projects as targeted, adequate provision of financial resources is required in the State Plan provisions and under AIBP Grant.

45
Appendix I
Methodology for Data Compilation Methodology
1. Financial aspects of Irrigation Projects refers to Revenue Receipt and Revenue Expenditure incurred for Major and Medium Irrigation and Multipurpose projects, Minor Irrigation schemes and Command Area Development projects now onwards will be referred as ‘Irrigation Projects’ across the country. The Receipt and Expenditure on Irrigation projects are compiled from the finance accounts of Union Government as well as State Governments / Union Territories prepared by Comptroller and Auditor General of India, Controller General of Accounts and Accountant General of concerned States respectively.
2. The Revenue Receipt and the Revenue Expenditure of all economic activities are classified into 4-digit codes. The first digit of the codes indicates the following:
0 or 1: Revenue receipt 2 or 3: Working Expenses 4 or 5: Capital Expenditure 6 or 7: Loans and advances 8or 9: Grants from Contingency Fund of India
The remaining 3 digits of the codes indicate the economic activity. The list of economic activities covered in this publication is as follows:
700 and 701 : Major and Medium Irrigation Projects 702 : Minor Irrigation Projects 705 : Command Area Development Programme
The other economic activities which are related to water resources sector but not included in this publication are listed below.
215: Rural and Urban Water Supply 402: Soil and Water Conservation scheme 711: Drainage and Anti-Sea Erosion Projects
3. The Finance Account of C&AG and AG of concerned State follow similar coding pattern of Major Head for Revenue Receipt and Revenue Expenditure uniformly across the country and compilation of financial aspects of Irrigation Projects is based on the finance account. In order to identify investment in Irrigation projects as commercial or non-commercial ventures, the project costing 25 lakh rupees or more is defined as commercial project and other projects costing less than 25 lakh rupees is termed as non-commercial project. 4. This publication is a compilation of Major Head-wise Revenue Receipt and Revenue Expenditure incurred for Major and Medium irrigation and

46
Multipurposes projects, Minor Irrigation schemes and Command Area Development projects. The Time Series data on Revenue Receipt and Revenue Expenditure incurred for Major and Medium Irrigation and Multipurpose projects, Minor Irrigation schemes and Command Area Development projects are segregated for Capital Expenditure during the year and Cumulative Total of Capital Expenditure at the end of year under Major Head of the instrument subscribed by 4 as first digit. Similarly, Gross Receipt of Major and Medium Irrigation and Multipurpose projects, Minor Irrigation schemes and Command Area Development projects are also worked out for every year under Major Head of the instrument subscribed by 0 as first digit. The Working Expenses of Major and Medium Irrigation and Multipurpose projects, Minor Irrigation schemes and Command Area Development projects including its inter related instruments are also worked out for every year under Major Head of the instrument subscribed by 2 as first digit. Although, Working Expenses has inter related instruments like Direction and Administration, Machinery and Equipment, Maintenance and Repair, Extension and Improvement, Training, Research and Survey and Investigation, there are several other instrument of Miscellaneous Expenditure which form part of Working Expenses. The Miscellaneous Expenditure naturally should be very nominal and the same is termed as ‘Other Expenses’ as a component of Working Expenses. There are expenses which are not classified properly are placed under suspense account by C&AG and so these amounts are shown separately in this publication.
5. The Working Expenses is the Gross Budgetary Support to implement infrastructure projects. In order to understand the degree of optimum utilisation of resources in implementing the infrastructure projects percentage variations of different instruments of expenditure have been worked out separately for States/ UTs.
_______________

47
Appendix II
Glossary of Terms This publication is the compilation of Major Head wise Revenue Receipt and Revenue Expenditure incurred for Major and Medium Irrigation and Multipurpose projects, Minor Irrigation schemes and Command Area Development programmes. Standard definitions and interpretations of these terms used, either in physical or financial term, for the publication is narrated below:
1. Revenue Receipt: Amount received for taxes, fees, permits, licenses, interest, intergovernmental sources and other sources during the fiscal year. Revenue or Revenues is income that a Government Department/ company receive from its normal business, activities, usually from the sale of goods and services to customers. Some Government Department/ companies also receive revenue from interest, dividend or royalties paid to them by beneficiaries’/ other companies. Revenue may refer to business income in general or it may refer to the amount in a monetary unit, received during a period of time.
2. Revenue Expenditure: The Revenue Expenditure deals with the proceeds of taxation and other receipts classified as revenue and the expenditure met there from, the net result of which represents the revenue surplus or deficit for the year. The Revenue expenditure also deals with expenditure met usually from borrowed funds with the object of increasing concrete assets of a material and permanent character. It also includes receipt of a capital nature intended to be applied as a set off against expenditure.
3. Capital Expenditure: Expenditure made for an asset with a useful life of more than one year that increases the value or extends the useful life of the asset. Capital expenditure generally may not be deducted in the year they are paid, even if they are paid in connection with a trade or business. In other words, they are capitalised and generally may be depreciated or amortized in succeeding years.
4. Working Expenses: Money spent for creation asset/ infrastructure in a fiscal year by a Government Department to add or expand infrastructure, plant and equipment assets and upkeep them with the expectation that they will benefit the Government Department over a long period of time.
5. Gross Receipt: Gross receipts are the total amounts the organisation received for taxes, fees, permits, licenses, interest, intergovernmental sources and other sources during the fiscal year during its annual accounting period without subtracting any costs or expenses.
6. Multipurpose River Projects: A Multipurpose River project is a project which covers the development of dam on a sufficiently large river extended over a large geographical area. It serves many purposes at a single time like acting as a

48
hydroelectric power plant, providing a source of clean drinking water, providing irrigation to fields, checking floods and flow of river water etc.
7. Major Irrigation Projects: A scheme having Culturable Command Area more than 10,000 hectares is Major Irrigation scheme
8. Medium Irrigation Projects: A scheme having Culturable Command Area more than 2,000 hectares and up to 10,000 hectares individually is a Medium Irrigation scheme.
9. Minor Irrigation Projects: A scheme having Culturable Command Area up to 2000 hectares individually is classified as Minor Irrigation scheme.
10. Command Area Development Programme: Development of geographical areas under the command of River Valley projects through Centrally Sponsored or Central Sector scheme implemented by State / Central Government for constructing field channels, drainage system and land levelling of undulating land of farmers. Reclamation of alkalinity and salinity of land are also carried out through Command Area Development Programme.
11. Modernisation and Improvement of Projects: Modernisation and Improvement of Projects envisages lining of existing canals, branches, distributaries, water courses and field channels and renewal of existing structures for reduction of conveyance and operational losses.
12. Sprinkler Irrigation System: Sprinkle Irrigation is a method of applying irrigation water which is similar to rainfall. Water is distributed through a system of pipes usually by pumping. It is then sprayed into the air of entire soil surface through spray heads so that it breaks up into small water drops which fall to the ground.
13. Drip Irrigation System: Drip Irrigation System delivers water to the crop using a network of mainlines, sub-main and lateral lines with emission points spaced along their lengths. Each dripper/emitter, orifice supplies a measured, precisely controlled uniform application of water, nutrients, and other required growth substances directly into the root zone of the plant.
14. Culturable Command Area (CCA): The Culturable Command Area is the geographical area which can be irrigated from an irrigation system and is fit for cultivation.
15. Cultivable Area: Cultivable Area consists of net area sown, current fallow, fallow lands, other lands, current fallow, culturable waste and land under miscellaneous trees/crops.
16. Gross Irrigated Area: The area irrigated under various crops during a year, counting the area irrigated under more than one crop during the same year as many times as the number of crops grown and irrigated.
17. Net Irrigated Area: It is the area irrigated through any source in a year for a particular crop.
18. Irrigated Potential Created: The total gross area proposed to be irrigated under different crops during a year by a scheme. The area proposed to be

49
irrigated under more than one crop during the same year is counted as many times as the number of crops grown and irrigated.
19. Irrigated Potential Utilised: The gross area actually irrigated during reference year out of the gross proposed area to be irrigated by the scheme during the year.
20. Recurring Working Expenses: Money spent for upkeep of asset/ infrastructure in a fiscal year by a Government Department to add or expand life of infrastructure, plant and equipment assets and upkeep them with the expectation that they will benefit the Government Department over a long period of time.
21. Direction and Administration: All expenditure from Plan / Non-plan budget incurred on establishment like salaries, office expenses, travel expenses and others in a fiscal year by a Government Department is termed as Direction and administration.
22. Machinery and Equipment: Machinery and Equipment are tools for facilitating delivery of manual works through mechanical device and at accurate speed and time.
23. Other Expenditure: Money spent on different instrument of expenditure in a fiscal year by a Government Department but not elsewhere classified in specific component of expenditure are termed as Other Expenditure. Money spent to acquire or upgrade physical assets such as construction of concrete and masionery dams, reserviours, spillways, canals and distributory networks of the irrigation project during a financial year.
24. Recovery of Revenue: Recovery of Revenue are the total amounts the organisation levy through taxes, fees, permits, licenses, interest, intergovernmental sources and other sources during the fiscal year during its annual accounting period.

50
Appendix III
Table A1 : Capital Expenditure, Working Expenses and Gross receipts for Major & Medium
Irrigation Projects over 1990-2007 All-India (Rs. in lakhs)
Year
Annual Plan/
5- Year Plan
Capital Expenditure Working Expenses Gross
Receipts
During the
year
up to the end of
the year
direction and
admini-stration
expenses other than direction and ad-
ministration
total
1 2 3 4 5 6 7 8
1990-91 Annual Plan
284638.32 3055690.63 21511.78 223707.69 245219.47 22415.44
1991-92 313186.59 3368877.25 21658.69 257362.27 279020.96 22741.51
Sub
Total 597824.91 - 43170.47 481069.96 524240.43 45156.95
1992-93
VIII Plan
341631.88 3710509.11 25687.58 290525.07 316212.65 32029.06
1993-94 397527.21 4108038.35 29555.32 333429.32 362984.64 47757.53
1994-95 480607.02 4588559.02 34152.76 401091.28 435244.04 44446.07
1995-96 545863.60 5134688.60 42475.76 439376.84 481852.60 49542.99
1996-97 549442.43 5684071.95 47261.79 497302.35 544564.14 45839.19
Sub
Total 2315072.14 - 179133.21 1961724.86 2140858.07 219614.84
1997-98
IX Plan
713793.01 6398415.12 85348.69 540442.92 625791.61 36334.13
1998-99 709370.62 7107785.75 92963.82 628574.37 721538.19 44180.30
1999-00 787471.61 7895283.28 116766.47 681255.25 798021.72 45694.45
2000-01 682162.91 7819722.37 99348.21 776893.86 876242.07 75351.72
2001-02 764937.61 8584670.24 139662.86 684255.67 823918.53 65224.50
Sub
Total 3657735.76 - 534090.05 3311422.07 3845512.12 266785.10
2002-03
X Plan
1016130.58 9600786.39 144452.42 740137.66 884590.08 78338.87
2003-04 1446344.00 11047270.74 143182.51 486177.69 629360.20 104760.26
2004-05 1765223.49 12844465.21 155666.83 546164.57 701831.40 126415.03
2005-06 2196479.30 15040964.55 201243.30 620362.33 821605.63 119470.28
2006-07 2654223.03 16897977.28 244233.64 716209.48 960443.12 150465.91
Sub
Total 9078400.40 - 888778.70 3109051.73 3997830.43 579450.35
Grand Total 15649033.21 - 1645172.43 5551846.55 10508441.05 1111007.24
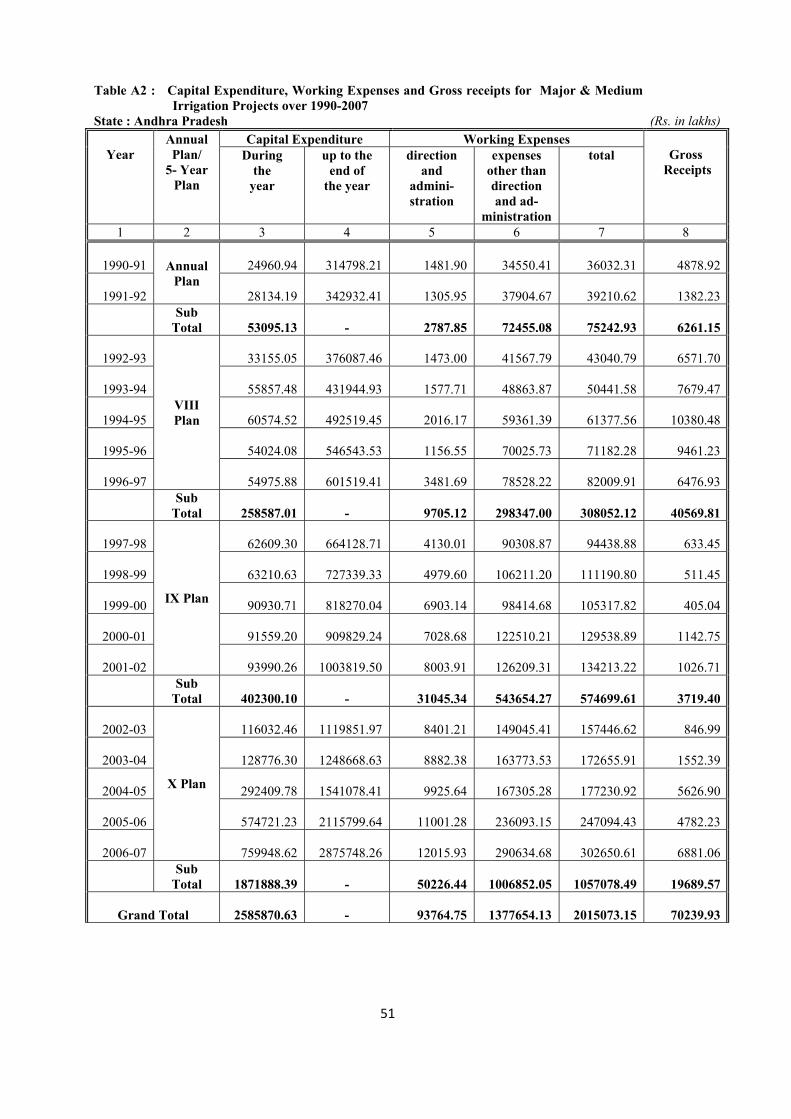
51
Table A2 : Capital Expenditure, Working Expenses and Gross receipts for Major & Medium
Irrigation Projects over 1990-2007 State : Andhra Pradesh (Rs. in lakhs)
Year
Annual Plan/
5- Year Plan
Capital Expenditure Working Expenses Gross
Receipts
During the
year
up to the end of
the year
direction and
admini-stration
expenses other than direction and ad-
ministration
total
1 2 3 4 5 6 7 8
1990-91 Annual Plan
24960.94 314798.21 1481.90 34550.41 36032.31 4878.92
1991-92 28134.19 342932.41 1305.95 37904.67 39210.62 1382.23
Sub
Total 53095.13 - 2787.85 72455.08 75242.93 6261.15
1992-93
VIII Plan
33155.05 376087.46 1473.00 41567.79 43040.79 6571.70
1993-94 55857.48 431944.93 1577.71 48863.87 50441.58 7679.47
1994-95 60574.52 492519.45 2016.17 59361.39 61377.56 10380.48
1995-96 54024.08 546543.53 1156.55 70025.73 71182.28 9461.23
1996-97 54975.88 601519.41 3481.69 78528.22 82009.91 6476.93
Sub
Total 258587.01 - 9705.12 298347.00 308052.12 40569.81
1997-98
IX Plan
62609.30 664128.71 4130.01 90308.87 94438.88 633.45
1998-99 63210.63 727339.33 4979.60 106211.20 111190.80 511.45
1999-00 90930.71 818270.04 6903.14 98414.68 105317.82 405.04
2000-01 91559.20 909829.24 7028.68 122510.21 129538.89 1142.75
2001-02 93990.26 1003819.50 8003.91 126209.31 134213.22 1026.71
Sub
Total 402300.10 - 31045.34 543654.27 574699.61 3719.40
2002-03
X Plan
116032.46 1119851.97 8401.21 149045.41 157446.62 846.99
2003-04 128776.30 1248668.63 8882.38 163773.53 172655.91 1552.39
2004-05 292409.78 1541078.41 9925.64 167305.28 177230.92 5626.90
2005-06 574721.23 2115799.64 11001.28 236093.15 247094.43 4782.23
2006-07 759948.62 2875748.26 12015.93 290634.68 302650.61 6881.06
Sub
Total 1871888.39 - 50226.44 1006852.05 1057078.49 19689.57
Grand Total 2585870.63 - 93764.75 1377654.13 2015073.15 70239.93

52
Table A3 : Capital Expenditure, Working Expenses and Gross receipts for Major & Medium
Irrigation Projects over 1990-2007
State : Arunachal Pradesh
(Rs. in lakhs)
Year
Annual Plan/
5- Year Plan
Capital Expenditure Working Expenses Gross
Receipts
During the
year
up to the end of
the year
direction and
admini-stration
expenses other than direction and ad-
ministration
total
1 2 3 4 5 6 7 8
1990-91 Annual Plan
0.00 182.49 0.00 2.50 2.50 0.00
1991-92 0.00 182.49 0.00 44.50 44.50 0.00
Sub
Total 0.00 - 0.00 47.00 47.00 0.00
1992-93
VIII Plan
0.00 182.49 0.00 70.06 70.06 0.00
1993-94 0.00 182.49 0.00 49.26 49.26 0.00
1994-95 0.00 182.49 0.00 49.77 49.77 0.00
1995-96 0.00 182.49 0.00 50.00 50.00 0.00
1996-97 0.00 182.49 0.00 48.25 48.25 0.00
Sub
Total 0.00 - 0.00 267.34 267.34 0.00
1997-98
IX Plan
0.00 182.49 0.00 93.90 93.90 0.00
1998-99 0.00 182.49 0.00 36.87 36.87 0.00
1999-00 0.00 182.49 0.00 33.00 33.00 0.00
2000-01 0.00 182.49 0.00 33.97 33.97 0.00
2001-02 0.00 182.49 0.00 36.00 36.00 0.00
Sub
Total 0.00 - 0.00 233.74 233.74 0.00
2002-03
X Plan
0.00 182.49 0.00 40.00 40.00 0.00
2003-04 0.00 182.49 0.00 39.87 39.87 0.00
2004-05 0.00 182.49 0.00 40.00 40.00 0.00
2005-06 0.00 182.49 0.00 39.95 39.95 0.00
2006-07 0.00 182.49 0.00 56.10 56.10 0.00
Sub
Total 0.00 - 0.00 215.92 215.92 0.00
Grand Total 0.00 - 0.00 764.00 764.00 0.00

53
Table A4 : Capital Expenditure, Working Expenses and Gross receipts for Major & Medium Irrigation Projects over 1990-2007
State : Assam
(Rs. in lakhs)
Year
Annual Plan/
5- Year Plan
Capital Expenditure Working Expenses Gross
Receipts
During the
year
up to the end of
the year
direction and
admini-stration
expenses other than direction and ad-
ministration
total
1 2 3 4 5 6 7 8
1990-91 Annual Plan
2373.87 23889.35 37.83 183.24 221.07 26.31
1991-92 3302.47 27191.82 52.21 124.88 177.09 43.04
Sub
Total 5676.34 - 90.04 308.12 398.16 69.35
1992-93
VIII Plan
2365.33 29557.15 36.80 152.40 189.20 19.76
1993-94 2531.15 32088.30 126.51 57.50 184.01 16.70
1994-95 2847.30 34935.60 297.20 0.00 297.20 5.25
1995-96 2382.96 37318.55 295.67 7.90 303.57 2.64
1996-97 2459.76 39778.31 347.75 0.33 348.08 7.21
Sub
Total 12586.50 - 1103.93 218.13 1322.06 51.56
1997-98
IX Plan
3150.96 42929.27 447.48 -7.20 440.28 35.84
1998-99 3865.66 46794.93 787.94 -5.35 782.59 6.34
1999-00 5024.00 51818.93 985.85 -15.16 970.69 16.00
2000-01 4425.62 56244.55 2482.26 -7.25 2475.01 14.92
2001-02 4057.91 60302.51 2216.25 31.99 2248.24 17.75
Sub
Total 20524.15 - 6919.78 -2.97 6916.81 90.85
2002-03
X Plan
3234.50 63537.01 1345.86 43.86 1389.72 27.50
2003-04 2081.43 65618.43 2377.43 42.28 2419.71 25.94
2004-05 2845.66 68464.09 3273.74 75.29 3349.03 25.83
2005-06 1492.64 69956.73 3626.51 26.61 3653.12 20.63
2006-07 2096.28 72053.01 3799.53 56.31 3855.84 37.89
Sub
Total 11750.51 - 14423.07 244.35 14667.42 137.79
G. Total 50537.50 - 22536.82 767.63 23304.45 349.55

54
Table A5 : Capital Expenditure, Working Expenses and Gross receipts for Major & Medium Irrigation Projects over 1990-2007
Bihar
(Rs. in lakhs)
Year
Annual Plan/
5- Year Plan
Capital Expenditure Working Expenses Gross
Receipts
During the
year
up to the end of
the year
direction and
admini-stration
expenses other than direction and ad-
ministration
total
1 2 3 4 5 6 7 8
1990-91 Annual Plan
25667.45 327675.00 145.39 6087.18 6232.57 648.52
1991-92 16951.87 344626.87 172.67 5687.64 5860.31 1637.38
Sub
Total 42619.32 - 318.06 11774.82 12092.88 2285.90
1992-93
VIII Plan
16286.36 360913.23 0.00 6838.80 6838.80 1914.13
1993-94 15450.36 376363.59 266.07 6625.80 6891.87 1802.38
1994-95 15195.97 391559.56 205.77 7200.67 7406.44 1613.37
1995-96 18587.97 410147.33 712.78 7635.95 8348.73 3080.17
1996-97 20771.61 430918.95 315.37 10360.19 10675.56 3764.03
Sub
Total 86292.27 - 1499.99 38661.41 40161.40 12174.08
1997-98
IX Plan
24521.75 455440.70 42.07 12348.43 12390.50 3532.01
1998-99 32387.79 487828.49 2027.51 14707.74 16735.25 4205.65
1999-00 51281.66 539110.15 2062.18 18244.53 20306.71 4140.22
2000-01 33756.75 572866.92 136.78 17835.09 17971.87 3389.85
2001-02 20145.13 593012.04 14464.86 43.35 14508.21 1557.90
Sub
Total 162093.08 - 18733.40 63179.14 81912.54 16825.63
2002-03
X Plan
22005.59 615017.63 15368.55 0.00 15368.55 1543.38
2003-04 26269.14 641286.78 1606.66 13437.94 15044.60 2622.30
2004-05 26434.82 667721.60 975.12 14060.30 15035.42 2082.31
2005-06 42292.89 710014.49 11908.20 4306.35 16214.55 1244.42
2006-07 45093.69 755108.18 14290.67 4400.42 18691.09 1290.31
Sub
Total 162096.13 - 44149.20 36205.01 80354.21 8782.72
G. Total 453100.80 - 64700.65 149820.38 214521.03 40068.33

55
Table A6 : Capital Expenditure, Working Expenses and Gross receipts for Major & Medium Irrigation Projects over 1990-2007
State : Chhattisgarh
(Rs. in lakhs)
Year
Annual Plan/
5- Year Plan
Capital Expenditure Working Expenses Gross
Receipts
During the
year
up to the end of
the year
direction and
admini-stration
expenses other than direction and ad-
ministration
total
1 2 3 4 5 6 7 8
1990-91 Annual Plan
0.00 0.00 0.00 0.00 0.00 0.00
1991-92 0.00 0.00 0.00 0.00 0.00 0.00
Sub
Total 0.00 - 0.00 0.00 0.00 0.00
1992-93
VIII Plan
0.00 0.00 0.00 0.00 0.00 0.00
1993-94 0.00 0.00 0.00 0.00 0.00 0.00
1994-95 0.00 0.00 0.00 0.00 0.00 0.00
1995-96 0.00 0.00 0.00 0.00 0.00 0.00
1996-97 0.00 0.00 0.00 0.00 0.00 0.00
Sub
Total 0.00 - 0.00 0.00 0.00 0.00
1997-98
IX Plan
0.00 0.00 0.00 0.00 0.00 0.00
1998-99 0.00 0.00 0.00 0.00 0.00 0.00
1999-00 0.00 0.00 0.00 0.00 0.00 0.00
2000-01 3455.10 137635.10 2083.54 649.67 2733.21 1037.92
2001-02 12039.86 149674.96 5480.09 1862.61 7342.70 3819.65
Sub
Total 15494.96 - 7563.63 2512.28 10075.91 4857.57
2002-03
X Plan
23526.23 173201.19 5531.80 2522.29 8054.09 5372.46
2003-04 26194.87 199396.06 6193.81 2508.19 8702.00 4484.99
2004-05 42196.02 241592.08 6650.43 2294.99 8945.42 6725.65
2005-06 33715.17 275307.25 6456.26 2956.38 9412.64 3897.84
2006-07 36115.24 311422.49 6959.41 2921.91 9881.32 10496.15
Sub
Total 161747.53 - 31791.71 13203.76 44995.47 30977.09G. Total 177242.49 - 39355.34 15716.04 55071.38 35834.66

56
Table A7 : Capital Expenditure, Working Expenses and Gross receipts for Major & Medium Irrigation Projects over 1990-2007
State : Delhi
(Rs. in lakhs)
Year
Annual Plan/
5- Year Plan
Capital Expenditure Working Expenses Gross
Receipts
During the
year
up to the end of
the year
direction and
admini-stration
expenses other than direction and ad-
ministration
total
1 2 3 4 5 6 7 8
1990-91 Annual Plan
0.00 0.00 0.00 0.00 0.00 0.00
1991-92 0.00 0.00 0.00 0.00 0.00 0.00
Sub
Total 0.00 - 0.00 0.00 0.00 0.00
1992-93
VIII Plan
0.00 0.00 0.00 0.00 0.00 0.00
1993-94 0.00 0.00 0.00 0.00 0.00 21.14
1994-95 0.00 65.43 0.00 0.00 0.00 21.14
1995-96 0.00 65.43 0.00 0.00 0.00 61.16
1996-97 0.00 65.43 0.00 0.00 0.00 61.16
Sub
Total 0.00 - 0.00 0.00 0.00 164.60
1997-98
IX Plan
0.00 65.43 0.00 0.00 0.00 61.89
1998-99 0.00 65.43 0.00 0.00 0.00 61.89
1999-00 0.00 65.43 0.00 0.00 0.00 523.19
2000-01 0.00 65.43 0.00 0.00 0.00 266.70
2001-02 0.00 65.43 0.00 0.00 0.00 257.45
Sub
Total 0.00 - 0.00 0.00 0.00 1171.12
2002-03
X Plan
0.00 65.43 0.00 0.00 0.00 191.23
2003-04 0.00 65.43 0.00 0.00 0.00 251.25
2004-05 0.00 65.43 0.00 0.00 0.00 186.00
2005-06 0.00 65.43 0.00 0.00 0.00 322.21
2006-07 0.00 65.43 0.00 0.00 0.00 535.06
Sub
Total 0.00 - 0.00 0.00 0.00 1485.75G. Total 0.00 - 0.00 0.00 0.00 2821.47

57
Table A8 : Capital Expenditure, Working Expenses and Gross receipts for Major & Medium Irrigation Projects over 1990-2007
State : Gujarat
(Rs. in lakhs)
Year
Annual Plan/
5- Year Plan
Capital Expenditure Working Expenses Gross
Receipts
During the
year
up to the end of
the year
direction and
admini-stration
expenses other than direction and ad-
ministration
total
1 2 3 4 5 6 7 8
1990-91 Annual Plan
40260.57 263527.45 2006.61 29888.16 31894.77 2001.36
1991-92 54299.39 317826.84 2396.30 33151.86 35548.16 2277.39
Sub
Total 94559.96 - 4402.91 63040.02 67442.93 4278.75
1992-93
VIII Plan
44358.48 362185.32 2570.49 34912.40 37482.89 2279.30
1993-94 24812.93 386998.26 2884.33 48700.21 51584.54 3098.68
1994-95 51066.11 438064.37 3419.49 54308.55 57728.04 4259.04
1995-96 66595.73 504660.60 4213.07 68960.85 73173.92 3722.44
1996-97 93321.04 597981.14 4458.55 79008.36 83466.91 3753.58
Sub
Total 280154.29 - 17545.93 285890.37 303436.30 17113.04
1997-98
IX Plan
117424.17 715405.31 4980.22 93170.63 98150.85 9129.21
1998-99 124919.97 840325.29 6964.03 124132.34 131096.37 13209.33
1999-00 129801.51 970126.80 7288.17 145331.29 152619.46 11068.40
2000-01 97016.00 1067142.80 7438.75 165461.35 172900.10 13658.17
2001-02 43747.61 1110890.41 7336.94 162076.77 169413.71 13208.60
Sub
Total 512909.26 - 34008.11 690172.38 724180.49 60273.71
2002-03
X Plan
75844.17 1186734.58 10765.34 169985.51 180750.85 26723.34
2003-04 121150.13 1307884.71 10820.07 10624.12 21444.19 20277.55
2004-05 106653.41 1414538.12 11573.25 13999.15 25572.40 20708.75
2005-06 141559.64 1556097.76 12315.40 11840.26 24155.66 24862.39
2006-07 355657.02 1911754.78 12585.70 19970.41 32556.11 33061.83
Sub
Total 800864.37 - 58059.76 226419.45 284479.21 125633.86G. Total 1688487.88 - 114016.71 1265522.22 1379538.93 207299.36

58
Table A9 : Capital Expenditure, Working Expenses and Gross receipts for Major & Medium Irrigation Projects over 1990-2007
State : Haryana
(Rs. in lakhs)
Year
Annual Plan/
5- Year Plan
Capital Expenditure Working Expenses Gross
Receipts
During the
year
up to the end of
the year
direction and
admini-stration
expenses other than direction and ad-
ministration
total
1 2 3 4 5 6 7 8
1990-91 Annual Plan
4940.39 91290.98 1120.64 10043.71 11164.35 1730.50
1991-92 6564.58 97855.56 2446.54 11748.57 14195.11 1580.82
Sub
Total 11504.97 - 3567.18 21792.28 25359.46 3311.32
1992-93
VIII Plan
7129.43 104985.00 2920.58 13801.14 16721.72 1796.19
1993-94 7983.91 112968.91 3326.80 14375.47 17702.27 2038.22
1994-95 5399.45 118368.36 5933.54 38107.73 44041.27 1919.19
1995-96 8676.43 127044.80 6345.88 16386.98 22732.86 2100.25
1996-97 17092.12 144136.92 5659.54 16978.95 22638.49 2429.96
Sub
Total 46281.34 - 24186.34 99650.27 123836.61 10283.81
1997-98
IX Plan
24220.29 168357.21 4866.02 20466.45 25332.47 2738.04
1998-99 26750.43 195107.64 7881.79 18199.23 26081.02 6103.55
1999-00 27128.27 222235.91 7064.41 20726.65 27791.06 3829.58
2000-01 25645.76 247881.67 6567.66 21397.12 27964.78 5430.12
2001-02 28068.18 275949.85 8802.54 25674.25 34476.79 6850.64
Sub
Total 131812.93 - 35182.42 106463.70 141646.12 24951.93
2002-03
X Plan
19658.96 295608.80 7541.92 29647.16 37189.08 5204.54
2003-04 19160.03 314768.84 7115.89 30958.39 38074.28 18299.62
2004-05 22271.59 337040.42 8056.91 30732.67 38789.58 10332.40
2005-06 40796.83 377837.25 7096.26 33034.48 40130.74 6412.91
2006-07 49792.18 427629.43 6435.83 42861.11 49296.94 8719.19
Sub
Total 151679.59 - 36246.81 167233.81 203480.62 48968.66G. Total 341278.83 - 99182.75 395140.06 494322.81 87515.72

59
Table A10: Capital Expenditure, Working Expenses and Gross receipts for Major & Medium Irrigation Projects over 1990-2007
State : Himachal Pradesh
(Rs. in lakhs)
Year
Annual Plan/
5- Year Plan
Capital Expenditure Working Expenses Gross
Receipts
During the
year
up to the end of
the year
direction and
admini-stration
expenses other than direction and ad-
ministration
total
1 2 3 4 5 6 7 8
1990-91 Annual Plan
213.96 2341.70 0.00 103.59 103.59 1.65
1991-92 210.95 2552.65 0.00 104.40 104.40 0.12
Sub
Total 424.91 - 0.00 207.99 207.99 1.77
1992-93
VIII Plan
165.99 51.74 64.54 116.28 0.14
1993-94 181.02 2899.67 53.55 62.21 115.76 0.17
1994-95 205.23 3104.91 62.70 55.90 118.60 0.40
1995-96 223.31 3328.22 67.70 133.56 201.26 0.07
1996-97 356.09 3684.30 75.70 145.09 220.79 0.44
Sub
Total 1131.64 - 311.39 461.30 772.69 1.22
1997-98
IX Plan
843.40 4527.70 99.03 245.91 344.94 1.09
1998-99 921.47 5449.18 182.24 265.76 448.00 2.50
1999-00 1347.07 6796.25 185.93 223.29 409.22 3.12
2000-01 1148.26 7944.51 176.96 255.18 432.14 1.99
2001-02 1115.14 9059.65 0.43 283.14 283.57 1105.94
Sub
Total 5375.34 - 644.59 1273.28 1917.87 1114.64
2002-03
X Plan
-371.84 8687.81 0.00 347.24 347.24 5.99
2003-04 1608.53 10296.33 0.00 311.65 311.65 6.10
2004-05 1468.36 11764.69 0.00 548.02 548.02 9.17
2005-06 2086.80 13871.31 0.00 515.84 515.84 43.74
2006-07 3920.63 17772.14 218.27 332.02 550.29 21.42
Sub
Total 8712.48 - 218.27 2054.77 2273.04 86.42G. Total 15644.37 - 1174.25 3997.34 5171.59 1204.05

60
Table A11: Capital Expenditure, Working Expenses and Gross receipts for Major & Medium Irrigation Projects over 1990-2007
State : Jammu & Kashmir
(Rs. in lakhs)
Year
Annual Plan/
5- Year Plan
Capital Expenditure Working Expenses Gross
Receipts
During the
year
up to the end of
the year
direction and
admini-stration
expenses other than direction and ad-
ministration
total
1 2 3 4 5 6 7 8
1990-91 Annual Plan
871.37 18228.97 0.00 667.67 667.67 19.401991-92 1205.64 19434.61 0.00 717.13 717.13 20.49
Sub
Total 2077.01 - 0.00 1384.80 1384.80 39.89
1992-93
VIII Plan
1255.55 20690.17 0.00 739.38 739.38 34.221993-94 1151.68 21841.85 0.00 782.01 782.01 21.851994-95 1287.08 23128.93 0.00 706.69 706.69 33.141995-96 1414.00 24542.93 0.00 715.90 715.90 100.391996-97 1255.08 25798.01 0.00 877.30 877.30 53.32
Sub
Total 6363.39 - 0.00 3821.28 3821.28 242.921997-98
IX Plan
1513.72 27311.74 205.68 1321.04 1526.72 35.151998-99 1897.88 29209.62 289.74 1698.55 1988.29 30.941999-00 869.43 30079.05 0.00 1618.06 1618.06 27.732000-01 1791.29 31870.34 1656.48 513.27 2169.75 44.202001-02 2349.10 34219.44 1209.73 -1.68 1208.05 58.30
Sub
Total 8421.42 - 3361.63 5149.24 8510.87 196.322002-03
X Plan
2477.37 36696.81 1253.10 853.33 2106.43 73.00
2003-04 6151.48 42848.29 1486.52 733.24 2219.76 103.432004-05 4487.65 47335.94 3918.97 1914.65 5833.62 97.092005-06 5467.58 52803.52 2021.51 831.60 2853.11 88.012006-07 3843.47 56646.99 1980.44 1506.99 3487.43 100.60
Sub
Total 22427.55 - 10660.54 5839.81 16500.35 462.13G. Total 39289.37 - 14022.17 16195.13 30217.30 941.26

61
Table A12: Capital Expenditure, Working Expenses and Gross receipts for Major & Medium Irrigation Projects over 1990-2007
State : Jharkhand
(Rs. in lakhs)
Year
Annual Plan/
5- Year Plan
Capital Expenditure Working Expenses Gross
Receipts
During the
year
up to the end of
the year
direction and
admini-stration
expenses other than direction and ad-
ministration
total
1 2 3 4 5 6 7 8
1990-91 Annual Plan
0.00 0.00 0.00 0.00 0.00 0.00
1991-92 0.00 0.00 0.00 0.00 0.00 0.00
Sub
Total 0.00 - 0.00 0.00 0.00 0.00
1992-93
VIII Plan
0.00 0.00 0.00 0.00 0.00 0.00
1993-94 0.00 0.00 0.00 0.00 0.00 0.00
1994-95 0.00 0.00 0.00 0.00 0.00 0.00
1995-96 0.00 0.00 0.00 0.00 0.00 0.00
1996-97 0.00 0.00 0.00 0.00 0.00 0.00
Sub
Total 0.00 - 0.00 0.00 0.00 0.00
1997-98
IX Plan
0.00 0.00 0.00 0.00 0.00 0.00
1998-99 0.00 0.00 0.00 0.00 0.00 0.00
1999-00 0.00 0.00 0.00 0.00 0.00 0.00
2000-01 5615.25 5615.25 327.59 0.32 327.91 566.09
2001-02 15545.32 21160.57 326.42 1345.70 1672.12 2673.55
Sub
Total 21160.57 - 654.01 1346.02 2000.03 3239.64
2002-03
X Plan
20291.96 41452.54 1620.47 10.12 1630.59 1652.94
2003-04 28091.26 69543.79 1555.78 0.00 1555.78 2330.50
2004-05 22859.35 92403.14 1284.50 0.00 1284.50 1552.79
2005-06 29627.44 122030.58 8691.13 0.00 8691.13 1108.79
2006-07 17153.59 139184.17 12650.02 0.00 12650.02 5108.60
Sub
Total 118023.60 - 25801.90 10.12 25812.02 11753.62
G. Total 139184.17 - 26455.91 1356.14 27812.05 14993.26

62
Table A13: Capital Expenditure, Working Expenses and Gross receipts for Major & Medium Irrigation Projects over 1990-2007
State : Karnataka
(Rs. in lakhs)
Year
Annual Plan/
5- Year Plan
Capital Expenditure Working Expenses Gross
Receipts
During the
year
up to the end of
the year
direction and
admini-stration
expenses other than direction and ad-
ministration
total
1 2 3 4 5 6 7 8
1990-91 Annual Plan
24251.78 233173.87 644.27 16231.41 16875.68 1689.14
1991-92 35286.39 268460.26 553.85 18988.86 19542.71 3014.79
Sub
Total 59538.17 - 1198.12 35220.27 36418.39 4703.93
1992-93
VIII Plan
47815.22 316275.48 720.59 21581.10 22301.69 1645.32
1993-94 65247.14 381522.62 683.41 25036.72 25720.13 1355.17
1994-95 68233.77 449756.39 671.18 29182.49 29853.67 1319.34
1995-96 73740.28 523496.66 748.39 33639.90 34388.29 1692.87
1996-97 84688.41 608185.07 3409.92 38558.68 41968.60 1710.24
Sub
Total 339724.82 - 6233.49 147998.89 154232.38 7722.94
1997-98
IX Plan
79133.59 687318.66 3716.63 43930.91 47647.54 1636.50
1998-99 91034.40 778353.06 1232.41 47662.19 48894.60 1845.37
1999-00 99741.30 878094.36 3500.64 55864.94 59365.58 1576.29
2000-01 109962.18 988056.54 2507.31 62553.35 65060.66 1845.92
2001-02 142664.30 1130720.84 1257.88 5601.63 6859.51 2056.41
Sub
Total 522535.77 - 12214.87 215613.02 227827.89 8960.49
2002-03
X Plan
191725.34 1322446.17 1238.96 5662.34 6901.30 2093.23
2003-04 176446.22 1498892.39 1575.06 4744.23 6319.29 1180.97
2004-05 280492.65 1779385.04 1245.21 4814.95 6060.16 1335.35
2005-06 314320.54 2093705.58 1158.05 5674.43 6832.48 2229.74
2006-07 373414.04 2467119.62 1087.74 6890.99 7978.73 2148.37
Sub
Total 1336398.79 - 6305.02 27786.94 34091.96 8987.66
G. Total 2258197.55 - 25951.50 426619.12 452570.62 30375.02

63
Table A14: Capital Expenditure, Working Expenses and Gross receipts for Major & Medium Irrigation Projects over 1990-2007
State : Kerala
(Rs. in lakhs)
Year
Annual Plan/
5- Year Plan
Capital Expenditure Working Expenses Gross
Receipts
During the
year
up to the end of
the year
direction and
admini-stration
expenses other than direction and ad-
ministration
total
1 2 3 4 5 6 7 8
1990-91 Annual Plan
5962.80 81973.70 471.86 1892.77 2364.63 207.36
1991-92 6763.67 88737.38 448.41 1742.00 2190.41 166.03
Sub
Total 12726.47 - 920.27 3634.77 4555.04 373.39
1992-93
VIII Plan
7765.64 96503.02 445.77 1846.27 2292.04 143.93
1993-94 10207.52 106710.54 564.14 2264.80 2828.94 235.56
1994-95 11084.68 117771.89 678.37 2627.00 3305.37 179.36
1995-96 14029.10 131800.99 592.49 2877.63 3470.12 266.30
1996-97 14067.03 145868.01 482.81 3018.81 3501.62 219.71
Sub
Total 57153.97 - 2763.58 12634.51 15398.09 1044.86
1997-98
IX Plan
14849.22 160717.24 893.23 2985.18 3878.41 554.42
1998-99 14263.00 174980.24 883.64 3346.36 4230.00 671.23
1999-00 13942.73 188946.26 1541.10 3082.19 4623.29 339.94
2000-01 12976.14 201922.40 1998.11 3393.44 5391.55 382.37
2001-02 11480.31 213402.73 1770.32 2404.47 4174.79 299.33
Sub
Total 67511.40 - 7086.40 15211.64 22298.04 2247.29
2002-03
X Plan
9890.36 223293.09 2032.53 4769.23 6801.76 365.09
2003-04 11735.79 235028.88 3372.91 4754.36 8127.27 610.11
2004-05 13817.16 248846.04 4751.88 5218.29 9970.17 478.10
2005-06 18841.18 267687.22 4893.65 7142.35 12036.00 487.23
2006-07 11928.31 279615.53 6710.97 4085.31 10796.28 487.48
Sub
Total 66212.80 - 21761.94 25969.54 47731.48 2428.01
G. Total 203604.64 - 43302.44 88931.38 132233.82 9759.09

64
Table A15: Capital Expenditure, Working Expenses and Gross receipts for Major & Medium Irrigation Projects over 1990-2007
State : Madhya Pradesh
(Rs. in lakhs)
Year
Annual Plan/
5- Year Plan
Capital Expenditure Working Expenses Gross
Receipts
During the
year
up to the end of
the year
direction and
admini-stration
expenses other than direction and ad-
ministration
total
1 2 3 4 5 6 7 8
1990-91 Annual Plan
23193.17 281843.80 5190.11 2841.31 8031.42 1583.77
1991-92 28727.29 310571.10 5465.28 3915.93 9381.21 2033.77
Sub
Total 51920.46 - 10655.39 6757.24 17412.63 3617.54
1992-93
VIII Plan
29982.44 340553.54 5980.63 4463.60 10444.23 2547.43
1993-94 30203.52 370757.06 7505.29 4260.82 11766.11 2324.12
1994-95 34801.46 405558.52 8778.22 4939.12 13717.34 4019.43
1995-96 28904.37 434462.89 10114.84 6999.98 17114.82 3648.56
1996-97 31852.87 466315.76 11601.65 6359.27 17960.92 4470.51
Sub
Total 155744.66 - 43980.63 27022.79 71003.42 17010.05
1997-98
IX Plan
32933.99 499249.75 12965.20 7339.89 20305.09 2975.19
1998-99 32433.06 531682.81 18509.04 7668.85 26177.89 3734.95
1999-00 26695.39 558378.21 18169.21 9449.36 27618.57 4967.012000-01
* 16397.07 328532.79 18629.41 8491.67 27121.08 3954.87
2001-02 54675.19 383207.98 14389.61 7257.49 21647.10 2712.96
Sub
Total 163134.70 - 82662.47 40207.26 122869.73 18344.98
2002-03
X Plan
77100.98 460308.96 14388.38 6715.28 21103.66 2463.63
2003-04 89847.84 550156.80 14962.53 7432.35 22394.88 3779.85
2004-05 150013.94 700170.74 16470.97 8566.41 25037.38 3792.18
2005-06 100487.45 800658.19 15923.13 11060.74 26983.87 2956.56
2006-07 106047.32 906705.51 16690.02 11369.06 28059.08 2981.52
Sub
Total 523497.53 - 78435.03 45143.84 123578.87 15973.74
G. Total 1788594.70 - 353032.01 193118.42 546150.43 93918.88Rs.21189.27 lakhs and Rs.133251.75 lakhs stood as un-apportioned Capital Outlay between MP and Chhattisgarh during the year and at the end of the year Respectively. Also, an amount of Rs.134180.01 lakhs has been transferred to Chhattisgarh.

65
Table A16: Capital Expenditure, Working Expenses and Gross receipts for Major & Medium Irrigation Projects over 1990-2007
State : Maharashtra
(Rs. in lakhs)
Year
Annual Plan/
5- Year Plan
Capital Expenditure Working Expenses Gross
Receipts
During the
year
up to the end of
the year
direction and
admini-stration
expenses other than direction and ad-
ministration
total
1 2 3 4 5 6 7 8
1990-91 Annual Plan
49976.55 450494.37 6175.97 44762.59 50938.56 1817.11
1991-92 45066.49 495560.86 5688.45 52614.72 58303.17 2142.09
Sub
Total 95043.04 - 11864.42 97377.31 109241.73 3959.20
1992-93
VIII Plan
55997.38 551558.23 7772.28 58993.26 66765.54 4576.93
1993-94 68446.99 620005.23 8173.52 67593.59 75767.11 7828.86
1994-95 101578.86 721584.09 7553.84 80775.44 88329.28 7098.54
1995-96 125789.46 847639.19 12790.81 93402.10 106192.91 7701.74
1996-97 95402.35 943041.54 10588.57 113620.10 124208.67 5799.66
Sub
Total 447215.04 - 46879.02 414384.49 461263.51 33005.73
1997-98
IX Plan
147517.79 1091109.46 11725.24 128950.30 140675.54 5207.13
1998-99 95022.65 1186132.11 7990.91 141150.01 149140.92 1985.22
1999-00 125968.00 1312100.11 5954.42 153134.18 159088.60 6162.91
2000-01 87360.29 1399460.40 5659.36 154454.15 160113.51 6249.05
2001-02 112111.83 1511586.53 6178.11 157378.76 163556.87 8603.45
Sub
Total 567980.56 - 37508.04 735067.40 772575.44 28207.76
2002-03
X Plan
244966.02 1756538.22 5892.26 159549.83 165442.09 11305.11
2003-04 592367.63 2348905.85 6180.71 8885.27 15065.98 23069.17
2004-05 575469.92 2924375.77 9425.06 48654.49 58079.55 33568.44
2005-06 589247.49 3513622.86 28233.83 69683.64 97917.47 37238.51
2006-07 503482.26 3219915.25 26487.09 78889.04 105376.13 44492.57
Sub
Total 2505533.32 - 76218.95 365662.27 441881.22 149673.80
G. Total 3615771.96 - 172470.43 1612491.47 1784961.90 214846.49

66
Table A17: Capital Expenditure, Working Expenses and Gross receipts for Major & Medium Irrigation Projects over 1990-2007
State : Manipur
(Rs. in lakhs)
Year
Annual Plan/
5- Year Plan
Capital Expenditure Working Expenses Gross
Receipts
During the
year
up to the end of
the year
direction and
admini-stration
expenses other than direction and ad-
ministration
total
1 2 3 4 5 6 7 8
1990-91 Annual Plan
2763.85 16163.51 0.00 503.15 503.15 36.12
1991-92 3231.18 19394.69 84.64 359.37 444.01 64.62
Sub
Total 5995.03 - 84.64 862.52 947.16 100.74
1992-93
VIII Plan
2110.15 21504.84 114.09 283.27 397.36 17.60
1993-94 2574.04 24078.89 56.87 145.32 202.19 45.59
1994-95 2783.00 26861.89 133.13 276.50 409.63 88.92
1995-96 3113.82 29975.71 156.14 276.87 433.01 31.28
1996-97 3558.03 33533.75 151.37 307.44 458.81 0.00
Sub
Total 14139.04 - 611.60 1289.40 1901.00 183.39
1997-98
IX Plan
3292.45 36826.20 167.53 582.28 749.81 42.49
1998-99 2796.97 39623.17 173.96 800.18 974.14 18.48
1999-00 3762.29 43385.45 711.70 834.41 1546.11 37.87
2000-01 2081.85 45467.30 426.87 262.66 689.53 30.74
2001-02 4125.61 49592.91 381.11 152.08 533.19 30.62
Sub
Total 16059.17 - 1861.17 2631.61 4492.78 160.20
2002-03
X Plan
1973.11 51566.02 755.07 766.84 1521.91 24.22
2003-04 2069.91 53635.95 445.74 1499.75 1945.49 34.41
2004-05 2770.17 56406.11 464.13 1362.68 1826.81 113.38
2005-06 11459.25 67865.36 591.05 1497.74 2088.79 197.00
2006-07 22007.20 89872.56 452.92 1478.31 1931.23 784.88
Sub
Total 40279.64 - 2708.91 6605.32 9314.23 1153.89
G. Total 152945.76 - 7823.73 16172.38 23996.11 2042.55

67
Table A18: Capital Expenditure, Working Expenses and Gross receipts for Major & Medium Irrigation Projects over 1990-2007
State : Meghalaya
(Rs. in lakhs)
Year
Annual Plan/
5- Year Plan
Capital Expenditure Working Expenses Gross
Receipts
During the
year
up to the end of
the year
direction and
admini-stration
expenses other than direction and ad-
ministration
total
1 2 3 4 5 6 7 8
1990-91 Annual Plan
55.78 82.60 0.00 0.00 0.00 0.00
1991-92 45.62 128.22 6.08 0.00 6.08 0.00
Sub
Total 101.40 - 6.08 0.00 6.08 0.00
1992-93
VIII Plan
129.30 257.52 10.18 0.00 10.18 0.16
1993-94 98.03 355.56 9.79 0.00 9.79 0.08
1994-95 46.00 401.56 12.82 0.00 12.82 0.10
1995-96 172.56 574.12 14.28 0.00 14.28 0.20
1996-97 149.24 723.36 11.96 0.00 11.96 0.13
Sub
Total 595.13 - 59.03 0.00 59.03 0.67
1997-98
IX Plan
127.83 851.20 12.61 0.00 12.61 1.22
1998-99 222.51 1073.70 15.89 0.00 15.89 0.22
1999-00 154.00 1227.48 18.45 0.00 18.45 0.11
2000-01 230.92 1458.40 18.19 0.00 18.19 0.10
2001-02 190.22 1648.61 21.76 0.00 21.76 0.11
Sub
Total 925.48 - 86.90 0.00 86.90 1.76
2002-03
X Plan
105.41 1754.03 15.75 0.00 15.75 0.12
2003-04 129.57 1883.60 6.81 0.00 6.81 0.82
2004-05 -28.29 1855.31 1.97 0.00 1.97 2.78
2005-06 17.56 1872.88 1.54 0.00 1.54 0.00
2006-07 0.00 1872.88 0.00 0.00 0.00 0.02
Sub
Total 224.25 - 26.07 0.00 26.07 3.74
G. Total 1846.26 - 178.08 0.00 178.08 6.17

68
Table A19: Capital Expenditure, Working Expenses and Gross receipts for Major & Medium Irrigation Projects over 1990-2007
State : Mizoram
(Rs. in lakhs)
Year
Annual Plan/
5- Year Plan
Capital Expenditure Working Expenses Gross
Receipts
During the
year
up to the end of
the year
direction and
admini-stration
expenses other than direction and ad-
ministration
total
1 2 3 4 5 6 7 8
1990-91 Annual Plan
24.53 37.72 0.00 0.00 0.00 0.00
1991-92 23.99 61.71 0.00 0.00 0.00 0.00
Sub
Total 48.52 - 0.00 0.00 0.00 0.00
1992-93
VIII Plan
18.04 79.75 0.00 0.00 0.00 0.00
1993-94 16.30 96.05 0.00 0.00 0.00 0.00
1994-95 0.00 96.05 0.00 4.25 4.25 0.00
1995-96 0.00 96.05 0.00 2.00 2.00 0.00
1996-97 0.00 96.05 0.00 0.00 0.00 0.00
Sub
Total 34.34 - 0.00 6.25 6.25 0.00
1997-98
IX Plan
0.00 96.05 0.00 3.98 3.98 0.00
1998-99 0.00 96.05 0.00 2.92 2.92 0.00
1999-00 0.00 96.05 0.00 3.37 3.37 0.00
2000-01 0.00 96.05 0.00 1.00 1.00 0.00
2001-02 0.26 96.31 0.00 0.72 0.72 0.00
Sub
Total 0.26 - 0.00 11.99 11.99 0.00
2002-03
X Plan
0.00 96.31 0.00 1.00 1.00 0.00
2003-04 0.00 96.31 0.00 6.00 6.00 0.00
2004-05 0.00 96.31 0.00 1.00 1.00 0.00
2005-06 0.00 96.31 0.00 1.00 1.00 0.00
2006-07 0.00 96.31 0.00 0.98 0.98 0.00
Sub
Total 0.00 - 0.00 9.98 9.98 0.00
G. Total 82.86 - 0.00 16.23 16.23 0.00

69
Table A20: Capital Expenditure, Working Expenses and Gross receipts for Major & Medium Irrigation Projects over 1990-2007
State : Nagaland
(Rs. in lakhs)
Year
Annual Plan/
5- Year Plan
Capital Expenditure Working Expenses Gross
Receipts
During the
year
up to the end of
the year
direction and
admini-stration
expenses other than direction and ad-
ministration
total
1 2 3 4 5 6 7 8
1990-91 Annual Plan
0.00 0.00 0.00 0.00 0.00 0.00
1991-92 0.00 0.00 0.00 0.00 0.00 0.00
Sub
Total 0.00 - 0.00 0.00 0.00 0.00
1992-93
VIII Plan
0.00 0.00 0.00 0.00 0.00 0.00
1993-94 0.00 0.00 0.00 0.00 0.00 0.00
1994-95 0.00 0.00 0.00 0.00 0.00 0.00
1995-96 0.00 0.00 0.00 0.00 0.00 0.00
1996-97 0.00 0.00 0.00 0.00 0.00 0.00
Sub
Total 0.00 - 0.00 0.00 0.00 0.00
1997-98
IX Plan
0.00 0.00 0.00 0.00 0.00 0.00
1998-99 0.00 0.00 0.00 0.00 0.00 0.00
1999-00 0.00 0.00 0.00 0.00 0.00 0.00
2000-01 0.00 0.00 0.00 0.00 0.00 0.00
2001-02 0.00 0.00 0.00 0.00 0.00 0.00
Sub
Total 0.00 - 0.00 0.00 0.00 0.00
2002-03
X Plan
0.00 0.00 0.00 0.00 0.00 0.00
2003-04 0.00 0.00 0.00 0.00 0.00 0.00
2004-05 0.00 0.00 0.00 0.00 0.00 0.00
2005-06 0.00 0.00 0.00 0.00 0.00 0.00
2006-07 0.00 0.00 0.00 0.00 0.00 0.00
Sub
Total 0.00 - 0.00 0.00 0.00 0.00
G. Total 0.00 - 0.00 0.00 0.00 0.00

70
Table A21: Capital Expenditure, Working Expenses and Gross receipts for Major & Medium Irrigation Projects over 1990-2007
State : Orissa
(Rs. in lakhs)
Year
Annual Plan/
5- Year Plan
Capital Expenditure Working Expenses Gross
Receipts
During the
year
up to the end of
the year
direction and
admini-stration
expenses other than direction and ad-
ministration
total
1 2 3 4 5 6 7 8
1990-91 Annual Plan
17697.68 177221.42 268.57 1393.04 1661.61 445.35
1991-92 19892.28 197113.70 390.62 2113.73 2504.35 528.17
Sub
Total 37589.96 - 659.19 3506.77 4165.96 973.52
1992-93
VIII Plan
19302.87 216416.56 593.72 2640.19 3233.91 1377.94
1993-94 16720.66 233137.22 655.03 2746.75 3401.78 549.89
1994-95 15217.72 248354.95 793.27 3467.40 4260.67 492.93
1995-96 20180.63 268535.58 930.85 3593.12 4523.97 1117.64
1996-97 34565.94 303101.53 1211.06 3890.91 5101.97 654.14
Sub
Total 105987.82 - 4183.93 16338.37 20522.30 4192.54
1997-98
IX Plan
53575.24 356676.77 1136.44 4229.96 5366.40 650.05
1998-99 56169.80 412846.60 1873.19 3964.79 5837.98 1116.80
1999-00 46495.37 459341.97 1984.06 4720.11 6704.17 777.67
2000-01 41830.00 501171.97 2326.30 4685.48 7011.78 1871.38
2001-02 40149.19 541316.69 1912.84 5273.00 7185.84 1653.42
Sub
Total 238219.60 - 9232.83 22873.34 32106.17 6069.32
2002-03
X Plan
47466.54 588783.23 1954.61 5478.22 7432.83 2252.97
2003-04 36339.91 625123.14 2202.33 5366.68 7569.01 3229.08
2004-05 44284.99 669408.12 1865.44 6356.70 8222.14 3642.11
2005-06 40625.00 710033.13 2990.56 7671.64 10662.20 3902.05
2006-07 61774.07 771807.19 2914.99 9475.51 12390.50 4975.35
Sub
Total 230490.51 - 11927.93 34348.75 46276.68 18001.56
G. Total 612287.89 - 26003.88 77067.23 103071.11 29236.94

71
Table A22: Capital Expenditure, Working Expenses and Gross receipts for Major & Medium Irrigation Projects over 1990-2007
State : Punjab
(Rs. in lakhs)
Year
Annual Plan/
5- Year Plan
Capital Expenditure Working Expenses Gross
Receipts
During the
year
up to the end of
the year
direction and
admini-stration
expenses other than direction and ad-
ministration
total
1 2 3 4 5 6 7 8
1990-91 Annual Plan
7251.39 95986.54 364.51 8384.89 8749.40 1416.30
1991-92 16533.44 112519.98 197.83 9333.42 9531.25 1511.33
Sub
Total 23784.83 - 562.34 17718.31 18280.65 2927.63
1992-93
VIII Plan
18522.98 131042.97 218.51 10671.39 10889.90 1579.88
1993-94 26480.65 157523.61 226.37 10948.28 11174.65 1641.21
1994-95 34310.15 191833.77 2.81 12053.76 12056.57 3145.64
1995-96 42583.70 234417.46 10.83 13531.60 13542.43 3014.15
1996-97 3945.98 238363.44 14.28 15418.06 15432.34 2764.11
Sub
Total 125843.46 - 472.80 62623.09 63095.89 12144.99
1997-98
IX Plan
49130.88 287494.32 21.70 16744.82 16766.52 1068.83
1998-99 48291.79 335786.10 15.41 18571.15 18586.56 1627.57
1999-00 26590.60 362376.70 9.17 19016.75 19025.92 1769.00
2000-01 25841.11 388217.81 0.21 22065.77 22065.98 1168.19
2001-02 32093.12 420310.94 0.00 22211.83 22211.83 1633.32
Sub
Total 181947.50 - 46.49 98610.32 98656.81 7266.91
2002-03
X Plan
28641.14 448952.08 0.00 24822.64 24822.64 2447.10
2003-04 4697.71 453649.80 0.00 39945.83 39945.83 1244.38
2004-05 12072.46 497693.25 0.00 33399.06 33399.06 9096.49
2005-06 17299.79 514993.04 0.00 46708.93 46708.93 2616.84
2006-07 26385.61 541378.64 0.00 42786.37 42786.37 2014.08
Sub
Total 89096.71 - 0.00 187662.83 187662.83 17418.89
G. Total 420672.50 - 1081.63 366614.55 367696.18 39758.42

72
Table A23: Capital Expenditure, Working Expenses and Gross receipts for Major & Medium Irrigation Projects over 1990-2007
State : Rajasthan
(Rs. in lakhs)
Year
Annual Plan/
5- Year Plan
Capital Expenditure Working Expenses Gross
Receipts
During the
year
up to the end of
the year
direction and
admini-stration
expenses other than direction and ad-
ministration
total
1 2 3 4 5 6 7 8
1990-91 Annual Plan
14395.19 169566.09 293.96 14991.31 15285.27 1630.70
1991-92 17221.47 186787.56 341.31 15743.01 16084.32 1859.77
Sub
Total 31616.66 - 635.27 30734.32 31369.59 3490.47
1992-93
VIII Plan
21966.71 208754.27 421.60 23046.18 23467.78 2072.69
1993-94 24972.43 233726.70 693.87 27521.64 28215.51 1992.36
1994-95 34060.05 267786.75 673.14 29045.41 29718.55 2109.38
1995-96 35482.67 303269.42 773.47 32783.64 33557.11 2144.23
1996-97 30432.24 333701.67 834.05 36306.90 37140.95 2427.05
Sub
Total 146914.10 - 3396.13 148703.77 152099.90 10745.71
1997-98
IX Plan
39194.42 372896.09 935.21 39650.56 40585.77 2459.72
1998-99 44141.31 417037.40 1225.71 51978.24 53203.95 2340.05
1999-00 35759.62 452797.02 1184.79 54478.95 55663.74 4088.43
2000-01 24933.15 477730.17 1005.62 57661.09 58666.71 3647.98
2001-02 26035.34 503765.51 1069.60 61167.86 62237.46 1842.98
Sub
Total 170063.84 - 5420.93 264936.70 270357.63 14379.16
2002-03
X Plan
27677.65 531443.17 470.22 61130.18 61600.40 2074.03
2003-04 78802.08 610245.24 467.75 68232.30 68700.05 4323.38
2004-05 68998.90 679244.14 276.63 76092.92 76369.55 5649.81
2005-06 71813.81 751057.95 8008.85 74281.15 82290.00 4679.18
2006-07 52988.09 804046.04 8707.80 79445.36 88153.16 6056.26
Sub
Total 300280.53 - 17931.25 359181.91 377113.16 22782.66
G. Total 648875.13 - 27383.58 803556.70 830940.28 51398.00

73
Table A24: Capital Expenditure, Working Expenses and Gross receipts for Major & Medium Irrigation Projects over 1990-2007
State : Sikkim
(Rs. in lakhs)
Year
Annual Plan/
5- Year Plan
Capital Expenditure Working Expenses Gross
Receipts
During the
year
up to the end of
the year
direction and
admini-stration
expenses other than direction and ad-
ministration
total
1 2 3 4 5 6 7 8
1990-91 Annual Plan
0.00 0.00 0.00 0.00 0.00 0.00
1991-92 0.00 0.00 0.00 0.00 0.00 0.00
Sub
Total 0.00 - 0.00 0.00 0.00 0.00
1992-93
VIII Plan
0.00 0.00 0.00 0.00 0.00 0.00
1993-94 0.00 0.00 0.00 0.00 0.00 0.00
1994-95 0.00 0.00 0.00 0.00 0.00 0.00
1995-96 0.00 0.00 0.00 0.00 0.00 0.00
1996-97 0.00 0.00 0.00 0.00 0.00 0.00
Sub
Total 0.00 - 0.00 0.00 0.00 0.00
1997-98
IX Plan
0.00 0.00 0.00 0.00 0.00 0.00
1998-99 0.00 0.00 0.00 0.00 0.00 0.00
1999-00 0.00 0.00 0.00 0.00 0.00 0.00
2000-01 0.00 0.00 0.00 0.00 0.00 0.00
2001-02 0.00 0.00 0.00 0.00 0.00 0.00
Sub
Total 0.00 - 0.00 0.00 0.00 0.00
2002-03
X Plan
0.00 0.00 0.00 0.00 0.00 0.00
2003-04 0.00 0.00 0.00 0.00 0.00 0.00
2004-05 0.00 0.00 0.00 0.00 0.00 0.00
2005-06 0.00 0.00 0.00 0.00 0.00 0.00
2006-07 0.00 0.00 0.00 0.00 0.00 0.00
Sub
Total 0.00 - 0.00 0.00 0.00 0.00
G. Total 0.00 - 0.00 0.00 0.00 0.00

74
Table A25: Capital Expenditure, Working Expenses and Gross receipts for Major & Medium Irrigation Projects over 1990-2007
State : Tamil Nadu
(Rs. in lakhs)
Year
Annual Plan/
5- Year Plan
Capital Expenditure Working Expenses Gross
Receipts
During the
year
up to the end of
the year
direction and
admini-stration
expenses other than direction and ad-
ministration
total
1 2 3 4 5 6 7 8
1990-91 Annual Plan
4595.25 69786.62 302.02 7742.86 8044.88 210.55
1991-92 4587.64 74374.25 261.83 8658.42 8920.25 226.78
Sub
Total 9182.89 - 563.85 16401.28 16965.13 437.33
1992-93
VIII Plan
7067.04 81441.27 292.39 10469.79 10762.18 236.91
1993-94 7921.67 89362.94 426.39 11738.03 12164.42 366.79
1994-95 8427.46 97790.41 587.24 12038.06 12625.30 364.47
1995-96 4893.18 102683.59 837.08 14060.47 14897.55 371.27
1996-97 1532.65 104157.64 1236.99 17775.87 19012.86 463.72
Sub
Total 29842.00 - 3380.09 66082.22 69462.31 1803.16
1997-98
IX Plan
4970.83 109128.47 5377.85 18631.88 24009.73 730.16
1998-99 18797.52 127925.99 7323.53 21839.95 29163.48 824.76
1999-00 33146.45 161075.30 7976.67 22672.26 30648.93 985.58
2000-01 27043.32 188118.41 5085.58 29683.67 34769.25 930.75
2001-02 28598.89 216717.67 6566.54 28027.89 34594.43 1050.59
Sub
Total 112557.01 - 32330.17 120855.65 153185.82 4521.84
2002-03
X Plan
25307.37 242024.90 2500.11 37826.49 40326.60 952.04
2003-04 18548.33 260573.23 2399.34 42576.99 44976.33 1271.06
2004-05 15393.31 275966.56 2597.74 44236.97 46834.71 1562.85
2005-06 11788.32 287754.88 2643.29 43520.35 46163.64 1490.46
2006-07 14276.57 302031.45 2699.77 51008.76 53708.53 2850.55
Sub
Total 85313.90 - 12840.25 219169.56 232009.81 8126.96
G. Total 236895.80 - 49114.36 422508.71 471623.07 14889.29

75
Table A26: Capital Expenditure, Working Expenses and Gross receipts for Major & Medium Irrigation Projects over 1990-2007
State : Tripura
(Rs. in lakhs)
Year
Annual Plan/
5- Year Plan
Capital Expenditure Working Expenses Gross
Receipts
During the
year
up to the end of
the year
direction and
admini-stration
expenses other than direction and ad-
ministration
total
1 2 3 4 5 6 7 8
1990-91 Annual Plan
722.62 5591.62 0.00 0.00 0.00 1.33
1991-92 992.11 6583.73 0.00 0.00 0.00 1.96
Sub
Total 1714.73 - 0.00 0.00 0.00 3.29
1992-93
VIII Plan
831.46 7415.19 0.00 0.00 0.00 0.52
1993-94 565.34 7980.53 0.00 0.00 0.00 5.13
1994-95 367.39 8347.92 0.00 0.00 0.00 0.20
1995-96 413.07 8760.99 0.00 0.00 0.00 4.41
1996-97 722.05 9483.04 0.00 0.00 0.00 0.29
Sub
Total 2899.31 - 0.00 0.00 0.00 10.55
1997-98
IX Plan
617.11 10100.15 0.00 0.00 0.00 1.49
1998-99 757.33 10857.48 0.00 0.00 0.00 0.18
1999-00 718.18 11575.66 0.00 0.00 0.00 0.19
2000-01 565.62 12141.28 0.00 0.00 0.00 0.10
2001-02 431.59 12572.87 0.00 0.00 0.00 1.73
Sub
Total 3089.83 - 0.00 0.00 0.00 3.69
2002-03
X Plan
225.73 12798.60 0.00 0.00 0.00 13.97
2003-04 543.14 13341.73 0.00 0.00 0.00 0.00
2004-05 595.80 13937.53 0.00 0.00 0.00 2.74
2005-06 1049.93 14987.46 0.00 0.00 0.00 0.02
2006-07 1774.02 16761.48 0.00 0.00 0.00 0.02
Sub
Total 4188.62 - 0.00 0.00 0.00 16.75
G. Total 11892.49 - 0.00 0.00 0.00 34.28

76
Table A27: Capital Expenditure, Working Expenses and Gross receipts for Major & Medium Irrigation Projects over 1990-2007
State : Uttar Pradesh
(Rs. in lakhs)
Year
Annual Plan/
5- Year Plan
Capital Expenditure Working Expenses Gross
Receipts
During the
year
up to the end of
the year
direction and
admini-stration
expenses other than direction and ad-
ministration
total
1 2 3 4 5 6 7 8
1990-91 Annual Plan
27373.26 347578.41 1259.75 35650.86 36910.61 3502.64
1991-92 17459.18 365037.59 0.00 46245.93 46245.93 3684.47
Sub
Total 44832.44 - 1259.75 81896.79 83156.54 7187.11
1992-93
VIII Plan
19423.06 384460.64 0.00 49220.15 49220.15 4596.95
1993-94 26528.19 410988.83 0.00 51657.33 51657.33 16123.10
1994-95 21892.68 432818.51 0.00 55694.61 55694.61 6548.16
1995-96 31350.94 464169.45 0.00 61160.82 61160.82 10395.34
1996-97 43279.27 507448.72 226.95 61511.08 61738.03 10078.47
Sub
Total 142474.14 - 226.95 279243.99 279470.94 47742.02
1997-98
IX Plan
41839.08 549287.80 29655.95 42173.54 71829.49 4085.50
1998-99 39523.60 588811.40 25062.25 45310.71 70372.96 4912.71
1999-00 56849.74 645661.15 44786.27 49566.33 94352.60 4016.052000-01
* 51109.88 51109.88 25851.64 79621.31 105472.95 28213.37
2001-02 72855.58 123965.46 44618.16 53450.10 98068.26 11575.84
Sub
Total 262177.88 - 169974.27 270121.99 440096.26 52803.47
2002-03
X Plan
66769.91 190735.38 49011.53 58279.23 107290.76 9012.17
2003-04 65463.69 256199.07 56019.08 55723.79 111742.87 13609.78
2004-05 66419.84 322618.91 56895.38 58764.06 115659.44 17659.78
2005-06 123210.79 445829.70 56448.14 34679.09 91127.23 17750.13
2006-07 174847.27 620676.97 83613.93 39002.57 122616.50 14862.70
Sub
Total 496711.50 - 301988.06 246448.74 548436.80 72894.56
G. Total 946195.96 - 473449.03 877711.51 1351160.54 180627.16* : Rs.26232.27 and Rs.671893.42 lakhs stood as un-apportioned Capital Outlay between UP and Uttaranchal during the year and at the end of year, respectively.

77
Table A28: Capital Expenditure, Working Expenses and Gross receipts for Major & Medium Irrigation Projects over 1990-2007
State : Uttarakhand
(Rs. in lakhs)
Year
Annual Plan/
5- Year Plan
Capital Expenditure Working Expenses Gross
Receipts
During the
year
up to the end of
the year
direction and
admini-stration
expenses other than direction and ad-
ministration
total
1 2 3 4 5 6 7 8
1990-91 Annual Plan
0.00 0.00 0.00 0.00 0.00 0.00
1991-92 0.00 0.00 0.00 0.00 0.00 0.00
Sub
Total 0.00 - 0.00 0.00 0.00 0.00
1992-93
VIII Plan
0.00 0.00 0.00 0.00 0.00 0.00
1993-94 0.00 0.00 0.00 0.00 0.00 0.00
1994-95 0.00 0.00 0.00 0.00 0.00 0.00
1995-96 0.00 0.00 0.00 0.00 0.00 0.00
1996-97 0.00 0.00 0.00 0.00 0.00 0.00
Sub
Total 0.00 - 0.00 0.00 0.00 0.00
1997-98
IX Plan
0.00 0.00 0.00 0.00 0.00 0.00
1998-99 0.00 0.00 0.00 0.00 0.00 0.00
1999-00 0.00 0.00 0.00 0.00 0.00 0.002000-01
* 1250.95 1250.95 1321.35 215.77 1537.12 223.26
2001-02 2446.75 3697.70 7264.47 670.39 7934.86 678.52
Sub
Total 3697.70 - 8585.82 886.16 9471.98 901.78
2002-03
X Plan
2230.52 5928.22 7915.41 814.11 8729.52 1037.81
2003-04 3128.74 9056.96 9033.79 1058.49 10092.28 936.23
2004-05 4746.94 13803.90 9330.08 1121.78 10451.86 0.00
2005-06 7022.15 20826.66 9595.77 1226.74 10822.51 621.01
2006-07 12791.29 33617.34 10579.37 941.09 11520.46 568.71
Sub
Total 29919.64 - 46454.42 5162.21 51616.63 3163.76
G. Total 33617.34 - 55040.24 6048.37 61088.61 4065.54* : Rs.26232.27 and Rs.671893.42 lakhs stood as un-apportioned Capital Outlay between UP and Uttaranchal during the year and at the end of year, respectively.

78
Table A29: Capital Expenditure, Working Expenses and Gross receipts for Major & Medium Irrigation Projects over 1990-2007
State : West Bengal
(Rs. in lakhs)
Year
Annual Plan/
5- Year Plan
Capital Expenditure Working Expenses Gross
Receipts
During the
year
up to the end of
the year
direction and
admini-stration
expenses other than direction and ad-
ministration
total
1 2 3 4 5 6 7 8
1990-91 Annual Plan
4581.56 60112.75 1236.42 4461.45 5697.87 155.14
1991-92 3994.57 64107.33 1315.89 4499.05 5814.94 195.30
Sub
Total 8576.13 - 2552.31 8960.50 11512.81 350.44
1992-93
VIII Plan
3180.76 67288.09 1474.95 4621.42 6096.37 231.45
1993-94 7489.75 74779.85 1696.04 5327.54 7023.58 230.57
1994-95 7943.94 82723.79 1657.27 5995.29 7652.56 304.17
1995-96 9982.62 92706.41 1897.49 6664.87 8562.36 279.85
1996-97 11296.08 104002.49 2202.59 7776.43 9979.02 279.26
Sub
Total 39893.15 - 8928.34 30385.55 39313.89 1325.30
1997-98
IX Plan
9412.75 113415.24 2762.12 8371.32 11133.44 242.34
1998-99 9717.78 123133.01 4180.11 9897.37 14077.48 293.52
1999-00 9241.86 132374.87 4902.53 12286.95 17189.48 297.01
2000-01 11162.81 143537.68 4926.69 14160.25 19086.94 398.95
2001-02 11449.18 154986.86 4845.63 11293.51 16139.14 367.20
Sub
Total 50984.38 - 21617.08 56009.40 77626.48 1599.02
2002-03
X Plan
7315.50 162302.37 4785.08 10396.63 15181.71 349.18
2003-04 5599.37 168001.73 4777.98 9439.71 14217.69 400.17
2004-05 5490.13 173491.86 4814.99 12108.54 16923.53 405.85
2005-06 4411.58 177903.44 5606.91 12868.99 18475.90 514.73
2006-07 6248.14 184151.58 11248.50 12938.99 24187.49 695.49
Sub
Total 29064.72 - 31233.46 57752.86 88986.32 2365.42
G. Total 128518.38 - 64331.19 153108.31 217439.50 5640.18

79
Table A30: Capital Expenditure, Working Expenses and Gross receipts for Major & Medium Irrigation Projects over 1990-2007
State : Goa
(Rs. in lakhs)
Year
Annual Plan/
5- Year Plan
Capital Expenditure Working Expenses Gross
Receipts
During the
year
up to the end of
the year
direction and
admini-stration
expenses other than direction and ad-
ministration
total
1 2 3 4 5 6 7 8
1990-91 Annual Plan
2299.46 15301.31 172.89 10.90 183.79 37.71
1991-92 2155.18 17456.49 181.74 19.64 201.38 86.81
Sub
Total 4454.64 - 354.63 30.54 385.17 124.52
1992-93
VIII Plan
2172.22 19628.70 210.68 24.30 234.98 76.20
1993-94 1583.10 21211.80 234.36 24.00 258.36 30.94
1994-95 2909.04 24120.84 257.03 20.62 277.65 91.92
1995-96 3007.18 27128.02 303.21 28.69 331.90 51.37
1996-97 2549.88 29677.90 400.01 44.84 444.85 35.86
Sub
Total 12221.42 - 1405.29 142.45 1547.74 286.29
1997-98
IX Plan
2349.58 32027.48 434.54 50.56 485.10 28.74
1998-99 1992.22 34019.70 524.16 58.84 583.00 25.92
1999-00 1718.53 35738.23 573.84 63.90 637.74 52.80
2000-01 4589.60 40327.83 692.76 67.19 759.95 21.99
2001-02 4144.15 44471.98 524.16 74.93 599.09 1369.61
Sub
Total 14794.08 - 2749.46 315.42 3064.88 1499.06
2002-03
X Plan
1537.56 46009.55 584.70 73.68 658.38 425.67
2003-04 1083.62 47093.17 591.33 79.92 671.25 293.51
2004-05 2991.91 50085.08 654.37 83.56 737.93 348.68
2005-06 13025.51 63110.58 746.23 87.31 833.54 1031.92
2006-07 12583.08 75693.66 805.17 94.38 899.55 293.28
Sub
Total 31221.68 - 3381.80 418.85 3800.65 2393.06
G. Total 62691.82 - 7891.18 907.26 8798.44 4302.93

80
Table A31: Capital Expenditure, Working Expenses and Gross receipts for Major & Medium Irrigation Projects over 1990-2007
State : Puducherry
(Rs. in lakhs)
Year
Annual Plan/
5- Year Plan
Capital Expenditure Working Expenses Gross
Receipts
during the
year
up to the end of
the year
direction and
admini-stration
expenses other than direction and ad-
ministration
total
1 2 3 4 5 6 7 8
1990-91 Annual Plan
20.00 472.22 15.75 0.00 15.75 0.00
1991-92 63.01 535.23 15.68 0.00 15.68 0.15
Sub
Total 83.01 - 31.43 0.00 31.43 0.15
1992-93
VIII Plan
71.60 606.83 18.62 0.00 18.62 0.41
1993-94 87.20 694.03 19.58 0.00 19.58 0.35
1994-95 8.66 702.63 21.52 0.00 21.52 0.32
1995-96 28.80 731.49 25.66 0.00 25.66 0.16
1996-97 26.42 757.91 29.10 0.00 29.10 0.20
Sub
Total 222.68 - 114.48 0.00 114.48 1.44
1997-98
IX Plan
33.45 791.36 38.97 0.00 38.97 0.19
1998-99 33.45 824.81 42.61 0.00 42.61 0.21
1999-00 63.79 888.58 47.56 0.00 47.56 0.54
2000-01 69.83 958.42 48.92 0.00 48.92 0.14
2001-02 70.02 1028.44 51.72 0.00 51.72 0.23
Sub
Total 270.54 - 229.78 0.00 229.78 1.31
2002-03
X Plan
44.13 1072.57 51.97 0.00 51.97 0.17
2003-04 42.28 1114.85 55.24 0.00 55.24 0.20
2004-05 0.00 1114.85 0.00 0.00 0.00 0.36
2005-06 0.00 1114.85 0.00 0.00 0.00 0.18
2006-07 0.00 1114.85 0.00 0.00 0.00 0.20
Sub
Total 86.41 - 107.21 0.00 107.21 1.11
G. Total 662.64 - 482.90 0.00 482.90 4.01

81
Table A32: Capital Expenditure, Working Expenses and Gross receipts for Major & Medium Irrigation Projects over 1990-2007
State : Union Government
(Rs. in lakhs)
Year
Annual Plan/
5- Year Plan
Capital Expenditure Working Expenses Gross
Receipts
during the
year
up to the end of
the year
direction and
admini-stration
expenses other than direction and ad-
ministration
total
1 2 3 4 5 6 7 8
1990-91 Annual Plan
184.90 8369.93 323.33 3314.69 3638.02 375.56
1991-92 473.99 8843.92 333.41 3644.54 3977.95 284.00
Sub
Total 658.89 - 656.74 6959.23 7615.97 659.56
1992-93
VIII Plan
558.82 9402.74 360.96 4517.64 4878.60 309.30
1993-94 416.15 9818.89 375.69 4648.17 5023.86 349.20
1994-95 366.50 10119.96 398.05 5180.63 5578.68 451.18
1995-96 286.74 10406.70 488.57 6438.28 6926.85 295.27
1996-97 1142.41 11549.11 521.88 6767.27 7289.15 389.21
Sub
Total 2770.62 - 2145.15 27551.99 29697.14 1794.16
1997-98
IX Plan
531.21 12080.32 734.96 8849.71 9584.67 483.48
1998-99 219.40 12299.72 798.15 11076.47 11874.62 651.46
1999-00 241.11 12540.83 916.38 11505.21 12421.59 609.77
2000-01 344.96 12885.79 951.19 10928.13 11879.32 859.85
2001-02 357.57 13243.36 969.78 11729.57 12699.35 771.69
Sub
Total 1694.25 - 4370.46 54089.09 58459.55 3376.25
2002-03
X Plan
453.91 13697.27 1027.59 11357.04 12384.63 1880.99
2003-04 15.00 13712.27 1053.37 14002.81 15056.18 823.07
2004-05 67.02 13779.29 1214.42 14412.81 15627.23 1409.24
2005-06 98.73 13878.02 1285.75 14613.61 15899.36 971.55
2006-07 55.04 13933.06 1299.57 15062.81 16362.38 1002.32
Sub
Total 689.70 - 5880.70 69449.08 75329.78 6087.17

82
Table B1 : Capital Expenditure, Working Expenses and Gross receipts for Minor Irrigation Projects over 1990-2007
All-India (Rs. in lakhs)
Year
Annual Plan/
5- Year Plan
Capital Expenditure Working Expenses Gross Receipts
during the
year
up to the end of
the year
direction and
admini-stration
expenses other than direction and ad-
ministration
total
1 2 3 4 5 6 7 8
1990-91 Annual Plan
48858.35 545944.67 5309.23 92170.42 97479.65 4192.82
1991-92 48338.60 592887.22 5093.97 95324.18 100418.15 5411.39
Sub
Total 97196.95 - 10403.20 187500.60 197897.80 9604.21
1992-93
VIII Plan
55983.68 650295.82 7125.77 87918.31 95044.08 5847.18
1993-94 63533.21 713829.02 8227.21 137725.28 145952.49 6898.29
1994-95 73240.19 789824.79 10702.41 151046.52 161748.93 9884.48
1995-96 75633.05 865457.87 11709.45 164344.71 176054.16 11152.40
1996-97 88995.16 953313.71 13829.54 177534.52 191364.06 10384.18
Sub
Total 357385.29 - 51594.38 718569.34 770163.72 44166.53
1997-98
IX Plan
90621.87 1043935.60 16964.63 173728.34 190692.97 11592.47
1998-99 100668.10 1134623.52 21583.08 191290.55 212873.63 10137.10
1999-00 114158.52 1260401.86 26161.52 147521.52 173683.04 9526.09
2000-01* 96522.88 1039678.56 27108.25 173324.38 200432.63 8013.87
2001-02 103838.38 1143517.22 27687.53 182978.71 210666.24 8015.06
Sub
Total 505809.75 - 119505.01 868843.50 988348.51 47284.59
2002-03
X Plan
106581.27 1250255.61 31666.71 174132.88 205799.59 10117.79
2003-04 160876.89 1411132.67 35775.35 165957.24 201732.59 12791.14
2004-05 246954.31 1658086.99 39057.73 196032.78 235090.51 14468.48
2005-06 288400.25 1946487.64 42599.74 209697.08 252296.82 16977.85
2006-07 302036.56 2026137.20 53627.36 239643.52 293270.88 17731.78
Sub
Total 1104849.28 - 202726.89 985463.50 1188190.39 72087.04
G. Total 2065241.27 - 384229.48 2760376.94 3144600.42 173142.37

83
Table B2 : Capital Expenditure, Working Expenses and Gross receipts for Minor Irrigation Projects over 1990-2007
State : Andhra Pradesh (Rs. in lakhs)
Year
Annual Plan/
5- Year Plan
Capital Expenditure Working Expenses Gross Receipts
during the
year
up to the end of
the year
direction and
admini-stration
expenses other than direction and ad-
ministration
total
1 2 3 4 5 6 7 8
1990-91 Annual Plan
4037.26 36016.00 0.00 4929.31 4929.31 272.2
1991-92 4411.24 40427.23 0.00 4032.61 4032.61 309.52
Sub
Total 8448.50 - 0.00 8961.92 8961.92 581.72
1992-93
VIII Plan
4259.30 44686.53 0.00 8934.26 8934.26 1048.69
1993-94 6737.44 51423.97 0.00 6292.16 6292.16 120.69
1994-95 5092.00 56515.97 0.00 5141.55 5141.55 813.54
1995-96 6528.25 63044.22 0.00 6070.94 6070.94 739.95
1996-97 6083.57 69127.79 0.00 4111.51 4111.51 696.08
Sub
Total 28700.56 - 0.00 30550.42 30550.42 3418.95
1997-98
IX Plan
8881.22 78009.00 0.00 7771.75 7771.75 270.15
1998-99 13155.68 91164.68 0.00 5606.86 5606.86 254.59
1999-00 12357.03 103521.71 0.00 7400.97 7400.97 254.68
2000-01 11134.15 114655.87 0.00 11999.80 11999.80 279.22
2001-02 13012.72 127668.58 0.00 16687.34 16687.34 162.76
Sub
Total 58540.80 - 0.00 49466.72 49466.72 1221.40
2002-03
X Plan
14221.97 141890.55 0.00 11117.71 11117.71 132.80
2003-04 23041.63 164932.19 0.00 7154.82 7154.82 144.37
2004-05 34239.35 199171.54 0.00 6902.46 6902.46 583.02
2005-06 35297.02 234468.56 0.00 6530.97 6530.97 197.59
2006-07 47842.02 282310.58 0.00 6890.95 6890.95 161.75
Sub
Total 154641.99 - 0.00 38596.91 38596.91 1219.53
G. Total 250331.85 - 0.00 127575.97 127575.97 6441.60

84
Table B3 : Capital Expenditure, Working Expenses and Gross receipts for Minor Irrigation Projects over 1990-2007
State : Arunachal Pradesh
(Rs. in lakhs) Year
Annual Plan/
5- Year Plan
Capital Expenditure Working Expenses Actual Gross Receipts
during the
year
up to the end of
the year
direction and
admini-stration
expenses other than direction and ad-
ministration
total
1 2 3 4 5 6 7 8
1990-91 Annual Plan
100.04 695.19 174.78 682.34 857.12 26.06
1991-92 90.00 785.19 217.48 717.64 935.12 28.53
Sub
Total 190.04 - 392.26 1399.98 1792.24 54.59
1992-93
VIII Plan
91.55 876.74 269.01 1153.26 1422.27 42.17
1993-94 81.70 958.44 306.85 1354.12 1660.97 22.11
1994-95 90.08 1048.52 352.61 1430.64 1783.25 45.01
1995-96 90.74 1139.26 400.69 1183.63 1584.32 27.18
1996-97 0.00 0.00 0.00 0.00 0.00 0.00
Sub
Total 354.07 - 1329.16 5121.65 6450.81 136.47
1997-98
IX Plan
0.00 0.00 0.00 0.00 0.00 0.00
1998-99 0.00 0.00 0.00 0.00 0.00 0.00
1999-00 168.00 1800.26 919.54 1086.11 2005.65 1.67
2000-01 222.68 2022.94 944.51 1796.26 2740.77 2.34
2001-02 178.64 2201.58 1057.24 2014.43 3071.67 1.80
Sub
Total 569.32 - 2921.29 4896.80 7818.09 5.81
2002-03
X Plan
117.50 2319.08 1130.21 1178.68 2308.89 0.98
2003-04 117.50 2436.58 1203.28 2615.09 3818.37 0.96
2004-05 11.00 2447.58 1220.51 1783.26 3003.77 68.57
2005-06 10.65 2458.23 1272.32 3013.15 4285.47 3.01
2006-07 329.05 2787.28 1486.44 4144.64 5631.08 1.50
Sub
Total 585.70 - 6312.76 12734.82 19047.58 75.02
G. Total 1699.13 - 10955.47 24153.25 35108.72 271.89

85
Table B4 : Capital Expenditure, Working Expenses and Gross receipts for Minor Irrigation Projects over 1990-2007
State : Assam
(Rs. in lakhs) Year
Annual Plan/
5- Year Plan
Capital Expenditure Working Expenses Gross Receipts
during the
year
up to the end of
the year
direction and
admini-stration
expenses other than direction and ad-
ministration
total
1 2 3 4 5 6 7 8
1990-91 Annual Plan
4219.31 32969.17 39.22 1336.59 1375.81 14.97
1991-92 5118.53 38087.70 50.02 1411.88 1461.90 10.76
Sub
Total 9337.84 - 89.24 2748.47 2837.71 25.73
1992-93
VIII Plan
4561.26 42648.96 0.00 0.00 0.00 10.76
1993-94 4899.18 47548.14 45.69 1029.27 1074.96 12.10
1994-95 5218.57 52766.71 75.78 1137.55 1213.33 21.39
1995-96 5323.70 58090.41 39.17 1078.25 1117.42 11.80
1996-97 5577.04 63667.45 118.97 1391.32 1510.29 9.41
Sub
Total 25579.75 - 279.61 4636.39 4916.00 65.46
1997-98
IX Plan
8462.53 72129.98 221.78 1408.81 1630.59 10.14
1998-99 6858.60 78988.58 358.99 2358.01 2717.00 6.71
1999-00 8064.81 87053.39 403.49 2236.88 2640.37 53.51
2000-01 7142.32 94195.71 658.98 4885.27 5544.25 13.69
2001-02 8015.45 102211.16 1208.89 2168.26 3377.15 18.99
Sub
Total 38543.71 - 2852.13 13057.23 15909.36 103.04
2002-03
X Plan
5561.35 107772.51 2433.41 2432.68 4866.09 28.74
2003-04 4279.73 112052.23 3855.27 3948.33 7803.60 19.87
2004-05 3965.13 116017.36 5034.59 4061.65 9096.24 43.30
2005-06 4810.30 120827.67 6803.22 3183.17 9986.39 17.27
2006-07 5271.68 126099.35 9759.92 3201.95 12961.87 24.48
Sub
Total 23888.19 - 27886.41 16827.78 44714.19 133.66
G. Total 97349.49 - 31107.39 37269.87 68377.26 327.89

86
Table B5 : Capital Expenditure, Working Expenses and Gross receipts for Minor Irrigation Projects over 1990-2007
State : Bihar
(Rs. in lakhs) Year
Annual Plan/
5- Year Plan
Capital Expenditure Working Expenses Gross Receipts
during the
year
up to the end of
the year
direction and
admini-stration
expenses other than direction and ad-
ministration
total
1 2 3 4 5 6 7 8
1990-91 Annual Plan
824.59 28594.59 0.00 9588.14 9588.14 185.73
1991-92 757.03 29351.62 0.00 9396.24 9396.24 294.23
Sub
Total 1581.62 - 0.00 18984.38 18984.38 479.96
1992-93
VIII Plan
999.65 30351.27 0.00 12972.67 12972.67 331.09
1993-94 373.13 30724.40 0.00 13221.83 13221.83 121.68
1994-95 272.89 30997.29 0.00 9338.90 9338.90 35.75
1995-96 226.17 31223.47 0.00 10230.79 10230.79 41.31
1996-97 344.36 31567.82 0.00 12244.88 12244.88 91.62
Sub
Total 2216.20 - 0.00 58009.07 58009.07 621.45
1997-98
IX Plan
1429.29 32997.11 0.00 14024.98 14024.98 59.48
1998-99 1878.03 24875.14 0.00 13126.46 13126.46 52.66
1999-00 2724.70 37599.84 0.00 17052.45 17052.45 82.55
2000-01 1775.12 39374.96 0.00 12921.64 12921.64 72.42
2001-02 1157.41 40532.37 0.00 12462.74 12462.74 80.41
Sub
Total 8964.55 - 0.00 69588.27 69588.27 347.52
2002-03
X Plan
549.30 41081.67 0.00 13463.52 13463.52 45.51
2003-04 17522.49 58604.16 0.00 10611.66 10611.66 163.02
2004-05 5943.05 64547.21 0.00 25386.42 25386.42 35.36
2005-06 2848.70 67395.91 0.00 21886.08 21886.08 41.32
2006-07 4833.15 72229.06 0.00 13591.35 13591.35 140.32
Sub
Total 31696.69 - 0.00 84939.03 84939.03 425.53
G. Total 44459.06 - 0.00 231520.75 231520.75 1874.46

87
Table B6 : Capital Expenditure, Working Expenses and Gross receipts for Minor Irrigation Projects over 1990-2007
State : Chhattisgarh
(Rs. in lakhs) Year
Annual Plan/
5- Year Plan
Capital Expenditure Working Expenses Gross Receipts
during the
year
up to the end of
the year
direction and
admini-stration
expenses other than direction and ad-
ministration
total
1 2 3 4 5 6 7 8
19901-91
0.00 0.00 0.00 0.00 0.00
1991-92
0.00 0.00 0.00 0.00 0.00
1992-93
0.00 0.00 0.00 0.00 0.00
1993-94
0.00 0.00 0.00 0.00 0.00
1994-95
0.00 0.00 0.00 0.00 0.00
1995-96
0.00 0.00 0.00 0.00 0.00
1996-97
0.00 0.00 0.00 0.00 0.00
1997-98
IX Plan
0.00 0.00 0.00 0.00 0.00
1998-99 0.00 0.00 0.00 0.00 0.00
1999-00 0.00 0.00 0.00 0.00 0.00
2000-01 1770.13 8133.37 6.88 543.24 550.12 151.65
2001-02 8282.33 16415.69 0.00 1020.18 1020.18 0.00
Sub
Total 10052.46 - 6.88 1563.42 1570.30 151.65
2002-03
X Plan
12796.95 29212.65 9.12 7732.61 7741.73 457.67
2003-04 15298.93 44511.58 0.55 4469.60 4470.15 1016.03
2004-05 18218.56 62730.14 2.82 2948.29 2951.11 1270.49
2005-06 19952.58 82682.72 0.39 2812.22 2812.61 772.10
2006-07 26930.70 109613.42 2.71 3666.23 3668.94 1036.29
Sub
Total 93197.72 - 15.59 21628.95 21644.54 4552.58
G. Total 103250.18 - 22.47 23192.37 23214.84 4704.23

88
Table B7 : Capital Expenditure, Working Expenses and Gross receipts for Minor Irrigation Projects over 1990-2007
State : Delhi
(Rs. in lakhs) Year
Annual Plan/
5- Year Plan
Capital Expenditure Working Expenses Gross Receipts
during the
year
up to the end of
the year
direction and
admini-stration
expenses other than direction and ad-
ministration
total
1 2 3 4 5 6 7 8
1990-91 Annual Plan
0.00 0.00 0.00 0.00 0.00 0.00
1991-92 0.00 0.00 0.00 0.00 0.00 0.00
Sub
Total 0.00 - 0.00 0.00 0.00 0.00
1992-93
VIII Plan
0.00 0.00 0.00 0.00 0.00 0.00
1993-94 138.02 138.02 9.40 106.05 115.45 1.13
1994-95* 140.00 1568.71 38.49 273.10 311.59 3.65
1995-96 179.58 1748.29 45.94 304.32 350.26 0.36
1996-97 45.62 1793.91 61.66 280.20 341.86 1.82
Sub
Total 503.22 - 155.49 963.67 1119.16 6.96
1997-98
IX Plan
84.05 1877.96 71.35 394.17 465.52 1.34
1998-99 63.35 1941.31 87.07 515.47 602.54 1.84
1999-00 93.72 2035.03 96.48 468.00 564.48 13.15
2000-01 107.67 2142.70 100.66 543.75 644.41 13.15
2001-02 40.85 2183.55 97.93 502.87 600.80 9.92
Sub
Total 389.64 - 453.49 2424.26 2877.75 39.40
2002-03
X Plan
48.67 2232.22 105.20 568.30 673.50 10.13
2003-04 2.33 2234.55 105.81 535.84 641.65 4.53
2004-05 0.00 2234.55 116.97 611.53 728.50 12.56
2005-06 9.97 2244.52 112.58 652.01 764.59 5.14
2006-07 9.93 2254.45 117.64 666.36 784.00 10.36
Sub
Total 70.90 - 558.20 3034.04 3592.24 42.72
G. Total 963.76 - 1167.18 6421.97 7589.15 89.08

89
Table B8 : Capital Expenditure, Working Expenses and Gross receipts for Minor Irrigation Projects over 1990-2007
State : Gujarat
(Rs. in lakhs) Year
Annual Plan/
5- Year Plan
Capital Expenditure Working Expenses Gross Receipts
during the
year
up to the end of
the year
direction and
admini-stration
expenses other than direction and ad-
ministration
total
1 2 3 4 5 6 7 8
1990-91 Annual Plan
519.36 8153.31 735.05 4207.03 4942.08 152.47
1991-92 809.78 8963.09 834.12 4911.97 5746.09 178.22
Sub
Total 1329.14 - 1569.17 9119.00 10688.17 330.69
1992-93
VIII Plan
1127.40 10090.50 875.27 7262.60 8137.87 151.06
1993-94 1002.85 11093.34 990.62 8240.25 9230.87 213.12
1994-95 2872.69 13966.03 1136.38 10561.71 11698.09 345.31
1995-96 5818.07 19784.11 1267.47 11086.01 12353.48 381.40
1996-97 5559.46 25343.56 1365.65 9194.93 10560.58 329.95
Sub
Total 16380.47 - 5635.39 46345.50 51980.89 1420.84
1997-98
IX Plan
7919.98 33263.55 1530.00 11897.79 13427.79 291.57
1998-99 10682.07 43945.62 2378.20 14647.64 17025.84 267.85
1999-00 10372.45 54318.08 2250.48 19032.87 21283.35 274.24
2000-01 16809.94 71128.02 2264.48 17324.37 19588.85 232.24
2001-02 7969.28 79097.29 1867.06 8328.29 10195.35 279.88
Sub
Total 53753.72 - 10290.22 71230.96 81521.18 1345.78
2002-03
X Plan
7960.28 87057.57 2507.72 9733.03 12240.75 480.04
2003-04 11813.35 98871.08 2414.74 12327.46 14742.20 1089.12
2004-05 69130.30 168001.38 2777.27 8388.19 11165.46 496.84
2005-06 82763.95 250765.33 2744.34 9493.20 12237.54 464.32
2006-07 11589.93 40594.66 2834.15 15019.15 17853.30 732.48
Sub
Total 183257.81 - 13278.22 54961.03 68239.25 3262.80
G. Total 326184.47 - 48267.78 308351.96 356619.74 9457.42

90
Table B9 : Capital Expenditure, Working Expenses and Gross receipts for Minor Irrigation Projects over 1990-2007
State : Haryana
(Rs. in lakhs) Year
Annual Plan/
5- Year Plan
Capital Expenditure Working Expenses Gross Receipts
during the
year
up to the end of
the year
direction and
admini-stration
expenses other than direction and ad-
ministration
total
1 2 3 4 5 6 7 8
1990-91 Annual Plan
2031.79 11772.41 0.00 2535.13 2535.13 5.31
1991-92 2357.12 14129.54 0.00 2596.93 2596.93 6.79
Sub
Total 4388.91 - 0.00 5132.06 5132.06 12.10
1992-93
VIII Plan
2664.48 16794.02 0.00 2545.78 2545.78 5.56
1993-94 3112.00 19906.02 0.00 2185.24 2185.24 6.23
1994-95 3057.00 22963.02 0.00 4720.86 4720.86 5.52
1995-96 4451.00 27414.02 0.00 893.49 893.49 5.71
1996-97 3700.00 31114.02 0.00 616.96 616.96 306.48
Sub
Total 16984.48 - 0.00 10962.33 10962.33 329.50
1997-98
IX Plan
2192.00 33306.02 0.00 993.52 993.52 7.05
1998-99 3565.00 36871.02 0.00 448.57 448.57 7.86
1999-00 4200.00 41071.02 0.00 826.61 826.61 8.36
2000-01 6600.00 47671.02 0.00 767.15 767.15 9.92
2001-02 7400.00 55071.02 0.00 2003.43 2003.43 10.79
Sub
Total 23957.00 - 0.00 5039.28 5039.28 43.98
2002-03
X Plan
0.00 55071.02 0.00 5483.92 5483.92 6.86
2003-04 0.00 55071.02 0.00 817.67 817.67 12.29
2004-05 0.00 55071.02 0.00 374.50 374.50 7.23
2005-06 0.00 55071.02 0.00 365.91 365.91 10.62
2006-07 0.00 55071.02 0.00 413.51 413.51 29.68
Sub
Total 0.00 - 0.00 7455.51 7455.51 66.68
G. Total 45330.39 - 0.00 28589.18 28589.18 452.26

91
Table B10 : Capital Expenditure, Working Expenses and Gross receipts for Minor Irrigation Projects over 1990-2007
State : Himachal Pradesh
(Rs. in lakhs) Year
Annual Plan/
5- Year Plan
Capital Expenditure Working Expenses Gross Receipts
during the
year
up to the end of
the year
direction and
admini-stration
expenses other than direction and ad-
ministration
total
1 2 3 4 5 6 7 8
1990-91 Annual Plan
1473.61 9075.10 348.92 1098.49 1447.41 4.75
1991-92 1239.55 10314.65 321.52 1102.92 1424.44 5.95
Sub
Total 2713.16 - 670.44 2201.41 2871.85 10.70
1992-93
VIII Plan
939.79 11254.44 421.12 1163.98 1585.10 6.59
1993-94 720.06 11974.50 414.64 1016.27 1430.91 10.48
1994-95 969.88 12944.37 494.57 1949.31 2443.88 10.48
1995-96 1281.37 14225.75 573.65 1952.04 2525.69 13.02
1996-97 2356.32 16582.06 626.12 2069.54 2695.66 9.14
Sub
Total 6267.42 - 2530.10 8151.14 10681.24 49.71
1997-98
IX Plan
2864.89 19446.95 765.92 2588.30 3354.22 11.55
1998-99 2830.64 22277.59 1012.90 3113.76 4126.66 15.45
1999-00 2719.66 24997.25 1144.72 3178.28 4323.00 9.90
2000-01 2191.60 27188.85 1275.34 3610.01 4885.35 20.39
2001-02 2436.60 29625.45 1829.91 2917.01 4746.92 45.57
Sub
Total 13043.39 - 6028.79 15407.36 21436.15 102.86
2002-03
X Plan
3295.14 32920.59 3212.15 3426.27 6638.42 30.37
2003-04 4667.10 37587.70 2576.27 4129.65 6705.92 24.14
2004-05 4129.02 41716.72 2647.78 3702.06 6349.84 36.44
2005-06 6239.69 47956.41 3223.33 5191.14 8414.47 54.11
2006-07 11292.90 59249.31 9884.31 2453.32 12337.63 48.03
Sub
Total 29623.85 - 21543.84 18902.44 40446.28 193.09
G. Total 51647.82 - 30773.17 44662.35 75435.52 356.36

92
Table B11 : Capital Expenditure, Working Expenses and Gross receipts for Minor Irrigation Projects over 1990-2007
State : Jammu & Kashmir
(Rs. in lakhs) Year
Annual Plan/
5- Year Plan
Capital Expenditure Working Expenses Gross Receipts
during the
year
up to the end of
the year
direction and
admini-stration
expenses other than direction and ad-
ministration
total
1 2 3 4 5 6 7 8
1990-91 Annual Plan
0.00 7903.08 1215.72 755.44 1971.16 15.28
1991-92 0.00 7903.08 687.21 1598.75 2285.96 11.54
Sub
Total 0.00 - 1902.93 2354.19 4257.12 26.82
1992-93
VIII Plan
0.05 7903.13 2087.44 946.30 3033.74 27.52
1993-94 0.00 7903.13 2234.60 966.34 3200.94 18.47
1994-95 0.00 7903.13 2507.71 794.06 3301.77 20.59
1995-96 0.00 7903.13 3421.30 765.91 4187.21 16.49
1996-97 0.00 7903.13 4225.85 632.17 4858.02 28.16
Sub
Total 0.05 - 14476.90 4104.78 18581.68 111.23
1997-98
IX Plan
941.83 8844.96 4890.61 671.59 5562.20 28.97
1998-99 956.91 9801.87 6512.15 426.60 6938.75 47.35
1999-00 192.44 9994.31 7911.60 335.91 8247.51 49.24
2000-01 325.88 10320.18 7953.84 541.81 8495.65 60.02
2001-02 728.81 11048.99 7663.83 903.80 8567.63 84.91
Sub
Total 3145.87 - 34932.03 2879.71 37811.74 270.49
2002-03
X Plan
1335.91 12384.90 8025.14 937.96 8963.10 98.39
2003-04 2090.03 14474.93 9017.32 570.41 9587.73 143.15
2004-05 2504.02 16978.95 11858.38 273.79 12132.17 173.34
2005-06 2745.13 19724.07 11098.10 283.51 11381.61 206.30
2006-07 4033.88 23757.95 11581.09 497.52 12078.61 238.27
Sub
Total 12708.97 - 51580.03 2563.19 54143.22 859.45
G. Total 15854.89 - 102891.89 11901.87 114793.76 1267.99

93
Table B12 : Capital Expenditure, Working Expenses and Gross receipts for Minor Irrigation Projects over 1990-2007
State : Jharkhand
(Rs. in lakhs) Year
Annual Plan/
5- Year Plan
Capital Expenditure Working Expenses Gross Receipts
during the
year
up to the end of
the year
direction and
admini-stration
expenses other than direction and ad-
ministration
total
1 2 3 4 5 6 7 8
0.00 0.00 0.00 0.00 0.00
0.00 0.00 0.00 0.00 0.00
0.00 0.00 0.00 0.00 0.00
0.00 0.00 0.00 0.00 0.00
0.00 0.00 0.00 0.00 0.00
0.00 0.00 0.00 0.00 0.00
0.00 0.00 0.00 0.00 0.00
IX Plan
0.00 0.00 0.00 0.00 0.00
0.00 0.00 0.00 0.00 0.00
0.00 0.00 0.00 0.00 0.00
2000-01 326.69 326.69 0.00 831.49 831.49 9.30
2001-02 3292.15 3618.84 0.00 2961.63 2961.63 14.83
Sub
Total 3618.84 - 0.00 3793.12 3793.12 24.13
2002-03
X Plan
2034.03 5652.87 0.00 2053.60 2053.60 21.78
2003-04 3350.92 9003.79 0.00 2882.09 2882.09 4.05
2004-05 2697.31 11701.10 0.00 2620.79 2620.79 15.26
2005-06 4215.67 15916.77 0.00 2998.12 2998.12 25.06
2006-07 4919.67 20836.44 0.00 3598.02 3598.02 68.58
Sub
Total 17217.60 - 0.00 14152.62 14152.62 134.73
G. Total 20836.44 - 0.00 17945.74 17945.74 158.86

94
Table B13 : Capital Expenditure, Working Expenses and Gross receipts for Minor Irrigation Projects over 1990-2007
State : Karnataka
(Rs. in lakhs) Year
Annual Plan/
5- Year Plan
Capital Expenditure Working Expenses Gross Receipts
during the
year
up to the end of
the year
direction and
admini-stration
expenses other than direction and ad-
ministration
total
1 2 3 4 5 6 7 8
1990-91 Annual Plan
2017.12 32830.54 702.75 3220.00 3922.75 68.64
1991-92 1760.66 34591.20 803.33 3805.88 4609.21 165.26
Sub
Total 3777.78 - 1506.08 7025.88 8531.96 233.90
1992-93
VIII Plan
3320.61 37911.81 962.42 4424.99 5387.41 111.38
1993-94 4287.64 42199.45 1043.30 3391.73 4435.03 70.40
1994-95 5357.18 47556.63 580.00 4481.11 5061.11 90.23
1995-96 4983.41 52540.04 146.10 4401.54 4547.64 122.08
1996-97 5619.14 58159.17 647.18 4883.55 5530.73 156.21
Sub
Total 23567.98 - 3379.00 21582.92 24961.92 550.30
1997-98
IX Plan
5098.60 63257.77 1276.71 5095.36 6372.07 294.53
1998-99 7652.04 70909.81 1249.25 5175.27 6424.52 238.99
1999-00 9499.05 80408.86 1528.23 6111.63 7639.86 202.61
2000-01 11217.52 91626.38 1023.30 7459.77 8483.07 332.04
2001-02 9139.31 100765.69 1751.05 6846.46 8597.51 317.69
Sub
Total 42606.52 - 6828.54 30688.49 37517.03 1385.86
2002-03
X Plan
10299.46 111065.15 1634.55 6632.84 8267.39 354.15
2003-04 10988.38 122053.53 2879.72 6011.02 8890.74 426.09
2004-05 19729.21 141782.74 1556.39 11776.25 13332.64 222.71
2005-06 17722.28 159505.02 3330.96 7202.14 10533.10 736.12
2006-07 36050.86 195555.88 3461.56 10563.57 14025.13 663.5
Sub
Total 94790.19 - 12863.18 42185.82 55049.00 2402.57
G. Total 164742.47 - 24576.80 101483.11 126059.91 4572.63

95
Table B14 : Capital Expenditure, Working Expenses and Gross receipts for Minor Irrigation Projects over 1990-2007
State : Kerala
(Rs. in lakhs) Year
Annual Plan/
5- Year Plan
Capital Expenditure Working Expenses Gross Receipts
during the
year
up to the end of
the year
direction and
admini-stration
expenses other than direction and ad-
ministration
total
1 2 3 4 5 6 7 8
1990-91 Annual Plan
647.33 6572.73 0.00 2120.53 2120.53 101.91
1991-92 704.61 7277.34 0.00 2255.71 2255.71 121.49
Sub
Total 1351.94 - 0.00 4376.24 4376.24 223.40
1992-93
VIII Plan
629.39 7906.74 0.00 1978.42 1978.42 51.08
1993-94 1246.37 9153.11 0.00 2915.38 2915.38 47.46
1994-95 1524.55 10677.66 0.00 3118.93 3118.93 56.24
1995-96 1136.47 11814.13 0.00 5153.81 5153.81 46.30
1996-97 2125.60 13939.73 0.00 4407.49 4407.49 100.15
Sub
Total 6662.38 - 0.00 17574.03 17574.03 301.23
1997-98
IX Plan
2241.09 16180.82 0.00 4021.87 4021.87 91.81
1998-99 1370.00 17550.82 0.00 6264.90 6264.90 47.58
1999-00 1722.39 19273.21 0.00 5981.55 5981.55 55.33
2000-01 1642.39 20915.60 0.00 5632.96 5632.96 69.15
2001-02 1225.10 22140.70 0.00 4871.11 4871.11 82.26
Sub
Total 8200.97 - 0.00 26772.39 26772.39 346.13
2002-03
X Plan
1402.42 23543.12 0.00 5558.77 5558.77 103.69
2003-04 1641.33 25184.45 0.00 6779.02 6779.02 138.33
2004-05 1366.82 26551.27 0.00 7902.30 7902.30 137.18
2005-06 1002.00 27553.27 0.00 8147.73 8147.73 145.66
2006-07 646.60 28199.87 0.00 7368.33 7368.33 187.93
Sub
Total 6059.17 - 0.00 35756.15 35756.15 712.79
G. Total 22274.46 - 0.00 84478.81 84478.81 1583.55

96
Table B15 : Capital Expenditure, Working Expenses and Gross receipts for Minor Irrigation Projects over 1990-2007
State : Madhya Pradesh
(Rs. in lakhs) Year
Annual Plan/
5- Year Plan
Capital Expenditure Working Expenses Gross Receipts
during the
year
up to the end of
the year
direction and
admini-stration
expenses other than direction and ad-
ministration
total
1 2 3 4 5 6 7 8
1990-91 Annual Plan
11371.16 113972.69 0.04 3641.42 3641.46 402.97
1991-92 10835.06 124807.75 0.60 2581.59 2582.19 584.71
Sub
Total 22206.22 - 0.64 6223.01 6223.65 987.68
1992-93
VIII Plan
10206.05 135013.80 0.70 5066.69 5067.39 1101.69
1993-94 8891.17 143904.97 1.98 5131.34 5133.32 898.27
1994-95 7031.29 150936.26 0.93 4725.49 4726.42 886.87
1995-96 8083.64 159019.90 0.00 4172.08 4172.08 774.38
1996-97 8579.84 167599.73 0.95 4268.25 4269.20 710.85
Sub
Total 42791.99 - 4.56 23363.85 23368.41 4372.06
1997-98
IX Plan
9463.41 177063.14 1.04 4867.20 4868.24 626.73
1998-99 10260.37 187323.35 0.99 3837.64 3838.63 528.44
1999-00 10453.30 197776.81 0.99 3941.23 3942.22 1718.32
2000-01 10807.39 16609.37 3.36 4271.91 4275.27 761.60
2001-02 13551.50 30160.87 3.14 3598.54 3601.68 1202.18
Sub
Total 54535.97 - 9.52 20516.52 20526.04 4837.27
2002-03
X Plan
17316.54 47477.41 0.33 3484.43 3484.76 1058.11
2003-04 17623.12 65100.53 0.00 4147.23 4147.23 721.76
2004-05 18524.32 83624.85 1.55 4511.31 4512.86 730.84
2005-06 23986.94 107611.79 5.95 5485.68 5491.63 775.65
2006-07 31679.53 139291.32 5.94 5880.00 5885.94 893.21
Sub
Total 109130.45 - 13.77 23508.65 23522.42 4179.57
G. Total 228664.63 - 28.49 73612.03 73640.52 14376.58

97
Table B16 : Capital Expenditure, Working Expenses and Gross receipts for Minor Irrigation Projects over 1990-2007
State : Maharashtra
(Rs. in lakhs) Year
Annual Plan/
5- Year Plan
Capital Expenditure Working Expenses Gross Receipts
during the
year
up to the end of
the year
direction and
admini-stration
expenses other than direction and ad-
ministration
total
1 2 3 4 5 6 7 8
1 2 3 4 5 6 7 8
1990-91 Annual Plan
7251.62 63671.87 159.13 9339.78 9498.91 611.43
1991-92 7351.60 70872.94 176.42 8881.90 9058.32 579.70
Sub
Total 14603.22 - 335.55 18221.68 18557.23 1191.13
1992-93
VIII Plan
10855.19 81728.13 199.39 13900.02 14099.41 1139.81
1993-94 16626.96 98355.09 483.32 16198.46 16681.78 1107.52
1994-95 23733.32 122088.41 1906.51 18299.67 20206.18 1701.17
1995-96 30414.34 152502.76 2473.42 21294.82 23768.24 1459.31
1996-97 28065.17 180567.93 2618.48 19048.88 21667.36 951.90
Sub
Total 109694.98 - 7681.12 88741.85 96422.97 6359.71
1997-98
IX Plan
29325.29 209893.22 2854.87 21163.15 24018.02 591.37
1998-99 24237.88 234131.10 3162.76 22046.03 25208.79 1985.22
1999-00 30157.80 264288.91 4885.47 11420.48 16305.95 524.38
2000-01 8455.35 272744.25 4662.18 19333.12 23995.30 569.14
2001-02 5051.44 277795.69 4232.67 18366.21 22598.88 555.21
Sub
Total 97227.76 - 19797.95 92328.99 112126.94 4225.32
2002-03
X Plan
6048.83 283844.52 4365.60 10237.14 14602.74 782.94
2003-04 16770.33 300614.85 5027.64 14429.44 19457.08 2070.33
2004-05 23654.97 324269.82 5571.01 16540.17 22111.18 3341.51
2005-06 16571.82 340842.04 5583.03 25492.75 31075.78 6547.21
2006-07 26816.32 367031.96 5823.46 37886.84 43710.30 5818.13
Sub
Total 89862.27 - 26370.74 104586.34 130957.08 18560.12
G. Total 532914.19 - 81999.98 503171.38 585171.36 42112.44

98
Table B17 : Capital Expenditure, Working Expenses and Gross receipts for Minor Irrigation Projects over 1990-2007
State : Manipur
(Rs. in lakhs) Year
Annual Plan/
5- Year Plan
Capital Expenditure Working Expenses Gross Receipts
during the
year
up to the end of
the year
direction and
admini-stration
expenses other than direction and ad-
ministration
total
1 2 3 4 5 6 7 8
1990-91 Annual Plan
0.00 1645.54 25.29 60.90 86.19 3.50
1991-92 0.00 1645.54 33.91 12.01 45.92 4.97
Sub
Total 0.00 - 59.20 72.91 132.11 8.47
1992-93
VIII Plan
0.00 1645.54 31.65 4.39 36.04 3.95
1993-94 423.03 2068.57 27.67 33.44 61.11 2.28
1994-95 472.63 2541.20 33.59 59.47 93.06 2.04
1995-96 556.91 3098.11 39.62 42.68 82.30 1.22
1996-97 444.28 3542.40 50.49 137.92 188.41 0.00
Sub
Total 1896.85 - 183.02 277.90 460.92 9.49
1997-98
IX Plan
452.38 3994.77 192.01 22.08 214.09 3.22
1998-99 318.24 4313.01 -97.76 374.91 277.15 0.38
1999-00 454.65 4767.66 90.93 420.31 511.24 4.54
2000-01 160.99 4928.65 81.85 230.81 312.66 6.95
2001-02 155.12 5083.76 215.75 410.53 626.28 0.29
Sub
Total 1541.38 - 482.78 1458.64 1941.42 15.38
2002-03
X Plan
180.42 5264.18 319.12 341.15 660.27 2.24
2003-04 571.72 5835.90 333.22 314.24 647.46 1.03
2004-05 335.70 6171.61 341.47 291.34 632.81 3.39
2005-06 1564.70 7736.31 462.34 265.81 728.15 8.27
2006-07 2331.47 10067.78 399.91 217.47 617.38 6.28
Sub
Total 4984.01 - 1856.06 1430.01 3286.07 21.21
G. Total 8422.24 - 2581.06 3239.46 5820.52 54.55

99
Table B18 : Capital Expenditure, Working Expenses and Gross receipts for Minor Irrigation Projects over 1990-2007
State : Meghalaya
(Rs. in lakhs) Year
Annual Plan/
5- Year Plan
Capital Expenditure Working Expenses Gross Receipts
during the
year
up to the end of
the year
direction and
admini-stration
expenses other than direction and ad-
ministration
total
1 2 3 4 5 6 7 8
1990-91 Annual Plan
121.63 614.25 153.11 249.84 402.95 1.76
1991-92 341.37 955.61 168.77 305.94 474.71 1.69
Sub
Total 463.00 - 321.88 555.78 877.66 3.45
1992-93
VIII Plan
348.68 1304.30 209.44 430.61 640.05 1.21
1993-94 348.89 1653.19 243.55 159.51 403.06 2.65
1994-95 230.51 1883.70 254.89 112.58 367.47 3.23
1995-96 388.58 2272.26 317.29 136.48 453.77 2.49
1996-97 364.35 2636.62 372.00 166.65 538.65 4.22
Sub
Total 1681.01 - 1397.17 1005.83 2403.00 13.80
1997-98
IX Plan
355.39 2992.02 480.22 260.67 740.89 2.94
1998-99 397.75 3389.76 515.42 241.90 757.32 5.55
1999-00 398.09 3787.85 565.51 149.55 715.06 4.66
2000-01 410.37 4198.22 619.66 278.57 898.23 3.34
2001-02 670.98 4869.21 657.97 186.09 844.06 7.25
Sub
Total 2232.58 - 2838.78 1116.78 3955.56 23.74
2002-03
X Plan
449.50 5318.71 654.50 184.54 839.04 6.93
2003-04 325.94 5644.65 696.88 202.80 899.68 5.92
2004-05 402.68 6047.33 740.22 290.01 1030.23 3.62
2005-06 300.96 6348.29 814.43 384.45 1198.88 2.85
2006-07 312.37 6660.66 887.60 434.15 1321.75 9.12
Sub
Total 1791.45 - 3793.63 1495.95 5289.58 28.44
G. Total 6168.04 - 8351.46 4174.34 12525.80 69.43

100
Table B19 : Capital Expenditure, Working Expenses and Gross receipts for Minor Irrigation Projects over 1990-2007
State : Mizoram
(Rs. in lakhs) Year
Annual Plan/
5- Year Plan
Capital Expenditure Working Expenses Gross Receipts
during the
year
up to the end of
the year
direction and
admini-stration
expenses other than direction and ad-
ministration
total
1 2 3 4 5 6 7 8
1990-91 Annual Plan
0.00 0.00 108.91 167.84 276.75 4.16
1991-92 0.00 0.00 149.07 164.96 314.03 0.00
Sub
Total 0.00 - 257.98 332.80 590.78 4.16
1992-93
VIII Plan
0.00 0.00 113.83 177.15 290.98 7.79
1993-94 236.76 236.76 64.01 0.00 64.01 1.49
1994-95 3.99 240.75 102.63 165.20 267.83 5.84
1995-96 0.00 240.75 106.70 148.27 254.97 2.18
1996-97 326.20 566.94 0.00 227.98 227.98 0.27
Sub
Total 566.95 - 387.17 718.60 1105.77 17.57
1997-98
IX Plan
97.86 664.81 0.00 143.36 143.36 4.18
1998-99 345.97 1010.78 0.00 186.59 186.59 0.54
1999-00 661.87 1672.65 0.00 379.48 379.48 1.64
2000-01 253.69 1926.34 0.00 284.02 284.02 6.31
2001-02 399.99 2326.33 192.51 81.89 274.40 4.06
Sub
Total 1759.38 - 192.51 1075.34 1267.85 16.73
2002-03
X Plan
370.00 2696.32 210.54 117.45 327.99 1.36
2003-04 1152.32 3848.64 254.56 109.50 364.06 5.48
2004-05 1210.68 5059.32 239.76 51.00 290.76 2.97
2005-06 1201.00 6260.32 229.16 516.98 746.14 2.60
2006-07 3005.90 9266.22 223.64 3.90 227.54 0.09
Sub
Total 6939.90 - 1157.66 798.83 1956.49 12.50
G. Total 9266.23 - 1995.32 2925.57 4920.89 50.96
- -

101
Table B20 : Capital Expenditure, Working Expenses and Gross receipts for Minor Irrigation Projects over 1990-2007
State : Nagaland
(Rs. in lakhs) Year
Annual Plan/
5- Year Plan
Capital Expenditure Working Expenses Gross Receipts
during the
year
up to the end of
the year
direction and
admini-stration
expenses other than direction and ad-
ministration
total
1 2 3 4 5 6 7 8
1990-91 Annual Plan
0.00 187.35 99.09 350.85 449.94 4.13
1991-92 0.00 187.35 86.44 440.22 526.66 2.83
Sub
Total 0.00 - 185.53 791.07 976.60 6.96
1992-93
VIII Plan
0.00 187.35 77.50 434.02 511.52 3.06
1993-94 0.00 187.35 93.44 508.87 602.31 0.14
1994-95 0.00 187.35 152.04 362.16 514.20 1.40
1995-96 0.00 187.35 123.70 537.41 661.11 1.39
1996-97 0.00 187.35 179.60 637.59 817.19 1.02
Sub
Total 0.00 - 626.28 2480.05 3106.33 7.01
1997-98
IX Plan
0.00 187.35 151.27 862.63 1013.90 1.91
1998-99 0.00 187.35 186.43 398.79 585.22 0.08
1999-00 0.00 187.35 0.00 48.36 48.36 0.00
2000-01 0.00 187.35 207.51 1027.31 1234.82 0.35
2001-02 0.00 187.35 254.16 1092.46 1346.62 0.87
Sub
Total 0.00 - 799.37 3429.55 4228.92 3.21
2002-03
X Plan
519.98 707.33 252.64 1093.23 1345.87 0.50
2003-04 1.00 708.33 315.06 1817.49 2132.55 1.46
2004-05 107.52 815.85 312.48 1908.05 2220.53 3.41
2005-06 81.95 897.80 354.78 2152.43 2507.21 0.68
2006-07 96.25 994.05 447.84 2881.64 3329.48 0.39
Sub
Total 806.70 - 1682.80 9852.84 11535.64
G. Total 806.70 - 3293.98 16553.51 19847.49 17.18

102
Table B21 : Capital Expenditure, Working Expenses and Gross receipts for Minor Irrigation Projects over 1990-2007
State : Orissa
(Rs. in lakhs) Year
Annual Plan/
5- Year Plan
Capital Expenditure Working Expenses Gross Receipts
during the
year
up to the end of
the year
direction and
admini-stration
expenses other than direction and ad-
ministration
total
1 2 3 4 5 6 7 8
1990-91 Annual Plan
2452.22 28440.33 257.90 2666.49 2924.39 80.34
1991-92 2788.45 31228.78 353.90 3308.15 3662.05 85.52
Sub
Total 5240.67 - 611.80 5974.64 6586.44 165.86
1992-93
VIII Plan
2541.05 33769.83 435.57 4034.34 4469.91 74.02
1993-94 2078.70 35848.53 491.63 4653.78 5145.41 86.48
1994-95 2532.23 38380.76 544.05 4098.30 4642.35 76.83
1995-96 2915.69 41296.45 639.74 5539.14 6178.88 191.83
1996-97 2981.16 44277.61 953.10 9368.08 10321.18 200.79
Sub
Total 13048.83 - 3064.09 27693.64 30757.73 629.95
1997-98
IX Plan
3637.68 47915.29 969.32 5459.71 6429.03 189.38
1998-99 3299.45 51214.74 1558.09 6361.41 7919.50 243.62
1999-00 5702.36 56917.10 1344.35 5716.12 7060.47 259.48
2000-01 4621.49 61538.59 1633.52 5968.14 7601.66 127.30
2001-02 4662.56 66201.15 1340.52 6570.40 7910.92 170.33
Sub
Total 21923.54 - 6845.80 30075.78 36921.58 990.11
2002-03
X Plan
3278.19 69479.34 1388.46 6884.20 8272.66 198.40
2003-04 3531.30 73010.64 1529.15 6004.39 7533.54 377.54
2004-05 3853.19 76863.83 1173.92 7878.09 9052.01 380.88
2005-06 6679.37 83543.20 1087.14 7074.62 8161.76 481.48
2006-07 6339.62 89882.82 1102.27 7358.79 8461.06 445.96
Sub
Total 23681.67 - 6280.94 35200.09 41481.03 1884.26
G. Total 63894.71 - 16802.63 98944.15 115746.78 3670.18

103
Table B22 : Capital Expenditure, Working Expenses and Gross receipts for Minor Irrigation Projects over 1990-2007
State : Punjab
(Rs. in lakhs) Year
Annual Plan/
5- Year Plan
Capital Expenditure Working Expenses Gross Receipts
during the
year
up to the end of
the year
direction and
admini-stration
expenses other than direction and ad-
ministration
total
1 2 3 4 5 6 7 8
1990-91 Annual Plan
795.75 5882.08 0.00 1968.72 1968.72 28.63
1991-92 653.19 6535.27 0.00 2053.22 2053.22 31.53
Sub
Total 1448.94 - 0.00 4021.94 4021.94 60.16
1992-93
VIII Plan
793.98 7329.25 0.00 2033.33 2033.33 13.84
1993-94 894.75 8224.00 0.00 2484.43 2484.43 15.78
1994-95 1093.87 9317.88 0.00 2639.34 2639.34 25.42
1995-96 986.97 10304.85 0.00 2260.93 2260.93 28.46
1996-97 1001.05 11305.90 0.00 2442.92 2442.92 22.82
Sub
Total 4770.62 - 0.00 11860.95 11860.95 106.32
1997-98
IX Plan
1139.03 12444.93 165.60 2011.94 2177.54 1074.31
1998-99 1653.05 14097.97 216.63 2608.01 2824.64 10.99
1999-00 1473.46 15571.44 239.86 3601.29 3841.15 11.93
2000-01 1348.14 16919.58 353.87 4649.19 5003.06 41.18
2001-02 1233.01 18152.59 0.00 5626.50 5626.50 11.69
Sub
Total 6846.69 - 975.96 18496.93 19472.89 1150.10
2002-03
X Plan
835.49 18988.07 0.00 4613.60 4613.60 13.34
2003-04 945.97 19934.04 0.00 4414.09 4414.09 13.58
2004-05 1503.65 21437.69 0.00 9526.73 9526.73 17.67
2005-06 2507.69 23945.38 0.00 8217.94 8217.94 18.09
2006-07 2685.45 26630.83 0.00 4366.33 4366.33 12.72
Sub
Total 8478.25 - 0.00 31138.69 31138.69 75.40
G. Total 21544.50 - 975.96 65518.51 66494.47 1391.98

104
Table B23 : Capital Expenditure, Working Expenses and Gross receipts for Minor Irrigation Projects over 1990-2007
State : Rajasthan
(Rs. in lakhs) Year
Annual Plan/
5- Year Plan
Capital Expenditure Working Expenses Gross Receipts
during the
year
up to the end of
the year
direction and
admini-stration
expenses other than direction and ad-
ministration
total
1 2 3 4 5 6 7 8
1990-91 Annual Plan
1978.38 23425.99 0.00 4355.44 4355.44 701.99
1991-92 2850.92 26276.90 0.00 4170.36 4170.36 895.01
Sub
Total 4829.30 - 0.00 8525.80 8525.80 1597.00
1992-93
VIII Plan
3255.82 29532.73 0.00 4231.98 4231.98 914.09
1993-94 3352.55 32885.28 2.10 5188.49 5190.59 1143.51
1994-95 2779.91 35665.18 3.72 5237.61 5241.33 1711.82
1995-96 4502.74 40167.93 6.39 5094.72 5101.11 2321.00
1996-97 3896.93 44064.85 10.39 5506.92 5517.31 2131.78
Sub
Total 17787.95 - 22.60 25259.72 25282.32 8222.20
1997-98
IX Plan
3016.79 47081.65 10.02 5562.52 5572.54 1609.26
1998-99 4322.00 51403.65 12.99 6744.78 6757.77 1847.47
1999-00 3596.67 55000.32 0.00 6562.53 6562.53 918.79
2000-01 3503.72 58504.04 0.00 7858.13 7858.13 2157.50
2001-02 8599.44 67103.48 0.00 6815.79 6815.79 1915.64
Sub
Total 23038.62 - 23.01 33543.75 33566.76 8448.66
2002-03
X Plan
5699.10 72802.57 0.00 5987.18 5987.18 2672.83
2003-04 5445.45 78248.03 0.00 5895.18 5895.18 1823.15
2004-05 6336.59 84584.62 0.00 6688.71 6688.71 2606.73
2005-06 20050.53 104635.15 0.00 6245.63 6245.63 1842.11
2006-07 16214.87 120850.02 0.00 6818.12 6818.12 1537.27
Sub
Total 53746.54 - 0.00 31634.82 31634.82 10482.09
G. Total 99402.41 - 45.61 98964.09 99009.70 28749.95

105
Table B24 : Capital Expenditure, Working Expenses and Gross receipts for Minor Irrigation Projects over 1990-2007
State : Sikkim
(Rs. in lakhs) Year
Annual Plan/
5- Year Plan
Capital Expenditure Working Expenses Gross Receipts
during the
year
up to the end of
the year
direction and
admini-stration
expenses other than direction and ad-
ministration
total
1 2 3 4 5 6 7 8
1990-91 Annual Plan
0.00 0.00 31.08 163.18 194.26 0.77
1991-92 0.00 0.00 43.40 199.48 242.88 1.86
Sub
Total 0.00 - 74.48 362.66 437.14 2.63
1992-93
VIII Plan
0.00 0.00 49.73 190.84 240.57 1.72
1993-94 0.00 0.00 52.65 159.81 212.46 0.12
1994-95 0.00 0.00 57.71 209.87 267.58 0.19
1995-96 0.00 0.00 65.20 613.34 678.54 0.31
1996-97 4.96 4.96 76.98 233.67 310.65 0.79
Sub
Total 4.96 - 302.27 1407.53 1709.80 3.13
1997-98
IX Plan
2.48 7.44 80.28 147.76 228.04 1.29
1998-99 2.05 9.49 157.30 68.04 225.34 0.00
1999-00 1.99 11.48 161.05 100.13 261.18 1.91
2000-01 307.08 318.56 178.60 319.48 498.08 22.60
2001-02 515.88 834.44 205.02 463.45 668.47 8.24
Sub
Total 829.48 - 782.25 1098.86 1881.11 34.04
2002-03
X Plan
290.84 1125.29 243.34 231.61 474.95 3.76
2003-04 2.93 1128.21 275.88 181.08 456.96 6.11
2004-05 0.00 1128.21 292.89 166.81 459.70 19.25
2005-06 3.70 1131.91 349.66 218.07 567.73 30.51
2006-07 3.01 1134.91 354.29 417.54 771.83 19.14
Sub
Total 300.48 - 1516.06 1215.11 2731.17 78.77
G. Total 1134.92 - 2675.06 4084.16 6759.22 118.57

106
Table B25 : Capital Expenditure, Working Expenses and Gross receipts for Minor Irrigation Projects over 1990-2007
State : Tamil Nadu
(Rs. in lakhs) Year
Annual Plan/
5- Year Plan
Capital Expenditure Working Expenses Gross Receipts
during the
year
up to the end of
the year
direction and
admini-stration
expenses other than direction and ad-
ministration
total
1 2 3 4 5 6 7 8
1990-91 Annual Plan
152.18 2201.18 0.00 3269.75 3269.75 222.83
1991-92 234.40 2435.58 0.00 3760.35 3760.35 209.44
Sub
Total 386.58 - 0.00 7030.10 7030.10 432.27
1992-93
VIII Plan
314.35 2749.93 0.00 3978.64 3978.64 231.61
1993-94 542.90 3292.83 0.00 3861.13 3861.13 218.97
1994-95 621.91 3798.74 0.00 5192.42 5192.42 258.09
1995-96 1699.28 5498.03 0.00 4925.81 4925.81 322.69
1996-97 1041.25 6539.27 78.82 4108.23 4187.05 270.32
Sub
Total 4219.69 - 78.82 22066.23 22145.05 1301.68
1997-98
IX Plan
1253.56 7792.83 278.55 4815.93 5094.48 235.59
1998-99 2161.91 9954.74 227.41 6525.89 6753.30 245.70
1999-00 2139.28 12101.39 267.81 5404.49 5672.30 284.12
2000-01 1490.77 13592.16 298.01 4745.27 5043.28 286.99
2001-02 1094.12 14686.60 301.65 2606.52 2908.17 296.66
Sub
Total 8139.64 - 1373.43 24098.10 25471.53 1349.06
2002-03
X Plan
4154.06 18997.79 254.91 3172.02 3426.93 316.78
2003-04 4636.39 23634.18 306.12 3496.66 3802.78 696.75
2004-05 9296.87 32931.05 232.23 5518.30 5750.53 346.37
2005-06 6368.84 39299.89 108.08 4449.34 4557.42 215.65
2006-07 11596.27 50896.16 112.00 4680.08 4792.08 157.00
Sub
Total 36052.43 - 1013.34 21316.40 22329.74 1732.55
G. Total 61544.25 - 3917.84 127705.26 131623.10 7898.57

107
Table B26 : Capital Expenditure, Working Expenses and Gross receipts for Minor Irrigation Projects over 1990-2007
State : Tripura
(Rs. in lakhs) Year
Annual Plan/
5- Year Plan
Capital Expenditure Working Expenses Gross Receipts
during the
year
up to the end of
the year
direction and
admini-stration
expenses other than direction and ad-
ministration
total
1 2 3 4 5 6 7 8
1990-91 Annual Plan
0.00 2520.40 231.58 815.15 1046.73 1.64
1991-92 0.00 2520.84 275.91 695.23 971.14 1.21
Sub
Total 0.00 - 507.49 1510.38 2017.87 2.85
1992-93
VIII Plan
0.00 2520.84 268.86 611.43 880.29 0.63
1993-94 0.00 2520.84 343.37 398.96 742.33 0.42
1994-95 0.00 2520.84 1005.93 346.31 1352.24 0.41
1995-96 0.00 2520.84 478.37 469.04 947.41 0.89
1996-97 0.00 2520.84 538.98 422.82 961.80 2.45
Sub
Total 0.00 - 2635.51 2248.56 4884.07 4.80
1997-98
IX Plan
0.00 2520.84 673.01 954.43 1627.44 1.49
1998-99 0.00 2520.84 314.57 1380.42 1694.99 4.18
1999-00 1423.73 3944.57 866.70 -187.31 679.39 5.48
2000-01 1672.86 5617.43 988.88 281.38 1270.26 3.08
2001-02 2391.97 8009.40 985.08 552.57 1537.65 3.85
Sub
Total 5488.56 - 3828.24 2981.49 6809.73 18.08
2002-03
X Plan
2932.65 10942.05 1065.16 606.41 1671.57 9.53
2003-04 1975.64 12917.69 1198.00 446.06 1644.06 16.18
2004-05 1328.40 14246.09 1232.87 -647.94 584.93 12.33
2005-06 2196.51 16442.59 1246.41 528.98 1775.39 29.76
2006-07 4198.42 20641.01 1231.26 5.67 1236.93 25.22
Sub
Total 12631.62 - 5973.70 939.18 6912.88 93.02
G. Total 18120.18 - 12944.94 7679.61 20624.55 118.75

108
Table B27 : Capital Expenditure, Working Expenses and Gross receipts for Minor Irrigation Projects over 1990-2007
State : Uttar Pradesh
(Rs. in lakhs) Year
Annual Plan/
5- Year Plan
Capital Expenditure Working Expenses Gross Receipts
during the
year
up to the end of
the year
direction and
admini-stration
expenses other than direction and ad-
ministration
total
1 2 3 4 5 6 7 8
1990-91 Annual Plan
6374.41 109933.36 0.00 23738.76 23738.76 874.52
1991-92 4254.86 114188.23 0.00 30116.61 30116.61 1432.78
Sub
Total 10629.27 - 0.00 53855.37 53855.37 2307.30
1992-93
VIII Plan
6804.62 120992.85 0.00 0.00 0.00 0.00
1993-94 2399.08 123391.93 0.00 39226.82 39226.82 2191.03
1994-95 7547.40 130939.33 0.00 52101.56 52101.56 3124.66
1995-96 -6122.49 124816.84 0.00 60971.73 60971.73 4058.29
1996-97 5548.50 130365.33 0.00 72331.39 72331.39 3675.42
Sub
Total 16177.11 - 0.00 224631.50 224631.50 13049.40
1997-98
IX Plan
-60.60 130304.73 0.00 56790.93 56790.93 3409.58
1998-99 910.11 131214.84 0.00 62172.23 62172.23 3508.53
1999-00 419.74 131634.58 0.00 12916.10 12916.10 3661.48
2000-01* 222.78 222.78 0.00 13086.65 13086.65 1895.94
2001-02 1029.42 1252.20 0.00 27619.90 27619.90 1773.12
Sub
Total 2521.45 - 0.00 172585.81 172585.81 14248.65
2002-03
X Plan
1863.69 3115.89 0.00 28118.18 28118.18 1211.20
2003-04 2965.67 6081.56 0.00 24505.21 24505.21 1852.70
2004-05 5913.21 11994.77 0.00 28645.20 28645.20 1252.58
2005-06 10597.75 22592.52 0.00 35007.88 35007.88 2121.04
2006-07 23522.00 46114.52 0.00 55008.35 55008.35 3301.81
Sub
Total 44862.32 - 0.00 171284.82 171284.82 9739.33
G. Total 74190.15 - 0.00 622357.50 622357.50 39344.68

109
Table B28 : Capital Expenditure, Working Expenses and Gross receipts for Minor Irrigation Projects over 1990-2007
State : Uttarakhand
(Rs. in lakhs) Year
Annual Plan/
5- Year Plan
Capital Expenditure Working Expenses Gross Receipts
during the
year
up to the end of
the year
direction and
admini-stration
expenses other than direction and ad-
ministration
total
1 2 3 4 5 6 7 8
IX Plan
2000-01* 0.26 0.26 0.00 240.84 240.84 9.09
2001-02 -17.14 -16.88 0.00 3710.80 3710.80 12.17
Sub
Total -16.88 - 0.00 3951.64 3951.64 21.26
2002-03
X Plan
0.00 -16.88 0.00 5254.83 5254.83 21.59
2003-04 4098.06 4081.18 0.00 3528.13 3528.13 64.91
2004-05 5722.06 9803.24 0.00 4485.80 4485.80 101.49
2005-06 11899.60 21702.84 0.00 5405.40 5405.40 92.38
2006-07 14003.60 35706.44 0.00 3978.81 3978.81 119.84
Sub
Total 35723.32 - 0.00 22652.97 22652.97 400.21
G. Total 35706.44 - 0.00 26604.61 26604.61 421.47

110
Table B29 : Capital Expenditure, Working Expenses and Gross receipts for Minor Irrigation Projects over 1990-2007
State : West Bengal
(Rs. in lakhs) Year
Annual Plan/
5- Year Plan
Capital Expenditure Working Expenses Gross Receipts
during the
year
up to the end of
the year
direction and
admini-stration
expenses other than direction and ad-
ministration
Total
1 2 3 4 5 6 7 8
1990-91 Annual Plan
2381.99 17621.56 953.40 6903.32 7856.72 325.16
1991-92 1780.23 19401.79 872.29 6393.56 7265.85 413.10
Sub
Total 4162.22 - 1825.69 13296.88 15122.57 738.26
1992-93
VIII Plan
2139.00 21540.79 1030.81 7111.65 8142.46 478.09
1993-94 5040.36 26581.15 1283.50 8934.66 10218.16 467.02
1994-95 2000.88 28582.03 1364.78 8578.14 9942.92 528.75
1995-96 1472.52 30054.55 1460.88 8066.32 9527.20 505.56
1996-97 4389.37 34443.92 1776.32 11240.02 13016.34 577.51
Sub
Total 15042.13 - 6916.29 43930.79 50847.08 2556.93
1997-98
IX Plan
876.62 35320.54 2189.87 13782.41 15972.28 536.60
1998-99 3049.27 38369.81 3531.92 17073.51 20605.43 651.22
1999-00 4304.35 42674.16 3286.18 22563.43 25849.61 665.55
2000-01 1594.28 44268.44 3571.60 29769.81 33341.41 623.46
2001-02 830.52 45098.96 3551.52 25245.10 28796.62 737.39
Sub
Total 10655.04 - 16131.09 108434.26 124565.35 3214.22
2002-03
X Plan
1024.11 46123.07 3620.98 19617.06 23238.04 691.81
2003-04 3213.41 49336.48 3540.09 20561.21 24101.30 1628.17
2004-05 3207.29 52543.77 3500.83 20410.74 23911.57 2115.40
2005-06 3534.87 56078.65 3563.36 22750.91 26314.27 1925.04
2006-07 2712.20 58790.85 3627.72 23678.12 27305.84 1890.49
Sub
Total 13691.88 - 17852.98 107018.04 124871.02 8250.91
G. Total 43551.27 - 42726.05 272679.97 315406.02 14760.32

111
Table B30 : Capital Expenditure, Working Expenses and Gross receipts for Minor Irrigation Projects over 1990-2007
State : Goa
(Rs. in lakhs) Year
Annual Plan/
5- Year Plan
Capital Expenditure Working Expenses Gross Receipts
during the
year
up to the end of
the year
direction and
admini-stration
expenses other than direction and ad-
ministration
total
1 2 3 4 5 6 7 8
1990-91 Annual Plan
0.00 0.00 24.33 99.63 123.96 7.16
1991-92 0.00 0.00 19.58 105.72 125.30 9.19
Sub
Total 0.00 - 43.91 205.35 249.26 16.35
1992-93
VIII Plan
0.00 0.00 31.60 118.95 150.55 10.97
1993-94 0.00 0.00 40.15 137.20 177.35 15.51
1994-95 253.72 3125.31 55.64 161.53 217.17 19.80
1995-96 320.60 3445.90 60.68 211.51 272.19 15.54
1996-97 415.27 3861.18 86.97 312.76 399.73 13.48
Sub
Total 989.59 - 275.04 941.95 1216.99 75.30
1997-98
IX Plan
286.93 4148.11 93.53 302.64 396.17 19.16
1998-99 473.94 4642.05 116.58 457.16 573.74 15.56
1999-00 691.45 5313.50 115.93 547.30 663.23 15.08
2000-01 318.32 5631.82 188.93 773.41 962.34 35.45
2001-02 266.59 5898.40 161.62 531.59 693.21 19.60
Sub
Total 2037.23 - 676.59 2612.10 3288.69 104.85
2002-03
X Plan
951.28 6849.68 127.08 561.87 688.95 1130.80
2003-04 2279.52 9129.20 57.17 557.01 614.18 180.65
2004-05 2170.52 11299.72 73.45 653.77 727.22 258.43
2005-06 2331.92 13631.64 104.15 945.67 1049.82 148.24
2006-07 1890.64 15522.29 144.58 988.02 1132.60 77.63
Sub
Total 9623.88 - 506.43 3706.34 4212.77 1795.75
G. Total 12650.70 - 1501.97 7465.74 8967.71 1992.25

112
Table B31 : Capital Expenditure, Working Expenses and Gross receipts for Minor Irrigation Projects over 1990-2007
State : Pondicherry
(Rs. in lakhs) Year
Annual Plan/
5- Year Plan
Capital Expenditure Working Expenses Gross Receipts
during the
year
up to the end of
the year
direction and
admini-stration
expenses other than direction and ad-
ministration
total
1 2 3 4 5 6 7 8
1990-91 Annual Plan
0.00 0.00 0.00 246.88 246.88 6.02
1991-92 0.00 0.00 0.00 304.35 304.35 25.56
Sub
Total 0.00 - 0.00 551.23 551.23 31.58
1992-93
VIII Plan
0.00 0.00 0.00 315.18 315.18 16.57
1993-94 0.00 0.00 0.00 334.85 334.85 12.16
1994-95 0.00 0.00 0.00 389.27 389.27 13.53
1995-96 0.00 0.00 0.00 946.24 946.24 10.08
1996-97 0.00 0.00 0.00 484.68 484.68 12.05
Sub
Total 0.00 - 0.00 2470.22 2470.22 64.39
1997-98
IX Plan
0.00 0.00 0.00 590.19 590.19 10.45
1998-99 0.00 0.00 0.00 774.97 774.97 14.30
1999-00 24.00 24.00 0.00 910.17 910.17 28.73
2000-01 2.22 26.22 0.00 985.74 985.74 22.44
2001-02 300.22 326.44 0.00 1030.72 1030.72 12.87
Sub
Total 326.44 - 0.00 4291.79 4291.79 88.79
2002-03
X Plan
769.56 1096.00 0.00 1047.49 1047.49 17.05
2003-04 235.53 1331.53 0.00 1139.43 1139.43 21.82
2004-05 1151.00 2482.53 0.00 1700.47 1700.47 25.62
2005-06 521.44 3003.97 0.00 1571.90 1571.90 12.68
2006-07 397.52 3401.49 0.00 1654.05 1654.05 20.62
Sub
Total 3075.05 - 0.00 7113.34 7113.34 97.79G. Total 3401.49 - 0.00 14426.58 14426.58 282.55

113
Table B32 : Capital Expenditure, Working Expenses and Gross receipts for Minor Irrigation Projects over 1990-2007
Union Government
(Rs. in lakhs) Year
Annual Plan/
5- Year Plan
Capital Expenditure Working Expenses Gross Receipts
during the
year
up to the end of
the year
direction and
admini-stration
expenses other than direction and ad-
ministration
total
1 2 3 4 5 6 7 8
1990-91 Annual Plan
108.60 1245.95 48.93 3659.47 3708.40 68.49
1991-92 0.00 0.00 0.00 0.00 0.00 0.00
Sub
Total 108.60 - 48.93 3659.47 3708.40 68.49
1992-93
VIII Plan
131.46 1556.34 61.43 3896.83 3958.26 62.23
1993-94 99.67 1656.01 54.74 9594.89 9649.63 91.07
1994-95* 343.69 709.01 34.45 5419.88 5454.33 76.72
1995-96 395.51 1104.52 43.14 5316.32 5359.46 51.18
1996-97 525.72 1630.24 41.03 6763.21 6804.24 79.49
Sub
Total 1496.05 - 234.79 30991.13 31225.92 360.69
1997-98
IX Plan
659.57 2289.81 68.67 7122.65 7191.32 2208.42
1998-99 223.79 2513.60 81.19 8354.73 8435.92 134.44
1999-00 141.53 2655.13 82.20 9316.60 9398.80 414.76
2000-01 87.08 2742.21 92.29 10363.08 10455.37 175.62
2001-02 224.11 2966.32 110.01 14782.10 14892.11 173.83
Sub
Total 1336.08 - 434.36 49939.16 50373.52 3107.07
2002-03
X Plan
274.05 3240.37 106.55 12260.60 12367.15 207.51
2003-04 288.87 3529.24 188.62 11355.43 11544.05 117.65
2004-05 301.89 3831.13 130.34 10682.73 10813.07 143.69
2005-06 382.72 4213.85 106.01 11223.29 11329.30 44.99
2006-07 480.75 4694.60 139.03 11310.74 11449.77 53.69
Sub
Total 1728.28 - 670.55 56832.79 57503.34 567.53
G. Total 4669.01 - 1388.63 141422.55 142811.18 4103.78

114
Table C1 : Capital Expenditure, Working Expenses and Gross receipts for Command
Area Development Programme over 1990-2007
All-India
(Rs. in lakhs)
Year
Annual Plan/
5- Year Plan
Capital Expenditure Working Expenses Gross Receipts
during the
year
up to the end of
the year
direction and
admini-stration
expenses other than direction and adm-inistration
total
1 2 3 4 5 6 7 8
1990-91 AnnualPlan
6965.44 46180.29 48.65 20449.54 20498.19 0.00
1991-92 7211.84 53392.14 52.80 20957.59 21010.39 0.00
Sub
Total 14177.28 - 101.45 41407.13 41508.58 0.00
1992-93
VIII Plan
8303.63 60604.48 59.61 21010.68 21070.29 0.00
1993-94 7110.52 68880.37 60.44 24664.73 24725.17 0.00
1994-95 8338.36 77218.73 73.09 26727.40 26800.49 0.00
1995-96 8970.28 86189.00 84.97 33641.61 33726.58 0.00
1996-97 13502.03 99691.03 81.71 29734.17 29815.88 0.00
Sub
Total 46224.82 - 359.82 135778.59 136138.41 0.00
1997-98
IX Plan
10968.67 110659.69 103.67 31666.90 31770.57 0.00
1998-99 11954.24 122613.92 138.74 33426.30 33565.04 0.00
1999-00 10930.36 133544.29 167.38 35471.46 35638.84 0.00
2000-01 15743.48 147615.93 119.67 39320.16 39439.83 0.00
2001-02 15225.72 162838.65 117.68 35416.25 35533.93 0.00
Sub
Total 64822.47 - 647.14 175301.07 175948.21 0.00
2002-03
X Plan
9701.33 172539.98 2259.60 44229.52 46489.12 0.00
2003-04 7746.93 180820.92 251.40 42758.57 43009.97 0.00
2004-05 13949.64 194770.54 284.96 36060.42 36345.38 0.00
2005-06 16559.13 211329.68 4931.70 37399.51 42331.21 0.00
2006-07 17294.87 228624.56 5790.82 40361.43 46152.25 0.00
Sub
Total 65251.90 - 13518.48 200809.45 214327.93 0.00
G. Total 190476.47 - 14626.89 553296.24 567923.13 0.00

115
Table C2 : Capital Expenditure, Working Expenses and Gross receipts for Command
Area Development Programme over 1990-2007
State : Andhra Pradesh
(Rs. in lakhs)
Year
Annual Plan/
5- Year Plan
Capital Expenditure Working Expenses Gross Receipts
during the
year
up to the end of
the year
direction and
admini-stration
expenses other than direction and adm-inistration
total
1 2 3 4 5 6 7 8
1990-91 AnnualPlan
388.16 6308.70 24.40 254.17 278.57 0.00
1991-92 460.90 6769.61 27.28 257.41 284.69 0.00
Sub
Total 849.06 - 51.68 511.58 563.26 0.00
1992-93
VIII Plan
1627.10 8396.70 29.71 280.30 310.01 0.00
1993-94 2175.29 10571.99 32.28 414.18 446.46 0.00
1994-95 2385.87 12957.86 40.20 430.62 470.82 0.00
1995-96 658.85 13616.71 40.71 460.36 501.07 0.00
1996-97 714.07 14330.78 39.97 472.86 512.83 0.00
Sub
Total 7561.18 - 182.87 2058.32 2241.19 0.00
1997-98
IX Plan
466.03 14796.80 57.60 514.10 571.70 0.00
1998-99 264.74 15061.55 87.51 441.00 528.51 0.00
1999-00 589.80 15651.35 115.36 516.76 632.12 0.00
2000-01 890.12 16541.47 90.82 573.39 664.21 0.00
2001-02 1275.32 17816.79 89.08 310.44 399.52 0.00
Sub
Total 3486.01 - 440.37 2355.69 2796.06 0.00
2002-03
X Plan
1065.14 18881.93 86.52 403.25 489.77 0.00
2003-04 10.49 18892.42 89.45 472.55 562.00 0.00
2004-05 107.35 18999.77 82.82 530.34 613.16 0.00
2005-06 789.88 19789.65 100.43 650.83 751.26 0.00
2006-07 1336.42 21126.07 101.24 527.97 629.21 0.00
Sub
Total 3309.28 - 460.46 2584.94 3045.40 0.00
G. Total 15205.53 - 1135.38 7510.53 8645.91 0.00

116
Table C3 : Capital Expenditure, Working Expenses and Gross receipts for Command
Area Development Programme over 1990-2007
State : Arunachal Pradesh
(Rs. in lakhs)
Year
Annual Plan/
5- Year Plan
Capital Expenditure Working Expenses Gross Receipts
during the
year
up to the end of
the year
direction and
admini-stration
expenses other than direction and adm-inistration
total
1 2 3 4 5 6 7 8
1990-91 AnnualPlan
0.00 0.00 0.00 8.90 8.90 0.00
1991-92 0.00 0.00 0.00 22.52 22.52 0.00
Sub
Total 0.00 - 0.00 31.42 31.42 0.00
1992-93
VIII Plan
0.00 0.00 0.00 35.65 35.65 0.00
1993-94 0.00 0.00 0.00 40.01 40.01 0.00
1994-95 0.00 0.00 0.00 41.00 41.00 0.00
1995-96 0.00 0.00 0.00 46.71 46.71 0.00
1996-97 0.00 0.00 0.00 0.00 0.00 0.00
Sub
Total 0.00 - 0.00 163.37 163.37 0.00
1997-98
IX Plan
0.00 0.00 0.00 0.00 0.00 0.00
1998-99 0.00 0.00 0.00 0.00 0.00 0.00
1999-00 0.00 0.00 0.00 100.00 100.00 0.00
2000-01 0.00 0.00 0.00 93.75 93.75 0.00
2001-02 0.00 0.00 0.00 210.02 210.02 0.00
Sub
Total 0.00 - 0.00 403.77 403.77 0.00
2002-03
X Plan
0.00 0.00 0.00 200.05 200.05 0.00
2003-04 0.00 0.00 0.00 344.85 344.85 0.00
2004-05 0.00 0.00 0.00 200.00 200.00 0.00
2005-06 0.00 0.00 0.00 199.98 199.98 0.00
2006-07 0.00 0.00 0.00 451.53 451.53 0.00
Sub
Total 0.00 - 0.00 1396.41 1396.41 0.00
G. Total 0.00 - 0.00 2593.53 2593.53 0.00

117
Table C4 : Capital Expenditure, Working Expenses and Gross receipts for Command
Area Development Programme over 1990-2007
State : Assam
(Rs. in lakhs)
Year
Annual Plan/
5- Year Plan
Capital Expenditure Working Expenses Gross Receipts
during the
year
up to the end of
the year
direction and
admini-stration
expenses other than direction and adm-inistration
total
1 2 3 4 5 6 7 8
1990-91 AnnualPlan
552.62 3819.20 0.00 0.00 0.00 0.00
1991-92 575.87 4395.07 0.00 0.00 0.00 0.00
Sub
Total 1128.49 - 0.00 0.00 0.00 0.00
1992-93
VIII Plan
453.06 4848.13 0.00 0.00 0.00 0.00
1993-94 425.27 5273.40 0.00 0.00 0.00 0.00
1994-95 428.95 5702.35 0.00 0.00 0.00 0.00
1995-96 389.09 6091.44 0.00 0.00 0.00 0.00
1996-97 381.24 6472.68 0.00 0.00 0.00 0.00
Sub
Total 2077.61 - 0.00 0.00 0.00 0.00
1997-98
IX Plan
367.87 6840.55 0.00 0.00 0.00 0.00
1998-99 328.89 7169.44 0.00 0.00 0.00 0.00
1999-00 332.15 7501.59 0.00 0.00 0.00 0.00
2000-01 279.91 7781.50 0.00 0.00 0.00 0.00
2001-02 235.31 8016.81 0.00 0.00 0.00 0.00
Sub
Total 1544.13 - 0.00 0.00 0.00 0.00
2002-03
X Plan
260.73 8277.54 0.00 0.00 0.00 0.00
2003-04 299.13 8576.67 0.00 0.00 0.00 0.00
2004-05 122.98 8699.65 0.00 90.88 90.88 0.00
2005-06 87.45 8787.10 0.00 151.91 151.91 0.00
2006-07 29.60 8816.70 0.00 175.30 175.30 0.00
Sub
Total 799.89 - 0.00 418.09 418.09 0.00
G. Total 5550.12 - 0.00 418.09 418.09 0.00

118
Table C5 : Capital Expenditure, Working Expenses and Gross receipts for Command
Area Development Programme over 1990-2007
State : Bihar
(Rs. in lakhs)
Year
Annual Plan/
5- Year Plan
Capital Expenditure Working Expenses Gross Receipts
during the
year
up to the end of
the year
direction and
admini-stration
expenses other than direction and adm-inistration
total
1 2 3 4 5 6 7 8
1990-91 AnnualPlan
0.00 58.00 17.70 1683.01 1700.71 0.00
1991-92 0.00 58.00 19.39 1978.53 1997.92 0.00
Sub
Total 0.00 - 37.09 3661.54 3698.63 0.00
1992-93
VIII Plan
0.00 58.00 23.19 1977.50 2000.69 0.00
1993-94 0.00 58.00 20.55 1131.82 1152.37 0.00
1994-95 0.00 58.00 21.59 1594.33 1615.92 0.00
1995-96 0.00 58.00 28.00 2022.90 2050.90 0.00
1996-97 0.00 58.00 30.68 1412.20 1442.88 0.00
Sub
Total 0.00 - 124.01 8138.75 8262.76 0.00
1997-98
IX Plan
0.00 58.00 28.93 1304.52 1333.45 0.00
1998-99 0.00 58.00 36.76 1177.55 1214.31 0.00
1999-00 0.00 58.00 30.44 1466.45 1496.89 0.00
2000-01 0.00 58.00 0.00 2846.91 2846.91 0.00
2001-02 0.00 58.00 0.00 607.83 607.83 0.00
Sub
Total 0.00 - 96.13 7403.26 7499.39 0.00
2002-03
X Plan
0.00 58.00 1965.58 0.00 1965.58 0.00
2003-04 0.00 58.00 0.00 1487.88 1487.88 0.00
2004-05 0.00 58.00 0.00 2231.89 2231.89 0.00
2005-06 0.00 58.00 4485.41 0.00 4485.41 0.00
2006-07 0.00 58.00 5449.60 0.00 5449.60 0.00
Sub
Total 0.00 - 11900.59 3719.77 15620.36 0.00
G. Total 0.00 - 12157.82 22923.32 35081.14 0.00

119
Table C6 : Capital Expenditure, Working Expenses and Gross receipts for Command
Area Development Programme over 1990-2007
State : Chhattisgarh
(Rs. in lakhs)
Year
Annual Plan/
5- Year Plan
Capital Expenditure Working Expenses Gross Receipts
during the
year
up to the end of
the year
direction and
admini-stration
expenses other than direction and adm-inistration
total
1 2 3 4 5 6 7 8
2000-01* IX Plan
38.22 2590.31 0.00 48.14 48.14 0.00
2001-02 86.70 2677.01 0.00 72.26 72.26 0.00
Sub
Total 124.92 - 0.00 120.40 120.40 0.00
2002-03
X Plan
234.68 2911.69 0.00 87.53 87.53 0.00
2003-04 200.89 3112.57 0.00 89.81 89.81 0.00
2004-05 1719.50 4832.07 0.00 154.94 154.94 0.00
2005-06 970.79 5802.86 0.00 74.40 74.40 0.00
2006-07 420.96 6223.82 0.00 74.00 74.00 0.00
Sub
Total 3546.82 - 0.00 480.68 480.68 0.00
G. Total 3671.74 - 0.00 601.08 601.08 0.00

120
Table C7 : Capital Expenditure, Working Expenses and Gross receipts for Command
Area Development Programme over 1990-2007
State : Delhi
(Rs. in lakhs)
Year
Annual Plan/
5- Year Plan
Capital Expenditure Working Expenses Gross Receipts
during the
year
up to the end of
the year
direction and
admini-stration
expenses other than direction and adm-inistration
total
1 2 3 4 5 6 7 8
1990-91 AnnualPlan
0.00 0.00 0.00 0.00 0.00 0.00
1991-92 0.00 0.00 0.00 0.00 0.00 0.00
Sub
Total 0.00 - 0.00 0.00 0.00 0.00
1992-93
VIII Plan
0.00 0.00 0.00 0.00 0.00 0.00
1993-94 0.00 0.00 0.00 0.00 0.00 0.00
1994-95 0.00 0.00 0.00 0.00 0.00 0.00
1995-96 0.00 0.00 0.00 0.00 0.00 0.00
1996-97 0.00 0.00 0.00 0.00 0.00 0.00
Sub
Total 0.00 - 0.00 0.00 0.00 0.00
1997-98
IX Plan
0.00 0.00 0.00 0.00 0.00 0.00
1998-99 0.00 0.00 0.00 0.00 0.00 0.00
1999-00 0.00 0.00 0.00 0.00 0.00 0.00
2000-01 0.00 0.00 0.00 0.00 0.00 0.00
2001-02 0.00 0.00 0.00 0.00 0.00 0.00
Sub
Total 0.00 - 0.00 0.00 0.00 0.00
2002-03
X Plan
0.00 0.00 0.00 0.00 0.00 0.00
2003-04 0.00 0.00 0.00 0.00 0.00 0.00
2004-05 0.00 0.00 0.00 0.00 0.00 0.00
2005-06 0.00 0.00 0.00 0.00 0.00 0.00
2006-07 0.00 0.00 0.00 0.00 0.00 0.00
Sub
Total 0.00 - 0.00 0.00 0.00 0.00
G. Total 0.00 - 0.00 0.00 0.00 0.00

121
Table C8 : Capital Expenditure, Working Expenses and Gross receipts for Command
Area Development Programme over 1990-2007
State : Gujarat
(Rs. in lakhs)
Year
Annual Plan/
5- Year Plan
Capital Expenditure Working Expenses Gross Receipts
during the
year
up to the end of
the year
direction and
admini-stration
expenses other than direction and adm-inistration
total
1 2 3 4 5 6 7 8
1990-91 AnnualPlan
0.00 5.08 0.00 1488.05 1488.05 0.00
1991-92 0.00 5.08 0.00 1362.52 1362.52 0.00
Sub
Total 0.00 - 0.00 2850.57 2850.57 0.00
1992-93
VIII Plan
0.00 5.08 0.00 1534.26 1534.26 0.00
1993-94 0.00 5.08 0.00 1513.73 1513.73 0.00
1994-95 0.00 5.08 0.00 1782.58 1782.58 0.00
1995-96 0.00 5.08 0.00 2153.99 2153.99 0.00
1996-97 0.00 5.08 0.00 2097.66 2097.66 0.00
Sub
Total 0.00 - 0.00 9082.22 9082.22 0.00
1997-98
IX Plan
0.00 5.08 0.00 2128.83 2128.83 0.00
1998-99 0.00 5.08 0.00 2724.90 2724.90 0.00
1999-00 0.00 5.08 0.00 2343.96 2343.96 0.00
2000-01 0.00 5.08 0.00 1663.11 1663.11 0.00
2001-02 0.00 5.08 0.00 654.76 654.76 0.00
Sub
Total 0.00 - 0.00 9515.56 9515.56 0.00
2002-03
X Plan
0.00 5.08 0.00 622.74 622.74 0.00
2003-04 0.00 5.08 0.00 520.47 520.47 0.00
2004-05 0.00 5.08 0.00 317.31 317.31 0.00
2005-06 0.00 5.08 0.00 520.27 520.27 0.00
2006-07 0.00 5.08 0.00 564.36 564.36 0.00
Sub
Total 0.00 - 0.00 2545.15 2545.15 0.00
G. Total 0.00 - 0.00 23993.50 23993.50 0.00

122
Table C9 : Capital Expenditure, Working Expenses and Gross receipts for Command
Area Development Programme over 1990-2007
State : Haryana
(Rs. in lakhs)
Year
Annual Plan/
5- Year Plan
Capital Expenditure Working Expenses Gross Receipts
during the
year
up to the end of
the year
direction and
admini-stration
expenses other than direction and adm-inistration
total
1 2 3 4 5 6 7 8
1990-91 AnnualPlan
0.00 0.00 0.00 11.99 11.99 0.00
1991-92 0.00 0.00 0.00 15.98 15.98 0.00
Sub
Total 0.00 - 0.00 27.97 27.97 0.00
1992-93
VIII Plan
0.00 0.00 0.00 18.22 18.22 0.00
1993-94 0.00 0.00 0.00 26.53 26.53 0.00
1994-95 0.00 0.00 0.00 33.91 33.91 0.00
1995-96 0.00 0.00 0.00 36.59 36.59 0.00
1996-97 0.00 0.00 0.00 46.48 46.48 0.00
Sub
Total 0.00 - 0.00 161.73 161.73 0.00
1997-98
IX Plan
0.00 0.00 0.00 26.50 26.50 0.00
1998-99 0.00 0.00 0.00 33.51 33.51 0.00
1999-00 0.00 0.00 0.00 22.15 22.15 0.00
2000-01 0.00 0.00 0.00 3812.38 3812.38 0.00
2001-02 0.00 0.00 0.00 5995.42 5995.42 0.00
Sub
Total 0.00 - 0.00 9889.96 9889.96 0.00
2002-03
X Plan
0.00 0.00 0.00 4783.14 4783.14 0.00
2003-04 0.00 0.00 0.00 2789.77 2789.77 0.00
2004-05 0.00 0.00 0.00 5404.54 5404.54 0.00
2005-06 0.00 0.00 0.00 9187.22 9187.22 0.00
2006-07 0.00 0.00 0.00 5487.37 5487.37 0.00
Sub
Total 0.00 - 0.00 27652.04 27652.04 0.00
G. Total 0.00 - 0.00 37731.70 37731.70 0.00

123
Table C10 : Capital Expenditure, Working Expenses and Gross receipts for Command
Area Development Programme over 1990-2007
State : Himachal Pradesh
(Rs. in lakhs)
Year
Annual Plan/
5- Year Plan
Capital Expenditure Working Expenses Gross Receipts
during the
year
up to the end of
the year
direction and
admini-stration
expenses other than direction and adm-inistration
total
1 2 3 4 5 6 7 8
1990-91 AnnualPlan
66.79 280.22 0.00 3.05 3.05 0.00
1991-92 74.07 354.29 0.00 17.97 17.97 0.00
Sub
Total 140.86 - 0.00 21.02 21.02 0.00
1992-93
VIII Plan
80.29 434.58 0.00 18.20 18.20 0.00
1993-94 91.61 526.19 0.00 18.78 18.78 0.00
1994-95 116.79 642.98 0.00 25.52 25.52 0.00
1995-96 121.42 764.39 0.00 32.29 32.29 0.00
1996-97 161.72 926.11 0.00 18.07 18.07 0.00
Sub
Total 571.83 - 0.00 112.86 112.86 0.00
1997-98
IX Plan
157.68 1083.79 0.00 10.05 10.05 0.00
1998-99 64.06 1147.85 0.00 22.53 22.53 0.00
1999-00 79.20 1227.05 0.00 0.00 0.00 0.00
2000-01 230.09 1457.14 0.00 28.84 28.84 0.00
2001-02 224.81 1681.95 0.00 31.44 31.44 0.00
Sub
Total 755.84 - 0.00 92.86 92.86 0.00
2002-03
X Plan
310.73 1992.68 0.00 34.70 34.70 0.00
2003-04 389.56 2382.23 0.00 7024.41 7024.41 0.00
2004-05 318.14 2700.37 0.00 14.49 14.49 0.00
2005-06 471.08 3171.45 0.00 10.91 10.91 0.00
2006-07 544.42 3715.87 0.00 9.16 9.16 0.00
Sub
Total 2033.93 - 0.00 7093.67 7093.67 0.00
G. Total 3502.46 - 0.00 7320.41 7320.41 0.00

124
Table C11 : Capital Expenditure, Working Expenses and Gross receipts for Command
Area Development Programme over 1990-2007
State : Jammu & Kashmir
(Rs. in lakhs)
Year
Annual Plan/
5- Year Plan
Capital Expenditure Working Expenses Gross Receipts
during the
year
up to the end of
the year
direction and
admini-stration
expenses other than direction and adm-inistration
total
1 2 3 4 5 6 7 8
1990-91 AnnualPlan
0.00 0.00 0.00 385.12 385.12 0.00
1991-92 0.00 0.00 0.00 491.84 491.84 0.00
Sub
Total 0.00 - 0.00 876.96 876.96 0.00
1992-93
VIII Plan
0.00 0.00 0.00 607.44 607.44 0.00
1993-94 0.00 0.00 0.00 529.23 529.23 0.00
1994-95 0.00 0.00 0.00 637.57 637.57 0.00
1995-96 0.00 0.00 0.00 645.75 645.75 0.00
1996-97 0.00 0.00 0.00 878.06 878.06 0.00
Sub
Total 0.00 - 0.00 3298.05 3298.05 0.00
1997-98
IX Plan
0.00 0.00 0.00 881.43 881.43 0.00
1998-99 0.00 0.00 0.00 867.87 867.87 0.00
1999-00 0.00 0.00 0.00 1019.24 1019.24 0.00
2000-01 0.00 0.00 0.00 1047.82 1047.82 0.00
2001-02 0.00 0.00 0.00 1119.12 1119.12 0.00
Sub
Total 0.00 - 0.00 4935.48 4935.48 0.00
2002-03
X Plan
0.00 0.00 0.00 1447.89 1447.89 0.00
2003-04 0.00 0.00 0.00 1317.66 1317.66 0.00
2004-05 0.00 0.00 0.00 1841.74 1841.74 0.00
2005-06 0.00 0.00 0.00 1970.47 1970.47 0.00
2006-07 0.00 0.00 0.00 2277.63 2277.63 0.00
Sub
Total 0.00 - 0.00 8855.39 8855.39 0.00
G. Total 0.00 - 0.00 17965.88 17965.88 0.00

125
Table C12 : Capital Expenditure, Working Expenses and Gross receipts for Command
Area Development Programme over 1990-2007
State : Jharkhand
(Rs. in lakhs)
Year
Annual Plan/
5- Year Plan
Capital Expenditure Working Expenses Gross Receipts
during the
year
up to the end of
the year
direction and
admini-stration
expenses other than direction and adm-inistration
total
1 2 3 4 5 6 7 8
2000-01 IX Plan
0.00 0.00 0.00 0.00 0.00 0.00
2001-02 0.00 0.00 0.00 0.00 0.00 0.00
Sub
Total 0.00 - 0.00 0.00 0.00 0.00
2002-03 0.00 0.00 0.00 0.00 0.00 0.00
2003-04 0.00 0.00 0.00 0.00 0.00 0.00
2004-05 0.00 0.00 0.00 0.00 0.00 0.00
2005-06 0.00 0.00 0.00 0.00 0.00 0.00
2006-07 0.00 0.00 5.67 0.36 6.03 0.00
Sub
Total 0.00 - 5.67 0.36 6.03 0.00
G. Total 0.00 - 5.67 0.36 6.03 0.00

126
Table C13 : Capital Expenditure, Working Expenses and Gross receipts for Command
Area Development Programme over 1990-2007
State : Karnataka
(Rs. in lakhs)
Year
Annual Plan/
5- Year Plan
Capital Expenditure Working Expenses Gross Receipts
during the
year
up to the end of
the year
direction and
admini-stration
expenses other than direction and adm-inistration
total
1 2 3 4 5 6 7 8
1990-91 AnnualPlan
0.00 0.00 6.55 2516.60 2523.15 0.00
1991-92 0.00 0.00 6.13 2792.50 2798.63 0.00
Sub
Total 0.00 - 12.68 5309.10 5321.78 0.00
1992-93
VIII Plan
0.00 0.00 6.71 3176.10 3182.81 0.00
1993-94 0.00 0.00 7.61 2261.19 2268.80 0.00
1994-95 0.00 0.00 11.30 2434.99 2446.29 0.00
1995-96 0.00 0.00 16.26 2471.96 2488.22 0.00
1996-97 0.00 0.00 11.06 3182.16 3193.22 0.00
Sub
Total 0.00 - 52.94 13526.40 13579.34 0.00
1997-98
IX Plan
0.00 0.00 17.14 2576.51 2593.65 0.00
1998-99 0.00 0.00 14.47 2235.11 2249.58 0.00
1999-00 0.00 0.00 21.58 2835.04 2856.62 0.00
2000-01 0.00 0.00 28.85 2883.47 2912.32 0.00
2001-02 0.00 0.00 28.60 3540.60 3569.20 0.00
Sub
Total 0.00 - 110.64 14070.73 14181.37 0.00
2002-03
X Plan
10.00 10.00 17.90 5437.63 5455.53 0.00
2003-04 0.00 10.00 14.40 2632.60 2647.00 0.00
2004-05 0.00 10.00 11.49 1938.33 1949.82 0.00
2005-06 0.00 10.00 7.70 4159.29 4166.99 0.00
2006-07 40.00 50.00 4.83 7373.60 7378.43 0.00
Sub
Total 50.00 - 56.32 21541.45 21597.77 0.00
G. Total 50.00 - 232.58 54447.68 54680.26 0.00

127
Table C14 : Capital Expenditure, Working Expenses and Gross receipts for Command
Area Development Programme over 1990-2007
State : Kerala
(Rs. in lakhs)
Year
Annual Plan/
5- Year Plan
Capital Expenditure Working Expenses Gross Receipts
during the
year
up to the end of
the year
direction and
admini-stration
expenses other than direction and adm-inistration
total
1 2 3 4 5 6 7 8
1990-91 AnnualPlan
0.00 0.00 0.00 1605.12 1605.12 0.00
1991-92 0.00 0.00 0.00 1385.30 1385.30 0.00
Sub
Total 0.00 - 0.00 2990.42 2990.42 0.00
1992-93
VIII Plan
0.00 0.00 0.00 1785.06 1785.06 0.00
1993-94 0.00 0.00 0.00 1969.55 1969.55 0.00
1994-95 0.00 0.00 0.00 2107.51 2107.51 0.00
1995-96 0.00 0.00 0.00 2077.34 2077.34 0.00
1996-97 0.00 0.00 0.00 1058.65 1058.65 0.00
Sub
Total 0.00 - 0.00 8998.11 8998.11 0.00
1997-98
IX Plan
0.00 0.00 0.00 2109.25 2109.25 0.00
1998-99 0.00 0.00 0.00 2110.60 2110.60 0.00
1999-00 0.00 0.00 0.00 1615.95 1615.95 0.00
2000-01 0.00 0.00 0.00 2014.35 2014.35 0.00
2001-02 0.00 0.00 0.00 11.78 11.78 0.00
Sub
Total 0.00 - 0.00 7861.93 7861.93 0.00
2002-03
X Plan
0.00 0.00 0.00 1713.76 1713.76 0.00
2003-04 0.00 0.00 0.00 1475.53 1475.53 0.00
2004-05 0.00 0.00 0.00 201.10 201.10 0.00
2005-06 0.00 0.00 0.00 855.00 855.00 0.00
2006-07 0.00 0.00 0.00 641.74 641.74 0.00
Sub
Total 0.00 - 0.00 4887.13 4887.13 0.00
G. Total 0.00 - 0.00 24737.59 24737.59 0.00

128
Table C15 : Capital Expenditure, Working Expenses and Gross receipts for Command
Area Development Programme over 1990-2007
State : Madhya Pradesh
(Rs. in lakhs)
Year
Annual Plan/
5- Year Plan
Capital Expenditure Working Expenses Gross Receipts
during the
year
up to the end of
the year
direction and
admini-stration
expenses other than direction and adm-inistration
total
1 2 3 4 5 6 7 8
1990-91 AnnualPlan
729.11 6666.88 0.00 1369.55 1369.55 0.00
1991-92 785.93 7452.81 0.00 1860.20 1860.20 0.00
Sub
Total 1515.04 - 0.00 3229.75 3229.75 0.00
1992-93
VIII Plan
244.68 7697.49 0.00 2432.12 2432.12 0.00
1993-94 193.77 7891.27 0.00 2602.63 2602.63 0.00
1994-95 340.08 8231.35 0.00 2897.07 2897.07 0.00
1995-96 541.28 8772.63 0.00 4436.76 4436.76 0.00
1996-97 70.78 8843.42 0.00 4272.24 4272.24 0.00
Sub
Total 1390.59 - 0.00 16640.82 16640.82 0.00
1997-98
IX Plan
98.00 8941.42 0.00 1806.39 1806.39 0.00
1998-99 332.63 9274.05 0.00 2339.74 2339.74 0.00
1999-00 273.97 9548.02 0.00 3156.93 3156.93 0.002000-01* 203.57 6720.27 0.00 2202.69 2202.69 0.00
2001-02 300.09 7020.36 0.00 862.05 862.05 0.00
Sub
Total 1208.26 - 0.00 10367.80 10367.80 0.00
2002-03
X Plan
348.00 7368.36 0.00 470.32 470.32 0.00
2003-04 565.57 8467.97 0.00 470.95 470.95 0.00
2004-05 892.15 9360.12 0.00 417.24 417.24 0.00
2005-06 670.15 10030.27 0.00 245.73 245.73 0.00
2006-07 796.27 10826.54 0.00 106.36 106.36 0.00
Sub
Total 3272.14 - 0.00 1710.60 1710.60 0.00
G. Total 7386.03 - 0.00 31948.97 31948.97 0.00

129
Table C16 : Capital Expenditure, Working Expenses and Gross receipts for Command Area Development Programme over 1990-2007
State : Maharashtra
(Rs. in lakhs)
Year
Annual Plan/
5- Year Plan
Capital Expenditure Working Expenses Gross Receipts
during the
year
up to the end of
the year
direction and
admini-stration
expenses other than direction and adm-inistration
total
1 2 3 4 5 6 7 8
1990-91 AnnualPlan
0.00 0.00 0.00 3537.98 3537.98 0.00
1991-92 0.00 0.00 0.00 3283.18 3283.18 0.00
Sub
Total 0.00 - 0.00 6821.16 6821.16 0.00
1992-93
VIII Plan
0.00 0.00 0.00 3341.38 3341.38 0.00
1993-94 0.00 0.00 0.00 3747.86 3747.86 0.00
1994-95 0.00 0.00 0.00 2819.33 2819.33 0.00
1995-96 0.00 0.00 0.00 3501.76 3501.76 0.00
1996-97 0.00 0.00 0.00 2862.97 2862.97 0.00
Sub
Total 0.00 - 0.00 16273.30 16273.30 0.00
1997-98
IX Plan
0.00 0.00 0.00 3178.21 3178.21 0.00
1998-99 0.00 0.00 0.00 2854.88 2854.88 0.00
1999-00 0.00 0.00 0.00 1897.30 1897.30 0.00
2000-01 0.00 0.00 0.00 881.11 881.11 0.00
2001-02 0.00 0.00 0.00 660.15 660.15 0.00
Sub
Total 0.00 - 0.00 9471.65 9471.65 0.00
2002-03
X Plan
0.00 0.00 92.00 517.00 609.00 0.00
2003-04 0.00 0.00 43.67 534.04 577.71 0.00
2004-05 0.00 0.00 79.75 545.68 625.43 0.00
2005-06 0.00 0.00 186.87 1275.10 1461.97 0.00
2006-07 0.00 0.00 100.85 1470.60 1571.45 0.00
Sub
Total 0.00 - 503.14 4342.42 4845.56 0.00
G. Total 0.00 - 503.14 36908.53 37411.67 0.00

130
Table C17 : Capital Expenditure, Working Expenses and Gross receipts for Command
Area Development Programme over 1990-2007
State : Manipur
(Rs. in lakhs)
Year
Annual Plan/
5- Year Plan
Capital Expenditure Working Expenses Gross Receipts
during the
year
up to the end of
the year
direction and
admini-stration
expenses other than direction and adm-inistration
total
1 2 3 4 5 6 7 8
1990-91 AnnualPlan
0.00 13.61 0.00 96.33 96.33 0.00
1991-92 0.00 13.61 0.00 231.76 231.76 0.00
Sub
Total 0.00 - 0.00 328.09 328.09 0.00
1992-93
VIII Plan
0.00 13.61 0.00 133.83 133.83 0.00
1993-94 0.00 13.61 0.00 115.34 115.34 0.00
1994-95 0.00 13.61 0.00 225.73 225.73 0.00
1995-96 0.00 13.61 0.00 252.04 252.04 0.00
1996-97 0.00 13.61 0.00 307.80 307.80 0.00
Sub
Total 0.00 - 0.00 1034.74 1034.74 0.00
1997-98
IX Plan
0.00 13.61 0.00 311.12 311.12 0.00
1998-99 0.00 13.61 0.00 309.50 309.50 0.00
1999-00 0.00 13.61 0.00 313.29 313.29 0.00
2000-01 0.00 13.61 0.00 136.20 136.20 0.00
2001-02 0.00 13.61 0.00 299.73 299.73 0.00
Sub
Total 0.00 - 0.00 1369.84 1369.84 0.00
2002-03
X Plan
0.00 13.61 97.60 119.74 217.34 0.00
2003-04 0.05 13.65 103.88 319.99 423.87 0.00
2004-05 120.00 133.65 110.90 215.89 326.79 0.00
2005-06 240.04 373.70 145.62 513.23 658.85 0.00
2006-07 0.00 373.70 128.63 562.46 691.09 0.00
Sub
Total 360.09 - 586.63 1731.31 2317.94 0.00
G. Total 360.09 - 586.63 4463.98 5050.61 0.00

131
Table C18 : Capital Expenditure, Working Expenses and Gross receipts for Command
Area Development Programme over 1990-2007
State : Meghalaya
(Rs. in lakhs)
Year
Annual Plan/
5- Year Plan
Capital Expenditure Working Expenses Gross Receipts
during the
year
up to the end of
the year
direction and
admini-stration
expenses other than direction and adm-inistration
total
1 2 3 4 5 6 7 8
1990-91 AnnualPlan
0.00 0.00 0.00 0.00 0.00 0.00
1991-92 0.00 0.00 0.00 0.00 0.00 0.00
Sub
Total 0.00 - 0.00 0.00 0.00 0.00
1992-93
VIII Plan
0.00 0.00 0.00 0.00 0.00 0.00
1993-94 0.00 0.00 0.00 0.00 0.00 0.00
1994-95 0.00 0.00 0.00 0.00 0.00 0.00
1995-96 0.00 0.00 0.00 0.00 0.00 0.00
1996-97 0.00 0.00 0.00 0.00 0.00 0.00
Sub
Total 0.00 - 0.00 0.00 0.00 0.00
1997-98
IX Plan
0.00 0.00 0.00 0.00 0.00 0.00
1998-99 0.00 0.00 0.00 0.00 0.00 0.00
1999-00 0.00 0.00 0.00 0.00 0.00 0.00
2000-01 0.00 0.00 0.00 0.00 0.00 0.00
2001-02 0.00 0.00 0.00 0.00 0.00 0.00
Sub
Total 0.00 - 0.00 0.00 0.00 0.00
2002-03
X Plan
0.00 0.00 0.00 0.00 0.00 0.00
2003-04 0.00 0.00 0.00 0.00 0.00 0.00
2004-05 0.00 0.00 0.00 0.00 0.00 0.00
2005-06 0.00 0.00 0.00 0.00 0.00 0.00
2006-07 0.00 0.00 0.00 0.00 0.00 0.00
Sub
Total 0.00 - 0.00 0.00 0.00 0.00
G. Total 0.00 - 0.00 0.00 0.00 0.00

132
Table C19 : Capital Expenditure, Working Expenses and Gross receipts for Command
Area Development Programme over 1990-2007
State : Mizoram
(Rs. in lakhs)
Year
Annual Plan/
5- Year Plan
Capital Expenditure Working Expenses Gross Receipts
during the
year
up to the end of
the year
direction and
admini-stration
expenses other than direction and adm-inistration
total
1 2 3 4 5 6 7 8
1990-91 AnnualPlan
0.00 0.00 0.00 0.00 0.00 0.00
1991-92 0.00 0.00 0.00 0.00 0.00 0.00
Sub
Total 0.00 - 0.00 0.00 0.00 0.00
1992-93
VIII Plan
0.00 0.00 0.00 0.00 0.00 0.00
1993-94 0.00 0.00 0.00 0.00 0.00 0.00
1994-95 0.00 0.00 0.00 4.08 4.08 0.00
1995-96 0.00 0.00 0.00 4.99 4.99 0.00
1996-97 0.00 0.00 0.00 5.00 5.00 0.00
Sub
Total 0.00 - 0.00 14.07 14.07 0.00
1997-98
IX Plan
2.43 2.43 0.00 1.58 1.58 0.00
1998-99 0.00 2.43 0.00 2.86 2.86 0.00
1999-00 0.00 2.43 0.00 4.94 4.94 0.00
2000-01 0.00 2.43 0.00 4.88 4.88 0.00
2001-02 0.00 2.43 0.00 38.11 38.11 0.00
Sub
Total 2.43 - 0.00 52.37 52.37 0.00
2002-03
X Plan
0.00 2.43 0.00 16.08 16.08 0.00
2003-04 0.00 2.43 0.00 20.83 20.83 0.00
2004-05 0.00 2.43 0.00 24.20 24.20 0.00
2005-06 0.00 2.43 0.00 29.20 29.20 0.00
2006-07 0.00 2.43 0.00 28.61 28.61 0.00
Sub
Total 0.00 - 0.00 118.92 118.92 0.00
G. Total 2.43 - 0.00 185.36 185.36 0.00
-

133
Table C20 : Capital Expenditure, Working Expenses and Gross receipts for Command
Area Development Programme over 1990-2007
State : Nagaland
(Rs. in lakhs)
Year
Annual Plan/
5- Year Plan
Capital Expenditure Working Expenses Gross Receipts
during the
year
up to the end of
the year
direction and
admini-stration
expenses other than direction and adm-inistration
total
1 2 3 4 5 6 7 8
1990-91 AnnualPlan
0.00 0.00 0.00 0.00 0.00 0.00
1991-92 0.00 0.00 0.00 0.00 0.00 0.00
Sub
Total 0.00 - 0.00 0.00 0.00 0.00
1992-93
VIII Plan
0.00 0.00 0.00 0.00 0.00 0.00
1993-94 0.00 0.00 0.00 0.00 0.00 0.00
1994-95 0.00 0.00 0.00 0.00 0.00 0.00
1995-96 0.00 0.00 0.00 0.00 0.00 0.00
1996-97 0.00 0.00 0.00 0.00 0.00 0.00
Sub
Total 0.00 - 0.00 0.00 0.00 0.00
1997-98
IX Plan
0.00 0.00 0.00 0.00 0.00 0.00
1998-99 0.00 0.00 0.00 0.00 0.00 0.00
1999-00 0.00 0.00 0.00 0.00 0.00 0.00
2000-01 0.00 0.00 0.00 0.00 0.00 0.00
2001-02 0.00 0.00 0.00 0.00 0.00 0.00
Sub
Total 0.00 - 0.00 0.00 0.00 0.00
2002-03
X Plan
0.00 0.00 0.00 0.00 0.00 0.00
2003-04 0.00 0.00 0.00 0.00 0.00 0.00
2004-05 0.00 0.00 0.00 0.00 0.00 0.00
2005-06 0.00 0.00 0.00 0.00 0.00 0.00
2006-07 0.00 0.00 0.00 0.00 0.00 0.00
Sub
Total 0.00 - 0.00 0.00 0.00 0.00
G. Total 0.00 - 0.00 0.00 0.00 0.00
-

134
Table C21 : Capital Expenditure, Working Expenses and Gross receipts for Command
Area Development Programme over 1990-2007
State : Orissa
(Rs. in lakhs)
Year
Annual Plan/
5- Year Plan
Capital Expenditure Working Expenses Gross Receipts
during the
year
up to the end of
the year
direction and
admini-stration
expenses other than direction and adm-inistration
total
1 2 3 4 5 6 7 8
1990-91 AnnualPlan
0.00 0.00 0.00 437.54 437.54 0.00
1991-92 0.00 0.00 0.00 491.39 491.39 0.00
Sub
Total 0.00 - 0.00 928.93 928.93 0.00
1992-93
VIII Plan
0.00 0.00 0.00 736.48 736.48 0.00
1993-94 0.00 0.00 0.00 838.09 838.09 0.00
1994-95 0.00 0.00 0.00 816.35 816.35 0.00
1995-96 0.00 0.00 0.00 834.13 834.13 0.00
1996-97 0.00 0.00 0.00 780.85 780.85 0.00
Sub
Total 0.00 - 0.00 4005.90 4005.90 0.00
1997-98
IX Plan
0.00 0.00 0.00 906.96 906.96 0.00
1998-99 0.00 0.00 0.00 1373.77 1373.77 0.00
1999-00 0.00 0.00 0.00 1102.17 1102.17 0.00
2000-01 0.00 0.00 0.00 1179.37 1179.37 0.00
2001-02 0.00 0.00 0.00 1952.29 1952.29 0.00
Sub
Total 0.00 - 0.00 6514.56 6514.56 0.00
2002-03
X Plan
0.00 0.00 0.00 636.82 636.82 0.00
2003-04 0.00 0.00 0.00 970.55 970.55 0.00
2004-05 0.00 0.00 0.00 1029.28 1029.28 0.00
2005-06 0.00 0.00 0.00 970.35 970.35 0.00
2006-07 0.00 0.00 0.00 2375.54 2375.54 0.00
Sub
Total 0.00 - 0.00 5982.54 5982.54 0.00
G. Total 0.00 - 0.00 17431.93 17431.93 0.00

135
Table C22 : Capital Expenditure, Working Expenses and Gross receipts for Command
Area Development Programme over 1990-2007
State : Punjab
(Rs. in lakhs)
Year
Annual Plan/
5- Year Plan
Capital Expenditure Working Expenses Gross Receipts
during the
year
up to the end of
the year
direction and
admini-stration
expenses other than direction and adm-inistration
total
1 2 3 4 5 6 7 8
1990-91 AnnualPlan
0.00 0.00 0.00 0.00 0.00 0.00
1991-92 0.00 0.00 0.00 0.00 0.00 0.00
Sub
Total 0.00 - 0.00 0.00 0.00 0.00
1992-93
VIII Plan
0.00 0.00 0.00 0.00 0.00 0.00
1993-94 0.00 0.00 0.00 0.00 0.00 0.00
1994-95 0.00 0.00 0.00 0.00 0.00 0.00
1995-96 0.00 0.00 0.00 0.00 0.00 0.00
1996-97 0.00 0.00 0.00 0.00 0.00 0.00
Sub
Total 0.00 - 0.00 0.00 0.00 0.00
1997-98
IX Plan
0.00 0.00 0.00 0.00 0.00 0.00
1998-99 1757.50 1757.50 0.00 0.00 0.00 0.00
1999-00 1800.00 3557.50 0.00 0.00 0.00 0.00
2000-01 6841.91 10399.41 0.00 0.00 0.00 0.00
2001-02 6821.08 17220.49 0.00 0.00 0.00 0.00
Sub
Total 17220.49 - 0.00 0.00 0.00 0.00
2002-03
X Plan
2742.26 19962.75 0.00 0.00 0.00 0.00
2003-04 1200.00 21162.75 0.00 0.00 0.00 0.00
2004-05 3532.79 24695.54 0.00 0.00 0.00 0.00
2005-06 3772.83 28468.37 0.00 0.00 0.00 0.00
2006-07 3859.21 32327.58 0.00 0.00 0.00 0.00
Sub
Total 15107.09 - 0.00 0.00 0.00 0.00
G. Total 32327.58 - 0.00 0.00 0.00 0.00

136
Table C23 : Capital Expenditure, Working Expenses and Gross receipts for Command
Area Development Programme over 1990-2007
State : Rajasthan
(Rs. in lakhs)
Year
Annual Plan/
5- Year Plan
Capital Expenditure Working Expenses Gross Receipts
during the
year
up to the end of
the year
direction and
admini-stration
expenses other than direction and adm-inistration
total
1 2 3 4 5 6 7 8
1990-91 AnnualPlan
4861.63 24224.86 0.00 2381.91 2381.91 0.00
1991-92 4879.72 29104.57 0.00 3094.12 3094.12 0.00
Sub
Total 9741.35 - 0.00 5476.03 5476.03 0.00
1992-93
VIII Plan
5609.12 34713.69 0.00 3628.31 3628.31 0.00
1993-94 3966.64 38680.33 0.00 4423.25 4423.25 0.00
1994-95 4736.25 43416.58 0.00 5308.90 5308.90 0.00
1995-96 6875.71 50292.29 0.00 7664.70 7664.70 0.00
1996-97 11897.78 62190.07 0.00 5053.27 5053.27 0.00
Sub
Total 33085.50 - 0.00 26078.43 26078.43 0.00
1997-98
IX Plan
9431.32 71621.39 0.00 5383.42 5383.42 0.00
1998-99 8860.04 80481.42 0.00 8230.75 8230.75 0.00
1999-00 7338.01 87819.43 0.00 8836.08 8836.08 0.00
2000-01 6202.15 94024.58 0.00 8556.06 8556.06 0.00
2001-02 5360.69 99382.27 0.00 8663.80 8663.80 0.00
Sub
Total 37192.21 - 0.00 39670.11 39670.11 0.00
2002-03
X Plan
4262.91 103645.18 0.00 7434.04 7434.04 0.00
2003-04 4559.64 108204.82 0.00 7779.70 7779.70 0.00
2004-05 6646.91 114851.73 0.00 6081.88 6081.88 0.00
2005-06 6546.86 121398.59 0.00 4250.61 4250.61 0.00
2006-07 6109.85 127508.44 0.00 4409.35 4409.35 0.00
Sub
Total 28126.17 - 0.00 29955.58 29955.58 0.00
G. Total 108145.23 - 0.00 101180.15 101180.15 0.00

137
Table C24 : Capital Expenditure, Working Expenses and Gross receipts for Command
Area Development Programme over 1990-2007
State : Sikkin
(Rs. in lakhs)
Year
Annual Plan/
5- Year Plan
Capital Expenditure Working Expenses Gross Receipts
during the
year
up to the end of
the year
direction and
admini-stration
expenses other than direction and adm-inistration
total
1 2 3 4 5 6 7 8
1990-91 AnnualPlan
0.00 0.00 0.00 0.00 0.00 0.00
1991-92 0.00 0.00 0.00 0.00 0.00 0.00
Sub
Total 0.00 - 0.00 0.00 0.00 0.00
1992-93
VIII Plan
0.00 0.00 0.00 6.70 6.70 0.00
1993-94 0.00 0.00 0.00 5.00 5.00 0.00
1994-95 0.00 0.00 0.00 3.55 3.55 0.00
1995-96 0.00 0.00 0.00 5.77 5.77 0.00
1996-97 0.00 0.00 0.00 5.91 5.91 0.00
Sub
Total 0.00 - 0.00 26.93 26.93 0.00
1997-98
IX Plan
0.00 0.00 0.00 0.00 0.00 0.00
1998-99 0.00 0.00 0.00 1.98 1.98 0.00
1999-00 0.00 0.00 0.00 2.00 2.00 0.00
2000-01 0.00 0.00 0.00 1.99 1.99 0.00
2001-02 0.00 0.00 0.00 4.50 4.50 0.00
Sub
Total 0.00 - 0.00 10.47 10.47 0.00
2002-03
X Plan
0.00 0.00 0.00 4.97 4.97 0.00
2003-04 0.00 0.00 0.00 4.99 4.99 0.00
2004-05 0.00 0.00 0.00 0.00 0.00 0.00
2005-06 0.00 0.00 0.00 4.97 4.97 0.00
2006-07 0.00 0.00 0.00 0.00 0.00 0.00
Sub
Total 0.00 - 0.00 14.93 14.93 0.00
G. Total 0.00 - 0.00 52.33 52.33 0.00

138
Table C25 : Capital Expenditure, Working Expenses and Gross receipts for Command
Area Development Programme over 1990-2007
State : Tamil Nadu
(Rs. in lakhs)
Year
Annual Plan/
5- Year Plan
Capital Expenditure Working Expenses Gross Receipts
during the
year
up to the end of
the year
direction and
admini-stration
expenses other than direction and adm-inistration
total
1 2 3 4 5 6 7 8
1990-91 AnnualPlan
0.00 1241.87 0.00 778.92 778.92 0.00
1991-92 0.00 1241.87 0.00 1050.25 1050.25 0.00
Sub
Total 0.00 - 0.00 1829.17 1829.17 0.00
1992-93
VIII Plan
0.00 1241.87 0.00 1150.55 1150.55 0.00
1993-94 0.00 1241.87 0.00 1147.39 1147.39 0.00
1994-95 0.00 1241.87 0.00 1360.71 1360.71 0.00
1995-96 0.00 1241.87 0.00 1530.96 1530.96 0.00
1996-97 0.00 1241.87 0.00 1869.01 1869.01 0.00
Sub
Total 0.00 - 0.00 7058.62 7058.62 0.00
1997-98
IX Plan
0.00 1241.87 0.00 3346.53 3346.53 0.00
1998-99 0.00 1241.87 0.00 3394.87 3394.87 0.00
1999-00 0.00 1241.87 0.00 3000.80 3000.80 0.00
2000-01 0.00 1241.87 0.00 2879.69 2879.69 0.00
2001-02 0.00 1241.87 0.00 3880.69 3880.69 0.00
Sub
Total 0.00 - 0.00 16502.58 16502.58 0.00
2002-03
X Plan
0.00 1241.87 0.00 4596.76 4596.76 0.00
2003-04 0.00 1241.87 0.00 4709.51 4709.51 0.00
2004-05 0.00 1241.87 0.00 3945.41 3945.41 0.00
2005-06 2445.76 3687.63 0.00 1596.61 1596.61 0.00
2006-07 3529.62 7217.25 0.00 1722.58 1722.58 0.00
Sub
Total 5975.38 - 0.00 16570.87 16570.87 0.00
G. Total 5975.38 - 0.00 41961.24 41961.24 0.00

139
Table C26 : Capital Expenditure, Working Expenses and Gross receipts for Command
Area Development Programme over 1990-2007
State : Tripura
(Rs. in lakhs)
Year
Annual Plan/
5- Year Plan
Capital Expenditure Working Expenses Gross Receipts
during the
year
up to the end of
the year
direction and
admini-stration
expenses other than direction and adm-inistration
total
1 2 3 4 5 6 7 8
1990-91 AnnualPlan
7.37 14.69 0.00 0.00 0.00 0.00
1991-92 5.69 20.38 0.00 0.00 0.00 0.00
Sub
Total 13.06 - 0.00 0.00 0.00 0.00
1992-93
VIII Plan
8.97 29.35 0.00 0.00 0.00 0.00
1993-94 4.74 34.09 0.00 0.00 0.00 0.00
1994-95 6.06 40.14 0.00 0.00 0.00 0.00
1995-96 5.18 45.32 0.00 0.00 0.00 0.00
1996-97 3.29 48.61 0.00 0.00 0.00 0.00
Sub
Total 28.24 - 0.00 0.00 0.00 0.00
1997-98
IX Plan
0.11 48.72 0.00 0.00 0.00 0.00
1998-99 0.00 48.72 0.00 0.00 0.00 0.00
1999-00 0.00 48.72 0.00 0.00 0.00 0.00
2000-01 0.00 48.72 0.00 0.00 0.00 0.00
2001-02 0.00 48.72 0.00 0.00 0.00 0.00
Sub
Total 0.11 - 0.00 0.00 0.00 0.00
2002-03
X Plan
0.00 48.72 0.00 0.00 0.00 0.00
2003-04 0.00 48.72 0.00 0.00 0.00 0.00
2004-05 0.00 48.72 0.00 0.00 0.00 0.00
2005-06 0.00 48.72 0.00 0.00 0.00 0.00
2006-07 14.52 63.24 0.00 0.00 0.00 0.00
Sub
Total 14.52 - 0.00 0.00 0.00 0.00
G. Total 55.93 - 0.00 0.00 0.00 0.00

140
Table C27 : Capital Expenditure, Working Expenses and Gross receipts for Command
Area Development Programme over 1990-2007
State : Uttar Pradesh
(Rs. in lakhs)
Year
Annual Plan/
5- Year Plan
Capital Expenditure Working Expenses Gross Receipts
during the
year
up to the end of
the year
direction and
admini-stration
expenses other than direction and adm-inistration
total
1 2 3 4 5 6 7 8
1990-91 AnnualPlan
0.00 1091.27 0.00 3639.58 3639.58 0.00
1991-92 0.00 1091.27 0.00 2386.01 2386.01 0.00
Sub
Total 0.00 - 0.00 6025.59 6025.59 0.00
1992-93
VIII Plan
0.00 0.00 0.00 0.00 0.00 0.00
1993-94 0.09 1165.45 0.00 3524.30 3524.30 0.00
1994-95 0.02 1165.47 0.00 3800.69 3800.69 0.00
1995-96 -0.03 1165.44 0.00 4982.62 4982.62 0.00
1996-97 -0.08 1165.35 0.00 4810.72 4810.72 0.00
Sub
Total 0.00 - 0.00 17118.33 17118.33 0.00
1997-98
IX Plan
32.00 1197.35 0.00 6453.34 6453.34 0.00
1998-99 -0.99 1196.36 0.00 4546.77 4546.77 0.00
1999-00 -0.76 1195.61 0.00 6384.70 6384.70 0.002000-01
* -0.84 -0.84 0.00 7593.86 7593.86 0.00
2001-02 -0.08 -0.92 0.00 5793.20 5793.20 0.00
Sub
Total 29.33 - 0.00 30771.87 30771.87 0.00
2002-03
X Plan
0.00 -0.92 0.00 14795.41 14795.41 0.00
2003-04 0.00 -0.92 0.00 8811.14 8811.14 0.00
2004-05 0.00 -0.93 0.00 10027.27 10027.27 0.00
2005-06 0.00 -0.93 0.00 9487.68 9487.68 0.00
2006-07 0.00 -0.93 0.00 10964.97 10964.97 0.00
Sub
Total 0.00 - 0.00 54086.47 54086.47 0.00
G. Total 29.33 - 0.00 108002.26 108002.26 0.00

141
2000-01 -0.58 1195.02 Un-apportioned between U.P. and Uttranchal.
1992-93 data not available
Table C28 : Capital Expenditure, Working Expenses and Gross receipts for Command Area Development Programme over 1990-2007
State : Uttarakhand
(Rs. in lakhs)
Year
Annual Plan/
5- Year Plan
Capital Expenditure Working Expenses Gross Receipts
during the
year
up to the end of
the year
direction and
admini-stration
expenses other than direction and adm-inistration
total
1 2 3 4 5 6 7 8
2000-01 IX Plan
0.00 0.00 0.00 21.43 21.43 0.00
2001-02 0.00 0.00 0.00 7.31 7.31 0.00
Sub
Total 0.00 - 0.00 28.74 28.74 0.00
2002-03
X Plan
0.00 0.00 0.00 149.96 149.96 0.00
2003-04 0.00 0.00 0.00 149.41 149.41 0.00
2004-05 0.00 0.00 0.00 132.85 132.85 0.00
2005-06 0.00 0.00 0.00 279.00 279.00 0.00
2006-07 0.00 0.00 0.00 207.36 207.36 0.00
Sub
Total 0.00 - 0.00 918.58 918.58 0.00
G. Total 0.00 - 0.00 947.32 947.32 0.00
P C
2000-01 -0.58 1195.02 Un-apportioned between U.P. and Uttranchal.

142
Table C29 : Capital Expenditure, Working Expenses and Gross receipts for Command Area Development Programme over 1990-2007
State : West Bengal
(Rs. in lakhs)
Year
Annual Plan/
5- Year Plan
Capital Expenditure Working Expenses Gross Receipts
during the
year
up to the end of
the year
direction and
admini-stration
expenses other than direction and adm-inistration
total
1 2 3 4 5 6 7 8
1990-91 AnnualPlan
208.34 1440.32 0.00 134.10 134.10 0.00
1991-92 161.66 1601.99 0.00 108.09 108.09 0.00
Sub
Total 370.00 - 0.00 242.19 242.19 0.00
1992-93
VIII Plan
161.87 1763.85 0.00 116.77 116.77 0.00
1993-94 117.11 1880.96 0.00 138.33 138.33 0.00
1994-95 239.51 2120.47 0.00 138.01 138.01 0.00
1995-96 300.27 2420.74 0.00 165.98 165.98 0.00
1996-97 191.42 2612.16 0.00 195.91 195.91 0.00
Sub
Total 1010.18 - 0.00 755.00 755.00 0.00
1997-98
IX Plan
318.90 2931.06 0.00 214.76 214.76 0.00
1998-99 243.42 3174.47 0.00 341.48 341.48 0.00
1999-00 413.27 3587.74 0.00 345.31 345.31 0.00
2000-01 949.44 4537.18 0.00 383.86 383.86 0.00
2001-02 805.93 5343.11 0.00 384.10 384.10 0.00
Sub
Total 2730.96 - 0.00 1669.51 1669.51 0.00
2002-03
X Plan
300.14 5643.25 0.00 381.91 381.91 0.00
2003-04 394.35 6037.60 0.00 373.68 373.68 0.00
2004-05 371.49 6409.08 0.00 375.39 375.39 0.00
2005-06 394.86 6803.94 0.00 381.14 381.14 0.00
2006-07 504.91 7308.86 0.00 391.27 391.27 0.00
Sub
Total 1965.75 - 0.00 1903.39 1903.39 0.00
G. Total 6076.89 - 0.00 4570.09 4570.09 0.00

143
Table C30 : Capital Expenditure, Working Expenses and Gross receipts for Command
Area Development Programme over 1990-2007
State : Goa
(Rs. in lakhs)
Year
Annual Plan/
5- Year Plan
Capital Expenditure Working Expenses Gross Receipts
during the
year
up to the end of
the year
direction and
admini-stration
expenses other than direction and adm-inistration
total
1 2 3 4 5 6 7 8
1990-91 AnnualPlan
121.42 958.96 0.00 110.68 110.68 0.00
1991-92 168.00 1126.96 0.00 128.02 128.02 0.00
Sub
Total 289.42 - 0.00 238.70 238.70 0.00
1992-93
VIII Plan
118.54 1245.50 0.00 8.75 8.75 0.00
1993-94 136.00 1381.50 0.00 130.69 130.69 0.00
1994-95 79.83 1461.34 0.00 118.48 118.48 0.00
1995-96 78.51 1539.85 0.00 119.62 119.62 0.00
1996-97 76.82 1616.67 0.00 164.02 164.02 0.00
Sub
Total 489.70 - 0.00 541.56 541.56 0.00
1997-98
IX Plan
68.33 1685.00 0.00 166.21 166.21 0.00
1998-99 52.95 1737.95 0.00 219.36 219.36 0.00
1999-00 51.01 1788.96 0.00 211.02 211.02 0.00
2000-01 71.91 1860.87 0.00 186.92 186.92 0.00
2001-02 67.88 1928.75 0.00 176.75 176.75 0.00
Sub
Total 312.08 - 0.00 960.26 960.26 0.00
2002-03
X Plan
97.74 2026.49 0.00 182.93 182.93 0.00
2003-04 69.31 2095.80 0.00 200.95 200.95 0.00
2004-05 69.01 2164.81 0.00 213.73 213.73 0.00
2005-06 129.44 2294.25 0.00 245.36 245.36 0.00
2006-07 82.41 2376.66 0.00 268.71 268.71 0.00
Sub
Total 447.91 - 0.00 1111.68 1111.68 0.00
G. Total 1539.11 - 0.00 2852.20 2852.20 0.00

144
Table C31 : Capital Expenditure, Working Expenses and Gross receipts for Command
Area Development Programme over 1990-2007
State : Pondicherry
(Rs. in lakhs)
Year
Annual Plan/
5- Year Plan
Capital Expenditure Working Expenses Gross Receipts
during the
year
up to the end of
the year
direction and
admini-stration
expenses other than direction and adm-inistration
total
1 2 3 4 5 6 7 8
1990-91 AnnualPlan
0.00 0.00 0.00 0.00 0.00 0.00
1991-92 0.00 0.00 0.00 0.00 0.00 0.00
Sub
Total 0.00 - 0.00 0.00 0.00 0.00
1992-93
VIII Plan
0.00 0.00 0.00 0.00 0.00 0.00
1993-94 0.00 0.00 0.00 0.00 0.00 0.00
1994-95 0.00 0.00 0.00 0.00 0.00 0.00
1995-96 0.00 0.00 0.00 0.00 0.00 0.00
1996-97 0.00 0.00 0.00 0.00 0.00 0.00
Sub
Total 0.00 - 0.00 0.00 0.00 0.00
1997-98
IX Plan
0.00 0.00 0.00 0.00 0.00 0.00
1998-99 0.00 0.00 0.00 0.00 0.00 0.00
1999-00 0.00 0.00 0.00 0.00 0.00 0.00
2000-01 0.00 0.00 0.00 0.00 0.00 0.00
2001-02 0.00 0.00 0.00 0.00 0.00 0.00
Sub
Total 0.00 - 0.00 0.00 0.00 0.00
2002-03
X Plan
0.00 0.00 0.00 0.00 0.00 0.00
2003-04 0.00 0.00 0.00 0.00 0.00 0.00
2004-05 0.00 0.00 0.00 0.00 0.00 0.00
2005-06 0.00 0.00 0.00 0.00 0.00 0.00
2006-07 0.00 0.00 0.00 0.00 0.00 0.00
Sub
Total 0.00 - 0.00 0.00 0.00 0.00
G. Total 0.00 - 0.00 0.00 0.00 0.00
- -

145
Table C32 : Capital Expenditure, Working Expenses and Gross receipts for Command
Area Development Programme over 1990-2007
Union Government
(Rs. in lakhs)
Year
Annual Plan/
5- Year Plan
Capital Expenditure Working Expenses Gross Receipts
during the
year
up to the end of
the year
direction and
admini-stration
expenses other than direction and adm-inistration
total
1 2 3 4 5 6 7 8
1990-91 AnnualPlan
30.00 56.63 0.00 6.94 6.94 0.00
1991-92 100.00 156.63 0.00 0.00 0.00 0.00
Sub
Total 130.00 - 0.00 6.94 6.94 0.00
1992-93
VIII Plan
0.00 156.63 0.00 23.06 23.06 0.00
1993-94 0.00 156.63 0.00 86.83 86.83 0.00
1994-95 5.00 161.63 0.00 146.47 146.47 0.00
1995-96 0.00 161.63 0.00 194.39 194.39 0.00
1996-97 4.99 166.62 0.00 240.33 240.33 0.00
Sub
Total 9.99 - 0.00 691.08 691.08 0.00
1997-98
IX Plan
26.00 192.62 0.00 347.19 347.19 0.00
1998-99 51.00 243.62 0.00 197.27 197.27 0.00
1999-00 53.71 297.33 0.00 297.37 297.37 0.00
2000-01 37.00 334.33 0.00 279.94 279.94 0.00
2001-02 47.99 382.32 0.00 139.90 139.90 0.00
Sub
Total 215.70 - 0.00 1261.67 1261.67 0.00
2002-03
X Plan
69.00 451.32 0.00 192.89 192.89 0.00
2003-04 57.94 509.26 0.00 257.30 257.30 0.00
2004-05 49.32 558.58 0.00 126.04 126.04 0.00
2005-06 39.99 598.57 0.00 339.89 339.89 0.00
2006-07 26.68 625.25 0.00 270.60 270.60 0.00
Sub
Total 242.93 - 0.00 1186.72 1186.72 0.00
G. Total 598.62 - 0.00 3146.41 3146.41 0.00

147
Table D1: Number of Major, Medium and ERM Irrigation Projects in India by State/UT Sl
. no.
Nam
e of
Sta
te/U
T Major Project Medium Project ERM Total
Com
plet
ed in
pre
- pl
an p
erio
d
Com
plet
ed i
n Pl
an
Perio
d u
p to
IX P
lan
Like
ly to
be
com
plet
ed
in X
Pla
n
Spill
ed o
ver
proj
ects
in
XI
Plan
Spill
ed o
ver N
ew
proj
ects
in
XI P
lan
Com
plet
ed i
n P
re-
Plan
Per
iod
Com
plet
ed i
n Pl
an
Perio
d up
to IX
Pla
n
Like
ly to
be
com
plet
ed
in X
Pla
n
Spill
ed o
ver p
roje
cts
in X
I Pla
n
Spill
ed o
ver N
ew
proj
ects
in
XI P
lan
Com
plet
ed i
n P
lan
Perio
d u
p to
IX P
lan
Like
ly to
be
com
plet
ed
in X
Pla
n
Spill
ed o
ver
proj
ects
in
XI P
lan
Spill
ed o
ver
new
pr
ojec
ts i
n X
I Pla
n
Com
plet
ed u
p to
IX
Plan
Like
ly to
be
com
plet
ed
in X
Pla
n
Spill
ed o
ver p
roje
cts
in X
I Pla
n
Spill
ed o
ver
new
pr
ojec
ts i
n X
I Pla
n
1 2 3 4 5 6 7 8 9 10 11 12 13 14 15 16 17 18 19 20 1 Andhra Pradesh 11 5 10 26 6 45 69 12 19 4 0 6 6 3 130 28 51 13
2 Arunachal Pradesh 0 0 0 0 0 0 0 0 0 3 0 0 0 0 0 0 0 3
3 Assam 0 2 2 2 0 0 8 2 2 3 1 0 2 0 11 4 6 3 4 Bihar 2 14 1 10 12 2 17 2 2 0 2 0 5 9 37 3 17 21 5 Chhattisgarh 4 3 1 4 5 4 22 3 7 24 2 0 1 0 35 4 12 29 6 Goa 0 0 1 0 0 0 1 0 0 0 0 1 0 0 1 2 0 0 7 Gujarat 2 17 0 3 3 0 114 6 15 21 12 2 11 27 145 8 29 51 8 Haryana 1 5 4 1 5 0 0 0 0 3 9 1 1 4 15 5 2 12 9 Himachal Pr. 0 0 0 1 0 0 4 0 3 0 0 0 0 0 4 0 4 0
10 Jammu&Kashmir 1 1 0 0 0 6 10 2 6 6 4 2 4 5 22 4 10 11 11 Jharkhand 0 1 0 6 3 0 34 6 16 4 1 0 0 9 36 6 22 16 12 Karnataka 4 4 0 15 1 8 32 5 27 6 0 0 5 0 48 5 47 7 13 Kerala 0 10 1 3 1 0 7 0 4 1 1 0 2 0 18 1 9 2 14 Madhya Pradesh 2 9 5 18 11 10 91 2 8 6 1 1 5 0 113 8 31 17 15 Maharashtra 5 16 10 53 4 16 171 38 83 27 1 3 3 0 209 51 139 31 16 Manipur 0 1 0 2 1 0 4 0 1 3 0 0 4 1 5 0 7 5 17 Meghalaya 0 0 0 0 0 0 0 0 1 0 0 0 0 0 0 0 1 0 18 Mizoram 0 0 0 0 0 0 0 0 0 0 0 0 0 0 0 0 0 0 19 Nagaland 0 0 0 0 0 0 0 0 1 1 0 0 0 0 0 0 1 0 20 Orissa 3 6 4 7 5 3 37 6 10 16 7 14 14 2 56 24 31 23

148
Table D1: Number of Major, Medium and ERM Irrigation Projects in India by State/UT Sl
. no.
Nam
e of
Sta
te/U
T Major Project Medium Project ERM Total
Com
plet
ed in
pre
- pl
an p
erio
d
Com
plet
ed i
n Pl
an
Perio
d u
p to
IX P
lan
Like
ly to
be
com
plet
ed
in X
Pla
n
Spill
ed o
ver
proj
ects
in
XI
Plan
Spill
ed o
ver N
ew
proj
ects
in
XI P
lan
Com
plet
ed i
n P
re-
Plan
Per
iod
Com
plet
ed i
n Pl
an
Perio
d up
to IX
Pla
n
Like
ly to
be
com
plet
ed
in X
Pla
n
Spill
ed o
ver p
roje
cts
in X
I Pla
n
Spill
ed o
ver N
ew
proj
ects
in
XI P
lan
Com
plet
ed i
n P
lan
Perio
d u
p to
IX P
lan
Like
ly to
be
com
plet
ed
in X
Pla
n
Spill
ed o
ver
proj
ects
in
XI P
lan
Spill
ed o
ver
new
pr
ojec
ts i
n X
I Pla
n
Com
plet
ed u
p to
IX
Plan
Like
ly to
be
com
plet
ed
in X
Pla
n
Spill
ed o
ver p
roje
cts
in X
I Pla
n
Spill
ed o
ver
new
pr
ojec
ts i
n X
I Pla
n
1 2 3 4 5 6 7 8 9 10 11 12 13 14 15 16 17 18 19 20 21 Punjab 3 5 0 1 1 0 2 0 0 0 8 4 2 6 18 4 3 7 22 Rajasthan 1 5 2 2 6 42 55 4 7 3 7 1 2 0 110 7 11 9 23 Sikkim 0 0 0 0 0 0 0 0 0 0 0 0 0 0 0 0 0 0 24 Tamil Nadu 17 5 0 0 0 7 39 0 2 0 11 1 3 0 79 1 5 0 25 Tripura 0 0 0 0 0 0 0 0 3 0 0 0 0 0 0 0 3 0 26 Uttaranchal 0 1 2 0 0 0 0 0 0 117 0 1 2 27 Uttar Pradesh 15 42 7 9 6 40 0 0 3 20 3 13 17 10 22 26 28 West Bengal 3 3 0 2 6 0 17 3 5 12 0 0 6 3 23 3 13 21 29. Total: States 74 154 48 166 78 143 774 91 222 146 87 39 89 86 1232 178 477 309 30. Total: UTs - - - - - - - - - - - 0 - - - -
31. North Eastern Council - - - - - - - - - - - 0 - - - - - -
32. ALL-INDIA 74 154 48 166 78 143 774 91 222 146 87 39 89 86 1232 178 477 309

149
Table D.2 : Financial implication of completed and Ongoing Projects of XI Plan
Unit : Rs. in crore, Potential
in '000 ha.)
Sl No
Name of Project No of Project
s
Latest estd. cost
Expenditure up to IX
Plan
Expenditure during X
Plan
Estd. expenditure
up to X Plan
Estd. spill over cost in XI Plan
Ultimate Irrigation Potential
Irrigation Potential
created* up to X Plan
Irrigation Potential to be created*
1 2 3 4 5 6 7 8 9 10 11 1 ANDHRA PRADESH 7+8 5+6 MAJOR PROJECTS 26 57239.56 3486.13 12897.57 16383.70 40855.86 3200.53 421.55 2778.98 MEDIUM PROJECTS 19 1866.13 77.18 1084.21 1161.39 704.74 109.60 25.78 83.82 ERM PROJECTS 6 2578.74 361.28 716.22 1077.50 1501.24 89.61 47.23 42.38 TOTAL 51 61684.43 3924.59 14698.00 18622.59 43061.84 3399.74 494.56 2905.18 2 ASSAM Major Projects 1 548.48 220.32 32.11 252.45 296.03 108.35 31.70 76.65 Medium Projects 2 112.84 59.47 23.35 82.82 30.02 18.61 4.46 14.15 ERM Projects 2 89.39 0.65 46.89 47.54 41.85 41.15 19.62 21.53 Total 5 750.71 280.44 102.35 382.81 367.90 168.11 55.78 112.33 3 BIHAR Major Projects 10 5553.10 1425.49 706.49 2131.98 3421.12 792.52 181.71 610.81 Medium Projects 2 99.98 40.46 14.58 55.04 44.94 13.22 7.38 5.84 ERM Projects 5 1304.78 238.61 402.67 641.28 663.50 1490.16 919.41 570.75 Total 17 6957.86 1704.56 1123.74 2828.30 4129.56 2295.90 1108.50 1187.40 4 CHHATTISGARH MAJOR PROJECTS 4 2669.43 1215.59 964.40 2179.99 489.44 751.36 654.91 96.46 Medium Projects 7 532.65 20.31 289.75 310.06 222.58 55.64 12.91 42.73 E.R.M. Projects 1 4.68 0.00 4.68 4.68 0.00 1.20 0.60 0.60 Total 12 3206.76 1235.90 1258.83 2494.73 712.03 808.20 668.41 139.78 5 GOA Major Projects 1 698.97 317.55 186.18 503.73 195.24 21.06 7.07 13.99 6 GUJARAT Major Projects 3 46019.01 12679.13 14878.75 27557.88 18461.13 1835.84 465.43 1370.41

150
Table D.2 : Financial implication of completed and Ongoing Projects of XI Plan
Unit : Rs. in crore, Potential
in '000 ha.)
Sl No
Name of Project No of Project
s
Latest estd. cost
Expenditure up to IX
Plan
Expenditure during X
Plan
Estd. expenditure
up to X Plan
Estd. spill over cost in XI Plan
Ultimate Irrigation Potential
Irrigation Potential
created* up to X Plan
Irrigation Potential to be created*
1 2 3 4 5 6 7 8 9 10 11 Medium Projects 15 651.34 261.43 78.53 339.98 311.36 59.00 11.78 47.22 ERM Projects 11 2714.04 985.42 434.62 1420.02 1294.02 98.47 36.93 61.54 Total 29 49384.39 13925.98 15391.90 29317.88 20066.51 1993.31 514.14 1479.17 7 HARYANA MAJOR PROJECTS 1 601.25 487.93 3.79 491.72 109.53 0.00 0.00 0.00 MEDIUM PROJECTS - Nil ERM 1 460.73 299.89 0.00 299.89 160.84 96.00 38.08 57.92 Total 2 1061.98 787.82 3.79 791.61 270.37 96.00 38.08 57.92 8 HIMACHAL PRADESH Major Project. 1 278.36 63.00 93.45 156.45 121.91 24.76 3.01 21.75 Medium Project. 3 207.11 5.40 44.17 49.57 157.54 12.74 0.36 12.38 Total 4 485.00 68.00 138.00 206.00 279.00 38.00 3.00 34.00 9 JAMMU&KASHMIR Major Projects - Medium Projects 6 167.23 56.46 32.43 88.89 78.34 29.31 3.71 25.60 ERM Projects 4 223.63 69.99 18.38 88.37 135.26 18.06 10.46 7.60 Total 10 390.86 126.45 50.81 177.26 213.60 47.37 14.17 33.20
10 JHARKHAND Major Projects 6 6544.92 1958.46 698.43 2656.89 3888.03 384.43 16.53 367.90 Medium Projects 16 1153.48 279.91 335.76 615.67 537.81 78.28 4.80 73.48 ERM Projects - Total 22 7698.40 2238.37 1034.19 3272.56 4425.84 462.71 21.33 441.38
11 KARNATAKA MAJOR PROJECTS: 15 23686.90 10476.40 5338.50 15814.90 7872.00 1648.20 1205.00 443.20

151
Table D.2 : Financial implication of completed and Ongoing Projects of XI Plan
Unit : Rs. in crore, Potential
in '000 ha.)
Sl No
Name of Project No of Project
s
Latest estd. cost
Expenditure up to IX
Plan
Expenditure during X
Plan
Estd. expenditure
up to X Plan
Estd. spill over cost in XI Plan
Ultimate Irrigation Potential
Irrigation Potential
created* up to X Plan
Irrigation Potential to be created*
1 2 3 4 5 6 7 8 9 10 11 MEDIUM PROJECTS 27 1864.50 657.70 580.70 1238.50 626.00 104.10 35.60 68.50 ERM PROJECTS 5 1914.30 1050.22 738.88 1789.10 125.20 219.60 202.06 17.54 Total 47 27465.71 12184.29 6658.16 18842.45 8623.26 1971.93 1442.65 529.27
12 KERALA Major Projects 3 1311.00 486.85 473.26 960.11 350.89 66.77 41.67 25.10 Medium Projects 4 667.12 199.61 77.54 277.15 389.97 21.84 0.00 21.84 ERM Projects 2 153.47 18.16 62.92 81.08 72.39 0.00 0.00 0.00 Total 9 2131.59 704.62 613.72 1318.34 813.25 88.61 41.67 46.94
13 MADHYA PRADESH MAJOR PROJECTS 18 16332.95 4070.44 4437.55 8507.99 7824.96 1422.71 402.60 1020.11 MEDIUM PROJECTS 8 546.03 10.82 196.85 207.68 338.35 80.32 0.90 79.42 ERM Projects 5 216.31 23.36 24.06 47.42 168.89 3.38 0.00 3.38 Total 31 17095.29 4104.62 4658.46 8763.08 8332.20 1506.41 403.50 1102.91
14 MAHARASHTRA Major Projects 53 40545.90 10712.52 6714.44 17426.96 23118.94 2849.46 1037.75 1811.70 Medium Projects 83 10051.17 2177.33 2927.50 5104.82 4946.35 526.43 132.92 393.51 ERM Projects 3 331.83 82.37 13.47 95.84 235.99 12.45 4.17 8.28 TOTAL 139 50928.90 12972.22 9655.41 22627.62 28301.28 3388.33 1174.84 2213.50
15 MANIPUR Major Projects 2 836.09 348.61 344.48 693.09 143.00 48.40 19.00 29.40 Medium Projects 1 98.37 19.89 38.23 58.12 40.25 7.55 0.00 7.55 ERM Projects 4 16.95 0.00 0.00 0.00 16.95 16.71 0.00 16.71 Total 7 951.41 368.50 382.71 751.21 200.20 72.66 19.00 53.66
16 MEGHALAYA

152
Table D.2 : Financial implication of completed and Ongoing Projects of XI Plan
Unit : Rs. in crore, Potential
in '000 ha.)
Sl No
Name of Project No of Project
s
Latest estd. cost
Expenditure up to IX
Plan
Expenditure during X
Plan
Estd. expenditure
up to X Plan
Estd. spill over cost in XI Plan
Ultimate Irrigation Potential
Irrigation Potential
created* up to X Plan
Irrigation Potential to be created*
1 2 3 4 5 6 7 8 9 10 11 Major Projects - Medium Project 1 131.72 17.15 1.85 18.99 112.73 4.78 0.00 4.78 ERM - Total 1 131.72 17.15 1.85 18.99 112.73 4.78 0.00 4.78
17 NAGALAND Major Projects - Medium Projects 1 70.00 20.00 20.00 50.00 9.54 2.00 7.54 ERM Projects - Total 1 70.00 0.00 20.00 20.00 50.00 9.54 2.00 7.54
18 ORISSA Major Projects 7 6186.56 1016.24 1166.27 2182.51 4004.05 481.36 31.97 449.39 Medium Projects 10 937.61 193.62 246.68 440.30 497.31 76.29 14.04 62.25 ERM & Other Projects 14 227.42 1.06 158.11 159.17 68.25 70.83 7.40 63.43 TOTAL 31 7351.59 1210.92 1571.06 2781.98 4569.61 628.48 53.41 575.07
19 PUNJAB Major Projects 1 1925.43 582.60 98.32 680.92 1244.51 0.00 0.00 0.00 Medium Projects 1 88.49 22.00 54.46 76.46 12.03 0.00 0.00 0.00 ERM Projects 2 252.77 18.45 126.65 145.10 107.67 23.33 0.00 23.33 Total 4 2266.69 623.05 279.43 902.48 1364.21 23.33 0.00 23.33
20 RAJASTHAN Major Projects 2 1447.00 203.17 880.02 1083.20 363.80 246.00 66.57 179.43 Medium Projects 7 545.31 0.42 120.16 120.58 424.73 42.70 0.00 42.70 ERM Projects 2 1179.39 83.58 784.61 868.19 311.20 96.51 57.76 38.75 Total 11 3171.70 287.17 1784.80 2071.97 1099.73 385.21 124.33 260.88

153
Table D.2 : Financial implication of completed and Ongoing Projects of XI Plan
Unit : Rs. in crore, Potential
in '000 ha.)
Sl No
Name of Project No of Project
s
Latest estd. cost
Expenditure up to IX
Plan
Expenditure during X
Plan
Estd. expenditure
up to X Plan
Estd. spill over cost in XI Plan
Ultimate Irrigation Potential
Irrigation Potential
created* up to X Plan
Irrigation Potential to be created*
1 2 3 4 5 6 7 8 9 10 11 21 TAMIL NADU Major Projects - Medium Projects 2 103.88 43.90 52.58 96.48 7.40 7.19 0.00 7.19 ERM PROJECTS 3 96.99 2.61 73.45 76.06 20.93 0.00 0.00 0.00 TOTAL 5 200.87 46.51 126.03 172.54 28.33 7.19 0.00 7.19
22 TRIPURA Major Projects - Medium Projects 3 227.96 125.60 45.54 171.13 56.83 26.72 17.75 8.97 ERM Projects -
TOTAL 3 227.96 125.60 45.54 171.13 56.83 26.72 17.75 8.97 23 UTTARANCHAL Major Projects 1 1446.00 227.28 2.00 229.28 1216.72 40.00 0.00 40.00 Medium Projects - ERM Projects -
Total 1 1446.00 227.28 2.00 229.28 1216.72 40.00 0.00 40.00 24 UTTAR PRADESH Major Projects 9 5943.04 1203.14 1954.75 3157.89 2785.15 1589.57 876.00 713.57 Medium Projects - ERM Projects 13 1719.26 13.12 703.87 716.99 1002.27 549.22 24.00 525.22 Total 22 7662.30 1216.26 2658.62 3874.88 3787.42 2138.79 900.00 1238.79
25 WEST BENGAL Major Projects 2 3329.68 937.12 157.65 1094.77 2234.91 641.20 183.43 457.77
Medium Irrigation Scheme 5 38.47 27.60 1.19 28.79 9.68 11.50 11.49 0.00

154
Table D.2 : Financial implication of completed and Ongoing Projects of XI Plan
Unit : Rs. in crore, Potential
in '000 ha.)
Sl No
Name of Project No of Project
s
Latest estd. cost
Expenditure up to IX
Plan
Expenditure during X
Plan
Estd. expenditure
up to X Plan
Estd. spill over cost in XI Plan
Ultimate Irrigation Potential
Irrigation Potential
created* up to X Plan
Irrigation Potential to be created*
1 2 3 4 5 6 7 8 9 10 11 E R M Project 6 579.33 26.34 1.90 28.24 551.09 96.50 0.50 96.00
Total (Major, Medium, ERM) 13 3947.48 991.06 160.74 1151.80 2795.68 749.20 195.42 553.77 All-India
Total: Major 166 223143.65 52117.92 52028.45 104146.40 118997.25 16152.53 5645.87 10506.65 Total: Medium 222 20161.37 4296.28 6266.09 10562.38 9598.99 1295.37 285.89 1009.47 Total: ERM 89 14064.02 3275.10 4311.38 7586.47 6477.55 2923.18 1368.21 1554.97 GRAND TOTAL 477 257369.04 59689.31 62605.93 122295.25 135073.79 20371.08 7299.98 13071.09
Source : Central Water Commission, Project Monitoring Organisation *Estimated

155
Table D3: Capital Expenditure and Working Expenses during Tenth Plan Period for Major & Medium Irrigation Projects State and Project wise
(Rs. in lakhs) Sl. Name of the State/UT's and Capital Expenditure during the year Cumulative Working Expenses during the year No. Name of Major & Medium Irrigation Projects Capital Expenditure upto 2002-03 2003-04 2004-05 2005-06 2006-07 2006-07 2002-03 2003-04 2004-05 2005-06 2006-07 1 2 3 4 5 6 7 8 9 10 11 12
Andhra Pradesh Major
1 Alaganooru Balancing Reservoir 0.00 0.00 0.00 0.00 0.00 1123.95 16.49 164.88 164.88 0.00 0.00 2 Bheema Project 0.00 0.00 0.00 0.00 0.00 214.47 50.49 97.11 97.11 733.68 27.18 3 Buggavanka Reservoir 94.56 48.50 6.99 3.64 604.55 4395.06 526.88 541.13 540.66 540.29 541.37 4 Changalnadu Lift Irrigation Scheme 843.09 710.98 582.82 347.63 290.05 7203.41 625.88 697.32 697.32 531.40 0.00
5 Chittoor Water Supply Scheme 81.20 328.48 0.00 0.00 0.00 933.67 0.00 0.00 0.00 0.00 0.00 6 Flood Flow Canal Project 761.75 4259.02 19191.61 65492.33 47620.03 137324.74 0.00 0 0.00 2856.06 7334.36 7 Geleru Nagari Sujala Sravanti Project 12.91 123.69 6744.98 20131.79 65883.12 94123.80 0.00 0.00 0.00 0.00 5319.17 8 Godavari Barrage 129.75 130.55 135.19 400.79 200.94 19110.06 2062.94 2090.76 2090.76 1481.15 2103.01 9 Godavari Delta System 122.73 39.30 76.42 95.75 170.07 8379.98 2570.81 5227.29 5478.28 4377.77 5599.15 10 Godavari Water Utilisation Authority 2098.24 5577.02 61529.61 111263.16 139988.64 323010.12 - - 999.68 7098.50 14808.15 11 Gostanadi Drain cum Canal 18.84 0.00 0.00 0.00 0.00 336.72 32.12 - - 12 Gururaghavendra Swamy Lift Irrigation Scheme 0.00 299.93 2553.25 2121.28 3298.13 8280.81 180.85 142.08 122.90 319.15 642.35 13 Handriniva Sujala Sravanthi 12.67 0.44 4163.70 16268.76 55291.08 76418.69 161.35 298.48 298.48 11067.45 14 Ichampally Project 0.00 0.00 0.00 0.00 0.00 0.06 15 Kadam Project(C.N.C.P.) 0.00 0.00 0.00 0.00 0.00 977.40 223.31 1416.44 612.12 332.25 874.75 16 Krishna Delta System 0.00 22.53 15.40 352.16 1610.98 3717.88 2972.42 2644.68 1754.20 2848.33 1341.29 17 Kurnool Cuddapah Canal 19757.98 17962.44 17797.54 4271.15 2362.39 92005.75 5102.01 5423.60 8765.70 11772.38 10995.38 18 Nagarjuna sagar Project 3549.64 5391.80 3244.74 -0.01 0.00 118432.20 19546.89 19064.78 18409.01 24691.29 24944.32 19 Neerada Barrage (Stage-II) 138.23 935.30 2567.43 12628.21 15920.54 35907.94 0.00 0.00 0.00 0.00 0.00 20 Nizamsagar Project 190.65 244.36 160.04 2.26 124.35 5000.49 1190.86 1021.28 761.16 1641.22 1424.79

156
Table D3: Capital Expenditure and Working Expenses during Tenth Plan Period for Major & Medium Irrigation Projects State and Project wise
(Rs. in lakhs)
Sl. Name of the State/UT's and Capital Expenditure during the year Cumulative Working Expenses during the year No. Name of Major & Medium Irrigation Projects Capital Expenditure upto 2002-03 2003-04 2004-05 2005-06 2006-07 2006-07 2002-03 2003-04 2004-05 2005-06 2006-07 1 2 3 4 5 6 7 8 9 10 11 12 21 Pennar River Canal System 7.75 155.59 23.48 2000.00 27.90 3088.78 298.65 351.73 404.28 205.73 549.92 22 Polavaram Project 0.00 0.00 10896.54 56559.37 13686.84 81171.38 5.05 0.56 23 Prakasham Barrage Scheme 7.41 0.00 0.00 0.00 753.27 2629.40 208.92 208.95 208.95 208.49 233.03 24 Pulichinthala Project 0.00 71.88 153.22 16574.80 11900.48 31186.46 385.77 381.87 381.87 1080.73 2871.96 25 Pullivendala Canal Scheme 531.04 855.35 1516.66 4635.51 36919.01 48921.13 708.60 715.56 717.16 1319.29 2338.99 26 Rajolibanda Diversion Scheme 65.69 778.25 4.22 287.46 151.49 2824.36 230.13 1830.04 336.75 401.22 378.89 27 Samarlakota Summer Storage Reservoir 0.00 0.00 0.00 0.00 0.00 196.27 28 Singur Project 221.30 170.50 1120.39 208.05 1438.27 19571.50 2054.97 2038.86 2038.86 2089.71 2257.83 29 Somasila Project 4550.97 6081.59 6175.26 3025.75 11231.99 60718.25 3317.29 3326.61 3800.35 4006.94 5247.53 30 Sriram Sagar Project(Stage.I)© 27345.34 23536.71 19210.46 2.87 0.00 269334.82 25016.31 27607.54 29208.63 40772.90 46128.29 31 Srisailam Left Branch Canal 8064.04 6032.85 10407.21 14821.60 29689.69 117459.39 6915.96 7533.27 7901.31 15331.61 20447.21 32 Srisailam Right Branch Canal 12231.30 8599.32 7634.38 0.00 0.00 128810.43 14682.16 15725.97 16356.38 24520.87 29257.84 33 Sriram Sagar Project(Stage.I)© 27345.34 23536.71 19210.46 2.87 0.00 269334.82 25016.31 27607.54 29208.63 40772.90 46128.29 34 Srisailam Left Branch Canal 8064.04 6032.85 10407.21 14821.60 29689.69 117459.39 6915.96 7533.27 7901.31 15331.61 20447.21 35 Srisailam Right Branch Canal 12231.30 8599.32 7634.38 0.00 0.00 128810.43 14682.16 15725.97 16356.38 24520.87 29257.84 36 Sunkesula Barrage 0.00 0.00 0.00 0.00 0.00 6132.64 911.10 911.10 911.10 911.10 911.10 37 Tarakarama Krishnaveni lift Irrigation Scheme 41.74 394.96 305.11 105.82 148.77 1527.08 108.10 107.28 107.28 248.24 242.17 38 Telugu Ganga Project 7708.55 9862.94 15571.51 31669.55 36279.66 259945.31 22378.88 23168.48 23168.48 25842.85 - 39 Tungabhadra Project(Low level canal) 914.85 800.97 2284.89 5956.83 14004.34 57084.32 5291.47 4701.40 3979.63 8927.33 10168.65

157
Table D3: Capital Expenditure and Working Expenses during Tenth Plan Period for Major & Medium Irrigation Projects State and Project wise
(Rs. in lakhs)
Sl. Name of the State/UT's and Capital Expenditure during the year Cumulative Working Expenses during the year No. Name of Major & Medium Irrigation Projects Capital Expenditure upto 2002-03 2003-04 2004-05 2005-06 2006-07 2006-07 2002-03 2003-04 2004-05 2005-06 2006-07 1 2 3 4 5 6 7 8 9 10 11 12 40 Valigonda Project 0.11 9.66 3414.03 16976.73 26073.80 47761.94 207.06 252.18 252.18 350.21 1426.62 41 Vamsadhara Project(Stage.I) 651.31 172.45 273.42 18.92 511.71 11518.88 1238.44 1423.04 1412.30 1463.77 1460.73 42 Vamsadhara Project(Stage.II) 0.00 0.00 0.00 0.00 0.00 375.94 609.81 789.77 789.77 1179.05 1920.65 43 Yeleru Reservoir Scheme 22.33 231.68 896.29 555.82 557.71 32536.46 3744.89 3745.96 3484.02 158.54 142.25 Medium 44 Andhra Reservoir 1.93 115.67 34.57 12.64 11.19 3955.16 558.97 563.67 563.67 569.81 574.06 45 Aranyiar Project 0.00 0.00 0.00 477.11 17.65 616.29 20.25 13.46 12.17 12.17 0.89 46 Asif Nahar Project 0.00 0.00 0.00 0.00 224.38 415.70 28.46 26.27 26.94 26.27 30.29 47 Bahuda Reservoir 0.00 0.00 0.00 0.00 0.00 109.91 16.29 9.05 9.05 9.05 0.21 48 Bhairavanitippa Project 249.49 46.57 2.99 0.11 0.00 513.35 30.16 36.46 36.46 43.03 43.36 49 Bheema Lift Irrigation Scheme 6699.29 18528.04 30744.87 55972.20 111944.40 50 Bhupatipalem Reservoir 498.85 435.13 2264.39 487.10 3685.47 189.45 48.71 51 Boggulavagu Project 0.00 0.00 0.00 0.00 0.00 446.98 36.92 29.03 29.03 29.62 29.72 52 Bollaram Mathadi 0.00 0.00 0.00 0.00 0.00 122.51 17.61 17.61 17.61 17.61 17.61 53 Channarayaswami gudi Project 0.00 0.00 0.00 0.00 0.00 48.59 3.85 7.72 3.55 3.55 3.55 54 Chayyeru Project 626.41 441.46 107.77 114.41 708.61 7274.63 713.80 735.23 735.23 769.27 773.91 55 Cumbam Tank 0.00 0.00 0.00 0.00 10.96 152.30 22.34 22.34 22.34 22.34 22.34 56 Denkada Anicut Scheme 0.00 0.00 0.00 0.00 0.00 19.11 10.53 7.55 7.55 7.55 7.88 57 Dindi Project 0.00 11.09 0.00 0.00 7.98 756.55 106.02 103.45 104.79 58 Fathenahar project - - - - - 8.54 0.23 0.23 0.23 0.23 59 Gajuladinne Project 0.00 0.00 0.00 0.00 0.99 1188.40 109.60 110.63 109.92 1299.68 2203.02

158
Table D3: Capital Expenditure and Working Expenses during Tenth Plan Period for Major & Medium Irrigation Projects State and Project wise
(Rs. in lakhs) Sl. Name of the State/UT's and Capital Expenditure during the year Cumulative Working Expenses during the year No. Name of Major & Medium Irrigation Projects Capital Expenditure upto 2002-03 2003-04 2004-05 2005-06 2006-07 2006-07 2002-03 2003-04 2004-05 2005-06 2006-07 1 2 3 4 5 6 7 8 9 10 11 12 60 Gandipalem Project 0.00 0.00 8.04 0.00 0.00 703.01 70.27 62.06 62.06 61.28 61.53 61 Gollavagu Project 268.00 1196.72 3616.32 5081.04 0.90 5.64 5.64 90.57 62 Guntur Channel Scheme 0.00 0.00 0.00 0.00 0.00 642.97 175.79 83.79 89.24 97.53 84.16 63 Improvement to Khanapur Channel 0.00 0.00 0.00 0.00 0.00 6.12 64 Jalleru Project 0 0 0 0 0 729.81 69.05 67.99 67.99 65.17 0 65 Jalsoudha 37.73 0.00 0.00 0.00 0.00 348.48 30.47 38.81 41.94 48.26 48.61 66 Janjavati Project 104.82 425.73 1835.34 1802.28 2273.53 9048.52 267.16 271.86 271.86 507.98 619.22 67 Jurala Project 5361.62 7050.37 8942.09 11626.13 12040.37 89832.92 6475.88 7186.61 7186.61 9300.98 9323.45 68 Jurreru Project - - - - - 8.84 1.70 2.70 1.54 7.28 69 Jutpalli Project 0.00 0.00 0.00 10.00 0.00 26.84 2.60 2.78 0.61 1.12 5.88 70 Kalangi Reservoir 0.00 0.00 1.07 0.00 0.00 113.12 23.48 19.88 11.77 11.65 58.97 71 Kalvakurthi Lift Irrigation Scheme 0.00 1199.96 15885.90 34549.41 41812.28 93447.55 112.80 338.40 342.66 2257.25 5715.57 72 Kanupur Canal System 42.65 112.99 67.04 19.71 0.00 2196.74 227.48 240.32 240.32 248.96 241.70 73 Kinnerasani Project 0.00 0.00 5.44 272.13 92.05 642.35 0.00 0.00 0.00 66.78 32.36 74 Koilsagar Project 0.00 0.00 128.52 1840.99 5645.49 8272.73 104.32 84.64 85.94 561.82 75 Konam Project 0.00 0.00 0.00 0.00 93.32 711.02 71.84 15.20 66.31 66.78 67.12 76 Kotipalli Project 0.00 0.00 0.00 0.00 0.00 398.11 8.73 51.18 2.43 9.61 63.10 77 Kovvadakalava Project 2051.28 1168.25 889.86 339.16 315.57 6027.02 292.60 414.95 414.95 559.07 78 Krishna Puram Reservoir 0.00 0.00 0.00 0.00 2.90 528.03 44.71 35.63 35.65 37.19 35.96 79 L.T.Bayyaram Project 0.00 0.00 0.00 216.77 6.47 223.24 0.00 0.00 0.00 0.00 0.00 80 Lakhnapur Project 0.00 0.00 0.00 0.00 0.00 97.40 81 Lakhnavaram Lake - - - - - - 11.71 5.23 4.74 9.38 18.65

159
Table D3: Capital Expenditure and Working Expenses during Tenth Plan Period for Major & Medium Irrigation Projects State and Project wise
(Rs. in lakhs) Sl. Name of the State/UT's and Capital Expenditure during the year Cumulative Working Expenses during the year No. Name of Major & Medium Irrigation Projects Capital Expenditure upto 2002-03 2003-04 2004-05 2005-06 2006-07 2006-07 2002-03 2003-04 2004-05 2005-06 2006-07 1 2 3 4 5 6 7 8 9 10 11 12 82 Laknapuram Project 0.00 0.00 0.00 0.00 390.98 414.11 7.48 1.50 1.04 9.93 10.70 83 Lankasagar Project 2.79 0.00 0.00 0.00 0.00 250.69 29.23 19.45 19.33 21.24 84 Lower Sagileru Project 63.40 54.95 28.54 82.51 4.50 948.47 103.37 94.85 96.15 - 0.05 85 Lower Upputuru System 0.00 0.44 15.89 0.00 131.23 155.23 1.32 1.94 1.94 2.56 3.91 86 Maddigadda project 96.86 287.33 65.78 10.31 41.52 859.62 19.17 0.00 3.76 0.00 5.85 87 Maddileru Project 110.49 39.85 73.15 111.69 22.99 5422.02 736.55 745.95 745.95 757.17 765.04 88 Maddula Valasa Project 1273.14 1419.36 597.39 122.87 54.12 12446.26 1380.94 1824.93 1824.93 1439.97 1444.61 89 Mahboob Nahar Project - - - - - - 13.57 0.78 0.78 0.78 0.78 90 Mallimadugu Project 0.00 17.65 0.00 0.00 0.00 128.05 22.03 10.94 10.94 12.92 12.61 91 Malluru Vagu Project 0.00 0.00 0.00 0.00 0.00 618.18 60.88 54.04 54.04 54.04 54.04 92 Manniar Project 0.00 0.00 0.00 0.00 0.00 151.15 24.25 9.52 12.99 8.18 8.81 93 Mathadivagu Project 0.00 0.00 189.00 1008.35 2179.43 3376.78 0.36 0.00 0.00 0.00 84.37 94 Modikuntavagu Project(Tribal Areas sub Plan) 0.00 0.00 0.00 770.00 21.27 791.27 0.00 0.00 0.00 0.00 0.00 95 Mopad Reservoir 0.00 0.00 0.00 0.00 0.00 200.47 29.39 29.67 29.67 29.25 29.25 96 Mukkamamidi Project 0.00 0.00 0.00 0.00 2.50 207.81 32.32 16.22 16.12 27.14 97 Muniveru System 0.00 0.00 1.20 94.17 181.79 423.85 37.34 26.59 26.37 78.13 98 Musi Project 0.00 0.00 0.00 0.00 32.44 615.49 56.05 49.24 50.34 48.88 50.62 99 Musurumeth Project 0.00 0.00 584.98 3057.43 1527.18 5169.59 0.00 0.00 0.00 0.00 10.85 100 Nagavalli River System 0.00 0.00 4.96 0.00 19.32 118.88 13.57 11.77 11.98 9.73 13.07 101 Nallavagu Project 0.00 0.00 9.99 12.02 8.63 211.86 22.38 15.63 15.63 16.81 23.37 102 Nettampadu Lift Irrigation Scheme 0.00 0.00 150.65 14343.64 29592.49 44086.78 73.34 220.03 39.25 117.75 278.99 103 Nilwai Project 0.00 0.00 294.75 986.78 3466.82 4748.35 0.00 0.00 0.00 0.00 106.57

160
Table D3: Capital Expenditure and Working Expenses during Tenth Plan Period for Major & Medium Irrigation Projects State and Project wise
(Rs. in lakhs) Sl. Name of the State/UT's and Capital Expenditure during the year Cumulative Working Expenses during the year No. Name of Major & Medium Irrigation Projects Capital Expenditure upto 2002-03 2003-04 2004-05 2005-06 2006-07 2006-07 2002-03 2003-04 2004-05 2005-06 2006-07 1 2 3 4 5 6 7 8 9 10 11 12 104 NTR Sagar Project 0.00 25.00 0.00 0.00 0.00 31.48 - 6.42 6.42 3.35 3.45 105 Paidigam Project 0.00 0.00 0.00 0.00 9.47 184.97 28.22 27.92 29.33 27.42 29.10 106 Pakhal Lake 0.00 4.01 0.00 25.76 1.23 893.27 76.41 75.49 75.70 76.01 85.28 107 Palair Project 0.00 0.00 0.00 0.00 0.00 3.81 9.48 1.62 1.62 1.98 2.20 108 Palem Vagu 48.25 0.00 214.66 1092.78 1476.21 2867.26 5.57 6.59 14.97 212.89 109 Pampa Reservoir 7.29 0.00 0.00 0.00 0.00 161.01 9.83 110 Pddavagu Near Ada (Komram Bhim Project) 1100.00 6140.77 3970.18 11210.95 111 Pedda Ankalam Project 0.00 0.00 0.00 0.00 4.84 237.63 23.80 16.58 16.40 15.69 15.81 112 Peddagadda Reservoir 0.00 143.04 985.26 1724.14 4544.90 7397.34 2.35 7.05 7.05 250.87 575.32 113 Peddavagu-Jagannadhapur 0.00 0.00 13.75 0.00 0.00 830.78 101.89 80.06 80.58 5.65 969.93 114 Pedderu Project 56.54 0.00 0.00 0.00 0.00 634.43 115 Peddivagu-Jagannadhapur 594.5 854.87 888.73 2338.10 116 Pedduru Project(Stage I) 876.40 677.83 402.04 220.87 365.66 4652.87 358.95 208.05 208.05 422.89 507.54 117 Peleru Bitragunta Scheme 0.00 14.19 0.00 0.00 0.00 245.24 28.66 28.66 28.66 29.78 30.26 118 Pennar Kumudavati Project 0.00 0.00 0.00 0.00 0.00 37.19 7.74 7.31 7.31 7.31 7.31 119 Pincha Project 0.00 34.61 0.00 2.50 1.24 139.81 18.96 7.09 7.50 4.97 120 Pocharam Project 16.62 0.00 0.00 0.00 380.22 868.54 57.51 62.91 62.36 60.31 67.27 121 Polavaram Barrage 2.63 2104.57 122 Polavaram Lift Irrigation Scheme 0.00 759.94 4806.71 13783.12 9051.11 28401.18 0.00 0.00 0.00 1364.37 1031.16 123 Raiwada Project 0.02 0.00 0.00 0.00 14.30 1673.09 126.40 15.59 106.63 106.40 106.70 124 Ralivagu Project 0.00 0.00 140.00 842.33 3113.12 4095.45 0.00 0.00 0.00 0.00 80.52 125 Rallapadu System 39.98 34.41 16.51 16.27 128.65 3463.71 263.49 269.33 452.32 462.82 461.99

161
Table D3: Capital Expenditure and Working Expenses during Tenth Plan Period for Major & Medium Irrigation Projects State and Project wise
(Rs. in lakhs) Sl. Name of the State/UT's and Capital Expenditure during the year Cumulative Working Expenses during the year No. Name of Major & Medium Irrigation Projects Capital Expenditure upto 2002-03 2003-04 2004-05 2005-06 2006-07 2006-07 2002-03 2003-04 2004-05 2005-06 2006-07 1 2 3 4 5 6 7 8 9 10 11 12 126 Ramadugu Project 0.00 0.00 0.00 0.00 199.64 426.88 33.32 31.26 32.13 30.96 36.42 127 Ramappa Lake 0.00 0.00 0.00 0.00 84.98 106.47 65.31 56.83 56.25 57.86 62.50 128 Ramathirtham Balancing Reservoir 0.00 0.00 0.00 160.42 1179.72 1339.84 0.00 0.00 0.00 133.61 5.56 129 Reconstruction of Rallapadu 186.01 186.01 130 Reservoir near veligallu 9.90 673.02 2726.70 8408.81 3422.48 15378.80 26.72 25.01 25.01 637.16 1335.87 131 Sadarmat L.F. Khanapur Canal 0.00 0.00 0.00 0.00 0.00 249.51 40.53 25.29 132 Sagileru Project - - - - - - 39.83 31.56 31.56 31.18 31.18 133 Salivagu Project 0.00 0.00 191.99 204.06 0.00 474.08 8.13 6.70 6.45 26.16 35.43 134 Sangambanda Project 263.81 1664.99 3011.74 617.39 1064.84 6622.77 135 Sanigram Project 0.00 0.00 0.00 0.00 0.47 25.55 8.38 3.29 3.29 4.47 4.68 136 Saralasagar Project 0.00 9.00 0.85 0.40 20.19 117.40 14.58 9.92 8.20 8.34 8.65 137 Sathnala Project 0.21 78.42 0.00 0.00 0.00 0.00 396.07 398.18 398.01 412.39 407.88 138 Seethanagaram Anicut 0.00 0.00 0.00 0.00 0.00 3.54 3.59 0.85 0.57 0.57 0.62 139 Siddalangadi Project 0.00 0.00 0.00 0.00 0.00 2.48 1.58 1.45 1.45 1.45 1.45 140 Sriram Sagar Project(Stage.II) 2197.89 2717.41 11255.09 17597.46 12934.72 47657.65 - 346.50 401.17 1892.44 4146.50 141 Subba Reddy Sagar Project 60.28 17.54 2.76 0.00 0.00 662.51 57.59 52.33 142 Suddavagu Project 1615.07 1961.56 1846.99 3402.43 1287.71 11194.04 376.71 415.49 415.49 281.57 932.89 143 Suranpalem Project 1184.05 1620.79 1002.64 314.54 342.71 4828.95 92.13 187.35 187.35 356.30 49.13 144 Swarna Mukhi Project 0.00 19.78 207.30 1846.42 1499.55 4645.48 167.49 152.24 154.74 201.96 656.86 145 Taliperu Project 6.98 8.59 7.35 13.47 24.75 5707.14 529.31 452.56 457.95 19.36 575.30 146 Tammileru Reservoir Scheme 0.00 0.00 7.32 18.59 18.98 634.19 92.61 90.35 90.37 89.77 147 Tarakarama Sagar Project 0.00 0.00 0.00 0.00 1091.28 1091.28 1.41 4.23 4.23 46.35 139.05

162
Table D3: Capital Expenditure and Working Expenses during Tenth Plan Period for Major & Medium Irrigation Projects State and Project wise
(Rs. in lakhs) Sl. Name of the State/UT's and Capital Expenditure during the year Cumulative Working Expenses during the year No. Name of Major & Medium Irrigation Projects Capital Expenditure upto 2002-03 2003-04 2004-05 2005-06 2006-07 2006-07 2002-03 2003-04 2004-05 2005-06 2006-07 1 2 3 4 5 6 7 8 9 10 11 12 148 Tatipudi Project 0.00 641.49 4159.57 4404.91 8009.23 17255.80 22.54 11.54 178.85 850.60 9.89 149 Thandava Reservoir 37.34 0.00 0.00 0.00 279.48 1689.91 158.32 16.83 141.23 374.85 143.96
150 Thotapalli Reservoir 0.00 300.00 11200.89 4021.67 3138.29 18660.85 11.34 6.14 12.28 120.78 5.43 151 Torrigadda Pumping Scheme 72.38 28.95 0.00 0.00 1.21 1099.48 128.66 52.21 148.71 0.14 152 Tungabhadra Project (Low Level canal-Board Area) - - - - - 850.28 1380.63 1467.49 153 Ukkachetty Vagu Project 0.00 0.00 0.00 0.00 0.00 264.06 19.09 - 18.82 154 Upper Koulasanala Project 18.35 28.72 249.52 74.32 850.78 5252.67 553.46 589.45 590.92 590.87 646.29 155 Upper Pennar Project 0.00 0.00 0.00 0.00 0.00 176.48 10.48 9.36 9.36 8.65 8.65 156 Upper Sagileru Project 1.31 11.55 0.00 0.00 0.00 217.78 - - - - - 157 Utukuni Marepalli Project - - - - - - 0.35 0.14 158 Vagavathi Anicut 0.00 - - - - - 2.58 1.87 1.87 1.87 1.87 159 Varadarajaswami gudi Project 0.00 9.70 -0.01 1.11 0.00 3503.99 494.06 494.95 495.01 498.74 507.53 160 Varaha Reservoir 0.00 0.00 0.00 0.00 0.00 140.21 13.09 11.00 11.00 11.00
161 Vengalaraya Lift Irrigation Scheme (Kothapalli Irrigation Scheme) 0.00 0.00 0.00 0.00 0.00 549.18 22.65 22.65 22.65
162 Vengalaraya Sagaram 17.62 9.32 51.49 64.66 134.88 6243.74 741.41 743.66 743.41 748.35 753.97
163 Venkatanagaram Pumping Scheme 0.00 0.00 0.00 1921.47 1950.27 3871.74 0.00 0.00 0.00 0.00 195.03 164 Vijayarai Anicut Scheme 0.00 24.61 0.00 0.00 4.34 241.81 36.01 36.76 36.76 32.11 165 Vottigadda Project 0.00 1.92 0.00 50.00 160.95 9703.88 1307.29 1277.65 1292.09 1277.47 1288.02 166 Wyra Project 0.00 0.00 0.00 0.00 25.97 142.51 30.77 8.27 8.21 56.76 21.00 167 Yerrakalva Reservoir 1162.71 1617.59 1393.17 1000.34 457.16 10070.12 525.05 537.88 537.88 939.55

163
Table D3: Capital Expenditure and Working Expenses during Tenth Plan Period for Major & Medium Irrigation Projects State and Project wise
(Rs. in lakhs) Sl. Name of the State/UT's and Capital Expenditure during the year Cumulative Working Expenses during the year No. Name of Major & Medium Irrigation Projects Capital Expenditure upto 2002-03 2003-04 2004-05 2005-06 2006-07 2006-07 2002-03 2003-04 2004-05 2005-06 2006-07 1 2 3 4 5 6 7 8 9 10 11 12 168 Yerravagu Project 1646.89 1007.00 534.43 211.98 18.65 4732.13 316.35 373.81 373.81 491.29 576.09 169 Zurreru Project 0.00 0.00 0.00 0.00 14.48 64.23 Assam Major 1 Borolia Irrigation Project 179.79 63.02 82.92 39.53 606.55 5050.86 2 Buridhihing Irrigation Project 75.39 105.97 1065.25 47.91 885.68 6619.68 0.00 0.00 0.00 0.00 0.00 3 Champabati Irrigation Project 172.59 62.77 125.47 58.34 0.03 5678.44 4 Dekadeng Irrigation Project 0.00 0.00 0.00 0.00 0.00 501.41 5 Dhansiri Irrigation Project 792.55 238.75 282.73 66.23 110.85 17547.66 6 Hawaipur Irrigation project 12.76 26.01 43.14 28.06 18.59 1223.16 7 Integrated Irrigation project on Kolong Basin 282.17 134.79 219.16 107.75 20.37 5661.63 8 Irrigation project in Hill District 0.00 0.00 0.04 0.40 0.73 33.80 9 Jamuna Irrigation Project 11.03 199.70 34.15 24.55 0.01 350.13 10 Kaldia Irrigation Project 8.51 1.13 1.27 0.71 0.00 991.03 11 Kaliabor Lift Irrigation Project 0.00 0.00 0.00 0.00 0.00 1014.00 12 Kolong Irrigation Project 32.94 94.76 0.40 0.00 0.00 1197.27 13 Pahumara Irrigation Project 136.06 24.92 22.88 199.23 75.79 3633.66 14 Rupahi Irrigation Project 20.77 9.42 13.53 5.74 0.00 680.25 Bihar Major 1 Damodar Valley project 0.00 0.00 0.00 - - - - 2 Gandak Project 0.00 0.00 0.00 254.67 294.18 50138.51 0.00 4543.21 5671.67 5524.18 6429.04

164
Table D3: Capital Expenditure and Working Expenses during Tenth Plan Period for Major & Medium Irrigation Projects State and Project wise
(Rs. in lakhs) Sl. Name of the State/UT's and Capital Expenditure during the year Cumulative Working Expenses during the year No. Name of Major & Medium Irrigation Projects Capital Expenditure upto 2002-03 2003-04 2004-05 2005-06 2006-07 2006-07 2002-03 2003-04 2004-05 2005-06 2006-07 1 2 3 4 5 6 7 8 9 10 11 12 3 Kiul-Badua-Chandan Basin 0.00 0.00 0.00 1190.02 1797.17 2987.19 0.00 0.00 0.00 0.00 0.00 4 Konar Project 0.00 0.00 0.00 0.00 0.00 7267.11 0.00 0.00 0.00 0.00 0.00 5 Koshi Project 0.00 0.00 0.00 0.00 0.00 58727.95 0.00 0.00 0.00 238.11 48.50 6 North Koel Dam Project 0.00 0.00 0.00 0.00 0.00 43504.40 0.00 0.00 0.00 0.00 0.00 7 Sone Project 0.00 0.00 0.00 26696.06 0.00 10399.93 0.00 0.00 0.00 0.00 0.00 8 Tenughat Dam Project 0.00 0.00 0.00 0.00 0.00 6245.86 9 Tilaiya Diversion Project 0.00 0.00 0.00 0.00 0.00 3395.72 0.00 0.00 0.00 0.00 0.00 Medium 10 Ajay Barrage Project 0.00 0.00 0.00 0.00 0.00 10259.05 0.00 0.00 0.00 0.00 0.00 11 Anjanwa Reservoir Scheme 0.00 0.00 0.00 0.00 0.00 2302.74 0.00 0.00 0.00 0.00 0.00 12 Anraj Reservoir Scheme 0.00 0.00 0.00 0.00 0.00 674.93 13 Badua Reservoir Project 0.00 0.00 0.00 0.00 0.00 811.91 14 Bagmati Irrigation Scheme 0.00 0.00 0.00 0.00 0.00 4097.93 15 Baksa Dam Scheme 0.00 0.00 0.00 0.00 0.00 197.24 16 Ban Sagar Dam Project 0.00 0.00 0.00 0.00 0.00 12198.17 17 Banki Lift Irrigation Scheme 0.00 0.00 0.00 0.00 0.00 136.34 18 Barner Reservoir Scheme 0.00 0.00 0.00 0.00 0.00 1984.55 19 Batane Reservoir 0.00 0.00 0.00 0.00 0.00 2529.66 0.00 0.00 0.00 0.00 0.00 20 Bateshwardhan pumping Scheme Ph-II 0.00 0.00 0.00 0.00 0.00 1706.40 0.00 0.00 0.00 0.00 0.00 21 Belharna Reservoir Project 0.00 0.00 0.00 0.00 0.00 1463.90 22 Bhagalpur Irrigation Scheme - - - - - - - 419.37 631.36 23 Bhairavanithippa project - - - - - - - - - 2940.97 694.52

165
Table D3: Capital Expenditure and Working Expenses during Tenth Plan Period for Major & Medium Irrigation Projects State and Project wise
(Rs. in lakhs) Sl. Name of the State/UT's and Capital Expenditure during the year Cumulative Working Expenses during the year No. Name of Major & Medium Irrigation Projects Capital Expenditure upto 2002-03 2003-04 2004-05 2005-06 2006-07 2006-07 2002-03 2003-04 2004-05 2005-06 2006-07 1 2 3 4 5 6 7 8 9 10 11 12 24 Bhairawa Reservoir Scheme 0.00 0.00 0.00 0.00 0.00 740.58 25 Bilasi Reservoir Scheme 0.00 0.00 0.00 0.00 0.00 1029.49 26 Chandan High Level Canal 0.00 0.00 0.00 0.00 0.00 1058.27 0.00 0.00 0.00 0.00 0.00 27 Chinda Reservoir Scheme 0.00 0.00 0.00 0.00 0.00 330.20 28 Chirka Reservoir Scheme 0.00 0.00 0.00 0.00 0.00 195.61 29 Dakra Nala Pump Scheme, Phase-I 0.00 0.00 0.00 0.00 0.00 2910.94 30 Dakra Nala Pump Scheme, Phase-II 0.00 0.00 0.00 0.00 0.00 594.58 31 Dhansinghtoli Reservoir Scheme 0.00 0.00 0.00 0.00 0.00 1482.54 32 Dudua Upper Nala Scheme 0.00 0.00 0.00 0.00 0.00 272.94 33 Durgawati Irrigation Scheme 0.00 0.00 0.00 0.00 0.00 3143.75 34 Eastern Kosi Canal Project 0.00 0.00 0.00 0.00 0.00 1611.30 35 Ganga Pumping Scheme at Chausa 0.00 0.00 0.00 0.00 0.00 820.48 36 Ghora Katora Dam 0.00 0.00 0.00 0.00 0.00 150.13 37 Gobai Irrigation Scheme 0.00 0.00 0.00 0.00 0.00 194.02 38 Gumani Reservoir Scheme 0.00 0.00 0.00 0.00 0.00 2986.90 39 Hiru Reservoir Scheme 0.00 0.00 0.00 0.00 0.00 208.24 40 Jaipur Reservoir Scheme - 0.00 0.00 0.00 0.00 311.33 41 Jamania pumping scheme 0.00 0.00 0.00 0.00 0.00 1817.58 42 Jharjhara Reservoir Scheme 0.00 0.00 0.00 0.00 0.00 123.28 43 Job Reservoir Scheme 0.00 0.00 0.00 0.00 0.00 116.95 44 Kamla and North Bihar Irrigation Proj. 0.00 0.00 0.00 0.00 0.00 106.63 0.00 2972.01 50.00 0.00 0.00 45 Kanchi Weir Scheme 0.00 0.00 0.00 0.00 0.00 1060.86 0.00 0.00 0.00 0.00 142.77

166
Table D3: Capital Expenditure and Working Expenses during Tenth Plan Period for Major & Medium Irrigation Projects State and Project wise
(Rs. in lakhs) Sl. Name of the State/UT's and Capital Expenditure during the year Cumulative Working Expenses during the year No. Name of Major & Medium Irrigation Projects Capital Expenditure upto 2002-03 2003-04 2004-05 2005-06 2006-07 2006-07 2002-03 2003-04 2004-05 2005-06 2006-07 1 2 3 4 5 6 7 8 9 10 11 12 46 Kansh Reservoir Scheme 0.00 0.00 0.00 0.00 0.00 865.89 47 Kansjore Reservoir Scheme 0.00 0.00 0.00 0.00 0.00 1734.77 48 Karamnasha Irrigation Scheme 0.00 0.00 0.00 0.00 0.00 134.14 49 Katri Reservoir Scheme 0.00 0.00 0.00 0.00 0.00 3335.73 50 Kesho Reservoir Scheme 0.00 0.00 0.00 0.00 0.00 322.11 51 Larma Pump Canal Scheme 0.00 0.00 0.00 0.00 0.00 146.79 52 Latia Reservoir Scheme 0.00 0.00 0.00 0.00 0.00 239.16 53 Latratu Reservoir Scheme 0.00 0.00 0.00 0.00 0.00 2620.19 54 Lower Kiul valley 0.00 0.00 0.00 0.00 0.00 127.34 55 Malay Reservoir Scheme 0.00 0.00 0.00 0.00 0.00 1356.00 56 Marajhir Reservoir Scheme 0.00 0.00 0.00 0.00 0.00 218.90 57 Masria Reservoir Scheme 0.00 0.00 0.00 0.00 0.00 157.87 58 Modernisation of Sone Canal 0.00 0.00 0.00 0.00 0.00 4769.07 59 Morwew Irrigation Scheme 0.00 0.00 0.00 0.00 0.00 133.06 60 Murahir Reservoir Scheme 0.00 0.00 0.00 0.00 0.00 402.42 61 Nakti Reservoir Scheme 0.00 0.00 0.00 0.00 0.00 1401.04 0.00 0.00 0.00 0.00 0.00 62 Nandini Reservoir Scheme 0.00 0.00 0.00 0.00 0.00 664.99 63 Orni Reservoir Scheme 0.00 0.00 0.00 0.00 0.00 4957.58 64 Paimar Irrigation Scheme 0.00 0.00 0.00 0.00 0.00 146.92 65 Palna Reservoir Scheme 0.00 0.00 0.00 0.00 0.00 636.57 66 Panch Kheswa Reseroir Scheme 0.00 0.00 0.00 0.00 0.00 552.13

167
Table D3: Capital Expenditure and Working Expenses during Tenth Plan Period for Major & Medium Irrigation Projects State and Project wise
(Rs. in lakhs)
Sl. Name of the State/UT's and Capital Expenditure during the year Cumulative Working Expenses during the year No. Name of Major & Medium Irrigation Projects Capital Expenditure upto 2002-03 2003-04 2004-05 2005-06 2006-07 2006-07 2002-03 2003-04 2004-05 2005-06 2006-07 1 2 3 4 5 6 7 8 9 10 11 12 67 Paras Reservoir Scheme 0.00 0.00 0.00 0.00 0.00 763.83 68 Phulwaria Reservoir 0.00 0.00 0.00 0.00 0.00 2763.61 69 Punasi Reservoir Scheme 0.00 0.00 0.00 0.00 0.00 4067.05 70 Ramrekha Reservoir Scheme 0.00 0.00 0.00 0.00 0.00 295.84 71 Roro Irrigation Scheme 0.00 0.00 0.00 0.00 0.00 117.87 72 Sakrigali Pump Scheme 0.00 0.00 0.00 0.00 0.00 952.96 73 Satpotka Reservoir Scheme Phase - I 0.00 0.00 0.00 0.00 0.00 281.60 74 Singh Barni Reservoir Scheme 0.00 0.00 0.00 0.00 0.00 763.90 75 Sonua Reservoir Scheme 0.00 0.00 0.00 0.00 0.00 2452.39 76 South Bihar Irrigation Projects - - - - - - - 694.03 1058.04 77 Sundar Reservoir Project 0.00 0.00 0.00 0.00 0.00 441.36 0.00 0.00 0.00 0.00 0.00 78 Surjgarha Apump Scheme 0.00 0.00 0.00 0.00 0.00 799.13 79 Surungi Reservoir Scheme 0.00 0.00 0.00 0.00 0.00 967.69 0.00 0.00 0.00 0.00 0.00 80 Tapkara Reservoir 0.00 0.00 0.00 0.00 0.00 2599.58 81 Toral Reservoir Scheme 0.00 0.00 0.00 0.00 0.00 2943.67 0.00 0.00 0.00 0.00 0.00 82 Understhan Irrigation Scheme 0.00 0.00 0.00 0.00 0.00 359.40 83 Upper Koel Reservoir Scheme 0.00 0.00 0.00 0.00 0.00 5769.55 0.00 0.00 0.00 0.00 0.00 84 Upper Shankh Reservoir Scheme 0.00 0.00 0.00 0.00 0.00 1153.52 85 Urita Danro Reservoir Scheme 0.00 0.00 0.00 - 0.00 424.59 86 Water distribution system from 0.00 0.00 0.00 0.00 0.00 193.25 87 Western Kosi Canal Project 0.00 0.00 0.00 0.00 0.00 10075.18 0.00 0.00 0.00 0.00 0.00

168
Table D3: Capital Expenditure and Working Expenses during Tenth Plan Period for Major & Medium Irrigation Projects State and Project wise
(Rs. in lakhs) Sl. Name of the State/UT's and Capital Expenditure during the year Cumulative Working Expenses during the year No. Name of Major & Medium Irrigation Projects Capital Expenditure upto 2002-03 2003-04 2004-05 2005-06 2006-07 2006-07 2002-03 2003-04 2004-05 2005-06 2006-07 1 2 3 4 5 6 7 8 9 10 11 12 Chhattisgarh Major 1 Arpa Project 0.00 0.00 0.00 0.00 0.00 5795.16 0.00 0.00 0.00 0.00 0.00 2 Hasdeo Barrage Project - - - 6193.43 14546.22 127462.45 407.44 234.65 262.46 297.13 512.96
3 Hasdeo Project - - - - - 630.75 - - - - -
4 Hasdeo Right Bank Canal - - - - 1417.92 - - - - -
5 Hasedo Bango Project 15965.13 17211.31 5852.58 446.14 332.20 4093.92 0.00 0.00 0.00 0.00 0.00
6 Jonk Project 579.15 431.18 109.23 - 3834.16 27.84 36.57 40.68 29.26 48.30
7 Kelo Project - 31.86 70.70 487.00 0.83 590.39 - - - - -
8 Kharang Water Tank - - - - - - 147.53 125.24
9 Kodar Project 47.05 152.53 89.75 276.49 467.05 3820.22 43.12 39.91 50.64 53.03 56.16 10 Mahanadi Project - - - 6462.48 4965.07 28981.83 78.46 449.16 402.47 927.38 484.15
11 Maniyari Water Tank - - - - - - 109.36 101.98
12 National Hydrology Project 685.77 146.18 106.15 - - 1455.59 - - - - -
13 Pairy Pariyojana 48.02 62.99 78.63 33.50 6.95 2424.14 110.55 181.29 182.96 122.29 248.33
14 Ravishankar Sagar Project 3142.26 4558.22 9966.39 - - 47630.15 - - - - -
15 Samoda Project 1193.63 504.82 1698.45 - - - - -
16 Sondoor Projecr 3996.49 2919.63 6916.12 - - - 132.27 100.41
17 Sukta Project - - - - - 334.96 - - - - -
18 Tandula Project 517.96 8997.8 2382.31 1450.01 13348.08 - 186.59 211.52 234.75 147.28
Medium
19 Ballar - - - - - 359.55 - - - 1.17 22.34

169
Table D3: Capital Expenditure and Working Expenses during Tenth Plan Period for Major & Medium Irrigation Projects State and Project wise
(Rs. in lakhs) Sl. Name of the State/UT's and Capital Expenditure during the year Cumulative Working Expenses during the year No. Name of Major & Medium Irrigation Projects Capital Expenditure upto 2002-03 2003-04 2004-05 2005-06 2006-07 2006-07 2002-03 2003-04 2004-05 2005-06 2006-07 1 2 3 4 5 6 7 8 9 10 11 12 20 Barari - - - - - - - - - 27.06
21 Barnai 220.23 29.89 400.00 - - - - -
22 Bichiya Tank Project - - - - - 211.18 - - -
23 Churpani/Chirpani - - - - - 2151.26 - - - 31.25 18.63
24 Devendera Nagar Project - - - - - - - - - -
25 Dhara - - - - - - - 2.16
26 Dudhwa Tank Project - - - - - - - - - - -
27 Gej Project 0.00 0.00 0.00 78.88 0.00 345.35 0.00 0.00 0.00 15.59 2.56 28 Ghonga 0.00 0.00 0.00 0.00 0.00 0.00 187.51 0.00 0.00 25.43 25.41 29 Ghumaria Nala 296.42 704.88 1001.30 - - - - -
30 Gnadhi Head Works and Re-modeling - - - - - 102.87 - - - - -
31 Gondi - - - - - - - 10.64
32 Hasdeo Tank Project - - - - - 1104.35 - - - - -
33 Jhiram Nadi - - - - - - 28.83 13.70
34 Jhumka Project - - - - - - 106.46 - - - 14.99
1 2 3 4 5 6 7 8 9 10 11 12 35 Kadar Nala - - - - - - 0.46
36 Kanhar Gaon 61.37 45.14 220.35 - - 375.49 - - - - -
37 Kapri - - - - - - - 15.94
38 Karra Nala - 499.93 499.93 - - - - -
39 Kerva Project - - - - - 165.87 - - - - -
40 Keswa Nala Project - - - - - - - - - - 9.02

170
Table D: Capital Expenditure and Working Expenses during Tenth Plan Period for Major & Medium Irrigation Projects State and Project wise
(Rs. in lakhs) Sl. Name of the State/UT's and Capital Expenditure during the year Cumulative Working Expenses during the year No. Name of Major & Medium Irrigation Projects Capital Expenditure upto 2002-03 2003-04 2004-05 2005-06 2006-07 2006-07 2002-03 2003-04 2004-05 2005-06 2006-07 1 2 3 4 5 6 7 8 9 10 11 12 41 Kharkhara Project 0.00 0.00 0.00 532.01 1672.83 2738.10 0.00 0.00 0.00 0.00 9.18 42 Kinkari Nalla - - - - - 107.87 - - - - 0.48
43 Kosarteda 1.90 592.28 594.18 - - - - -
44 Kumhar Pakut - - - - - - 9.17 11.04
45 Kuwarpuram - - - - - - - 10.30
46 Mand Division - - - 1134.43 48.04 1387.88 - - - - 1.41
47 Maroda - - - - - - 14.84
48 Mata Sutiyapat - - 290.97 - - 290.97 - - - - -
49 Matiya Moti 0.00 0.00 0.00 0.00 0.00 1427.77 0.00 0.00 0.00 12.57 10.24 50 Mayana - - - - - - 3.06 3.03
51 Mongra Project - 340.76 6997.25 3450.73 2810.98 13599.72 - - - - -
52 Paralkot - - - - - - 27.25
53 Pindvani 0.00 0.00 0.00 0.00 0.00 0.00 0.00 0.00 0.00 0.25 16.81 54 Piparia Branch Canal 0.00 0.00 0.00 0.00 0.00 982.11 0.00 0.00 0.00 13.36 12.34 55 Putka - - - - - - 0.04
56 Remodeling Mahanadi Canal - - - - 362.95 - - - - -
57 Russey - - - - - - 6.53 3.97
58 Sanoda 4065.08 299.98 4365.06 - - - - -
59 Saroda - - - - - - 10.63 20.43
60 Shivnath Diversion Project 0.00 0.00 0.00 0.00 0.00 282.23 0.00 0.00 0.00 25.62 5.93 61 Shyam Ghungutta - 84.96 84.96 - - - 30.57 28.08
62 Sukha Nala 821.39 1011.13 1832.52 - - - - -

171
Table D3: Capital Expenditure and Working Expenses during Tenth Plan Period for Major & Medium Irrigation Projects State and Project wise
(Rs. in lakhs) Sl. Name of the State/UT's and Capital Expenditure during the year Cumulative Working Expenses during the year No. Name of Major & Medium Irrigation Projects Capital Expenditure upto 2002-03 2003-04 2004-05 2005-06 2006-07 2006-07 2002-03 2003-04 2004-05 2005-06 2006-07 1 2 3 4 5 6 7 8 9 10 11 12
63 Suthiya Pat 952.48 2186.95 3139.43 - - - - -
64 Tendula Tank - - - - - - - - - - -
65 Tilwara Project - - - - 1945.3 - - - - -
66 Upper Jonk 344.18 344.18 - - - - 3.00
Goa
Major
1 Anjunem Medium Irrigation Project 64.71 12.63 147.54 25.83 405.90 3582.01 - - - - -
2 Daman Ganga Reservoir Project - - - - 752.37 - - - - -
3 Hydrology Project Phse-II - - - 176.16 -
4 Mandovi Irrigation Project 23.62 88.03 64.10 24.03 221.31 - - - - -
5 Salauli Irrigation Project 607.76 493.07 465.83 433.33 390.31 16738.88 - - - - -
6 Tilari Irrigation Project - - - 11746.86 33782.47 - - - - -
Gujarat
Major
1 Bajaj Sagar Project 0.00 0.05 2793.91 0.00 36.00 7576.01 2 Banas Valley Project - - - - - - 242.43 247.85 280.34 76.01 263.17
3 Constructing High Level canal from Panam Reservoir
0.00 0.00 0.00 0.00 0.00 36.58
4 Damanganga River Project 0.00 0.00 0.00 0.00 0.00 19438.29 343.33 405.51 374.81 355.47 843.67 5 Dharoi Right Bank loop Canal Scheme 15.53 0.00 0.00 0.00 0.00 26.84 6 Fatewadi Irrigation Scheme 0.00 1.59 0.19 0.00 0.00 3961.63 70.10 53.24 78.04 132.51 126.66 7 Hathmati Reservoir Project - - - - - - 124.64 98.36 135.17 297.53 285.43

172
Table D3: Capital Expenditure and Working Expenses during Tenth Plan Period for Major & Medium Irrigation Projects State and Project wise
(Rs. in lakhs) Sl. Name of the State/UT's and Capital Expenditure during the year Cumulative Working Expenses during the year No. Name of Major & Medium Irrigation Projects Capital Expenditure upto 2002-03 2003-04 2004-05 2005-06 2006-07 2006-07 2002-03 2003-04 2004-05 2005-06 2006-07 1 2 3 4 5 6 7 8 9 10 11 12 8 Completed Major Irrigation Project 1687.27 153.72 99.56 51.72 1990.94 16076.43
9 Kadana Project - - - - - - 414.40 352.74 394.52 365.87 497.20 10 Kakrapara Project 0.00 0.00 0.00 0.00 0.00 6651.08 595.80 716.95 860.84 736.58 1577.00 11 Karjan Project 0.00 0.00 0.00 0.00 0.00 157.87 147.55 272.42 143.88 344.93 12 Narmada Project 19.18 16.27 9.20 1.58 0.00 633201.52 0.00 0.00 0.00 0.00 0.00 13 Panam Project 1.88 0.15 0.04 6.08 0.00 9403.52 499.26 371.10 394.37 383.82 718.34 14 Sabarmati Project 50.63 127.05 27.05 18.88 23.30 12894.08 312.93 362.17 560.74 347.60 512.03 15 Reconstruction of Machhu-II Irrigation Project 0.00 0.00 0.00 5048.94 16 Salinity Ingress Prevention Scheme 668.59 482.25 2496.32 717.72 0.00 27864.60 36.59 10.27 7.94 38.16 123.71 17 Shetrunji Irrigation Project - - - - - - 123.18 172.45 156.67 128.32 270.55 18 Sipu Irrigation Project 5.51 0.00 0.00 0.00 0.00 12107.11 0.00 0.00 0.00 0.00 0.00 19 Strengthening of Machhu-I 0.00 0.00 0.00 0.00 0.00 131.03 20 Triba Area Sub-Plan -97.04 118.26 103.39 61.51 637.40 10062.11 21 Sukhi Irrigation Scheme 4.34 0.00 0.00 0.00 0.65 11764.19 104.37 88.83 163.67 149.97 231.46 22 Ukai Project 0.00 0.00 0.16 0.00 0.00 15559.89 998.94 804.14 839.38 854.59 1542.17 23 Watrak Irrigation Scheme 34.32 34.53 0.00 0.00 0.00 7150.36 102.50 103.38 108.56 93.49 141.21 Medium
24 Banas Valley Project (Dantiwada Weir-Scheme)
0.66 0.00 0.00 0.00 5569.85
25 Guhai Reservoir Project (Guhai Irrigation Scheme)
3.45 -0.25 0.77 15.08 19.50 6247.12
26 Hatmati Reservoir Modernisation Project 0.00 0.00 0.00 0.00 820.89
27 Hiran Irrigation Scheme 0.00 0.00 0.00 0.00 518.02

173
Table D3: Capital Expenditure and Working Expenses during Tenth Plan Period for Major & Medium Irrigation Projects State and Project wise
(Rs. in lakhs) Sl. Name of the State/UT's and Capital Expenditure during the year Cumulative Working Expenses during the year No. Name of Major & Medium Irrigation Projects Capital Expenditure upto 2002-03 2003-04 2004-05 2005-06 2006-07 2006-07 2002-03 2003-04 2004-05 2005-06 2006-07 1 2 3 4 5 6 7 8 9 10 11 12 28 Mazam Irrigation Scheme 3.91 0.00 0.76 0.00 3363.13 29 Shetrunji Irrigation Project 0.00 0.00 0.00 0.00 3737.78
Tribal Sub Plan
30 Aji Irrigation Scheme 295.00 165.32 731.21 131.76 208.09 12999.19 0.00 0.00 0.00 0.00 0.00 31 Ambajal Irrigation Scheme 0.00 0.00 0.00 0.00 100.62 32 Amipur Irrigation Scheme 5.94 2.00 0.00 0.00 0.00 1365.52 33 Augmentation of Surface Water Recharge 4217.29 12648.38 15069.53 0.00 25.66 33147.16 34 Bagad Irrigation Scheme 0.00 0.00 0.00 36.27 0.00 434.69 35 Bakrol Irrigation Scheme 15.77 0.00 0.00 0.00 105.10 36 Baldeva Irrigation Scheme 0.00 0.00 0.00 0.00 78.33 37 Basin Planning of Sabarmati 0.00 0.00 0.00 85.48 0.00 85.48 38 Berachia Irrigation Scheme 0.00 0.00 0.00 0.00 97.55 39 Bhadar Irrigation Scheme 220.07 340.85 318.52 87.35 543.84 15156.12 0.00 0.00 0.00 0.00 0.00
40 Bhadar water resources project 0.00 0.00 0.00 0.00 24.96
41 Bhoghavo Irrigation Scheme 0.00 0.00 0.00 0.00 80.15 42 Bhugalwadi Irrigation Scheme 0.00 0.00 0.00 0.00 182.60 43 Bhukhi Irrigation Scheme 0.00 0.00 0.00 0.00 187.42 44 Brahamani Irrigation Scheme 0.00 0.00 0.00 0.00 5.45
45 shingoda irrigation scheme 1.48 0.00 0.00 0.00 1.48 46 Chaparwadi Irrigation Scheme(Near Lunivav) 34.00 0.00 0.00 0.00 0.00 561.48 0.00 0.00 0.00 0.00 0.00
47 Kakarapar and Ukai Right Bank Canal
0.00 0.00 0.00 0.00 318.75

174
Table D3: Capital Expenditure and Working Expenses during Tenth Plan Period for Major & Medium Irrigation Projects State and Project wise
(Rs. in lakhs) Sl. Name of the State/UT's and Capital Expenditure during the year Cumulative Working Expenses during the year No. Name of Major & Medium Irrigation Projects Capital Expenditure upto 2002-03 2003-04 2004-05 2005-06 2006-07 2006-07 2002-03 2003-04 2004-05 2005-06 2006-07 1 2 3 4 5 6 7 8 9 10 11 12 48 Construction of pick weir on Sabarmati river 1.81 17.29 39.98 0.00 0.00 59.08 49 Construction of weir on down stream of Mahi river 8.69 1.03 519.71 0.00 1036.53 1565.96 - 0.00 50 Construction of weir on river Sabarmati 2.01 213.49 0.00 0.00 215.50 51 Dai(Minsar)Irrigation Scheme 0.00 0.00 0.00 0.00 257.49 52 Dam Safety Works of Irrigation Scheme 30.23 29.01 0.00 42.75 157.48 5295.90 0.00 0.00 0.00 0.00 0.00 53 Datarwadi Irrigation Scheme 0.00 0.00 0.00 0.00 0.00 166.41 0.00 0.00 0.00 0.00 0.00 54 Demi Irrigation Scheme 196.97 126.78 169.40 231.65 142.98 4190.64 0.00 0.00 0.00 0.00 0.00 55 Deo Irrigation Scheme 1.23 3.19 0.00 0.00 26.23 5018.40 56 Dhari Irrigation Scheme 0.00 0.00 0.00 0.00 25.27 57 Dharoi left Bank High level Canal 0.00 0.00 0.00 0.00 0.00 2.89 58 Don Irrigation Scheme 0.00 0.00 0.00 0.00 115.63 59 Extension of Dantiwada Project 0.00 0.00 0.00 0.00 0.00 0.47 60 Extension of Dharoi Right Bank Main Canal 350.48 890.56 0.44 0.00 0.00 1781.06 61 Extension on Irrigation Chanels 40 Hec. Chak to 8H 13.72 12.80 5.62 0.00 2.75 2541.55 62 Falka Irrigation Scheme 0.00 0.00 0.00 0.00 0.00 1442.80 0.00 0.00 0.00 0.00 0.00 63 Fatehgadh Irrigation Scheme 1.27 -23.00 0.00 0.00 0.00 172.42 0.00 0.00 0.00 0.00 0.00 64 Fulzar Irrigation Scheme 0.00 0.00 0.00 0.00 0.00 106.55 0.00 0.00 0.00 0.00 0.00 65 Gajod Irrigation Scheme 0.00 0.00 0.00 0.00 30.33 66 Godhadhari Irrigation Scheme 0.00 0.00 0.00 0.00 394.02 67 Godhatad Irrigation Scheme 0.00 0.00 0.00 0.00 0.00 77.14 0.00 0.00 0.00 0.00 0.00 68 Goma Vadodara Irrigation Scheme 4.66 15.87 27.36 7.55 8.75 774.70 0.00 0.00 0.00 0.00 0.00 69 Gonda Irrigation Scheme 0.00 0.00 0.00 0.00 24.39

175
Table D3: Capital Expenditure and Working Expenses during Tenth Plan Period for Major & Medium Irrigation Projects State and Project wise
(Rs. in lakhs) Sl. Name of the State/UT's and Capital Expenditure during the year Cumulative Working Expenses during the year No. Name of Major & Medium Irrigation Projects Capital Expenditure upto 2002-03 2003-04 2004-05 2005-06 2006-07 2006-07 2002-03 2003-04 2004-05 2005-06 2006-07 1 2 3 4 5 6 7 8 9 10 11 12 70 Gujansar Irrigation Scheme 0.00 0.00 0.00 0.00 0.00 4.97 71 Hadaf Irrigation Scheme 0.00 0.00 0.00 0.00 2767.85 72 Hamirpur Irrigation Scheme 0.00 1.39 0.00 0.00 0.00 68.75 73 Harnav River Scheme 0.00 0.00 0.00 0.00 34.58 74 Hathi Pagla Irrigation Scheme 0.00 0.00 0.00 0.00 0.10 75 Hathmati and K.C.C.System 0.00 0.00 0.00 0.00 180.00 76 Hiran-II Irrigation Scheme 0.00 0.00 0.00 0.00 580.95 77 Improvement of Irrigation Management 53.77 38.29 76.77 93.53 285.91 2455.37 78 Improving the Drainage in Surat 0.00 0.00 0.00 0.00 54.56 79 Ishwaria Irrigation Scheme 0.00 0.00 0.00 0.00 124.39 80 Jagadia Irrigation Scheme 0.00 0.00 0.00 0.00 212.14 81 Jojwa Wadhwan Irrigation Scheme 0.00 0.00 0.00 0.00 276.17 82 Kabutri Irrigation Scheme 0.00 0.00 0.00 0.00 16.89 83 Kadana Left Bank High Level Canal 0.00 0.00 0.00 0.00 0.00 12.08 84 Kadana Project 83.18 11859.36 85 Kadana Recharge Canal 0.00 4.24 0.00 0.00 0.00 10.56 86 Kadana Reservoir Project 85.00 80.46 136.33 93.80 0.00 890.24 87 Kaila Irrigation Scheme 0.00 0.03 0.00 0.00 0.00 59.42 88 Kakarapar Modernisation Scheme 1.09 0.00 0.00 0.00 89 Kakrapar Irrigation Project 0.00 1424.33 90 Kalagodha Irrigation Scheme 0.00 0.00 0.00 0.00 205.55 91 Kalindri Irrigation Scheme 0.78 0.00 0.00 6.28 0.00 464.38

176
Table D3: Capital Expenditure and Working Expenses during Tenth Plan Period for Major & Medium Irrigation Projects State and Project wise
(Rs. in lakhs) Sl. Name of the State/UT's and Capital Expenditure during the year Cumulative Working Expenses during the year No. Name of Major & Medium Irrigation Projects Capital Expenditure upto 2002-03 2003-04 2004-05 2005-06 2006-07 2006-07 2002-03 2003-04 2004-05 2005-06 2006-07 1 2 3 4 5 6 7 8 9 10 11 12 92 Kalubhar Irrigation Scheme 0.00 0.00 0.00 0.29 0.45 2087.53 93 Kankavati Irrigation Scheme 0.00 0.00 0.00 0.00 69.86 94 Karad Irrigation Scheme 0.00 0.00 0.00 0.00 127.64 95 Karad Tank Scheme 0.00 0.00 0.00 0.00 97.38 96 Karmal Irrigation Scheme 0.03 0.00 0.00 0.00 448.79 97 Kaswati Irrigation Scheme 0.00 0.00 0.00 0.00 85.25 98 khambhalav Irrigation Scheme 0.00 0.00 0.00 0.00 357.43 99 Khankhi jadia Irrigation Scheme 0.00 0.00 0.00 0.00 66.60 100 Kharicut Modernisation Scheme 0.00 0.00 0.00 101 Khedra Irrigation Scheme 0.00 0.00 0.00 0.00 1.36 102 Khodiar (Shetrunji) Project 0.00 0.00 0.00 0.00 202.22 103 Khura Irrigation Sceme 0.00 0.00 0.00 0.00 355.72 104 kotda Bavisi Irrigation Scheme 0.00 0.00 0.00 0.00 2..06 105 Lakhanko Irrigation Scheme 0.00 0.00 0.00 0.00 141.67 106 Lift Irrigation Scheme in Ukai Project Area 0.00 0.00 0.00 0.00 242.33 107 Limbdi Irrigation Scheme 48.22 20.00 55.31 4.99 27.50 5265.37 0.00 0.00 0.00 0.00 0.00 108 Kadana Right Bank Canal 0.00 0.00 164.67 0.00 9.20 184.26 0.00 0.00 0.00 0.00 0.00 109 Macchu-II Irrigation Scheme 9.68 0.00 12.98 0.00 0.00 120.86
110 Machhan Nala Irrigation Scheme 0.00 0.00 0.00 0.00 56.96 111 Machhandri Irrigation Scheme 0.00 0.00 0.00 0.00 142.57 112 Machhu Irrigation Scheme Stage-I 0.00 0.00 0.00 0.00 1216.46 113 Machhu-III Irrigation Scheme 5.59 0.13 249.97 0.00 -14.00 274.09

177
Table D3: Capital Expenditure and Working Expenses during Tenth Plan Period for Major & Medium Irrigation Projects State and Project wise
(Rs. in lakhs) Sl. Name of the State/UT's and Capital Expenditure during the year Cumulative Working Expenses during the year No. Name of Major & Medium Irrigation Projects Capital Expenditure upto 2002-03 2003-04 2004-05 2005-06 2006-07 2006-07 2002-03 2003-04 2004-05 2005-06 2006-07 1 2 3 4 5 6 7 8 9 10 11 12 114 Machhundri Irrigation 0.43 0.00 0.00 4.99 66.94 2298.32 115 Mahi Canal Project 0.29 1.72 0.00 -0.15 0.00 5852.49 1009.60 844.02 1251.41 1159.96 1852.14 116 Malan Irrigation Scheme 0.00 0.00 0.00 0.00 40.62 117 Malgadh Irrigation Scheme 0.00 0.00 0.00 0.00 83.19 118 Mandhuvanti Irrigation Scheme 0.00 71.01 119 Manjisar Irrigation Scheme 0.00 0.00 0.00 0.00 0.00 50.00 120 Meshwa Irrigation Scheme 0.00 0.00 0.00 0.00 496.00 121 Mitty Irrigation Scheme 0.00 0.00 0.00 0.00 119.85 122 Modernisation of Old Irrigation Scheme 58.06 33.25 9.20 12.99 0.21 4882.01 123 Moj Irrigation Scheme 0.00 0.00 0.00 0.00 142.85 124 Morsal Irrigation Scheme 0.00 0.00 0.00 0.00 2.10 125 Motisar Irrigation Scheme 0.00 0.00 0.00 0.00 441.28 126 Mukteshwar Irrigation Scheme 125.87 174.37 210.26 4.42 79.97 4203.61 127 Muthal Irrigation Scheme 0.00 0.00 0.00 0.00 212.46 128 Nara Irrigation Scheme 2.25 0.00 0.00 0.00 0.00 247.49 129 National Hydrological Project with external aid 464.58 613.27 46.26 12.66 94.78 6623.88 130 Nayari-II Irrigation Scheme 0.00 0.00 0.00 0.00 521.03 131 Niruna Irrigation Scheme 1.55 0.00 0.00 0.00 0.00 108.26 132 Orsang Water Resources Project 0.00 0.00 0.00 0.00 0.00 0.00 133 Ozat Irrigation Scheme 189.99 106.04 163.96 0.00 120.81 8691.45 0.00 0.00 0.00 0.00 0.00 134 Patadungri Irrigation Scheme 0.00 0.00 0.00 0.00 0.00 197.09 0.00 0.00 0.00 0.00 0.00 135 Phad-Dang Betti Irrigation Scheme 0.00 0.00 0.00 0.00 1.57

178
Table D3: Capital Expenditure and Working Expenses during Tenth Plan Period for Major & Medium Irrigation Projects State and Project wise
(Rs. in lakhs) Sl. Name of the State/UT's and Capital Expenditure during the year Cumulative Working Expenses during the year No. Name of Major & Medium Irrigation Projects Capital Expenditure upto 2002-03 2003-04 2004-05 2005-06 2006-07 2006-07 2002-03 2003-04 2004-05 2005-06 2006-07 1 2 3 4 5 6 7 8 9 10 11 12 136 Phophal Irrigation Scheme 0.00 0.00 0.00 0.00 0.00 583.42 137 Pighat Irrigation Scheme 0.00 0.00 0.00 0.00 104.34 138 Raidy Irrigation Scheme 0.00 0.91 0.00 0.00 0.00 896.30 139 Rajval Irrigation Scheme 0.00 0.00 0.00 0.00 400.28 140 Rajwasana Irrigation cheme 0.00 0.00 0.00 0.00 116.87 141 Rana Khirasara Water Resources Project 1.00 0.00 0.76 0.00 0.00 716.04 - 0.00 142 Ranghola Irrigation Scheme 0.00 0.00 0.00 0.00 82.29 143 Rangmati IrrigationScheme 0.00 0.00 0.00 0.00 105.04 144 Rauni Irrigation Scheme 0.00 0.00 0.00 0.00 0.11 145 Raval Irrigation Scheme 0.00 0.00 0.00 0.00 814.33 146 Rehabilitation of old canal system 99.85 21.03 20.68 3.49 86.16 10640.07 147 Restoration of Mitty Irrigation Scheme -0.72 0.00 0.00 0.00 2610.17 148 Rojki Irrigation Scheme 0.00 0.00 0.00 0.00 26.29 149 Rudramata Irrigation Scheme 0.00 0.00 0.00 0.00 88.08 150 Sakrola Irrigation Scheme 0.00 0.00 0.00 0.00 27.71 151 Sanandro Irrigation Scheme 0.00 0.00 0.00 0.00 26.22 152 Sani Irrigation Scheme 0.00 0.00 0.00 0.00 1043.30
153 Santli Irrigatgion Scheme 4.90 2.00 1.98 0.51 1.80 35.63 154 Saran Water Resources Project-III 0.00 0.00 0.00 0.00 0.49 155 Sarangpur Gala Irrigation Scheme 0.00 0.00 0.00 0.00 3.51 156 Saraswati Irrigation Scheme 0.00 0.00 0.00 0.00 211.44

179
Table D3: Capital Expenditure and Working Expenses during Tenth Plan Period for Major & Medium Irrigation Projects State and Project wise
(Rs. in lakhs) Sl. Name of the State/UT's and Capital Expenditure during the year Cumulative Working Expenses during the year No. Name of Major & Medium Irrigation Projects Capital Expenditure upto 2002-03 2003-04 2004-05 2005-06 2006-07 2006-07 2002-03 2003-04 2004-05 2005-06 2006-07 1 2 3 4 5 6 7 8 9 10 11 12 157 Scheme for augmentive storage capacity 86.64 59.00 397.03 59.62 73.87 3828.68 158 National Water Management Programme 0.00 0.00 0.00 0.00 530.84 159 Shell Dedwamal Irrigation Scheme 0.00 0.00 0.00 0.00 0.35 160 Sindhari Irrigation Scheme 0.00 0.00 0.00 0.00 0.59 161 Sindhari Irrigation Scheme 0.00 0.00 0.00 72.25 0.00 591.43 162 Singoda Water Resources Project 0.00 0.00 0.00 0.00 0.00 163 Sonamati Irrigation Scheme 0.00 0.00 0.00 0.00 191.67 164 Sorathi Irrigation Scheme 0.00 0.00 0.00 - 0.00 70.86 165 Sukhbhadar Irrigation Scheme 2.88 2.91 0.00 0.00 3.52 2428.37 166 Surajwadi Irrigation Scheme 0.00 0.00 0.00 0.00 30.18 167 Suvai Irrigation Scheme 0.00 0.00 0.00 0.00 18.62 168 Suvi Irrigation Scheme 0.97 0.00 0.00 0.00 59.32 169 Thebi Water Resources Scheme 0.00 0.00 0.00 0.00 0.37 170 Uben Irrigation Scheme 0.35 0.00 51.90 0.00 9.09 1538.63 171 Umaria Irrigation Scheme 0.00 0.00 0.00 0.00 22.90 172 Umreecha Irrigation Scheme 0.09 0.00 40.48 180.00 531.04 751.89 173 Und Irigation Scheme 0.00 0.00 0.00 0.00 1634.41 174 Und(Jivapur)Irrigation Scheme 0.00 1.27 0.00 0.00 0.00 2285.72 175 Und-II Irrigation Scheme 40.00 34.88 50.05 88.99 41.00 6496.61 176 Utavali(Gunda) Irrigation Scheme 172.00 37.78 57.50 13.43 - - 177 Vadgam Irrigation Scheme 0.00 0.00 0.00 0.00 0.00 3.90 178 Vadhvan Bhogavo-III Water Resources Project 0.00 0.00 0.00 0.00 0.00 0.00

180
Table D3: Capital Expenditure and Working Expenses during Tenth Plan Period for Major & Medium Irrigation Projects State and Project wise
(Rs. in lakhs)
Sl. Name of the State/UT's and Capital Expenditure during the year Cumulative Working Expenses during the year No. Name of Major & Medium Irrigation Projects Capital Expenditure upto 2002-03 2003-04 2004-05 2005-06 2006-07 2006-07 2002-03 2003-04 2004-05 2005-06 2006-07 1 2 3 4 5 6 7 8 9 10 11 12 179 Vadia Khambhi Jadia Irrigation Scheme 0.00 0.00 0.00 0.00 736.75 180 Varadi Irrigation Scheme 0.00 0.00 0.00 0.00 12.76 181 Varajani Irrigation Scheme 0.00 0.00 0.00 0.00 66.25 182 Varansi Irrigation Scheme 184.91 130.02 122.00 22.00 91.99 615.21 183 Venu-II Irrigation Scheme 0.00 1.74 0.00 0.00 2241.29 184 Veradi Irrigation Scheme 0.00 0.00 0.00 0.00 0.03 185 Vertu-II Irrigation scheme 104.24 63.20 91.82 41.93 65.72 8045.05 186 Wadhvan Bhoghavo Irrigation Scheme 0.00 0.00 0.00 0.00 81.31 187 Waidy Irrigation Scheme 0.00 0.00 0.00 0.00 83.03 188 Wartoo Irrigation Scheme 0.00 0.00 0.00 0.00 66.38 189 Water Resources Consolidation Project 0.00 0.00 0.00 0.00 0.00 0.00 190 Zanjesari Irrigation Scheme 0.00 0.00 0.00 0.00 113.41 Haryana Major 1 Augmentation Canal Project 5.51 2 Barwala Link Scheme 78.22 3 Budkhal and Suraj Kund Lake 13.45 4 Canal Project 689.28 5 Constructing New Tejewala Barrage 6 Construction of Hathni Kund Barrage 733.77 4631.77 24152.59
7 Extension of Existing Channels 10111.46

181
Table D3: Capital Expenditure and Working Expenses during Tenth Plan Period for Major & Medium Irrigation Projects State and Project wise
(Rs. in lakhs) Sl. Name of the State/UT's and Capital Expenditure during the year Cumulative Working Expenses during the year No. Name of Major & Medium Irrigation Projects Capital Expenditure upto 2002-03 2003-04 2004-05 2005-06 2006-07 2006-07 2002-03 2003-04 2004-05 2005-06 2006-07 1 2 3 4 5 6 7 8 9 10 11 12 8 Fatehabad Branch 0.05 9 Gurgaon Canal Project 3215.38 0.16 6.84 0.11 0.14 10 Hissar Bhakhara Canal Project 39.35 11 Jawahar Lal Nehru Canal Project 96.36 178.53 464.13 1326.27 18592.90 4090.52 5918.33 3274.78 233.42 7315.66 12 Jhajjar Lift Irrigation Scheme 83.36 13 Jui Canal Project including increasing capacity 8.84 0.00 0.00 0.00 0.00 1138.20 620.59 373.81 360.69 0.00 0.00 14 Kotla Bhindwas and Otoo 784.05 15 Ladwa Irrigation Scheme 0.00 0.00 0.00 0.00 0.00 0.01 0.00 0.00 0.00 0.00 0.00 16 Lining Channels and Institutional Strengthening 95.70 135.39 11725.80 17 Lining Delhi Parllel Branch 687.34 18 Loheru Lift Irrigation Project 108.41 68.26 26.64 19.25 4704.83 1643.46 784.50 978.63 1787.11 2840.62 19 Modernisation and Lining of Canal System in (HR) 65957.82 20 Munak Canal Scheme 96.68 746.52 21 Naggal Lift Irrigation Scheme 216.67 0.00 0.00 0.00 0.00 638.25 0.38 0.65 3.94 0.00 0.00 22 Nalvi Irrigation Scheme 11145.78 1440.22 1440.22 23 National Water Management Project of Jui Canal 300.15 216.45 24 Raising Capacity of Bibipur Lake 207.58 25 Rehablitation of existing Channels 3314.84 8019.04 8099.44 26 Repairing/Renovation of Irrigation Channels 13011.62 13829.82 27 Rewari Irrigation Scheme 2.28 28 Sewani Lift Irrigation Project 0.00 0.00 0.00 0.00 0.00 2945.30 655.93 150.35 670.13 890.50 1233.29 29 Sutlej Yamuna Link Project 3553.23 108.05 1863.60 26367.01 3.70 2.99 6.60 17.56 5.18

182
Table D3: Capital Expenditure and Working Expenses during Tenth Plan Period for Major & Medium Irrigation Projects State and Project wise
(Rs. in lakhs) Sl. Name of the State/UT's and Capital Expenditure during the year Cumulative Working Expenses during the year No. Name of Major & Medium Irrigation Projects Capital Expenditure upto 2002-03 2003-04 2004-05 2005-06 2006-07 2006-07 2002-03 2003-04 2004-05 2005-06 2006-07 1 2 3 4 5 6 7 8 9 10 11 12 30 Water Resources Consolidated Project 2661.07 31 Western Jamuna Canal 0.00 0.00 0.00 21751.33 0.00 5408.22 464.55 909.28 0.00 24596.90 29163.01 Himachal Pradesh Major 1 Balh Valley Project 0.00 0.00 152.78 0.00 0.00 2 Bhabour Sahib Project 0.00 0.00 840.01 0.00 0.00 3 Changer Area Irrigation Project 0.00 0.00 101.06 0.00 0.00 4 Flow Irrigation Scheme Sidhara 0.00 0.00 261.96 0.00 0.00 5 Shah Nehar Project -546.84 1200.00 1053.75 0.00 0.00 1290.00 0.00 0.00 0.00 0.00 106.07 Medium 6 Balh Valley Project 0.00 0.00 0.00 0.00 250.47 1354.44 39.78 57.44 62.90 92.10 20.04 7 Bhabour Sahib Project 0.00 0.00 442.15 90.47 100.25 107.56 228.25 114.00 8 Changer Area Irrigation Project 75.00 100.00 141.68 323.14 704.30 1495.83 0.00 0.00 0.00 0.00 73.50 9 Flow Irrigation Scheme Sidhata 100.00 0.00 300.00 909.96 1309.85 3228.12 0.00 0.00 0.00 0.00 52.27 10 Giri Bata Project 0.00 0.00 864.88 136.50 153.96 191.01 153.95 83.10 11 Halti Sunrag Batanta Project 0.00 0.00 10.00 10.25 0.00 0.00 12 Kirpal Chand Kuhl Project 13 Lift Irrigation Scheme, Bhargaon 0.00 0.00 0.30 0.00 0.00 14 Phena Singh Canal Project 0.00 245.00 0.00 0.00 10.00 15.32 0.00 0.00 0.00 0.00 0.00 15 Shah Nehar Project 0.00 0.00 221.10 0.00 0.00 41.54 16 Survey River Project 0.00 0.00 0.00 0.00 0.00 50.51 0.00 0.00 0.00 0.00 0.00

183
Table D3: Capital Expenditure and Working Expenses during Tenth Plan Period for Major & Medium Irrigation Projects State and Project wise
(Rs. in lakhs) Sl. Name of the State/UT's and Capital Expenditure during the year Cumulative Working Expenses during the year No. Name of Major & Medium Irrigation Projects Capital Expenditure upto 2002-03 2003-04 2004-05 2005-06 2006-07 2006-07 2002-03 2003-04 2004-05 2005-06 2006-07 1 2 3 4 5 6 7 8 9 10 11 12 Jammu & Kashmir Major 1 Ahizi Canal - 43.87 125.75 55.00 49.99 198.86 - - - - - 2 ANS Irrigation Scheme - - 513.78 - 1118.82 2495.46 - - - - - 3 Awantipora Canal - - - - - - 15.97 0.59 8.00 - - 4 Baramulla Lift Irrigation Scheme - 182.35 74.59 399.00 - 457.17 - - - - - 5 Dadi Canal - 121.94 50.00 170.01 312.62 789.77 13.23 4.89 - - - 6 Dudder Canal/Raya Lift Scheme - 69.09 97.05 45.46 19.47 231.47 14.00 14.65 17.61 19.50 7.00 7 Kashtigarh Canal - - - - - - 9.27 8.34 16.11 19.84 1.73 8 Kathua Feeder Canal 52.84 280.26 242.50 686.81 15.00 1470.44 17.83 16.04 9.94 14.01 52.86 9 Koil Lift Irrigation Scheme 129.90 562.70 264.48 14.18 25.33 1685.82 - - - - - 10 Lar Canal - - - - 91.29 91.29 - - - - - 11 Lethpora Lift Scheme 20.95 78.39 60.86 49.21 0.52 801.56 9.13 2.03 0.92 8.53 12 Manwal Zoura Irrigation Scheme - - 12.27 50.77 - 180.79 - - - - - 13 Martand Canal - 67.36 185.20 98.03 9.72 272.16 12.96 0.61 - - - 14 Marval Lift Scheme 177.23 173.55 142.14 5.64 10.88 1857.50 0.24 9.65 0.48 15 Modernisation of Canal 9.40 - 97.45 - 386.66 1916.33 - - - - - 16 New Krewwa Lift Scheme - - 69.00 - - 313.28 - - - - - 17 Pargwal Canal - - - - - - 16.41 9.11 20.50 15.36 18.46 18 Partap Canal 39.46 287.92 334.00 352.60 60.95 2172.72 24.50 26.66 26.12 27.59 8.49 19 Rafiabad Canal - - - - 65.69 65.69 - - - - - 20 Rajal Lift Irrigation 5.73 25.00 95.00 404.92 31.00 1334.88 17.45 24.44 29.47 31.27 44.26

184
Table D3: Capital Expenditure and Working Expenses during Tenth Plan Period for Major & Medium Irrigation Projects State and Project wise
(Rs. in lakhs) Sl. Name of the State/UT's and Capital Expenditure during the year Cumulative Working Expenses during the year No. Name of Major & Medium Irrigation Projects Capital Expenditure upto 2002-03 2003-04 2004-05 2005-06 2006-07 2006-07 2002-03 2003-04 2004-05 2005-06 2006-07 1 2 3 4 5 6 7 8 9 10 11 12 21 Rajpura Canal - - - - 123.96 123.96 - - - - - 22 Ranjan Lift Irrigation Scheme 6.17 55.01 246.07 73.00 118.56 1558.76 28.77 25.74 33.22 37.48 602.74 23 Ravi Tawi Lift Irrigation Scheme 171.37 209.89 0.00 265.31 300.51 11646.95 507.54 522.03 1633.75 539.54 673.38 24 Remodelling of Ranbir Canal 410.42 890.10 677.35 1532.33 357.07 7692.74 26.26 60.40 62.14 69.42 28.69 25 Tral Lift Irrigation Scheme 173.89 1128.46 530.87 90.45 3028.35 - - - - - 26 Yousmarg Storage Tank Scheme - - - - - 194.46 - - - - - 27 Zaingir - 214.08 -8.32 130.00 - 469.83 0.33 - - - - Karnataka Major 1 Bennithora Project 1373.40 434.14 261.96 159.58 307.27 24861.26 - - - - - 2 Bhadra Modernisation 80.83 1583.03 - - - - - 3 Bhadra Project 463.38 307.88 82.69 2079.80 6630.83 20407.58 - - - - - 4 Bheemaarayanagudi - - 63.76 - - - - - 5 Bhima Project 0.16 370.84 - - - - - 6 Cauvery Anicut Channel 601.50 126.49 2960.90 - - - - - 7 Dhudganga project 8.10 - 1318.88 - - - - - 8 Diversion of Chickhole to Suvarnavathy Reservoir 750.06 - - - - - 9 exclusive to Karnataka) - - 424.51 - - - - - 10 Ghataprabha project Stage I & II - - 7270.40 - - - - - 11 Ghataprabha project Stage III 28.46 19.08 15.20 16.01 15.40 37979.78 - - - - - 12 Harangi Project 1704.75 685.85 41.10 34856.03 - - - - - 13 Hemavathy Project 8940.09 3469.09 393.51 178.39 183.61 175145.60 - - - - -

185
Table D3: Capital Expenditure and Working Expenses during Tenth Plan Period for Major & Medium Irrigation Projects State and Project wise
(Rs. in lakhs) Sl. Name of the State/UT's and Capital Expenditure during the year Cumulative Working Expenses during the year No. Name of Major & Medium Irrigation Projects Capital Expenditure upto 2002-03 2003-04 2004-05 2005-06 2006-07 2006-07 2002-03 2003-04 2004-05 2005-06 2006-07 1 2 3 4 5 6 7 8 9 10 11 12 14 Hippargi Barrage - - 2768.40 - - - - - 15 Jurala Project - - 400.00 - - - - - 16 Kabini Project 1456.05 781.82 81.17 41560.90 - - - - - 17 Krishnaraja Sagar - - 1874.74 - - - - - 18 Krishnaraja Sagar Right Bank Canal 1723.78 1332.52 53.98 28632.99 - - - - - 19 Malaprabha Project 64.30 122.72 62.17 52.27 51865.74 - - - - - 20 Karanja Project 2987.47 2472.78 4907.06 2363.74 2140.20 47077.00 - - - - - 21 Markandeya Project - - 1078.82 - - - - - 22 Modernisation of Krishnaraja Sagar Canals 1055.20 297.34 27.07 28762.14 - - - - - 23 Narayanapura - - - - - - - 24 National Water Management Project - - 12071.85 - - - - - 25 Resettlement and Rehabilitation - - - - - - - 26 Singatalur lift Irrigation Scheme - 1.44 788.65 - - - - - 27 Thunga Anicut - - 331.30 - - - - - 28 Thungabhadra Project High Level Canal Stage I - - 571.66 - - - - - 29 Tungabhadra Project - HLC II Stage 184.73 52.64 111.08 57.47 54.98 5438.26 - - - - - 30 Tungabhadra Project - Left Bank 1767.82 1219.46 1772.63 2004.35 1410.70 40664.70 - - - - - 31 Tungabhadra Project : Karnataka - - - - - - - 32 Upper Thunga Project 14.34 - 2987.88 - - - - - 33 Upper Krishna Project 0.00 1.45 0.17 122.70 138.13 182808.22 0.00 0.00 0.00 0.00 0.00 34 Varahi Project 444.80 149.17 3458.04 - - - - - 35 Yagachi Project 864.63 270.84 17.06 15846.98 - - - - -

186
Table D3: Capital Expenditure and Working Expenses during Tenth Plan Period for Major & Medium Irrigation Projects State and Project wise
(Rs. in lakhs)
Sl. Name of the State/UT's and Capital Expenditure during the year Cumulative Working Expenses during the year No. Name of Major & Medium Irrigation Projects Capital Expenditure upto 2002-03 2003-04 2004-05 2005-06 2006-07 2006-07 2002-03 2003-04 2004-05 2005-06 2006-07 1 2 3 4 5 6 7 8 9 10 11 12 Medium 36 Amarja Project 180.11 116.58 163.28 134.94 90.81 11063.05 - - - - - 37 Anjanapura Project 68.74 64.72 53.87 34.51 775.11 - - - - - 38 Arkavathy Project 553.38 520.11 5.37 8429.13 - - - - - 39 Basapura - Lift Irrigation Schemes 2.04 30.15 - - - - - 40 Chandrampalli Project - - 201.68 - - - - - 41 Chicklihole Project 19.00 3.74 2240.21 - - - - - 42 Chulkinala Project 134.13 87.25 382.95 144.88 0.00 13767.75 0.00 0.00 0.00 0.00 0.00 43 Feetha Project - - 953.10 - - - - - 44 Gandorinala Project - - 2157.94 - - - - - 45 Gundal Project - - 451.64 - - - - - 46 Hagari Bommanahally Project - - 395.74 - - - - - 47 Harinala Project - - 353.37 - - - - - 48 Hirehalla Project 1206.87 1269.54 2037.83 995.10 1728.25 22012.18 - - - - - 49 Hodinarayana Halla to Jhambada Halla Project 1.24 113.74 114.98 50 Huchana Koppala Project 173.16 18.04 1662.89 - - - - - 51 Iggalur Project 230.32 32.66 2.81 5211.93 - - - - - 52 Itagi – Sasalwad 3.67 33.66 - - - - - 53 Jambadahalla Project - - 116.46 - - - - - 54 Kamasamudra Lift Irrigation Project 108.64 16.80 2061.62 - - - - - 55 Karnataka Neeravari Nigam Limited (AIBP) 16244.20 4000.00 20244.20

187
Table D3: Capital Expenditure and Working Expenses during Tenth Plan Period for Major & Medium Irrigation Projects State and Project wise
(Rs. in lakhs) Sl. Name of the State/UT's and Capital Expenditure during the year Cumulative Working Expenses during the year No. Name of Major & Medium Irrigation Projects Capital Expenditure upto 2002-03 2003-04 2004-05 2005-06 2006-07 2006-07 2002-03 2003-04 2004-05 2005-06 2006-07 1 2 3 4 5 6 7 8 9 10 11 12 56 Krishna Basin Project - - 24823.78 - - - - - 57 Krishns Basin Project(AIBP) 23888.00 - 6519.80 9299.80 45957.60 - - - - - 58 Lower Mullamari Project 222.30 106.56 11.17 12360.96 - - - - - 59 Manchanabele Project 241.01 86.28 11.06 7283.05 - - - - - 60 Maskinala Project 264.30 188.53 33.65 179.63 239.21 4842.42 - - - - - 61 Nallur Ammanikere Project - - 514.98 - - - - - 62 Nanjapur Lift Irrigation Scheme 90.18 6.67 660.15 - - - - - 63 Narihalla Project - - 324.60 - - - - - 64 Soudagar Project - - 595.95 - - - - - 65 Suvarnavathi Project - - 381.02 - - - - - 66 Taraka Project 215.95 43.96 4.28 3116.65 - - - - - 67 Theetha Project - - 419.67 - - - - - 68 Thimmapura Lift Irrigation Scheme 8.03 8.03 69 Uduthorehalla Project 963.81 80.44 5.94 13853.77 - - - - - 70 Upper Krishna Project (AIBP) 34060.00 8174.15 33593.24 20747.80 12063.80 153638.99 - - - - - 71 Upper Mullamari Project - - 2000.21 - - - - - 72 Vijayanagar Channel - - 103.80 - - - - - 73 Votechole Project 301.33 47.46 5.03 4497.31 - - - - - Kerala Major 1 Banasura Sagar Project 309.89 305.97 142.13 167.84 113.91 1689.47 - - - - - 2 Chaliyar River Valley Scheme - - - 0.0-3 - 372.68 - - - - -

188
Table D3: Capital Expenditure and Working Expenses during Tenth Plan Period for Major & Medium Irrigation Projects State and Project wise
(Rs. in lakhs)
Sl. Name of the State/UT's and Capital Expenditure during the year Cumulative Working Expenses during the year No. Name of Major & Medium Irrigation Projects Capital Expenditure upto 2002-03 2003-04 2004-05 2005-06 2006-07 2006-07 2002-03 2003-04 2004-05 2005-06 2006-07 1 2 3 4 5 6 7 8 9 10 11 12 3 Chitturpuzha Scheme -1.20 -15.94 - 0.89 - 2696.58 146.27 132.58 133.77 184.11 36.72 4 Idamalayar Project 1329.92 1286.70 1519.70 -17.29 1912.86 23220.22 - - - - - 5 Kakkadavu Project - - - 1223.29 - 237.57 - - - 469.57 - 6 Kallada Irrigation Project -39.24 -16.69 -20.55 36.70 -7.64 63774.06 - - 28.64 - 95.47 7 Kanhirapuzha Scheme 146.29 -8.01 -13.72 - -5.88 11140.61 69.34 99.21 111.39 144.63 90.64 8 Kuriyarkutty Karappara Project 84.07 792.30 512.54 - 117.80 3962.95 - - - - - 9 Kuttiyadi Irrigation Project -20.01 - - -5.77 - 5528.23 66.78 104.56 88.55 114.26 46.41 10 Malampuzha Project - - - - - 676.40 431.82 564.25 356.57 507.83 186.99 11 Mangalam Project - - - - - - 80.28 74.62 99.04 94.35 30.05 12 Meenachil River Valley Scheme 0.05 0.-11 0.0-8 7040.04 0.-01 267.35 - - - - - 13 Meenkara Project(Gayathri Project) - - - - - - 90.54 52.58 80.70 95.81 48.13 14 Moolathara R.B.Canal - - - 4756.88 - 203.60 - 13.35 2.17 4.63 1.22 15 Moovattupuzha Project 3340.00 4839.62 8288.31 - 6597.80 67819.71 - - - - - 16 Neyyar Irrigation Project - - - - 524.18 43.95 170.22 79.59 340.64 134.21 17 Pamba Irrigation Project -7.39 0.37 5.59 -20.02 -2.42 6521.58 88.47 159.24 223.95 307.47 101.08 18 Pazhassi Project (valapattanam Project) 15.12 -11.52 -18.81 0.-32 - 15544.65 32.44 70.67 44.65 72.37 31.95 19 Periyar Vally Project (Boothathankettu Scheme) 2.91 -1.03 30.94 135.78 0.-66 10147.49 1134.32 1213.62 1844.25 1411.66 1072.26 20 Thaneer Mukkom Project 27.15 5.19 -3.16 - - 1314.42 89.34 10.49 11.04 36.03 7.71 21 Vamanapuram Project .-45 0.04 0.-14 0.0-7 0.-25 994.00 - - - - - 22 Wadakkancherry Project - - - - - - - 119.06 76.72 75.69 95.64 23 Walayar Project - - - - - - 131.55 127.11 139.10 98.10 37.76

189
Table D3: Capital Expenditure and Working Expenses during Tenth Plan Period for Major & Medium Irrigation Projects State and Project wise
(Rs. in lakhs)
Sl. Name of the State/UT's and Capital Expenditure during the year Cumulative Working Expenses during the year No. Name of Major & Medium Irrigation Projects Capital Expenditure upto 2002-03 2003-04 2004-05 2005-06 2006-07 2006-07 2002-03 2003-04 2004-05 2005-06 2006-07 1 2 3 4 5 6 7 8 9 10 11 12 Medium 24 Attappady Scheme 42.28 36.02 16.65 15.29 -3.32 1014.60 - - - - - 25 Chalakudy River Diversion Scheme - - - - - 238.62 238.85 127.06 386.94 180.30 84.62 26 Cheerakuzhy Scheme - - - - - 128.25 42.05 47.84 58.51 76.70 68.11 27 Cheramangalam Scheme - - - 39.64 - - 56.79 43.26 45.55 14.92 28 Chimoni Mupli Scheme 58.17 35.20 0.67 11.14 - 6089.28 - - - 9.00 6.33 29 Kabini Scheme 1077.81 1108.72 784.11 2196.11 1463.65 24513.98 - - - - - 30 Kattampally Scheme - - - - - 67.79 35.59 0.59 42.55 3.92 18.84 31 Kuttanad Development Scheme - - - - - 25.88 42.04 20.68 54.24 221.63 22.80 32 Mangalam Project - - - - - 93.63 - - - - - 33 Meenkara Project(Gayathri Project) - - 114.50 10.50 - 462.72 - - - - - 34 Palakapandy River Diversion Scheme - - - - 547.47 587.11 - - - - 35 Peechi Reservoir Scheme - - - - - 251.30 95.91 159.64 103.16 204.69 145.06 36 Pothundy Scheme - - - - - 384.89 36.34 67.37 78.83 64.62 25.71 37 Regulator-Cum-Bridge at Chamravattom 32.97 34.62 28.31 31.18 - 767.85 - - - - - 38 Regulator-Cum-Bridge at Kanakkankadavu - - - - - 740.90 - - - - - 39 Thottappally Spillway (New Shutters) - - - - - 22.14 - - - - - 40 Velliyamkallu Causway 534.57 251.61 588.99 1353.40 - 4357.95 - - - - - 41 Wadakkancherry Project - - - - - 42.50 43.95 - - - - 42 Walayar Project - - - - - 149.32 - - - -

190
Table D3: Capital Expenditure and Working Expenses during Tenth Plan Period for Major & Medium Irrigation Projects State and Project wise
(Rs. in lakhs) Sl. Name of the State/UT's and Capital Expenditure during the year Cumulative Working Expenses during the year No. Name of Major & Medium Irrigation Projects Capital Expenditure upto 2002-03 2003-04 2004-05 2005-06 2006-07 2006-07 2002-03 2003-04 2004-05 2005-06 2006-07 1 2 3 4 5 6 7 8 9 10 11 12 Madhya Pradesh Major 1 Ban Sagar Project 5486.16 9292.98 22226.79 -390.14 8289.81 81629.73 - - - - - 2 Ban Sagar Project-Unit-II 1044.46 5433.19 8989.31 9230.70 13393.84 43666.12 - - - - - 3 Bargi Diversion Scheme 14847.29 18966.20 26928.68 27817.96 12005.53 61425.14 0.00 0.00 0.00 0.00 0.00 4 Bariyarpur Project 2079.18 2679.98 3046.21 2960.20 3695.18 20696.69 - - - - - 5 Barna Project 130.64 89.78 15.01 0.00 0.00 3077.00 166.11 204.70 167.45 217.74 230.58 6 Bhander Canal 3.80 - - - - 497.25 26.75 45.21 68.22 56.58 58.50 7 Bhawan Thadi Project 2619.73 2035.04 2699.43 1349.18 2695.03 20005.77 - - - - - 8 Chambal Project 6.23 21.99 225.64 117.72 147.11 19142.71 816.29 855.59 1034.72 1896.47 2450.36 9 Dam Safety and Rehabilitation Scheme - - - - - 14057.86 - - - - - 10 Halali Project 0.00 0.00 0.00 0.00 0.00 1749.11 115.15 121.63 100.41 110.07 118.99 11 Harsi Irrigation Scheme 8.20 3.23 - - - 1342.02 - - - - - 12 Hydro-Metrological Net Work 154.62 127.68 199.51 210.30 236.89 1096.74 - - - - - 13 Indra Sagar Project Unit I&II. - - 10111.30 117001.91 - - - - - 14 Kolar Project 187.97 227.71 150.67 8.82 0.00 13831.43 340.41 304.87 342.74 659.14 492.01 15 Mahi Project 2040.15 0.00 0.00 0.00 4430.53 4619.04 0.00 0.00 0.00 0.00 0.00 16 Multipurpose River Projects- - - - - - 1197.21 - - - - - 17 Narmada (Indira) Sagar Project 14194.12 15132.7 16506.10 14744.73 - - - - - - - 18 National Hydrological Project 498.63 444.88 17.85 4.14 28.92 1917.69 - - - - 121.18 19 National Water Management - - - - - 5245.88 - - - - - 20 Omkareshwar Hydel Scheme 0.00 1768.85 0.00 6497.42 10895.26 31310.28 0.00 0.00 0.00 0.00 0.00

191
Table D3: Capital Expenditure and Working Expenses during Tenth Plan Period for Major & Medium Irrigation Projects State and Project wise
(Rs. in lakhs) Sl. Name of the State/UT's and Capital Expenditure during the year Cumulative Working Expenses during the year No. Name of Major & Medium Irrigation Projects Capital Expenditure upto 2002-03 2003-04 2004-05 2005-06 2006-07 2006-07 2002-03 2003-04 2004-05 2005-06 2006-07 1 2 3 4 5 6 7 8 9 10 11 12 21 Pench Diversion Project - - 68.17 510.56 991.98 1570.71 - - - - - 22 Rajghat Project 10417.26 7495.6 8875.15 10517.02 4225.35 96826.22 - - - - - 23 Rangvan Project 0.00 0.00 0.00 0.00 0.00 894.52 0.00 18.39 101.44 107.12 16.19 24 Rani Awanti Bai Sagar Project Unit I&II - - - - 7813.50 110829.07 - - - - - 25 Ruthiyai Project - - - - - 2212.32 - - - - - 26 Samrat Ashok Sagar Project - - 148.55 107.16 111.57 367.28 - - - - - 27 Sardar Sarovar Project 0.00 0.00 0.00 0.00 0.00 4241.55 0.00 0.00 0.00 0.00 0.00 28 Sindh Mohini Project 11096.54 10858.48 15344.81 7447.26 7659.25 65146.61 19.83 17.88 21.57 30.66 40.64 29 Sukta Project 0.00 0.00 0.00 0.00 0.00 457.40 39.42 40.85 50.76 50.48 43.13 30 Tawa Project 0.00 1040.32 722.00 499.67 1585.07 17422.91 604.89 618.24 740.22 926.10 976.36 31 Thanwan Project 73.47 158.83 47.66 17.21 - 2126.07 26.95 33.45 36.90 115.35 137.65 32 Upper Wainganga Project 1594.23 748.26 571.54 845.77 335.86 28123.72 24.15 34.17 97.34 330.16 551.58 33 Urmil Project 326.96 25.84 - - 2909.86 6.18 27.68 39.97 29.47 35.78 Medium 34 Akhijhiri Tank - - - - - 92.04 - - - - - 35 Amki Bahadur - - - - - 78.64 - - - - - 36 Arniya Bahadurpur Tank - - - - - 101.90 - - - - - 37 Bah Project - 1.22 1882.61 565.44 - - - - - - 38 Baijna Project - - - - - 123.61 - - - - - 39 Bandia Nala - - - - 18.82 28.82 - - - - - 40 Baniganj Project - - - - - 79.95 - - - - - 41 Barad Development Project - - - - - 146.33 - - - - -

192
Table D3: Capital Expenditure and Working Expenses during Tenth Plan Period for Major & Medium Irrigation Projects State and Project wise
(Rs. in lakhs) Sl. Name of the State/UT's and Capital Expenditure during the year Cumulative Working Expenses during the year No. Name of Major & Medium Irrigation Projects Capital Expenditure upto 2002-03 2003-04 2004-05 2005-06 2006-07 2006-07 2002-03 2003-04 2004-05 2005-06 2006-07 1 2 3 4 5 6 7 8 9 10 11 12 42 Barchar Project 0.00 347.88 20.05 37.84 70.35 666.97 0.00 0.00 0.00 0.00 0.00 43 Barnodia Tank - - - - - 42.32 - - - - - 44 Benisagar Nahar Diversion - - - - 192.75 192.75 - - - - - 45 Bhaiswar Canal - - - - - 129.89 - - - - - 46 Bhamisa Khadi Tank Project - - - - - 95.15 - - - - - 47 Bhaner Khadi - - - - - 75.36 - - - - - 48 Bhimgarh Right Bank Canal(Seoni) - - - - - 225.43 - - - - - 49 Bijna Reservoir - - - - - 115.03 - - - - - 50 Bilanadi River Project - - - - - 297.98 - - - - - 51 Bindhya Tank - - - - - 164.11 - - - - - 52 Budhan Nalla 10.00 1485.68 - - - - - 53 Bundala - - - - - 1002.96 - - - - - 54 Chandora 37.94 26.83 - 1124.22 - - - - - 55 Chandra Keshar Tank Project - - - - - 441.86 - - - - - 56 Chiller River Tank Project - - - - - 355.9 - - - - - 57 Choral Tank - - - - - 2867.25 - - - - - 58 Construction of Bhander Canal - - - - - 158.02 - - - - - 59 Construction of Canal on Right Bank of Bagh River 39.11 - - - - 162.45 - - - - - 61 Dejla Deoda - - - - - 1186.7 - - - - - 62 Dholwad Tank - - - - - 348.86 - - - - - 63 Doraha Tank - - - - - 238.49 - - - - - 64 Dudhi Tank - - - - - 1084.04 - - - - -

193
Table D3: Capital Expenditure and Working Expenses during Tenth Plan Period for Major & Medium Irrigation Projects State and Project wise
(Rs. in lakhs) Sl. Name of the State/UT's and Capital Expenditure during the year Cumulative Working Expenses during the year No. Name of Major & Medium Irrigation Projects Capital Expenditure upto 2002-03 2003-04 2004-05 2005-06 2006-07 2006-07 2002-03 2003-04 2004-05 2005-06 2006-07 1 2 3 4 5 6 7 8 9 10 11 12 65 Gangulpara Tank Project - - - - - 229.95 - - - - - 66 Gomukh Project - - - - - 2326.01 - - - - - 67 Gopad Project - - - - 68.77 68.77 - - - - - 68 Gopal Lift Irrigation - 41.58 82.36 157.19 - - - - - - 69 Halon Project - - - - 36.50 36.50 - - - - - 70 Jamini Right Bank System - - - - - 80.2 - - - - - 71 Jarmora - - - - - 118.55 - - - - - 72 Jassiya Tank Project - - - - - 212.18 - - - - - 73 Jhirigiri Project - - - - - 150.38 - - - - - 74 Jobat Project - 3381.43 2565.71 2161.00 862.12 14497.63 - - - - - 75 Johila Tank - - - - - 154.08 - - - - - 76 Kaji Kheda - - - - - 138.42 - - - - - 77 Kali Sagar Yojna - - - - - 297.04 - - - - - 78 Kalia Sote Project 80.22 7.76 98.19 78.70 149.99 5582.36 - - - - - 79 Kamalpura Tank Project - - 432.06 524.44 956.5 - - - - - 80 Kamhargaon - - - - - 1265.91 - - - - - 81 Kanbari Nala - - - - - 122.74 - - - - - 82 Kanhar Gaon - - - - - 67.80 - - - - - 83 Karke Ki Mahu. - - - - 1.47 1.47 - - - - - 84 Katju Garden - - - - 0.34 0.34 - - - - - 85 Katra Reservoir - - - - - 259.35 - - - - - 86 Kawarpur(Sutia Nalla) Project - - - - - 125.97 - - - - -

194
Table D3: Capital Expenditure and Working Expenses during Tenth Plan Period for Major & Medium Irrigation Projects State and Project wise
(Rs. in lakhs) Sl. Name of the State/UT's and Capital Expenditure during the year Cumulative Working Expenses during the year No. Name of Major & Medium Irrigation Projects Capital Expenditure upto 2002-03 2003-04 2004-05 2005-06 2006-07 2006-07 2002-03 2003-04 2004-05 2005-06 2006-07 1 2 3 4 5 6 7 8 9 10 11 12 87 Kedar Nalla Project - - - - - 110.02 - - - - - 88 Kerwan Project - - - - - 179.02 - - - - - 89 Khetam Project - - - - - 108.32 - - - - - 90 Kulghari Project - - - - - 70.62 - - - - - 91 Kunwar Chain Sagar Project - - 18.65 19.80 4.72 43.17 - - - - - 92 Kushalpura Tank Scheme - - - - 262.5 262.5 - - - - - 93 Lakhundar - - - - - 1804.69 - - - - - 94 Lower Gohi Project - 31.78 - - 68.93 149.24 - - - - - 95 Macroda - - - - - 355.26 - - - - - 96 Maham Project - 329.42 528.75 1618.86 - 6268.91 - - - - - 97 Mahuar - - - - - 213.112 - - - - - 98 Man Project - 1132.53 628.91 403.72 405.08 6341.67 - - - - - 99 Mansoor Wari - - - - - 155.52 - - - - - 100 Mayana Tank Project - - - - - 57.77 - - - - - 101 Modi Mandir - - - - 0.97 0.97 - - - - - 102 Morwan Tank Project - - - - - 79.99 - - - - - 103 Nagda Nala Project - - - - - 87.62 - - - - - 104 Nahlessara Tank Project - - - - - 242.19 - - - - - 105 Naren Project - - - - - 147.96 - - - - - 106 Pampawati Tank - - - - - 102.38 - - - - - 107 Paras - - - - - 63.75 - - - - - 108 Piplia Kumar Tank - - - - - 81.76 - - - - -

195
Table D3: Capital Expenditure and Working Expenses during Tenth Plan Period for Major & Medium Irrigation Projects State and Project wise
(Rs. in lakhs) Sl. Name of the State/UT's and Capital Expenditure during the year Cumulative Working Expenses during the year No. Name of Major & Medium Irrigation Projects Capital Expenditure upto 2002-03 2003-04 2004-05 2005-06 2006-07 2006-07 2002-03 2003-04 2004-05 2005-06 2006-07 1 2 3 4 5 6 7 8 9 10 11 12 109 Pukta Nala Project - - - - - 108.84 - - - - - 110 Rampura Khurd - - - - - 326.49 - - - - - 111 Rusi Tank - - - - - 107.62 - - - - - 112 Sagad Project - 6.1 4.89 1899.87 2010.49 - - - - - 113 Sagar Nadi River Project - - - - - 203.68 - - - - - 114 Sahibkhedi Talao - - - - - 297.99 - - - - - 115 Sampara Tank Project - - - - - 103.12 - - - - - 116 Sanjay Sagar - - - - 1180.40 4056.38 - - - - - 117 Saroda Tank - - - - - 209.65 - - - - - 118 Tiller Project - - - - - 2706.31 - - - - - 119 Tillone - - - - - 352.43 - - - - - 120 Umrar Nalla - - - - - 214.51 - - - - - 121 Upper Narmada Project - - - - 19.67 19.67 - - - - - 122 Upper Veda Project - 892.99 - - 2432.77 3472.00 - - - - - 123 Waghiya Nalla Pariyojna - - - - - 98.39 - - - - - 124 Wainganga Pariyojna - - - - - 221.88 - - - - - Maharashtra Major 1 Bagh Project - - - - - 1381.31 - - - 59.99 271.89
2 Bhama Asked Project - 5.68 - - - - 55.00 179.92 - -
3 Bhandhardara Project 0.00 0.00 0.00 0.00 0.00 0.00 0.00 0.00 0.00 106.15 195.15 4 Bhatgher Project 0.00 0.00 0.00 185.00 0.00 0.00 0.00 0.00 0.00 185.00 177.53

196
Table D3: Capital Expenditure and Working Expenses during Tenth Plan Period for Major & Medium Irrigation Projects State and Project wise
(Rs. in lakhs) Sl. Name of the State/UT's and Capital Expenditure during the year Cumulative Working Expenses during the year No. Name of Major & Medium Irrigation Projects Capital Expenditure upto 2002-03 2003-04 2004-05 2005-06 2006-07 2006-07 2002-03 2003-04 2004-05 2005-06 2006-07 1 2 3 4 5 6 7 8 9 10 11 12 5 Bhatsa Project 0.00 0.00 0.00 0.00 1696.59 10560.75 0.00 0.00 0.00 127.56 51.73 6 Bhavali Project - - - - - 0.04 - - - - - 7 Bhima Canal 0.00 0.00 0.00 0.00 0.00 0.00 0.00 30.37 40.22 0.00 0.00 8 Chanakpur Project - - - - - - - - - 131.70 138.08
9 Chandrabhaga - - - - - 11.29 - - - - -
10 Chasakman Project - 7.99 - - 572.85 572.85 - - 49.63 144.95 56.01
11 Darna Project - - - - - - - - - 268.20 328.69
12 Dawadi - - - - - 7.73 - - - - -
13 Dhom - - - - - - - - 213.55 - -
14 Dhumore - - - - - 0.21 - - - - -
15 Dimbhe - 3.31 - - - - - - - -
16 Dombhal Kawadi - 4.75 - - - - - - - -
17 Dudhganga 0.00 0.00 0.00 0.00 0.00 0.00 0.00 0.00 89.75 250.00 120.00 18 Ekruk Dam - - - - - - - 291.71 257.94 - -
19 Gangapur Project - - - - - - - - - 119.98 175.00
20 Ghod Project - - - - - - - - - 225.01 121.49
21 Giana Project - - - - - - - - - 269.25 559.54
22 Gunjwani Project - 5.59 - - - - 196.46 237.87 - -
23 Hatnoor Project - 18.37 - - - - - - - -
24 Itiadoh Project - - - - - 1034.40 - - - 309.36 452.11
25 Janai Sirsai - 2.41 - - - - 377.09 212.97 -
26 Jayakwadi Project-II 0.00 0.00 0.00 0.00 0.00 0.00 0.00 0.00 0.00 590.73 965.56

197
Table D3: Capital Expenditure and Working Expenses during Tenth Plan Period for Major & Medium Irrigation Projects State and Project wise
(Rs. in lakhs) Sl. Name of the State/UT's and Capital Expenditure during the year Cumulative Working Expenses during the year No. Name of Major & Medium Irrigation Projects Capital Expenditure upto 2002-03 2003-04 2004-05 2005-06 2006-07 2006-07 2002-03 2003-04 2004-05 2005-06 2006-07 1 2 3 4 5 6 7 8 9 10 11 12 27 Kadwa Project - - - - - - - - - 75.23 90.70
28 Kal Project - - - - - 902.42 - - - 41.57 65.34
29 Kalisarar - - - - - 1020.73 - - - 9.00 8.98
30 Khadkwasala (Chaskaman) - 2.03 - - 29.82 29.82 - 33.19 40.00 234.55 311.60
31 Koregaon - - - - - 4.05 - - - - -
32 Koyna - - - - - 2.17 - - - - -
33 Krishna Project 0.00 4.57 0.00 0.00 160.93 160.93 0.00 0.00 193.42 476.93 1041.00 34 Kukadi Project 0.00 0.00 0.00 0.00 702.74 702.74 0.00 38.79 229.39 419.90 420.56 35 Kunthe - - - - - 2.17 - - - - -
36 Lower Pendhi Project 721.00 934.14 - -
37 Lower Terna Project - - - - - - - - - 92.06 52.29
38 Lower Wunna Project - 31.73 - - 126.05 1034.89 - - - - -
39 Mahendra - - - - - 2.17 - - - - -
40 Manad Manar - - - 213.14 - 0.04 - - - - -
41 Mangrulpur Project - - - - - - - - - 92.06 -
42 Manjara Project - - - - - - - - - 170.70 165.75
43 Moha Hatghar - 4.75 - - - 8.23 - - - - -
44 Mula Project 7.01 689.26 342.29
45 Nalganga Project - - - - - - - - - 233.37 112.46
46 Neera Deoghar 0.00 6.77 0.00 0.00 0.00 0.00 0.00 156.44 130.14 0.00 0.00
47 Pawan Project - - - - - - - - - 119.45 44.94
48 Pench Project - 508.94 203.89 247.69 298.23 27522.66 - - - 238.98 551.89

198
Table D3: Capital Expenditure and Working Expenses during Tenth Plan Period for Major & Medium Irrigation Projects State and Project wise
(Rs. in lakhs) Sl. Name of the State/UT's and Capital Expenditure during the year Cumulative Working Expenses during the year No. Name of Major & Medium Irrigation Projects Capital Expenditure upto 2002-03 2003-04 2004-05 2005-06 2006-07 2006-07 2002-03 2003-04 2004-05 2005-06 2006-07 1 2 3 4 5 6 7 8 9 10 11 12 49 Pimpaljoga - 5.59 - - - - - - - -
50 Purna Project - 1552.91 1770.66 2433.33 - - - - - 697.60 870.93
51 Radhanagari Project - - - - - - - - - 205.00 553.12
52 Shikvapur - - - - - 3.08 - - - - -
53 Shindhegaon - - - - - 2.85 - - - - -
54 Shirur - - - - - 6.03 - - - - -
55 Surya Project - 2060.88 1437.69 1089.93 748.38 26907.68 - - - 124.93 84.39
56 Temghar - 2.41 - - - - - - - -
57 Tillari Project - 6966.69 4283.27 1321.77 -87.74 40149.33 - - - - -
58 Tulsi Project - - - - - - - - - 108.97 96.42
59 Ujjani - 43.11 - - - - - - -12.57 738.78
60 Upper Penganga 0.00 0.00 0.00 0.00 0.00 0.00 0.00 0.00 0.00 224.98 315.59 61 Upper Tapi (Hatur) - - - - - - - - - 259.25 240.52
62 Upper Wardha Project 0.00 195.47 176.14 85.12 1.51 2029.79 0.00 0.00 0.00 0.00 0.00
63 Upper wunna Project (CADA) - - 33.93 25.12 - - - - - -
64 Urmodi Project - 4.75 - - - - - - - -
65 Vadhu - - - - - 12.74 - - - - -
66 Via Project - - - - - - - - - 290.00 460.00
67 Vishnupuri - - - - - - - - - 224.33 107.03
68 Wadgaon - - - - - 35.00 - - - - -
69 Warna Project - 11.26 - - - - - - 150.00 130.00

199
Table D3: Capital Expenditure and Working Expenses during Tenth Plan Period for Major & Medium Irrigation Projects State and Project wise
(Rs. in lakhs) Sl. Name of the State/UT's and Capital Expenditure during the year Cumulative Working Expenses during the year No. Name of Major & Medium Irrigation Projects Capital Expenditure upto 2002-03 2003-04 2004-05 2005-06 2006-07 2006-07 2002-03 2003-04 2004-05 2005-06 2006-07 1 2 3 4 5 6 7 8 9 10 11 12 Medium
70 Amal nalla Project - - - - - 688.09 - - - - -
71 Andhola Project - - - - 2303.30 5664.03 - - - - -
72 Andra Valley Project - 0.41 - - - 1540.65 - - - - -
73 Arjuna Project - 2587.35 1907.39 1241.82 2578.78 9245.62 - - - - -
74 Bageda Tank Project - - - - - 81.71 - - - - -
75 Betekar Bothali Project - - - - - 258.15 - - - - -
76 Bhakuchiwadi Project - - - - - - - - - - -
77 Bhehdana - 0.49 110.35 454.27 360.37 933.26 - - - - -
78 Bibi Darphai Project - - - - - 5.00 - - - - -
79 Bodalkasa Project - - - - - 54.15 - - - - -
80 Borgaon Dhaneshwar Project - - - - - 11.52 - - - - -
81 Borogaon Project - - - - - 744.22 - - - - -
82 Chandali Project - - - - - 500.70 - - - - -
83 Chandpur Project - 72.14 112.15 274.96 2446.29 - - - - -
84 Chargaon Project - - - - - 578.70 - - - - -
85 Chorkhamara Project - - - - - 54.14 - - - - -
86 Chulband Project - - - 126.88 0.01 1692.38 - - - - -
87 Deogaon Project - - - - - 375.80 - - - - -
88 Dina Nadi Project - - - - - 571.68 - - - - -
89 Ekbhurji Tank Project - - - - - 51.27 - - - - -
90 Goki Project - - - - - 1458.49 - - - - -

200
Table D3: Capital Expenditure and Working Expenses during Tenth Plan Period for Major & Medium Irrigation Projects State and Project wise
(Rs. in lakhs) Sl. Name of the State/UT's and Capital Expenditure during the year Cumulative Working Expenses during the year No. Name of Major & Medium Irrigation Projects Capital Expenditure upto 2002-03 2003-04 2004-05 2005-06 2006-07 2006-07 2002-03 2003-04 2004-05 2005-06 2006-07 1 2 3 4 5 6 7 8 9 10 11 12 91 Gyansagar Project - - - - - 192.39 - - - - -
92 Halad Bhadra Project - - - - - 328.90 - - - - -
93 Haranghat Project - - - 633.34 226.68 4242.63 - - - - -
94 Hasangad Project - 983.08 - - - - - - - - -
95 Jhansinagar Project - 127.43 530.74 651.07 530.76 2045.43 - - - - -
96 kanhuli Para Tank Project - - - - - 422.03 - - - - -
97 Kasari Project - - 351.14 360.24 - - - - - -
98 Katepurna Project - - - - - 716.72 - - - - -
99 Kesar Nalla Project - - - - - 139.31 - - - - -
100 kharband Project - 376.27 210.25 100.13 94.52 2823.21 - - - - -
101 Khekra Nalla Project - - - - 1408.60 - - - - -
102 Kirimiri Darun Project - 352.58 103.15 319.24 159.37 2567.22 - - - - -
103 Kolar River Project 0.00 0.00 0.00 203.32 56.30 2280.53 0.00 0.00 0.00 0.00 0.00
104 Korale Satandi Project 0.00 1017.64 0.00 0.00 226.79 2149.70 0.00 0.00 0.00 0.00 0.00
105 Kudadha Project - - - - - 89.00 - - - - -
106 Lodhi Project - - - - - 4.99 - - - - -
107 Lower Pus Project - - - - - 3093.49 - - - - -
108 Makardhokda Project - - - - - 930.65 - - - - -
109 Makumdraj Udayan Project - - - - - 1.22 - - - - -
110 Malini Tank Project - - - - - 73.54 - - - - -
111 Managarh Project - - - - - 219.34 - - - - -
112 Mandwa Project - - - - - 152.90 - - - - -

201
Table D3: Capital Expenditure and Working Expenses during Tenth Plan Period for Major & Medium Irrigation Projects State and Project wise
(Rs. in lakhs) Sl. Name of the State/UT's and Capital Expenditure during the year Cumulative Working Expenses during the year No. Name of Major & Medium Irrigation Projects Capital Expenditure upto 2002-03 2003-04 2004-05 2005-06 2006-07 2006-07 2002-03 2003-04 2004-05 2005-06 2006-07 1 2 3 4 5 6 7 8 9 10 11 12 113 Mingonda Tank Project - - - - - 316.36 - - - - -
114 Mordan Project - - - - - 113.40 - - - - -
115 Morna Gureghar(W.M) Project - 2.03 - - - - - - - - -
116 Morna River Project - - - - - 739.68 - - - - -
117 Mulkhed Project - - - - - 88.55 - - - - -
118 Mus Project - - - - - 666.71 - - - - -
119 Musli Project - - - - - 422.84 - - - - -
120 Nagalwadi Proiject - - - - - 601.43 - - - - -
121 Nalganga Project - - - - - 247.66 - -
122 Narangi Sarangin Project - - - - - 1183.20 - - - - -
123 Natuwadi Project - - - - - 3685.85 - - - - -
124 Nerpur Project - - - - - 3.29 - - - - -
125 Paldaj Project - - - - - 228.70 - - - - -
126 Palsegaon Amdi - - - - 10.07 10.07 - -
127 Panchaddhara Project - - - - - 176.33 - - - - -
128 Pothara Project 0.00 481.94 402.25 548.31 675.92 6189.94 0.00 0.00 0.00 0.00 0.00 129 Pus River Project - - - - - 562.05 - - - - -
130 Rajangaon Project - - - - - 2.04 - - - - -
131 Rajegaonkati Lift Irrigation Scheme - 68.19 1.94 1247.72 1077.94 2883.13 - - - - -
132 Ratrapur Lift Irrigation Scheme - 88.28 507.92 144.27 1530.92 1677.62 - - - - -
133 Rawanwadi Project - 9.99 - - 86.24 1047.58 - - - - -
134 Rengepar Project - - - - - 96.79 - - - - -

202
Table D3: Capital Expenditure and Working Expenses during Tenth Plan Period for Major & Medium Irrigation Projects State and Project wise
(Rs. in lakhs)
Sl. Name of the State/UT's and Capital Expenditure during the year Cumulative Working Expenses during the year No. Name of Major & Medium Irrigation Projects Capital Expenditure upto 2002-03 2003-04 2004-05 2005-06 2006-07 2006-07 2002-03 2003-04 2004-05 2005-06 2006-07 1 2 3 4 5 6 7 8 9 10 11 12 135 Saikheda Kurmi River Project - - - - - 171.08 - - - - -
136 Sakhali Project - - - - - 30.56 - - - - -
137 Sakoli Nalla Project 0.00 0.00 0.00 0.00 0.00 503.62 0.00 0.00 0.00 0.00 0.00 138 Sapan Project - 1815.92 1206.00 2489.81 4925.24 12804.84 - - - - -
139 Satpura Project - - - - - 524.23 - - - - -
140 Shirna Project - - - - - 49.29 - - - - -
141 Sonal Project - - - - - 616.52 - - - - -
142 Susary Project - - - - - 6.99 - - - - -
143 Tajana Project - - - - - 98.02 - - - - -
144 Titewadi Project - - - - - 8.45 - - - - -
145 Ulap Project - - - - - 84.83 - - - - -
146 Uma Project - - - - - 570.30 - - - - -
147 Umari Tank Project - - - - - 57.36 - - - - -
148 Waghodi Project - - - - - 915.42 - - - - -
149 Wahate Project - - - - - 284.82 - - - - -
150 Wandri Project - - - - - 1223.98 - - - - -
151 Wardha Division Pendhari 0.00 0.00 0.00 31.15 197.48 228.63 0.00 0.00 0.00 0.00 0.00 152 Wunna Project - - - - - 100.01 - - - - -
153 Yeralwadi Tank Project - 7.03 550.44 - - 0.41 - - - - -

203
Table D3: Capital Expenditure and Working Expenses during Tenth Plan Period for Major & Medium Irrigation Projects State and Project wise
(Rs. in lakhs) Sl. Name of the State/UT's and Capital Expenditure during the year Cumulative Working Expenses during the year No. Name of Major & Medium Irrigation Projects Capital Expenditure upto 2002-03 2003-04 2004-05 2005-06 2006-07 2006-07 2002-03 2003-04 2004-05 2005-06 2006-07 1 2 3 4 5 6 7 8 9 10 11 12 Manipr
Major
1 Khuga Irrigation Project - - 5260.45
2 Loktak Lift Irrigation Project - - 5161.34
3 Singda Lift Irrigation Project - - 4767.93
4 Thoubal Multipurpose River Irrigation Project - - 7932.50
Medium
5 Dollaithabi River Irrigation Project - 1065.89
6 Iram Siphai Barrage Project - - - 625.68 - - - - -
7 Khoupum Dam - 304.00
8 Sekmai Barrage - 1042.83
Meghalaya Medium 1 Construction of RVMI Project unti I and II 57.08 - -55.35 13.52 - 315.53 - - - - -
2 Mawramhah Valley Medium Irrigation Project - - 4.05 -
Orissa
Major
1 Anandpur Barrage Project 0.00 0.00 0.00 600.43 1002.21 0.00 123.29 111.00 117.49 87.57 0.00 2 Aunli Irrigation Project 296.31 421.35 282.65 .. 304.19 7.26 7.34 8.41 3 Badanala Irrigation Project .. .. .. .. .. 25.36 .. 4 Bagh Barage Irrigation Project 1129.91 919.75 1549.54 421.06 457.21 5653.62 0.00 0.00 0.00 0.00 0.00 5 Baghalati Irrigation Project 0.00 0.00 0.00 0.00 305.75 138.45 0.00 0.00 0.00 0.00 0.00

204
Table D3: Capital Expenditure and Working Expenses during Tenth Plan Period for Major & Medium Irrigation Projects State and Project wise
(Rs. in lakhs) Sl. Name of the State/UT's and Capital Expenditure during the year Cumulative Working Expenses during the year No. Name of Major & Medium Irrigation Projects Capital Expenditure upto 2002-03 2003-04 2004-05 2005-06 2006-07 2006-07 2002-03 2003-04 2004-05 2005-06 2006-07 1 2 3 4 5 6 7 8 9 10 11 12 6 Baghua Irrigation Project 0.00 0.00 0.00 0.00 0.00 186.57 12.85 4.43 6.25 0.00 0.00 7 Bahuda Irrigation Project .. .. .. .. .. 164.59 35.52 28.20 39.26 8 Baitarani System .. .. .. .. .. 79.25 7.32 4.18 8.12 9 Baladia Irrigation Project .. .. .. 185.19 8.36 11.37 11.59 17.99 10 Balimela Dam Project .. .. .. .. 3827.12 .. 11 Bankabahal Irrigation Project 32.52 12 Barasuan Irrigation Project .. .. .. .. .. 1635.46 .. 19.56 13 Bhaskel Irrigation Project 707.36 512.32 367.36 .. .. 135.10 17.89 7.92 23.36 14 Bhimkund Irrigation Project 1934.94 1262.86 1161.20 .. .. 20.86 .. 15 Birupa-Genguti Island Irrigation Project .. .. .. .. .. 1400.54 .. 16 Bondapipili Irrigation Project 0.00 0.00 0.00 0.00 0.00 40.66 0.00 0.00 0.00 0.00 0.00 17 Budhabudhiani Irrigation Project 227.83 16.24 19.44 21.86 18 Chheligada Irrigation Project(AIBP) .. .. .. .. .. 181.35 .. 19 Chiroli Irrigation Project 166.50 631.24 994.01 .. .. 213.84 .. 20 Choukinala Irrigation Project 4.76 .. .. .. .. 15.23 .. 21 Dadarghati Irrigation Project 0.00 0.00 0.00 0.00 0.00 975.56 16.92 16.99 19.55 0.00 0.00 22 Daha Irrigation Project 128.95 70.01 99.72 .. .. 1543.1 21.59 21.03 27.63 23 Dahuka Irrigation Project .. .. .. .. .. 152.98 12.35 4.79 8.99 24 Darjang Irrigation Project 0.00 0.00 0.00 0.00 0.00 1016.67 0.00 0.00 0.00 47.20 0.00 25 Delta Irrigation Project 2815.54 3148.64 4155.72 0.00 0.00 9489.98 1168.75 863.20 1234.44 1533.33 0.00 26 Dumerbahal Irrigation Project 0.00 0.00 0.00 0.00 0.00 2227.99 0.00 0.00 0.00 15.59 0.00 27 Godahada Irrigation Project 0.00 0.00 0.00 0.00 0.00 565.13 29.66 25.62 45.12 41.06 0.00

205
Table D3: Capital Expenditure and Working Expenses during Tenth Plan Period for Major & Medium Irrigation Projects State and Project wise
(Rs. in lakhs) Sl. Name of the State/UT's and Capital Expenditure during the year Cumulative Working Expenses during the year No. Name of Major & Medium Irrigation Projects Capital Expenditure upto 2002-03 2003-04 2004-05 2005-06 2006-07 2006-07 2002-03 2003-04 2004-05 2005-06 2006-07 1 2 3 4 5 6 7 8 9 10 11 12 28 Gohira Irrigation Project .. .. .. 1324.38 2568.85 2011.4 29.01 13.75 35.94 29 Hadagada Irrigation Project 1568.89 826.39 863.80 .. .. 22.36 20.53 30 Hadua Irrigation Project .. .. .. .. 654.21 654.21 .. 31 Haldia Irrigation Project 0.00 0.00 0.00 0.00 0.00 -0.39 5.34 5.44 10.04 13.35 0.00 32 Harbhangi Irrigation Project 0.00 0.00 0.00 1420.77 0.00 8194.20 0.00 0.00 0.00 0.00 0.00 33 Hariharjore Irrigation Project 366.35 341.49 669.25 .. .. 9394.9 34 Hiradharbati Irrigation Project .. .. .. .. .. 45.70 24.07 18.40 23.79 35 Hirakud Dam Project 0.00 0.00 0.00 129.65 0.00 8618.28 1115.60 1289.27 1437.51 0.00 0.00 36 Hydraulic Research (AIBP) .. .. .. 586.51 46.15 83.80 .. 37 Hydrology Project (EAP) 197.33 1045.15 1405.50 1279.47 95.98 179.08 0.00 0.00 0.00 0.00 0.00 38 Ib Irrigation Project .. .. .. .. .. 38.86 .. 39 Indra Dam Project .. .. .. .. .. 108.80 .. 40 Jay Mangal Irrigation Project 34.42 41 Jharbandha Irrigation Project 9.56 .. .. .. .. 390.01 10.60 4.61 10.71 42 Kalo Irrigation Project 5.01 0.00 0.00 0.00 0.00 9474.53 58.27 30.58 55.71 0.00 0.00 43 Kanjhaaariari Irrigation Project 30.68 44 Kanjhari Irrigation Project .. .. .. .. .. 12525.99 .. 45 Kansabahal Irrigation Project .. .. .. .. .. 30.66 .. 46 Khadakei Irrigation Project 0.00 0.00 0.00 0.00 0.00 9.98 36.13 44.42 44.01 36.45 0.00 47 Modernisation of Dalta Development Plan Scheme 0 0 0 0 0 163.46 28.12 14.5 28.03 0 0 48 Modernisation of Rushikulya System 3.66 -0.02 0.00 0.00 0.00 3588.98 51.03 0.00 0.00 0.00 0.00 49 Kharekhara Irrigaaation Project .. .. .. .. .. 129.65 ..

206
Table D3: Capital Expenditure and Working Expenses during Tenth Plan Period for Major & Medium Irrigation Projects State and Project wise
(Rs. in lakhs)
Sl. Name of the State/UT's and Capital Expenditure during the year Cumulative Working Expenses during the year No. Name of Major & Medium Irrigation Projects Capital Expenditure upto 2002-03 2003-04 2004-05 2005-06 2006-07 2006-07 2002-03 2003-04 2004-05 2005-06 2006-07 1 2 3 4 5 6 7 8 9 10 11 12 50 Kuanria Irrigation Project .. .. .. 1383.81 16.95 9.16 18.62 51 Kusei Irrigation Project .. .. .. .. .. 635.31 .. 36.94 52 Lower Indra Irrigation Project 1726.65 2453.35 3892.85 .. .. .. 53 Lower Suktel Irrigation Project .. .. .. 39.39 47.70 .. 54 Mahanadi Birupa Barrage project 1998.89 1179.15 682.45 0.00 0.00 15775.35 217.86 230.80 257.51 139.79 90.65 55 Manajore Irrigation Project .. .. .. .. 45.34 .. 56 Medium Irrigation - Commercial 57 Modernisation of Baitarani System 5597.38 3727.82 4541.41 0.00 0.00 429.17 0.00 0.00 0.00 0.00 0.00 58 Naraj Barrage 671.98 572.11 841.31 363.71 0.00 21668.71 0.00 0.00 0.00 0.00 0.00 59 Nessa Irrigation Project .. .. .. .. .. 133.6 3.71 6.00 5.79 60 Okala Irrigation Project 5.00 .. .. .. .. 16.62 .. 61 Ong Irrigation Project 0.00 0.00 0.00 0.00 100.76 2380.16 23.65 52.97 66.62 0.00 0.00 62 Orissa canals Project 5.44 0.00 0.00 0.00 0.00 306.58 121.26 95.24 116.45 0.00 0.00 63 Pilasalki irrigation Project 4.98 .. .. .. .. 3461.27 21.91 24.60 33.43 64 Pipe Line Projects under A.I.B.P. 5387.91 2857.41 2575.04 .. 968.12 9333.67 .. 65 Pitamahal Irrigation Project .. .. .. .. .. 267.36 11.54 12.31 13.31 66 Potteru Irrigation Project 0.00 0.00 0.00 504.77 0.00 0.00 114.44 129.43 235.81 0.00 0.00 67 Rajua Irrigation Project (NABARD) 5.01 .. .. .. .. .. .. 68 Ramanadi Irrigation Project .. .. .. .. .. 927.9 9.71 3.35 10.48 69 Ramiala Irrigation Project .. .. .. 364.98 .. 1921.8 37.75 37.53 46.48 50.60 70 Remal Irrigation Project 230.16 117.69 146.17 0.00 0.00 701.39 0.00 0.00 0.00 18.34 0.00

207
Table D3: Capital Expenditure and Working Expenses during Tenth Plan Period for Major & Medium Irrigation Projects State and Project wise
(Rs. in lakhs) Sl. Name of the State/UT's and Capital Expenditure during the year Cumulative Working Expenses during the year No. Name of Major & Medium Irrigation Projects Capital Expenditure upto 2002-03 2003-04 2004-05 2005-06 2006-07 2006-07 2002-03 2003-04 2004-05 2005-06 2006-07 1 2 3 4 5 6 7 8 9 10 11 12 71 Rengali Irrigstion Project 14708.27 8798.60 9896.16 0.00 0.00 1475.67 262.09 268.21 286.59 0.00 0.00 72 Rukuranala Irrigation Project .. .. .. .. .. 841.76 .. 73 Rushikulya System 0.00 0.00 0.00 0.00 0.00 6.66 0.00 0.00 0.00 258.65 0.00 74 Saipal Irrigation Project .. .. .. .. .. 293.46 8.91 4.85 10.41 13.78 75 Salandi Dasa Mouza .. .. .. 2372.59 15432.59 .. 76 Salia Irrigation Project 0.00 0.00 0.00 0.00 0.00 578.39 34.63 24.56 38.67 40.64 0.00 77 Salki Irrigation Project 754.10 392.42 343.52 0.00 0.00 328.70 87.38 70.44 92.67 128.26 0.00 78 Salpada Canal System .. .. .. .. .. 18.98 .. 79 Samakoi Irrigation Project .. .. .. 291.51 1000.88 147.46 .. 80 Sapua Badjore Irrigation Project .. .. .. .. 85.61 4523.74 .. 81 Sarafgarh Irrigation Project 1315.06 2808.07 3666.13 .. .. 5.27 .. 13.66 82 Satiguda Irrigation Project .. .. .. .. .. 49.98 .. 34.25 83 Sunder Irrigation Project .. .. .. .. 800.74 20.06 21.73 18.83 23.46 84 Sunei Irrigation Project 56.66 55.88 85 Talasara Irrigation Project .. .. .. 145.75 .. 14202.16 15.90 15.28 17.86 17.46 86 Talia Minor 1176.90 279.92 579.36 .. .. 60.66 .. 87 Talsara Irrigation Project .. .. .. .. .. 3348.9 19.17 20.04 20.97 88 Telengiri Irrigation Project 0.00 0.00 0.00 0.00 140.04 265.19 0.00 0.00 0.00 0.00 0.00 89 Titilagarh Irrigation Project .. 10.18 .. 90 Upkeeping of Existing Irrigation System .. .. .. .. 1162.49 .. 91 Upper Indravati Irrigation Project -27.95 0.00 -22.50 3721.95 5092.30 0.00 248.29 294.16 304.17 0.00 0.00 92 Upper Jonk Irrigation Project 0.00 0.00 0.00 0.00 0.00 12214.93 0.00 0.00 0.00 0.00 0.00

208
Table D3: Capital Expenditure and Working Expenses during Tenth Plan Period for Major & Medium Irrigation Projects State and Project wise
(Rs. in lakhs) Sl. Name of the State/UT's and Capital Expenditure during the year Cumulative Working Expenses during the year No. Name of Major & Medium Irrigation Projects Capital Expenditure upto 2002-03 2003-04 2004-05 2005-06 2006-07 2006-07 2002-03 2003-04 2004-05 2005-06 2006-07 1 2 3 4 5 6 7 8 9 10 11 12 93 Upper Kolab Irrigation Project 0.00 0.00 0.00 661.41 -19.24 0.00 241.62 321.77 341.17 0.00 0.00 94 Upper Suktel Irrigation Project 5.00 .. .. .. .. 800.31 4.54 5.72 6.04 6.48 95 Uthei Irrigation Project 5.00 0.00 0.00 0.00 0.00 250.78 38.70 20.47 38.87 0.00 0.00 Medium 96 Aunli Irrigation Project .. .. .. .. .. 1.47 .. 97 Bankabahal Irrigation Project .. .. .. .. .. 1.50 .. 98 Barasuan Irrigation Project .. .. .. .. 0.83 .. 99 Budhabudhani Irrigation Project .. .. .. .. .. 9.00 .. 100 Dahuka Irrigation Project .. .. .. .. .. 0.27 .. 101 Khanjhari Irrigation Project .. .. .. 318.66 .. .. .. Punjab Major 1 Construction of weir for Shah Nahar 2206.96 2 Banur Canal System 0.00 3.08 0.22 0.21 0.02 0.21 0.21 3 Beas Project 88.58 0.00 -3.31 13.31 495.78 9293.86 1073.33 1244.39 943.44 2431.93 2504.21 4 Bhakra Dam 8.32 0.00 0.00 0.00 0.00 10323.10 1507.92 1455.46 1582.13 655.51 0.00 5 Bist Doab Canal System 38.45 6.58 6 Canalisation of Navin and Mughali Kulhs 0.00 8.64 0.60 0.6 0.04 0.61 0.61 7 Construction of New distributries Minor 537.56 7.37 0.00 0.00 0.00 8622.31 524.14 524.40 36.71 524.40 524.40 8 Dholbaha Check Dam 2745.85 9 shah Nahar Canal System 194.61 32.95 -3.09 3111.03 17087.37 950.99 952.14 66.89 1061.27 1061.27 10 Kandi Canals Lift Irrigation Schemes 0.00 17.42

209
Table D3: Capital Expenditure and Working Expenses during Tenth Plan Period for Major & Medium Irrigation Projects State and Project wise
(Rs. in lakhs) Sl. Name of the State/UT's and Capital Expenditure during the year Cumulative Working Expenses during the year No. Name of Major & Medium Irrigation Projects Capital Expenditure upto 2002-03 2003-04 2004-05 2005-06 2006-07 2006-07 2002-03 2003-04 2004-05 2005-06 2006-07 1 2 3 4 5 6 7 8 9 10 11 12 11 Extension of Non Peronnial Irrigation 317.24 22.20 22.20 1.55 22.20 22.20 12 Extension of Phase II Kandi Canal 451.59 543.99 5287.94 7655.08 48.01 13 Garahi Lift Irrigation Scheme 0.00 12.41 0.87 0.87 0.06 0.87 0.87 14 Garshankar Lift Irrigation Scheme 0.00 13.02 0.91 0.91 0.06 0.91 0.91 15 Ghaggar Project 0.00 15.13 1.06 1.06 0.07 1.06 1.06 16 Gurgaon Canal 0.00 2.64 0.19 0.18 0.01 0.19 0.19 17 Harike Project 0.00 1084.27 276.24 315.67 5.31 75.90 75.9 18 Irrigation facilities to Himachal area below Talwada 1449.84 881.04 0.93 7362.75 19 Lining of Channels 3320.99 1374.52 1601.01 3700.44 8082.85 68938.86 3595.98 3644.09 310.97 3754.38 3989.50 20 Lohat Lift Irrigation Scheme 0.00 0.06 0.00 21 Low Dam in Kandi Aarea 699.52 750.42 1685.86 1788.88 22256.89 22 Madhopur Beas Link Project 0.00 361.12 27.15 25.28 1.77 25.28 25.28 23 Modernisation of Existing canals 3863.98 -2.96 14933.24 730.14 727.67 50.94 727.67 727.67 24 Nangal Dam 2529.48 876.00 0.00 5.24 0.00 6928.48 605.48 635.44 189.75 606.97 457.53 25 Raising Lining of BML for providing free board 24.04 23.10 1.52 0.00 284.70 14.87 15.68 1.12 15.89 15.89 26 Rajasthan Feeder 0.10 27 Ranjit Sagar Dam 1559.83 307358.15 16767.75 28 Remodelling of channel UBDC System to meet the 579.87 776.88 1963.08 1083.77 4403.60 29 Runing of Basant pur Canal 0.00 15.27 1.07 1.07 0.07 1.07 1.07 30 Shah Nahar Canal System 0.00 0.00 0.00 0.00 0.00 5751.18 240.72 221.77 13.43 191.78 191.79 31 Shahpur Kandi project 1764.06 1162.04 666.31 753.45 3394.44 13962.56 32 Sidhwan Canal System 0.48

210
Table D3: Capital Expenditure and Working Expenses during Tenth Plan Period for Major & Medium Irrigation Projects State and Project wise
(Rs. in lakhs) Sl. Name of the State/UT's and Capital Expenditure during the year Cumulative Working Expenses during the year No. Name of Major & Medium Irrigation Projects Capital Expenditure upto 2002-03 2003-04 2004-05 2005-06 2006-07 2006-07 2002-03 2003-04 2004-05 2005-06 2006-07 1 2 3 4 5 6 7 8 9 10 11 12 33 Sirhind Feeder Project 0.00 0.15 4370.17 4574.75 4111.30 14746.79 12775.29 27937.94 30435.49 34813.19 14041.22 34 Sutlej Valley Project 0.00 301.65 126.70 33.46 32.93 21.10 21.10 35 Sutlej Yamuna Link Project 568.74 9027.69 1679.73 1679.73 117.58 1679.73 3995.10 36 Thein Dam (Ranjit Sagar Dam) 14109.76 37 Upper Bari Doab Canal System 0.00 1027.30 45.56 78.32 5.03 71.91 71.91 38 Utilissation of Surplus Ravi Beas Waters 0.00 0.00 0.00 0.00 0.00 1718.21 120.07 120.07 8.41 120.07 120.07 Rajasthan Major 1 Beas Project 0.35 3.45 3.55 3.80 3.99 15843.38 3050.24 4092.87 4583.38 4536.55 4034.14 2 Bhakra Nangal Project © 0.44 0.00 0.00 184.17 0.00 2465.00 1166.82 1429.47 1409.36 1681.37 1825.80 3 Bisalpur Project 1855.86 4700.81 4771.70 4305.22 2996.69 39557.67 2185.53 2513.37 2986.99 3440.83 3805.93 4 Chambal Project 473.75 525.87 657.03 1463.53 696.94 19255.67 2802.53 2841.92 2986.80 3172.74 3435.34 5 Gurgaon Canal 0.00 0.00 0.00 258.02 0.00 3088.16 399.34 383.31 370.88 378.07 405.48 6 Indira Gandhi Nahar Project 12565.54 15654.87 20006.84 14987.94 10847.18 310540.69 27627.00 29943.07 32133.54 33851.70 35410.91 7 Jakham Project 16.30 4.12 12.00 110.00 0.00 11087.77 1177.43 1186.90 1202.08 1211.19 1222.76 8 Mahi Project 2269.95 13.67 4342.75 5644.60 4996.44 71192.45 5506.00 5620.18 5642.58 5946.52 6869.42 9 Narbada Project 2042.27 36713.49 15582.32 19866.81 12768.32 107244.61 2129.25 4067.04 6681.83 8454.29 10086.04 10 Nohar Feeder Project 0.00 0.00 0.00 0.00 0.00 6144.86 614.46 614.44 614.48 614.49 614.49 11 Okhala-Weir Project 0.00 0.00 0.00 0.00 0.00 20.00 2.00 2.00 2.00 2.00 2.00 12 Sidhmukh Project 0.00 0.00 0.00 78.75 58.32 26129.51 2417.10 2440.63 2489.36 2503.22 2610.03 13 Yamuna Project 0.00 0.00 0.00 30.00 30.00 90.00 - - - 1.50 7.50

211
Table D3: Capital Expenditure and Working Expenses during Tenth Plan Period for Major & Medium Irrigation Projects State and Project wise
(Rs. in lakhs) Sl. Name of the State/UT's and Capital Expenditure during the year Cumulative Working Expenses during the year No. Name of Major & Medium Irrigation Projects Capital Expenditure upto 2002-03 2003-04 2004-05 2005-06 2006-07 2006-07 2002-03 2003-04 2004-05 2005-06 2006-07 1 2 3 4 5 6 7 8 9 10 11 12 Medium 14 Vallabh Nagar Project 0.00 0.00 0.00 0.00 0.00 86.37 25.31 29.50 29.67 27.07 28.88 15 Alnia Project 0.00 0.00 0.00 0.00 0.00 195.06 59.83 71.08 74.18 80.37 75.78 16 Badagaon Pal Project 0.00 0.00 0.00 0.00 0.00 76.02 26.14 29.44 31.71 22.37 20.16 17 Bandi Sedara Project 23.97 206.95 809.47 1037.94 670.32 2786.21 - - 67.32 159.69 245.10 18 Bassi Project 0.00 0.00 0.00 0.00 0.00 1127.67 138.11 139.47 140.43 138.95 141.02 19 Bethali Project 157.94 312.44 452.86 335.41 52.34 5165.14 393.19 416.59 455.10 494.51 513.90 20 Bhim Sagar Project 0.00 0.00 0.00 0.00 0.00 2394.13 278.69 273.21 269.53 271.26 269.13 21 Bilas Project 0.00 0.00 0.00 38.66 0.00 2188.89 215.14 215.27 215.02 216.96 218.89 22 Chanwali Project 1369.89 1426.05 1344.62 884.55 686.13 9886.17 485.99 625.78 764.32 875.78 954.31 23 Chhaparwara Project 0.00 0.00 0.00 0.00 0.00 2.84 0.28 0.28 0.28 0.28 0.28 24 Chhapi Project 957.60 1043.87 522.08 411.17 257.68 10201.54 748.79 848.87 927.17 973.83 1007.27 25 Daia Project 0.00 0.00 0.00 0.00 0.00 140.06 14.01 14.01 14.01 14.01 14.01 26 Gagrin Project 205.02 205.02 - - - - 10.25 27 Galwa Project 0.00 43.92 0.00 0.00 0.00 1791.95 174.80 177.00 179.19 179.20 179.19 28 Gambhiri Project 16.00 -0.26 0.00 0.00 0.00 1466.18 149.18 149.93 149.97 149.63 149.60 29 Gang Canal 3506.26 9988.92 5769.36 2931.12 3699.78 33479.18 1438.30 2107.07 2908.18 3553.83 3925.23 30 Gardada Project 23.91 287.97 1070.13 2075.24 1572.10 5029.65 - - 84.72 241.99 424.36 31 Gopalpura Project 0.00 0.00 0.00 0.00 0.00 252.18 25.22 25.22 25.22 25.22 25.22 32 Gosunda Project 0.00 0.00 0.00 0.00 0.00 99.21 9.92 9.92 9.92 9.92 9.92 33 Gudha Project 0.00 0.00 0.00 0.00 0.00 163.29 52.79 50.31 48.50 51.75 60.42 34 Harish Chandra Sagar Project 0.00 0.00 0.00 0.00 0.00 1213.20 14.01 14.33 11.11 10.73 11.95

212
Table D3: Capital Expenditure and Working Expenses during Tenth Plan Period for Major & Medium Irrigation Projects State and Project wise
(Rs. in lakhs) Sl. Name of the State/UT's and Capital Expenditure during the year Cumulative Working Expenses during the year No. Name of Major & Medium Irrigation Projects Capital Expenditure upto 2002-03 2003-04 2004-05 2005-06 2006-07 2006-07 2002-03 2003-04 2004-05 2005-06 2006-07 1 2 3 4 5 6 7 8 9 10 11 12 35 Jaisamand Project 13.54 0.00 0.00 0.00 0.00 1458.62 147.89 147.19 147.21 147.03 147.11 36 Jawai Canal - - - 0.00 0.00 660.40 143.34 150.29 153.71 154.28 148.41 37 Jetpura Project 0.00 0.00 0.00 0.00 0.00 182.16 18.22 18.22 18.22 18.21 18.22 38 Jhadol Project 0.00 0.00 0.00 0.00 0.00 93.64 9.36 9.36 9.36 9.36 9.36 39 Kalisil Project - - - 0.00 0.00 29.54 2.95 2.95 2.95 2.95 2.95 40 Kanota Project 0.00 0.00 0.00 0.00 0.00 1.60 0.16 0.16 0.16 0.16 0.16 41 Khari Feeder 0.00 0.00 0.00 0.00 0.00 136.18 13.62 13.62 13.62 13.62 13.62 42 Klakh Project 0.00 0.00 0.00 0.00 0.00 0.96 0.01 0.10 0.10 0.10 0.10 43 Kothari Project 0.00 0.00 0.00 0.00 0.00 1119.79 131.05 131.47 130.75 128.31 130.69 44 Lasadia Project 0.00 0.00 0.00 0.00 0.00 137.40 13.74 13.74 13.74 13.74 13.74 45 Mashi Project 0.00 0.00 0.00 0.00 0.00 61.16 6.12 6.12 6.12 6.12 6.12 46 Matra Kundia Project 0.00 0.00 0.00 3.11 0.00 323.95 32.08 32.08 32.08 32.24 32.40 47 Meja Irrigation Project Meja Feeder 0.00 0.00 0.00 0.00 0.00 4052.11 494.33 495.82 498.11 496.86 488.60 48 Morel Project 0.00 0.00 0.00 0.00 0.00 235.54 89.61 72.45 64.70 65.21 82.49 49 Naraian Sagar Project - - - 0.00 0.00 61.55 6.15 6.15 6.15 6.15 6.15 50 Orai Project 0.00 0.00 0.00 0.00 0.00 63.42 22.86 25.47 25.41 22.80 25.33 51 Pachana Project 1150.44 1185.48 870.19 749.31 129.87 12341.88 882.64 999.98 1102.76 1183.74 1227.69 52 Parbati Project 0.00 0.00 0.00 0.00 0.00 6416.83 693.63 688.38 690.93 741.69 736.70 53 Parbati Project 0.00 0.00 0.00 0.00 0.00 7.00 0.70 0.70 0.70 0.70 0.70 54 Parwan Project 138.40 58.78 14.89 24.21 21.21 3929.55 124.76 118.33 132.84 120.74 126.04 55 Peepad project - - - - 205.97 205.97 - - - - 10.30 56 Sawan-Bhadon Project 8.30 0.72 -1.49 315.49 4.99 4015.83 393.40 415.07 412.87 420.32 441.04

213
Table D3: Capital Expenditure and Working Expenses during Tenth Plan Period for Major & Medium Irrigation Projects State and Project wise
(Rs. in lakhs) Sl. Name of the State/UT's and Capital Expenditure during the year Cumulative Working Expenses during the year No. Name of Major & Medium Irrigation Projects Capital Expenditure upto 2002-03 2003-04 2004-05 2005-06 2006-07 2006-07 2002-03 2003-04 2004-05 2005-06 2006-07 1 2 3 4 5 6 7 8 9 10 11 12 57 Somkagdar Project 0.00 0.00 0.00 0.00 0.00 2318.74 231.87 231.87 231.87 231.87 231.87 58 Somkamla Amba Project 150.28 66.78 99.10 144.22 2.55 21054.56 2141.14 2163.89 2188.60 2198.31 2219.70 59 Sukli Project 24.06 258.93 725.13 1031.34 1287.58 3341.17 - - 65.97 153.79 269.74 60 Takali Project - - - - 206.72 206.72 - - - - 10.34 61 Tank Project - - - 0.00 0.00 28.44 2.84 2.84 2.84 2.84 2.84 62 Wagon Diversion Schemes 0.00 0.00 0.00 0.00 0.00 1396.62 163.97 165.43 170.01 169.91 173.27 63 West Banas Project 0.00 0.00 0.00 0.00 0.00 67.03 23.99 25.02 27.46 24.07 23.97 Tamil Nadu Major 1 Chittar-Pattanamkal Project 982.73 2211.48 2115.87 2584.48 3606.98 4142.01 2 Improvement to Periyar System 776.39 54.23 54.23 54.23 54.23 54.23 3 Modernisation of Cauvery Delta With World 15.35 6.64 18.53 -1.67 0.07 16939.98 2142.75 2143.79 2144.87 2145.61 2146.34 4 Modernisation of Thanjavur Channels 126.9 14.43 14.43 14.43 14.43 14.43 5 Modernisation of Vaigai Channel 784.54 788.39 791.26 467.63 1060.28 6 Modernising the Thanjavur Cannels 7.83 202.7 208.32 221.33 525.36 7 Orathapalayam Reservoir Scheme 21.85 63.7 5.42 6215.2 791.5 8 Parambikulam-Aliyar Project 63.78 -18.6 1955.25 9 Periyar Project 35.25 -0.22 10.83 -0.2 -0.23 8725.54 1853.93 1814.15 2078 2258.76 2578.32 10 Perumpallam Reservoir Scheme 2343.22 4430.65 1090.19 229.7 1740.29 24662.37 4356.62 4661.16 5152.27 4911.13 5187.2 Medium 11 Amaravathi Reservoir Project 1247.53 -2.55 -0.51 -1.86 -2.39 7468.11 833.95 914.33 912.02 914.64 905.44 12 Anaikuttam Reservoir Scheme 329.54 193.85 386.97 192.21 197.44 270.08

214
Table D3: Capital Expenditure and Working Expenses during Tenth Plan Period for Major & Medium Irrigation Projects State and Project wise
(Rs. in lakhs) Sl. Name of the State/UT's and Capital Expenditure during the year Cumulative Working Expenses during the year No. Name of Major & Medium Irrigation Projects Capital Expenditure upto 2002-03 2003-04 2004-05 2005-06 2006-07 2006-07 2002-03 2003-04 2004-05 2005-06 2006-07 1 2 3 4 5 6 7 8 9 10 11 12 13 Anaimaduve Reservoir Scheme 0 0 0 0 0 560.01 149.25 198.44 73.32 73.36 77.32 14 Arakkankottai Channel Project 0 0 0 0 0 1209.87 165.29 174.25 180.39 172.34 164.3 15 Araniar Project System 0 0 0 0 0 99.43 67.72 55.66 79.14 96.01 110.88 16 Barur Tank System 1.11 0.22 1.33 0.05 0.11 17 Bund across Palarriver 104.92 60.75 66.39 31.84 35.9 18 Canal of Lower Bhavani Anaicut System under 50.05 77.56 127.61 2.19 3.39 11.04 19 Cauvery Channel 20 Cauvery-Mettur Project System 75.16 184.26 82.94 31.55 23.28 612.96 30.05 41.78 53.01 58.06 64.15 21 Chembarampakkam Tank System 730.73 1002.15 1067.25 1266.31 1186.01 1361.78 22 Chennampatti Anicut System 106.91 78.92 96.22 54.81 63.3 23 Cheyyar Anicut System 145.04 146.55 146.74 155.29 176 24 Chinnar Reservoir System 125.58 123.13 130.07 103.65 117.36 25 Chinnavedampatty Tank System 189.98 69.67 60.2 69.83 35.75 40.63 26 Chittar Project 103.84 101.71 105.01 90.41 90.65 27 Consolidation Project 18.69 0 5120.78 0 -7.64 6708.82 102.14 117.3 355.13 598.81 842.15 28 Cumbum Valley Project 2214.57 2160.04 325.65 466.09 47.88 7154.25 468.03 654.91 743.28 758.85 776.58 29 Construction of Reservoir 6270.47 4477.33 6339.49 4001.04 2226.74 52203.9 1895.02 4179.87 4642.11 4916.37 5594.53 30 Gatana Project System 775.29 457.59 60.49 0 -0.02 4342.48 461.28 517.87 540.32 562.48 571.66 31 Golwarpatti Reservoir Project 0 0 0 0 0 219.62 121.29 130.78 129.14 113.64 115.78 32 Gomuki Nadhi Project 0.91 0 0 0 0 1059.17 47.21 0 0 0 0 33 Gundar Project Scheme 47.21 60.68 64.21 48.79 30.09

215
Table D3: Capital Expenditure and Working Expenses during Tenth Plan Period for Major & Medium Irrigation Projects State and Project wise
(Rs. in lakhs) Sl. Name of the State/UT's and Capital Expenditure during the year Cumulative Working Expenses during the year No. Name of Major & Medium Irrigation Projects Capital Expenditure upto 2002-03 2003-04 2004-05 2005-06 2006-07 2006-07 2002-03 2003-04 2004-05 2005-06 2006-07 1 2 3 4 5 6 7 8 9 10 11 12 34 Gunderipallam Reservoir System 123.64 17 16.14 16.13 14.34 15.01 35 humbalahalli Reservoir Scheme 144.2 16.35 16.14 17 21.89 28.4 36 Ichambadi Anicut System 0 3.75 4.01 0 0 310.92 103.07 90.65 94.25 101 102.15 37 Irrukangudi Reservoir Scheme 16.5 1258.74 -39.82 592.09 290.95 39.3 43.1 36.75 35.01 33.27 38 Kalingarayan Channel System 1082.24 3220.23 257.95 108.42 -2.8 6650.71 312.15 505.79 649.91 666.07 682.11 39 Kallar,Coonar and Bhavani River System 53.62 64.35 73.38 111.13 97.33 40 Kariakoil Reservoir Project System 9.74 23.19 33.64 22.61 24.85 41 Kariyuakpil Reservoir Project 247.07 179.86 184.64 176.95 168.34 42 Karuppananadhi Project 0 0 0 0 0 1574.97 0 0 31.55 60.79 65.52 43 Kattalai Project System 0 0 0 0 0 237.84 155.78 117.71 98.51 51.63 56.81 44 Kelavarappalli Reservoir Prject 0 0 0 0 0 0 482.06 419.28 470.98 455.87 493.89 45 Kesarigulihallah Reservoir Scheme 104.73 97.33 2492.4 46 Kodaganar Scheme 0 0 0 0 0 352.6 381.1 333.42 339.1 355.36 364.58 47 Kodayar Project 875.33 0 0 0 -0.76 2440.21 987.75 703.75 320.19 216.51 252.08 48 Kodumudiyar Project 1626.73 0 -6.56 0.36 0 3933.39 477.38 497.72 498.42 502.69 491.61 49 Kottaikarungulam in Radhapuram Tank 78.02 -13.38 4180.71 339.42 351.53 351.32 351 350.07 50 Krishnagiri Reservoir Project 51 Kullursandhai Resvoir Project 0 0 0 0 0 160.43 389.3 128.24 154.26 99.44 120 52 Kuthiraiyar Reservoir Scheme 0 0 29.15 256.06 327.84 1046.49 49.12 47.83 49.72 66.62 81.28 53 Lower Bhavani Project System 0 0 0 0 0 883.98 104.99 117.04 114.8 124.25 129.79 54 Lower Coleroon Anicut System 0 0 0 0 0 1028.66 1026.78 459.97 563.81 743.59 842.87 55 Madanapallam river 423.87 385.89 425.64 481.56 554.81

216
Table D3: Capital Expenditure and Working Expenses during Tenth Plan Period for Major & Medium Irrigation Projects State and Project wise
(Rs. in lakhs) Sl. Name of the State/UT's and Capital Expenditure during the year Cumulative Working Expenses during the year No. Name of Major & Medium Irrigation Projects Capital Expenditure upto 2002-03 2003-04 2004-05 2005-06 2006-07 2006-07 2002-03 2003-04 2004-05 2005-06 2006-07 1 2 3 4 5 6 7 8 9 10 11 12 56 Malattar Anicut Scheme 7.84 11.78 2.22 471.25 526.88 1022.84 0.71 1.61 2.19 23.5 44.8 57 Nambiyar Project System 232.1 45.78 24.35 1086.03 1568.9 3429.01 68.58 81.89 84.84 134.78 156.75 58 Maniimuthar Project System 10.13 6.84 3.21 59 Manimuktha Nadu Project 517.9 177.93 184.67 168.46 124.9 146.42 60 Manimutharu Nadhi Project System 105.19 61 Manjalar Project System 63.45 49.84 57.21 47.56 27.11 62 Marudhanadhi Reservoir Project -0.07 0 0 0 0 117.47 50.26 54.14 63.18 76.64 57.23 63 Marudhanadhi Scheme 527.05 60.82 105.85 59.66 60.23 64.99 64 Medium Irrigation Schemes 527.05 0.05 0.05 0.05 0.05 65 Mehmathur Anicut System 932.55 3688.37 4620.92 41.96 66 Metur Canal Scheme 0 0 0 0 0 0 243.8 163.63 191.68 197.93 240.28 67 Mirga Nadhi Resvoir Project 189.79 193.76 68 Modernisation & Rehabilitation Consolidation Project 5312.78 4.28 55.17 1216.13 521.02 29803.51 3834.8 3377.35 3379.4 3436.89 3381.78 69 Mordhana Project System 104 13.01 13.01 13.01 13.01 13.01 70 Nagavathy Reservoir Scheme 0 0 0 0 0 330.59 66.91 70.53 90.83 78.74 55.63 71 Nandiar Channel System 72 National Water Management Project 0 6.65 0 -0.39 22.83 12183.39 1645.92 1679.28 1690.83 1659.74 1665 73 New Veeranam Project 74 Neyyar Irrigation Project 516.59 0 516.36 0 380.64 8372.24 691.98 735.87 810.38 859.61 925.98 75 Noyyal Barrage Project 0 0 0 0 0 1352.53 204.68 210.48 222.01 224.28 231.72 76 Old Coleroon River 77 Orathapalayam Reservoir Project Scheme 107.18 62.96 170.14 4.69 11.86 14.62

217
Table D3: Capital Expenditure and Working Expenses during Tenth Plan Period for Major & Medium Irrigation Projects State and Project wise
(Rs. in lakhs) Sl. Name of the State/UT's and Capital Expenditure during the year Cumulative Working Expenses during the year No. Name of Major & Medium Irrigation Projects Capital Expenditure upto 2002-03 2003-04 2004-05 2005-06 2006-07 2006-07 2002-03 2003-04 2004-05 2005-06 2006-07 1 2 3 4 5 6 7 8 9 10 11 12 78 P.T.Rajan Channel Scheme 261.16 262.66 264.97 259.6 263.26 79 Pachilainachiamman Odai 0 364.26 9.4 0 0 0.75 27.33 21.17 22.73 28.4 31.47 80 Palar Anicut System 0 0 76.81 54.08 18.33 149.22 305.75 261.84 327.81 355.42 408.46 81 Pambar Reservoir 1740.32 148.65 289.04 228.67 219.38 233.2 82 Panjapatti Reservoir System 93.48 92.14 102.73 58.14 61.4 83 Parappalar System 1.09 2.33 2.51 1.23 1.46 84 Peria Odthu Odai 0 0 0 0 0 101.33 23.41 26.48 29.91 15.21 16.92 85 Periyar Vaigai Project 0 0 135.55 1.49 21.34 158.38 0 0 5.94 11.95 0 86 Perumpallam Reservoir System 286.43 597.37 0 0 0 3057.39 422.77 438.13 441.49 438.62 439.25 87 Pilandurai Anicut System 0 0 9.94 218.36 290.92 519.22 0 0 0.43 10.7 0 88 Pilavukkal Project 91.48 61.75 75.52 23.65 54.85 89 Poigaiyar Reservoir System 229.23 104.85 29.93 33.67 42.15 45.4 90 Ponnaniar Scheme 0 0 0 0 0 105.76 147.62 98.76 115.7 111.67 128.04 91 Pullambadi Scheme 0 0 0 0 0 224.07 59.6 0 0 0 0 92 Rajathopukannur Project System 59.6 58.47 68.31 72.38 80.23 93 Rajjakumarapalayam and Mohanur Channel 2.6 4.73 2.69 0.96 94 Ramanadhi Scheme 0 0 0 0 0 195.17 1800.22 1044.43 751.17 38.96 217.33 95 Sambarpallam Odai 0 0 0 0 0 0 7.29 7.29 7.29 7.29 7.29 96 Sanaguliyan Koil Odai 5.35 89.77 22.17 16.65 133.94 0.23 3.93 9.31 97 Sanganorpallam Odai System 1.08 0.95 2.03 0.05 98 Sasthakoil 23.89 24.95 28.28 13.61 13.23 99 Sathanur Project 0.39 0 0 0 0 2723.23 565.99 259.85 259.85 259.85 259.85

218
Table D3: Capital Expenditure and Working Expenses during Tenth Plan Period for Major & Medium Irrigation Projects State and Project wise
(Rs. in lakhs)
Sl. Name of the State/UT's and Capital Expenditure during the year Cumulative Working Expenses during the year No. Name of Major & Medium Irrigation Projects Capital Expenditure upto 2002-03 2003-04 2004-05 2005-06 2006-07 2006-07 2002-03 2003-04 2004-05 2005-06 2006-07 1 2 3 4 5 6 7 8 9 10 11 12 100 Seruvalar Hydorelectric-cum-Irrigation Project 306.15 354.61 429.74 310.99 372.57 101 Sethiatope Anicut System 0 0 0 0 0 0 94.94 94.94 188.98 94.94 94.94 102 Sethiyathope Project 100.35 70.1 69.78 118.17 129.76 103 Shanmuganadhi Reservoir Scheme 16.07 1074.69 132.46 133.25 133.25 133.25 133.25 104 Shenbagathoppu Reservior 73.57 67.26 5.54 34.37 0 1477.91 175.06 181.59 184.61 186.4 205.3 105 Shoolagiri Chinnar Reservoir Project 12.15 1.71 1.71 1.71 1.71 1.71 106 Siddhamalli Reservoir Project System 0 0 0 0 0 1219.96 0 0 0 0 0 107 Sothuparai Project System 62.27 60.5 61.48 70.77 69.66 108 Souyhuparai Reservoir Project 17.54 8.48 4.16 109 Sulagiri Chinnar Reservoir System 13.63 110 Taluk, Tiruchirappalli District 54.5 41.19 45.59 33.7 36.28 111 Thambarabarani Project 423.97 41.94 43.88 0 0 3913.86 596.73 539.96 558.4 533.94 4699.04 112 Thandarai Anicut System 327.22 351.56 425.82 499.63 539 113 Thirukoilur Anicut 32.1 25.87 29.49 12.38 13.8 114 Thoppiar Reservoir System 17.72 989.22 128.74 129.61 129.61 129.61 129.6 115 Thumbalahalli Reservoir System 91.98 77.77 82.07 76.08 79.51 116 Tirukkoilur Anicut System 237.24 41.27 44.88 34.37 35.19 38.79 117 Tozhudur Project System 0 0 0 0 0 505.88 200.94 144.14 163.51 159.86 167.75 118 Water Resources Consolidation Project 109.21 64.54 74.5 82.43 128.56 119 Upper Reservoir Scheme

219
Table D3: Capital Expenditure and Working Expenses during Tenth Plan Period for Major & Medium Irrigation Projects State and Project wise
(Rs. in lakhs)
Sl. Name of the State/UT's and Capital Expenditure during the year Cumulative Working Expenses during the year No. Name of Major & Medium Irrigation Projects Capital Expenditure upto 2002-03 2003-04 2004-05 2005-06 2006-07 2006-07 2002-03 2003-04 2004-05 2005-06 2006-07 1 2 3 4 5 6 7 8 9 10 11 12 120 Uyyakondan Channel 21.64 18.86 19.55 -12.86 22.74 121 Vadakkupachaiyar Project System -0.53 0.04 0.04 0.04 0.04 0.04 122 Vaigai Project 0 0 0 0 0 0 252.88 287.37 326.29 320.23 390.62 123 Vallimalai Village of Harur Taluk 248.13 0 727.55 140.8 1366.71 6071.91 498.29 283.64 340.11 378.28 477.95 124 Vallur Anicut Ststem 125 Vandal Odai Reservoir Scheme 11.14 5.93 6.68 7.1 8.4 126 Varadhamanadhi Scheme 5.42 575.06 12.31 592.79 127 Varattupallam Reervoir System 0 0 0 0 0 175.37 32.53 30.71 34.36 34.87 38.08 128 Vasistha Nadhi Project 169.03 34.9 32.98 36.68 32.85 31.87 129 Vattamalaikarai Odai Scheme 7.02 11.04 5.07 130 Veedur Project System 0.64 233.55 25.47 25.2 25.89 31.55 34.45 131 Vellapparai Odai Project 61.22 37.73 40.33 42.17 32.37 132 Vembakottai Reservoir System 52.94 74.89 127.83 2.58 8.44 11.53 11.53 133 Venampalli Tank 0 32.15 -0.01 0 -0.01 689.04 72.2 76.22 73.8 80.93 87.72 134 Virumanathu Odai 2.23 0.98 54.64 633.4 138.23 829.43 0.11 0.26 2.69 33.58 135 Vridhachalam Anicut System 0 0 0 78.92 37.23 116.15 36.86 21.71 25.7 33.99 42.12 Tripura Medium 1 Khowai Medium Irrigation projects 70.81 175.66 132.31 136.65 204.17 3567.81 - - - - - 2 Manu Medium Irrigation Projects 25.89 162.97 257.07 366.38 926.32 5344.67 - - - - -

220
Table D3: Capital Expenditure and Working Expenses during Tenth Plan Period for Major & Medium Irrigation Projects State and Project wise
(Rs. in lakhs) Sl. Name of the State/UT's and Capital Expenditure during the year Cumulative Working Expenses during the year No. Name of Major & Medium Irrigation Projects Capital Expenditure upto 2002-03 2003-04 2004-05 2005-06 2006-07 2006-07 2002-03 2003-04 2004-05 2005-06 2006-07 1 2 3 4 5 6 7 8 9 10 11 12 Uttar Pradesh Major 3 agreement of Irrigation Department 198.04 974.17 2541.75 1792.99 6631.41 12190.05 323.11 338.10 308.53 532.18 327.99 4 Ban Sagar Project 750.21 780.10 9.17 1539.48 5 Banagar Project 4239.21 5764.97 4778.63 23404.60 53075.29 6 Betwa Canal 14887.87 11715.38 9 Bewar Poshak Project 245.46 415.85 22.45 683.76 326.17 348.17 359.17 302.72 271.75 7 Chambal Lift Project 48.03 48.03 8 Choudhary Charan Singh Deokali Pump Canal 1787.54 1434.32 972.27 5119.99 8617.42 17195.34 0.00 0.00 0.00 0.00 0.00 9 Concriete Lining in Barodha Rajwaha 2371.29 3471.60 5842.89 10 Construction of New Jasrana Canal 33.01 0.00 0.00 739.00 8067.79 8806.79 0.00 0.00 0.00 0.00 0.00 11 Deokali Pump Canal 2701.27 2701.27 12 Diverson of Noorpur Rajwaha 427.21 95.23 40.02 366.58 230.01 1542.03 13 Dohrighat Pump Canal 400.00 223.64 30.00 653.64 14 Eastern Ganga Canal 15 Eastern Yamuna Canal 4383.48 4381.69 8541.32 14655.35 37507.02 9.20 5.55 16 External added Scheme 2419.92 290.70 486.02 316.51 267.73 17 Gandak and Naraini Canal 1563.25 3750.00 8.50 8013.15 2658.71 16014.84 18 Gandak Project 1158.42 284.93 300.24 295.12 402.23 276.8 19 Gyanpur Pump Canal 4.71 400.00 404.71 20 Hindon Bandh 1.01 2923.59 21 Kanhar Irrigation Project 512.17 512.17

221
Table D3: Capital Expenditure and Working Expenses during Tenth Plan Period for Major & Medium Irrigation Projects State and Project wise
(Rs. in lakhs) Sl. Name of the State/UT's and Capital Expenditure during the year Cumulative Working Expenses during the year No. Name of Major & Medium Irrigation Projects Capital Expenditure upto 2002-03 2003-04 2004-05 2005-06 2006-07 2006-07 2002-03 2003-04 2004-05 2005-06 2006-07 1 2 3 4 5 6 7 8 9 10 11 12 22 Kishau Dam Project 431.97 128.20 59.86 -6.86 1152.89 23 Lakhwar Vyasi Project 0.40 0.40 24 Lining sultanpur Branch 9.56 9.56 25 Lower Ganga Canal 337.23 337.23 26 Madhwa Bandh 1021.60 1172.42 1024.38 1083.23 27 Madhya Ganga Project 2.27 2.27 28 Majhgaon Bandh Project 5018.82 842.95 165.55 12575.93 98.14 29 Maudha Bandh Project 199.75 0.00 176.74 0.00 25.35 719.15 0.00 0.00 0.00 0.00 0.00 30 Middle Ganga Canal 460.00 460.00 31 Modernisation of Upper Ganga Canal(W.B.) 1378.60 51.77 76.05 120.21 32 National Water Marg Scheme 3975.19 830.92 -3.46 9750.09 33 Ganga Canal 0.00 1269.23 1119.41 282.55 650.01 3321.20 0.00 0.00 0.00 1.03 2.44 34 Ghagra Canal 0.00 0.00 0.00 0.00 486.17 486.17 0.00 0.00 0.00 0.00 0.00 35 Purbi Yamuna Canal 100.19 100.19 36 Rajghat Bandh Project 219.21 37 Ram Ganga Project 4586.01 3107.33 2992.41 5911.91 6617.39 29564.24 38 Restoration of Capacity of different Projects 0.00 0.00 552.06 1861.76 7910.48 10324.30 0.00 0.00 0.00 0.00 0.00 39 Sarda Sahayak 26.06 1238.05 32.14 74.97 2406.39 11235.72 919.58 1009.20 931.49 758.07 883.10 40 Saryu Canal Project 16699.17 14870.47 16565.10 23108.68 0.00 0.00 1320.26 1560.17 1417.76 1404.43 1461.28 41 Scheme of Cementing edge Side of Canal 27931.98 123363.99 42 Son Pumped Canal 200.54 211.94 43 Upper Ganga Canal 12752.51 13319.35 7987.28 18478.94 12157.73 103139.67

222
Table D3: Capital Expenditure and Working Expenses during Tenth Plan Period for Major & Medium Irrigation Projects State and Project wise
(Rs. in lakhs) Sl. Name of the State/UT's and Capital Expenditure during the year Cumulative Working Expenses during the year No. Name of Major & Medium Irrigation Projects Capital Expenditure upto 2002-03 2003-04 2004-05 2005-06 2006-07 2006-07 2002-03 2003-04 2004-05 2005-06 2006-07 1 2 3 4 5 6 7 8 9 10 11 12 44 Urmil Bandh Project 4687.95 4687.95 907.68 849.08 793.58 1047.52 820.67 Medium 45 Arjun Dam/Canal 230.16 46 Ayodhya Pump Canal 57.00 869.12 878.53 1202.92 3007.57 6.73 11.99 6.72 7.18 47 Baigul Tank 5.85 5.28 4.53 5.56 48 Ban Ganga Canal 70.72 70.43 70.91 49 Barwar Canal System 0.00 0.00 0.00 0.00 0.00 0.00 32.50 39.49 39.82 25.07 37.20 50 Begul Reservoir 7.17 7.17 51 Belan Canal 194.37 0.00 0.00 0.00 0.00 0.00 0.00 0.00 0.00 48.36 52.23 52 Bewar Feeder Irrigation Project 74.16 67.29 72.40 64.66 65.04 53 Bhiaingoda Headwork 6.75 6.74 2.85 7.50 54 Bhopali Pump Canal 117.48 326.49 443.97 55 Bijnore Canals 0.00 1224.09 662.35 1996.86 450.01 4343.59 64.33 71.41 52.46 59.04 65.97 56 Chandra Prabha Canal 9.24 13.47 9.23 9.23 9.22 57 Chandrawal Dam 27.41 27.22 27.15 24.86 14.01 58 Charkhari Pump Canal 0.12 0.11 0.01 1.37 59 Chillimal Pump Canal 2.57 2.56 60 Chittaurgarh Reservior 367.04 0.00 0.00 1484.35 441.06 1955.94 0.00 11.59 10.22 14.73 6.87 61 Dalmau Pumped Canal 52.00 52.00 62 Dangri Bandh in Jhansi 38.00 223.34 1227.85 397.88 2004.27 63 Deokali Pump Canal 8.63 0.00 0.00 0.00 0.00 0.00 34.66 27.40 36.21 32.03 31.97 64 Dhasan Canal 8.37 8.37

223
Table D3: Capital Expenditure and Working Expenses during Tenth Plan Period for Major & Medium Irrigation Projects State and Project wise
(Rs. in lakhs) Sl. Name of the State/UT's and Capital Expenditure during the year Cumulative Working Expenses during the year No. Name of Major & Medium Irrigation Projects Capital Expenditure upto 2002-03 2003-04 2004-05 2005-06 2006-07 2006-07 2002-03 2003-04 2004-05 2005-06 2006-07 1 2 3 4 5 6 7 8 9 10 11 12 65 Doharighat Pumped Canal 10608.36 13885.56 24493.92 56448.14 83613.93 66 Dongari and Khaprar Canal 122.17 140.74 114.24 121.74 152.58 67 Dumariaganj Pump Canal 0.00 0.00 0.00 0.00 0.00 0.00 0.00 17.22 12.68 17.36 22.74 68 Ganga Bundh 69 Ghaggra Canal 0.00 0.00 496.55 701.33 0.00 197.17 106.90 102.62 98.66 118.47 82.26 70 Ghova Pumped Canal 39.75 155.06 86.56 241.62 71 Gola Pump Canal 109.00 72 Gunta and Nala Bandh 7.66 3.69 10.59 7.22 73 Gursarai Main Canal -4.45 149.36 -39.95 -19.63 203.42 8.84 7.90 74 Gyanpur Pump Canal 117.20 0.00 0.00 155.40 25.00 374.77 31.25 55.66 81.24 77.90 66.95 75 Jamaniya Pump Canal 0.00 154.68 0.00 0.00 0.00 0.00 50.11 46.64 55.12 64.54 68.25 76 Jarouli Pumped Canal 46.97 47.50 47.46 33.34 29.87 77 Kabrai Dam/Canal 322.71 441.19 247.12 592.56 2731.94 78 Ken Canal 61.14 60.07 60.27 53.96 47.19 79 Kwano Pumped Canal 244.88 150.79 149.79 149.49 96.16 90.18 80 Kyolari Bandh/Canal 52.90 36.18 45.78 41.04 39.56 81 Lakes and Tanks 11.48 2.33 0.56 0.56 82 Lalitpur Canal 40.03 83 Lining of Canal 22.63 24.41 24.4 17.38 13.35 84 Lumpsum arrangment for Medium Irrigation -88.02 85 Majhgawa Tank and Canal Project 10.71 12.29 125.77 86 Maudoha Canal 41.95

224
Table D3: Capital Expenditure and Working Expenses during Tenth Plan Period for Major & Medium Irrigation Projects State and Project wise
(Rs. in lakhs) Sl. Name of the State/UT's and Capital Expenditure during the year Cumulative Working Expenses during the year No. Name of Major & Medium Irrigation Projects Capital Expenditure upto 2002-03 2003-04 2004-05 2005-06 2006-07 2006-07 2002-03 2003-04 2004-05 2005-06 2006-07 1 2 3 4 5 6 7 8 9 10 11 12 87 Meja Canal 18.27 18.15 20.43 23.26 88 Modernisation of lachoora Head Works 125.24 139.51 75.08 138.52 88.01 87.55 89 Modernisation of Sarda Canal 1127.28 3081.81 4607.96 90 Nanak Sagar 263.72 91 Narainpur pumped Canal 96.00 126.11 3.69 225.80 92 National Water Management Scheme 117.04 310.32 1153.56 254.34 168.47 1965.13 127.30 126.22 126.55 130.57 121.56 93 Pahunj and Garhmau Canal 367.79 94 Parallel Ganga Bandh -36.79 2.98 2.97 2.19 2.17 95 Parikalp Sansthan Lucknow 32.53 96 Pathrai Bandh 13.51 13.75 97 Peeli Bandh and Canal 9.19 54.54 214.92 76.51 1141.65 6.06 6.06 98 Power Increasing of Dariyabad Branch 76.83 59.11 90.96 74.93 126.64 99 Raja Mahendra Ripuda Mansingh Chambal Project 213.00 63.86 276.86 100 Ram Ki Pairi 41.95 14.94 19.53 20.66 12.94 101 Ramganga Canal 10.88 10.14 10.56 11.74 102 Rampur Canals 90.38 89.90 99.88 102.74 106.88 103 Ranipur Canals 45.23 44.63 44.54 43.13 42.17 104 Sone Pump Canal 135.16 0.00 223.23 562.61 3884.04 4824.56 21.38 21.38 21.92 16.43 11.67 105 Rohikhand Canals 199.82 534.84 298.13 1032.79 106 Rohini Bandh/Canal 16.18 28.33 44.49 40.39 41.82 107 Rural Water Supply Schemes 0.91 0.91 1.50 0.5 108 Sarda Barrage 30381.85 100.14 32.14 0.00 0.00 132.28 0.00 4.92 4.92 4.77 3.88

225
Table D3: Capital Expenditure and Working Expenses during Tenth Plan Period for Major & Medium Irrigation Projects State and Project wise
(Rs. in lakhs) Sl. Name of the State/UT's and Capital Expenditure during the year Cumulative Working Expenses during the year No. Name of Major & Medium Irrigation Projects Capital Expenditure upto 2002-03 2003-04 2004-05 2005-06 2006-07 2006-07 2002-03 2003-04 2004-05 2005-06 2006-07 1 2 3 4 5 6 7 8 9 10 11 12 109 Machua Rajwaha Scheme 41.58 42.38 44.1 19.40 50.13 110 Shahjad Band/Canal 25.00 25.00 111 Sone Pumped Canal 7.73 7.72 7.57 6.59 112 Distt. Canal Palari Bridges 0.00 0.00 0.00 0.00 0.00 0.00 13.33 13.46 25.01 21.86 21.40 113 Suhel Irrigation Project 835.96 835.96 114 Surhatal Pump Canal 9.19 6.80 11.08 115 Tanda Pump Canal 4.43 2.58 4.07 5.00 3.47 116 Tanks and Bundh 13.00 80.08 36.70 60.05 82.75 86.85 117 Tons Pumped Canal 53.91 118 Tumarial Project 82.62 47.07 47.45 48.21 62.66 119 Umarahat Pumped Canal 0.66 30.11 36.42 40.12 25.92 35.94 120 Urmil Canal/Bandh 149.75 128.17 141.18 121 Utraula Pump Canal 0.16 0.50 0.50 2.35 122 variou Canal 1.75 31.76 21.82 24.38 Uttarakhand Major 1 Banagar Project 2 Bewar Poshak Project - - - - - 23427.29 - - - - - 3 Chambal Lift Project - - - - - 5049.89 - - - - - 4 Construction of Jamrani Dam - - - - - 7627.40 - - - - - 5 Construction of Lakhwar Vyasi Dam Project 9.68 13.36 14.19 - - 44.88 - - - - - 6 Deckali Pump Canal 99.57 52.34 - - 280.44 - - - - -

226
Table D3: Capital Expenditure and Working Expenses during Tenth Plan Period for Major & Medium Irrigation Projects State and Project wise
(Rs. in lakhs)
Sl. Name of the State/UT's and Capital Expenditure during the year Cumulative Working Expenses during the year No. Name of Major & Medium Irrigation Projects Capital Expenditure upto 2002-03 2003-04 2004-05 2005-06 2006-07 2006-07 2002-03 2003-04 2004-05 2005-06 2006-07 1 2 3 4 5 6 7 8 9 10 11 12 7 Dhorighat Pump Canal - - - - - 3978.27 - - - - - 8 Eastern Ganga Canal - - - - - 1309.76 - - - - - 9 Gandak Project - - - - - 0.76 - - - - - 10 Gyanpur Pump Canal - - - - - 7089.05 - - - - - 11 Hidon Bandh - - - - - 12161.03 - - - - - 12 Jamrani Dam - - - - - 7423.91 - - - - - 13 Kanhar Irrigation Project 72.52 10.98 2617.62 14 Kishau Dam Project - - - - - 3987.58 - - - - - 15 Koshi Irrigation Project - - - - - 1030.51 - - - - - 16 Lakhwar Vyasi Project - - - - - 2081.83 - - - - - 17 Madhya Ganga Project - - -14.61 - - 16034.20 - - - - - 18 Maudha Bandh Project - - - - - 51252.39 - - - - - 19 Meja Reservoir - - - - - 10808.70 - - - - - 20 Modernisation of Upper Ganga Canal (W.B.) - - - - - 8470.20 - - - - - 21 Narainpur Pump Canal - - 67976.15 - - - - - 22 Rajghat Bandh Project - - 0.80 - - 6781.87 - - - - - 23 Ram Ganga Project 102.32 96.54 165.17 0.00 0.00 46070.12 0.00 0.00 0.00 0.00 0.00 24 Sarda Canal - - 118.30 - - 126.48 - - - - - 25 Sarju Canal Project - - - - - 123712.52 - - - - - 26 Scheme Madho Tanda Irrigation Project - - - - - 66342.80 - - - - - 27 Shahjad Bandh - 1802.91 - - 400.00 - - - - -

227
Table D3: Capital Expenditure and Working Expenses during Tenth Plan Period for Major & Medium Irrigation Projects State and Project wise
(Rs. in lakhs) Sl. Name of the State/UT's and Capital Expenditure during the year Cumulative Working Expenses during the year No. Name of Major & Medium Irrigation Projects Capital Expenditure upto 2002-03 2003-04 2004-05 2005-06 2006-07 2006-07 2002-03 2003-04 2004-05 2005-06 2006-07 1 2 3 4 5 6 7 8 9 10 11 12 28 Son Pumped Canal - - - - - 2443.15 - - - - - 29 Suhel Irrigation Project - - 327.21 - - 4436.79 - - - - - 30 Tehri Project 0.00 0.00 0.00 0.00 1998.10 2614.59 0.00 0.00 0.00 0.00 0.00 31 Upper Ganga Canal - - - - - 14885.23 - - - - - 32 Urmil Bandh Project - - - 534.58 - - - - - 33 Zamania Pump Canal - - - 3310.83 - - - - - Medium 34 Agra Canal - - - - - 24.63 - - - - - 35 Alganj Irrigation Project - - - - - 1682.57 - - - - - 36 Anupshahr Branch Canal - - - - - 396.17 - - - - - 37 Aracote Hydel Scheme - - - - - 587.98 - - - - - 38 Arjun Canal - - - - - 13.72 - - - - - 39 Augasi Pumped Canal - - - - - 84.46 - - - - - 40 Bagoli and Padoli Jal Vidyut Project - - - - - 101.07 - - - - - 41 Banaras Canal - - - - - 22.33 - - - - - 42 Banwa Dam - - - - - 288.94 - - - - - 43 Base Camp in far flung areas - - - - - 62.09 - - - - - 44 Baur Reservior - - - - - 290.88 - - - - - 45 Belan Canal - - - - - 863.20 - - - - - 46 Belari Buckher Division - - - - - 529.38 - - - - - 47 Betwa Canal - - - - - 253.15 - - - - - 48 Bharvighati Hydel Project - - - - - 993.96 - - - - -

228
Table D3: Capital Expenditure and Working Expenses during Tenth Plan Period for Major & Medium Irrigation Projects State and Project wise
(Rs. in lakhs) Sl. Name of the State/UT's and Capital Expenditure during the year Cumulative Working Expenses during the year No. Name of Major & Medium Irrigation Projects Capital Expenditure upto 2002-03 2003-04 2004-05 2005-06 2006-07 2006-07 2002-03 2003-04 2004-05 2005-06 2006-07 1 2 3 4 5 6 7 8 9 10 11 12 49 Bhiaingoda Headworks - - - - - 35.43 - - - - - 50 Bhopal Pumped canal - - - - - 476.44 - - - - - 51 Bolanand Prayag Scheme - - - - - 85.31 - - - - - 52 Cane Canal - - - - - 2.59 - - - - - 53 Chandrawal Dam 1160.69 54 Changarh Dam Project - - - - - 161.45 - - - - - 55 Chittaurgarh Reservior - - - - - 5.70 - - - - - 56 Dalmau Pumped Canal - - - - - 365.80 - - - - - 57 Dangri Bandh in Jhansi - - - - - 179.35 - - - - - 58 Dhasan Canal 0.04 59 Dhekwa Bandh Project - - - - - 142.02 - - - - - 60 Dongri Bendh Project - - - - - 184.41 - - - - - 61 Doon Canals - - - - - 99.12 - - - - - 62 East Behgul Reservior 286.33 281.50 63 Eastern Yamuna Canal - - - - - 652.54 - - - - - 64 Ganga bundh - - - - - 1348.87 - - - - - 65 Ghagra Canal 0.00 0.00 0.00 0.00 0.00 1850.72 0.00 0.00 0.00 0.00 0.00 66 Ghova Pumped Canal - - - - - 15360.70 - - - - - 67 Gunta and Nala Bandh - - - - - 209.34 - - - - - 68 Harganpur Rajbaha - - - - - 2162.05 - - - - - 69 Haripur/Baur Dam & Canals 0.00 0.00 0.00 0.00 0.00 143.22 0.00 0.00 0.00 230.65 225.40 70 Jamni Bandh - - - - - 1134.37 - - - - -

229
Table D3: Capital Expenditure and Working Expenses during Tenth Plan Period for Major & Medium Irrigation Projects State and Project wise
(Rs. in lakhs) Sl. Name of the State/UT's and Capital Expenditure during the year Cumulative Working Expenses during the year No. Name of Major & Medium Irrigation Projects Capital Expenditure upto 2002-03 2003-04 2004-05 2005-06 2006-07 2006-07 2002-03 2003-04 2004-05 2005-06 2006-07 1 2 3 4 5 6 7 8 9 10 11 12 71 Jarouli Pumped Canal - - - - - 880.78 - - - - - 72 Jirgo Reservoir - - - - - 2230.07 - - - - - 73 Karna Prayag Scheme 0.00 0.00 0.00 0.00 0.00 152.97 0.00 0.00 0.00 0.00 0.00 74 Khajuri II - - - - - 21.67 - - - - - 75 Kharo Canal Project - - - - - 85.41 - - - - - 76 Kishanpur Pumped Canal - - - - - 446.41 - - - - - 77 Kotli Mel Hydel Project - - - - - 2074.59 - - - - - 78 Kwano Pumped Canal - - - - - 367.99 - - - - - 79 Lata Tapovan Hydel Project - - - - - 1844.34 - - - - - 80 Lower Ganga Canal - - - - - 298.61 - - - - - 81 Mariachoo Feeder - - - - - 3776.11 - - - - - 82 Mata Tila II 0.00 0.00 0.00 0.00 0.00 4046.82 0.00 0.00 0.00 0.00 0.00 83 Moosakhand Reaervior - - - - - 98.10 - - - - - 84 Nanak Sagar - - - - - 414.60 - - - - - 85 Narora Weir - - - - - 754.78 - - - - - 86 National Water Marg Scheme - - - - - 427.10 - - - - - 87 Ohen Reservoir - - - - - 191.05 - - - - - 88 Parallel Ganga Canal - - - - - 95.24 - - - - - 89 Pathrai Bandh - - - - - 41.23 - - - - - 90 Pull Reservoir - - - - - 3402.92 - - - - - 91 Rihand Dam Project - - - - - 237.71 - - - - - 92 Rohini Bandh Project - - - - - 22.19 - - - - -

230
Table D3: Capital Expenditure and Working Expenses during Tenth Plan Period for Major & Medium Irrigation Projects State and Project wise
(Rs. in lakhs)
Sl. Name of the State/UT's and Capital Expenditure during the year Cumulative Working Expenses during the year No. Name of Major & Medium Irrigation Projects Capital Expenditure upto 2002-03 2003-04 2004-05 2005-06 2006-07 2006-07 2002-03 2003-04 2004-05 2005-06 2006-07 1 2 3 4 5 6 7 8 9 10 11 12 93 Sajnam Bandh Project - - - - - 105.41 - - - - - 94 Saprar Bandh Project - - - - - 858.58 - - - - - 95 Sarda Sagar II - - - - - 24.43 - - - - - 96 Sarju Lift Canal - - - - - 1533.39 - - - - - 97 Singar Dam - - - - - 1086.62 - - - - - 98 Tanks and Bundh - - - - - 2.21 - - - - - 99 Tons Pumped Canal - - - - - 186.60 - - - - - 100 Tumria Scheme 0.00 0.00 0.00 0.00 0.00 4853.56 0.00 0.00 0.00 0.00 0.00 101 Umarhat Pumped Canal 295.88 277.16 102 Yamuna Pumped Canal - - - - - 405.86 - - - - - West Bengal Major & Medium 1 Beko Irrigation Schemes 2.69
2 Damodar valley Project Other Scheme 4.30 5.58
3 Futiary Irrigation Scheme 67.10 143.42 2.85 0.00 18104.07 3089.19 2530.41 2975.02 3089.05 5104.96
4 Hanumata Irrigation Schemes 16.11 1.06
5 Kanasabati Reservoir Project 31.76 33.96 271.00
6 Karatwa Irrigation Project 1808.67 1195.48 244.30 0.-31 0.00 36423.61 2716.2 2365.32 4437.08 4858.27 4873.06
7 Mayurakshi Reservoir Project 0.00 0.00 0.00 0.00 0.00 4006.57 2079.83 1982.30 2107.69 2102.08 1937.17
8 Midnapore Irrigation canal 73.95 48.66 75.57 75.49
9 Old Damodar Canals - 0.00 137.51

231
Table D3: Capital Expenditure and Working Expenses during Tenth Plan Period for Major & Medium Irrigation Projects State and Project wise
(Rs. in lakhs) Sl. Name of the State/UT's and Capital Expenditure during the year Cumulative Working Expenses during the year No. Name of Major & Medium Irrigation Projects Capital Expenditure upto 2002-03 2003-04 2004-05 2005-06 2006-07 2006-07 2002-03 2003-04 2004-05 2005-06 2006-07 1 2 3 4 5 6 7 8 9 10 11 12 10 Patloi Irrigation Schemes 179.01
11 Saharajore Irrigation Schemes 65.31 53.17
12 Subarnarekha Barrage Project 197.23 462.00 86.38 246.20 0.00 1170.91 22.73 0.00 0.00 0.00 0.00
13 Tatko Irrigation Scheme 259.46 230.97 133.74 164.17 0.00 3942.40
14 Teesta Barrage Project 36.16 23.04 0.00 0.00 0.00 0.00 0.00 0.00 0.00 0.00 0.00
Medium
15 Bakreswar Canal
16 Beko Irrigation Schemes 3.73 7.95 1.53 0.65 17 Eden Canal System 5.22
18 Futiary Irrigation Scheme 0.00 0.23 0.01
19 Golmarajore Irrigation Scheme 0.87
20 Hanumata Irrigation Schemes 7.76
21 Hinglow Irrigation Project 22.29
22 Karatwa Irrigation Canals - 1610.9
23 Midanpore Irrigation Canal 22.98 22.46 19.07 18.31
24 Old Damodar Canals 273.77 241.57 247.90 294.47
25 Other Irrigation Schemes in K.C. 128.19 179.01 177.25 184.17 186.33 171.1
26 Patloi Irrigation Schemes 93.15 6568.13 4.90
27 Ramchandrapur Irrigation Scheme 6.52
28 Saharajore Irrigation Schemes
29 Tatko Irrigation Scheme 0.00 0.00 4.92 0.00 0.00 189.65 0.00 15.72 19.80 8.37 7.84

232
Table D4 : State-wise Status of Accelerated Irrigation Benefits Programme (AIBP)-Central Loan Assistance (CLA)/Grant Released for Major, Medium & ERM Projects in India
(in Rs. crore)
Sl. No.
State/Project Name CLA released up to 2004-2005
Grand released total up to 21.01.2009
Cumulative CLA/Grant
released 1 2 3 4 5 1 Andhra Pradesh 933.61 2544.36 3475.97 2 Assam 98.05 50.02 148.07
3 Bihar 454.90 118.94 573.84
4 Chhattisgarh 267.33 75.45 342.78
5 Goa 130.86 49.70 180.55
6 Gujarat 4107.17 1344.86 5452.03
7 Haryana 78.03 12.51 90.54
8 Himachal Pradesh 60.11 90.41 150.51
9 Jammu & Kashmir 75.80 188.60 264.40
10 Jharkhand 77.81 25.66 103.47
11 Karnataka 2269.01 1050.63 3319.64
12 Kerala 123.70 40.84 164.54 13 Madhya Pradesh 1866.69 955.31 2822.00
14 Maharashtra 979.89 2816.33 3792.22
15 Manipur 102.90 330.81 433.71
16 Meghalaya 873.16 1167.29 2040.45
17 Punjab 415.47 39.82 455.29
18 Rajasthan 1387.43 542.92 1930.34
19 Tripura 30.92 27.27 58.19
20 Up/Uttaranchal 1914.54 492.30 2404.84
21 West Bengal 166.13 34.40 200.54
22 Grand Total 16425.51 11982.41 28407.92
Source : Central Water Commission, Project Monitoring Organisation. C : Completed. X : The project is not under AIBP now. * : CLA ammounting to Rs.1.30 crore during 1996-1997 was released to
Marwal Lift, Lethpora Lift and Koil Lift, J&K (Rs.0.30 crore, 0.50 crore and Rs.0.50 crore respectively) out of which 1.25 crore was transferred to Modernisation of Ranvir Canal and Rs..005 crore to new Pratap Canal and utilised in the same year.
@ : Kolonga Project of Assam has been transferred to Minor Irrigation Sector. + : Torai Project of Jharkhand has been abondoned due to public agitation.

233
Table D5 : Physical and Financial Progress of River Valley Projects and Flood Prone River (RVP & FPR) by State
(Physical in lakh ha. & Financial in Rs. lakh)
Sl. no.
Name of States Up to IX Plan
During X Plan
UP to X Plan
2007-2008
Total up to 2007-08
Programme for 2008-09
Physical Financial Physical Financial Physical Financial Physical Financial Physical Financial PhysicalTarget Financial Outlay
1 2 3 4 5 6 7 8 9 10 11 12 13 14
1 A.P. a) Forests 1.434 4769.87 0.20 2117.94 1.632 6887.81 0.033 433.12 1.665 7320.93 0.042 500.00
b) Agriculture 1.277 2472.03 0.21 1152.84 1.485 3624.87 0.037 318.27 1.522 3943.14 0.019 150.00 Sub-Total 2.711 7241.90 0.408 3270.78 3.117 10512.68 0.070 751.39 3.187 11264.07 0.061 650.000
2 Arunachal Pradesh 0.000 0.00 0.03 144.78 0.025 144.78 0.016 224.04 0.041 368.82 0.000 0.00
3 Assam 0.192 494.12 0.04 216.81 0.227 710.93 0.033 126.95 0.260 837.88 0.037 287.38 4 Bihar 1.636 4108.74 0.00 27.40 1.639 4136.14 0.000 1.639 4136.14 0.009 40.00 5 Chhattisgarh 0.056 281.58 0.25 1182.80 0.307 1464.38 0.101 602.67 0.408 2067.05 0.063 400.00
6 Gujarat a)Forest 0.444 1317.51 0.10 828.78 0.540 2146.29 0..019 283.94 0.559 243023 0.020 283.47
b) Agriculture 0.828 3212.19 0.63 5648.43 1.453 8860.62 0.223 2120.04 1.676 10980.66 0.179 1504.13 Sub-Total 1.271 4529.70 0.721 6477.21 1.993 11006.912 0.242 2403.90 2.235 13410.89 0.199 1787.600 7 Haryana 0.639 1774.03 0.20 950.24 0.842 2724.27 0.017 299.01 0.859 3023.28 0.037 200.00
8 Himachal Pradesh 2.957 11227.75 0.25 3780.08 3.209 15007.83 0.076 1090.13 3.285 16097.96 0.195 1242.30
9 Jharkhand 0.000 0.00 0.00 0.00 0.000 0.00 0.056 322.21 0.056 322.21 0.024 190.00
10 Jammu & Kashmir 0.679 4057.56 0.15 1811.92 0.828 5839.48 0.034 383.86 0.862 6223.34 0.057 702.00
11 Karnataka 5.923 11166.98 1.62 5816.09 7.547 16983.07 0.246 1353.95 7.793 18337.02 0.360 1800.00 12 Kerala 0.307 1974.66 0.09 1094.58 0.401 3069.24 0.031 242.89 0.432 3312.13 0.040 160.00
13 M.P. a) Agriculture 10.098 17670.96 0.73 3824.27 10.830 21495.23 0.259 1613.18 11.089 23108.41 0.160 1420.62
b) NVDD 0.441 1783.59 0.29 1329.76 0.727 3113.35 0.052 298.80 0.779 3412.15 0.075 624.44 Sub-Total 10.538 19454.55 1.019 5154.03 11.557 24608.58 0.311 1911.98 11.867 36520.56 0.235 2045.060 14 Maharashtra 2.337 8212.67 0.96 8031.98 3.300 16244.65 0.369 4324.46 3.669 20569.11 0.434 3453.07

234
Table D5 : Physical and Financial Progress of River Valley Projects and Flood Prone River (RVP & FPR) by State
(Physical in lakh ha. & Financial in Rs. lakh)
Sl. no.
Name of States Up to IX Plan
During X Plan
UP to X Plan
2007-2008
Total up to 2007-08
Programme for 2008-09
Physical Financial Physical Financial Physical Financial Physical Financial Physical Financial PhysicalTarget Financial Outlay
1 2 3 4 5 6 7 8 9 10 11 12 13 14 15 Manipur 0.000 0.00 0.01 163.92 0.012 163.92 0.039 453.00 0.051 616.92 0.040 453.00 16 Meghalaya 0.000 0.00 0.00 11.49 0.000 11.49 0.000 4.73 0.000 16.22 0.015 127.47 17 Mizoram 0.008 107.03 0.06 767.45 0.066 874.48 0.045 563.00 0.111 1437.48 0.029 453.00 18 Nagaland 0.000 0.00 0.06 444.00 0.061 444.00 0.018 300.00 0.079 744.00 0.027 300.00 19 Orissa 2.476 4007.56 0.11 568.58 2.586 4576.14 0.094 445.00 2.680 5021.14 0.065 693.67 20 Punjab 0.340 394.69 0.04 165.17 0.376 559.86 0.009 76.62 0.385 636.48 0.013 80.00 21 Rajasthan 6.812 19276.57 1.32 9745.26 8.133 2921.83 0.360 2919.21 8.493 31941.04 0.405 3427.00 22 Sikkim 0.246 1289.09 0.02 255.47 0.267 1544.56 0.022 227.88 0.288 1772.44 0.023 220.50 23 Tamil Nadu 1.329 6824.47 0.30 3444.01 1.630 10268.48 0.108 1237.35 1.738 11505.83 0.078 1064.12 24 Tripura 0.102 405.29 0.02 174.65 0.121 579.94 0.002 60.70 0.123 640.64 0.004 49.95 25 Uttar Pradesh 6.265 17643.66 1.40 8126.15 7.660 58769.81 0.170 1201.68 7.829 26971.49 0.220 2200.00 26 Uttaranchal 1.721 8099.38 0.17 1618.48 1.895 9717.86 0.056 675.54 1.951 10393.40 0.047 624.44 27 West Bengal 1.378 3344.10 0.10 576.93 1.479 3921.03 0.010 94.92 1.489 4015.95 0.013 180.00 # Chandigarh 0.017 95.27 0.00 0.00 0.017 95.27 0.000 0.017 95.27 0.000 # Delhi 0.024 48.47 0.00 0.00 0.024 48.47 0.000 0.024 48.47 0.000 # DVC 4.900 15193.76 0.48 5464.90 5.382 20658.66 0.093 1011.24 5.475 21669.90 0.078 700.00 # Hd. Quarter 0.000 397.26 0.00 219.00 0.000 616.26 0.000 0.000 616.26 0.000 TOTAL 54.863 151620.84 9.840 69704.16 64.703 221325.00 2.627 23308.39 67.329 244633.39 2.807 23530.56
# Pm Package for J&K 0.00 0.00 0.58 4981.68 0.580 4981.68 0.206 1852.97 0.786 6834.65 0.221 2000.00
Grand Total 54.863 151620.84 10.419 74685.84 65.283 226306.68 2.833 25161.36 68.115 251468.04 3.027 25530.56 Sources : Ministry of Agriculture (Natural Resource Management Division) Note : There is a slight variation, in the figures ( Physical & Financial) achievements as reported earlier under col.5&6 due to reconciled & revised progress report received from the various
states e.g. Andhra Pradesh, Jammu & Kashmir, M.P., W.B., etc.

235
Table D6 : Central Releases Under the Command Area Development Programme by State
(Unit: Rs. in lakh)
Sl. no.
Name of State Total up to end of VIII
Plan
During IX Plan
Up to IX Plan
[(5)=(3)+(4)]
During X Plan
Total up to X Plan
[(7)=(5)+(6)]
During XI Plan up to March
2008
Cumulative release up to March 2008 [(9)=(7)+(8)]
1 2 3 4 5 6 7 8 9
1 Andhra Pradesh 5458.17 3839.57 9297.74 0.00 9297.74 0.00 9297.74
2 Arunachal Pradesh 0.00 48.50 48.50 525.36 573.86 238.59 812.45
3 Assam 1873.96 192.45 2066.41 0.00 2066.41 0.00 2066.41
4 Bihar 10918.43 300.00 11218.43 630.11 11848.54 0.00 11848.54
5 Chattisgarh 0.00 46.32 46.32 2060.02 2106.34 0.00 2106.34
6 Goa 897.93 20.00 917.93 0.00 917.93 0.00 917.93
7 Gujarat 9838.75 1089.97 10928.72 4110.00 15038.72 3057.66 18096.38
8 Haryana 8372.77 6078.03 14450.80 8058.51 22509.31 2332.22 24841.53
9 Himachal Pradesh 414.51 365.90 780.41 402.00 1184.70 0.00 1184.70
10 Jammu & Kashmir 1881.07 1009.29 2890.36 1863.29 4753.74 777.61 5531.35
11 Jharkhand 0.00 0.00 0.00 0.00 0.00 0.00 0.00
12 Karnataka 11031.25 7278.81 18310.06 13141.43 31450.96 5771.29 37222.25
13 Kerala 6475.12 3047.71 9522.83 467.40 9990.23 0.00 9990.23
14 Madhya Pradesh 8259.41 558.71 8818.12 2148.67 10966.79 490.07 11456.86
15 Maharashtra 21443.63 3883.91 25327.54 545.94 25873.48 622.27 26495.75
16 Manipur 813.03 460.38 1273.41 791.75 2065.16 184.07 2249.23
17 Meghalaya 55.89 18.40 74.29 43.73 118.02 0.00 118.02
18 Mizoram 0.00 11.88 11.88 61.07 72.95 6.43 79.38
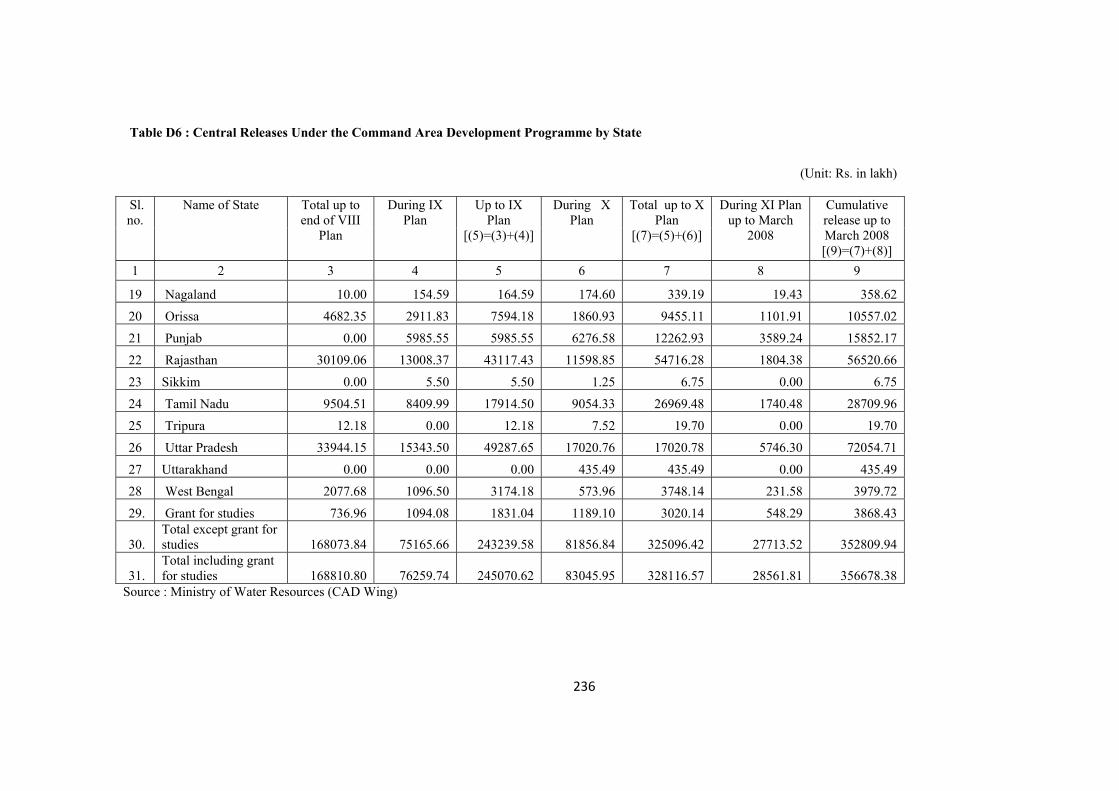
236
Table D6 : Central Releases Under the Command Area Development Programme by State
(Unit: Rs. in lakh)
Sl. no.
Name of State Total up to end of VIII
Plan
During IX Plan
Up to IX Plan
[(5)=(3)+(4)]
During X Plan
Total up to X Plan
[(7)=(5)+(6)]
During XI Plan up to March
2008
Cumulative release up to March 2008 [(9)=(7)+(8)]
1 2 3 4 5 6 7 8 9
19 Nagaland 10.00 154.59 164.59 174.60 339.19 19.43 358.62
20 Orissa 4682.35 2911.83 7594.18 1860.93 9455.11 1101.91 10557.02
21 Punjab 0.00 5985.55 5985.55 6276.58 12262.93 3589.24 15852.17
22 Rajasthan 30109.06 13008.37 43117.43 11598.85 54716.28 1804.38 56520.66
23 Sikkim 0.00 5.50 5.50 1.25 6.75 0.00 6.75
24 Tamil Nadu 9504.51 8409.99 17914.50 9054.33 26969.48 1740.48 28709.96
25 Tripura 12.18 0.00 12.18 7.52 19.70 0.00 19.70
26 Uttar Pradesh 33944.15 15343.50 49287.65 17020.76 17020.78 5746.30 72054.71
27 Uttarakhand 0.00 0.00 0.00 435.49 435.49 0.00 435.49
28 West Bengal 2077.68 1096.50 3174.18 573.96 3748.14 231.58 3979.72
29. Grant for studies 736.96 1094.08 1831.04 1189.10 3020.14 548.29 3868.43
30. Total except grant for studies 168073.84 75165.66 243239.58 81856.84 325096.42 27713.52 352809.94
31. Total including grant for studies 168810.80 76259.74 245070.62 83045.95 328116.57 28561.81 356678.38
Source : Ministry of Water Resources (CAD Wing)

237
Table D7 : Number of Water Users’ Associations (WUAs) Formed and Area covered by State
Sl. No.
Name of State Number of WUAs formed
Area covered (‘000 ha)
1 2 3 4 1 Andhra Pradesh 10800 4169.00 2 Arunachal Pradesh 39 9.02 3 Assam 720 47.04 4 Bihar 46 147.76 5 Chhattisgarh 1324 1244.56 6 Goa 57 7.01 7 Gujarat 576 96.68 8 Haryana 2800 200.00 9 Himachal Pradesh 876 35.00
10 J&K 1* 1.00* 11 Jharkhand NA NA 12 Karnataka 2524 1559.68 13 Kerala 4126 255.27 14 Madhya Pradesh 1687 1691.88 15 Maharashtra 1539 667.00 16 Manipur 73 49.27 17 Meghalaya 123 16.45 18 Mizoram NA NA 19 Nagaland 23 3.15 20 Orissa 16196 1537.00 21 Punjab 957 116.95 22 Rajasthan 506 619.65 23 Sikkim NA NA 24 Tamil Nadu 1566 787.96 25 Tripura NA NA 26 Uttar Pradesh 279 121.21 27 Uttaranchal NA NA 28 West Bengal 10000** 37.00**
Total 56830 13420.34 Source : Ministry of Water Resources (CAD Wing) * Under verification ** Under MI, RIDF Scheme +Updated

238
Table D8 : Water Rates for Flow Irrigation by State
Sl. no.
States/UT For Irrigation Purposes (Flow Irrigation) Status as on Rate (Rs/ha) Date since applicable
1 2 3 4 5 1 Andhra Pradesh 148.20 to 1235.00 1.7.1996 23.4.03 2 Arunachal Pradesh No water rates 25.2.02 3 Assam 150.00 to 751.00 30.3.2000 09.5.01 4 Bihar 74.10 to 370.50 Nov. 1995/2001 28.02.03 5 Chhattisgarh 123.50 to 741.00 15.6.1999 Feb. 04 6 Delhi 22.23 to 711.36 1951/1979 Nov.03 7 Goa 60.00 to 300.00 2.1.1998 24.3.06 8 Gujarat 70.00 to 2750.00* 16.2.2001 1.3.06 9 Haryana 86.45 to 197.60 27.7.2000 29.11.05
10 Himachal Pradesh 21.23 1.6.2006 1.10.05 11 Jammu & Kashmir 49.42 to 247.10 1.4.2005 3.7.07 12 Jharkhand 74.10 to 370.50 26.11.2001 25.11.03 13 Karnataka 37.05 to 988.45 13.7.2000 24.10.05 14 Kerala 37.00 to 99.00 18.9.1974 18.3.06 15 Madhya Pradesh 50.00 to 960.00 1.11.2005 1.11.05 16 Maharashtra 238.00 to 6297.00 ** 1.7.2003 25.10.05 17 Manipur 45.00 to 150.00 8.3.2007 8.3.07 18 Meghalaya No water rates (Rs.100 proposed to be fixed) - 28.2.06 19 Mizoram No water rates - 4.8.03 20 Nagaland No water rates - 12.4.06 21 Orissa 28.00 to 930.00 5.4.2002 1.3.06 22 Punjab Abolished 14.2.1977 27.8.02 23 Rajasthan 29.64 to 607.62 24.5.1999 24.10.05 24 Sikkim 10.00 to 250.00 @@ 2002 10.3.06 25 Tamil Nadu 2.77 to 61.78 1.7.1962 4.3.02 26 Tripura 312.50 N.A. 26.10.05 27 Uttaranchal 60.00 to 948.00 18.9.1995 8.12.03 28 Uttar Pradesh 30.00 to 474.00 18.9.1995 Apr.02 29 West Bengal 37.05 to 123.50 6.4.1997 16.5.03 30 A & N Islands No water rates - 6.2.04 31 Chandigarh No water rates - 12.6.01 32 Dadra & Nagar Haveli 110.00 to 830.00 29.1.1996 31.8.05 33 Daman & Diu 200.00 1980 3.1.02 34 Lakshadweep No water rates - 8.3.06 35 Pondicherry 12.50 to 37.50 31.3.1979 2.8.79 Source: Combined Finance and Revenue Accounts of Union & State Government, State Finance accounts, Central Water Commission, ISO, (Financial Performance Unit). Remarks : * subject to increase @ 15% to 25% per annum ** subject to increase @ 15% per annum The previous increase Rs.180 - 4763 w.e.f. 1.9.2001 $ : These rates escalate by 10% on the first of April every year The previous rates were Rs.6.87 to Rs.76.03/ha w.e.f. 1977/1981 $$: Proposed to be revised as Rs.250-550/ha @ : The previous rates were Rs.123.50 to Rs.741.00 w.e.f. 15.6.1999 @@: Rates as per the Sikkim Irrigation water Tax Act 2002 which still in the process in the inforcement. There were no
water rates prior to the act.

239
Table D9 : Water rates for lift irrigation by State
Sl. No.
States/UTs FOR IRRIGATION PURPOSES Status as on Lift Irrigation
Rate (Rs/ha) Date since application
1 2 3 4 5 1 Andhra Pradesh # 23.4.032 Arunachal Pradesh No water rates specified for irrigation 27.10.053 Assam 150.00 to 751.00 30.3.2000 20.4.20004 Bihar # 28.02.035 Chhattisgarh # 25.8.056 Delhi 33.35 to 1067.04 1951/1979 Nov.037 Goa 120.00 to 600.00 1.2.1988 24.3.068 Gujarat 23.33 to 1375.00* 16.2.2001 1.3.069 Haryana 43.23 to 98.80 27.7.2000 29.11.05
10 Himachal Pradesh 42.34$ 1.6.2006$ 1.10.0511 Jammu & Kashmir 49.40 to 716.30 1.4.2000 28.7.0112 Jharkhand # 25.11.0313 Karnataka # 24.10.0514 Kerala 37.00 to 99.00$$ 18.9.1974 18.3.0615 Madhya Pradesh 50.00 to 960.00@ 1.11.2005 1.11.0516 Maharashtra 20.00 to 610.00 ** 1.7.2003 25.10.0517 Manipur 45.00 to 150.00 Marh 2007 Marh 18 Meghalaya No water rates (Rs.100/- proposed tro be 28.2.0619 Mizoram No water rates 4.8.0320 Nagaland No water rates 12.4.0621 Orissa 129.21 to 4990.63 July 1997 27.4.9822 Punjab Abolished 14.2.1997 22.8.0223 Rajasthan 74.10 to 1215.24 24.5.1999 24.10.0524 Sikkim 10.00 to 250.00 @@ 2002 10.3.0625 Tamil Nadu # 4.3.0226 Tripura 312.50 Yet to start 26.10.0527 Uttaranchal 30.00 to 474.00 18.9.1995 8.12.0328 Uttar Pradesh 15.00 to 237.00 18.9.1995 Apr.0229 West Bengal # 16.5.0330 A & N Islands No water rates - 6.2.0431 Chandigarh No water rates 12.6.0132 Dadra & Nagar 75.00 to 275.00 *** 31.8.0533 Daman & Diu 200.00 1980 3.1.0234 Lakshadweep No water rates 8.3.0635 Pondicherry 10.00 to 30.00 31.3.1979 2.8.79
Remarks : * subject to increase @ 15% to 25% per annum ** subject to increase @ 15% per annum The previous rates were Rs.20 - Rs.495 w.e.f. 1.9.2001 $ : These rates shall escalated by 10% on the first of April every year. The previous rates were Rs.13.96 to 82.15/ha w.e.f. 1977/1981 $$ : Proposed to be revised as Rs.250 - Rs.550/ha. @ : The privious rates were Rs.123.50 to Rs.741.00 w.e.f. 15.6.1999 @@ : The rates as per the Sikkim irrigation water tax Act 2002 which is still in the process of
enforcement. There were no water rates prior to this Act. # : No separate rate for lift irrigation has been reported. *** Depending upon the type of Minor Irrigation schemes, the date of enforcement varied from
1.12.1970 to 13.11.1973