
His Highness Sheikh Tamim Bin Hamad Al-Thani Amir of the ...
85
-
Upload
khangminh22 -
Category
Documents
-
view
2 -
download
0
Transcript of His Highness Sheikh Tamim Bin Hamad Al-Thani Amir of the ...


His Highness Sheikh Tamim Bin Hamad Al-Thani Amir of the State of Qatar

QNB Annual Report 2021 — 3
Financial statements
SustainabilityC
orporate governanceR
iskO
perational performance
Strategic reportG
roup overview
2 — QNB Annual Report 2021
Group overview4 Board of Directors6 Chairman of the
Board of Directors’ statement8 Group Chief Executive
Officer’s statement10 QNB at a glance 12 Our heritage
Strategic report16 Operating environment 18 QNB Group strategy20 Future-proofing our business
Operational performance24 Wholesale and Commercial
Banking32 Retail Banking 38 Asset and Wealth Management 42 International Business
Risk 46 Risk management 48 Strategic risk50 Credit risk 52 Operational risk 54 Cybersecurity
Corporate governance 58 Corporate governance 68 Management assessment of internal
control over financial reporting70 Independent reasonable
assurance report72 Group Compliance76 Group Internal Audit
Sustainability 82 Sustainability 92 Beyond banking – Corporate
social responsibility
Financial statements98 Financial statements
Established in 1964 as the first Qatari-owned bank, we are the largest financial institution in MEA and one of the leading banks in MEASEA. We are a trusted financial partner to a growing number of customers in more than 31 countries across three continents.By leveraging the strength of our relationships and the diversity of our footprint, we fuel growth across multiple, strategically-selected regions, creating long-term sustainable value for individuals, institutions, countries, communities and our shareholders.
Who we are
Contents
Our purposePromoting prosperity and sustainable growth across the markets we serve.
Our visionTo be one of the leading Middle East, Africa and Southeast Asia (MEASEA) banks while maintaining our number one position in the Middle East and Africa (MEA).
Our values> Operational excellence> Integrity> Transparency> Social responsibility
> Performance-driven> Continuous improvement> Career development> Teamwork
Our financial strength
Assets
QR1,093 bn
+7%
Net profit
QR13.2 bn
+10%
Earnings per share
QR1.32
+11%
Operating income
QR28.3 bn
+11%
Cost-to-income
22.2%
Capital adequacy ratio (Basel III)
19.3 %

4 — QNB Annual Report 2021 QNB Annual Report 2021 — 5
Financial statements
SustainabilityC
orporate governanceR
iskO
perational performance
Strategic reportG
roup overview
Board of Directors
4 — QNB Annual Report 2021
H.E. Sheikh Fahad Bin Faisal Bin Thani Al-Thani
> Vice Chairman of the Board of Directors since 2019
> Chairman of the Group Board Audit and Compliance Committee
> BOD member since 2019
H.E. Sheikh Abdulrahman Bin Saud Bin Fahad Al-Thani
> Member of the Group Board Nomination, Remuneration, Governance and Policies Committee
> BOD member since 2016
Mr. Adil Hassan H A Al-Jufairi
> Member of the Group Board Audit and Compliance Committee
> BOD member since 2019
Mr. Abdulrahman Mohammed Y Jolo
> Member of the Group Board Audit and Compliance Committee
> BOD member since 2019
Mr. Mansoor Ebrahim Al-Mahmoud
> Chairman of the Group Board Risk Committee
> BOD member since 2004
Mr. Fahad Mohammed Fahad Buzwair
> Chairman of the Group Board Nomination, Remuneration, Governance and Policies Committee
> BOD member since 2001
Mr. Bader Abdulla Darwish Fakhroo
> Member of the Group Board Risk Committee
> Member of the Group Board Executive Committee
> BOD member since 2001
Mr. Ali Hussain Ali Al-Sada
> Member of the Group Board Risk Committee
> Member of the Group Board Executive Committee
> BOD member since 1998
H.E. Sheikh Hamad Bin Jabor Bin Jassim Al-Thani
> Chairman of the Group Board Executive Committee
> Member of the Group Board Nomination, Remuneration, Governance and Policies Committee
> BOD member since 2004
H.E. Mr. Ali Ahmed Al-Kuwari
> Chairman of the Board of Directors >BOD member since 2021

6 — QNB Annual Report 2021 QNB Annual Report 2021 — 7
Financial statements
SustainabilityC
orporate governanceR
iskO
perational performance
Strategic reportG
roup overview
Our purpose helps us to determine our aspiration and strategy to ensure QNB Group is well-positioned to drive growth in the new normal.
Chairman of the Board of Directors’ statement
This new normal also led us to revisit and review our corporate strategy. We developed a new five-year plan which again affirms our aspiration to be a leading Middle East, Africa and Southeast Asia (MEASEA) bank while maintaining our number one ranking in the Middle East and Africa (MEA). Being ambitious but realistic, we aim to further foster our core value proposition as an international wholesale bank while leveraging innovation as a strategic enabler. We expect this will allow us to continue to create long-term profitable growth and deliver sustainable value by capitalising on incremental revenue opportunities, improving our efficiency, developing new and nurturing existing relationships while enhancing our offering and services. Our 2025 strategy has been fully embedded into our existing risk appetite and risk management framework.
The success of our strategy will also depend on us as a Board of Directors to oversee its effective implementation. Our robust governance framework will enable us to not only oversee but also ensure that the necessary mechanisms and controls are in place to monitor and track its progress. Furthermore, our governance framework serves us to safeguard our business and its practices. It also ensures that we are compliant with the growing complexity of regulatory requirements across all
jurisdictions. Besides controls, the role of a Board is also to instil the appropriate culture, values and behaviours throughout the organization to support our purpose and aspiration. With the experience of our Board of Directors, combined with the expertise of our executive leadership and employees, we aim to foster a culture of transparency, accountability, and collaboration.
As the Board of Directors, we continuously assess emerging and strategic trends in the banking sector to understand the implications for our existing value proposition, business and operating model. Following the pandemic, we this year saw a further evolution in customer behaviour, acceleration of digitisation, increase of cyber threats, as well as growing importance of making a positive contribution and impact to topics of social and environmental concern. As a leading financial institution, we consider those areas a priority for investment in our capabilities to help us future proof our business.
I want to thank our customers, our partners, and our shareholders for their continued commitment. Together with the tireless dedication of our employees at every level of the bank, their support has been instrumental in our success this year.
On behalf of the Board of Directors, I express our deep gratitude to His Highness the Amir, Sheikh Tamim Bin Hamad Al-Thani, for the support and guidance he provides on an ongoing basis.
The Board also expresses its appreciation for His Excellency Sheikh Khalid Bin Khalifa Bin Abdulaziz Al-Thani, the Prime Minister and Minister of the Interior, for his constant support.
Following a year that had disrupted the globe in an unprecedented manner, 2021 was a period of recovery from the COVID-19 pandemic with a shift to positive sentiment and momentum. Nevertheless, short to medium-term downside risks remain. The year started with the launch of mass vaccination campaigns that allowed restrictions to be eased. This, along with strong policy support, led to a macro-economic rebound and growth, with the recovery of global GDP by 5.9%.
In 2021, QNB Group demonstrated strong financial growth in this environment. We delivered a robust net profit of QR13.2 billion, an increase of 10% and an operating income of QR28.3 billion, an increase of 11%. As a result, QNB has remained one of the world’s top 50 banks in terms of market capitalisation, reaching QR186.5 billion.
In recognition of this, the Board of Directors is recommending to the General Assembly the distribution of a cash dividend at the ratio of 55% of the nominal value of the share, equating to QR0.55 per share.
COVID-19 changed our existing way of life, both in our individual and corporate environment. It challenged the way we act, interact, organize, operate and think. As times passes, it will become clearer which of these changes were temporary or permanent. We believe that “The more profound the change, the more likely it will persist”. As such, we also believe that these changes are shaping the new normal across our economic and social landscape.
I am proud that QNB Group has been able to overcome the challenges the pandemic brought and we will need to adopt the new normal throughout our institution. Coupled with the breadth of our banking experience, this allows us to maintain and continue the long-standing commitment to our stakeholders with the purpose of promoting prosperity and sustainable growth across the markets we serve.
H.E. Mr. Ali Ahmed Al-KuwariChairman of the Board of Directors
We developed a new five-year plan which again affirms our aspiration to be a leading MEASEA bank while maintaining our number one ranking in MEA.
QR1.32Earnings per share
16.4%Return on equity
“We delivered a robust net profit of QR13.2 billion, an increase of 10% and an operating income of QR28.3 billion, an increase of 11%. As a result, QNB has remained one of the world’s top 50 banks in terms of market capitalisation, reaching QR186.5 billion.”
“Our 2025 strategy has been fully embedded into our existing risk appetite and risk management framework.”

8 — QNB Annual Report 2021 QNB Annual Report 2021 — 9
Financial statements
SustainabilityC
orporate governanceR
iskO
perational performance
Strategic reportG
roup overview
Group Chief Executive Officer’s statement
The excellence of our service, quality of our people and strength of our performance underpin QNB Group’s leadership position.
QR1,093 bnAssets +7%
QR785.5 bnDeposits +6%
QR763.7 bnLoans +6%
22.2%Cost-to-income ratio
19.3%Capital adequacy ratio
dynamic, nimble and flexible, and thus realise the need to adopt new behaviours. By leveraging developments in areas such as open banking, Robotics Process Automation (RPA), big data and analytics, Artificial Intelligence (AI) as well as digitisation and automation, our innovation strategy will benefit the Bank and all our stakeholders.
Importantly, our sustainability programme forms an integral part of our strategy and aligns with Qatar National Vision 2030 and the UN Sustainable Development Goals. We are part of the United Nations Global Compact (UNGC), the world’s largest corporate sustainability initiative, and a constituent member of the FTSE4Good Index Series.
Our sustainability strategy has been developed in line with these international and national commitments, and we use the leading global reporting frameworks to assess and disclose our performance. Thanks to these efforts, we were the first bank in the region to achieve an MSCI ESG AA rating, and this year picked up two awards for sustainable financing and outstanding leadership in green bonds.
Delivering strong results domestically and internationallyThe start of the post-pandemic recovery and the resilience of our business drove our strong performance in 2021. Our full-year results showed total assets reached QR1,093 billion, an increase of 7% from 2020 and comfortably above the trillion-riyal watermark that we reached last year. Net profit was QR13.2 billion, up 10% compared to the same period last year. Meanwhile, the Bank’s overall profitability was lifted by an increase of 11% in operating income, to QR28.3 billion.
These results are a testament to our strong governance framework, prudent risk management, stringent operating model and disciplined execution.
We benefit from a robust balance sheet, significant capital strength, and high-quality assets. At QNB, we always maintain a very healthy liquidity buffer in all markets where we operate, in local and major foreign currencies.
We have successfully issued bonds in several major financial centres throughout the year, leveraging our existing relationships and accessing new sources of funding. We attracted a broad international investor base, with funding raised in multiple currencies across the full tenor range. These actions, together with our strong deposit gathering capabilities, supported our liquidity position, resulting in a loans-to-deposits ratio of 97.2%.
We also ensured that we continue to be well capitalised, with a capital adequacy ratio of 19.3%. Our relentless focus on cost management and generating synergies from our network have also allowed us to improve our efficiency ratio to 22.2%. This leads to top tier ratings from the world’s leading rating agencies.
Fostering a robust performanceQatar acted decisively to engage in a rapid vaccination campaign using the world’s most effective vaccines, allowing the country to face the previous and emerging variants with minimal impact. Combined with continued government stimulus measures, this has supported the private sector through the worst of the pandemic and has enabled a rapid recovery.
We benefit from Qatar’s continuing growth as a global hub for trade, tourism and sport with our leading domestic presence. Throughout this challenging year, we were able to help hundreds of Qatari companies to overcome the financial and logistical challenges created by the COVID-19 pandemic. Our primary sector focus was on the utilities, transport and food security sectors as well as 2022 FIFA
World Cup™ and North Field Expansion infrastructure projects.
Our retail business produced strong performance with growth in new accounts, loans and deposits, underpinned by a holistic suite of products and services as well as unrivalled customer experience. Our retail value proposition was further supported by cutting-edge digital technology and innovation delivered with a human touch. We enhanced our product line-up and infrastructure to serve our customers seamlessly and maintain the highest levels of satisfaction. For example, we were the first bank in Qatar to introduce Apple Pay, Garmin Pay, and Fitbit Pay.
This year we expanded our international presence by opening our branch in Hong Kong, one of the major global financial centres. This allows us to capitalize on Hong Kong as a financial gateway to China for trade and investment flows. Furthermore, we re-launched our operations in Saudi Arabia. In 2021, the profit contribution of our international operations was 21.5%.
Our unwavering effort to add ever more value to our customers is also reflected in our strong brand performance. This year, we became one of the top 50 most valuable banking brands globally with a total brand value of USD6.1 billion. This comfortably maintains us as the most valuable banking brand in the MEA region.
Maintaining a robust risk and control environmentMaintaining a strong risk management and compliance culture remains a priority for QNB Group. This year we continued to invest on governance standards, frameworks and tools to enhance our risk management. These range from an increase in the number and proficiency of credit risk staff, to improved risk modelling, to improvements on how we capture operational risk data and new enhancements in cybersecurity. Together with our prudent risk management approach, these investments and enhanced capabilities have allowed us to maintain a high asset quality, even with the ongoing effects of the pandemic, which in turn enabled us to maintain top-tier credit ratings from international rating agencies.
This year, we merged the Group Risk and Group Credit divisions into one unit. This move will allow us to better integrate the different risk functions and improve the cohesiveness of our risk governance.
With regard to financial conduct, we have zero tolerance for breaches of laws and regulations and consistently strive for the highest levels of ethical and professional behaviour. A central part of our mission is to effectively combat financial crime and prevent the use of our infrastructure for fraudulent activity.
Continuing our journeyOf course, the success of our business today – and tomorrow – lies with our people. At every level, I want to thank all of our employees for their relentless commitment and exemplary service they deliver every day.
My gratitude also goes to our customers and stakeholders whose loyalty and trust have been so important on our ongoing journey. I also express my gratitude for the foresightful guidance from Qatar Central Bank. We look forward to continuing and further fostering this mutually beneficial relationship in the future.
Finally, I would like to thank the Chairman and the Board of Directors for their continued guidance and support. As a result, I truly believe that QNB is well-positioned to succeed in the new normal while fulfilling our purpose of promoting prosperity and sustainable growth across the markets we serve.
As we publish this year’s annual report, the world is continuing its transition to a new normal from the depth of the COVID-19 pandemic. With effective vaccines against COVID-19 and mass inoculation campaigns across continents, authorities from major economies allowed greater mobility leading to higher levels of economic activity than last year. Moreover, unprecedented monetary and fiscal support measures continued into 2021 and protected the global economy from the adverse impact of the pandemic. This supported improvements in market sentiment, investor optimism and consumer demand. Despite short to medium-term downside risks, economic recovery is under way as the world is learning to manage health challenges while minimising the impact on the economy and society.
Driving growth in the new normalToday’s social and economic environment has been transformed by the pandemic, setting the foundations for the new normal. This has changed the way we do business and operate, creating new challenges as well as offering new opportunities for the Bank and our customers.
In line with our ambition to capitalize on the opportunities of the new normal, and inspired by our purpose of promoting prosperity and sustainable growth, we have revised our strategy and developed a new five-year plan. The new plan aims to boost our bank-wide capabilities while upgrading our corporate banking services across our entire international footprint. Simultaneously, it recalibrates our business model for a transition towards a more fee-rich approach with higher-margin businesses contribution. QNB is well-placed to drive growth in this new landscape, capitalising on our considerable strengths and experience.
In order to achieve this ambition, we will rely on our core capabilities to develop strategic initiatives that seek to enhance our value proposition as a solution-led wholesale bank, which places greater emphasis in offering solutions to our clients. With this in mind, we propose to enrich our strategy by deploying innovation in order to identify new business opportunities and cost efficiency measures. We believe that being innovative requires us to be more agile,
Mr. Abdulla Mubarak Al-KhalifaGroup Chief Executive Officer
“The start of the post-pandemic recovery and the resilience of our business drove our strong performance in 2021.”

10 — QNB Annual Report 2021 QNB Annual Report 2021 — 11
QNB is a highly-rated bank with a significant international presence, serving more than 26 million customers across our network. We are proud of our Qatari heritage and of the continuing contribution we make to the region and beyond.
QNB at a glance
Our businesses
Wholesale and Commercial Banking
A comprehensive suite of wholesale, commercial and Small and Medium Enterprise (SME) banking products and services. These include structured finance, project finance, transaction banking, financial institutions, treasury, investment banking and advisory services.
Retail Banking
A broad array of retail banking products and services across a multichannel network with more than 1,063 branches and an ATM network of more than 4,642 machines*. These include premium banking services through QNB First and QNB First Plus, designed for our affluent clients.
*Including subsidiaries and associates
Asset and Wealth Management
A broad collection of onshore and offshore private banking and asset management products, with a bespoke relationship-driven approach for our institutional, high net and ultra-high net worth clients. These offerings are complemented by brokerage and custody services in our major markets.
International Business
Leading the expansion of QNB’s international presence and enabling cooperation, consistency and unrivalled customer service by providing oversight and best practice sharing across our network.
Financial statements
SustainabilityC
orporate governanceR
iskO
perational performance
Strategic reportG
roup overview
Our top-tier credit ratings
Moody’s Standard & Poor’s Fitch Capital Intelligence
Long term Aa3 A A+ AA-
Name % stake
QNB Finansbank (Turkey) 99.88%
QNB ALAHLI (Egypt) 95.00%
QNB Indonesia 92.5%
QNB Tunisia 99.99%
QNB Syria 50.8%
QNB Suisse (Switzerland) 100%
QNB Capital LLC (Qatar) 100%
QNB Financial Services (Qatar) 100%
Name % stake
Mansour Bank (Iraq) 54.2%
Commercial Bank International (CBI) (UAE)
40%
Housing Bank for Trade and Finance (HBTF) (Jordan)
38.6%
Ecobank Transnational Incorporated (Ecobank) (Togo)
20.1%
Al Jazeera Finance Company (Qatar) 20%
Our subsidiaries and associates

12 — QNB Annual Report 2021 QNB Annual Report 2021 — 13
Financial statements
SustainabilityC
orporate governanceR
iskO
perational performance
Strategic reportG
roup overview
Established in 1964 as the first Qatari-owned bank, QNB is strongly influenced by our Qatari heritage. Looking back at our achievements inspires us to continue to play a leading role in contributing to our nation’s future. We firmly believe in supporting and investing in the Qatari people so we can all move forward with confidence and determination.
Our heritage
“As the largest bank in MEA and one of the leading banks in MEASEA, we are a trusted financial partner to millions of customers in more than 31 countries across three continents.”
1964 First Qatari-owned bank established
1997 Public listing on Qatar Stock Exchange
1973 Introduction of the Qatari Riyal
1976 QNB opens its first overseas branch with the opening of a branch in London
2013 Acquisition of NSGB in Egypt
2015 Largest bank in the MEA region across all financial metrics
2016 Acquisition of Finansbank in Turkey
2021QNB opens branch in Hong Kong
2007 Began a ten-year expansion phase with the opening of branches and offices in 15 countries and eight acquisitions
QNB Kuwait QNB Switzerland
QNB Indonesia

Financial statements
SustainabilityC
orporate governanceR
iskO
perational performance
Strategic reportG
roup overview
14 — QNB Annual Report 2021 QNB Annual Report 2021 — 15
Strategic report

16 — QNB Annual Report 2021 QNB Annual Report 2021 — 17
Financial statements
SustainabilityC
orporate governanceR
iskO
perational performance
Strategic reportG
roup overview
Following the once-in-a-century pandemic in 2020, the world economy began its recovery with sentiment, investment and consumption improving.
Operating environment
Global economic developments This year started with optimism triggered by the rapid development of effective vaccines for COVID-19. Vaccine production ramped up during the first half of 2021 and many countries have now vaccinated the majority of their population against COVID-19.
Unfortunately, the virus is constantly mutating, which resulted in the emergence of the Delta and Omicron variants. These variants were much more infectious than previous strains and quickly spread around the world, resulting in new waves of the pandemic. Fortunately, vaccines remain highly effective against different strains, which has helped to significantly reduce the proportion of COVID-19 infections that result in severe cases requiring hospitalisation.
Governments in Europe, North America and the GCC have therefore been able to allow greater levels of mobility and economic activity than last year without overwhelming their health systems. As lockdown restrictions eased and consumer demand recovered, economic activity in the services sector began to pick up. Asian economies, however, faced headwinds from the Delta variant due to relatively slow progress with vaccination campaigns.
Particularly rapid recoveries in China and the US peaked during 2021, as the impact of exceptionally strong stimulus faded. Recovery in Europe gained traction in 2021, as EU-level stimulus funds began to flow and vaccination campaigns progressed further. Commodity markets continued to recover during the year as rising economic activity fuelled strong demand growth. Consequently, oil prices rose, additionally supported by OPEC+ continuing to constrain oil supply.
This supported improvements in market sentiment, investor optimism and consumer demand. Despite short to medium-term downside risks, economic recovery is under way as the world is learning to manage health challenges while minimising the impact on the economy and society. Unprecedented monetary and fiscal support measures continued into 2021 and protected the global economy from the pandemic. These tailwinds allowed global GDP to grow by 5.9% in 2021 relative to 2020.
Global and regional economic outlook We expect further vaccine development and booster shots, where necessary. However, the global economy is not yet “out of the woods”, with a number of risks threatening growth. Although unlikely to get out of control, high inflation will act as a catalyst for a gradual withdrawal of exceptional policy support on the fiscal and monetary front.
Despite short to medium-term downside risks, we expect global GDP to grow by 4.9% in 2022. Importantly, however, the recovery is expected to be somewhat uneven, with performance varying markedly by country depending on the progress of vaccination programmes, re-opening of economies and the pace of withdrawals of policy stimulus.
The US is a major pillar of the global economy and has been leading the recovery process. US authorities quickly launched a “whatever it takes” response to the pandemic, with unprecedented fiscal and monetary stimulus. This response was so strong that it even pushed the level of GDP above its pre-crisis growth path. However, the strength of the recovery has prompted the government to allow for the stimulus to fade. Therefore, the US recovery has peaked at 6.0% in 2021, and we expect moderation to 5.2% in 2022 in light of further COVID-19 related challenges.
The recovery in the Euro area has been comparatively slow and steady. Vaccination campaigns were slow to begin with, but gained traction over time with the relaxation of restrictions prior to the summer vacations. Fiscal support from EU-wide funds started to materialise in H2 2021 and is expected to support the recovery going forward. We expect the Euro area to grow by 4.3% in 2022, from 5.0% in 2021, despite COVID-19 related challenges.
Emerging Asia is facing headwinds from the pandemic, with GDP growth expected at 7.2% in 2021, from -0.9% in 2020. The first region affected by the pandemic, Emerging Asia was also the most effective at containing the virus in 2020, leading to more limited or shorter lockdowns and an earlier normalisation. Unfortunately, this was not repeated in 2021. More infectious variants combined with delayed vaccination campaigns forced many Asian countries to re-introduce restrictions to manage the pandemic. The Chinese economic recovery is fading as tried and tested stimulus of construction and infrastructure is withdrawn. The authorities’ current focus is on rebalancing the economy towards domestic consumption. China’s GDP is set to grow moderately by 5.6% in 2022, after an exceptional growth in 2021 of 8.0%. As a consequence, China will act as an additional headwind to the otherwise fast-growing economies of the Association of Southeast Asian Nations (ASEAN). The ASEAN-5 economies (Indonesia, Malaysia, the Philippines, Singapore, and Thailand) are expected to grow by 5.8% in 2022, from 2.9% this year, as they are learning to manage pandemic-related challenges while minimising economic impact.
“Unprecedented monetary and fiscal support measures continued into 2021 and protected the global economy from the pandemic.”
In the Middle East and North Africa (MENA), economic dynamics must be differentiated between net oil importing countries and net oil exporting countries.
Oil importing countries were mainly affected by the increase in oil and other prices of imported goods. A gradual re-opening of the global economy, official international financial support and appropriate policy responses are expected to drive a recovery in 2022, with GDP growth expected at 3.8%, from 3.5% in 2021.
The oil exporting countries of the Gulf have benefited from both the recovery in oil prices and rapid vaccination campaigns. This has allowed them to gradually unwind oil production cuts and re-open their economies to international tourism, respectively. Moreover, current and fiscal accounts have returned to more comfortable levels, contributing to a smooth transition towards a full-fledged recovery. With sustained oil prices and high levels of vaccination across the GCC, business conditions and prospects for 2022 remain positive, despite the emergence of new variants. A 4.2% GDP growth is expected for the Gulf economies in 2022, from 2.5% this year.
Economic prospects for Qatar Qatar acted decisively to engage in a rapid vaccination campaign using the world’s most effective vaccines. Indeed, effective vaccination and targeted restrictions have allowed Qatar to face the new variants waves with minimal economic impact. Combined with continued government stimulus measures, this has supported the private sector through the worst of the pandemic and has enabled a rapid recovery.
Qatar has clearly demonstrated its ability to combine a prudent fiscal policy with the effective delivery of an extensive infrastructure and investment programme to support the Qatar National Vision 2030 (QNV 2030) and prepare for the 2022 FIFA World Cup™. This is laying the foundation for continued GDP growth over the medium and long-term through both diversification and stronger private sector growth.
Moving forward, tailwinds from investment in increasing hydrocarbon production is expected to drive economic growth in the medium to long-term. Six new LNG liquefaction trains are planned to increase Qatar’s LNG production by 64% to 126 million tonnes per annum (MTPA) by 2027. Positive spill-overs from increased hydrocarbon production will combine with diversification efforts and structural reforms to boost activity and output in the manufacturing and services sectors.
Banking sector The COVID-19 pandemic added another layer of complexity to the challenges faced by the banking sector globally. Before the pandemic, while banks were generally in good health and well capitalised, returns and profitability were under pressure. This was particularly apparent in advanced economies, where growth has been subdued for years, with low or even negative interest rates. The COVID-19 pandemic has accelerated significant trends that were already taking place, in areas such as credit quality, core profitability, digitisation, cyber security and sustainability.
The imposition of lockdowns and social distancing measures placed significant strain on the balance sheets of corporates and income of households, impacting credit quality. However, government support measures have so far prevented widespread bankruptcies, allowing some provisions built up in 2020 to be released in 2021 and potentially further down the line. In addition, persistently lower interest rates and ample liquidity in key markets are acting as headwinds on the core profitability of banks.
Social distancing measures have forced changes in habits for both retail and corporate customers, accelerating the shift towards digitisation. With the increased use of remote working, electronic products and digital services, cyber and fraud risk became a critical threat for banks to manage. Finally, COVID-19 further accelerated the focus on sustainability, with investors and other stakeholders placing greater emphasis on ESG matters.
In Qatar, the domestic banking system remains resilient with significant growth, ample liquidity, high asset quality, more than adequate capitalisation levels and robust profitability. Total assets of the local banking sector were up by 8.6% in 2021, driven mainly by the government support measures and a pickup in business activity following the pandemic. Banks remain well capitalised with capital adequacy ratio (CAR) of 18.8%, well above Basel III guidelines. Asset quality also remains strong with non-performing loans (NPLs) at 2.0%. Overall sector profitability is solid with returns on equity (ROE) of 13.7%.
“With sustained oil prices and high levels of vaccination across the GCC, business conditions and prospects for 2022 remain positive, despite the emergence of new variants.”
The oil-exporting countries in the Gulf have benefited both from the recovery in oil prices and vaccination campaigns.

18 — QNB Annual Report 2021 QNB Annual Report 2021 — 19
Financial statements
SustainabilityC
orporate governanceR
iskO
perational performance
Strategic reportG
roup overview
At the same time, we acknowledge the importance of sustainability to deliver positive impact along Environmental, Social, and Governance (ESG) related topics. Our sustainability approach consists of three pillars: sustainable finance, sustainable operations and beyond banking. All three pillars support QNB’s goal of sustainable financial performance, by reducing risks, creating new business opportunities, strengthening our brand and improving our performance. Our approach to sustainability is therefore fully integrated into our strategy.
Ensuring our annual plans align with our strategyOur strategic initiatives have implications on the Bank’s business model, value proposition, capabilities (systems, people and processes), operating model and financial roadmap. Each year, the Group’s vision and strategic initiatives are cascaded down across all QNB’s divisions and subsidiaries and embedded in their annual business plans and targets. These targets are continuously tracked through our performance management approach.
Delivering value to our stakeholdersThe ultimate objective of a strategy is to create meaningful long-term value for our shareholders and stakeholders. For our shareholders this means that we need to deliver sustainable profitable growth. For our stakeholders, this means that the value is delivered through long-term, collaborative and trusted partnerships. As such, we see ourselves as a trusted partner for our customers, employees, regulators, investors and suppliers.
Our value creation is substantiated through four fundamental elements that support our strategy and empower our growth:
1. Capital strength, risk management and rating:Our extensive experience in our core markets and prudent attitude to risk allow us to maintain a strong balance sheet. We have the capital and agility to take immediate advantage of any opportunities we see in our markets.
Our position is reinforced by strong ratings from the leading rating agencies, including Standard & Poor’s (A), Moody’s (Aa3), Fitch (A+) and Capital Intelligence (AA-). As the highest-rated bank in Qatar, these ratings reflect the quality of our assets, the diversity of our portfolio, the stability of our revenue and our management’s strength. We see this as a testament to our capital strength, strategy, governance, prudent risk management, business and operating model.
From an ESG perspective, we are the first bank in the region to obtain an AA rating from MSCI. We are thus one of the leading financial institutions in the Middle East for sustainability-related topics.
Our credit and ESG ratings provide us with a competitive advantage to access global capital markets for wholesale funding, enabling us to continue our growth and expansion plans as per our strategy.
2. Our people:Aside from financial capital, we consider human capital as our strongest element for value creation. Our employees and talent base are paramount to our business success. We empower and reward our employees by fostering a high-performance culture, investing in ongoing training and development, and encouraging loyalty and respect. Compared to regional and industry standards, QNB is above or in line with most performance metrics such as collaboration, brand recognition and work-life balance.
Attracting and retaining superior talent in Qatar and across our diverse international network remains essential. We employ 41% women and over 83 different nationalities across our operations in Qatar. Our culture is underpinned by mutual trust, integrity, respect, loyalty, and meritocracy. Thanks to this focus on employee development and engagement, our turnover is one of the lowest in the industry with only 5.8% in 2021.
Our Qatarisation drive, which supports the 2030 Qatar National Vision (QNV 2030), has created a local Qatari workforce of 58.9% – one of the highest in the Qatari domestic banking sector.
3. Brand value:QNB enjoys an award-winning brand platform that reflects our values, commitment and excellence to deliver outstanding banking services to our customers. Thanks to our creative but disciplined approach to continue building our brand image and values, we have again cemented our status as the Middle East and Africa’s most valuable banking brand in The Banker’s Brand Finance® Global 500 2021 report. We are proud to see that over the previous years we were able to record a significant improvement of our brand rankings both globally and within the banking sector.
Our Brand Strength Index (BSI) is 82 out of 100, driven by our strong financial performance and growing international footprint. With this, QNB remains the most valuable banking brand in the Middle East and Africa at USD6.1 billion. Our reputation is further enhanced by the regional and international recognition we receive through a string of industry awards every year.
4. International presence:We are the largest bank in the MEA region, with an international presence in more than 31 countries across Asia, Africa, and Europe. We operate as a full-service financial institution in our core markets of Qatar, Turkey, and Egypt and as a wholesale commercial bank across many frontier and emerging markets in MEASEA.
We also have a growing presence in developed economies, such as the UK, France, Switzerland, Hong Kong and Singapore. As our network grows, so do the number and scale of opportunities to capture relevant market share and risk-adjusted returns.
27,381Employees worldwide
Our purpose to promote prosperity and sustainable growth across the markets we serve guides our aspiration to be one of the leading MEASEA banks while maintaining our number one position in MEA.
QNB Group strategy
We believe that having a purpose justifies our existence and underpins our contribution to society. Our purpose is to promote prosperity and sustainable growth across the markets we serve. This serves as a day-to-day reminder of our business ethics, and is embedded into our vision, strategy, mission, values and behaviours.
This year, we performed a review of our aspiration and strategy to create a new five-year plan that will help us navigate the increasing complexities of a post-pandemic world. Our 2025 vision is to be one of the leading MEASEA banks while maintaining our number one position in MEA.
Defining a new strategyThrough a clearly defined strategy, QNB has remained a successful and growing financial institution. Over the past five years, our strategy has helped us anticipate, plan for and adapt to significant regional and global trends. Over the next five years, we aim to ensure the Bank is well-positioned to reap the rewards from greater efficiency, more customers, outstanding service and future growth opportunities to create sustainable value for all our stakeholders.
This strategy is ambitious but realistic. It will be achieved by boosting our bank-wide capabilities while upgrading our corporate banking services across our entire international footprint. At the same time, we will seek to recalibrate our business model to transition towards a more fee-rich business model with higher-margin businesses.
As such, we rely on our core as a wholesale bank and focus our strategic initiatives on further enhancing our value propositions as a solution-led wholesale bank, complemented by an analytics-enabled global transaction banking proposition. We aim to enrich our strategy by leveraging innovation as a strategic enabler to identify new business opportunities and cost-efficiency measures. We believe that being innovative requires us to be more agile, dynamic, nimble and flexible, thus realising the need to adopt new behaviours. By capitalising on developments in areas such as open banking, Robotics Process Automation (RPA), big data and analytics, Artificial Intelligence (AI) as well as digitisation and automation, our innovation strategy will benefit the Bank and all our stakeholders.
We will develop a solution-led wholesale banking approach, aiming to place a greater focus on offering client-centric solutions rather than taking a product-push approach. This will be supported by a range of enhanced products, upgraded data infrastructure, analytical tools and training. We will also seek to attract hundreds of new clients by expanding our team of experienced relationship managers and product specialists across the business.
By embedding analytics into the fabric of our global transactional banking business, we will ensure that we deliver a seamless transaction banking proposition across our entire global footprint. The move will be supported by an investment in digital channels and processing capabilities. In parallel, we will offer advanced solutions and analytics beyond traditional banking products with the help of strategic partnerships.
“We aim to ensure the bank is well-positioned to reap the rewards from greater efficiency, more customers, outstanding service and future growth opportunities that will create sustainable value for all our stakeholders.”
Our purpose Promoting prosperity and sustainable growth across the markets we serve
Our vision To be one of the leading MEASEA banks while maintaining our number one position in MEA
Our businesses
> Wholesale and Commercial Banking> Asset and Wealth Management> Retail Banking> International Business
Our competitive strengths
> Capital strength, risk management and ratings> Our people> Brand recognition> International presence
Our strategy> Develop a solution-led wholesale banking approach> Deliver a seamless transaction banking proposition across our entire global footprint> Supported by leveraging innovation as a strategic enabler and a Group-wide approach to sustainability
Local Qatari workforce (%)
58.9%
58.8%
54.9%
2021
2020
2019
Brand value (USD Bn)
6.1
6.0
5.0
2021
2020
2019

20 — QNB Annual Report 2021 QNB Annual Report 2021 — 21
Financial statements
SustainabilityC
orporate governanceR
iskO
perational performance
Strategic reportG
roup overview
An unrelenting focus on innovation and emerging technologies ensure we remain the bank of choice – for today and generations to come.
Future-proofing our business
Our ability to drive growth in the new normal is underpinned by our continuing efforts to effectively future-proof our business. Changes in the regulatory landscape, customer behaviours and the entry of new competitors such as Fintech, BigTech and non-bank players are increasingly challenging the ways of operating in the banking sector. We are constantly pushing ourselves to use innovation to find new revenue opportunities, protect our existing businesses, create cost-saving opportunities and adjust our operating models, thus mitigating the effects of technological disruption and financial disintermediation.
With this in mind, we have positioned innovation as a critical strategic enabler to support our long-term strategy. We have identified emerging, long-term trends that we see as opportunities to build into our business model to continue our growth journey. As part of this approach, we use data, advanced analytics, digital technologies, automation and new delivery platforms to strengthen the Bank and generate more opportunities.
Meanwhile, our group-wide innovation centre, QNBeyond, has created momentum across the organisation, promoting innovation and best-practice through a series of successful employee boot camps.
QNBeyond is also responsible for our accelerator programme that has already onboarded more than a dozen Fintechs. Our partnerships with these organisations help us shape a financial ecosystem designed to meet the evolving needs of our customers and the future of banking. This includes incorporating open banking, new platforms, RPA, AI and digitisation and automation into our products and services.
This year, the third period of the QNBeyond Acceleration Programme was completed. During an online ‘Demo Day’
“We have positioned innovation as a critical strategic enabler to support our long-term strategy.”
event, eight participating startups signed nine collaborations with QNB. Additionally, there were five ongoing Proof of Concept (PoC) studies identified, contributing to the positive momentum of our innovation centre.
In Qatar, we continued to work closely with the Qatar Fintech Hub to evaluate new Fintech solutions in the investments, crowdfunding and payments space that best fit the local market and our own aspirations.
At the same time, we are beginning to reap the benefits of the harmonisation of innovation governance of the previous years. Our collective approach to innovation helps us foster collaboration, embeds best-practice and provides additional revenue opportunities and efficiencies at scale across the network. As such, we are constantly evaluating new ideas across our network to identify potential synergies for innovation and new initiatives within relevant markets.
Collaborative Execution Driven Dynamic
New Behaviours
Innovation as the Strategic Enabler
Digital Autom
ation an
d Rob
otics
Platforms, Ecosystems and Open Banking
Core Capabilities Uplift
Analytics enabled Global
Transaction Banking
Solution-led Wholesale
Banking
Other 2025 & Strategic
Projects
Case examples of strategic innovation themes
We continued to scale up our RPA programme on a Group level across QNB Qatar, QNB Finansbank in Turkey and QNB ALAHLI in Egypt. More than 100 processes have been automated within corporate and retail banking, treasury, finance, transaction services, merchant services, operations services, custody, fund administration, global transaction banking, trade finance, risk management, IT and human resources. This year, we have targeted to automate entire domains and functions, resulting in better operational efficiencies and improved economies of scale.
As a result, the programme has brought significant efficiency improvements through the reduction of processing time and elimination of human errors, while at the same time increasing customer satisfaction and reducing complaints. Furthermore, the programme helped free up employees to focus on higher-value work requiring critical thinking and cognitive capabilities.
By developing this programme at a Group level, we unlocked several synergies and materialised them in terms of cost reduction and cross-pollination of best practises.
This year we ran a series of POCs leveraging Big Data, Analytics and AI to develop several models around predictive banking use cases. One of these successful AI-driven POCs helped build a more accurate prediction of withdrawals and deposits across our branch network. Consequently, we are scaling up the model to analyse and forecast cash levels in ATMs and branches, aiming to optimize cash transport, thus lowering idle cash and insurance costs.
We also launched another POC to analyse the transaction network of our corporate customers by mapping the commercial relationships between them and their respective customers, suppliers and partners. This POC helped us better understand our customers and their behaviours, which allowed us to customise our products and services to cater for their needs. In addition, it helped increase customer acquisition and generate new business leads with non-QNB customers.
On a Group level, AI infrastructure and Data Analytics capabilities have been scaled up in Turkey and Egypt to build in-production models around customer segmentation, behavioural scorecards, customer retention, predictive card utilisation, deposit and fund acquisition, money laundering and fraud detection.
Platforms and marketplaces are a key strategic innovation component of our 2025 Group strategy. This year we continued to explore new decentralised global trade finance platforms that leverage blockchain technology. These platforms provide banks, corporates and trade partners a common stage to collaborate digitally end-to-end, transacting in real time to create new opportunities and generate new revenues.
In QNB India, we onboarded RXIL, a distributed platform for Trade Receivables and Discounting. The platform facilitates the financing of trade receivables by giving customers a digitised experience, providing easier access to funds and competitive discount rates. This allows small and medium-sized companies to secure financing on the strength of their buyer’s credit rating without having to negotiate separately with financiers.
In October 2021, QNB launched a new cross-border remittance service developed in partnership with Ripple, an innovative Fintech digital payment network with advanced blockchain technology and built upon a distributed open-source protocol. This cross-border payment platform offers secure, instant and free global financial transactions of any size with no chargebacks. Ripple relies on a common shared ledger, which is a distributed database storing information about all Ripple accounts.
QNB has successfully launched a corridor on Ripple’s global financial network technology, RippleNet, between QNB Qatar and QNB Finansbank. We have plans to expand to other key remittance corridors in the future.
Data AnalyticsAutomation
Trade Finance platforms Cross-border payment platforms
Lear
nin
g Creative
Data &
Analy
tics

Financial statements
SustainabilityC
orporate governanceR
iskO
perational performance
Strategic reportG
roup overview
22 — QNB Annual Report 2021 QNB Annual Report 2021 — 23
Operational performance

24 — QNB Annual Report 2021 QNB Annual Report 2021 — 25
Financial statements
SustainabilityC
orporate governanceR
iskO
perational performance
Strategic reportG
roup overviewinclude an expansion of Qatar’s refining and downstream
capacity, with significant investments in liquefied petroleum gas (LPG) and helium plants, as well as petrochemicals in the form of a new mega ethane cracker.
The size and scale of the undertaking is immense and our corporate banking team has been integral in activities around the project since its inception, supporting international specialist contractors with a wide range of engineering, construction, procurement, and installation projects (EPC). QNB played a major role in assisting both international and local contractors in various financial requirements for the award of several EPC packages.
Much of the materials for the expansion will be sourced directly from local suppliers, and we expect a significant boost for the non-hydrocarbon sector with the creation of jobs in the ancillary sectors due to the inflow of labour required for the undertaking. The North Field Expansion will also require massive investment in vessels and supporting marine works, for which QNB is expecting to play a significant role.
Projects in retail and real estate remained strong, with developments such as the West Bay North Beach, which includes creating new beaches and an entertainment destination. We are also supporting Gewan Island, a residential and commercial development set for completion next year, as well as Mazaya Marina Plaza, another building project that will add retail and entertainment venues.
Transport was another focal point, and we continued to support work on expanding Hamad International Airport in Doha, financing a key package. The project, which will add extra capacity, will be completed in 2022 and enable the five-star airport to deal with the 58 million passengers expected to pass through it next year.
We also continued to work with clients on promoting Qatar as a global sports hub while building on a series of education initiatives and nurturing the growing number of technology industries taking root in the country. The Qatar Cultural and Sports Hub (QCSH) uses its sports accelerator programme to fuel opportunities to help transform the country into one of the world’s premier sports destinations and contribute to Qatar’s diversification. Qatar’s sports sector offers huge opportunities beyond the FIFA World Cup 2022™, as the country will also play host to the 2030 Asian Games.
We played a significant role in supporting the diversification of the economy by continuing to strengthen our sustainability engagements. This reflects our commitment to promoting and financing sustainable practices across the value chain while contributing to society beyond financial products and services. QNB’s green and social loan portfolio eligibility criteria align with 13 of the United Nation’s Sustainable Development Goals (UNSDGs) and reflect our investment in green buildings, renewable energy, clean transportation and pollution prevention.
As a result, QNB Group picked up two awards at the Global Finance’s inaugural 2021 Sustainable Finance Awards, for ‘Outstanding Sustainable Financing in Emerging Markets’ and ‘Outstanding Leadership in Green Bonds’ in the Middle East regional category.
Qatar’s main economic focus will be on the FIFA World Cup 2022™, while the North Field Expansion will remain equally important as the project moves into the next phase.
SMEAs part of the QNV 2030, QNB remains committed to acting as an incubator and nurturing the growing private sector of the country. As such, QNB acts as a one-stop shop for small and medium-sized businesses (SMEs) in the market. SMEs in Qatar make up 98% of all private companies, providing a significant contribution to the economy.
In addition to providing financial services and access to local and international markets, we offer our SME clients a wide range of benefits to help them manage and grow their businesses. We offer a comprehensive range of products as well as services, ranging from market insight and skills training to one-to-one consulting. Furthermore, we work in partnership with our clients, strengthening the success of both start-ups and scale-ups in the sector.
In 2021, despite the lasting economic and social impact of the global COVID-19 pandemic, we successfully grew our client base and balance sheet, while maintaining a healthy and stable asset quality. New account openings in Qatar grew by 7%, with a steady stream of new clients attracted by our reputation for superior services and products, market expertise and unrivalled personal support. Deposits also grew by 17% across the year.
We continued to build on our proactive COVID-19 support programme introduced last year. Working in tandem with the Qatar Development Bank (QDB), we ensured thousands of firms remained open for business with a range of measures to ease the financial pressure on SMEs. These included continued participation in the National Response Guarantee Programme with QDB during the first half of the year, under which the government of Qatar provided a 100% guarantee. The aim was to mitigate COVID-19 impacts by relieving the most critical short-term payments
Awards
Best Domestic Bank in Qatar > Asiamoney Middle East 2021
Outstanding Sustainable Financing in Emerging Markets
> Global Finance 2021 Sustainable Finance
Outstanding Leadership in Green Bonds > Global Finance 2021 Sustainable Finance
Green Market Pioneer in Qatar > Climate Bonds Initiative
Best FX Provider in the Middle East > Global Finance
Best FX Provider in Qatar > Global Finance
Best Transaction Bank in Middle East and Africa > The Asian Banker
Strongest Bank in the Arab World > World Union of Arab Bankers
Domestic corporateThe economy and consumer confidence benefitted from a proactive approach to managing the pandemic in the country. Extensive testing programmes and a rapid vaccination rollout ensured Qatar is well-positioned for a recovery, despite potential short-term disruptions. A key driver in this recovery was the success of last year’s relief programme introduced by the Qatar Central Bank (QCB). Working in tandem with QCB, we were able to help hundreds of Qatari companies to overcome the financial and logistical challenges created by the COVID-19 pandemic. We maintained steady growth in assets and liabilities and ensured our non-performing loan ratio remained low, cementing our market-leading position in Qatar.
The upcoming 2022 FIFA World Cup™ and Qatar Energy’s North Field Expansion remain at the forefront for the State of Qatar.
The 2022 FIFA World Cup™ continued to drive momentum across the year. This event presented several economic opportunities, providing a wide range of significant projects covering the entire supply chain from developers all the way through to contractors and sub-contractors. Other domestic corporate banking activities were particularly strong in the healthcare, infrastructure, hospitality, transport and food security sectors, where our involvement has helped strengthen self-sufficiency and improve international trade and logistics.
The multi-billion-dollar North Field Expansion is another one of the major projects supported by QNB Group. Qatar has one of the largest reserves of natural gas in the world and is the leading exporter of Liquefied Natural Gas (LNG).
Qatar Energy’s North Field Expansion project is set to increase Qatar’s LNG capacity. Six new LNG liquefaction trains are planned to increase Qatar’s LNG production by 64% to 126 million tonnes per annum (MTPA) by 2027. There are two phases in relation to the North Field Expansion – the East (NFE) and South (NFS) Expansion. Qatar is planning to increase production from 77 to 110 MTPA by 2025 during the NFE expansion and then to 126 MTPA by 2027 with the NFS expansion. As well as the design and construction of the LNG mega-trains, other essential projects include 80 wells with eight wellheads, pipelines, LNG storage tanks and new berths for around 100 new LNG tankers. In addition, the project will also
The strength of our performance and financial resilience position us as the preferred partner to help our clients thrive in a post-pandemic world.
Wholesale and Commercial Banking
What we do
We provide a selection of products and services created for our diverse customer base, tailored to specific industry sectors and customer needs.
These include:
> wholesale, commercial and SME banking services;
> structured finance, including syndication and distribution, project and acquisition finance and asset-backed and real estate finance;
> transaction banking, consisting of global trade services and cash management;
> financial institutions, comprising of an extensive correspondent banking network;
> a full suite of treasury products and services; and
> investment banking via QNB Capital, offering comprehensive corporate advisory services covering all aspects of corporate finance.
Qatar Corporate banking revenue (QR billion)
15.1
12.4
10.5
2021
2020
2019

26 — QNB Annual Report 2021 QNB Annual Report 2021 — 27
Financial statements
SustainabilityC
orporate governanceR
iskO
perational performance
Strategic reportG
roup overview
faced by private sector employers, such as staff and rental fees. Throughout the programme, we received thousands of applications, for which we charged 0% interest within the first-year grace period.
While the pandemic presented many challenges, it also created significant new opportunities, particularly in the pharmaceutical, technology, and food and beverage sectors.
Indeed, technology has become one of the cornerstones in helping SMEs navigate the post-pandemic economy, and QNB is championing greater digitalisation. Following our investments last year, the number of Qatari SME clients using our e-commerce platform has surged to 250.
We continued to develop and enhance the range of digital services we offer to our customers. By making banking faster, easier, and more secure, our customers have more time to focus on growing their core business. We provided active support to help SMEs harness the power of emerging technologies to help improve their productivity, boost efficiency, and drive growth. Our well-established and successful e-commerce platform – QNB Simplify – remains an essential tool in helping small businesses showcase their products and services online. This year we once again saw an increase in e-commerce volumes by 29%.
In Turkey, QNB Finansbank continued to support SMEs, seen as the lifeline of the economy, with over 1,500 dedicated employees across nearly four hundred branches. SMEs are a critical business segment for our Turkey operations, accounting for approximately one-fourth of the total loan portfolio of QNB Finansbank. To continue to support our clients throughout this challenging period, QNB Finansbank was again side by side with SMEs by supporting their financing needs and offering market-leading remote services such as the SME Easy Line and Digital Bridge platform.
We fully appreciated the difficulty and challenging business environment that the pandemic posed to our SME clients in Turkey. Therefore, we continued to support our customers in maintaining their cash flow balance and liquidity under the difficult market environment by quickly meeting the rescheduling and new loan requests of our customers. For example, QNB Finansbank supported SME customers by revising payment plans with additional maturity and/or grace periods to manage their cash cycles.
Additionally, we preserved the close relations with customers, through customer calls and online meetings instead of physical visits, by offering the “SME Easy Line” solution. This provided our SME customers in Turkey with instantaneous and professional support by remote RMs, allowing them to carry out all of their transactions over the phone. Enpara Şirketim, an SME-specific sub-brand of our highly successful digital-only retail bank, continued its growth journey. We continued to attract new SMEs, growing our customer base by 47% to reach 100 thousand and 20 thousand POS terminals.
The Digital Bridge platform, with more than 41 thousand active customers, provided digital-first products such as e-Invoice, e-Ledger, e-Archive and e-Waybill. Additionally, the platform enabled Fintech third party providers to participate in the Bank’s ecosystem and offer value-added services to our customers. These include solutions such as
KolayIK, providing human resources services; Stockmount, helping customers in e-commerce; and KolayBi, Ekmob, KolayMutabakat, NeoVade, Kobaküs, Navlungo, Mindbehind and Ikas, all of which aim to digitise the way SMEs do their business. To facilitate and educate customers on using these digital services, we continued with our highly successful Digital Bridge Academy programme.
In Egypt, we continued to support financial inclusion and the contribution of SMEs to the local economy. Following the success of our efforts to achieve the Central Bank of Egypt’s target ratio of 20% of the loan portfolio to SMEs, we have taken on another challenge to increase this benchmark to 25% of the total portfolio. QNB ALAHLI was also recognised as one of the first banks to achieve the 10% portfolio threshold for small enterprises.
To achieve these targets, QNB ALAHLI held financial inclusion events in specific Business Development Service (BDS) centres throughout the year, including sessions on financial literacy about SME activities, products and how to start businesses for entrepreneurs. Our main aim was to transform micro SMEs and startups from unbanked to bankable clients.
Building on our focus on employee training and to ensure all SME clients are served at the highest level of professionalism, this year QNB ALAHLI started to certify all the SME RMs as “Certified Expert in SME Finance”, in coordination with the Egyptian Banking Institute (EBI) and the Frankfurt Business School.
Looking ahead, we will continue our unrelenting focus on making banking more accessible and more seamless for SMEs throughout our global footprint. We aim to continue to develop our product range and enhance our customer service as we build on our position as the preferred banking partner for SMEs in Qatar, Turkey, Egypt, and beyond. In Qatar, we expect next year to be dominated by supporting a diverse range of SMEs in advance of the 2022 FIFA World Cup™. In Turkey, our focus will be in further building on our digital leadership by improving our end-to-end digital credit underwriting and drawdown capabilities.
29%growth in e-commerce volumes in Qatar
250number of Qatari clients using our e-commerce platform
Awards
Best SME Bank – Qatar > International Finance
Digital Bridge: Business Intelligence Solution (Gold) – Turkey
> Stevie Awards 2021
Most Innovative Banks – Turkey > World Finance Banking Awards (Europe)
Excelling Innovation in Corporate Banking – Turkey
> Global Finance (The Innovators)
Best Digital Strategy – Turkey > European Customer Centricity Awards
Best SME Bank – Egypt > Capital Finance Magazine
Best Corporate Bank – Egypt > Global Banking and Finance
Wholesale and Commercial Bankingcontinued
Case study: Lusail Katara Twin Towers
The vision of the iconic Katara Twin Towers project in Lusail is as striking as the very building itself, soaring nearly 40 stories into Doha’s cloudless blue sky.
QNB has been a part of the project every step of the way, supporting and advising at every stage, from conception to completion. We remain active in the financing of almost every level of construction and delivery. QNB financed the developer, the main contractor and various sub-contractors and suppliers, in order to capitalise on the project and cover the entire supply chain.
The ground-breaking building, designed as two mirrored towers that symbolise the crossed swords of Qatar, will host two luxury hotels, residential apartments, offices, recreational facilities, specialist boutiques, and several high-end restaurants. In the lavish garden environment below and around the building, a range of entertainment and water sports facilities, including a water park, shops, and more restaurants are being created.
The project was awarded a five-star rating for the Global Sustainability Assessment System (GSAS) Design and Built, the performance-based certification standard in the MENA region for infrastructure projects. This assesses and rates buildings and structures for their sustainability impact.
Environmental impacts will be minimised by using state-of-the-art energy, water, and waste management systems, including efficient plumbing fixtures and appliances, water recycling, and a lighting control system to help reduce energy use by 40%.
The venture represents part of our drive as a responsible bank to develop sustainable finance initiatives.

28 — QNB Annual Report 2021 QNB Annual Report 2021 — 29
Financial statements
SustainabilityC
orporate governanceR
iskO
perational performance
Strategic reportG
roup overview
International Corporate Businesses across the globe are recovering from the severe impact that the COVID-19 pandemic caused to their operating environment. As a result, the high level of uncertainty that dominated our international corporate business environment in 2020 is fading. While in 2020 our efforts were focused on helping our customers navigate through the initial shock of the pandemic, this year we built upon the recovery momentum to assist them in adjusting to the new normal. While the requirements for liquidity, working capital and business continuity continued this year, we have seen an upside trend in business sentiment.
Acting as a gateway to MEASEA, our strength lies in the depth and diversity of our international presence which offers our growing customer base a wealth of strategic opportunities across multiple markets. Our international performance continued to grow in line with the global business environment, reinforcing our position as the partner of choice for large corporate clients and financial institutions. Deposits across our international branches had double-digit growth as we continued to help our customers adapt to the new normal in a post-pandemic world.
The COVID-19 pandemic has brought to the forefront the importance of reliable and effective digital financial services platforms. Capitalising on the investments of the previous years, we continued to migrate customers to our new online platform, which offers reliable and effective solutions. Additionally, we continued to focus on big data and analytics by providing real-time insights. This helps us to identify and address our clients’ needs more effectively.
As we expand our international corporate banking business, we are conscious of the risk-related impacts that the pandemic has brought. We consequently adjusted our risk appetite and lending criteria across geographies, sectors and corporates, to cater for the risks of the most affected industries. Our conservative lending policies are aimed at protecting the bank from mounting credit risks in international markets. QNB has adopted a cautious approach in opening credit lines to new customers and for COVID-19-affected industries. Throughout the network and across our subsidiaries, we implemented additional risk management tools to maintain our corporate portfolio asset quality with enhanced early warning and risk monitoring initiatives.
In Europe, we delivered a strong performance in treasury and trade finance by expanding our customer base and broadening our product offering. We did this by building on our trade business and closed several sizeable transactions, particularly in deposits from large corporates. In the UK, we enhanced our loan book, particularly in the real estate and energy sectors. We also helped clients with the practical challenge of transitioning away from the LIBOR standard.
This year, QNB Finansbank continued to strengthen both its market position and portfolio, even with the volatility
and economic downturn brought by the onset of the pandemic. We were able to deliver strong double-digit loan and deposit growth, thanks to our increasing market share and to an overall expansion of the market driven by the government’s fiscal stimulus. As in Qatar, our primary focus revolved around a tireless effort to reach out to our Turkish corporate clients, understanding their needs and helping them cope with their specific challenges.
In line with the changes in customer needs and expectations, this year we optimised our branch network. We did this by consolidating commercial branches in the largest cities in Turkey under Commercial Centres, where subsidiaries and support teams work together with sales teams to provide integrated financial solutions.
Additionally, this year we successfully rolled out our global account management model for multinational corporations in Turkey, enabling them to generate new business opportunities, while at the same time providing better customer service. Our global account management model supports a rising number of key clients, generating new business by deepening relationships and creating cross-selling opportunities.
In Egypt, our subsidiary QNB ALAHLI continued to maintain its prominence in the Egyptian corporate banking market. We maintained strong, long-standing relationships with major Egyptian and multinational companies operating in all economic sectors in Egypt. To ensure the business continuity of some of our clients affected by the pandemic, QNB ALAHLI led, managed and participated in a number of debt restructuring transactions with other local banks, including participation in Egypt’s largest corporate bond issuance.
In line with our sustainability aspirations, we also continued our market-leading role in financing renewable energy developments. QNB ALAHLI was particularly active in the Egyptian solar energy market, offering support and innovative solutions to encourage further development of the Egyptian solar energy industry.
Looking forward, we will continue to build upon the momentum we created last year and act as a strong partner as well as advisors to our international customers. We aim to further strengthen and deepen the relationships established through our global account management approach.
Global Transaction BankingOur trade finance and cash management solutions support the needs of domestic and multinational corporates across the QNB network. Powered by innovation and digitisation, our business is focused on the evolving needs of our customers while ensuring robust compliance with regulatory requirements across every jurisdiction in which we operate.
In 2021, global trade was buoyed by the robust, stimulus-driven economic recovery from the pandemic, which boosted demand for manufactured products and supported
Wholesale and Commercial Bankingcontinued
the rebound of commodity prices. As global trade surged to USD 21.7 trillion, from USD 17.4 trillion last year, we saw strong growth of 27% in our international trade business.
Meanwhile, we continued to leverage innovation and digitisation to support more efficient, safer execution as well as business origination initiatives.
We see trade finance origination platforms as a disruption to our traditional trade business origination model, and therefore we are adjusting our business and operating model by embedding this new norm. Our innovation efforts target platforms as a strategic means to adjust our operating model to this new normal. We have therefore focused on engaging with new regional and global trade finance origination platforms that allow us to operate seamlessly with a large number of corporates, reaching previously untapped markets. This year, we established a partnership with a newly established trade finance platform in India that enables us to address the SME receivables discounting market in India in a cost-effective way. Similar to last year, we continued our efforts to on-board customers on our QNB Trade Portal application.
We also continued to extend our comprehensive e-Business digital cash management platform across our international branches. The platform, already firmly established in Qatar, helps firms efficiently manage their cash flow, providing payment instructions and retrieving account statement information. The platform also includes payment file upload, host to host and statement download functions in different file formats. These functions, along with complex corporate user profile setups, support sophisticated corporate treasury operations via full integration with various enterprise resource planning systems.
This year we also developed a digital tax payment functionality using APIs to support tax payments in Qatar via an automated process to optimise the user experience.
Protecting critical data and providing secure access to our applications is paramount in QNB. This year we have shifted to using so-called soft bank tokens in compliance with the European Union’s Payment Services Directive (PSD2) to provide the highest level of security possible. We are in the process of phasing out physical hard tokens that generate a One Time Password, or code, in favour of more efficient authenticator methods used on smartphones. An increasing number of our customers rely on their phones for their daily banking needs, and soft tokens make accessing their accounts more secure and without a need to keep track of passwords.
As a recognition of our efforts, The Asian Banker awarded QNB as the Best Transaction Bank in Middle East & Africa, highlighting the wide range of outstanding transaction banking services that we offer, supported by corporate bank e-channel platforms. Additionally, this year, the Union of Arab Banks recognised QNB as the Best Bank in Digital Innovation in Qatar and the Global Trade Review nominated QNB as the Best Trade Finance Bank in Qatar, following the success of our Trade Finance Portal. Our trade e-channel, an integrated e-business solution, offers importers and exporters a comprehensive platform to seamlessly complete their local and international trade transactions, as well as to receive advice electronically. The platform also reflects the Bank’s achievements to make business easier by driving the efficiency of transacting remotely through its various e-channels for small and medium-sized enterprises and corporates.
Next year, we will continue to help our customers navigate the new market ecosystem as we continue to pioneer next-generation banking technology. We are committed to developing and accelerating new applications and platforms to boost customer service, security, and efficiency.
At the same time, in 2022 we expect our operations in our international branches, particularly in the Kingdom of Saudi Arabia and Hong Kong, to flourish and generate significant opportunities for transaction banking.
27%growth in international trade finance revenue
Investment in technology for the latest format/standards
Experienced transaction banking teams located in key hubs and markets
Multitude of proprietary and multi-bank channels
Ability to support high-volume transactions via automation
Leading regional presence and growing international network
Comprehensive product offering to support trade and investment flows
Leading domestic presence in Qatar
Strong credit ratings
QNB’s Global Transaction Banking Strengths

30 — QNB Annual Report 2021 QNB Annual Report 2021 — 31
Financial statements
SustainabilityC
orporate governanceR
iskO
perational performance
Strategic reportG
roup overview
Global Structured FinanceThis year’s momentum was driven by a growing sense of confidence in the economy, which served to re-establish an appetite for more extensive and ambitious opportunities. The many social and economic challenges presented by COVID-19 created a paradigm shift in attitudes to the post-pandemic market landscape, sparking new opportunities – especially around digital connectivity. A surge of activity in the market in 2021 resulted in a sustained and robust performance, with an increase in new transactions and loans helping fuel the Bank’s international momentum throughout the year.
There was growth in new clients as customers sought our support for a diverse range of capital projects and major corporate financing deals. Our reputation and expertise in structured finance, including syndication, project and export credit agency financing, acquisition financing, asset-backed and real estate financing services, make QNB the partner of choice for those corporates to drive growth in the new normal. We also benefit from our international presence, where we can support clients in a growing number of global markets.
In 2021 we facilitated a series of substantial structured finance deals across a range of sectors in Qatar, UK, Hong Kong, France, India, Singapore and Turkey. We continue to cover multiple sectors, including energy, infrastructure, telecommunications, real estate and utilities. In addition to primary deals, we were particularly active in secondary transactions throughout the year, working on refinancing and restructuring deals. At the same time, we also saw an increase in export credit agency (ECA) and multilateral deals.
Meanwhile, we have also benefitted from the opening our new branch in Hong Kong, where we have completed multiple deals, with more in the pipeline. A first-rate international financial centre, Hong Kong provides access to a vibrant local economy and China itself, where the structured financing market continues to mature.
We coordinated successful closing of the syndication of QNB’s EUR 1.75 billion three-year senior unsecured term loan facility. There was a strong positive response from the market, resulting in a large over-subscription in the general syndication stage from 31 participating banks joining the five initial Mandated Lead Arrangers.
As Environmental, Social and Governance (ESG) issues continue to influence share prices, bonds and corporate and sovereign debt, sustainable finance options remain on the top of the agenda. There is significant interest across our growing sustainable loan portfolio, to facilitate our efforts on Green bonds, Social bonds and Sustainability bonds.
In 2022, we expect a worldwide surge in projects and loans as an increasing number of firms move from caution to dynamism as the constraints of the pandemic begin to lift.
Treasury and Financial InstitutionsIn 2021, we continued the growth of our business in line with our strategic ambition, providing our clients with support in treasury trading, sales, financial institutions and correspondent banking.
Our strategic relationships with local, regional, and global banks worldwide underpin our successful financial institutions and correspondent banking business. We are well-positioned to provide uninterrupted correspondent banking services in places where counterparts require strong domestic capabilities. In addition to this, QNB has established partnerships with leading financial institutions and development banks. Combined with local expertise and market intelligence, this allows us to offer access to various markets across MEASEA from a top-rated bank.
Throughout the COVID-19 pandemic over the past two years, we ensured the continuity of our liquidity position by leveraging robust relationships with our partner banks across the globe. We also continued to diversify funding sources by entering new debt markets and extending the maturity profile. As a result, we maintained our growth, strengthened the liquidity coverage profile and reinforced the trust international investors have in QNB Group.
We have successfully issued bonds in the global markets throughout the year, as the appetite for our paper remains strong. We were able to effectively leverage our existing relationships and access new sources of funding. The Bank continues to attract an extremely broad international investor base, with funding raised from across the globe in multiple currencies across the full tenor range. This year QNB successfully closed a EUR1.75 billion senior unsecured loan. Due to strong demand from the market, QNB received a large over-subscription thanks to the trust of international investors in QNB Group’s strategy and the strength of its financial position. Capitalising on our presence in Hong Kong, we secured our first Central Moneymarkets Unit (CMU) transaction for USD600 million and a new Formosa deal for USD300 million in Taiwan.
We bolstered our international teams by onboarding highly experienced new hires, which has helped further improve the oversight and interactions with our subsidiaries and international branches.
As part of the worldwide transition away from the London Inter-bank Offered Rate (LIBOR), we have upgraded our systems to meet the requirements of the post-Libor market to price our products with the new benchmarks. We have worked closely with our clients to keep them informed and to update contractual terms. This transition to the new market norm will continue into 2022 and beyond.
QNB CapitalDriven by active capital markets, our investment banking division, QNB Capital, demonstrated solid performance across the year. As the Qatari corporate advisory market leader, our dedicated and highly experienced team of
financial advisory and investment banking professionals help the Bank grow its brand and boost its financial performance. We remain active as a key adviser for the government on various initiatives to help diversify the economy, attract foreign direct investment and more generally promote long-term stability for the country.
In 2021, we concluded more than ten transactions in the debt capital market space worth over USD25 billion. These included:> USD3.25 billion sovereign bond for the Sultanate of Oman;
> USD1 billion for Ooredoo;> USD12.5 billion for Qatar Energy; and > USD9 billion for financial institutions, including Commercial Bank of Qatar, Doha Bank, Ahli Bank, and Dukhan Bank.
Elsewhere, we advised and supported a range of companies across multiple sectors that were considering, or preparing for, an Initial Public Offering (IPO). This year, we have seen a significant increase in the number of family-owned businesses with an appetite to list their companies, demonstrating the evolution and increasing sophistication of companies maturing towards becoming listed entities.
Meanwhile, the corporate sector has continued to mature, prompting a rise in capital market development, and fuelling the growth and significance of SMEs. As a result, we have seen an increase in the number of clients seeking
our advisory services in the mergers and acquisitions space, particularly within the construction, contracting, and trading sectors. This was driven by a desire to build more effective ‘national champions’ – large local companies that excel in their field and are capable of competing internationally.
Looking forward, we expect to see a surge of business early next year as investors are already considering how best to capitalise on the 2022 FIFA World Cup™. Qatar’s status as a global sports hub is already creating new business opportunities for the private sector, attracting foreign investment while at the same time developing Qatari entrepreneurs who can provide services such as sports performance and wellness, fan engagement, and event and venue management.
We also expect to see strong growth in new projects to benefit the economy beyond sport. In the context of COVID-19, there has been a proliferation of SMEs, particularly in the e-commerce space. The strengthening of regulatory frameworks will help pave the way for more foreign direct investment and Private-Public Partnerships (PPP) projects, particularly in the education, healthcare, and tourism sectors.
Over the next few years, and against the backdrop of Qatar Energy’s significant North Field Expansion project, we anticipate new initiatives to support the SME sector and success in the continued drive to attract Foreign Direct Investment into Qatar.
Wholesale and Commercial Bankingcontinued
Looking forward, we expect to see a surge of business early next year as investors are already considering how best to capitalise on the 2022 FIFA World Cup™.
QNB Capital’s mission is to remain the investment bank of choice for Qatari and regional clients
Mergers and acquisitionsFinancial and strategic advisory
Real estate investment managementProject finance
Equity capital markets Debt capital markets

32 — QNB Annual Report 2021 QNB Annual Report 2021 — 33
Financial statements
SustainabilityC
orporate governanceR
iskO
perational performance
Strategic reportG
roup overview
A determined focus on digital innovation and customer-centricity allowed us to foster the prosperity of our clients in the new normal.
Retail Banking
Our retail banking division is well-positioned to help clients succeed and prosper in the new normal. In 2021, our performance reflected our ability to meet the challenges of the pandemic and the rapidly changing needs of our clients.
The change in the way we buy and sell online has resulted in a strong growth in online shopping. Beyond a noticeable increase in sales of fashion, health and beauty products as well as household appliances, consumers are now just as likely to purchase other products online too. Indeed, we have seen household spending on groceries, takeaway food and home entertainment all increase this year.
Our retail value proposition is underpinned by cutting-edge digital technology and innovation delivered with a human touch. By providing new payment technologies that are safe, secure, and offer greater convenience, we saw an increase in digital transactions. Furthermore, our exceptional customer experience and comprehensive, holistic suite of products and services contributed to our strong performance with growth in new accounts, loans and deposits.
With the motto “QNB Finansbank is always there for you”, we focused on offering our Turkish retail customers the right products at the right time. With customer-centricity in mind, QNB Finansbank enhanced its product line-up and infrastructure to serve our customers seamlessly and maintain the highest levels of satisfaction.
In Egypt, QNB ALAHLI strengthened its financial inclusion activities. Through dedicated offers and leveraging social media, we helped spread financial literacy, and at the same time, attracted new clients in many governorates all over
Egypt, especially in segments such as females, minors and senior citizens.
Strengthening digital services and automated channels We continued our drive to deliver a first-class digital experience throughout our global network.
This year, our focus in Qatar was on enhancing our omni-channel distribution mix, boosting self-service capacity, reducing the load on our physical network and upgrading the Bank’s ecosystem. As a result, more than 93% of our customers in Qatar use our digital channels.
A significant milestone is our exclusive partnership with PayPal, the first with any bank in the region. We are able to provide our retail customers with a set of new services for secure online purchases. The partnership offers the ability to link their credit or debit card to PayPal and shop on e-commerce sites around the globe. Furthermore, customers can top up their PayPal accounts from their QNB bank account and send money through our website. Additionally, we added a feature that allows QNB customers to withdraw any PayPal wallet amount directly into their QNB online account in local currency. We expect this partnership to act as a catalyst for the growth of e-commerce volumes across the region and beyond.
The QNB WhatsApp banking service, launched last year, provides customers with information about products and services, as well as connecting customers to QNB agents for live support. Since the service was launched, we have seen a significant reduction in the number of calls to our call centres.
We also continued to enhance our self-services offering by rolling out additional Integrated Teller Machines (ITM) in Qatar. In locations where a branch is equipped with an ITM, more than 28% of the total transactions are executed through this channel. We also extended the ITMs service availability, helping to boost total usage by 35%. The success of this initiative has encouraged us to plan for further expansion in the number of our ITMs in the future.
We continued the expansion programme of our ATMs in Qatar that are enabled with a self-service cheque deposit and clearing facility. Today, these ATMs account for over 65% of total cheque clearing volumes. We are committed to continuing this expansion by adding additional locations in the future. In parallel, we increased the transaction limits for ATM QR code withdrawals in Turkey, making it easier and more convenient for customers to engage without the need for physical contact. We also continued to expand our ATM footprint in Egypt through all governates, including Drive-Thru ATMs that respect social distance precautions.
On the international front we have achieved a number of significant milestones. In France and the UK, we upgraded our internet and mobile banking platforms to meet PSD2 requirements and enhanced our retail systems to drive greater efficiency and service through increased automation.
In Turkey, we renewed our mobile app design and functionality according to the latest user experience trends. The new design offers a customisable dashboard structure, user-friendly interface, quick access panel and enriched agenda menu. Using the latest technology to provide a personalised and frictionless customer experience, the app guides our customers in banking transactions with its personal assistant “Digital Intelligence Q”. As a result of these initiatives and new legislation allowing for customer acquisition via video-calls, digital channel penetration increased from 67% in 2020 to 71% in 2021, with additionally more than 60 thousand new customers on-boarded. Our digital-only bank in Turkey, Enpara, continued from strength to strength, growing its customer base by 26% to reach 3.0 million. Even with the considerable increases in the customer portfolio, we have sustained a high level of Net Promoter Score, at 77.
The Egyptian market, with its rapidly digitising consumer base, continued to offer great opportunities. We maintain our commitment to developing innovative digital solutions by introducing the latest disruptive digital services and products with the highest levels of security. This year, QNB ALAHLI added numerous enhancements to our Internet Banking service, such as allowing clients to redeem their credit card loyalty points, reissue credit card PIN codes, and change supplementary cards limits and issue new certificate of deposits.
We recognise that establishing a meaningful presence in Asia requires capturing a share of a fast-growing, large, widely dispersed and technology-savvy population. For our subsidiary in Indonesia, we created a wide-reaching presence by leveraging technology and innovation while at the same time supporting greater financial inclusion. We have done this by investing in the development of a dedicated digital solution, UCan.
Embedding sustainability into our retail offeringTo further support QNB’s sustainability agenda, raise awareness in the community and showcase the progress that Qatar has made in the areas of sustainability, we have launched a series of green initiatives in our retail portfolio.
In Qatar, QNB’s sustainable products and services include a green mortgage and green vehicle loan promotion with attractive interest rates. The Bank signed a memorandum of understanding (MOU) with Gulf Organisation for Research
93%Digital channel penetration in Qatar
26%Growth in Enpara customer base in Turkey
77Enpara Net Promoter Score
Awards
Best digital banking products and services > Global Banking and Finance
Customer Satisfaction Achievement (Bronze) - Turkey
> Stevie awards 2021
Best retail bank - Egypt > International Finance Magazine
Best retail bank - Egypt > Global Banking and Finance
Best retail bank - Egypt > Capital Finance Magazine
Best E-banking product - mobile banking in Egypt > International Finance MagazineWhat we do
Retail Banking offers a comprehensive, holistic suite of products and services with an integrated, multichannel distribution network.
These include:
> 53 branches in Qatar and 1,010 internationally;
> more than 508 ATMs and 10 ITMs in Qatar – the largest network in the country – and 4,134 abroad;
> innovative and user friendly internet and mobile banking platforms;
> market leading premium proposition through the QNB First and QNB First Plus services;
> international retail offering with global account access across our international network;
> consideration of sustainability criteria.

34 — QNB Annual Report 2021 QNB Annual Report 2021 — 35
Financial statements
SustainabilityC
orporate governanceR
iskO
perational performance
Strategic reportG
roup overview
Retail Bankingcontinued
and Development (GORD) to promote sustainable building practices through the use of the Global Sustainability Assessment System (GSAS) rating. The GSAS rating is used to determine the client’s eligibility to avail a green mortgage for sustainable properties and assets. QNB is the first bank in the region to apply the GSAS rating as part of its efforts towards sustainable development and climate change mitigation. This collaboration with GORD will lead to introducing further attractive promotional interest rates for green properties and assets.
In addition, the Bank published a customer charter, which details our commitment to providing excellent customer service and meeting customers’ financial needs with quality products and services. In line with the commitments set in the charter, we aim to continually enhance our products, services and customer channels to deliver an exceptional customer experience.
In Egypt, QNB ALAHLI participated in the Central Bank of Egypt’s initiative of “Substitute Cars to Work with Dual Fuel”, in which we provided payment facilities and special interest rates for customers intending to buy environmentally-friendly vehicles.
Growing our cards and payment businessesWe saw powerful momentum in the cards market across 2021. This was driven by a surge in card acceptance, a substantial increase in e-commerce activity - including the successful launch of Apple Pay in Qatar - and the success of our digital enhancements and partnerships.
The market was also buoyed by the gradual lifting of travel restrictions, increased domestic consumption, and improved consumer confidence. As a result, we saw a surge in growth in the cards business. Credit card issuance increased by 37.5%, while the uptake in prepaid cards rose by 60%. Debit cards were up by 16%, and the number of commercial cards soared by 89%. The ongoing transition from cash to card also helped fuel a 35% increase in debit card transaction volume, while cash usage grew by only 4%.
We continued to invest in technology, helping to nurture an extensive and secure e-commerce infrastructure. At the same time, by adhering to our successful strategic approach, we also launched new products and services that served to boost our market competitiveness. Customer demand for safe, secure, and more rapid payment solutions has enabled a range of new ways to pay for goods and services. As a result, many more businesses have recognised the need to be fully present online and accept a broad spectrum of digital payments.
We launched QNBpay, a mobile banking service that enabled customers to make secure, mobile contactless payments. Every one of the new cards we issue is enabled for contactless payment, and the number of contactless transactions continues to rise, with a growth of 37% in contactless transactions, compared to 19% last year. QNB led the market in launching the safest and most
convenient payment form factors, including Fitbit Pay, Garmin Pay, and Apple Pay. Since its launch in August, the total number of Apple Pay transactions has exceeded 2.2 million with a total volume of over QAR548 million, clearly demonstrating strong customer adoption to new forms of digital payments.
Pharmacies and delivery services, in particular, continued to be in high demand. Snoonu, an award-winning delivery app, is one such success story. The Qatari e-commerce start-up already has more than 100,000 users and plans to expand and diversify its offering by adding new features and services to its platform. QNB has developed a wide array of digital payment solutions to support businesses like these, including offering contactless payments that ensure customer data remains secure. Our reputation for providing customers with state-of-the-art technologies is one of the reasons we remain the market leader in retail banking and the acquiring business.
Meanwhile, we actively collaborated with Visa, FIFA, and the Supreme Committee for Delivery & Legacy to bring seamless payment solutions for Qatari citizens, tourists, and sports fans. The Bank is an Official Middle East and Africa Supporter of the FIFA World Cup Qatar 2022™ as well as the Official Qatari Bank of the tournament, which will help strengthen QNB’s brand image and reputation globally. The tournament is expected to bring together fans from all over the world. To help our retailer clients cater to payments from Chinese customers, this year we launched WeChat Pay. Used by more than 1.2 billion people monthly, the WeChat Pay mobile payment solution is the premier payment solution in China and constitutes an additional powerful tool for our clients accept payments from Chinese consumers traveling abroad.
One of the highlights of this year in our cards business was establishing a strategic partnership with Visa. This has enabled us to create advanced payment products that at the same time offer more benefits and privileges. These include complimentary airport lounge access, travel insurance benefits and discounts in both Qatar and abroad, in addition to a loyalty program. We are confident that this strategic partnership with Visa will help us to mutually benefit and raise our global expertise and network in the cards business.
Launched at the beginning of 2021, FAST, a money transfer solution, enabled our QNB Finansbank customers in Turkey to make transfers to other bank accounts outside of traditional working hours. Before FAST, customers could only issue transfers to other bank accounts during working hours or weekdays.
Our subsidiary in Egypt, QNB ALAHLI, actively supported the country’s financial inclusion initiatives by extending the use of POS machines, QR Code payments and several digital services. Together with introducing the contactless feature to all our cards, we have provided individual customers with various solutions to enjoy an easier, faster and safer shopping experience, thus favouring the transition into a cashless society.
Looking ahead, our focus will be on the upcoming FIFA World Cup Qatar 2022™. This event will require extensive planning and preparation to fully capitalise on this unique event. We see this as an opportunity to showcase our leading-edge cards capabilities which will position us for further growth and better customer service.
58%Percentage of contactless transactions in Qatar
35%Increase in debit card transaction volumes in Qatar
We continued to invest in technology, helping to nurture an extensive and secure e-commerce infrastructure.

36 — QNB Annual Report 2021 QNB Annual Report 2021 — 37
Financial statements
SustainabilityC
orporate governanceR
iskO
perational performance
Strategic reportG
roup overview
Retail Bankingcontinued
Case study: Supporting financial inclusion in Indonesia
In partnership with a world-class FinTech and Indosat Ooredoo, one of the largest telecommunications firms in the country, QNB Indonesia launched a new, fully-digital offering, UCan.
This solution combines advanced data analytics and decision algorithms to provide a powerful new loan service app that enables customers to borrow up to USD200 in cash, quickly and easily through their mobile devices. The app makes banking more accessible to the local retail market and uses sophisticated data analytics to offer qualified customers credit in just two minutes. The advanced data algorithms provide a cache of alternative data to accurately validate a customer’s creditworthiness to give credit to people for the first time.
This solution allowed QNB to enhance financial inclusion in Indonesia by supporting those who might not usually have access to credit by traditional lenders due to a lack of reliable information or who don’t have time to visit branches.
Furthermore, we will continue to build on our infrastructure and support a growing number of customers with secure and seamless transactions. The cards and payments business will continue to grow and evolve through digitisation, differentiation, and strong marketing deliveries. The significant untapped commercial payment space will remain an area of focus as we seek to extend our market dominance.
Accelerating our premium offering with QNB FirstBy connecting our customers to a range of world-class products and services, we provide an unrivalled premium value proposition across domestic and international markets. We continue to be the bank of choice for millions of customers, while rewarding their loyalty.
A winning strategy and innovative business model helped us sustain continuous growth in the number of QNB First customers and the volume of deposits and loans. As such, we are well positioned to retain our leading position for premium banking services in the respective markets we are present. The number of QNB First customers in Qatar grew by 9.2%, while total
deposits increased by 7.1% and total loans by 7.6% compared to year-end 2020. We also delivered growth in the number of credit cards, with numbers rising by 8.9%.
We continued to enhance our premium banking value proposition, providing seamless access to exclusive lifestyle and privilege services for our QNB First customers across the globe. Our new strategic partnership with Visa has enabled us to offer even more premium choices. We established 65 new partners to expand the range of benefits available to our premium customers. We now have almost 350 lifestyle partners that provide exclusive offers and discounts to customers in more than 20 cities worldwide.
Our International retail offering provides our customers with global account access across our international network. This year, we further expanded our international network access with cross-border account opening between Turkey, Kuwait and Oman.
In Turkey, we continued to carry out initiatives to increase the satisfaction and loyalty of our affluent customers in 2021. With a wide range of premium products, discounted or free-of-charge banking services and specially designed lifestyle privileges, we aimed to provide the best affluent banking experience in Turkey. We continued to invest in QNB First Digital, our mobile interface specially designed for these customers. In addition to banking services, we offered non-banking privileges such as free dry cleaning, privileged miles with free Miles&Smiles credit card, free or discounted books from the “QNB First Library”, QNB First Loyalty Programme and special discounts on digital platforms such as Netflix and the Apple App Store. As a result of our strong value proposition and the tireless efforts of our dedicated Relationship Managers, the number of affluent customers increased by 8% in 2021, with the mobile banking penetration increasing by 20%.
7.1%Growth in QNB First deposits in Qatar
42.9%Growth in QNB Finansbank retail deposits
12.9%Growth in QNB ALAHLI retail deposits
In Turkey, we continued to carry out initiatives aimed at increasing the satisfaction and loyalty of our affluent customers in 2021.

38 — QNB Annual Report 2021 QNB Annual Report 2021 — 39
Financial statements
SustainabilityC
orporate governanceR
iskO
perational performance
Strategic reportG
roup overview
Our award-winning asset and wealth management services provide institutional investors and high net-worth clients with exclusive, tailored services at local, regional, and global levels.
Asset and Wealth Management
Asset managementWe remain the leading player in a market where per-capita income is almost six times greater than the world average. In 2021, we delivered a strong performance despite the challenges of a global pandemic. By enhancing our distribution capabilities and further developing our range of innovative products and services, we continued to be the bank of choice for high and ultra-high net worth individuals in Qatar.
In a rapidly changing investment landscape influenced by prolonged uncertainty and higher risks, our asset management business was able to identify and provide high-yielding innovative products to our clients. This has helped our clients better position themselves in the market by accessing more attractive investment opportunities. Our engaging communication with clients and robust product performance enabled us to attract more subscriptions to our investment products, even with the continued uncertainty caused by the pandemic.
Assets Under Management (AUM) increased by 8.1% as market sentiment remained strong after last year’s volatility. We saw sustained interest in sector specialisation and an ongoing move towards thematic investments, particularly in the medical, technology, and green energy sectors. The lasting impact of the COVID-19 pandemic has also placed a significant ongoing focus on healthcare. To capitalise on this, we continued to build on the series of themed products we developed to capture significant market trends and offer our clients higher yields.
In Turkey, we offer an expanded range of investment instruments including alternative investment and deposit products for our customers. In 2021, the attractiveness of alternative investment products continued to increase due to the high volatility in local markets. With the support of our local subsidiaries, QNB Finansinvest and QNB Finans Asset Management, we widened our investment product range, especially mutual funds, to offer new investment products. Moreover, QNB Finansinvest played an active role in several IPOs as a consortium leader or a member.
Looking into 2022, we will develop our digital offering still further. Launching a new platform offering clients a 360-degree view across all their QNB accounts will enhance accessibility, boost customer service, and provide greater agility. The cross-platform service will give clients a real-time umbrella view of all their accounts and investments on just one screen. Dedicated relationship managers will also have access, enabling them to offer increasingly tailored opportunities with greater efficiency and speed.
61%Institutional market share for QNBFS
8.1%Increase in AUM
Elsewhere, we will build distribution capabilities to enhance our global asset management offering. We will also optimise our collaboration with retail and private banking to drive distribution and continue to develop and source products that meet investor demand across our network.
Private bankingWe offer our clients a professional relationship with a personal touch, delivering a banking experience perfectly tailored to their needs. Taking advantage of our financial strength, high ratings, and the diversity of our portfolio of services and investment products, we continued to offer our clients highly bespoke private banking solutions through discretionary and non-discretionary portfolio management mandates.
In 2021, we strengthened our private banking value proposition by bolstering the level and range of client services and support in the UK, France, Singapore, and Switzerland. Additionally, we were granted an advisory licence in Switzerland, allowing us to expand our offering and further take advantage of the opportunities in this global private banking hub. While the market was challenging due to the lingering effects of the COVID-19 pandemic, we saw a 28% increase in investments and maintained a stable loan book.
We are continuously exploring new ways to meet the needs of our clients, looking for new tailor-made, exclusive and curated lifestyle experiences. In 2021, we launched Qatar’s first Mastercard® World Elite Exclusive™ credit card in partnership with Mastercard. The most exclusive card in the Mastercard product suite, the stylish metal–hybrid card is only available to QNB Private Banking customers by invitation. Customers benefit from an extensive range of lifestyle privileges, including access to personalised
lifestyle management services, unique rewards, reduced waiting times at the world’s most coveted restaurants, and private dining experiences with renowned Michelin-Star Chefs. Other benefits include the ability to locate, source, and deliver exclusive luxury items at the world’s most celebrated retail establishments.
What we do
QNB Group’s Asset and Wealth Management (AWM) provides an end-to-end advisory service for clients to help them effectively manage their wealth. We support high net-worth individuals with our private banking offering, manage mutual funds across a variety of asset classes and geographies, and offer extensive brokerage and custody services.
We are building distribution capabilities to enhance our global asset management offering.
Awards
Best performance in Qatar for the 2021 Euromoney Private Banking and Wealth Management survey in the following segments:
> Mega High Net Worth Clients
> Ultra High Net Worth Clients
> High Net Worth Clients
> Super Affluent Clients
> Mass Affluent Clients
> Capital Markets and Advisory
> Technology Innovative or Emerging Technology Adoption
Best Private Bank in the Middle East 2022 > Global Finance
Best Private Bank in Qatar 2022 > Global Finance
40.1%6.0%
29.3%9.6%
17.4%12.7%
5 years
3 years
1 year
Performance of Al Watani Fund 1 (%)
Performance of Al Watani Fund 1 (31 Dec 2021)
Performance of Standard & Poor’s Qatar Domestic Index (Custom) (31 Dec 2021)

40 — QNB Annual Report 2021 QNB Annual Report 2021 — 41
Financial statements
SustainabilityC
orporate governanceR
iskO
perational performance
Strategic reportG
roup overview
Meanwhile, the success of our Private Banking capabilities and performance was recognised by Euromoney magazine, which awarded the Bank seven trophies in the 2021 Euromoney Private Banking and Wealth Management survey. The success of our Private Banking capabilities and performance was also recognised by Global Finance, which awarded QNB Private as the “Best Private Bank in The Middle East 2021” and “Best Private Bank in Qatar 2021”.
Brokerage and custody servicesQNB Financial Services (QNBFS), our wholly-owned, award-winning subsidiary, continued to sustain its leading position within the brokerage business in 2021, significantly contributing to the total trade turnover in the Qatar Stock Exchange and maintaining market share. In 2021, our market share reached 32%, while our share of the institutional investment market increased to 61%.
This year we continued to attract a growing client list of customers for our liquidity provisioning (LP) services. Since its introduction last year, we have helped provide greater price stability and improved liquidity in the Qatari stock market. Our clients have benefitted from a considerable improvement in the liquidity of their shares, a significant reduction in their bid-ask spreads, and increased foreign flows. To further expand our retail investor base, we have also gone live with our Margin Trading offering.
We also played a role in launching the Qatar Exchange Venture Market (QEVM) by supporting and advising the first two companies to list on the new exchange. The launch of the new market is the result of intense efforts by the Qatar Stock Exchange and the QDB to develop Qatar’s capital market. Following consultations with private and family-owned companies, the QEVM is designed to attract and encourage entrepreneurial SMEs to list their companies and grow with greater ease.
We also offer high-quality research and analysis on the Qatari market and those of the broader GCC markets. We consistently strive to add value to our clients by providing them with on-the-ground local market intelligence and insights that enable them to make informed investment decisions. QNBFS also holds itself to the highest global standards of professional ethics. The research team maintains complete analytical integrity and independence of views from the rest of the QNB Group.
As well as being one of the leading brokerage houses for the Qatari stock market, we also enjoy a growing regional and international reputation and connect investors to a range of international markets. In 2021, we expanded and upgraded
our international equity and fixed income trading desk for retail customers. This has enabled our customers to access investment opportunities across a broader range of diverse products and markets.
While the pandemic prevented a physical presence at international investment events, we continued to showcase Qatar’s leading businesses and the opportunities to international investors and conferences virtually.
Recognising our leadership in the market and quality of our services, International Finance once again awarded us Best Brokerage House in Qatar for 2021. These achievements reflect QNB’s success in developing the performance of our custody services and offering an integrated set of innovative products and specialised advisory services for capital market transactions and brokerage companies’ clients.
In our custody business, we are moving beyond serving purely domestic clients to focus on attracting global custodians and capture a greater market share of global investment flows into Qatar.
The focus for our custody business has been to add volumes to our existing offering and take advantage of our scalable platform. Our advances have been recognised internationally and we have received the Global Finance award for Best sub-custodian in Qatar during the year. We continue to be in constant discussion with market participants and authorities on how we can drive change to ease and attract more investments and capital to Qatar’s financial market.
At the same time, we also remain actively engaged with the Qatar Central Securities Depository to advocate for the adoption of best practices in servicing international clients who invest in Qatar.
In 2022, we will continue to focus on growing our share of the retail and institutional business in Qatar and increasing our international profile for both the brokerage and custody businesses.
Asset and Wealth Managementcontinued
Awards
Best Brokerage House in Qatar 2021 > International Finance
Best sub custodian in Qatar > Global Finance
This year we continued to attract a growing client list of customers for our liquidity provisioning (LP) services.

42 — QNB Annual Report 2021 QNB Annual Report 2021 — 43
Financial statements
SustainabilityC
orporate governanceR
iskO
perational performance
Strategic reportG
roup overview
International expansion is one of the strategic pillars of our long-term strategy. By connecting and enabling, we create prosperity and growth in the societies we serve across our network.
International Business
Driving growth internationallyThe resilience of our international network throughout the global pandemic reflects the success of our approach to manage and govern our international business. Our balance sheet remained robust with high asset quality, delivering steady returns.
With the vaccination rollout and the gradual re-opening of the global economy, we have witnessed a pickup in business activity throughout our network. This reassures us that we have the right setup to continue to drive growth in the new normal, even though short-term volatilities may remain.
One of the highlights for 2021 was the opening of our Hong Kong branch. Hong Kong is a global financial centre as well as the gateway into and out of mainland China. It is a significant trade hub, accounting for over USD1 trillion of cross border trade flows, and will serve as the focal point of our presence in East Asia, funnelling our business activities in that region. As a result, we will facilitate cross-border business by offering a range of corporate banking products and services, including treasury and correspondent banking, trade finance, foreign exchange, syndication, and project financing.
The branch will work closely with the Group’s global network, particularly the Singapore branch and Shanghai representative office. We are also well-placed to provide strategic and practical support in the continued growth of the Pearl River Delta in the south of China. This mega-city cluster is a significant growth engine for the country and a significant source of investment opportunities.
OptimisationElsewhere, we continued our focus to fortify and extend our international value proposition by optimising our products and services in Tunisia, Kuwait, and Oman. We have also continued our efforts to optimise our operational resilience.
With our in-depth knowledge of our customers and their banking needs, we can carefully calibrate the size and shape of our services in each location, tailoring them accordingly. By doing so, we create greater efficiencies through an optimised operating model while enhancing customer service and stakeholder value. This year, we improved our efficiency ratio to 22.2%.
Following the lifting of the blockade in early 2021, we are revamping our business activities in the Kingdom of Saudi Arabia (KSA). KSA is a strategic market for QNB and we envisage that in the future, KSA will be a significant contributor to the growth of QNB.
Furthermore, we strengthened and harmonised operational risk, compliance, and systems across the entire network. As part of this, we have launched an initiative to further increase the effectiveness of our subsidiary board members. We are streamlining the process of Board induction, on-boarding, development planning and succession management. The review covers topics such as corporate governance, board effectiveness and subsidiary strategy. We also introduced a specialist training programme to reinforce the skills and abilities of our senior staff designed to share knowledge and drive best-practice across our footprint.
What we do
We act as a liaison between QNB’s Head Office in Qatar and our international branches and subsidiaries, ensuring alignment in our network activities. Our purpose is to connect and enable to facilitate sustainable, profitable growth. We do this by striving for excellence in the execution of our strategy and by embedding a consistent culture of regulatory compliance, governance, and risk management while ensuring we have best-in-class processes, technologies as well as optimised operating model and governance framework.
Looking aheadLooking ahead into 2022, we will continue with our persistence to promote prosperity and growth in the societies we operate in across our international network. We will do this by continuing to support our entities across the network, leveraging cross-border initiatives and opportunities, and vertically integrating new business opportunities in each of our jurisdictions.
This year we opened a branch in Hong Kong, a global financial centre as well as the gateway into and out of mainland China.
International business net profit (QR billion)
2.85
3.22
4.95
2021
2020
2019

44 — QNB Annual Report 2021 QNB Annual Report 2021 — 45
Group overv
iewFinancial statem
entsSustainability
Corporate governance
Risk
Operational perform
anceStrategic report
Risk

46 — QNB Annual Report 2021 QNB Annual Report 2021 — 47
Group overv
iewFinancial statem
entsSustainability
Corporate governance
Risk
Operational perform
anceStrategic report
Our robust Group-wide enterprise risk management framework, our prudent approach to risk management and our comprehensive governance framework have helped us successfully manage the impact of COVID-19 on our business.
Risk management
Risk is an integral part of our business and decision-making process. QNB Group’s sustainable performance relies on our ability to successfully manage risk at all levels. QNB’s risk profile and appetite are approved by the Board of Directors (BOD) and Group Board Risk Committee (GBRC) and then cascaded down to every division, department and employee.
This year we have re-structured the functional reporting line of the Risk and Credit divisions. As such, we have merged the Group Chief Credit Officer and Group Chief Risk Officer (GCRO) positions. The risk function is headed by the GCRO, reporting directly to the Group Chief Executive Officer (GCEO). The GCRO also has a reporting line to the Group Board Risk Committee, ensuring that the Bank has a robust risk management governance framework in place to maintain the appropriate balance between risk and reward.
In 2021, Group Risk continued its prudent approach towards managing risk across the network in line with regulatory guidelines and compliance. This has helped us successfully manage the continuing impact of the COVID-19 pandemic on our business. Our foresight and collaborative approach towards risk management across the Group has enabled us to understand the country-specific conditions of the ongoing economic recovery. This allows us to adjust and fine-tune our risk management approach for each of our network’s jurisdictions to manage the recovery and support our clients in an optimal way.
Risk appetite QNB Group’s Risk Appetite Statement (RAS) is central to the Group’s integrated approach to risk management and articulates the risk culture, governance and boundaries of QNB Group. The RAS ensures alignment with the Group’s vision and strategy by tracking current performance through risk appetite targets. The RAS also provides a framework for QNB Group’s attitude towards risk taking and is reviewed, reassessed and agreed alongside QNB Group’s strategic and financial planning process on an ongoing basis. Our Group risk appetite is in accordance with
best-practice risk management principles that govern our overall approach to risk management and our risk culture. This approach is actively enforced through the Three Lines of Defence model.
We believe that risk management is the responsibility of all employees. The businesses act as the first line of defence, and are responsible for owning and managing the risk under their jurisdiction. The risk function, as the second line of defence, oversights the risk and provides the frameworks, policies, definitions, tools and techniques to enable the first line to discharge their risk-related responsibilities.
Risk governance and managementBest-in-class risk management is considered fundamental to QNB Group’s efforts to maximise profitability. Every employee in the Group is responsible for identifying, assessing and controlling potential risks when carrying out their duties. The Board of Directors (BOD) assumes the ultimate responsibility for assessing, taking, managing and monitoring QNB Group’s risks through the GBRC in coordination with the GCEO, the Group Management Risk Committee (GMRC), the Group Credit Committee (GCC), the Group Operational Risk Committee (GORC), the Group Assets and Liabilities Committee (GALCO) and the Group Cybersecurity Committee (GCSC). The BOD has determined the objectives and framework of the Group’s risk management policy, managed through the various committees. The BOD receives regular updates on the Group’s risk profile. The BOD also supervises other financial and non-financial risks affecting the Group. As such, the Bank monitors its risks on a daily basis based on the objectives and mechanisms identified by the Board. This includes, but is not limited to, changes to the Group’s operating environment, risk appetite, financial (capital, liquidity, earnings) and non-financial risks, such as endogenous and exogenous operational risk events (fraud, human errors, cybersecurity, natural catastrophes).
The BOD is responsible for approving strategic plans and the acceptance and control of risks implied in delivering these strategies. This includes monitoring the implementation of appropriate restrictions and limits with respect to products, issuers, geographic location and maturity.
The Group Risk Division undertakes the formulation and review of the risk management strategy, defines the risk management policies, evaluates the activities of risk
In line with Basel guidelines, the Group has adopted the ‘Three Lines of Defence/Control’ model.
Responsible and accountable for identifying, assessing and controlling the risks of their activities.
1. Business and process functions
Introduce policies and systems to ensure that the risks in the business and process units have been appropriately identified and managed.
2. Risk and control functions
Independently assesses the effectiveness of the processes created in the first and second lines of control.Provides assurance on these processes and value-added recommendations to improve the process and promote best practice.
3. Internal audit function
“Our approach to risk-management is actively enforced through the Three Lines of Defence model.”
management and control mechanisms, and assesses and determines the Group’s operational, credit, market, strategic, legal, reputational and other risks. The division, which is headed by the GCRO, undertakes the implementation of the policy. Risk management policies and procedures are established to identify, assess and monitor risk at Group level. Group Risk also ensures the implementation of operational plans to monitor and manage these risks, reviews and monitors cases of fraud and operating losses and oversees the legal disputes at all levels. Ultimately, the GMRC bears the executive authority vested to deal with the various risk aspects at Group level.
The responsibility for the day-to-day management of risk is assigned to specific teams within the Bank. By way of an example, QNB Group’s Treasury function is responsible for compliance with the Group’s trading restrictions, expressed in terms of limits and product mandates, imposed by the GALCO under the delegated authority of the BOD, with second line oversight being provided by Risk Management and third line by the Group Internal Audit Division. A comprehensive control framework has been designed and implemented and detailed monthly reports are submitted to the GALCO.
Risk identification, monitoring and control The identification of principal risks is a process overseen by Group Risk. The material risks are regularly reported to the GBRC and GMRC, together with a regular evaluation of the effectiveness of the risk operating controls. The day-to-day governance is delegated through an Enterprise Risk Management (ERM) oversight structure and a robust risk control framework. This framework consists of a comprehensive set of policies, standards, procedures and processes designed to identify, measure, monitor, mitigate and report risk in a consistent and effective manner across
the Group. The framework is essential to support our strategic objectives and acts as a platform for our growth. We continue to improve our frameworks for risk identification to ensure adequate early warning indicators and timely decision making.
We have a strong country and cross-border risk management framework. Our centralised approach to risk management is complemented by local expertise and knowledge and every employee in the Group is responsible for highlighting and dealing with potential risks in the course of their work.
Risk culture We actively promote a risk-minded culture across the organisation. To do this, we have embedded specific risk management metrics into all our employee’s performance scorecards. Each risk function is involved in defining these metrics annually and providing oversight by evaluating and rating them throughout the year through our performance management process. Our metrics are broad and touch on all risk disciplines, including non-financial risks such as Operational Risk and Information Security. In addition, employees are required to complete mandatory risk-related training each year to ensure a thorough understanding of the Bank’s policies and procedures.
“We continue to improve our frameworks for risk identification to ensure adequate early warning indicators and timely decision making.”

48 — QNB Annual Report 2021 QNB Annual Report 2021 — 49
Group overv
iewFinancial statem
entsSustainability
Corporate governance
Risk
Operational perform
anceStrategic report
The Group Strategic Risk Management (GSRM) function manages Strategic, Enterprise, Credit Portfolio, Market, Asset and Liability Management (ALM) and Liquidity risks. The team is responsible for the Bank’s risk systems infrastructure; risk limit setting, monitoring and control; and pillar 2 reporting, stress testing and scenario analysis.
The strategic risk function proactively alerts management of any perceived emerging or escalating threats, and provides recommendations as to the remedial actions the Bank should adopt. The function also provides insights, recommendations and support in a number of areas of prudential interaction, most notably with respect to the Internal Capital Adequacy Assessment Process (ICAAP), recovery planning, capital planning and in formulating responses to regulatory consultative exercises. GSRM is an active participant in the Bank’s change initiatives, and as an example, leads both the Group’s LIBOR Transition programme and its Climate Risk initiative.
Following the prudent measures that were introduced during the pandemic, we adjusted our risk appetite in line with the global economic recovery. This year’s efforts have built upon the measures taken in 2020 to limit the impact of the COVID-19 pandemic, and has entailed a considered variation of certain pandemic-related controls at a sectoral and country level. In 2021, we focused on protecting the Group’s capital and liquidity position while simultaneously ensuring that our customers have access to credit.
QNB’s risk controls are regularly reviewed, and where appropriate, we apply an increased level of vigilance and tighter controls. Our pre-emptive actions ensured that we were able to maintain our capital and liquidity ratios well
above regulatory requirements across our entire network without needing to take advantage of the available relaxations in regulatory requirements.
LIBOR, a set of global reference rates used by financial market participants across the globe, is expected to be phased out by the 31st December 2021 (GBP, CHF, JPY & EUR LIBORs) and 30th June 2023 (USD LIBORs). Our LIBOR transition programme has successfully implemented the Risk Free Rate (RFR) functionality in loan booking and Treasury systems, provided training for our employees and proactively reached out to our customers to notify them of the expected changes. We have a clearly defined plan for transitioning our exposures, taking into account the nature and complexity of products, counterparties, legal jurisdictions, regulatory expectations as well as our own internal positions and hedging preferences.
Market risk Oversight of market risk is delegated by the BOD to the GALCO. Market risk exposures primarily relate to interest rate risk in the banking book and FX risks that generally arise as a result of the Bank’s day-to-day business activities. Our market risk function monitors all market risks within the GALCO-approved delegated authority limits and product mandates. The market risk limits are set at very conservative levels to reflect a limited appetite for this type of risk exposure. From a market risk perspective, QNB is very risk averse. Our Value at Risk (VaR) limit as a proportion of capital stands at 0.057% while average VaR utilisation is at 5.68% of its limit.
“Our pre-emptive actions ensured that we were able to maintain our capital and liquidity ratios well above regulatory requirements across our entire network without needing to take advantage of the available relaxations in regulatory requirements.”
Our sophisticated strategic risk capabilities allow us to fuel our growth while safeguarding our future.
Strategic risk
Liquidity risk To ensure a sustainable, profitable business and to retain the confidence of the financial markets, the prudent management of liquidity is essential. The responsibility for liquidity management ultimately resides with the BOD, with operational oversight being delegated to the GALCO and day-to-day management to the Treasury function. The risk management oversight process provides assurance that the Group’s liquidity resources are sufficient in amount and diversity. This allows for planned and unplanned increases in funding requirements to be accommodated routinely without material adverse impact on earnings or on the way the Bank is perceived in the market. We maintain a comprehensive liquidity control framework to manage the Group’s liquidity and funding risk in a robust manner. Through this framework, we help to control and optimise the risk-return profile of the Group.
Stress testing and ICAAP Maintaining adequate resources across our network of countries in order to withstand unforeseen macroeconomic headwinds and shocks remains paramount. ICAAP is an integral part of assessing the capital adequacy of the Bank, providing a forward-looking evaluation of our ability to operate in a more stressed economic situation. The results of this process help us to determine and plan how to allocate our capital and liquidity in the most efficient way. Through this, we ensure that the Bank maintains healthy risk metrics in line with our approved Group risk appetite and regulatory limits.
Our Interest Rate Risk in the Banking Book (IRRBB) framework provides us with a means to measure, calculate, report and hedge interest rate risk, ensuring compliance with regulation and simultaneously optimising regulatory capital requirements. We have undertaken a detailed
empirical analysis this year to calibrate and validate our behavioural assumptions as part of our ongoing commitment to promote best practice risk measurement and reporting standards, and to ensure full compliance with enhanced QCB requirements.
Climate risk QNB understands that climate risk is a real and imminent threat to the environment we live in, and the subject represents both a business risk and an opportunity for the Bank. The Bank recognises climate risk as one of the key risk dimensions and we have initiated the integration of climate risk into our risk management framework.
Improved risk management and monitoring We are continuously developing our risk control and monitoring framework. During the year, we have strengthened our risk modelling capabilities, both in terms of in-house expertise and process improvement. Various enhancements to risk analytics are underway which will support the Bank’s credit risk quantification and provisioning processes. Additionally, the development of a quarterly Risk Bulletin, highlighting key risk themes at a strategic, global and regional level was a notable 2021 deliverable.
Looking ahead As we move into 2022, some of the key themes that motivated our actions in 2021 will remain prevalent. Finding a balanced and nuanced way to address the risk legacy of the pandemic whilst capitalising on the opportunities provided by the post-lockdown economic resurgence will continue to be key. Secondly, the focus of the LIBOR Transition project will move to the third and final phase of a controlled migration of the remaining USD transactions.
The risk management oversight process provides assurance that the Group’s liquidity resources are sufficient in amount and diversity.
Fully loaded CET1 ratio (%)
14.2%
14.0%
13.7%
2021
2020
2019
Liquidity coverage ratio (%)
146.7%
164.2%
159.7%
2021
2020
2019
0.057%VaR limit as a percentage of capital

50 — QNB Annual Report 2021 QNB Annual Report 2021 — 51
Group overv
iewFinancial statem
entsSustainability
Corporate governance
Risk
Operational perform
anceStrategic report
We carefully manage credit risk across the Group through a comprehensive and rigorous governance oversight, while maximising our risk-adjusted returns.
Credit risk
Adapting to the post-pandemic environment Following the unprecedented stress that the pandemic caused globally to the economy, we concentrated our efforts to mitigate the impact this may have had on our portfolio across our network. As a result of the rigorous controls we have previously put in place to manage our credit risk, our high-quality diversified portfolio and proactive measures taken throughout the year, we maintained our NPL ratio at 2.3%.
The impact of COVID-19 is now starting to subside, with Qatar well placed to move into the post-pandemic world. Qatar vaccination rates are amongst the highest in the world, with 87% of the total population fully vaccinated and a booster programme already underway. The easing of COVID-19 conditions and tailwinds from the end of the GCC blockade have created the conditions for economic recovery and GDP growth, allowing the Government to gradually start to unwind the support measures.
In Turkey and Egypt, our business benefitted from regulatory incentives such as relaxations of loan classification criteria, government guarantees and temporary easing of CAR calculations. Obligors were also offered loan and repayment postponement schemes which enabled businesses to weather the impact of the pandemic. Notwithstanding these measures, QNB subsidiaries continued to allocate prudent provisions for the postponed facilities. Decreasing infection and hospitalisation rates from COVID-19 enabled regulators to gradually start to unwind these measures during the second half of 2021.
Credit risk managementQNB employs a framework of models, policies and procedures to assess, manage and monitor credit risk. We ensure the strict segregation of duties between front-line transaction originators and the credit risk function as reviewers and approvers. The credit risk function provides independent credit risk opinions to the Group Credit Committee. Our credit exposure limits are approved within a set credit approval and authority framework.
Policies and procedures for the approval and review of credit facilities are robustly applied and updated regularly. The Bank has an integrated process covering credit initiation, rating validation, analytics, approvals, credit administration, documentation, model risk validation controls, collateral management and limits monitoring at multiple levels.
The Bank’s credit policy includes restrictions and prohibitions on lending to several sectors, such as alcohol or gambling. Lending to the real estate sector is subject to tight internal lending criteria and QCB regulations, including high collateral coverage requirements for commercial properties and restricted salary multiples for residential mortgages. In addition to regulatory exposure limits, the Bank imposes its own internal limits on obligor groups and individual obligors, reinforced by portfolio limits, which are categorised in terms of sector, country and rating buckets. Furthermore, many of the largest exposures benefit from the State of Qatar’s Government guarantees and support, with the majority (by value) of real estate projects funded by the Bank being Government infrastructure segment-related projects.
Wholesale borrowers are assessed through a combination of expert judgement, experience and analysis together with the use of credit models. Credit applications pass through multiple levels of review and validation. Following the integration of sustainability requirements within our Wholesale Credit Policy, we this year have further integrated ESG criteria as part of our due diligence assessment into the existing credit risk management framework. We have done this through the group-wide roll-out of the Environmental and Social Risk Management (ESRM) Framework. Our ESRM enables the Bank to proactively identify, assess and manage exposure to environmental and social (E&S) risks. Our ESRM clearly articulates exclusions, sectors deemed high risk, prohibited activities and risk categorisation. This overarching group-wide ESRM Framework is supported by ESRM policies in our major subsidiaries to cater to local specificities. These initiatives contributed to QNB’s award for Outstanding Sustainable Finance in Emerging Markets in Global Finance’s inaugural 2021 Sustainable Finance Awards.
QNB places significant importance on the development of Qatari talent, which now accounts for more than 40% of Group Credit employees. We aim to ensure that our future Qatari leaders benefit from the Continuous Professional Development Programme. This programme consists of a balanced combination of on the job training, short and medium-term rotation plans with other divisions, product-
NPL ratio (%)
2.3%
2.1%
1.9%
2021
2020
2019
specific training, and formal development and training programmes, including external training courses for professional accreditation.
International credit governance and regulationComplementing our credit risk functions in Head Office and our subsidiaries, we also have local credit risk teams of varying sizes in our international branches. In addition to complying with local country regulations, the international branch credit teams have reporting lines into the Head Office function and are managed as an extension of the centralised credit team. Credit governance is further strengthened by our close collaboration with Strategic Risk Management to set, monitor, and evolve our risk acceptance criteria across our markets and in line with both Group and individual branch strategies.
While Head Office continues to perform regular oversight, decision, review and credit audit functions, we have delegated authority to our subsidiaries whose strong asset quality reflects the strength of our underwriting standards. To further harmonise our processes, standards and disciplined, high-performance culture, we have continued with our strategy of placing Head Office credit team members into key positions across the international network. The establishment of our single point of contact for all credit-related internal audit recommendations has
served us well. Through this, we are able to ensure that audit items are successfully implemented, and that best practices are applied across the network. Elsewhere, to ensure appropriate risk ratings and requisite provisions across our network, we reviewed and benchmarked international branches’ local regulatory requirements and IFRS 9 standards on impairments and write-offs against those in Qatar. Meanwhile, following guidance from QCB and in line with the Basel framework for measuring and controlling large exposures, we maintain tight controls and monitoring for financial institutions and subsidiaries to ensure effective, ongoing compliance in this area.
Looking aheadOur preparedness and remote working contingency protocols were thoroughly validated in the harshest of circumstances throughout the pandemic. Nevertheless, we are far from complacent about the risks of a resurgence of COVID-19 through new variants or through vaccinations losing efficacy over time. QNB’s 2022 focus will be on ensuring that our customers are well placed to continue their recovery from pandemic-related restrictions.
We also plan to further embed ESRM considerations, evaluations and reporting into our credit culture, further developing our lending decision making.
We aim to ensure that our Qatari future leaders benefit from a Continuous Professional Development Programme.

52 — QNB Annual Report 2021 QNB Annual Report 2021 — 53
Group overv
iewFinancial statem
entsSustainability
Corporate governance
Risk
Operational perform
anceStrategic report
Operational resilience and a robust framework reflect the growing sophistication and reach of our operational risk function.
Operational Risk
QNB Group benefits from a solid and effective operational risk management framework that is interconnected, interdependent and embedded within the organisation. As we continue to grow in size across an ever more complex and expanding regulatory landscape, our operational risk approach and framework must reflect the increasing sophistication of the business and operating environment.
The operational risk function’s mandate is to act as a second line of defence to incubate, establish and fortify a solid operational risk management approach, standards and culture. This ensures that the Bank and its stakeholders are protected by:
> maintaining a set of fundamental standards for operational risk management across QNB, leading to the avoidance of unexpected and catastrophic losses and the minimisation of expected losses;
> ensuring consistency with relevant best practices and compliance with regulatory (quantitative and qualitative) requirements;
> pursuing business objectives in a risk-controlled manner; and
> promoting Group-wide operational risk awareness and management culture, further contributing to process efficiency and efficacy.
As the Bank continued to cement its international footprint in 2021, we ensured all our overseas branches, subsidiaries, and affiliates were fully integrated and aligned to our operational risk framework. Meanwhile, we expanded and refreshed our in-branch risk and control self-assessment protocols to identify and prioritise issues and enhance the control environment.
Operational risk governance is discussed at our regular Operational Risk Committee meetings, where all seven principal operational risks are routinely analysed, and day-to-day issues are resolved.
Operational resilienceIn 2021, we accelerated our drive to achieve operational resilience, a topic of increasing importance to international bodies and regulatory entities worldwide.
Operational resilience builds on the principles of business continuity and disaster recovery, but extends it much further. It aims to enhance the Bank’s ability to protect and sustain our business in the face of regulatory changes, disruptive technology, complex infrastructure, and evolving market demands.
In recent years, the growth of technology-related threats has increased the importance of operational resilience in the banking sector. The COVID-19 pandemic has made the need to address these threats even more pressing.
We have a robust framework and tools to continually identify external and internal threats and potential failures in people, processes, and systems. QNB has the capabilities to promptly assess the vulnerabilities of critical operations and manage the resulting risks. For example, in the past two years, we have worked with the Prudential Regulation Authority (PRA), the Financial Conduct Authority (FCA), the Bank of England, and others as we seek to comply with the UK Operational requirements of the Resilience Consultancy Paper.
Becoming fully resilient requires more than simply continuing to perform the existing risk management practices. We therefore are constantly challenging ourselves to stay abreast of market requirements and have developed detailed action plans to align our approach further. This reflects our role as a leading, responsible financial institution committed to best practice at every level.
Third-Party Risk Management and SustainabilityOur Third-Party Risk Management (TPRM) framework is used to systematically identify, assess, mitigate, control, and monitor third-party risks. We seek to promote a consistent risk culture by supporting the different business and support divisions in their decision-making process.
The TPRM framework was designed and developed with clearly defined policies, roles and responsibilities, procedures, systems, resources and to support our Third-Party Risk objectives. Engagements are assessed against seven key Risk dimensions: Resilience & Continuity, Financials, Information Security, Data Privacy, Compliance & Litigation, Strategy, and Sustainability. These risk dimensions are of material importance in evaluating, reviewing, monitoring, and mitigating the Bank’s risk exposure, especially concerning the interconnected nature of the risks and their significance to critical business services.
The TPRM process is facilitated by three key assessment stages: pre-assessment, Tier 1 and Tier 2. Each stage is designed to be progressively deeper in its analysis of an individual third party engagement, allowing QNB to manage and mitigate risk. The first stage in the process is a high level scoping of activity that identifies which risks exist and determines if the engagement is material enough to warrant further review. The second stage quantifies the inherent risk exposure to the Bank of the individual engagement. If the quantified risk meets the requirement for further analysis (i.e. rated High or Medium-High), then the third stage, a detailed ‘controls assessment’ process, is completed by the third party and reviewed by QNB as the final step.
We believe in a responsible and sustainable approach to doing business. That is why in 2021, we finalised our Third-Party Supplier Code of Conduct and published it on the Bank’s website. The code was developed as part of our commitment to sustainability, enhancing our due diligence in our supply chain to promote environmental, social and governance-related topics. We expect all our suppliers to meet or go beyond the code of conduct requirements and demand the same of those with whom they work. As part of this ongoing commitment, Vendor Worker Welfare Self-Assessment (VWWS) were also conducted across our supply chain this year to ensure compliance.
Card and Merchant RiskThe lasting effects of the pandemic fuelled a surge in digital transactions, prompting more businesses to shift their operations online. As a result, an increasing number of transactions are processed without a physical card, increasing the risk of fraud.
We closely monitor card risk, and, in the event of any possible fraud, we take immediate corrective action to protect our customers and secure any potential loss.
As an increasing number of Qatari firms now accept online payments, we established a set of fundamental Risk Management controls and guidelines to ensure best practice. These include guidance to evaluate merchant risk to ensure applicants meet strict requirements. Meanwhile, we will continue to build a successful Payment Facilitator sponsorship programme to support the safety and security of our payment system.
As a result of increased vigilance measures around online transactions, we reduced card fraud losses by almost 40% on last year.
2022 FIFA World Cup™ The FIFA World Cup 2022™ to be held next year will present QNB with unique business opportunities, but at the same time, has the potential for increased risk. As well as being the sole provider of ATM cash machines in the stadiums, we are involved in a range of projects that include apps and contactless payment solutions. Data privacy and protection, as well as robust security standards will be essential to the success of this project. This year, we continued a detailed review of all products, services, processes, staff, infrastructure, technology, and third-party engagements impacted by the event. This review will enable us to strengthen our operational resilience accordingly to mitigate issues such as volume and capacity surges, disruption, incidents, and attacks.
The programme comprises three high-level phases: Impacted Activity Identification; Analysis and Risks, Assumptions, Issues, and Dependencies Log; and Oversight and Tracking.
“We have a robust framework and tools to continually identify external and internal threats and potential failures in people, processes, and systems.”
We have classified our seven principal operational risks as:
External fraudtheft of information, hacking damage, third-party theft and forgery
1
Employment practices and workplace safetydiscrimination, workers’ compensation and employee health and safety
6
Clients, products and business practicemarket manipulation, antitrust, improper trade, product defects, fiduciary breaches and account churning
7
Internal fraudmisappropriation of assets, tax evasion, intentional mismarking of positions and bribery
2
Business disruption and system failuresutility disruptions, software failures and hardware failures
3
Damage to physical assetsnatural disasters,terrorism and vandalism
4
Execution, delivery and process managementdata entry errors, accounting errors, failedmandatory reporting and negligent loss of client assets
5

54 — QNB Annual Report 2021 QNB Annual Report 2021 — 55
Group overv
iewFinancial statem
entsSustainability
Corporate governance
Risk
Operational perform
anceStrategic report
Cybersecurity governance and strategyThe banking sector is a high profile target for cybercriminals, where threats and attacks are more frequent and sophisticated than ever. Globally, cyber threat levels have increased since the outbreak of the COVID-19 pandemic, due to increased remote working and digitisation of products and services.
As banking continues to become increasingly digital, the wealth of new payment technologies and platforms, including open banking, have triggered rapid growth in the number of connected devices. As a result, cybersecurity is a significant threat and remains one of our top concerns. For this reason, QNB has a dedicated governance framework in place to elevate this topic up to the C-suite and Board level.
In order to ensure that our cybersecurity strategy remains agile, while simultaneously balancing risk appetite, security and user convenience, we have a Group Cybersecurity Committee (GCSC), chaired by the GCEO. The Group Chief Information Security Officer provides regular updates on the cybersecurity programme, presents key risks, and makes recommendations when a change in direction or critical decisions are required. Through the GCSC, we define and monitor the implementation of our IT security and cybersecurity governance and framework, including strategy, policies, controls, capabilities, budget, skills, and roles and responsibilities across the Group.
As a leading financial institution, QNB Group maintains a robust cybersecurity strategy and its execution continues to be a key area of focus. Meanwhile, we worked closely with Gartner, which specialises in global cybersecurity, to develop our strategy. QNB is now one of 50 global corporations to be part of Gartner’s influential research board.
We place the highest priority on continuous enhancements of the three pillars of our IT security remit: systems, processes and people to safeguard our data. Each of these pillars needs to be resilient and continually strengthened to support and protect the Bank.
Improvements in our cybersecurity systemsWe are committed to investing in a world-class security system and the best protection available on the market. We deploy the latest technological platforms to support the proactive detection and prevention of malicious activities and malware attacks. Additionally, we continuously assess the security of our network devices and firewalls to check for vulnerabilities. Our focus this year has been to mature these systems, testing and refining the technology we deploy across the Bank.
We also continued our investment in both detection and preventive controls by enhancing our intrusion and malware
recognition capabilities. We conducted extensive Blue Team/Red Team exercises and stress-tested our ability to safeguard critical assets using first-hand knowledge of cyberattacks. We simulate the tactics, techniques and procedures of a real-world targeted attack, without the negative consequences, significantly improving the effectiveness of our information security programme. The Bank utilises the Council of Registered Ethical Security Testers (CREST), who are certified vendors to conduct penetration testing on all internet facing websites and mobile applications, at least twice a year and upon every major system release.
Enhancing our cybersecurity processesWhile much of our attention is directed to external threats, we recognise it is equally essential to ensure our internal protection processes are just as rigorous. To that end, we also enhanced vulnerability scanning in our internal environment.
The Bank’s information technology, information security, and data security capabilities are regularly audited by a specialist team from the independent internal audit division.
This team conducts several comprehensive annual risk-based audits that include a review of related policies and procedures. The results are reported to the Bank’s independent Group Board Audit and Compliance Committee (GBACC), and the reports are also shared with Executive Management and Group Cybersecurity Committee members. The internal audit division follows up any recommendations made in the reports through to resolution.
QNB maintains an ISO 27001 certification, an independently certified methodology used to operate, monitor and improve the information security management system (ISMS) in the Bank.
Strengthening our cybersecurity cultureTo strengthen our cybersecurity culture, we are constantly investing in training and awareness programmes. As part of this approach, the training and awareness programme covers the entire employee base, and details a range of issues from Denial of Service (DoS) attacks to phishing and social engineering attempts.
Additionally, all of our Information Security policies are available to all staff through our intranet portal.
Looking aheadIn 2022, we will continue to introduce additional capabilities around our three IT security pillars. To further safeguard our data, we will continue to execute upon our strategy and ensure the necessary investments to cope with any upcoming cyber threats.
Cybersecurity is an integral part of our enterprise risk management framework.
Cybersecurity
We deploy the latest technological platforms to support the proactive detection and prevention of malicious activities and malware attacks.

56 — QNB Annual Report 2021 QNB Annual Report 2021 — 57
Financial statements
SustainabilityC
orporate governanceR
iskO
perational performance
Strategic reportG
roup overview
Corporate governance

58 — QNB Annual Report 2021 QNB Annual Report 2021 — 59
Financial statements
SustainabilityC
orporate governanceR
iskO
perational performance
Strategic reportG
roup overview
Corporate governance has an important role in promoting sustainable economic growth by building investor confidence and strengthening financial markets. At QNB Group, corporate governance is not simply an exercise in regulatory compliance, but a means to project robust implementation of sound governance practices.
We have a robust set of corporate governance measures across the Group that combine all aspects of internal control, risk and compliance. These help us successfully navigate the constantly changing regulatory landscape, allowing us to meet our customers’ expectations and deliver sustainable value to our stakeholders.
Corporate governance practices aim to promote overall transparency, explaining the rationale behind the decision-making processes and insights into the formation of the Board of Directors, their related committees, their powers and responsibilities, Executive Management and other key corporate governance components.
The Board of Directors (BOD) and Executive Management believe that corporate governance is an essential element to enhance shareholder confidence, specifically that of minority shareholders and stakeholders. By increasing the level of transparency of ownership and control, QNB enhances investors’ outlook about the Bank. In addition, the implementation of effective monitoring systems for governance and strategic business management further boosts investors’ trust.
A separate Corporate Governance Report is issued by QNB Group, as a supplement to the 2021 Annual Report, reflecting QNB Group’s efforts to comply with the supervisory and regulatory requirements issued by Qatar Central Bank (QCB), Qatar Financial Markets Authority (QFMA), the Commercial Companies Law and all relevant regulatory authorities across our operating footprint.
Board of Directors compositionAccording to QNB’s Articles of Association, ten (10) members of the BOD are elected or nominated for three years renewable for the same period. The major shareholder in QNB, which is the Government of Qatar, through the Qatar Investment Authority (QIA) (holding 50% equity stake), is entitled to appoint five (5) of these members while the other shareholders have the right to elect the remaining five (5) members. During the Annual General Assembly Meeting of February 2019, five elected Board members were appointed for a 3-year term from 2019 to early 2022. The BOD members shall elect its Chairman and Vice-Chairman among its members by a majority secret vote of the Board.
The Board’s roles and responsibilitiesThe Board of Directors has a vital role in overseeing the Bank’s management and business strategies to achieve long-term value creation. Selecting a well-qualified Group Chief Executive Officer (GCEO) to lead the Bank, monitoring and evaluating the GCEO’s performance, and overseeing the GCEO succession planning process are some of the most important functions of the Board.
The BOD is responsible for the leadership, oversight, control, development and long-term success of the Group. They are also responsible for instilling the appropriate culture, values and behaviour throughout the organisation as entrusted by the shareholders.
Tasks delegation and segregation of dutiesA balance between the roles and responsibilities of the BOD and executive management is achieved through the segregation of duties. The BOD provides overall strategic direction and oversight through the review and approval of major strategic initiatives, policies and objectives while day-to-day management of QNB Group is entrusted to the GCEO.
Corporate governance
QNB has a robust corporate governance framework in place to align with global governance standards, maintain regulatory compliance and formulate appropriate policies and controls. The framework relies upon the principles of responsibility, accountability, fairness and transparency to bolster the governance culture at all levels of organisation and business operation.
Board committees
As per corporate governance practices and regulatory requirements, the BOD of QNB Group has established committees to assist in carrying out its supervisory responsibilities.
Each BOD committee is assigned to handle part of the tasks of the BOD. The responsibilities of the BOD committees are duly documented in the terms of reference, which are approved by the BOD.
QNB Group BOD committees are as follows:
1. Group Board Executive Committee (GBEC)
2. Group Board Audit and Compliance Committee (GBACC)
3. Group Board Nomination, Remuneration, Governance and Policies Committee (GBNRGPC)
4. Group Board Risk Committee (GBRC)
Group Board Executive CommitteeH.E. Sheikh Hamad Bin Jabor Bin Jassim Al-Thani – Chairman of the Committee
Mr. Bader Abdulla Darwish Fakhroo – Member
Mr. Ali Hussain Ali Al-Sada – Member
Group Board Nomination, Remuneration, Governance and Policies CommitteeMr. Fahad Mohammed Fahad Buzwair – Chairman of the Committee
H.E. Sheikh Abdulrahman Bin Saud Bin Fahad Al-Thani – Member
H.E. Sheikh Hamad Bin Jaber Bin Jassem Al-Thani – Member
Group Board Audit and Compliance CommitteeH.E. Sheikh Fahad Bin Faisal Bin Thani Al-Thani – Chairman of the Committee*
Mr. Abdulrahman Mohammed Y Jolo – Member
Mr. Adil Hassan H A Al-Jufairi – Member
Group Board Risk CommitteeMr. Mansoor Ebrahim Al-Mahmoud – Chairman of the Committee
Mr. Bader Abdulla Darwish Fakhroo – Member
Mr. Ali Hussain Ali Al-Sada – Member
* In accordance with the Bank’s changed Board of Directors (BOD) composition, His Excellency Sheikh Fahad Bin Faisal Bin Thani Al Thani – Vice Chairman of the Board of Directors, and the Chairman of the Group’s Board Audit and Compliance Committee (GBACC) was appointed as the Acting Chairman of the Board of Directors (May 2021). His Excellency did not attend any (GBACC) meetings, as to avoid any conflict with the responsibilities, tasks and powers vested. After the appointment of the new Chairman, His Excellency resumed attending (GBACC) meetings.
We have a robust set of corporate governance measures across the Group that combine all aspects of internal control, risk and compliance.“Good corporate
governance embodies more than economic stability and regulatory compliance; it factors in social welfare and environmental sustainability as well.”
“QNB’s Board and Executive management believe in the necessity of instilling a governance culture as the only way for real governance implementation.”

60 — QNB Annual Report 2021 QNB Annual Report 2021 — 61
Financial statements
SustainabilityC
orporate governanceR
iskO
perational performance
Strategic reportG
roup overview
The Board delegates to the GCEO, and through the GCEO, to other Executive Management the authority and responsibility for operating the Bank’s daily business. BOD members exercise vigorous and diligent oversight of the Bank’s affairs, including key areas such as strategy and risk, but they do not manage or micromanage the Bank’s business by performing or duplicating the tasks of the GCEO and Executive Management team.
The Board has also adopted the Board Charter, which is reviewed annually and provides a framework on how the Board operates as well as the type of decisions to be taken by the Board and which decisions should be delegated to management with periodic reports submitted to the Board on the exercise of the delegated powers. The Board Charter can be found on QNB Group’s website and is also available in print to any shareholder upon request.
Group Board Executive Committee (GBEC) primary responsibilities:
> review and endorse Board approval of the long-term strategy, annual business plans and budgets of QNB Group based on economic and market conditions and Board of Directors’ directives;
> review and approve credit proposals as per the QNB Group approved authority matrix;
> review and approve QNB corporate social responsibility strategy in light of QNB brand values across the Group;
> review and consolidate marketing and communication plans and resource distribution plans to efficiently and effectively align them to support QNB business development and growth;
> review and consolidate business developments, products alignment, and resources distribution across QNB Group; and
> review and recommend the action to be taken on impaired loans in line with the delegated limits and authorities as approved by the BOD and in line with QCB regulations.
Group Board Nomination, Remuneration, Governance and Policies Committee (GBNRGPC) primary responsibilities:> identify and assess eligible and qualified candidates for
the BOD and Executive Management positions according to the fit-and-proper criteria set by the committee in addition to the independent/non-executive requirements;
> monitor the induction, training and continuous professional development of Directors pertaining to corporate governance matters;
> approve and review the Group’s remuneration and incentives guidelines and ensure that the remuneration of the Board of Directors and Executive Management is in line with the criteria and limits set forth by QCB and Commercial Companies Law;
> direct and oversee the preparation and update of the Corporate Governance Manual in collaboration with the Executive Management and GBACC; and
> inform the Board of Directors of key sustainability-related risks and opportunities. At a minimum, the Board receives an annual update on the overall execution of the Group sustainability strategy and performance.
Group Board Risk Committee (GBRC) primary responsibilities:
> review and endorse the Board’s approval of the risk management strategy of the Group as well as Group risk appetite and portfolio strategies recommended by the GMRC and review any changes in risk strategy/risk appetite arising;
> approve risk frameworks, policies and control structures in accordance with the approved strategy and oversee implementation of policies pertaining to the Bank’s internal control system;
> evaluate the monitoring process made by GMRC on Group entities in the identification of operational, credit, market, strategic, legal and reputational risks and action plans implemented to monitor and manage these risks;
> ensure that there is no material impact/risk identified by GMRC related to anti-money laundering and terrorist financing as well as the “know your customer” (KYC) requirements; and
> review any breaches of risk limits or internal control failures (if any) and review investigation results performed by GMRC.
Group Board Audit and Compliance Committee (GBACC) primary responsibilities:> review and endorse the annual financial statements and consider whether they are complete, consistent and reflect appropriate accounting standards and principles before submission to the BOD for final approval;
> review with management and the external auditors all matters required to be communicated or disclosed under generally accepted auditing standards or regulatory requirements;
> consider with internal and external auditors any fraud, illegal acts or deficiencies in internal control or other similar areas;
> review with Group Compliance and external auditors any fines imposed by the regulators and/or other bodies;
> appoint or remove the Group Chief Audit Executive;
“During 2021, QNB demonstrated a strong commitment to the highest standards of disclosure and transparency as a cornerstone of good corporate governance.”
> review and approve the charter, plans, activities, staffing and organisational structure of the Group Internal Audit Division;
> ensure there are no unjustified restrictions or limitations on the functioning of Group Internal Audit, as well as on internal audit’s access to the Group’s records, documents, personnel as and when required in performance of their functions;
> review the effectiveness of the internal audit function, including compliance with The Institute of Internal Auditors’ Standards for the Professional Practice of Internal Auditing and other applicable standards and best practices;
> appoint or remove the Group Chief Compliance Officer;
> ensure the efficiency of the compliance function in detecting the deviations and breaches within the Group, and ensure the non-existence of any factors that would impact its independence and objectivity as well as proper reporting of the compliance function with appropriate consideration to Basel Committee requirements and FATF (Financial Action Task Force) on money laundering recommendations;
> ensure there is an effective framework in place across the Group for managing and monitoring financial crime compliance-related risks, in line with regulatory requirements and international leading practices;
> evaluate the critical issues reports, submitted by Group Chief Compliance Officer and Group Chief Audit Executive, including those critical issues related to QNB Group subsidiaries; and
> review and confirm the independence of the external auditors by obtaining statements from the auditors on relationships between the auditors and the Group, including non-audit services.
Board meetingsIn 2021, the BOD held six meetings. According to QNB Group’s Articles of Association, the Board should hold at least six meetings during the year. The meetings are held regularly or when called for by the Chairman or by two Board members. The invitation for the Board meeting should be communicated to all members at least one week prior to the meeting. In this regard, any member can add a subject to the meeting’s agenda. The Group’s Articles of Association also provide detailed information on the attendance, quorum, voting and meeting requirements.
In line with QFMA requirements, QNB’s Articles of Association, article (28) states that an absent member may, by written request to the Chairman, delegate any other Board member to represent him/her in attendance and voting. A Board member cannot represent more than one member. The Board should periodically meet in order to ensure that it is adequately fulfilling its roles and responsibilities.
Corporate governancecontinued
Number of meetings Board GBRC GBACC GBEC GBNRGPC
1 12/01/2021 24/03/2021 12/01/2021 24/03/2021 24/03/2021
2 24/03/2021 24/05/2021 22/02/2021 24/05/2021 24/05/2021
3 24/05/2021 13/07/2021 11/04/2021 13/07/2021 13/07/2021
4 13/07/2021 14/09/2021 05/05/2021 14/09/2021 14/09/2021
5 14/09/2021 21/11/2021 11/07/2021 21/11/2021 21/11/2021
6 29/11/2021 - 31/08/2021 - -
7 - - 10/10/2021 - -
8 - - 15/11/2021 - -
Total 6 5 8 5 5
Good corporate governance embodies more than economic stability and regulatory compliance; it factors integrity, trust, transparency and accountability.

62 — QNB Annual Report 2021 QNB Annual Report 2021 — 63
Financial statements
SustainabilityC
orporate governanceR
iskO
perational performance
Strategic reportG
roup overview
Corporate governancecontinued
Board of Directors and Executive Management members’ remunerationThe remuneration system within the Group forms a key component of the governance and incentive structure through which the Board and Executive Management promote good performance, convey acceptable risk-taking behaviour and reinforce the Bank’s operating and risk culture.
Consequently, there is a separate “QNB Group Remuneration Policy for Board, Executive Management & Employees” that defines the mechanism whereby the remuneration is directly linked to the effort and performance at both department and employee levels including that of the Board, through the achievement of assigned goals and objectives in accordance with the profitability, risk assessment and the overall performance of the Group. This policy is applicable to the Chairman, Board members, Senior Executive Management and employees of QNB Group.
The BOD will follow regulatory guidelines and leading practices on compensation and remuneration. The Board, through its Group Board Nomination, Remuneration, Governance and Policies Committee (GBNRGPC) (by delegation), is responsible for the overall oversight of management’s implementation of the remuneration system for the entire Bank. The GBNRGPC regularly monitors and reviews outcomes to assess whether the Bank-wide remuneration system is creating the desired incentives for managing risk, capital and liquidity. The Board reviews the remuneration plans, processes and outcomes on an annual basis.
The remuneration policy for QNB BOD members is duly acknowledged to be in line with QCB instructions and QFMA requirements. The BOD will present at the annual general assembly meeting for approval, the remuneration/salaries, fees (if any), amounts received for technical or administrative work or other material advantages received for approval, in accordance with the Commercial Companies Law, QCB and QFMA instructions.
QNB Group’s adopted remuneration policy for the BOD in line with applicable laws and regulations, such as the Commercial Companies Law provisions, as well as the QCB circular related to the remuneration of the Board of Directors’ Chairman and members and QFMA requirements. The Group’s Articles of Association have established a framework for the Board members’ remuneration, which is far below the limits referred to in the Commercial Companies Law.
For 2021, the total BOD remuneration proposed (inclusive of all fees and allowances) is QR16.94 million divided as the following: QR2 million for the Chairman, QR1.5 million for each member and additionally QR120,000 for each BOD member for the respective committees that they are a member of. This remuneration is consistent with the provisions of Article 119 of Commercial Companies Law, Article 50 of QNB’s Article of Association and QCB circular 18/2014. Moreover, the remuneration amount is subject to QCB and 2022 General Assembly approvals.
Executive Management teamThe GCEO is aided by a seasoned and experienced Executive Management team. Five executives report directly to the GCEO:
> the Executive General Manager – Group Chief Business Officer (EGM – GCBO);
> the Executive General Manager – Group Chief Operating Officer (EGM – GCOO);
> the General Manager – Group Chief Risk Officer (GM – GCRO);
> the General Manager – Group Chief Financial Officer (GM – GCFO); and
> the General Manager – Group Chief Strategy Officer (GM – GCSO).
The Group Chief Compliance Officer and the Group Chief Audit Executive report directly to the Board through the GBACC.
GCEO and Executive Management remuneration
Elements In 2021
Executive Management total remuneration
To attract and retain key talent through competitive market compensation and rewarding ongoing contribution to role
Salaries and other benefits QR43.4 millionEnd of service indemnity benefits QR1.0 million
Performance-based remuneration
Top-down application of group-wide performance management
QNB employs the Balanced Scorecard approach to measure performance at Executive level (as well as at division, department and individual level). This consists of a set of KPIs across highlighted performance dimensions, with attributes specific to the Executive role. Common KPIs include those linked to Sustainability, Innovation, People matters, Compliance awareness, etc.
Executive Management Balanced Scorecard
Overall scorecard performance target
Balanced Scorecard performance dimensions
Financial Customer and Process Organisation
GCEO 100% 61% 21% 18%
GCBO 100% 65% 17% 18%
GCFO 100% 20% 62% 18%
GCOO 100% 20% 62% 18%
GCRO 100% 20% 62% 18%
GCSO 100% 8% 74% 18%
QNB Group organisation structure
International branches and rep. offices
Board of Directors
Group Chief Compliance
Officer
Group Chief Audit
Executive
Board Advisory
Board Secretariat
Chairman’s Office
Group Chief Risk Officer
Group Chief Financial Officer
GM Group Administration
and General Services
GM Group Operations
GM Group Information Technology
GM Group Communications
GM Group Human Capital
Group Chief Strategy Officer
GM Group Corporate and Institutional
Banking
GM Group Retail Banking
GM Group International
Business
GM Group Treasury
GM Group Asset and Wealth
Management
Group Board Nomination, Remuneration,
Governance and Policies
Committee
Group Board Audit and
Compliance Committee
Group Board Risk
Committee
Group Board Executive
Committee
EGM Group Chief Business
Officer
EGM Group Chief Operating
Officer
Group Chief Executive Officer

64 — QNB Annual Report 2021 QNB Annual Report 2021 — 65
Financial statements
SustainabilityC
orporate governanceR
iskO
perational performance
Strategic reportG
roup overview
Corporate governancecontinued
There are a number of management committees attended by Executive Management in order to effectively and efficiently handle the responsibilities and run the day-to-day activities of the Bank. Management committees are endowed with full executive powers to take decisions and actions related to their field, scope and structured hierarchy.
Currently, the management committees established at Head Office are structured as follows:
> Tier 1 ‘Executive Committees’, the ‘decision-making’ committees (which include ALCO, CPC, Credit, Cyber Security, Risk, Senior Management and Strategy) will report to the Board via the Board of Directors’ relevant committee;
> Tier 2 ‘Management Committees’, the ‘working committees’ (which include Business Development, IT, HR and Operations & Services) will report to the parent committee in Tier 1; and
> Senior Management Committee: chaired by the GCEO and represented by the five Chiefs (GCBO, GCOO, GCRO, GCFO and GCSO). The committee discusses the critical topics and strategic matters related to QNB Group activities; oversees and monitors the activities related to the operations management committees (Tier 2); decision-making/preparation of Board decisions by collecting facts from related committees and providing opinions; monitors the capital and operating expenditure budget assigned to IT projects and services; reviews yearly the information technology strategy across the Group; and monitors the performance related to QNB divisions, branches and subsidiaries.
QNB Group subsidiaries form their respective management committees according to their own needs, size and nature taking into consideration the corporate governance framework of QNB Group. For supervision and coordination purposes, those committees report and coordinate directly with the correspondent GM at QNB Group Head Office level.
The overseas branches form one or more committees to strengthen the control environment in the various processes and banking activities. Such committees depend on the volume of business and the country risk where QNB Group operates and are decided by QNB management. The overseas branch committees report the critical issues handled by them to the relevant QNB Head Office division.
Commitment to maintaining an effective corporate governance culture Good corporate governance embodies more than economic stability and regulatory compliance; it factors integrity, trust, transparency and accountability. Understanding this, QNB Group maintains a Corporate Governance and Compliance Framework that directs ethical behaviour by way of tone at the top and situates transparency and trust at the core of all of its dealings with investors, stakeholders and regulators. The Bank made further progress on its corporate governance framework throughout the year. The following sections illustrate the Bank’s key corporate governance enhancements during 2021.
Reinforced governance: Board of Directors’ independency assessmentThe success of QNB Group is highly dependent on the structure, actions, decisions and behaviour of the BOD. Ideally, a diverse Board would include both independent and non-independent Board members, all coming from different professional backgrounds who are qualified and experienced in their respective roles. Considering this, QNB conducted a comprehensive evaluation of Board member independency and conflict of interest in compliance with QCB and QFMA regulations in 2021. The evaluation, which is conducted annually, examined each Board member’s activities and position against the regulatory-set definition of independency, as to find-out whether the Bank fulfilled its regulatory obligations, and if QNB’s BOD has complied with the regulatory set standard. The independency assessment outcome assured that QNB Group’s Board fulfilled their stipulated criteria for independence.
Conducted an intensive Board self-assessment that assesses governance at the top QNB seeks to continuously improve and measure Board engagement and effectiveness throughout the year. The “annual Board self-assessment survey” is a key governance tool that provides the Board with a practical engagement opportunity to share any recommendations or considerations they may have on overall Board governance. Consequently, QNB reviews through this exercise the performance of the Board as a whole and as individual members, including the flow of information to the Board from Board committees and from management and examines committee actions and initiatives to increase the effectiveness of the Board.
During 2021, the Group’s Compliance Division coordinated efforts for this assessment exercise, reviewed all submitted Board member self-assessment surveys and conducted a thorough analysis. The findings were shared with the Board for retrospection and feedback.
The Board annual assessments gauge the operative nature of BOD engagement, composition, culture, and effectiveness and allow QNB to examine and determine whether its Directors are working together effectively and making sure that Board members have an avenue for discussing any issues and considerations. As such, the self-assessment process (at collective and individual levels) provides a much-needed contemplation into the dynamics of Board member interaction and the ways through which their interaction fulfils QNB’s strategic business goals.
Maintaining comprehensive Board documentationMaintaining an updated and unified Board-related documentation is a fundamental part of the Group’s commitment to defining the roles of Directors and the Board as a whole. Furthermore, the statement of the roles and responsibilities of BOD members through the Board Charter and policy works to deter conflicts from arising between Directors, and facilitates cooperation between them during decision-making.
Management committees membership structure (Tier 1 and Tier 2)l Chairman Vice Chairman ¨ Member ¡ Non-voting member t Secretary
Group M
anagement R
isk Com
mittee
Group C
redit Com
mittee
Group A
ssets and Liabilities Com
mittee
Group Strategy C
omm
ittee
Group In
formation Tech
nology Com
mittee
Group B
usiness Developm
ent Com
mittee
Group O
perations and Services Com
mittee
Group H
uman C
apital Com
mittee
Group C
ybersecurity Com
mittee
Centralised P
urchasing Com
mittee
Senior M
anagement C
omm
ittee
Management committee membership
GCEO l l l l l l l
EGM – GCBO ¨ ¨ ¨ l ¨ ¨ ¨
EGM – GCOO ¨ ¨ ¨ l l l ¨ ¨
GM – GCRO ¡ ¨ ¨ ¨ ¨ ¨
GM – GCFO ¨ ¨ ¨
GM – GCSO ¨ ¨ ¨ ¨ ¨ ¨ t
GM – Group Chief Compliance Officer ¡ ¡
GM – Group Chief Audit Executive ¡ ¡ ¡
GM – Group Asset and Wealth Management ¨ ¨
GM – Group Communications ¨
GM – Group Corporate and Institutional Banking ¨ ¨ ¨
GM – Group Administration and General Services ¨ ¨
GM – Group Human Capital
GM – Group Information Technology ¨
GM – Group International Business Division ¨ ¨ ¨ ¨ ¨
GM – Group Retail Banking ¨ ¨ ¨ ¨
GM – Group Treasury ¨ ¨
GM – Group Operations ¨
CEO – QNB Capital ¨
AGM – International Operations Affairs ¡
AGM – Treasury and Assets Operations ¡
AGM – Strategy and Business Development t
AGM – Domestic Corporate Banking ¨
AGM – Head of Group SME Credit ¨
AGM – Trading t
AGM – Group Credit ¨
AGM – HC Strategy and Integration ¨
AGM – HC Services ¨
AGM – Operations Control and Excellence t
AGM – Group Operational Risk ¨ ¡
AGM – Group Strategic Risk Management t
AGM – Central Operations ¡
AGM – IT Governance & Group Project Portfolio Management t t
Group Chief Information Security Officer t
Group General Counsel ¡
Senior Credit Officer t
Head of Infrastructure ¨
Head of Development and User Services ¨
Head of Global Cash Management t
Head of Tenders and Contracts Admin t
EM – International HR Integration t
Number of meetings held during 2021 4 43 12 4 4 10 4 4 4 * 12
* Due to business requirements, decisions by the CPC are taken through circulation and not through meetings, concerned department will choose one representative as a Non-voting Member.

66 — QNB Annual Report 2021 QNB Annual Report 2021 — 67
Financial statements
SustainabilityC
orporate governanceR
iskO
perational performance
Strategic reportG
roup overview
Since robust Board documentation is an essential component of good governance and QNB’s proper functioning, QNB on an ongoing basis reviews and updates Board documentation as may be required. Furthermore, stakeholders and shareholders are able to view the Board Charter on the QNB website. QNB Group is committed to forming an adaptive corporate governance structure that factors in QFMA’s, QCB’s and other leading requirements and practices on corporate governance.
Good governance measures at overseas entitiesQNB has established effective communication channels and governance oversight mechanisms with its overseas entities. The aim is to ensure alignment between Head Office’s corporate governance practices and that of the Bank’s overseas operations. The Group also maintains a set of corporate governance guidelines that assist international branches and subsidiaries in integrating QNB Head Office policies into their own framework. QNB’s governance strategy thus extends sound corporate governance practices downstream for overseas entities to follow, while keeping in mind and taking into account alignments with their own respective jurisdictional regulatory requirements.
In 2021, QNB assessed the implementation of these guidelines at its overseas branches and the findings served as useful pointers for QNB to enhance its oversight of overseas entities governance infrastructure. Oversight measures were set in place to help direct alignment efforts at QNB’s international network of branches and subsidiaries. QNB’s aim is to achieve appropriate governance
homogeneousness across the board, and maintain a proper chain of Group oversight across all levels of operation.
QNB representatives’ assessment to evaluate management and governance at group levelQNB Group (as the holding company) nominates representatives at the Board level of each QNB subsidiary and affiliate. This helps align interests, mitigates associated risks, promulgates seamless governance measures, protects QNB stakeholders including shareholders and creates an adequate setting for sustainable development across QNB Group’s international network. This also harmonises QNB Group’s strategic objectives and corporate governance culture with that of its subsidiaries and affiliates. These QNB representatives on subsidiary boards thus help maintain an optimal synergy between Head Office and subsidiaries to protect QNB’s interests and foster an adequate control environment.
QNB annually undertakes a performance assessment of Board representatives in QNB subsidiaries and affiliates. In collaboration with the required stakeholders, the Group’s Compliance Division facilitates this exercise by evaluating the performance of QNB representatives positioned across the subsidiaries and affiliates. Doing so allows QNB to view and analyse the representatives’ use of escalation channels, as to see whether they have sought out communication properly and timely. It also helps assess the implementation of directives, performance and deficiencies remediation. The Group-wide oversight framework established at subsidiaries enables them to report to QNB Qatar’s Board (as the parent company) through appropriate divisions.
Corporate governancecontinued
QNB Group’s corporate governance framework has several key pillars and an important one of them is disclosure and transparency.
Management committees are endowed with full executive powers to take decisions and actions related to their field, scope and structured hierarchy.
Managing conflict of interest and insider trading risksIt is essential for QNB to be able to identify actual and/or potential conflict of interest situations and manage them fairly and appropriately. In this context, Board members, Executive Management, employees and third-party vendors are obligated to raise or disclose potential conflicts of interest at QNB Group in line with the associated policy, so as to allow the Group to adequately address, identify and manage such conflicts.
The established “Conflict of Interest and Insider Dealing Policy” at QNB guides all employees and personnel from top management to entry-level employees, as they make every effort to meet their obligations to shareholders, clients, personnel and all stakeholders. The policy addresses potential conflicts of interest between QNB and its employees, contains prohibitions, restrictions and disclosure requirements to protect the Group’s reputation. It lays out the expectations that the Group has for each banking area and function and provides the information and the resources needed to conduct business ethically and in compliance with laws and regulations everywhere the Group operates. QNB expects relevant employees to participate in the requirements related to conflicts management, conflict of interest and insider training related topics. These are crucial steps to ensure employees are able to identify and escalate conflict of interest and related situations within the Group. This helps promote integrity across the Bank.
Furthered the culture of openness, disclosure and transparency QNB Group’s corporate governance framework has several key pillars and an important one is disclosure and transparency. The Bank believes in increasing shareholders trust within the institution and further elevating the quality of experience shareholders have when choosing QNB Group. Since a culture of openness and transparency
ensures that equality and justice are maintained among shareholders and more generally, all stakeholders. In accordance, QNB maintains the “Disclosure and Transparency Policy”, which sets guidelines around financial, strategic, governance and performance-related disclosures. The policy integrates principles from international best practice and local regulatory requirements to cultivate prosperous investor relationships.
Disclosure and transparency components also incorporate relevant environmental, social, and governance (ESG) information that investors and other stakeholders increasingly seek. Adhering to these standards will positively encourage more investors to consider adding well-governed companies to their investment portfolios.
During 2021, and in line with the policy, QNB Group used its digital platforms and website to disclose the Annual General Assembly Meeting results, the Bank’s financial performance in each Quarter, its ESG initiatives, and its Corporate Social Responsibility (CSR) activities along with multiple other facets that QNB accomplished during the year.
Safe environment for encouraging whistleblowing Whistleblowing is an important element of corporate governance, transparency and accountability. It helps organisations avoid serious risks that could threat the shareholders, customers, staff or even the organisation’s own reputation. QNB Group established the whistleblowing policy and related-channels, thereby encouraging employees to report wrongdoings or violations they are aware of or have suspicions or concerns about to a responsible and designated internal authority within QNB Group. The objective is to build a safe culture where employees feel that they can speak up when something is not right. This helps to minimise the Group’s exposure to reputational or financial damage, which may occur when employees circumvent internal mechanisms.

68 — QNB Annual Report 2021 QNB Annual Report 2021 — 69
Financial statements
SustainabilityC
orporate governanceR
iskO
perational performance
Strategic reportG
roup overview
Management assessment of internal control over financial reporting
GeneralThe Board of Directors of Qatar National Bank (Q.P.S.C.) and its consolidated subsidiaries (together “the Group”) is responsible for establishing and maintaining adequate internal control over financial reporting (ICOFR) as required by Qatar Financial Markets Authority (QFMA). Our internal control over financial reporting is a process designed to provide reasonable assurance regarding the reliability of financial reporting and the preparation of the Group’s consolidated financial statements for external reporting purposes in accordance with International Financial Reporting Standards (IFRS) and the applicable provisions of Qatar Central Bank Regulations. ICOFR also includes our disclosure controls and procedures designed to prevent misstatements.
Risks in financial reportingThe main risks in financial reporting are that either the consolidated financial statements are not presented fairly due to inadvertent or intentional errors or the publication of consolidated financial statements is not done on a timely basis. A lack of fair presentation arises when one or more financial statement accounts or disclosures contain misstatements (or omissions) that are material. Misstatements are deemed material if they could, individually or collectively, influence economic decisions that users make on the basis of the consolidated financial statements.
To confine those risks of financial reporting, the Group has established ICOFR with the aim of providing reasonable but not absolute assurance against material misstatements. We have also assessed the design, implementation and operating effectiveness of the Group’s ICOFR based on the criteria established in Internal Control Integrated Framework (2013) issued by the Committee of Sponsoring Organizations of the Treadway Commission (COSO). COSO recommends the establishment of specific objectives to facilitate the design and evaluate the adequacy of a control system. As a result, in establishing ICOFR, management has adopted the following financial statement objectives:
> Existence / occurrence - assets and liabilities exist and transactions have occurred;
> Completeness - all transactions are recorded, account balances are included in the consolidated financial statements;
> Valuation / measurement - assets, liabilities and transactions are recorded in the financial reports at the appropriate amounts;
> Rights and obligations and ownership - rights and obligations are appropriately recorded as assets and liabilities; and
> Presentation and disclosures - classification, disclosure and presentation of financial reporting is appropriate.
Organisation of the internal control system Functions involved in the system of internal control over financial reporting: Controls within the system of ICOFR are performed by all business and support functions with an involvement in reviewing the reliability of the books and records that underlie the consolidated financial statements. As a result, the operation of ICOFR involves staff based in various functions across the organisation.
Controls to minimise the risk of financial reporting misstatement: The system of ICOFR consists of a large number of internal controls and procedures aimed at minimising the risk of misstatement of the consolidated financial statements. Such controls are integrated into the operating process and include those which:
> are ongoing or permanent in nature such as supervision within written policies and procedures or segregation of duties;
> operate on a periodic basis such as those which are performed as part of the annual consolidated financial statement preparation process;
> are preventative or detective in nature;
> have a direct or indirect impact on the consolidated financial statements themselves. Controls which have an indirect effect on the consolidated financial statements include entity level controls and Information Technology general controls such as system access and deployment controls whereas a control with a direct impact could be, for example, a reconciliation which directly supports a balance sheet line item; and
> feature automated and/or manual components. Automated controls are control functions embedded within system processes such as application enforced segregation of duty controls and interface checks over the completeness and accuracy of inputs. Manual internal controls are those operated by an individual or group of individuals such as authorization of transactions.
Measuring design, implementation and operating effectiveness of internal control:
For the financial year 2021, the Group has undertaken a formal evaluation of the adequacy of the design, implementation and operating effectiveness of the system
of ICOFR considering:> the risk of misstatement of the consolidated financial statement line items, considering such factors as materiality and the susceptibility of the financial statement item to misstatement; and
> the susceptibility of identified controls to failure, considering such factors as the degree of automation, complexity, and risk of management override, competence of personnel and the level of judgment required.
These factors, in aggregate, determine the nature, timing and extent of evidence that management requires in order to assess whether the design, implementation and operating effectiveness of the system of ICOFR is effective. The evidence itself is generated from procedures integrated within the daily responsibilities of staff or from procedures implemented specifically for purposes of the ICOFR evaluation. Information from other sources also form an important component of the evaluation since such evidence may either bring additional control issues to the attention of management or may corroborate findings.
The evaluation has included an assessment of the design, implementation, and operating effectiveness of controls within various processes including Treasury, Lending and Credit Risk Management, Human Resources
and Payroll, General Ledger and Financial Reporting. The evaluation also included an assessment of the design, implementation, and operating effectiveness of Entity Level Controls, Information Technology General Controls, and Disclosure Controls. As a result of the assessment of the design, implementation, and operating effectiveness of ICOFR, management did not identify any material weaknesses and concluded that ICOFR is appropriately designed, implemented, and operated effectively as of 31 December 2021.
Manual internal controls are those operated by an individual or group of individuals such as authorization of transactions.
“Automated controls are control functions embedded within system processes such as application enforced segregation of duty controls and interface checks over the completeness and accuracy of inputs.”

70 — QNB Annual Report 2021 QNB Annual Report 2021 — 71
Financial statements
SustainabilityC
orporate governanceR
iskO
perational performance
Strategic reportG
roup overview
Independent reasonable assurance report to the shareholders of Qatar National Bank (Q.P.S.C.)
Report on internal controls over financial reporting In accordance with Article 24 of the Corporate Governance Code for Companies and Legal Entities Listed on the Main Market (“the Code”) issued by the Qatar Financial Markets Authority (QFMA), we were engaged by the Board of Directors of Qatar National Bank (Q.P.S.C.) (“the Bank”) and its subsidiaries (together referred to as ”the Group”) to carry out a reasonable assurance engagement over Board of Directors’ description of the processes and internal controls and assessment of the suitability of the design, internal controls over financial reporti implementation and operating effectiveness of the Group’s (ICOFR) as at 31 December 2021 (the “Statement”).
Responsibilities of the Board of Directors The Board of Directors are responsible for fairly stating that the Statement is free from material misstatement and for the information contained therein.
The Statement, which was signed by the Group CEO and shared with KPMG on 11 January 2022 and is to be included in the annual report of the Group, includes the following:
> the Board of Directors’ assessment of the suitability of design, implementation and operating effectiveness of the ICOFR;
> the description of the process and internal controls over financial reporting for the processes of lending and credit risk management, treasury, tender, general ledger and financial reporting, information technology, entity level controls, disclosure controls, and human resources;
> designing, implementing and testing controls to achieve the stated control objectives;
> identification of control gaps and failures, how they are remediated, and procedures set to prevent such failures or to close control gaps; and
> planning and performance of the management’s testing, and identification of the control deficiencies.
The Board of Directors is responsible for establishing and maintaining internal controls over financial reporting based on the criteria established in Internal Control – Integrated Framework (2013), issued by the Committee of Sponsoring Organizations of the Treadway Commission (“COSO” or “COSO Framework”).
This responsibility includes designing, implementing, maintaining and testing internal control relevant to the preparation and fair presentation of the Statement that is free from material misstatement, whether due to fraud or error. It also includes developing the control objectives in line with the COSO Framework; designing, implementing and testing controls to achieve the stated control objectives;
selecting and applying policies, making judgments and estimates that are reasonable in the circumstances, and maintaining adequate records in relation to the appropriateness of the Group’s ICOFR.
The Board of Directors is responsible for ensuring that management and staff involved with the preparation of the Statement are properly trained, systems are properly updated and that any changes in reporting encompass all significant business units.
The Board of Directors is also responsible for compliance with all applicable laws and regulations applicable to its activities.
Our responsibilities Our responsibility is to examine the Statement prepared by the Group and to issue a report thereon including an independent reasonable assurance conclusion based on the evidence obtained. We conducted our engagement in accordance with International Standard on Assurance Engagements (ISAE) 3000, Assurance Engagements Other Than Audits or Reviews of Historical Financial Information issued by the International Auditing and Assurance Standards Board, which requires that we plan and perform our procedures to obtain reasonable assurance about whether the Statement is fairly presented, in all material respects, in accordance with the control objectives set out therein.
We apply International Standard on Quality Control 1 and accordingly maintain a comprehensive system of quality control including documented policies and procedures regarding compliance with ethical requirements, professional standards and applicable legal and regulatory requirements.
We have complied with the independence and other ethical requirements of the International Ethics Standards Board for Accountants’ International Code of Ethics for Professional Accountants (including International Independence Standards) (IESBA Code), which is founded on fundamental principles of integrity, objectivity, professional competence and due care, confidentiality and professional behaviour.
The procedures selected depend on our judgment, including the assessment of the risks of material misstatement of the Statement whether due to fraud or error.
Our engagement included assessing the appropriateness of the Group’s ICOFR, and the suitability of the control objectives set out by the Group in preparing and presenting the Statement in the circumstances of the engagement. Furthermore, evaluating the overall presentation of the Statement, and whether the internal controls over financial reporting are suitably designed and implemented and are operating effectively as of 31 December 2021 based on the COSO Framework.
The procedures performed over the Statement include, but are not limited to, the following:
> conducted inquiries with management of the Group to gain an understanding of the risk assessment and scoping exercise conducted by management;
> examined the in-scope areas using materiality at the Group’s consolidated financial statement level;
> assessed the adequacy of the following:
> process level control documentation and related risks and controls as summarized in the Risk & Control Matrix (RCM);
> entity level controls documentation and related risks and controls as summarized in the RCM;
> Information Technology risks and controls as summarized in the RCM; and
> disclosure controls as summarized in the RCM.
> obtained an understanding of the methodology adopted by management for internal control design and implementation testing;
> inspected the walkthrough and design and implementation testing completed by management and conducted independent walkthrough testing, on a sample basis, as deemed necessary;
> assessed the significance of any internal control weaknesses identified by management;
> assessed the significance of any additional gaps identified through the procedures performed;
> examined the management plans for testing the operating effectiveness to evaluate the reasonableness of tests with respect to the nature, extent and timing thereof, and whether the testing responsibilities have been appropriately assigned;
> examined the management’s testing documents to assess whether the operating effectiveness testing of key controls has been performed by the management in accordance with the management testing plan; and
> re-performed tests on key controls to gain comfort on the management testing of operating effectiveness.
We have made such enquiries of the auditors of significant components within the Group concerned and have reviewed their work to the extent necessary to form our conclusion. We remain solely responsible for our conclusion.
Other information The other information comprises the information to be included the Group’s annual report which are expected to be made available to us after the date of this report. The Statement and our reasonable assurance report thereon will be included in the annual report. When we read the annual report if we conclude that there is a material misstatement therein, we are required to communicate the matter to the Board of Directors.
Characteristics and limitations of the Statement The Group’s internal controls over financial reporting, because of their nature, may not prevent or detect all errors or omissions in processing or reporting transactions and
consequently cannot provide absolute assurance that the control objectives will be met.
Historic evaluation of design, implementation and operating effectiveness of an internal control system may not be relevant to future periods if there is a change in conditions or that the degree of compliance with policies and procedures may deteriorate.
The Statement is prepared to meet the common needs of a broad range of users and may not, therefore, include every aspect of the information that each individual user may consider important in its own particular environment.
Criteria The criteria for this engagement are the control objectives set out therein against which the design, implementation and operating effectiveness of the controls is measured or evaluated. The control objectives have been internally developed by the Group, based on the criteria established in the COSO Framework.
ConclusionsOur conclusion has been formed on the basis of, and is subject to, the matters outlined in this report.
We believe that the evidence we have obtained is sufficient and appropriate to provide a basis for our conclusion.
In our opinion, based on the results of our reasonable assurance procedures, the Board of Directors’ Statement fairly presents that the Group’s ICOFR were properly designed and implemented and are operating effectively in accordance with the COSO framework as at 31 December 2021.
Restriction of use of our reportOur report should not be regarded as suitable to be used or relied on by any party wishing to acquire rights against us other than the shareholders of the Bank and QFMA for any purpose or in any context. Any party other than the shareholders of the Bank and QFMA who obtains access to our report or a copy thereof and chooses to rely on our report (or any part thereof) will do so at its own risk. To the fullest extent permitted by law, we accept or assume no responsibility and deny any liability to any party other than the shareholders of the Bank and QFMA for our work, for this independent reasonable assurance report, or for the conclusions we have reached.
Our report is released to the shareholders of the Bank and QFMA on the basis that it shall not be copied, referred to or disclosed, in whole (save for the Bank’s own internal purposes) or in part, without our prior written consent.
13 January 2022DohaState of Qatar
Gopal BalasubramaniamKPMG Auditor’s Registration No. 251Licensed by QFMA: ExternalAuditor’s License No. 120153

72 — QNB Annual Report 2021 QNB Annual Report 2021 — 73
Financial statements
SustainabilityC
orporate governanceR
iskO
perational performance
Strategic reportG
roup overview
Tone at the topThe Board and Executive Management set the tone at the top to direct proper ethical conduct across the Bank. In this regard, QNB’s Executive Management directs the Bank’s employees to let them know their roles, responsibilities, objectives and limits within the Group. Being committed to morality and ethical actions embodies more rather than just complying with rules and guidelines. By having the Board of Directors and the Executive Management team adopt ethical moral principles, QNB Group employees get a look into the correct type of behaviour they should also embody. This also serves as an effective risk mitigation tool against fraud, corruption, embezzlement, bribery, insider dealing, conflict of interest, customer privacy violations, discrimination, harassment, violations of laws, misinterpretation of facts, etc.
During 2021, QNB Group updated a number of its policies and procedures, including, but not limited to, the following:
> Anti-Bribery and Corruption (ABC) Policy;
> Conflict of Interest and Insider Dealing Policy;
> Transparency and Disclosure Policy;
> AML and CFT Policy;
> Know Your Customer (KYC) Policy;
> Stakeholders’ Rights Policy;
> Fraud Control Policy;
> Data Protection Policy;
> Code of Conduct (Ethics);
> Internal Controls Policy;
> Outsourcing and Vendor Management Policy;
> Management Succession Policy;
> Chinese Walls Policy;
> Remuneration Policy;
> Internal Control Charter; and
> Whistleblowing Policy.
Employees received various training courses on the aforementioned policies during 2021, in an effort to strengthen the Group’s spirit of compliance, reaffirm employees’ commitments to the Group’s ethical standards and provide an overview of the preventions currently in place to curb unethical behaviour at QNB Group.
The spirit of compliance and ethical behaviourInstilling a strong compliance culture is a priority for both the Board of Directors and Executive Management. This is disseminated across QNB Group through various initiatives such as policies and procedures, circulars, staff training, awareness sessions, brochures, etc. A Code of Ethics and Conduct is also in place, which sets the expectations from all QNB Employees in terms of values and code of conduct of business. It also serves as a reference point when dealing with entities and personnel, especially colleagues, customers, suppliers and regulators. It is applicable to all staff at QNB and in subsidiaries where QNB has a controlling interest. The code covers requirements that the Bank employees should be aware of and comply within the conduct of their daily business activities.
Enriched framework and tools to strengthen the financial crime compliance structure QNB Group has an Anti-Money Laundering and Combating Terrorism Financing (AML/CTF) framework, which aims to combat financial crimes and related corruption in its many forms. Proper detection systems and controls are designed to detect, deter and report suspicious transactions flowing into the Bank’s system. The Bank uses the framework to verify the identity of QNB customers and conduct regular reviews of their accounts then make a report if any suspicious transactions were made using a QNB account.
As per the Financial Action Task Force’s (FATF) Recommendation 18 for implementing group-wide programmes against money laundering and terrorist financing, QNB conducted financial crime compliance reviews to monitor the implementation of AML/CTF controls in overseas branches. The objective of the reviews was to ensure that QNB Group has a coordinated approach to financial crime compliance. Due to the COVID-19 pandemic restrictions, these reviews were held off-site.
In line with QCB instructions and as part of digitising the onboarding of customers, QNB is working on implementing an E-KYC solution for the Bank. This will ensure a hassle-free onboarding process and ongoing authentication of existing customers by optimising the identity and verification process.
Against a backdrop of rapid regulatory and technological change, QNB Group depends on its compliance strategy to further the Group’s position and build trusting relationships with its investors, regulators and stakeholders.
Group Compliance
Reinforced the Anti-Bribery and Corruption Framework with an assessment programme Establishing a culture of integrity, transparency and compliance is important to the success of any business. It is therefore crucial for QNB Group to conduct all operations in an honest and ethical manner. In accordance with this, QNB Group put in place an Anti-Bribery and Corruption (ABC) Framework, which is comprised of two mutually reinforcing principles, the Anti-Bribery & Corruption Policy, which governs ethical behaviour, and the Anti-Bribery & Corruption Assessment Programme, which aims to deter, detect, and prevent bribery and corrupt payments across the Group using a compliance structure.
QNB Group continued to develop the ABC programme during 2021 by adopting leading international practices and standards on anti-bribery and corruption, such as the U.S. Foreign Corrupt Practice Act (FCPA), the UK Bribery Act, FATF, the OECD Convention on Combating Bribery of Foreign Public Officials and the UN Convention Against Corruption.
The Board of Directors are responsible for approving and overseeing the implementation of the ABC programme, and the Executive Management Team ensures that the programme is cascaded down to all employees. Furthermore, all employees and personnel associated with QNB are equally responsible for the prevention, detection, and reporting of bribery and other forms of corruption.
Strengthened the sanctions compliance frameworkQNB’s robust Sanctions Compliance Programme is regularly enhanced to meet growing sanctions regulations and challenges without disrupting customer service or jeopardising QNB’s strong reputation on the market. An integrated Sanctions Compliance Programme effectively detects whether the Bank might enter into an area of elevated sanction risk and includes rigorous and cost-effective controls that satisfy the needs of both regulators and customers. This ensures we achieve full compliance with local regulations and
major global sanctions programmes imposed by the UN, EU, US, and UKHMT.
Technology has always been an essential pillar of a strong and sustainable Sanctions Compliance Programme. Therefore QNB is continuously assessing new sanctions systems to find out which one could help us be more efficient and effective in managing sanction risks. In 2021, we worked with one of the most reputable vendors around the globe to implement a tailored sanctions screening solution that helps prevent any potential sanction exposure to the business.
Enforcement of a robust fraud control frameworkQNB’s Fraud Control Unit, reporting under the Group Compliance Division, has a comprehensive fraud control framework, programme and investigative capabilities in place, indicating the commitment and expectations of the Board of Directors and Executive Management toward fraud risk management.
Compliance functions in the future must embrace innovative solutions to face the heightened risk and compliance challenges faced by businesses globally. Compliance will be powered by information and smart technologies (machine learning, artificial intelligence, big data, analytics) to make sense of complex patterns in data and foresee risks and compliance failures. Hence, it is a critical need for compliance functions to adapt and adopt the technological advancements in the industry. In that perspective, this year we set up an internal RegTech/Fintech Steering Committee to monitor, implement and oversee the Group’s compliance strategy in line with technological advancements in areas of compliance.
We are also progressing with the implementation of the Enterprise Fraud Management System, which will cover online banking transactions monitoring for QNB Qatar for the purposes of both fraud prevention and detection. Once rolled out, the Enterprise Anti-Fraud solution will strengthen the fraud framework through the process automation of fraud monitoring and prevention efforts.
Compliance functions in the future must embrace innovative solutions to face the heightened risk and compliance challenges faced by businesses globally.
“The tone at the top directs ethical conduct, promotes integrity and provides a stable backbone of support to help QNB Group accomplish its long-term goals.”

74 — QNB Annual Report 2021 QNB Annual Report 2021 — 75
Financial statements
SustainabilityC
orporate governanceR
iskO
perational performance
Strategic reportG
roup overview
Tax reporting: enabling transparent and effective tax information exchange across QNB GroupTax authorities have heightened their scrutiny on financial institutions, as tax transparency became an increasing focus area for companies and regulators alike. Banks have become an essential part of the global tax-reporting infrastructure. Therefore, QNB Group applies global initiatives to improve tax transparency and compliance requirements across the Group. QNB abides with global tax requirements set by the US Foreign Account Tax Compliance Act (FATCA), the OECD Standard for Automatic Exchange of Financial Account Information (also known as the Common Reporting Standard (CRS)), the EU Mandatory Disclosure Regime (MDR) and Directive for the Administrative Cooperation (DAC 6).
QNB Group intends to verify that our banking services are not associated with any arrangements known or suspected of facilitating tax evasion, while our Tax Compliance Unit validates that we have adequate measures that combat tax evasion. In 2021, we successfully conducted various reviews and remediation programmes on the Bank’s FATCA and CRS identification and due diligence processes. These activities were done to evaluate whether FACTA and CRS reporting was completed in line with the set regulatory authorities in Qatar and to applicable jurisdictions in overseas branches and subsidiaries, and that the reporting was accurate and duly submitted.
Enhancement of internal controls over financial reporting (ICOFR) processQNB Group has performed a comprehensive Management Assessment of its Internal Controls over Financial Reporting (ICOFR) for 2021. The Bank has also enhanced the internal controls over financial reporting assessment framework and methodology based on criteria set in Internal Control – Integrated Framework (2013) issued by the Committee of Sponsoring Organizations of the Treadway Commission (COSO). At QNB, Group Compliance Division is responsible for establishing a strong control environment over QNB’s financial reporting processes as per criteria set in the COSO Framework. The Bank is continuously working to improve and enhance the Bank’s dynamic internal controls system and procedures including internal controls over financial reporting, designed to ensure reliable financial record-keeping and transparent financial reporting and disclosure.
Global data protection and privacy programmeAt QNB, there is a strong commitment from the top to protect personal data, as it is fundamental in achieving our long-term vision. QNB has a Data Protection Team responsible for the overall data privacy activities and compliance with data protection regulations.
The data protection landscape affecting QNB’s network is constantly evolving as more regulators update their data protection laws. Broadly speaking, the majority of jurisdictions that QNB operate in impose their own data protection requirements. At a high level, they describe the scope, obligations and minimum standards to adhere to when processing personal data. During 2018, the General Data Protection Regulation (GDPR) came into force and elevated the minimum requirements significantly. As such, there is a greater onus on QNB to maintain data inventories, tighter privacy risk assessments and stricter obligations when processing data as a controller.
In 2021, QNB Group enhanced its data protection landscape by introducing ESG standards and ensuring privacy is incorporated into the framework, as well as implementing a standalone Data Protection Management System to manage key data privacy tasks. Moreover, the Group also incorporated a Data Protection Assurance Programme and Enterprise Health Check to the data protection landscape in an effort to integrate with best practices. These different programmes and initiatives have helped QNB maintain a strong data privacy and security framework, which in turn has helped us obtain top-tier ratings from ESG rating agencies.
Relationships with regulatorsAt QNB, the Group Compliance Division intermediates all communications between the Bank and the regulatory authorities, aiming to strengthen the Bank’s crucial relationship with the regulators. The Group’s compliance division helped obtain the necessary regulatory approvals from QCB, QFMA, QFCRA and any other relevant authorities for offering new products and services as well as the enhancement of the Bank’s existing products and services suite. The major types of interactions between the Bank and our regulators include the implementation of emergency measures to combat the proliferation of COVID-19, inquiries raised by the business, follow-up/feedback on new circulars and reporting of regulatory requirements, among others.
Enriched compliance monitoring and oversight The compliance self-assessment framework is based on the roles and responsibilities assigned to the Bank’s compliance division as per the QNB Group Board approved compliance charter. The main objective of the framework is to identify areas that pose the greatest compliance risk. It aims to systematically and periodically evaluate and document compliance risks and achievements of divisions, branches and subsidiaries. The framework ensures a proactive identification of compliance and non-compliance risks, potential areas of weaknesses or unsound practices. This undertaking helps QNB prioritise compliance risk assessments by assigning a proper rating to risk observed, mapping them to applicable risk owners and effectively allocating resources to perform risk-mitigating activities.
Compliance monitoring programme (CMP)The Compliance Monitoring Programme (CMP) aims to monitor compliance risks and develop a strong compliance culture, by holistically assessing where the key risks are, and what mitigating actions are undertaken. In this regard, the Bank has rolled out the enhanced CMP across its operations in order to monitor efficiently the Group’s compliance with applicable regulatory requirements. The compliance division monitors the suitability of the CMP and updates the framework, methodology and guidelines frequently to ensure they are adequate and in line with best practices.
Compliance training and awareness programmes to QNB employees QNB fosters an inclusive workplace environment where its staff can bring out their inner strengths and ambitions and where diverse perspectives and ideas are embraced and appreciated. QNB encourages career growth and development by offering broad and diverse training to its staff.
The Bank has adopted compliance-related trainings as an integral part of staff development for promoting a robust compliance culture. This in turn fosters a positive work environment and takes the Bank one step closer to achieving its goals and objectives. This approach also serves to enhance compliance awareness among employees, protecting QNB’s brand and reputation across the globe.
The Group’s compliance division regularly monitors the progress of employees against the approved training plans using KPI’s and specific reports on compliance training performance. In light of COVID-19 and in the absence of face-to-face training, QNB has developed multiple methods for disseminating compliance-related training to its staff globally.
Initiatives and strategies implemented in light of COVID-19The COVID-19 pandemic posed unique challenges for the Bank and its customers. To overcome these challenges, QNB developed new and more efficient service delivery methods, both for external and internal customers. QNB’s business continuity plans (BCP) were updated taking into consideration any disruptions to the business mandated by the authorities. From a regulatory standpoint, QNB applied a proactive approach in ensuring regulatory compliance and maintaining strong second line of defence responsibilities during the COVID-19 pandemic. Furthermore, we ensured that any new guidelines and requirements from the regulators on combating COVID-19 were properly disseminated across the Bank and its entities.
Core governance and compliance initiatives for overseas entitiesQNB regularly reviews its overseas branches and subsidiaries’ internal control framework and is consistently developing its regulatory control framework factoring in global best practices and standards. Furthermore, the Group introduced strict methodologies for testing the efficiency and design of controls within overseas entities’ internal control framework and regulatory reporting control framework. This was done to ensure that internal controls were operating within approved limits or to mitigate additional risks, as well as to identify the impact new regulatory developments may have on the operations, structure and procedures of overseas entities.
Building capabilities and skillsets within compliance In order to provide a better working environment for its employees, QNB Group places significant importance on enhancing the skillsets and capabilities of its workforce. Hence, the compliance division employees are provided with continuous learning opportunities in the form of in-house and external compliance-related international courses in addition to financial support for relevant professional qualifications such as CAMS, CISI, CIA, CFE etc. This ensures increased morale in the workforce coupled with enhanced productivity. QNB places a high importance on our human capital, and strongly encourages our employees to further enhance their skills, prepare themselves for progression, drive innovation and further challenge themselves in their existing roles.
“Efficiently working internal control functions are what preserve the Group’s financial viability and further its compliant behavior thereby protecting the Bank’s reputation and that of its clients.”
Group Compliancecontinued
The Bank has adopted compliance-related trainings as an integral part of staff development for promoting a robust compliance culture.

76 — QNB Annual Report 2021 QNB Annual Report 2021 — 77
Financial statements
SustainabilityC
orporate governanceR
iskO
perational performance
Strategic reportG
roup overview
Our robust internal audit capabilities protect and strengthen the Bank, underpinning stakeholders’ confidence in our processes and controls.
Group Internal Audit
Assurance to key stakeholders and regulatorsThe Group’s Internal Audit division is headed by the Group Chief Audit Executive (GCAE), who reports to the BOD, through the GBACC, thus ensuring the independence of the audit function. The GCAE is nominated by the GBACC. The GBACC is also responsible to monitor, review, track and evaluate the performance as well as the determination of the remuneration of the GCAE and his division.
The Group’s audit function’s mandate is to provide: > an independent assurance service to the BOD and the GBACC on the effectiveness of the Group’s governance, risk management and control processes;
> advice to management on best practices and areas for necessary improvements; and
> coverage and assurance to key regulatory authorities in all jurisdictions of branches and subsidiaries.
The aim is to promote the confidence of all our stakeholders, including the BOD, home and host regulators, and Senior Management, by executing all internal audit tasks with consistent objectivity, rigour and discipline, backed by a process of continuous improvement.
Throughout 2021, we continued to support our international subsidiaries to reprioritise their annual audit plans to adapt to the COVID-19 residual challenges and ensure proper coverage of key risks. In addition, we shared programmes intended to raise risk and control awareness as well as appropriate governance culture.
The tracking of audit items and ensuring management implementation of agreed action plans to address audit issues is facilitated using our Audit Management System (AMS). Dashboards provide the GBACC, GCEO, and the GMRC with real-time information on open and overdue matters. This information also apprises Senior Management, GBACC and the BOD on the implementation status of pending audit issues. It is used as part of the bank-wide key performance indicators measures on the control environment. In addition, total observations classified by risk categories are reported to Senior Management, GBACC, and BOD on a semi-annual basis to drive attention and development of corrective actions.
Additional focus on emerging risksIn 2021, we continued to prioritise reviews required by regulators across our network. This included reviews of Financial Crime (AML/CTF and sanctions risks), the Internal Capital Adequacy Assessment Process (ICAAP) and reconciliation of collateral records against the records maintained by relevant authorities, such as the Land Registry Department under the Ministry of Justice and QSE, respectively.
We continued to embed financial crime reviews in our audit processes throughout 2021 to address growing concerns from regulators about financial crime. This has ensured that sound controls are in place and operating effectively, and all applicable regulatory requirements are adequately incorporated in our policy and procedures and implemented accordingly. We have devoted increased resources to this area across all jurisdictions. We enhanced the depth of controls testing carried out, as well as the scope of coverage through further training and introduced a new baseline testing programme. Furthermore, we conducted dedicated Financial Crime reviews of International Branches for the first time.
The Global Financial Crime Audit team rolled out a Financial Crime Risk (FCR) training and awareness programme to the subsidiary audit teams and introduced a methodology for the self-assessment of FCR Coverage. This helped to ensure that the Internal Audit teams in our subsidiaries have the required expertise and resources to integrate financial crime coverage in their regular audit assignments.
We enhanced our information technology and information security audit methodology to ensure it covers the latest technology/ cyber security related risks. It also includes concepts and guidelines from global and regional stakeholders, such as ISACA, an international professional association focused on IT governance, and regulatory bodies such as the European Banking Authority.
International regulators are increasingly focused on cybersecurity risks and controls, particularly those related
The Group Internal Audit Division (GIAD) plays a vital role in evaluating the effectiveness of risks, controls, and governance frameworks across the Group. By performing a comprehensive and systematic programme of independent audits, GIAD supports the proper functioning of the Group, ensuring efficiency and effectiveness across our internal processes. QNB goes beyond auditing financial risks and statements to consider broader issues such as reputation, risk awareness, growth, environment (including safety, security and health standards) and employee development.
GIAD provides our stakeholders with a mix of assurance and advisory services, reviewing our systems and processes, and offering insight to support ongoing improvement. Our internal audit function has a full and unrestricted access to all the Group’s records, documentation, systems, properties and personnel, including Senior Management and the BOD.
The Bank’s internal audit philosophy is to collaborate with the business, objectively influencing and challenging to facilitate the best results for the Group and its stakeholders across our footprint. Most of our audit staff in Qatar are professionally qualified and hold globally recognised certifications. Our audit team is composed of individuals with experience from leading financial institutions and audit firms across the globe.
External and internal quality assurance programmeOur audit function’s experience and ongoing professional development provides us with the required competencies to tackle the growing sophistication and challenges of the banking industry in the new normal. It is vital that the audit team possesses the necessary level of understanding and depth to be an adequate counterpart of our respective businesses across the Group. QNB Group adheres to the International Professional Practices Framework (IPPF) issued by the Institute of Internal Auditors (IIA) and Basel Committee recommendations and other leading standards. Under the IPPF framework, a qualified, independent assessor must conduct an external quality assessment of an internal audit activity at least once every five years. This assurance was provided in 2018 when the IIA conducted a comprehensive external quality assessment. This certified that we conform to the Standards and the IIA Code of Ethics.
In 2021, we performed an Internal Quality Assurance review that again reconfirmed that the Bank adhered to the IIA standards and Code of Ethics. The review programme was also implemented across our subsidiaries. The results were presented to the Group Board Audit and Compliance Committee (GBACC) and to the respective Audit Committees in our subsidiaries along with necessary actions needed to ensure full conformance with the standards.
“We maintain and promote the confidence of all our stakeholders, including the BOD, home and host regulators, and senior management, by executing all internal audit tasks with consistent objectivity, rigour, and discipline, backed by a process of continuous improvement.”
We shared programmes intended to raise risk and control awareness as well as appropriate governance culture.Improve Efficency
of Bank OperationsControls & Cyber Security Assesments
Ensure Legal & Regulatory Compliance
Governance & Transparency
IndependentAssurance
Advisory & Insight
Risk Focus
Cost Optimisation
Internal Audit

78 — QNB Annual Report 2021 QNB Annual Report 2021 — 79
Financial statements
SustainabilityC
orporate governanceR
iskO
perational performance
Strategic reportG
roup overview
to payment systems and personal data protection. Some of these regulators rely on work conducted by our IT&IS audit teams for assurance, using our enhanced methodology. This methodology continues to be developed with further enhancements to include more integrated coverage, such as IT functions and controls that are critical to business/ operational processes.
Advisory services, insight, and analysisThe valuable insights gained through the unbiased and objective internal audit analysis enables to help the Bank improve its capabilities, systems and processes.
GIAD analysed and made presentations to Group functions on common and key audit findings in international branches to support them in exploring and developing permanent solutions to ensure a regular and effective oversight and support to the key functions and activities in international locations.
As an independent reviewer, GIAD participates in the review of new and updated policies in an advisory capacity. The main objectives of the review are to ensure that the policies address and mitigate key business, IT and regulatory risk factors with proper alignment and integration with other policies and applicable standards. By using the combined technical knowledge of the business and our seasoned IT auditors, our policies can be effectively benchmarked against industry best-practice.
GIAD continued to support the rollout of major IT projects by providing regular feedback and insight and advising on key risks and controls. This includes our participation in the bi-annual Business Continuity Management (BCM) exercise, assessing and ensuring that the results meet the target level of readiness and recovery.
Enhanced Group governance frameworkGIAD continued the implementation of the QNB Group international governance framework. This included, but was not limited to, reviewing the audit universes, risk assessments, internal quality assurance reviews, follow-up processes and annual audit plans’ development and implementation in our international subsidiaries.
Audit programmed and techniques As the impact of the COVID-19 pandemic continued in 2021, we adjusted our way of working to the new normal. We updated our audit programmes and techniques to address emerging and higher risk areas and adopted analytical processes focusing on key risks. Despite the travel restrictions, we were nevertheless able to work closely with our internal audit teams in our international branches.
Other enhancements included: > strengthening exception reports and data available centrally at head office to fine-tune risk assessments and enable early identification of control gaps;
> enhancing our audit programmes and audit implementation scripts to close gaps and inadequacies at system-level;
> introducing integrated audits of key systems and applications covering three dimensions-technology, security, and business configurations and parameters;
> optimising existing systems leveraging automated control capabilities;
> enhancing Data Analytics capabilities and techniques to identify systemic gaps to improve the control environment; and
> implementing advanced sampling techniques to increase the assurance gained through the testing of controls.
Promoting control awareness and risk cultureThe services provided by our internal audit function are vital and add value to the organisation. This helps us build an informed risk culture, raising control awareness of the issues we face across our businesses. GIAD ensures continuous improvement of QNB Group’s risk management framework by highlighting emerging risks and placing particular emphasis on systemic issues related to the various processes that we audit. To support this initiative in 2021, we continued to update and expand our mandatory awareness programme on key risks and controls for all employees across the network.
Group Internal Auditcontinued
The training includes:
> overview of individual responsibilities over the control environment and risk management;
> Basel Committee Three Lines of Control approach;
> overview of the key banking risks and the internal control framework and assurance structure;
> insights on key risks as a result of COVID-19 and how to maintain sound internal controls;
> common and repeated audit findings covering respective functions and key processes; and
> key information technology and security risks and controls.
The programmes include an evaluation of understanding of the materials taught.
Promoting transparencyWe believe that greater transparency brings more accountability and improved stakeholder confidence. For that reason, GIAD continues to improve communication on our activities throughout the business. Final audit reports incorporating audit issues, management’s action plans, and target dates for implementation are regularly issued to the management, the GCEO, and the GBACC. In addition, a quarterly report summarising activities and outcomes is also issued and discussed with the GBACC and the BOD.
Looking aheadIn 2022, GIAD will continue to monitor the key IFRS 9 processes, particularly considering the impact of the COVID-19 pandemic. The function will also focus on the transition to the RFR and all the related processes, as part of the transition from LIBOR.
GIAD will continue to work with management to review the enhanced capabilities, monitoring and risk focus and response related to the increase in frequency, sophistication, and intensity of QNB services - especially related to cybersecurity and resilience. Likewise, the introduction of new digital platforms will also be of particular focus.
Finally, we will include ESG topics into our audit universe and will schedule periodic reviews on such areas to address the increasing importance of this topic to our stakeholders.
In 2022, GIAD will continue to monitor the key IFRS 9 processes, particularly considering the impact of the COVID-19 pandemic.
“We believe that greater transparency brings more accountability and improved stakeholder confidence. For that reason, GIAD continues to improve communication on our activities throughout the business.”
Confidentiality
Fair Presentation
Integrity
Evidence Based Approch
Due Professional Care
Independence
QNB’s Internal Audit Approach

80 — QNB Annual Report 2021 QNB Annual Report 2021 — 81
Financial statements
SustainabilityC
orporate governanceR
iskO
perational performance
Strategic reportG
roup overview
Sustainability

82 — QNB Annual Report 2021 QNB Annual Report 2021 — 83
Financial statements
SustainabilityC
orporate governanceR
iskO
perational performance
Strategic reportG
roup overview
At QNB, we define sustainability as the delivery of long-term value in financial, environmental, social and ethical terms, for the benefit of our customers, shareholders, employees and communities.
Sustainability
QNB sustainability framework and strategy Our sustainability framework consists of three pillars: sustainable finance, sustainable operations and beyond banking. All three pillars support QNB’s goal of sustainable financial performance, by reducing risks, opening up new
business opportunities and strengthening our brand. Under each pillar, we have identified the sustainability topics most material to our business and stakeholders, along with a series of action plans to improve our performance.
Sustainability governanceThe QNB Group sustainability programme, which consists of our group-wide sustainability strategy and roadmap, is owned and governed by the QNB Group Strategy Committee (SC), chaired by the Group Chief Executive Officer and attended by the Group’s Executive Management Team. The SC is the decision-making body for all matters relating to the Group’s sustainability programme.
Responsibilities include reviewing the strategic framework and agenda, deciding on priority initiatives for implementation with accountable working groups, monitoring performance and assessing ESG-related risks and opportunities, including climate related issues.
When required, the SC reports key risks and opportunities to the Board of Directors via the GBNRGPC. As a minimum, the Board of Directors receives an annual update on the overall execution of the Group’s sustainability strategy as well as achievements of our sustainability efforts.
A designated Group Sustainability Team, within Group Strategy, acts as an advisory body to the SC and senior management on all sustainability-related matters. The Group Sustainability Team engages with external stakeholders and drives all ESG related reporting, disclosures and interaction with the relevant ESG related bodies, institutions, investors and partners. In addition, the team is at the core of our various ESG initiatives, acting as a central focus point for ESG related projects in collaboration with concerned departments.
The Group’s sustainability policy is subject to annual review by the SC and applied to the entire Group, including international branches and majority controlled subsidiaries. Any revisions or modifications to the policy are communicated to the subsidiaries for its correct local adoption in compliance with prevailing regulatory requirements.
The Group also has a Green, Social and Sustainability Bond Committee (GSSBC), made up of senior representatives from the Sustainability, Corporate Banking, Treasury, Risk
and Finance teams. On a quarterly basis the GSSBC reviews updates on the eligible bond portfolio and approves any action to comply with eligibility criteria, management of proceeds, reporting standards and mitigating action to meet the bond thresholds.
To enhance disclosure, in 2021 the Group published a number of sustainability-related policies and statements on its website. These include the Code of Ethics and Conduct, Anti-Bribery and Corruption Policy Statement, Group Environmental and Social Risk Management (ESRM) framework, Third Party Supplier Code of Conduct (TPSCC) and the Modern Slavery Act (United Kingdom).
In 2021, we have further enhanced sustainability governance by including topics such as Board gender diversity, enhanced governance disclosures and external ESG preparedness review.
Stakeholder engagementQNB Group’s sustainability strategy was developed in consultation with key stakeholder groups – our customers, investors, employees, regulators and government, society and suppliers – taking into account their needs and expectations. Through regular and targeted engagement with stakeholders, we deepen our understanding of their priorities, and where appropriate, align our initiatives with their interests and needs.
Our stakeholder selection process is guided by a benchmarking exercise against peer banks in the region and beyond. In addition, our primary stakeholders are groups that are directly affected by our business and operations (customers, employees, suppliers), invest in our business (investors), have oversight and influence on our activities (regulators and government), as well as those who are indirectly impacted in the communities we serve (society). The relevance of these stakeholder groups is reviewed on an annual basis.
* The Group Sustainability Team disseminates strategy, policy and priority initiatives to Subsidiaries’ Sustainability Teams.
Board of Directors
Group Strategy Committee
Group Sustainability Team*
Sustainability Working Groups
Sustainability governance
Sustainable Financial Performance
Beyond banking refers to QNB’s Corporate Social Responsibility (CSR) activities in the communities in which we operate. Our ambition is to make a positive contribution towards wider society with an emphasis on education and financial literacy. In addition, we support and deliver a range of initiatives within our focus areas of social and humanitarian, arts and culture, health and environment, economic and international affairs, and sport.
QNB’s material topic identified within beyond banking is:
> community investment and socio-economic development.
Sustainable operations is the integration of ESG criteria into our business operations and across our supply chain to ensure we operate ethically and efficiently. Our ambition is to strengthen corporate governance and risk management practices, promote equality throughout our workforce and reduce carbon emissions generated by our operations. This approach keeps us compliant with increasing ESG-related regulations while helping QNB to be an employer of choice.
QNB’s material topics identified within sustainable operations are:
> governance, compliance, and risk management;
> employee value proposition;
> diversity and inclusion;
> responsible procurement and supply chain; and
> environmental and climate impact.
Sustainable finance is the integration of ESG criteria into QNB’s financing activities to deliver profit with purpose. Our ambition is to help customers manage their environmental and social risks, lend to businesses that contribute towards sustainable development goals, improve access to finance for SMEs and underserved groups, and provide responsible customer service. Delivering sustainable finance is the most significant way in which QNB can support national and global sustainable development goals. Moreover, it enables us to reduce reputational risks in our portfolio and maximise business opportunities emerging from the transition to a greener, more inclusive economy.
QNB’s material topics identified within sustainable finance are:
> customer experience and responsible engagement;
> customer privacy and data security;
> digital innovation and transformation;
> sustainable investment, lending, products and services;
> supporting SMEs and entrepreneurship; and
> financial inclusion, accessibility, and education.
Beyond BankingSustainable Operations
Sustainable Finance

84 — QNB Annual Report 2021 QNB Annual Report 2021 — 85
Financial statements
SustainabilityC
orporate governanceR
iskO
perational performance
Strategic reportG
roup overview
Sustainabilitycontinued
Creating And Delivering Value
Investors
Customers
Society
Suppliers
Regulators and government
Employees
Materiality assessmentBy identifying and prioritising our material sustainability topics, we are able to focus on what matters most to our business and stakeholders. In line with the materiality assessment process set out in the Global Reporting Initiative (GRI) standards, QNB Group has compiled a comprehensive list of relevant economic, ethical, social and environmental topics.
Our approach to the ranking of these topics include both internal and external stakeholder engagement, conducted through dialogue and feedback provided by nominated proxies across the Bank. We regularly communicate with our external stakeholders including regulators, rating agencies, government entities and NGO’s with regard to sustainability topics.
Community investment and socio-economic development
Diversity and inclusion
Responsible procurement
Financial inclusion, accessibility and financial education
Sustainable investment, lending, products and services
Environment and climate impact Supporting SMEs and Entrepreneurship Digital innovation and transformation
Employee value proposition Customer privacy and data security
Financial performance
Governance, compliance and risk management
Customer experience and engagement
Financial stability and systemic risk management
QNB Group Materiality Matrix
Influ
ence on stak
eholde
r assessm
ents and
decisions
Significance of impacts
Stakeholders Needs and Expectations Material Topics QNB Engagement Channels Frequency
Customers > Customer service and satisfaction
> Financial stability and systemic risk management
> Customer satisfaction survey Annual
> Easy to use and secure digital channels
> Customer experience and responsible engagement
> Customer care centre Ongoing
> Competitive rates and fees > Financial performance > Mobile and online banking
> Access to financing and services
> Customer privacy and data security > Complaints management
> Products with a positive impact > Digital innovation and transformation > Relationship managers
> Robust data privacy > Sustainable investment, lending, products and services
> Supporting SMEs and entrepreneurship
> Financial inclusion, accessibility and financial education
Investors > Strong and stable returns > Financial stability and systemic risk management
> Annual General Meeting (AGM)
Annual
> Robust corporate governance, risk management and ratings
> Governance, compliance and risk management
> Board of Directors’ meetings Quarterly
> Transparency and disclosure > Environmental and climate impact > Analyst calls
> Comprehensive approach to ESG along the value chain
> Diversity and inclusion > Investor days, roadshows, and ongoing dialogue
Ad-hoc
Employees > Competitive salaries, benefits and rewards
> Employee value proposition > Employee engagement survey Annual
> Professional development > Diversity and inclusion > Training need analysis
> Fairness, diversity and equal opportunity
> Intranet Ongoing
> Work life balance > Induction Programme
> Learning and development programmes
> Performance management
Regulators and
government
> Compliance with all legal and regulatory requirements
> Financial stability and systemic risk management
> Public disclosures (e.g., Annual and Corporate Governance Report)
Annual
> Robust anti-corruption and bribery measures
> Governance, compliance and risk management
> GCEO office Ongoing
> Strong risk management and governance
> Customer privacy and data security > Group compliance and audit teams
> Addressing climate change risks and opportunities
> Environmental and climate impact > Regulatory working groups
> Banking associations
Society > Creating employment opportunities
> Financial stability and systemic risk management
> Products and services with environmental or social benefits
Ongoing
> Making a positive contribution to the challenges facing society
> Governance, compliance and risk management
> CSR activities
> Addressing climate change risks and opportunities
> Employee value proposition > HR recruitment teams Ad-hoc
> Diversity and inclusion > NGOs
> Environmental and climate impact
> Community investment and socio-economic development
Suppliers > Timely payment > Digital innovation and transformation > Bidding and tendering Ongoing
> Fair and transparent processes > Responsible procurement and supply chain > Supplier e-portal
> New business opportunities > Supplier audits Ad-hoc

86 — QNB Annual Report 2021 QNB Annual Report 2021 — 87
Financial statements
SustainabilityC
orporate governanceR
iskO
perational performance
Strategic reportG
roup overview
We reference our material topics against international and regional peer reviews by conducting a comparative analysis of our material topics though our annual ESG performance review. Prioritisation of topics takes into account an ESG assessment, ratings and weightings from multiple internationally recognised rating agencies.
In 2021, we reassessed our material topics to address the rapidly and dynamically evolving operating environment. The key changes to this year’s materiality assessment are reflected in increased rankings for “Employee value proposition” and “Environmental and climate impact” (renamed from “Environmental impact of operations” in 2020).
The increasing focus on employee value proposition is a result of our employees’ transition to Working From Home (WFH). This has had a profound impact on the way we work
and has elevated the importance of employee wellbeing. In addition, our increased focus on the environmental and climate impact recognises the growing significance of climate change and increasing risk to the stability of the global financial systems.
While our material topics have been reprioritised, they remain aligned with the pillars of our sustainability framework and the objectives of the UNSDGs, QNV 2030 and the QSE “Guidance on ESG Reporting”. Our approach to materiality provides the foundation of our sustainability strategy and ensures that we address the issues of most relevance to all our stakeholders. Our Executive Management has reviewed the Group’s materiality matrix to ensure that the range of issues included provides a complete representation of the organisation’s significant sustainability impacts.
Sustainabilitycontinued
The table below shows how our most material sustainability topics align with the UNSDGs.
Material topics alignment with UNSDGs UNSDGs GRI Topics
Financial stability and systemic risk management GRI: 102-30
Governance, compliance and risk management GRI: 102
Customer experience and responsible engagement
Financial performance GRI: 201
Customer privacy and data security
GRI: 418
Digital innovation and transformation
Sustainable investment, lending, products and services
Supporting SMEs and entrepreneurship
Employee value proposition
GRI: 401, 404
Diversity and inclusion
GRI: 405
Financial inclusion, accessibility and financial education
Responsible procurement and supply chain
GRI: 204
Environmental and climate impact
GRI: 302, 305
Community investment and socio-economic development
GRI: 413
International Commitments
UN Global Compact (UNGC)
As part of our commitment to sustainable business practices, QNB joined the UNGC, the world’s largest corporate sustainability initiative, promoting better business practices in the areas of human rights, labour, environment and anti-corruption. Each year we publish our Communication on Progress (COP) to report progress against these topics.
UNSDGs The UNSDGs are the principal global framework for sustainability. Their aim is to protect the planet, end poverty, fight inequalities and ensure prosperity. Launched in 2016, through to 2030, the 17 goals are underpinned by 169 targets. We have aligned our materiality topics to the UNSDGs.
National Commitments
QNV 2030 The QNV 2030 serves as a clear roadmap for Qatar’s future, guiding economic, social, human and environmental development for the coming decade. The vision is supplemented by the National Development Strategy, with five-year plans to support its implementation.
Qatar’s Nationally Determined Contribution (NDC)
In 2021, Qatar submitted its updated NDCs to the United Nations Framework Convention on Climate Change (UNFCCC). The NDC outlines the country’s climate actions and efforts towards reducing greenhouse gas emissions, as part of an ongoing commitment to The Paris Agreement.
Reporting Frameworks
GRI standards To promote transparency in the banking sector, we report our sustainability performance annually and in accordance with the GRI Standards: core option and GRI G4 Financial Services Sector Disclosures.
In 2021, Deloitte & Touche Middle East (DTME) provided an independent limited assurance under ISAE 3000 (Revised) on the preparation of the 2020 Sustainability Report in accordance with the GRI standards. In addition, we also published our third sustainability report in Turkey.
Sustainability Accounting Standards Board (SASB)
We commenced reporting against the SASB Index for Commercial Banks.
Carbon Disclosure Project (CDP)
We commit to continuously reducing the Bank’s carbon footprint and providing transparency across our environmental performance.
Taskforce on Climate-related Financial Disclosures (TCFD)
We support the principles and recommendations of TCFD. Currently TCFD relevant metrics are disclosed where aligned with GRI standards and through the active annual participation in CDP.
QSE Sustainability and ESG Dashboard
We have committed to disclose QNB’s ESG performance to the QSE, which is a signatory to the United Nations Sustainable Stock Exchange Initiative.
International Capital Markets Association (ICMA)
Our Green, Social and Sustainability Bond (GSSB) framework follows the four components of the ICMA Green Bond Principles and 4 components of the Social Bond Principles. The GSSB framework sets out our governance and approach, outlines eligible project categories, use of proceeds and reporting commitments.
This year we updated our GSSB Framework to ensure alignment with ICMA Green Project Mapping, latest ICMA principles and guidelines, as well as Climate Bonds Initiative (CBI) and EU taxonomies, where applicable. The framework successfully obtained a full alignment opinion from S&P Global Rating.
In 2021, we published our green bond anniversary reporting, consisting of an independently assured allocation report and an environmental impact report developed with a third party specialist.
External commitmentsOur sustainability strategy has been developed in line with these international and national commitments, as well as reporting frameworks.

88 — QNB Annual Report 2021 QNB Annual Report 2021 — 89
Financial statements
SustainabilityC
orporate governanceR
iskO
perational performance
Strategic reportG
roup overview
Sustainabilitycontinued
Environmental and social risk management (ESRM)In 2021, we formally rolled out our ESRM Framework, which was developed in accordance with national and international laws and regulations and is publicly available in our website. Within the ESRM Framework, the Exclusion List clearly lists the prohibited activities and sectors that the Bank will not knowingly finance, directly or indirectly. All in-scope activities passing the Exclusion List screening and meeting our financing threshold are subject to additional E&S screening through Restricted Sectors and corresponding Prohibited Activities. The Group also has a position statement on Extractive Industries and Palm Oil, which states that we support and encourage clients to use, or transition towards,
internationally recognised standards and practices to manage their E&S risks and impacts. For Palm Oil, we require clients to be Roundtable on Sustainable Palm Oil (RSPO) certified or in the process of becoming a member. The Group has committed to revisiting and evolving the Group’s ESRM Framework over time, including the assessment of product and sector coverage. Following the rollout of our group-wide ESRM framework, our subsidiaries in Turkey and Egypt also published their own frameworks in alignment with the Group’s minimum standards and taking into consideration local operational specificities.
Sustainalitics disclaimer:Copyright ©2021 Sustainalytics. All rights reserved. This section contains information developed by Sustainalytics www.sustainalytics.com. Such information and data are proprietary of Sustainalytics and/or its third party suppliers (Third Party Data) and are provided for informational purposes only. They do not constitute an endorsement of any product or project, nor an investment advice and are not warranted to be complete, timely, accurate or suitable for a particular purpose. Their use is subject to conditions available at https://www.sustainalytics.com/legal-disclaimers.
MSCI score reference: In 2021, QNB Group received a rating of AA (on a scale of AAA-CCC) in the MSCI ESG Ratings assessment.The use by QNB Group of any MSCI ESG Research LLC or its affiliates (“MSCI”) data, and the use of MSCI logos, trademarks, service marks or index names herein, do not constitute a sponsorship, endorsement, recommendation, or promotion of QNB by MSCI. MSCI services and data are the property of MSCI or its information providers, and are provided ‘as-is’ and without warranty. MSCI names and logos are trademarks or service marks of MSCI.
United Nations Sustainable Development Goals
QNV 2030 and National Development Strategy 2018–2022
UNSDGsThe UNSDGs are the principle global framework for sustainability. Their aim is to protect the planet, end poverty, fight inequalities and ensure prosperity. Launched in 2016, through to 2030, the 17 goals are underpinned by 169 targets.
Human Development
Environmental Development
Economic Development
Social Development
National and international frameworks and commitmentsWe are committed to the objectives of the QNV 2030, the UNSDGs and the UNGC. Our sustainability strategy has been developed in line with these national and international frameworks.
QNV 2030The QNV 2030 serves as a clear roadmap for Qatar’s future, guiding economic, social, human and environmental development for the coming decade. The vision is supplemented by the National Development Strategy, with five-year plans to support its implementation.
We are committed to and align with:
The UNSDGs is a global framework for sustainability. The aim is to protect the planet, end poverty, fight inequalities and ensure prosperity.

90 — QNB Annual Report 2021 QNB Annual Report 2021 — 91
Financial statements
SustainabilityC
orporate governanceR
iskO
perational performance
Strategic reportG
roup overview
Combating climate changeIn line with Qatar’s ratification of the Paris Agreement and recent publication of the second NDC, QNB is committed to doing its part to address climate change mitigation and adaptation. We encourage ambitious climate action from all parties and stakeholders to achieve the goals of the Paris Agreement, and emphasise that everyone has a role to play.
The Bank recognises climate risk as one of the key risk dimensions and we have initiated the integration of climate risk into our risk management framework.
Respecting and advancing human rightsAs a large financial institution, we acknowledge that human rights issues can arise not only in our own operations, but also through our engagement with outside parties, namely our business relationships, customer interactions, financing and investments, supply chain and the communities we serve. We recognise that it is our duty to respect and advance human rights throughout our value chain.
As such, we have continued to align our Human Resources business practices against the principles set out in the International Labour Organisation’s (ILO) Declaration on Fundamental Principles and Rights at Work, as well as the UN Guiding Principles on Business and Human Rights (UNGPs). We support the journey to identify and eradicate human rights issues and modern slavery from our business, as reflected in our Modern Slavery and Human Trafficking Transparency Statement. The statement is in compliance with section 54 of the UK modern Slavery Act 2015. In alignment with Qatar’s Supreme Committee for Delivery and Legacy Worker’s Welfare Standards, we developed and launched the Vendor Worker Welfare Self-Assessment (VWWS) to measure and track adherence to best practices, and to form input for ongoing vendor engagement as part of TPRM.
In 2021, we engaged with a leading external service provider on the human rights topic and dedicated expertise on the UNGPs to better understand the unique challenges most salient and material to financial institutions. We have taken this input as a baseline to assess our current business performance against the standards and leading practices in this field. Based on this assessment, we have defined a roadmap on how to advance our practices on human rights across the institution going forward.
Ratings table and indices
Ratings provider Rating
MSCI AA
Sustainalytics 22.4 (Medium Risk)
S&P CSA 42 (62nd percentile)
CDP D
ESG Invest 1st in Qatar
Index Update
FTSE4GOOD Constituent
MSCI QSE 20 ESG Constituent
Case study: The European Bank for Reconstruction and Development (EBRD) invests USD50 million in QNB Finansbank’s first green bond
QNB Finansbank issued its first green bond with the backing of the EBRD. This first green bond issuance, of USD50 million, marks the EBRD’s first investment in a green bond issued by a Turkish bank. QNB Finansbank’s green bond is issued under the Group’s GSSB framework, which was updated and received a Second Party Opinion (SPO) earlier in 2021.
The USD50 million proceeds will be used to finance internationally certified green building projects in the bank’s portfolio. The bank’s eligible green portfolio is significantly greater than the issue size, providing scope for future issuances.
This transaction demonstrates the Group’s commitment to sustainable financing. It also allowed QNB Finansbank to successfully diversify its international funding base and to tap into a pool of capital that supports the transition towards a sustainable and low-carbon economy.
Sustainabilitycontinued
We recognise and encourage ambitious climate action from all parties and stakeholders to achieve the goals of the Paris Agreement.

92 — QNB Annual Report 2021 QNB Annual Report 2021 — 93
Financial statements
SustainabilityC
orporate governanceR
iskO
perational performance
Strategic reportG
roup overview
Among other topics, the pandemic has further emphasised social themes, which brings CSR to the forefront of our agenda. We have defined our purpose as to promote prosperity and sustainable growth across the markets we serve. Hence, we are committed to contribute to the communities that we serve.
As a socially responsible and sustainable bank, we believe that our work in society helps creating new opportunities for individuals and corporates, which enables them to raise living standards and further develop their communities. Through the power of our people, our customers, services and products, QNB Group has an unparalleled opportunity to make the communities in which we operate a better place. This is especially true during the pandemic, as we assisted our customers throughout our footprint overcome various challenges, through technological enhancements and a wide range of financing options.
In line with our purpose to promote prosperity and sustainable growth, we are committed to contribute to the communities that we serve.
Beyond Banking – Corporate Social Responsibility
Our people and CSRIn line with our purpose, our goal is to enable economic and social empowerment through our services across our footprint, particularly in developing and emerging economies that are underserved by other banks.
We are proud of our diversity. Our network brings together people from around 83 different nationalities working in more than 31 countries across three continents. Our values entail working in a collaborative manner, which, at the same time, promotes mutual respect and support. We see it also as our role to lead by example. We are therefore proud that our employees have proactively taken the initiative to engage in community work. Over the years, our volunteers have supported a wide range of community projects, including fundraising, keep-clean rallies, financial education initiatives, mentoring and training, coaching a children’s sports team and even providing a warm meal to those less fortunate. Many of these initiatives are in line with our five main areas of CSR focus:
Social and humanitarianAs part of our CSR engagement, we define social and humanitarian work as material to our purpose. We are committed to building a better society for communities, corporates and individuals. This year, we:
> supported the SME sector in several of our network countries by engaging with government programmes, such as the National Response Programme in Qatar, thus offering further relief to businesses impacted by COVID-19. We helped our customers to maintain their cash flow balance and liquidity under the difficult market environment by quickly meeting the rescheduling and new loan requests;
> volunteered to be part of a campaign called “An Armful of Happiness” and helped distribute gifts and books to less fortunate children in Turkey; and
> participated in the economic empowerment programme in coordination with Misr El Kheir Foundation in Egypt. The project targeted 100 female trainees, and succeeded in increasing the number of women to reach 120 female trainees to enrol in a number of training programmes, including readymade garments, leather goods, shoe making and more.
Youth and educationOur future lies in the hands of our youth, and educating the next generation is key to developing a knowledge-based economy and society. As a bank, our goal is to educate children on financial values such as saving, spending and sharing. Additionally, we aim to highlight to the younger generation the importance of money management and investing principles. This year, we held various campaigns, and:
> launched a Ramadan online competition in partnership with Kidzania Qatar to promote financial literacy. This initiative aimed to incentivize kids to start building their own savings;
> launched an initiative called “Value of Book Increase by Sharing”, targeting students aged 7-12 years at the Elementary School of Erzurum in Turkey. Our team collected more than 800 children’s books to build a library for the school, together with clothing, shoes, stationery equipment and toys;
> held an annual financial literacy programme in Indonesia called “QNB Goes to Schools”, which offered financial education classes related to money management and investment. This year the activity was organised online due to the ongoing pandemic and was well received by students; and
> continued with our annual “Tiny Hands are Coding” project, where we conducted online coding courses for nearly ten thousand children. Additionally, we held the Scratch Cup competition, in which children displayed their newly-found coding talents.
Our values entail to work in a collaborative manner, which, at the same time, promotes mutual respect and support.
“Through the power of our people, our customers, services and products, QNB Group has an unparalleled opportunity to make the communities in which we operate a better place.”
“As a bank, our goal is to educate children on financial values such as saving, spending and sharing.”
We coordinated with the Ministry of Health and Population in Egypt to drive a vaccination campaign for the families of our employees.
“We are committed to building a better society for communities, corporates and individuals.”

94 — QNB Annual Report 2021 QNB Annual Report 2021 — 95
Financial statements
SustainabilityC
orporate governanceR
iskO
perational performance
Strategic reportG
roup overview
Beyond Banking – Corporate Social Responsibilitycontinued
Health and environmentIn light of the recent COVID-19 pandemic and the increasing importance of sustainability, we see the promotion of health and the protection of our environment as vital to the future of our communities. Therefore, this year engaged the community by:
> sponsoring the “Blossom” competition of the Qatar Cancer Society (QCS). This event aimed at raising awareness of the threat from and preventive measures against breast cancer, one of the most prevalent types of cancer among women worldwide;
> coordinating with the Ministry of Health and Population in Egypt to drive a vaccination campaign for the families of our employees; and
> partnering with the Qatar Green Building Council for the 6th edition of Qatar Sustainability Week (QSW). QNB’s support of this event emphasizes the Group’s continuous efforts towards supporting the initiatives of its sustainability agenda, along with raising awareness in the community and showcasing the progress that Qatar has made in the areas of sustainability.
Arts and cultureOur traditions and culture help us define who we are and what we want to become. This goes hand in hand with our cultural engagement to preserve our traditions and heritage across our communities, supporting diversity, inclusion and societal development. This year, we were proud that we:
> continued our long-term partnership with the Qatar Racing and Equestrian Club, officially sponsoring the H.H. The Amir Sword Festival, an event that is deeply rooted in Qatar’s traditional culture; and
> extended our sponsorship of the Tales Math Museum by launching a new digital platform. Today, all children in Turkey can freely reach modules in the Museum online and discover the world of math. This year, we reached more than 22,000 children through this new digital platform.
SportSports acts as a liaison between social, economic and human development. Qatar has successfully positioned itself as a global hub for sports. As a national champion, QNB aims to support national and international sports events, in line with the country’s visions and ambitions. This year, we:
> became the Official Middle East and Africa Supporter of the FIFA World Cup 2022™, the Official National Supporter of the FIFA Club World Cup Qatar 2020™ and the Official Regional Supporter of the FIFA Arab Cup 2021™;
> continued our support of the world of swimming by being the National Sponsor of the FINA Marathon Swim World Series 2021;
> partnered with the World Athletics Federation to become the official sponsor of World Athletic Champions U20 that took place in Nairobi; and
> maintained our strategic sponsorship of the Qatar National Football Team in different tournaments, working towards preparing for the FIFA World Cup 2022™.
We are committed to building a better society for communities, corporates and individuals.
In light of the recent COVID-19 pandemic and increasing importance of sustainability, we see the promotion of health and the protection of our environment as vital to the future of our communities.
Our traditions and culture help us define who we are and what we want to become.
We continued our support of the world of swimming by being the National Sponsor of the FINA Marathon Swim World Series 2021.
QNB aims to support national and international sports events, in line with the country’s visions and ambitions.

96 — QNB Annual Report 2021 QNB Annual Report 2021 — 97
Financial statements
SustainabilityC
orporate governanceR
iskO
perational performance
Strategic reportG
roup overview
Financial Statements

98 — QNB Annual Report 2021 QNB Annual Report 2021 — 99
Financial statements
SustainabilityC
orporate governanceR
iskO
perational performance
Strategic reportG
roup overview
Qatar National Bank (Q.P.S.C.)Independent auditor’s report To the shareholders of Qatar National Bank (Q.P.S.C.)
Qatar National Bank (Q.P.S.C.)Independent auditors’ report To the shareholders of Qatar National Bank (Q.P.S.C.)
INDEPENDENT AUDITORS’ REPORT
To the Shareholders of
Qatar National Bank (Q.P.S.C.)
Opinion
We have audited the consolidated financial statements of Qatar National Bank (Q.P.S.C.) (the ‘Bank’) and its subsidiaries (together the ‘Group’), which comprise the consolidated statement of financial position as at 31 December 2021, the consolidated statements of profit or loss, comprehensive income, changes in equity and cash flows for the year then ended, and notes, comprising significant accounting policies and other explanatory information.
In our opinion, the accompanying consolidated financial statements present fairly, in all material respects, the consolidated financial position of the Group as at 31 December 2021, and its consolidated financial performance and its consolidated cash flows for the year then ended in accordance with International Financial Reporting Standards (IFRS).
Basis for Opinion
We conducted our audit in accordance with International Standards on Auditing (‘ISA’). Our responsibilities under those standards are further described in the Auditors’ Responsibilities for the Audit of the Consolidated Financial Statements section of our report. We are independent of the Group in accordance with the International Ethics Standards Board for Accountants International Code of Ethics for Professional Accountants (including International Independence Standards) (‘IESBA Code’), together with the ethical requirements that are relevant to our audit of the Bank’s consolidated financial statements in the State of Qatar, and we have fulfilled our other ethical responsibilities in accordance with these requirements and the IESBA Code. We believe that the audit evidence we have obtained is sufficient and appropriate to provide a basis for our opinion.
KPMG Zone 25 C Ring Road Street 230, Building 246 PO Box 4473, Doha State of Qatar Telephone: +974 4457 6444 Fax: +974 4436 7411 Website: home.kpmg/qa
KPMG, Qatar Branch is registered with the Ministry of Commerce and Industry, State of Qatar, and a member firm of the KPMG global
organization of independent member firms affiliated with KPMG International Limited, a private English company limited by guarantee.
The KPMG name and logo are registered trademarks of KPMG International.
INDEPENDENT AUDITORS’ REPORT (CONTINUED)
Key Audit Matters
Key audit matters are those matters that, in our professional judgment, were of most significance in our audit of the consolidated financial statements of the current period. These matters were addressed in the context of our audit of the consolidated financial statements as a whole, and in forming our opinion thereon, and we do not provide a separate opinion on these matters.
Impairment of financial assets
See notes 4(b), 8, 9, 10, 11, 15 and 20 in the consolidated financial statements
The key audit matter How the matter was addressed in our audit
We focused on this area because:
• Impairment of financial assets involves:
- complex accounting requirements,including assumptions, estimates andjudgements underlying the determinationof impairment;
- ECL modelling risk over methodology anddesign decisions;
- susceptibility to management bias whenmaking judgements to determineexpected credit loss outcomes; and
- complex disclosure requirements.
• The COVID-19 pandemic has also impacted themanagement's determination of ECL. Theassumptions regarding the economic outlookremain uncertain which increases the level ofjudgement required by the Group in calculatingthe ECL, and the associated audit risk.
• The Group’s financial assets, both on and off-balance sheet, subject to credit risk were QAR1,259,462 million, as at 31 December 2021,which constitutes a material portion of theconsolidated statement of financial position.Furthermore, the total impairment recognizedby the Group on these financial assetsamounted to QAR 7,224 million, in the yearended 31 December 2021, which represents54% of the net profit of the Group, hence amaterial portion of the consolidated statementof income.
Our audit procedures in this area included the following, among others:
• Evaluating the appropriateness of theaccounting policies adopted based on therequirements of IFRS 9, our businessunderstanding, and industry practice.
• Confirming our understanding ofmanagement’s processes, systems and controlsimplemented, including controls over ECLmodel development.
• Identifying and testing the relevant controls.
• Involving information risk management (IRM)specialists to test IT systems and relevantcontrols.
• Evaluating the reasonableness ofmanagement’s key judgements and estimatesmade in the provision calculations, includingselection of methods, models, assumptions anddata sources in light of the impact of theCOVID-19 pandemic.
• Involving financial risk management (FRM)specialists to challenge significant assumptions/ judgements relating to credit risk grading,significant increase in credit risk, definition ofdefault, probability of default, macro-economicvariables, and recovery rates, including theimpact of the COVID-19 pandemic.
• Involving valuation specialists to evaluate theinputs, assumptions and techniques used bythe valuers engaged by the Group for thevaluation of real estate collateral, relating tothe determination of ECL including the impactof the COVID-19 pandemic.
INDEPENDENT AUDITORS’ REPORT (CONTINUED)
Auditors’ Responsibilities for the Audit of the Consolidated Financial Statements
Our objectives are to obtain reasonable assurance about whether the consolidated financial statements as a whole are free from material misstatement, whether due to fraud or error, and to issue an auditors’ report that includes our opinion. Reasonable assurance is a high level of assurance, but is not a guarantee that an audit conducted in accordance with ISA will always detect a material misstatement when it exists. Misstatements can arise from fraud or error and are considered material if, individually or in the aggregate, they could reasonably be expected to influence the economic decisions of users taken on the basis of these consolidated financial statements.
As part of an audit in accordance with ISA, we exercise professional judgement and maintain professional scepticism throughout the audit. We also:
– Identify and assess the risks of material misstatement of the consolidated financial statements,whether due to fraud or error, design and perform audit procedures responsive to those risks, andobtain audit evidence that is sufficient and appropriate to provide a basis for our opinion. The riskof not detecting a material misstatement resulting from fraud is higher than for one resulting fromerror, as fraud may involve collusion, forgery, intentional omissions, misrepresentations or the override of internal control.
– Obtain an understanding of internal control relevant to the audit in order to design auditprocedures that are appropriate in the circumstances, but not for the purpose of expressing anopinion on the effectiveness of the Group’s internal control.
– Evaluate the appropriateness of accounting policies used and the reasonableness of accountingestimates and related disclosures made by the Board of Directors.
– Conclude on the appropriateness of the Board of Directors’ use of the going concern basis ofaccounting and, based on the audit evidence obtained, whether a material uncertainty existsrelated to events or conditions that may cast significant doubt on the Group’s ability to continue as a going concern. If we conclude that a material uncertainty exists, we are required to drawattention in our auditors’ report to the related disclosures in the consolidated financial statementsor, if such disclosures are inadequate, to modify our opinion. Our conclusions are based on the audit evidence obtained up to the date of our auditors’ report. However, future events orconditions may cause the Group to cease to continue as a going concern.
– Evaluate the overall presentation, structure and content of the consolidated financial statements,including the disclosures, and whether the consolidated financial statements represent the underlying transactions and events in a manner that achieves fair presentation.
– Obtain sufficient appropriate audit evidence regarding the financial information of the entities orbusiness activities within the Group to express an opinion on the consolidated financial statements.We are responsible for the direction, supervision and performance of the group audit. We remainsolely responsible for our audit opinion.
INDEPENDENT AUDITORS’ REPORT
To the Shareholders of
Qatar National Bank (Q.P.S.C.)
Opinion
We have audited the consolidated financial statements of Qatar National Bank (Q.P.S.C.) (the ‘Bank’) and its subsidiaries (together the ‘Group’), which comprise the consolidated statement of financial position as at 31 December 2021, the consolidated statements of profit or loss, comprehensive income, changes in equity and cash flows for the year then ended, and notes, comprising significant accounting policies and other explanatory information.
In our opinion, the accompanying consolidated financial statements present fairly, in all material respects, the consolidated financial position of the Group as at 31 December 2021, and its consolidated financial performance and its consolidated cash flows for the year then ended in accordance with International Financial Reporting Standards (IFRS).
Basis for Opinion
We conducted our audit in accordance with International Standards on Auditing (‘ISA’). Our responsibilities under those standards are further described in the Auditors’ Responsibilities for the Audit of the Consolidated Financial Statements section of our report. We are independent of the Group in accordance with the International Ethics Standards Board for Accountants International Code of Ethics for Professional Accountants (including International Independence Standards) (‘IESBA Code’), together with the ethical requirements that are relevant to our audit of the Bank’s consolidated financial statements in the State of Qatar, and we have fulfilled our other ethical responsibilities in accordance with these requirements and the IESBA Code. We believe that the audit evidence we have obtained is sufficient and appropriate to provide a basis for our opinion.
KPMG Zone 25 C Ring Road Street 230, Building 246 PO Box 4473, Doha State of Qatar Telephone: +974 4457 6444 Fax: +974 4436 7411 Website: home.kpmg/qa
KPMG, Qatar Branch is registered with the Ministry of Commerce and Industry, State of Qatar, and a member firm of the KPMG global
organization of independent member firms affiliated with KPMG International Limited, a private English company limited by guarantee.
The KPMG name and logo are registered trademarks of KPMG International.
INDEPENDENT AUDITORS’ REPORT (CONTINUED)
Auditors’ Responsibilities for the Audit of the Consolidated Financial Statements
Our objectives are to obtain reasonable assurance about whether the consolidated financial statements as a whole are free from material misstatement, whether due to fraud or error, and to issue an auditors’ report that includes our opinion. Reasonable assurance is a high level of assurance, but is not a guarantee that an audit conducted in accordance with ISA will always detect a material misstatement when it exists. Misstatements can arise from fraud or error and are considered material if, individually or in the aggregate, they could reasonably be expected to influence the economic decisions of users taken on the basis of these consolidated financial statements.
As part of an audit in accordance with ISA, we exercise professional judgement and maintain professional scepticism throughout the audit. We also:
– Identify and assess the risks of material misstatement of the consolidated financial statements,whether due to fraud or error, design and perform audit procedures responsive to those risks, andobtain audit evidence that is sufficient and appropriate to provide a basis for our opinion. The riskof not detecting a material misstatement resulting from fraud is higher than for one resulting fromerror, as fraud may involve collusion, forgery, intentional omissions, misrepresentations or the override of internal control.
– Obtain an understanding of internal control relevant to the audit in order to design auditprocedures that are appropriate in the circumstances, but not for the purpose of expressing anopinion on the effectiveness of the Group’s internal control.
– Evaluate the appropriateness of accounting policies used and the reasonableness of accountingestimates and related disclosures made by the Board of Directors.
– Conclude on the appropriateness of the Board of Directors’ use of the going concern basis ofaccounting and, based on the audit evidence obtained, whether a material uncertainty existsrelated to events or conditions that may cast significant doubt on the Group’s ability to continue as a going concern. If we conclude that a material uncertainty exists, we are required to drawattention in our auditors’ report to the related disclosures in the consolidated financial statementsor, if such disclosures are inadequate, to modify our opinion. Our conclusions are based on the audit evidence obtained up to the date of our auditors’ report. However, future events orconditions may cause the Group to cease to continue as a going concern.
– Evaluate the overall presentation, structure and content of the consolidated financial statements,including the disclosures, and whether the consolidated financial statements represent the underlying transactions and events in a manner that achieves fair presentation.
– Obtain sufficient appropriate audit evidence regarding the financial information of the entities orbusiness activities within the Group to express an opinion on the consolidated financial statements.We are responsible for the direction, supervision and performance of the group audit. We remainsolely responsible for our audit opinion.
INDEPENDENT AUDITORS’ REPORT
To the Shareholders of
Qatar National Bank (Q.P.S.C.)
Opinion
We have audited the consolidated financial statements of Qatar National Bank (Q.P.S.C.) (the ‘Bank’) and its subsidiaries (together the ‘Group’), which comprise the consolidated statement of financial position as at 31 December 2021, the consolidated statements of profit or loss, comprehensive income, changes in equity and cash flows for the year then ended, and notes, comprising significant accounting policies and other explanatory information.
In our opinion, the accompanying consolidated financial statements present fairly, in all material respects, the consolidated financial position of the Group as at 31 December 2021, and its consolidated financial performance and its consolidated cash flows for the year then ended in accordance with International Financial Reporting Standards (IFRS).
Basis for Opinion
We conducted our audit in accordance with International Standards on Auditing (‘ISA’). Our responsibilities under those standards are further described in the Auditors’ Responsibilities for the Audit of the Consolidated Financial Statements section of our report. We are independent of the Group in accordance with the International Ethics Standards Board for Accountants International Code of Ethics for Professional Accountants (including International Independence Standards) (‘IESBA Code’), together with the ethical requirements that are relevant to our audit of the Bank’s consolidated financial statements in the State of Qatar, and we have fulfilled our other ethical responsibilities in accordance with these requirements and the IESBA Code. We believe that the audit evidence we have obtained is sufficient and appropriate to provide a basis for our opinion.
KPMG Zone 25 C Ring Road Street 230, Building 246 PO Box 4473, Doha State of Qatar Telephone: +974 4457 6444 Fax: +974 4436 7411 Website: home.kpmg/qa
KPMG, Qatar Branch is registered with the Ministry of Commerce and Industry, State of Qatar, and a member firm of the KPMG global
organization of independent member firms affiliated with KPMG International Limited, a private English company limited by guarantee.
The KPMG name and logo are registered trademarks of KPMG International.

100 — QNB Annual Report 2021 QNB Annual Report 2021 — 101
Financial statements
SustainabilityC
orporate governanceR
iskO
perational performance
Strategic reportG
roup overview
Qatar National Bank (Q.P.S.C.)Independent auditor’s report To the shareholders of Qatar National Bank (Q.P.S.C.)
Qatar National Bank (Q.P.S.C.)Independent auditor’s report To the shareholders of Qatar National Bank (Q.P.S.C.)
INDEPENDENT AUDITORS’ REPORT (CONTINUED)
Auditors’ Responsibilities for the Audit of the Consolidated Financial Statements
Our objectives are to obtain reasonable assurance about whether the consolidated financial statements as a whole are free from material misstatement, whether due to fraud or error, and to issue an auditors’ report that includes our opinion. Reasonable assurance is a high level of assurance, but is not a guarantee that an audit conducted in accordance with ISA will always detect a material misstatement when it exists. Misstatements can arise from fraud or error and are considered material if, individually or in the aggregate, they could reasonably be expected to influence the economic decisions of users taken on the basis of these consolidated financial statements.
As part of an audit in accordance with ISA, we exercise professional judgement and maintain professional scepticism throughout the audit. We also:
– Identify and assess the risks of material misstatement of the consolidated financial statements,whether due to fraud or error, design and perform audit procedures responsive to those risks, andobtain audit evidence that is sufficient and appropriate to provide a basis for our opinion. The riskof not detecting a material misstatement resulting from fraud is higher than for one resulting fromerror, as fraud may involve collusion, forgery, intentional omissions, misrepresentations or the override of internal control.
– Obtain an understanding of internal control relevant to the audit in order to design auditprocedures that are appropriate in the circumstances, but not for the purpose of expressing anopinion on the effectiveness of the Group’s internal control.
– Evaluate the appropriateness of accounting policies used and the reasonableness of accountingestimates and related disclosures made by the Board of Directors.
– Conclude on the appropriateness of the Board of Directors’ use of the going concern basis ofaccounting and, based on the audit evidence obtained, whether a material uncertainty existsrelated to events or conditions that may cast significant doubt on the Group’s ability to continue as a going concern. If we conclude that a material uncertainty exists, we are required to drawattention in our auditors’ report to the related disclosures in the consolidated financial statementsor, if such disclosures are inadequate, to modify our opinion. Our conclusions are based on the audit evidence obtained up to the date of our auditors’ report. However, future events orconditions may cause the Group to cease to continue as a going concern.
– Evaluate the overall presentation, structure and content of the consolidated financial statements,including the disclosures, and whether the consolidated financial statements represent the underlying transactions and events in a manner that achieves fair presentation.
– Obtain sufficient appropriate audit evidence regarding the financial information of the entities orbusiness activities within the Group to express an opinion on the consolidated financial statements.We are responsible for the direction, supervision and performance of the group audit. We remainsolely responsible for our audit opinion.
INDEPENDENT AUDITORS’ REPORT (CONTINUED)
• Assessing the completeness, accuracy andrelevance of input data used.
• Evaluating the appropriateness and testing themathematical accuracy of ECL models applied.
• Evaluating the reasonableness of and testingthe post-model adjustments particularly in lightof the volatility caused due to impact of theCOVID-19 pandemic.
• Performing detailed credit risk assessment of asample of performing and non-performingloans and advances.
• Assessing the adequacy of the Group’sdisclosures in relation to IFRS 9 by reference tothe requirements of the relevant accountingstandards.
Other Information
The Board of Directors is responsible for the other information. The other information comprises the information included in the Bank’s Annual Report, but does not include the Bank’s consolidated financial statements and our auditors’ report thereon. Prior to the date of this auditors’ report, we obtained the statement of the Chairman which forms part of the Annual Report, and the remaining sections of the Annual Report are expected to be made available to us after that date.
Our opinion on the consolidated financial statements does not cover the other information and we do not and will not express any form of assurance conclusion thereon.
In connection with our audit of the consolidated financial statements, our responsibility is to read the other information identified above and, in doing so, consider whether the other information is materially inconsistent with the consolidated financial statements or our knowledge obtained in the audit, or otherwise appears to be materially misstated.
If, based on the work we have performed on the other information that we have obtained prior to the date of this auditors’ report, we conclude that there is a material misstatement of this other information, we are required to report that fact. We have nothing to report in this regard.
Responsibilities of Board of Directors for the Consolidated Financial Statements
The Board of Directors is responsible for the preparation and fair presentation of the consolidated financial statements in accordance with IFRS, and for such internal control as the Board of Directors determines is necessary to enable the preparation of consolidated financial statements that are free from material misstatement, whether due to fraud or error.
In preparing the consolidated financial statements, the Board of Directors is responsible for assessing the Group’s ability to continue as a going concern, disclosing, as applicable, matters related to going concern and using the going concern basis of accounting unless the Board of Directors either intends to liquidate the Group or to cease operations, or has no realistic alternative but to do so.
INDEPENDENT AUDITORS’ REPORT (CONTINUED)
Auditors’ Responsibilities for the Audit of the Consolidated Financial Statements
Our objectives are to obtain reasonable assurance about whether the consolidated financial statements as a whole are free from material misstatement, whether due to fraud or error, and to issue an auditors’ report that includes our opinion. Reasonable assurance is a high level of assurance, but is not a guarantee that an audit conducted in accordance with ISA will always detect a material misstatement when it exists. Misstatements can arise from fraud or error and are considered material if, individually or in the aggregate, they could reasonably be expected to influence the economic decisions of users taken on the basis of these consolidated financial statements.
As part of an audit in accordance with ISA, we exercise professional judgement and maintain professional scepticism throughout the audit. We also:
– Identify and assess the risks of material misstatement of the consolidated financial statements,whether due to fraud or error, design and perform audit procedures responsive to those risks, andobtain audit evidence that is sufficient and appropriate to provide a basis for our opinion. The riskof not detecting a material misstatement resulting from fraud is higher than for one resulting fromerror, as fraud may involve collusion, forgery, intentional omissions, misrepresentations or the override of internal control.
– Obtain an understanding of internal control relevant to the audit in order to design auditprocedures that are appropriate in the circumstances, but not for the purpose of expressing anopinion on the effectiveness of the Group’s internal control.
– Evaluate the appropriateness of accounting policies used and the reasonableness of accountingestimates and related disclosures made by the Board of Directors.
– Conclude on the appropriateness of the Board of Directors’ use of the going concern basis ofaccounting and, based on the audit evidence obtained, whether a material uncertainty existsrelated to events or conditions that may cast significant doubt on the Group’s ability to continue as a going concern. If we conclude that a material uncertainty exists, we are required to drawattention in our auditors’ report to the related disclosures in the consolidated financial statementsor, if such disclosures are inadequate, to modify our opinion. Our conclusions are based on the audit evidence obtained up to the date of our auditors’ report. However, future events orconditions may cause the Group to cease to continue as a going concern.
– Evaluate the overall presentation, structure and content of the consolidated financial statements,including the disclosures, and whether the consolidated financial statements represent the underlying transactions and events in a manner that achieves fair presentation.
– Obtain sufficient appropriate audit evidence regarding the financial information of the entities orbusiness activities within the Group to express an opinion on the consolidated financial statements.We are responsible for the direction, supervision and performance of the group audit. We remainsolely responsible for our audit opinion.
INDEPENDENT AUDITORS’ REPORT (CONTINUED)
Auditors’ Responsibilities for the Audit of the Consolidated Financial Statements
Our objectives are to obtain reasonable assurance about whether the consolidated financial statements as a whole are free from material misstatement, whether due to fraud or error, and to issue an auditors’ report that includes our opinion. Reasonable assurance is a high level of assurance, but is not a guarantee that an audit conducted in accordance with ISA will always detect a material misstatement when it exists. Misstatements can arise from fraud or error and are considered material if, individually or in the aggregate, they could reasonably be expected to influence the economic decisions of users taken on the basis of these consolidated financial statements.
As part of an audit in accordance with ISA, we exercise professional judgement and maintain professional scepticism throughout the audit. We also:
– Identify and assess the risks of material misstatement of the consolidated financial statements,whether due to fraud or error, design and perform audit procedures responsive to those risks, andobtain audit evidence that is sufficient and appropriate to provide a basis for our opinion. The riskof not detecting a material misstatement resulting from fraud is higher than for one resulting fromerror, as fraud may involve collusion, forgery, intentional omissions, misrepresentations or the override of internal control.
– Obtain an understanding of internal control relevant to the audit in order to design auditprocedures that are appropriate in the circumstances, but not for the purpose of expressing anopinion on the effectiveness of the Group’s internal control.
– Evaluate the appropriateness of accounting policies used and the reasonableness of accountingestimates and related disclosures made by the Board of Directors.
– Conclude on the appropriateness of the Board of Directors’ use of the going concern basis ofaccounting and, based on the audit evidence obtained, whether a material uncertainty existsrelated to events or conditions that may cast significant doubt on the Group’s ability to continue as a going concern. If we conclude that a material uncertainty exists, we are required to drawattention in our auditors’ report to the related disclosures in the consolidated financial statementsor, if such disclosures are inadequate, to modify our opinion. Our conclusions are based on the audit evidence obtained up to the date of our auditors’ report. However, future events orconditions may cause the Group to cease to continue as a going concern.
– Evaluate the overall presentation, structure and content of the consolidated financial statements,including the disclosures, and whether the consolidated financial statements represent the underlying transactions and events in a manner that achieves fair presentation.
– Obtain sufficient appropriate audit evidence regarding the financial information of the entities orbusiness activities within the Group to express an opinion on the consolidated financial statements.We are responsible for the direction, supervision and performance of the group audit. We remainsolely responsible for our audit opinion.

102 — QNB Annual Report 2021 QNB Annual Report 2021 — 103
Financial statements
SustainabilityC
orporate governanceR
iskO
perational performance
Strategic reportG
roup overview
Qatar National Bank (Q.P.S.C.)Independent auditor’s report To the shareholders of Qatar National Bank (Q.P.S.C.)
Qatar National Bank (Q.P.S.C.)Consolidated Statement of Financial PositionAs at 31 December 2021(All amounts are shown in thousands of Qatari Riyals)
Notes 2021 2020
ASSETS
Cash and balances with central banks 8 88,551,288 81,550,978
Due from banks 9 69,055,144 65,127,820
Loans and advances to customers 10 763,652,041 723,795,174
Investment securities 11 142,821,328 123,383,569
Investments in associates 12 7,467,009 7,064,652
Property and equipment 13 5,156,806 5,405,040
Intangible assets 14 3,886,786 3,946,963
Other assets 15 12,447,209 14,740,864
Total assets 1,093,037,611 1,025,015,060
LIABILITIES
Due to banks 16 111,441,572 87,953,723
Customer deposits 17 785,511,524 738,737,586
Debt securities 18 40,088,927 42,573,503
Other borrowings 19 26,138,239 27,901,487
Other liabilities 20 29,800,702 30,947,042
Total liabilities 992,980,964 928,113,341
EQUITY
Issued capital 22 9,236,429 9,236,429
Legal reserve 22 25,326,037 25,326,037
Risk reserve 22 10,000,000 9,000,000
Fair value reserve 22 (1,169,550) (1,811,051)
Foreign currency translation reserve 22 (23,613,712) (18,617,295)
Other reserves 22 46,141 166,050
Retained earnings 22 59,117,808 52,509,508
Total equity attributable to equity holders of the bank 78,943,153 75,809,678
Non-controlling interests 23 1,113,494 1,092,041
Instruments eligible for additional Tier 1 Capital 24 20,000,000 20,000,000
Total equity 100,056,647 96,901,719
Total liabilities and equity 1,093,037,611 1,025,015,060
These consolidated financial statements were approved by the Board of Directors on 11 January 2022 and were signed on its behalf by:
Ali Ahmed Al-KuwariChairman of the Board of Directors
Abdulla Mubarak Al-KhalifaGroup Chief Executive Officer
The attached notes 1 to 41 form an integral part of these consolidated financial statements.
INDEPENDENT AUDITORS’ REPORT (CONTINUED)
We communicate with the Board of Directors regarding, among other matters, the planned scope and timing of the audit and significant audit findings, including any significant deficiencies in internal control that we identify during our audit.
We also provide the Board of Directors with a statement that we have complied with relevant ethical requirements regarding independence, and communicate with them all relationships and other matters that may reasonably be thought to bear on our independence, and where applicable, actions taken to eliminate threats or safeguards applied.
From the matters communicated with the Board of Directors, we determine those matters that were of most significance in the audit of the consolidated financial statements of the current period and are therefore the key audit matters. We describe these matters in our auditors’ report unless law or regulation precludes public disclosure about the matter or when, in extremely rare circumstances, we determine that a matter should not be communicated in our report because the adverse consequences of doing so would reasonably be expected to outweigh the public interest benefits of such communication.
Report on Other Legal Requirements
As required by the Qatar Commercial Companies Law No. 11 of 2015, we also report that:
– We have obtained all the information and explanations we considered necessary for the purposes of ouraudit.
– The Bank has maintained proper accounting records and its consolidated financial statements are inagreement therewith.
– We have read the statement of the Chairman to be included in the Annual Report, and the financialinformation contained therein is in agreement with the books and records of the Bank.
– We are not aware of any violations of the applicable provisions of the Qatar Commercial Companies LawNo. 11 of 2015 or the terms of the Bank’s Articles of Association and any amendments thereto havingoccurred during the year which might have had a material effect on the Bank’s consolidated financialposition or performance as at and for the year ended 31 December 2021.
18 January 2022 Gopal Balasubramaniam Doha KPMG State of Qatar Qatar Auditors’ Registry Number 251
Licensed by QFMA: External Auditors’ License No. 120153
INDEPENDENT AUDITORS’ REPORT (CONTINUED)
Auditors’ Responsibilities for the Audit of the Consolidated Financial Statements
Our objectives are to obtain reasonable assurance about whether the consolidated financial statements as a whole are free from material misstatement, whether due to fraud or error, and to issue an auditors’ report that includes our opinion. Reasonable assurance is a high level of assurance, but is not a guarantee that an audit conducted in accordance with ISA will always detect a material misstatement when it exists. Misstatements can arise from fraud or error and are considered material if, individually or in the aggregate, they could reasonably be expected to influence the economic decisions of users taken on the basis of these consolidated financial statements.
As part of an audit in accordance with ISA, we exercise professional judgement and maintain professional scepticism throughout the audit. We also:
– Identify and assess the risks of material misstatement of the consolidated financial statements,whether due to fraud or error, design and perform audit procedures responsive to those risks, andobtain audit evidence that is sufficient and appropriate to provide a basis for our opinion. The riskof not detecting a material misstatement resulting from fraud is higher than for one resulting fromerror, as fraud may involve collusion, forgery, intentional omissions, misrepresentations or the override of internal control.
– Obtain an understanding of internal control relevant to the audit in order to design auditprocedures that are appropriate in the circumstances, but not for the purpose of expressing anopinion on the effectiveness of the Group’s internal control.
– Evaluate the appropriateness of accounting policies used and the reasonableness of accountingestimates and related disclosures made by the Board of Directors.
– Conclude on the appropriateness of the Board of Directors’ use of the going concern basis ofaccounting and, based on the audit evidence obtained, whether a material uncertainty existsrelated to events or conditions that may cast significant doubt on the Group’s ability to continue as a going concern. If we conclude that a material uncertainty exists, we are required to drawattention in our auditors’ report to the related disclosures in the consolidated financial statementsor, if such disclosures are inadequate, to modify our opinion. Our conclusions are based on the audit evidence obtained up to the date of our auditors’ report. However, future events orconditions may cause the Group to cease to continue as a going concern.
– Evaluate the overall presentation, structure and content of the consolidated financial statements,including the disclosures, and whether the consolidated financial statements represent the underlying transactions and events in a manner that achieves fair presentation.
– Obtain sufficient appropriate audit evidence regarding the financial information of the entities orbusiness activities within the Group to express an opinion on the consolidated financial statements.We are responsible for the direction, supervision and performance of the group audit. We remainsolely responsible for our audit opinion.

104 — QNB Annual Report 2021 QNB Annual Report 2021 — 105
Financial statements
SustainabilityC
orporate governanceR
iskO
perational performance
Strategic reportG
roup overview
Qatar National Bank (Q.P.S.C.)Consolidated Statement of Comprehensive IncomeFor the year ended 31 December 2021(All amounts are shown in thousands of Qatari Riyals)
Qatar National Bank (Q.P.S.C.)Consolidated Income StatementFor the year ended 31 December 2021(All amounts are shown in thousands of Qatari Riyals)
2021 2020
Profit for the year 13,276,100 12,082,661
Other comprehensive income that is or may be reclassified to the consolidated income statement in subsequent periods:
Foreign currency translation differences for foreign operations (5,020,969) (2,274,562)
Share of other comprehensive income of associates (119,981) (97,059)
Effective portion of changes in fair value of cash flow hedges 222,657 216,006
Effective portion of changes in fair value of net investment in foreign operation 713,760 (785,132)
Investments in debt instruments measured at FVOCI
- Net change in fair value (354,934) 248,203
- Net amount transferred to income statement – (67,359)
Other comprehensive income that will not be reclassified to the consolidated income statement in subsequent periods:
- Net change in fair value of investments in equity instruments designated at FVOCI 61,914 (95,320)
Total other comprehensive loss for the year, net of income tax (4,497,553) (2,855,223)
Total comprehensive income for the year 8,778,547 9,227,438
Attributable to:
Equity holders of the Bank 8,738,785 9,244,555
Non-controlling interests 39,762 (17,117)
Total comprehensive income for the year 8,778,547 9,227,438
Notes 2021 2020
Interest income 25 44,736,163 43,773,079
Interest expense 26 (21,700,043) (22,777,721)
Net interest income 23,036,120 20,995,358
Fee and commission income 27 4,535,149 3,971,535
Fee and commission expense (1,322,326) (955,431)
Net fee and commission income 3,212,823 3,016,104
Net foreign exchange gain 28 1,331,118 1,150,875
Income from investment securities 29 125,985 205,607
Other operating income 237,229 62,282
Operating income 27,943,275 25,430,226
Staff expenses 30 (3,382,058) (3,399,935)
Depreciation 13 (615,699) (664,164)
Other expenses 31 (2,294,345) (2,141,391)
Net ECL / impairment losses on loans and advances to customers 10 (7,066,008) (5,825,419)
Net ECL / impairment losses on investment securities (55,851) (69,004)
Net ECL / impairment losses on other financial assets (102,639) (142,783)
Amortisation of intangible assets (79,113) (76,804)
Other provisions (51,705) (36,161)
(13,647,418) (12,355,661)
Share of results of associates 12 370,208 109,734
Profit before income taxes 14,666,065 13,184,299
Income tax expense 32 (1,389,965) (1,101,638)
Profit for the year 13,276,100 12,082,661
Attributable to:
Equity holders of the Bank 13,211,123 12,002,867
Non-controlling interests 64,977 79,794
Profit for the year 13,276,100 12,082,661
Basic and diluted earnings per share (QR) 33 1.32 1.19
The attached notes 1 to 41 form an integral part of these consolidated financial statements.The attached notes 1 to 41 form an integral part of these consolidated financial statements.

106 — QNB Annual Report 2021 QNB Annual Report 2021 — 107
Financial statements
SustainabilityC
orporate governanceR
iskO
perational performance
Strategic reportG
roup overview
Qatar National Bank (Q.P.S.C.)Consolidated Statement of Changes in EquityFor the year ended 31 December 2021(All amounts are shown in thousands of Qatari Riyals)
Equity attributable to equity holders of the Bank
Non– controlling
interests
Instruments eligible for Additional
Tier 1 Capital TotalIssued capital
Legalreserve
Risk reserve
Fair value
reserve
Foreign currency
translationreserve
Otherreserves
Retained earnings
Equity attributable
to equity holders of the Bank
Balance at 1 January 2021 9,236,429 25,326,037 9,000,000 (1,811,051) (18,617,295) 166,050 52,509,508 75,809,678 1,092,041 20,000,000 96,901,719
Total comprehensive income for the year
Profit for the year – – – – – – 13,211,123 13,211,123 64,977 – 13,276,100
Total other comprehensive income/(loss) – – – 643,988 (4,996,417) (119,909) – (4,472,338) (25,215) – (4,497,553)
Total comprehensive income for the year – – – 643,988 (4,996,417) (119,909) 13,211,123 8,738,785 39,762 – 8,778,547
Reclassification of net change in fair value of equity instruments upon derecognition – – – (2,487) – – 2,487 – – – –
Transfer to risk reserve – – 1,000,000 – – – (1,000,000) – – – –
Transfer to social and sports fund – – – – – – (259,143) (259,143) – – (259,143)
Transactions recognised directly in equity
Dividend for the year 2020 (note 22) – – – – – – (4,156,393) (4,156,393) – – (4,156,393)
Dividend appropriation for instruments eligible for additional capital – – – – – – (1,000,000) (1,000,000) – – (1,000,000)
Other movements – – – – – – (189,774) (189,774) (18,309) – (208,083)
Total transactions recognised directly in equity – – – – – – (5,346,167) (5,346,167) (18,309) – (5,364,476)
Balance at 31 December 2021 9,236,429 25,326,037 10,000,000 (1,169,550) (23,613,712) 46,141 59,117,808 78,943,153 1,113,494 20,000,000 100,056,647
Balance at 1 January 2020 9,236,429 25,326,037 8,500,000 (1,347,274) (16,439,210) 263,729 48,059,481 73,599,192 1,119,976 20,000,000 94,719,168
Total comprehensive income for the year
Profit for the year – – – – – – 12,002,867 12,002,867 79,794 – 12,082,661
Total other comprehensive (loss)/income – – – (482,548) (2,178,085) (97,679) – (2,758,312) (96,911) – (2,855,223)
Total comprehensive income for the year – – – (482,548) (2,178,085) (97,679) 12,002,867 9,244,555 (17,117) – 9,227,438
Reclassification of net change in fair value of equity instruments upon derecognition – – – 18,771 – – (18,771) – – – –
Transfer to risk reserve – – 500,000 – – – (500,000) – – – –
Transfer to social and sports fund – – – – – – (219,467) (219,467) – – (219,467)
Transactions recognised directly in equity
Dividend for the year 2019 – – – – – – (5,541,857) (5,541,857) – – (5,541,857)
Dividend appropriation for instruments eligible for additional capital – – – – – – (1,000,000) (1,000,000) – – (1,000,000)
Other movements – – – – – – (272,745) (272,745) (10,818) – (283,563)
Total transactions recognised directly in equity – – – – – – (6,814,602) (6,814,602) (10,818) – (6,825,420)
Balance at 31 December 2020 9,236,429 25,326,037 9,000,000 (1,811,051) (18,617,295) 166,050 52,509,508 75,809,678 1,092,041 20,000,000 96,901,719
The attached notes 1 to 41 form an integral part of these consolidated financial statements.

108 — QNB Annual Report 2021 QNB Annual Report 2021 — 109
Financial statements
SustainabilityC
orporate governanceR
iskO
perational performance
Strategic reportG
roup overview
Qatar National Bank (Q.P.S.C.) Notes to the Consolidated Financial StatementsAs at and for the year ended 31 December 2021(All amounts are shown in thousands of Qatari Riyals)
1. Reporting entityQatar National Bank (Q.P.S.C.) (‘QNB’ or ‘the Bank’ or 'the Parent Bank') was incorporated in the State of Qatar on 6 June 1964 as a Joint Stock Company under Amiri Decree No. 7 issued in 1964. The registered office of the Bank is in Doha, State of Qatar.
The Bank together with its subsidiaries (together referred to as the ‘Group’) is engaged in conventional and Islamic banking activities operating through its branches, associates and subsidiaries.
The principal subsidiaries of the Group are as follows:
Name of subsidiaryCountry of
incorporation
Year ofincorporation/
acquisition Ownership %
QNB International Holdings Limited Luxembourg 2004 100
CSI QNB Property France 2008 100
QNB Capital LLC Qatar 2008 100
QNB Suisse S.A. Switzerland 2009 100
QNB Syria Syria 2009 50.8
QNB Finance Ltd. Cayman Islands 2010 100
QNB Indonesia Indonesia 2011 92.5
QNB Financial Services Qatar 2011 100
Al–Mansour Investment Bank Iraq 2012 54.2
QNB India Private Limited India 2013 100
QNB Tunisia Tunisia 2013 99.99
QNB ALAHLI Egypt 2013 95.0
QNB Finansbank Turkey 2016 99.88
QNB (Derivatives) Limited Cayman Islands 2017 100
2. Basis of preparation
a) Statement of complianceThe consolidated financial statements have been prepared in accordance with International Financial Reporting Standards (‘IFRS’).
b) Basis of measurementsThe consolidated financial statements have been prepared on the historical cost basis, except for the following items, which are measured at fair value:
> Derivative financial instruments > Investments measured at fair value through profit or loss ('FVPL') > Other financial assets designated at fair value through profit or loss ('FVPL') > Financial investment measured at fair value through other comprehensive income ('FVOCI') > Recognised financial assets and financial liabilities designated as hedged items in qualifying fair value hedge relationships
to the extent of risks being hedged.
c) Functional and presentation currencyThese consolidated financial statements are presented in Qatari Riyals (‘QR’), which is the Bank’s functional and presentation currency. Except as otherwise indicated, financial information presented in QR has been rounded to the nearest thousands.
d) Use of estimates and judgements The preparation of the consolidated financial statements in conformity with IFRS requires management to make judgements, estimates and assumptions that affect the application of accounting policies and the reported amounts of assets, liabilities, income and expenses. Actual figures may differ from these estimates.
Estimates and underlying assumptions are reviewed on an ongoing basis. Revisions to accounting estimates are recognised in the period in which the estimate is revised and in any future periods affected.
Information about significant areas of estimation uncertainty and critical judgements in applying accounting policies that have the most significant effect on the amounts recognised in the consolidated financial statements are described in note 5.
Qatar National Bank (Q.P.S.C.)Consolidated Statement of Cash FlowsFor the year ended 31 December 2021(All amounts are shown in thousands of Qatari Riyals)
Notes 2021 2020
Cash flows from operating activitiesProfit before income taxes 14,666,065 13,184,299
Adjustments for:Interest income (44,736,163) (43,773,079)
Interest expense 21,700,043 22,777,721
Depreciation 13 615,699 664,164
Net ECL / impairment losses on loans and advances to customers 10 7,066,008 5,825,419
Net ECL / impairment losses on investment securities 55,851 69,004
Net ECL / impairment losses on other financial assets 102,639 142,783
Other provisions 100,290 93,162
Dividend income 29 (47,198) (48,365)
Net gain on sale of property and equipment (49,406) (17,881)
Net gain on sale of investment securities 29 (59,492) (120,745)
Amortisation of intangible assets 79,113 76,804
Net amortisation of premium or discount on investments (970,336) (1,629,308)
Net share of results of associates (256,673) (63,830)
(1,733,560) (2,819,852)Changes in:Due from banks (5,063,696) 1,558,999
Loans and advances to customers (81,430,647) (56,876,857)
Other assets (10,678,206) (6,135,498)
Due to banks 32,175,130 11,825,389
Customer deposits 82,244,426 57,835,092
Other liabilities (866,094) 2,227,437
Cash from operations 14,647,353 7,614,710 Interest received 43,974,692 35,952,097
Interest paid (21,580,593) (17,964,730)
Dividends received 47,198 48,365
Income tax paid (1,245,157) (864,513)
Other provisions paid (56,863) (44,880)
Net cash from operating activities 35,786,630 24,741,049
Cash flows from investing activities
Acquisition of investment securities (96,932,320) (111,997,115)
Proceeds from sale / redemption of investment securities 74,114,534 85,139,198
Investment in an associate (305,578) –
Additions to property and equipment 13 (1,173,874) (1,167,928)
Proceeds from disposal of property and equipment 64,505 20,681
Net cash used in investing activities (24,232,733) (28,005,164)
Cash flows from financing activities
Payment of coupon on instruments eligible for Additional Tier 1 Capital (1,000,000) (1,000,000)
Proceeds from issuance of debt securities 18 8,748,885 12,142,592
Repayment of debt securities 18 (10,754,896) (3,815,091)
Proceeds from issuance of other borrowings 19 11,259,064 17,710,213
Repayment of other borrowings 19 (10,419,936) (15,325,322)
Payment of lease liabilities (239,951) (274,052)
Dividends paid (4,162,715) (5,533,350)
Net cash (used in)/from financing activities (6,569,549) 3,904,990
Net increase in cash and cash equivalents 4,984,348 640,875 Effects of exchange rate fluctuations on cash held (807,228) (885,380)
Cash and cash equivalents at 1 January 102,483,340 102,727,845
Cash and cash equivalents at 31 December 39 106,660,460 102,483,340
The attached notes 1 to 41 form an integral part of these consolidated financial statements.

110 — QNB Annual Report 2021 QNB Annual Report 2021 — 111
Financial statements
SustainabilityC
orporate governanceR
iskO
perational performance
Strategic reportG
roup overview3. Significant accounting policies (continued)
When the Group ceases to have control or significant influence, any retained interest in the entity is re–measured to its fair value, with the change in carrying amount recognised in profit or loss. The fair value is the initial carrying amount for the purposes of subsequent accounting for the retained interest as an associate, joint venture or financial asset. In addition, any amounts previously recognised in other comprehensive income in respect of that entity are accounted for as if the Group had directly disposed of the related assets or liabilities. This may mean that amounts previously recognised in other comprehensive income are transferred to the consolidated income statement.
If the ownership interest in an associate is reduced but significant influence is retained, only a proportionate share of the amounts previously recognised in other comprehensive income is transferred to the consolidated income statement where appropriate.
(v) Transactions eliminated on consolidation Intra–group balances, transactions and unrealised gains arising from intra–group transactions, are eliminated in preparing the consolidated financial statements. Unrealised losses are also eliminated only to the extent that there is no Expected Credit Losses (‘ECL’) or impairment.
(vi) Associates Associates are entities over which the Group has significant influence but not control, generally accompanying a shareholding of between 20% and 50% of the voting rights.
Investments in associates are accounted using the equity method of accounting and are initially recognised at cost (including transaction costs directly related to acquisition of investment in the associate). The Group’s investment in associates includes goodwill (net of any accumulated impairment losses) identified on acquisition.
The Group’s share of its associates’ post–acquisition profits or losses is recognised in the consolidated income statement, its share of post–acquisition movements in other comprehensive income of the associate is recognised in reserves. The cumulative post–acquisition movements are adjusted against the carrying amount of the investment. When the Group’s share of losses in an associate equals or exceeds its interest in the associate, including any other unsecured receivables, the Group does not recognise further losses, unless it has incurred obligations or made payments on behalf of the associate. Dilution gains and losses in associates are recognised in the consolidated income statement.
For preparation of the consolidated financial statements, equal accounting policies for similar transactions and other events in similar circumstances are used.
The Group’s share of the results of associates is based on the financial statements made up to a date not earlier than three months before the date of the consolidated statement of financial position, adjusted to conform with the accounting policies of the Group. Intergroup gains on transactions are eliminated to the extent of the Group’s interest in the investee.
(vii) Funds management The Group manages and administers assets held in unit trusts and other investment vehicles on behalf of investors. The financial statements of these entities are not included in these consolidated financial statements, except when the Group controls the entity. Information about the Group’s funds management is set out in note 37.
b) Foreign currency
(i) Foreign currency transactions and balances Foreign currency transactions are transactions denominated, or that require settlement, in a foreign currency and are translated into the respective functional currencies of the operations at the spot exchange rates on the dates of the transactions.
Monetary assets and liabilities denominated in foreign currencies at the reporting date are translated into the functional currency at the spot exchange rate on that date. Non–monetary assets and liabilities denominated in foreign currencies that are measured at fair value are re–translated into the functional currency at the spot exchange rate on the date that the fair value was determined. Non–monetary assets and liabilities that are measured in terms of historical cost in a foreign currency are translated using the exchange rate on the date of the transaction. Foreign currency differences resulting from the settlement of foreign currency transactions and arising on translation at period end exchange rates of monetary assets and liabilities denominated in foreign currencies are recognised in the consolidated income statement.
Changes in the fair value of investment securities denominated in a foreign currency classified as measured at FVOCI are analysed between translation differences resulting from changes in the amortised cost of the security and other changes in the carrying amount of security. Translation differences related to changes in amortised cost are recognised in the consolidated income statement, and other changes in the carrying amount are recognised in other comprehensive income.
Translation differences on non–monetary financial assets, such as equity instruments classified as measured at FVOCI are included in other comprehensive income.
3. Significant accounting policies The accounting policies set out below have been applied consistently to all periods presented in these consolidated financial statements, except for the effects of adoption of new standards as described in note 3(ab).
a) Basis of consolidation The consolidated financial statements comprise the financial statements of the Group and its subsidiaries as at the end of the reporting period.
(i) Business combinations For acquisitions meeting the definition of a business under IFRS 3, the acquisition method of accounting is used as at the acquisition date, which is the date on which control is transferred to the Group.
The Group measures goodwill at the acquisition date as the total of:
> The fair value of the consideration transferred; plus > The recognised amount of any non–controlling interest in the acquiree; plus if the business combination is achieved
in stages, the fair value of the existing equity interest in the acquiree; less > The net recognised amount (generally fair value) of the identifiable assets acquired, including any assets which
the acquiree has not previously recognised, and liabilities assumed.
When this total is negative, a bargain purchase gain is recognised immediately in the consolidated income statement.
The consideration transferred does not include amounts related to the settlement of pre–existing relationships. Such amounts are generally recognised in the consolidated income statement.
Costs related to the acquisition, other than those associated with the issue of debt or equity securities, that the Group incurs in connection with a business combination are expensed as incurred.
Any contingent consideration payable is recognised at fair value at the acquisition date. If the contingent consideration is classified as equity, it is not re–measured and settlement is accounted for within equity. Otherwise, subsequent changes to the fair value of the contingent consideration are recognised in the consolidated income statement.
If the business combination is achieved in stages, any previously held equity interest is re–measured at its acquisition date at fair value and any resulting gain or loss is recognised in the consolidated income statement. It is then considered in the determination of goodwill.
(ii) Subsidiaries Subsidiaries are all entities (including structured entities) controlled by the Group. The financial statements of subsidiaries are included in the consolidated financial statements from the date that control commences until the date that control ceases.
Control is achieved when the Group is exposed, or has rights, to variable returns from its involvement with the investee and has the ability to affect those returns through its power over the investee.
The accounting policies of subsidiaries have been aligned to the Group accounting policies.
(iii) Loss of control Upon the loss of control, the Group derecognises the assets and liabilities of the subsidiary, any non–controlling interests and the other components of equity related to the subsidiary. Any surplus or deficit arising on the loss of control is recognised in the consolidated income statement. If the Group retains any interest in the former subsidiary, then such interest is measured at fair value at the date that control is lost. Subsequently, it is accounted for as an equity–accounted investee or in accordance with the Group’s accounting policy for financial instruments, depending on the level of influence retained.
(iv) Non–controlling interests and transactions therewith The Group has elected to measure the non–controlling interests in the acquiree at the proportionate share of the acquiree’s identifiable net assets. Interests in the equity of subsidiaries not attributable to the Bank are reported in the consolidated equity as non–controlling interests. Profits or losses attributable to non–controlling interests are reported in the consolidated income statement as profit or loss attributable to non–controlling interests. Losses applicable to the non–controlling interest in a subsidiary are allocated to the non–controlling interest even if doing so causes the non–controlling interest to have a deficit balance.
The Group treats transactions with non–controlling interests as transactions with equity holders of the Group. For purchases from non–controlling interests, the difference between any consideration paid and the relevant share acquired of the carrying value of net assets of the subsidiary is recorded in equity. Gains or losses on disposals to non–controlling interests are also recorded in equity.
Qatar National Bank (Q.P.S.C.) Notes to the Consolidated Financial StatementsAs at and for the year ended 31 December 2021(All amounts are shown in thousands of Qatari Riyals)
Qatar National Bank (Q.P.S.C.) Notes to the Consolidated Financial StatementsAs at and for the year ended 31 December 2021(All amounts are shown in thousands of Qatari Riyals)

112 — QNB Annual Report 2021 QNB Annual Report 2021 — 113
Financial statements
SustainabilityC
orporate governanceR
iskO
perational performance
Strategic reportG
roup overview3. Significant accounting policies (continued)
Financial assets that are held for trading or managed and whose performance is evaluated on a fair value basis are measured at FVPL because they are neither held to collect contractual cash flows nor held both to collect contractual cash flows and to sell financial assets.
Assessment of whether contractual cash flows are solely payments of principal and interest For the purposes of this assessment, ‘principal’ is defined as the fair value of the financial asset on initial recognition. ‘Interest’ is defined as consideration for the time value of money and for the credit risk associated with the principal amount outstanding during a particular period of time and for other basic lending risks and costs (e.g. liquidity risk and administrative costs), as well as profit margin.
In assessing whether the contractual cash flows are solely payments of principal and interest, the Group considers the contractual terms of the instrument. This includes assessing whether the financial asset contains a contractual term that could change the timing or amount of contractual cash flows such that it would not meet this condition. In making the assessment, the Group considers contingent events that would change the amount and timing of cash flows, prepayment and extension terms, terms that limit the Group’s claim to cash flows from specified assets and features that modify consideration of the time value of money.
ReclassificationsFinancial assets are not reclassified subsequent to their initial recognition, except in the period after the Group changes its business model for managing financial assets.
Financial liabilities The Group has classified and measured its financial liabilities at amortised cost.
(iii) Derecognition
Financial assets The Group derecognises a financial asset when the contractual rights to the cash flows from the financial asset expire, or when it transfers the financial asset in a transaction in which substantially all the risks and rewards of ownership of the financial asset are transferred, or in which the Group neither transfers nor retains substantially all the risks and rewards of ownership and it does not retain control of the financial asset.
Any interest in transferred financial assets that qualify for derecognition that is created or retained by the Group is recognised as a separate asset or liability in the statement of financial position.
On derecognition of a financial asset, the difference between the carrying amount of the asset (or the carrying amount allocated to the portion of the asset transferred), and consideration received (including any new asset obtained less any new liability assumed) and any cumulative gain or loss that had been recognised in OCI is recognised in the consolidated income statement, except in case of equity investment securities designated at FVOCI, where this difference is recognised in OCI and is not recognised in the consolidated income statement on derecognition of such securities.
The Group enters into transactions whereby it transfers assets recognised on its statement of financial position, but retains either all or substantially all of the risks and rewards of the transferred assets or a portion of them. If all or substantially all risks and rewards are retained, then the transferred assets are not derecognised. Transfers of assets with retention of all or substantially all risks and rewards include, for example, securities lending and repurchase transactions.
When assets are sold to a third party with a concurrent total rate of return swap on the transferred assets, the transaction is accounted for as a secured financing transaction similar to repurchase transactions as the Group retains all or substantially all the risks and rewards of ownership of such assets.
In transactions in which the Group neither retains nor transfers substantially all the risks and rewards of ownership of a financial asset and it retains control over the asset, the Group continues to recognise the asset to the extent of its continuing involvement, determined by the extent to which it is exposed to changes in the value of the transferred asset.
In certain transactions, the Group retains the obligation to service the transferred financial asset for a fee. The transferred asset is derecognised if it meets the derecognition criteria. An asset or liability is recognised for the servicing contract, depending on whether the servicing fee is more than adequate (asset) or is less than adequate (liability) for performing the servicing.
Financial liabilitiesThe Group derecognises a financial liability when its contractual obligations are discharged or cancelled or expired.
3. Significant accounting policies (continued)
(ii) Foreign operations The results and financial position of all the Group’s entities, that have a functional currency different from the presentation currency are translated into the presentation currency as follows:
> Assets and liabilities for each statement of financial position presented are translated at the closing rate at the reporting date;
> Income and expenses for each income statement are translated at average exchange rates (unless this average is not a reasonable approximation of the cumulative effect of the rates prevailing on the transaction dates, in which case income and expenses are translated at the dates of the transactions); and
> All resulting exchange differences are recognised in other comprehensive income.
Exchange differences arising from the above process are reported in shareholders’ equity as ‘foreign currency translation reserve’.
When a foreign operation is disposed of, or partially disposed of when the control is not retained, such exchange differences are recognised in the consolidated income statement as part of the gain or loss on sale.
Goodwill and fair value adjustments arising on the acquisition of a foreign entity are treated as assets and liabilities of the foreign entity and translated at the closing rate.
When the settlement of a monetary item receivable from or payable to a foreign operation is neither planned nor likely in the foreseeable future, foreign exchange gains and losses arising from such a monetary item are considered to form part of the net investment in the foreign operation and are recognised in other comprehensive income, and presented in the foreign currency translation reserve in equity.
c) Financial assets and financial liabilities
(i) Recognition The Group initially recognises loans and advances to customers, due from / to banks, customer deposits, debt securities and other borrowings on the date at which they are originated. All other financial assets and liabilities are initially recognised on the trade date at which the Group becomes a party to the contractual provisions of the instrument.
(ii) Classification and initial measurement
Financial assets On initial recognition, a financial asset is classified as measured at: amortised cost, FVOCI or FVPL.
A financial asset is measured at amortised cost if it meets both of the following conditions and is not designated at FVPL:
> The asset is held within a business model whose objective is to hold assets to collect contractual cash flows; and > The contractual terms of the financial asset give rise on specified dates to cash flows that are solely payments of principal
and interest on the principal amount outstanding.
A debt instrument is measured at FVOCI only if it meets both of the following conditions and is not designated at FVPL:
> The asset is held within a business model whose objective is achieved by both collecting contractual cash flows and selling financial assets; and
> The contractual terms of the financial asset give rise on specified dates to cash flows that are solely payments of principal and interest on the principal amount outstanding.
On initial recognition of an equity investment that is not held for trading, the Group may irrevocably elect to present subsequent changes in fair value in OCI. This election is made on an investment–by–investment basis.
All other financial assets are classified as measured at FVPL.
In addition, on initial recognition, the Group may irrevocably designate a financial asset that otherwise meets the requirements to be measured at amortised cost or at FVOCI or at FVPL if doing so eliminates or significantly reduces an accounting mismatch that would otherwise arise.
Business model assessmentThe Group makes an assessment of the objective of a business model in which a financial asset is held at a portfolio level because this best reflects the way the business is managed and information is provided to management. The information considered includes:
> The stated policies and objectives for the portfolio and the operation of those policies in practice; > How the performance of the portfolio is evaluated and reported to the Group’s management; > The risks that affect the performance of the business model (and the financial assets held within that business model) and
how those risks are managed; > How managers of the business are compensated; and > The frequency, volume and timing of sales in prior periods, the reasons for such sales and its expectations about future
sales activity.
Qatar National Bank (Q.P.S.C.) Notes to the Consolidated Financial StatementsAs at and for the year ended 31 December 2021(All amounts are shown in thousands of Qatari Riyals)
Qatar National Bank (Q.P.S.C.) Notes to the Consolidated Financial StatementsAs at and for the year ended 31 December 2021(All amounts are shown in thousands of Qatari Riyals)
Qatar National Bank (Q.P.S.C.) Notes to the Consolidated Financial StatementsAs at and for the year ended 31 December 2021(All amounts are shown in thousands of Qatari Riyals)

114 — QNB Annual Report 2021 QNB Annual Report 2021 — 115
Financial statements
SustainabilityC
orporate governanceR
iskO
perational performance
Strategic reportG
roup overview3. Significant accounting policies (continued)
Assets and long positions are measured at bid price; liabilities and short positions are measured at ask price. Where the Group has positions with offsetting risks, mid–market prices are used to measure the offsetting risk positions and a bid or asking price adjustment is applied only to the net open position as appropriate. Fair values reflect the credit risk of the instrument and include adjustments to take account of the credit risk of the Group entity and the counterparty, where appropriate. Fair value estimates obtained from models are adjusted for any other factors, such as liquidity risk or model uncertainties; to the extent that the Group believes a third–party market participant would take them into account in pricing a transaction.
(vii) Expected credit losses (ECL) / impairment The Group recognises loss allowances for expected credit losses (ECL) / impairment on the following financial instruments that are not measured at FVPL:
> Financial assets that are debt instruments; and > Loan commitments and financial guarantee contracts.
No ECL / impairment loss is recognised on equity instruments. Impairment and ECL are used interchangeably throughout these consolidated financial statements.
The Group measures loss allowances at an amount equal to lifetime ECL, except for the following, for which they are measured as 12–month ECL:
> Debt investment securities that are determined to have low credit risk at the reporting date; and > Other financial instruments on which credit risk has not increased significantly since their initial recognition.
12–month ECL are the portion of ECL that result from default events on financial instruments that are possible with the 12 months after the reporting date.
Measurement of ECLECL are a probability–weighted estimate of credit losses. They are measured as follows:
> Financial assets that are not credit–impaired at the reporting date: as the present value of all cash shortfalls (i.e. the difference between the cash flows due to the entity in accordance with the contract and the cash flows that the Group expects to receive);
> Financial assets that are credit–impaired at the reporting date: as the difference between the gross carrying amount and the present value of estimated future cash flows;
> Undrawn loan commitments: as the present value of the difference between the contractual cash flows that are due to the Group if the commitment is drawn down and the cash flows that the Group expects to receive; and
> Financial guarantee contracts: the expected payments to reimburse the holder less any amounts that the Group expects to recover.
When discounting future cash flows, the original effective interest rate or an approximation thereof is used for most financial assets.
Restructured financial assetsIf the terms of a financial asset are renegotiated or modified or an existing financial asset is replaced with a new one due to financial difficulties of the borrower, then an assessment is made of whether the financial asset should be derecognised and ECL / impairment are measured as follows:
> If the expected restructuring will not result in derecognition of the existing asset, then the expected cash flows arising from the modified financial asset are included in calculating the cash shortfalls from the existing asset.
> If the expected restructuring will result in derecognition of the existing asset, then the expected fair value of the new asset is treated as the final cash flow from the existing financial asset at the time of its derecognition. This amount is included in calculating the cash shortfalls from the existing financial asset that are discounted from the expected date of derecognition to the reporting date using the original effective interest rate of the existing financial asset.
Credit–impaired financial assetsAt each reporting date, the Group assesses whether financial assets carried at amortised cost and debt financial assets carried at FVOCI are credit impaired. A financial asset is ‘credit–impaired’ when one or more events that have a detrimental impact on the estimated future cash flows of the financial asset have occurred.
Evidence that a financial asset is credit–impaired includes the following observable data:
> Significant financial difficulty of the borrower or issuer; > A breach of contract such as a default or past due event; > The restructuring of a loan or advance by the Group on terms that the Group would not consider otherwise; > It is becoming probable that the borrower will enter bankruptcy or other financial reorganisation; or > The disappearance of an active market for a security because of financial difficulties.
3. Significant accounting policies (continued)
Interest Rate Benchmark ReformWhen the basis for determining the contractual cash flows of a financial asset or financial liability measured at amortised cost changed as a result of interest rate benchmark reform, the Group updated the effective interest rate of the financial asset or financial liability to reflect the change that is required by the reform. A change in the basis for determining the contractual cash flows is required by interest rate benchmark reform if the following conditions are met:
> the change is necessary as a direct consequence of the reform; and > the new basis for determining the contractual cash flows is economically equivalent to the previous basis – i.e. the basis
immediately before the change.
When changes were made to a financial asset or financial liability in addition to changes to the basis for determining the contractual cash flows required by interest rate benchmark reform, the Group first updated the effective interest rate of the financial asset or financial liability to reflect the change that is required by interest rate benchmark reform. After that, the Group applied the policies on accounting for modifications to the additional changes.
(iv) Modification of financial assets and liabilities
Financial assetsIf the terms of a financial asset are modified, the Group evaluates whether the cash flows of the modified asset are substantially different. If the cash flows are substantially different, then the contractual rights to cash flows from the original financial asset are deemed to have expired. In this case, the original financial asset is derecognised and a new financial asset is recognised at fair value.
If the cash flows of the modified asset carried at amortised cost are not substantially different, then the modification does not result in derecognition of the financial asset. In this case, the Group recalculates the gross carrying amount of the financial asset and recognises the amount arising from adjusting the gross carrying amount as a modification gain or loss in the consolidated income statement. If such a modification is carried out because of financial difficulties of the borrower, then the gain or loss is presented together with ECL / impairment losses. In other cases, it is presented as interest income.
Financial liabilitiesThe Group derecognises a financial liability when its terms are modified and the cash flows of the modified liability are substantially different. In this case, a new financial liability based on the modified terms is recognised at fair value. The difference between the carrying amount of the financial liability extinguished and the new financial liability with modified terms is recognised in the consolidated income statement.
(v) Offsetting Financial assets and liabilities are offset and the net amount presented in the statement of financial position when, and only when, the Group has a legal right to set off the recognised amounts and it intends either to settle on a net basis or to realise the asset and settle the liability simultaneously.
Income and expenses are presented on a net basis only when permitted under IFRS, or for gains and losses arising from a group of similar transactions such as in the Group’s trading activity.
(vi) Measurement principles
Amortised cost measurementThe amortised cost of a financial asset or liability is the amount at which the financial asset or liability is measured at initial recognition, minus principal repayments, plus or minus the cumulative amortisation using the effective interest rate method of any difference between the initial amount recognised and the maturity amount, minus any reduction for ECL/impairment loss. The calculation of effective interest rate includes all fees paid or received that are an integral part of the effective interest rate.
Fair value measurement Fair value is the price that would be received to sell an asset or paid to transfer a liability in an orderly transaction between market participants at the measurement date in the principal market of the asset or liability, or in the absence of a principal market, in the most advantageous market for the asset or liability which the Group has access to as at that date. The fair value of a liability reflects its non–performance risk.
The fair value for financial instruments traded in active markets at the reporting date is based on their quoted market price or dealer price quotations (bid prices). For unlisted investments, the Group recognises any change in the fair value, when they have reliable indicators to support such a change.
The fair value of investments in mutual funds and portfolios, whose units are unlisted, are measured at the net asset value adjusted for market characteristics reported as at the end of the reporting period.
Qatar National Bank (Q.P.S.C.) Notes to the Consolidated Financial StatementsAs at and for the year ended 31 December 2021(All amounts are shown in thousands of Qatari Riyals)
Qatar National Bank (Q.P.S.C.) Notes to the Consolidated Financial StatementsAs at and for the year ended 31 December 2021(All amounts are shown in thousands of Qatari Riyals)

116 — QNB Annual Report 2021 QNB Annual Report 2021 — 117
Financial statements
SustainabilityC
orporate governanceR
iskO
perational performance
Strategic reportG
roup overview3. Significant accounting policies (continued)
h) Derivatives
(i) Derivatives held for risk management purposes and hedge accounting Derivatives held for risk management purposes include all derivative assets and liabilities that are not classified as trading assets or liabilities. Derivatives held for risk management purposes are measured at fair value on the statement of financial position. The Group designates certain derivatives held for risk management as well as certain non–derivative financial instruments as hedging instruments in qualifying hedging relationships. On initial designation of the hedge, the Group formally documents the relationship between the hedging derivative instrument(s) and hedged item(s), including the risk management objective and strategy in undertaking the hedge, together with the method that will be used to assess the effectiveness of the hedging relationship. The Group makes an assessment, both at the inception of the hedge relationship as well as on an ongoing basis, as to whether the hedging instrument(s) is (are) expected to be highly effective in offsetting the changes in the fair value or cash flows of the respective hedged item(s) during the period for which the hedge is designated, and on an ongoing basis. The Group makes an assessment for a cash flow hedge of a forecast transaction, as to whether the forecast transaction is highly probable to occur and presents an exposure to variations in cash flows that could ultimately affect the consolidated income statement.
For the purpose of evaluation of hedge effectiveness, the Group has applied relief required Interbank Offered Rate (IBOR) Reforms Phase 2 amendments.
Fair value hedges When a derivative is designated as the hedging instrument in a hedge of the change in fair value of a recognised asset or liability or a firm commitment that could affect the consolidated income statement, changes in the fair value of the derivative are recognised immediately in profit or loss together with changes in the fair value of the hedged item that are attributable to the hedged risk. If the hedging derivative expires or is sold, terminated, or exercised, or the hedge no longer meets the criteria for fair value hedge accounting, or the hedge designation is revoked, then hedge accounting is discontinued prospectively. Any adjustment up to that point to a hedged item, for which the effective interest rate method is used, is amortised to the consolidated income statement as part of the recalculated effective interest rate of the item over its remaining life.
Cash flow hedges When a derivative is designated as the hedging instrument in a hedge of the variability in cash flows attributable to a particular risk associated with a recognised asset or liability or a highly probable forecast transaction that could affect the consolidated income statement, the effective portion of changes in the fair value of the derivative is recognised in other comprehensive income in the hedging reserve. The amount recognised in other comprehensive income is reclassified to consolidated income statement as a reclassification adjustment in the same period as the hedged cash flows affect consolidated income statement, and in the same line item in the statement of comprehensive income. Any ineffective portion of changes in the fair value of the derivative is recognised immediately in the consolidated income statement.
If the hedging derivative expires or is sold, terminated, or exercised, or the hedge no longer meets the criteria for cash flow hedge accounting, or the hedge designation is revoked, then hedge accounting is discontinued prospectively. In a discontinued hedge of a forecast transaction the cumulative amount recognised in other comprehensive income from the period when the hedge was effective is reclassified from equity to the consolidated income statement as a reclassification adjustment when the forecast transaction occurs and affects the consolidated income statement. If the forecast transaction is no longer expected to occur, then the balance in other comprehensive income is reclassified immediately to the consolidated income statement as a reclassification adjustment.
Hedges of a net investment in foreign operationHedges of a net investment in a foreign operation, including a hedge of a monetary item that is accounted for as part of the net investment, are accounted for in a way similar to cash flow hedges. Gains or losses on the hedging instrument relating to the effective portion of the hedge are recognised as other comprehensive income while any gains or losses relating to the ineffective portion are recognised in the consolidated income statement. On disposal of the foreign operation, the cumulative value of any such gains or losses recorded in equity is transferred to the consolidated income statement.
Other non–trading derivatives When a derivative is not held for trading, and is not designated in a qualifying hedge relationship, all changes in its fair value are recognised immediately in the consolidated income statement.
3. Significant accounting policies (continued)
Financial guarantee contracts heldThe Group assesses whether a financial guarantee contract held is an integral element of a financial asset that is accounted for as a component of that instrument or is a contract that is accounted for separately. If the Group determines that the guarantee is an integral element of the financial asset, then the Group considers the effect of the protection when measuring the fair value of the financial asset and when measuring ECL.
d) Cash and cash equivalentsCash and cash equivalents include notes and coins on hand, unrestricted balances held with central banks and highly liquid financial assets with original maturities of three months or less that are subject to an insignificant risk of change in their fair value, and are used by the Group in the management of its short–term commitments. Cash and cash equivalents are carried at amortised cost in the consolidated statement of financial position.
e) Due from banks Due from banks are financial assets which are mainly money market placements with fixed or determinable payments and fixed maturities that are not quoted in an active market. Money market placements are not entered into with the intention of immediate or short–term resale. Due from banks are initially measured at cost, being the fair value of the consideration given. Following the initial recognition, due from banks are stated at amortised cost.
f) Loans and advances to customers Loans and advances to customers are non–derivative financial assets with fixed or determinable payments that are not quoted in an active market and that the Group does not intend to sell immediately or in the near term.
Loans and advances to customers are initially measured at the transaction price, which is the fair value plus incremental direct transaction costs, and subsequently measured at their amortised cost using the effective interest rate method, except for the financial assets which are classified to be measured at FVPL, which are measured at fair value with changes recognised immediately in the consolidated income statement. Following the initial recognition, loans and advances are stated at the amortised cost.
When the Group purchases a financial asset and simultaneously enters into an agreement to resell the asset (or a substantially similar asset) at a fixed price on a future date (reverse repo or stock borrowing), the arrangement is accounted for as a loan or advance, and the underlying asset is not recognised in the Group’s consolidated financial statements.
g) Investment securitiesThe ‘investment securities’ include:
> Debt investment securities measured at amortised cost; these are initially measured at fair value plus incremental direct transaction costs, and subsequently at their amortised cost using the effective interest method;
> Debt and equity investment securities mandatorily measured at FVPL or designated as at FVPL; these are measured at fair value with fair value changes recognised immediately in consolidated income statement;
> Debt securities measured at FVOCI; and > Equity investment securities designated as at FVOCI.
For debt securities measured at FVOCI, gains and losses are recognised in OCI, except for the following, which are recognised in consolidated income statement in the same manner as for financial assets measured at amortised cost:
> Interest revenue using the effective interest method; > ECL / impairment and reversals; and > Foreign exchange gains and losses.
When a debt security measured at FVOCI is derecognised, the cumulative gain or loss previously recognised in OCI is reclassified from equity to consolidated income statement.
The Group elects to present in OCI changes in the fair value of certain investments in equity. The election is made on an instrument by instrument basis on initial recognition and is irrevocable. Gains and losses on such equity instruments are never reclassified to consolidated income statement and no ECL / impairment is recognised in consolidated income statement. Dividends are recognised in consolidated income statement, unless they clearly represent a recovery of part of the cost of the investment, in which case they are recognised in OCI. Cumulative gains and losses recognised in OCI are transferred to retained earnings on disposal of an investment.
Qatar National Bank (Q.P.S.C.) Notes to the Consolidated Financial StatementsAs at and for the year ended 31 December 2021(All amounts are shown in thousands of Qatari Riyals)
Qatar National Bank (Q.P.S.C.) Notes to the Consolidated Financial StatementsAs at and for the year ended 31 December 2021(All amounts are shown in thousands of Qatari Riyals)

118 — QNB Annual Report 2021 QNB Annual Report 2021 — 119
Financial statements
SustainabilityC
orporate governanceR
iskO
perational performance
Strategic reportG
roup overview3. Significant accounting policies (continued)
The estimated useful lives for the current and prior years are as follows:Years
Buildings 10 to 50
Equipment and furniture 3 to 12
Motor vehicles 4 to 7
Leasehold improvements 4 to 10
Freehold land is stated at cost.
Depreciation methods, useful lives and residual values are reassessed at each reporting date and adjusted prospectively, if appropriate.
j) Intangible assets Goodwill that arises upon the acquisition of subsidiaries is included under intangible assets. Subsequent to initial recognition, goodwill is measured at cost less accumulated impairment losses. Intangible assets also include Core Deposit Intangibles (‘CDI’) acquired in a business combination which are recognised at fair value at the acquisition date. CDI has a finite useful life and is carried at cost less accumulated amortisation. Amortisation is calculated using the straight–line method to allocate the cost of CDI and licences over their estimated useful life ranging between 6 and 12 years. Intangible assets (such as operating licenses) with indefinite useful lives are not amortised, but are tested for impairment annually, either individually or at the Cash Generating Unit (‘CGU’) level.
k) Impairment of non–financial assets The carrying amounts of the Group’s non–financial assets, other than deferred tax assets, are reviewed at each reporting date to determine whether there is any indication of impairment. If any such indication exists, then the asset’s recoverable amount is estimated. For goodwill and intangible assets that have indefinite useful lives or that are not yet available for use, the recoverable amount is estimated each year at the same time. An impairment loss is recognised if the carrying amount of an asset or its CGU exceeds its estimated recoverable amount.
The recoverable amount of an asset or CGU is the greater of its value in use and its fair value less costs to sell. In assessing value in use, the estimated future cash flows are discounted to their present value using a pre–tax discount rate that reflects current market assessments of the time value of money and the risks specific to the asset or CGU.
For the purpose of impairment testing, assets that cannot be tested individually are grouped together into the smallest group of assets that generate cash inflow from continuing use, that are largely independent of the cash inflows of other assets or CGUs. Subject to an operating segment ceiling test, for the purposes of goodwill impairment testing, CGUs to which goodwill has been allocated are aggregated, so that the level at which impairment testing is performed reflects the lowest level at which goodwill is monitored for internal reporting purposes. Goodwill acquired in a business combination is allocated to the groups of CGUs that are expected to benefit from the synergies of the combination.
The Group’s corporate assets do not generate separate cash inflows and are utilised by more than one CGU. Corporate assets are allocated to CGUs on a reasonable and consistent basis and tested for impairment as part of the testing of the CGU to which the corporate asset is allocated.
Impairment losses are recognised in the consolidated income statement. Impairment losses recognised in respect of CGUs are allocated first to reduce the carrying amount of any goodwill allocated to the CGU (group of CGUs) and then to reduce the carrying amount of the other assets in the CGU (group of CGUs) on a pro–rata basis.
An impairment loss in respect of goodwill is not reversed. In respect of other assets, impairment losses recognised in prior periods are assessed at each reporting date, for any indications that the loss has decreased or no longer exists. An impairment loss is reversed if there has been a change in the estimates used to determine the recoverable amount. An impairment loss is reversed only to the extent that the asset’s carrying amount does not exceed the carrying amount that would have been determined, net of depreciation or amortisation, if no impairment loss had been recognised.
l) Provisions A provision is recognised if, as a result of a past event, the Group has a present legal or constructive obligation that can be estimated reliably, and it is probable that an outflow of economic benefits will be required to settle the obligation. Provisions are determined by discounting the expected future cash flows at a pre–tax rate that reflects current market assessments of the time value of money and, where appropriate, the risks specific to the liability.
m) Financial guarantees Financial guarantees are contracts that require the Group to make specified payments to reimburse the holder for a loss it incurs because a specified debtor fails to make payment when due in accordance with the terms of a debt instrument. Financial guarantee liabilities are recognised initially at their fair value, and the initial fair value is amortised over the life of the financial guarantee. The financial guarantee liability is subsequently carried at the higher of this amortised amount and the present value of any expected payment when a payment under the guarantee has become probable.
3. Significant accounting policies (continued)
Hedges directly affected by interest rate benchmark reformThe Group has adopted the Phase 2 amendments and retrospectively applied them from 1 January 2021.
When the basis for determining the contractual cash flows of the hedged item or hedging instrument changes as a result of IBOR reform and therefore there is no longer uncertainty arising about the cash flows of the hedged item or the hedging instrument, the Group amends the hedge documentation of that hedging relationship to reflect the change(s) required by IBOR reform. For this purpose, the hedge designation is amended only to make one or more of the following changes:
> designating an alternative benchmark rate as the hedged risk; > updating the description of the hedged item, including the description of the designated portion of the cash flows or fair
value being hedged; or > updating the description of the hedging instrument.
The Group amends the description of the hedging instrument only if the following conditions are met:
> it makes a change required by IBOR reform by changing the basis for determining the contractual cash flows of the hedging instrument or using another approach that is economically equivalent to changing the basis for determining the contractual cash flows of the original hedging instrument; and
> the original hedging instrument is not derecognised.
The Group amends the formal hedge documentation by the end of the reporting period during which a change required by IBOR reform is made to the hedged risk, hedged item or hedging instrument. These amendments in the formal hedge documentation do not constitute the discontinuation of the hedging relationship or the designation of a new hedging relationship.
If changes are made in addition to those changes required by IBOR reform described above, then the Group first considers whether those additional changes result in the discontinuation of the hedge accounting relationship. If the additional changes do not result in the discontinuation of the hedge accounting relationship, then the Group amends the formal hedge documentation for changes required by IBOR reform as mentioned above.
When the interest rate benchmark on which the hedged future cash flows had been based is changed as required by IBOR reform, for the purpose of determining whether the hedged future cash flows are expected to occur, the Group deems that the hedging reserve recognised in other comprehensive income for that hedging relationship is based on the alternative benchmark rate on which the hedged future cash flows will be based.
(ii) Derivatives held for trading purposes The Group’s derivative trading instruments includes forward foreign exchange contracts and interest rate swaps. The Group sells these derivatives to customers in order to enable them to transfer, modify or reduce current and future risks. These derivative instruments are fair valued as at the end of the reporting date and the corresponding fair value changes are taken to the consolidated income statement.
i) Property and equipment
(i) Recognition and measurement Items of property and equipment are measured at cost less accumulated depreciation and accumulated impairment losses.
Purchased software that is integral to the functionality of the related equipment is capitalised as part of that equipment.
When parts of an item of property or equipment have different useful lives, they are accounted for as separate items (major components) of property and equipment.
The gain or loss on disposal of an item of property and equipment is determined by comparing the proceeds from disposal with the carrying amount of the item of property and equipment, and is recognised in other income / other expenses in the consolidated income statement.
(ii) Subsequent costs The cost of replacing a component of an item of property or equipment is recognised in the carrying amount of the item, if it is probable that the future economic benefits embodied within the part will flow to the Group and its cost can be measured reliably. The carrying amount of the replaced part is derecognised. The costs of the day–to–day servicing of property and equipment are recognised in the consolidated income statement as incurred.
(iii) Depreciation The depreciable amount is the cost of property and equipment, or other amount substituted for cost, less its residual value. Depreciation is recognised in the consolidated income statement on a straight–line basis over the estimated useful lives of each part of an item of property and equipment as this closely reflects the expected pattern of consumption of the future economic benefits embodied in the asset and is based on cost of the asset less its estimated residual value. Land is not depreciated.
Qatar National Bank (Q.P.S.C.) Notes to the Consolidated Financial StatementsAs at and for the year ended 31 December 2021(All amounts are shown in thousands of Qatari Riyals)
Qatar National Bank (Q.P.S.C.) Notes to the Consolidated Financial StatementsAs at and for the year ended 31 December 2021(All amounts are shown in thousands of Qatari Riyals)
Qatar National Bank (Q.P.S.C.) Notes to the Consolidated Financial StatementsAs at and for the year ended 31 December 2021(All amounts are shown in thousands of Qatari Riyals)
120 — QNB Annual Report 2021 QNB Annual Report 2021 — 121
Financial statements
SustainabilityC
orporate governanceR
iskO
perational performance
Strategic reportG
roup overview3. Significant accounting policies (continued)
t) Taxation Taxes are calculated based on tax laws and regulations in jurisdictions in which the Group operates. The amount of the tax payable or receivable is the best estimate of the tax amount expected to be paid or received that reflects uncertainty related to income taxes. The parent company operations inside Qatar are not subject to income tax. QNB Capital LLC's operations are subject to tax as per the Qatar Financial Centre Authority tax regulations. QNB Financial Services Limited's operations are subject to income tax based on non–resident share of owners in the parent company. Deferred tax assets are recognised for deductible temporary differences, carry forward of unused tax credits and unused tax losses, to the extent it is probable that taxable profit will be available to utilise these. Deferred tax liabilities are recognised for taxable temporary differences. Deferred tax assets and liabilities are measured using tax rates that are expected to be applied to temporary differences when they reverse, using tax rates enacted or substantively enacted at the reporting date, and reflects uncertainty related to income taxes, if any.
u) Earnings per share The Group presents basic and diluted earnings per share (‘EPS’) data for its ordinary shares. Basic EPS is calculated by dividing the profit or loss attributable to equity holders of the Bank, further adjusted for the dividend appropriation for instruments eligible for Additional Tier 1 Capital, if any, by the weighted average number of ordinary shares outstanding during the period. Diluted EPS is determined by adjusting the profit or loss attributable to equity holders and the weighted average number of ordinary shares outstanding for the effects of all dilutive potential ordinary shares.
v) Segment reporting An operating segment is a component of the Group that engages in business activities from which it may earn revenues and incur expenses, including revenues and expenses that relate to transactions with any of the Group’s other components, whose operating results are reviewed regularly by the Group management committees to make decisions about resources allocated to each segment and assess its performance, and for which discrete financial information is available.
w) Fiduciary activities The Group acts as fund manager and in other fiduciary capacities that result in the holding or placing of assets on behalf of individuals, corporates and other institutions. These assets and any income arising thereon are excluded from these consolidated financial statements, as they are not assets of the Group.
x) Repossessed collateral Repossessed collateral against settlement of customers’ debts are stated within the consolidated statement of financial position under ‘Other assets’ at their acquisition value net of allowance for impairment.
According to Qatar Central Bank (QCB) instructions, the Group should dispose of any land and properties acquired against settlement of debts, for Qatar operations, within a period not exceeding three years from the date of acquisition although this period can be extended after obtaining approval from QCB.
y) Comparatives Except when a standard or an interpretation permits or requires otherwise, all amounts are reported or disclosed with comparative information.
z) Appropriations for Instruments Eligible for Additional Capital Appropriations for Instruments Eligible for Additional Capital are treated as dividends.
aa) LeasesAt inception of a contract, the Group assesses whether a contract is, or contains, a lease based on if the contract conveys the right to control the use of an identified asset for a period of time in exchange for consideration. The Group has decided to separate the lease and non–lease component in the underlying contracts based on their relative standalone prices.
The Group recognises a right–of–use asset and a lease liability at the lease commencement date. The right–of–use asset is initially measured at cost, which comprises the initial amount of the lease liability adjusted for any prepaid and accrued lease expenses. The right–of–use asset is subsequently depreciated using the straight–line method over the shorter of the lease term and their useful lives unless it is reasonably certain that the Group will obtain ownership by the end of the lease term. In addition, the right–of–use asset is periodically reduced by impairment losses, if any, and is adjusted for extension in lease terms or cancellation of the leases.
The lease liability is initially measured at the present value of the lease payments which are discounted using the interest rate implicit in the lease or, if that rate cannot be readily determined, the Group’s incremental borrowing rate, which is based on the weighted average rate applied in the Group’s principal markets adjusted for the nature of the asset, lease term, security and any other relevant assumptions. The lease liability is subsequently measured at amortised cost using the effective interest method. The finance cost incurred related to the lease liabilities is included in the ‘interest expense’ in the consolidated income statement.
3. Significant accounting policies (continued)
n) Employee benefits
Defined benefit plan – expatriate employees The Group makes a provision for all termination indemnity payable to employees in accordance with its regulations, calculated on the basis of the individual’s final salary and period of service at the end of the reporting period. The expected costs of these benefits are accrued over the period of employment. The provision for employees’ termination benefits is included in other provisions within other liabilities.
Defined contribution scheme – Qatari employees With respect to Qatari employees, the Group makes a contribution to the State administered Qatari Pension Fund calculated as a percentage of the employees’ salaries. The Group’s obligations are limited to these contributions. The cost is considered as part of staff expenses and is disclosed in note 30.
o) Share capital and reserves (i) Share issue costs Incremental costs directly attributable to the issue of an equity instrument are deducted from the initial measurement of the equity instruments.
(ii) Dividends on ordinary shares Dividends on ordinary shares are recognised in equity in the period in which they are approved by the Bank’s shareholders. Dividends for the year that are declared after the end of the reporting period are dealt as a separate disclosure.
p) Interest income and expense Interest income and expense are recognised in the consolidated income statement using the effective interest rate method. The effective interest rate is the rate that exactly discounts the estimated future cash payments and receipts through the expected life of the financial asset or liability (or, where appropriate, a shorter period) to the carrying amount of the financial asset or liability. When calculating the effective interest rate, the Group estimates future cash flows considering all contractual terms of the financial instrument, but not future credit losses.
For the financial assets that have become credit–impaired subsequent to initial recognition, interest income is calculated by applying the effective interest rate to the net carrying amount of the financial asset. If the asset is no longer credit–impaired, then the calculation of interest income reverts to the gross basis.
The calculation of the effective interest rate includes all transaction costs and fees paid or received that are an integral part of the effective interest rate. Transaction costs include incremental costs that are directly attributable to the acquisition or issue of a financial asset or liability.
Interest income and expense include:
> Interest on financial assets and financial liabilities measured at amortised cost calculated on an effective interest rate basis; > The effective portion of fair value changes in qualifying hedging derivatives designated in cash flow hedges of variability
in interest cash flows, in the same period that the hedged cash flows affect interest income / expense; > The ineffective portion of fair value changes in qualifying hedging derivatives designated in cash flow hedges of interest
rate risk; and > Fair value changes in qualifying derivatives and related hedged items, related to hedge ineffectiveness, in fair value
hedges of interest rate risk.
q) Fee and commission income and expense Fees and commission income and expense that are integral to the effective interest rate on a financial asset or liability are included in the measurement of the effective interest rate.
Other fee and commission income, including account servicing fees, investment management fees, sales commission, placement fees and syndication fees, are recognised over time as the related services are performed. When a loan commitment is not expected to result in the draw–down of a loan, the related loan commitment fees are recognised over time on a straight–line basis over the commitment period. In case of these services, the control is considered to be transferred over time as the customer is benefited from these services over the tenure of the service period. Other fee and commission expense relate mainly to transaction and service fee, which are recognised in the consolidated income statement as an expense as the services are received.
r) Income from investment securities Gains or losses on the sale of investment securities are recognised in the consolidated income statement as the difference between fair value of the consideration received and the carrying amount of the investment securities, except in the case of equity securities designated as at FVOCI, where any cumulative gain / loss recognised in OCI is not recognised in the consolidated income statement on derecognition of such securities.
s) Dividend income Dividend income is recognised when the right to receive income is established.
Qatar National Bank (Q.P.S.C.) Notes to the Consolidated Financial StatementsAs at and for the year ended 31 December 2021(All amounts are shown in thousands of Qatari Riyals)
Qatar National Bank (Q.P.S.C.) Notes to the Consolidated Financial StatementsAs at and for the year ended 31 December 2021(All amounts are shown in thousands of Qatari Riyals)
Qatar National Bank (Q.P.S.C.) Notes to the Consolidated Financial StatementsAs at and for the year ended 31 December 2021(All amounts are shown in thousands of Qatari Riyals)

122 — QNB Annual Report 2021 QNB Annual Report 2021 — 123
Financial statements
SustainabilityC
orporate governanceR
iskO
perational performance
Strategic reportG
roup overview4. Financial risk management
I) Financial instruments
Definition and classification Financial instruments cover all financial assets and liabilities of the Group. Financial assets include cash balances, on demand balances and placements with banks, investment securities, loans and advances to customers and banks and certain other financial assets. Financial liabilities include customer deposits, due to banks and certain other financial liabilities. Financial instruments also include contingent liabilities and commitments included in off–balance sheet items and derivative financial instruments.
Note 3 explains the accounting policies used to recognise and measure the major financial instruments and their related income and expense.
II) Risk management
a) Risk management framework Risk is inherent in the Group’s activities but it is managed through a process of ongoing identification, measurement and monitoring, subject to risk limits and other controls. This process of risk management is critical to the Group’s continuing profitability and each individual within the Group is accountable for the risk exposures relating to their responsibilities. The Group is exposed to credit risk, liquidity risk, operational risk and market risk, which include trading and non–trading risks.
Risk management structure The Board of Directors is ultimately responsible for identifying and controlling risks, however, there are separate independent bodies responsible for managing and monitoring risks.
Risk CommitteeThe Risk Committee has the overall responsibility for the development of the risk strategy and implementing principles, frameworks, policies and limits.
Risk measurement and reporting systems Monitoring and controlling risks is primarily performed based on limits established by the Group. These limits reflect the business strategy and market environment of the Group as well as the level of risk that the Group is willing to accept, with additional emphasis on selected industries.
Information compiled from all businesses is examined and processed in order to analyse, control and identify early risks. This information is presented and explained to the Board of Directors, the Risk Committee and the head of each business division.
Internal AuditRisk management processes throughout the Group are audited by the Group Internal Audit function, as part of each audit which examines both the adequacy and compliance with the procedures, in addition to the specific audit of the Group risk function itself as per the approved audit plan. Internal Audit discusses the results of all assessments with management and reports its findings and recommendations to the Group Board Audit and Compliance Committee.
Risk mitigation As part of its overall risk management, the Group uses derivatives and other instruments to manage exposures resulting from changes in interest rates, foreign currencies, equity risks, credit risks and exposures arising from forecast transactions. The risk profile is assessed before entering into hedge transactions, which are authorised by the appropriate level of seniority within the Group.
The effectiveness of all hedge relationships is monitored by Risk Management on a monthly basis. In a situation of hedge ineffectiveness, the Group will enter into a new hedge relationship to mitigate risk on a continuous basis.
b) Credit risk The Group manages its credit risk exposure through diversification of its investments, capital markets and lending and financing activities to avoid undue concentrations of risks with individuals or groups of customers in specific locations or businesses. It also obtains collaterals where appropriate. The types of collaterals obtained may include cash, treasury bills and bonds, mortgages over real estate properties and pledges over shares.
The Group uses the same credit risk procedures when entering into derivative transactions as it does for traditional lending products.
Note 10 discloses the distribution of loans and advances and financing activities by industry wise sector. Note 35 discloses the geographical distribution of the Group’s assets and liabilities.
3. Significant accounting policies (continued)
The Group has elected not to recognise right–of–use assets and lease liabilities for leases of low–value assets (where the leased asset value is less than USD10,000) and short–term leases (where the lease term is less than 12 months). The Group recognises the lease payments associated with these leases as an expense on a straight–line basis over the lease term.
The Group presents right–of–use assets in ‘property and equipment’ and lease liabilities in ‘other liabilities’ in the consolidated statement of financial position. The deferred tax impact, if any, is recognised in accordance with the relevant tax regulations and is accounted under IAS 12.
ab) New amendments to standardsThe following amendments to IFRS have been applied by the Group in preparation of these consolidated financial statements. The below were effective from 1 January 2021:
Amendment to standards Effective date
COVID–19 Related Rent Concessions (Amendment to IFRS 16) 1 January 2021
Interest Rate Benchmark Reform – Phase 2 (Amendments to IFRS 9, IAS 39, IFRS 7, IFRS 4 and IFRS 16) 1 January 2021
Effective from 1 January 2021, the Group has adopted Interest Rate Benchmark Reform – Phase 2 (Amendments to IFRS 9, IAS 39, IFRS 7, IFRS 4 and IFRS 16). These amendments provide practical relief from certain requirements in IFRS. These reliefs relate to modifications of financial instruments and lease contracts or hedging relationships triggered by a replacement of a benchmark interest rate in a contract with a new alternative benchmark rate.
If the basis for determining the contractual cash flows of a financial asset or financial liability measured at amortised cost changed as a result of interest rate benchmark reform, then the Group updated the effective interest rate of the financial asset or financial liability to reflect the change that is required by the reform. A change in the basis for determining the contractual cash flows is required by interest rate benchmark reform if the following conditions are met:
> the change is necessary as a direct consequence of the reform; and > the new basis for determining the contractual cash flows is economically equivalent to the previous basis – i.e. the basis
immediately before the change.
The Phase 2 amendments provide a series of temporary exceptions from certain hedge accounting requirements when a change required by interest rate benchmark reform occurs to a hedged item and/or hedging instrument that permits the hedging relationship to be continued without interruption. The Group applied the following reliefs as and when uncertainty arising from interest rate benchmark reform was no longer present with respect to the timing and amount of the interest rate benchmark based cash flows of the hedged item or hedging instrument:
> the Group amended the designation of a hedging relationship to reflect changes that were required by the reform without discontinuing the hedging relationship; and
> when a hedged item in a cash flow hedge was amended to reflect the changes that were required by the reform, the amount accumulated in the cash flow hedge reserve was deemed to be based on the alternative benchmark rate on which the hedged future cash flows are determined.
The Group applied the Phase 2 amendments retrospectively. However, in accordance with the exceptions permitted in the Phase 2 amendments, the Group has elected not to restate comparatives for the prior periods to reflect the application of these amendments. Since the Group had no transactions for which the benchmark rate had been replaced with an alternative benchmark rate as at 31 December 2020, there is no impact on opening equity balances as a result of retrospective application.
ac) Standards issued but not yet effectiveThe forthcoming requirements of new Standard and amendments to existing Standards are applicable for future reporting periods. The Group will adopt these on annual periods beginning on or after the effective date.
Standards / Amendment to standards Effective date
COVID–19–Related Rent Concessions beyond 30 June 2021 (Amendment to IFRS 16) 1 January 2022
Onerous Contracts – Cost of Fulfilling a Contract (Amendments to IAS 37) 1 January 2022
Annual Improvements to IFRS Standards 2018 – 2020 1 January 2022
Property, Plant and Equipment: Proceeds before Intended Use (Amendments to IAS 16) 1 January 2022
Reference to the Conceptual Framework (Amendments to IFRS 3) 1 January 2022
Classification of Liabilities as Current or Non–current (Amendments to IAS 1) 1 January 2023
IFRS 17 Insurance Contracts and amendments to IFRS 17 Insurance Contracts 1 January 2023
Definition of Accounting Estimate (Amendments to IAS 8) 1 January 2023
Disclosure of Accounting Policies (Amendments to IAS 1 and IFRS Practice Statement 2) 1 January 2023
Deferred Tax related to Assets and Liabilities arising from a Single Transaction (Amendments to IAS 12) 1 January 2023
Sale or Contribution of Assets between an Investor and its Associate or Joint Venture (Amendments to IFRS 10 and IAS 28)
Deferred indefinitely
Qatar National Bank (Q.P.S.C.) Notes to the Consolidated Financial StatementsAs at and for the year ended 31 December 2021(All amounts are shown in thousands of Qatari Riyals)
Qatar National Bank (Q.P.S.C.) Notes to the Consolidated Financial StatementsAs at and for the year ended 31 December 2021(All amounts are shown in thousands of Qatari Riyals)
Qatar National Bank (Q.P.S.C.) Notes to the Consolidated Financial StatementsAs at and for the year ended 31 December 2021(All amounts are shown in thousands of Qatari Riyals)
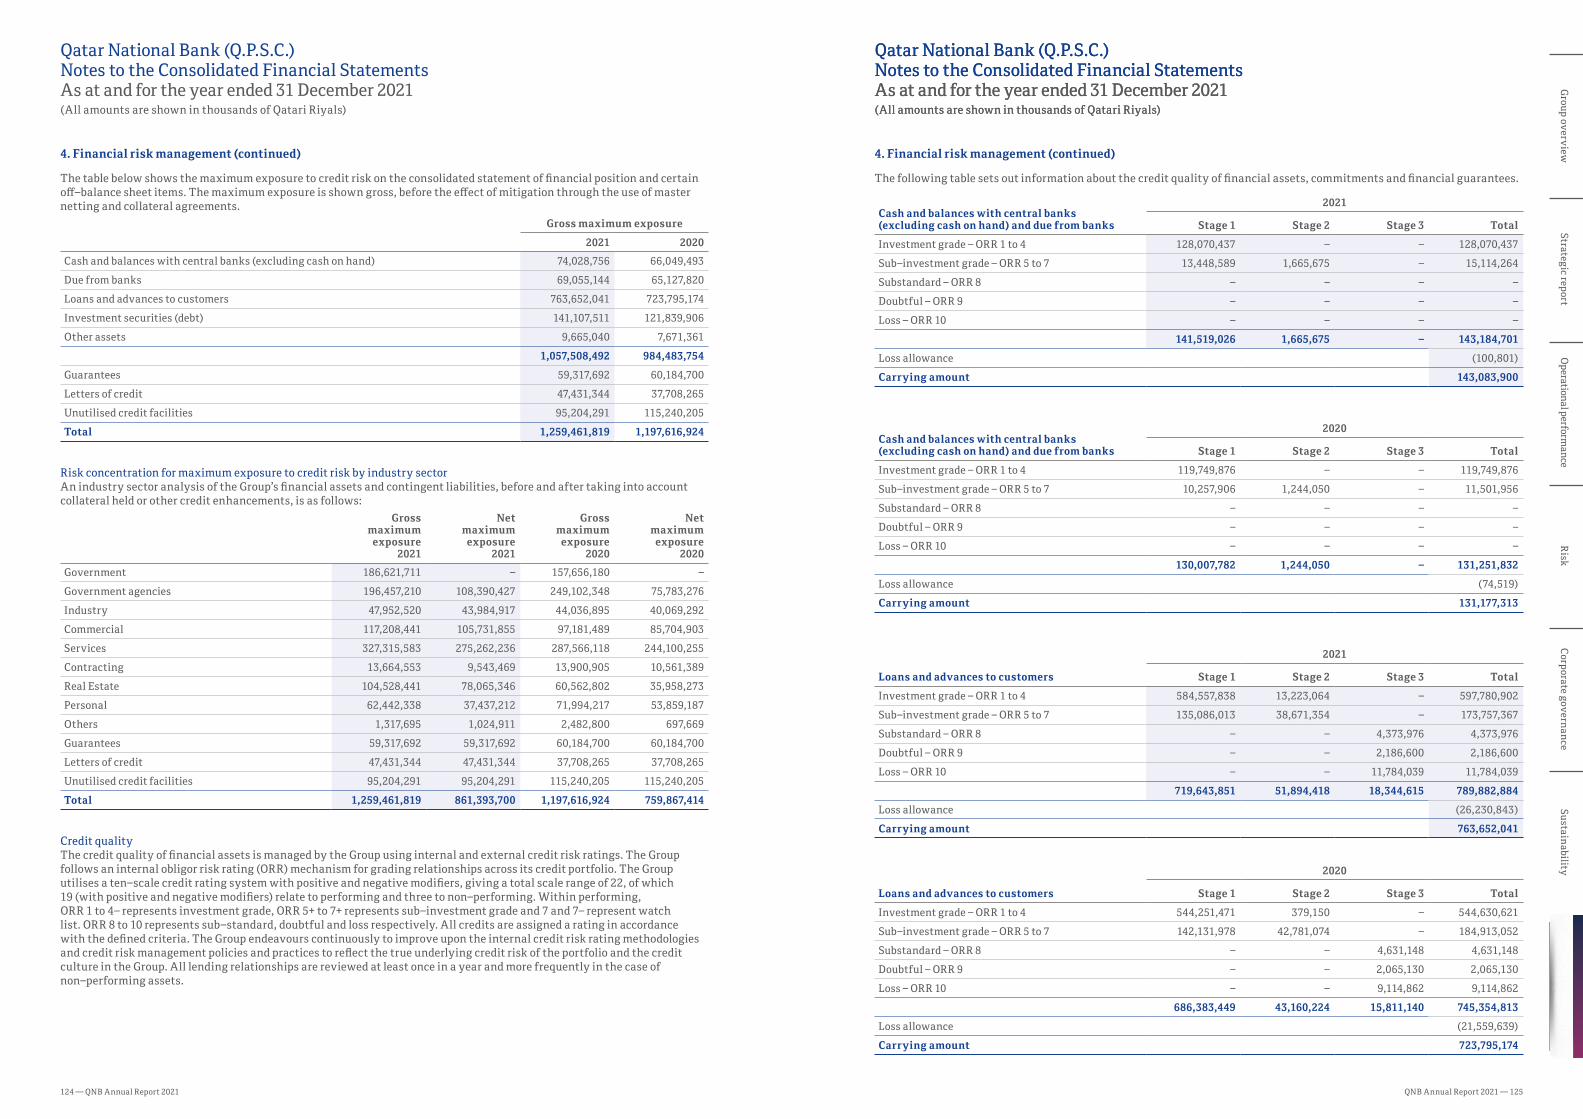
124 — QNB Annual Report 2021 QNB Annual Report 2021 — 125
Financial statements
SustainabilityC
orporate governanceR
iskO
perational performance
Strategic reportG
roup overview4. Financial risk management (continued)
The following table sets out information about the credit quality of financial assets, commitments and financial guarantees.
Cash and balances with central banks (excluding cash on hand) and due from banks
2021
Stage 1 Stage 2 Stage 3 Total
Investment grade – ORR 1 to 4 128,070,437 – – 128,070,437
Sub–investment grade – ORR 5 to 7 13,448,589 1,665,675 – 15,114,264
Substandard – ORR 8 – – – –
Doubtful – ORR 9 – – – –
Loss – ORR 10 – – – –
141,519,026 1,665,675 – 143,184,701
Loss allowance (100,801)
Carrying amount 143,083,900
Cash and balances with central banks (excluding cash on hand) and due from banks
2020
Stage 1 Stage 2 Stage 3 Total
Investment grade – ORR 1 to 4 119,749,876 – – 119,749,876
Sub–investment grade – ORR 5 to 7 10,257,906 1,244,050 – 11,501,956
Substandard – ORR 8 – – – –
Doubtful – ORR 9 – – – –
Loss – ORR 10 – – – –
130,007,782 1,244,050 – 131,251,832
Loss allowance (74,519)
Carrying amount 131,177,313
Loans and advances to customers
2021
Stage 1 Stage 2 Stage 3 Total
Investment grade – ORR 1 to 4 584,557,838 13,223,064 – 597,780,902
Sub–investment grade – ORR 5 to 7 135,086,013 38,671,354 – 173,757,367
Substandard – ORR 8 – – 4,373,976 4,373,976
Doubtful – ORR 9 – – 2,186,600 2,186,600
Loss – ORR 10 – – 11,784,039 11,784,039
719,643,851 51,894,418 18,344,615 789,882,884
Loss allowance (26,230,843)
Carrying amount 763,652,041
Loans and advances to customers
2020
Stage 1 Stage 2 Stage 3 Total
Investment grade – ORR 1 to 4 544,251,471 379,150 – 544,630,621
Sub–investment grade – ORR 5 to 7 142,131,978 42,781,074 – 184,913,052
Substandard – ORR 8 – – 4,631,148 4,631,148
Doubtful – ORR 9 – – 2,065,130 2,065,130
Loss – ORR 10 – – 9,114,862 9,114,862
686,383,449 43,160,224 15,811,140 745,354,813
Loss allowance (21,559,639)
Carrying amount 723,795,174
4. Financial risk management (continued)
The table below shows the maximum exposure to credit risk on the consolidated statement of financial position and certain off–balance sheet items. The maximum exposure is shown gross, before the effect of mitigation through the use of master netting and collateral agreements.
Gross maximum exposure
2021 2020
Cash and balances with central banks (excluding cash on hand) 74,028,756 66,049,493
Due from banks 69,055,144 65,127,820
Loans and advances to customers 763,652,041 723,795,174
Investment securities (debt) 141,107,511 121,839,906
Other assets 9,665,040 7,671,361
1,057,508,492 984,483,754
Guarantees 59,317,692 60,184,700
Letters of credit 47,431,344 37,708,265
Unutilised credit facilities 95,204,291 115,240,205
Total 1,259,461,819 1,197,616,924
Risk concentration for maximum exposure to credit risk by industry sector An industry sector analysis of the Group’s financial assets and contingent liabilities, before and after taking into account collateral held or other credit enhancements, is as follows:
Grossmaximum
exposure2021
Netmaximum
exposure2021
Grossmaximum
exposure2020
Netmaximum
exposure2020
Government 186,621,711 – 157,656,180 –
Government agencies 196,457,210 108,390,427 249,102,348 75,783,276
Industry 47,952,520 43,984,917 44,036,895 40,069,292
Commercial 117,208,441 105,731,855 97,181,489 85,704,903
Services 327,315,583 275,262,236 287,566,118 244,100,255
Contracting 13,664,553 9,543,469 13,900,905 10,561,389
Real Estate 104,528,441 78,065,346 60,562,802 35,958,273
Personal 62,442,338 37,437,212 71,994,217 53,859,187
Others 1,317,695 1,024,911 2,482,800 697,669
Guarantees 59,317,692 59,317,692 60,184,700 60,184,700
Letters of credit 47,431,344 47,431,344 37,708,265 37,708,265
Unutilised credit facilities 95,204,291 95,204,291 115,240,205 115,240,205
Total 1,259,461,819 861,393,700 1,197,616,924 759,867,414
Credit qualityThe credit quality of financial assets is managed by the Group using internal and external credit risk ratings. The Group follows an internal obligor risk rating (ORR) mechanism for grading relationships across its credit portfolio. The Group utilises a ten–scale credit rating system with positive and negative modifiers, giving a total scale range of 22, of which 19 (with positive and negative modifiers) relate to performing and three to non–performing. Within performing, ORR 1 to 4– represents investment grade, ORR 5+ to 7+ represents sub–investment grade and 7 and 7– represent watch list. ORR 8 to 10 represents sub–standard, doubtful and loss respectively. All credits are assigned a rating in accordance with the defined criteria. The Group endeavours continuously to improve upon the internal credit risk rating methodologies and credit risk management policies and practices to reflect the true underlying credit risk of the portfolio and the credit culture in the Group. All lending relationships are reviewed at least once in a year and more frequently in the case of non–performing assets.
Qatar National Bank (Q.P.S.C.) Notes to the Consolidated Financial StatementsAs at and for the year ended 31 December 2021(All amounts are shown in thousands of Qatari Riyals)
Qatar National Bank (Q.P.S.C.) Notes to the Consolidated Financial StatementsAs at and for the year ended 31 December 2021(All amounts are shown in thousands of Qatari Riyals)
Qatar National Bank (Q.P.S.C.) Notes to the Consolidated Financial StatementsAs at and for the year ended 31 December 2021(All amounts are shown in thousands of Qatari Riyals)
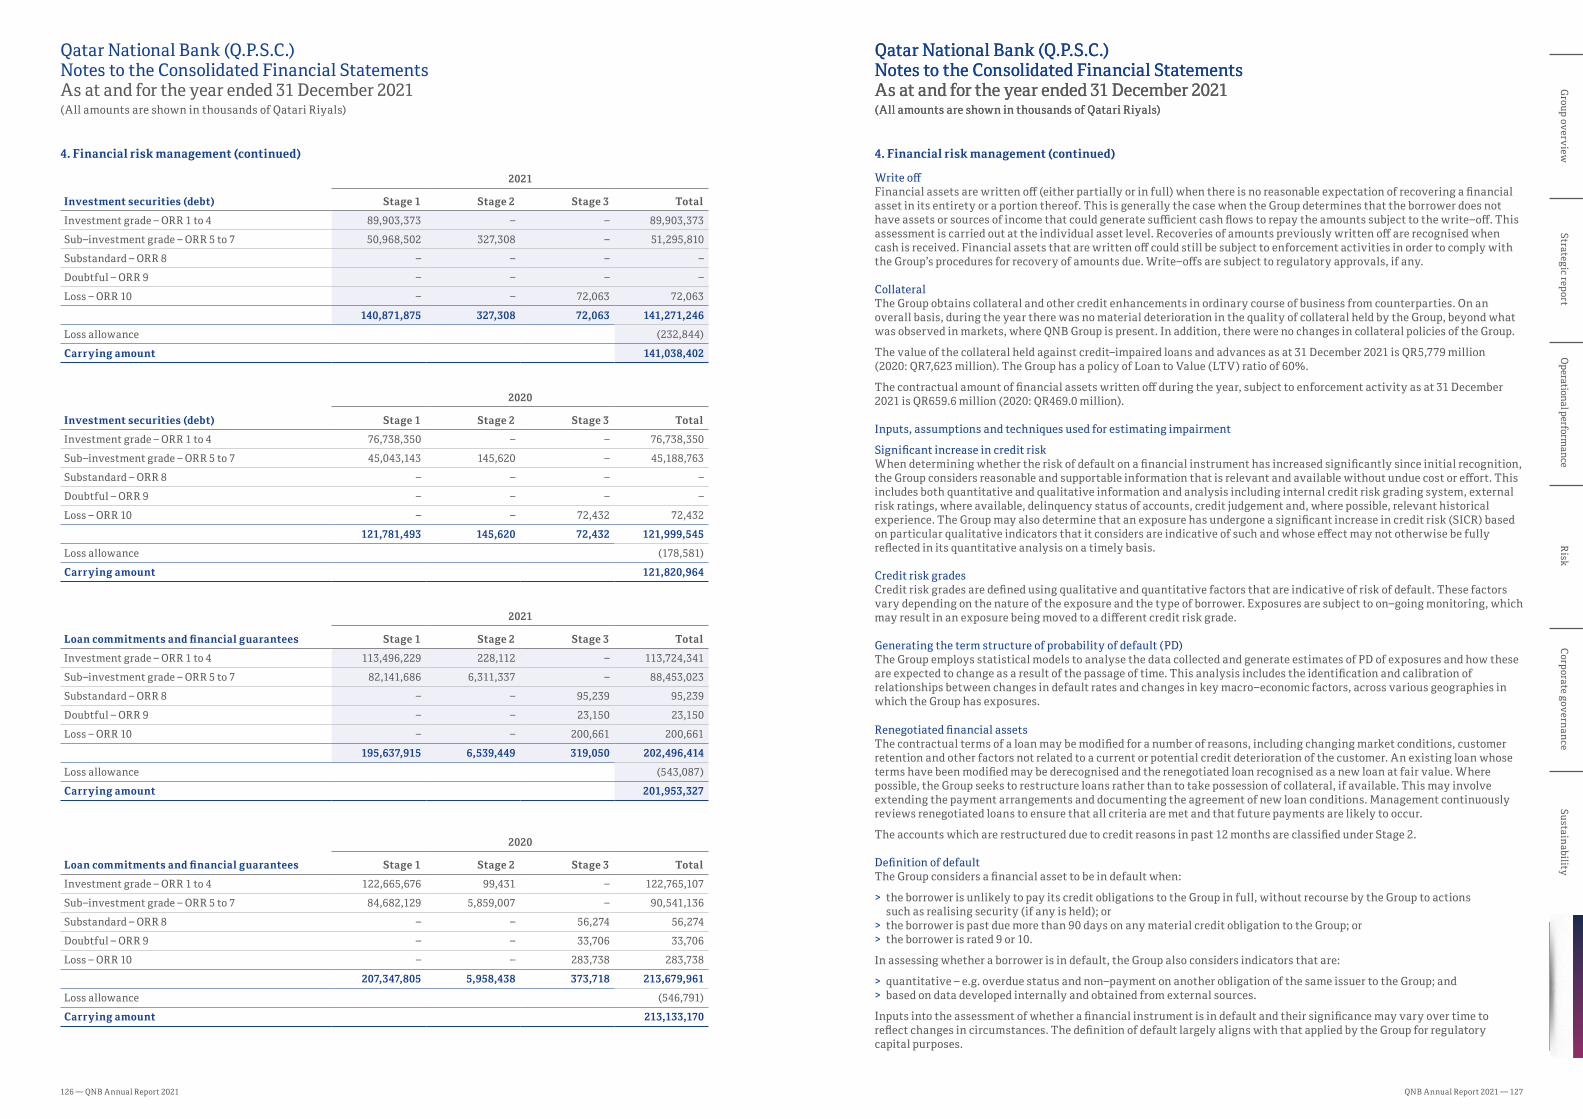
126 — QNB Annual Report 2021 QNB Annual Report 2021 — 127
Financial statements
SustainabilityC
orporate governanceR
iskO
perational performance
Strategic reportG
roup overview4. Financial risk management (continued)
Write offFinancial assets are written off (either partially or in full) when there is no reasonable expectation of recovering a financial asset in its entirety or a portion thereof. This is generally the case when the Group determines that the borrower does not have assets or sources of income that could generate sufficient cash flows to repay the amounts subject to the write–off. This assessment is carried out at the individual asset level. Recoveries of amounts previously written off are recognised when cash is received. Financial assets that are written off could still be subject to enforcement activities in order to comply with the Group’s procedures for recovery of amounts due. Write–offs are subject to regulatory approvals, if any.
CollateralThe Group obtains collateral and other credit enhancements in ordinary course of business from counterparties. On an overall basis, during the year there was no material deterioration in the quality of collateral held by the Group, beyond what was observed in markets, where QNB Group is present. In addition, there were no changes in collateral policies of the Group.
The value of the collateral held against credit–impaired loans and advances as at 31 December 2021 is QR5,779 million (2020: QR7,623 million). The Group has a policy of Loan to Value (LTV) ratio of 60%.
The contractual amount of financial assets written off during the year, subject to enforcement activity as at 31 December 2021 is QR659.6 million (2020: QR469.0 million).
Inputs, assumptions and techniques used for estimating impairment
Significant increase in credit riskWhen determining whether the risk of default on a financial instrument has increased significantly since initial recognition, the Group considers reasonable and supportable information that is relevant and available without undue cost or effort. This includes both quantitative and qualitative information and analysis including internal credit risk grading system, external risk ratings, where available, delinquency status of accounts, credit judgement and, where possible, relevant historical experience. The Group may also determine that an exposure has undergone a significant increase in credit risk (SICR) based on particular qualitative indicators that it considers are indicative of such and whose effect may not otherwise be fully reflected in its quantitative analysis on a timely basis.
Credit risk gradesCredit risk grades are defined using qualitative and quantitative factors that are indicative of risk of default. These factors vary depending on the nature of the exposure and the type of borrower. Exposures are subject to on–going monitoring, which may result in an exposure being moved to a different credit risk grade.
Generating the term structure of probability of default (PD)The Group employs statistical models to analyse the data collected and generate estimates of PD of exposures and how these are expected to change as a result of the passage of time. This analysis includes the identification and calibration of relationships between changes in default rates and changes in key macro–economic factors, across various geographies in which the Group has exposures.
Renegotiated financial assetsThe contractual terms of a loan may be modified for a number of reasons, including changing market conditions, customer retention and other factors not related to a current or potential credit deterioration of the customer. An existing loan whose terms have been modified may be derecognised and the renegotiated loan recognised as a new loan at fair value. Where possible, the Group seeks to restructure loans rather than to take possession of collateral, if available. This may involve extending the payment arrangements and documenting the agreement of new loan conditions. Management continuously reviews renegotiated loans to ensure that all criteria are met and that future payments are likely to occur.
The accounts which are restructured due to credit reasons in past 12 months are classified under Stage 2.
Definition of defaultThe Group considers a financial asset to be in default when:
> the borrower is unlikely to pay its credit obligations to the Group in full, without recourse by the Group to actions such as realising security (if any is held); or
> the borrower is past due more than 90 days on any material credit obligation to the Group; or > the borrower is rated 9 or 10.
In assessing whether a borrower is in default, the Group also considers indicators that are:
> quantitative – e.g. overdue status and non–payment on another obligation of the same issuer to the Group; and > based on data developed internally and obtained from external sources.
Inputs into the assessment of whether a financial instrument is in default and their significance may vary over time to reflect changes in circumstances. The definition of default largely aligns with that applied by the Group for regulatory capital purposes.
4. Financial risk management (continued)
Investment securities (debt)
2021
Stage 1 Stage 2 Stage 3 Total
Investment grade – ORR 1 to 4 89,903,373 – – 89,903,373
Sub–investment grade – ORR 5 to 7 50,968,502 327,308 – 51,295,810
Substandard – ORR 8 – – – –
Doubtful – ORR 9 – – – –
Loss – ORR 10 – – 72,063 72,063
140,871,875 327,308 72,063 141,271,246
Loss allowance (232,844)
Carrying amount 141,038,402
Investment securities (debt)
2020
Stage 1 Stage 2 Stage 3 Total
Investment grade – ORR 1 to 4 76,738,350 – – 76,738,350
Sub–investment grade – ORR 5 to 7 45,043,143 145,620 – 45,188,763
Substandard – ORR 8 – – – –
Doubtful – ORR 9 – – – –
Loss – ORR 10 – – 72,432 72,432
121,781,493 145,620 72,432 121,999,545
Loss allowance (178,581)
Carrying amount 121,820,964
Loan commitments and financial guarantees
2021
Stage 1 Stage 2 Stage 3 Total
Investment grade – ORR 1 to 4 113,496,229 228,112 – 113,724,341
Sub–investment grade – ORR 5 to 7 82,141,686 6,311,337 – 88,453,023
Substandard – ORR 8 – – 95,239 95,239
Doubtful – ORR 9 – – 23,150 23,150
Loss – ORR 10 – – 200,661 200,661
195,637,915 6,539,449 319,050 202,496,414
Loss allowance (543,087)
Carrying amount 201,953,327
Loan commitments and financial guarantees
2020
Stage 1 Stage 2 Stage 3 Total
Investment grade – ORR 1 to 4 122,665,676 99,431 – 122,765,107
Sub–investment grade – ORR 5 to 7 84,682,129 5,859,007 – 90,541,136
Substandard – ORR 8 – – 56,274 56,274
Doubtful – ORR 9 – – 33,706 33,706
Loss – ORR 10 – – 283,738 283,738
207,347,805 5,958,438 373,718 213,679,961
Loss allowance (546,791)
Carrying amount 213,133,170
Qatar National Bank (Q.P.S.C.) Notes to the Consolidated Financial StatementsAs at and for the year ended 31 December 2021(All amounts are shown in thousands of Qatari Riyals)
Qatar National Bank (Q.P.S.C.) Notes to the Consolidated Financial StatementsAs at and for the year ended 31 December 2021(All amounts are shown in thousands of Qatari Riyals)
Qatar National Bank (Q.P.S.C.) Notes to the Consolidated Financial StatementsAs at and for the year ended 31 December 2021(All amounts are shown in thousands of Qatari Riyals)

128 — QNB Annual Report 2021 QNB Annual Report 2021 — 129
Financial statements
SustainabilityC
orporate governanceR
iskO
perational performance
Strategic reportG
roup overview4. Financial risk management (continued)
LGD is the magnitude of the likely loss if there is a default. The Group estimates LGD parameters based on the history of recovery rates of claims against defaulted counterparties. The LGD models consider the forecasted collateral value and recovery costs of any collateral that is integral to the financial asset.
LGD estimation includes:
1) Cure Rate: Defined as the ratio of accounts which have fallen to default and have managed to move backward to the performing accounts.
2) Recovery Rate: Defined as the ratio of liquidation value to market value of the underlying collateral at the time of default would also account for expected recovery rate from a general claim on the individual’s assets for the unsecured portion of the exposure.
3) Discounting Rate: Defined as the opportunity cost of the recovery value not being realised on the day of default adjusted for time value.
EAD represents the expected exposure in the event of a default. The Group derives the EAD from the current exposure to the counterparty and potential changes to the current amount allowed under the contract including amortisation. The EAD of a financial asset is its gross carrying amount. For lending commitments and financial guarantees, the EAD includes the amount drawn, as well as potential future amounts that may be drawn under the contract, which are estimated based on historical observations and forward–looking forecasts.
Where modelling of a parameter is carried out on a collective basis, the financial instruments are grouped on the basis of shared risk characteristics that include credit risk gradings, product type and geographic location of the borrower. The groupings are subject to regular review to ensure that exposures within a particular group remain appropriately homogeneous.
Loss allowanceThe following tables show reconciliations from the opening to the closing balance of the loss allowance by class of financial instruments.
Cash and balances with central banks (excluding cash on hand) and due from banks
2021
Stage 1 Stage 2 Stage 3 Total ECL/
impairment
Balance at 1 January 53,701 20,818 – 74,519
Transfers to Stage 1 – – – –
Transfers to Stage 2 – – – –
Transfers to Stage 3 – – – –
ECL / impairment allowance for the year, net 42,498 (11,858) – 30,640
Amounts written off – – – –
Foreign currency translation (4,396) 38 – (4,358)
Balance at 31 December 91,803 8,998 – 100,801
Cash and balances with central banks (excluding cash on hand) and due from banks
2020
Stage 1 Stage 2 Stage 3 Total ECL /
impairment
Balance at 1 January 41,651 9,572 – 51,223
Transfers to Stage 1 – – – –
Transfers to Stage 2 – – – –
Transfers to Stage 3 – – – –
ECL / impairment allowance for the year, net 14,441 11,058 – 25,499
Amounts written off – – – –
Foreign currency translation (2,391) 188 – (2,203)
Balance at 31 December 53,701 20,818 – 74,519
4. Financial risk management (continued)
Incorporation of forward–looking informationThe Group employs statistical models to incorporate macro–economic factors on historical default rates. In case none of the above macro–economic parameters are statistically significant or the results of forecasted PDs are deviated significantly from the present forecast of the economic conditions, qualitative PD overlay shall be used by management after analysing the portfolio as per the diagnostic tool.
Incorporating forward looking information increases the level of judgement as to how changes in these macroeconomic factors will affect the Expected Credit Loss (ECL) applicable to the stage 1 and stage 2 exposures which are considered as performing. The methodologies and assumptions involved, including any forecasts of future economic conditions, are reviewed periodically.
The assessment of SICR and the calculation of ECL both incorporate forward–looking information. The Group uses mathematical function which links the credit cycle index (CCI) with PD as a key input to ECL. These economic variables and their associated impact on the PD, EAD and LGD vary by financial instrument. Forecasts of these economic variables (the “base economic scenario”) are provided by the Group’s Economics team on a quarterly basis and provide the best estimate view of the economy over the next five years. After five years, to project the economic variables out for the full remaining lifetime of instrument, a mean reversion approach has been used.
Scenarios are incorporated through the forward looking factors selected which are essentially credit cycle index factors (CCI) that are conditioned and then used as an input to the various ECL components. The CCI calculation is derived through the construction of suitable credit cycles based on economic variables that can be used as proxy to describe credit activities within each country of operation. CCI can be derived from a number of historical factors, such as risky yields, credit growth, credit spreads, default or NPL rates data. Interdependency exists between macro–economic factors as well as risk drivers for a range of scenarios and the CCI, given its integral part in driving the economic or business cycles. Qatar scenarios included the following assumptions:
2021 2020
Average oil price range (USD / Barrel) 40 – 64 19 – 44.9
GDP Growth Rate –1.25% to 1.8% –4.4% to –1.5%
Inflation –0.9% to 1.0% 0.7% to 1.9%
The following weightings were assigned to each macro–economic scenario at QNB parent company level which are based on the CCI:
2021 2020
Upside Case 5% 0%
Base Case 80% 55%
Downside Case 15% 45%
The table below shows the loss allowance on loans and advances to customers assuming each forward–looking scenario (e.g. base, upside and downside) were weighted 100% instead of applying scenario probability weights across the three scenarios.
2021 2020
100% Upside case, loss allowance would be higher / (lower) by (760,395) (824,000)
100% Base case, loss allowance would be higher / (lower) by (189,554) (295,000)
100% Downside case, loss allowance would be higher / (lower) by 756,924 557,000
These estimates are based on comparisons performed during the year.
Measurement of ECLThe key inputs into the measurement of ECL are the term structure of the following variables:
> probability of default (PD); > loss given default (LGD); and > exposure at default (EAD).
These parameters are generally derived from internally developed statistical models and other historical data. They are adjusted to reflect forward–looking information as described above.
PD estimates are estimates at a certain date, which are calculated based on statistical rating models. These statistical models are primarily based on internally compiled data comprising both quantitative and qualitative factors and are supplemented by external credit assessment data where available.
Qatar National Bank (Q.P.S.C.) Notes to the Consolidated Financial StatementsAs at and for the year ended 31 December 2021(All amounts are shown in thousands of Qatari Riyals)
Qatar National Bank (Q.P.S.C.) Notes to the Consolidated Financial StatementsAs at and for the year ended 31 December 2021(All amounts are shown in thousands of Qatari Riyals)
Qatar National Bank (Q.P.S.C.) Notes to the Consolidated Financial StatementsAs at and for the year ended 31 December 2021(All amounts are shown in thousands of Qatari Riyals)

130 — QNB Annual Report 2021 QNB Annual Report 2021 — 131
Financial statements
SustainabilityC
orporate governanceR
iskO
perational performance
Strategic reportG
roup overview4. Financial risk management (continued)
Loan commitments and financial guarantees
2021
Stage 1 Stage 2 Stage 3 Total ECL /
impairment
Balance at 1 January 276,015 137,470 133,306 546,791
Transfers to Stage 1 – – – –
Transfers to Stage 2 (120) 120 – –
Transfers to Stage 3 – – – –
ECL / impairment allowance for the year, net 55,136 (16,179) 33,042 71,999
Amounts written off – – (27,152) (27,152)
Foreign currency translation (35,453) (2,560) (10,538) (48,551)
Balance at 31 December 295,578 118,851 128,658 543,087
Loan commitments and financial guarantees
2020
Stage 1 Stage 2 Stage 3 Total ECL /
impairment
Balance at 1 January 213,251 75,150 158,758 447,159
Transfers to Stage 1 – – – –
Transfers to Stage 2 (719) 719 – –
Transfers to Stage 3 – (1,070) 1,070 –
ECL / impairment allowance for the year, net 67,109 68,662 (18,487) 117,284
Amounts written off – – – –
Foreign currency translation (3,626) (5,991) (8,035) (17,652)
Balance at 31 December 276,015 137,470 133,306 546,791
c) Market riskThe Group takes on exposure to market risks from interest rates, foreign exchange rates and equity prices due to general and specific market movements. The Group applies an internal methodology to estimate the market risk of positions held and the maximum losses expected, based upon a number of assumptions for various changes in market conditions. The Group has a set of limits on the value of risk that may be accepted, which is monitored on a daily basis.
Equity price riskEquity price risk, is the risk that the fair values of equities decrease as a result of changes in the levels of equity indices and the value of individual stocks. The effect on equity due to a reasonably possible change in equity indices, with all other variables held constant, is as follows:
Change in equity price
%
Effect on other comprehensive income
2021 2020
Market indices
Qatar exchange ±5 14,043 11,888
4. Financial risk management (continued)
Loans and advances to customers
2021
Stage 1 Stage 2 Stage 3 Total ECL /
impairment
Balance at 1 January 1,427,951 3,186,651 16,945,037 21,559,639
Transfers to Stage 1 – – – –
Transfers to Stage 2 (49,362) 49,362 – –
Transfers to Stage 3 – (291,158) 291,158 –
ECL / impairment allowance for the year, net 224,552 1,045,776 6,829,675 8,100,003
Amounts written off – – (1,378,113) (1,378,113)
Foreign currency translation (173,050) (608,116) (1,269,520) (2,050,686)
Balance at 31 December 1,430,091 3,382,515 21,418,237 26,230,843
Loans and advances to customers
2020
Stage 1 Stage 2 Stage 3 Total ECL /
impairment
Balance at 1 January 1,246,620 2,694,380 12,835,228 16,776,228
Transfers to Stage 1 – – – –
Transfers to Stage 2 (82,829) 82,829 – –
Transfers to Stage 3 – (396,954) 396,954 –
ECL / impairment allowance for the year, net 370,228 988,612 5,513,855 6,872,695
Amounts written off – – (1,318,718) (1,318,718)
Foreign currency translation (106,068) (182,216) (482,282) (770,566)
Balance at 31 December 1,427,951 3,186,651 16,945,037 21,559,639
Investment securities (debt)
2021
Stage 1 Stage 2 Stage 3 Total ECL /
impairment
Balance at 1 January 76,735 25,219 76,627 178,581
Transfers to Stage 1 – – – –
Transfers to Stage 2 (2,007) 2,007 – –
Transfers to Stage 3 – – – –
ECL / impairment allowance for the year, net 42,308 18,034 (4,491) 55,851
Amounts written off – – – –
Foreign currency translation (1,515) – (73) (1,588)
Balance at 31 December 115,521 45,260 72,063 232,844
Investment securities (debt)
2020
Stage 1 Stage 2 Stage 3 Total ECL /
impairment
Balance at 1 January 56,902 5,291 76,600 138,793
Transfers to Stage 1 – – – –
Transfers to Stage 2 (6,593) 6,593 – –
Transfers to Stage 3 – (177) 177 –
ECL / impairment allowance for the year, net 28,596 13,512 26,896 69,004
Amounts written off – – (27,237) (27,237)
Foreign currency translation (2,170) – 191 (1,979)
Balance at 31 December 76,735 25,219 76,627 178,581
Qatar National Bank (Q.P.S.C.) Notes to the Consolidated Financial StatementsAs at and for the year ended 31 December 2021(All amounts are shown in thousands of Qatari Riyals)
Qatar National Bank (Q.P.S.C.) Notes to the Consolidated Financial StatementsAs at and for the year ended 31 December 2021(All amounts are shown in thousands of Qatari Riyals)
Qatar National Bank (Q.P.S.C.) Notes to the Consolidated Financial StatementsAs at and for the year ended 31 December 2021(All amounts are shown in thousands of Qatari Riyals)

132 — QNB Annual Report 2021 QNB Annual Report 2021 — 133
Financial statements
SustainabilityC
orporate governanceR
iskO
perational performance
Strategic reportG
roup overview4. Financial risk management (continued)
Interest rate riskInterest rate risk reflects the risk of a change in interest rates, which might affect future earnings or the fair value of financial instruments. Exposure to interest rate risk is managed by the Group using, asset and liability management and, where appropriate, various derivatives. Maturities of assets and liabilities have been determined based on the contractual pricing. The following table summarises the repricing profile of the Group’s assets, liabilities and off–balance sheet exposures:
Within3 months
3–12months
1–5years
More than5 years
Non–interestsensitive Total
Effective interest
rate
As at 31 December 2021:
Cash and balances with central banks 38,013,529 – – – 50,537,759 88,551,288
Due from banks 55,444,474 3,161,941 123,838 2,143,417 8,181,474 69,055,144 0.62%
Loans and advances 493,821,774 202,718,503 32,997,126 7,464,985 26,649,653 763,652,041 4.44%
Investments 58,642,788 15,234,941 45,276,977 19,715,578 11,418,053 150,288,337 7.47%
Other assets – – – – 21,490,801 21,490,801
Total assets 645,922,565 221,115,385 78,397,941 29,323,980 118,277,740 1,093,037,611
Due to banks 85,912,218 20,797,971 4,377,162 86,465 267,756 111,441,572 1.29%
Customer deposits 494,840,733 136,729,226 54,476,092 8,114,958 91,350,515 785,511,524 2.60%
Debt securities 4,274,065 3,490,549 19,301,114 12,458,148 565,051 40,088,927 3.09%
Other borrowings 26,022,307 9,586 11,808 3,715 90,823 26,138,239 1.20%
Other liabilities – – – – 29,800,702 29,800,702
Total equity – – – – 100,056,647 100,056,647
Total liabilities and equity 611,049,323 161,027,332 78,166,176 20,663,286 222,131,494 1,093,037,611
Balance sheet items 34,873,242 60,088,053 231,765 8,660,694 (103,853,754) –
Off–balance sheet items 19,196,470 (5,504,942) (14,933,201) 3,454,500 (2,212,827) –
Interest rate sensitivity gap 54,069,712 54,583,111 (14,701,436) 12,115,194 (106,066,581) –
Cumulative interest rate sensitivity gap 54,069,712 108,652,823 93,951,387 106,066,581 – –
As at 31 December 2020:
Cash and balances with central banks 27,913,197 – – – 53,637,781 81,550,978
Due from banks 57,910,813 1,811,574 278,110 – 5,127,323 65,127,820 0.74%
Loans and advances 481,221,081 171,410,130 40,293,352 7,350,037 23,520,574 723,795,174 4.90%
Investments 43,757,356 20,376,037 37,344,273 18,592,815 10,377,740 130,448,221 8.33%
Other assets – – – – 24,092,867 24,092,867
Total assets 610,802,447 193,597,741 77,915,735 25,942,852 116,756,285 1,025,015,060
Due to banks 59,817,908 23,769,263 4,129,419 5,665 231,468 87,953,723 1.50%
Customer deposits 463,524,570 138,948,148 39,292,749 8,177,172 88,794,947 738,737,586 2.69%
Debt securities 11,121,418 3,652,247 15,058,930 12,138,464 602,444 42,573,503 3.35%
Other borrowings 27,844,912 7,296 22,294 – 26,985 27,901,487 1.63%
Other liabilities – – – – 30,947,042 30,947,042
Total equity – – – – 96,901,719 96,901,719
Total liabilities and equity 562,308,808 166,376,954 58,503,392 20,321,301 217,504,605 1,025,015,060
Balance sheet items 48,493,639 27,220,787 19,412,343 5,621,551 (100,748,320) –
Off–balance sheet items 19,196,470 (5,504,942) (14,933,201) 3,454,500 (2,212,827) –
Interest rate sensitivity gap 67,690,109 21,715,845 4,479,142 9,076,051 (102,961,147) –
Cumulative interest rate sensitivity gap 67,690,109 89,405,954 93,885,096 102,961,147 – –
Other assets includes property and equipment and intangible assets.
4. Financial risk management (continued)
Foreign exchange riskThe Group takes on exposure to the effect of fluctuations in prevailing foreign currency exchange rates on its financial position. The Group has a set of limits on the level of currency exposure, which are monitored daily. The Group has the following significant net exposures denominated in foreign currencies which are subject to market risk:
QR US$ EuroPound
SterlingOther
currencies Total
As at 31 December 2021:
Assets 262,385,531 492,068,907 122,214,014 59,475,371 156,893,788 1,093,037,611
Liabilities and equity 268,599,200 489,000,082 122,550,694 59,168,701 153,718,934 1,093,037,611
Net exposure (6,213,669) 3,068,825 (336,680) 306,670 3,174,854 –
As at 31 December 2020:
Assets 288,052,794 431,128,086 119,991,589 46,411,911 139,430,680 1,025,015,060
Liabilities and equity 276,328,203 444,731,503 120,270,161 46,270,348 137,414,845 1,025,015,060
Net exposure 11,724,591 (13,603,417) (278,572) 141,563 2,015,835 –
The table below indicates the effect of a reasonably possible movement of the currency rate against the Qatari Riyal on the income statement, with all other variables held constant:
Change in currency rate
Effect on consolidated income statement
Currency % 2021 2020
US$ +2 61,377 (272,068)
Euro +3 (10,100) (8,357)
Pound Sterling +2 6,133 2,831
Egyptian Pound +3 539 524
Turkish Lira +3 6,190 6,398
Other currencies +3 88,517 53,553
US$ –2 (61,377) 272,068
Euro –3 10,100 8,357
Pound Sterling –2 (6,133) (2,831)
Egyptian Pound –3 (539) (524)
Turkish Lira –3 (6,190) (6,398)
Other currencies –3 (88,517) (53,553)
Qatar National Bank (Q.P.S.C.) Notes to the Consolidated Financial StatementsAs at and for the year ended 31 December 2021(All amounts are shown in thousands of Qatari Riyals)
Qatar National Bank (Q.P.S.C.) Notes to the Consolidated Financial StatementsAs at and for the year ended 31 December 2021(All amounts are shown in thousands of Qatari Riyals)
Qatar National Bank (Q.P.S.C.) Notes to the Consolidated Financial StatementsAs at and for the year ended 31 December 2021(All amounts are shown in thousands of Qatari Riyals)

134 — QNB Annual Report 2021 QNB Annual Report 2021 — 135
Financial statements
SustainabilityC
orporate governanceR
iskO
perational performance
Strategic reportG
roup overview4. Financial risk management (continued)
Hedge AccountingThe Group has evaluated the extent to which its cash flow hedging relationships are subject to uncertainty driven by IBOR reform as at 31 December 2021. The Group’s hedged items and hedging instruments continue to be indexed principally to LIBOR. These benchmark rates are quoted each day and the IBOR cash flows are exchanged with counterparties as usual. The Group’s LIBOR cash flow hedging relationships extend beyond the anticipated cessation date for LIBOR.
Total amounts of unreformed contracts, including those with an appropriate fallback clauseThe Group monitors the progress of transition from IBORs to new benchmark rates by reviewing the total amounts of contracts that have yet to transition to an alternative benchmark rate and the amounts of such contracts that include an appropriate fallback clause.
The following table shows the contracts depending on the inclusion of fallback language and and the expected transition. The amounts of financial assets and financial liabilities are shown at their carrying amounts and derivatives are shown at their notional amounts.
Not subject to IBOR under
transition or already
incorporate ARR
Subject to IBOR under transition without fallback clauses
Subject to IBOR under transition
with fallback clauses Total
USD LIBOR – maturity before
expected transition
USD LIBOR – maturity after
expected transition
As at 31 December 2021:
Cash and balances with central banks 87,065,225 – – 1,486,063 88,551,288
Due from banks 68,803,893 – – 251,251 69,055,144
Loans and advances to customers 256,073,852 6,998,836 73,393,064 427,186,289 763,652,041
Investments 102,444,399 – – 47,843,938 150,288,337
Other assets 21,490,801 – – – 21,490,801
Total assets 535,878,170 6,998,836 73,393,064 476,767,541 1,093,037,611
Due to banks 108,263,714 – 70,588 3,107,270 111,441,572
Customer deposits 785,511,524 – – – 785,511,524
Debt securities 36,987,711 – 3,101,216 – 40,088,927
Other borrowings 20,121,579 1,092,150 1,456,200 3,468,310 26,138,239
Other liabilities 29,112,647 – – 688,055 29,800,702
Total liabilities 979,997,175 1,092,150 4,628,004 7,263,635 992,980,964
Interest Rate Swaps 16,441,718 – – 94,991,873 111,433,591
Cross Currency Swaps 98,307,079 – – 10,827,972 109,135,051
Total Derivatives 114,748,797 – – 105,819,845 220,568,642
As at 31 December 2020:
Cash and balances with central banks 77,476,632 – – 4,074,346 81,550,978
Due from banks 64,868,604 – – 259,216 65,127,820
Loans and advances to customers 360,793,294 16,429,868 33,224,392 313,347,620 723,795,174
Investments 95,683,865 – – 34,764,356 130,448,221
Other assets 24,092,867 – – – 24,092,867
Total assets 622,915,262 16,429,868 33,224,392 352,445,538 1,025,015,060
Due to banks 83,000,343 – 114,880 4,838,500 87,953,723
Customer deposits 738,737,586 – – – 738,737,586
Debt securities 32,790,156 6,662,115 3,121,232 – 42,573,503
Other borrowings 1,518,548 13,833,900 1,456,200 11,092,839 27,901,487
Other liabilities 30,947,042 – – – 30,947,042
Total liabilities 886,993,675 20,496,015 4,692,312 15,931,339 928,113,341
Interest Rate Swaps 14,688,574 – – 104,797,597 119,486,171
Cross Currency Swaps 108,838,182 – – 11,603,432 120,441,614
Total Derivatives 123,526,756 – – 116,401,029 239,927,785
4. Financial risk management (continued)
Interest rate sensitivityThe following table demonstrates the sensitivity to a possible and reasonable change in interest rates, with all other variables held constant, of the Group’s consolidated income statement. The sensitivity of the consolidated income statement is the effect of the assumed changes in interest rates on the net interest income for one year, based on the floating rate of non–trading financial assets and financial liabilities including the effect of hedging instruments.
2021Increase in
basis points
Sensitivity of net
interestincome
Decrease inbasis points
Sensitivity of net
interestincome
Currency
Qatari Riyal 10 87,074 10 (87,074)
US$ 10 19,082 10 (19,082)
Euro 10 (8,908) 10 8,908
Pound Sterling 10 4,239 10 (4,239)
Other currencies 10 4,365 10 (4,365)
2020
Currency
Qatari Riyal 10 105,138 10 (105,138)
US$ 10 12,930 10 (12,930)
Euro 10 (13,010) 10 13,010
Pound Sterling 10 1,789 10 (1,789)
Other currencies 10 6,407 10 (6,407)
Inter Bank Offered Rate (IBOR) reforms
OverviewA fundamental reform of major interest rate benchmarks is being undertaken globally, including the replacement of some interbank offered rates (IBORs) with alternative nearly risk–free rates (referred to as ‘IBOR reform’). The Group has exposures to IBORs on its financial instruments that have been and will be replaced or reformed as part of these market–wide initiatives. The Group's main IBOR exposures and the relevant reference rates with expected transition date(s) are as follows:
Currency IBOR Alternative Reference Rate Transition date
USD USD LIBOR (3 / 6 Months) Secured Overnight Financing Rate (SOFR) June 2023
GBP GBP LIBOR Sterling Overnight Index Average (SONIA) December 2021
EUR EURIBOR / EUR LIBOR Euro Short–Term Rate (€STR) December 2021
CHF CHF LIBOR Swiss Average Rate Overnight (SARON) December 2021
JPY JPY LIBOR Tokyo Overnight Average Rate (TONAR) December 2021
The Group closely monitors the market and the output from the various industry working groups managing the transition to new benchmark interest rates. This includes announcements made by the IBOR regulators. In response to the announcements, the Group has set up an IBOR Steering Committee comprised of the various work streams including risk management, tax, treasury, legal, accounting and systems. The programme is under the governance of the Group Chief Business Officer. The aim is to effect an orderly transition of legacy transactions onto risk free rate based repricing indicies, and to enable a smooth adoption for new transactions. The IBOR Steering Committee oversights the IBOR transition process in its entirety, including product development, legal considerations, system enhancements, operational readiness, staff awareness and customer communication.
DerivativesThe Group holds interest rate swaps for risk management purposes which are designated in cash flow hedging relationships. The interest rate swaps have floating legs that are indexed principally to LIBOR. The Group’s derivative instruments are governed by contracts based on the International Swaps and Derivatives Association (ISDA)’s master agreements.
Qatar National Bank (Q.P.S.C.) Notes to the Consolidated Financial StatementsAs at and for the year ended 31 December 2021(All amounts are shown in thousands of Qatari Riyals)
Qatar National Bank (Q.P.S.C.) Notes to the Consolidated Financial StatementsAs at and for the year ended 31 December 2021(All amounts are shown in thousands of Qatari Riyals)
Qatar National Bank (Q.P.S.C.) Notes to the Consolidated Financial StatementsAs at and for the year ended 31 December 2021(All amounts are shown in thousands of Qatari Riyals)

136 — QNB Annual Report 2021 QNB Annual Report 2021 — 137
Financial statements
SustainabilityC
orporate governanceR
iskO
perational performance
Strategic reportG
roup overview4. Financial risk management (continued)
Maturity analysis of undiscounted cash flowsThe table below summarises the maturity profile of the Group’s financial liabilities at 31 December based on contractual undiscounted repayment obligations.
Within1 month
1–3months
3–12months
1–5years
More than 5 years Total
As at 31 December 2021:
Due to banks 41,568,592 25,679,525 21,106,675 22,073,157 1,954,889 112,382,838
Customer deposits 320,642,175 57,391,073 103,458,863 297,192,574 26,342,819 805,027,504
Debt securities 156,979 161,189 7,066,041 20,454,382 12,584,429 40,423,020
Other borrowings 76,667 1,152,756 3,568,906 22,391,049 – 27,189,378
Lease liabilities 61,701 16,119 71,203 404,832 62,294 616,149
Derivative financial instruments
Contractual amounts
– Payable - forward contracts 36,460,573 59,931,293 22,828,097 5,102,923 – 124,322,886
– Receivable - forward contracts (36,622,465) (59,946,431) (23,331,913) (5,096,044) – (124,996,853)
– Payable/(receivable) - Others (635,578) 951,324 1,120,930 556,052 (7,418,106) (5,425,378)
Total liabilities 361,708,644 85,336,848 135,888,802 363,078,925 33,526,325 979,539,544
As at 31 December 2020:
Due to banks 27,921,155 16,397,513 24,266,902 23,004,504 2,298,600 93,888,674
Customer deposits 251,734,678 70,401,504 135,982,400 271,009,133 29,714,887 758,842,602
Debt securities 274,054 439,565 10,992,312 20,976,693 12,571,513 45,254,137
Other borrowings 70,160 74,363 11,484,876 17,148,926 – 28,778,325
Lease liabilities 14,319 19,276 79,309 483,868 87,546 684,318
Derivative financial instruments
Contractual amounts
– Payable - forward contracts 52,047,998 42,126,509 10,898,287 346,771 – 105,419,565
– Receivable - forward contracts (50,816,106) (41,427,002) (10,665,689) (365,760) – (103,274,557)
– Payable/(receivable) - Others (660,045) (259,796) 1,258,229 625,052 (9,383,836) (8,420,396)
Total liabilities 280,586,213 87,771,932 184,296,626 333,229,187 35,288,710 921,172,668
e) Operational risksOperational risk is the risk of direct or indirect loss due to an event or action causing failure of technology, process infrastructure, personnel and other risks having an operational risk impact. The Group seeks to minimise actual or potential losses from operational risk failure through a framework of policies and procedures that identify, assess, control, manage and report those risks. Controls include effective segregation of duties, access, authorisation and reconciliation procedures, staff education and assessment processes.
f) Other risksOther risks to which the Group is exposed are regulatory risk, legal risk and reputational risk. Regulatory risk is controlled through a framework of compliance policies and procedures. Legal risk is managed through the effective use of internal and external legal advisers. Reputational risk is controlled through the regular examination of issues, that are considered to have reputational repercussions for the Group, with guidelines and policies being issued as appropriate.
The Group provides custody and corporate administration to third parties in relation to mutual funds marketed or managed by the Group. These services give rise to legal and operational risk. Such risks are mitigated through detailed daily procedures and internal audits to assure compliance. Note 37 lists the funds marketed by the Group.
4. Financial risk management (continued)
The Group expects to have a minimal impact because the transition is done and expected to be done on economically equivalent rates and therefore no modification gain or loss will take place.
d) Liquidity riskLiquidity risk is the risk that an institution will be unable to meet its funding requirements. Liquidity risk can be caused by market disruptions or credit downgrades, which may cause certain sources of funding to cease immediately. To mitigate this risk, the Group has a diversification of funding sources and a diversified portfolio of high quality liquid assets and readily marketable securities.
The table below summarises the maturity profile of the Group’s assets and liabilities. The contractual maturities of assets and liabilities have been determined on the basis of the remaining period at the statement of financial position date to the contractual maturity date and do not take account of the effective maturities as indicated by the Group’s deposit retention history.
Management monitors the maturity profile to ensure that adequate liquidity is maintained.
Within1 month
1–3months
3–12months
1–5years
More than 5 years Total
As at 31 December 2021:
Cash and balances with central banks 44,822,662 – – – 43,728,626 88,551,288
Due from banks 59,941,734 1,896,064 4,020,654 965,375 2,231,317 69,055,144
Loans and advances to customers 101,204,371 21,105,043 64,941,939 281,496,736 294,903,952 763,652,041
Investments 8,029,309 8,075,158 13,213,921 49,694,558 71,275,391 150,288,337
Other assets 9,792,883 1,090,729 1,541,994 8,038,770 1,026,425 21,490,801
Total assets 223,790,959 32,166,994 83,718,508 340,195,439 413,165,711 1,093,037,611
Due to banks 41,410,803 25,565,087 20,713,371 21,915,130 1,837,181 111,441,572
Customer deposits 319,615,186 56,669,798 100,413,126 292,037,094 16,776,320 785,511,524
Debt securities 149,884 – 7,040,724 20,435,139 12,463,180 40,088,927
Other borrowings 76,667 1,093,209 3,351,179 21,617,184 – 26,138,239
Other liabilities and equity 17,034,857 2,289,573 5,375,697 1,908,820 103,248,402 129,857,349
Total liabilities and equity 378,287,397 85,617,667 136,894,097 357,913,367 134,325,083 1,093,037,611
On–balance sheet gap (154,496,438) (53,450,673) (53,175,589) (17,717,928) 278,840,628 –
Contingent and other items 89,730,790 32,619,927 37,373,568 33,916,258 20,383,293 214,023,836
As at 31 December 2020:
Cash and balances with central banks 40,951,732 – – – 40,599,246 81,550,978
Due from banks 53,606,418 7,925,190 1,405,589 2,190,623 – 65,127,820
Loans and advances to customers 96,407,324 25,020,417 58,500,313 187,861,136 356,005,984 723,795,174
Investments 3,832,435 7,517,728 16,533,277 42,687,748 59,877,033 130,448,221
Other assets 13,033,236 400,910 1,189,723 8,155,930 1,313,068 24,092,867
Total assets 207,831,145 40,864,245 77,628,902 240,895,437 457,795,331 1,025,015,060
Due to banks 23,702,869 16,190,259 23,620,314 22,227,774 2,212,507 87,953,723
Customer deposits 250,649,193 69,455,430 133,060,377 265,922,482 19,650,104 738,737,586
Debt securities 265,737 124,271 10,846,133 19,196,973 12,140,389 42,573,503
Other borrowings 70,160 7,376 11,320,290 16,503,661 – 27,901,487
Other liabilities and equity 19,415,527 1,359,028 1,887,587 4,124,076 101,062,543 127,848,761
Total liabilities and equity 294,103,486 87,136,364 180,734,701 327,974,966 135,065,543 1,025,015,060
On–balance sheet gap (86,272,341) (46,272,119) (103,105,799) (87,079,529) 322,729,788 –
Contingent and other items 91,989,521 32,750,242 46,088,632 35,885,268 21,928,438 228,642,101
Other assets includes property and equipment and intangible assets.
The liquidity coverage ratio maintained by the Group as at 31 December 2021 is 147% (2020: 164%), as against the minimum requirement of 100% for the year ended 31 December 2021 (100% for 31 December 2020) as per QCB regulations.
Qatar National Bank (Q.P.S.C.) Notes to the Consolidated Financial StatementsAs at and for the year ended 31 December 2021(All amounts are shown in thousands of Qatari Riyals)
Qatar National Bank (Q.P.S.C.) Notes to the Consolidated Financial StatementsAs at and for the year ended 31 December 2021(All amounts are shown in thousands of Qatari Riyals)
Qatar National Bank (Q.P.S.C.) Notes to the Consolidated Financial StatementsAs at and for the year ended 31 December 2021(All amounts are shown in thousands of Qatari Riyals)

138 — QNB Annual Report 2021 QNB Annual Report 2021 — 139
Financial statements
SustainabilityC
orporate governanceR
iskO
perational performance
Strategic reportG
roup overview5. Use of estimates and judgements (continued)
(iii) Valuation of financial instrumentsThe Group’s accounting policy on fair value measurements is discussed in the significant accounting policies section. The Group measures fair values using the following fair value hierarchy that reflects the significance of the inputs used in making the measurements.
Level 1: Quoted market price (unadjusted) in an active market for an identical instrument.
Level 2: Valuation techniques based on observable inputs, either directly (i.e. as prices) or indirectly (i.e. derived from prices). This category includes instruments valued using: quoted market prices in active markets for similar instruments; quoted prices for identical or similar instruments in markets that are considered less than active; or other valuation techniques where all significant inputs are directly or indirectly observable from market data.
Level 3: Valuation techniques using significant unobservable inputs. This category includes all instruments where the valuation technique includes inputs not based on observable data and the unobservable inputs have a significant effect on the instrument’s valuation. This category includes instruments that are valued based on quoted prices for similar instruments where significant unobservable adjustments or assumptions are required to reflect differences between the instruments.
Fair values of financial assets and financial liabilities that are traded in active markets are based on quoted market prices or dealer price quotations. For all other financial instruments, the Group determines fair values using valuation techniques.
Valuation techniques include net present value and discounted cash flow models, comparison to similar instruments for which market observable prices exist, Black–Scholes and polynomial option pricing models and other valuation models.
Assumptions and inputs used in valuation techniques include risk–free and benchmark interest rates, credit spreads and other premia used in estimating discount rates, bond and equity prices, foreign currency exchange rates, equity and equity index prices and expected price volatilities and correlations. The objective of valuation techniques is to arrive at a fair value determination that reflects the price of the financial instrument at the reporting date, that would have been determined by market participants acting at arm’s length.
The table below analyses financial instruments measured at fair value at the end of the reporting period, by the level in the fair value hierarchy into which the fair value measurement is categorised:
Level 1 Level 2 Level 3 Total
As at 31 December 2021:
Derivative assets held for risk management – 7,308,699 – 7,308,699
Investment securities 29,375,351 1,292,818 – 30,668,169
Total 29,375,351 8,601,517 – 37,976,868
Derivative liabilities held for risk management 602 5,630,316 – 5,630,918
Total 602 5,630,316 – 5,630,918
As at 31 December 2020:
Derivative assets held for risk management 50 5,505,932 – 5,505,982
Investment securities 35,860,571 1,202,063 – 37,062,634
Total 35,860,621 6,707,995 – 42,568,616
Derivative liabilities held for risk management 1,430 5,856,817 – 5,858,247
Total 1,430 5,856,817 – 5,858,247
There have been no transfers between Level 1 and Level 2 (2020: Nil).
Financial assets and liabilities not measured at fair value, for which fair value is disclosed, would be largely classified as Level 2 in fair value hierarchy.
b) Critical accounting judgements in applying the Group's accounting policies
i) Going concernThe Group’s management has made an assessment of the Group’s ability to continue as a going concern and is satisfied that the Group has resources to continue in the business for the foreseeable future. Furthermore, the management is not aware of any material uncertainties that may cast significant doubt upon the Group’s ability to continue as a going concern. Therefore, the financial statements continue to be prepared on the going concern basis.
4. Financial risk management (continued)
g) Capital managementThe Group maintains an actively managed capital base to cover risks inherent in the business. The adequacy of the Group’s capital is monitored using, among other measures, the rules and ratios established by the Basel Committee on Banking Supervision and adopted by Qatar Central Bank in supervising the Group.
The primary objectives of the Group’s capital management are to ensure that the Group complies with externally imposed capital requirements and that the Group maintains strong credit ratings and healthy capital ratios in order to support its business and to maximise shareholders’ value.
Capital adequacy2021 2020
Common Equity Tier 1 (CET 1) capital 75,905,083 73,485,795
Eligible Additional Tier 1 (AT1) capital instruments 20,000,000 20,000,000
Additional Tier 1 capital 78,664 84,021
Additional Tier 2 capital 5,560,003 5,267,427
Total eligible capital 101,543,750 98,837,243
Risk weighted assets for credit risk 446,010,514 446,945,612
Risk weighted assets for market risk 8,827,758 5,265,239
Risk weighted assets for operational risk 44,542,881 43,095,707
Total risk weighted assets 499,381,153 495,306,558
CET 1 ratio* 14.2% 14.0%
Tier 1 capital ratio* 18.2% 18.1%
Total capital ratio* 19.3% 19.1%
* The above ratios are calculated on Total Eligible capital, net of proposed dividends.
The minimum requirements for Capital Adequacy Ratio under Basel III for QNB as per QCB regulations are as follows:
WithoutCapital
ConservationBuffer
CapitalConservation
Buffer
AdditionalDSIB
charge
ICAAPCapitalCharge Total
Minimum limit for CET 1 ratio 6.0% 2.5% 2.5% 0.0% 11.00%Minimum limit for Tier 1 capital ratio 8.0% 2.5% 2.5% 0.0% 13.00%Minimum limit for Total capital ratio 10.0% 2.5% 2.5% 1.0% 16.00%
5. Use of estimates and judgements
a) Key sources of estimation uncertaintyThe Group makes estimates and assumptions that affect the reported amounts of assets and liabilities. Estimates and judgements are continually evaluated and are based on historical experience and other factors, including expectations of future events that are believed to be reasonable under the circumstances.
(i) Allowances for credit lossesAssessment whether credit risk on the financial asset has increased significantly since initial recognition and incorporation of forward–looking information in the measurement of ECL / impairment.
(ii) Determining fair valueThe determination of fair value for financial assets and liabilities, for which there is no observable market price requires the use of valuation techniques as described in the accounting policies. For financial instruments that trade infrequently and have little price transparency, fair value is less objective, and requires varying degrees of judgement depending on liquidity, concentration, uncertainty of market factors, pricing assumptions and other risks affecting the specific instrument.
Qatar National Bank (Q.P.S.C.) Notes to the Consolidated Financial StatementsAs at and for the year ended 31 December 2021(All amounts are shown in thousands of Qatari Riyals)
Qatar National Bank (Q.P.S.C.) Notes to the Consolidated Financial StatementsAs at and for the year ended 31 December 2021(All amounts are shown in thousands of Qatari Riyals)
Qatar National Bank (Q.P.S.C.) Notes to the Consolidated Financial StatementsAs at and for the year ended 31 December 2021(All amounts are shown in thousands of Qatari Riyals)
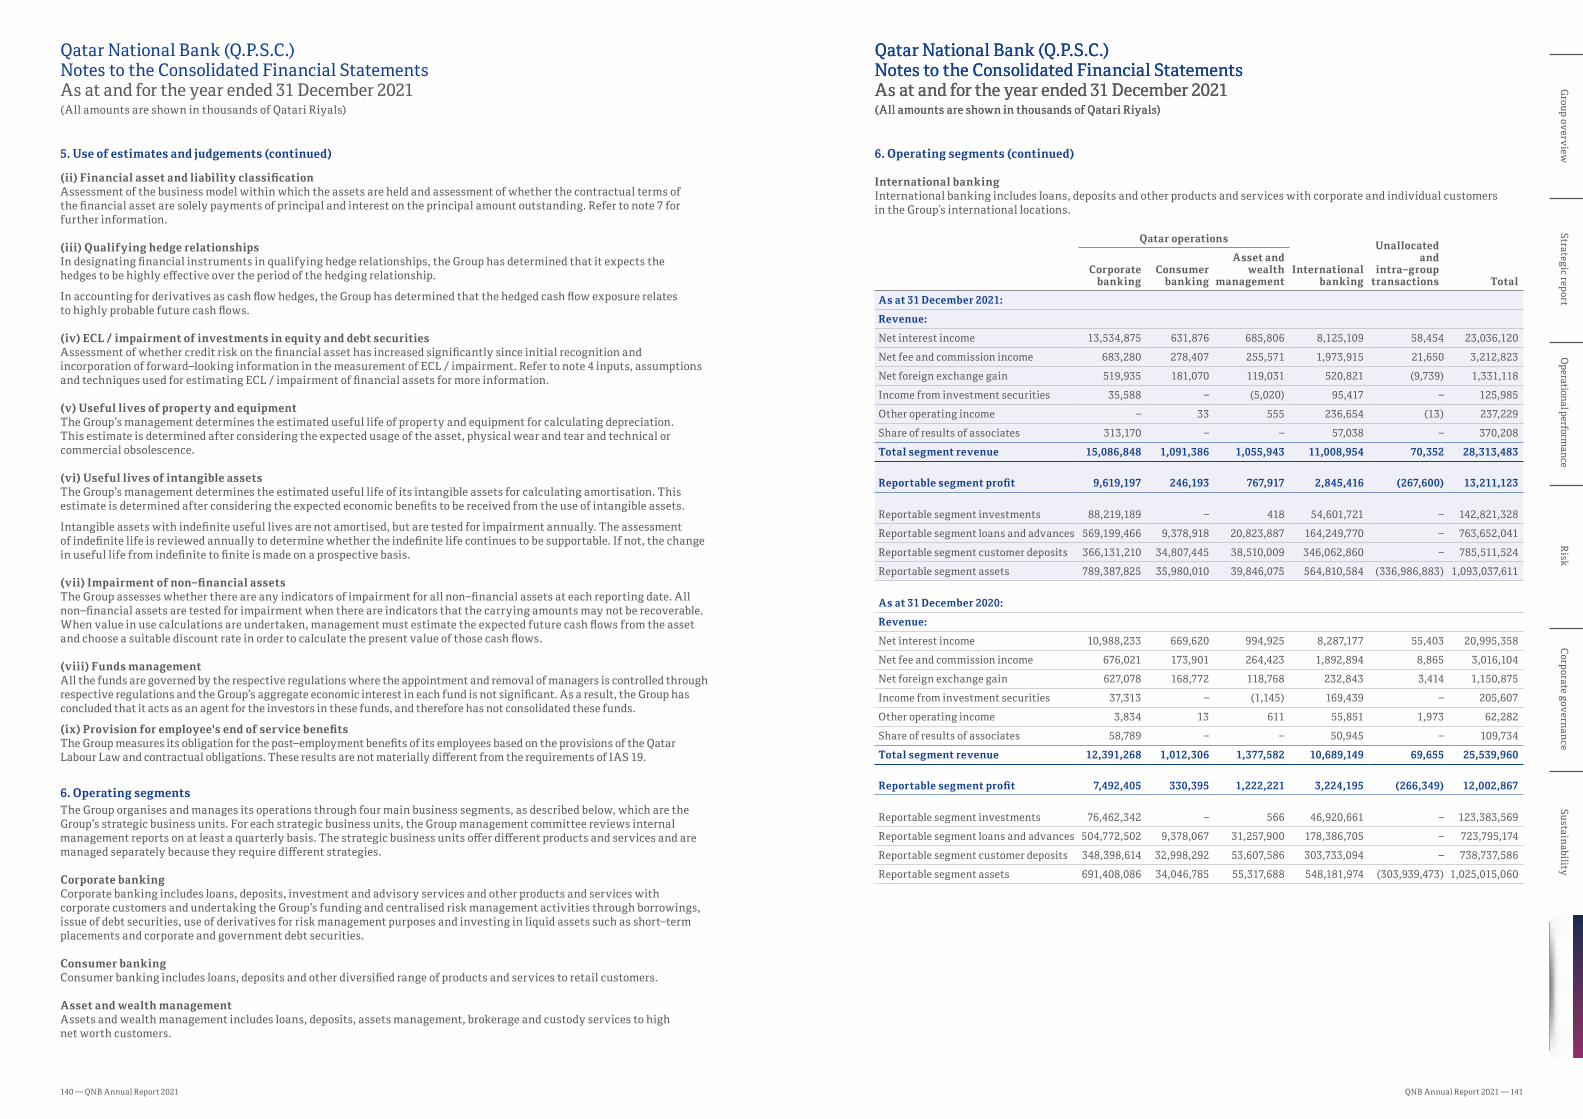
140 — QNB Annual Report 2021 QNB Annual Report 2021 — 141
Financial statements
SustainabilityC
orporate governanceR
iskO
perational performance
Strategic reportG
roup overview6. Operating segments (continued)
International bankingInternational banking includes loans, deposits and other products and services with corporate and individual customers in the Groupʼs international locations.
Qatar operationsUnallocated
andintra–group
transactionsCorporate
bankingConsumer
banking
Asset and wealth
management International
banking Total
As at 31 December 2021:
Revenue:
Net interest income 13,534,875 631,876 685,806 8,125,109 58,454 23,036,120
Net fee and commission income 683,280 278,407 255,571 1,973,915 21,650 3,212,823
Net foreign exchange gain 519,935 181,070 119,031 520,821 (9,739) 1,331,118
Income from investment securities 35,588 – (5,020) 95,417 – 125,985
Other operating income – 33 555 236,654 (13) 237,229
Share of results of associates 313,170 – – 57,038 – 370,208
Total segment revenue 15,086,848 1,091,386 1,055,943 11,008,954 70,352 28,313,483
Reportable segment profit 9,619,197 246,193 767,917 2,845,416 (267,600) 13,211,123
Reportable segment investments 88,219,189 – 418 54,601,721 – 142,821,328
Reportable segment loans and advances 569,199,466 9,378,918 20,823,887 164,249,770 – 763,652,041
Reportable segment customer deposits 366,131,210 34,807,445 38,510,009 346,062,860 – 785,511,524
Reportable segment assets 789,387,825 35,980,010 39,846,075 564,810,584 (336,986,883) 1,093,037,611
As at 31 December 2020:
Revenue:
Net interest income 10,988,233 669,620 994,925 8,287,177 55,403 20,995,358
Net fee and commission income 676,021 173,901 264,423 1,892,894 8,865 3,016,104
Net foreign exchange gain 627,078 168,772 118,768 232,843 3,414 1,150,875
Income from investment securities 37,313 – (1,145) 169,439 – 205,607
Other operating income 3,834 13 611 55,851 1,973 62,282
Share of results of associates 58,789 – – 50,945 – 109,734
Total segment revenue 12,391,268 1,012,306 1,377,582 10,689,149 69,655 25,539,960
Reportable segment profit 7,492,405 330,395 1,222,221 3,224,195 (266,349) 12,002,867
Reportable segment investments 76,462,342 – 566 46,920,661 – 123,383,569
Reportable segment loans and advances 504,772,502 9,378,067 31,257,900 178,386,705 – 723,795,174
Reportable segment customer deposits 348,398,614 32,998,292 53,607,586 303,733,094 – 738,737,586
Reportable segment assets 691,408,086 34,046,785 55,317,688 548,181,974 (303,939,473) 1,025,015,060
5. Use of estimates and judgements (continued)
(ii) Financial asset and liability classificationAssessment of the business model within which the assets are held and assessment of whether the contractual terms of the financial asset are solely payments of principal and interest on the principal amount outstanding. Refer to note 7 for further information.
(iii) Qualifying hedge relationshipsIn designating financial instruments in qualifying hedge relationships, the Group has determined that it expects the hedges to be highly effective over the period of the hedging relationship.
In accounting for derivatives as cash flow hedges, the Group has determined that the hedged cash flow exposure relates to highly probable future cash flows.
(iv) ECL / impairment of investments in equity and debt securitiesAssessment of whether credit risk on the financial asset has increased significantly since initial recognition and incorporation of forward–looking information in the measurement of ECL / impairment. Refer to note 4 inputs, assumptions and techniques used for estimating ECL / impairment of financial assets for more information.
(v) Useful lives of property and equipmentThe Group’s management determines the estimated useful life of property and equipment for calculating depreciation. This estimate is determined after considering the expected usage of the asset, physical wear and tear and technical or commercial obsolescence.
(vi) Useful lives of intangible assetsThe Group’s management determines the estimated useful life of its intangible assets for calculating amortisation. This estimate is determined after considering the expected economic benefits to be received from the use of intangible assets.
Intangible assets with indefinite useful lives are not amortised, but are tested for impairment annually. The assessment of indefinite life is reviewed annually to determine whether the indefinite life continues to be supportable. If not, the change in useful life from indefinite to finite is made on a prospective basis.
(vii) Impairment of non–financial assetsThe Group assesses whether there are any indicators of impairment for all non–financial assets at each reporting date. All non–financial assets are tested for impairment when there are indicators that the carrying amounts may not be recoverable. When value in use calculations are undertaken, management must estimate the expected future cash flows from the asset and choose a suitable discount rate in order to calculate the present value of those cash flows.
(viii) Funds managementAll the funds are governed by the respective regulations where the appointment and removal of managers is controlled through respective regulations and the Group’s aggregate economic interest in each fund is not significant. As a result, the Group has concluded that it acts as an agent for the investors in these funds, and therefore has not consolidated these funds.
(ix) Provision for employee's end of service benefitsThe Group measures its obligation for the post–employment benefits of its employees based on the provisions of the Qatar Labour Law and contractual obligations. These results are not materially different from the requirements of IAS 19.
6. Operating segmentsThe Group organises and manages its operations through four main business segments, as described below, which are the Group’s strategic business units. For each strategic business units, the Group management committee reviews internal management reports on at least a quarterly basis. The strategic business units offer different products and services and are managed separately because they require different strategies.
Corporate bankingCorporate banking includes loans, deposits, investment and advisory services and other products and services with corporate customers and undertaking the Group’s funding and centralised risk management activities through borrowings, issue of debt securities, use of derivatives for risk management purposes and investing in liquid assets such as short–term placements and corporate and government debt securities.
Consumer bankingConsumer banking includes loans, deposits and other diversified range of products and services to retail customers.
Asset and wealth management Assets and wealth management includes loans, deposits, assets management, brokerage and custody services to high net worth customers.
Qatar National Bank (Q.P.S.C.) Notes to the Consolidated Financial StatementsAs at and for the year ended 31 December 2021(All amounts are shown in thousands of Qatari Riyals)
Qatar National Bank (Q.P.S.C.) Notes to the Consolidated Financial StatementsAs at and for the year ended 31 December 2021(All amounts are shown in thousands of Qatari Riyals)
Qatar National Bank (Q.P.S.C.) Notes to the Consolidated Financial StatementsAs at and for the year ended 31 December 2021(All amounts are shown in thousands of Qatari Riyals)

142 — QNB Annual Report 2021 QNB Annual Report 2021 — 143
Financial statements
SustainabilityC
orporate governanceR
iskO
perational performance
Strategic reportG
roup overview8. Cash and balances with central banks
2021 2020
Cash 14,522,532 15,501,485
Cash reserve with Qatar Central Bank 20,304,244 20,271,711
Other balances with Qatar Central Bank 20,437,212 19,561,356
Balances with other central banks 33,253,087 26,209,313
Accrued interest 40,382 11,947
Allowance for impairment (6,169) (4,834)
Total 88,551,288 81,550,978
Cash reserve with Qatar Central Bank is a mandatory reserve and cannot be used to fund the Group’s day–to–day operations. Balances with Other Central Banks include mandatory reserves amounting to QR23,424 million (2020: QR20,328 million) which cannot be used to fund the Group’s day–to–day operations.
9. Due from banks
2021 2020
Current accounts 15,398,205 9,896,494
Placements 51,221,076 55,001,394
Loans 2,143,417 –
Accrued interest 387,078 299,617
Allowance for impairment (94,632) (69,685)
Total 69,055,144 65,127,820
10. Loans and advances to customers
a) By type2021 2020
Loans 703,184,195 670,910,892
Overdrafts 72,659,681 64,138,497
Bills discounted 6,351,837 3,033,856
782,195,713 738,083,245
Accrued interest 7,750,961 7,336,182
Deferred profit (63,790) (64,614)
Expected credit losses – performing loans and advances to customers – Stage 1 and 2 (4,812,606) (4,614,602)
Impairment on non–performing loans and advances to customers – Stage 3 (21,418,237) (16,945,037)
Net loans and advances to customers 763,652,041 723,795,174
The aggregate amount of non–performing loans and advances to customers amounted to QR18,345 million, which represents 2.3% of total loans and advances (2020: QR15,811 million, 2.1% of total loans and advances to customers).
Allowance for impairment of loans and advances to customers includes QR3,063 million of interest in suspense (2020: QR2,383 million).
7. Financial assets and liabilitiesThe table below sets out the carrying amounts and fair values of the Group’s financial assets and financial liabilities:
Fair value through profit or loss –
mandatory
Fair value through other comprehensive
income
Amortisedcost
Total carrying
amount Fair valueDebt
instrumentsEquity
instrumentsDebt
instrumentsEquity
instruments
As at 31 December 2021:
Cash and balances with central banks – – – – 88,551,288 88,551,288 88,551,288
Due from banks – – – – 69,055,144 69,055,144 69,055,144
Loans and advances – – – – 763,652,041 763,652,041 762,022,852
Investment securities:
– At fair value 50,402 234,307 28,903,950 1,479,510 – 30,668,169 30,668,169
– At amortised cost – – – – 112,153,159 112,153,159 113,787,479
Total 50,402 234,307 28,903,950 1,479,510 1,033,411,632 1,064,079,801 1,064,084,932
Due to banks – – – – 111,441,572 111,441,572 111,441,572
Customer deposits – – – – 785,511,524 785,511,524 785,533,787
Debt securities – – – – 40,088,927 40,088,927 40,128,136
Other borrowings – – – – 26,138,239 26,138,239 26,118,515
Total – – – – 963,180,262 963,180,262 963,222,010
As at 31 December 2020:
Cash and balances with central banks – – – – 81,550,978 81,550,978 81,550,978
Due from banks – – – – 65,127,820 65,127,820 65,127,820
Loans and advances – – – – 723,795,174 723,795,174 722,138,187
Investment securities:
– At fair value 142,661 146,257 35,376,310 1,397,406 – 37,062,634 37,062,634
– At amortised cost – – – – 86,320,935 86,320,935 87,771,854
Total 142,661 146,257 35,376,310 1,397,406 956,794,907 993,857,541 993,651,473
Due to banks – – – – 87,953,723 87,953,723 87,953,723
Customer deposits – – – – 738,737,586 738,737,586 738,759,706
Debt securities – – – – 42,573,503 42,573,503 42,510,124
Other borrowings – – – – 27,901,487 27,901,487 27,908,762
Total – – – – 897,166,299 897,166,299 897,132,315
Qatar National Bank (Q.P.S.C.) Notes to the Consolidated Financial StatementsAs at and for the year ended 31 December 2021(All amounts are shown in thousands of Qatari Riyals)
Qatar National Bank (Q.P.S.C.) Notes to the Consolidated Financial StatementsAs at and for the year ended 31 December 2021(All amounts are shown in thousands of Qatari Riyals)
Qatar National Bank (Q.P.S.C.) Notes to the Consolidated Financial StatementsAs at and for the year ended 31 December 2021(All amounts are shown in thousands of Qatari Riyals)

144 — QNB Annual Report 2021 QNB Annual Report 2021 — 145
Financial statements
SustainabilityC
orporate governanceR
iskO
perational performance
Strategic reportG
roup overview10. Loans and advances to customers (continued)
d) Net ECL / impairment during the year2021 2020
Corporate lending (6,359,786) (5,263,009)
Small business lending (4,891) (334,026)
Consumer lending (687,452) (225,379)
Residential mortgages (13,879) (3,005)
Total (7,066,008) (5,825,419)
Impairment loss excludes interest in suspense.
11. Investment securities
Notes 2021 2020
Investments measured at fair value through profit or loss (FVPL) 11a 284,709 288,918
Investments measured at fair value through other comprehensive income (FVOCI) 11b 29,860,133 36,267,165
Investments measured at amortised cost (AC), net 11c 110,439,259 85,058,061
Accrued interest 2,237,227 1,769,425
Total 142,821,328 123,383,569
The carrying amount and fair value of securities under repurchase agreements amounted to QR41,949 million and QR41,738 million respectively (2020: QR 37,611 million and QR 38,869 million respectively).
a) Investments measured at fair value through profit or loss2021 2020
Quoted Unquoted Quoted Unquoted
Mutual funds and equities 234,307 – 146,257 –
Debt securities 50,402 – 142,661 –
Total 284,709 – 288,918 –
b) Investments measured at fair value through other comprehensive income2021 2020
Quoted Unquoted Quoted Unquoted
Mutual fund and equities 1,218,995 260,515 1,133,336 264,070
State of Qatar debt securities 16,691,062 – 21,561,136 –
Other debt securities 11,689,561 – 13,308,623 –
Total 29,599,618 260,515 36,003,095 264,070
Fixed rate securities amounted to QR26,019 million (2020: QR32,492 million) and floating rate securities amounted to QR2,362million (2020: QR2,378 million).
The above is net of impairment allowance in respect of debt securities amounting to QR Nil (2020: QR Nil).
Expected credit loss of QR18.7 million (2020: QR18.9 million), pertaining to FVOCI debt securities is part of fair value reserve in equity.
10. Loans and advances to customers (continued)
b) By industryLoans and advances Overdrafts
Bills discounted Total
As at 31 December 2021:
Government 47,585,612 45,492,182 – 93,077,794
Government agencies 190,803,569 1,988,782 – 192,792,351
Industry 38,836,361 2,366,799 523,729 41,726,889
Commercial 105,429,136 5,567,734 1,410,869 112,407,739
Services 193,529,585 10,127,961 2,613,982 206,271,528
Contracting 12,845,672 678,383 171,903 13,695,958
Real estate 60,912,328 3,216,793 815,138 64,944,259
Personal 60,043,734 3,170,922 803,514 64,018,170
Others 949,159 50,125 12,702 1,011,986
Total 710,935,156 72,659,681 6,351,837 789,946,674
As at 31 December 2020:
Government 45,650,497 27,835,403 – 73,485,900
Government agencies 180,190,591 2,321,686 – 182,512,277
Industry 41,203,052 3,901,566 281,393 45,386,011
Commercial 95,508,163 4,079,141 620,983 100,208,287
Services 177,330,495 8,812,058 1,125,452 187,268,005
Contracting 13,516,947 726,524 88,826 14,332,297
Real estate 58,889,991 3,165,284 386,992 62,442,267
Personal 63,568,670 13,167,073 489,067 77,224,810
Others 2,388,668 129,762 41,143 2,559,573
Total 678,247,074 64,138,497 3,033,856 745,419,427
The amounts include interest receivable and exclude ECL / impairment and deferred profit.
c) ECL / impairment of loans and advances to customers
Corporate lending
Small businesslending
Consumerlending
Residentialmortgages Total
Balance as at 1 January 2021 14,667,613 2,422,398 4,405,431 64,197 21,559,639
Foreign currency translation (969,167) (613,018) (466,192) (2,309) (2,050,686)
Allowances made during the year 8,429,685 455,888 959,591 17,476 9,862,640
Recoveries during the year (1,113,674) (356,612) (288,895) (3,456) (1,762,637)
Written off / transfers during the year (1,263,902) (35,725) (78,486) – (1,378,113)
Balance as at 31 December 2021 19,750,555 1,872,931 4,531,449 75,908 26,230,843
Balance as at 1 January 2020 9,878,877 2,657,388 4,177,912 62,051 16,776,228
Foreign currency translation (243,254) (343,934) (182,464) (914) (770,566)
Allowances made during the year 7,735,291 567,458 818,797 8,497 9,130,043
Recoveries during the year (1,657,172) (212,377) (382,387) (5,412) (2,257,348)
Written off / transfers during the year (1,046,129) (246,137) (26,427) (25) (1,318,718)
Balance as at 31 December 2020 14,667,613 2,422,398 4,405,431 64,197 21,559,639
ECL / impairment allowance and recoveries for the year includes interest in suspense and recoveries of balances previously written off amounting to QR1,034 million (2020: QR1,047 million).
Qatar National Bank (Q.P.S.C.) Notes to the Consolidated Financial StatementsAs at and for the year ended 31 December 2021(All amounts are shown in thousands of Qatari Riyals)
Qatar National Bank (Q.P.S.C.) Notes to the Consolidated Financial StatementsAs at and for the year ended 31 December 2021(All amounts are shown in thousands of Qatari Riyals)
Qatar National Bank (Q.P.S.C.) Notes to the Consolidated Financial StatementsAs at and for the year ended 31 December 2021(All amounts are shown in thousands of Qatari Riyals)

146 — QNB Annual Report 2021 QNB Annual Report 2021 — 147
Financial statements
SustainabilityC
orporate governanceR
iskO
perational performance
Strategic reportG
roup overview13. Property and equipment
Land and buildings
Leaseholdimprovements
Equipment and
furnitureMotor
vehicles Total
Balance as at 1 January 2021Cost:Balance as at 1 January 5,125,782 870,877 3,308,169 92,451 9,397,279
Additions 747,195 19,884 369,558 37,237 1,173,874
Disposals (8,984) (15,795) (19,486) (2,237) (46,502)
Foreign currency translation / others (698,106) (113,577) (742,389) (11,997) (1,566,069)
5,165,887 761,389 2,915,852 115,454 8,958,582
Accumulated depreciation:Balance as at 1 January 852,540 712,392 2,378,671 48,636 3,992,239
Charged during the year 229,821 35,706 329,278 20,894 615,699
Disposals (459) (11,112) (17,608) (2,224) (31,403)
Foreign currency translation / others (139,653) (90,062) (543,018) (2,026) (774,759)
942,249 646,924 2,147,323 65,280 3,801,776 Net Carrying Amount as at 31 December 2021 4,223,638 114,465 768,529 50,174 5,156,806
Balance as at 1 January 2020
Cost:Balance as at 1 January 4,911,932 995,620 3,380,777 63,810 9,352,139
Additions 664,146 41,793 427,645 34,344 1,167,928
Disposals (65,573) (3,931) (14,767) (1,768) (86,039)
Foreign currency translation / others (384,723) (162,605) (485,486) (3,935) (1,036,749)
5,125,782 870,877 3,308,169 92,451 9,397,279
Accumulated depreciation:Balance as at 1 January 690,809 807,611 2,441,442 34,535 3,974,397
Charged during the year 258,703 51,200 338,722 15,539 664,164
Disposals (65,071) (3,363) (13,399) (1,406) (83,239)
Foreign currency translation / others (31,901) (143,056) (388,094) (32) (563,083)
852,540 712,392 2,378,671 48,636 3,992,239 Net Carrying Amount as at31 December 2020 4,273,242 158,485 929,498 43,815 5,405,040
Details of right-of-use assets included in afore-mentioned class of assets are as follows:
Landand buildings
Equipmentand furniture
Motorvehicles Total
Balance as at 1 January 2021 532,657 14,016 20,455 567,128
Additions 132,054 2,281 12,628 146,963
Disposal (3,900) – – (3,900)
Depreciation (171,991) (9,761) (14,775) (196,527)
Foreign currency translation / others (59,754) (97) (3,826) (63,677)
Balance as at 31 December 2021 429,066 6,439 14,482 449,987
Balance as at 1 January 2020 572,689 23,497 23,343 619,529
Additions 204,102 6,547 14,389 225,038
Disposals – – (16) (16)
Depreciation (204,833) (16,005) (13,608) (234,446)
Foreign currency translation / others (39,301) (23) (3,653) (42,977)
Balance as at 31 December 2020 532,657 14,016 20,455 567,128
11. Investment securities (continued)
c) Investments measured at amortised cost2021 2020
Quoted Unquoted Quoted Unquoted
By issuer
State of Qatar debt securities 20,879,358 – 13,617,892 –
Other debt securities 48,019,265 41,540,636 36,432,645 35,007,524
Total 68,898,623 41,540,636 50,050,537 35,007,524
By interest rate
Fixed rate securities 64,561,687 245,698 45,539,963 3,988,964
Floating rate securities 4,336,936 41,294,938 4,510,574 31,018,560
Total 68,898,623 41,540,636 50,050,537 35,007,524
The above is net of impairment allowance in respect of debt securities amounting to QR214.1 million (2020: QR159.6 million).
12. Investments in associates
2021 2020
Balance as at 1 January 7,064,652 7,116,602
Foreign currency translation (52,972) (24,742)
Share of results 370,208 109,734
Investment during the year 305,578 –
Cash dividend (113,535) (45,904)
Other movements / disposals (106,922) (91,038)
Balance as at 31 December 7,467,009 7,064,652
Ownership %
Name of associate Country Principal business 2021 2020
Housing Bank for Trade and Finance Jordan Banking 38.6 34.5
Al Jazeera Finance Company Qatar Financing 20.0 20.0
Commercial Bank International UAE Banking 40.0 40.0
Senouhi Company for Construction Materials Egypt Construction – 23.0
Ecobank Transnational Incorporated Togo Banking 20.1 20.1
Bantas Turkey Security services 33.3 33.3
Cigna Finans Turkey Pension fund 49.0 49.0
The table below shows the summarised financial information of the Group’s investment in direct and material associates:
Total assets
Total liabilities Equity
Group’s share
of profit / (loss)
Market price per
share (QR)
Balance as at 30 September 2021Housing Bank for Trade and Finance 41,905,512 35,790,077 6,115,435 156,727 19.31
Commercial Bank International 17,494,530 15,049,320 2,445,210 (7,751) 0.64
Ecobank Transnational Incorporated 96,170,346 88,446,603 7,723,743 159,643 0.05
Balance as at 31 December 2020Housing Bank for Trade and Finance 42,649,044 36,683,258 5,965,786 82,713 15.00
Commercial Bank International 17,339,024 14,915,549 2,423,475 (4,879) 0.74
Ecobank Transnational Incorporated 94,432,651 87,050,762 7,381,889 (27,306) 0.06
Qatar National Bank (Q.P.S.C.) Notes to the Consolidated Financial StatementsAs at and for the year ended 31 December 2021(All amounts are shown in thousands of Qatari Riyals)
Qatar National Bank (Q.P.S.C.) Notes to the Consolidated Financial StatementsAs at and for the year ended 31 December 2021(All amounts are shown in thousands of Qatari Riyals)
Qatar National Bank (Q.P.S.C.) Notes to the Consolidated Financial StatementsAs at and for the year ended 31 December 2021(All amounts are shown in thousands of Qatari Riyals)

148 — QNB Annual Report 2021 QNB Annual Report 2021 — 149
Financial statements
SustainabilityC
orporate governanceR
iskO
perational performance
Strategic reportG
roup overview16. Due to banks
2021 2020
Balances due to central banks 585,900 356,920
Current accounts 4,673,868 1,106,860
Deposits 77,443,792 54,693,992
Repurchase agreements 27,850,736 30,763,116
Interest payable 887,276 1,032,835
Total 111,441,572 87,953,723
17. Customer deposits
a) By type2021 2020
Current and call accounts 159,473,716 139,931,016
Saving accounts 24,721,893 22,999,355
Time deposits 598,501,193 572,680,969
Interest payable 2,814,722 3,126,246
Total 785,511,524 738,737,586
b) By sector2021 2020
Government 43,663,229 19,646,918
Government agencies 147,133,381 151,562,428
Individuals 131,649,397 144,072,640
Corporate 460,250,795 420,329,354
Interest payable 2,814,722 3,126,246
Total 785,511,524 738,737,586
18. Debt securities
2021 2020
Face value of bonds 39,648,312 41,945,617
Less: Unamortised premium / discount (107,330) 6,187
Interest payable 547,945 621,699
Total 40,088,927 42,573,503
The table below shows the debt securities issued by the Group as at the end of the reporting period:
2021 2020
Balance as at 1 January 42,573,503 33,778,250
Issuances during the year 8,748,885 12,142,592
Repayments (10,754,896) (3,815,091)
Interest accrued 547,945 621,699
Other movements (1,026,510) (153,947)
Balance as at 31 December 40,088,927 42,573,503
14. Intangible assets
GoodwillCore depositintangibles
Operating licence Total
Cost
Balance as at 1 January 2021 1,998,318 932,907 1,752,890 4,684,115
Foreign currency translation (1,112) – – (1,112)
Additions – – 38,423 38,423
Balance as at 31 December 2021 1,997,206 932,907 1,791,313 4,721,426
Accumulated amortisation
Balance as at 1 January 2021 – (631,532) (105,620) (737,152)
Amortisation charge – (75,465) (22,023) (97,488)
Balance as at 31 December 2021 – (706,997) (127,643) (834,640)
Net book value as at 31 December 2021 1,997,206 225,910 1,663,670 3,886,786
Cost
Balance as at 1 January 2020 1,962,802 932,907 1,739,432 4,635,141
Foreign currency translation 35,516 – – 35,516
Additions – – 13,458 13,458
Balance as at 31 December 2020 1,998,318 932,907 1,752,890 4,684,115
Accumulated amortisation
Balance as at 1 January 2020 – (555,861) (86,062) (641,923)
Amortisation charge – (75,671) (19,558) (95,229)
Balance as at 31 December 2020 – (631,532) (105,620) (737,152)
Net book value as at 31 December 2020 1,998,318 301,375 1,647,270 3,946,963
Impairment tests for goodwill and intangible assets with indefinite livesNet book value of goodwill as at 31 December 2021 includes QR1.7 billion (2020: QR1.7 billion) in respect of QNB ALAHLI, QR89.6 million (2020: QR89.6 million) in respect of QNB Indonesia, QR111.9 million (2020: QR111.9 million) in respect of Mansour Bank and QR77.4 million (2020: QR77.4 million) in respect of QNB Tunisia.
The Group performed its annual impairment test in accordance with its accounting policy and performed a sensitivity analysis of the underlying assumptions used in the value–in–use calculations. The recoverable amounts of cash–generating units were higher than the carrying amounts. Consequently, no impairment was considered necessary as at the end of the reporting period (2020:Nil).
The intangible assets with finite lives have a remaining amortisation period ranging between 2 to 4 years. Recoverable amount of goodwill and other intangible assets with indefinite useful life for QNB ALAHLI, which includes, corporate and consumer banking CGUs, is calculated using value–in–use method based on following inputs. A discount rate of 21.75% (2020 : 25.03%) and a terminal growth rate of 2.5% (2020: 2.5%) were used to estimate the recoverable amount..
15. Other assets
2021 2020
Prepaid expenses 479,817 565,094
Positive fair value of derivatives (note 36) 7,308,699 5,505,982
Sundry debtors 2,356,341 2,165,379
Deferred tax asset (note 32) 388,447 794,630
Others 1,913,905 5,709,779
Total 12,447,209 14,740,864
Qatar National Bank (Q.P.S.C.) Notes to the Consolidated Financial StatementsAs at and for the year ended 31 December 2021(All amounts are shown in thousands of Qatari Riyals)
Qatar National Bank (Q.P.S.C.) Notes to the Consolidated Financial StatementsAs at and for the year ended 31 December 2021(All amounts are shown in thousands of Qatari Riyals)
Qatar National Bank (Q.P.S.C.) Notes to the Consolidated Financial StatementsAs at and for the year ended 31 December 2021(All amounts are shown in thousands of Qatari Riyals)

150 — QNB Annual Report 2021 QNB Annual Report 2021 — 151
Financial statements
SustainabilityC
orporate governanceR
iskO
perational performance
Strategic reportG
roup overview20. Other liabilities
2021 2020
Expense payable 1,245,600 1,029,343
Other provisions (note 21) 428,952 486,328
Tax payable 554,936 908,725
Negative fair value of derivatives (note 36) 5,630,918 5,858,247
Unearned revenue 2,210,796 2,029,475
Social and sports fund 259,143 219,467
Deferred tax liability (note 32) 53,078 52,577
Margin accounts 1,318,167 1,280,110
Allowance for impairment for loan commitments and financial guarantees 543,087 546,791
Lease liabilities (note 20.1) 608,724 677,443
Others 16,947,301 17,858,536
Total 29,800,702 30,947,042
20.1 Lease liabilities include current and non–current liabilities amounting to QR147.2 million (2020: QR111.8 million) and QR461.5million (2020: QR565.7 million), respectively.
21. Other provisions
Staff indemnity
Legalprovision
OtherProvision Total
Balance as at 1 January 2021 254,696 97,600 134,032 486,328
Foreign currency translation (32,557) (40,467) (27,779) (100,803)
Provisions made, net 48,585 28,587 23,118 100,290
270,724 85,720 129,371 485,815
Provisions paid, written off or transferred (19,649) (954) (36,260) (56,863)
Balance as at 31 December 2021 251,075 84,766 93,111 428,952
Balance as at 1 January 2020 268,213 81,774 142,580 492,567
Foreign currency translation (33,217) (12,756) (12,003) (57,976)
Provisions made, net 56,390 30,398 5,763 92,551
291,386 99,416 136,340 527,142
Provisions paid, written off or transferred (36,690) (1,816) (2,308) (40,814)
Balance as at 31 December 2020 254,696 97,600 134,032 486,328
22. Equity
a) Issued capitalThe authorised, issued and fully paid up share capital of the Bank totalling QR9,236 million consists of 9,236,428,570 ordinary shares of QR1 each. Qatar Investment Authority holds 50% of the ordinary shares of the Bank with the remaining 50% are available to be held by members of the public. All shares issued are of the same class and carry equal rights.
b) Legal reserve In accordance with Qatar Central Bank Law, at least 10% of the profit for the year is required to be transferred to the legal reserve until the reserve equals 100% of the paid up capital. This reserve is not available for distribution, except in circumstances specified in the Qatar Commercial Companies Law and after Qatar Central Bank approval. When bonus shares are proposed, an increase in the legal reserve is proposed equivalent to the increase in capital to enhance the financial position of the Group.
The proceeds received from the rights issue, net of any directly attributable transaction costs, are directly credited to share capital (nominal value of shares) and legal reserve (share premium on rights issue) when shares have been issued higher than their nominal value.
18. Debt securities (continued)
The table below shows the maturity profile of the debt securities outstanding as at the end of the reporting period:
Year of maturity 2021 2020
2021 – 11,236,141
2022 7,190,608 5,754,534
2023 1,484,198 1,552,207
2024 8,429,161 6,084,829
2025 5,809,506 5,805,403
2026 4,712,274 –
2027 3,634,530 3,634,133
2028 724,882 770,673
2047 2,787,465 2,654,252
2048 3,046,815 2,897,031
2060 2,269,488 2,184,300
Total 40,088,927 42,573,503
The above debt securities are denominated in USD, GBP, AUD and comprise of fixed and floating interest rates. The interest rate paid on the above averaged 3.09% p.a in 2021 (2020: 3.35% p.a).
19. Other borrowingsThe table below shows the movement in other borrowings issued by the Group as at the end of the reporting period:
2021 2020
Balance as at 1 January 27,901,487 25,266,611
Issuances during the year 11,259,064 17,710,213
Repayments (10,419,936) (15,325,322)
Other movements/foreign exchange translation (2,630,964) 217,774
Interest accrued 28,588 32,211
Balance as at 31 December 26,138,239 27,901,487
The table below shows the maturity profile of the other borrowings outstanding as at the end of the reporting period:
Year of maturity 2021 2020
2021 – 11,397,826
2022 4,521,055 2,049,829
2023 8,856,590 8,868,859
2024 7,289,240 133,376
2025 5,471,354 5,451,597
Total 26,138,239 27,901,487
The above are mainly denominated in USD, EUR and comprise of fixed and floating interest rates. The interest rate paid on the above averaged 1.20% p.a in 2021 (2020: 1.63% p.a).
The Group hedges part of the currency risk of its net investment in foreign operations using foreign currency borrowings. Included in other borrowings was a borrowing of EUR1.75 billion (2020: EUR 2.0 billion) designated as a hedge of the Group’s net investment foreign operations, and is being used to hedge the Group’s exposure to foreign exchange risk on this investment.
At the end of the reporting period, the net investment hedge was highly effective.
Qatar National Bank (Q.P.S.C.) Notes to the Consolidated Financial StatementsAs at and for the year ended 31 December 2021(All amounts are shown in thousands of Qatari Riyals)
Qatar National Bank (Q.P.S.C.) Notes to the Consolidated Financial StatementsAs at and for the year ended 31 December 2021(All amounts are shown in thousands of Qatari Riyals)
Qatar National Bank (Q.P.S.C.) Notes to the Consolidated Financial StatementsAs at and for the year ended 31 December 2021(All amounts are shown in thousands of Qatari Riyals)

152 — QNB Annual Report 2021 QNB Annual Report 2021 — 153
Financial statements
SustainabilityC
orporate governanceR
iskO
perational performance
Strategic reportG
roup overview
Qatar National Bank (Q.P.S.C.) Notes to the Consolidated Financial StatementsAs at and for the year ended 31 December 2021(All amounts are shown in thousands of Qatari Riyals)
Qatar National Bank (Q.P.S.C.) Notes to the Consolidated Financial StatementsAs at and for the year ended 31 December 2021(All amounts are shown in thousands of Qatari Riyals)
22. Equity (continued)
c) Risk reserveIn accordance with Qatar Central Bank regulations, a risk reserve is made to cover contingencies on loans and advances and financing activities, with a minimum requirement of 2.5% of the total direct facilities after excluding provisions for credit losses, deferred profits, exposures granted to or guaranteed by the Government and exposures against cash collaterals.
d) Fair value reserveHedges of a
net investmentin foreignoperation
Cash flow hedges
Fair ValueThrough Other
ComprehensiveIncome Total
Balance as at 1 January 2021 (885,748) (1,189,898) 264,595 (1,811,051)
Foreign currency translation – 92,800 58,431 151,231
Revaluation impact 713,760 129,857 (350,669) 492,948
Reclassified to income statement – – – –
Other movements – (191) (2,487) (2,678)
Net movement during the year 713,760 129,666 (353,156) 490,270
Balance as at 31 December 2021 (171,988) (967,432) (30,130) (1,169,550)
Balance as at 1 January 2020 (100,616) (1,405,869) 159,211 (1,347,274)
Foreign currency translation – 49,285 1,214 50,499
Revaluation impact (785,132) 166,721 152,437 (465,974)
Reclassified to income statement – – (67,038) (67,038)
Other movements – (35) 18,771 18,736
Net movement during the year (785,132) 166,686 104,170 (514,276)
Balance as at 31 December 2020 (885,748) (1,189,898) 264,595 (1,811,051)
e) Foreign currency translation reserveThe translation reserve comprises all foreign exchange differences arising from the translation of the financial statements of foreign operations.
f) Other reservesOther reserves represent mainly a general reserve which, in accordance with the Bank’s Articles of Association, shall be employed according to a resolution of the General Assembly upon the recommendation from the Board of Directors and after Qatar Central Bank approval. Currency translation adjustments and share of changes recognised directly in associates’ equity are not available for distribution. Details of other reserves are as follows:
2021 2020
General reserve 1,763,194 1,777,179
Share of changes recognised directly in associates’ equity, excluding share of profit (1,717,053) (1,611,129)
Total 46,141 166,050
g) Retained earningsRetained earnings include the Group’s share in profit of associates. These profits are distributable to the shareholders only to the extent of the cash received.
h) Proposed dividendThe Board of Directors have proposed a cash dividend of 55% of the nominal share value (QR0.55 per share) for the year ended 31 December 2021 (2020: cash dividend 45% of the nominal share value (QR0.45 per share). The amounts are subject to the approval of the General Assembly.
23. Non–controlling interestsRepresents the non – controlling interest in QNB Syria amounting to 49.2% of the share capital, 7.5% in QNB Indonesia, 45.8% in Al–Mansour Investment Bank, 0.01% in QNB Tunisia, 5.0% in QNB ALAHLI and 0.12% in QNB Finansbank.
24. Instruments eligible for Additional Tier 1 CapitalIn 2016, QNB raised Additional Tier 1 Perpetual Capital (‘Note’) by issuing unsecured perpetual non–cumulative unlisted note for an amount of QR10 billion. In 2018, QNB issued another series of Additional Tier 1 Perpetual Capital (‘Note’) for an amount of QR10 billion with similar terms and conditions as described below.
The distributions (i.e. coupon payments) are discretionary and non–cumulative and payable annually until the first call date being six years from the date of issuance.
These Notes rank junior to the QNB’s existing unsubordinated obligations including existing depositors, pari–passu to all current and future subordinated obligations and senior to the ordinary shares issued by the Bank. These Notes have no fixed redemption date and the Bank can only redeem the Notes in the limited circumstances and other general redemption conditions solely at the Bank’s discretion. The Bank might be required to write–off the Note, if a ‘loss absorption’ event is triggered. These Notes have been classified within total equity.
25. Interest income
2021 2020
Due from central banks 280,192 244,449
Due from banks 1,255,705 1,744,987
Debt securities 8,529,468 6,825,450
Loans and advances 34,670,798 34,958,193
Total 44,736,163 43,773,079
The amounts reported above include interest income, calculated using the effective interest method, that relate to the following items:
2021 2020
Financial assets measured at amortised cost 42,932,647 42,158,214
Financial assets measured at fair value 1,803,516 1,614,865
Total 44,736,163 43,773,079
26. Interest expense
2021 2020
Due to banks 4,918,937 5,229,367
Customer deposits 14,666,384 14,882,168
Debt securities 1,292,408 1,339,881
Others 822,314 1,326,305
Total 21,700,043 22,777,721
Others include interest expense related to leased liabilities amounting to QR46.9 million (2020: QR 50.4 million).
27. Fee and commission income
2021 2020
Loans and advances 734,847 509,433
Off–balance sheet items 649,800 595,703
Bank services 2,667,306 2,325,109
Investment activities for customers 279,160 315,360
Others 204,036 225,930
Total 4,535,149 3,971,535

154 — QNB Annual Report 2021 QNB Annual Report 2021 — 155
Financial statements
SustainabilityC
orporate governanceR
iskO
perational performance
Strategic reportG
roup overview32. Income taxes
2021 2020
Current income tax 1,006,149 1,363,252
Deferred tax (benefit) / expense 376,889 (252,430)
Adjustments to prior periods corporate taxes 6,927 (9,184)
Income tax expense 1,389,965 1,101,638
Profit before tax 14,666,065 13,184,299
Less: Profit not subject to tax (10,725,804) (9,670,331)
Profit subject to tax 3,940,261 3,513,968
Effective tax rate 23.65% 23.48%
Tax calculated based on the current tax rate (effective rate) 931,928 825,098
Effect of income not subject to taxation (30,963) (45,187)
Effect of expenses not deductible for tax purposes 482,073 330,911
Adjustments to prior periods corporate taxes 6,927 (9,184)
Income tax expense 1,389,965 1,101,638
Movement in deferred tax asset
As at and for the year ended Recognised in Deferred tax
31 December 2021 Net balance as at 1 January
2021income
statement
other comprehensive
incomeNet Asset Liability
Expected credit losses 630,619 (220,684) 2,677 412,612 442,482 (29,870)
Property and equipment (68,153) 16,346 – (51,807) (51,807) –
Employee related accruals 102,611 (10,185) – 92,426 92,426 –
Unearned revenue 48,357 (8,748) – 39,609 39,609 –
Investment securities 105,825 33,553 67,192 206,570 207,288 (718)
Tax losses carried forward 136,883 64,661 – 201,544 201,544 –
Others (214,089) (251,832) (99,664) (565,585) (543,095) (22,490)
Deferred tax assets / (liabilities) 742,053 (376,889) (29,795) 335,369 388,447 (53,078)
As at and for the year ended Recognised in Deferred tax
31 December 2020 Net balance as at 1 January
2020income
statement
other comprehensive
incomeNet Asset Liability
Expected credit losses 454,310 176,309 – 630,619 674,372 (43,753)
Property and equipment (56,876) (11,277) – (68,153) (68,153) –
Employee related accruals 84,716 17,895 – 102,611 102,611 –
Unearned revenue 36,640 11,717 – 48,357 48,357 –
Investment securities 52,517 25,475 27,833 105,825 107,133 (1,308)
Tax losses carried forward 114,655 22,228 – 136,883 136,883 –
Others (165,588) 10,083 (58,584) (214,089) (206,573) (7,516)
Deferred tax assets / (liabilities) 520,374 252,430 (30,751) 742,053 794,630 (52,577)
28. Net foreign exchange gain
2021 2020
Dealing in foreign currencies 683,557 824,587
Revaluation of assets and liabilities 1,582,922 357,507
Revaluation of derivatives (935,361) (31,219)
Total 1,331,118 1,150,875
29. Income from investment securities
2021 2020
Net gain on sale of investments measured at amortised cost 4,689 5,072
Net gain from sale of investments measured at fair value 54,803 115,673
Dividend income 47,198 48,365
Changes in fair value of financial assets measured at fair value through profit or loss 19,295 36,497
Total 125,985 205,607
30. Staff expenses
2021 2020
Staff costs 3,282,848 3,293,846
Staff pension fund costs 50,625 49,699
Staff indemnity costs 48,585 56,390
Total 3,382,058 3,399,935
31. Other expenses
2021 2020
Training 48,160 45,281
Advertising 434,368 461,199
Professional fees 183,344 234,147
Communication and insurance 394,188 249,024
Occupancy and maintenance 373,408 353,498
Computer and IT costs 505,959 412,669
Printing and stationery 53,525 52,612
Directors’ fees 16,940 11,740
Others 284,453 321,221
Total 2,294,345 2,141,391
Occupany costs include expenses related to leases other than interest expense amounting to QR31.6 million (2020: QR 29.0 million).
Qatar National Bank (Q.P.S.C.) Notes to the Consolidated Financial StatementsAs at and for the year ended 31 December 2021(All amounts are shown in thousands of Qatari Riyals)
Qatar National Bank (Q.P.S.C.) Notes to the Consolidated Financial StatementsAs at and for the year ended 31 December 2021(All amounts are shown in thousands of Qatari Riyals)
Qatar National Bank (Q.P.S.C.) Notes to the Consolidated Financial StatementsAs at and for the year ended 31 December 2021(All amounts are shown in thousands of Qatari Riyals)

156 — QNB Annual Report 2021 QNB Annual Report 2021 — 157
Financial statements
SustainabilityC
orporate governanceR
iskO
perational performance
Strategic reportG
roup overview32. Income taxes (continued)
Expiry of deferred tax recognised on carried forward tax losses 2021 2020
2021 – 2025 139,269 45,992
2026 – 2030 40,369 68,826
Never expire 21,906 22,065
201,544 136,883
There are no material tax assessments pending as at 31 December 2021 (2020: Nil).
33. Basic and diluted earnings per shareEarnings per share for the Group is calculated by dividing profit for the year attributable to equity holders of the Bank, further adjusted for the dividend appropriation for instruments eligible for Additional Tier 1 Capital, by the weighted average number of ordinary shares in issue during the year.
2021 2020
Profit for the year attributable to equity holders of the Bank 13,211,123 12,002,867
Less: Dividend appropriation for instruments eligible for Additional Tier 1 Capital (1,000,000) (1,000,000)
Net profit for the year attributable to equity holders of the Bank 12,211,123 11,002,867
Weighted average number of shares 9,236,428,570 9,236,428,570
Earnings per share (QR) – basic and diluted 1.32 1.19
34. Contingent liabilities
2021 2020
Unutilised credit facilities 95,460,312 115,535,472
Guarantees 59,477,207 60,337,801
Letters of credit 47,558,895 37,806,688
Others 11,527,422 14,962,140
Total 214,023,836 228,642,101
Unutilised credit facilitiesCommitments to extend credit represent contractual commitments to make loans and revolving credits. The majority of these expire in the next year. Since commitments may expire without being drawn upon, the total contractual amounts do not necessarily represent future cash requirements.
Guarantees and letters of creditGuarantees and letters of credit commit the Group to make payments on behalf of customers in the case of a specific event. Guarantees and standby letters of credit carry the same credit risk as loans.
35. Geographical distribution
QatarOther GCCcountries Europe
NorthAmerica Others Total
Balance as at 31 December 2021:
Cash and balances with central banks 52,102,776 990,999 22,458,693 – 12,998,820 88,551,288
Due from banks 11,741,230 947,225 34,601,677 10,113,903 11,651,109 69,055,144
Loans and advances to customers 599,402,271 13,725,100 83,093,191 4,625,644 62,805,835 763,652,041
Investments 82,460,115 6,028,605 15,078,031 1,067,748 45,653,838 150,288,337
745,706,392 21,691,929 155,231,592 15,807,295 133,109,602 1,071,546,810
Other assets 21,490,801
Total assets 1,093,037,611
Due to banks 13,921,548 13,418,362 57,444,673 1,752,493 24,904,496 111,441,572
Customer deposits 439,448,664 24,136,088 202,342,353 4,046,879 115,537,540 785,511,524
Debt securities – – 27,489,283 – 12,599,644 40,088,927
Other borrowings – – 22,963,298 – 3,174,941 26,138,239
453,370,212 37,554,450 310,239,607 5,799,372 156,216,621 963,180,262
Other liabilities 29,800,702
Total equity 100,056,647
Total liabilities and equity 1,093,037,611
Guarantees 33,756,889 1,194,871 17,098,594 – 7,426,853 59,477,207
Letters of credit 36,575,077 252,624 7,367,057 – 3,364,137 47,558,895
Unutilised credit facilities 30,837,136 2,956,334 49,626,419 – 12,040,423 95,460,312
Balance as at 31 December 2020:
Cash and balances with central banks 52,069,158 1,429,236 15,054,329 – 12,998,255 81,550,978
Due from banks 13,860,731 623,601 31,266,802 7,655,564 11,721,122 65,127,820
Loans and advances to customers 545,408,469 13,933,760 96,389,901 4,607,258 63,455,786 723,795,174
Investments 69,671,383 6,034,051 19,977,703 1,245,664 33,519,420 130,448,221
681,009,741 22,020,648 162,688,735 13,508,486 121,694,583 1,000,922,193
Other assets 24,092,867
Total assets 1,025,015,060
Due to banks 10,082,122 8,580,814 48,062,555 2,773,708 18,454,524 87,953,723
Customer deposits 435,004,492 17,917,746 177,405,654 1,089,829 107,319,865 738,737,586
Debt securities – – 26,088,384 – 16,485,119 42,573,503
Other borrowings – – 24,568,488 – 3,332,999 27,901,487
445,086,614 26,498,560 276,125,081 3,863,537 145,592,507 897,166,299
Other liabilities 30,947,042
Total equity 96,901,719
Total liabilities and equity 1,025,015,060
Guarantees 30,927,007 1,203,718 20,361,706 – 7,845,370 60,337,801
Letters of credit 32,967,276 173,817 3,141,292 – 1,524,303 37,806,688
Unutilised credit facilities 34,587,599 3,125,047 67,018,756 – 10,804,070 115,535,472
Other assets includes property and equipment and intangible assets.
Qatar National Bank (Q.P.S.C.) Notes to the Consolidated Financial StatementsAs at and for the year ended 31 December 2021(All amounts are shown in thousands of Qatari Riyals)
Qatar National Bank (Q.P.S.C.) Notes to the Consolidated Financial StatementsAs at and for the year ended 31 December 2021(All amounts are shown in thousands of Qatari Riyals)
Qatar National Bank (Q.P.S.C.) Notes to the Consolidated Financial StatementsAs at and for the year ended 31 December 2021(All amounts are shown in thousands of Qatari Riyals)

158 — QNB Annual Report 2021 QNB Annual Report 2021 — 159
Financial statements
SustainabilityC
orporate governanceR
iskO
perational performance
Strategic reportG
roup overview36. Derivatives
The table below shows the positive and negative fair values of derivative financial instruments, together with the notional amounts analysed by the term to maturity. The notional amounts, which provide an indication of the volumes of the transactions outstanding at the year end, do not necessarily reflect the amounts of future cash flows involved. These notional amounts, therefore, are neither indicative of the Group’s exposure to credit risk, which is generally limited to the positive fair value of the derivatives, or market risk.
Positivefair
value
Negativefair
valueNotional
amount
Notional / expected amount by term to maturity
Within3 months
3–12months
1–5years
More than
5 years
As at 31 December 2021:
Derivatives held for trading:
Forward foreign exchange contracts 477,034 824,763 127,673,393 98,317,361 24,076,744 5,279,288 –
Interest rate swaps 523,504 479,533 55,352,217 4,260,957 7,552,981 16,847,473 26,690,806
Cross currency swaps 2,106,121 2,004,636 56,277,302 51,061,251 3,994,733 1,189,503 31,815
Options / Others 80,687 19,343 1,693,182 1,160,036 518,210 14,936 –
Derivatives held as cash flow hedges:
Interest rate swaps 105,888 861,460 27,492,712 801,204 5,326,980 16,843,056 4,521,472
Cross currency swaps 2,755,036 881,430 50,745,694 2,630,438 3,088,292 36,779,378 8,247,586
Derivatives held as fair value hedges:Interest rate swaps 366,703 559,753 28,588,662 55,780 3,346,192 7,359,598 17,827,092
Cross currency swaps 893,726 – 2,112,055 51,366 678,497 1,382,192 –
Total 7,308,699 5,630,918 349,935,217 158,338,393 48,582,629 85,695,424 57,318,771
As at 31 December 2020:
Derivatives held for trading:
Forward foreign exchange contracts 306,946 300,540 108,994,615 96,169,195 11,717,873 1,107,547 –
Interest rate swaps 809,914 779,661 60,637,262 3,195,172 3,161,294 20,705,310 33,575,486
Cross currency swaps 1,358,252 2,260,225 72,536,317 64,843,169 2,715,130 4,940,965 37,053
Options 79,040 14,406 2,978,280 2,178,342 799,938 – –
Derivatives held as cash flow hedges:
Interest rate swaps 170,212 1,540,668 39,069,848 – 1,436,418 25,147,802 12,485,628
Cross currency swaps 1,162,590 524,069 40,419,593 340,177 1,366,275 21,365,788 17,347,353
Derivatives held as fair value hedges:
Interest rate swaps 155,914 330,070 19,779,061 79,919 240,723 6,635,572 12,822,847
Cross currency swaps 1,463,114 108,608 7,485,704 950,103 2,672,328 3,769,121 94,152
Total 5,505,982 5,858,247 351,900,680 167,756,077 24,109,979 83,672,105 76,362,519
Cash collaterals given for derivative transactions amounted to QR10,555 million (2020: QR7,632million) which is included under Due from Banks in Note 9. Collaterals received for derivative transactions amounted to QR9,055 million (2020: QR4,340 million) which is included under Due to Banks in Note 16.
36. Derivatives (continued)
Swaps Swaps are commitments to exchange one set of cash flows for another. In the case of interest rate swaps, counterparties generally exchange fixed and floating interest payments in a single currency without exchanging principal. In the case of currency swaps, fixed interest payments and principal are exchanged in different currencies. In the case of cross–currency interest rate swaps, principal, fixed and floating interest payments are exchanged in different currencies. In the case of credit default swaps the counterparties agree to make payments with respect to defined credit events based on specified notional amounts.
Forwards and futures Forwards and futures are contractual agreements to either buy or sell a specified currency, commodity or financial instrument at a specified price and date in the future. Forwards are customised contracts transacted in the over–the–counter market. Foreign currency and interest rate futures are transacted in standardised amounts on regulated exchanges and changes in future contract values are settled daily.
Forward rate agreements Forward rate agreements are individually negotiated interest rate futures that call for a cash settlement of the difference between a contracted interest rate and the market rate on a specified future date, on a notional principal for an agreed period of time.
Options Options are contractual agreements under which the seller (writer) grants the purchaser (holder) the right, but not the obligation, to either buy or sell at fixed future date or at any time during a specified period, a specified amount of a currency, commodity or financial instrument at a pre–determined price.
Caps and floorsAn interest rate cap or floor is a contractual arrangement under which the buyer receives money at the end of each specific period, in which the agreed interest rate exceeds or is below the agreed strike price of the cap or floor.
Derivatives held for hedging purposesThe Group has adopted a comprehensive system for the measurement and management of risk. Part of the risk management process involves reducing the Group’s exposure to fluctuations in foreign exchange rates and interest rates to acceptable levels within the guidelines issued by the Qatar Central Bank. The Group has established levels of currency risk by setting limits on counterparty and currency position exposures. Positions are monitored on a daily basis and hedging strategies are used to ensure positions are maintained within the established limits. The Group has established a level of interest rate risk by setting limits on interest rate gaps for stipulated periods. Asset and liability interest rate gaps are reviewed on a periodic basis and hedging strategies are used to reduce interest rate gaps within the established limits.
As part of its asset and liability management, the Group uses derivatives for hedging purposes in order to adjust its own exposure to currency and interest rate risks. This is generally achieved by hedging specific transactions in the consolidated statement of financial position.
The Group uses interest rate swaps to hedge against the cash flow risk arising on certain floating rate liabilities. In such cases, the hedging relationship and objective, including details of the hedged items and hedging instruments, are formally documented and the transactions are accounted for as cash flow hedges.
The Group uses interest rate swap contracts to mitigate part of the risk of a potential increase in the fair value of its fixed rate customer’s deposits in foreign currencies to the extent caused by declining market interest rates. These transactions are accounted as fair value hedges.
Derivatives held for trading purposes Most of the Group’s derivative trading activities relate to sales, positioning and arbitrage. Sales activities involve offering products to customers in order to enable them to transfer, modify or reduce current and future risks. Positioning involves managing market risk positions with the expectation of profiting from favourable movements in prices, rates or indices. Arbitrage involves identifying and profiting from price differentials between markets or products. The Group also uses forward foreign exchange contracts and currency swaps to hedge against specifically identified currency risks.
Qatar National Bank (Q.P.S.C.) Notes to the Consolidated Financial StatementsAs at and for the year ended 31 December 2021(All amounts are shown in thousands of Qatari Riyals)
Qatar National Bank (Q.P.S.C.) Notes to the Consolidated Financial StatementsAs at and for the year ended 31 December 2021(All amounts are shown in thousands of Qatari Riyals)
Qatar National Bank (Q.P.S.C.) Notes to the Consolidated Financial StatementsAs at and for the year ended 31 December 2021(All amounts are shown in thousands of Qatari Riyals)

160 — QNB Annual Report 2021 QNB Annual Report 2021 — 161
Financial statements
SustainabilityC
orporate governanceR
iskO
perational performance
Strategic reportG
roup overview37. Mutual funds
As part of the Group’s investment activities, the following mutual funds were marketed by the Group:
2021 2020
Funds marketed 153,672 78,538
The Group’s investment activities also include management of certain investment funds. As at 31 December 2021, third party funds under management amounted to QR 25,020 million (2020: QR20,984 million). The consolidated financial statements of these funds are not consolidated with the financial statements of the Group as these funds have no recourse to the general assets of the Group and the Group has no recourse to the assets of the funds. However, the Group’s share of equity in these funds is included in the investment securities of the Group.
38. Related partiesThe Group has transactions in the ordinary course of business with directors, officers of the Group and entities over which they have significant influence and control. The key management personnel are those persons having authority and responsibility in making financial and operating decisions. At the statement of financial position date, such significant balances included:
2021 2020
Statement of financial position items
Loans and advances 3,174,664 2,933,737
Deposits 1,406,375 1,383,123
Contingent liabilities and other commitments 48,938 81,658
Income statement items
Interest and commission income 127,325 130,951
Interest and commission expense 15,795 32,145
2021 2020
Associates
Due from banks 1,363,707 1,512,004
Interest and commission income 45,243 56,832
Due to banks 58,238 1,708
Interest and commission expense 41 156
The Group also has significant commercial transactions with the Government of Qatar which are disclosed in notes 10 and 17. All the transactions with related parties are substantially on the same terms, including interest rates and collateral, as those prevailing in comparable transactions with unrelated parties.
2021 2020
Compensation of key management personnel is as follows:
Salaries and other benefits 43,399 43,287
End of service indemnity benefits 1,017 1,169
39. Cash and cash equivalentsFor the purpose of the consolidated statement of cash flows, cash and cash equivalents comprise the following balances:
2021 2020
Cash and balances with central banks 44,822,662 40,951,732
Due from banks maturing in three months 61,837,798 61,531,608
Total 106,660,460 102,483,340
Cash and balances with central banks do not include mandatory reserve deposits.
Qatar National Bank (Q.P.S.C.)Notes to the Consolidated Financial StatementsAs at and for the year ended 31 December 2021(All amounts are shown in thousands of Qatari Riyals)
Qatar National Bank (Q.P.S.C.)Notes to the Consolidated Financial StatementsAs at and for the year ended 31 December 2021(All amounts are shown in thousands of Qatari Riyals)
40. Impact of COVID–19The coronavirus (“COVID–19”) pandemic has spread across various geographies globally, causing disruption to business and economic activities. COVID–19 has brought about uncertainties in the global economic environment.
QNB Group is closely monitoring the situation and has activated its business continuity planning and other risk management practices to manage the potential business disruption COVID–19 outbreak may have on its operations and financial performance.
QNB Group’s operations are partially concentrated in economies that are relatively dependent on the price of crude oil. During the current year, the uncertainties caused by COVID–19, and the changes in oil prices have required the Group to update the inputs and assumptions used for the determination of expected credit losses (“ECLs”) accordingly and the Group has updated the same as at 31 December 2021. ECLs were estimated based on a range of forecast economic conditions as at that date and the Group has considered the impact of volatility in the forward–looking macro–economic factors, when determining the severity and likelihood of economic scenarios for ECL determination.
This volatility has been reflected through adjustment in the methods of scenario construction and the underlying weightages assigned to these scenarios. The forward–looking factors used are determined from statistical distribution of credit cycle index (CCI) factors, which can be derived from a number of historical observed factors such as risk yields, credit growth, credit spreads or defaults. These are disclosed in note 4(b) Credit Risk.
QNB Group also updated the relevant forward–looking information of QNB Group’s international operations with respect to the weightings of the relevant macro–economic scenarios relative to the economic climate of the respective market in which it operates.
The Group has delayed repayments of certain customers for the period and the resulting modification loss on these exposures is not considered material for the Group. In accordance with IASB guidance, the extension of payment relief does not automatically trigger a significant increase in credit risk and a stage migration for the purpose of calculating expected credit losses, as these measures are being made available to assist borrowers affected by Covid–19 outbreak to resume regular payments.
QNB Group has given specific consideration to the relevant impact of COVID–19 on the qualitative and quantitative factors when determining the significant increase in credit risk and assessing the indicators of impairment for the exposures in potentially affected sectors. This has resulted in staging downgrade of certain exposures and recognition of relevant ECLs and impairment allowances as disclosed in note 4 and note 10.
The Group has investments in associates which were tested for impairment during the period, due to market volatility arising from economic conditions due to global pandemic. The Group has performed an impairment testing, and based on results of the test, the recoverable amounts were higher than the carrying amounts at end of the reporting period, and hence no impairment is deemed to be required.
The Group has considered the potential impacts of the current economic volatility in determination of the reported amounts of the financial and non–financial assets and these are considered to represent management's best assessment based on observable information. Markets however remain volatile and the recorded amounts remain sensitive to market fluctuations.
41. Comparative figuresCertain prior year amounts have been reclassified for better presentation in order to conform with the current year presentation.

162 — QNB Annual Report 2021 QNB Annual Report 2021 — 163
Financial statements
SustainabilityC
orporate governanceR
iskO
perational performance
Strategic reportG
roup overview(ii) Income statement for the year ended 31 December:
2021 2020
Interest income 24,792,217 25,819,879
Interest expense (9,111,933) (12,092,328)
Net interest income 15,680,284 13,727,551
Fee and commission income 2,010,778 1,683,327
Fee and commission expense (624,295) (460,722)
Net fee and commission income 1,386,483 1,222,605
Net foreign exchange gain 1,036,533 1,004,489
Income from investment securities 65,643 477,718
Other operating income 957 4,784
Operating income 18,169,900 16,437,147
Staff expenses (1,630,294) (1,538,468)
Depreciation (206,531) (243,164)
Other expenses (929,128) (818,415)
Net ECL / impairment losses on loans and advances to customers (4,903,898) (4,380,253)
Net ECL / impairment losses on investment securities (52,236) (71,449)
Net ECL / impairment losses on other financial assets (90,905) (108,773)
Other provisions (4,803) (10,309)
Profit before income taxes 10,352,105 9,266,316
Income tax expense (44,767) (55,608)
Profit for the year 10,307,338 9,210,708
(iii) Accounting policies for financial information of the parent bank
Statement of financial position and income statement of the parent bank are prepared using the same accounting policies followed for the consolidated financial statements except for investment in subsidiaries and associates, which are not consolidated and carried at cost.
Qatar National Bank (Q.P.S.C.)Supplementary Information to the Consolidated Financial StatementsAs at and for the year ended 31 December 2021(All amounts are shown in thousands of Qatari Riyals)
Parent companyThe statement of financial position and income statement of the parent company are presented below:
(i) Statement of financial position as at 31 December:2021 2020
ASSETS
Cash and balances with central banks 58,031,420 59,671,077
Due from banks 65,022,638 63,629,676
Loans and advances to customers 655,180,935 603,336,365
Investment securities 96,268,406 83,967,228
Investments in subsidiaries and associates 32,297,916 31,589,794
Property and equipment 2,922,753 2,417,955
Other assets 7,258,444 10,414,573
Total assets 916,982,512 855,026,668
LIABILITIES
Due to banks 133,436,779 116,230,401
Customer deposits 642,374,563 600,794,225
Other borrowings 22,381,528 24,095,827
Other liabilities 15,261,328 15,609,505
Total liabilities 813,454,198 756,729,958
EQUITY
Issued capital 9,236,429 9,236,429
Legal reserve 25,326,037 25,326,037
Risk reserve 10,000,000 9,000,000
Fair value reserve (787,123) (1,535,400)
Foreign currency translation reserve (1,746,173) (1,572,120)
Other reserves 52,981 158,905
Retained earnings 41,446,163 37,682,859
Total equity attributable to equity holders of the Bank 83,528,314 78,296,710
Instruments eligible for Additional Tier 1 Capital 20,000,000 20,000,000
Total equity 103,528,314 98,296,710
Total liabilities and equity 916,982,512 855,026,668
Qatar National Bank (Q.P.S.C.)Supplementary Information to the Consolidated Financial StatementsAs at and for the year ended 31 December 2021(All amounts are shown in thousands of Qatari Riyals)

164 — QNB Annual Report 2021 QNB Annual Report 2021 — 165
Financial statements
SustainabilityC
orporate governanceR
iskO
perational performance
Strategic reportG
roup overview
QNB Head Office, International Branches and Representative Offices
ChinaRepresentative OfficeUnit 1905, Level 19, Tower 2(S2) The Bund Financial Center 600 Zhongshan Dong Er Road Huangpu districtShanghai, China 200010Tel: +86 21 6877 8980Fax: +86 21 6877 [email protected]
FranceBranch65 Avenue d’lena75116Paris, FranceTel: +33 1 53 23 0077Fax: +33 1 53 23 [email protected]
Hong KongBranchTwo InternationalFinance Centre,5801–5804,Central, Hong Kong
IndiaBranchG–1A, Ground Floor, 4 North AvenueMaker Maxity, Bandra Kurla ComplexBandra East400 051Mumbai, IndiaTel: +91 22 62296300Fax: +91 22 [email protected]
Iran*Representative OfficeNo.17 Africa HighwayNavak Building, 6th Floor, Unit 14Tehran, IranTel: +9821 88889814–22Fax: +9821 [email protected]
Kingdom of Saudi ArabiaBranchHamad BuildingKing Fahad Highway230108Riyadh, KSATel: +966 11 297 80 99Fax: +966 11 297 80 [email protected]
KuwaitBranchAl–Arabia TowerAhmad Al–Jaber StreetSharq Area, P.O. Box: 583Dasman 15456 – KuwaitTel: +965 2226 7023Fax: +965 2226 [email protected]
LebanonBranchAhmad Shawki StreetCapital Plaza BuildingMina El Hosn, Solidere11–210 Riad El SolhBeirut, LebanonTel: +961 1 762 222Fax: +961 1 377 [email protected]
MauritaniaBranchAl–Khaima City Center10, Rue Mamadou KonateP.O. Box: 2049Nouakchott, MauritaniaTel: +222 45249651Fax: +222 4524 [email protected]
MyanmarRepresentative OfficeNo. 53, Strand Road #316Strand Square Pabedan TownshipYangon, MyanmarTel: +95 1 2307371Fax: +95 1 [email protected]
OmanBranchPlot No. 18, Central Business DistrictP.O. Box: 4050112, RuwiMuscat, OmanTel: +968 2478 3555Fax: +968 2477 [email protected]
QatarHead OfficeP.O. Box: 1000Doha, State of QatarTel: +974 4425 2444Fax: +974 4441 [email protected]
SingaporeBranchThree Temasek Avenue#27–01 Centennial Tower39190SingaporeTel: +65 6499 0866Fax: +65 6884 [email protected]
South SudanGoshen House Kololo, Airport Road, Plot NO: 23, Juba Nabari area Juba, South SudanTel: +211 959 000 [email protected]
SudanBranchQNB Tower – Africa RoadStreet 17, AmaratP.O. Box: 8134Khartoum, SudanTel: +249 183 48 0000Fax: +249 183 48 [email protected]
United KingdomBranch51 Grosvenor StreetW1K 3HHLondon, UKTel: +44 207 647 2600Fax: +44 207 647 [email protected]
VietnamRepresentative OfficeTimes Square Building10th Floor 57–69F, Dong Khoi StreetBen Nghe Ward District 1Ho Chi Minh City, VietnamTel: +84 8 3911 7525Fax: +84 8 3827 [email protected]
YemenBranchQNB BuildingAl–Zubairi Street4310 Sana’aSana’a, YemenTel: +967 1 517517Fax: +967 1 [email protected]
QNB Subsidiaries and Associate Companies
AlgeriaThe Housing Bank for Trade andFinanceAssociate Company16 Rue Ahmed Ouaked – Dali IbrahimP.O.Box: 10316 320 Dali IbrahimAlger, AlgeriaTel: +213 21918787Fax: +213 [email protected]
BahrainQNB FinansbankSubsidiaryFlat 51, 5th Floor, Unitag Hse, Bldg 150,Rd 383, Block 315, Government AveP.O. Box: 2435Manama, BahrainTel +973 211322Fax +973 [email protected]
EgyptQNB Al AhliSubsidiaryDar Champollion, 5 Champollion St.Downtown 2664Cairo, EgyptTel: +202 2770 7000Fax: +202 2770 [email protected]
IndonesiaPT Bank QNB Indonesia TbkSubsidiaryRevenue Tower, 8th FloorDistrict 8, SCBD Lot 13Jl. Jenderal Sudirman Kav. 52–5312190Jakarta, IndonesiaTel : +62 21 515 5155Fax: +62 21 515 [email protected]
IraqMansour BankSubsidiaryAl Wihda AreaDistrict 14, Building 51Al Alawiya 3162Baghdad, IraqTel: +964 1 7175586Fax: +964 1 [email protected]
JordanThe Housing Bank for Trade and FinanceAssociate CompanyParliament Street, AbdaliP.O. Box: 7693Postal Code 11118Amman, JordanTel: +962 6 500 5555Fax: +962 6 567 [email protected]
LibyaThe Housing Bank for Trade and FinanceAssociate CompanyTripoli Tower, First Tower, Floor 15, (Office 155)P.O. Box: 91270Tripoli, LibyaTel: +218 9 13749132Fax: +218 2 [email protected]
PalestineThe Housing Bank for Trade andFinanceAssociate CompanyRamallah, AlQuds St., Padico BuildingP.O.Box: 1473West Bank, PalestineTel: +970 2 2986270Fax: +970 2 [email protected]
QatarAl Jazeera Finance CompanyAssociate CompanySalwa Road, Opposite to Midmak BridgeP.O. Box: 22310Doha, QatarTel: +974 4405 0444Fax: +974 4405 [email protected]
SwitzerlandQNB Suisse SASubsidiaryQuai du Mont Blanc 1P.O. Box: 1785 – 1201Genève, SwitzerlandTel: +41 22907 7070Fax: +41 22907 [email protected]
SyriaQNB SyriaSubsidiaryAl Abbassiyeen SquareP.O. Box: 33000Damascus, SyriaTel: +963 11 2290 1000Fax: +963 11 44 [email protected]
TunisiaQNB TunisiaSubsidiaryRue de la cité des sciencesP.O. Box: 320 – 1080Tunis, TunisiaTel: +216 71 754 911Fax: +216 70 728 533qnb.com.tn
TurkeyQNB FinansbankSubsidiaryEsentepe Mahallesi BuyukdereCaddesi Kristal Kule Binası No: 215, ŞişliIstanbul, TurkeyTel: +222 4524 9651Fax: +222 4524 [email protected]
TogoEcobank Transnational IncorporatedAssociate Company2365 Boulevard du MonoP.O. Box: 3261 Lomé, TogoTel: +228 22 21 72 14Fax: +228 22 21 42 [email protected]
UAECommercial Bank International P.S.C.Associate Company3rd and 13th Floor, Festival Tower,Dubai Festival CityP.O. Box: 4449Dubai, UAETel: +971 4 4023 000Fax: +971 4 4023 737cbiuae.com
* Dormant

166 — QNB Annual Report 2021
The information in this publication ("Information") has been prepared by Qatar National Bank (Q.P.S.C.) (“QNB”) which term includes
no guarantee, representation or warranty of any kind, express or implied, as to the Information’s accuracy, completeness or reliability and shall not be held responsible in any way (including in respect of negligence) for any errors in, or omissions from, the Information. QNB expressly disclaims all
recommendation in respect of any information or products presented in this publication. This publication is provided solely on the basis that the recipient will make an independent evaluation of the Information at the recipient's sole risk and responsibility. It may not be relied upon to make any investment decision. QNB recommends that the recipient obtains investment, legal, tax or accounting advice from independent professional advisors before making any investment decision. Any opinions expressed in this publication are the opinions of the author as at the date of publication. They do not necessarily
representatives or agents do not assume any liability for any loss, injury, damages or expenses that may result from or be related in any way to the
re-posted, reused, sold, transmitted or reproduced in whole or in part without the permission of QNB. The Information has not, to the best of QNB's knowledge, been reviewed by Qatar Central Bank, the Qatar Financial Markets Authority, nor any governmental, quasi-governmental, regulatory or advisory authority either in or outside Qatar and no approval has been either solicited or received by QNB in respect of the Information.