
Highly active Ti02-based photocatalaysts for indoor air ...
240
The university of Nottingham Highly active Ti0 2 -based photocatalaysts for indoor air remediation GEORGE GREEN LIBRARY OF...( SCIENCE AND ENGINEERING Valeria Puddu Thesis submitted to the University of Nottingham for the degree of Doctor of Philosophy August 2008
-
Upload
khangminh22 -
Category
Documents
-
view
0 -
download
0
Transcript of Highly active Ti02-based photocatalaysts for indoor air ...
The university of
Nottingham
Highly active Ti02-based
photocatalaysts for indoor air
remediation
GEORGE GREEN LIBRARY OF...(SCIENCE AND ENGINEERING
Valeria Puddu
Thesis submitted to the University of Nottingham for the
degree of Doctor of Philosophy
August 2008

Abstract
ABSTRACT
Energy saving policies applied to modem buildings and air recirculation
systems promote the build up of high levels of VOCs in indoor air. The
growing concern related to the air quality in indoor environments requires the
replacement of ineffective traditional purification methods, with an efficient
and cost effective technology. Photocatalytic oxidation that utilise Ti02,
represents a promising candidate for this purpose. However, the formulation of
photocatalysts that can efficiently utilise a sustainable energy source (i.e. solar
light), still represents an ambitious target in this field.
In this study, different TiOrbased photocatalysts were synthesised by
modified sol-gel and/or hydrothermal routes. The materials were characterised
by XRD, SEM, N2 sorption (BET and BJH methods), UV-vis Spectroscopy
and XPS. The photocatalytic activity of TiOrbased materials was
systematically investigated at different light intensities, in a gas-phase flat-
plate photoreactor, using trichloroethylene (TCE) as model pollutant, and
compared with that of the commercial product Ti02 Degussa P-25.
This research provides insights into the influence of preparation parameters
on different synthetical pathways for the preparation of highly active Ti02-
based photocatalysts. The general approach to this investigation is based on the
study of the influence of several processing parameters on morphological,
textural and crystallographic properties of the photocatalysts, in order to
correlate the material's features with their photocatalytic properties.
The preparation of a wide range of pristine Ti02 allowed assessing a clear
correlation between phase composition and crystal size and the photocatalytic

Abstract
performance. A series of highly active anatase photocatalysts was prepared.
The best photocatalyst has an optimum crystal size of 28 run and exhibits a
photocatalytic activity that exceeds that ofP-25 by a factor of over 2 times.
A new Ti02IW03 nanocomposites with peculiar crystallographic properties
of the W component was developed by a novel one-step hydrothermal
synthesis. The synthesis conditions were optimised with respect to the
photocatalytic activity.
Overall, the optimisation of the properties that enable an efficient interfacial
charge transfer rate at the catalyst surface was found to be of fundamental
importance for the design ofimproved Ti02-based photocatalysts.
11
PUBLISHED PAPERS
The following papers based on the work reported in this thesis have been
published in refereed journals or international conferences:
• PUDDU, v., MOKAVA, R. and LI PUMA, G., 2007. Novel one step
hydrothermal synthesis of Ti02IW03 nanocomposites with enhanced
photocatalytic activity. Chemical Communications, (45), 4749-4751.
• PUDDU, v., CHOI H., LI PUMA, G. and DYONYSIOU, D. D., 2007.
Gas phase photocatalytic decomposition of trichloroethylene by
immobilized Ti02 film reactor: effect of Ti02 properties and DV light
intensity. In: Ti02-12, 12th International Conference on Ti02
Photocatalysis: Fundamentals & Applications, Niagara Falls, USA, 24-
27 September 2007
• PUDDU, v., MOKAYA, R. and LI PUMA, G., 2007. Mesoporous
Ti02 photocatalysts with improved activity for trichloroethylene
degradation. In: SP-2, Second International Conference on
Semiconductor Photochemistry, Aberdeen, UK, 23-25 July 2007
At the time of writing, the following papers are in preparation:
• PUDDU, v., CHOI H., LI PUMA, G. and DYONYSIOU, D. D., 2008.
Ti02 photocatalysts for indoor air remediation: influence of crystallinity
and DV light intensity on trichloroethylene photodegradation. Applied
Catalysis B: Environmental
• PUDDU, V. & LI PUMA, G. 2008. Novel highly active Ti02IW03
nanocomposites: synthesis optimisation and light intensity studies.
Applied Catalysis B: Environmental
• PUDDU, V. & LI PUMA, G. 2008. Effect of synthesis parameters on
photocatalytic activity of mesoporous Ti02. Applied Catalysis B:
Environmental.
III

ACKNOWLEDGEMENTS
My sincere gratitude goes to my Supervisor, Dr. Gianluca Li Puma, for giving
me the opportunity to carry out this challenging research project and for
motivating me during the course of this PhD.
Many people have contributed to the realization of this work. First of all, I
would like to express my gratitude to Dr. Ignasi Saivado-Estivill that designed
and built the photocatalytic reactor. I would also like to acknowledge the work
of Dr. Hyeok Choy and Jenia Georgieva for preparing some of the samples
tested.
Special thanks to Dave Clift for his help with XRD analysis, Martin Roe for
the SEM imaging analysis, and all the technical stuff in Schee.
I also wish to express my appreciation to Professor Mokaya, for his help in
interpreting the adsorption properties of my samples, and for his contribution to
the published paper from this work.
A special thanks goes to Professor Marc Anderson and Dr. Isabel Tejedor-
Tejedor for their hospitality at the University of Winsconsin, and for their
contribution in making my stay in US an amazing experience.
I would like to acknowledge the Engineering and Physical Sciences Research
Council (EPSRC) for the financial support, and the Business-Engineering and
Science travel Scholarship (BEST).
All my friends in Nottingham deserve a special mention just for their
friendship and support during the last four years: from all my colleagues in
Schee to the Italian/Sardinian community in Nottingham, thank you
everybody!
The last but the most important acknowledgement is for my family: my parents
Raffaele and Ignazia and my lovely sister Claudia. Your love, support and faith
in me are, and will always be, the moving forces for everything I do.
IV
TABLE OF CONTENTS
ABSTRACT , i
PUBLISHED PAPERS .iii
ACKNOWLEDGMENTS iv
TABLE OF CONTENTS v
LIST OF TABLES xi
LIST OF FIGURES xii
Chapter 1- Introduction
1.1. Indoor Air Quality (lAQ) 1
1.2. Advanced Oxidation Technology(AOTs) for Air Remediatio .4
1.3. Photocatalysis for Indoor air remediation 5
1.4. Aims of the project. 6
1.5. Thesis Outline , 7
Chapter 2- Literature Review
2.1. Introduction to Heterogeneous Photocatalysis ~: 9
2.1.1 Semiconductors as photocatalysts 11
2.1.2 Titanium Dioxide (Ti02) 15
2.1.2.1 Crystal structures 15
2.1.3 Mechanism of heterogeneous photocatalysis 18
2.1.4 Titania properties influencing the photocatalytic activity 21
2.1.4.1 Crystalline phase and composition 21
2.1.4.2 Particle size and surface area 23
2.1.4.3 Crystallinity 25
2.1.4.4 Degussa P-25 26
2.2 Ti02 synthesis: Sol-gel method 27
2.2.1 Introduction .- 27
2.2.2 Chemistry of sol-gel process 28
2.2.3 Synthesis Parameters in Sol-gel 31
2.2.3.1 Nature of the Precursor 32
v

2.2.3.2 Concentration of water 33
2.2.4 pH of solution: acid and basic catalysis 34
2.2.5 Advantages and applications of sol-gel.. 35
2.2.6 Hydrothermal process 37
2.2.6.1 Introduction 37
2.2.6.2 Effect ofPrecursor 38
2.2.6.3 Effect of Temperature and holding time 39
2.2.6.4 Effect of reaction media 40
2.2.6.5 Advantages of hydrothermal method 41
2.2.7 Modified Ti02 photocatalysts 42
2.2.7.1 Introduction 42
2.2.7.2 Metal doping 43
2.2.7.3
2.2.7.4
2.2.7.5
2.2.7.6
Anion doping 45
Metal deposition 47
Coupled semiconductors 48
Ti02IW03 nanocomposites 49
2.2.8 Photocatalytic reactors for gas phase 51
2.2.9 Reaction rate and Kinetic studies 55
2.2.10
2.2.10.1
2.2.10.2
2.2.10.3
2.2.10.4
2.2.11
Factors affecting the reaction rate 56
Light intensity 56
Water vapour concentration 57
Temperature 58
Flow rate · · 58
Mechanism of TCE degradation 59
Chapter 3- Analytical Techniques
3.1 Introduction ··..· 62
3.2 X-Ray Diffraction (XRO) 62
3.2.1The Bragg's law 64
3.2.2Scherrer's Equation 65
3.3 N2 adsorption-desorption studies 66
3.3.1Introduction ·..·.. 66
3.3.2Adsorption-desorption isotherms 68
VI
3.3.3Surface area calculation: Langmuir and BET methods 70
3.3.4Pore volume and pore size distribution: BJH model. 72
3.4 Electron Microscopy 73
3.4. IScanning Electron Microscopy (SEM) 74
3.4.2Transmission Electron Microscopy (TEM) 75
3.5 X-Ray Photoelectron Spectroscopy (XPS) 77
Chapter 4- Methodology
4.1 Catalyst preparation 79
4.1.1 Materials and chemicals 79
4.1.2 Pristine Ti02 catalysts 79
4.1.2.1 Amorphous Ti02: synthesis route 1 79
4.1.2.2 Amorphous Ti02: synthesis route 2 80
4.1.2.3
4.1.2.4
Amorphous Ti02: synthesis route 3 80
Thermal treatment 80
4.1.2.5 Hydrothermal treatment 81
4.1.3 N-doped Ti02 81
4.1.3.1 Method 1:N insertion during sol-gel 81
4.1.3.2 Method 2: N insertion on amorphous Ti02 82
4.1.3.3 Method 3: hydrothermal synthesis 82
4.1.4 Ti02IWOJ composites 82
4.1.4.1 Synthesis optimisation 83
4.2 Characterisation 83
4.2.1 X-ray diffraction 83
4.2.2 Absorption analysis 84
4.2.3 Microscopy studies 84
4.2.4 UV-visible Optical absorption properties 85
4.2.5 XPS 85
4.3 Photocatalytic reactor 85
4.3.1 Description of flat-plate photocatalytic reactor 86
4.3.2 Reactor rig set-up 87
4.3.2.1 Original set up 87
vu

4.3.2.2
4.3.2.3
4.3.2.4
4.3.2.5
Photocatalytic experiment protocol.. 89
Problems encountered 90
Improvements made and actual set up description 92
Rig- Cleaning protocol 94
4.3.3 GC analysis 95
4.3.3.1 Calibration 95
4.3.4 Evaluation of incident photon flux on catalyst surface 96
4.3.5 Calculation of reaction rates 97
4.3.6 Catalyst immobilisation 98
Chapter 5- Pristine TiOl
5.1 Introduction 99
5.2 Synthesis of Titania samples 100
5.2.1General synthesis scheme 100
5.2.2Samples prepared 101
5.2.3Visual aspect of products 101
5.3 Photocatalysts characterisation 104
5.3.1Calcined samples (Series TT) 104
5.3.1.1 X-raystudies 104
5.3.1.2
5.3.1.3
Surface area and Porosity studies 106
Morphological studies........... 109
5.3.2Effect of calcination temperature 111
5.3.3Hydrothennal samples (Series HY) 112
5.3.3.1 X-ray studies 112
5.3.3.2
5.3.3.3
Surface area and porosity studies 114
Morphological studies 115
5.3.4Effect of water content 117
5.4 Acid-calcined (Series TTA) and acid-hydrothermal samples (Series
HYA) 1175.4.1X-Ray studies 117
viii
5.4.2Surface area and Porosity studies 119
5.4.3Morphological studies 121
5.4.4Effect of acidic catalysis during sol-gel 124
5.4.5Photocatalytic activity 125
5.4.5.1 Studies on P-25 125
5.4.5.1.1 Effect of light intensity 126
5.4.5.1.2 Effect ofTCE initial concentration 128
5.4.5.1.3 Effect ofRH 129
5.5 Calcined (Series TT) and hydrothermal samples (Series RY) 130
5.6 Acid-calcined (Series TTA) and acid-hydrothermal samples (Series
RYA) 138
5.7 Further investigation on calcined Ti02 142
5.7.1Ti02 samples ·..·.. 142
5.7.2Photocatalytic activity 144
5.8 Summary 148
Chapter 6- Nitrogen doped TiO~6.1 Introduction 150
6.2 Samples prepared 150
6.3 Characterisation 151
6.3.1 X-ray studies · · 151
6.3.2 Porosity properties 153
6.3.3 XPS studies 154
6.3.4 Absorption properties 156
6.4 Photocatalytic activity 157
6.4.1 Photocatalytic activity under visible light 157
6.4.2 Photocatalytic activity under UVA light 158
6.5 Summary 160
Chapter 7- TiO~IWO~systems
7.1 Introduction 161
IX

7.2 Layer structured Ti02IW03 system 162
7.2.1 Preparation and characterisation of supports 162
7.2.2Photocatalytic activity 165
7.3 Ti02IW03 mixed oxides 169
7.3.1A novel Ti02IW03 nanocomposite 170
7.3.20ptimisation of synthesis parameters: Effect of solvent composition 175
7.3.2.1 Material properties 175
7.3.2.2 Photocatalytic activity 178
7.3.3Optimisation of synthesis parameters: Effect of reaction time 180
7.3.3.1 Material properties 180
7.3.3.2 Photocatalytic activity 181
7.3.40ptimisation of synthesis parameters: Effect of (NH4)O.33 W03 loading ..
............................................................................ , 1837.3.4.1 Material properties 183
Photocatalytic activity 1877.3.4.2
7.3.5Studies at different light intensities 191
7.3.6Studies on photocatalyst deactivation 193
7.4 Summary ~ ~ 194
Chapter 8- Conclusions
8.1 Conclusions 196
8.1.1 Studies on pristine Ti02 196
8.1.2 Studies on N-doped Ti02 198
8.1.3 Studies on Ti02IW03 systems 198
8.1.4 Practical implications 199
8.2 Recommendations for future work 200
Bibliography; , 202
x
LIST OF TABLES
Table 2.1. Examples ofVOCs found in indoor air and their source materials ... 2Table 2.1. Bandgap energies Eg of various photocatalysts (Dhananjay S
Bhatkhande, 2002) 13Table 2.2 Some properties oftitania polymorphs 15Table 2.3. Expected product of the sol-gel process depending on the hydrolysis
and condensation rates 32
Table 4.1. GC method ISOTEMPl. 95
Table 5.1. Synthesis conditions and macroscopic appearance of hydrolysis-condensation and crystallisation products 102
Table 5. 2. Crystallographic and structural properties ofTT series Ti02 106Table 5.3. Structural and crystallographic properties of hydrothermal samples
................................................................................................................ 113Table 5.4. Crystallographic and structural properties of series TTA and HYA
................................................................................................................ 119Table 5.5. Effect of light intensity on TCE reaction rate on Ti02 nanoparticles
belonging to series TT and HY. Values of a. and correlation coefficient R................................................. , 133
Table 5. 6. Atomic composition (A) and C peak composition (B) of P-25 andTi02 nanoparticles obtained by calcination as obtained by XPS analysis................................................................................................................. 134
Table 5.7. Effect of light intensity on TCE reaction rate on Ti02 nanoparticlesbelonging to series TTA and HYA: values of a. and correlationcoefficient R 141
Table 5.S. Structural and crystallographic properties of Ti02 nanoparticlesobtained by sol-gel followed by calcination for 1h at temperature between300 and SOOQC. Amorphous sample (not calcined) and P-25 are alsoreported for comparison purpose 143
Table 5.9 Effect of light intensity (5.1-20.8 W/m2) on TCE reaction rate onTi02 nanoparticles calcined at temperature between 300 and SOOQC:values of a. and correlation coefficient R. 145
Table 6. 1. Process conditions for preparation ofN-doped Ti02 149Table 6. 2. Crystallographic and structural properties ofN-doped Ti02 150Table 6.3. Atomic composition % ofN-doped Ti02 catalysts 152,
Table 7.1. Ti02 and W03 loadings on stainless steel supports studied for thephotodegradation of TCE in gas phase under UVA and visible lightirradiation I I I I ••••••••••• I' •••••••••••• I ••••••••••••••••••••••••••••• 164
Table 7.2. Experimental condition for photocatalytic degradation of TCEon Ti02IW03 layered systems 165
Table 7.3. Effect of H20 content on anatase textural properties 176Table 7.4. Textural properties ofTi02 samples with different W03 loading IS3Table 7. 5. Effect of light intensity (5.0-21 W/m2) on TCE reaction rate of
Ti02/(NR.)o.33W03 nanocomposites with different (NH4)O.33W03 loading:values of a. and correlation coefficient R 192
xi
LIST OF FIGURES
Fig. 2.1. Change in the electronic structure with increase of monomeric units.(Adapted from Hoffmann et al., 1995) 12
Fig. 2.2. VB and CB positions of various semiconductors, and reductionpotentials of relevant redox couples (in liquid phase) at pH=O (Mills andHunte, 1997) 14
Fig. 2.3. Polyhedral diagrams of rutile (A) and anatase (B) crystal. From(Chichina et al., 2005) 16
Fig. 2.4. Thermodinamic free energy of rutile and anatase at differenttemperatures (Chichina et al., 2005) 17
Fig. 2.5. Mechanism scheme ofphotocatalysis 18Fig. 2.6. Models of mixed phase Ti02 activity: A) traditional model where
rutile acts as electron sink B) model proposed on the base of EPR results,where electron transfer occurs from rutile to anatase. (Adapted fromHurum et al, 2003) 23
Fig. 2.7. SEM micrograph of Degussa P-25 coated on glass fibre support...... 26Fig. 2.8. Proposed associative mechanism for hydrolysis reaction.
iPr=isopropyl group. (Adapted from Park et al, 2003) 30Fig. 2. 9. Formation of olated olygomers 30Fig. 2.10. Proposed model for hydrothermal conversion of amorphous titania
to anatase. (From Yanagisawa and Ovenstone, 1999) 40Fig. 2.11 Fraction of the solar spectra utilisable for the photoexcitation of Ti02•
(From Linsebigler et al. 1995) 42Fig. 2. 12. Diagram of possible doping effects on red-shift adsorption proposed
by Serpone (Serpone, 2006): (a) Band gap of bare Ti02; (b) doped Ti02with localized dopant levels near the VB and the CB; (c) band gapnarrowing resulting from broadening of the VB; (d) localized dopantlevels and electronic transitions to the CB; and (e) electronic transitionsfrom localized levels near the VB to their corresponding excited states forTi3+ and F+ centers 46
Fig. 2.13. Doping mechanism scheme in heterojunction betweensemiconductors (Chatterjee and Dasgupta, 2005) 48
Fig. 2. 14. Fluidised-bed photoreactors: A) Front and side views of flat-platephotoreactor (Dibble and Raupp, 1992) and B) Annulus fluidisedphotoreactor (Lim and Kim, 2004), used for TCE photooxidation in thegas phase 52
Fig. 2.15. Annular photocatalytic reactors: A) used by Shiraishi (2005) for TCEmineralisation and B) used by Larson (1995) for 2-propanol degradation................................................................................................................... 53
Fig. 2.16. Flat-plate reactor scheme. (From Keshmiri et al, 2006).. 54Fig. 2.17. Honeycomb monolith photocatalytic reactor for indoor air
purification (Raupp et al., 2001) 54Fig. 2.18. Generation of Chlorine radicals 60Fig. 2.19. Mechanism of DCAC and Phosgene formation through Chlorine
attack on TeE 61
Fig. 3.1. Different planes and correspondent interplanar distances di, d2 and d3existing within a crystal. 63
Fig. 3.2. Geometrical derivation of the Braggs' Law 64
xii
Fig. 3.3. IUPAC isotherms classification of gas adsorption-desorptionisotherms (A) and hysteresis loops (B) (Sangwichien et aI., 2002) 68
Fig. 3. 4. Mechanism of capillary condensation (a) low PlPo; (b) high PlPo 72Fig. 3.5. Schematic drawing of a scanning electron microscope with secondary
electrons forming the images on the TV screen (Perkes, 2008) 75Fig. 3.6. TEM's instrument scheme 76Fig. 3.7. Diagram describing the photoelectric effect. 77
Fig. 4.1. Detail of the photocatalytic plate A) UVA lamps; B) coatedphotocatalytic plate 86
Fig. 4.2. Emitting spectrum of UV light source (blacklight blue fluorescentlamps Philips TL 8W/08 F8 T5IBLB) and visible light source (Sylvaniahalophosphor fluorescent lamps F8W/154 Daylight) 87
Fig. 4.3. Original Experimental set-up of photocatalytic reactor rig 88Fig. 4.4. TCE conversions vs. time diagram for a typical photocatalytic
experiment. 90Fig. 4.5. Initial TCE concentration (at steady state) expressed in J.lMand ppmv
as function of injection rate at total air flow rate of 2.4 Umin and 1.2L/min 92
Fig. 4. 6. Initial TCE concentration (at steady state) expressed in J.lMand ppmvas function of air flow rate through Dreshel bottle saturated with TCEvapors in ice bath and at 30°C. Total flow rate: 2.4 Umin 93
Fig. 4.7. Current configuration of experimental rig for evaluation ofphotocataytic oxidation of TCE in the gas phase, after modification ofpollutant injection system 94
Fig. 4.8. Radiometer reading as function of time after switching on 5 lamps at10 cm distance from 365 nm UVA sensor 97
Fig. 5.1. Synthesis scheme employed for preparation of Ti02 photocatalysts ............................................................................... , 100
Fig. 5.2. XRD patterns of and calcined samples calcined at differenttemperatures a) amorphous powder (20°C); b) TTOI (300°C); c) TT02(400°C); d) TT03 (550°C); e) TT04 (600 °C) 105
Fig. 5.3. N2 adsorption-desorption isotherms and pore size distributions of a)TTOl; b) TT02; c) TT03; d) TT04. The nm scale in the pore sizedistribution graphs is logarithmic 107
Fig. 5.4. SEM images of Ti02 nanoparticles at different magnifications: A)TTOI (400°C); B) TT02 (450°C); C) TT03 (550°C); D) TT04 (600°C) ................................................................................................................. 110
Fig. 5.5. TEM images of Ti02 nanoparticles: A) TTOI (400°C); B) TT02(450°C); C) TT03 (550°C); D) TT04 (600°C) 111
Fig. 5.6. Particle size and surface area of calcined samples as function ofcalcination temperature 112
Fig. 5.7. XRD patterns of Ti02 prepared by hydrothermal method at 150 °C/8hfrom ethanol/water reaction media with different XH.O (water molarfractions): a) XH20= 0.59; b) XH20= 0.74; c) XH20= 0.85; d) XHzO= 0.88 .. 113
Fig. 5.8. N2 adsorption desorption isotherms and pore size distributions (insert)of a) HYOI b) HY02 c) HY03 ; d) HY04 114,
xiii

Fig. 5.9. SEM micrographs of HYOI. Images correspond to different spot ofthe sample at different magnifications. Magnification increases from A) toD) II 116
Fig. 5.10. TEM images of Ti02 nanoparticles prepared by hydrothermaltreatment at different water contents, at 150 °C/12 h of amorphous Ti02
obtained without acidic catalysis A) HYOI XH2o=0.59 ; B) HY02XHzo=0.74;C) HY03 XHzo=0.85;D) HY04 XH20=0.88 116
Fig. 5.11. Particle size and surface area of HY titania, as function of H20molar fraction in the hydrothermal reaction media 117
Fig. 5.12. XRD patterns of Ti02 prepared by sol-gel in acidic conditionfollowed by calcination: a) Ac.ac/550 C; b) HCl/550 C; c) Ac.ac/400 C; d)HCl/400 C. A denotes the anatase diffraction peaks 118
Fig. 5.13. XRD patterns of Ti02 prepared by sol-gel at acidic conditions by a)Acetic acid and b) HCI and treated hydrothermically in a mixtureH20/ethanol at 150°C /8h. A and B denote the anatase and brookitediffraction peaks respectively 119
Fig. 5.14. N2 adsorption-desorption isotherms of Ti02 samples prepared in acidconditions by acetic acid (.) and by HCI (.) and calcined at A) 400°Cand B) 550 QC 120
Fig. 5.15. N2 adsorption-desorption isotherms of titania samples prepared inacid conditions by acetic acid (.) and by HCI (.) and treatedhydrothermically in a mixture 1:1 ethanol/water at 150°C for 8h 121
Fig. 5.16. SEM images at low (left) and high (right) magnification of Ti02prepared by sol-gel at acidic conditions followed by calcination: a)TTAOI (CH3COOH-400 GC);b) TTA02 (CH3COOH-550 GC);c) TTA03(HCI-400 GC);d) TTA04 (HCI-550°C) 122
Fig. 5.17. SEM images at low (left) and high (right) magnification of Ti02prepared by sol-gel at acidic conditions by A) HCI (HYAOl) and B)CH3COOH (HYA02) and crystallised by hydrothermal treatment in H20/ethanoll:1 at 150 °C/8h 123
Fig. 5.18. Effect of UVA incident light intensity (343-380 run with maximumirradiation peak at 365 run) on the photo-oxidation rate of 68.5±1.0 ~TCE. (8% RH; flow rate ofO.04 Us) 126
Fig. 5.19. Linearization of reaction rate as function of UVA incident lightintensity (343-380 run with maximum irradiation peak at 365 run) on thephoto-oxidation rate of 68.5±1.0 J.lMTCE. (8% RH; flow rate of 0.04Us). Empty diamonds indicate first order light intensity range and filleddiamonds denote 0.6 order intensity region 127
Fig. 5.20. Effect of inlet TCE concentration on TCE conversion and TCEreaction rate (insert). Experiments were carried out at 8% RH, UVAincident light intensity (343-380 run with maximum irradiation peak at365 run) 1=10 W/m2 •.••.••••...•••....••••••..•••.•••••.•••.•••••.••.•••••.•.•..••..•••••.••••....• 128
Fig. 5.21. Effect of Relative humidity on 34.5±1.0 J.lMTCE conversion on P-25. UVA incident light intensity (343-380 run with maximum irradiationpeak at 365 run) 1=24.36W/m2
•••••••••••••••••••••••••••••••••••••••••••••••••••••••••••••• 130Fig. 5.22. TCE degradation rates of Ti02 photocatalyst: comparison between P-
25 and Ti02 prepared by sol-gel without acid, followed by calcination (TTsamples) or hydrothermal treatment (HY sampes). Initial TCE
XIV

concentration was 35±2 J-lM(870±30 ppmv), 8% RH. Reaction rates areper unity surface area of irradiated support 132
Fig. 5.23. A: representative XPS survey spectra of Ti02 nanoparticles obtainedby calcination. B: detail ofC 1s signal.. 134
Fig. 5.24. TCE degradation rates of Ti02 photocatalyst as function of crystalsize (A) and surface area (B). Empty diamonds denote TT and HY Ti02nanoparticles, and square denotes Degussa P-25. Reaction rates are perunity surface area of irradiated support (RH=8%, light 1=11.2 W/m2) .. 136
Fig. 5.25. Effect of acidic catalysis during hydrolysis-condensation on thephotocatalytic activity of catalysts calcined at 400°C and 550 °C. InitialTCE concentration was 33±1 J-lM(810±15 ppmv), 8% RH, flowrate: 0.04Us. Reaction rates are per unity surface area of irradiated support ...... 139
Fig. 5.26. TCE degradation rates of Ti02 catalyst: comparison between P-25and catalysts prepared. by sol-gel without acid followed by hydrothermaltreatment in mixture H20lEtOH with XH20=0.59 at 150 °C/8 hours. InitialTCE concentration was 29±1 J.!M (716±10 ppmv), 8% RH. Reaction ratesare per unity surface area of irradiated support 140
Fig. 5.27. TCE degradation rates of Ti02 catalyst: comparison between P-2Sand catalysts prepared by sol-gel followed by 1 h calcination attemperature between 300 and 800°C. Initial TCE concentration was 25±3J-lM(610±42 ppmv), 8% RH. Reaction rates are per unity surface area ofirradiated support 145
Fig. 5.28. TCE degradation rates of Ti02 as function of mean crystal size.Diamonds denote catalyst prepared by calcination between 300 and 800°C and square denotes Degussa P-25. Initial TCE concentration was 25±3J.!M (61O±42 ppmv), 8% RH. Reaction rates are per unity surface area ofirradiated support 146
Fig. 6. 1. XRD patterns ofN-doped Ti02 samples a) N-TiOl; b) N-Ti02 c) N-Ti03; d) N-Ti04; e) N-Ti05. A= anatase 150
Fig. 6. 2. N2 adsorption desorption isotherms ofN-doped Ti02 152Fig. 6. 3. Survey XPS spectrum of sample N-Ti05 153Fig. 6. 4. N Is XPS peak. Showing the shoulder attributed to N-Ti bond 153Fig. 6. 5. Optical absorption spectra of: a) Degussa P-25, b) N-TiOl, c) N-Ti02,
d) N-Ti03, e) N-Ti04, f) N-Ti05 154Fig. 6. 6. TCE degradation rates of N-doped Ti02 photocatalyst under UV A
irradiation at different light intensities, compared with Degussa P-25.Initial TCE concentration was 26±1 J-lM, 8% RH, Flowrate: 0.04 Us.Reaction rates are per unit surface area of irradiated support 157
Fig. 7. 1. SEM micrographs of (a) and (b): plain W03 coating (loading: 1.2mg/crrr'); (c) and (d): bi-Iayer Ti02IW03 coatings, (loading 0.36 and 1.12mg/cm2 respectively) on SS 304 substrates (From Georgieva et ai, 2007) ................................................................................................................. 163
Fig. 7. 2. A) Scheme of Taka's photocatalytic system, with striped Ti02 isdeposited on W03, showing the electron transfer from Ti02 to W03 uponillumination. B) SEM image of bilayered system under study in this work,which show similarity with Taka's system 168
xv

Fig. 7.3. Flow charts showing traditional two steps reaction scheme forTi021W03 nanocomposites preparation (A), and one-step reaction schemedeveloped in this study (B) 169
Fig. 7.4. XPS spectra of Ti021W03 10% wt W03. Top: survey spectrum.Bottom: 0, Ti and W peaks 171
Fig. 7. 5. XRD pattern of a) Ti02 anatase; b) mixed oxide 10% wt W03; c)(NlI4)O.33W03 ·.· 172
Fig. 7. 6. Top view of tunneling structure of MxW03 bronze (Fouad et al.,2000) 173
Fig. 7. 7. XRD pattern of Ti02/(NlI4)o.33W03 40% wt (NH4)O.33W03content a)before and b)after calcination at 600 °C for 8 hours 174
Fig. 7. 8. N2 adsorption desorption isotherms of pure Ti and W oxides and ofaTi02/(NH4)o.33 W03 nanocomposite with 10% wt <NH4)O.33W03 175
Fig. 7. 9. Diffraction patterns of 10% wt Ti02/(NH4)o.33W03 compositesprepared with different H20-ethanol ratios during solvothermal process.(O=Ti02; ~=(NH4)O.33W03) 176
Fig. 7. 10. N2 adsorption-desorption isotherms of Ti02/<NH4)o.33W03 mixedoxides with 10% wt (NH4)O.33W03 prepared with different H20 % duringsolvothermal process 178
Fig. 7. 11. Reaction rate of mixed oxide 10% wt (NH4)O.33W03 loadingprepared with different ethanol-water ratios during solvothermal process.Reaction rates are per unit surface area of irradiated coated supports ... 179
Fig. 7.12. X-Ray diffraction pattern of TiIW mixed oxide with 10% wt<NH4)O.33W03 content, prepared in 1:1 mixture H20:Ethanol at 150 °C atdifferent reaction times (O=Ti02; C:.=(NH4)O.33W03) 180
Fig. 7. 13. N2 adsorption-desorption isotherms of mixed oxide with 10% wt(NH4)O.33W03 obtained at different hydrothermal holding time 181
Fig. 7. 14. Reaction rate of mixed oxide 10% wt (NH4)O.33W03 loadingprepared with 1:1 ethanol-water ratio during solvothermal process atdifferent holding times. Reaction rates are per unit surface area ofirradiated coated supports 182
Fig. 7.15. XRD patterns of Ti02/<NH4)o.33 W03 composite with different(NH4)o.33W03Ioading (o=Ti02; C:.=<NH4)0.33W03)' 184
Fig. 7.16. N2 adsorption-desorption isotherms of mixed oxide with different(NH4)O.33W03 loadings 185
Fig. 7. 17. SEM micrographs of pure Ti02 (A); pure <NH4)O.33W03(B); mixedoxides with 1% (C); 5% (D); 10% (E) 20% (F) 40% (G) (NH4)0.33W03content .. t ••••••••••••••••••••••••••••••••••••••••••• t •••••••••••••••••••••••••••••••••••••••••••• t .t •..... 186
Fig.7. 18. Reaction rate of mixed oxide with different <NH4)O.33W03 loadingsprepared with 1:1 ethanol-water ratio for 12 hours. Initial TCEconcentration was 24.8 ± 2 J.I.M, 8% RH, flowrate: 0.04 Us. Reactionrates are per unity surface area of irradiated support 188
Fig. 7. 19. Reaction rate of mixed oxides at different light intensities. InitialTCE concentration was 24.8 ± 2 J.lM, 8% RH, flowrate: 0.04 Us.Reaction rates are per unity surface area of irradiated support 192
Fig. 7. 20. TCE conversion for 5% wt (NH4)O.33W03 over time; [TCE]i = 29umol; 1= 5.12 W/m2 •.............................................................................. 194
xvi

Chapter 1
Introduction
Chapter 1 Introduction
1.1. Indoor Air Quality (IAQ)
In the past few decades Indoor Air Quality (IAQ) has increased scientific
and public interest in developed countries as a consequence of the growing
incidence rate of respiratory diseases such as asthma, allergies, building related
illness (BR!) and the so-called sick building syndrome (SBS). In the UK, the'
IAQ matter was officially acknowledged in 1991when the House of Commons
Select Committee published the Sixth Report on 'Indoor Pollution' containing
the recommendation to "develop guidelines and code of practice for indoor air
quality in buildings, which specifically identify exposure limits for an extended
list of pollutants ... ". In 2004 the Committee of Medical Effects of Air
Pollutant (COMEAP, 2004) set guidelines for most common indoor pollutants
in home indoor environments. COMEAP guidelines provide some advice on
how to minimise the production of indoor air pollution. They are aimed at
individuals concerned about indoor air quality, and also at material
manufactures, architects and engineers that are involved in building design.
Principal sources of indoor pollution are: tobacco smoke, combustion
products from heating systems, particulates such as dust, microorganisms,
moulds and Volatile Organic Compounds (VOCs). Infiltration of polluted air
from outdoors can also be a pollution source, but the most characteristic
components of indoor pollution are VOCs (Yu et al, 2008).
VOCs are a wide and heterogeneous class of organic chemicals including
alcohols, aldehydes, aromatic compounds and halogenated compounds, that
have in common a high vapour pressure, thus evaporate at ambient temperature
and pressure conditions (Doucet et ai, 2006). They are largely used in the
1

Chapter 1 Introduction
manufacturing process of furniture, carpet, building material and house
holdings, and are slowly released from these sources to the surrounding
environment (IEH, 2001). The use of cleaning products, deodorants and some
human activities or hobbies contribute to increase the VOCs contamination
loading in indoors. Moreover, energy saving policies applied to modem air
recirculation systems reduce the ventilation rate and promotes the build up of
high levels of indoor pollution (Yu et ai, 2008) .
Usually, in indoor environments, VOCs concentrations are in the ppb or ppm
range, however, during or after activities such as wall painting or paint
stripping VOCs levels can reach levels up to 1000 times higher than outside
(EPA, 2002).
Table 1.1 Examples of VOCs found in indoor air and their source materials.
Compound Source material(s)Fonnaldehyde Pressed wood and insulation products, adhesivesp-dichlorobenzeneStyreneBenzeneTetrachloroethylene,trichloroethaneAromatic hydrocarbons(Le. toluene, xylenes)PAHsAlcohols
Moth crystals, room deodorantsInsulation, textiles, disinfectants, plastics, paintssmokingDry cleaned clothes, aerosol sprays, fabricprotectorsPaints, adhesive, gasoline
KetonesEthersEsters
Combustion productsAerosols, window-cleaners, paints, cosmeticsand adhesivesVarnishes, polish remover, adhesivesResins, paints, dyes, soaps, cosmeticsPlastics, resins, plasticisers, flavours, perfumes
Some VOCs like benzene and formaldehyde have been classified as
carcinogenic and their short and long term harmful effects on human health
have been extensively demonstrated. The risk associated with pollution
exposure is not just a function of pollutant concentration but also a function of
2

Chapter 1 Introduction
exposure length. Thus, considering that people spend most of their time in
indoors, it is reasonable to assume that exposure to even extremely low
concentrations ofVOCs may have adverse effects on human health in the short
or long term (EPA, 2002).
Three strategies are generally recommended to improve IAQ (EPA, 2002):
Source control
Ventilation improvement
Air cleaners
Source control and ventilation improvements represent the most effective
strategies to prevent the build up of dangerous pollution levels (Guo et al,
2003). However, not much can be done to reduce the ordinary emission from
house holdings and fittings normally installed in houses and buildings. Thus,
the use of air cleaners as supporting remediation solution is highly
recommended in those environments where natural ventilation is not possible
(Kim et al., 2008).
The air cleaning systems available in the market are usually designed to
remove particles by mechanical filtration, and to adsorb gaseous contaminants
on solid adsorbents like activated carbon or specifically developed
chemisorbents able to remove specific compounds or class of compounds
(Metts and Batterman, 2006). However, information available on the
effectiveness of these adsorption devices for removal of gaseous contaminants
at indoor concentrations are limited (Yu et al, 2008). Moreover, the adsorption
technology employed in commercial devices for indoor air purification does
not represent a definitive solution to the issue. In fact, the pollutants are only
3
Chapter 1 Introduction
transferred from the air to the absorbent, which thus requires further treatment
before disposal (EPA, 2002).
1.2. Advanced Oxidation technology (AOTs) for Air
Remediation
Since classic remediation technologies based on filtration and adsorption are
proving to be insufficient to achieve adequate air cleaning, the development of
an effective and environmentally friendly solution must be accomplished.
Advanced Oxidation Technologies (AOTs) are one of the main remediation
technologies for water purification, and have been considered also for
application in air treatment. AOTs involve the in situ production of free
radicals, mainly hydroxyl and peroxyl, which are characterised by strong
oxidative power. These radicals can initiate radical chain reactions on organic
substrates, leading to the complete mineralisation of organic compounds to
C02 and H20. AOTs usually can achieve a higher degree of mineralization
compared with traditional chemical oxidation (Le. peroxidation) and are
effective also for refractant chemicals (Dhananjay S Bhatkhande, 2002).
Among AOTs, ozonation has found some commercial application in air
cleaning devices (EPA, 2008). Ozonation is based on a photolytic oxidation
process, where radicals are produced by a reaction between high-energy
photons and ozone, and have been widely used for purification of wastewater
(Gogate and Pandit, 2004). However, the recognised irritant properties of
ozone at high concentration increase the safety concerns regarding devices that
employ this system. Moreover, scientific evidences show that ozone has little
4

Chapter 1 Introduction
potential to remove indoor air contaminants at concentrations that do not
exceed public health standards (EPA, 2008).
1.3. Photocatalysis for indoor air remediation
Photocatalysis represents a cheaper and safer alternative to ozonation and its
potential as a remediation technology for polluted air is well established. As
will be extensively reported in the Literature review of this thesis, titania based
materials show the best performance at laboratory scale for VOCs remediation.
Much of the work available in literature focuses on the study of the reaction
mechanism through identification of reaction intermediates as well as
development and validation of kinetic models. However, to allow extensive
commercialisation and utilisation of photocatalysis at industrial scale, the
efficiency of the systems must be optimised and made economically feasible.
From an engineering point of view, the reactor design optimisation is a
crucial point. Different reactor configurations with different scale levels have
been investigated and in many cases mathematical models have been applied to
predict and control the photocatalytic efficiency. However, for practical
applications the optimisation of the photocatalytic material employed in the
photocatalytic process is also very important. Indeed, the development of
improved photocatalysts represents a dynamic and challenging aspect of
research in the field of applied photocatalysis.
The main drawback of Ti02 as photocatalyst is the continuous requirement
of DV light that activates the catalyst, thus starting the photocatalytic reaction.
This requirement increases the overall cost of a photocatalytic process. An
ideal photocatalyst would be activated by solar illumination, therefore be able
5
Chapter 1 Introduction
to work under this natural and renewable form of energy. Another disadvantage
of titania is its fast electron-hole recombination rate that reduces the
photocatalytic activity. In order to optimise the material's photocatalytic
properties, two approaches can be used:
1) The extension of absorption spectrum of the catalyst into the visible
range usually by means of doping
2) The development of catalyst with improved efficiency under UV light
Both effects can be obtained by modifying the structural and electronic
characteristics of the materials employed as will be extensively described in
this thesis.
1.4. Aims of the Project
Principal aim of this research project is the production, comparison and
optimisation of titania based photocatalysts with improved activity for
photooxidation in the gas phase of volatile organic compounds under UV
and/or visible radiation. Trichloroethylene (TCE) was chosen as probe
pollutant.
To achieve the above aims the following objectives have been investigated:
To develop Ti02-based nanomaterials, using sol-gel, modified sol-gel
and hydrothermal methods.
To characterise the physical and morphological properties of
synthesised photocatalyst.
To study the effect of various synthesis parameters on crystallographic
and structural properties of the catalysts.
6

Chapter 1 Introduction
To investigate the photocatalytic properties of synthesised Ti02 in a gas
phase flat plate photoreactor using TCE as model pollutant.
To compare synthesised Ti02-based photocatalyst with photocatalytic
activity of commercial Ti02 Degussa P-25.
To study the correlation between structural and crystallographic
properties of the photocatalysts and their photocatalytic activity.
1.5. Thesis Outline
The present thesis is composed of eight chapters.
Chapter 1- Introduction.
Chapter 2- Literature Review - an overview of several topics that have been
studied to carry out this research project is reported. The general principles of
photocatalysis as AOP and the characteristics and properties of Ti02 as
photocatalyst are reported. Principles of Sol-gel chemistry and hydrothermal
synthesis for synthesis of nanomaterials are introduced along with Ti02
modification by doping and coupling effects with other semiconductors are
discussed and relevant literature outcomes presented. Also an overview of
photocatalytic reactors employed gas-phase photocatalysis is outlined.
Chapter 3- Analytical techniques- deals with a brief description of theory
and application of the major analytical techniques adopted during this work.
Chapter 4- Methodology - A detailed description of photocatalysts
synthesis and characterisation procedures are presented. Also, the
specifications and the optimisation of the gas-phase photocatalytic reactor
7
Chapter] Introduction
used, as well as experimental conditions employed during evaluation of the
catalysts are reported.
In Chapters 5, 6 and 7 report the experimental evidences and the discussion
of the results for three different sets ofTi02 samples.
Chapter 5- Pristine Ti02- the preparation, characterisation and
photocatalytic activity of pristine Ti02 nanoparticles obtained by modified sol-
gel methods are reported. The impact of different hydrolysis-condensation
conditions and crystallisation processes on material properties and
photocatalytic activity have been evaluated and discussed.
Chapter 6- Nitrogen doped Ti02 - reports the work carried out in the attempt
to develop doped Ti02 active under visible light.
Chapter 7- Ti02IW03 systems- describes the studies on Ti02IW03
photocatalysts. The first part concerns studies carried out on a Ti02IW03
layered system. The second part describes the development and optimisation of
hydrothermal synthesis for novel Ti02IW03 nanocomposites with high
activity.
Chapter 8 - Conclusions and recommendations- presents a summary of the
research outcomes and provides recommendations for future work on the topic.
8

Chapter 2
Literature review

Chapter2 Literature review
2.1 Introduction to Heterogeneous Photocatalysis
Photocatalysis is defined as "a change in the rate of chemical reactions, or
their generation, under the action of light in the presence of substances -
photocatalysts that absorb light quanta and are involved in chemical
transformations of the reaction participants" (!UPAC, 2007). This definition by
!UPAC combines photochemistry and catalysis and it can apply to any
chemical reaction where light and a catalyst are necessary to achieve or to
accelerate a chemical transformation as described by Eq. 2.1. (Parmon et al.,
2002). Like classic catalysis, the catalyst is regenerated in its original chemical
state, at the end of the catalytic cycle.
A + hv+ Cat ~ B + Cat (Eq.2.1)
Photocatalytic processes can be classified as homogeneous or
heterogeneous. Homogeneous processes are carried out in single-phase system
(liquid) and the catalyst is a photon absorbing species, such as a transition
metal complex (Ciesla et al., 2004, Hennig, 1999), an organic dye (Arques et
al., 2007) or an iron salt solution (Andreozzi et al., 2006). In homogeneous
photocatalysis the reaction is accelerated through an excited state of the
catalyst, which is generated as a result of radiation absorption.
Heterogeneous processes occur in binary phase system (solid-liquid or
solid-gas) where a semiconductor is usually used as the photocatalyst. In this
case, the absorption of light leads to the formation of active sites on the
photocatalyst surface i.e. electron-hole pairs, that interact with the substrate
absorbed on its surface (Parmon et al., 2002).
9

Chapter2 Literature review
Since the discovery of water photoelectrolysis on a Ti02 electrode made by
Fujishima and Honda (Fujishima and Honda, 1972), heterogeneous
photocatalysis has been the object of intensive study. Research on
semiconductors as photocatalysts has initially focused on energy conversion
and photovoltaic applications (Fujishima et al., 1975). However, it has shifted
into environmental application for water treatment and air remediation (Akira
Fujishima, 2000).
It has been largely established that the most common water and air
pollutants can be oxidised through the breakdown of C-C bonds by
photocatalytic oxidation, often achieving complete mineralisation to H20 and
C02. Compared with traditional oxidation methods, photocatalysis is more
active towards degradation of refractive compounds such as pesticides and
oestrogens (Gora et al., 2006).
The photocatalytic process is a red-ox process; thus a reduction reaction
always accompanies the oxidation reaction. The photoreduction process has
been studied for the removal of heavy metal ions such as Cr(VI), Hg(II), Ag(I),
Pb(II), Pd(III) (Litter, 1999). Indeed, one of the advantages of photocatalytic
treatment in wastewater treatment is the possibility to treat at the same time
organic and inorganic pollutants (Park et al., 2006, Schrank et al., 2002).
The use of suspended catalyst particles in slurry systems is very common, as
it allows the maximisation of catalyst surface that is exposed to light
irradiation. However, slurries require the separation and recycling of the
photocatalyst at the end of the process. The immobilisation of the photocatalyst
as thin or thick films on suitable supports like glass, stainless steel or other
10

Chapter2 Literature review
metals, solves the problem of catalyst separation and make it possible the
application of photocatalytic technologies also for air cleaning.
With a primary focus on Ti02 as photocatalyst, heterogeneous
photocatalysis has been applied in a wide range of environmental issues. As a
result of the intense work on fundamental and applied studies on heterogeneous
photocatalysis, a range of reviews have been published over the years (Akira
Fujishima, 2000, Hoffmann et al., 1995, Linsebigler et al., 1995, Dhananjay S
Bhatkhande, 2002, Chatterjee and Dasgupta, 2005, Zhao and Yang, 2003,
Malato et al., 2002, Mills and Hunte, 1997).
In the following sections the principles and applications of heterogeneous
photocatalysis with particular attention on gas phase systems are reviewed.
2.1.1 Semiconductors as photocatalysts
Photocatalysts used in heterogeneous photocatalysis are usually solid
semiconductors due to a combination of properties among which their peculiar
electronic structure, light absorption properties and excited state lifetimes.
It is well known that interaction between matter and photons of suitable
energy leads to promotion of electrons from the ground state to an excited
state. The energy of the photon that can be absorbed depends on the energy
difference between ground and excited states. In a single molecule, the ground
state and the excited state are respectively the HOMO (Highest Occupied
Molecular Orbital) and the LUMO (Lowest Unoccupied Molecular Orbital).
The band theory model derives from the extension of molecular orbital theory
to a large number of monomeric units Le. atoms and is generally used to
11
Chapter 2 Literature review
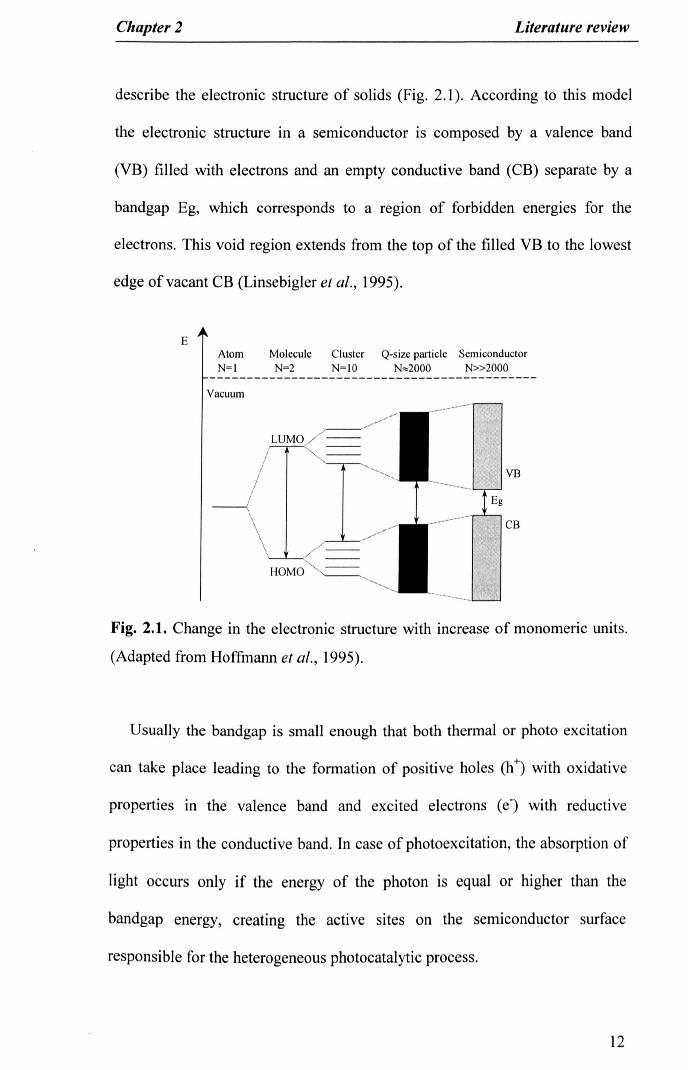
describe the electronic structure of solids (Fig. 2.1). According to this model
the electronic structure in a semiconductor is composed by a valence band
(VB) filled with electrons and an empty conductive band (CB) separate by a
bandgap Eg, which corresponds to a region of forbidden energies for the
electrons. This void region extends from the top of the filled VB to the lowest
edge of vacant CB (Linsebigler et al., 1995).
EAtom Molecule Cluster Q-size particle SemiconductorN=l N=2 N=IO N",2000 N»2000
Vacuum
LUMO ..···
HOMO
Fig. 2.1. Change in the electronic structure with increase of monomeric units.
(Adapted from Hoffmann et al., 1995).
Usually the bandgap is small enough that both thermal or photo excitation
can take place leading to the formation of positive holes (h+) with oxidative
properties in the valence band and excited electrons (e") with reductive
properties in the conductive band. In case of photoexcitation, the absorption of
light occurs only if the energy of the photon is equal or higher than the
bandgap energy, creating the active sites on the semiconductor surface
responsible for the heterogeneous photocatalytic process.
12
Chapter2 Literature review
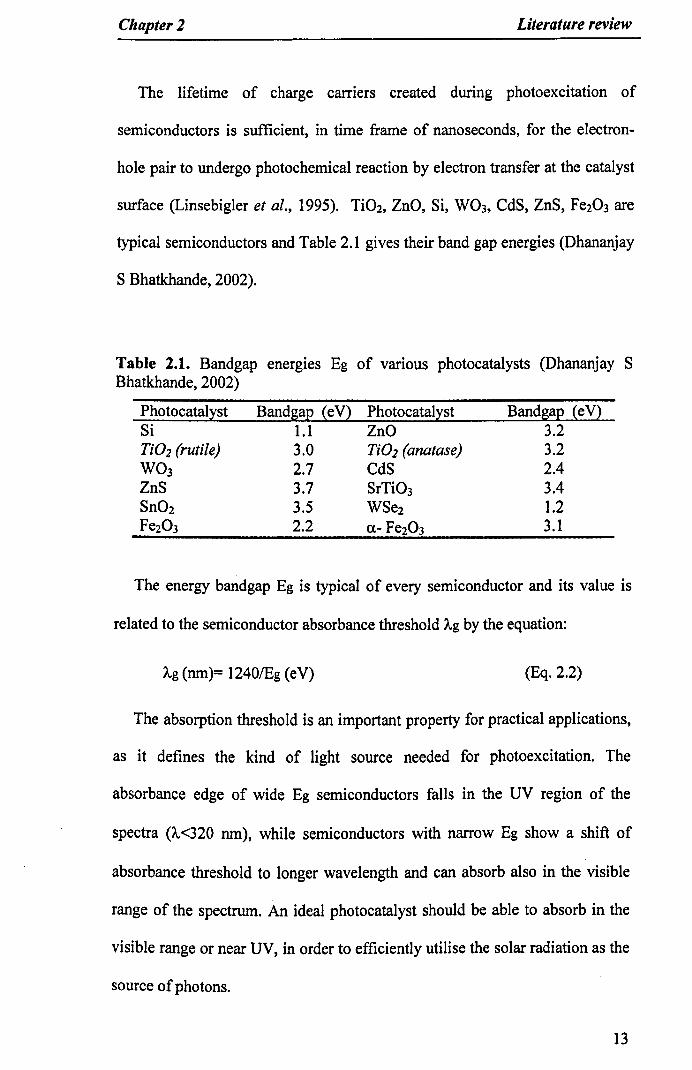
The lifetime of charge carriers created during photoexcitation of
semiconductors is sufficient, in time frame of nanoseconds, for the electron-
hole pair to undergo photochemical reaction by electron transfer at the catalyst
surface (Linsebigler et al., 1995). Ti02, ZnO, Si, W03, CdS, ZnS, Fe203 are
typical semiconductors and Table 2.1 gives their band gap energies (Dhananjay
S Bhatkhande, 2002).
Table 2.1. Bandgap energies Eg of various photocatalysts (Dhananjay SBhatkhande, 2002)
Photocatalyst Bandgap (eV) Photocatalyst Bandgap (eV)SiTiO] (rutile)W03ZnSSn02Fe203
1.13.02.73.73.52.2
ZnOTiO] (anatase)CdSSrTi03WSe20.- Fe203
3.23.22.43.41.23.1
The energy bandgap Eg is typical of every semiconductor and its value is
related to the semiconductor absorbance threshold A.gby the equation:
A.g(nm)= 1240lEg (eV) (Eq.2.2)
The absorption threshold is an important property for practical applications,
as it defines the kind of light source needed for photoexcitation. The
absorbance edge of wide Eg semiconductors falls in the UV region of the
spectra (1..<320 nm), while semiconductors with narrow Eg show a shift of
absorbance threshold to longer wavelength and can absorb also in the visible
range of the spectrum. An ideal photocatalyst should be able to absorb in the
visible range or near UV, in order to efficiently utilise the solar radiation as the
source of photons.
13

Chapter 2 Literature review
The potential of the conductive or valence bands are another important
factor for the applicability of a semiconductor in photocatalysis.
In fact, the photo-reduction can occur only if the CB of the semiconductor is
more negative than the reduction potential of the oxidant species. Conversely,
the photo-oxidation can only occur if the potential of the valence band of the
semiconductor is more positive than the oxidation potential of the reductant
species.
-J
-0"':0-tltl"lOlr
2
TTl-···T··..··TTIII'.m I-t.~-''''-.,...1. ....,
o
1
Fig. 2.2. VB and CB positions of various semiconductors, and reduction
potentials of relevant redox couples (in liquid phase) at pH=O (Mills and
Hunte, 1997).
These two conditions must be realized at the same time to finalize the
photocatalytic process. As shown in Fig 2.2, among various semiconductors
the titanium oxide based semiconductors (anatase, rutile and SrTi03) and CdS
satisfy this requirement.
Among various semiconductors, Ti02 has been proven to be highly active
toward a wide range of organic compounds; therefore it is the most commonly
used. Ti02 is a very stable, biologically and chemically inert, non-toxic,
photostable, inexpensive and commercially available semiconductor. The main
14
Chapter 2 Literature review
drawback of Ti02 is its wide bandgap that limits its application under sunlight.
Ti02 bandgap is Eg=3.0 and 3.2 eV for rutile and anatase respectively, requires
UV light for photoexcitation, which represent only around 5% of the solar
spectrum (Mills and Hunte, 1997). Other catalysts with narrower bandgap,
such as WO), can absorb larger portion of the solar radiation, however, WO)
shows lower photocatalytic activity than Ti02. ZnO and CdS do not show long
term stability in aqueous media, while metal sulfide semiconductors (ZnS or
CdS) and iron oxides are subject to photocorrosion during the photocatalytic
process.
2.1.2 Titanium Dioxide(Ti02)
2.1.2.1 Crystal structures
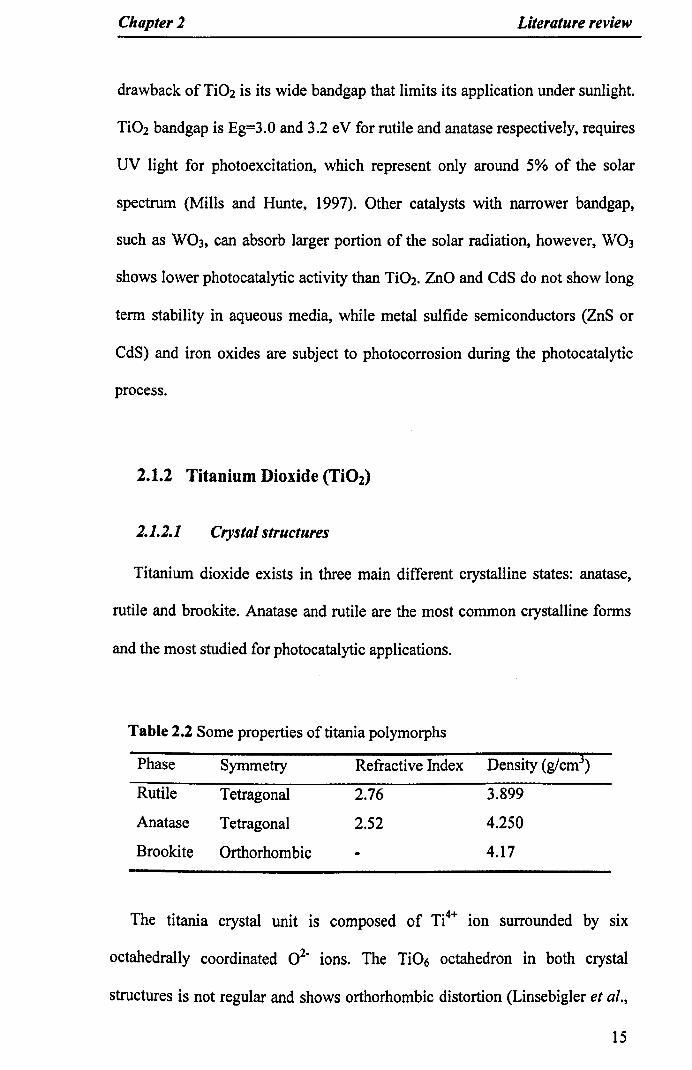
Titanium dioxide exists in three main different crystalline states: anatase,
rutile and brookite. Anatase and rutile are the most common crystalline forms
and the most studied for photocatalytic applications.
Table 2.2 Some properties of titania polymorphs
Phase Symmetry Refractive Index
Rutile Tetragonal 2.76
Anatase Tetragonal 2.52
Brookite Orthorhombic
3.899
4.250
4.17
The titania crystal unit is composed of Ti4+ ion surrounded by six
octahedrally coordinated 02- ions. The Ti06 octahedron in both crystal
structures is not regular and shows orthorhombic distortion (Linsebigler et al.,
15

Chapter 2 Literature review
1995). The different crystal structures arise from different arrangements of the
octahedral Ti06 units. As shown in Fig 2.3, chains of edge-sharing octahedral
form the rutile crystal, while in anatase the octahedron chains share four
corners (Chichina et al., 2005). Due to different spatial arrangement of
octahedral chains, the rutile structure is more densely packed than anatase. This
fact reflects in the mass densities of the materials: 3.899 g/crrr' for anatase and
4.250 g/crrr' for rutile (Navrotsky, A. and OJ. Kleppa, 1967) .
.... ,j
Fig. 2.3. Polyhedral diagrams of rutile (A) and anatase (B) crystal. From
(Chichina et al., 2005).
Noticeable property of titania, especially in rutile crystals, is its very high
refractive index (Table 2.2). For this reason, titanium dioxide in powder form
is widely used as white pigment for providing whiteness and opacity to a
variety of materials: e.g. paints and coatings, plastics, paper, inks and
cosmetics.
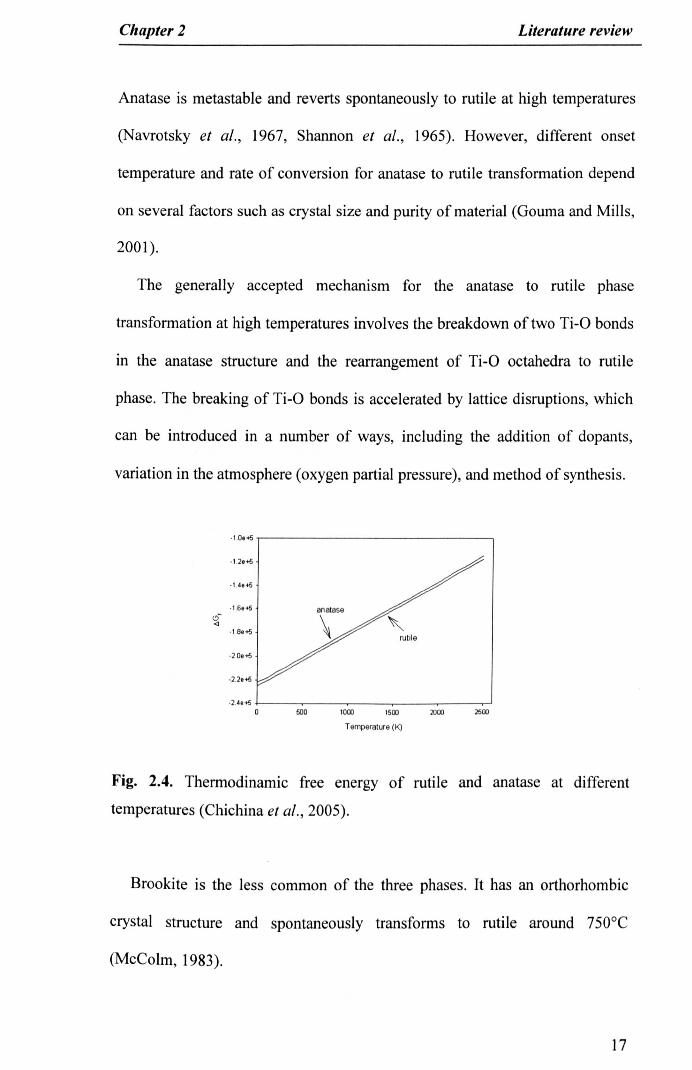
Rutile is the thermodynamically stable form of titania. This is shown by
thermochemical data shown in Figure 2.4: the free energy of rutile formation
~Gf is always lower than the free energy of anatase formation, making rutile
the most stable structure at all examined temperatures (Chichina et al., 2005).
16
Chapter 2 Literature review
Anatase is metastable and reverts spontaneously to rutile at high temperatures
(Navrotsky et al., 1967, Shannon et al., 1965). However, different onset
temperature and rate of conversion for anatase to rutile transformation depend
on several factors such as crystal size and purity of material (Gouma and Mills,
2001).
The generally accepted mechanism for the anatase to rutile phase
transformation at high temperatures involves the breakdown of two Ti-O bonds
in the anatase structure and the rearrangement of Ti-O octahedra to rutile
phase. The breaking of Ti-O bonds is accelerated by lattice disruptions, which
can be introduced in a number of ways, including the addition of dopants,
variation in the atmosphere (oxygen partial pressure), and method of synthesis.
·1.0.+5
·1.2.+5
·1.4.+5
-1.68+5cS<1
·1.8.+5
·2.0.+5
·2.2.+5
·2.4.+50 500 1000 1500 2000 2500
Temperature (K)
Fig. 2.4. Thermodinamic free energy of rutile and anatase at different
temperatures (Chichina et al., 2005).
Brookite is the less common of the three phases. It has an orthorhombic
crystal structure and spontaneously transforms to rutile around 750°C
(McColm, 1983).
17
Chapter 2 Literature review
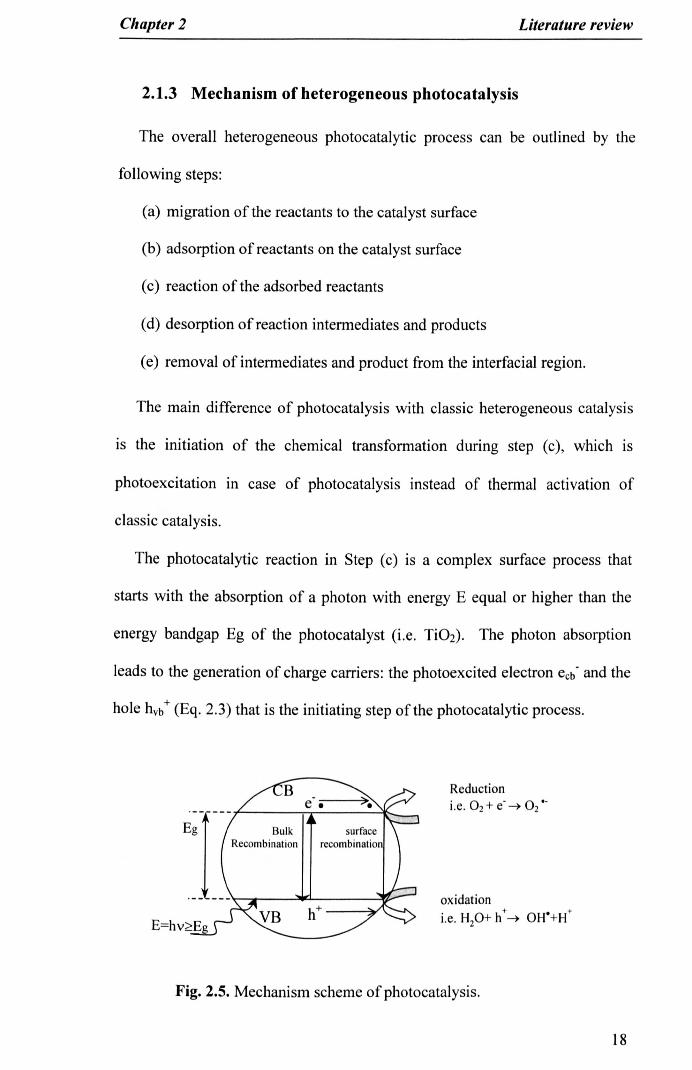
2.1.3 Mechanism of heterogeneous photocatalysis
The overall heterogeneous photocatalytic process can be outlined by the
following steps:
(a) migration of the reactants to the catalyst surface
(b) adsorption of reactants on the catalyst surface
(c) reaction of the adsorbed reactants
(d) desorption of reaction intermediates and products
(e) removal of intermediates and product from the interfacial region.
The main difference of photocatalysis with classic heterogeneous catalysis
IS the initiation of the chemical transformation during step (c), which is
photoexcitation III case of photocatalysis instead of thermal activation of
classic catalysis.
The photocatalytic reaction in Step (c) is a complex surface process that
starts with the absorption of a photon with energy E equal or higher than the
energy bandgap Eg of the photocatalyst (i.e. Ti02). The photon absorption
leads to the generation of charge carriers: the photo excited electron ecbo and the
hole hVb+(Eq. 2.3) that is the initiating step of the photocatalytic process.
Reductioni.e. O2 + e' ~ O2 ,.
oxidationi.e. Hp+ h+~ OH'+H+
Fig, 2.5. Mechanism scheme of photocatalysis.
18

Chapter2 Literature review
charge carrier generation (Eq.2.3)
The electron-hole pair can follow different de-excitation pathways
(Linsebigler et al., 1995). Charge carriers can undergo bulk recombination,
with release of heat in the crystal lattice (Eq 2.4). A fraction of charge carriers
migrate at the catalyst surface to get trapped by absorbed species (Eq 2.5a, 2.5b
and 2.5c). Typical trapping sites in Ti02 are adsorbed H20, chemisorbed OH
groups or surface titanol groups Ti-OH on the catalyst surface (Hoffmann et
al.,1995).
hVb++ ecb4- heat bulk recombination
hVb++Ti1vOH4- Ti1vOH·+
ecb'+ Ti1vOH~ TiIlIOH
charge carrier trapping
(Eq.2.4)
(Eq.2.Sa)
(Eq.2.Sb)
(Eq.2.5c)
The electron trapping might occur via two mechanisms: Eq. 2.Sb represents
a dynamic equilibrium, which involves the reduction of hydroxylated Tilv.
Reaction in Eq. 2.Sc is irreversible and leads to reduction of Tilvto TiIlI.On the
other hand, the positive charge is trapped on hydroxilated Ti giving rise to the
cation radical Ti1vOH"'. At this point, in the presence of suitable scavengers
adsorbed on the catalyst surface (electron donor D and electron acceptor A), a
redox reaction may occur through an interfacial electron transfer mechanism:
Ti1vOH·++D ~ TilvOH+D·+
et; +A ~ Ti1vOH+A·'
oxidation
reduction
(Eq.2.6)
(Eq.2.7)
19

Chapter 2 Literature review
In the absence of such scavengers, electrons and holes recombine in few
nanoseconds and dissipate the energy as heat. (D. S. Bhatkhande, 2001)
hVb++ TiIllOH-+ TiIVOH
ecb"+ Ti1vOH .+ ~ Ti1vOH
(Eq.2.8)
(Eq.2.9)
The excellent activity of Ti02 can be explained with considerations about
redox potential values of excited CB and VB's holes. The oxidation of many
organic pollutants requires high potentials. The redox potential of the
photogenerated valence band holes in Ti02 is sufficiently positive to react with
the hydroxylated surface to produce OH· radicals, which are the most potent
oxidising agents after fluorine. On the other hand the redox potential of the
conduction band electrons is sufficiently negative to reduce an electron
acceptors such as adsorbed 02 (Fig 2.2). However, the oxidation process may
occur by either indirect oxidation via the surface-bound hydroxyl radical (Le. a
trapped hole at the particle surface) or directly via the valence band hole before
it is trapped.
The bulk and surface charge carrier recombination and the oxidation and
reduction at the catalyst surface are competitive processes. The balance of this
competition defines the overall efficiency of a photocatalyst.
The charge carrier recombination is a very fast process and occurs in
nanoseconds, while the timescale necessary for redox processes to take place is
10"s s. It has been estimated that in pure Ti02 colloids, around 90% of
photogenerated charge carriers recombine within IOns, therefore are not
available for the surface redox processes (Serpone, 1997). One strategy to
improve the activity of Ti02 is to slow down the charge carrier recombination
20

Chapter2 Literature review
rate by enhancing e"/h+pair lifetime. Charge separation is often achieved by
introducing suitable dopants in the crystal lattice or at the surface of the
photocatalyst or by coupling different semiconductors (Section 2.2.5).
2.1.4 Titania properties influencing the photocatalytic activity
The photocatalytic activity of Ti02 strongly depends on its chemical and
physical properties. Many authors have focused their attention on the role of
...Ti02 structural parameters such as crystal phase, particle size, surface area,
surface hydroxylation etc.... These parameters are reviewed in the following
paragraphs. Nowadays it is generally accepted that the differences in the
photocatalytic activity of titania cannot be undoubtedly ascribed to only one of
the above parameters. Therefore, the general trend is to consider the joined
effect of several electronic, textural and structural factors. In this sense, it was
recently reported that an efficient Ti02 photocatalyst should possess
simultaneously an appropriate phase structure with textural and electronic
properties; the lack of one of these conditions yields to a sharp reduction of its
photoactivity (Kolen'ko et al., 2004, Yu et al., 2007).
2.1.4.1 Crystalline phase and composition
It is widely accepted that anatase is the most active Ti02 polymorph for
photooxidation of organic compounds in heterogeneous systems, while rutile is
generally considered less active, despite its narrower bandgap (Hurum et al.,
2005). Sclafani and Hermann (1996) explained the higher activity of anatase by
mean of photoconductance measurements, which is evidenced by two distinct
feautures:
21

Chapter2 Literature review
(a) anatase is more efficient in the formation of the electron-hole pair than
rutile.
(b) anatase has a higher attitude in photoadsorbing 02 on its surface
compared with rutile (Sclafani and Herrmann, 1996).
Moreover, the anatase surface is highly hydroxylated, thus with significant
chemisorption properties for 02 and other species on its surface. On the other
hand, rutile is characterised by poor surface hydroxylation possibly due to the
high temperatures reached during its preparation (Morterra, 1988, Primet et al.,
1971).
However, Ti02 catalyst made up of mixtures of anatase and rutile often
show unexpectedly high photocatalytic activity and sometimes higher than
pure anatase (Hoffmann et al., 1995, Kolen'ko et al., 2004). A typical example
of this kind of Ti02 catalyst is the commercial material Degussa P-25, the
specifications and structural characteristic of Ti02 P-25 are reported in section
2.1.4.4.
The first model developed to rationalize the high activity of mixed phases
considers anatase as the active component, absorbing the photon and giving
rise to evh+ formation. Electron phase transfer occurs from anatase CB to rutile
trapping site, providing an efficient charge separation, hence reducing the
recombination rate of the anatase phase (Fig 2.6A).
Hurum and Gray carried out several fundamental studies using electron
paramagnetic resonance spectroscopy (EPR) to understand the phenomena
responsible for P-25 and other mixed phases Ti02 improved activity (Hurum et
al., 2003, Hurum et al., 2005, Hurum et al., 2006). Their results provide
evidences of photogenerated electron transfer from rutile to anatase lattice
22

Chapter 2 Literature review
trapping sites. The electron is then further transferred from the anatase
trapping sites to the surface trapping sites. The whole electron-transfer results
in a significant charge separation in the semiconductor system, and allows
rutile originating holes to take part in the photocatalytic reactions (Hurum et
al.,2003).
The photogenerated electron transfer from rutile to anatase can take place at
the interface between anatase and rutile particles only in case of intimate
contact between the two phases. This implies good contact between particles
with comparable dimension (Hurum et aI, 2003).
A B
E Rutile Anatase Rutile Anatase
-CB CB
~ht-- hI surface
VB VB VB
Fig. 2.6. Models of mixed phase Ti02 activity: A) traditional model where
rutile acts as electron sink B) model proposed on the base of EPR results,
where electron transfer occurs from rutile to anatase. (Adapted from Hurum et
al,2003).
2.1.4.2 Particle size and surface area
Particle size and surface area are properties inversely correlated, as the
direct consequence of the growth of titania crystals is the decrease of the
surface area. A large surface area is widely considered a desirable property for
a photocatalyst. With large surface area the adsorption rate of reactants on the
23

Chapter2 Literature review
surface increases; it increases also the number of active sites and consequently
the interfacial charge transfer rate at the surface (Zhang et al., 1998).
On the other hand, the particle size influences the electron-hole
recombination properties of the material. In fact the dominant electron-hole
recombination pathway is different for Ti02 of different particle sizes. In large
crystals, the main pathway is the bulk recombination, while in small crystals
the predominant recombination process is the surface recombination. Ti02 with
high crystallinity is characterized by longer charge carrier lifetime associated
with a more efficient electron-hole utilization (Ohtani et al., 1997). A linear
correlation between photocatalytic activity and anatase crystal size at constant
surface area, was found for the degradation of TeE in the gas phase (Jung et
al.,2002).
An increase in the photocatalytic activity with increasing the surface area
(or decreasing particle size) has been reported (Zhang et al, 1998, Maira et al,
2000). However, the activity does not increase monotonically and an optimum
surface area (or particle size) is usually found. Zhang (1998) found an optimum
particle size of 10 nm for the degradation of chloroform in the liquid phase.
The authors attribute this phenomenon to the increased surface electron-hole
recombination rate that occurs in small particles and offsets the benefits from
high surface area (Zhang et al., 1998). In the gas-phase, Maira et al (2000)
found an optimum Ti02 crystal size of 7 nm for the photodegradation of TeE.
A red shift of the absorption properties in crystals smaller than 11 nm was
observed, due to a quantum-size effect. The decreased activity in catalyst
smaller than 7 nm was ascribed to a combination of structural and electronic
properties (Maira et al., 2000).
24

Chapter2 Literature review
The particle size was observed also to affect the activity and the selectivity
of products in the photocatalytic oxidation of toluene. ri02 with 6 nm crystals
were found more active than 20 nm crystals, probably due to higher surface
area. Smaller crystals were found to favour the complete mineralisation of
toluene, while in larger crystal partial oxidation to benzaldehyde and
consequent catalyst deactivation was observed (Maira et al., 2001).
2.1.4.3 Crystallinity
The degree and quality of crystallisation of the semiconductor is generally
related to the synthesis procedure and they are considered of crucial
importance in photocatalytic studies. In relating the structural and electronic
properties of titania samples with their photocatalytic activity, Kolen'ko and
co-workers considered the crystalline quality as the main factor governing the
'photo-part' of the photocatalytic process. The 'photo part' includes all
phenomena that occur as result of the interaction of matter with light, from the
photon absorption to the surface trapping of the charge carriers. In contrast, the
surface area is considered to rule the 'catalysis part' that encompasses the
surface reactivity of the material.
The photocatalytic activity of amorphous Ti02 is considered negligible. The
inactivity of amorphous ri02 has been ascribed to the high recombination rate
of photoexcited electron-hole pairs (Ohtani et al., 1997). Amorphous Ti02
contains many imperfections in the bulk structure, like impurities or
microvoids, which are responsible for the presence in the band gap of
electronic states that may behave as centers for charge carrier recombination
On the other hand, well-developed titania crystals are usually associated with
25

Chapter 2 Literature review
fewer flaws in the crystal structure, thus fewer recombination centres (Ohtani
et al., 1997).
2.1.4.4 Degussa P-25
One of the most widely studied forms of titanium dioxide is the commercial
material Degussa P25, which is obtained on industrial scale by high
temperature (greater than 1200 QC)flame hydrolysis of TiCl4 in the presence of
hydrogen and oxygen, which yields a 99.5% pure product. Degussa P-25 is a
mixture of 70% anatase and 30% rutile. It can be classified as non-porous, or
with a very low porosity material, with a BET surface area of 55±15 m2g-1 and
average crystal size of 30 nm. 90% of the particles fall in the size range 9-38
nm (Mills and Hunte, 1997). Ti02 crystals do not exist as individual particles
forming aggregates of homogeneous appearance, as shown in Fig. 2.7.
Degussa P25 has set the standard for photoreactivity in environmental
applications, but recently research is moving towards studies on nanoparticles
obtained mainly by sol-gel and hydrothermal methods.
Fig. 2.7. SEM micrograph of Degussa P-25 coated on glass fibre support.
26
Chapter 2 Literature review
2.2 Ti02 synthesis: Sol-gel method
2.2.1 Introduction
Sol-gel is known since mid 1800's when Ebelman and Graham during their
studies on silica gels observed that the hydrolysis of Si(OC2Hs)4under acidic
conditions, yielded Si02 in the form of a "glass like material" (Hench and
West, 1990). However, the potential of the sol-gel method in the preparation of
inorganic materials was recognized and developed only during the last decade.
Sol-gel process is nowadays a powerful and versatile process for making
glasses and ceramic oxides due to its the advantages compared with more
conventional synthetic procedures, such as higher purity and homogeneity of
the products and milder process temperatures.
Sol-gel process can be defined as a method to convert a colloidal "solution"
(sol), to a gelatinous substance (gel) through the growth of inorganic polymers
in a solvent. A sol is a colloidal dispersion of particles in the dimension range
between 1 nm and 1 micron and a gel is a solid consisting of at least two
phases, namely the solvent and the polymeric matrix. The evaporation of the
solvent from the gel leaves a material called xerogel.
Sol-gel processing has gained scientific interest and technological
importance mainly due to the relative simplicity of the procedure and the
almost unlimited possibilities for the formation of materials by tuning the
experimental conditions.
The chemistry of sol-gel is based on hydrolysis-condensation reactions.
Two approaches of sol-gel process are used differing in the nature of initial
precursor (Livage, 1998). The aqueous route is based on the hydrolysis and
27

Chapter2 Literature review
condensation of metal salts dissolved in water. In aqueous solution metal ions
Mn+ are coordinated by water molecule (solvatation). The interaction between
the metal ion and coordinated solvent increases the acidity of the OH bond in
coordinated water. Thus at high pH formation of hydroxyls and oxoanion is
possible. At low concentrations «10-4 M) these species exist as monomers,
while at higher concentration condensation occurs via nucleophilic attack of
OH- ions onto metal cation. The pH of the solution is a crucial parameter for
the condensation process and the determination of final size of aggregate
obtained. This process is used for production of silica and alumino-silicate
compounds.
The second type of sol-gel route is the so-called alkoxidic route, where a
metal-organic precursors Le. an alkoxide is used as precursor in alcoholic
media. Most of the metallic alkoxides can react with water through a series of
hydrolysis steps and condensation giving rise to an amorphous solid (Hench
and West, 1990). Gelling in this case occurs as a result of polymerization and
leads to interconnected 3-D network. The rest of this section will focus only
on the alkoxide route since it is the method employed during this study for
Ti02 sol-gel preparation.
2.2.2 Chemistry of sol-gel process
The sol-gel chemistry of silica is one of the most widely studied topics in
this area (C.J. Brinker, G.W. Scherer, 1990) and the starting point for
application of sol-gel chemistry to other elements such as transition metals like
titanium. The sol-gel chemistry of transition metals is more complex than that
28

Chapter2 Literature review
of silica because transition metals can exhibit various coordination numbers
and show generally higher reactivity due to their lower electronegativity
(Livage et al., 1988).
Sol-gel process is based on inorganic polymerisation reactions. It involves
the hydrolysis and condensation reactions of metal alkoxide precursors
dissolved in organic solvent, usually an alcoholic solution. Common precursors
in the case of titania are titanium n-butoxide Ti(O-nBu)4 and titanium
isopropoxide Ti(O-iPr)4.
The hydrolysis of the precursor leads to formation of monomers with
reactive hydroxo groups. The monomers then condense forming bunched
oligomers characterized by the presence of hydroxy terminal groups. Further
condensation of these polymers leads to a 3D macromolecular network (Hench
and West, 1990, B.B. Lakshimi et al. 1997; Mansor A.H. and Ismail A.R,
2003;). Eq. 2.10 and 2.11 describe the hydrolysis and condensation steps
respectively:
Ti(OH)4 + 4 ROH Hydrolysis (Eq.2.10)
Condensation (Eq. 2.11)
In metal alkoxide precursors the Ti-OR bond is polarized and Ti acts as
electrophile in the molecule. The hydrolysis reaction is a bimolecular
nucleophilic substitution (Sn2), where an oxygen lone pair attacks the Ti atom
bonding to it and causing the elimination of an alkoxyl group. Studies on the
reaction mechanism (Park et al., 2003) show that the hydrolysis reaction of
titanium alkoxides occurs through an associative substitution reaction pathway,
29

Chapter2 Literature review
with the formation of a pentavalent intermediate that in the case of titanium
isopropoxide (TIP) as precursor, can be isolated.
The condensation reaction is a nucleophilic substitution that leads to the
formation of Ti-O- Ti bridges with the elimination of a water molecule.
H 0,iPr kJ, • OiP
H'O:\ rPiO-Ji,'" r ':::;:::k=2~<::> OiPr
OiPrH, '. OiPrJJT~
rPiO OiPr
OiPrHO- ti,"·...or---i,.... ,
-iPrOH OiPr
Fig. 2.8. Proposed associative mechanism for hydrolysis reaction.
iPr=isopropyl group. (Adapted from Park et al, 2003).
However, in normal conditions the hydrolysis and condensation reactions
cannot be considered separately. In fact, the condensation process starts before
the complete hydrolysis of the precursor: as soon as the formation of hydroxyl
groups occurs, the formation of hydroxo bridges between monomers takes
place, with formation of olated polymers (Kallala et al., 1993). This is due to
the fact that the oxidation state of Ti is lower than its preferred coordination
number i.e.: 6.
OR H OR H OR ~ qRRO,,,. I.~o,,,,. I _..,....O"',... I .""' .........__I ..""OR'" Ti:_ .....Ti ....-- "Ti'' _IY'"HO"""" t ""0/ I ""0/' ............0,.....t "'-OR
HbR R OR R OR H HOR
Fig. 2. 9. Formation of olated olygomers.
30

Chapter2 Literature review
Therefore the metal tends to increase is coordination number by using its
vacant d orbital accepting lone pairs from any nucleophile ligand. The
formation of hydroxo bridges allows Ti to fully satisfy its coordination sphere,
and this is the driven force of the whole process. The process proceeds through
further hydrolysis that substitute residual OR groups with OH groups and
through condensation reaction between two hydroxylated Ti centres (Eq. 2.11).
Further hydrolysis and polycondensation leads to the formation of a 3D
structure.
2.2.3 Synthesis Parameters in Sol-gel
In the classic sol-gel, when the polymers reach macroscopic size a gel is
formed. In reality a gel is not the only possible outcome for such hydrolysis-
polymerization reaction. Other final product can be obtained depending on
reaction conditions. Formation of stable colloidal suspension at microscopic,
scale can be obtained; or formation of precipitates can be achieved where the
reactions produces a very dense structure. Sol and precipitates represent the
extreme possibilities; all products in between these two products can be
obtained by fine-tuning the synthetic parameters (Ka11ala et al., 1993).
What determines the nature of the final reaction product is the ratio between
the hydrolysis and the condensation reaction rates kH and Ice (Livage et al.,
1988). A good amount of research has been done with the purpose of
understanding the kinetics of hydrolysis and condensation reactions and their
constants ratio kH/lce. Table 2.3 illustrates the commonly accepted rules used to
predict the final product of sol-gel system (Livage et al., 1988).
31
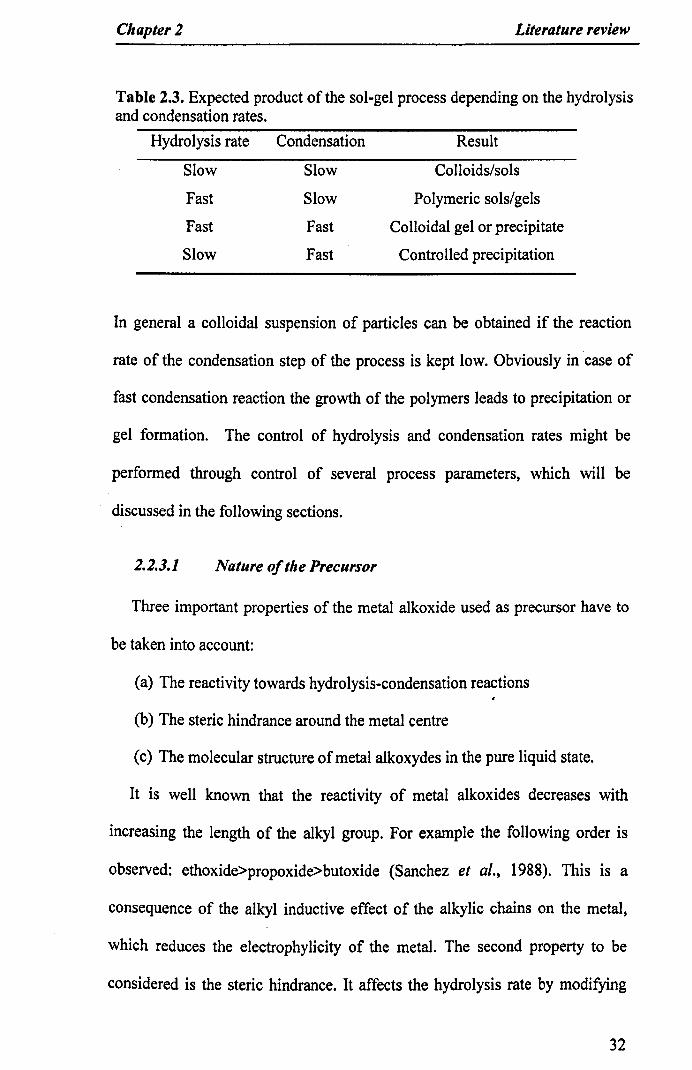
Chapter2 Literature review
Table 2.3. Expected product of the sol-gel process depending on the hydrolysisand condensation rates.
Hydrolysis rate Condensation Result
Slow Slow Colloids/sols
Fast Slow Polymeric sols/gelsFast Fast Colloidal gel or precipitateSlow Fast Controlled precipitation
In general a colloidal suspension of particles can be obtained if the reaction
rate of the condensation step of the process is kept low. Obviously incase of
fast condensation reaction the growth of the polymers leads to precipitation or
gel formation. The control of hydrolysis and condensation rates might be
performed through control of several process parameters, which will be
discussed in the following sections.
2.2.3.1 Nature of the Precursor
Three important properties of the metal alkoxide used as precursor have to
be taken into account:
(a) The reactivity towards hydrolysis-condensation reactions
(b) The steric hindrance around the metal centre
(c) The molecular structure of metal alkoxydes in the pure liquid state.
It is well known that the reactivity of metal alkoxides decreases with
increasing the length of the alkyl group. For example the following order is
observed: ethoxide>propoxide>butoxide (Sanchez et al., 1988). This is a
consequence of the alkyl inductive effect of the alkylic chains on the metal,
which reduces the electrophylicity of the metal. The second property to be
considered is the steric hindrance. It affects the hydrolysis rate by modifying
32
Chapter2 Literature review
the facility of nucleophilic attack to the metal centre. Reaction rates increase
with the following order: primary >secondary> tertiary (Hawes and Trippett,
1968). Finally, the molecular structure of the alkoxide is another important
parameter. In fact, due to the coordination expansion tendency of Ti, some Ti
alkoxides are oligomers rather than monomers in the pure liquid state.
Formation of alkoxy bridging between the monomers or with the coordination
of another donor ligand from the solution occurs. Of course, the molecular
structure is correlated with steric effect of the alkyl group. As a general rule Ti
alkoxides with primary alkoxyl groups easily allows the coordination
expansion, forming trimers where the metal centre is surrounded by five
ligands. In case of secondary or tertiary alkoxyl groups the monomeric form
with Ti in its fourfold coordination is favourite (Livage et al., 1988). Manzini
et al. shown that Ti(Oi-Pr)4 is a tetracoordinated monomer in pure liquid state,
while Ti(OBu)4 and Ti(OEt)4 form a pentacoordinated oligomer with Ti-Ti
distance of 11.09 and 13.09 A. respectively (Manzini et al., 1995, Kallala et
al., 1993).
2.2.3.2 Concentration oj water
The molar ratio of water to titanium precursor rw=[H20]/[Ti] has a
significant effect on the size and morphology of the obtained sol because it
influences the equilibrium of both hydrolysis and condensation reactions (See
Eq. 2.10 and 2.11). The complete hydrolysis of Ti alkoxide requires four
molecules of water (Eq. 2.10) and the condensation reaction produces one
molecule of water for every bridge Ti-O- Ti formed (Eq. 2.11). However, the
condensation rate in absence of catalysts or inhibitors depends on the
33

Chapter2 Literature review
hydrolysis reaction, which can be considered the drawing force of all the
process. When the molar rate is lower or equal to the stoechiometric, i.e.: rw::5:4,
colloidal particles are usually obtained, due to the slow hydrolysis reaction. In
excess of water, i.e.: rw>4,the formation of precipitates is expected because, as
a general trend, the hydrolysis rate increases and with it the condensation rate
(Hamid and Rahman, 2003).
In a recent study (Maira et al., 2000) is reported how the concentration of water
affects the dimension of amorphous Ti02 aggregates. The concentration of
water was varied from 0.25 and 2.5 M, keeping the ratio [H20]/[Ti] at fixed
value of 4. SEM images show clearly that increasing the concentration of water
from 0.25 to 0.5 the particle size decrease rapidly from 900 nm to 100 nm. For
concentrations of water higher than 0.5 M a constant value was reached and
particle size smaller than 80 nm couldn't be obtained.
2.2.4 pH of solution
The hydrolysis reaction rate increases if carried out under either acid or
basic conditions. Under acidic conditions the oxygen atom of the alkoxil group
attracts the H+ ion. Due to this interaction, the Ti electrophilic property
increases favoring the nucleophilic attack from a water molecule. Conversely
under basic conditions, the OH"ion, which is a stronger nucleophile than water,
attacks the metal centre initiating the hydrolysis reaction.
The W ions act also as inhibitor for the condensation reaction. In fact,
depending on the pH, the Ti-OH groups formed through the hydrolysis can be
protonated or deprotonated. If the TiOH attacking another Ti is protonated
34

Chapter2 Literature review
during its approach to the metal centre the condensation reaction does not
occur (Kallala et al., 1993). H+prevents the particle growth and agglomeration
through electrostatic repulsion. Since the isoelectric point (IEP) of Ti02 lies at
pH 6-6.5 at pH<IEP the surface of the particles is positively charged, thus an
acidic environment promotes the dispersed state of the particles. Some organic
acids such as acetic acid can act as ligands, coordinating the metal center,
hence modifying the reaction equilibrium also through steric indrance.
Conversely, at basic pH the condensation rate is improved through
deprotonation of TiOH and consequent formation of TiO· groups, which are
strong nuc1eophiles. Hence, referring to conditions reported in Table 2.3, the
addition of acid to the reaction mixture leads to production of stable sols as
final products through a decrease in the condensation reaction rate. On the
other hand a reaction carried out in basic conditions produces precipitates due
to fast condensation reaction rate.
2.2.5 Advantages and applications of sol-gel
The sol-gel method is widely used in a variety of applications: monolith
ceramics, porous membranes, powders, nanoparticles and thin coatings.
Monolith ceramics are obtained through formation of stable and crack free bulk
gel that can be casted and consolidated at the desired shape.
The principal advantages of the sol-gel technique are:
Low cost of equipment necessary
Low temperatures required for reactions
High homogeneity and purity of products
35
Chapter2 Literature review
Versatility of method
Ideal starting point for preparation of coatings and thin films
The possibility of depositing thin films on a variety of porous and non
porous supports (metals, glasses, plastics, wood, and ceramics) contributes to
the application of coated metal oxides in several fields: from environmental
applications with photocatalysis for water and air remediation, to the
development of energy storage devices (solar cells, fuel cells and
supercapacitors), to self-cleaning surfaces. The coatings can be obtained by
spin or dip coating technique and electrodeposition.
However, nanoparticles obtained by the hydrolysis-condensation reaction
are mainly amorphous, thus powders or deposited thin films must be treated
thermally, usually by calcination at high temperature (higher than 300°C) to
achieve crystallization to active polymorph. During thermal treatments but also
during normal solvent evaporation, the formation of cracks on the thin film
surface occurs which compromises its mechanical properties and successful
application in a variety of applications. It has been reported that the sol-gel
process carried out in presence of PEG as surfactant leads to crack-free dip-
coated films with different degree of porosity depending on molecular weight
of PEG used (Guo et al., 2005). A non-acidic sol-gel system containing
titanium isoproxide and acetylacetone in I-butanol, and Tween 20, a nonionic
surfactant, has been recently developed for deposition of crack-free coatings on
borosilicate glass (Chen et al., 2008).
36

Chapter2 Literature review
2.2.6 Hydrothermal process
2.2.6.1 Introduction
The hydrothermal process identifies a preparation method carried out in a
sealed heated solution above ambient temperature and pressure. The term
'hydrothermal' is borrowed from geology and earth science where it refers to
high temperatures and water pressures processes that occur during the natural
formation of mineral ores. Hydrothermal reactions are crystal growth processes
that can be carried out in a wide temperature (100°-1000° C) and pressure (1-
1000 atm) ranges. Most of the hydrothermal reactions are conducted below the
supercritical temperature of water (374°C) and do not exceed pressure of few
atmospheres (Shigeyuki and Rustum, 2000).
The term 'solvothermal' is generically used when water or any other solvent
(Le. organic solvents such as alcohols) are used, while 'hydrothermal' refers
specifically to those processes conducted in water as reaction media. At
laboratory scale, the reactions are carried out in specific autoclaves or digestion
bombs. The whole apparatus is composed of an inner vessel, made of inert and
corrosion resistant material like Teflon that contains the reaction mixture. The
inner container is placed inside a sealable stainless steel cylinder capable of
holding the high internal pressures reached during the reaction.
The hydrothermal method is traditionally used for the preparation of
synthetic quartz or precious gems in single crystal form. Hydrothermal
reactions have been also successfully employed for the preparation of a variety
of metal oxides such as ZnO crystals and nanopowders (Cai et al., 2008), CdS
nanopartic1es (Zhang et al., 2007, Han et al., 2007), W03 (Balazsi and Pfeifer,
37
Chapter2 Literature review
2002, Kominami et al., 2003) and Ti02 nanostructures (Hidalgo et al., 2007,
Kolen'ko et al., 2003, Kolen'ko et al., 2004, Kominami et al., 2003, Shigeyuki
and Rustum, 2000, Yanagisawa and Ovenstone, 1999, Yu et al., 2005, Yu et
al.,2007).
2.2.6.2 Effect of Precursor
One of the most used precursors in the hydrothermal synthesis of Ti02
nanoparticles is amorphous Ti02 in the form of sol, gel or powders (Ito et al.,
2000, Wang and Ying, 1999, Maira et al., 2000, Yanagisawa and Ovenstone,
1999, Yu et al., 2007). The role of the preparation route for the amorphous
precursor has been studied.
Hidalgo et al (2007) reported the hydrothermal treatment of Ti02 gels
obtained by precipitation of Ti4+ from TIP in different acidic solutions (nitric,
hydrochloric and acetic acids) as well as using triethylamine (TEA) at different
pH. Surface and morphological qualities significantly differ depending on the
sol-gel synthetic route. In a similar way, Yanagisawa and Ovenstone used
precursors obtained by precipitation of TiCl4 in water, acidic and basic
conditions, as well as hydrolysis of Ti(OC2Hs)4 in dry ethanol (Yanagisawa
and Ovenstone, 1999).
Yu and colleagues used colloidal solution obtained from
tetrabutylorthotitanate precursor (TiO(C4H9)4,TBOT) in water. Hydrothermal
treatment at 100<[<200 °C produced catalysts characterized by an interesting
bimodal porosity distribution in the meso and macroporous region, and highly
active towards photoxidation of acetone in the liquid phase. The best sample
38

Chapter2 Literature review
showed an apparent rate constant that exceed that of P-25 by a factor of over 3
times (Yu et al., 2007).
Also commercial Degussa P-25 has been treated hydrothermically in water
suspension. Hydrothermal treatment of P-25 at 150 °C for different length of
time (1-72 hours) promoted a significant increase in the porosity and surface
hydroxylation of the powders, yielding to Ti02 catalyst with improved activity
for mineralisation of acetone in the liquid phase (Yu et al., 2006).
TiOS04 is another common Ti precursor used in hydrothermal synthesis.
(Kolen'ko et al., 2004, Hidalgo et al., 2007, Kolen'ko et al., 2003, Ran et al.,
2007). When TiOS04 was reacted with urea, only formation of anatase was
observed (Ran et al., 2007). TiOS04 aqueous solution acidified with H2S04
yielded to anatase-rutile mixtures with 15% rutile (Kolen'ko et al., 2003).
Kolen'ko also compared the use of TiOS04 and H2S04, H2TiO(C204)2 and
TiO(N03)2 solutions as precursors on either structural and photocatalytic
properties of obtained Ti02 emphasizing the correlation between salt precursor
and phase composition and structural properties.
2.2.6.3 Effect of Temperature and holding time
Increasing both reaction temperature and holding time result in the increase
of crystallinity and crystal size of Ti02 samples. Conversely a decrease in the
surface area was observed, most probably as a direct consequence of crystal
growth (Ran et al., 2007). Both tendencies have been observed until a
maximum temperature, after which the crystal size and the surface area reach a
constant value. This trend suggests that the mechanisms of crystal formation
and crystal growth may be temperature dependant. Yanagisawa and Ovenstone
39

Chapter 2 Literature review
proposed a model for the hydrothermal crystallisation of Ti02 from amorphous
precursor where the crystallisation proceeds through a solid-state epitaxial
growth at low temperatures and changes to dissolution-precipitation at
temperatures higher than 250°C (Yanagisawa and Ovenstone, 1999).
2.2.6.4 Effect of reaction media
Reaction media properties such as viscosity and dielectric constant can
heavily influence the mobility, reactivity and solubility of species in solution.
Thus, the composition of the solution media influences the product nature and
characteristics.
Amorphous titaniaInterme diale Anatase
o
H",/H,.0,
"' /",0,
° °
Fig. 2.10. Proposed model for hydrothermal conversion of amorphous titania
to anatase. (From Yanagisawa and Ovenstone, 1999).
Water has proven to have a positive effect on the anatase crystallization
from amorphous sols and powders, by coordinating the amorphous titania
surface and catalyzing the rearrangement of Ti06 octahedra and the nucleation
step in the phase transition (Yanagisawa and Ovenstone, 1999).
By using mixture of water and alcohols it is possible to control the degree of
crystallization of obtained powders. It has also been observed that increasing
40

Chapter2 Literature review
the ratio alcohol-water, the expected decrease in particle size is accompanied
by an increase in surface area and porosity that occur systematically at different
combinations of reaction temperatures and holding times (Wang and Ying,
1999).
2.2.6.5 Advantages of hydrothermal met/rod
The Ti02 nanomaterials obtained by hydrothermal treatment are
characterized by high surface area compared with similar materials prepared by
other methods such as sol-gel followed by calcination. In addition, the
hydrothermal process has proven to be very versatile as it is possible to tune
and control the size, shape and type of titania polymorph by using different
precursors and changing the hydrothermal conditions. For these reasons, the
hydrothermal synthesis has been used as an alternative process to sol-gel for
the preparation of highly active photocatalysts.
The preparation of nanoparticles by hydrothermal process offers the
following advantages:
Mild temperature conditions - crystallisation of Ti02 requires
temperatures much lower than those required by calcination treatment.
High purity of the product
High reproducibility
It is a green technique: being carried out in a closed environment the
pollution and waste are minimised.
However, some limitations for the application of hydrothermal methods on
a large scale arise from the safety issues related to the utilisation of high
pressures.
41

Chapter 2 Literature review
2.2.7 Modified Ti02 photocatalysts
2.2.7.1 Introduction
The widespread use of titania as photocatalyst in industrial remediation
technologies and commercial systems is prevented by its low efficiency under
natural illumination. Indeed, the main flaw of Ti02 as photocatalyst is its wide
bandgap energy, 3.0 and 3.2 eV for rutile and anatase respectively, which
require absorption of UV radiation at wavelength <386-400 nm for
photoexcitation. This means that only 5-10% of solar spectra can be utilised
limiting its applicability under solar or visible light illumination.
Moreover, as already stated, the recombination is a predominant process on
Ti02, and by the time the photocatalytic reaction can take place, only around
10% of the photogenerated charge carriers are available at the catalyst surface.
Wov,lel'i9lh ("ml=t ~ ~ooo !ooo sao 400 sco'1 to M"'- ........._~""""'f=-.--"9',.,_-"""'l
"..::i~ ti 10
n!.I/)
~ 10i O~~~~Z--~~~4~~~~PtlOlon 'Energy hV)
Fig. 2.11 Fraction of the solar spectra utilisable for the photoexcitation ofTi02.
(From Linsebigler et al. 1995).
The scientific community's efforts towards the optimisation of the
performance of Ti02 have focused in two directions: (a) the alteration of Ti02
electronic and surface properties to allow a shift of the absorption onset
towards visible wavelength; (b) the maximisation of the utilisation of
42

Chapter2 Literature review
photogenerated charge carriers through the reduction of the charge carrier
recombination rate.
The utilisation of various dopant species has been widely investigated, as
well as the introduction of surface modifications such as metal deposition and
development of composite semiconductors. According to Asahi et ai, an ideal
dopant should satisfy three general conditions (Asahi et al., 2001):
(a) It should produce states in the Ti02 bandgap that absorb radiations in
the visible range of the spectra (A. ~ 400 nm);
(b) The conduction band minimum (CBM) of the doped Ti02 should be
higher than the redox couple involved in the photoreductive process
(c) The dopant states should overlap adequately with the band states of
Ti02, in order to allow transfer of the photoexcited carriers to the
reactive sites at the catalyst surface within their lifetime.
2.2.7.2 Metal doping
The first doping attempts that can be found in the literature used transition
and noble metals as dopant agents, on Degussa P-25 first, and on Ti02 obtained
by sol-gel or alternative methods later (Chatterjee and Dasgupta, 2005, Anpo
and Takeuchi, 2003). Metal ions from the transition series such as V, Cr, Mn,
Fe, Cu, Ag, Au, Pd as well as rare earth metals (Parida and Sahu, 2008) were
inserted in the crystal lattice of titania, substituting the Ti ions. Referring to the
aforementioned Asahi's conditions, metals may contribute with their d orbitals
and corresponding energy states, to shifting the absorption edge towards the
visible range. However, the d states can also act as recombination charge
centres and have a detrimental effect on the photocatalytic efficiency under
43

Chapter2 Literature review
UV -visible light. For this reason, to date contrasting results have been reported,
depending on the nature of metal ion and the preparation method.
The metal-ion doping can be achieved by physical or chemical methods. In
the physical ion implantation, bare titania is bombarded with high-energy metal
ion beam (Yamashita et al., 2002, Anpo and Takeuchi, 2003). It was
discovered that metal-ion implantation with V, Cr, Mn, Fe, and Ni caused a
consistent shift toward the visible light region with the following order: V > er
> Mn > Fe > Ni. This shift allows the utilization of approximately 20-30% of
solar spectra of the titanium oxide catalysts and its extent was found to be
function of the dopant concentration (Anpo and Takeuchi, 2003).
Yamashita reported the mineralization of 2-propanol in water under visible
light by V+ doped Ti02 obtained by physical ion implantation as result of light
absorption improvement (Yamashita et al., 2002). It was also found that the
activity under UV irradiation of the doped catalyst was comparable with that of
the pristine catalyst, suggesting that the implanted metal ions do not act as
recombination centre (Yamashita et al., 2002).
Among chemical doping methods, the sol-gel and the chemical implantation
are often used (Arana et al., 2004, Anpo and Takeuchi, 2003). In the sol-gel
approach the doping occurs during the hydrolysis-condensation step when a
suitable metal precursor (usually a salt) is added to the reactant solution. On the
other hand, the implantation is carried out by mixing the amorphous or
crystalline titania with a metal salt solution followed by evaporation of the
solvent. The degree of doping achievable with chemical methods is obviously
lower than with physical implantation. As a consequence, the absorption shift
obtained by chemical methods is much less efficient than with implantation
44

Chapter2 Literature review
method (Anpo and Takeuchi, 2003). Metal doping has some drawbacks such as
thermal instability that limit the possibility of real application of these catalysts
({Dhananjay,2002}.
2.2.7.3 Anion doping
The use of non-metal doping (predominantly N, C, and S) has been used to
shift the photoresponse of Ti02, giving rise to the so-called "second
generation" titania catalysts.
Asahi and co-workers (2001) were the first researchers to report a visible
light active anion-doped Ti02 photocatalyst (Asahi et al., 2001). A high
temperature nitridation process under reductive conditions was used to prepare
Ti02_xNx catalyst where N was substituting 0 in the crystal lattice. This Ti02_
xNx catalyst shows a red-shift of the adsorption edge. The shift was justified in
terms of Ti02 band-gap narrowing due to the mixing of N2p and 02p states. N-
doped Ti02 showed an increased photo-activity for the decomposition of
methylene blue and acetaldehyde under visible light.
Several alternative ways to the high temperature nitridation synthesis used
by Asashi have been proposed. These syntheses are mainly based on the sol-gel
process and have recently been reviewed (Qiu and Burda, 2007). Burda et al
(2003) developed a synthesis based on the sol-gel method, which leads to a
doping concentration up to 8% molar. In this method Ti02-xNx samples were
prepared via direct nitridation by tetraethylamine (TEA) of Ti02 nanopartic1es
colloid obtained after the hydrolysis at controlled pH of titanium isopropoxide
(TIP) in water. Visible light activation of the catalyst and photocatalytic
degradation of methylene blue in the liquid phase was proved.
45

Chapter 2 Literature review
A hydrothermal synthesis for the preparation of N-doped Ti02 was recently
proposed by Rhee et al (2005). In this method titanium oxysulfate (TiOS04)
and ammonia solution react hydrothermically at 120 °C for 3 days. For the
reaction a constant reagents ratio ofTiOS04/H20INH40H=1/15150 was used.
The product of the hydrothermal process was identified as the compound
showed improved activity compared with non-doped nanoparticles for visible
light photodegradation of 2-propanol (Rhee et al., 2005). Visible light
activation has been claimed also for C and S-doped systems and mixed anionic
doping (Zhou and Yu, 2008, Yu et al., Ren et al., 2007).
eV
0- CB Cl ::;::::::l C==:::J
+2
._._-}~1'-f+ •
2.05.V
-F+
"iT2 2.80 ; 20$5 tV
I I(e)
+1-
dop•.nt
Itv.1 D+3- VB~I ~II~ ~I ~I ~(c)(I) (b) Cd)
Ebi· 3.20.V
Fig. 2. 12. Diagram of possible doping effects on red-shift adsorption proposed
by Serpone (Serpone, 2006): (a) Band gap of bare Ti02; (b) doped Ti02 with
localized dopant levels near the VB and the CB; (c) band gap narrowing
resulting from broadening of the VB; (d) localized dopant levels and electronic
transitions to the CB; and (e) electronic transitions from localized levels near
the VB to their corresponding excited states for Te+ and F+centers.
The actual reason for the red-shift in anion-doped Ti02 is still a matter of
debate. Some studies have proposed a narrowing of the bandgap due to the
46
Chapter2 Literature review
formation of a N2p and 02p mixing state, while other authors proposed the
existence in the bandgap of localised energy states deriving from dopant
presence. In this respect, in 2006 Serpone summarised and discussed the
various options, claiming that the bandgap narrowing in semiconductor
requires a heavy doping level that would compromise the nature of the
semiconductor. It was proposed that the absorption in the visible range is
related with the formation of defects due to formation of oxygen vacancies
resulting from anion (or other) lattice doping. These defects give rise to colour
centres responsible for the absorption band at lower energies (longer
wavelength) (Serpone, 2006).
2.2.7.4 Metal deposition
The addition of noble metals to a semiconductor can change the
photocatalytic process by changing the semiconductor surface properties. The
metal is deposited in form of small nanoparticles. The effect of deposition of
Pt, Au, Ag in metallic form on Ti02 on reaction products and selectivity of the
process has been extensively studied. The Ptffi02 system is the metal-
semiconductor system most commonly studied. For some reactions such as
evolution of H2 from ethanol reduction and water splitting, the metal is
important also because of its own catalytic activity. In the case of
photocatalytic oxidations, the effect of the platinisation is highly dependant on
the substrate to be degraded and on the loading of deposited Pt. To date, the
role of Pt is not fully understood, and the effect of platinisation on Ti02
photocatalysis is still the object of intense research. However, In general, it is
accepted that in Ptffi02 systems a better separation of charge carriers occurs.
47

Chapter 2 Literature review
2.2.7.5 Coupled semiconductors
Another interesting approach to modify the surface properties of Ti02
consists in coupling Ti02 with a narrower band-gap semiconductor (e.g. CdS
or W03). For example, CdS is capable of receiving excitation in the visible
region of the solar spectrum (Eg=2.4 eV), but it cannot be used efficiently as
photocatalyst due to its instability. By coupling narrow band-gap
semiconductors (i.e.: CdS or W03) with Ti02 the photoexcitation process can
be modifyied as shown in Fig 2.13 where SC is a narrow band gap
semiconductor.
Fig. 2.13. Doping mechanism scheme in heterojunction between
semiconductors (Chatterjee and Dasgupta, 2005).
Photoexcitation occurs on SC, for absorption of visible range wavelengths.
If SC's conduction band overlaps efficiently with that of Ti02, excited
electrons can be transferred from se to Ti02 (Fig. 2.13A). Fig 2.13B shows the
transfer of electrons as well as holes between the two semiconductors.
This visible light induced interparticle electron transfer (IPET) was
discovered and demonstrated the improvement of decomposition of H2S into
hydrogen and sulfur by coupling Ti02 and CdS. The coupling of two different
48
Chapter2 Literature review
types of semiconductors has been reported to be beneficial also in the photo-
oxidation processes. The IPET pathway can take place from narrow band-gap
semiconductor to Ti02 enhancing the charge separation in the coupled system
(Serpone et al., 1995).
Because the two semiconductors' energy state must overlap to allow the
charge transfer and the consequent charge separation, the nature and quality of
the heterojunction between the two semiconductors surfaces is very important.
2.2.7.6 TiOy'WOJ nanocomposites
During this research work some Ti02IW03 systems have been prepared and
studied, thus in this section the most common preparation methods and some
relevant photocatalytic results are 'reviewed.
Several synthetical routes are reported in literature for the preparation of
Ti02IW03 nanocomposites, which are based either on impregnation (Keller et
al., 2003, Zuo et al., 2006), sol-precipitation (Yang et al., 2002, Yang et al.,
2005) or sol-gel (Yang et al., 2005).
In the impregnation methods, an aqueous solution of W03 precursor is left
reacting under stirring in a Ti02 suspension. Ammonium paratungstate
(NI-4)lOH2(W207)6 is often used as W03 precursor. After evaporation of the
solvent until dryness, the resulting powder is calcined in air. The initial
addition of different amount of tungsten precursor, leads to nanocomposites
that differ in W03 content.
In a sol-precipitation method proposed by Yang in 2002 ammonia
hydroxide is dropped in a solution of TiCLt and W06, precursor of Ti02 and
W03 respectively, and using PEG as surfactant. The powders were then
49

Chapter] Literature review
calcined between 400 and 900°C for 2 h leading to samples with different
morphologies and textural properties. In the sol-gel method proposed by Yang
in 2005, TiOBl14is used as Ti precursor while ammonium tungstate as W
precursor. The reaction is simply a hydrolysis-condensation carried out in
ethanol at pH=10. The obtained sol was aged for 12 h, and the powders were
calcined at 400°C.
A simple physical mixing by ball milling (Shifu et al., 2005) and a
microemulsion approach (Fuerte et al., 2002) were also employed. Recently a
surfactant-assisted hydrothermal synthesis, followed by calcination, has been
developed using Ti(S04h and Na2W04 as oxides precursors respectively and
CTAB (cetyltrimethylammonium bromide) as surfactant (Ke et al., 2008).
The effect of W03 on the photocatalytic properties of Ti02 was reported for
the first time by Do in 1993 for the photo-oxidation of 1,4-dichlorobenzene
(DCB) in the liquid phase. DCB decomposition was improved using Ti02/WOJ
system and an optimum WOJ loading of 3% molar was found. Photoexcited
electron-trapping by WOJ with formation of W(V) was proposed to explain the
improved activity (Do et al., 1993).
In the vapor phase, the addition of W03 to Ti02 yield enhanced reaction
rates also in the photooxidation of butyl acetate (Keller et al., 2003), benzene
and 2-propanol (Kwon et al., 2000) and toluene (Fuerte et al., 2002).
Nanocomposites from 1 to 10% wt W03 showed higher activity towards butyl
acetate oxidation in vapour phase, compared with Ti02 alone. The optimum
WOJ content was established to be 4% wt (Keller et al., 2003). These studies
focused also in the determination of the WOJ loading effect on photocatalytic
behavior of composite systems. A loading of around 3% mol, which is
50

Chapter2 Literature review
approximately equivalent to the formation of a W03 monolayer, has been
found as optimum value.
The IPET pathway that produces an efficient charge separation within the
coupled semiconductor system is one of the phenomena that contribute to the
improved photocatalytic behaviour of Ti02IW03 composites. However, W03
exhibits a higher acidity than Ti02 and its presence in the nanocomposite can
modify the affinity of substrates for the catalyst surface, and consequently, the
adsorption equilibrium and photo-oxidation activity of the catalyst. Evidences
of higher adsorption affinity of W03fn02 composites due to the higher Lewis
acidity of the mixed systems have been reported (Kwon et al., 2000). Song et
01 also reported an increase in the Lewis surface acidity of Degussa P-25 when
W03 was deposited on its surface. The acidity increased with increasing W03
content up to 3% molar (Song et 01.,2001).
2.2.8 Photocatalytic reactors for studies in the gas phase
An efficient and cost effective photocatalytic reactor for indoor air
remediation should achieve good conversion rates and be capable of work with
high air feeding. Thus, high volume and low- pressure drop designs that
guarantee an effective contact between photons, solid catalyst and gaseous
reactants in the system are required (Zhao and Yang, 2003). Several reactor
configurations have been designed and modeled to study the kinetic of
photocatalytic oxidations as function of operative parameters such as humidity,
pollutant concentration, flow rate and light intensity. Photocatalytic reactors
can be classified on the basis of their geometry i.e. tubular, flat plate or catalyst
disposition i.e. fixed bed, fluidized bed or slurries.
51
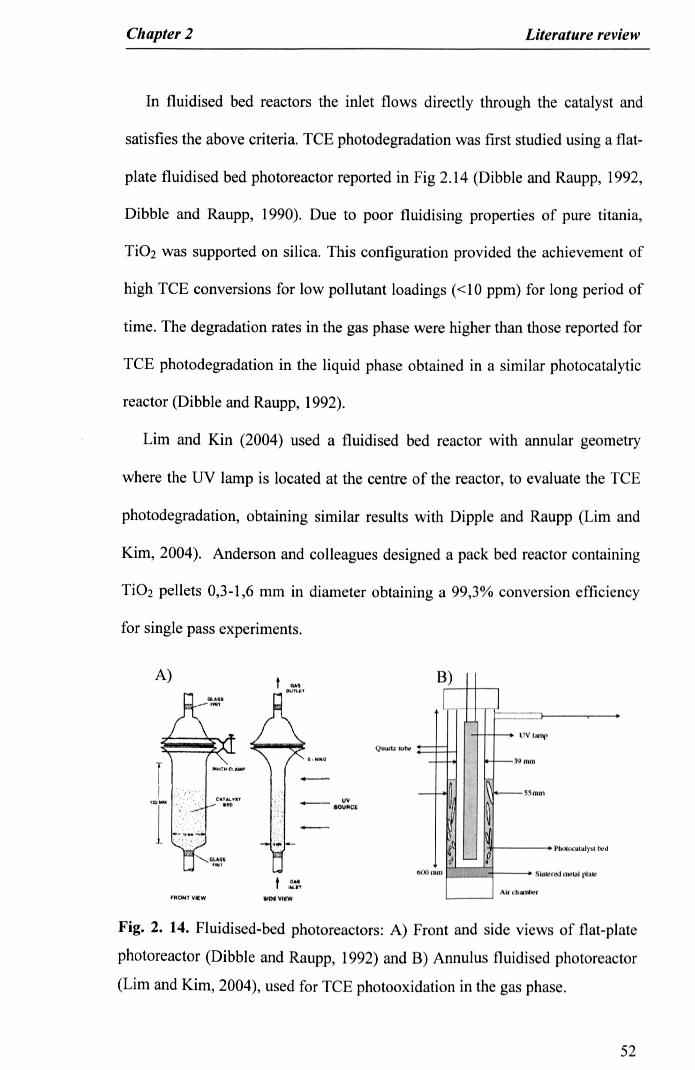
Chapter 2 Literature review
In fluidised bed reactors the inlet flows directly through the catalyst and
satisfies the above criteria. TeE photodegradation was first studied using a flat-
plate fluidised bed photoreactor reported in Fig 2.14 (Dibble and Raupp, 1992,
Dibble and Raupp, 1990). Due to poor fluidising properties of pure titania,
Ti02 was supported on silica. This configuration provided the achievement of
high TeE conversions for low pollutant loadings «10 ppm) for long period of
time. The degradation rates in the gas phase were higher than those reported for
TeE photodegradation in the liquid phase obtained in a similar photocatalytic
reactor (Dibble and Raupp, 1992).
Lim and Kin (2004) used a fluidised bed reactor with annular geometry
where the UV lamp is located at the centre of the reactor, to evaluate the TeE
photodegradation, obtaining similar results with Dipple and Raupp (Lim and
Kim,2004). Anderson and colleagues designed a pack bed reactor containing
Ti02 pellets 0,3-1,6 mm in diameter obtaining a 99,3% conversion efficiency
for single pass experiments.
A) B)
Q\lW17.llI~
l o- J-
trv IfillI'
~ r--r-r-o -.19 mill
~~rfi
- 1\ i"--'Smn,
~I~ 1)1)('\(o.:'l.Il.-I)",I.\).tI
001 -- •
nun 51"lOr.oJ I1l<L,1 rl .,
Ar ~h~ntx>rt l~:'
"MONT Vlt!W liD' VI,·W
Fig. 2. 14. Fluidised-bed photoreactors: A) Front and side views of flat-plate
photoreactor (Dibble and Raupp, 1992) and B) Annulus fluidised photoreactor
(Lim and Kim, 2004), used for TeE photooxidation in the gas phase.
52
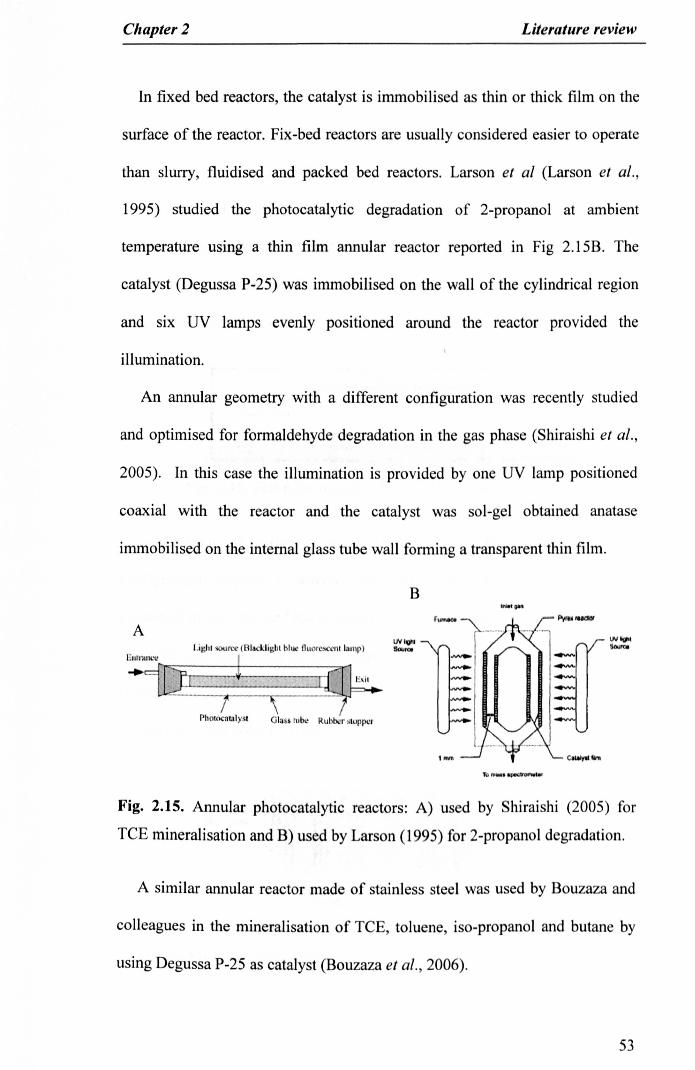
Chapter 2 Literature review
In fixed bed reactors, the catalyst is immobilised as thin or thick film on the
surface of the reactor. Fix-bed reactors are usually considered easier to operate
than slurry, fluidised and packed bed reactors. Larson et al (Larson et al.,
1995) studied the photocatalytic degradation of 2-propanol at ambient
temperature using a thin film annular reactor reported in Fig 2.15B. The
catalyst (Degussa P-25) was immobilised on the wall of the cylindrical region
and six DV lamps evenly positioned around the reactor provided the
illumination.
An annular geometry with a different configuration was recently studied
and optimised for formaldehyde degradation in the gas phase (Shiraishi et al.,
2005). In this case the illumination is provided by one UV lamp positioned
coaxial with the reactor and the catalyst was sol-gel obtained anatase
immobilised on the internal glass tube wall forming a transparent thin film.
B
ALighl source (BJ.cldilllli hlut fluorescent J.. np)
J'III.11Ul~'e I_'~-C::-·. ~.._-._+.~~1-.=:-~...-.:::::'-'~.=-.=-~:=~-.-=r'1t!.(11
rLd=......-......-7--..·..··..- ..·-\..·-..·..·......·........··....~Ph()locomlyst. OJaSJ rube Rubber sIOpp~I'
Fig. 2.15. Annular photocatalytic reactors: A) used by Shiraishi (2005) for
TCE mineralisation and B) used by Larson (1995) for 2-propanol degradation.
A similar annular reactor made of stainless steel was used by Bouzaza and
colleagues in the mineralisation of TCE, toluene, iso-propanol and butane by
using Degussa P-25 as catalyst (Bouzaza et al., 2006).
53
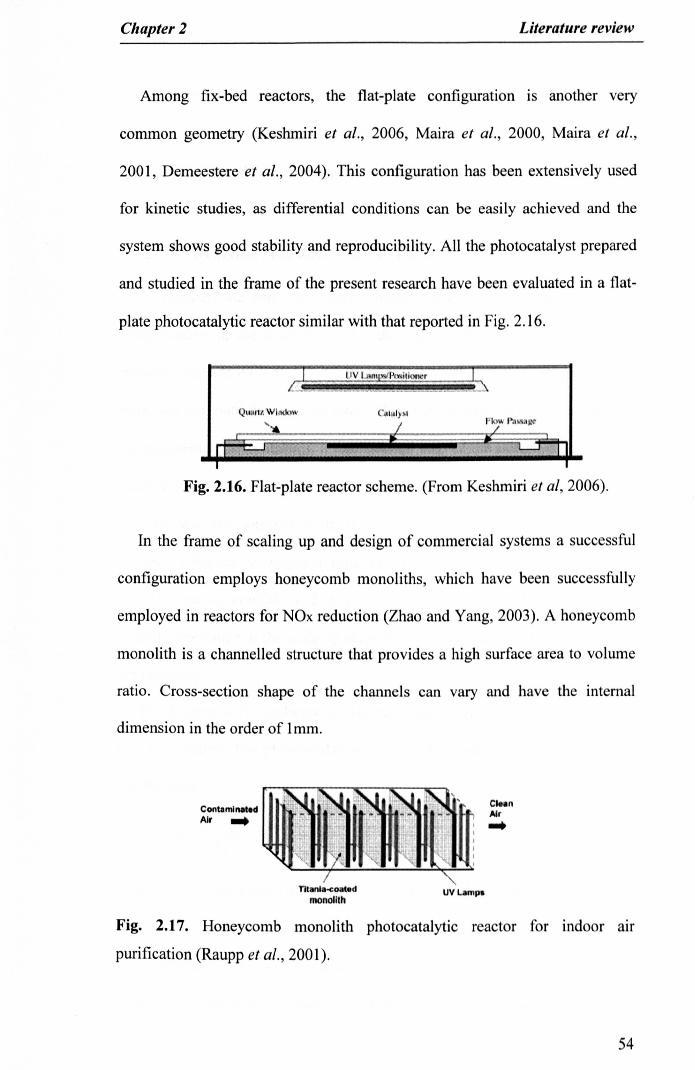
Chapter 2 Literature review
Among fix-bed reactors, the flat-plate configuration is another very
common geometry (Keshmiri et al., 2006, Maira et al., 2000, Maira et al.,
2001, Demeestere et al., 2004). This configuration has been extensively used
for kinetic studies, as differential conditions can be easily achieved and the
system shows good stability and reproducibility. All the photocatalyst prepared
and studied in the frame of the present research have been evaluated in a flat-
plate photocatalytic reactor similar with that reported in Fig. 2.16.
Ql~lrl'1;Window
'..
~ ,;''',;.!Will<,.".,
C"luly~l
I
I LlV t.llnlLl~p(l"ilIQfl"r . I..... ,.._._._ "".."""""-""""", .."",,,,.,,,,, , ,"'" .."._,,\
I I
Fig. 2.16. Flat-plate reactor scheme. (From Keshmiri et aI, 2006).
In the frame of scaling up and design of commercial systems a successful
configuration employs honeycomb monoliths, which have been successfully
employed in reactors for NOx reduction (Zhao and Yang, 2003). A honeycomb
monolith is a channelled structure that provides a high surface area to volume
ratio. Cross-section shape of the channels can vary and have the internal
dimension in the order of lmm.
ContamlnlltedAir ...
CI•• nAIr...
Tllanla-coat.dmonolith
Fig. 2.17. Honeycomb monolith photocatalytic reactor for indoor air
purification (Raupp et al., 2001).
54
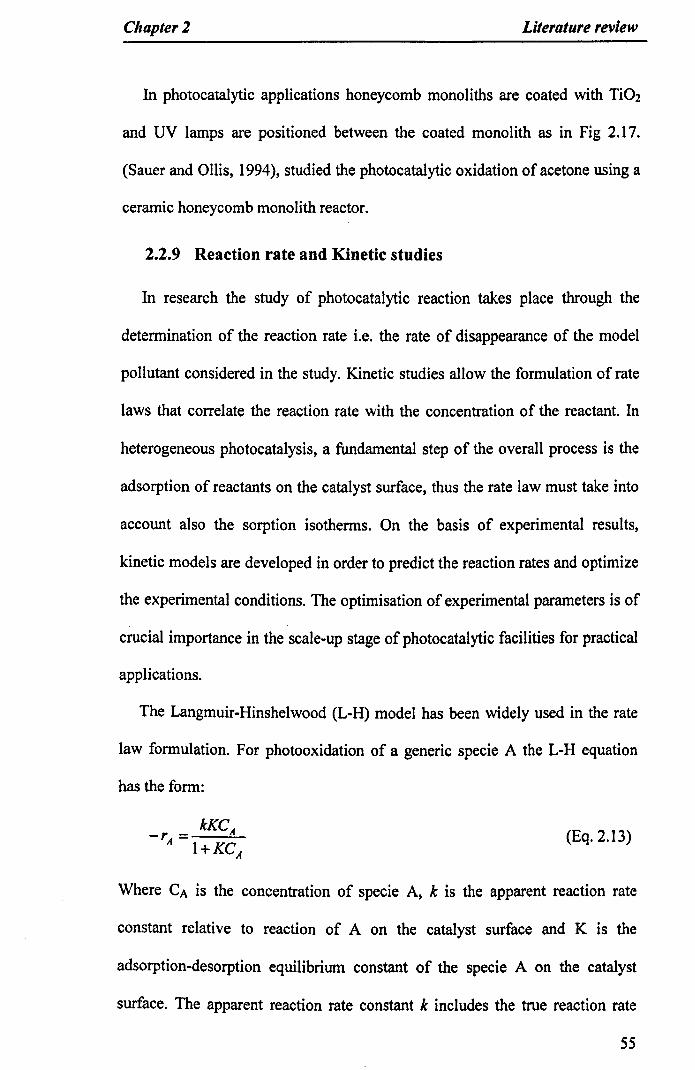
Chapter2 Literature review
In photocatalytic applications honeycomb monoliths are coated with Ti02
and UV lamps are positioned between the coated monolith as in Fig 2.17.
(Sauer and Ollis, 1994), studied the photocatalytic oxidation of acetone using a
ceramic honeycomb monolith reactor.
2.2.9 Reaction rate and Kinetic studies
In research the study of photocatalytic reaction takes place through the
determination of the reaction rate i.e. the rate of disappearance of the model
pollutant considered in the study. Kinetic studies allow the formulation of rate
laws that correlate the reaction rate with the concentration of the reactant. In
heterogeneous photocatalysis, a fundamental step of the overall process is the
adsorption of reactants on the catalyst surface, thus the rate law must take into
account also the sorption isotherms. On the basis of experimental results,
kinetic models are developed in order to predict the reaction rates and optimize
the experimental conditions. The optimisation of experimental parameters is of
crucial importance in the scale-up stage of photocatalytic facilities for practical
applications.
The Langmuir-Hinshelwood (L-H) model has been widely used in the rate
law formulation. For photooxidation of a generic specie A the L-H equation
has the form:
kKCA-r -----!!-A -1+KC
A
(Eq.2.13)
Where CA is the concentration of specie A, k is the apparent reaction rate
constant relative to reaction of A on the catalyst surface and K is the
adsorption-desorption equilibrium constant of the specie A on the catalyst
surface. The apparent reaction rate constant k includes the true reaction rate
55

Chapter2 Literature review
plus the contribution from the optical properties of the film, the relative
humidity and the intermediates (Salvado-Estivill et al., 2007b). The L-H
equation is often applied to describe the initial rate of degradation at time
equals zero as a function of the initial substrate concentration. The
extrapolation of the rate to time equals to zero simplifies the interpretation of
data, as it avoids all the possible interference from by-products. Less often the
L-H rate equation has been combined with the material and radiation balance
equations of the reactor to yield the dynamic or steady-state behaviour of the
system (Salvado-Estivill et al., 2007a).
The adsorption constant K can be obtained from the dark adsorption
isotherms of the catalyst. However, in many cases the so obtained values of K
differ from those obtained from kinetic data in the photocatalytic system
(Minero, 1999). The actual interpretation of kinetic constants values has been a
matter of debate. Thus, even if the two-parameters L-H model described in Eq.
2.13 offers a good fitting of experimental data, the values of the kinetic
constant are to be taken sceptically and not considered of physical significance
(Minero, 1999).
2.2.10 Factors affecting the reaction rate
In photocatalytic reaction, the reaction rate depends on several experimental
parameters such as reactant concentration, light intensity, relative humidity,
and temperature.
2.2.10.1 Light intensity
The relation between light intensity and reaction rate is expressed by the
following power law (Terzian and Serpone, 1995):
56

Chapter2 Literature review
r =kxJa (Eq.2.14)
In the linearised equation
Logr= a log I (Eq.2.15)
The value of a can be estimated by the linear regression of the data. It has
been reported that the reaction rate is proportional to light intensity (u=I) at
low intensity regime, while it is proportional to square root of light intensity
(a=0,5) at high intensity regime. At low light intensity the photon harvesting
is efficient and the electron-hole pairs formed are consumed by chemical
process, while at high light intensity the recombination of electron hole pairs is
considered the dominant process on catalyst surface (Zhao and Yang, 2003).
Obee and Brown studied the correlation between light intensity and reaction
rate for photodegradation of formaldehyde, toluene and 1,3-butadiene, finding
half order correlation at light intensities above 10-20 W1m2• In the case of TCE
photooxidatition in the gas phase, a first order correlation has been observed up
to 17 W/m2 (Jacoby et al., 1995) and recently up to 28.1 W/m2 (Salvado-
Estivill et al., 2007b).
2.2.10.2 Water vapour concentration
As reported in Fig 2.5, water is involved in the oxidation reaction at the
catalyst surface, forming the hydroxyl radicals, thus a certain level of relative
humidity in the gas reaction media is considered favourable. In absence of
water vapour, the photo-degradation of some substrates such as formaldehyde
and toluene is retarded and complete mineralisation is not achieved (Zhao and
Yang, 2003). However, high relative humidity leads to an inhibition of the
photo-oxidation rate. Water is easily adsorbed on ri02 surface, and it
57
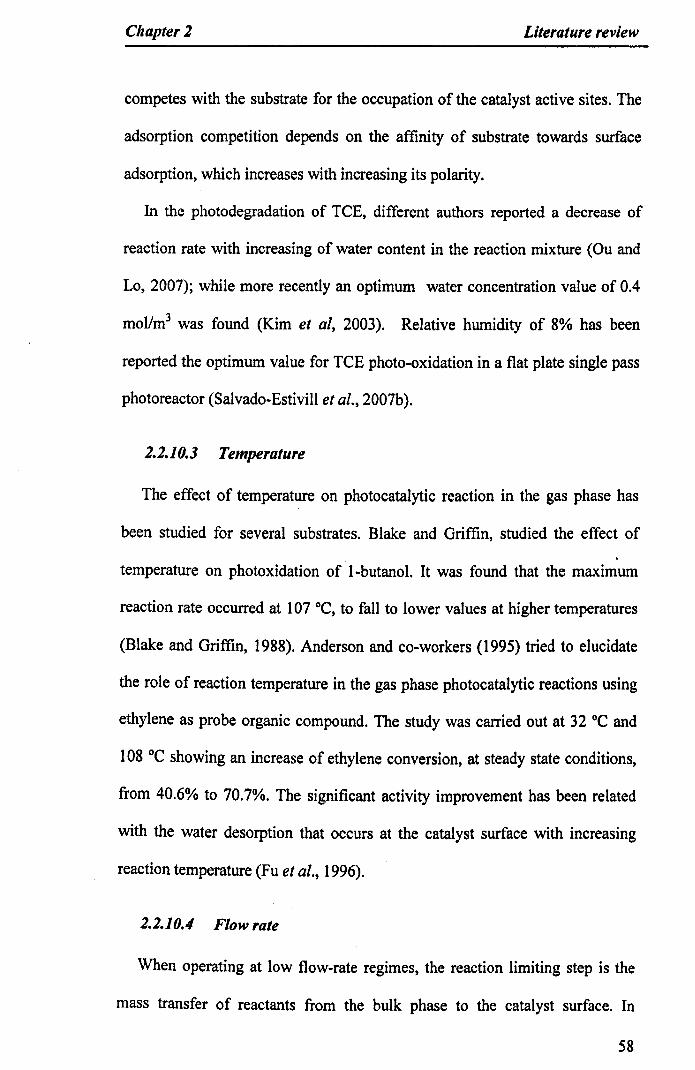
Chapter2 Literature review
competes with the substrate for the occupation of the catalyst active sites. The
adsorption competition depends on the affinity of substrate towards surface
adsorption, which increases with increasing its polarity.
In the photodegradation of TeE, different authors reported a decrease of
reaction rate with increasing of water content in the reaction mixture (Ou and
Lo, 2007); while more recently an optimum water concentration value of 0.4
mol/nr' was found (Kim et ai, 2003). Relative humidity of 8% has been
reported the optimum value for TeE photo-oxidation in a flat plate single pass
photoreactor (Salvado-Estivill et al., 2007b).
2.2.10.3 Temperature
The effect of temperature on photocatalytic reaction in the gas phase has
been studied for several substrates. Blake and Griffin, studied the effect of
temperature on photoxidation of l-butanol. It was found that the maximum
reaction rate occurred at 107 "C, to fall to lower values at higher temperatures
(Blake and Griffin, 1988). Anderson and co-workers (1995) tried to elucidate
the role of reaction temperature in the gas phase photocatalytic reactions using
ethylene as probe organic compound. The study was carried out at 32 "C and
108°C showing an increase of ethylene conversion, at steady state conditions,
from 40.6% to 70.7%. The significant activity improvement has been related
with the water desorption that occurs at the catalyst surface with increasing
reaction temperature (Fu et al., 1996).
2.2.10.4 Flow rate
When operating at low flow-rate regimes, the reaction limiting step is the
mass transfer of reactants from the bulk phase to the catalyst surface. In
58

Chapter] Literature review
condition of mass transfer control the reaction rate increases with the flow rate.
At sufficiently high flow rates the reaction rate is independent from the reactant
mass transfer and it is controlled by the surface reaction (kinetic control). In
order to minimise the mass transfer influence in the determination of reaction
rates and comparison of photocatalytic activities, a photocatalytic reactor
should be operated in the kinetic control flow rate regime. The determination
of the transition value from mass to kinetic control depends on experimental
conditions and reactor geometry. The kinetic regime for photodegradation of
TCE, was established at flowrates equal or higher than 300 mllmin for a
tubular packed bed reactor (Kuo-Hua Wang et al., 1998). In the flat-plate
photoreactor used in this study, the kinetic control was observed at flow-rates
higher than 1.72 Llmin (Salvado-Estivill et al., 2007b).
2.2.11 Mechanism ofTCE degradation
The first studies on TCE photodegradation on Ti02 in the gas phase showed
high rates of reactions with formation of C02 and HC} as photo-oxidation
products, but no byproducts or intermediates were identified in the reaction
effluent. However, by using 'direct sampling' techniques such as molecular
beam mass spectrometry and gas-phase Fourier transform infrared (FTIR)
several reaction intermediates such as dichloroacetaldehyde (DCAAD),
phosgene (COCh) carbon dioxide (C02), carbon monoxide (CO) and
molecular chlorine (Ch) were identified (Jacoby et al., 1994, Nimlos et al.,
1993, Alberici et al., 1998).
It is generally accepted that photocatalytic degradation of TCE over Ti02
produces DCAC as major by-products, which undergoes further oxidation to
59
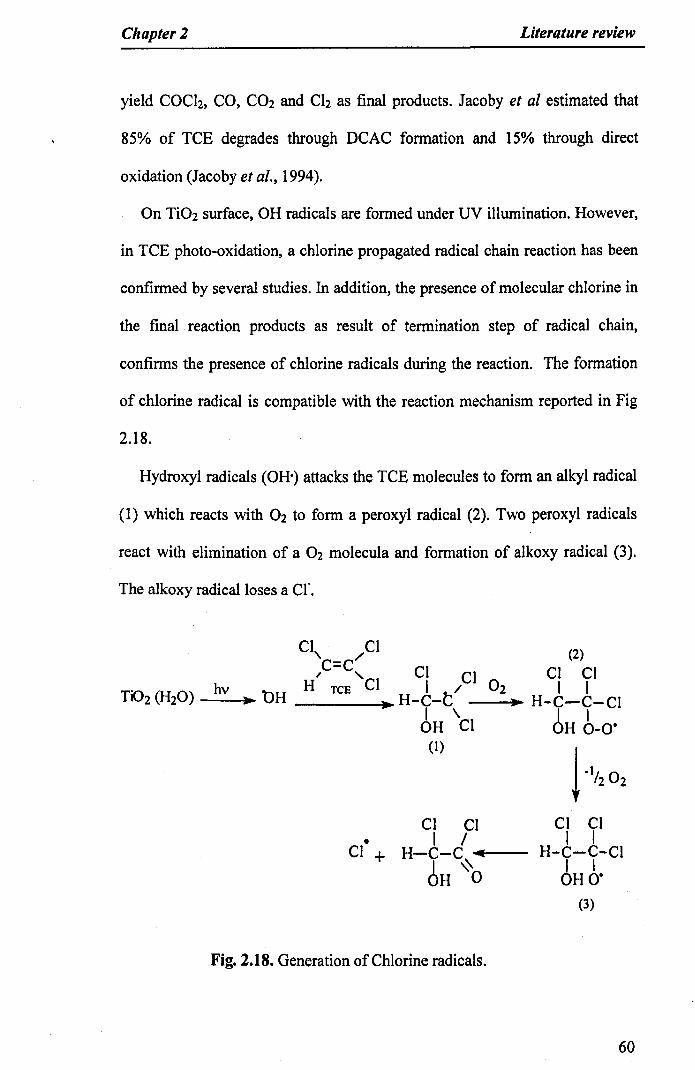
Chapter2 Literature review
yield COCh, CO, C02 and Ch as final products. Jacoby et al estimated that
85% of TCE degrades through DCAC formation and 15% through direct
oxidation (Jacoby et al., 1994).
On Ti02 surface, OH radicals are formed under UV illumination. However,
in TCE photo-oxidation, a chlorine propagated radical chain reaction has been
confirmed by several studies. In addition, the presence of molecular chlorine in
the final reaction products as result of termination step of radical chain,
confirms the presence of chlorine radicals during the reaction. The formation
of chlorine radical is compatible with the reaction mechanism reported in Fig
2.18.
Hydroxyl radicals (OH') attacks the TCE molecules to form an alkyl radical
(1) which reacts with 02 to form a peroxyl radical (2). Two peroxyl radicals
react with elimination of a 02 molecula and formation of alkoxy radical (3).
The alkoxy radical loses a Cr.
Cl, ClC=C/I "-
hv ,.. OH H TeE Cl
•Cl +
(2)
Cl Cl Cl ClI / 02 I I
H-C-t )II H-C-C-CI
6H 'Cl 6H 6-0·(1) !
-1/202
Cl ClI I
H-C-C-CII IOHO·
(3)
Cl ClI /
H-C-C .......i--I "OH 0
Fig. 2.18. Generation of Chlorine radicals.
60
Chapter2 Literature review
Following a similar chain reaction pattern, the Cl' radical attacks a TCE
molecule, until formation of the alkoxyl radical. The alkoxyl radical can
undergo Cl elimination through the equilibrium pathway (a) or undergo C-C
bond cleavage (pathway b) yielding phosgene and CICH.The branching ratio
for the two competing processes (a) and (b), depends upon the relative
strengths of the C-C and the C-CI bonds of the alkoxy carbon. The DCAC by-
product eventually forms phosgene by Cl' (or OH) attack via the reverse
reaction (a). TCE degradation is completed by phosgene decomposition to CO,
The involvement of chlorine radicals in photo-oxidation of chlorinated
hydrocarbons is also confirmed by the evidence that isooctane and toluene are
degraded much more efficiently in the presence of TCE as source of chlorine
atoms (Sauer M.L. et al., 1995) .
Cl, Cl er Cl Cl Cl ClC=C/ I / O2 I I, , --. ... H-C-t --.; ..... H-C-C-Cl
H TeE Cl tl 'Cl tl 6-0'!·',,0,Cl Cl
H-t-t-Cl
•Cl~ tl 6' ,,-(b)~(a) ~
Cl ClI I
H-C-Ctl ~
Cl, ClC'IIo
ClI
+ H-C·tl
DCAC PHOSGENE
Fig. 2.19. Mechanism of DCAC and Phosgene formation through Chlorine
attack on TCE.
61

Chapter 3
Analytical techniques
Chapter 3 Analytical techniques
3.1 Introduction
The physical and chemical properties of titania such as crystalline phase,
crystal and particle size, porosity and surface composition strongly influence
its effectiveness as photocatalyst (Section 2.1.4). Therefore, the accurate
characterisation of material's properties is of crucial importance for the
evaluation of titania preparation methods and interpretation of photoactivity
results.
In this chapter, the basic principles and concepts concerning the analytical
techniques used in this work for the characterisation of Ti02 photocatalysts are
briefly reported.
3.2 X-Ray Diffraction (XRD)
Titania exists in three main crystalline phases: anatase, rutile and brookite;
which show different photocatalytic properties (Section 2.1.4.1). X-ray
diffraction is a quick and reliable technique for the determination of titania
crystallographic properties.
X-ray diffraction (XRD) is a powerful and non-destructive technique for the
characterisation of solid materials. XRD technique takes advantage on the
coherent scattering of X-rays by crystalline and polycrystalline solids to obtain
a diffraction pattern, which is unique and can be considered as a fingerprint of
the material itself. This technique reveals a wide set of analytical and structural
information such as crystal phase composition, preferred orientation and
average crystallite size (Nefedov, 1988).
62

Chapter3 Analytical techniques
About 95% of all solids can be described as crystalline or polycrystalline. In
crystalline materials the atoms are organised in planes that form a three-
dimensional structure i.e. the crystal lattice. Most crystals can have many sets
of planes, each of them with a specific interplanar distance (Fig. 3.1). By
interaction of the atom planes with a focused X-ray beam, absorption,
transmission, refraction and diffraction phenomena occur. The pattern obtained
as result of the interference of diffracted waves reflects the crystallographic
properties of the material.
'all;"! .-.,_.-'.
" .. iii Ii IIIi • Ii'
Fig. 3.1. Different planes and correspondent interplanar distances d., d2 and d,
existing within a crystal.
X-rays are electromagnetic radiation characterised by high quantum energy
and very short wavelength. For diffraction application onlyhard X-rays in the
range of 1 keV-120 keV, which correspond wavelength from few angstrom to
0.1 A, are used. X-rays are produced by bombarding a solid target, usually
copper or molybdenum, with a focused electron beam accelerated across a high
voltage field. The wavelength of the X-rays obtained is characteristic of the
nature of the target used, for example Cu emits 8 keY X-rays with
corresponding wavelength of 1.54 A, while Mo emits 14 keY Xrays with
correspond wavelength of 0.8 A. The wavelength in this range, are comparable
with the distance separating ions or atoms in a crystal, and causes a crystal to
diffract an X-ray beam passing through it (Warren, 1990).
63

Chapter3 Analytical techniques
In a laboratory instrument, the X-rays are produced in a sealed tube under
vacuum, collimated and directed on the sample surface. A detector detects the
diffracted X-ray waves and the signal is then processed and converted to a
count rate.
3.2.1 The Bragg's law
The Bragg's Equation (Eq. 3.1) solves the relationship between wavelength,
atomic spacing (d) and angle e in X-ray diffraction. It was derived by the
English physicists Sir W.H. Bragg and his son Sir W.L. Bragg in 1913.
nA = 2d sinu (Eq.3.1)
The variable d is the distance between atomic plans in a crystal, A is the
wavelength of the incident X-ray beam; e is the diffraction angle and n is an
integer (Atkins, 1998).
Bragg's Law can be derived from geometrical analysis of the conditions
necessary to make the phases of the beams coincide, when the incident angle
equals the reflecting angle. Consider two planes separated by a distance d and
an X-ray beam incident on the planes as shown in Fig. 3.2. The two parallel
incident rays 1 and 2 make an angle e with these planes.
z
BA B
Fig. 3.2. Geometrical derivation of the Braggs' Law.
64

Chapter3 Analytical techniques
A reflected beam of maximum intensity will result if the waves represented by
1' and 2' are in phase. The difference in path length between 1 to l' and 2 to 2'
(AB+BC) must then be an integral number of wavelengths, A.
nA.=AB +BC (Eq.3.2)
Recognizing d as the hypotenuse of the right triangle ABz, trigonometry can be
used to relate d and e to the distance (AB + BC).
AB =d sin~
Because AB = BC eq. (3.3) becomes:
nA=2AB
(Eq.3.3)
(Eq 3.4)
Finally, the Bragg's law equation is obtained by substituting Eq. 3.3 in Eq. 3.4
nA= 2 d sine
3.2.2 Scherrer's Equation
The use of Scherrer's equation is the simplest method to calculate the
crystallite size from the XRD pattern. It is performed by measuring the
broadening of a particular peak associated with a particular planar reflection
from within the crystal unit cell. Crystalline size is inversely related to the full
width at half maximum (FWHM) of an individual peak. The narrower the peak,
the larger is the crystallite size. This is due to the periodicity of the individual
crystallite domains in phase reinforcing the diffraction of the X-ray beam, thus
resulting in a tall narrow peak. If the crystals are defect free and periodically
arranged, the X-ray beam is diffracted to the same angle even through multiple
layers of the specimen. If the crystals are randomly arranged or have low
degrees of periodicity, and the result is a broader peak.
6S

Chapter3 Analytical techniques
Scherrer's equation can be derived from Bragg's law by multiplying both
sides ofEq. 3.1 by an integer m such that md=t, the thickness of the crystal:
rnA. = 2 md sinO= 2t sinO (Eq.3.5)
Differentiating both sides ofEq. 3.5:
2.M sinO+ 2t cos0!10= 0 (Eq.3.6)
The thickness of the crystal tis:
t = I1t sinOcos0!10
(Eq 3.7)
Since the smallest increment in t is d, using !1t=d
t = dsinOcos0!10
(Eq.3.8)
Substituting 2!19 with the angular width B and dsinO with ')J2 (from Bragg's
law) we obtain the Scherrer's equations:
t= ABcosO
(Eq.3.9)
A more sophisticated analysis of the problem adds a prefactor of 0.89 to the
right hand side of Eq. 3.9 and leads to the correct Scherrer's equation (Eq.
3.10) (Atkins, 1998).
t=0.89 ABcosO
(Eq.3.10)
3.3 Nz adsorption-desorption studies
3.3.1 Introduction
In heterogeneous photocatalysis process, the adsorption of reactants on the
66

Chapter3 Analytical techniques
catalyst surface is a key step. Therefore, the characteristics of the catalyst
surface that influence the adsorption process are of fundamental importance.
Porosity and surface area determine the contact between active sites and
reactants at the catalyst surface. Materials with porous structure are believed to
facilitate the transportation of reactants to the catalyst surface (Yamazaki-
Nishida et al, 1996). In materials with large surface area, the adsorption rate of
reactants and the number of active sites at the catalyst's surface increase
(Section 2.1.4.2). The study of the gas adsorption properties allows the
determination of surface area, pore size distribution and quality of pores.
According with the pores mean diameter d, a solid can be classified in
microporous (d<2 nm), mesoporous (2<d<50 nm) and macroporous (d>50
nm). Adsorption is a process that occurs when a molecule (the adsorbate)
bonds to the surface of a solid (the adsorbent). Depending on the type of
bonding forces involved, the adsorption can be classified in two broad
categories: physisorption and chemisorption (Ruthven, 1984). Physisorption is
a general process that occurs at every gas-solid interface and the interactions
between adsorbate and adsorbant involve long-distance, weak 'Van der Waalls'
forces. These interactions lead to multilayer surface coverage characterized by
enthalpy comparable to condensation enthalpy of the adsorbate (Attard, 1998).
Physisorption is of associative type and it is usually reversible (desorption
process). On the other hand, chemisorption occurs through the creation of a
chemical bond (ionic or covalent) between adsorbate molecule and specific
surface sites on the adsorbant. Hence, chemisorption is characterized by
chemical specificity and high enthalpy. The saturation point is the monolayer
formation. If the adsorbant is a molecule, a dissociative process with molecule
67
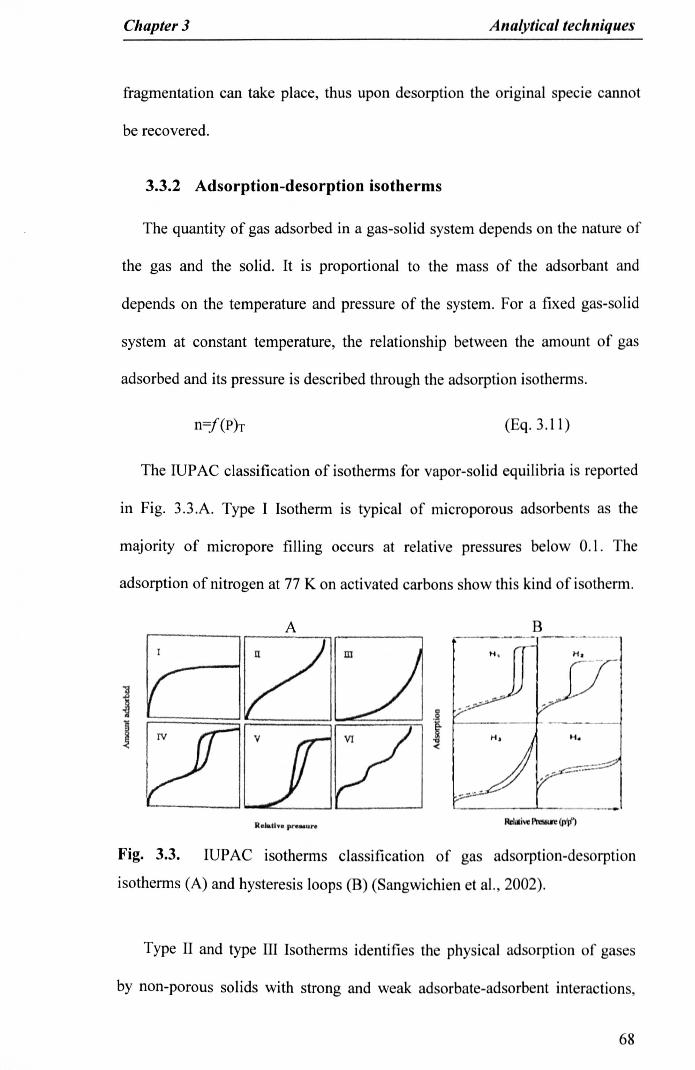
Chapter3 Analytical techniques
fragmentation can take place, thus upon desorption the original specie cannot
be recovered.
3.3.2 Adsorption-desorption isotherms
The quantity of gas adsorbed in a gas-solid system depends on the nature of
the gas and the solid. It is proportional to the mass of the adsorbant and
depends on the temperature and pressure of the system. For a fixed gas-solid
system at constant temperature, the relationship between the amount of gas
adsorbed and its pressure is described through the adsorption isotherms.
n=f(ph (Eq. 3.11)
The IUPAC classification of isotherms for vapor-solid equilibria is reported
in Fig. 3.3.A. Type I Isotherm is typical of microporous adsorbents as the
majority of micropore filling occurs at relative pressures below 0.1. The
adsorption of nitrogen at 77 K on activated carbons show this kind of isotherm.
A B
J«
R .... Il .. pr .... ":re
Fig. 3.3. IUPAC isotherms classification of gas adsorption-desorption
isotherms (A) and hysteresis loops (B) (Sangwichien et aI., 2002).
Type II and type III Isotherms identifies the physical adsorption of gases
by non-porous solids with strong and weak adsorbate-adsorbent interactions,
68

Chapter3 Analytical techniques
respectively. Type N and V isotherms present a hysteresis loop, which is
associated with the presence of mesopores. Type V correspond to weak
adsorbate-adsorbent interactions and is quite rare. The filling of mesopores
occurs through a capillary condensation mechanism (Sing, 2001).Since the
capillary condensation occurs' at higher pressures than the capillary
evaporation, the hysteresis loop is observed.
The hysteresis loops may exhibit different shapes as shown in Fig. 3.3.B
(Sangwichien et al., 2002). In type HI, the hysteresis loop is narrow, with the
adsorption and desorption branches almost vertical and nearly parallel,
indicating a narrow pore-size distribution. Type HI has been associated with
porous materials made from agglomerates of spherical shape uniform in size
dimension. The type H2 loop is broad with a desorption branch much steeper
than the adsorption branch. Type H2 can be found in systems with a broad
distribution of pore sizes and pore shapes within the material. It is believed that
this kind of loop results from pores with narrow necks and wide bodies (ink-
bottle shape) or when the porous material has an interconnected pore network.
The type H3 loop does not exhibit any plateau at high relative pressures,
indicating significant adsorption. This shape is associated with aggregates of
plate-like particles that give rise to slit-shaped pores. Finally, the type H4 loop
is nearly horizontal and parallel over a wide range of relative pressures and is
associated with narrow slit-like pores (Sangwichien et al., 2002). Inconclusion,
Type VI Isotherm occurs rarely and presents steps due to the formation of
monomolecular layers.
69
Chapter3 Analytical techniques
3.3.3 Surface area calculation: Langmuir and BET methods
Adsorption has been widely studied in the past two centuries and several
mathematical models have been developed to fit adsorption isotherms.
Langmuir published a isotherm model based on an adsorption kinetic
mechanism which is based on the following assumptions:
1) The surface of the solid is uniform and all surface adsorption sites are
equivalent.
2) The interaction between adsorbed molecules is negligible.
3) The adsorption takes place through the same mechanism.
4) The maximum adsorption corresponds to the formation of a monolayer
on the solid surface.
The Langmuir equation is:
V bP(Eq.3.12)-=--
Vm l+bP
Where V is the amount of adsorbate adsorbed, Vm is the monolayer capacity of
the adsorbent, P is the pressure of the system and b is the Langmuir constant
(Langmuir, 1918). From Eq. 3.12 is possible to calculate the Langmuir surface
area of the adsorbent (A) using the formula:
(Eq.3.13)
Where L is the Avogadro's constant and am is the average area occupied by one
molecule of adsorbate. In case of'N, at 77K am= 0.162 nm2 (Sing, 2001).
The major restriction for the use of the Langmuir adsorption is the
assumption of a monolayer formation, which limits its applicability to
70

Chapter] Analytical techniques
physisorption systems. The Langmuir isotherm is generally considered valid
for chemisorption processes where the monolayer coverage approximation is
realistic.
Brauner, Emmett and Teller in 1938 modified the Langmuir model
introducing the concept of multilayer adsorption (Brunauer et al., 1938). The
assumptions made in the BET model are (Sing, 2001):
I) The molecule in the first coverage layer act as sites for molecule in the
second layer and so on for molecule in higher layers.
2) No lateral interaction between adsorbate molecule are allowed.
3) At equilibrium, the rates of condensation and evaporation are equal for
each individual layer.
4) An infinite number of layer can be obtained.
The resulting BET equation is:
P =_1_+ (C+I)x~V(Po-P) VmC VmC Po
(Eq.3.14)
Where V is the volume adsorbed, Vm is the volume adsorbed correspondent to
the monolayer formation, P is the pressure of the system, Po is the saturation
pressure of the gas at the temperature of analysis and C is a constant related to
the enthalpy of adsorption of the first monolayer.
Practically, the measurement occurs by using a discontinuous method,
where the quantity of gas adsorbed (N2 at 77K) and the corresponding sample
relative pressure PlPo are measured point by point and used to fit Eq. 3.14.
The BET surface area can be calculated from Vrn value, by applying Eq. 3.13.
71

Chapter 3 Analytical techniques
Due to the assumptions in the BET theory, the linearity of BET equation is
limited to a small portion of the N2 adsorption isotherm, usuall for partial
pressures P/Po<O.3.
3.3.4 Pore volume and pore size distribution: BJH model
Classical mesopores size distribution calculations are based on the analysis
of the desorption branch of a type IV isotherm. The most common methods
utilises the BJH theory (Barrett, Joyner and Helanda, 1951). It assumes a
mono-multilayer formation in the mesopores and subsequent capillary
condensation. This mechanism is illustrated below in Figure 3.5.
(a) (b)
Fig. 3. 4. Mechanism of capillary condensation (a) low P/Po; (b) high P/Po.
Kelvin equation (3.15) predicts the partial pressure at which the gas
condenses (or evaporates) in a cylindrical pore of a given size r. In this
equation y is the surface tension of adsorbed gas. Eq. 3.15 is used to obtain a
relationship between P/Po and r, which in case of'N, is equal to Eq. 3.16.
In_!_'= 2rVmPo rRT
(Eq. 3.15)
In_!_' = -4.14Po r
(Eq.3.16)
The BJH approach calculation of adsorbed volume, utilises the desorption
branch, thus starts at P/Po=l, assuming that all pores are filled. The desorption
72

Chapter3 Analytical techniques
process is assumed to occur through capillary evaporation from the interior of
the pore, progressively decreasing the radius r. When PIPOt (to which
correspond r.) is lowered to PIP02, (to which correspond r2), a volume V will
desorb from the surface. The pore volume of the largest pore is given by:
Vi = v[ rl ]2P Ilt
r2+-2
(Eq.3.17)
3.4 Electron Microscopy
Ti02 nanoparticles were prepared and studied in this work. Electron
microscopy techniques are widely used in nanotechnology and nanoscience
research to yield information about the topography, morphology, composition
and crystallographic characteristics of nanoparticles and nanostructured
materials (Flegler et al., 1993).
Electron microscopes were developed to address the resolution limitations
of optical microscopy.
The Rayleigh criterion defines the resolution of light microscope as:
0= 0,61AJ.lsinfJ
(Eq.3.18)
Where: A. is the wavelength of the radiation, Jl is the refractive index of the
view medium and P is the semi-angle of collection of the magnifying lens
(Flegler et al. 1993). The resolution is mainly decided by the wavelength of the
radiation source, and for optical microscopy it corresponds to 0.2 um.
An electron microscope operates on the same basic principles as the optical
microscope but uses beam of highly energetic accelerated electrons instead of
73
Chapter3 Analytical techniques
visible radiations, in order to achieve a very high resolution. The De Broglie
relationship (Eq. 3.18) where h is Planck's constant, m, v and A. are the mass,
velocity and wavelength of the particle respectively, indicates that the faster the
electron the shorter is the wavelength, thus the higher is the resolution. In
addition, electrons can be refracted easily, using magnetic fields, in order to
form an image (FIeger et al. 1993).
hA=-mv
(Eq 3.18)
In electron microscopies, the electron beam is provided by an electron gun.
A commonly used 'electron gun in modem instruments is the thermoionic gun.
In the thermoionic electron gun a compound with high melting point and low
work function (e.g. tungsten, LaB6 or CeB6) is heated to provide the electrons
enough thermal energy to overcome the work function of the source and be
emitted. The emitted electrons are then given velocity and directed towards the
specimen by an electrical field. To avoid interactions between the electrons and
air all the system works under ultra high vacuum conditions (10-7_10-9 torr).
3.4.1 Scanning Electron Microscopy (SEM)
Scanning electron microscopy is a surface analysis technique that provides
images of samples on a microscopic scale. It was used for the investigation of
morphology of catalysts surface and the evaluation of particle size shape and
dimension.
In SEM the electron beam focuses on the surface of the sample over a very
small area, and it is scanned over the entire specimen. The interaction between
the electron beam and the specimen causes different effect like secondary
electrons emission, electron backscattering, catholuminescence or X-rays
74

Chapter3 Analytical techniques
emission. All these effects can be used to produce an image using a suitable
detector that produces an electrical signal. This signal is finally processed and
amplified to generate a point of brightness on the screen. The image is built up
scanning the electron beam on the sample in synchrony with the scan on the
screen.
A schematic drawing of a scanning electron microscopy is given in Fig 3.5.
ilh.unin:lling
~~:.~..~~~!~:.~
....'.Jll·t>il~
Fig. 3.5. Schematic drawing of a scanning electron microscope with secondary
electrons forming the images on the TV screen (Perkes, 2008).
In SEM the magnification of the image is obtained controlling the ratio of
the area scanned of the specimen to the area of the screen. Increasing of
magnification is achieved quite simply by scanning the electron beam over
smaller area of specimen. Conductivity and vacuum compatibility are the only
special requirements for the sample. Insulating or semiconductive samples
must be coated either with carbon or gold thin films.
3.4.2 Transmission Electron Microscopy (TEM)
In the frame of this work, TEM technique was used to determine the crystallite
size of titania and confirm the data obtained by the application of Scherrer's
equation on the XRD patterns. The transmission electron microscope was first
75

Chapter 3 Analytical techniques
developed in the 1930's and nowadays is one of the most powerful surface
techniques. Different kinds of information can be achieved by TEM analysis:
the morphology of the sample, the crystallite size, shape and arrangement of
the particles. Moreover, crystallographic information and the detection of
atomic-scale defects is possible. Finally, if so equipped also the composition of
the specimen can be studied. The electrons emitted from the electron gun are
accelerated by high voltage (50 and 150 kV). The accelerated ray of electrons
is focused on the specimen by a serie of electronic coils generating an
electromagnetic field. It then passes through the object, where it is partially
transmitted. As the electron beam passes through the specimen, some electrons
are scattered whilst the remainder are focused by the objective lens either onto
a phosphorescent screen or photographic film to form an image.
SOli''''' 0" Bor,uo
,v ~~( a.Hl(,ul~".... 11';1 "
"
Fig. 3.6. TEM's instrument scheme.
The higher resolution achievable with a modem IEM microscope is 0,5-0,1
nm. However, the power of resolution of electron microscopy is usually
controlled by the quality of the lens-systems. Materials for TEM must be
specially prepared to thicknesses, which allow electrons to transmit through the
sample (Flegler et al., 1993).
76

Chapter3 Analytical techniques
3.5 X-Ray Photoelectron Spectroscopy (XPS)
X-ray Photoelectron Spectroscopy is a quantitative spectroscopic technique
that measures the elemental composition and chemical state of the elements
within a solid surface. The technique is based on the photoelectric effect,
described by Einstein in 1905, where valence or inner shell electrons are
ejected from a surface due to absorption of photons of appropriate energy
(Watts,2003).
In XPS the sample is illuminated with soft X-rays in ultrahigh vacuum
conditions. AlKa (1486.6eV) or MgKa (1253.6eV) are often used as
monochromatic sources of photons. By interaction with the photons, core
electrons are emitted from the specimen (photoelectrons).
2p (L,.3) --- ........
2s(Ll) .,_-
?'''v0.)IV • photoelectronlstK) ~
Fig. 3.7. Diagram describing the photoelectric effect.
The ejected photoelectrons are characterized by kinetic energy that depends
on its provenance shell. Thus, for a given element, electrons with a variety of
kinetic energies are ejected because of the different energies associated with
each shell. The kinetic energy of the photoelectrons is measured and converted
to the binding energy BE with Eq. 3.19 and it is equal to the energy of the
exciting radiation (hv) minus the binding energy (BE) of the electron minus the
work function ~ of the material.
Ek= hv-BE-~ (Eq.3.19)
77
Chapter3 Analytical techniques
The XPS spectra is a plot of the intensity (counts of electrons) versus the
BE. The binding energies of the core electron of an element have a unique
value, which allows the identification of the chemical composition.
Furthermore, the binding energy of core electron is very sensitive to the
chemical environment of the element. In fact, if the same atom is bonded to the
different chemical species, the binding energy of its core electron is different.
The variation of binding energy results in the shift of the corresponding XPS
peak, ranging from O.leV to IOeV. This effect known as "chemical shift" is
used to identify the chemical status of elements in the surface (Watts).
78

Chapter 4
Methodology

Chapter4 Methodology
4.1 Catalyst preparation
4.1.1 Materials and chemicals
All chemicals and solvents used in the syntheses were supplied by Fluka
and were used without any further purification. Ultrapure water was obtained
by Nanopure Diamond ultrapure water system (water conductivity: 18.2 MQ-
cm). Commercial Ti02 P-25 was supplied by Degussa.
4.1.2 Pristine TiOz catalysts
4.1.1.1 Amorphous TiD]: synthesis route 1
A solution of 30 ml of Titanium isopropoxide, TIP (Fluka, purity 99,9%) in
20 ml of isopropanol was slowly dropped to mixture of 49 ml of isopropanol
and 11 ml of water. The addition was conducted in air, under continuous
magnetic stirring, dropping the precursor very slowly using an addition funnel
equipped with pressure equalizer that guarantees the drop's homogeneity
during the addition time. The white suspension obtained was kept under
stirring for one hour, to allow the hydrolysis-condensation reaction to occur.
The solid was filtered under vacuum through a sintered funnel of porosity 4,
washed thoroughly with ethanol and dried in the oven at 80° C overnight. The
solid obtained were grounded for further treatment. The reaction yield was
about 80-85%. Amorphous powders obtained by synthesis route 1 gave rise to
sample TTOI-TT04 and HYOI-HY04.
79

Chapter4 Methodology
4.1.2.2 Amorphous Ti01: synthesis route 2
A solution of 5 ml of Titanium isopropoxide, TIP (Fluka, purity 99,9%) in
25 ml of ethanol was slowly added dropwise to a mixture of 25 ml of ethanol,
0.5 ml H20 and 0.5 ml HCI 0.1 M. Same as in Route 1.
Amorphous powders obtained by synthesis route 2 gave rise to samples
TTA03 and TTA04.
4.1.2.3 Amorphous Ti01: synthesis route 3
A solution of30 ml of Titanium isopropoxide, TIP (Fluka, purity 99.9%) in
20 ml of isopropanol was slowly dropped to mixture of 270 ml of ethanol, 5 ml
of water and 0.7 ml of glacial acetic acid. Same as in Route 1.
Amorphous powders obtained by synthesis route 3 gave rise to samples
TTAOI and TTA02.
4.1.2.4 Thermal treatment
Thermal treatments on amorphous powders were carried out using a
multistep programmable furnace (Carbolite CWF 1100). 3g of amorphous
powder were placed in a ceramic crucible and calcined at temperatures
between 400 and 600°C. Target temperature was reached using a ramp rate of
5°C/min, and kept for a period between 3 and 5 hours depending on the
sample. The furnace was then allowed to cool down naturally to room
temperature. After calcination, samples were ground and stored in a dessiccator
for characterisation.
80

Chapter4 Methodology
4.1.2.5 Hydrothermal treatment
A small amount of amorphous powder (0.6-0.8 g) was added to a mixture of
water and isopropanol in different proportions. The quantity of water in the
mixture expressed in molar fraction was varied between 0.59 and 0.88. The
suspension was sonicated in water bath for 10 minutes, until homogeneity was
reached, then it was transferred in alSO ml Teflon lined autoclave vessel,
sealed (PTFE-4748, Parr Scientific) and heated in oven at 150°C for 8 hours.
After treatment in the oven, the system was allowed to cool at room
temperature and the solid obtained was filtered under vacuum through a glass
sintered of porosity 4, washed twice with water, ethanol and acetone
respectively. The solid was dried at 50°C for 2 hours, ground and stored in
dessiccator for characterisation.
4.1.3 N-doped Ti02
4.1.3.1 Method 1:N insertion during sol-gel
A solution of 15 ml of Titanium isopropoxide, TIP (Fluka, purity 99,9%) in
20 ml of isopropanol was slowly dropped to mixture of 24 ml of isopropanol,S
ml of water and 5 ml of NH3 26%. The suspension obtained was kept under
stirring for one hour, to allow the hydrolysis-condensation reaction to occur.
The solid was filtered under vacuum through a sintered funnel of porosity 4,
washed thoroughly with water until neutral pH of water phase, then rinsed with
ethanol and dried in the oven at 80° C overnight.
81

Chapter4 Methodology
4.1.3.2 Method 2: N insertion on amorphous Ti02
Amorphous Ti02 was prepared by following the synthesis route 1. 3 g of
amorphous Ti02 powder were suspended in a solution of 5 ml of NH3 26% in
isopropanol or 5 ml triethylamine (NEt3) in isopropanol and left under vigorous
stirring at room temperature overnight. The powder was recovered by vacuum
filtration on a sintered funnel of porosity 4, washed thoroughly with water until
neutral pH of water phase and dried in the oven at 110° C for 3 hours.
4.1.3.3 Method 3: hydrothermal synthesis
1.5 g of Titanium oxisulfate (TiOS04) were mixed with a solution of 2.5 ml
of NH3 26% in 100 ml of water:isopropanol 1:3 (pH=12). The mixture was
placed in the 150 ml Teflon line autoclave vessel (PTFE-4748, Parr Scientific)
and heated in the oven at 120°C for 12 hours. The powder obtained was
filtered under vacuum, on a sintered funnel of porosity 4, washed thoroughly
with water until neutral pH of water phase and dried in air overnight. Powders
were treated by thermal process following procedure reported in section
4.1.2.4.
4.1.4 Ti02IW03 composites
A novel synthetic route was developed and optimised for these materials.
Titanium oxysulfate (TiOS04) and ammonium metatungstate hydrate
«(NH4)6(W12041)·xH20) were used as precursors for Ti02 and W03
respectively. Appropriate amount of precursors were mixed with 100 ml of
H20, ethanol or a mixture of the two solvents in different proportions. The
suspension was transferred in a 1SO ml Teflon lined autoclave vessel (PTFE-
82

Chapter4 Methodology
4748, Parr Scientific) and reacted solvothermically in oven. After reaction the
solid obtained was recovered by filtration using a sintered funnel of porosity 3,
washed thoroughly with copious amount of water, followed by acetone. The
solid was dried in the oven at 50 °C for 1 h, and left cooling in a desiccator.
The powder was grounded, and stored in dessiccator for characterisation. To
optimise the synthetic process, three reaction variables were considered:
solvent composition, reaction temperature and reaction time. Each sample was
prepared twice to assure consistency in the preparation method.
4.1.4.1 Synthesis optimisation
To study the effect of solvent composition, the hydrothermal reaction was
carried out in pure water, pure ethanol and in mixtures of H20lEthanoi varying
the water content from 30 to 70%. The reaction was carried out at 150 °C for
24 hours.
The effect of reaction temperature was studied keeping solvent composition
at constant water-ethanol ratio 1:1 and varying reaction holding time between 4
and 24 hours at 150 °C.
The effect of WOJ loading was studied in the range 0-40% wt, carrying out
the reaction for 12h at 150 °C with water ethanol ratio 1:1.
4.2 Characterisation
4.2.1 X-ray diffraction
X-ray diffraction (XRD) was performed using a HILTONBROOKS X-ray
powder diffraction instrument, using (Cu radiation at 1.5406 A) graphite
monochromator, a scan speed of 2 degrees 29 per minute, scan ranging from 5-
83

Chapter4 Methodology
80 degrees 2e. Diffraction peaks were identified according with the Joint
Committee on Powder Diffraction Standards (JCPDS).
The mean particle size of the samples was calculated using Scherrer's
equation from broadening of (101) anatase peak.
When necessary, the content of rutile was calculated by using the following
equation:
(Eq.4.1)
where: IR and lA are the (110) rutile peak and the (101) anatase peak intensities
respectively ..
4.2.2 Absorption analysis
N2 adsorption-desorption isotherms at -196°C were recorded using a
Micrometries ASAP 2010 or a Micrometries ASAP 2020. All samples were
degassed overnight at 110°C prior analysis. The surface areas were calculated
using a multipoint BET method using the absorption data in the partial pressure
(PlPo) range between 0.05 and 0.35. BJH method was used to determine the
porosity ofthe samples in the range 2-300 run.
4.2.3 Microscopy studies
Scanning Electron Microscopy (SEM) images were collected from a FEI
XL30 scanning electron microscope fitted with a LaB6 electron gun utilising
a beam with accelerating voltage of 20kV. Samples for SEM analysis were
gold coated to assure good conduction using a Poalron-SOOsputter coater.
84
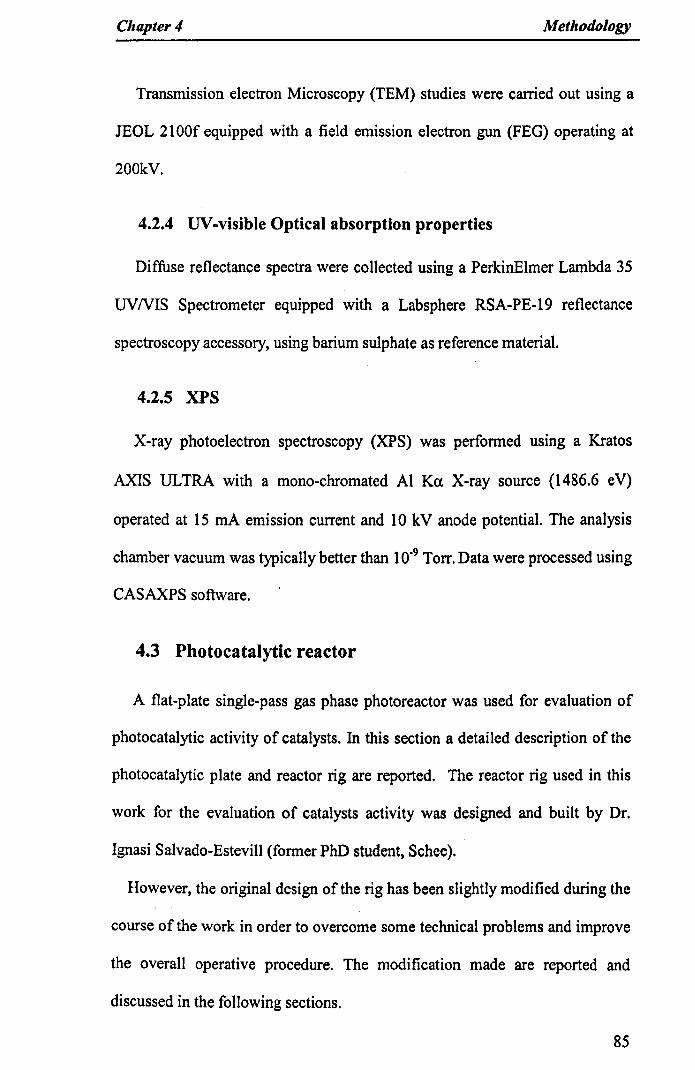
Chapter4 Methodology
Transmission electron Microscopy (TEM) studies were carried out using a
JEOL 2100f equipped with a field emission electron gun (FEG) operating at
200kV.
4.2.4 UV-visible Optical absorption properties
Diffuse reflectance spectra were collected using a PerkinElmer Lambda 35
UVNIS Spectrometer equipped with a Labsphere RSA-PE-19 reflectance
spectroscopy accessory, using barium sulphate as reference material.
4.2.5 XPS
X-ray photoelectron spectroscopy (XPS) was performed using a Kratos
AXIS ULTRA with a mono-chromated Al Ka. X-ray source (1486.6 eV)
operated at 15 rnA emission current and 10 kV anode potential. The analysis
chamber vacuum was typically better than 10.9Torr. Data were processed using
CASAXPS software.
4.3 Photocatalytic reactor
A flat-plate single-pass gas phase photoreactor was used for evaluation of
photocatalytic activity of catalysts. In this section a detailed description of the
photocatalytic plate and reactor rig are reported. The reactor rig used in this
work for the evaluation of catalysts activity was designed and built by Dr.
Ignasi Salvado-Estevill (former PhD student, Schee).
However, the original design of the rig has been slightly modified during the
course of the work in order to overcome some technical problems and improve
the overall operative procedure. The modification made are reported and
discussed in the following sections.
85
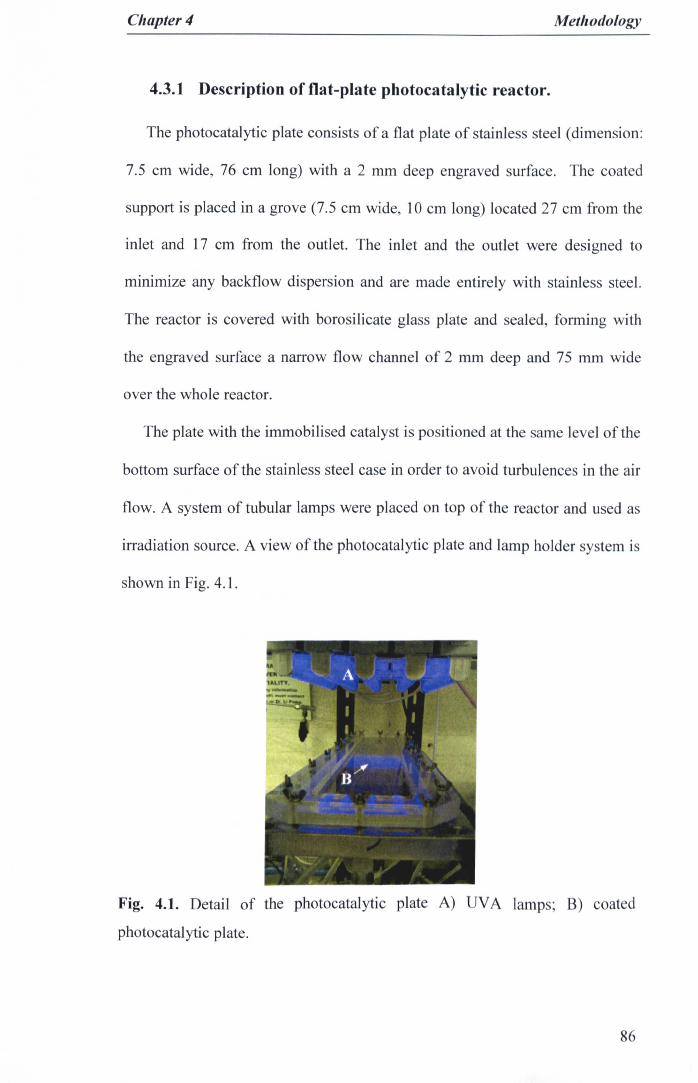
Chapter4 Methodology
4.3.1 Description of flat-plate photocatalytic reactor.
The photocatalytic plate consists of a flat plate of stainless steel (dimension:
7.5 cm wide, 76 cm long) with a 2 mm deep engraved surface. The coated
support is placed in a grove (7.5 em wide, 10 em long) located 27 em from the
inlet and 17 em from the outlet. The inlet and the outlet were designed to
minimize any backflow dispersion and are made entirely with stainless steel.
The reactor is covered with borosilicate glass plate and sealed, forming with
the engraved surface a narrow flow channel of 2 mm deep and 75 mm wide
over the whole reactor.
The plate with the immobilised catalyst is positioned at the same level of the
bottom surface of the stainless steel case in order to avoid turbulences in the air
flow. A system of tubular lamps were placed on top of the reactor and used as
irradiation source. A view of the photocatalytic plate and lamp holder system is
shown in Fig. 4.1.
Fig. 4.1. Detail of the photocatalytic plate A) UVA lamps; B) coated
photocatalytic plate.
86

Chapter 4 Methodology
UV -A irradiation was achieved by using blacklight blue fluorescent lamps
(Philips TL 8W/08 F8 T5/BLB). The lamps emit between 343 and 400 nm with
a maximum irradiance peak at 365 nm.
UV
20
1\\t\
V \'AISO 400100
Visible~ 0.12
~ 0.10
ll08i~·06~ !J.04i0.02
~ 0.003SO
~ .I
A UI J r-,400 4SO SOO 550 600
W~velength • nm
650 700 750
Fig. 4.2. Emitting spectrum of UV light source (blacklight blue fluorescent
lamps Philips TL 8W/08 F8 T5/BLB) and visible light source (Sylvania
halophosphor fluorescent lamps F8WI154 Daylight)
4.3.2 Reactor rig set-up
4.3.2.1 Original set up
A diagram of the original experimental set up is reported on Fig. 4.3. A
three way valve V I allowed to select between N2, which was used to flow the
system before and at the end of experiment for cleaning purposes; and the
synthetic air (BOC 20% O2, 80% N2), used as carrier gas. The gas-feeding
stream was divided in three lines: two of them formed the dry stream pa sing
through two identical flowmeters FDI and FD2(0-1.222 Llmin, Cole-Parmer),
while the third line was used to crea.te a wet stream bubbling carrier gas in a
water saturator kept at constant temperature (30°C) in a water bath. Flowmeter
Fw (0-0.264 Llmin, Cole-Parmer) was used to control the inlet flow to water
saturator. The gas streams rejoined before the pollutant injection point. The
87
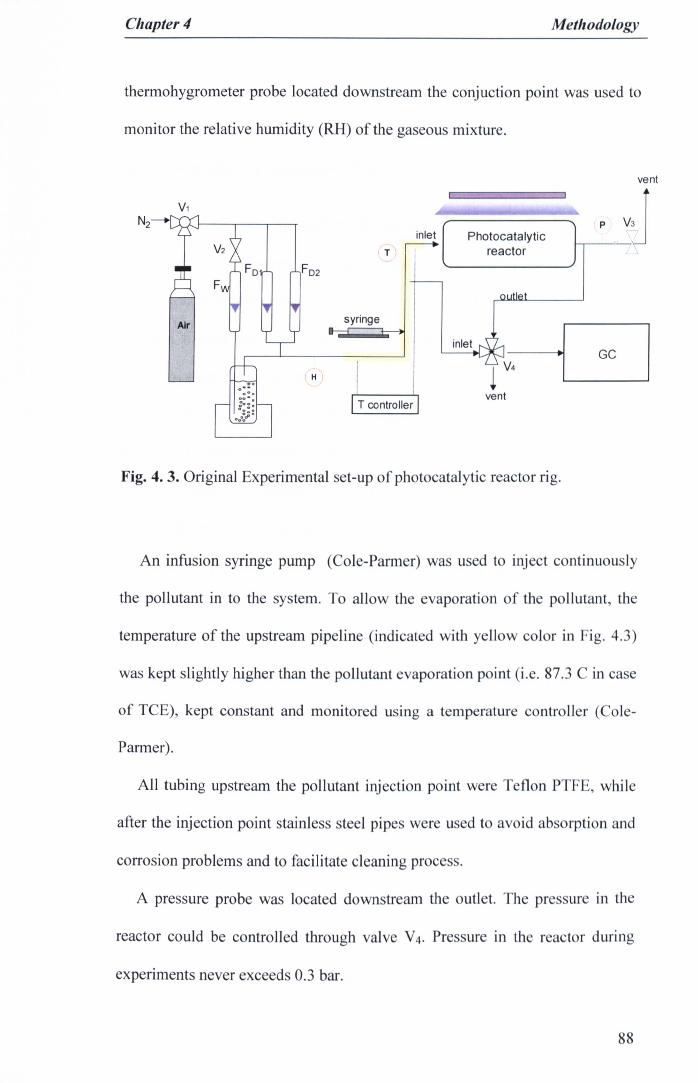
Chapter4 Methodology
thermohygrometer probe located downstream the conjuction point was used to
monitor the relative humidity (RH) of the gaseous mixture.
vent
""'::=:::::::::::::::::=====::h-P----,-,--XJ
( H )
syringe
GC
vent
Fig. 4.3. Original Experimental set-up of photocatalytic reactor rig.
An infusion syringe pump (Cole-Parmer) was used to inject continuously
the pollutant in to the system. To allow the evaporation of the pollutant, the
temperature of the upstream pipeline (indicated with yellow color in Fig. 4.3)
was kept slightly higher than the pollutant evaporation point (i.e. 87.3 C in case
of TCE), kept constant and monitored using a temperature controller (Cole-
Parmer).
All tubing upstream the pollutant injection point were Teflon PTF , while
after the injection point stainless steel pipes were used to avoid ab orption and
corrosion problems and to facilitate cleaning process.
A pressure probe was located downstream the outlet. The pressur in the
reactor could be controlled through valve V4. Pressure in the reactor during
experiments never exceeds 0.3 bar.
88

Chapter4 Methodology
Irradiation sources were located on the top of the photocatalytic plate. The
number of lamps used and their distance from the catalyst surface was
adjustable, to allow the regulation of light intensity.
4.3.2.2 Photocatalytic experiment protocol
In a typical experiment, the coated support was placed in the grove and the
reactor was carefully sealed. The system was flushed with N2 for 5 minutes,
and then slightly pressurized up to I bar (partially closing valve V4) and the
reactor was carefully checked for leaks by a liquid leak detector. Leak test was
also carried out on all flowmeters connections. Fresh ultrapure water was
placed in the water saturator. Valve VI was used to select the carrier gas and
carrier gas flow was started. Temperature at the injection point was set, and
water bath was switched on. All flowmeters were set to desired values
depending on total flow wanted and relative humidity condition wanted. The
syringe was filled with pollutant and the pump was set at the suitable injection
rate. The GC method and sequence were set up. Valve V4 was partially closed
and pressure monitored until stabilization. When the temperature at the
injection point, carrier gas flows and humidity were stabilized injection in the
GC was started.
After starting injection, the concentration of pollutant in the inlet and outlet
of reactor were monitored by mean of its FID chromatographic peak area (see
Section 4.3.3). The system was considered at steady state when the
concentrations in the inlet and outlet were the same with an error of 1%. After
steady state was reached and kept for 30 minutes, the lamps were switched on
and any change in pollutant concentration was evaluated by changes in outlet
89
Chapter4 Methodology
concentration from FID chromatographic peak (see section 4.3.3). The
conversion is considered at steady state when the same value (±5%) is recorded
for more than 5 consecutive analyses. At this point the lamps were usually
switch off to ensure that the actual conversion could be ascribed to
photocatalytic process and not to leaks in the system or artifacts in the analyses
procedure. The system is allowed to reach again the steady state condition
before applying irradiation on the catalyst surface (Fig. 4.4).
25%larrps ON1=12W/m2
larrps ON1=20W/m2
20%c:o.~ 15%>eoo 10%wo~
larrpsOFF
5% larrpsOFF
larrpsOFF
larrps ON1=5W/m2
0%o 50 100 150 200 250
time min
Fig. 4.4. TCE conversions vs. time diagram for a typical photocatalytic
experiment.
After every experiment, the system was flushed with N2 for 5 min, to eliminate
any trace of contaminant from the rig and from the catalyst urface.
4.3.2.3 Problems encountered
During the first experiments on the photocatalyst valuation, some
drawbacks of the experimental set up became evid nt. The main disadvantages
of the rig in its original configuration were related to th difficulty in obtaining
a steady state of the poJiutant inlet concentration, before and during the
photocatalytic experiment. Moreover, the syringe pump rev aled to be not th
ideal system for the introduction of the pollutant in the system. The main
90

Chapter4 Methodology
limitation experienced in operating the photocatalytic reactor are reported as
follows:
The achievement of a stable TCE initial concentration at fixed injection
rate.
1. Limitation in the initial concentration of TCE achievable by using the
syringe pump as injection system. The injection rate of the syringe pump
could be set in the range: 0-1.5 mllh. However, preliminary experiments
carried out in order to evaluate the reliability of the injection rate, showed
that the lowest injection rate that guaranteed the achievement of a steady
state of TCE injection was 0.5 ml/h, At rates lower than 0.5 ml/h the
injection resulted very unstable and consequently the TCE peak areas
obtained were very variable, indicating that the amount of pollutant
injected was not constant during the injection time. It was observed that at
low injection rates, the movement of the screw in the pump was not
continuous and smooth, but it proceeded "by steps" causing the non-
continuous injection. The inlet concentration of TCE was evaluated from
the GC peak area at different injection rates. Figure 4.5 reports the
concentration in J.1Mand ppmv obtained at different injection rates, starting
from 0.5 ml/h for the reasons reported above, considering two different air
flow-rates. It can be seen that the lowest initial concentration of TCE
achievable is 39 J.1M,equivalent to 950 ppm. Considering that in real air the
VOCs concentration is in the ppm or ppb range, a lower initial
concentration of pollutant than the one allowed by the syringe pump
injection system is highly desirable.
91
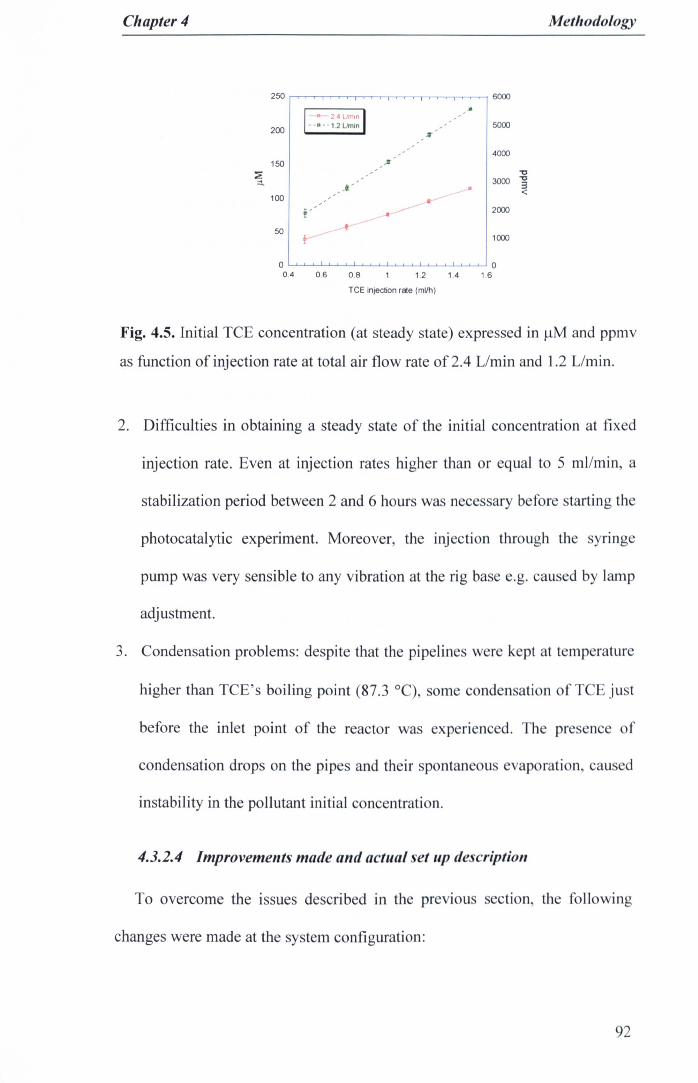
Chapter4 Methodology
250 6000
.Ii1---24 Ltrun I200 --.-- 1.2Urnln 5000...
4000150 /¥
:2: -03000 -0
:::1. ,I' 3<100
f' ~.----- 2000
50 ~~-1000
0 00.4 0.6 0.8 1.2 1.4 1.6
TCE injection rate (ml/h)
Fig. 4.5. Initial TCE concentration (at steady state) expressed in /-lMand ppmv
as function of injection rate at total air flow rate of 2.4 Llmin and 1.2 Llmin.
2. Difficulties in obtaining a steady state of the initial concentration at fixed
injection rate. Even at injection rates higher than or equal to 5 ml/min, a
stabilization period between 2 and 6 hours was necessary before starting the
photocatalytic experiment. Moreover, the injection through the syringe
pump was very sensible to any vibration at the rig base e.g. caused by lamp
adjustment.
3. Condensation problems: despite that the pipelines were kept at temperature
higher than TCE's boiling point (87.3 °C), some condensation of TCE ju t
before the inlet point of the reactor was experienced. The presence of
condensation drops on the pipes and their spontaneous vaporation, caused
instability in the pollutant initial concentration.
4.3.2.4 Improvements made and actual set up description
To overcome the issues described in the previous section, the following
changes were made at the system configuration:
92

Chapter4 Methodology
1. Injection system: the syringe pump was substituted by a Dreschel bottle
containing a small amount (~5 ml) of liquid TCE in equilibrium with the
vapours. The flow through the bottle was controlled by a flowmeter
(Cole-Parmer). The vapour pressure of TCE in the Dreshel bottle
depends on temperature varying from 20 torr at 0 QC,75 torr at 25 to 200
torr at 50 QC. The bottle was kept in a water bath at controlled
temperature, or in an ice bath. The TCE concentration can be controlled
by changing the gas flow inside the bottle, or by changing the
temperature of the water bath. If the flow and the temperature are kept
constant, the concentration of TCE in the inlet is constant.
2. The flowmeters were substituted with two precision mass and volumetric
flow controllers (Cole-Parmer). The range covered by the flow-mass
controllers is from 0 to 5 Umin. Final configuration of the reactor rig is
reported in Fig. 4.7, where MCD and MCW indicates the mass flow
controller used for the dry flow and for the humid flow respectively.
50 1200
401000
30 QC '0030
~ .00 120 o QC
'00
10200
010 15 20 25 30 35
airflow rate (ml/min)
Fig. 4. 6. Initial TCE concentration (at steady state) expressed in IlM and ppmv
as function of air flow rate through Dreshel bottle saturated with TC vapors 111
ice bath and at 30°C. Total flow rate: 2.4 Umin.
93
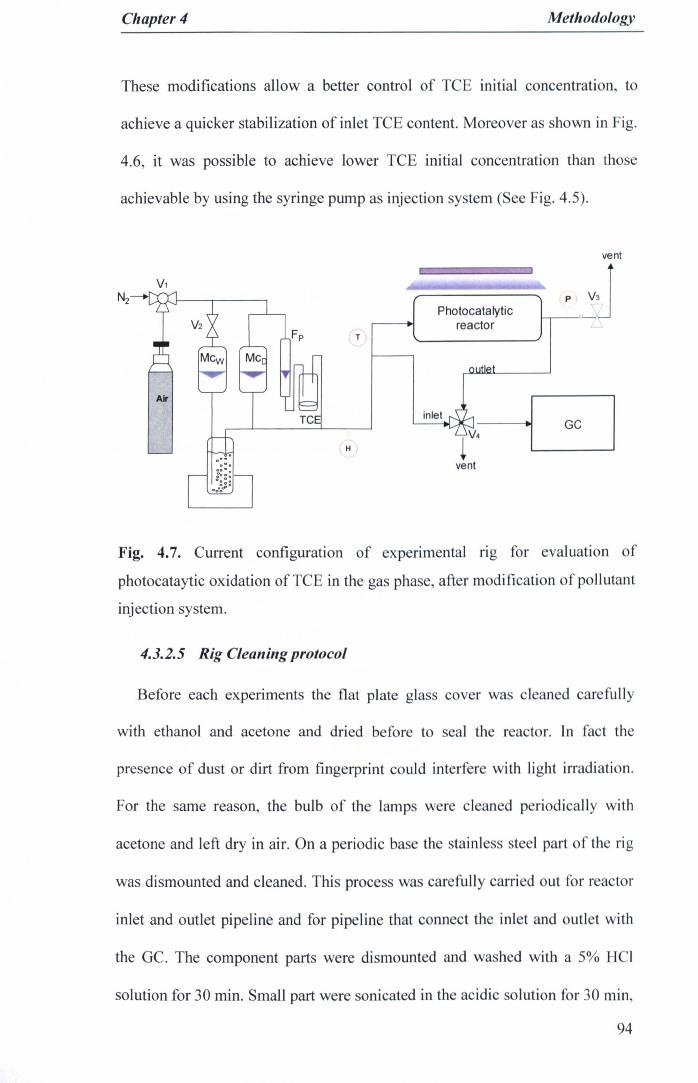
Chapter 4 Methodology
These modifications allow a better control of TeE initial concentration, to
achieve a quicker stabilization of inlet TeE content. Moreover as shown in Fig.
4.6, it was possible to achieve lower TCE initial concentration than those
achievable by using the syringe pump as injection system (See Fig. 4.5).
vent
,~Photocatalyticreactor
(H )
Fig. 4.7. Current configuration of experimental fig for evaluation of
photocataytic oxidation of TeE in the gas phase, after modification of pollutant
injection system.
4.3.2.5 Rig Cleaning protocol
Before each experiments the flat plate glass cover was cleaned carefully
with ethanol and acetone and dried before to seal the reactor. In fact the
presence of dust or dirt from fingerprint could interfere with light irradiation.
For the same reason, the bulb of the lamps were clean d periodically with
acetone and left dry in air. On a periodic base the stainless ste I part of th rig
was dismounted and cleaned. This process was carefully carried out for reactor
inlet and outlet pipeline and for pipeline that connect the inlet and outlet with
the GC. The component parts were dismounted and washed with a 5% H I
solution for 30 min. Small part were sonicated in the acidic solution for 30 min,
94

Chapter4 Methodology
while long tubes were rinsed several times with the solution. After being rinse
with ultrapure water and acetone, all parts were dried with N2 flow. The parts
were mounted back and a leak: test was carried out.
4.3.3 GC analysis
Inlet and outlet air streams from the photocatalytic reactor were connected
to a gas chromatograph (Agilent Technologies, GC-6890N) through a system
of automatic sampling valves (V3). In reality V3 consists of two valves: a
sampling valve was responsible for the selection of sampling origin, i.e. inlet or
outlet, and sampling valve for injection of gases into a sampling loop. This
system allows the analysis of the inlet and outlet samples composition and the
calculation of TCE conversion during the experiment. The volume of the
sampling loop determines the injection volume in the GC column. In all our
experiments a 1 ml sampling loop was used. The GC was equipped with a GS-
GASPRO capillary column (30 m, 0.32 mm) for separation of analytes and
Flame Ionization Detector (FID) for detection of organic and halogenated
compounds and Thermal Conductivity Detector (TCD) for analysis of
inorganic gases such as C02 detectors.
An isotherm method was used for the detection of TCE. Specification of the
method are reported in Table 4.1.
4.3.3.1 Calibration
Calibration curves for the determination of TCE concentration from the FID
peak areas were produced before every set of experiments. Standard solutions
of TCE in cyclohexane were prepared, with TCE in the experiments
concentration range. 1 J.lL injections were carried out at least in triplicate and
95
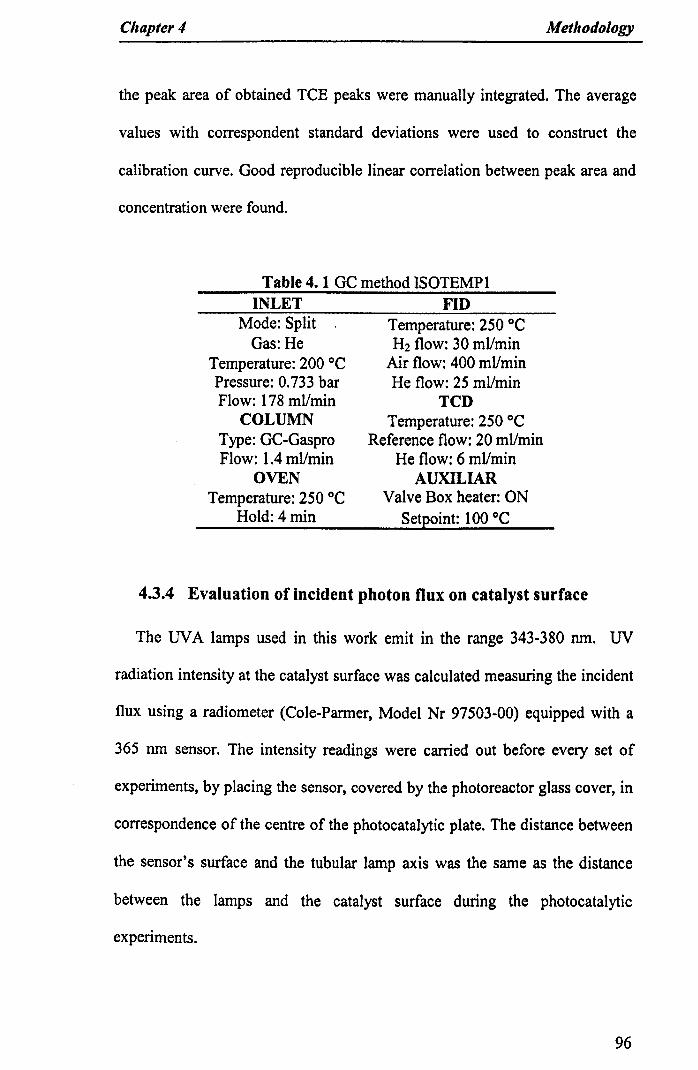
Chapter4 Methodology
the peak area of obtained TCE peaks were manually integrated. The average
values with correspondent standard deviations were used to construct the
calibration curve. Good reproducible linear correlation between peak area and
concentration were found.
Table 4. 1 GC method ISOTEMP1INLET FID
Mode: Split Temperature: 250°CGas: He H2 flow: 30 mllmin
Temperature: 200°C Air flow: 400 mllminPressure: 0.733 bar He flow: 25 mllminFlow: 178mllmin TCD
COLUMN Temperature: 250°CType: GC-Gaspro Reference flow: 20 mllminFlow: 1.4mllmin He flow: 6 mllmin
OVEN AUXILIARTemperature: 250°C Valve Box heater: ON
Hold: 4 min Setpoint: 100°C
4.3.4 Evaluation of incident photon flux on catalyst surface
The DVA lamps used in this work emit in the range 343-380 nm. DV
radiation intensity at the catalyst surface was calculated measuring the incident
flux using a radiometer (Cole-Parmer, Model Nr 97503-00) equipped with a
365 nm sensor. The intensity readings were carried out before every set of
experiments, by placing the sensor, covered by the photoreactor glass cover, in
correspondence of the centre of the photocatalytic plate. The distance between
the sensor's surface and the tubular lamp axis was the same as the distance
between the lamps and the catalyst surface during the photocatalytic
experiments.
96
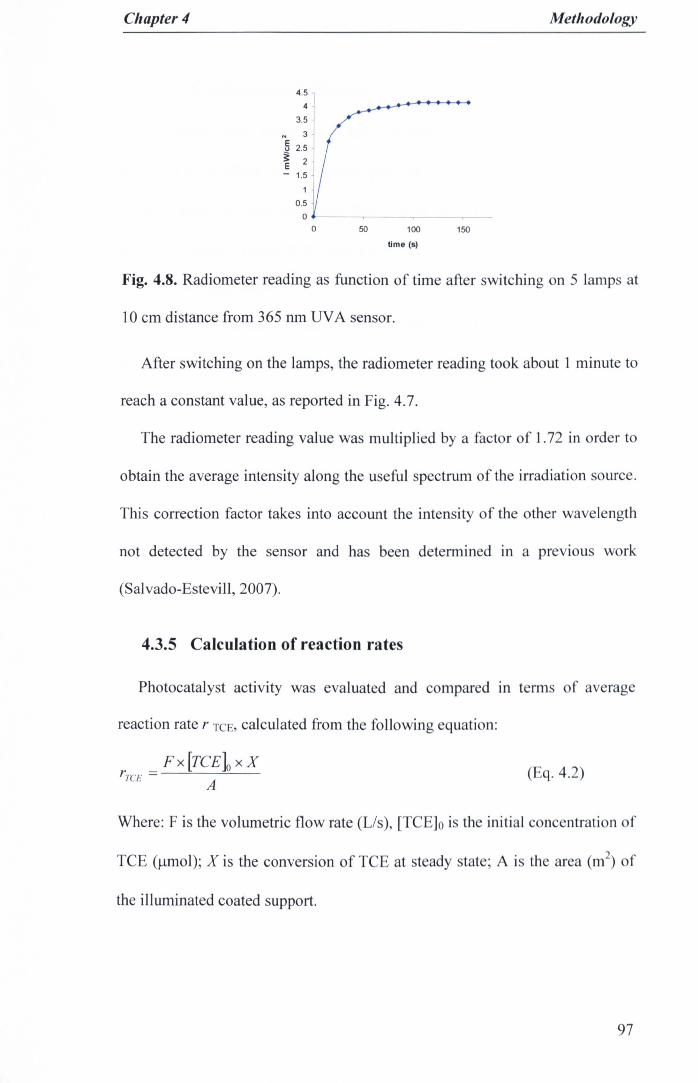
Chapter4 Methodology
4.5
4
3.5
N 3E 2.5"~ 2E- 1.5
1
0.5
00 50 100
time (s)
150
Fig. 4.8. Radiometer reading as function of time after switching on 5 lamps at
10 cm distance from 365 nm UVA sensor.
After switching on the lamps, the radiometer reading took about 1minute to
reach a constant value, as reported in Fig. 4.7.
The radiometer reading value was multiplied by a factor of 1.72 in order to
obtain the average intensity along the useful spectrum of the irradiation source.
This correction factor takes into account the intensity of the other wavelength
not detected by the sensor and has been determined in a previous work
(Salvado-Estevill,2007).
4.3.5 Calculation of reaction rates
Photocatalyst activity was evaluated and compared in terms of average
reaction rate r TeE, calculated from the following equation:
Fx[TCE]o xX"tc« =
A( q.4.2)
Where: F is the volumetric flow rate (Lis), [TC ]0 is the initial concentration of
TCE (umol); X is the conversion of TCE at steady state; A is the area (m2) of
the illuminated coated support.
97

Chapter4 Methodology
4.3.6 Catalyst immobilisation
The photocatalyst evaluated in the photoreactor were immobilised as thick
non-transparent films on borosilicate glass plate (dimension: 10 cm length x
7.5 cm width x 0.5 cm thickness). The glass plates were cleaned in ultrasonic
bath with ethanol, rinsed first with ethanol then with acetone, and allowed to
dry at room temperature.
0.045 g of Ti02 were ultrasonically dispersed in 5 ml of ethanol for 10 min,
then pipetted uniformly on the glass plate surface achieving a Ti02 loading of
0.6 mg/crrr', The solvent was allowed to evaporate and the coated plates were
heated at 120°C in the oven for 2 hours.
98

Chapter 5
Pristine Ti02
Chapter5 Pristine riOl
5.1 Introduction
Among the vanous methods available for the preparation of Ti02
nanoparticles, sol-gel based syntheses offer several advantages (Section 2.2.5).
Sol-gel preparation offers the possibility of preparing materials with different
structural and morphological characteristics by tuning processing parameters
with cost effectiveness and high reproducibility (Section 2.2.1). It is well
known that changes in the Ti02 materials properties reflect on Ti02
photocatalytic activity. In this chapter the preparation, characterisation and
photocatalytic evaluation of Ti02 nanoparticles obtained reproducing and
modifying a sol-gel based procedure (Maira et ai, 2000) is presented and
discussed. Ti02 photocatalysts have been synthesised under different
experimental conditions, with the aim of investigating:
1. The impact of acid addition during the hydrolysis-condensation
reaction on material's properties and photocatalytic activity.
2. The effect of calcinations temperature in thermal treatment and the
effect of solvent composition in the hydrothermal process on
material's properties and photocatalytic activity
The first part of the chapter reports the crystallographic, structural and
morphological characterisations of titania photocatalysts, investigating the
eventual correlations between processing parameters and materials properties.
The second part of the chapter reports the results and the discussion of the
photocatalytic test for TCE photoxidation in the gas phase, scrutinizing the
correlation between activity and materials properties.
99

Chapter 5 Pristine riO]
5.2 Synthesis of Titania samples
5.2.1 General synthesis scheme
The preparation method of all Ti02 nanoparticles reported in this chapter is
based on the modified two-steps sol-gel procedure, resumed in Scheme 4.1. In
the first step, indicated as "sol-gel", a hydrolysis-condensation reaction is
carried out at controlled parameters, leading to the formation of amorphous
Ti02. In this study the hydrolysis-condensation reaction was carried without
acid addition (synthesis route l-Section 4.1.2.1) and by adding Hel (synthesis
route 2-Section 4.1.2.2) or glacial acetic acid (synthesis route 3-Section
4.1.2.3).
Thermal treatment
'"[ FURNACE I
, -====:0 ,iltrationnd drying Amorphous 300<T <800°C> Ti02
Hydrothermal treatm
0Filtrationand drying
'", ,
EtOH/H2O I--
crystallineTi02
ent
crystallineTi02
T=lS0°C
Fig. 5.1. Synthesis scheme employed for preparation of Ti02 photocatalyst.
The second step of the preparation process consists of the conver ion of
amorphous Ti02 to crystalline and photocatalytically active form of titania.
Such crystallisation is achieved by either a thermal treatment i.e. calcination at
high temperatures, or by a hydrothermal treatment in water/alcoholic solutions
100

ChapterS Pristine Ti02
at different solvent ratios, carried out at constant temperature and holding time,
i.e. 150 °CI Bh.
5.2.2 Samples prepared
Four different series of Ti02 nanoparticles were obtained by changing the
combination of hydrolysis and crystallisation conditions employed during the
materials preparation.
Amorphous Ti02 obtained under uncatalysed condition (synthesis route 1)
were crystallised by thermal and hydrothermal methods, yielding to sample
series TT and HY, respectively. Sample series TTA and HYA were prepared
by thermal and hydrothermal crystallisation of amorphous powder obtained by
hydrolysis-condensation conducted under acidic conditions. Two acids were
used as catalysts: HCI and CH3COOH, (synthesis route 2 and 3) (Table 5.1).
5.2.3 Visual aspect of products.
Some macroscopic differences were observed in the reaction products from
the three synthetic routes employed in the preparation of Ti02• Hydrolysis and
crystallisation conditions for all samples reported in this chapter are resumed in
Table 5.1 with the macroscopic observation of the product characteristics after
each preparation step.
The hydrolysis-condensation carried out without acid (Route 1) yield a
milky white solution as soon as the addition of the precursor was started (TIP).
After one hour aging, a white powder decantates spontaneously from the
reaction mixture. The formation of a milky solution was observed also when
the hydrolysis-condensation reaction was carried out in the presence of HCI
(Route 2). However, in this case, at the end of the aging time (lh) no
101
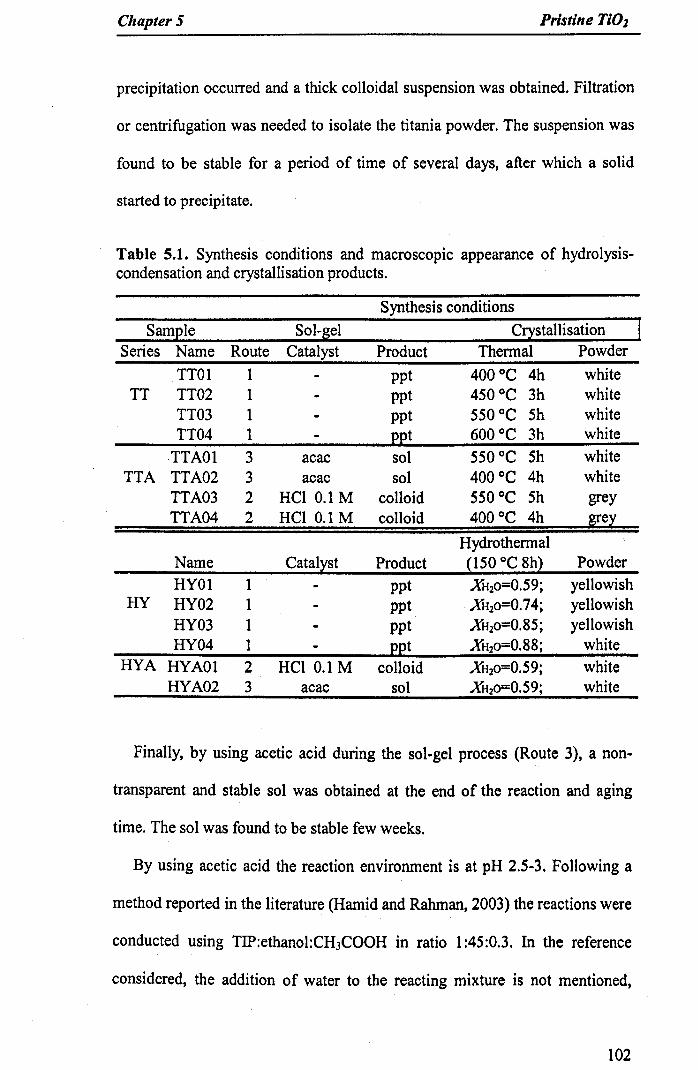
Chapter 5 Pristine TiO]
precipitation occurred and a thick colloidal suspension was obtained. Filtration
or centrifugation was needed to isolate the titania powder. The suspension was
found to be stable for a period of time of several days, after which a solid
started to precipitate.
Table 5.1. Synthesis conditions and macroscopic appearance of hydrolysis-condensation and crystallisation products.
Synthesis conditionsSam21e Sol-sel C!1stallisation
Series Name Route Catalyst Product Thermal PowderTTOI 1 ppt 400°C 4h white
TT TT02 1 ppt 450°C 3h whiteTT03 1 ppt 550°C 5h whiteTT04 1 22t 600°C 3h white
ITAOI 3 acac sol 550°C 5h whiteTTA TTA02 3 acac sol 400°C 4h white
TTA03 2 HCI 0.1 M colloid 550°C 5h greyTTA04 2 HCI 0.1 M colloid 400°C 4h S!e~
HydrothermalName Catal~st Product ~I50 °C Shl PowderHYOI 1 ppt XH20=0.59; yellowish
HY HY02 1 ppt XH20=0.74; yellowishHY03 1 ppt XH20=0.S5; yellowishHY04 1 22t XH20=0.S8; white
HYA HYAOI 2 HCI 0.1 M colloid XH20=0.59; whiteHYA02 3 acac sol XH20=0.59; white
Finally, by using acetic acid during the sol-gel process (Route 3), a non-
transparent and stable sol was obtained at the end of the reaction and aging
time. The sol was found to be stable few weeks.
By using acetic acid the reaction environment is at pH 2.5-3. Following a
method reported in the literature (Hamid and Rahman, 2003) the reactions were
conducted using TIP:ethanol:CH3COOH in ratio 1:45:0.3. In the reference
considered, the addition of water to the reacting mixture is not mentioned,
102

Chapter 5 Pristine Ti02
however following this method no formation of Ti02 was observed in the first
24 hours of reaction, thus a small amount (1 ml) of water was added to achieve
reasonable reaction times.
The hydrolysis-condensation step can be driven towards the formation of
different products, from transparent sols to powder precipitation, depending on
the ratio between the hydrolysis and the condensation reaction rate, which
depends on synthesis conditions (Table 2.3). The difference in products
resulting from different hydrolysis condensation conditions i.e.: precipitate or
sols with different stability can be attributed to the effect of the acid on
hydrolysis and condensation reaction rates. When no acid is used (synthesis
route 1) both hydrolysis reaction rate and condensation rate are fast and
precipitate is the favoured product (Table 2.3). When an acid is added to the
reaction environment, the presence of H+ increases the Ti electrophilic property
of the Ti(OiPr)4 precursor, therefore favouring the nucleophilic attack from a
water molecule. As a result, the equilibrium of the hydrolysis reaction of
Ti(OiPr)4 is shifted towards the formation of the hydrolysed product Ti(OH)4.
On the other hand, the addition of H+ in the reaction environment has an
inhibitory effect on the condensation reaction (Section 2.2.4). Generally, when
condensation is slow, the formation of a sol is favoured. When acetic acid was
used, the sol obtained was stable for longer period of time that the sol obtained
with HCt. Acetic acid can also act as a ligand during the hydrolysis and
condensation reaction, coordinating the Ti centre. Moreover, the hydrolysis
condensation with acetic acid occurs in conditions of high dilution if compared
with HCI reaction: the final total volume for route 3 was six times larger than
for route 1 and 2.
103
ChapterS Pristine 1i02
Some visual differences in terms of colour and textures were noticed also in
the crystallised powders. Ti02 nanoparticles crystallised by the thermal
treatment gave rise to white fine powders with the exception of amorphous
Ti02 obtained in presence of Hel that present grey colour after thermal
treatment. Ti02 nanoparticles obtained by hydrothermal treatment were
powders with a coarse aspect, either white or yellowish. Each sample reported
in Table 5.1 was prepared at least in duplicate and the differences in
appearance were observed to be fairly reproducible.
5.3 Photocatalysts characterisation
The characterisation of the photocatalysts' structural and morphological
properties by mean of X-ray diffraction studies, adsorption studies and
microscopy studies (SEM and TEM) is reported in this section. The material
properties are discussed in relation with the photocatalysts preparation
conditions. Sample series obtained under uncatalysed conditions and those
obtained in acidic conditions are considered separately, and a summary of the
correlation between material properties and relevant experimental parameters is
reported at the end of each section. The morphological and crystallographic
properties ofTi02 obtained under acidic conditions are also compared with the
Ti02 obtained without acid and crystallised in similar conditions.
5.3.1 Calcined samples (Series TT)
5.3.1.1 X-ray studies
X-Ray diffraction patterns reported in Fig. 5.2 provide informations about
104

Chapter 5 Pristine TiO]
the crystal phase composition and the crystal particle size of Ti02
nanoparticles.
No diffraction peaks were found for powders obtained after hydrolysis-
condensation reaction, confirming their amorphous nature. Samples calcined at
temperature between 400 and 550°C show characteristic anatase diffraction
pattern according with JCPDS 21-1272, while Ti02 calcined at 600°C, shows
clearly also the (110) rutile peak at 29 = 27.5°. The rutile content in this sample
has been estimated equal to 5%.
The peak corresponding to the strongest anatase line, at 28=25.3°, becomes
sharper with increasing the calcination temperature, along the whole amples
series, indicating an increase in the mean crystalline size with firing
temperature. Crystal size varies from 13 to 64 11m(Table 5.2).
A
10 20 30 40 50 60 70 8029
Fig. 5.2. XRD patterns of and calcined ample calcin d at diff rent
temperatures a) amorphous powder (20 °C); b) TIO] (300 ° ). c) TI02 (400
QC); d) TT03 (550°C); e) TT04 (600°C).
105

ChapterS Pristine TiO]
Table 5. 2. Crystallographic and structural properties of TT series Ti02.
Crystallographic StructuralSample Phase Q D b SA C V PORE d
(nm) (m2/g) (cmJ/g)
TTO1 A 13 100 0.480TT02 A 19 92 0.402TI03 A 28 53 0.107TT04 A+R(5%) 64 33 0.172
a)A=anatase; R=rutile. b) Diameter calculated from the broadening of the (101)anatase peak using Scherrer's equation. c) Specific surface area determinedusing the BET method in the range 0.05<PIP0<0.35. d) BJH desorption porevolume calculated between 2 and 300 nm.
5.3.1.2 Surface area and Porosity studies
Figure 5.3 shows the N2 adsorption-desorption isotherms of Ti02 samples
obtained by calcination between 400 and 600°C. All isotherms are reported on
the same volume adsorbed scale for comparison purpose. The correspondent
pore size distribution calculated by BJH method from the desorption branch are
also reported as insert in each isotherm. All calcined samples present isotherm
of Type IV of BDDT classification with two hysteresis loops, indicating a
bimodal porosity of the materials in the mesoporous and macroporous regions.
Bimodal nature of calcined materials is also confirmed by BJH pore size
distribution.
In the isotherm of sample TTO1, calcined at 400°C, two different regions
characterised by a condensation step at P/Po=0.59 and a steeper condensation
step at PlPo=0.84 respectively, can be clearly identified. The isotherm presents
two hysteresis loops with different shape. The first hysteresis loop, at
0.6<PlPo<0.84, is of type H2 which is usually associated with ink bottle-shaped
pores. The second hysteresis, at O.84<PlPo<1, is of type H3 and is associated
106

Chapter 5 Pristine n02
with the presence of slit-shaped pores deriving from the aggregation of plate
like particles (Section 3.2.2). The isotherm of this sample indicates a very high
absorption capacity in correspondence to the macropores regions, which
corroborate with sorption data (Table 5.2). The TTO! pore size distribution
denotes a narrow distribution in the mesoporous region with a mean pore size
of 5.5 nm and wider distribution in the macroporous region with a maximum
around 45 nm.
350 ~ ::llc;; 300 ;- 0 01
l250 ~ 0 00 .--~,
400
350
_ 300Cl
E 250.!:.'tI.e 200o~ 150et
g 100
50
400
'tI.e 200
~~ 150
o> 100
50
I 0.05 ~~a)_ 0.04
? 0.03e.!!. 0.02
~ 0.01
g_ 0.00 ~--,---:~~10 100
nm
400
350
300c;E 250.!:.'tI.e 200oIII~ 150
g 100
o
E 0.05
e 0.04 ~? 0.03
E. 0.02
I:: ":~ J*~
o 0.2 0.4 0.6PI Po
0.8
_300Cl
l250
~ 200oIII 150~g 100
b)
o 0.4 0.6P/Po
0.8
c)
10 100
nm
........1-:.7-------_._ .....
0.2
400d)
oo 0.2 0.4 0.6
PI Po0.8
0.05
~ 0.04
!! 0.03
~ 0.02>"e 0.01g_ 0.00 ~ ...~
350
50
oo 0.40.2 0.6 0.8
Fig. 5.3. N2 adsorption-desorption isotherm and por ize di tribution of a)
P/Po
TT01; b) TT02; c) TT03; d) TT04. The run seal in tb pore ize di tribution
graphs is logarithmic.
107
ChapterS Pristine TIOz
N2 adsorption-desorption isotherm of TT02 is similar to that of TTO1, with the
main difference in the maximum volume adsorbed at high partial pressure that
denotes a lower absorption capacity for TT02 in the macropore region.
The position of the absorption branches is also slightly shifted towards
higher PlPo i.e.: 0.65 and 0.87 respectively. The pore size distribution shows a
narrow peak at 6.7 nm with a small peak around 56 nm'
Sample TT03, calcined at 550°C, shows two adsorption steps at PIP0>0.65
and PIP0>0.85, respectively. However the volume adsorbed at high partial
pressures is very small showing a low adsorption contribution in the macropore
region. In fact, TT03 is the material with the lowest pore volume. The pore
size distribution is narrow and shows a mean pore size of7.2 nm and negligible
contribution from pores> 10 nm.
Finally, the isotherm of sample TT04, shows a less defined boundary
between the two hysteresis loops, and the second condensation step is found at
high PlPo>0,9. rr04 pore distribution indicates a mean pore size of 7.7 nm
with also a small peak in the macropores area.
The preparation of Ti02 with bimodal porosity features have been reported
(Yu et al., 2003b, Yu et al., 2007). According with these reports, the
adsorption contribution in the mesoporous region arises from intra-aggregate
porosity, that derives from the aggregation of ri02 crystals with formation of
fine pores in the mesoporous range. On the other hand, the contribution in the
macroporous region is due to inter-aggregate porosity produced by the
aggregation of secondary ri02 particles generating interparticle voids of
dimensions larger than 50 nm.
108
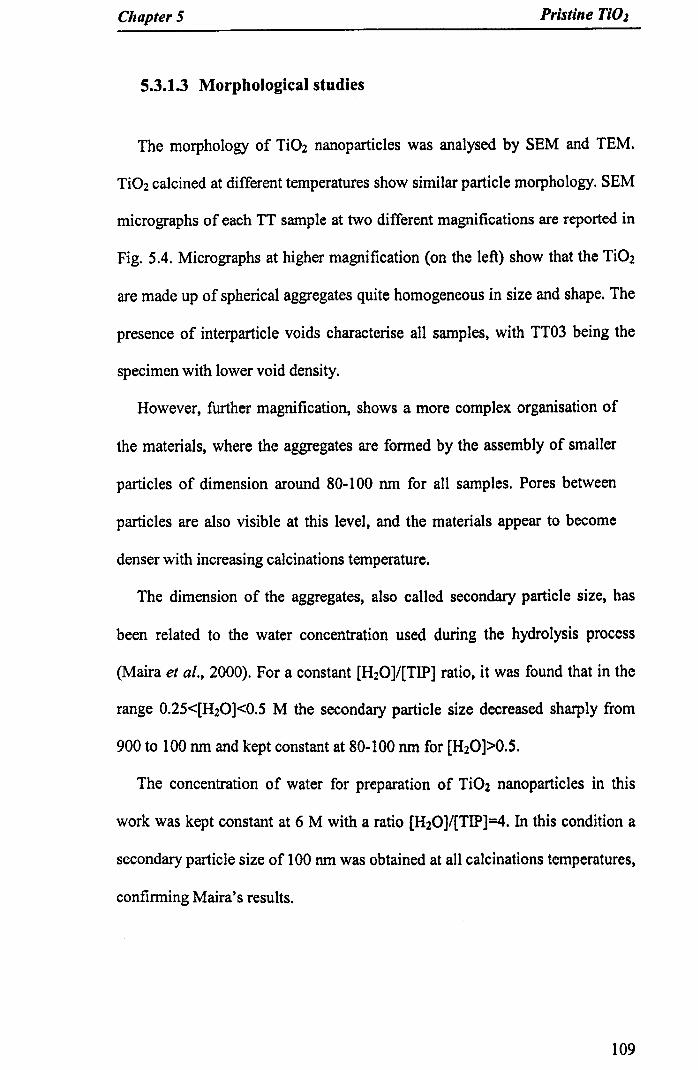
Chapter 5 Pristine Ti02
5.3.1.3 Morphological studies
The morphology of Ti02 nanoparticles was analysed by SEM and TEM.
Ti02 calcined at different temperatures show similar particle morphology. SEM
micrographs of each TT sample at two different magnifications are reported in
Fig. 5.4. Micrographs at higher magnification (on the left) show that the Ti02
are made up of spherical aggregates quite homogeneous in size and shape. The
presence of interparticle voids characterise all samples, with TI03 being the
specimen with lower void density.
However, further magnification, shows a more complex organisation of
the materials, where the aggregates are formed by the assembly of smaller
particles of dimension around 80-100 nm for all samples. Pores between
particles are also visible at this level, and the materials appear to become
denser with increasing calcinations temperature.
The dimension of the aggregates, also called secondary particle size, has
been related to the water concentration used during the hydrolysis process
(Maira et al., 2000). For a constant [H20]/[TIP] ratio, it was found that in the
range 0.25<[H20]<0.5 M the secondary particle size decreased sharply from
900 to 100 nm and kept constant at 80-100 nm for [H20]>0.5.
The concentration of water for preparation of Ti02 nanoparticles in this
work was kept constant at 6 M with a ratio [H20]/[TIP]=4. In this condition a
secondary particle size of 100 nm was obtained at all calcinations temperatures,
confirming Maira's results.
109

Chapter 5 Pristine Ti02
Fig. 5.4. SEM images of Ti02 nanoparticles at different rnagnificati n : A)
TTOI (400°C); B) TT02 (450°C); C) TT03 (550°C); D) TT04 (600° ).
110
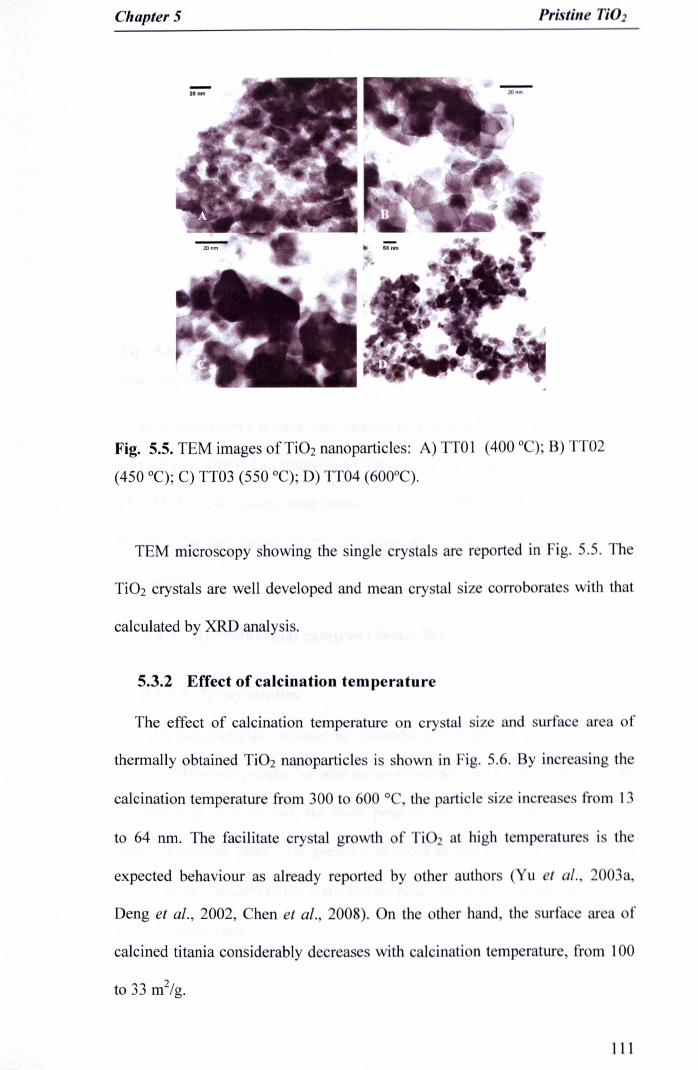
Chapter 5 Prj tine Ti01
Fig. 5.5. TEM images of Ti02 nanoparticles: A) TTOl (400 DC);B) TT02
(450 DC);C) TT03 (550 DC);D) TT04 (600DC).
TEM microscopy showing the single cry tal ar I' p rt d in ig. 5.5. Th
Ti02 crystals are well developed and mean crystal iz corrob rat with that
calculated by XRD analysis.
5.3.2 Effect of calcination temperature
The effect of calcination temperature on cry tal IZ and urf: ar a f
thermally obtained Ti02 nanoparticles j shown in ig. 5.. y in r a ing th
calcination temperature from 300 to 600 0 th P ti I
to 64 nm. The facilitate cry tal gr wth f j 2 at hi h t mp ratur i th
expected behaviour as already repolt d by other auth r (Yu L al.
Deng et al., 2002, Chen et al., 2008). 11 th th I' hand th f
calcined titania considerably decrease with calcinati 11 t mp ratur fr m 100
to 33 m2/g.
111
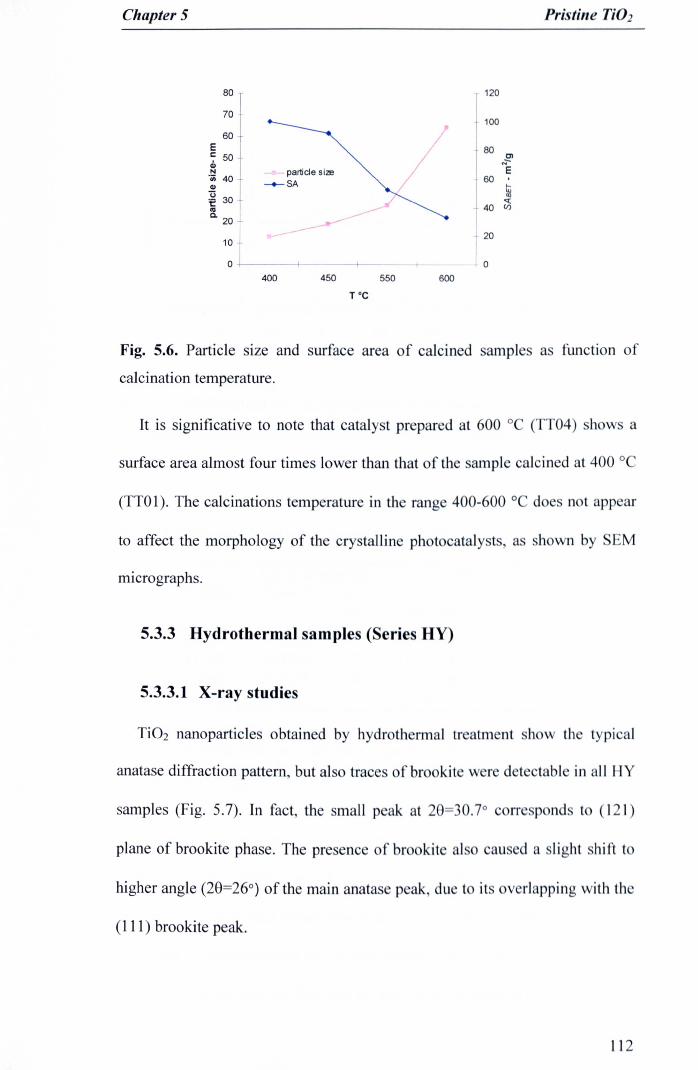
Chapter 5 Pristine Ti02
80 120
70 10060
E 807 50 ClCl> "EN - - particle size'iii 40 -+-SA 60Cl> t;"0 IX):e 30 «'" _- 40 Cl)Q. 20 _____ -----
2010
0 -I--- 0400 450 550 600
Toe
Fig. 5.6. Particle size and surface area of calcined sampl as function of
calcination temperature.
It is significative to note that catalyst prepared at 600 0 (TT04) how a
surface area almost four times lower than that of the sample calcined at 400 0
(TTO1). The calcinations temperature in the rang 400-600 0 do n t app ar
to affect the morphology of the crystalline photocataly t a hOWDby . M
micrographs.
5.3.3 Hydrothermal samples (Series HY)
5.3.3.1 X-ray studies
Ti02 nanoparticles obtained by hydroth rmal tr atm nt h w th typi al
anatase diffraction pattern, but also trac of br kit w r d t ctabl in all HY
higher angle (28=26°) of the main anata p ak du t it v rJapping with th
(111) brookite peak.
112
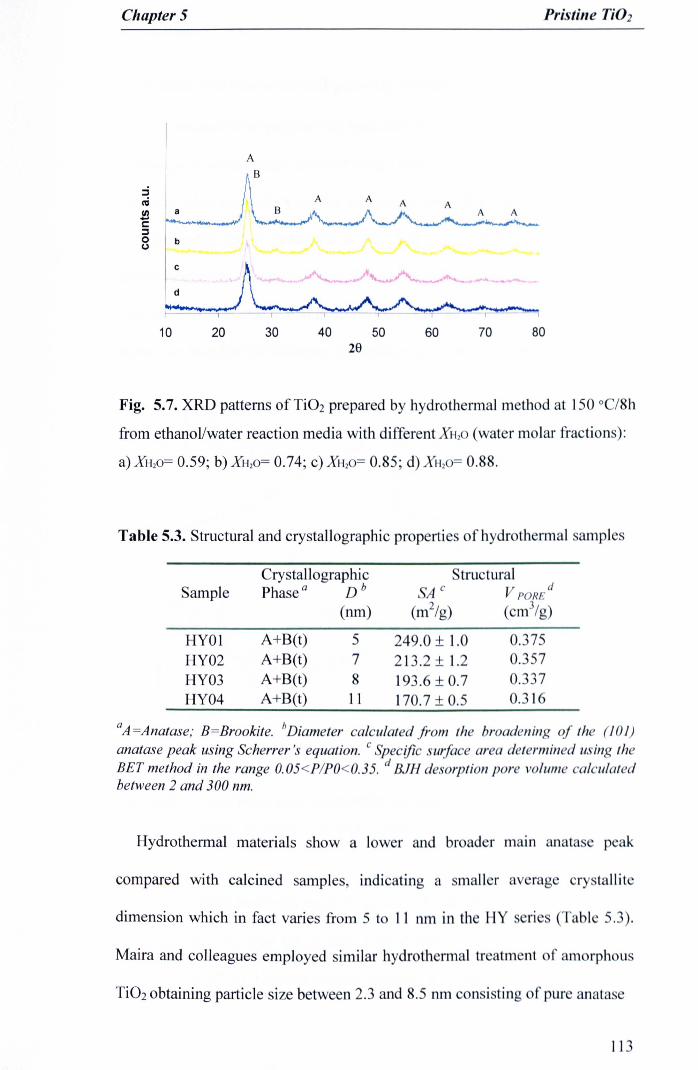
Chapter 5 Pristine Ti02
A
B
A A
10 20 30 40 50 60 70 8028
Fig. 5.7. XRD patterns of Ti02 prepared by hydrothermal m thod at 150 cC/Sb
from ethanol/water reaction media with different Au.o (water molar fraction ):
a)XH2o= 0.59; b)XH2o= 0.74; C)XH20= 0.S5; d)XH10= O.SS.
Table 5.3. Structural and crystallographic properties of hydr th rmal sample
Crystallographic tructuralSample Phase" Db 'Ac V P RE
d
(nm) (m2/g) ( m/g)
HYOI A+B(t) 5 249.0 ± 1.0 0.375HY02 A+B(t) 7 213.2 ± 1.2 O. 57HY03 A+B(t) 8 193.6 ± 0.7 0.337HY04 A+B(t) 11 170.7 ± 0.5 O. 1
"Ar=Anatase;B=Brookite. bDiameter calculated from th broad ning of th (10.1)anatase peak using Scherrer's equation. C lpeciflc surfa e ar a d. t rmin d usin thBET method in the range 0.05<PIPO<0.35.d BJH desorption por volum al ulat dbetween 2 and 300 nm.
Hydrothermal materials show a lower and br d r main nata p ak
compared with calcined samples, indicating a mall r ay rag ry tallit
dimension which in fact varies from 5 to ] 1 nrn in the HY n (Tabl 5. ).
Maira and colleagues employed similar hydroth rmal tr atrn I1t of am rph u
Ti02 obtaining particle size between 2.3 and 8.5 nm c n i ting f pur anata e
]13

Chapter 5 Pristine Ti02
5.3.3.2 Surface area and porosity studies
Ti02 nanoparticles prepared by hydrothermal treatm nt how high valu s of
surface area, in the range 250-170 m2/g (Table 5.3). Titania belonging to HY
series are characterised by similar adsorption propertie , as dispayed by the N2
adsorption-desorption isotherms in Fig. 5.8. All isotherms di play a well-
defined hysteresis loop at P/Po>0.5, characteristic of mesoporous materials.
The condensation step is found at relative pressures between 0.4 and 0.65. The
hysteresis loop has H2 character, indicating ink-bottle shaped por s.
300
i':L a) b)300
ttL250250
~ 200c;;
E. 1200
... nm ~ 150.: 150 0 10 20 30(; e nm.. 0... ~ 100~ 100 «0 >>
5050
0 ° 0.2 0.4 0.6 0.80 0.2 0.4 0.6 0.8 PIP,
PIP,
300 300
rL c)250 q d)
_250Cl
c;;'" ...1200 12OO e
0-e .., ... 0
.f 150 0 10 20 30 .f 150 0 10 20 30 40 50:;: nm :;: nm
~ 100 ~ 100"0 "0> 50 >
50
0 0
° 0.2 0.4 0.6 0.8 ° 0.2 0.4 0.6 0.8PIP, PIP,
Fig. 5.8. N2 adsorption desorption i otherm andp r IZ di tributi n
(insert) of a) HYOI b) HY02 c) HY03 . d) Y04.
Sample HYOI isotherms presents a bimodal charact r r p rting a littl
hysteresis loop of type H2 at high P/Po (>0.9). The p r iz di tributi n
confirms the HYOI bimodal nature, howing a narr w di tributi n . und a
114

IMAGING SERVICESNORTH. Boston Spa, Wetherby
West Yorkshire, LS23 7BQ
www.bl.uk
PAGE MISSING INORIGINAL

Chapter 5 Pristine TiO}
Fig. 5.9. SEM micrographs of HYOl. Images correspond to different spot of
the sample at different magnifications. Magnification increa es from A) to D).
Fig. 5.10. rEM images of ri02 nanoparticl pr par d y hydr th rrn I
treatment at different water contents, at 150 0 112 h of am rph U 1 2
obtained without acidic catalysis A) HYOI XH2 =0.5 . B) Y02 H2=0.74·
C) HY03 XH2o=0.85; D) HY04 XH20=0.88.
11

Chapter 5 Pristine n02
5.3.4 Effect of water content
Different H20 content during the hydrothermal process give rise to different
crystallite sizes. The trend is shown in Fig. 5.11: increasing the water content
leads to larger crystals. Tuning water content from X=O.59 to X=O.89 crystal
size in the range 5-11 nm has been obtained. It is worth noticing that little
increase in water concentration lead to considerable growth of the Ti02 crystal.
Conversely, the surface area decreases with increasing the water content,
probably as direct consequence of the larger crystal size. Morphology and
porosity properties do not appear to be effected by changes in the reaction
media composition during the hydrothermal process.
11- - particle size
270
10 -+-SA250
9 ->E 230 -'i' 8 !t3: .»: E_,
210 '7~ 7
/ ~c:co190 ~Cl 6
5 170
4 ---j 1500.59 0.74 0.85 0,88
XH,O
Fig. 5.11. Particle size and surface area of HY titania a fun ti n f 12
molar fraction in the hydrothermal reaction media.
5.4 Acid-calcined (Series TTA) and acid-hydrothermal
samples (Series HY A)
5.4.1 X-Ray studies
Ti02 samples belonging to series TTA con i t of pur anata wn in
Fig. 5.12, no rutile or brookite diffraction peak w r d teet d. h typ of
117

Chapter 5 Pr; tine rio,
acid used during hydrolysis-condensation does not affect th cry tallin iz a
Ti02 treated at the same temperature have similar crystal size indiffi r ntly on
the acid used. These crystal sizes are in good agreement with tho e of sampl
prepared with no acid (series TT) calcined at the same temperatur indicating
that the principal parameter in crystal growth is the calcination temperature.
Amorphous material obtained by sol-gel in acidic condition by HCI and
acetic acid respectively, were treated hydrothermally in a mixture
water: ethanol 1:1 at 150 QC for 8 hours obtaining sample belonging to series
HYA. X-ray diffraction analysis of HYA samples shows the presence of
anatase with traces of brookite (Fig. 5.13).
- d~~~ ctfjeCl)-.E
b
A
10 30 50 7029
Fig. 5.12. XRD patterns of Ti02 prepared by I-g lin idi nditi n
followed by calcination: a) Ac.ac/550 ; b) H ]/550 . ) A. /400 . d)
HCI/400 C. A denotes the anatase diffraction p ak .
The formation of brookite in traces during hydr th rmal tr atm nt f
amorphous Ti02 in presence of HCI ha b en r p rt d in lit ratur (R y -
Coronado et al., 2008).
11
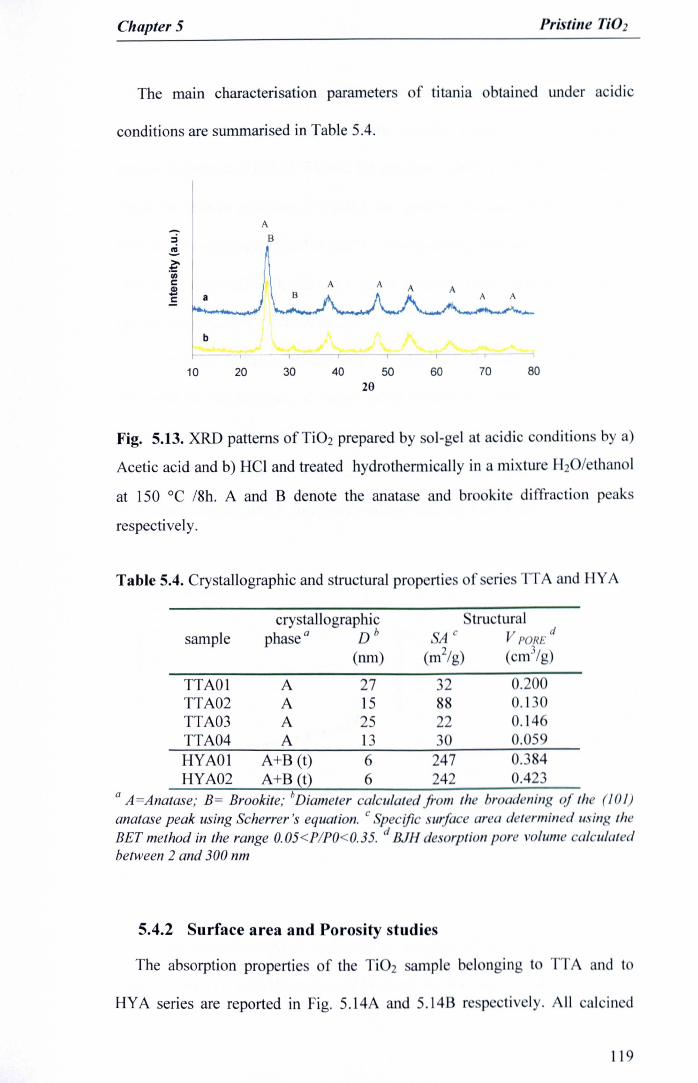
Chapter 5 Prj title TiO]
The main characterisation parameters of titania obtained und r acidic
conditions are summarised in Table 5.4.
AB
A A A
10 20 30 40 502e 60 70 80
Fig. 5.13. XRD patterns of Ti02 prepared by sol-gel at acidic condition by a)
Acetic acid and b) HCI and treated hydrothermically in a rnixtur H2 I thanol
at 150°C 18h. A and B denote the anatase and brookite diffraction p ak
respecti vel y.
Table 5.4. Crystallographic and structural prop rtie f n TT and HY
crystallographic tructuralsample phase a D b 'A C V P RE d
(nm) (m2/g) (cm Ig)
TTAOI A 27 32 0.200TTA02 A 15 8 0.1 0TTA03 A 25 22 0.14TTA04 A 13 30 0.05HYAOI A+B (t) 6 247 0.3 4HYA02 A+B (t) 6 242 0.42
a At=Anatase; B= Brookite; bDiameter al ulated from the br ad ning of th (101)anatase peak using Scherrer's equation. C Speciji urfa area d termin d usin thBET method in the range O.05<PIPO<0.35. d BJH de .orption p r volum al ulat dbetween 2 and 300 nm
5.4.2 Surface area and Porosity studies
The absorption properties of the Ti02 ampl b I nging t T and t
HYA series are reported in Fig. 5.14A and 5.14B r p tiv ly. All al in d
119

Chapter 5 Pristine TiO]
samples prepared under acidic conditions present similar isotherm hap with a
narrow hysteresis loop of type H3. The samples hydroly ed by ac tic acid
present hysteresis at P/Po>O.7 while for samples hydrolysed by H 1 th loop is
found at relative pressures P/Po>0.5 for powder calcined at 400 ° and
P/Po>0.8 for powder calcined at 550 °C. The hysteresis loop of these samples is
typical of materials with slit-shape pores deriving from platelike secondary
particles aggregation (Section 3.2.2).
The position of the hysteresis loop can give an indication about the size of
the pores in the samples, as larger pores absorb at higher valu s of P/Po.
However, it was not possible to obtain a pore distribution by BJH method for
these specimens. Sample TTA04 exhibits sen ibly lower adsorption capacity
than other samples, which corroborate adsorption data (s e Tabl 5.4)
A B140 •____ HCI
140 HCI120 • acetic acid •
120
Ci 100 Ci •.;-~ 100E
" .!:!.:; 80 .."C 80€ ~ •0 60III .,
" "C 60c( c('0 40 g> 40
20 20~; .. ,..
0 00 0.2 0.4 0.6 0.8 0 0.2 0.4 0.6 0.8
P/Po P/Po
Fig. 5.14. N2 adsorption-desorption i otherm of. 2 ampl pr par d in a id
conditions by acetic acid ( • ) and by H I(.)and al in d at ) 400 ° and )
550°C.
N2 adsorption-desorption isotherm of amples HYAOI and HYA02 ar
clearly of type IV with H2 hysteresis loop at P/Po>O.4 and a mall ntributi n
120

Chapter 5 Pristine n02
in macroporous region at P/Po approaching 1. From the shape of the hysteresis
loop, an ink-bottle pore type can be predicted. The two hy otherms almo t
overlap, thus in Fig. 5.15 they are plot at different scales. The hydrothermal
treatment at consistent experimental conditions of Ti02 obtained by hydrolysis-
condensation in non-acidic and acidic conditions yields to crystalline materials
with similar adsorption features. Also, the type of acid used during the
hydrolysis step does not affect the adsorption-desorption properties of the
hydrothermal samples.
at;;-
E2--e..of!o....,«g
o 0.2 0.4 0.6 0.8
PIP,
Fig. 5.15. N2 adsorption-desorption isotherms of titania ampl pr par din
acid conditions by acetic acid (.) and by HCI (.) and tr at d hydr th rmi ally
in a mixture 1:1 ethanol/water at 150 "C for 8h.
5.4.3 Morphological studies
SEM micrograph reported in Fig. 5.16 how th differen b tw n titani
obtained with HCl and acetic acid as hydroly j cataly t . In ca f utili ati n
of acetic acid, the catalyst appears made up of big ph ri al aggr gat with
dimension in the range 300-500 nm.
121
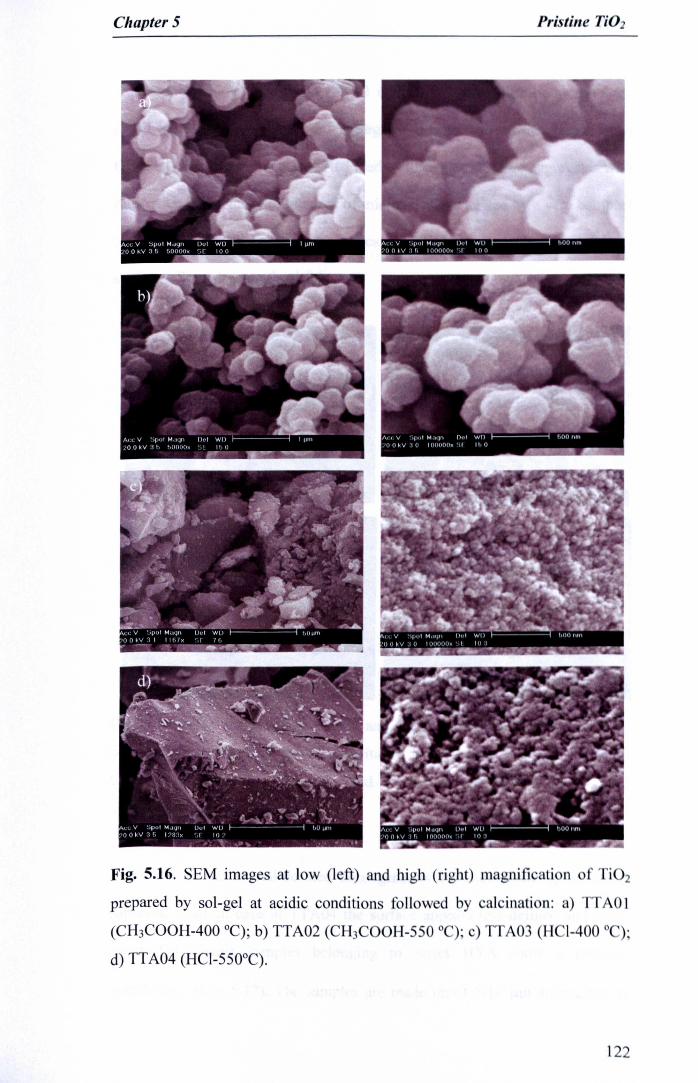
Chapter 5 Pri tine TiO}
Fig. 5.16. SEM images at low (left) and high (right) rnagnif
prepared by sol-gel at acidic conditions follow d by cal in ti n: ) TAO]
(CH3COOH-400 QC);b) TTA02 (CH3COOH-550 ° ). c) TA03 ( 1-400 ° ).
d) TTA04 (HCl-550°C).
122

Chapter 5 Pri tine n02
The morphology of catalyst TTAOI and TTA02 r mbl th m rph logy
of TT series, but the size of the aggregates is from 3 t 5 tim larger wh n
CH3COOH is used. The use of HCI lead to formation of larg aggr gate with
dimension in the range of hundred of microns charact ri d by a v ry compa t
texture. As shown by high magnification M micrograph on cataly t
surface a finer structure is visible.
Fig. 5.17. SEM images at low (I ft) and hi
prepared by sol-gel at acidic c nditi n A) H 1 HYA 1 n
CH3COOH (HYA02) and cry talli d by hydro th I'm 1 tr arm nt in H2
lethanol 1:1 at 150 °C/Sh.
TTA03 shows a well-defin d horn gnu tru tur mad II r m 11
particles, while in case of TTA04 th
compacted Titania samples belonging n HY uliar
morphology (Fig. 5.17). The samples ar mad lip f 5-10 urn f
12

ChapterS Pristine Ti02
irregular shape. The dimension of samples hydrolysed by HCI and by acetic
acid show comparable dimension. High magnification micrographs show that
the surface of the aggregates appears smooth and covered by small particles of
100-200 run dimension
5.4.4 Effect of acidic catalysis during sol-gel
The addition of acid during the hydrolysis-condensation step of the Ti02
preparation yield to Ti02 materials with significant differences compared with
materials prepared under uncatalysed sol-gel step and crystallised at same
conditions.
Since the hydrolysis-condensation carried out under acidic catalysis yields
to titania with crystal size comparable to titania obtained without acidic
catalysts, it can be assumed that the acidic catalysis does not affect the crystal
dimension. This evidence was observed in samples crystallised by thermal and
hydrothermal treatments, where the parameter setting the crystal growth appear
to be the calcination temperature and the water content, respectively.
In the case of Ti02 crystallised by calcination, the presence of acid during the
hydrolysis-condensation step yield to Ti02 with different surface areas despite
the similar crystal size. In general a reduction of the surface area was found for
calcined samples prepared in an acidic environment. The surface area reduction
was found to be more pronounced when HCI was used as catalyst. In the case
of hydrothermally crystallised samples, the use of acid during sol-gel
preparation step does not influence the surface area of the obtained Ti02.
The addition of acid during the sol-gel step appears to have an important
impact on the catalyst morphology as demonstrated by the microscopy studies.
124

ChapterS Pristine TiO]
Relevant differences in terms of shape and dimension of Ti02 particles have
been experienced depending on the presence and nature of the acid used for
samples crystallised by thermal and hydrothermal processes.
The hydrolysis-condensation carried out under acidic catalysis modifies also
the quality and distribution of the pores in the crystallised Ti02• With regard to
calcined materials, the defined bimodal distribution characteristic of Ti02
belonging on series TT is not present in samples prepared by acidic hydrolysis
TTA. A comparison of the hysteresis pattern suggests also a different shape of
the pores, which in series TTA are predominantly slit-like deriving from
secondary particles aggregation. It is interesting to note that by changing the
sol-gel conditions at constant crystallisation conditions it was possible to obtain
Ti02 with similar crystal size, modulating the surface area by changing
porosity and morphological properties.
5.4.5 Photocatalytic activity
5.4.5.1 Studies OD P-25
Commercial photocatalyst P-25 has been widely used to assess the
efficiency of photocatalytic reaction for decomposition and mineralization of
organics in both water and gaseous phases. For this reason, it was chosen as
standard reference for this work, since its effectiveness has been proved by
several authors in the photodegradation of TCE (Jacoby et al., 1994, Lim and
Kim, 2004, Ou and Lo, 2007, Maira et al., 2000). The first part of the
evaluation of the photocatalyst activity focused on the evaluation of P-25 and
on the effect that some experimental parameters have on the conversion of
TCE in our experimental setup. All experiments were conducted using a total
125

Chapter 5 Pristine Ti02
flow rate of 0.04 L s' at which the reaction-controlled regime is guaranteed
(Salvado-Estivill,2007).
No TeE conversion was experienced in absence of catalyst or in absence of
UVA illumination, thus any conversion during the experiments can be ascribed
to the photo-oxidation of TeE on Ti02 surface.
5.4.5.1.1 Effect of light intensity
The reaction rate of 68.5±1.0 f.!MTeE inlet with 8% RH was determined at
different UVA incident light intensities in the range 3.0-41.3 W/m2. The TeE
reaction rate increases with the light intensity, as shown in Fig. 5.18.
90
80
70•<f' 60
E.,.. 50
~ 40 •:1~ 30
20 •10
00 10 20 30 40 50
I (W/m')
Fig. 5.18. Effect of UVA incident light intensity (343-380 run with maximum
irradiation peak at 365 nm) on the photo-oxidation rate of 68.5± 1.0 f.!M T E.
(8% RH; flow rate ofO.04 Lis).
The correlation between reaction rate and incident light inten ity follow a
power law r = k 'la (Section 2.2.10.1). The data linearization through a log-log
plot is reported in Fig. 5.19 and allows to identify two di tinct inten ity
regions, where the correlation between the reaction rate and th light int n ity
is of different order. For light intensities up to about 20 W1m2 th C rr lation j
of first order (a=0.97), while in the range 20-41 W/m2 a 0.61 order i found. In
126
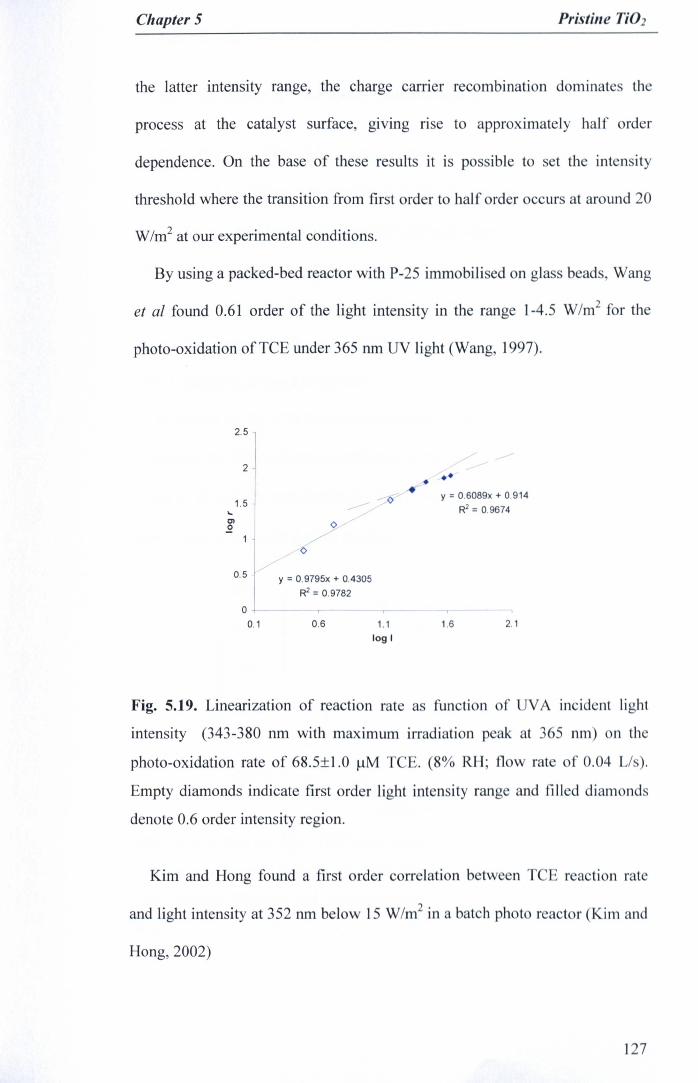
Chapter 5 Pr; tine Ti02
the latter intensity range, the charge earner recombination dominate th
process at the catalyst surface, giving rise to approximately half order
dependence. On the base of these results it is possible to set the intensity
threshold where the transition from first order to half order occurs at around 20
W/m2 at our experimental conditions.
By using a packed-bed reactor with P-25 immobilised on glass beads, Wang
et al found 0.61 order of the light intensity in the range 1-4.5 W/m2 for the
photo-oxidation ofTCE under 365 nm UV light (Wang, 1997).
2.5
2 •••... y = 0.6089x + 0.914R2 = 0.96741.5...
r:n2 o-:
o
0.5 y = 0.9795x + 0.4305R2 = 0.9782
o -i-------r--0.1 0.6 1.1
log I1.6 2.1
Fig. 5.19. Linearization of reaction rate as function of UVA incident light
intensity (343-380 nm with maximum irradiation peak at 365 11m) 11 th
photo-oxidation rate of 68.5±1.0 I-lM TCE. (8% RH; flow rat of 0.04 LI ).
Empty diamonds indicate first order light intensity range and filled di mond
denote 0.6 order intensity region.
Kim and Hong found a first order corr lation betw n 1 reacti n r t
and light intensity at 352 nrn below 15 W/m2 in a batch ph to react r (Kim and
Hong,2002)
127
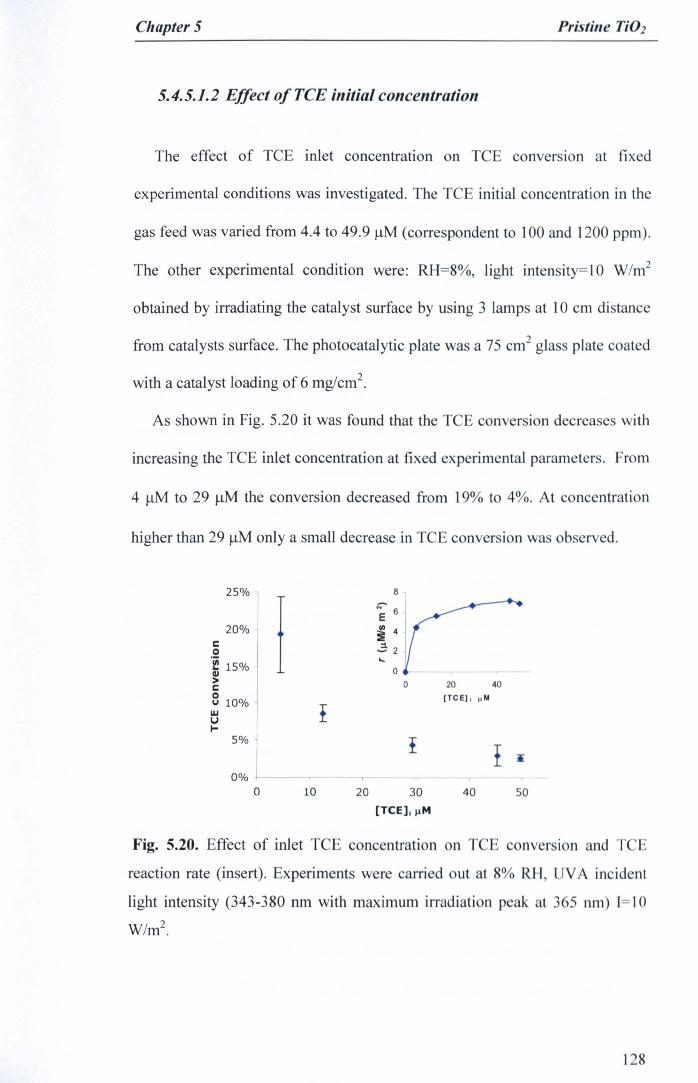
Chapter5 Pristine Ti02
5.4.5.1.2 Effect o/TCE initial concentration
The effect of TeE inlet concentration on TeE conversion at fixed
experimental conditions was investigated. The TeE initial concentration in the
gas feed was varied from 4.4 to 49.9 ulvl (correspondent to 100 and 1200 ppm).
The other experimental condition were: RH=8%, light intensity=lO W/m2
obtained by irradiating the catalyst surface by using 3 lamps at 10 cm distance
from catalysts surface. The photocatalytic plate was a 75 cm2 glass plate coated
with a catalyst loading of 6 mg/cnr'.
As shown in Fig. 5.20 it was found that the TeE conversion decreases with
increasing the TeE inlet concentration at fixed experimental parameters. From
4 )..lMto 29 )..lMthe conversion decreased from 19% to 4%. At concentration
higher than 29 )..lMonly a small decrease in TeE conversion was observed.
25% 6
! ;:;"'6E
20% ~ 4e 320'f 15%
....CII 0> 0 20 40C0 [TeE], ~Mu 10%wuI-
5% I I *0%
0 10 20 30 40 50[TeE]II1M
Fig. 5.20. Effect of inlet TeE concentration on T conv r i nand T
reaction rate (insert). Experiments were carried ut at 8% RH UVA incid nt
light intensity (343-380 run with maximum irradiation p ak at 3 5 nm) r=10
W/m2,
128
Chapter 5 Pristine Ti02
The insert in Fig. 5.20, reports a plot of TeE reaction rate vs. TeE inlet
concentration. This graph clearly indicates a saturation of the adsorption or
"active" adsorption sites on the catalysts surface with increasing TeE
concentration and agrees with previous reports from other authors. Lim and
Kim (2004) found that the gas phase photodegradation of TeE on Degussa p.
25 decreases linearly with increasing the initial TeE concentration in the range
100-500 ppm in an annulus fluidised bed photoreactor. The same trend was
also found in a flat plate photoreactor by Demeestere and coworkers (2004).
Since the photocatalytic process is a surface process, it is always valid the
assumption that only adsorbed pollutant can undergo photodegradation.
However, due to the electron-hole recombination process, not all adsorption
sites at the surface will be reached by the h+ that initiate the process. Since the
photocatalytic and recombination competition depends on the photon flux at
the catalyst surface, at fixed light intensity a fixed number of 'active" sites at
the surface are available for TeE degradation. From our results, the saturation
of P-2S at our experimental conditions is reached at TeE concentration of 30
flM (around 700 ppm).
5.4.5.1.3 Effect of RH
The effect of relative humidity in the interval 1-65% on TeE conversion
was investigated and the obtained results are reported in Fig. 4.20. TeE initial
concentration was 34.5±1.0 f.1M, UVA incident light intensity was 1=24.36
W/m2•
Increasing the relative humidity from 1 to 4% there is an increase in the
TeE conversion. Water is easily adsorbed on Ti02 surface, where it can act as
129
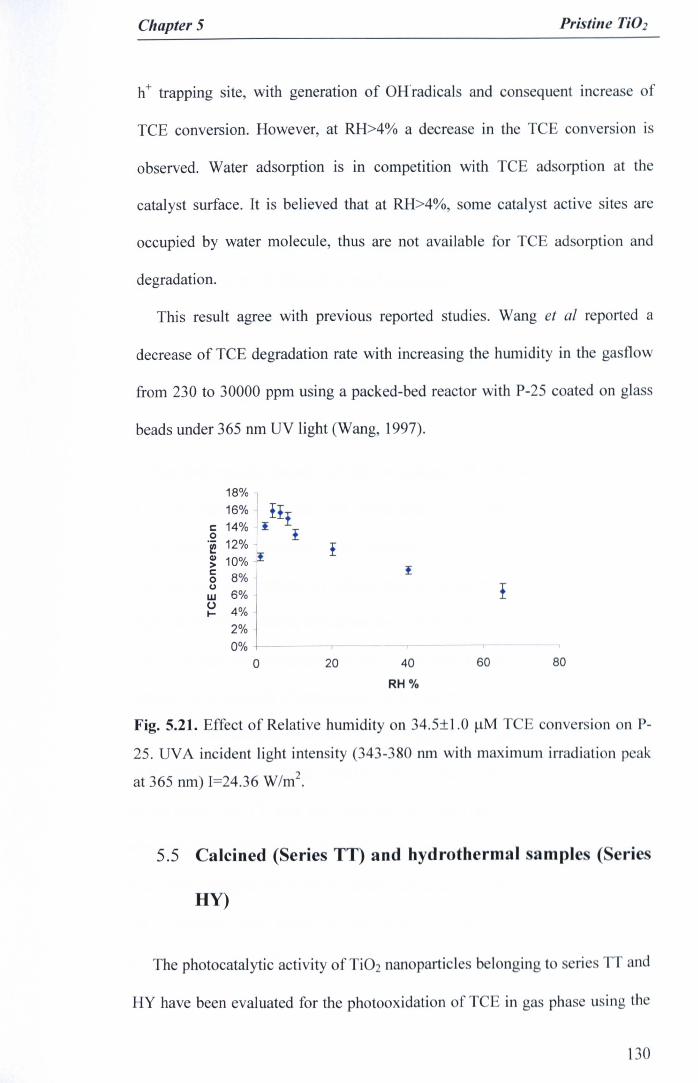
Chapter 5 Pristine TiO]
h+ trapping site, with generation of OHradicals and consequent increase of
TCE conversion. However, at RH>4% a decrease in the TCE conversion is
observed. Water adsorption is in competition with TCE adsorption at the
catalyst surface. It is believed that at RH>4%, some catalyst active sites are
occupied by water molecule, thus are not available for TCE adsorption and
degradation.
This result agree with previous reported studies. Wang et al reported a
decrease of TCE degradation rate with increasing the humidity in the gasflow
from 230 to 30000 ppm using a packed-bed reactor with P-25 coated on glass
beads under 365 nm UV light (Wang, 1997).
18%16% HI
e 14% :I f0.~ 12% fQI 10%>e 8%0ow 6%o 4%I-
2%0% T -t
0 20 40 60 80RH%
Fig. 5.21. Effect of Relative humidity on 34.5±1.0 f.lM T conversion on P-
25. UVA incident light intensity (343-380 nm with maximum irradiation peak
at 365 run) I=24.36 W/m2•
5.5 Calcined (Series TT) and hydrothermal samples ( erie
HY)
The photocatalytic activity of Ti02 nanoparticle b longing to T and
HY have been evaluated for the photooxidation of TC in gas phas u ing the
130
Chapter5 Pristine ri01
gas phase reactor in its final configuration (section 3.2.10.4). All experiments
were conducted using a total flow rate of 0.04 L s·l at which the reaction-
controlled regime is guaranteed (Salvado-Estivill, 2007); TeE inlet
concentration was 35±2 J.lM(870±30 ppmv) and applying three different light
intensities (343-380 nm with maximum irradiation peak. at 365 nm) at the
catalyst surface: 11.2,28.6,41.2 W/m2 respectively.
Preliminary experiments carried out in absence of catalyst or in absence of
UV illumination show no variation in the TeE concentration, thus the TeE
conversion during the catalyst evaluation can be ascribed to the photocatalytic
oxidation of TeE on the Ti02 surface.
The first samples tested were the amorphous Ti02 obtained with the three
different synthesis routes. No detectable TeE photo-oxidation on the
amorphous Ti02 powders was observed. This result corroborate with
experimental observation of photocatalytic inactivity of amorphous Ti02
reported by other authors, which has been attributed to the high recombination
rate of photoexcited electron-hole pairs at the many defects sites present at the
surface and in the bulk of amorphous Ti02 (Ohtani et al., 1997).
Crystallined samples were then tested. Figure 5.22 reports and compares the
TeE conversion percentage obtained at the three different light intensities
investigated, on TT and RY samples and includes also the behavior of
commercial catalyst P-25 evaluated in the same experimental conditions. All
crystallined samples show some photocatalytic activity for TeE degradation in
the gas-phase, and some of the specimens show considerably higher
photoactivity than P-25.
131
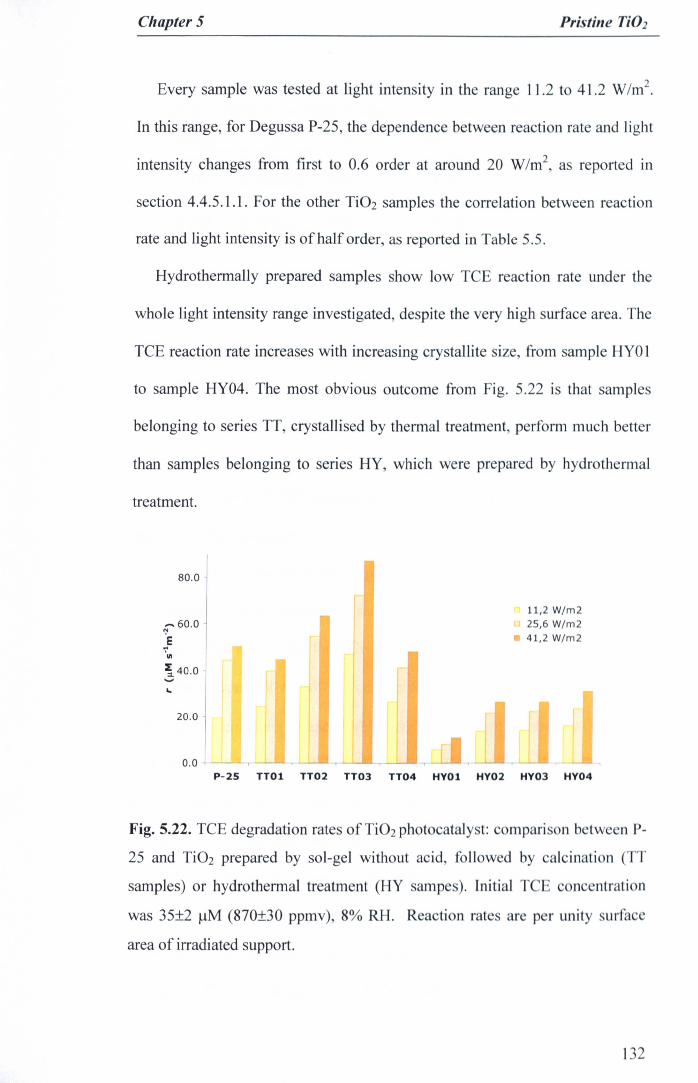
Chapter 5 Pristine Ti02
Every sample was tested at light intensity in the range 11.2 to 41.2 W1m2.
In this range, for Degussa P-25, the dependence between reaction rate and light
intensity changes from first to 0.6 order at around 20 W/m2, as reported in
section 4.4.5.1.1. For the other Ti02 samples the correlation between reaction
rate and light intensity is of half order, as reported in Table 5.5.
Hydrothermally prepared samples show low TeE reaction rate under the
whole light intensity range investigated, despite the very high surface area. The
TeE reaction rate increases with increasing crystallite size, from sample HYO1
to sample HY04. The most obvious outcome from Fig. 5.22 is that samples
belonging to series TT, crystallised by thermal treatment, perform much better
than samples belonging to series HY, which were prepared by hydrothermal
treatment.
80.0
Cl 11,2 W/m2[J 25,6 W/m2• 41,2 W/m2
.....60.0r:-E~'III
~40.0........
P-25 TTOl TT02 TT03 TT04 HYOl HY02 HY03 HY04
Fig. 5.22. TeE degradation rates ofTi02photocataly t: c rnpari on betw n P-
25 and Ti02 prepared by sol-gel without acid, followed by calcination (T
samples) or hydrothermal treatment (HY samp ). Initial T c nc ntrati n
was 35±2 ulvl (870±30 ppmv), 8% RH. Reacti n rate ar p r unity urfac
area of irradiated support.
132

Chapter 5 Pristine TiO]
Table 5.5. Effect of light intensity on TeE reaction rate on Ti02 nanoparticlesbelonging to series TT and HY. Values of et and correlation coefficient R.
Sample et R Sample et RTTOI 0.52±0.09 0.9945 HYOI 0.51±0.04 0.9954TT02 0.52±0.08 0.9974 HY02 0.53±0.04 0.9914TT03 0.50±0.04 0.9890 HY03 0.51±0.06 0.9889TT04 0.49±0.03 0.9973 HY04 0.53±0.03 0.9979
This photoactivity improvement can be correlated with the water content
during the hydrothermal process: the higher the water content during the
hydrothermal process, the higher is the photoactivity of obtained catalyst. Very
little difference in the photoactivity of sampes HY02 and HY03 is observed,
compatibly with the minor difference in the mean crystallite size which were
estimated 7 and 8 nm respectively (from XRD pattern). If compared with the
photoactivity of P-25, HY samples performances are much lower in the whole
intensity range investigated.
All samples in the thermally prepared series show considerably higher TeE
conversions than hydrothermal samples. A comparison made among the
calcined series shows that the TeE conversion increases with the calcination
temperature from 400 to 550 °e i.e. samples TTOl, TT02 and IT03; to drop
when the calcinations temperature is 600 °e in case of sample TT04. In
addition, it can be observed that, at the lowest light intensity (11.2 W1m2), all
thermal samples show higher activity than P-2S. At higher light intensities,
25.6 and 41.2 W/m2, catalysts TTOI shows lower conversions than P-25, while
TT04 shows photoactivity comparable with that performed by P-25. Samples
IT02 and IT03 present enhanced photocatalytic activity with respect to P-25
in the entire light intensity range considered in this study. The best performing
catalyst is TT03 which shows a TeE conversion 2.5 times higher than P-25 at
133

Chapter 5 Pristine Ti02
the lowest light intensity and almost double conversion at the highest light
intensity.
XPS analysis was performed on all samples belonging to the series TT in
order to investigate the possible differences in surface composition or the
existence of impurities at the catalyst surface that could influence the
photocatalytic behaviour. Fig. 5.23A reports the XPS survey spectra of sample
TTO1 with peak assignation. The other samples present similar features.
Photoelectron peaks for Ti and 0 were recorded at typical Ti02 binding
energy. Also C at 284.8 eV was clearly detectable as surface impurity in all
samples, which can derive from the incomplete decomposition of the carbon in
the starting material and from air absorbents.
o.ie
A
T12p3/2
Tj 28
c te),
TI3p
~L,M• __ -..v(~y,
B
• ;3 Is ) S
N. '1f1f')
Fig. 5.23. A: representative XPS survey spectra of Ti02 nanoparticJe obtain d
by calcination. B: detail ofC Is signal.
Table 5. 6. Atomic composition (A) and peak comp iti n (B) f P-25 andTi02 nanoparticles obtained by calcination a obtained by XP analy i .
A % atomic composition Bo Is Ti 2p C Is
TTOI 67.06 26.20 6.74 TTO]TT02 66.24 26.45 7.30 TT02TT03 66.61 25.88 4.50 TT03TT04 66.07 26.06 7.87 TT04P-25 66.27 25.68 8.08 P-25
134
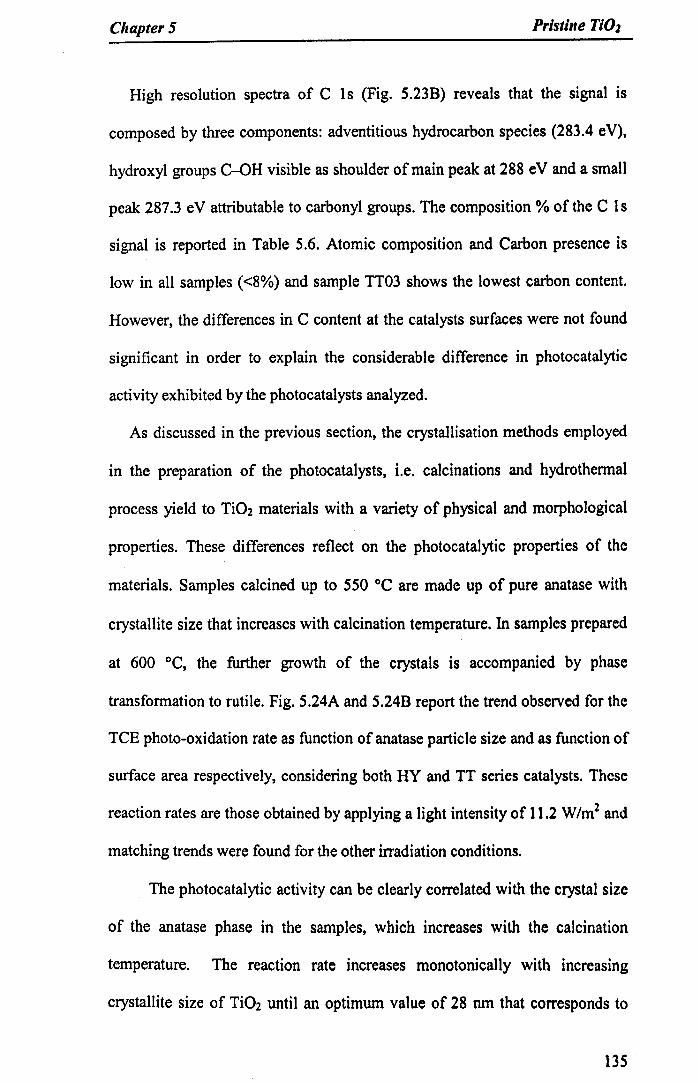
Chapter 5 Pristine TI02
High resolution spectra of C 1s (Fig. 5.23B) reveals that the signal is
composed by three components: adventitious hydrocarbon species (283.4 eV),
hydroxyl groups C-OH visible as shoulder of main peak at 288 eV and a small
peak 287.3 eV attributable to carbonyl groups. The composition % of the C Is
signal is reported in Table 5.6. Atomic composition and Carbon presence is
low in all samples «8%) and sample TT03 shows the lowest carbon content.
However, the differences in C content at the catalysts surfaces were not found
significant in order to explain the considerable difference in photocatalytic
activity exhibited by the photocatalysts analyzed.
As discussed in the previous section, the crystallisation methods employed
in the preparation of the photocatalysts, Le. calcinations and hydrothermal
process yield to Ti02 materials with a variety of physical and morphological
properties. These differences reflect on the photocatalytic properties of the
materials. Samples calcined up to 550°C are made up of pure anatase with
crystallite size that increases with calcination temperature. In samples prepared
at 600 °C, the further growth of the crystals is accompanied by phase
transformation to rutile. Fig. 5.24A and 5.24B report the trend observed for the
TCE photo-oxidation rate as function of anatase particle size and as function of
surface area respectively, considering both HY and TT series catalysts. These
reaction rates are those obtained by applying a light intensity of 11.2 W1m2 and
matching trends were found for the other irradiation conditions.
The photocatalytic activity can be clearly correlated with the crystal size
of the anatase phase in the samples, which increases with the calcination
temperature. The reaction rate increases monotonically with increasing
crystallite size of Ti02 until an optimum value of 28 nm that corresponds to
135
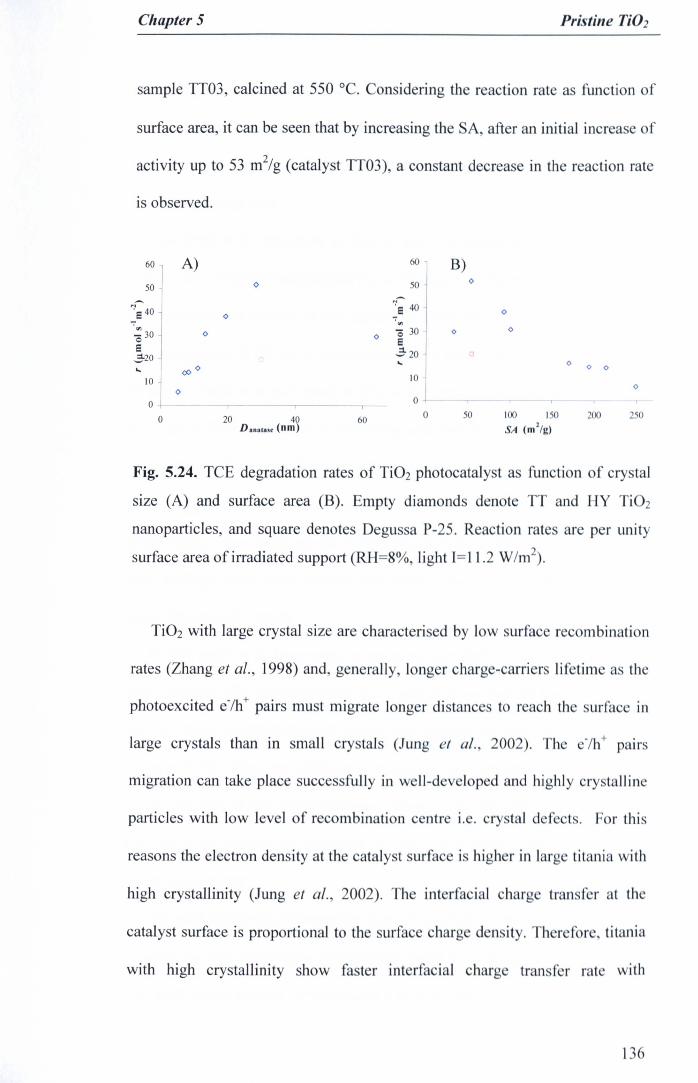
Chapter 5 Pristine Ti02
sample TT03, calcined at 550 QC. Considering the reaction rate as function of
surface area, it can be seen that by increasing the SA, after an initial increase of
activity up to 53 m2/g (catalyst TT03), a constant decrease in the reaction rate
is observed.
60 A) 60 B)o 50 o
50~ 'I
S 40'Ie 40 oo .,..,.'"'" o "0 30 e o
"030 o Ee~20~20 .. o.. <f><> <> o
10 10oo
0 0
0 20 40 60 0 50 100 150 200 250D.nato,t (nrn) SA (rn2/g)
Fig. 5.24. TCE degradation rates of Ti02 photocatalyst as function of crystal
size (A) and surface area (B). Empty diamonds denote TT and BY Ti02
nanoparticles, and square denotes Degussa P-25. Reaction rate ar per unity
surface area of irradiated support (RH=8%, light 1=11.2 W/m2).
Ti02 with large crystal size are characterised by low surface rec mbination
rates (Zhang et al., 1998) and, generally, longer charge-carri r lifetim a the
photoexcited evh + pairs must migrate longer distances to reach th urfacc in
large crystals than in small crystals (lung et al. 2002). Th -/h+ pair
migration can take place succes fully in w II-d veloped and highly cry tallin
particles with low level of recombination c ntr I.. cry tal def ct. For this
reasons the electron density at the cataly t urfac high r in larg tit nia with
high crystallinity (lung et al., 2002). Th int rfa ial h rg transf r at th
catalyst surface is proportional to the urfac charg den ity. Th r f r , titania
with high crystallinity show faster interfacial charg tran fer rate with
136

ChapterS Pristine 1102
increasing particle size. The trend of photocatalytic activity with crystallite
size indicates a high crystallinity of titania calcined samples and an increase the
interfacial charge transfer rate from catalyst surface to adsorbed species with
increasing crystal size.
However, it is important to notice that the linear relationship between
crystal size and photocatalytic activity of titania is observed as long as rutile is
not present in the sample. In fact, in sample TT04 the growth of Ti02 crystal to
an average size of 64 nm is accompanied by a phase conversion from anatase
to rutile, which was estimated in 5% in this sample. Sample TT04 shows a
decrease in TCE conversion of 40% compared with best sample TT03. Despite
this reduction its photoactivity is still higher than reference sample P-25. This
result suggest that pure anatase titania with high crystallinity lead to higher
photoactivity than rutile-anatase mixed phase photocatalysts and corroborates
with findings from other authors (Kuo-Hua Wang et al., 1998, Jung et al.,
2002, Zhang et al., 1998).
At this point it is interesting to compare our highly active photocatalysts
with Degussa P-25. In this respect, it is worth noticing that the best performing
catalyst shows a crystal size and surface area that are comparable with those of
Degussa P-25. Thus, the difference in activity and the enhanced activity of
TT03, and also of the other specimens belonging to TT series compared with
Degussa P-25, cannot be explained in terms of a crystal size effect on the
charge transfer rate.
The main difference between the thermal samples and the commercial P-25
concern the crystallographic composition being P·25 made of 75% anatase,
25% rutile while thermal samples consist of pure anatase apart of sample TT04
137

Chapter 5 Pristine TiOl
with 5% of rutile content. However, a consistent evaluation of the role of
crystalline phase was not possible using these samples as only one specimen
contains rutile and in a very small amount. The analysis and comparison of an
analogous series of samples with titania richer in rutile is presented in a
following section of this chapter.
Another distinctive property ofTT samples concerns the porosity, as P-25 is
a non-porous material while thermal samples shows significant mesoporosity
as well as a macroporous contribution. The porosity features of the calcined
sample can play a role in increasing the photocatalytic activity, allowing a
higher adsorption and diffusion of reactive species at the catalyst surface
compared with the non-porous P-25 material.
5.6 Acid-calcined (Series TTA) and acid-hydrothermal
samples (Series HYA)
The photocatalytic properties of Ti02 samples prepared by hydrolysis-
condensation in acidic condition by either acetic acid and HCI and calcined at
400 and 550°C (series TTA) or treated hydrothermically at 1SO °C for 8 hours
in a mixture H20lEthanoi with XH20=0.59 (series HYA) are reported in this
section. The experimental conditions for the evaluation of the photocatalytic
activity are the same reported in the evaluation of series TT and HY, and a
systematic study at three different UV A incident light intensities was carried
out.
The results of the photocatalytic test of calcined (series TTA) samples are
reported in Fig. 5.25 and compared with the photocatalytic activity ofP-2S and
138

Chapter 5 Pristine TiD]
of Ti02 prepared without acidic catalysis and crystallised at analogous
conditions.
It was found that, for a fixed calcinations temperature, the photocatalytic
properties of Ti02 nanoparticles was sensibly different depending on the
utilisation and on the nature of the acidic catalyst used during the hydrolysis-
condensation reaction. Calcined Ti02 obtained with acidic catalysis yields a
photocatalyst with reduced activity for TCE decomposition in the gas-phase,
compared with the analogous Ti02 obtained under uncatalysed conditions. The
photo activity reduction is more pronounced when HCI is used as catalyst
during the hydrolysis-condensation step.
9080
......70III~ 60! 50~ 402; 30a.. 20
10o +-'----'--'-.J---,--'-~.._,_-'-'-_.....--,--L -,--,....___,--,
no acid55O'C o 11,2 W/m2
o 25,6 W/m2• 41,2 W/m2
no acid400 'C
, r [P-25 n03 nA01 nA03 n01 nA02 nA04
HCI
Ac. Ac55O'C
400 'C
Fig. 5.25. Effect of acidic catalysis during hydrolysis-condensation on the
photocatalytic activity of catalysts calcined at 400 °C and 550 ° . Initial T ~
concentration was 33±1 11M (810±15 ppmv), 8% RH, flowrate: 0.04 LI .
Reaction rates are per unity surface area of irradiated upport.
It was also found that the two Ti02 sample prepared in pr ence f ac tic
acid (TTAOI and TTA02) show comparable photocatalytic activity de pite
being calcined at different temperatures. The same b haviour wa found for
catalysts prepared by using HCI and calcined at different temperature (TTA03
139
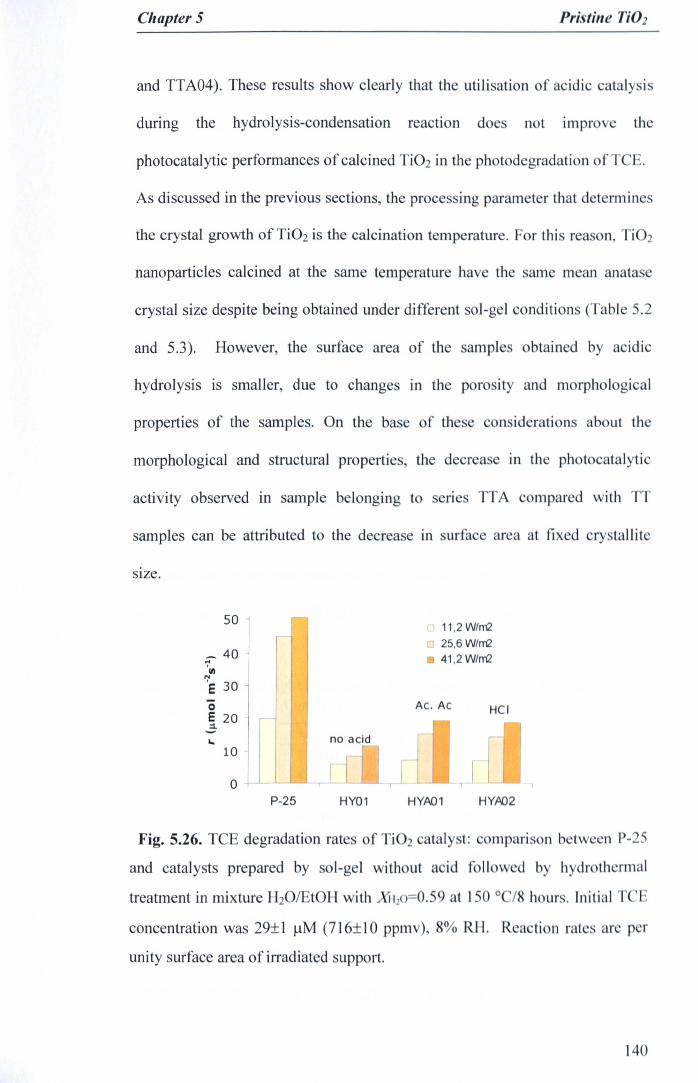
Chapter 5 Pristine no]
and TTA04). These results show clearly that the utilisation of acidic catalysi
during the hydrolysis-condensation reaction does not improv the
photocatalytic performances of calcined Ti02 in the photodegradation of T
As discussed in the previous sections, the processing parameter that determines
the crystal growth of Ti02 is the calcination temperature. For this reason, Ti02
nanoparticles calcined at the same temperature have the same mean anatase
crystal size despite being obtained under different sol-gel conditions (Table 5.2
and 5.3). However, the surface area of the samples obtained by acidic
hydrolysis is smaller, due to changes in the porosity and morphological
properties of the samples. On the base of these consideration about the
morphological and structural properties, the decrease in the photocatalytic
activity observed in sample belonging to series TTA compar d with T
samples can be attributed to the decrease in surface ar a at fixed cry tallite
SIze.
50 n 11,2W/m2u 25,6 W/m2• 41,2 W/m2
_ 40...'VI
':Ie 30oE 20~-
AC. Ac Hel
no acid10
o [P-25 HY01 HYA01 HYA02
Fig. 5.26. TeE degradation rates of Ti 2 cataly t: mpari n b tw en P-25
and catalysts prepared by sol-g I with ut a id f II w d by hydr til rmal
treatment in mixture H20/ t H with .H2 =0.59 t 150 0 / h UJ" • Initial T
concentration was 29± 1 J-lM (716± 10 ppmv)
unity surface area of irradiated support.
re p r
]40

Chapter 5 Pristine Ti02
With respect to the correlation between reaction rate and incident light
intensity, samples belonging to TTA series show half order dependence,
similarly to TT samples (Table 5.7)
In a similar fashion as for thermal Ti02 nanopartic1es, Fig. 5.26 shows the
results of the photocatalytic test carried out on hydrothermal samples HYAO1
and HYA02, compared with P-25 and the analogous Ti02 obtained without
acidic catalysis (HYO1).
In this case the hydrothermal treatment of Ti02 obtained by acidic
hydrolysis-condensation yield to photocatalyst with comparable activity than
analogous samples prepared under uncatalysed conditions at the low incident
light intensity and improved activity at medium and high light intensities. The
type of acid employed during the hydrolysis-condensation reaction does not
appear to sensibly influence the photocatalytic activity of resultant Ti02
nanopartic1es. When compared with reference catalyst P-25, the photocatalytic
activity is still much lower in the whole light intensity range considered.
Table 5.7. Effect of light intensity on TeE reaction rate on Ti02 nanoparticlesbelonging to series TTA and HYA: values of a and correlation coefficient R.
Sample (l RTTAOI 0.54±0.02 0.999TTA02 0.52±0.08 0.994TTA03 0.50±0.06 0.992TTA04 0.49±0.07 0.991HYAOI 0.76±0.06 0.992HYA02 0.78±O.09 0.994
The characterisation of the Ti02 samples belonging to series HYA did not
evidence particular differences in terms of surface area, porosity and anatase
dimension compared with Ti02 belonging to series HY.
141
Chapter 5 Pristine TlOl
It is interesting to notice that samples belonging to HYA series show
respectively a 0.76 and a 0.78 order correlation between reaction rate and light
intensity in the light intensity range under investigation. In the same range, the
hydrothermally treated sample RYOI showed half order dependence with
a=0.51±0.04. This fact indicates that the intensity threshold where the
transition from first order to half order occurs is different for the two sets of
catalysts. In RYA samples the photocatalytic process is still the predominant
process at the catalyst surface, while on HY sample the predominant process is
the recombination. This can explain the difference in photocatalytic activity
found at high light intensities, as for a given light intensity in the range under
investigation the photon harvesting leading to photocatalytic process is higher
for RYA than for RY catalyst.
5.7 Further investigation on calcined Ti02
5.7.1 Ti02 samples
In order to further investigate the role of the phase composition and in
particular the role of rutile content in determine the photocatalytic activity of
Ti02 photocatalysts, another set of Ti02 samples were tested. These samples
were prepared by Dr. Hyeok Choi in the frame of a collaboration with
Professor D.D.Dionysiou, Department of Civil and Environmental
Engineering, University of Cincinnati. The synthesis procedure is essentially
the same employed in the preparation of TT series samples, but with the benefit
of using a consistent calcination time (lh) for all specimens. The calcination
treatment was carried out up to 800°C in order to achieve materials richer in
rutile than those in the TT series. Six samples were prepared and characterised,
142
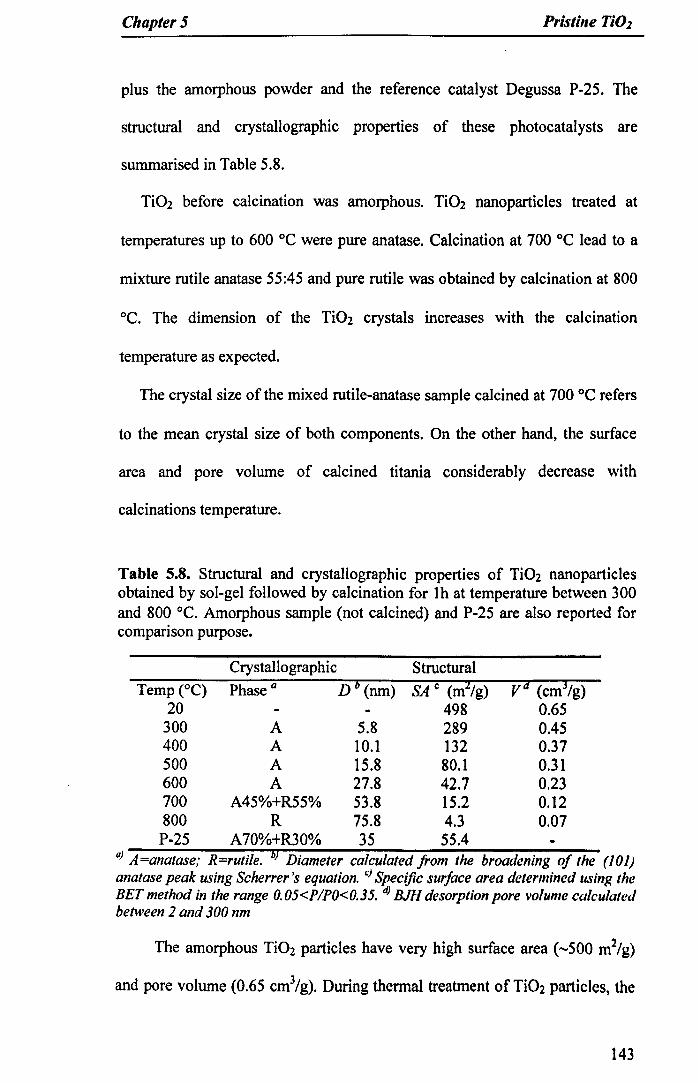
ChapterS Pristine TiO]
plus the amorphous powder and the reference catalyst Degussa P-25. The
structural and crystallographic properties of these photocatalysts are
summarised in Table 5.8.
Ti02 before calcination was amorphous. Ti02 nanoparticles treated at
temperatures up to 600 °C were pure anatase. Calcination at 700 °C lead to a
mixture rutile anatase 55:45 and pure rutile was obtained by calcination at 800
°C. The dimension of the Ti02 crystals increases with the calcination
temperature as expected.
The crystal size of the mixed rutile-anatase sample calcined at 700 °C refers
to the mean crystal size of both components. On the other hand, the surface
area and pore volume of calcined titania considerably decrease with
calcinations temperature.
Table 5.8. Structural and crystallographic properties of Ti02 nanoparticlesobtained by sol-gel followed by calcination for 1h at temperature between 300and 800 °C. Amorphous sample (not calcined) and P-25 are also reported forcompanson purpose.
Crystallographic StructuralTemp eC) Phase a D 6 (nm) SA C (mz/g)
20 498300 A 5.8 289400 A 10.1 132500 A 15.8 80.1600 A 27.8 42.7700 A45%+R55% 53.8 15.2800 R 75.8 4.3P-25 A70%+R30% 35 55.4
Vd (cm3/g)0.650.450.37OJI0.230.120.07
0) A=anatase; R=rutile. b) Diameter calculated from the broadening of the (101)anatase peak using Scherrer's equation. c) Specific surface area determined using theBET method in the range 0.05<PIPO<0.35. d) BJH desorption pore volume calculatedbetween 2 and 300 nm
The amorphous Ti02 particles have very high surface area (-500 m2/g)
and pore volume (0.65 cm3/g). During thermal treatment of Ti02 particles, the
143

Chapter 5 Pristine TiO]
amorphous phase was compacted and its porous structure was collapsed. As a
result, the surface area and porosity were dramatically reduced with increasing
calcinations temperature. Catalyst prepared at 600°C shows a surface area
almost seven times lower than that of the sample calcined at 300 °C. The
surface area and pore volume of rutile Ti02 are only 4.3 m2/g and 22.9 cm3/g,
respectively. The surface area, particle size, and phase composition trend with
calcination temperature are comparable with that obtained for TT series,
confirming the material properties reproducibility of the calcination method.
From the characterization, the properties of P-2S were very similar to those
of Ti02 calcined at 500-600 °e in terms of structural properties (i.e.: surface
area) and to those of Ti02 calcined at 600-700 "C in terms of crystallographic
properties (i.e.: phase composition and crystal size).
5.7.2 Photocatalytic activity
No TeE conversion was observed during preliminary experiments carried
out in the dark or in absence of catalyst, and no detectable TeE photo-
oxidation on amorphous Ti02 was observed. For this set of samples the TeE
inlet concentration was 2S±3 J.lM (61O±42 ppmv) and RH=8%. The effect of
radiation intensity was investigated in the range 5.1-20.8 W/m2•
The correlation between the reaction rate and incident light intensity in the
range 5.1-20.8 W/m2 is reported in Table 5.9. In this light intensity range P-25
follows a first order dependence. Similarly photocatalysts containing rutile
show a first order correlation, while anatase samples vary between half order
and first order.
144
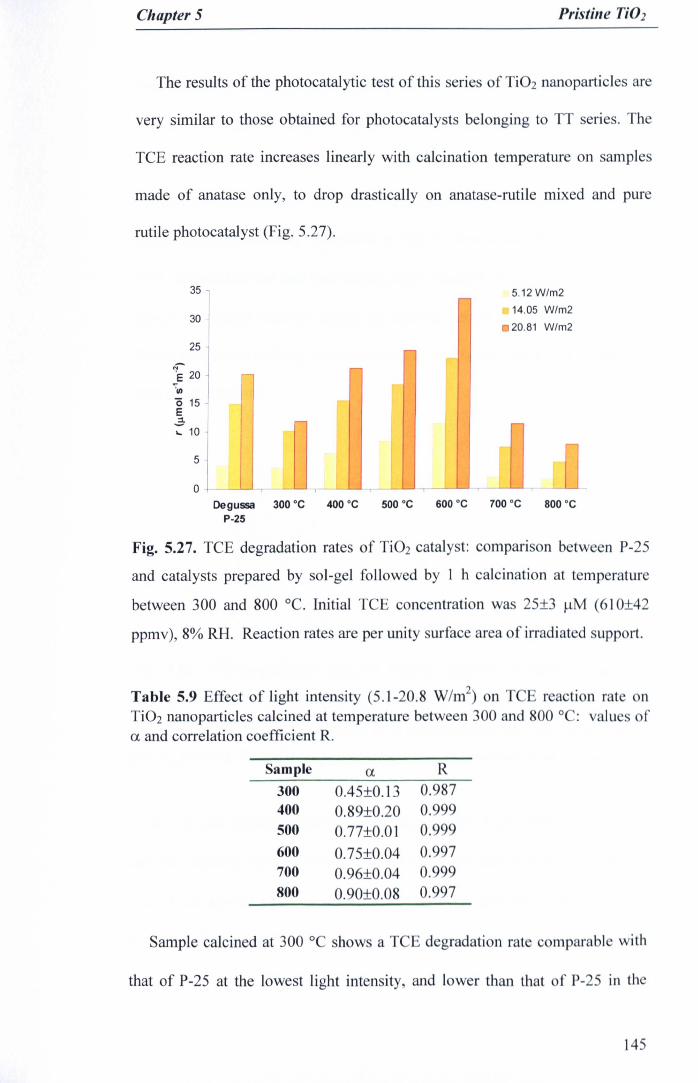
Chapter 5 Pristine TiD2
The results of the photocatalytic test of this series of Ti02 nanoparticles are
very similar to those obtained for photocatalysts belonging to TT series. The
TCE reaction rate increases linearly with calcination temperature on samples
made of anatase only, to drop drastically on anatase-rutile mixed and pure
rutile photocatalyst (Fig. 5.27).
35
5
r-
.... ........ .-
0-
r- r-
r-
fr-
I'" L 1: l
5.12 W/m2.14.05 W/m220.81 W/m2
30
25
1: 20'I'm'0 15E::1.:- 10
oOegussa 300 °C 400 °C 500 °C 600°C 700 °C 800 ·C
P-25
Fig. 5.27. TCE degradation rates of Ti02 catalyst: compari on between P-25
and catalysts prepared by sol-gel followed by I h calcination at temperature
between 300 and 800°C. Initial TCE concentration was 25±3 I-LM (610±42
ppmv), 8% RH. Reaction rates are per unity surface area of irradiat d upport.
Table 5.9 Effect of light intensity (5.l-20.8 W/m2) on Traction rat nTi02 nanopartic1es calcined at temperature betwe n 300 and 800 ° : value ofa and correlation coefficient R.
Sample a R300 0.45±0.13 0.987400 0.89±0.20 0.999500 0.77±0.01 0.999600 0.75±0.04 0.997700 0.96±0.04 0.999800 0.90±0.08 0.997
Sample calcined at 300°C shows a T degradation rate c mparabl with
that of P-25 at the lowest light intensity, and lower than that of P-25 in th
145
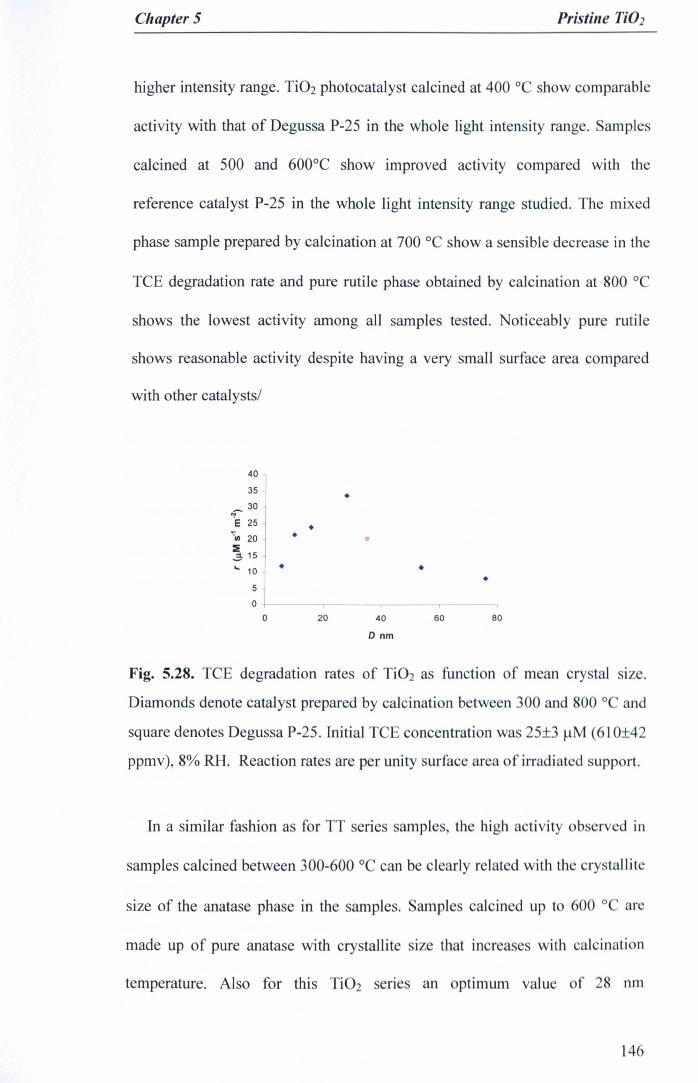
Chapter 5 Pristine Ti02
higher intensity range. Ti02 photocatalyst calcined at 400°C show comparable
activity with that of Degussa P-25 in the whole light intensity range. Samples
calcined at 500 and 600°C show improved activity compared with the
reference catalyst P-25 in the whole light intensity range studied. The mixed
phase sample prepared by calcination at 700°C show a sensible decrease in the
TCE degradation rate and pure rutile phase obtained by calcination at 800°C
shows the lowest activity among all samples tested. Noticeably pure rutile
shows reasonable activity despite having a very small surface area compared
with other catalysts/
403530
"IE 25 •
"'Cl) 20 •::E~ 15'" 10 •
50
0 20
•
•
• •----.- ----r -r
40 60 80D nm
Fig. 5.28. TCE degradation rates of Ti02 as function of mean cry tal size.
Diamonds denote catalyst prepared by calcination betwe n 300 and 800 ° and
square denotes Degussa P-25. Initial TCE concentration wa 25±3 ~M (61 0±42
ppmv), 8% RH. Reaction rates are per unity surface area of irradiat d upport.
In a similar fashion as for TT series sampl s, the high activity ob erv d in
samples calcined between 300-600 °C call b clearly relat d with the ry tallit
size of the anatase phase in the samples. Sampl s calcin d up t 00 0 ar
made up of pure anatase with crystallite size that increa with calcinati n
temperature. Also for this Ti02 series an optimum value of 28 nm
146
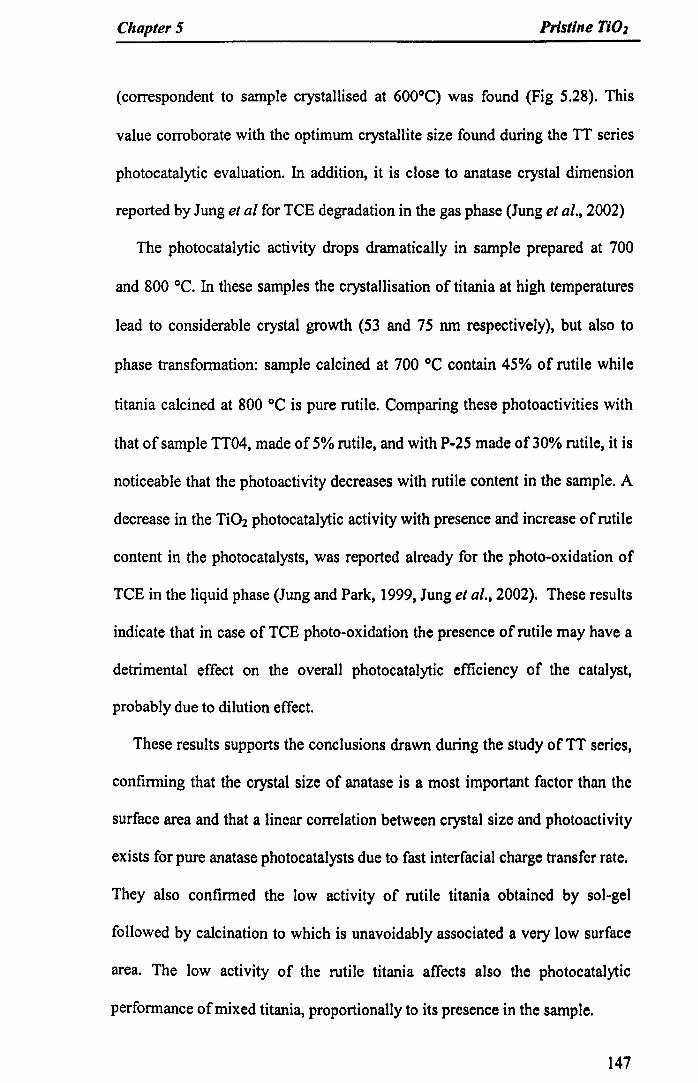
ChapterS Pristine TiOl
(correspondent to sample crystallised at 600°C) was found (Fig 5.28). This
value corroborate with the optimum crystallite size found during the TT series
photocatalytic evaluation. In addition, it is close to anatase crystal dimension
reported by Jung et al for TeE degradation in the gas phase (Jung et al., 2002)
The photocatalytic activity drops dramatically in sample prepared at 700
and 800°C. In these samples the crystallisation of titania at high temperatures
lead to considerable crystal growth (53 and 75 nm respectively), but also to
phase transformation: sample calcined at 700°C contain 45% of rutile while
titania calcined at 800°C is pure rutile. Comparing these photoactivities with
that of sample TT04, made of 5% rutile, and with P-25 made of 30% rutile, it is
noticeable that the photoactivity decreases with rutile content in the sample. A
decrease in the Ti02 photocatalytic activity with presence and increase of rutile
content in the photocatalysts, was reported already for the photo-oxidation of
TeE in the liquid phase (Jung and Park, 1999, Jung et al., 2002). These results
indicate that in case of TeE photo-oxidation the presence of rutile may have a
detrimental effect on the overall photocatalytic efficiency of the catalyst,
probably due to dilution effect.
These results supports the conclusions drawn during the study of TT series,
confirming that the crystal size of anatase is a most important factor than the
surface area and that a linear correlation between crystal size and photoactivity
exists for pure anatase photocatalysts due to fast interfacial charge transfer rate.
They also confirmed the low activity of rutile titania obtained by sol-gel
followed by calcination to which is unavoidably associated a very low surface
area. The low activity of the rutile titania affects also the photocatalytic
performance of mixed titania, proportionally to its presence in the sample.
147

Chapter 5 Pristine TiD]
5.8 Summary
A range of highly active calcined Ti02 photocatalysts has been obtained by
a modified sol-gel method, which exceed Degussa P-25 photoactivity for
degradation of TCE in the gas phase. The effects of processing parameters on
the structural, crystallographic, morphological and photocatalytic properties of
sol-gel obtained Ti02 have been studied. In particular the effect of acidic
hydrolysis condition during the hydrolysis-condensation reaction and the
impact of thermal and hydrothermal treatment as crystallisation methods have
been investigated. It was found that calcination temperature and water content
rule the titania crystal growth in the thermal and hydrothermal processes,
respectively. For given crystallisation conditions, the acidic hydrolysis during
the hydrolysis step does not affect the structural and crystallographic properties
of the titania. However, it has an important effect on the morphology of the
particle aggregates.
With regard to the photocatalytic properties, it was found that samples
obtained by hydrothermal treatment show much lower activity compared with
Ti02 crystallised by calcination, despite having higher surface area. The
photoactivity strongly depends on the crystal size of titania and also on the
presence and percentage of rutile in the photocatalyst. A linear relationship
between crystal size and photoactivity was found in anatase titania, probably
due to faster interfacial charge transfer rate at catalyst surface. The best
performing sample was pure anatase, with an optimal crystal size of 28 nrn.
The presence of rutile has a negative effect on the photocatalytic activity
probably due to its low activity towards TCE photodegradation. The synthesis
procedure has proved to be highly reproducible with respect to material
148

Chapter 5 Pristine Ti02
properties and photocatalytic activities as demonstrated by studies carried out
on Cincinnati's prepared specimens.
149

Chapter 6
Nitrogen doped Ti02

Chapter 6 Nitrogen doped TiO]
6.1 Introduction
The understanding of the photocatalytic mechanism and the development of
materials for photocatalytic applications went through considerable
development in the last few decades. However, despite this progress, the
design of a photocatalyst that can be used under solar or natural illumination
still represent a major challenge for the scientific community in the field of
photocatalysis (Section 2.2.7.1).
In Chapter 5 the improved photocatalytic activity under UV irradiation of a
range of Ti02 samples obtained by a modified sol-gel method have been
reported and discussed. The enhanced activity of some of these Ti02
nanoparticles was attributed to a fast interfacial electron transfer at the catalyst
surface with adsorbed species during the photocatalytic process.
In the present chapter, the modification of these improved Ti02 materials by
means of anionic doping is reported. The purpose is to obtain incorporation of
N atoms into the Ti02 lattice, which should either shift the photocatalytic
activation to visible light range, or create crystalline defects on the catalyst
surface which might result in enhanced charge separation, leading to higher
activity also under UV light (Section 2.2.7.3).
6.2 Samples prepared
The synthesis procedure of N-doped Ti02 photocatalysts is based on the
modified sol-gel scheme reported in the previous chapter, which consists of a
hydrolysis-condensation reaction, followed by calcination. The introduction of
N atoms in the titania crystal lattice has been carried out in different ways:
150
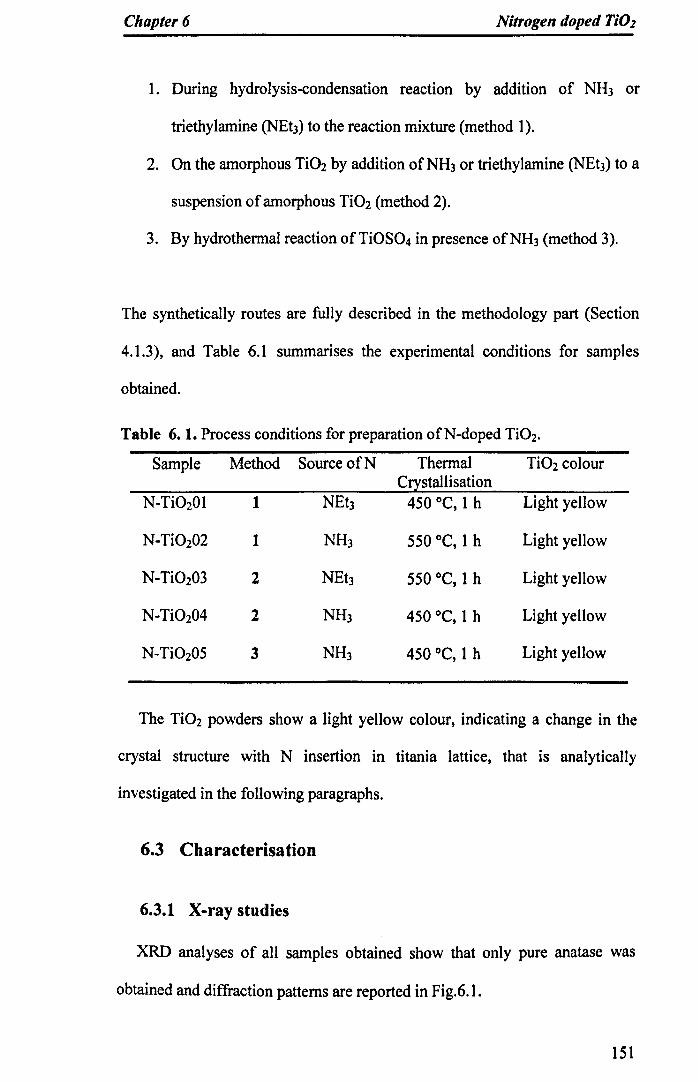
Chapter6 Nitrogen doped TiO]
1. During hydrolysis-condensation reaction by addition of NB3 or
triethylamine (NEt3)to the reaction mixture (method 1).
2. On the amorphous Ti02 by addition of NB3 or triethylamine (NEt3) to a
suspension of amorphous Ti02 (method 2).
3. By hydrothermal reaction of TiOS04 in presence ofNH3 (method 3).
The synthetically routes are fully described in the methodology part (Section
4.1.3), and Table 6.1 summarises the experimental conditions for samples
obtained.
Table 6.1. Process conditions for preparation ofN-doped Ti02•
Sample Method Source ofN Thermal Ti02 colourCrystallisation
N-Ti0201 1 NEt3 450°C,1 h Light yellow
N-Ti0202 1 NB3 550°C,1 h Light yellow
N-Ti0203 2 NEt) 550°C, 1 h Light yellow
N-Ti0204 2 NH3 450°C, 1 h Light yellow
N-Ti0205 3 NB3 450°C, 1 h Light yellow
The Ti02 powders show a light yellow colour, indicating a change in the
crystal structure with N insertion in titania lattice, that is analytically
investigated in the following paragraphs.
6.3 Characterisation
6.3.1 X-ray studies
XRD analyses of all samples obtained show that only pure anatase was
obtained and diffraction patterns are reported in Fig.6.1.
151
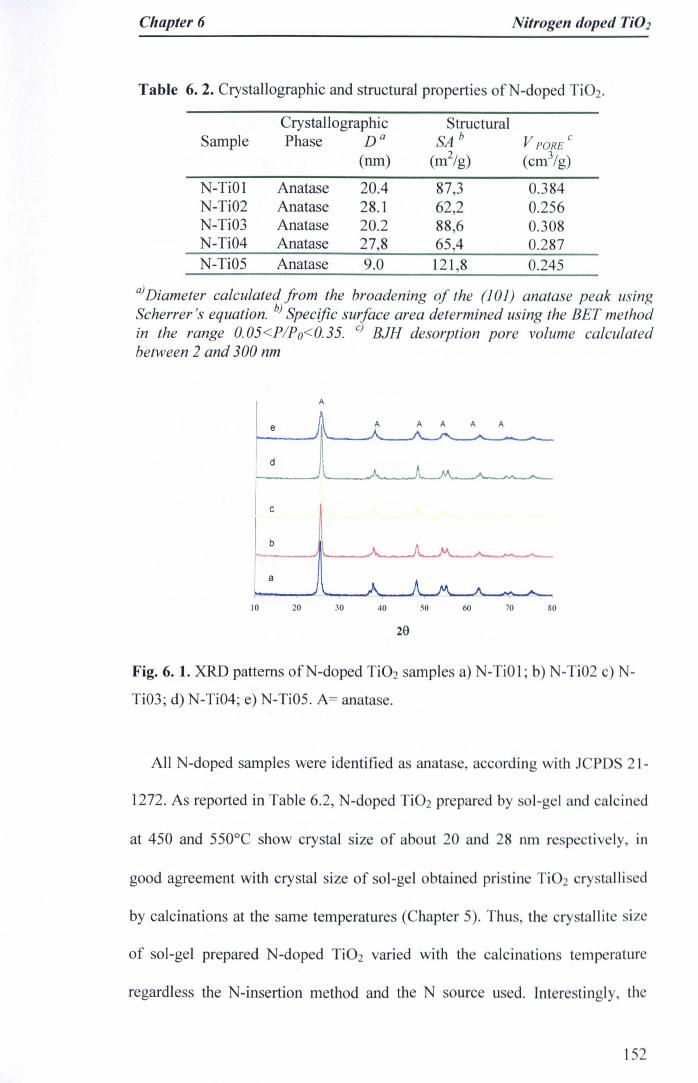
Chapter 6 Nitrogen doped Ti02
Table 6.2. Crystallographic and structural properties ofN-doped Ti02.
Crystallographic StructuralSample Phase Da SA b V PORE
c
(run) (m2/g) (cm 'zg)
N-TiOI Anatase 20.4 87,3 0.384N-Ti02 Anatase 28.1 62,2 0.256N-Ti03 Anatase 20.2 88,6 0.308N-Ti04 Anatase 27,8 65,4 0.287N-Ti05 Anatase 9.0 121,8 0.245
a)Diameter calculated from the broadening of the (l01) anatase peak usingScherrer's equation. b) Specific su1ace area determined using the BET methodin the range 0.05<PIPo<0.35. C BJH desorption pore volume calculatedbetween 2 and 300 nm
A
e A A A A A
d
c
b
a
10 20 30 40 50 60 70 80
20
Fig. 6.1. XRD patterns ofN-doped Ti02 samples a) N-TiOI; b) N-Ti02 c) N-
Ti03; d) N-Ti04; e) N-TiOS. A= anatase.
All N-doped samples were identified as anata e, according with J PD 21-
1272. As reported in Table 6.2, N-doped Ti02 prepared by I-gel and calcin d
at 450 and 550°C show crystal size of about 20 and 28 nm re p ctiv ly, in
good agreement with crystal size of sol-gel obtained pri tin Ti 2 cry talli d
by calcinations at the same temperatures (Chapter 5). Thu , the cry tallit ize
of sol-gel prepared N-doped Ti02 varied with the calcin tion temp rature
regardless the N-insertion method and the N source us d. Int re tingly, the
152

Chapter6 Nitrogen doped TiO]
sample N-TiOS, shows a broad main anatase peak, indicating a small mean
particle size of the material. N-TiOSwas prepared by hydrothermal procedure
followed by calcination at 450 °C. It shows particle size of 9 nm, much smaller
than crystal mean dimension of other samples treated at the same temperature
(Table 6.2). This result agrees with trend reported in Chapter 5 in this work and
other studies in the literature (Maira et al, 2000), where the hydrothermal
process leaded to crystals with smaller mean size than those obtained by
thermal crystallisation. The small particle size reflects also on the surface area
of hydrothermally prepared doped titania, which shows the largest value (121,8
m2/g). Surface area of sol-gel prepared doped titania are 62 m2/g for powders
calcined at 450 °C and 88 m2/g for thermal treatment at 550 °C, regardless the
N source used during the preparation process.
6.3.2 Porosity properties
The N-doped Ti02 powders show significant porosity in the meso and
macroporous region as suggested by N2 adsorption desorption isotherms
reported in Fig 6.2.
Isotherms are of type IV, according with BDDT classification(Chapter 4),
and present clear hysteresis of type H2 at PIP0>O,4 for samples N-Ti02 and
PIPO>O.55 for all other samples.
It was not possible to achieve a pore size distribution with the BJH method
for these samples, probably due to the wide distribution along the meso and
macroporous dimension range. N doped Ti02 catalyst show similar pore
volume (Table 6.2).
153

Chapter 6 Nitrogen doped Ti02
° 0,2 0,4 0,6 0,8Degrees 29
Fig. 6. 2. N2 adsorption desorption isotherms ofN-doped Ti02.
6.3.3 XPS studies
The surface composition and chemical state of the elements in the N-doped
Ti02 samples was studied using X-ray Photoelectron Spectroscopy (XPS). The
representative survey XPS spectrum of sample N- Ti05 with signals attribution
is shown in Fig. 6.3. Signals from 0 Is (528 eV), Ti 2p (457 eV), and N Is
(400 eV) can be easily recognised in the spectrum. The spectra of other
samples show similar patterns, exception for the quantitative ratio of th
elements. The atomic composition of the doped Ti02 powders is reported in
Table 6.3, which evidences different N contents at the catalysts surfac for the
different samples. N content between 1.9 and 4% was found in the ampl .
Table 6.3. Atomic composition % ofN-doped Ti02 catalyst.
SampleAtomic composition %
0 Ti C NN-TiOI 65,77 25,49 6,20 2,55N-Ti02 64,53 26,58 6,76 2 12N-Ti03 64,47 25,96 6,96 1 897N-Ti04 65,18 25,21 7,33 2,984N-Ti05 62,42 26,01 7,52 4,05
154
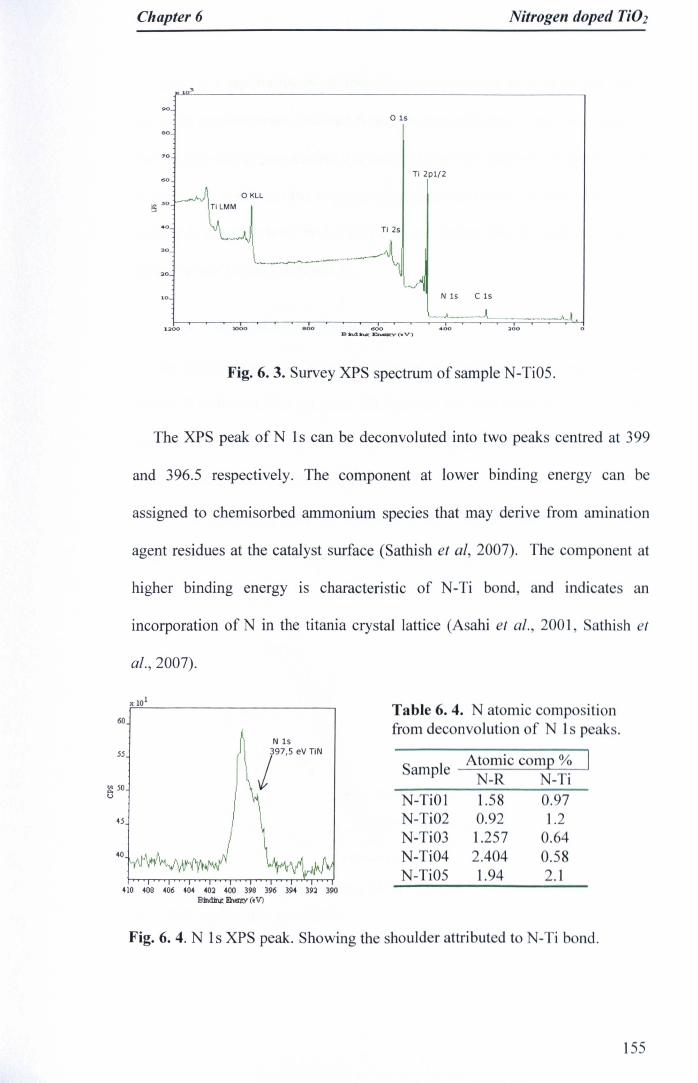
Chapter 6 Nitrogen doped Ti02
TiLMM ILvL__. __~
.-Jj
70
o KLL
).::lOO
015
Ti 2p1/2
N 15 C 15
Fig. 6.3. Survey XPS spectrum of sample N-Ti05.
The XPS peak ofN Is can be deconvoluted into two peaks centred at 399
and 396.5 respectively. The component at lower binding energy can be
assigned to chemisorbed ammonium species that may derive from amination
agent residues at the catalyst surface (Sathish et al, 2007). The component at
higher binding energy is characteristic of N-Ti bond, and indicates an
incorporation of N in the titania crystal lattice (Asahi et al., 200], Sathish et
ai.,2007).
55
60
g! 50u
45
410 408 406 404 40~ 400 398 396 394 39~ 390Bindint: ~ (.V)
Table 6. 4. N atomic compo itionfrom deconvolution of N 1 peak.
Sample Atomic comp %N-R N-Ti
N-TiOIN-Ti02N-Ti03N-Ti04N-Ti05
1.58 0.970.92 1.21.257 0.642.404 0.581.94 2.1
Fig. 6. 4. N Is XPS peak. Showing the shoulder attribut d to N-Ti bond.
155

Chapter 6 Nitrogen doped Ti02
Table 6.3 reports the N atomic percentage relative relative to the two N
chemical environments obtained from the deconvolution of the two peaks. It
can be seen that doping carried out during the sol-gel reaction (method 1) leads
to higher N insertion than impregnation of amorphous Ti02 (method 2). The
highest N insertion level in the titania crystal lattice (2%) is obtained with the
hydrothermal method (method 3).
6.3.4 Absorption properties
The XPS analysis confirmed the insertion ofN atoms into the titania crystal
lattice. It was found in previous studies that the modification of the crystal
composition with the introduction of anions in place of oxygen atoms lead to
shift of absorption properties of doped titania.
The absorption spectra of Ti02_xNx were recorded and compared with
Degussa P-2S as reference material, as shown in Fig. 6.5.
b,c,d,e
350 400 450 500 550 600wavelength A - nm
Fig. 6. 5. Optical absorption spectra of: a) Degussa P-2S, b) N-TiOl c) N-Ti02
d) N-Ti03, e) N-Ti04, f) N-Ti05.
156

Chapter6 Nitrogen doped TiO]
The UV-vis absorption spectra collected in diffuse reflectance mode, ofN-
doped Ti02 and Ti02 P-2S samples are shown in Fig. 6.5. Commercial material
P-2S shows an onset absorption at 405 run, which corresponds to a bandgap
energy Eg =3.1 eV. It can be seen from the figure that there is a shift in the
onset absorption towards the longer wavelength region for all N-doped samples
when compared to undoped Ti02. The absorption spectrum of N-doped Ti02
obtained by sol-gel method, are similar, with a shift between 2S-30 nm, while
the sample N-TiOSshows al arger shift (60 run) in the onset absorption.
6.4 Photocatalytic activity
The photocatalytic activity ofN-doped Ti02 materials in the gas phase were
tested in the flat plate photoreactor using TCE as probe pollutant. Two
different series of experiments were carried, using UV and visible irradiation
sources, respectively.
All experiments were conducted using a total flow rate of 0.04 L S·I, RH of
8%, and TCE initial concentration was 26±t JlM. Experiments under UV and
visible light were carried out on two different supports, coated with a
photocatalysts loading of 6 rng/crrr', The results obtained for Ti02."N" were
always compared with those of commercial material Degussa P-2S.
6.4.1 Photocatalytic activity under visible light
It has been proven Section 6.3.4 that the N insertion in the titania crystal
lattice was carried out successfully, and that the absorption properties of
resulting Ti02."Nx were expanded toward wavelengths in the visible range of
the spectrum.
157

Chapter 6 Nitrogen doped TiO]
Experiments on Degussa P-25 under visible illumination did not show any
photocatalytic conversion of TCE. This results was expected, and agrees with
results reported in literature, as P-25's absorption onset is in the UV range, thus
cannot be activated by the visible irradiation source.
However, also the evaluation of the photocatalytic properties of Ti02."N"
samples under visible illumination yield no photocatalysis. In fact, no TCE
conversion was recorded for all the N-doped samples, despite their capacity to
absorb some visible light. The highest shift of the adsorption onset of the doped
samples is of 60 nm, which means that the longest wavelength that can be
absorbed is 450 nm. The emission spectrum of the visible irradiation source
used in this work is reported in Figure 4.2. The visible lamps emit between 400
and 675 nm, but the portion of the spectrum emitted below 450 nm is very
small and the portion in the UV range is less than 1%. Thus we can assume that
the adsorption properties of N-doped catalysts are not sufficient for being
activated under the visible irradiation conditions employed for the
investigation.
6.4.2 Photocatalytic activity under UVA light
The photocatalytic activity of photocatalytic plates coated with N-doped
Ti02 was investigated also under UVA irradiation. The results of the
photocatalytic experiments are reported in Fig. 6.6 and compared with the
photoactivity of Degussa P-25. The photocatalytic activity of N-doped
photocatalysts is higher or comparable with that of -25 at low light intensity. At
high light intensity only sample N-Ti02 and N-Ti04 shows activity comparable
with that of the commercial Ti02 P-25.
158

Chapter 6 Nitrogen doped Ti02
For a given preparation method (see table 6.1) the N-doped samples
obtained using NEt3 as N source perform better than photocatalyst prepared by
using NH3 during the process. The hydrothermally obtained sample show an
activity intermediate between the other two groups.
However it is important to recall that undoped samples prepared in Chapter 5
at similar conditions, which show similar structural properties (i.e. particle
size) were found to perform much better than commercial P-25 under the same
experimental conditions, for TCE photooxidation. The insertion of N in the
crystal lattice of these photo catalysts lead to a decrease of the photocatalytic
activity.
25 01 =5.1 W/m2
1=14.0 W/m2
1=21 W/m220
5
oP-25 N-Ti01 N-Ti02 N-Ti03 N-TI04 N-TI05
Fig. 6. 6. TCE degradation rates of N-doped Ti02 phot cataly t und r UVA
irradiation at different light intensities, compared with D gu a P-25. Initial
TCE concentration was 26±1 !-lM, 8% RH, Flowrat : 0,04 LI , R a ti n r t
are per unit surface area of irradiated support.
The high activity of undoped Ti02 nanoparticle wa r lat d with th g d
crystallinity of the samples and the optimum crystal ize whi h guarant d a
15

Chapter 6 Nitrogen doped TiO]
fast charge transfer from the catalyst surface to the adsorbate species. The
insertion ofN into the crystal lattice can sensibly modify the crystallinity of the
material, as crystal defects can be associated with doped materials. The doping
centre itself can act as recombination centre during the photocatalytic process
having a detrimental effect on the photocatalyst performance. Moreover, the N
insertion gives rise to titanium nitride Ti-N, as also confirmed by XPS studies
(Figure 6.4). Ti-N is an electron conductor, thus it may assist the electron-hole
recombination process, leading to electron-hole pairs with shorter lifetime.
6.5 Summary
The aim of this part of the research work was the N-doping of the highly
active Ti02 nanoparticles developed and studied in Chapter 5, which show
much higher photocatalytic activity than P-25 under UV light, in the attempt to
develop visible light activated photocatalysts.
The N insertion was successfully carried out by following some procedures
reported in Literature. However, no visible light activity was achieved, and the
photocatalytic activity of N-doped nanoparticles under UV irradiation was
lower than undoped Ti02 with similar structural properties. It is hypotesised
that the N doping creates energy levels that can act as recombination centres,
decreasing the overall efficiency of the photocatalysts.
160

Chapter 7
Ti02IW03 systems

Chapter 7 TiO;IWOJsystems
7.1 Introduction
Coupling Ti02 with another semiconductor is one of the approaches used to
improve the photocatalytic activity of Ti02 (Chatterjee and Dasgupta, 2005, Do
et al., 1993). Ti02IW03 systems have recently raised the interest of researchers
due to their photocatalytic and photoelectrocatalytic properties (Georgieva et
al., 2007, Georgieva et al., 2005, Tada et al., 2004).
W03 is a semiconductor with an energy bandgap of 2.8 eV that exists in
several crystalline forms. It can absorb radiation of wavelength shorter than
420 nm, which fall in the visible range. Among all W03 crystalline forms,
monoclinic and orthorhombic (Fuerte et al., 2002) are the most commonly
encountered in photocatalytic studies (Fuerte et al., 2002).
In coupled semiconductors systems, the intimate contact between different
oxide particles has been shown to have a fundamental role in improving the
photocatalytic properties (Tada et al., 2004). Thus, in the preparation and
optimisation of Ti02IW03 systems, synthetical pathway, experimental
conditions and deposition methods can all playa crucial role in determining the
final photocatalytic properties of the material.
In this chapter studies on two different coupled Ti02IW03 systems are
presented. A layered Ti02IW03, and a novel Ti02IW03 nanocomposite
obtained through a one step hydrothermal reaction are investigated. The
morphologic, structural and photocatalytic properties of both Ti02IW03
systems are reported and discussed.
161

Chapter 7 TlOy'WOJ systems
7.2 Layer structured TiOzIW03 system
A common material configuration for semiconductor coupled systems is
obtained by deposition of single oxides films forming a layered structure. This
configuration is commonly achieved through techniques such as sol-gel (Song
et al., 2001), chemical vapour deposition CVD (Harizanov et al., 1996),
electrodeposition (de Tacconi et al., 2003), and can utilise commercial starting
materials. In the frame of a project in collaboration with the Institute of
Physical Chemistry in the Bulgarian Academy of Science, Sofia, Bulgaria, a set
of layered systems were tested in the gas phase photocatalytic reactor for
photodegradation of TCE. Supports coated with both W03 and Ti02 and
supports coated with only W03 were evaluated.
7.2.1 Preparation and characterisation of supports
The photocatalytic supports coated with W03 and ri02 were prepared by
Jenia Georgieva from the Institute of Physical Chemistry in the Bulgarian
Academy of Science. In this section the preparation method and
characterisation of these Ti02IW03 layered systems are reported briefly as a
comprehensive description and discussion of these systems can be found in
literature (Georgieva et al., 2005, Georgieva et al., 2007).
W03 single coatings and WOJiTi02 layered coatings were prepared on
stainless steel (SS304) supports, by an electrosynthesislelectrodeposition
technique from precursors solutions. Na2W04 was used as W precursor and
after W03 deposition the coated SS plates were annealed at 350°C for 30
minutes to allow crystallisation of the oxide. ri02 was deposited on top of the
162
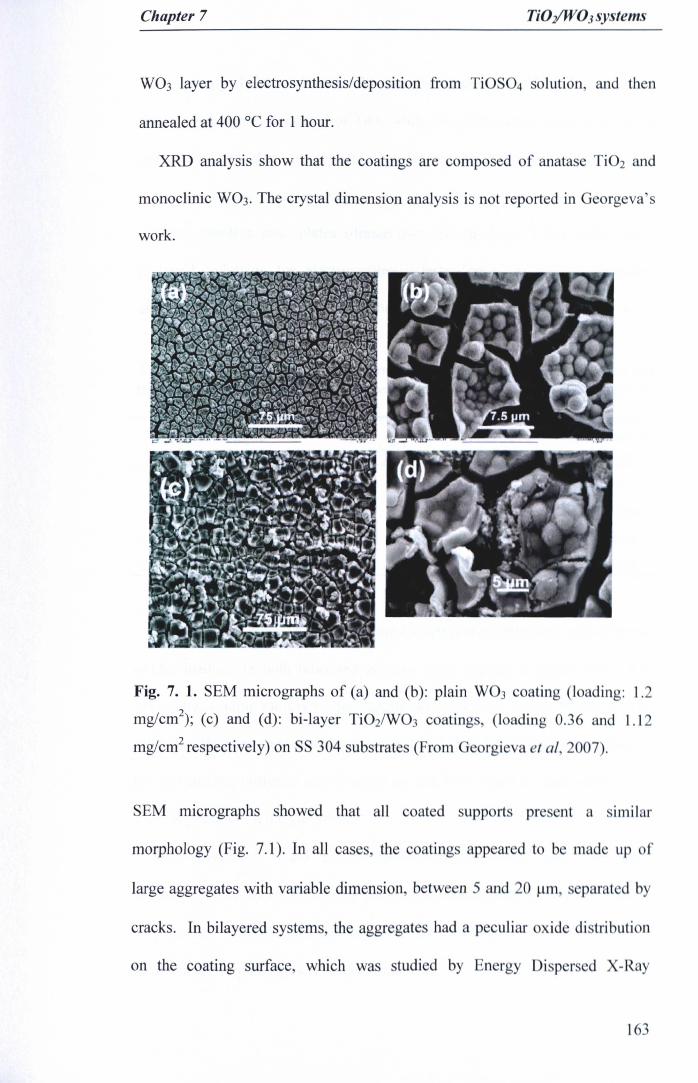
Chapter 7 TiO/WOJ systems
W03 layer by electrosynthesis/deposition from TiOS04 solution, and th n
annealed at 400 QCfor 1 hour.
XRD analysis show that the coatings are composed of anatase Ti02 and
monoclinic W03. The crystal dimension analysis is not reported in Georgeva's
work.
Fig. 7. 1. SEM micrographs of (a) and (b): plain W03 coating (I ading: 1.2
mg/crrr'); (c) and (d): bi-layer Ti02/W03 coating, (I ading O. 6 and 1.12
mg/crrr' respectively) on SS 304 substrates (From G orgi va et al, 2007).
SEM micrographs showed that all coated support pre nt a irnilar
morphology (Fig. 7.1). In all cases, the coating appeared to b mad up f
large aggregates with variable dimension b twe n 5 nd 20 urn
cracks. In bilayered systems, the aggregates had a p culiar id di tributi n
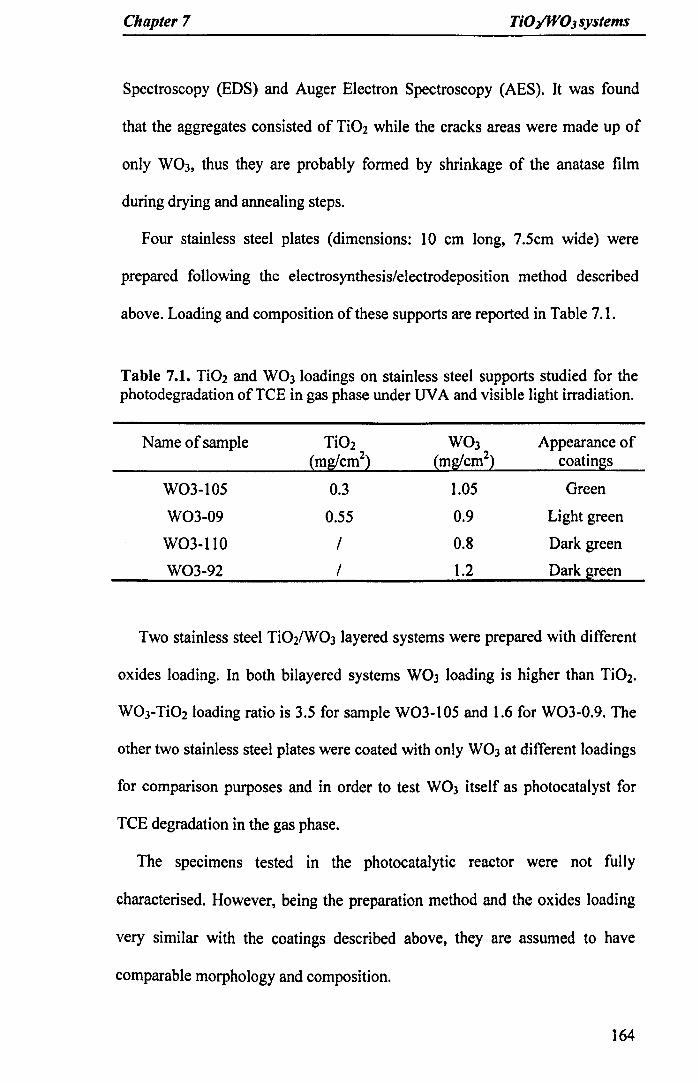
Chapter 7 TiOYWOJsystems
Spectroscopy (EDS) and Auger Electron Spectroscopy (AES). It was found
that the aggregates consisted of Ti02 while the cracks areas were made up of
only W03, thus they are probably formed by shrinkage of the anatase film
during drying and annealing steps.
Four stainless steel plates (dimensions: 10 cm long, 7.5cm wide) were
prepared following the electrosynthesis/electrodeposition method described
above. Loading and composition of these supports are reported in Table 7.1.
Table 7.1. Ti02 and W03 loadings on stainless steel supports studied for thephotodegradation of TCE in gas phase under UVA and visible light irradiation.
Name of sample Ti02 W03 Appearance of(mglcm2) (mglcm2) coatings
W03-105 0.3 1.05 Green
W03-09 0.55 0.9 Light green
W03-110 / 0.8 Dark green
W03-92 I 1.2 Dark green
Two stainless steel Ti02IW03 layered systems were prepared with different
oxides loading. In both bilayered systems W03 loading is higher than Ti02.
W03-Ti02loading ratio is 3.5 for sample W03-lOS and 1.6 for W03-0.9. The
other two stainless steel plates were coated with only W03 at different loadings
for comparison purposes and in order to test W03 itself as photocatalyst for
TCE degradation in the gas phase.
The specimens tested in the photocatalytic reactor were not fully
characterised. However, being the preparation method and the oxides loading
very similar with the coatings described above, they are assumed to have
comparable morphology and composition.
164
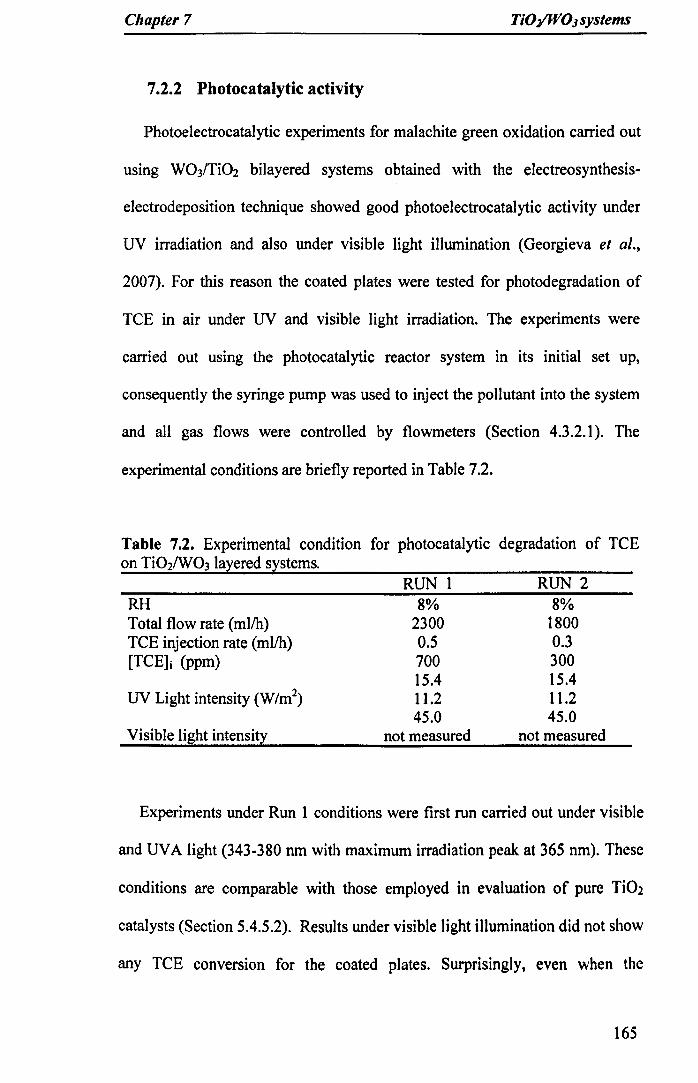
Chapter 7 TiOYWOJsystems
7.2.2 Photocatalytic activity
Photoelectrocatalytic experiments for malachite green oxidation carried out
using W03ITi02 bilayered systems obtained with the electreosynthesis-
electrodeposition technique showed good photoelectrocatalytic activity under
UV irradiation and also under visible light illumination (Georgieva et al.,
2007). For this reason the coated plates were tested for photodegradation of
TCE in air under UV and visible light irradiation. The experiments were
carried out using the photocatalytic reactor system in its initial set up,
consequently the syringe pump was used to inject the pollutant into the system
and all gas flows were controlled by flowmeters (Section 4.3.2.1). The
experimental conditions are briefly reported in Table 7.2.
Table 7.2. Experimental condition for photocatalytic degradation of TCEon Ti02/W03 layered systems.
RUN 1 RUN 2RH 8% 8%Total flow rate (ml/h) 2300 1800TCE injection rate (ml/h) 0.5 0.3[TCE]i (ppm) 700 300
15.4 15.4UV Light intensity (W1m2) 11.2 11.2
45.0 45.0Visible light intensity not measured not measured
Experiments under Run 1 conditions were first run carried out under visible
and UVA light (343-380 nm with maximum irradiation peak at 365 nm). These
conditions are comparable with those employed in evaluation of pure Ti02
catalysts (Section 5.4.5.2). Results under visible light illumination did not show
any TCE conversion for the coated plates. Surprisingly, even when the
165

Chapter 7 TlOYWOJ systems
photocatalytic supports were illuminated with UVA light, no photocatalytic
process occurred.
Total flow rate and injection rate were changed in order to achieve a much
lower TCE initial concentration (Run 2). Also under this condition, the catalysts
did not show any activity for TCE degradation under either visible or UVA
irradiation.
The results obtained from supports coated with WO) only, allow the
assumtion that W03 is insufficient as a photocatalyst for TCE
photodegradation. This finding is supported by the fact that, to the best of my
knowledge, photodegradation of TCE using pure WO) as the photocatalyst has
never been reported in the literature.
Concerning Ti02IW03 mixed samples, unexpectedly, a total deactivation of
Ti02 derives from its coupling with W03 in this bilayered configuration. An
accurate analysis of materials loading, surface morphology and semiconductors
distribution at the surface can contribute the justification and understanding of
these results. First of all, in the bilayered systems under study, the WO) loading
is very high and in view of the WO)lTi02 ratios, we can think about Ti02 as the
'dopant' component. In layered systems, positive coupling effects have been
reported when the WO) is loaded as a monolayer (-3% molar) on Ti02 (Song et
al., 2001). It has also been observed that the activity of the mixed oxide systems
decreases sharply with increasing W03 loading (Keller et al., 2003). Moreover,
given that W03 is not effective as a photocatalyst for TeE degradation, its high
loading could affect the whole system by a dilution effect. However,
considering that both components are exposed to light irradiation, some activity
was expected due to presence of Ti02.
166
Chapter 7 TiO:/JYOJ systems
During irradiation, electron-hole pairs are formed on both semiconductors.
Even if W03 does not act as photocatalyst itself, it can act as sink for
photoexited electrons, accepting them from Ti02 conductive band, generating
intermediate W (V) on the surface (Chapter 2). The reduced W(V) can then
follow two paths: it can be oxidized to W(VI) by reaction with the holes
following a recombination process, or it can react with an electron acceptor on
the surface completing the photocatalytic reaction. This trapping mechanism is
believed to drive the charge separation responsible for the improved activity in
many TiIW composites (Fuerte et al., 2002, Do et al., 1994, G. et al., 1996).
W(VI) + e·(Ti02CB)~W(V)
W(V) + h+~ W(VI)
W(V) + 02~ W(VI) + ·02
(Eq.7.1)
(Eq.7.2)
(Eq.7.3)
Thus, in order to finalize the photocatalytic cycle, an electron acceptor must be
reduced. For reaction in air, the electron acceptor specie involved in this step is
02. It is evident that the rate of electron transfer from semiconductors to 02 can
influence the overall photocatalytic process.
The rate of electron transfer from catalyst surface to 02 was recently
determined in the frame of studies on a photocatalytic system with surface
consisting of anatase Ti02 deposited as striped pattern on top of monoclinic
W03 on Sn02-film-coated glass (Tada et ai, 2004). The composition and
morphology of these coatings are similar to the one of our layered systems, as
shown in Fig. 7.2. In Tada's work, the photoinduced electron transfer from
Ti02 to W03 was demonstrated by mapping the surface reductive sites by
photodeposition of Ag, however the gas phase photo-oxidation of acetaldehyde
167
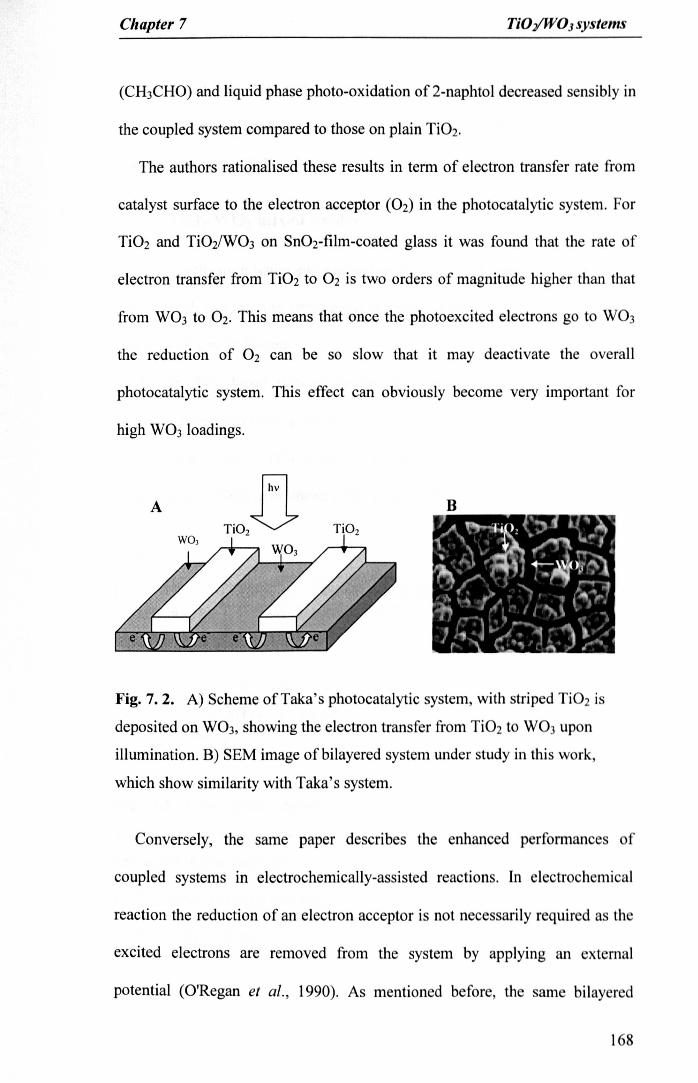
Chapter 7 TiOYWOj systems
(CH3CHO) and liquid phase photo-oxidation of 2-naphtol decreased sensibly in
the coupled system compared to those on plain Ti02.
The authors rationalised these results in term of electron transfer rate from
catalyst surface to the electron acceptor (02) in the photocatalytic system. For
Ti02 and Ti02/W03 on Sn02-film-coated glass it was found that the rate of
electron transfer from Ti02 to 02 is two orders of magnitude higher than that
from W03 to 02. This means that once the photoexcited electrons go to W03
the reduction of O2 can be so slow that it may deactivate the overall
photocatalytic system. This effect can obviously become very important for
high W03 loadings.
B
Fig. 7.2. A) Scheme of Taka's photocatalytic system, with striped Ti02 is
deposited on W03, showing the electron transfer from Ti02 to W03 up n
illumination. B) SEM image of bilayered system under study in this work
which show similarity with Taka's system.
Conversely, the same paper describes the enhanced performance f
coupled systems in electrochemically-assisted reaction. In electrochemical
reaction the reduction of an electron acceptor is not necessarily required a the
excited electrons are removed from the system by applying an external
potential (O'Regan et al., 1990). As mentioned before, the same bilayer d
168
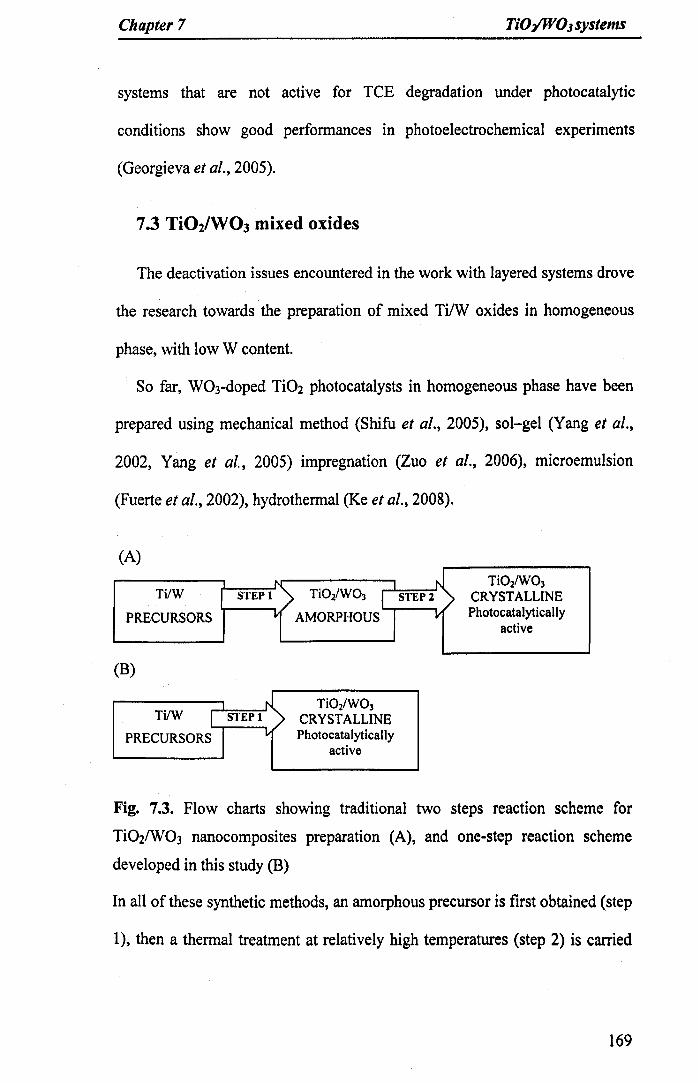
Chapter 7 TiOYWOJsystems
systems that are not active for TeE degradation under photocatalytic
conditions show good performances In photoelectrochemical experiments
(Georgieva et al., 2005).
7.3 Ti02IW03 mixed oxides
The deactivation issues encountered in the work with layered systems drove
the research towards the preparation of mixed Ti/W oxides in homogeneous
phase, with low W content.
So far, W03-doped Ti02 photocatalysts in homogeneous phase have been
prepared using mechanical method (Shifu et al., 2005), sol-gel (Yang et al.,
2002, Yang et al., 2005) impregnation (Zuo et al., 2006), microemulsion
(Fuerte et al., 2002), hydrothermal (Ke et al., 2008).
(A)
TilW STEP1 Ti02IW03
PRECURSORS AMORPHOUS
Ti02IW03
CRYSTALLINEPhotocatalytically
active
(B)
TiIW I STEP1)
PRECURSORS I ~Ti02/W03
CRYSTALLINEPhotocatalytically
active
Fig. 7.3. Flow charts showing traditional two steps reaction scheme for
Ti02IW03 nanocomposites preparation (A), and one-step reaction scheme
developed in this study (B)
In all of these synthetic methods, an amorphous precursor is first obtained (step
1), then a thermal treatment at relatively high temperatures (step 2) is carried
169

Chapter 7 TiOy'WO] systems
out to permit the formation of the final photoactive crystalline material (Fig.
7.3).
In the attempt to simplify the synthesis of Ti02IW03 nanocomposites, a
novel one-step synthesis based on hydrothermal method has been developed
and optimised for photooxidation ofTCE in gas phase.
7.3.1 A novel TiOzIW03 nanocomposite
Hydrothermal treatment at high temperature of Titanium oxisulfate
(TiOS04). It has been used for the preparation of Ti02 nanoparticles (Kolen'ko
et al., 2003). Also W03 has been prepared by hydrothermal reaction, using
H2W04 as precursor (Kominami et al., 2003). In Kominami's synthesis,
orthorhombic W03 (W03·0.33H20) and monoclinic W03 were obtained by
treatment at 473 and 523 K respectively. However, the hydrothermal synthesis
has not been used for the preparation of Ti02 and W03 mixed oxides.
For samples synthesized in this work, ammonium metatungstate hydrate
«(NH4)6(W12)41}xH20 and TiOS04 were used as W and Ti oxides precursors
respectively. As starting point, pure Ti and W oxides, and Ti/W mixed oxides
with 10% wt W03 were prepared using a mixture 1: 1 water and ethanol as
reaction media.
The product of the hydrothermal treatment of TiOS04 and of the mixed
precursors were white powders, while by treatment of ammonium
metatungstate, a very fine, light green powder was obtained.
The oxidation state of the components in the mixed oxide was analyzed by
XPS spectroscopy. As shown in Fig. 7.4, sample surface is composed by Ti, 0,
C, F, N and W. The F signal is present because of a contamination in the
170

Chapter 7 TiO/W03 systems
instrument chamber. Due to this contamination, only qualitative considerations
can be done on the basis of this spectrum.
Wida/16
CIs
~,-~---,~4f
015
TiTI
TllsF 15
lJOD 1000 800 400 '00
o Is Ti2p W4d
s ,
Ii
I \I \I \/ \
// \
Fig. 7.4. XPS spectra of Ti02/W03 10% wt W03. Top: survey spectrum.
Bottom: 0, Ti and W peaks.
The binding energy of Ti2p (457.5 eV) and W4d (247 eV) correspond to
Ti(IV) and W(VI) with values typical of Ti02 and W03 respectively. 0 Is
signal has a principal peak at 530 eV characteristic of oxide bond, and a clear
shoulder at higher binding energies that correspond to hydroxyl bond. The C
signal at 288 eV can be attributed to residues of ethanol on catalysts surface
and adsorbed CO2.
The crystallographic properties of the samples were investigated by X-ray
spectroscopy (Fig. 7.5). From the hydrothermal reaction of TiOS04 anatase
with good crystallinity was obtained (Fig. 7.5 a).
171
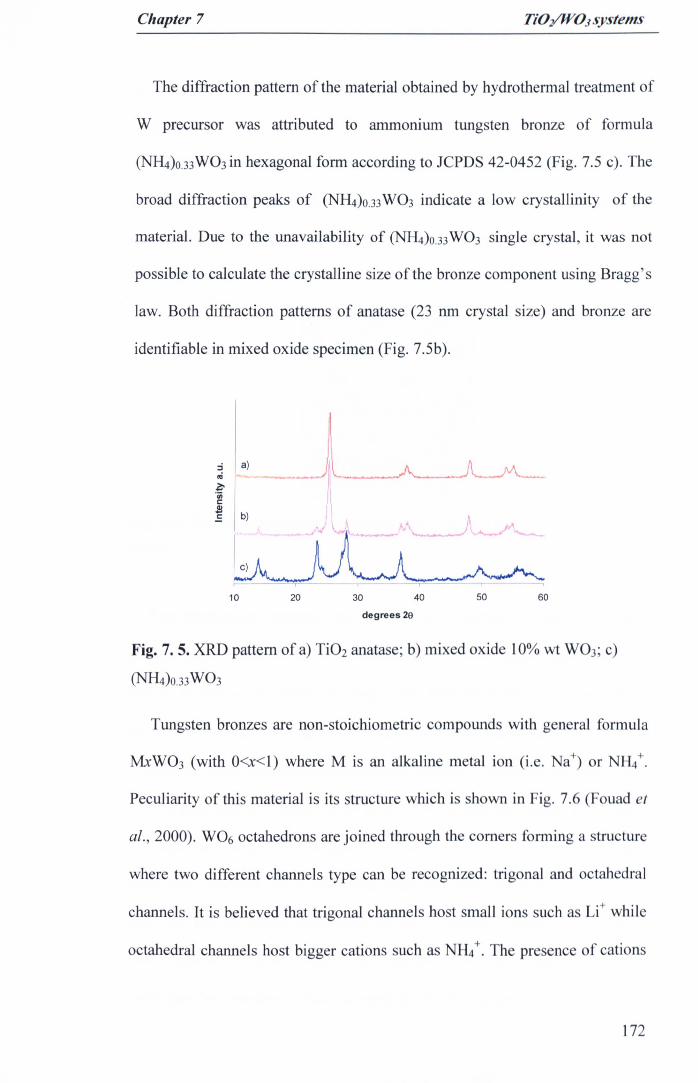
Chapter 7 TiOYW03systems
The diffraction pattern of the material obtained by hydrothermal treatment of
W precursor was attributed to ammonium tungsten bronze of formula
(NH4)o.33W03 in hexagonal form according to JCPDS 42-0452 (Fig. 7.5 c). The
broad diffraction peaks of (NH4)0.33W03 indicate a low crystallinity of the
material. Due to the unavailability of (NH4)o.33W03 single crystal, it was not
possible to calculate the crystalline size of the bronze component using Bragg's
law. Both diffraction patterns of anatase (23 nm crystal size) and bronze are
identifiable in mixed oxide specimen (Fig. 7.5b).
10 20 30 40 50 60degrees 29
Fig. 7. 5. XRD pattern of a) Ti02 anatase; b) mixed oxide 10% wt W03; c)
(NH4)o.33W03
Tungsten bronzes are non-stoichiometric compounds with general formula
MxW03 (with O<x<l) where M is an alkaline metal ion (i.e. Na+) or NH/.
Peculiarity of this material is its structure which is shown in Fig. 7.6 (Fouad et
al., 2000). W06 octahedrons are joined through the corners forming a structure
where two different channels type can be recognized: trigonal and octahedral
channels. It is believed that trigonal channels host small ions such as u:whi Ie
octahedral channels host bigger cations such as NH4+. The presence of cations
172
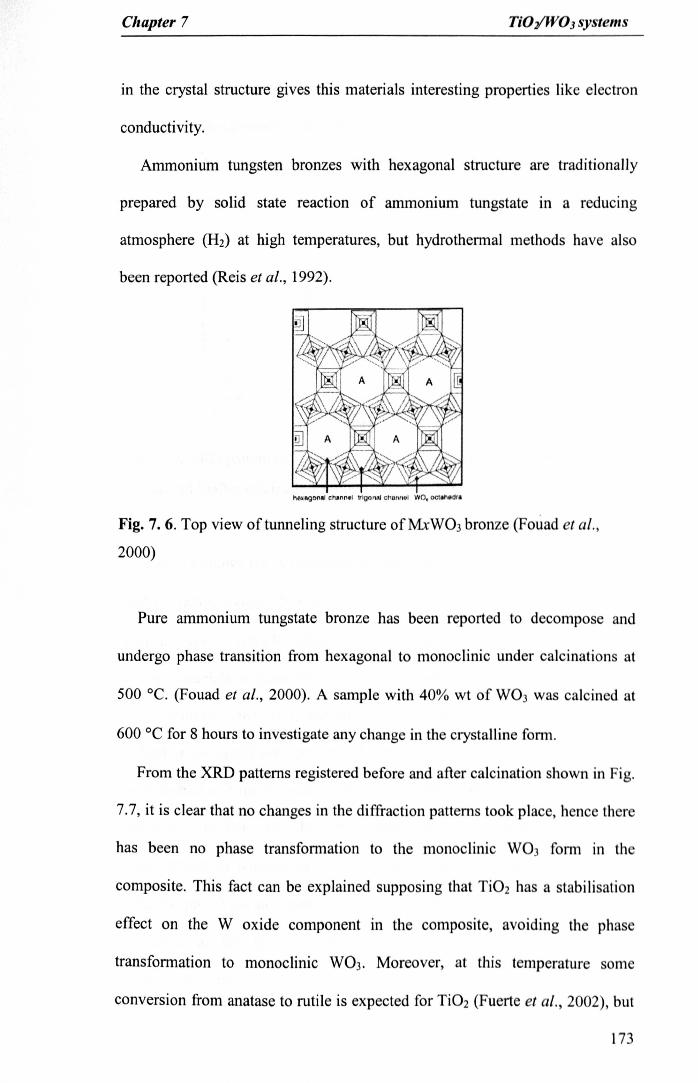
Chapter 7 TiOy"W03 systems
in the crystal structure gives this materials interesting properties like electron
conductivity.
Ammonium tungsten bronzes with hexagonal structure are traditionally
prepared by solid state reaction of ammonium tungstate in a reducing
atmosphere (H2) at high temperatures, but hydrothermal methods have also
been reported (Reis et al., 1992).
h",..:l\g,n.1 coh.nn«' trigonal 'ct\tulliel WO. OCIAhMtra
Fig. 7. 6. Top view of tunneling structure ofM.xW03 bronze (Fouad et al.,2000)
Pure ammonium tungstate bronze has been reported to decompose and
undergo phase transition from hexagonal to monoclinic under calcinations at
500°C. (Fouad et al., 2000). A sample with 40% wt of W03 was calcined at
600°C for 8 hours to investigate any change in the crystalline form.
From the XRD patterns registered before and after calcination shown in Fig.
7.7, it is clear that no changes in the diffraction patterns took place, hence th re
has been no phase transformation to the monoclinic WO form in th
composite. This fact can be explained supposing that Ti02 has a stabili ati n
effect on the W oxide component in the composite, avoiding the phase
transformation to monoclinic W03. Moreover, at this temperature some
conversion from anatase to rutile is expected for Ti02 (Fuerte et al. 2002), but
173

Chapter 7 TiOYW03 systems
no conversion of anatase to rutile was observed, showing that also that Ti02
component is stabilised in the composite towards phase modification.
This is the first time that a Ti02/(NH4)o.33 W03 nanocomposite has been
prepared with a easy one-step hydrothermal process (Puddu et al., 2007).
,;nil;-'u;c::S a.s
b
10 20 30 40degrees29
50 60
Fig. 7. 7. XRD pattern of Ti02/(NH4)o.33 W03 40% wt (N~)O.33W03 content a)
before and b)after calcination at 600°C for 8 hours
Fig. 7.8 shows the N2 sorption isotherm of pure Ti02, pure (NH4)O.33W03
and the mixed oxides. The isotherm of pure (NH4)0.33·W03 matches that of a
typical Type II (BDDT classification), which is usually attributed to 110n-
porous materials or materials of very limited porosity ( ection 3.2.2).
In contrast, pure Ti02 and the mixed oxide samples present .isotherms
indicative of significant porosity. These N2 sorption i otherm may g n rally
be classified as Type IV, with clear inflection and hysteresis loop in th relative
pressure P/Po>O.4. The hysteresis loop can be cia ified a typ H2,
characteristic of slit-shaped pores. At relative pre sure approaching P/Po =
0.95, the pure Ti02 and mixed oxide exhibit significant sorption which can be
attributed to the presence of large pores or macropore ari ing from
interparticle voids.
174

Chapter 7 TiOy'WOj systems
200-o- Ti02/(NH4)O.33VV03
__ (NH4)O.33 W03
-+-Ti02:Ei150ME~'0~ 100...o1/1'0III
'0 50>
o _ .... " •••• • ~ ••o 0.2 0.4 0.6
P/Po
~ . .-10.8
Fig. 7.8. N2 adsorption desorption isotherms of pure Ti and W oxides and ofa
7.3.2 Optimisation of synthesis parameters: Effect of solvent
composition
7.3.2.1 Material properties
In solvothermal or hydrothermal reactions, solvent compo ition can aff
the structure, size and composition of the product ( h ng et al. 1995, Kim et
al., 2006). To evaluate this effect, mix d oxid with 10% (NH4)o.3 W
content were prepared using differ nt H20- thanol ratio. Jv th rmal
syntheses were carried out in pure water, pur thanol and mixtur f th tw
solvents, with H20 concentration of 70, h
process was carried out at 150°C for 24 hour . h eff t
composition on material's properties are resum d in Tabl 7.3. Fig. 7.
the X-ray diffraction patterns obtained from th mix d oxid .
175
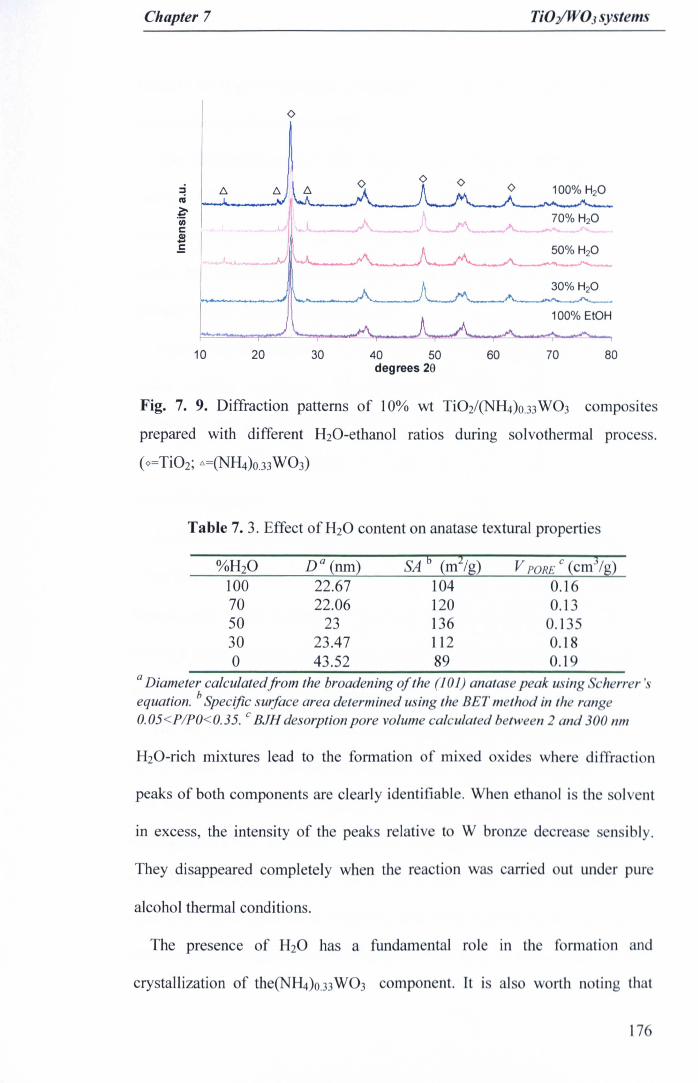
Chapter 7 TiOYW03 systems
100% EtOH
10 20 30 40 50degrees 29
60 70 80
Fig. 7. 9. Diffraction patterns of 10% wt Ti02/(NH4)o.33 W03 composites
prepared with different H20-ethanol ratios during solvothermal process.
(0=Ti02; "=(NH4)o.33W03)
Table 7. 3. Effect of H20 content on anatase textural properties
%H20 o: (nm) SA b (m2/g) V PORE C (cm3/g)100 22.67 104 0.1670 22.06 120 0.1350 23 136 0.13530 23.47 112 0.180 43.52 89 0.19
aDiameter calculated from the broadening of the (101) anatase peak using herrer 'equation. b Specific surface area determined using the BET method in the ran e0.05<PIPO<0.35. C BJH desorption pore volume calculated between 2 and 300 nm
H20-rich mixtures lead to the formation of mixed oxide wher diffracti n
peaks of both components are clearly identifiable. When ethanol i th Iv nt
They disappeared completely when the reaction wa carri d ut under pur
alcohol thermal conditions.
The presence of H20 has a fundamental role m the forrnati n and
crystallization of the(NH4)o.33W03 component. It j at 0 w rth n ting that
]7

Chapter 7 TiOy'WOJ systems
there is no trace of precursor ammonium metatungstate or other crystalline
intermediates in the final products.
The differences in the XRD patterns with respect to the presence and
intensity of (NH4)O.33 W03 diffraction peaks may be the result of two different
scenarios. In the first, we can assume that no W bronze is formed in ethanol
media and that the unreacted precursor is rinsed away during the washing
procedure after filtration (Section 4.1.4).
Ammonium metatungstate, is soluble in water but it is not soluble in ethanol
under ambient conditions. The presence of water allows the precursor
dissolution and the crystallisation of the W bronze. On the other hand, the
reaction of precursor in ethanol may give rise to an amorphous product not
detectable by XRD.
Anatase crystal size does not appear to be highly affected by H20 content
being constant at values 23±1 nm. On the other hand, surface area reaches its
highest value when a mixture 1:1 is used. Sample prepared in pure ethanol
shows a larger anatase particle size, almost double with respect to the other
samples, and a consequent lower surface area.
The N2 sorption isotherms are reported in Fig. 7.10. All isotherms are of
type IV with loops of H2 character in all cases and are characteristic of wide
pore size distribution in the mesopore size range with significant adsorption
starting at PlPo>O.4.However, they show slightly different features depending
on solvent composition. For 100% EtOH and 30% water isotherms the
hysteresis loop is positioned PlPo>0.5, with steep inclination at high partial
pressures, indicating presence of large pores. For 50% to 100% water content
177
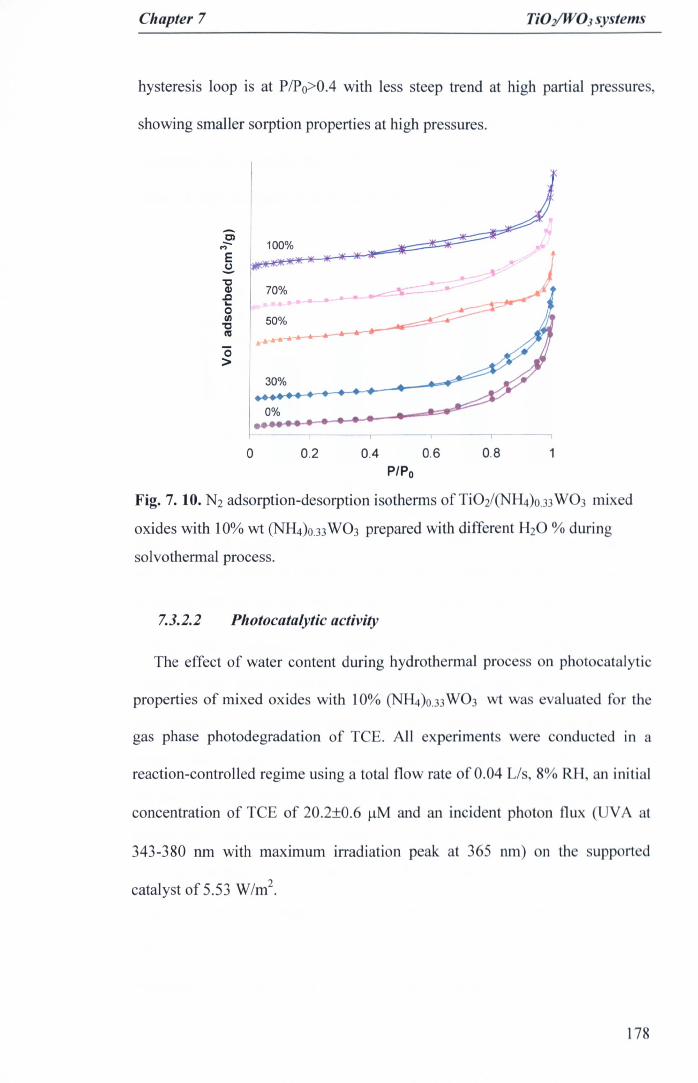
Chapter 7 TiO/W03 systems
hysteresis loop is at P/Po>O.4 with less steep trend at high partial pressures,
showing smaller sorption properties at high pressures.
o 0.2 0.4 0.6 0.8 1P/Po
Fig. 7. 10. N2 adsorption-desorption isotherms of Ti02/(NlLt)o.33 W03 mixed
oxides with 10% wt (NH4)o.33 W03 prepared with different H20 % during
solvothermal process.
7.3.2.2 Photocatalytic activity
The effect of water content during hydrothermal process on photocatalytic
properties of mixed oxides with 10% (NH4)o.33 W03 wt was val uated for the
gas phase photodegradation of TCE. All experiments wer conduct d in a
reaction-controlled regime using a total flow rate of 0.04 L/ , 8% RH, an initial
concentration of TCE of 20.2±0.6 ~M and an incid nt photon nux (UVA at
343-380 nm with maximum irradiation peak at 365 nm) on th upported
catalyst of 5.53 W/m2.
178
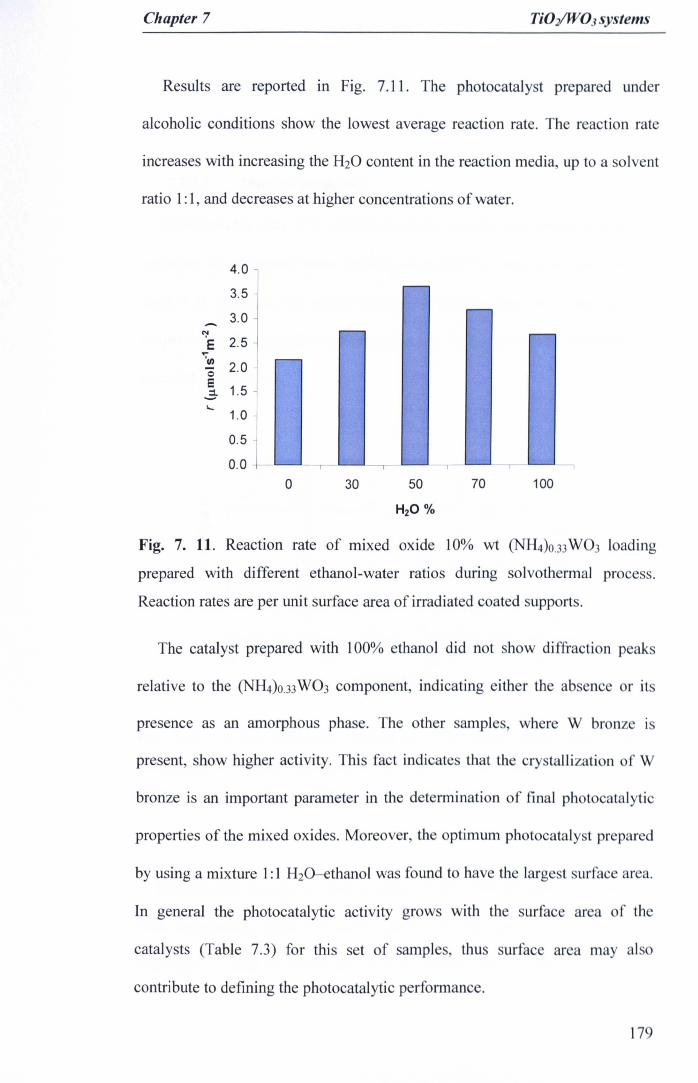
Chapter 7 TiO/W03 systems
Results are reported in Fig. 7.11. The photocatalyst prepared under
alcoholic conditions show the lowest average reaction rate. The reaction rate
increases with increasing the H20 content in the reaction media, up to a solvent
ratio 1:1, and decreases at higher concentrations of water.
4.03.53.0
~ 2.5E...'I/) 2.0 -'0S 1.5~...... 1.0
0.50.0 ----,-- --.- ,
0 30 50 70 100H2O%
Fig. 7. 11. Reaction rate of mixed oxide 10% wt (NH4)o.33W03 loading
prepared with different ethanol-water ratios during solvothermal process.
Reaction rates are per unit surface area of irradiated coated supports.
The catalyst prepared with 100% ethanol did not show diffraction peak
relative to the (NH4)o.33W03 component, indicating either the ab nee or it
presence as an amorphous phase. The other samples wher W bronz i
present, show higher activity. This fact indicates that th cry tallizati n f W
bronze is an important parameter in the determination of final photocatalyti
properties of the mixed oxides. Moreover, the optimum photocataly t pr P r d
by using a mixture 1:1 H20-ethanol was found to have the large t urfac area.
In general the photocatalytic activity grows with the urface area of the
catalysts (Table 7.3) for this set of samples, thus urfac area may al
contribute to defining the photocatalytic performance.
179
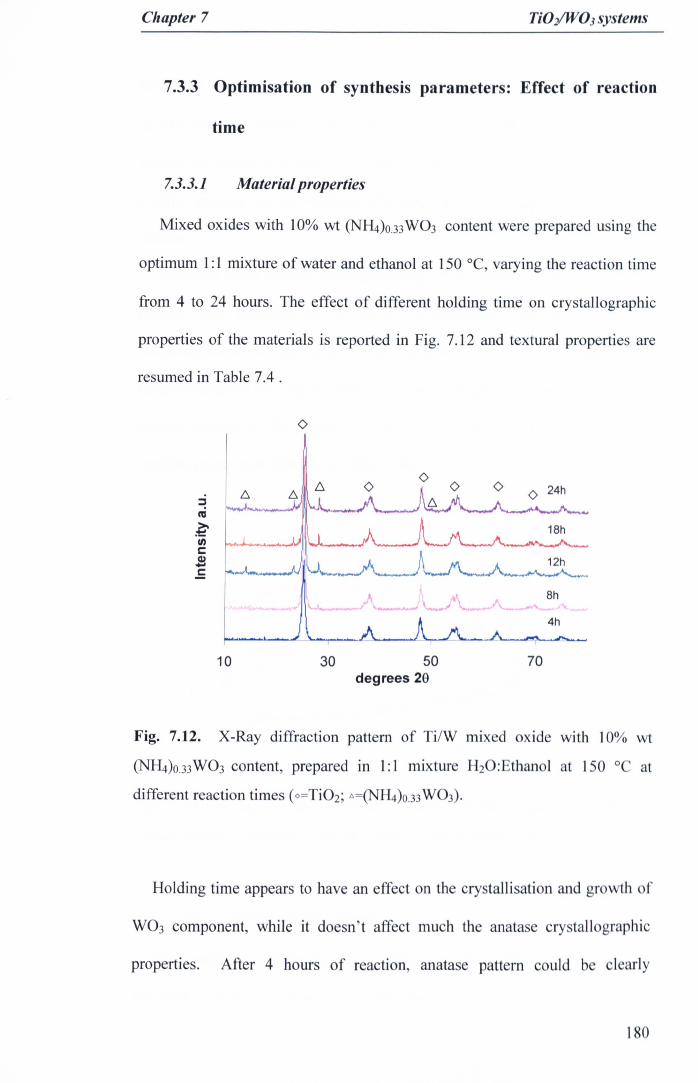
Chapter 7 TiOyW03 systems
7.3.3 Optimisation of synthesis parameters: Effect of reaction
time
7.3.3.1 Material properties
Mixed oxides with 10% wt (NH4)o.33 W03 content were prepared using the
optimum 1:1 mixture of water and ethanol at 150 °C, varying the reaction time
from 4 to 24 hours. The effect of different holding time on crystallographic
properties of the materials is reported in Fig. 7.12 and textural properties are
resumed in Table 7.4 .
o 24h
8h
4h~--"_""""'~"---r~-I. _......._ .........,r-""---~
7030 50degrees 29
10
Fig. 7.12. X-Ray diffraction pattern of Ti/W mixed oxide with 10% wt
(NH4)o.33 W03 content, prepared in 1:1 mixture H20:Ethanol at J 50 ° at
different reaction times (o=Ti02; .o.=(NH4)o.33W03).
Holding time appears to have an effect on the crystallisation and growth f
W03 component, while it doesn't affect much the anata e cry tallographic
properties. After 4 hours of reaction, anatase pattern could be cl arJy
180

Chapter 7 TiOYW03 systems
identified, but no peaks from W bronze were detected. The (NH4)O.)) WO) peak
at 28.2 °28 was detected after reaction for 8 hours. The complete diffraction
pattern of anatse and WO) was then achieved after 12 hours of reaction.
Further increase in the reaction time seemed not to change the diffraction
pattern.
Variation in the surface area and porosity of mixed oxides with 10%wt WO)
content were followed by N2 adsorption-desorption analysis. N2 sorption
isotherms, shown in Fig. 7.13, are characteristic of a wide pore size distribution
in the mesopore size range with significant adsorption starting at P/Po>OA.
Similar features of the isotherms suggest similar porosity of the mixed oxide
samples prepared at different holding times.
~ 24 hM
E~"CCl),g...0Cl),gCV
0>
~ .....-....~r---~----~--- ~ r
o 0.2 0.4 0.6 0.8
P/Po
Fig. 7. 13. N2 adsorption-desorption isotherms of mixed oxid with 10% wt
(NH4)o.)3 WO) obtained at different hydrothermal holding tim.
7.3.3.2 Photocatalytic activity
The results of photocatalytic activity of Ti02/(NH4)o.3) W 10% wt
prepared at different holding times are reported in Fig. 7.] 4. All xperirn nt
181

Chapter 7 TiOy'W03 systems
were conducted in a reaction-controlled regime using a total flow rate of 0.04
LI s, 8% relative humidity, an initial concentration of TCE in synthetic air
(20% 02, 80% N2; BOC gases) of 21± 2 ).!Mand an incident photon flux (UVA
at 343-380 nm with maximum irradiation peak at 365 nm) on the supported
catalyst of 5.53 W/m2•
The average reaction rate increased with increasing reaction time and
doubles its value from 4 to 12 hours of holding time. Catalyst obtained by
reaction longer than 12 hours did not show any further improvement in
photocatalytic activity, thus 12 hours were considered to be the optimum
reaction time.
4.03.5
N 3.0E 2.5CJ
'II) 2.00E 1.5..:,,_ 1.0
0.50.0
4 12time h
188 24
Fig. 7. 14. Reaction rate of mixed oxide 10% wt (NH4)o.3 W lading
prepared with 1:1 ethanol-water ratio during solvothermal proce at diff r nt
holding times. Reaction rates are per unit surface area of irradiat d c at d
supports.
182

Chapter 7 TiOYWOJsystems
7.3.4 Optimisation of synthesis parameters: Effect of
7.3.4.1 Material properties
Mixed oxide samples with (NH4)o.33W03 percentage between 1 and 40% wt
were prepared using a solution 1:1 ethanol-water, reaction temperature of 150
°C and reaction time of 12 h. Pure ri02 and all mixed oxides were white
powders, while by treatment of ammonium metatungstate a very fine, light
green powder was obtained.
The structural properties of the nanocomposites were measured from
duplicate XRD and N2 adsorption-desorption analyses, and the results are
reported in Table 7.4. Data relative to pure Ti02 and pure (NH4)O.33W03 are
also reported for comparison.
Table 7.4.Textural properties of Ti02 samples with different W0310ading
(NH4)0.33W03 D" (nm) SA b (mllg) VPORE C (cmJ Ig){%wt}
0 30 100 0.301 28 86 0.175 26 87 0.2110 23 136 0.2220 21 102 0.2440 18 99 0.20100 7.6
aDiameter calculatedfrom the broadening of the (101) anatase peak using Scherrer'sequation. hSpecific surface area determined using the BET method in the range0.05<PIPO<0.35. CBJH desorption pore volume calculated between 2 and 300 nm
The anatase peak. positions did not shift in the mixed oxides, indicating that
the two oxides were present as distinct crystals and solid solutions were not
formed, for all (N~)0.33 W03 loadings. The (NH4)0.33W03 peaks were not
183
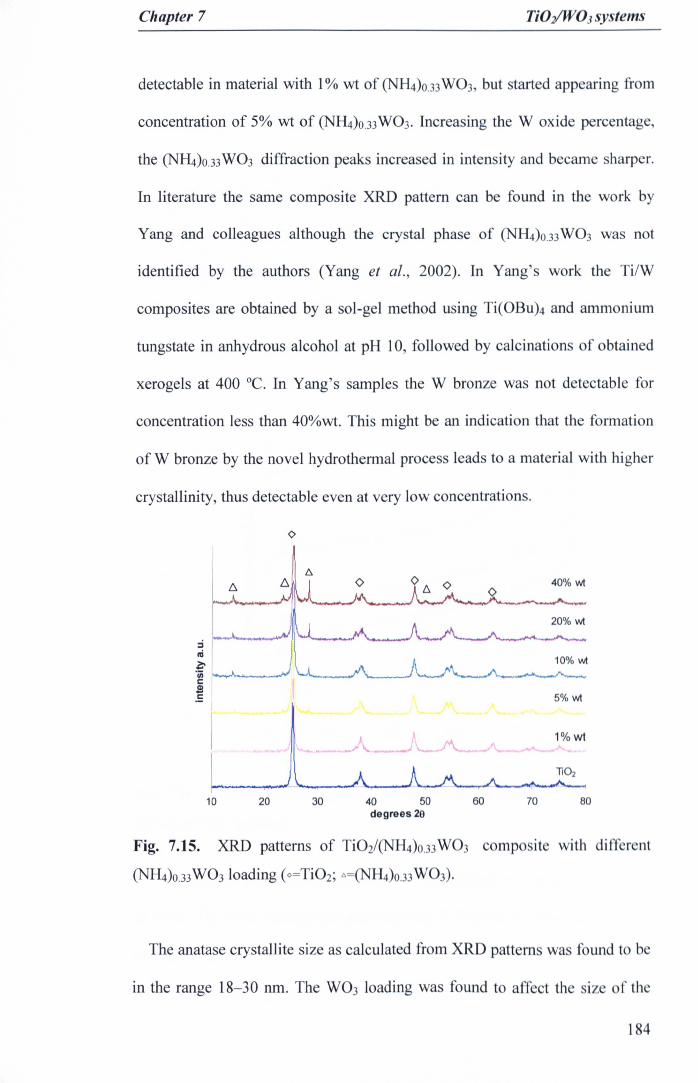
Chapter 7 TiOyWO 3systems
detectable in material with 1% wt of (NH4)o.33W03, but started appearing from
concentration of 5% wt of (NH4)o.33W03. Increasing the W oxide percentage,
the (NH4)o.33W03 diffraction peaks increased in intensity and became sharper.
In literature the same composite XRD pattern can be found in the work by
Yang and colleagues although the crystal phase of (NH4)o.33W03 was not
identified by the authors (Yang et al., 2002). In Yang's work the Ti/W
composites are obtained by a sol-gel method using Ti(OBu)4 and ammonium
tungstate in anhydrous alcohol at pH 10, followed by calcinations of obtained
xerogels at 400°C. In Yang's samples the W bronze was not detectable for
concentration less than 40%wt. This might be an indication that the formation
of W bronze by the novel hydrothermal process leads to a material with higher
crystallinity, thus detectable even at very low concentrations.
o
10 20 30 40 50degrees 29
60 70 80
Fig. 7.15. XRD patterns of Ti02/(NH4)o.33 W03 compo ite with diff r nt
(N~)O.33W0310ading (o=Ti02; "=(NH4)o.33W03).
The anatase crystaiJite size as calculated from XRD pattern was found to be
in the range 18-30 nm. The W03 loading was found to affect th lZ of th
184
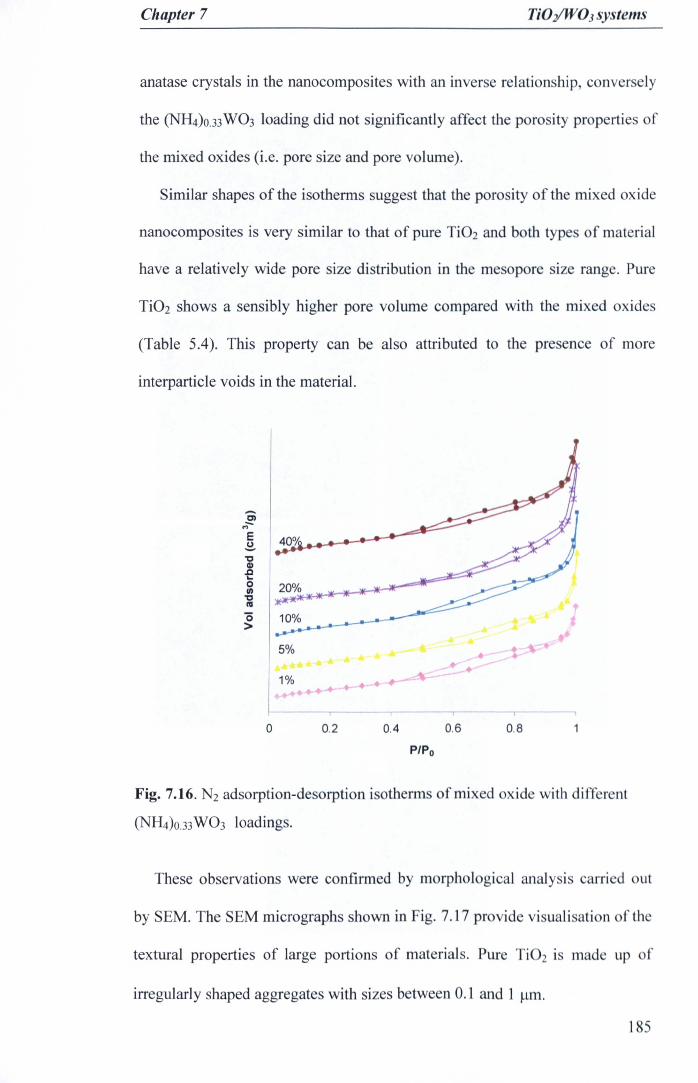
Chapter 7 TiO]I'W03 systems
anatase crystals in the nanocomposites with an inverse relationship, conversely
the (NH4)O.33W03 loading did not significantly affect the porosity properties of
the mixed oxides (i.e. pore size and pore volume).
Similar shapes of the isotherms suggest that the porosity of the mixed oxide
nanocomposites is very similar to that of pure Ti02 and both types of material
have a relatively wide pore size distribution in the mesopore size range. Pure
Ti02 shows a sensibly higher pore volume compared with the mixed oxides
(Table 5.4). This property can be also attributed to the presence of more
interparticle voids in the material.
o 0.2 0.4 0.6 0.8
P/Po
Fig. 7.16. N2 adsorption-desorption isotherms of mixed oxid with differ nt
(NH4)o.33W03 loadings.
These observations were confirmed by morphological analy i carri d ut
by SEM. The SEM micrographs shown in Fig. 7.17 provid vi uali ati n f the
textural properties of large portions of materials. Pure Ti02 i made up f
irregularly shaped aggregates with sizes between 0.1 and 1 1•.lITI.
185

Chapter 7
Fig. 7. 17. SEM micrographs of pure Ti02 CA); pure (NH4)o.33 W03 CB); mixed
oxides with 1% CC); 5% (D); 10% (E) 20% (F) 40% (G) (NRt)O.33 W03 content.
186

Chapter 7 TlO:/WOJsystems
The particles generally exist in loose aggregates with a significant quantity
of interparticle voids, which is consistent with the sorption data and justifies
the higher pore volume. Comparison of SEM micrograph shows that the
presence' of ammonium tungstate bronze in the mixed oxides does not
significantly affect the particle morphology. In the mixed oxides can be noticed
only a slight increase in the level of particle aggregation and an associated
decrease in interparticle voids density. However, the sample containing 10%wt
(NH4)O.33W03 shows peculiar behaviour, with a morphological structure more
similar to that of pure Ti02 but with a slight increase in porosity, which
corroborates with an increase in BET surface area (Table 5.5). Conversely,
pure (NH4)O.33W03 exhibits a highly aggregated particle morphology, which
may explain the lower level of interparticle voids evident from the sorption
data.
7.3.4.2 Photocatalytic activity
The photocatalytic activity of novel Ti02/(NlL.)o.33WO] materials was
evaluated in the gas phase photodegradation of TeE in the flat plate
photoreactor. All experiments were conducted in a reaction-controlled regime
using a total flow rate of 0.04 L s, 8% relative humidity, an initial
concentration of TCE in synthetic air (20% Oz, 80% Nl; BOC gases) of 24.8 ±
2 J.lM and an incident photon flux (UVA) on the supported catalyst of 5.53
W/m. Reaction rates of the mixed oxide samples were compared to those of
single component catalysts evaluated under the same conditions, and with that
of commercial Ti02 Degussa P-25 reference catalyst.
187
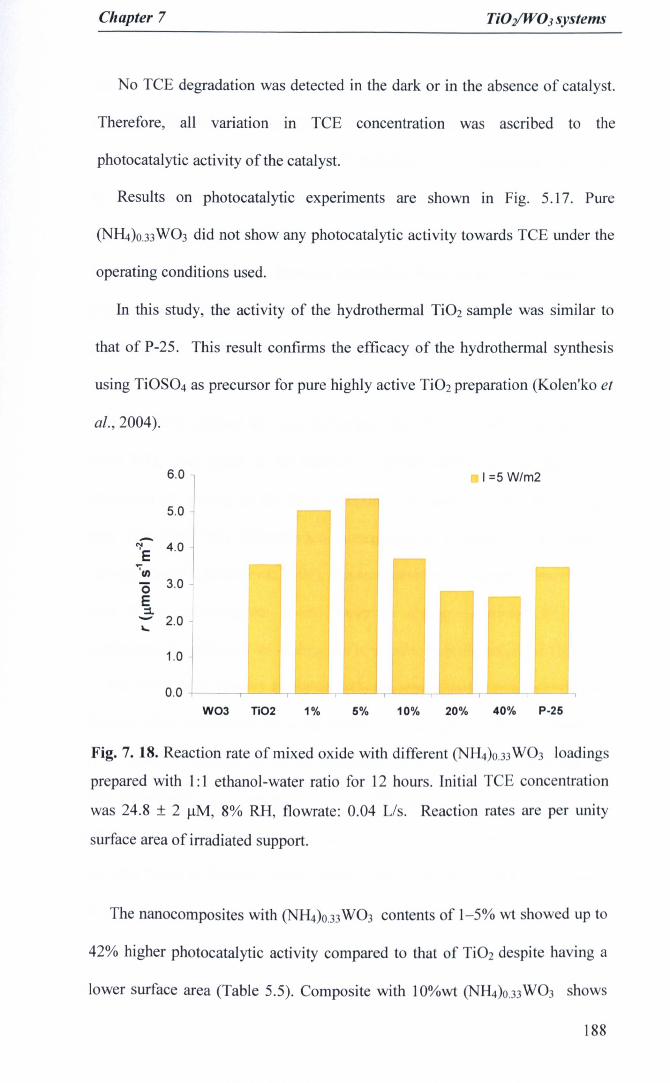
Chapter 7 TiOYW03 systems
No TCE degradation was detected in the dark or in the absence of catalyst.
Therefore, all variation in TCE concentration was ascribed to the
photocatalytic activity of the catalyst.
Results on photocatalytic experiments are shown in Fig. 5.17. Pure
(NH4)O.33 W03 did not show any photocatalytic activity towards TCE under the
operating conditions used.
In this study, the activity of the hydrothermal Ti02 sample was similar to
that of P-2S. This result confirms the efficacy of the hydrothermal synthesis
using TiOS04 as precursor for pure highly active Ti02 preparation (Kolen'ko et
al.,2004).
6.0
5.0
-~ 4.0E"II)
(5 3.0E:1.- 2.0"-
1.0
0.0W03 Ti02 1%
., =5 W/m2
5% 10% 20% 40% P-25
Fig. 7. 18. Reaction rate of mixed oxide with different (NH4)o.33 W03 loadings
prepared with 1:1 ethanol-water ratio for 12 hours. Initial TCE concentration
was 24.8 ± 2 ~M, 8% RH, flowrate: 0.04 Lis. Reaction rates are per unity
surface area of irradiated support.
The nanocomposites with (NH4)o.33 W03 contents of 1-5% wt showed up to
42% higher photocatalytic activity compared to that of Ti02 despite having a
lower surface area (Table 5.5). Composite with 10%wt (NH4)o.33 W03 shows
188
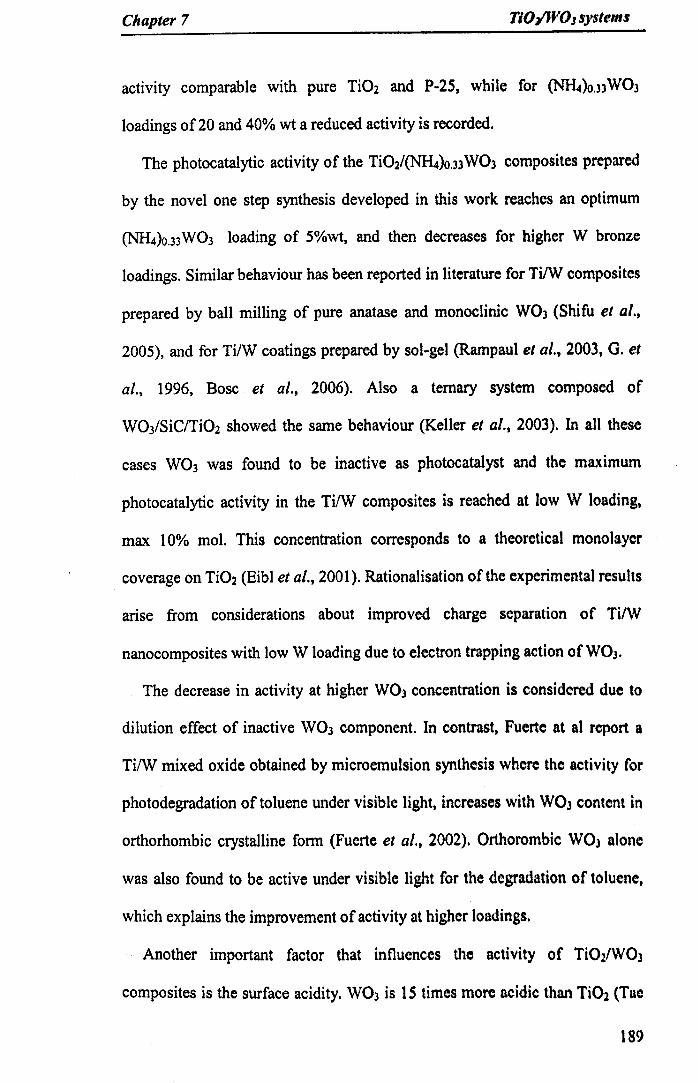
Chapter 7 TiO~OJ systelll'
activity comparable with pure Ti02 and P-2S, while for (NH4)OJ) WO)
loadings of 20 and 40% wt a reduced activity is recorded.
The photocatalytic activity of the Ti02/('N1i..)o.33WO) composites prepared
by the novel one step synthesis developed in this work reaches an optimum
(NH4)O.)3W03 loading of S%wt, and then decreases for higher W bronze
loadings. Similar behaviour has been reported in literature for TiIW composites
prepared by ball milling of pure anatase and monoclinic WO) (Shifu et al.,
2005), and for TiIW coatings prepared by sol-gel (Rampaul et al., 2003, O. et
al., 1996, Bose et al., 2006). Also a ternary system composed of
W03/SiC/Ti02 showed the same behaviour (Keller et al., 2003). In all these
cases WO) was found to be inactive as photocatalyst and the maximum
photocatalytic activity in the TiIW composites is reached at low W loading,
max 10% mol. This concentration corresponds to a theoretical monolayer
coverage on Ti02 (Eibl et al., 2001). Rationalisation of the experimental results
arise from considerations about improved charge separation of Ti/W
nanocomposites with low W loading due to electron trapping action of WO).
The decrease in activity at higher WO) concentration is considered due to
dilution effect of inactive WO) component. In contrast, Fuerte at al report a
TiIW mixed oxide obtained by microemulsion synthesis where the activity for
photodegradation of toluene under visible light, increases with WO) content in
orthorhombic crystalline form (Fuerte et al., 2002). Orthorombic WO) alone
was also found to be active under visible light for the degradation of toluene,
which explains the improvement of activity at higher loadings.
Another important factor that influences the activity of Ti02IW03
composites is the surface acidity. W03 is 15 times more acidic than TiOl (Tae
189

Chapter 7
Kwon et al., 2000) therefore its presence in the nanocomposite results in
improved adsorption of hydroxyl and water at the surface and can modify the
affinity of organic substrates for the catalyst surface, and as a consequence, the
adsorption equilibrium and photooxidation activity of the catalyst.
A linear correlation between surface acidity and photocatalytic activity was
found for decomposition of DCB by P-2S (papp et al., 1994). Loading W03 by
impregnation on P-2S was found to increase the surface acidity of the resulting
materials. The optimized photocatalyst was found 3.6% W03 content which
correspond the maximum surface acidity. Kwon and colleagues report a value
of 3% for W03 loading for maximum surface acidity and optimum degradation
rate of 2-propanol and benzene in gas phase (Tae Kwon et al., 2000). Loading
of amorphous W03 improves the surface acidity as recently reported by
Akurati and co-workers in their study on degradation of methylene blu in liquid
phase by flam-made Ti02IW03 nanoparticles (Akurati et al., 2008). Recently, a
novel Ti02IW03 composite made of anatase and monoclinic W03 has been
developed by surfactant assisted hydrothennal process followed by calcination
(Ke et al., 2008). Composites with 1:3, 4: 1 and 1:1 Ti02IW03 molar ratio show
improved photocatalytic activity than pure Ti02 obtained following in the same
experimental conditions, for degradation of Rhodamine B in aqueous phase.
The best composite was the 1:1 Ti02IW03, which showed activity comparable
with that of Degussa P-25.
An improved activity of the composite compared with pure components can
be the result of the synergic effect of two or all the above factors, but the
determination of the contribution of each factor to is difficult. as it depends on
many variables such as composite preparation, crystal composition etc
190

Chapter 7 TiOYWOJ systems
The experimental results relative to the Ti02/(NH4)o.33W03 nanocomposites
prepared in this work show that <NH4)O.33W03 is not photocatalytically active.
During the optimization of synthesis parameters, the crystallization of
(NH4)O.33W03 component was found to be of fundamental importance. In fact,
materials that did not show <N"H4)O.33W03 diffraction pattern were found to be
the less active for TeE photodegradation. The enhancement in the degradation
rate compared with plain Ti02 can therefore be attributed to presence of
hexagonal W03. which lead to improved charge separation. Optimum loading
corresponds with monolayer coverage, confirming previously reported results
discussed above. However, at <NH4)O.33W03 loadings of 10% wt or higher, the
activity reduced as a result of the dilution effect of the inactive (NH4)o.33W03
phase.
7.3.5 Studies at different light Intensities
The dependence of reaction rate on irradiation intensity in the range 5-21
W/m2 for novel Ti02/(NH4)o.33 W03 composites was studied. Photon flux was
controlled by using 1, 3 and 5 UV A lamps kept at 10.5 cm from the catalyst
surface. This distance has been proven to assure homogeneous illumination on
the catalyst surface (Salvado-Estivill, 2007).
The reaction rates obtained for the composite catalysts and P-25 at the three
intensities studied are reported in Fig. 7.19. By comparison among different
nanocomposites we can see that for high light intensities the mixed oxides with
1wt % (NH4)O.33W03 is most active. The reaction rate decreased steadily with
increasing (NH4)0.33W03 loading in the catalyst for the three light intensities
investigated.
191
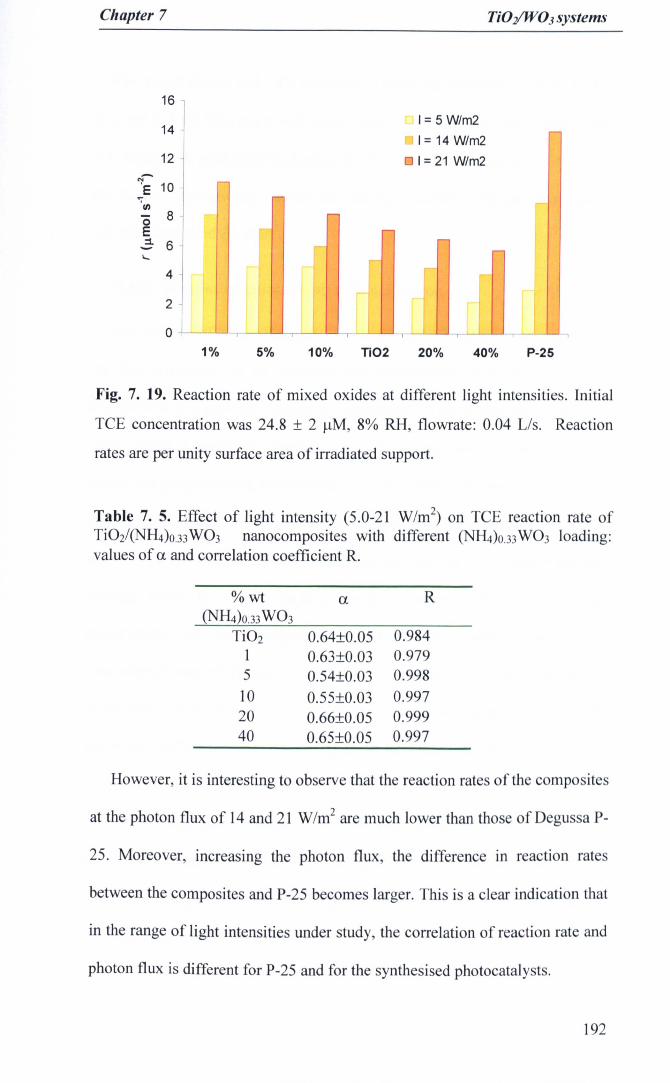
Chapter 7 TiO]/'W03 systems
16
14
12-"i 10E
';"VI
0 8E:1. 6'-
4
2
0
Q 1 = 5 W/m2
.1 = 14 W/m2 -1= 21 W/m2
,.....,
r-,.... r+,.... ,
, r-r-
r- r-,
....., ~r-
~;II:"
,~ [ [! ~.... ~ ~
1% 5% 10% Ti02 20% 40% P-25
Fig. 7. 19. Reaction rate of mixed oxides at different light intensities. Initial
TCE concentration was 24.8 ± 2 I-lM, 8% RH, flowrate: 0.04 Lis. Reaction
rates are per unity surface area of irradiated support.
Table 7. 5. Effect of light intensity (5.0-21 W/m2) on TCE reaction rate ofTi02/(NH4)o.33 W03 nanocomposites with different (NH4)o.33W03 loading:values of a and correlation coefficient R.
%wt a R(NH4)o.33W03
Ti02 0.64±0.05 0.9841 0.63±0.03 0.9795 0.54±0.03 0.99810 0.55±0.03 0.99720 0.66±0.05 0.99940 0.65±0.05 0.997
However, it is interesting to observe that the reaction rates of the composites
at the photon flux of 14 and 21 W1m2 are much lower than those of Degussa P-
25. Moreover, increasing the photon flux, the difference in reaction rates
between the composites and P-25 becomes larger. This is a clear indication that
in the range of light intensities under study, the correlation of reaction rate and
photon flux is different for P-25 and for the synthesised photocatalysts.
192
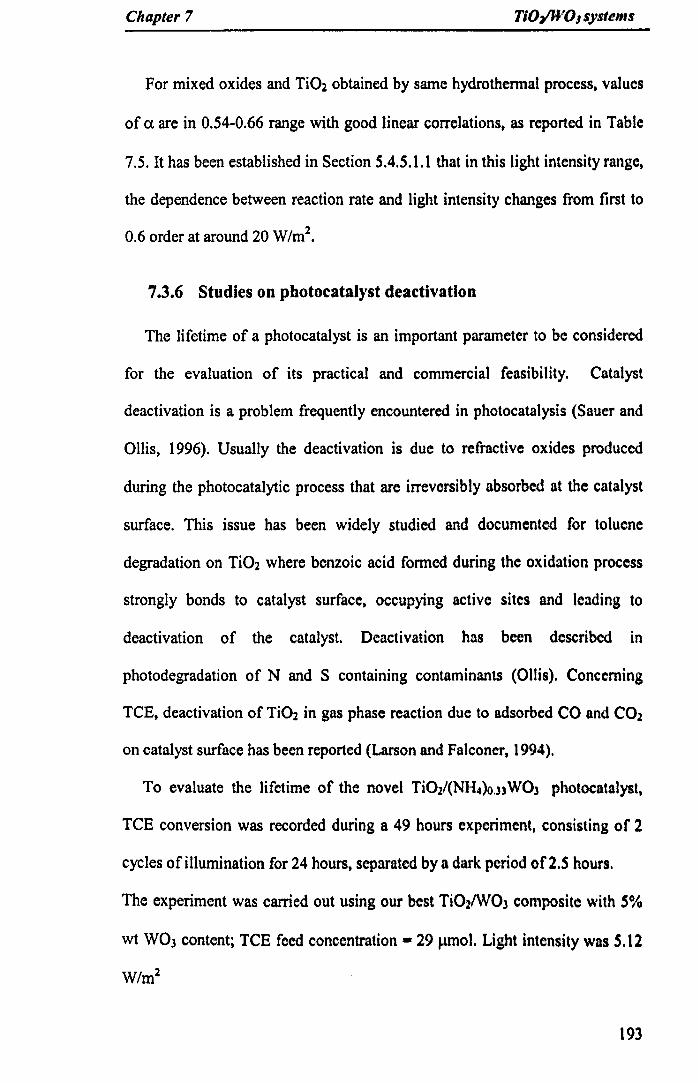
Chapter 7 TlOYWO, systems
For mixed oxides and Ti02 obtained by same hydrothermal process, values
of Cl are in 0.54-0.66 range with good linear correlations, as reported in Table
7.5. It has been established in Section 5.4.5.1.1 that in this light intensity range,
the dependence between reaction rate and light intensity changes from first to
0.6 order at around 20 W/m2•
7.3.6 Studies on photocatalyst deactivation
The lifetime of a photocatalyst is an important parameter to be considered
for the evaluation of its practical and commereial feasibility. Catalyst
deactivation is a problem frequently encountered in photocatalysis (Sauer and
Ollis, 1996). Usually the deactivation is due to refractive oxides produced
during the photocatalytic process that are irreversibly absorbed at the catalyst
surface. This issue has been widely studied and documented for toluene
degradation on Ti02 where benzoic acid formed during the oxidation process
strongly bonds to catalyst surface, occupying active sites and leading to
deactivation of the catalyst. Deactivation has been described in
photodegradation of N and S containing contaminants (Ollis). Concerning
TCE, deactivation of Ti02 in gas phase reaction due to adsorbed CO and CO2
on catalyst surface has been reported (Larson and Falconer, 1994).
To evaluate the lifetime of the novel Ti02/(NH.)o.)) WO) photocatalyst,
TCE conversion was recorded during a 49 hours experiment, consisting of 2
cycles of illumination for 24 hours, separated by a dark period of 2.S hours.
The experiment was carried out using our best Ti02/WO) composite with S%
wt W03 content; TCE feed concentration - 29 J.U1101. Light intensity was S.12
W/m2
193

Chapter 7 TiO:z/WOJ systems
c:o'j!?~ 4%c:oeWo 2%I-
6%
o 10 20 30 40 50
illumination time (hours)
Fig. 7. 20. TeE conversion for 5% wt (NH4)o.33W03 over time; [TeE]i = 29
umol; 1= 5.12 W/m2,
The experimental result shows no deactivation of the Ti02/(NH4)o.33 W03
catalyst with irradiation time during the whole experiment. TeE conversion of
5,6±O,5%was rapidly reached by the system and kept constant until the end of
the first irradiation cycle, and recovered during the second cycle,
7.4 Summary
Two different Ti02/(NH4)o.33 W03 systems have been studied for
photodegradation of TeE in the gas phase: a layered structure and a mixed
oxide thick film,
The layered structured system demonstrates an interesting surface
morphology that leads to useful photoelectrochemical properties, However, no
photodegradation of TeE in gas phase was observed under UV and visible
light. The complete inactivity of the layered materials was ascribed to the high
194

Chapter 7 TiOy'WOJ systems
W03 loading which deactivate the system due to its low rate of electron
transfer to 02.
A novel one step hydrothermal synthesis was developed for preparation of
Ti02/<N"H4)0.33 W03 nanocomposite. Reaction conditions were studied in
respect to structural and crystallographic properties of the resulting material,
and optimised in respect to photocatalytic oxidation of TeE. Best
photocatalytic performances were found for low (NH..)o.33WO) loading (up to
5%). Effect of light intensity and possible deactivation of the nanocomposites
were also evaluated, showing a half order dependence of reaction rate with
light intensity for synthesised photocatalysts and no deactivation after SO hours
of reaction.
195

Chapter 8
Conclusions and reccommendations

Chapter8 Conclusions tmd recom",endlll;ons
8.1 Conclusions
The aim of this research was the development, optimisation and comparison
of Ti02-based photocatalysts with enhanced photocatalytic activity for the
photo-oxidation in the gas phase for indoor air application. Trichloroethylene,
a common volatile organic compound, was chosen as probe pollutant.
Three different TiOrbased photocatalytic systems have been studied:
pristine Ti02, N-doped Ti02 and Ti02IWOJ. For the photocatalyst preparation,
modified sol-gel and/or hydrothermal synthesis approaches were used.
The syntI;tesisparameters were varied in order to study their impact on
photocatalysts' properties and activity. The materials properties were
characterised by a wide range of analytical techniques such as X-ray
diffraction, N2 adsorption, electron microscopies, diffuse reflectance and X-ray
photoelectron spectroscopy. The photocatalytic properties were evaluated in a
flat-plate single-pass photocatalytic reactor, at initial TCE concentration in the
J.lM range, RH of 8%, flowrate of 0.04 Us. The photoactivity was
systematically studied at different incident light intensities, in the range S-41
W/m2 and compared with the activity of commercial material Ti02 P·2S as
reference photocatalyst. The structural and morphological properties of
synthesised photocatalyst were correlated to the structural and morphological
properties of the materials.
8.1.1 Studies on pristine Ti02
A wide range of mesoporous bare Ti02 were prepared by a modified sol-gel
procedure, consisting of a hydrolysis-condensation step followed by a
196

Chapter8 Conclusions and recommendtltlons
crystallization process. The effect of acidic catalysis during the hydrolysis-
condensation reaction and the impact of calcination and hydrothennal
treatment as crystallization methods were fully investigated.
Depending on the crystallization process, the materials show significant
morphological and structural properties. The impact of crystallization
parameters on crystal growth was assessed. In the case of calcination it was
possible to modulate with high reproducibility the titania crystal dimension, by
increasing the firing temperature in the range 300-800 "C, An increase in the
crystal size was achieved by increasing the calcination temperature regardless
the addition of acid during the hydrolysis-condensation step of the amorphous
Ti02. In the case ofhydrothennal process an increase in crystal size was found
by increasing the water content in the H20/ethanol reaction media. Particle size
in the range 13-64 nm and 5-11 nm were obtained for calcination and
hydrothermal process respectively, to which correspond surface areas in the
range 100-33 and 250-170 m2/g.
It was found that acidic sol-gel preparation yield to Ti02 materials with
significant differences in particles morphology and porosity compared with
materials prepared under uncatalysed sol-gel and crystallised at same
conditions. For a given crystal size, the morphologic difference leads to a
reduction of surface area.
The photoactivity under UVA irradiation strongly depends on the crystal
size of titania and also on the presence and percentage of rutile in the
photocatalyst. A linear correlation between the photocatalytic activity and the\
crystal size was found as long as no rutile was present in the sample. Pure
anatase obtained by uncatalysed sol-gel and calcined at temperature between
197
Chapter8 COllcluslons alld recommendations
400 and 600°C show an enhanced photocatalytic activity compared with TiOl
P-25. The optimum anatase crystal size of 28 nm exhibits a photocatalytic
activity that exceeds that ofP-25 by a 2 folds.
The correlation between crystal size and photoactivity for anatase was
attribute to the faster interfacial charge transfer rate at catalyst surface. The
presence of rutile was found to have a detrimental effect on the overall
photoactivity probably due to its low activity towards TeE photodegradation.
8.1.2 Studies on N-doped TiOz
The best performing pristine Ti02 were doped with N in the attempt of
obtaining a visible active photocatalyst. Different N insertion levels in the
titania crystal lattice were achieved by sol-gel and hydrothermal procedures.
with the latter leading to higher N-doping. However, no photocatalytic activity
under visible illumination was recorded under low irradiation intensities.
Moreover, the activity of the original bare TiOl materials under WA light was
reduced by doping. probably due to higher density of recombination centre
associated with the N doping.
8.1.3 Studies on TiOz/(NH.)O.33 W03 systems
The importance of photocatalyst design and relative spatial arrangement in
mixed oxide photocatalysts was assessed during this study. A layered system
composed of anatase Ti02 deposited on an layer of monoclinic W03 was found
to be photocatalytic inactive under WA and visible light for photodegradation
of TCE. By comparison with similar systems reported in the literature, the
inactivity of these layered photocatalytic systems was ascribed to the high WOJ
198
Chapter8
loading which deactivates the system due to its low rate of electron transfer to
02.
In the frame of studies about Ti021W03 mixed photocatalytic systems, a
novel one-step hydrothermal synthesis was developed and optimised for the
preparation of Ti02/(NH4)o.33 W03 nanocomposite with high photocatalytic
activity at low UVA intensity. Synthesis parameters such as reaction time,
solvent composition and W03 loading were optimised with respect to the
photocatalytic oxidation of TCE. Best material was Ti02/(NH,,)o.33 W03 with
5% wt (NH4)O.33W03 loading prepared by hydrothennal reaction at 1SO °C for
12 hours, in mixture 1:1water-ethanol.
The studies on the dependence of reaction rate on light intensity of the
different set of samples show reaction orders between half and first order, and
allow to evidence that the intensity threshold for transition from first order to
half order, is different for the different photocatalysts.
8.1.4 Practical implications
The practical application of photocatalytic processes based on the use of
Ti02 in indoor air remediation devices requires the development of
photocatalyst capable to perform high conversions, possibly in a sustainable
way. The photocatalysts prepared during this research, exhibit a substantial
potentiality for the implementation of indoor air cleaning technologies. These
materials exhibit enhanced photactivity especially at low incident UVA light
intensities. This is a fundamental requirement for the implementation of a cost-
effectiveness and sustainable photocatalytic technology in commercial devices
199

ChapterS Conclusions and recommendations
for indoor air treatments. However, the coating technology used for catalyst
immobilisation must be optimized in order to guarantee stability under
operational conditions.
8.2 Recommendations for future work
The results achieved during this work open to several possibilities for
further work concerning the study of fundamental aspects of the photocatalytic
process and the applicability of the optimized photocatalysts developed in this
thesis for practical applications in indoor air treatment.
• The major limitation in the evaluation of the photocatalysts prepared in
this work concerns its immobilisation. A suitable immobilisation
method for the preparation of stable coatings must be developed and
assessed.
• A high activity has been proven for the photo-oxidation of TCE as
model pollutant. Therefore, it is suggested the evaluation of the
photocatalytic behaviour of the optimised photocatalysts towards other
gaseous substrates.
• The evaluation of the catalysts for the abatement of multicomponent
VOCs systems reproducing the air composition and pollution
concentration found in enclosed environments is also highly
recommended. This investigation would assess the feasibility of the
materials in real indoor air conditions. It would also provide important
insights for the elucidation of reaction kinetics and mechanisms in
multicomponent systems.
200

Chapter8 Conclusions and recommendations
• Further research concerning the optimisation of the photocatalysts for
visible light activation is needed. The evaluation of prepared N-doped
samples under high irradiation intensity in the visible light range is also
advised.
• In this thesis, the evaluation of the photocatalysts perfonnances was
restricted to a laboratory scale. Considering the practical implication of
this research, the scale up of the photocatalytic system and the testing
of the best photocatalysts in photocatalytic air cleaning prototypes is
strongly encouraged.
• The applicability of Ti02 materials is not confined to the field of
photocatalysis but concern various research topics such as energy
storage and H2 production. Thus, expanding the field of application of
the optimised Ti02 based materials developed in this thesis is highly
recommended.
201

Bibliography

Bibliography
AKIRA FUJISHIMA, T. N. R, DONALD A. TRYK (2000) Titanium Dioxidephotocatalysis. Journal 0/ Photochemistry and Photobiology C:Photochemistry Reviews. 1, 1-21.
AKURATI, K. K., VITAL, A., DELLEMANN, J.-P., MICHALOW, K.,GRAULE, T., FERRI, D. &. BAlKER, A. (2008) Flame-madeW03ffi02 nanoparticles: Relation between surface acidity, structureand photocatalytic activity. Applied Catalysis B: Environmental, 79,53-62.
ALBERICI, R M., MENDES, M. A., JARDIM, W. F. &. EBERLIN, M. N.(1998) Mass spectrometry on-line monitoring and MS2 productcharacterization of Ti02IUV photocatalytic degradation of chlorinatedvolatile organic compounds. Journal 0/ the American Society for MassSpectrometry. 9, 1321-1327.
ANDREOZZI, R, CANTERINO, M. &. MAROTTA, R. (2006) Fe(II1)homogeneous photocatalysis for the removal of 1,2-dichlorobenzene inaqueous solution by means UV lamp and solar light. Water Research.40,3785-3792.
ANPO, M. &. TAKEUCHI, M. (2003) The design and development of highlyreactive titanium oxide photocatalysts operating under visible lightirradiation. Journal of Catalysis, 216,505-516.
ARANA, J., DONA-RODRIGUEZ, J. M., GONzALEZ-DiAZ, 0., TELLOREND6N, E., HERRERA MELlAN, J. A., COL6N, G., NAVio, J. A.& PEREZ PENA, J. (2004) Gas-phase ethanol photocatalyticdegradation study with Ti02 doped with Fe, Pd and Cu. Journal 0/Molecular Catalysis A: Chemical. 215, 153-160.
ARQUES, A., AMAT, A. M., SANTOS-JUANES, L., VERCHER, R. F.,MARiN, M. L. &. MIRANDA, M. A. (2007) 2,4,6-Triphenylthiapyrylium cation as homogeneous solar photocatalyst.Catalysis Today. 129,37-42.
ASAHI, R, MORIKAWA, T., OHWAKI, T., AOKI, K. &. TAGA, Y. (2001)Visible-Light Photocatalysis in Nitrogen-Doped Titanium Oxides.Science. 293,269-271.
ATKINS, P. W. (1998) Physical Chemistry, New York, Freeman.ATTARD, G., BARNES, C. (1998) Surfaces, Oxford; New York, Oxford
University Press.BALAzsI, C. &. PFEIFER, J. (2002) Development of tungsten oxide hydrate
phases during precipitation, room temperature ripening andhydrothermal treatment. Solid State Iontcs, 151, 353·358.
BARRETT, E. P., JOYNER, L. G. &. HALENDA, P. P. (1951) TheDetermination of Pore Volume and Area Distributions in PorousSubstances. I. Computations from Nitrogen Isotherms. Journal cif theAmerican Chemical Society. 73,373·380.
BLAKE, N. R. & GRIFFIN, G. L. (1988) Selectivity control during thephotoassisted oxidation of l-butanol on titanium dioxide. JournalPhysical Chemistry. 92,5697·5701.
BOSC, F., EDWARDS, D., KELLER, N., KELLER, V. & AYRAL, A. (2006)Mesoporous Ti02·based photocatalysts for UV and visible light gas-phase toluene degradation. Thin Solid Films. 495, 272-279.
202
Bibliography
BOUZAZA, A., VALLET, C. & LAPLANCHE, A. (2006) Photocatalyticdegradation of some VOCs in the gas phase using an annular flowreactor: Determination of the contribution of mass transfer andchemical reaction steps in the photodegradation process. Journal ofPhotochemistry and Photobiology A: Chemistry, 177,212·217.
BRUNAUER, S., EMMETT, P. H. & TELLER, E. (193S) Adsorption of Gasesin Multimolecular Layers. Journal of the American Chemical Society,60,309-319.
CAl, K. F., HE, X. R. & ZHANG, L. C. (200S) Fabrication, properties andsintering ofZnO nanopowder. Materials Letters, 62,1223·1225.
CHATTERJEE, D. & DASGUPTA, S. (2005) Visible light inducedphotocatalytic degradation of organic pollutants. Journal ofPhotochemistry and Photobiology C: Photochemistry Reviews, 6, IS6-205.
CHEN, Y., CRITTENDEN, 1. C., HACKNEY, S., SUITER, L. & HAND, D.W. (2005) Preparation of a Novel Ti02-Based p-n Junction NanotubePhotocatalyst. Environmental Scence and Technology, 39, 1201-120S.
CHEN, Y., STATHATOS, E. & DIONYSIOU, D. D. (200S) Microstructurecharacterization and photocatalytic activity of mesoporous Ti~ filmswith ultrafine anatase nanocrystallites. Surface and CoatingsTechnology, 202, 1944-1950.
CHENG, H., MA, J., ZHAO, Z. & QI, L. (1995) Hydrothermal Preparation ofUniform Nanosize Rutile and Anatase Particles. Cheistry of Materials,7,663·671.
CHENG, P., DENG, C., DAI, X., LI, B., LIU, D. & XU, J. (200S). Enhancedenergy conversion efficiency of Ti02 electrode modified with WO] indye-sensitized solar cells. Journal of Photochemistry and PhotobiologyA: Chemistry, 195, 1, 144·1S0.
CHICHINA, M., TICHY, M., CHURPITA, O. & HUBICKA, Z. (200S) WDS05 Proceedings of Contributed Papaers, Part lit 325-331.
CIESLA, P., KOCOT, P., MYTYCH, P. & STASICKA, Z. (2004)Homogeneous photocatalysis by transition metal complexes in theenvironment. Journal of Molecular Catalysis A: Chemical, 224, 17·33.
COMEAP (2004) Guidance on the Effects on Health of Indoor Air Plootants.[online] Available fram:<http:\ 'advtsorybodies.doh.gov. uk/comeap/P DFSlguidancelndoorairqualitydec04.pdf> .
DE TACCONI, N. R., CHENTHAMARAKSHAN, C. R., RAJESHWAR, K.,PAUPORTE, T. & LINCOT, D. (2003) Pulsed electrodeposition ofW03-Ti02 composite films. Electrochemistry Communications, St 220-224.
DE TACCONI, N. R., CHENTHAMARAKSHAN, C. R., WOUTERS, K. L.,MACDONNELL, F. M. & RAJESHWAR, K. (2004) Composite WO)-Ti02 films prepared by pulsed electrodeposition: morphological aspectsand electrochromic behavior. Journal of Electroanalytical Chemistry,566, 249-256.
DEMEESTERE, K., VISSCHER, A. D., DEWULF, J., LEEUWEN, M. V. &LANGENHOVE, H. V. (2004) A new kinetic model for titaniumdioxide mediated heterogeneous photocatalytic degradation of
203

Bibliography
trichloroethylene in gas-phase. Applied Catalysis B: Environmental, 54,261-274.
DENG, X., YUE, Y. & GAO, Z. (2002) Gas-phase photo-oxidation of organiccompounds over nanosized Ti02 photocatalysts by variouspreparations. Applied Catalysis B: Environmental, 39, 135-147.
DHANANJAY S BHATKHANDE, V. G. P. A. A CM. B. (2002)Photocatalytic degradation for environmental applications - a review.Journal of Chemical Technology & Biotechnology, 77,102-116.
DIBBLE, L. A. & RAUPP, G. B. (1990) Catalysis Letters, 4,345.DIBBLE, L. A. & RAUPP, G. B. (1992) Fluidized-bed photocatalytic
oxidation of trichloroethylene in contaminated air streams.Environmental and Science Technology, 26,492-495.
DO, Y. R., LEE, W., DWIGHT, K. & WOLD, A. (1994) The Effect ofWOJ onthe Photocatalytic Activity of Ti02. Journal of Solid State Chemistry,108, 198-201.
DO, Y. R., LEE, W. 1., DWIGHT, K. & WOLD, A. (1993) The Effect of WO)on the Photocatalytic Activity of Ti02. Journal of Solid StaleChemistry, 108, 198-201.
EIBL, S., GATES, B. C. & KNOZINGER, H. (2001) Structure of WO,lfi02Catalysts Prepared from Hydrous Titanium Oxide Hydroxide: Influenceof Preparation Parameters. Langmuir, 17, 107-115.
EPA, U.S. (2002) The Inside Story: A Guide to Indoor Air Quality. [online]Available from:<htt,p:llwww.epa.gov/iag/pubstinsidest.html.
EPA, U. S. (2008) Ozone Generators that are Sold as Air Cleaners. [online]Available from:< http://www.epa.gov/iag/pubslozonegen.html>
FLEGLER, S. L., HECKMAN, J. W. & KLOMPARENS, K. L. N. Y., W.H.(1993) Scanning and Transmission Electron Microscopy: anIntroduction. Freeman.
FOUAD, N. E., NOHMAN, A. K. H., MOHAMED, M. A. & ZAKI, M. I.(2000) Characterization of ammonium tungsten bronze [(NH4)o.J3WOl]in the thermal decomposition course of ammonium paratungstate.Journal 0/Analytical and Applied Pyrolysis, 56, 23-31.
FU, X., CLARK, L. A., ZELTNER, W. A. & ANDERSON, M. A. (1996)Effects of reaction temperature and water vapor content on theheterogeneous photocatalytic oxidation of ethylene. Journal ofPhotochemistry and Photobiology A: Chemistry, 97, 181-186.
FUERTE, A., HERNANDEZ-ALONSO, M. D., MAIRA, A. J., MARTINEZ-ARIAS, A., FERNANDEZ-GARCIA, M., CONESA, J. C., SORIA, J.& MUNUERA, G. (2002) Nanosize Ti-W Mixed Oxides: Effect ofDoping Level in the Photocatalytic Degradation of Toluene UsingSunlight-Type Excitation. Journal of Catalysis, 212, 1·9.
FUJISHIMA, A. & HONDA, K. (1972) Electrochemical Photolysis of Water ata Semiconductor Electrode. Nature, 238, 37-38.
FUJISHIMA, A., KOHAYAKAWA, K. & HONDA, K. (1975) Journal of theElectrochemical Society, 1487.
G., M., L., P., A., S., M., V. A., R., C., G., C., C., M., V., R. & G., S. (1996)Influence of tungsten oxide on structural and surface properties of 501-gel prepared Ti02 employed for 4-nitrophenol photodegradation
204
Bibliography
Journal of the Chemical Society, Faraday Transactions, 92,819 - 829.GAO, W., LI, M., KLIE, R. & ALTMAN, E. I. (2006) Growth and
characterization of model oxide catalysts. Journal of ElectronSpectroscopy and Related Phenomena, 150, 136-149.
GEORGIEVA, J., ARMYANOV, S., VALOVA, E., POULIOS, I. &SOTIROPOULOS, S. (2007) Enhanced photocatalytic activity ofelectrosynthesised tungsten trioxide-titanium dioxide bi-layer coatingsunder ultraviolet and visible light illumination. ElectrochemistryCommunications, 9, 365-370.
GEORGIEVA, J., ARMYANOV, S., VALOVA, E., TSACHEVA, T.,POULIOS, I. & SOTIROPOULOS, S. (2005) Photoelectrochemicalbehaviour of electrodeposited tungsten trioxide and electrosynthesisedtitanium dioxide single component and bilayer coatings on stainlesssteel substrates. Journal of Electroanalyncal Chemistry, 585,35-43.
GOGATE, P. R. & PANDIT, A. B. (2004) A review of imperativetechnologies for wastewater treatment I: oxidation technologies atambient conditions. Advances in Environmental Research, 8, 501-551.
GORA, A., TOEPFER, B., PUDDU, V. & LI PUMA, G. (2006) Photocatalyticoxidation of herbicides in single-component and multicomponentsystems: Reaction kinetics analysis. Applied Catalysis B:Environmental, 65, 1-10.
GOUMA, P. I. & MILLS, M. J. (2001) Anatase to rutile transfonnation inTitania powders. Journal American Chemical Society, 84, 619.
GUO, B., LIU, Z., HONG, L. & JIANG, H. (2005) Sol gel derivedphotocatalytic porous Ti02 thin films. Surface and Coattng»Technology, 198,24-29.
HAMID, M. A. & RAHMAN, I. (2003) Preparation of Titanium Dioxide(Ti02) thin films by sol-gel dip coating method. Malaysian Journal ofChemistry,S, 86.
HAN, Z., ZHU, H., SHI, J., PARKINSON. G. & LU, G. Q. (2007) Preparationof mesoporous cadmium sulfide nanoparticles with moderate pore size.Journal of Solid State Chemistry, 180, 902-906.
HARIZANOV, O. A., GESHEVA, K. A. & STEFCHEV, P. L. (1996) Sol-geland CVD-metal oxide coatings for solar energy utilization. CeramicsInternational, 22,91-94.
HAWES, W. & TRIPPETT, S. (1968) Steric Hyndrance of the AlkalineHydrolysis of Phosphinate Esters. Chemical Communication, 577.
HENCH, L. L. & WEST, J. K. (1990) The sol-gel process. Chemical Reviews,90,33-72.
HENNIG, H. (1999) Homogeneous photo catalysis by transition metalcomplexes. Coordination Chemistry Reviews, 182, 101-123.
HIDALGO, M. C., AGUILAR, M., MAICU, M., NAVio, J. A. & COL6N, O.(2007) Hydrothermal preparation of highly photoactive Ti01nanoparticles. Catalysis Today, 129,50-58.
HOFFMANN, M. R., MARTIN, S. T., CHOI, W. & BAHNEMANN, D. W.(1995) Environmental Applications of Semiconductor Photocatalysis.Chemical Reviews, 95, 69-96.
205
Bibliography
HSU, C.-S., LIN, C.-K., CHAN, C.-C., CHANG, C.-C. &. TSAY, C.-Y. (2006)Preparation and characterization of nanocrystalline porous Ti<hIW03composite thin films. Thin Solid Films, 494,228-233.
HUO, L., ZHAO, H., MAUVY, F., FOURCADE, S., LABRUGERE, C.,POUCHARD, M. &. GRENIER, r-e, (2004) Synthesis and mixedconductivity of ammonium tungsten bronze with tunneling structures.Solid State Sciences, 6, 679-688.
HURUM, D. C., AGRIOS, A. G., CRIST, S. E., GRAY, K. A., RAJH, T. &.THURNAUER, M. C. (2006) Probing reaction mechanisms in mixedphase Ti02 by EPR. Journal 0/ Electron Spectroscopy and RelatedPhenomena, 150, 155-163.
HURUM, D. C., AGRIOS, A. G., GRAY, K. A., RAJH, T. &. THURNAUER,M. C. (2003) Explaining the Enhanced Photocatalytic Activity ofDegussa P25 Mixed-Phase Ti02 Using EPR. Journal 0/ PhysicalChemistry B, 107,4545-4549.
HURUM, D. C., GRAY, K. A., RAJH, T. &. THURNAUER, M. c. (2005)Recombination Pathways in the Degussa P2S Formulation of Ti<h:Surface versus Lattice Mechanisms. Journal 0/ Physical Chemislry B,109,977-980.
IEH (2001) Indoor Air quality in the home: Final report on DETR ContractEPG 1/5/12, (Web Report W7) Leicester, UK, Institute forEnvironmental and Health. [online] Availablefrom: <http: IIwww.le.ac. uk/iehipublicclIiQnsipublicQljons. him/.
ITO, S., YOSHIDA, S. &. WATANABE, T. (2000) Preparation of ColloidalAnatase Ti02 Secondary Submicroparticles by Hydrothermal Sol-GelMethod. Chemistry Letters, 29, 70.
JACOBY, W. A., BLAKE, D. M., NOBLE, R. D. &. KOVAL, C. A. (1995)Kinetics of the Oxidation of Trichloroethylene in Air viaHeterogeneous Photocatalysis. Journal a/Catalysis, 157,87-96.
JACOBY, W. A., NIMLOS, M. R., BLAKE, D. M., NOBLE, R. D. &.KOVAL, C. A. (1994) Products, Intermediates, Mass Balances, andReaction Pathways for the Oxidation of Trichloroethylene in Air viaHeterogeneous Photocatalysis. Environmental Science and Technolc)gy28, 1661-1668.
JUNG, K. Y. &. PARK, S. B. (1999) Anatase-phase titania: preparation byembedding silica and photocatalytic activity for the decomposition oftrichloroethylene. Journal of Photochemistry and Photobiology A,'Chemistry, 127, 117-122.
JUNG, K. Y., PARK, S. B. &. IHM, S.-K. (2002) Linear relationship betweenthe crystallite size and the photoactivity of non-porous titania ranaingfrom nanometer to micrometer size. Applied Catalysis A: General, 224.229-237.
KALLALA, M., SANCHEZ, C. &. CABANE, B. (1993) Structures ofinorganic polymers in sol-gel processes based on titanium oxide.Physical Review E, 48, 3692.
KE, D., LlU, H., PENG, T., LlU, X. & DAI, K. (2008) Preparation andphotocatalytic activity of WOJrri02 nanocomposite particles. MalerialsLetters, 62,447-450.
206
Bibliography
KELLER, N., BARRAUD, E., BOSC, F., EDWARDS, D. & KELLER, V.(2007) On the modification of photocatalysts for improving visible lightand UV degradation of gas-phase toluene over Ti02. Applied CatalysisB: Environmental, 70, 423-430.
KELLER, V., BERNHARDT, P. & GARIN, F. (2003) Photocatalytic oxidationof butyl acetate in vapor phase on Ti02, Ptffi02 and W03ffi02catalysts. Journal of Catalysis, 215, 129-138.
KESHMIRI, M., TROCZYNSKI, T. & MOHSENI, M. (2006) Oxidation ofgas phase trichloroethylene and toluene using composite sol-gel Ti02photocatalytic coatings. Journal of Hazardous Materia/s, 128, 130-137.
KIM, E., WHANG, C., LEE, W. & KIM, Y. (2006) Photocatalytic property ofSi02ffi02 nanoparticles prepared by sol-hydrothermal proeess. Journalof Electroceramics, 17,899-902.
KIM, J., BONDARCHUK, 0., KAY, B. D., WHITE, J. M. & DOHNALEK, Z.(2007) Preparation and characterization of monodispersed WO)nanoclusters on Ti02(110). Catalysis Today. 120, 186-195.
KIM, S.-S., KANG, D.-H., CHOI, D.-H., YEO, M.-S. & KIM, K.-W. (2008)Comparison of strategies to improve indoor air quality at the pre-occupancy stage in new apartment buildings. Building andEnvironment. 43, 320-328.
KOLEN'KO, Y. V., BURUKHIN, A. A., CHURAGULOV, B. R. &OLEYNIKOV, N. N. (2003) Synthesis ofnanocrystaJline Ti02 powdersfrom aqueous TiOS04 solutions under hydrothermal conditions.Materials Letters. 57, 1124-1129.
KOLEN'KO, Y. V., CHURAGULOV, B. R., KUNST, M., MAZEROLLES, L.& COLBEAU-JUSTIN, C. (2004) Photocatalytic properties of titaniapowders prepared by hydrothermal method. Applied Catalysis B:Environmental. 54, 51-58.
KOMINAMI, H., KATO, J.-I., MURAKAMI, S.-Y., ISHII, Y., KOHNO, M.,YABUTANI, K.-I., YAMAMOTO, T., KERA, Y., INOUE, M., INUI,T. & OHTANI. B. (2003) Solvothermal syntheses of semiconductorphotocatalysts of ultra-high activities. Catalysis Today. 84, 181·189.
KOMORNICKI, S., RADECKA, M. & SOBAS, P. (2004) Structural. electricaland optical properties of Ti02-WO) polycrystalline ceramics. AlaterialsResearch Bulletin. 39,2007-2017.
KUO-HUA WANG, HUAN-HUNG, T. & YUNG-HSU, H. (1998) A study ofphotocatalytic degradation of trichloroethylene in vapor phase on Ti02photocatalyst. Chemosphere, 36,2763-2773.
KWON, Y. T., SONG, K. Y., LEE, W. I., J.• C. G. & DO, Y. R. (2000)Photocatalytic behavior of W03-Loaded Ti02 in an OxidationReaction. Journal ofCa/alysls .. 191, 192.
LANGMUIR, I. (1916) The constitution and fundamental properties of solidand liquids. Journal of the American Chemical Society. 38,2221.
LANGMUIR, I. (1918) The adsorption of gases on plane surfaces of glass OFmica and platinum. 40, 1361 • 1403.
LARSON, S. A. & FALCONER, J. L. (1994) Characterization of Ti02photocatalysts used in trichlorocthene oxidation. Applied Catalysis B:Environmental, 4, 325-342.
207

Bibliography
LARSON, S. A., WIDEGREN, J. A. & FALCONER, J. L. (1995) TransientStudies of 2-Propanol Photocatalytic Oxidation on Titania. Journal 0/Catalysis, 157,611-625.
LI, X. Z., LI, F. B., YANG, C. L. & GE, W. K. (2001) Photocatalytic activityof WOx-Ti02 under visible light irradiation. Journal 0/ Photochemistryand Photobiology A: Chemistry, 141,209-217.
LIM, T. H. & KIM, S. D. (2004) Trichloroethylene degradation byphotocatalysis in annular flow and annulus fluidized bed photoreactors,Chemosphere, 54, 305-312.
LIN, C.-F., WU, C.-H. & ONN, Z.-N. Degradation of 4-chlorophenol in Ti02•W03, Sn02, Ti021W03 and Ti02/Sn~ systems. Journal 0/ HazardousMaterials, In Press, Corrected Proof, 450.
LINSEBIGLER, A. L., LU, G. & YATES, J. T. (1995) Photocatalysis on Ti02Surfaces: Principles, Mechanisms, and Selected Results. ChemicalReviews, 95, 735-758.
LIQIANG, J., BAIFU, X., FULONG, Y., BAIQI, W., KEYING, S., WEIMIN,C. & HONGGANG, F. (2004) Deactivation and regeneration of ZnOand Ti02 nanopartic1es in the gas phase photocatalytic oxidation of n-C7H16or S02. Applied Catalysis A: General, 275,49·54.
LITTER, M. I. (1999) Heterogeneous photocatalysis: Transition metal ions inphotocatalytic systems. Applied Catalysis B: Environmental, 23, 89-114.
LIVAGE, 1. (1998) Sol-gel synthesis of heterogeneous catalysts from aqueoussolutions. Catalysis Today, 41,3-19.
LIVAGE, J. J., HENRY, M. & SANCHEZ, C. (1988) Sol-gel chemistry oftransition metal oxides. Progress in Solid State Chemistry. 18,259-341.
MAlRA, A. J., YEUNG, K. L., LEE, C. Y., VUE, P. L. & CHAN, C. K.(2000) Size Effects in Gas-Phase Photo-oxidation of TrichloroethyleneUsing Nanometer-Sized Ti02 Catalysts. Journal of Catalysis, 192, 185-196.
MAlRA, A. J., YEUNG, K. L., SORIA, J., CORONADO, J. M., BELVER, C.,LEE, C. Y. & AUGUGLIARO, V. (2001) Gas-phase photo-oxidationof toluene using nanometer-size Ti02 catalysts. Applied Catalysis B:Environmental, 29, 327·336.
MALATO, S., BLANCO, J., VIDAL, A. & RICHTER, C. (2002)Photocatalysis with solar energy at a pilot-plant scale: an overview.Applied Catalysis B: Environmental, 37, 1·15.
MANZINI, I., ANTONIOLl, G., BERSANI, D., LOTTIeI, P. P., GNAPPI, G.& MONTENERO, A. (1995) X-ray absorption spectroscopy study ofcrystallization processes in sol-gel-derived Ti~. Journal 0/ Non-Crystal Solid, 192-193,519-523.
METTS, T. A. & BATTERMAN, S. A. (2006) Effect of VOC loading on theozone removal efficiency of activated carbon filters. Chemo.fphere. 62,34·44.
MILLS, A. & HUNTE, S. L. (1997) An overview on semiconductorPhotocatalysis. Journal 0/ Photochemistry and Photob/oogy A:Chemistry, 108, 1.
MINERO, C. (1999) Kinetic analysis of photoinduced reactions at the watersemiconductor interface. Catalysis Today, 54, 205·216.
208

Bibliography
MORTERRA, C. (1988) An infrared spectroscopic study of anatase properties.6. Surface hydration and strong Lewis acidity of pure and sulfate-dopedpreparations Journal of the Chemical Society, Faraday Transactions, 1,1617.
NAVROTSKY, A., KLEPPA, O. J. & (1967) Enthalpy of the Anatase-RutileTransformation Journal of the American Ceramic Society, 50.
NEFEDOV, V. I. V. I. (1988) X-ray photoelectron spectroscopy of solidsurfaces
NGAOTRAKANWIWAT, P. & TATSUMA, T. (2004) Optimization of energystorage TiOr W03 photocatalysts and further modification withphosphotungstic acid. Journal of Electroanalytical Chemistry. 573,263-269.
NIMLOS, M. R., JACOBY, W. A., BLAKE, O. M. & MILNE, T. A. (1993)Direct mass spectrometric studies of the destruction of hazardouswastes. 2. Gas-phase photocatalytic oxidation of trichloroethylene overtitanium oxide: products and mechanisms. Environmental Science andTechnology, 27,732-740.
NISHIDE, T., YAMAGUCHI, H. & MIZUKAMI, F. (1995) Crystalmodulation of tungsten oxide gels and films prepared by the sol-gelprocess using 2,4-pentanedione as an organic ligand. Journal ofMaterials Science, 30,4946-4949.
O'REGAN, B., MOSER, J., ANDERSON, M. & GRAETZEL, M. (1990)Vectorial electron injection into transparent semiconductor membranesand electric field effects on the dynamics of light-induced chargeseparation. Journal of Physical Chemistry, 94, 8720-8726.
OHTANI, B., OGAWA, Y. & NISHIMOTO, S. I. (1997) PhotocatalyticActivity of Amorphous-Anatase Mixture of Titanium(IV) OxideParticles Suspended in Aqueous Solutions. Journal of PhysicalChemistry B, 101,3746·3752.
OU, H.-H. & LO, S.-L. (2007) Photocatalysis of gaseous trichloroethylene(TCE) over Ti02: The effect of oxygen and relative humidity on thegeneration of dichloroacetyl chloride (OCAC) and phosgene. Journal ofHazardous Materials. 146, 302-308.
PAPP, J., SOLED, S., DWIGHT, K. & WOLD, A. (1994) Surface Acidity andPhotocatalytic Activity of Ti02, W03rn02, and Mo03rn02Photocatalysts. Chemistry of Materials. 6, 496-500.
PARIOA, K. M. & SAHU, N. (2008) Visible light induced photocatalyticactivity of rare earth titania nanocomposites. Journal of MolecularCatalysis A: Chemical, 287, 151·158.
PARK, E.-H., JUNG, J. & CHUNG, H.-H. (2006) Simultaneous oxidation ofEDTA and reduction of metal ions in mixed Cu(II)/Fe(III)·EDT Asystem by Ti02 photocatalysis. Chemospher« 64, 432-436.
PARK, J. K., MYOUNG, J. J., KYONG, J. B. & KIM, H. K. (2003) ReactionMechanism for the Hydrolysis of Titanium Alkoxide. Bull'tln ofKorean Chemical Society, 24, 671.
PARMON, V., EMELINE, A. V. & SERPONE, N. (2002) Glossary of terms inphotocatalysis amd radiocatalysis. International Journal cifPhotoenergy, 4,91.
209
Bibliography
PATIL, P. S., MUJAWAR, S. H., INAMDAR, A. 1., SHINOE, P. S.,DESHMUKH, H. P. & SAOALE, S. B. (2005) Structural, electrical andoptical properties of Ti02 doped WO) thin films. Applied Sur/aceScience, 252, 1643-1650.
PERKES, P. (2008) Reading on Electron Microscopy. (online] Availablefrom: <http://acept. asu. eduiPiNlrdglelmicrlelmicr.shtml
PRIMET, M., PICHAT, P. & MATHIEU, M. V. (1971) Infrared study of thesurface of titanium dioxides. I. Hydroxyl groups Journal 0/ PhysicalChemistry, 75, 1216.
PUDDU, V., MOKAYA, R. & PUMA, G. L. (2007) Novel one stephydrothermal synthesis of Ti02IWO) nanocomposites with enhancedphotocatalytic activity. Chemical Comuntcations, 4749.
QIU, X. & BURDA, C. (2007) Chemically synthesized nitrogen-doped metaloxide nanoparticles. Chemical Physics, 339, 1-10.
RAMPAUL, A., PARKIN, I. P., O'NEILL, S. A., DESOUZA, J., MILLS, A. &ELLIOTT, N. (2003) Titania and tungsten doped titania thin films onglass; active photocatalysts. Polyhedron, 22,35-44.
RAN, F. Y., CAO, W., LI, Y. H. & ZHANG, X. N. (2007) Preparation ofNanosize Anatase Ti02 Powders by Hydrothermal Synthesis KeyEngineering Materials 336-338,2017.
RAUPP, G. B., ALEXIADIS, A., HOSSAIN, M. M. & CHANGRANI, R.(2001) First-principles modeling, scaling laws and design of structuredphotocatalytic oxidation reactors for air purification. Catalysis Today,69,41-49.
REIS, K. P., RAMANAN, A. & WHITTINGHAM, M. S. (1992) Synthesis ofnovel compounds with the pyrochlore and hexagonal tungsten bronzestructures. Journal of Solid State Chemistry. 96, 31-47.
REN, W., AI, Z., JIA, F., ZHANG, L., FAN, X. & lOU, z: (2007) Lowtemperature preparation and visible light photocatalytic activity ofmesoporous carbon-doped crystalline Ti~. Applied Catalysis B:Environmental, 69, 138-144.
REYES-CORONADO, D., ROORiGUEl-GA TTORNO, G., ESPINOSA·PESQUEIRA, M. E., CAB, C., DE COSS, R. & OSKAM, O. (2008)Phase-pure Ti02 nanoparticles: anatase, brookite and rutile,Nanotechnology, 19,145605.
REYES, L. F., SAUKKO, S., HOEL, A., LANTTO, V. & GRANQVIST, C. O.(2004) Structure engineering of WO) nanoparticles for porous filmapplications by advanced reactive gas deposition. Journal 0/ theEuropean Ceramic Society, 24, 1415·1419.
RHEE, C. H., BAE, S. W. & LEE, J. S. (2005) Template -free HidrothermalSynthesis of High Surface Area Notrogen-doped Titania PhotocatalystActive under Visible Light. Chemistry Leiters, 34, 660.
ROBERT, D. (2007) Photosensitization of Ti02 by MxOy and MxSynanoparticles for heterogeneous photocatalysis applications. CatalysisToday, 122,20-26.
RUTHVEN, D. M. (1984) Principles of Adsorption and Adsorption Processes,New York, Wiley.
210
Bibliography
SALVADO-ESTIVILL, 1. (2007) Photocatalytic Oxidation of Indoor AirPollutants: Kinetics, Modelling and Experimental validation. PhDthesis.
SALVADO-ESTIVILL, 1., BRUCATO, A. & LIPUMA, G. (2007a) Two-Dimensional Modeling of a Flat-Plate Photocatalytic Reactor forOxidation of Indoor Air Pollutants. Industrial and EngineeringChemistry Research, 46,7489-7496.
SALVADO-ESTIVILL, I., HARGREAVES, D. M. & LIPUMA, G. (2007b)Evaluation of the Intrinsic Photocatalytic Oxidation Kinetics of IndoorAir Pollutants. Environmental Science and Technology, 41,2028-2035.
SANCHEZ, C., LIVAGE, J., HENRY, M. & BABONNEAU, F. (1988)Chemical modification of alkoxide precursors. Journal of Non-Crystalline Solids, 100, 65-76.
SANGWICHIEN, C., ARANOVICH, G. L. & DONOHUE, M. D. (2002)Density functional theory predictions of adsorption isotherms withhysteresis loops. Colloids and Surfaces A: Physicochemical andEngineering Aspects, 206, 313-320.
SAUER M.L. , HALE M.A. & D.F., O. (1995) Journal of Photochemistry andPhotobiology A: Chemistry, 88, 169.
SAUER, M. L. & OLLIS, D. F. (1994) Acetone Oxidation in a PhotocatalyticMonolith Reactor. Journal of Catalysis, 149, 81-91.
SAUER, M. L. & OLLIS, D. F. (1996) Catalyst Deactivation in Gas-SolidPhotocatalysis. Journal of Catalysis, 163, 215-217.
SCHRANK, S. G., JOSE, H. J. & MOREIRA, R. F. P. M. (2002) Simultaneousphotocatalytic Cr(VI) reduction and dye oxidation in a Ti02 slurryreactor. Journal of Photochemistry and Photobiology A: Chemistry.147,71-76.
SCLAFANI, A. & HERRMANN, J. M. (1996) Comparison of thePhotoelectronic and Photocatalytic Activities of Various Anatase andRutile Forms of Titania in Pure Liquid Organic Phases and in AqueousSolutions. Journal of Physical Chemistry, 100, 13655-13661.
SERPONE, N. (1997) Relative photonic efficiencies and quantum yields inheterogeneous photocatalysis. Journal of Photochemistry andPhotobiology A: Chemistry, 104, 1-12.
SERPONE, N. (2006) Is the Band Gap of Pristine Ti02 Narrowed by Anion-and Cation-Doping of Titanium Dioxide in Second-GenerationPhotocatalysts? Journal of PhYSicalChemistry B. 110,24287-24293.
SERPONE, N., MARUTHAMUTHU, P., PICHAT, P., PELIZZETTI, E. &HIDAKA, H. (1995) Exploiting the interparticle electron transferprocess in the photocatalysed oxidation of phenol, 2-chlorophenol andpentachlorophenol: chemical evidence for electron and hole transferbetween coupled semiconductors. Journal of Photochemistry andPhotobiology A: Chemistry. 85,247-255.
SHANNON, R. D., PASCK, J. A. & (1965) Kinetics of the Anatase-RutileTransformation, Journal of the American Ceramic Society, 48, 391-398.
SHIFU, C., LEI, C., SHEN, G. & GENGYU, C. (2005) The preparation ofcoupled W03ffi02 photocatalyst by ball milling. Powder Technology.160, 198-202.
211

Bibliography
SHIGEYUKI, S. M. & RUSTUM, R. (2000) Hydrothermal synthesis of fineoxide powders. Bulletin of Material Science, 23, 453-460.
SHIRAISHI, F., OHKUBO, D., TOYODA, K. & YAMAGUCHI, S. (2005)Decomposition of gaseous formaldehyde in a photocatalytic reactorwith a parallel array of light sources: 1. Fundamental experiment forreactor design. Chemical Engineering Journal, 114, 153-159.
SING, K. (2001) The use of Nitrogen Adsorption for the Characterisation ofPorous materials- A review. Colloids and Surfaces A:Physicalchemistry and Enineering Aspects, 187-188,3.
SOMASUNDARAM, S., CHENTHAMARAKSHAN, C. R., DE TACCONI,N. R., BASIT, N. A. & RAJESHWAR, K. (2006) Composite W03-Ti02 films: Pulsed electrodeposition from a mixed bath versussequential deposition from twin baths. ElectrochemistryCommunications, 8,539-543.
SONG, K. Y., PARK, M. K., KWON, Y. T., LEE, H. W., CHUNG, W. J. &LEE, W. I. (2001) Preparation of Transparent Particulate MoOyri02and W03ffi02 Films and Their Photocatalytic Properties. Chem.Mater., 13,2349-2355.
TADA, H., KOKUBU, A., IWASAKI, M. & ITO, S. (2004) Deactivation ofthe Ti02 Photocatalyst by Coupling with W03 and theElectrochemically Assisted High Photocatalytic Activity of W03.Langmuir, 20, 4665-4670.
TAE KWON, Y., YONG SONG, K., IN LEE, W., JIN CHOI, G. & RAG DO,Y. (2000) Photocatalytic Behavior of W03-Loaded Ti02 in anOxidation Reaction. Journal of Catalysis, 191, 192-199.
TATSUMA, T., TAKEDA, S., SAITOH, S., OHKO, Y. & FUJISHIMA, A.~2003) Bactericidal effect of an energy storage Ti02-W03 photocatalystIn dark. Electrochemistry Communications, 5, 793-796.
TERZI~, ~. & SERPONE, N. (1995) Heterogeneous photocatalyzedOXIdation of creosote components: mineralization of xylenols byilluminated Ti02 in oxygenated aqueous media. Journal ofPhotochemistry and Photobiology A: Chemistry, 89, 163-175.
TSAI, S.-J. & CHENG, S. (1997) Effect of Ti02 crystalline structure inphotocatalytic degradation of phenolic contaminants. Catalysis Today,33,227-237. '
WACHS, I. E., KIM, T. & ROSS, E. I. (2006) Catalysis science of the solidacidity of model supported tungsten oxide catalysts. Catalysis Today,116, 162-168.
WANG, C. C. & YING, J. Y. (1999) Sol-Gel Synthesis and HydrothermalProcessing of Anatase and Rutile Titania Nanocrystals. Chem. Mater.,11,3113-3120.
WARREN, B. E. (1990) X-ray Diffraction, New York, Dover.WATTS, J. F. (1998) An Introduction to Surface Analysis by XPS and AES,
Wiley.YAMASHITA, H., HARADA, M., MISAKA, J., TAKEUCHI, M., IKEUE, K.
& ANPO, M. (2002) Degradation of propanol diluted in water undervisible light irradiation using metal ion-implanted titanium dioxidephotocatalysts. Journal of Photochemistry and Photobiology A:Chemistry, 148,257-261.
212
Bibliography
YANAGISAWA, K. & OVENS TONE, J. (1999) Crystallization of Anatasefrom Amorphous Titania Using the Hydrothermal Technique: Effects ofStarting Material and Temperature. J. Phys. Chem. B, 103, 7781-7787.
YANG, H., SHI, R., ZHANG, K., HU, Y., TANG, A. & LI, X. (2005)Synthesis of W03ffi02 nanocomposites via sol-gel method. Journal ofAlloys and Compounds, 398, 200-202.
YANG, H., ZHANG, D. & WANG, L. (2002) Synthesis and characterizationof tungsten oxide-doped titania nanocrystallites. Materials Leiters, 57,674-678.
YU, B. F., HU, Z. B., LIU, M., YANG, H. L., KONG, Q. X. & LIU, Y. H.(2008) Review of research on air-conditioning systems and indoor airquality control for human health. International Journal ofRefrigeration. In Press, Corrected Proof.
YU, J.-G., YU, J. C., CHENG, B., HARK, S. K. & ru, K. (2003a) The effectof F'doping and temperature on the structural and textural evolution ofmesoporous Ti02 powders. Journal of Solid State Chemistry, 174, 372-380.
YU, J., LIU, S., xru, Z., YU, W. & FENG, G. Synthesis of sulfur-doped Ti02by solvothermal method and its visible-light photocatalytic activity.Journal of Alloys and Compounds, In Press, Corrected Proof.
YU, 1., WANG, G., CHENG, B. & ZHOU, M. (2007) Effects of hydrothermaltemperature and time on the photocatalytic activity and microstructuresof bimodal mesoporous Ti02 powders. Applied Catalysis B:Environmental, 69, 171-180.
YU, J., YU, H. C., CHENG, B., ZHOU, M. & ZHAO, X. (2006) Enhancedphotocatalytic activity of Ti02 powder (P25) by hydrothermaltreatmentJournal of Molecular Catalysis A: Chemical, 253, 112-118
YU, J., YU, J. C., LEUNG, M. K. P., HO, W., CHENG, B., ZHAO, X. &ZHAO, J. (2003b) Effects of acidic and basic hydrolysis catalysts onthe photocatalytic activity and microstructures of bimodal mesoporoustitania. Journal of Catalysis. 217, 69-78.
YU, K., ZHAO, J., GUO, Y., DING, X., HARI, B., LIU, Y. & WANG, Z.(2005) Sol-gel synthesis and hydrothermal processing of anatasenanocrystals from titanium n-butoxide. Materials Letters, 59, 2515-2518.
YUAN, M., SHAN, Z., TIAN, B., TU, B., YANG, P. & ZHAO, D. (2005)Preparation of highly ordered mesoporous WO)- Ti02 as matrix inmatrix-assisted laser desorption/ionization mass spectrometry.Microporous and Mesoporous Materials, 78,37-41.
ZHAN, J. H., YANG, X. G., XIE, Y., LI, B. F., QAIN, Y. T. & JIA, Y. B.(1999) A solvothermal route for the synthesis of ammonium tungstenbronze. Solid State Ionics, 126,373-377.
ZHANG, H., YANG, D. & MA, X. (2007) Synthesis of flower-like CdSnanostructures by organic-free hydrothermal process and their opticalproperties. Materials Letters, 61,3507-3510.
ZHANG, Z., WANG, C. C., ZAKARIA, R. & YINO, J. Y. (1998) Role ofParticle Size in Nanocrystalline Ti02-Based Photocatalysts. J. Phys.Chem. B. 102, 10871-10878.
213
Bibliography
ZHAO, J. & YANG, X. (2003) Photocatalytic oxidation for indoor airpurification: a literature review. Building and Environment, 38, 645-654.
ZHOU, M. & YU, J. (2008) Preparation and enhanced daylight-inducedphotocatalytic activity of C,N,S-tridoped titanium dioxide powders.Journal 0/Hazardous Materials, 152, 1229-1236.
ZUO, G.-M., CHENG, z-x., CHEN, H., LI, G.-W. & MIAO, T. (2006) Studyon photocatalytic degradation of several volatile organic compounds.Journal of Hazardous Materials, 128, 158-163. .
214