
High-speed stereo DPIV measurement of wakes of two bat species flying freely in a wind tunnel
10
RESEARCH ARTICLE High-speed stereo DPIV measurement of wakes of two bat species flying freely in a wind tunnel Anders Hedenstro ¨m F. T. Muijres R. von Busse L. C. Johansson Y. Winter G. R. Spedding Received: 25 July 2008 / Revised: 12 December 2008 / Accepted: 10 February 2009 / Published online: 28 February 2009 Ó Springer-Verlag 2009 Abstract Previous studies on wake flow visualization of live animals using DPIV have typically used low repetition rate lasers and 2D imaging. Repetition rates of around 10 Hz allow *1 image per wingbeat in small birds and bats, and even fewer in insects. To accumulate data rep- resenting an entire wingbeat therefore requires the stitching-together of images captured from different wingbeats, and at different locations along the wing span for 3D-construction of wake topologies. A 200 Hz stereo DPIV system has recently been installed in the Lund University wind tunnel facility and the high-frame rate can be used to calculate all three velocity components in a cube, whose third dimension is constructed using the Taylor hypothesis. We studied two bat species differing in body size, Glossophaga soricina and Leptonycteris cur- asoa. Both species shed a tip vortex during the downstroke that was present well into the upstroke, and a vortex of opposite sign to the tip vortex was shed from the wing root. At the transition between upstroke/downstroke, a vortex loop was shed from each wing, inducing an upwash. Vor- ticity iso-surfaces confirmed the overall wake topology derived in a previous study. The measured dimensionless circulation, C/Uc, which is proportional to a wing section lift coefficient, suggests that unsteady phenomena play a role in the aerodynamics of both species. 1 Introduction Flapping flight in vertebrates has resisted simple analysis, because of the time-varying shape of elastic actuators and their complex interaction with the surrounding fluid. Early models therefore discarded these facts altogether by rep- resenting the animal, bird or bat, by mass and wing span alone (Pennycuick 1968, 1975; Norberg 1990). Even though this approach allows predictions for cruising flight performance (Pennycuick 1989; Hedenstro ¨m 2002), it does not capture any details of the kinematics and associated time-varying force production and cannot be used to pre- dict performance during maneuvering or hovering flight. On the other hand, the early vortex wake theory of bird flight was based upon a minimum of kinematic details, even if the assumptions about the wake geometry itself were more realistic than the actuator disk and momentum jet models (Rayner 1979a, b). Experiments originally focused upon kinematic analyses of wing motions (Brown 1948; Norberg 1976; Aldridge 1986). Eventually, with improved experimental techniques for quantitative wake flow visualization (Spedding et al. 1984; Spedding 1987a, b), the conceptual image of the wake structure began to improve (if not always simplify), now that it was based on actual evidence. Digital particle image velocimetry (DPIV) techniques have been applied to freely flying birds in wind A. Hedenstro ¨m (&) F. T. Muijres L. C. Johansson Department of Theoretical Ecology, Lund University, Ecology Building, 223 62 Lund, Sweden e-mail: [email protected] R. von Busse Y. Winter Department of Biology, Bielefeld University, 33501 Bielefeld, Germany G. R. Spedding Department of Aerospace and Mechanical Engineering, University of Southern California, Los Angeles, CA 90089-1191, USA Present Address: G. R. Spedding Department of Mechanical and Aeronautical Engineering, University of Pretoria, Pretoria 0002, South Africa 123 Exp Fluids (2009) 46:923–932 DOI 10.1007/s00348-009-0634-5
Transcript of High-speed stereo DPIV measurement of wakes of two bat species flying freely in a wind tunnel
RESEARCH ARTICLE
High-speed stereo DPIV measurement of wakes of two bat speciesflying freely in a wind tunnel
Anders Hedenstrom Æ F. T. Muijres Æ R. von Busse ÆL. C. Johansson Æ Y. Winter Æ G. R. Spedding
Received: 25 July 2008 / Revised: 12 December 2008 / Accepted: 10 February 2009 / Published online: 28 February 2009
� Springer-Verlag 2009
Abstract Previous studies on wake flow visualization of
live animals using DPIV have typically used low repetition
rate lasers and 2D imaging. Repetition rates of around
10 Hz allow *1 image per wingbeat in small birds and
bats, and even fewer in insects. To accumulate data rep-
resenting an entire wingbeat therefore requires the
stitching-together of images captured from different
wingbeats, and at different locations along the wing span
for 3D-construction of wake topologies. A 200 Hz stereo
DPIV system has recently been installed in the Lund
University wind tunnel facility and the high-frame rate can
be used to calculate all three velocity components in a
cube, whose third dimension is constructed using the
Taylor hypothesis. We studied two bat species differing in
body size, Glossophaga soricina and Leptonycteris cur-
asoa. Both species shed a tip vortex during the downstroke
that was present well into the upstroke, and a vortex of
opposite sign to the tip vortex was shed from the wing root.
At the transition between upstroke/downstroke, a vortex
loop was shed from each wing, inducing an upwash. Vor-
ticity iso-surfaces confirmed the overall wake topology
derived in a previous study. The measured dimensionless
circulation, C/Uc, which is proportional to a wing section
lift coefficient, suggests that unsteady phenomena play a
role in the aerodynamics of both species.
1 Introduction
Flapping flight in vertebrates has resisted simple analysis,
because of the time-varying shape of elastic actuators and
their complex interaction with the surrounding fluid. Early
models therefore discarded these facts altogether by rep-
resenting the animal, bird or bat, by mass and wing span
alone (Pennycuick 1968, 1975; Norberg 1990). Even
though this approach allows predictions for cruising flight
performance (Pennycuick 1989; Hedenstrom 2002), it does
not capture any details of the kinematics and associated
time-varying force production and cannot be used to pre-
dict performance during maneuvering or hovering flight.
On the other hand, the early vortex wake theory of bird
flight was based upon a minimum of kinematic details,
even if the assumptions about the wake geometry itself
were more realistic than the actuator disk and momentum
jet models (Rayner 1979a, b). Experiments originally
focused upon kinematic analyses of wing motions (Brown
1948; Norberg 1976; Aldridge 1986). Eventually, with
improved experimental techniques for quantitative wake
flow visualization (Spedding et al. 1984; Spedding 1987a,
b), the conceptual image of the wake structure began to
improve (if not always simplify), now that it was based on
actual evidence. Digital particle image velocimetry (DPIV)
techniques have been applied to freely flying birds in wind
A. Hedenstrom (&) � F. T. Muijres � L. C. Johansson
Department of Theoretical Ecology, Lund University,
Ecology Building, 223 62 Lund, Sweden
e-mail: [email protected]
R. von Busse � Y. Winter
Department of Biology, Bielefeld University,
33501 Bielefeld, Germany
G. R. Spedding
Department of Aerospace and Mechanical Engineering,
University of Southern California, Los Angeles,
CA 90089-1191, USA
Present Address:G. R. Spedding
Department of Mechanical and Aeronautical Engineering,
University of Pretoria, Pretoria 0002, South Africa
123
Exp Fluids (2009) 46:923–932
DOI 10.1007/s00348-009-0634-5

tunnels (Spedding et al. 2003a, b; Warrick et al. 2005;
Hedenstrom and Spedding 2008) to yield more refined
models of the wake geometry and its variation with for-
ward flight speed, wing geometry and kinematics. The
same techniques have also been applied to the small
Glossophagine bats, and reveal some notable differences in
wake geometry compared with birds (Hedenstrom et al.
2007).
To date, quantitative wake data of flying vertebrates
have come from rather low repetition rates lasers (5–
10 Hz), and the three-dimensional wake structure over one
wingbeat cycle is assembled from large numbers of sepa-
rate images, obtained from large numbers of separate
wingbeats. Previous studies have also derived primarily
from stacks (in space or time) of 2D data, with two out of
three velocity components available in any one plane.
Nevertheless, the use of DPIV methods has considerably
strengthened our understanding of wake topology and
aerodynamics of vertebrate flapping flight in recent years
(e.g. Hedenstrom and Spedding 2008), and continued rapid
technological advances are likely to propel the scientific
progress further still (see Spedding and Hedenstrom 2009,
this issue). Here we report on the first high-speed stereo-3D
DPIV measurements, and thus 3D velocity profiles, of bat
flight in the Lund University wind tunnel using two species
of Glossophagine bats. The main objective was to inves-
tigate whether the wake topology derived from high-speed
wake sampling conforms to previous conclusions derived
from low-speed sampling (Hedenstrom et al. 2007). A
second objective was to compare the scaling of wake
properties from two species of bats with different body
weight, aspect ratio and wing loading.
2 Materials and methods
2.1 Experimental animals
Two species of nectarivorous bats, Glossophaga soricina
and Leptonycteris curasoae, were trained to fly in front of a
thin metal tube (feeder) providing honey water in the test
section of a low-turbulence wind tunnel. For these exper-
iments, two individuals each of G. soricina and L. curasoae
were used. The morphology of the four bats is summarised
in Table 1. Wing span and wing area were measured from
top-view images obtained at flight speeds 5–6 m/s cap-
tured, when the wings are positioned horizontally during
the downstroke. At this flight speed, the body angle is near
horizontal. Wing span and wing area were measured using
ImageJ (http://rsb.info.nih.gov/ij/) with the length of the
radius as reference length (Table 1). Body mass was
measured with an electronic balance before and after each
experimental session, and the mean values are shown in
Table 1.
Since bats are nocturnal and mainly active in the dark,
they were clock-shifted by 12 h, so their active feeding
period coincided with researchers’ working schedule.
Before experiments, the bats were released into the wind
tunnel, where they roosted on a net inside the settling
chamber 6 m upstream from the test section. When a bat
decided to feed, it would fly with the wind towards the test
section, increasing the speed between the settling chamber
and the test section through the contraction, and would then
make a U-turn inside the test section to approach the feeder
from the downstream direction. The requirement of making
this U-turn inside the test section area (1.22 9 1.08 m)
limits the maximum flight speed range that can be studied
to approximately 7–8 m/s.
2.2 Wind tunnel
The Lund University wind tunnel is a closed-loop, low-
speed, low-turbulence wind tunnel crafted for studies of
animal flight. The overall design and baseline characteris-
tics are described in Pennycuick et al. (1997). The
background turbulence is about 0.03% (Spedding et al.
2009), which makes this tunnel suitable for repeatable
quantitative measurements at the moderate values of wing
chord-based Reynolds number that are characteristic of
small birds and bats (see below). All airspeeds (U) refer to
the equivalent airspeed defined as
Ueq ¼ffiffiffiffiffiffiffiffiffiffiffiffi
2q=q0
p
;
Table 1 Morphological properties of the four bats used in this study, body mass (m), wing span (b), wing area (S), mean wing chord (c), aspect
ratio (AR = b2/S), wing loading (Q = mg/S), and f is wing beat frequency
Bat m (kg) Femur length (mm)a Wing length (m) b (m) S (m2) c (m) AR Q (N) f (Hz)
Glossophaga soricina, male (#1) 0.0101 34.6 0.101 0.233 0.00879 0.038 6.2 11.3 14.9
Glossophaga soricina, female (#5) 0.0095 34.9 0.097 0.230 0.00860 0.037 6.2 10.9 14.9
Leptonycteris curasoae, male (#97) 0.0216 50.3 0.149 0.335 0.01576 0.047 7.1 13.4 10.4
Leptonycteris curasoae, female (#18) 0.0236 51.0 0.144 0.323 0.01529 0.047 6.8 15.1 9.9
a Used as reference length on images for estimating wing length, wing span and wing area
924 Exp Fluids (2009) 46:923–932
123
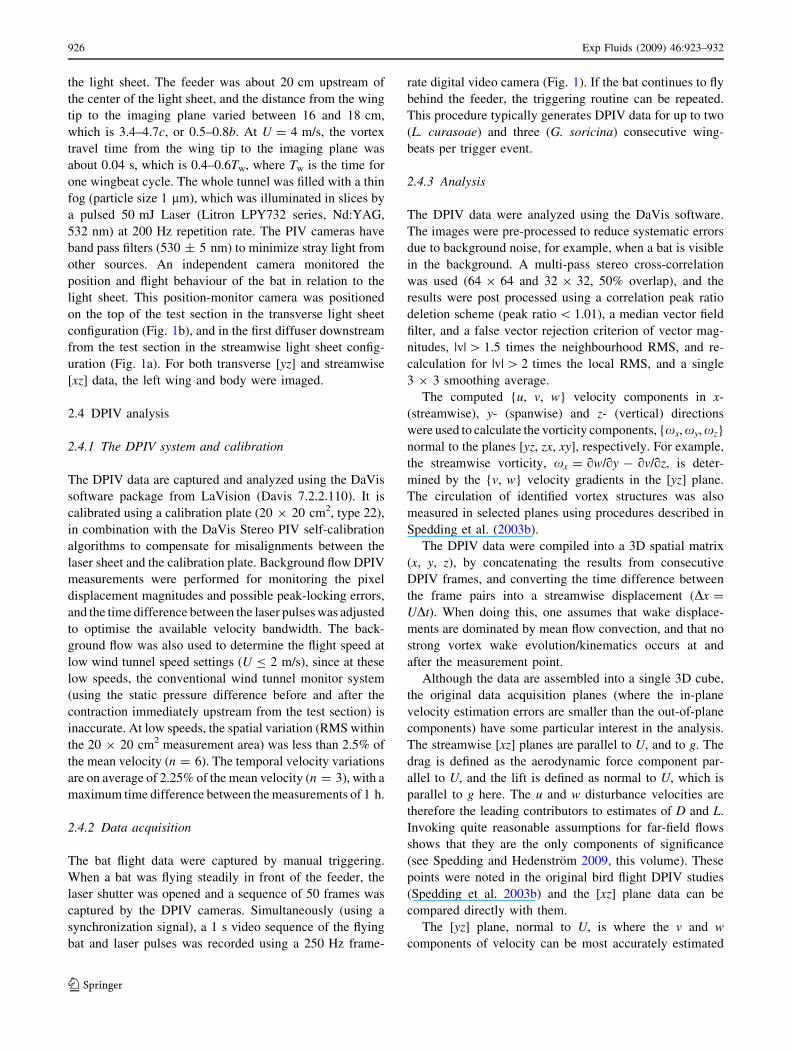
where q0 is the assumed air density at sea level in the
International Standard Atmosphere (1.225 kg/m3) and q
(=qU2/2) is the dynamic pressure at the measured air
density during an experiment. During this study, q varied
between 1.16 and 1.20 kg/m3, and the temperature was
19–24�C. The bats were studied at forward flight speeds
1–7 m/s, but the main results in this paper are based on
observations at 4 m/s. The Reynolds number based on
airspeed (Re = Uc/m, where c is the mean chord length of
the wing and m is the kinematic viscosity) ranged from
Re = 0.26–1.81 9 104 in G. soricina to Re = 0.32–
2.27 9 104 in L. curasoae. At U = 4 m/s, the speed for
which we present most of the data in this paper,
Re = 1.03 9 104 and 1.30 9 104, respectively. This dif-
ference in Re is aerodynamically not significant. The bats
are small in comparison with the test section [wing span
(b)/tunnel diameter (B): b/B \ 0.28) and so interactions
with the side walls are ignored.
2.3 Stereo DPIV
The flow field was measured over an approximately
20 9 20 cm2 area using two CMOS-cameras (High-
SpeedStar3; 1,024 9 1,024 pixels) and frame grabber PCI
boards in the host computer. The cameras were equipped
with 60 mm lenses (Micro Nikkor, f2.8) on Scheimpflug
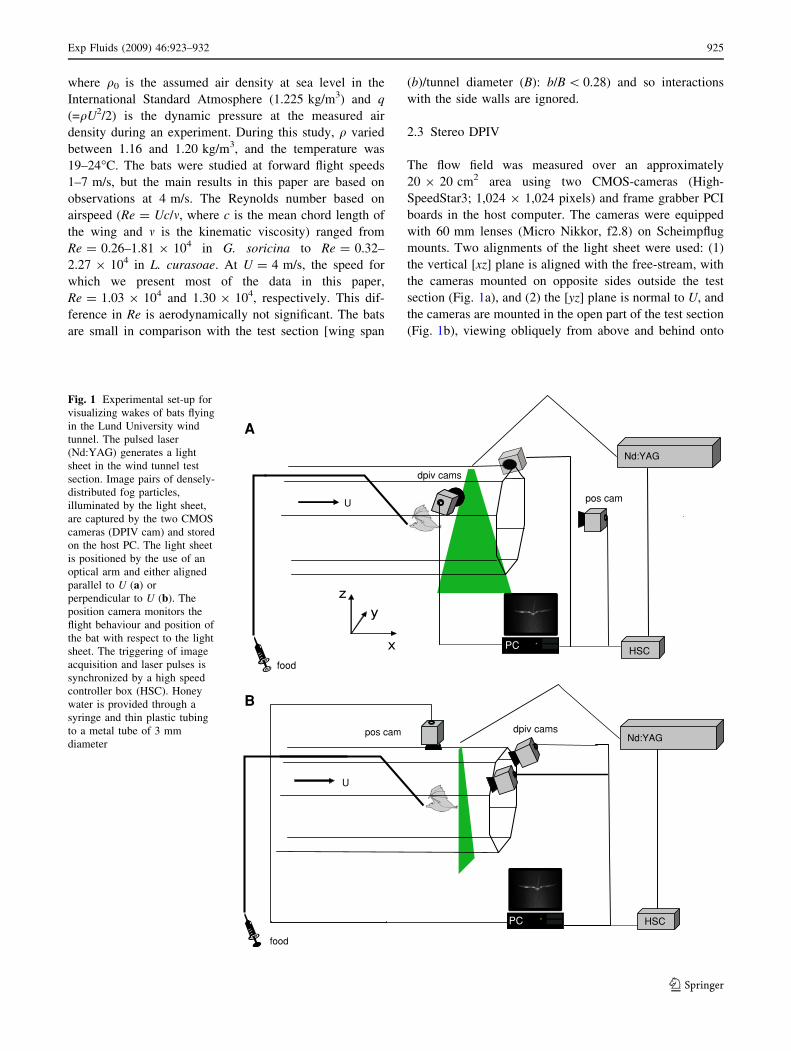
mounts. Two alignments of the light sheet were used: (1)
the vertical [xz] plane is aligned with the free-stream, with
the cameras mounted on opposite sides outside the test
section (Fig. 1a), and (2) the [yz] plane is normal to U, and
the cameras are mounted in the open part of the test section
(Fig. 1b), viewing obliquely from above and behind onto
Nd:YAG
B
z
x
y
pos cam
food
dpiv cams
A
U
dpiv cams
pos cam
food
PC
PC
Nd:YAG
U
HSC
HSC
Fig. 1 Experimental set-up for
visualizing wakes of bats flying
in the Lund University wind
tunnel. The pulsed laser
(Nd:YAG) generates a light
sheet in the wind tunnel test
section. Image pairs of densely-
distributed fog particles,
illuminated by the light sheet,
are captured by the two CMOS
cameras (DPIV cam) and stored
on the host PC. The light sheet
is positioned by the use of an
optical arm and either aligned
parallel to U (a) or
perpendicular to U (b). The
position camera monitors the
flight behaviour and position of
the bat with respect to the light
sheet. The triggering of image
acquisition and laser pulses is
synchronized by a high speed
controller box (HSC). Honey
water is provided through a
syringe and thin plastic tubing
to a metal tube of 3 mm
diameter
Exp Fluids (2009) 46:923–932 925
123
the light sheet. The feeder was about 20 cm upstream of
the center of the light sheet, and the distance from the wing
tip to the imaging plane varied between 16 and 18 cm,
which is 3.4–4.7c, or 0.5–0.8b. At U = 4 m/s, the vortex
travel time from the wing tip to the imaging plane was
about 0.04 s, which is 0.4–0.6Tw, where Tw is the time for
one wingbeat cycle. The whole tunnel was filled with a thin
fog (particle size 1 lm), which was illuminated in slices by
a pulsed 50 mJ Laser (Litron LPY732 series, Nd:YAG,
532 nm) at 200 Hz repetition rate. The PIV cameras have
band pass filters (530 ± 5 nm) to minimize stray light from
other sources. An independent camera monitored the
position and flight behaviour of the bat in relation to the
light sheet. This position-monitor camera was positioned
on the top of the test section in the transverse light sheet
configuration (Fig. 1b), and in the first diffuser downstream
from the test section in the streamwise light sheet config-
uration (Fig. 1a). For both transverse [yz] and streamwise
[xz] data, the left wing and body were imaged.
2.4 DPIV analysis
2.4.1 The DPIV system and calibration
The DPIV data are captured and analyzed using the DaVis
software package from LaVision (Davis 7.2.2.110). It is
calibrated using a calibration plate (20 9 20 cm2, type 22),
in combination with the DaVis Stereo PIV self-calibration
algorithms to compensate for misalignments between the
laser sheet and the calibration plate. Background flow DPIV
measurements were performed for monitoring the pixel
displacement magnitudes and possible peak-locking errors,
and the time difference between the laser pulses was adjusted
to optimise the available velocity bandwidth. The back-
ground flow was also used to determine the flight speed at
low wind tunnel speed settings (U B 2 m/s), since at these
low speeds, the conventional wind tunnel monitor system
(using the static pressure difference before and after the
contraction immediately upstream from the test section) is
inaccurate. At low speeds, the spatial variation (RMS within
the 20 9 20 cm2 measurement area) was less than 2.5% of
the mean velocity (n = 6). The temporal velocity variations
are on average of 2.25% of the mean velocity (n = 3), with a
maximum time difference between the measurements of 1 h.
2.4.2 Data acquisition
The bat flight data were captured by manual triggering.
When a bat was flying steadily in front of the feeder, the
laser shutter was opened and a sequence of 50 frames was
captured by the DPIV cameras. Simultaneously (using a
synchronization signal), a 1 s video sequence of the flying
bat and laser pulses was recorded using a 250 Hz frame-
rate digital video camera (Fig. 1). If the bat continues to fly
behind the feeder, the triggering routine can be repeated.
This procedure typically generates DPIV data for up to two
(L. curasoae) and three (G. soricina) consecutive wing-
beats per trigger event.
2.4.3 Analysis
The DPIV data were analyzed using the DaVis software.
The images were pre-processed to reduce systematic errors
due to background noise, for example, when a bat is visible
in the background. A multi-pass stereo cross-correlation
was used (64 9 64 and 32 9 32, 50% overlap), and the
results were post processed using a correlation peak ratio
deletion scheme (peak ratio \ 1.01), a median vector field
filter, and a false vector rejection criterion of vector mag-
nitudes, |v| [ 1.5 times the neighbourhood RMS, and re-
calculation for |v| [ 2 times the local RMS, and a single
3 9 3 smoothing average.
The computed {u, v, w} velocity components in x-
(streamwise), y- (spanwise) and z- (vertical) directions
were used to calculate the vorticity components, {xx, xy, xz}
normal to the planes [yz, zx, xy], respectively. For example,
the streamwise vorticity, xx = qw/qy - qv/qz, is deter-
mined by the {v, w} velocity gradients in the [yz] plane.
The circulation of identified vortex structures was also
measured in selected planes using procedures described in
Spedding et al. (2003b).
The DPIV data were compiled into a 3D spatial matrix
(x, y, z), by concatenating the results from consecutive
DPIV frames, and converting the time difference between
the frame pairs into a streamwise displacement (Dx =
UDt). When doing this, one assumes that wake displace-
ments are dominated by mean flow convection, and that no
strong vortex wake evolution/kinematics occurs at and
after the measurement point.
Although the data are assembled into a single 3D cube,
the original data acquisition planes (where the in-plane
velocity estimation errors are smaller than the out-of-plane
components) have some particular interest in the analysis.
The streamwise [xz] planes are parallel to U, and to g. The
drag is defined as the aerodynamic force component par-
allel to U, and the lift is defined as normal to U, which is
parallel to g here. The u and w disturbance velocities are
therefore the leading contributors to estimates of D and L.
Invoking quite reasonable assumptions for far-field flows
shows that they are the only components of significance
(see Spedding and Hedenstrom 2009, this volume). These
points were noted in the original bird flight DPIV studies
(Spedding et al. 2003b) and the [xz] plane data can be
compared directly with them.
The [yz] plane, normal to U, is where the v and w
components of velocity can be most accurately estimated
926 Exp Fluids (2009) 46:923–932
123

together. When this plane is far from the disturbance
source, then the only significant disturbance velocities will
be the v and w components in the wake itself (u will be
much smaller), and inviscid theory can be used to estimate
the induced drag of a wake oriented parallel to U and
passing through this plane. This plane is called the Trefftz
plane in aeronautics. If all the three components of velocity
are available in this plane, then both the lift and drag can be
computed, using only this information. It is tempting to
invoke all [yz] planes as Trefftz planes, but they must be
large, far from the body and the wake must be normal to
them for the original analysis to hold.
3 Results
3.1 Wake structure and implications for aerodynamic
force generation on the wing
Figure 2 shows a time sequence of [yz] planes at x/c & 5
(from set-up in Fig. 1b), behind the body and left wing
through one complete wing stroke at U = 4 m/s, for one
individual each of G. soricina and L. curasoae (hereafter
G. s. and L. c.). The path of the wingtip is shown by a
continuous line and the centers of the tip vortices are
shown as black dots with the current centre of the wing tip
vortex shown in grey. At the beginning of the downstroke,
some weak streamwise vorticity is seen in G. s. (Fig. 2a),
while in L. c., the tip vortex is already visible (blue patch,
Fig. 2f), together with a counter-rotating vortex shed from
the wing root (yellow patch, Fig. 2f). By mid downstroke,
there are prominent wing tip vortices as well as wing root
vortices in both species (Fig. 2b, g). At this stage, there is a
clear downwash between the opposite-signed shed vortices,
with magnitude (mean ± SD) 1.47 ± 0.63 m/s (n = 18)
and 1.27 ± 0.47 m/s (n = 25) in G. s. and L. c., respec-
tively (n is the number of vectors between tip- and toot-
vortices). The larger sample size in L. c. is due to the longer
wingspan compared with G. c. At mid downstroke, the
wing span has its maximum horizontal extent, and the
horizontal distance, ly, between tip and root vortices for
Fig. 2 Colour-coded vorticity fields and velocity vector fields from
two bats flying in a wind tunnel. The images show the [yz] plane of
the left wing and body for one Glossophaga soricina (a–e) and one
Leptonycteris curasoae (f–j), both flying at U = 4 m/s. The individ-
ual bats are the males (#1 and #97) of Table 1. The distance from the
bat to the [yz] imaging plane varied between 3.4 and 4.7 chord
lengths. The panels represent sub-periods of a wing stroke as follows
(top–bottom): beginning of downstroke, mid downstroke, end of
downstroke, mid upstroke and end of upstroke. The colour scale
symmetrically maps the streamwise vorticity, xx, (s-1) from -280
(blue) to ?280 (red) in steps of 40 s-1. The {v,w}-component
velocity vectors are scaled to the reference at 5 m/s at bottom right.The closed curves show the path of the wing tip for an average
wingbeat and the dots show the centers of the wing tip vortices with
the grey dot showing the current frame. The panels represent a real
area of 17.5 9 17.5 cm
c A F
B G
C
D
E J
I
H
Exp Fluids (2009) 46:923–932 927
123

G. s. and L. c. is 7.9 and 12.2 cm, respectively. Normalised
by the wing semispan, 2ly/b = 0.69 and 0.74, respectively.
At the end of the downstroke, the tip vortex has the same
circulation magnitude as at mid downstroke, but it is now
shed from a position closer to the body midline as the wing
tips are moved towards each other below the body (Fig. 2c,
h). At the beginning of the upstroke, the wing is being flexed
and at mid upstroke, the tip vortex is still present, although it
is closer to the body midline than it was at mid downstroke.
Notice that there is still an induced downwash about half-
way into the upstroke (Fig. 2d, i), indicating that the wing is
generating lift also during the upstroke up to this point.
Towards the end of the upstroke, the tip vortex vanishes, but
instead, there is shedding of a vortex dipole inducing an
upwash and hence an associated negative lift (Fig. 2e, j). The
root vortex appears weaker during the upstroke in G. s. than
in L. c. (Fig. 2c, d vs. h, i). In most cases, the centre of the tip
vortex is inboard of the wing-tip trace, except for about one
quarter into the downstroke in L. c. (Fig. 2).
The circulation, C is a measure of the integrated vor-
ticity magnitude in a region. The normalised circulation of
the tip vortices, C* = C/Uc, is plotted as a function of T
(T = t/Tw, where Tw is the wing beat period, and t is
counted from the beginning of each downstroke) stroke at
U = 4 m/s in Fig. 3. C* increases rapidly after the
beginning of the downstroke (T \ 0.1), and then varies
only little between 1.2–1.8 well into the upstroke
(T & 0.75), after which it drops to almost zero at the end
(T = 1) of the upstroke. The pattern and magnitude of the
circulation variation throughout a wing stroke are very
similar between the two species, although one individual L.
c. (the female) appears to show somewhat larger variation.
3.2 Three-dimensional wake topology
As the wake is sampled at 200 Hz, the [yz](t) image sequence
can be used to generate iso-surfaces of constant streamwise
vorticity (xx) over one wing stroke. xx(x, y, z) was assembled
from time sequences of data, such as Fig. 2, using the pre-
viously-noted transform rule Dx = UDt, and xx iso-surfaces
are shown in Fig 4. The iso-values of xx are ±mean |xx| (red
positive, blue negative). The bat is flying from left to right
and obliquely towards the observer, and the iso-surfaces
show the streamwise vorticity that trails the bat wing and
body during the course of a little over one wingbeat. The tip
vortex shed by the right wing is blue, circulating clockwise
when viewed downstream from the bat, and the root vortex is
red, rotating in the opposite, anti-clockwise direction. Their
counterparts in mirror image behind the left wing are
opposite in direction of rotation and colour. The downstroke
generates a prominent tip vortex in both G. s. and L. c. A wing
root vortex of opposite sign is also present during the
downstroke in both species. At the end of the upstroke, an
inverted vortex dipole, whose cross-section was shown in
Fig. 2e and j, can be seen in the top right of both Fig. 4a and
b. The wingtip trailing vortex gradually loses strength and
falls below the visualization threshold towards the end of the
upstroke, but we should remember that the visualized com-
ponent is xx (and not |x|), so although the connecting start
and stop vortices, which are primarily xy, are not visible,
their presence (as required by Helmholtz’s conservation
laws) is known from the full vorticity vector data, and from
plots of xy (x, z). Here, however, the vortex loops appear as
disconnected vortex strands of xx.
3.3 Wake defect maps
Figure 5 shows the normalized streamwise velocity, (u - U)/U.
Since drag and thrust are associated with deceleration and
acceleration of the mean streamwise velocity, U, then a
region of (u - U)/U \ 0 might be interpreted to contribute
a net drag and (u - U)/U [ 0, a net thrust. Then the inte-
grated sum of these regions, taken over a suitable control
volume, will be zero for any self-propelled body in steady
motion. This is a rather over-simplified picture, especially
for such a complex flow, and so close to the wings and body
(see Spedding and Hedenstrom 2009, this volume, for
conditions for estimating mean forces from wake velocity
distributions), but as a first order approximation, we may
assert that maps of (u - U)/U show where the major con-
tributors to thrust and drag are located on the bat, through
their imprint in the cross-plane wake. The trailing tip vortex
has a velocity defect towards its centre in both species. This
2
1
00
1
2
0 0.25 0.50 0.75 1T
Fig. 3 Normalised circulation, C*average = C/Uc, of the wingtip
trailing vortex, realtive to the mean value of the sequence. Mean
values for individual wingbeats are given in the panel to the right.The symbols represent Glossophaga soricina (circles; open and filledsymbols denote different individuals) and Leptonycteris curasoae(squares) followed over a number of wing strokes. The wingbeat
period was 0.067 and 0.099 s for Glossophaga soricina and
Leptonycteris curasoae, respectively
928 Exp Fluids (2009) 46:923–932
123

is consistent with an axial flow along the vortex core towards
the wing, as also noted in the kestrel wake by Spedding
(1987b), and based also on 3D velocity fields. The strongest
accelerated wake flow appears inboard of the tip vortex,
between it and the wing root. At the body, the flow is again
decelerated in this cut, at this stage of the wingbeat. Figure 6
shows that this is true for most of the wingbeat, for both bats.
4 Discussion
4.1 Aerodynamically-equivalent flight speeds
This paper describes the wakes of two species of bats flying
at the same speed, U = 4 m/s, which is in the middle of the
speed range of small bats (Lindhe Norberg and Winter
2006). In a comprehensive study of insect flight, Ellington
(1984) used the advance ratio J = U/2UfR, where U is
stroke angle (in radians), f is wingbeat frequency and R is
wing length, to describe the force asymmetry between
downstroke and upstroke and defined hovering as including
slow forward speed with J \ 0.1. Here J = 1.08 for both
for G. s. and L. c. The related Strouhal number, St = fA/U,
where A is the vertical peak-to-peak amplitude of the
wingtip, evaluates to 0.47 and 0.43 for G. s. and L. c.,
respectively. The similar values of both J and St show that
the flight speeds are aerodynamically-equivalent for the
two bat species, even though they are of different size.
St measures the mean wingtip speed relative to the
forward speed (it is one half of this ratio; Spedding et al.
2008) and so at U = 4 m/s, the tip and forward speeds
have a similar magnitude. Since the wingtip speed fluctu-
ates considerably during each wingbeat cycle, then we may
expect time-varying aerodynamic force components to be
non-negligible, simply based on such values of St.
4.2 The loading and unloading wing cycle
The circulation of the wingtip trailing vortex varies
smoothly through the downstroke/upstroke transition and
continues to be measurable, with the same sign, until close
to the end of the upstroke. At the same time, a downwash
induced between the wingtip and wing root sections sup-
ports the notion that the upstroke is aerodynamically active
for about half its duration, at which point, the circulation
falls to zero and the wing is aerodynamically unloaded.
This cycle of wing loading and unloading through the
wingbeat is quite consistent with previous interpretations
(Hedenstrom et al. 2007) based on multiple 2D DPIV
planes. The agreement of the 3D data with multiple 2D
slices from hundreds of different wingbeats is gratifying.
Fig. 4 Iso-surfaces of normalized constant streamwise vorticity
(x�x¼ xx=j-xj) during just over one wing stroke of (a) Glossophaga
soricina (#1) and (b) Leptonycteris curasoae (#97). The iso-values are
normalized of x�x ¼ �1:0 (red is positive; blue is negative). The data
cubes are oriented, so the bat is flying obliquely to the right and
towards the viewer. The larger centrally trailing tubes therefore mark
the streamwise vorticity shed at the wing root. Approximate time-
marks are: bd (beginning of downstroke), md (mid downstroke), ed(end of downstroke), mu (mid upstroke), eu (end of upstroke). The
data boxes are scaled as (x, y, z) = (400, 260, 180) mm in (a) and
(x, y, z) = (400, 345, 180) mm in (b)
A B
Fig. 5 (u - U)/U at mid downstroke of (a) Glossophaga soricina(#1)and (b) Leptonycteris curasoae (#97). The colour bar runs from
(u - U)/U = -0.35 to 0.35 in steps of 0.05 m/s. The {v,w}-
component velocity vectors are scaled to the reference at 5 m/s at
bottom right. The panels represent a real area of 17.5 9 17.5 cm
Exp Fluids (2009) 46:923–932 929
123

4.3 Pseudo-3D data
It is not only the wing loading/unloading cycle that can be
confirmed in the 3D data, but also the observations of wing
root vortices and of the shedding of inverted vortex loops at
the end of the upstroke. These phenomena were newly
observed in bats and make their wake signatures qualita-
tively different from those of birds (Hedenstrom et al.
2007). The 3D reconstructions in Figs. 4 and 6 are rea-
sonable if the transformation Dx = UDt is reasonable. The
wake evolves in both space and time, and one can only
substitute one for the other provided the intervals are short
compared with spatial or temporal evolution time-scales.
This is often known as the ‘frozen-flow’ hypothesis: would
the wake really be frozen in place as it convects through
the measurement volume? The streamwise extent of the
reconstructed wake, Xw = UTw, where Tw is the wingbeat
period, and here Xw/c = 7.2 for G. s. and 8.3 for L. c.
A comparison of near and far wakes in G. s. at x = 3.2c
and 19c (Johansson et al. 2008) shows that the qualita-
tive and quantitative wake properties vary rather little with
x and so the frozen flow assumption is tenable.
4.4 Drag, thrust and power
The power required to move at steady speed U is just DU,
where D is the total drag that must be overcome to move
through the surrounding fluid. In steady, unaccelerated
flight, the total drag is balanced by the total thrust and the
net horizontal momentum flux in the wake is zero.
Although the wake is often touted as the footprint of the
flying animal, which must contain a record of all the forces
experienced by the wings and body, the causes and traces
of drag and thrust are not necessarily separable. There are
two major contributors to drag in a three-dimensional
lifting system—the induced drag due to the downwash
induced by the trailing vortices, and the viscous drag due to
friction and pressure drag on all exposed surfaces. The
induced drag is an inviscid component, and will be non-
zero on all parts of the flyer that generate lift (and hence
shed trailing vortices). The largest part of that, by far, can
be expected to be from the wings, but especially in light of
the complex root vortex shedding, it will be interesting to
see how and when body lift makes a contribution to the
induced drag.
The viscous drag is not predicted by any tractable the-
ory, so it is always estimated from empirical performance
curves, usually from polar plots of lift coefficient versus
drag coefficient. There is a very significant uncertainty in
its estimation, especially for complex systems like flapping
bat wings. Given this practical problem, it is tempting to
look to the wake structure for alternative measures of drag.
Thus far, animal wake analyses have assumed that the total
drag of the flying animal is balanced by a thrust that can be
calculated from the geometry of the vortex wake
(e.g. Spedding et al. 2003b; Hedenstrom et al. 2006;
Henningsson et al. 2008). Thus the wake geometry, which
is essentially an inviscid construct of line vortices in a
potential flow, can be estimated to give a certain net for-
ward impulse. This is then assumed to balance a viscous
drag over one wingbeat, whose signature has not been
explicitly measured, but which is assumed to trail behind
the wings and body without disrupting the primary trailing
vortex system.
It may be reasonable to further localize these forces. The
wake directly downstream of the body presumably contains
the drag signature of the body, and the measurement of a
three-dimensional, mean streamwise velocity defect could
be used to estimate the body drag. It is tempting therefore
to look to data such as Fig. 6, which contains the velocity
defect map for one wingbeat, for a complete solution to the
Fig. 6 (u - U)/U (x, y, z) for one wing beat of (a) Glossophagasoricina (#1) and (b) Leptonycteris curasoae (#97). Orientation and
time-marks as in Fig. 4.The threshold values used were (u - U)/
U = ±0.25 in (a) and ±0.3 in (b). The data boxes are scaled as (x, y,
z) = (400, 260, 180) mm in (a) and (x, y, z) = (400, 345, 180) in (b)
930 Exp Fluids (2009) 46:923–932
123

drag estimation problem. Indeed, blue and red blobs of
momentum excess or deficit seem to be located in separate
regions, and so while their sum must be zero, the different
parts might be countable. It seems plausible that most
thrust comes from the outer part of the wing, and that most
drag comes from the body, as deduced from Fig. 6. How-
ever, it is far from clear that the pressure fluctuations can
be ignored at x = 3–5c in this highly unsteady wake, and it
is also not clear whether appropriate far-field boundary
conditions can be assumed. Furthermore, there is a
uniqueness problem when the propulsor is a source of both
thrust and drag, because there are an infinite number of
combinations of negative and positive momentum flux that
could have given rise to any given positive or negative net
result. Teasing out these force components will be a sig-
nificant challenge, but at least the data that one requires
(such as Figs. 4, 6) are now becoming available.
4.5 Unsteady aerodynamics
Based on values of the Strouhal number alone (St & 0.4–
0.5), we expect that unsteady aerodynamic forces are likely
to be non-negligible. Wake measurements here show that
C/Uc & 1 for both bat species and if this is interpreted as
one half of a local lift coefficient (Rosen et al. 2007), then
the wings apparently have time-averaged CL & 2. A local
wing section sees the vector sum of U and its local flapping
speed, and not just U, and if the tip speed and mean speed
have the same magnitude, then the corrected speed will beffiffiffi
2p
U and the implied average CL becomes 1.4. This is
close to the upper limit that could be expected from
moderate aspect ratio wings at this Re (Laitone 1997; Lyon
et al. 1997; Spedding et al. 2008). G. s. has been shown to
develop a significant fraction of its lift in near hovering
flight from an unsteady leading-edge vortex (LEV) that
appears and is stable due to wing accelerations (Muijres
et al. 2008). It is possible that some form of LEV persists
into higher speed conditions for G. s., and since it appears
to be flying in a very similar regime, the same extrapolation
is as likely to hold for L. c. also.
5 Conclusion
The higher temporal resolution and availability of the third
velocity component allows wake reconstructions for flying
animals of greater detail and reliability than before. Nev-
ertheless, it is notable how the new wake data are very
consistent with previous reconstructions based on the
painstaking assembly of multiple, separately-acquired data
planes. We look forward to make new flight models based
on these more comprehensive data, and to explore the
challenges in estimating force coefficients from the 3D,
unsteady wake.
Acknowledgments The manuscript benefited from the comments
by two anonymous referees. The 3D high-speed PIV system was
acquired through a generous grant from the Knut and Alice Wallen-
berg foundation. The research was funded by the Swedish Research
Council to A.H.
References
Aldridge HDJN (1986) Kinematics and aerodynamics of the greater
horseshoe bat, Rhinolophus ferrumequinum, in horizontal flight
at various flight speeds. J Exp Biol 126:479–497
Brown RHJ (1948) The flight of birds. The flapping cycle of the
pigeon. J Exp Biol 25:322–333
Ellington CP (1984) The aerodynamics of hovering insect flight. III.
Kinematics. Phil Trans R Soc B 305:41–78
Hedenstrom A (2002) Aerodynamics, evolution and ecology of bird
flight. Trends. Ecol Evol 17:415–422
Hedenstrom A, Spedding GR (2008) Beyond robins: aerodynamic
analyses of animal flight. J R Soc Interface 5:595–601
Hedenstrom A, Rosen M, Spedding GR (2006) Vortex wakes
generated by robins Erithacus rubecula during free flight in a
wind tunnel. J R Soc Interface 3:263–276
Hedenstrom A, Johansson LC, Wolf M, von Busse R, Winter Y,
Spedding GR (2007) Bat flight generates complex aerodynamic
tracks. Science 316:894–897
Henningsson P, Spedding GR, Hedenstrom A (2008) Vortex wake
and flight kinematics of a swift in cruising flight in a wind
tunnel. J Exp Biol 211:717–730
Johansson LC, Wolf M, von Busse R, Winter Y, Spedding GR,
Hedenstrom A (2008) The near and far wake of Pallas’ long
tongued bat (Glossophaga soricina). J Exp Biol 211:2909–2918
Laitone EV (1997) Wind tunnel tests of wings at Reynolds numbers
below 70 000. Exp Fluids 23:405–409
Lindhe Norberg UM, Winter Y (2006) Wing beat kinematics of a
nectar-feeding bat, Glossophaga soricina, flying at different
flight speeds and Strouhal numbers. J Exp Biol 209:3887–3897
Lyon CA, Broeren AP, Giguere P, Gopalarathnam A, Selig MS
(1997) Summary of low-speed airfoil data, vol 3. Soartech,
Virginia Beach
Muijres FT, Johansson LC, Barfield R, Wolf M, Spedding GR,
Hedenstrom A (2008) Leading-edge vortex improves lift in
slow-flying bats. Science 319:1250–1253
Norberg UM (1976) Aerodynamics, kinematics, and energetics of
horizontal flapping flight in the long-eared bat Plecotus auritus.
J Exp Biol 65:179–212
Norberg UM (1990) Vertebrate flight. Springer, Berlin
Pennycuick CJ (1968) Power requirements for horizontal flight in the
pigeon Columba livia. J Exp Biol 49:527–555
Pennycuick CJ (1975) Mechanics of flight. In: Farner DS, King JR,
Parkes KC (eds) Avian Biology, vol 5. Academic Press, New
York, pp 1–75
Pennycuick CJ (1989) Bird flight performance: a practical calculation
manual. Oxford University Press, Oxford
Pennycuick CJ, Alerstam T, Hedenstrom A (1997) A new low-
turbulence wind tunnel for bird flight experiments at Lund
University, Sweden. J Exp Biol 200:1441–1449
Rayner JMV (1979a) A vortex theory of animal flight. Part 2. The
forward flight of birds. J Fluid Mech 91:731–763
Rayner JMV (1979b) A new approach to animal flight mechanics.
J Exp Biol 80:17–54
Exp Fluids (2009) 46:923–932 931
123
Rosen M, Spedding GR, Hedenstrom A (2007) Wake structure and
wingbeat kinematics of a house-martin Delichon urbica. J R Soc
Interface 4:659–668
Spedding GR (1987a) The wake of a kestrel (Falco tinnunculus) in
gliding flight. J Exp Biol 127:45–57
Spedding GR (1987b) The wake of a kestrel (Falco tinnunculus) in
flapping flight. J Exp Biol 127:59–78
Spedding GR, Hedenstrom A (2009) PIV-based investigations of
animal flight. Exp Fluids. doi:10.1007/s00348-008-0597-y
Spedding GR, Rayner JMV, Pennycuick CJ (1984) Momentum and
energy in the wake of the a pigeon (Columba livia) in slow flight.
J Exp Biol 111:81–102
Spedding GR, Hedenstrom A, Rosen M (2003a) Quantitative studies
of the wakes of freely flying birds in a low turbulence wind
tunnel. Exp Fluids 34:291–303
Spedding GR, Rosen M, Hedenstrom A (2003b) A family of vortex
wakes generated by a thrush nightingale in free flight in a wind
tunnel over its entire natural range of flight speeds. J Exp Biol
206:2313–2344
Spedding GR, Hedenstrom A, McArthur J, Rosen M (2008) The
implications of low-speed fixed-wing aerofoil measurements on
the analysis and performance of flapping bird wings. J Exp Biol
211:215–223
Spedding GR, Hedenstrom A, Johansson C (2009) A note on wind-
tunnel turbulence measurements with DPIV. Exp Fluids 46:527–
537. doi:10.1007/s00348-008-0578-1
Warrick DR, Tobalske BW, Powers DP (2005) Aerodynamics of the
hovering hummingbird. Nature 435:1094–1097
932 Exp Fluids (2009) 46:923–932
123