High-resolution wide-field microscopy with adaptive optics for spherical aberration correction and...
23
High-resolution wide-field microscopy with adaptive optics for spherical aberration correction and motionless focusing P. Kner *,# , J.W. Sedat * , D.A. Agard *,† , and Z. Kam ‡ * Keck Advanced Microscopy Laboratory and Department of Biochemistry and Biophysics, University of California, 600 16th St., San Francisco, CA 94158, U.S.A. † Howard Hughes Medical Institute, University of California, San Francisco, CA 94158, U.S.A. ‡ Department of Molecular Cell Biology, Weizmann Institute of Science, Rehovot 76100, Israel Summary Live imaging in cell biology requires three-dimensional data acquisition with the best resolution and signal-to-noise ratio possible. Depth aberrations are a major source of image degradation in three- dimensional microscopy, causing a significant loss of resolution and intensity deep into the sample. These aberrations occur because of the mismatch between the sample refractive index and the immersion medium index. We have built a wide-field fluorescence microscope that incorporates a large-throw deformable mirror to simultaneously focus and correct for depth aberration in three- dimensional imaging. Imaging fluorescent beads in water and glycerol with an oil immersion lens we demonstrate a corrected point spread function and a 2-fold improvement in signal intensity. We apply this new microscope to imaging biological samples, and show sharper images and improved deconvolution. Keywords Adaptive optics; biomedical imaging; microscopy Introduction In vivo fluorescence microscopy is an essential tool in cell biology. A dominant driving force has been the extraordinary ability to study live biological samples made possible by the plethora of fluorescent proteins permitting sub-cellular labelling (Shaner et al., 2005). Despite its tremendous versatility, in vivo imaging is limited in practice by the sensitivity of biological samples and fluorophores to photodamage and photobleaching. As a consequence, image quality can be severely compromised by the lack of photons. A recent comprehensive study of several modern commercial microscopes (Murray et al., 2007) shows that wide-field microscopy is the most sensitive technique followed by a 2- to 4-fold reduction in sensitivity for spinning disc microscopy, and then a further sensitivity reduction of 10-fold for laser- scanning confocal microscopy. Because wide-field microscopy captures as efficiently as possible every emitted photon ultimately minimizing the sample excitation dose, it is well suited to in vivo imaging in samples where scattering is not too large. Although the out-of- © 2009 The Authors Journal compilation © 2009 The Royal Microscopical Society Correspondence to: P. Kner. Correspondence to: P. Kner. Tel: +1 706 542 8966; fax: +1 706 542 8806. [email protected]. # Present address: Faculty of Engineering, University of Georgia, Athens, GA 30602, U.S.A. NIH Public Access Author Manuscript J Microsc. Author manuscript; available in PMC 2010 July 6. Published in final edited form as: J Microsc. 2010 February ; 237(2): 136–147. doi:10.1111/j.1365-2818.2009.03315.x. NIH-PA Author Manuscript NIH-PA Author Manuscript NIH-PA Author Manuscript
Transcript of High-resolution wide-field microscopy with adaptive optics for spherical aberration correction and...

High-resolution wide-field microscopy with adaptive optics forspherical aberration correction and motionless focusing
P. Kner*,#, J.W. Sedat*, D.A. Agard*,†, and Z. Kam‡*Keck Advanced Microscopy Laboratory and Department of Biochemistry and Biophysics, Universityof California, 600 16th St., San Francisco, CA 94158, U.S.A.†Howard Hughes Medical Institute, University of California, San Francisco, CA 94158, U.S.A.‡Department of Molecular Cell Biology, Weizmann Institute of Science, Rehovot 76100, Israel
SummaryLive imaging in cell biology requires three-dimensional data acquisition with the best resolution andsignal-to-noise ratio possible. Depth aberrations are a major source of image degradation in three-dimensional microscopy, causing a significant loss of resolution and intensity deep into the sample.These aberrations occur because of the mismatch between the sample refractive index and theimmersion medium index. We have built a wide-field fluorescence microscope that incorporates alarge-throw deformable mirror to simultaneously focus and correct for depth aberration in three-dimensional imaging. Imaging fluorescent beads in water and glycerol with an oil immersion lenswe demonstrate a corrected point spread function and a 2-fold improvement in signal intensity. Weapply this new microscope to imaging biological samples, and show sharper images and improveddeconvolution.
KeywordsAdaptive optics; biomedical imaging; microscopy
IntroductionIn vivo fluorescence microscopy is an essential tool in cell biology. A dominant driving forcehas been the extraordinary ability to study live biological samples made possible by the plethoraof fluorescent proteins permitting sub-cellular labelling (Shaner et al., 2005). Despite itstremendous versatility, in vivo imaging is limited in practice by the sensitivity of biologicalsamples and fluorophores to photodamage and photobleaching. As a consequence, imagequality can be severely compromised by the lack of photons. A recent comprehensive study ofseveral modern commercial microscopes (Murray et al., 2007) shows that wide-fieldmicroscopy is the most sensitive technique followed by a 2- to 4-fold reduction in sensitivityfor spinning disc microscopy, and then a further sensitivity reduction of 10-fold for laser-scanning confocal microscopy. Because wide-field microscopy captures as efficiently aspossible every emitted photon ultimately minimizing the sample excitation dose, it is wellsuited to in vivo imaging in samples where scattering is not too large. Although the out-of-
© 2009 The Authors Journal compilation © 2009 The Royal Microscopical SocietyCorrespondence to: P. Kner.Correspondence to: P. Kner. Tel: +1 706 542 8966; fax: +1 706 542 8806. [email protected].#Present address: Faculty of Engineering, University of Georgia, Athens, GA 30602, U.S.A.
NIH Public AccessAuthor ManuscriptJ Microsc. Author manuscript; available in PMC 2010 July 6.
Published in final edited form as:J Microsc. 2010 February ; 237(2): 136–147. doi:10.1111/j.1365-2818.2009.03315.x.
NIH
-PA Author Manuscript
NIH
-PA Author Manuscript
NIH
-PA Author Manuscript

focus photons are in the wrong place, they can be effectively re-assigned to the location ofemission by constrained deconvolution algorithms (Swedlow et al., 1997).
To maintain the highest resolution and signal intensity in modern three-dimensionalmicroscopy, high numerical aperture (NA) objectives are used. Unfortunately, high NAobjectives only give well-corrected images just below the cover slip. As the focal plane ismoved deeper into the sample, the image degrades due to path length errors that arise fromdifferences between the refractive index of the sample and that of the immersion media (depthaberration) and due to path length errors that arise from refractive index variations in the sampleitself (sample-induced aberrations). In many samples the dominant aberrations are depthaberrations (Schwertner, 2004). In this paper, we concentrate on the depth dependent aberrationwhich can quickly become serious. Imaging 20 µm into a live sample [index of refraction ~1.36(Choi et al., 2007)] with an oil immersion lens causes the peak intensity of the point spreadfunction (PSF) to drop 3-fold and the width of the PSF in the axial direction to increase by 2-folds (Gibson & Lanni, 1991).
Because deconvolution requires an accurate knowledge of the PSF, a mismatch between thetrue PSF and that used for deconvolution will significantly degrade the ability to accurately re-assign the out-of-focus photons to their correct positions. Deconvolution with a depth-dependent PSF has been implemented (Kam et al., 2001; Shaevitz & Fletcher, 2007), but thistechnique is computationally intensive and can never as fully restore the peak intensity of theoriginal signal, resulting in sub-optimal signal-to-noise ratio. This is in general true of the manysophisticated post-acquisition image processing algorithms that are available.
The problem of depth aberrations can be solved by matching the sample index and the indexof the immersion medium, but this is frequently not feasible or desirable. For example, theindex of fixed cells can be matched to that of the immersion oil (Staudt et al., 2007), but thisoption is not available for live imaging. A water immersion objective can be used to moreclosely match the index of a live sample; however, this solution merely pushes the point atwhich aberrations become serious from a few micrometres to a few tens of micrometres, andthere are many cases where one would like to image hundreds of micrometres into embryosand live tissue (Wyckoff et al., 2007). Water lenses have a correction collar which is generallyused to correct for the cover slip thickness. If they are not carefully adjusted, they will causethe same types of image degradation that they are meant to correct. The collar can be adjustedso that the PSF is optimized not just below the cover slip but at some depth into the sample,but this solution still only corrects the PSF for one specific depth. Above and below thisposition, the PSF will be distorted.
Based on quantitative simulations, we recently proposed that depth aberrations could beeffectively eliminated by correcting the phase of the emitted light in the back pupil plane ofthe microscope (Kam et al., 2007). Depth aberrations are readily corrected across the entirefield of view because the path differences of the emitted light that give rise to the depthaberrations are only dependent on the angle of the emitted light and not on field position. Herewe describe our first-generation implementation of this proposal using a deformable mirror(DM) conjugate to the back pupil plane in both the excitation and emission paths of a wide-field fluorescence microscope. Only recently have DMs become sufficiently small for them tobe reasonable choices for optical microscopy. We chose a DM (described in the ‘Materials andmethods’ section) capable of large displacements to correct aberrations deep into the sample.To correct depth aberrations 50 into an aqueous sample for example, requires a total mirrordisplacement of 10 µm.
Another benefit to controlling the phase in the back pupil plane of the microscope is that itallows for focusing without perturbing the sample (Wright et al., 2006; Kam et al., 2007; Poland
Kner et al. Page 2
J Microsc. Author manuscript; available in PMC 2010 July 6.
NIH
-PA Author Manuscript
NIH
-PA Author Manuscript
NIH
-PA Author Manuscript

et al., 2008). As discussed below, the phase can be modified to compensate not only for therefractive index mismatch, but for the change in focal plane as well. This can be important forrapid three-dimensional imaging; coupling between the objective and sample through theimmersion liquid can induce sample motions when the stage or objective lens is rapidly moved.This problem can be completely avoided by focusing with the DM.
Adaptive optics (AO) has been implemented in confocal microscopy (Booth et al., 2002,2007) and multiphoton microscopy (Sherman et al., 2002; Marsh et al., 2003; Rueckel et al.,2006) to correct both depth aberrations and sample-induced aberrations on a point-by-pointbasis and in wide-field fluorescence microscopy with optical sectioning by structuredillumination (Débarre et al., 2008). Adaptive optics has also been used to correct for off-axisaberrations in a two-dimensional bright-field microscope to increase the field of view (Potsaidet al., 2005). An important drawback to most schemes that have been proposed so far is thatthey require several images to be taken to optimize the aberration correction. This presents aserious problem for live imaging in biology because the fluorescence intensities can be weakand susceptible to rapid bleaching. Rueckel et al. use backscattered excitation light to measurethe wavefront. Booth et al. used a modal wavefront sensor which required extra images tomeasure the wavefront. Potsaid et al. use a predictive correction based on the known aberrationfor a given field position.
Materials and methodsDepth aberration correction
The approach we follow is to correct the depth aberrations with an open-loop predictivealgorithm similar to the approach taken by Potsaid et al. in correcting off-axis aberrations.
This is possible because the depth aberration can be calculated for a given depth into the sample.The depth aberration is the result of depth-dependent path length differences. Figure 1(a)illustrates the path length difference between a ray from a point source at depth d below thecover slip in a material with index n2 < n1 and a ray from a point source in a material with n2= n1. For an objective that obeys the sine condition (Gu, 1999), the phase correction that mustbe applied in the back pupil plane is (Booth et al., 1998)
(1)
where ρ = n 1 sin θ is the normalized radial coordinate in the back pupil plane, λ is thewavelength of the emitted light and NA is the numerical aperture. For a sample with internalrefractive index variations in addition to the refractive index mismatch at the cover slip, thiscorrection will not be complete.
The DM can also be used to focus into the sample. Figure 1(b) shows the path length differencebetween a point at the cover slip and a point a depth d below the cover slip. Correcting for thisadditional path length difference in the back pupil plane accomplishes focusing with depthcorrection. In this case, the phase correction applied in the back pupil plane is
(2)
The shape of the DM is then given by
Kner et al. Page 3
J Microsc. Author manuscript; available in PMC 2010 July 6.
NIH
-PA Author Manuscript
NIH
-PA Author Manuscript
NIH
-PA Author Manuscript
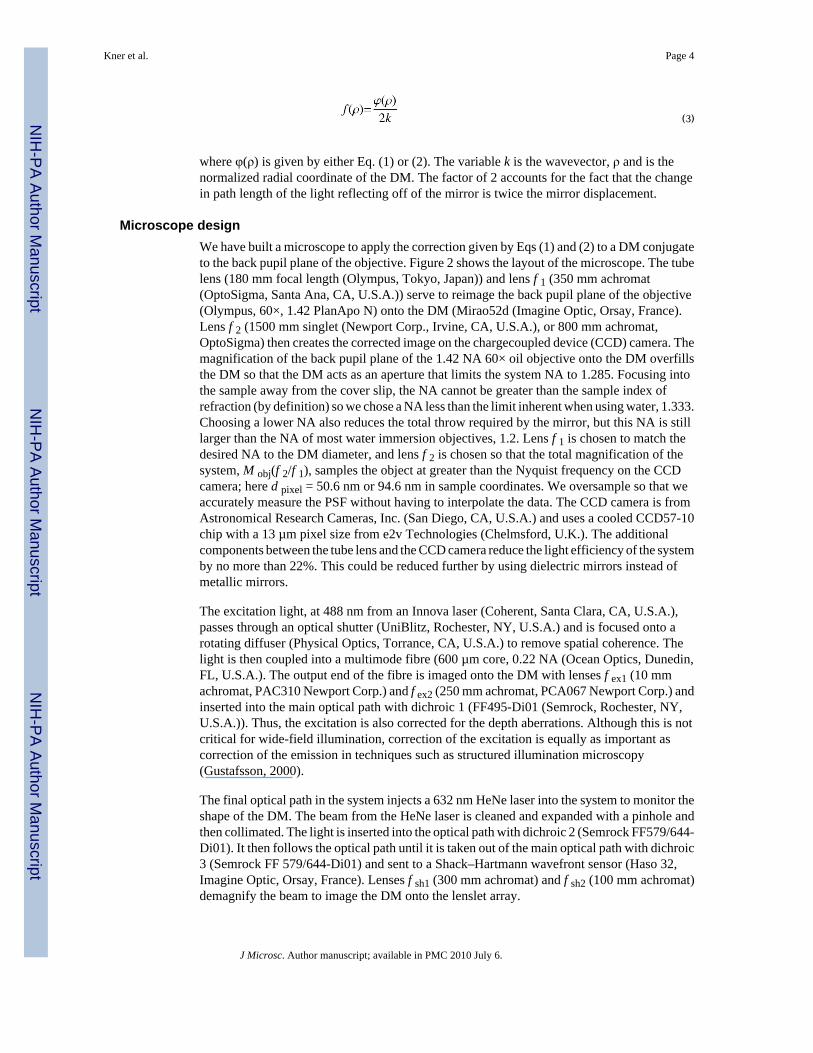
(3)
where φ(ρ) is given by either Eq. (1) or (2). The variable k is the wavevector, ρ and is thenormalized radial coordinate of the DM. The factor of 2 accounts for the fact that the changein path length of the light reflecting off of the mirror is twice the mirror displacement.
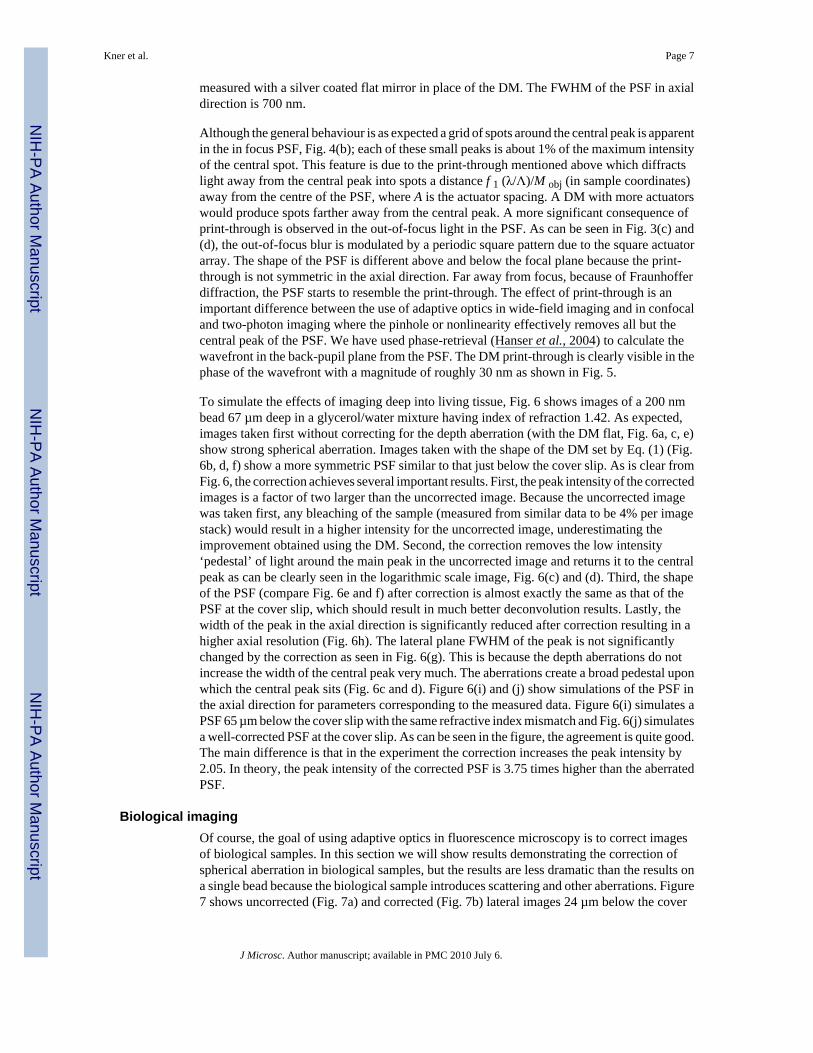
Microscope designWe have built a microscope to apply the correction given by Eqs (1) and (2) to a DM conjugateto the back pupil plane of the objective. Figure 2 shows the layout of the microscope. The tubelens (180 mm focal length (Olympus, Tokyo, Japan)) and lens f 1 (350 mm achromat(OptoSigma, Santa Ana, CA, U.S.A.)) serve to reimage the back pupil plane of the objective(Olympus, 60×, 1.42 PlanApo N) onto the DM (Mirao52d (Imagine Optic, Orsay, France).Lens f 2 (1500 mm singlet (Newport Corp., Irvine, CA, U.S.A.), or 800 mm achromat,OptoSigma) then creates the corrected image on the chargecoupled device (CCD) camera. Themagnification of the back pupil plane of the 1.42 NA 60× oil objective onto the DM overfillsthe DM so that the DM acts as an aperture that limits the system NA to 1.285. Focusing intothe sample away from the cover slip, the NA cannot be greater than the sample index ofrefraction (by definition) so we chose a NA less than the limit inherent when using water, 1.333.Choosing a lower NA also reduces the total throw required by the mirror, but this NA is stilllarger than the NA of most water immersion objectives, 1.2. Lens f 1 is chosen to match thedesired NA to the DM diameter, and lens f 2 is chosen so that the total magnification of thesystem, M obj(f 2/f 1), samples the object at greater than the Nyquist frequency on the CCDcamera; here d pixel = 50.6 nm or 94.6 nm in sample coordinates. We oversample so that weaccurately measure the PSF without having to interpolate the data. The CCD camera is fromAstronomical Research Cameras, Inc. (San Diego, CA, U.S.A.) and uses a cooled CCD57-10chip with a 13 µm pixel size from e2v Technologies (Chelmsford, U.K.). The additionalcomponents between the tube lens and the CCD camera reduce the light efficiency of the systemby no more than 22%. This could be reduced further by using dielectric mirrors instead ofmetallic mirrors.
The excitation light, at 488 nm from an Innova laser (Coherent, Santa Clara, CA, U.S.A.),passes through an optical shutter (UniBlitz, Rochester, NY, U.S.A.) and is focused onto arotating diffuser (Physical Optics, Torrance, CA, U.S.A.) to remove spatial coherence. Thelight is then coupled into a multimode fibre (600 µm core, 0.22 NA (Ocean Optics, Dunedin,FL, U.S.A.). The output end of the fibre is imaged onto the DM with lenses f ex1 (10 mmachromat, PAC310 Newport Corp.) and f ex2 (250 mm achromat, PCA067 Newport Corp.) andinserted into the main optical path with dichroic 1 (FF495-Di01 (Semrock, Rochester, NY,U.S.A.)). Thus, the excitation is also corrected for the depth aberrations. Although this is notcritical for wide-field illumination, correction of the excitation is equally as important ascorrection of the emission in techniques such as structured illumination microscopy(Gustafsson, 2000).
The final optical path in the system injects a 632 nm HeNe laser into the system to monitor theshape of the DM. The beam from the HeNe laser is cleaned and expanded with a pinhole andthen collimated. The light is inserted into the optical path with dichroic 2 (Semrock FF579/644-Di01). It then follows the optical path until it is taken out of the main optical path with dichroic3 (Semrock FF 579/644-Di01) and sent to a Shack–Hartmann wavefront sensor (Haso 32,Imagine Optic, Orsay, France). Lenses f sh1 (300 mm achromat) and f sh2 (100 mm achromat)demagnify the beam to image the DM onto the lenslet array.
Kner et al. Page 4
J Microsc. Author manuscript; available in PMC 2010 July 6.
NIH
-PA Author Manuscript
NIH
-PA Author Manuscript
NIH
-PA Author Manuscript

The microscope slide is mounted above the objective on a custom-designed mount that uses aNewport 462 xyz-stage. Z-stacks are taken with a piezo stack attached to the z-axis micrometer(P-810 piezo and E661.CP controller (Physik Instrumente, Karlsruhe, Germany)), and the stageposition is measured with a capacitive sensor (NS2000-L (Queensgate, Torquay, U.K.)).
Three-dimensional image stacksAll the three-dimensional data stacks were taken using the piezo for focusing through thesample except the data for Figs 10 and 11 in which the focusing was performed by the DM. Inthree-dimensional image stacks in which Eq. (1) was used to correct the depth aberration, thecorrection was adjusted for each depth so that the PSF is corrected throughout the sample andnot just at one particular depth. The only exception to this is the images of a bead in Figs 4 and6, where the phase correction was set to the depth of the centre of the bead and not adjustedfor the three-dimensional data stack.
Deformable mirror controlFor the DM, we chose the Mirao52D from Imagine-Optic (www.imagine-optic.com) becauseit is capable of large displacements and thus permits the correction of aberrations deep into asample. The 15-mm-diameter mirror has 52 actuators on a square grid with 2.5 mm spacing.The mirror is capable of a maximum displacement of ±75 µm for the focus mode and ±µm for the first order spherical aberration . The mirror can take the shape of any Zernikemode through order 4 with a root-mean square (rms) wavefront error of less than 20 nm.Because the mirror cannot set the higher order terms, the Strehl ratio will degrade with depth,as the amount of higher order spherical terms needed to fit the correction (given by Eq. 2)increases. Thus, the maximum depth the mirror can correct will be limited by the residualaberrations and not the maximum displacement of the focus mode.
We control the mirror by measuring the wavefront of the HeNe laser with the wavefront sensor(reference path in Fig. 2). We reference the wavefront to a measurement with all actuators setto zero, and then measure the wavefront on a 32 × 32 lenslet array for each of the 52 actuatorsactivated individually, yielding a 1024 × 52 matrix. To set a desired mirror shape, we use thestandard singular value decomposition technique (Gavel, 2003) to determine the matrix Swhich will yield the actuator values for a desired wavefront. Typically, we only retain the first45 singular values.
Sample preparationTo estimate the PSF, we imaged 200-nm-diameter Yellow-Green fluorescent beads (F-8811,Molecular Probes, Inc., Eugene, OR, U.S.A.). Because a bead is smaller than the diffractionspot, its image represents a good approximation for the PSF of the microscope. The beads aredispersed in water at a concentration of 2% by weight and were diluted by an additional factorof 106 in water to a concentration of 3.9 × 10⁶ beads/ml (Fluospheres Fluorescent MicrospheresApplication Note, Molecular Probes, Inc.). To image beads at 0 depth (on the cover slip), 15µl of bead solution were dried on a #1.5 cover slip and mounted on a slide with 5 µl of glycerol.To image beads below the cover slip, #2 cover slips were glued to a slide on either side of a#1.5 cover slip using optical adhesive (Optical Adhesive 61 (Norland, Cranbury, NJ, U.S.A.)).The #2 cover slips serve as a support. 200 nm beads were dried on the centre cover slip and ona 40 × 20 mm #1.5 cover slip. A total of 25 µl of a water/glycerol mixture was put on the slideand the larger cover slip was placed on top and sealed with nail polish. The relativeconcentration of water and glycerol in the mixture was adjusted to yield an index of refractionof 1.42 for the mounting solution (Newman, 1968). The distance between the top cover slipand the slide varied between 45 and 75 µm.
Kner et al. Page 5
J Microsc. Author manuscript; available in PMC 2010 July 6.
NIH
-PA Author Manuscript
NIH
-PA Author Manuscript
NIH
-PA Author Manuscript

To image beads at a variety of depths (Fig. 10), a 2% w/v solution of 200 nm YG beads wasdiluted by a factor of 1000 and mixed at a concentration of 1:1 with a solution of 2% low-temperature Agar. Approximately 30 µl of the solution was pipetted onto a microscope slideand immediately covered with a #1.5 cover slip and sealed with nail polish.
B16F10 mouse cells were grown on Fibronectin coated #1.5 cover slips and were stained withAlexa488-phalloidin to label the actin following the protocol developed by Cramer and Desai(‘Fluorescence Procedures for the Actin and Tubulin Cytoskeleton in Fixed Cells’,http://mitchison.med.harvard.edu/protocols/gen1.html). The cover slips were then mounted onslides with Phosphate Buffered Saline (PBS) and sealed with nail polish.
Live worms expressing a Green Fluorescent Protein (GFP) sur-5 construct were mounted onagar in M9 buffer containing 1 mM Levamisole and sealed with #1.5 cover slips. Bladder cancercells from endothelial bladder carcinoma cancer cell line UMUC3 (#CRL-1749 (AmericanType Culture Collection, Manassas, VA, U.S.A)) infected with the Lentivirus GFP constructof the protein Telemeric Repeat binding Factor 1 (TRF1) were grown on #1.5 cover slips andthen mounted on slides with PBS buffer and sealed with nail polish.
Eye imaginal discs from a third instar larvae of the w1118; P {wmc, CIDGFP} fly line(Henikoff et al., 2000) were dissected into a drop of PBS buffer on a cover slip (Wolff,2000). Before dissection, the #1.5 cover slip was glued to a metal slide with UV cured epoxy.The drop with the discs was covered with a gas-permeable membrane for the purpose offlattening the tissues and gently pressing them against the cover slip. The top of the slide overthe cover slip was then sealed with a clear plastic cover to prevent evaporation of the buffer.
DeconvolutionThe deconvolution was performed using the AIDA software package (Hom et al., 2007). Weused the myopic deconvolution option in AIDA, allowing the PSF to vary to optimize thereconstructed object, and the initial guess was a Wiener-filtered version of the image. Themaximum changes in the PSF were 20% of the maximum value. The deconvolution of a 256× 256 × 64 pixel image stack took approximately 30 min on a Pentium III computer.
ResultsDeformable mirror performance
Figure 3(a) shows the mirror shape and residual error for focusing a depth of 5 µm into waterwith an oil immersion lens. The desired shape of the mirror given by Eq. (2) cannot be setexactly by the mirror and there is a 20 nm residual rms error in the wavefront. Figure 3(b)shows the residual rms error as a function of the depth. This effectively sets the upper limit tothe depth that can be corrected for a given NA and refractive index mismatch. Anotherimportant aspect of the DM performance is ‘print-through’ which is any residual non-flatstructure at the array spacing due to the manufacturing process. The print-through will diffractlight because it is a regular pattern and results in satellite peaks in the PSF as discussed below.
Imaging beadsFigure 4 shows an image of a 200 nm Yellow-Green bead at the cover slip. Because the beaddiameter is just below the microscope resolution, the image of the bead is a reasonableapproximation of the PSF of the microscope (Hiraoka et al., 1990). The finite size of the beadshould increase the full-width at half-maximum (FWHM) of the PSF by 15% and reduce thecontrast of the rings in the airy disk. As can be seen from the figure, the PSF is well correctedwith a FWHM of 270 nm which is 15% larger than the theoretical FWHM of 234 nm for 520nm emission light with an NA of 1.285 and a 200 nm bead. This is comparable to the PSF
Kner et al. Page 6
J Microsc. Author manuscript; available in PMC 2010 July 6.
NIH
-PA Author Manuscript
NIH
-PA Author Manuscript
NIH
-PA Author Manuscript
measured with a silver coated flat mirror in place of the DM. The FWHM of the PSF in axialdirection is 700 nm.
Although the general behaviour is as expected a grid of spots around the central peak is apparentin the in focus PSF, Fig. 4(b); each of these small peaks is about 1% of the maximum intensityof the central spot. This feature is due to the print-through mentioned above which diffractslight away from the central peak into spots a distance f 1 (λ/Λ)/M obj (in sample coordinates)away from the centre of the PSF, where A is the actuator spacing. A DM with more actuatorswould produce spots farther away from the central peak. A more significant consequence ofprint-through is observed in the out-of-focus light in the PSF. As can be seen in Fig. 3(c) and(d), the out-of-focus blur is modulated by a periodic square pattern due to the square actuatorarray. The shape of the PSF is different above and below the focal plane because the print-through is not symmetric in the axial direction. Far away from focus, because of Fraunhofferdiffraction, the PSF starts to resemble the print-through. The effect of print-through is animportant difference between the use of adaptive optics in wide-field imaging and in confocaland two-photon imaging where the pinhole or nonlinearity effectively removes all but thecentral peak of the PSF. We have used phase-retrieval (Hanser et al., 2004) to calculate thewavefront in the back-pupil plane from the PSF. The DM print-through is clearly visible in thephase of the wavefront with a magnitude of roughly 30 nm as shown in Fig. 5.
To simulate the effects of imaging deep into living tissue, Fig. 6 shows images of a 200 nmbead 67 µm deep in a glycerol/water mixture having index of refraction 1.42. As expected,images taken first without correcting for the depth aberration (with the DM flat, Fig. 6a, c, e)show strong spherical aberration. Images taken with the shape of the DM set by Eq. (1) (Fig.6b, d, f) show a more symmetric PSF similar to that just below the cover slip. As is clear fromFig. 6, the correction achieves several important results. First, the peak intensity of the correctedimages is a factor of two larger than the uncorrected image. Because the uncorrected imagewas taken first, any bleaching of the sample (measured from similar data to be 4% per imagestack) would result in a higher intensity for the uncorrected image, underestimating theimprovement obtained using the DM. Second, the correction removes the low intensity‘pedestal’ of light around the main peak in the uncorrected image and returns it to the centralpeak as can be clearly seen in the logarithmic scale image, Fig. 6(c) and (d). Third, the shapeof the PSF (compare Fig. 6e and f) after correction is almost exactly the same as that of thePSF at the cover slip, which should result in much better deconvolution results. Lastly, thewidth of the peak in the axial direction is significantly reduced after correction resulting in ahigher axial resolution (Fig. 6h). The lateral plane FWHM of the peak is not significantlychanged by the correction as seen in Fig. 6(g). This is because the depth aberrations do notincrease the width of the central peak very much. The aberrations create a broad pedestal uponwhich the central peak sits (Fig. 6c and d). Figure 6(i) and (j) show simulations of the PSF inthe axial direction for parameters corresponding to the measured data. Figure 6(i) simulates aPSF 65 µm below the cover slip with the same refractive index mismatch and Fig. 6(j) simulatesa well-corrected PSF at the cover slip. As can be seen in the figure, the agreement is quite good.The main difference is that in the experiment the correction increases the peak intensity by2.05. In theory, the peak intensity of the corrected PSF is 3.75 times higher than the aberratedPSF.
Biological imagingOf course, the goal of using adaptive optics in fluorescence microscopy is to correct imagesof biological samples. In this section we will show results demonstrating the correction ofspherical aberration in biological samples, but the results are less dramatic than the results ona single bead because the biological sample introduces scattering and other aberrations. Figure7 shows uncorrected (Fig. 7a) and corrected (Fig. 7b) lateral images 24 µm below the cover
Kner et al. Page 7
J Microsc. Author manuscript; available in PMC 2010 July 6.
NIH
-PA Author Manuscript
NIH
-PA Author Manuscript
NIH
-PA Author Manuscript
slip of UMUC bladder cancer cells with GFP-TRF1 labelled telomeres. Although the intensityof the cell autofluorescence is not increased by the correction of the depth aberrations, the GFP-TRF1 signal is brighter by 60% after subtracting the broad autofluorescence signal (Fig. 7c).Because the aberrations spread out the energy but do not remove it, we would not expect aspatially broad signal from the autofluorescence or from a thin fluorescent sheet to be improvedby correcting the depth aberration in a wide-field microscope because the integrated intensityis unchanged. Figure 8 shows another example, GFP labelled centromeres in eye ImaginalDiscs in Drosophila embryos. In this sample, correcting the depth aberration did not increasethe intensity of the signal from the GFP centromeres, but the FWHM of the centromere imagesin the axial direction are smaller by 27% in the axial direction which can be seen in Fig. 8.
Because adaptive optics corrects the PSF throughout the sample (the DM shape is adjustedaccording to Eq. 1 at each depth), it should greatly improve the ability of deconvolutionalgorithms to remove the blurring of the object caused by the PSF; this is because the PSF isnow constant throughout the image and matches the PSF taken at the cover slip which is usedfor deconvolution. This is demonstrated in Fig. 9, which shows the deconvolution of imagesof actin labelled with Alexa488-Phalloidin in B16F10 cells. The deconvolved image, Fig. 9(d), of the AO-corrected data shows significantly less background than the deconvolved imageof the uncorrected data, Fig. 9(b). Interestingly the images before deconvolution (Fig. 7a andc, which are the uncorrected and corrected images, respectively) do not look as different. Theseimages are xy-sections 4.4 µm below the cover slip and show actin labelling in cell–celljunctions.
In addition to correcting the depth aberration, the DM also has the capability to focus into thesample as described by Eq. (2). Figure 10 is an example of using the DM to focus through 200nm beads in an agarose solution. It is clear from the maximum intensity projections in Fig. 10(a) and (b) that the DM correctly focuses through the sample because the same beads can beseen in both images. Unfortunately focusing with the DM adds aberrations because the remotefocusing configuration is sensitive to aberrations in the optical components between the sampleand the DM. This is because the beam diameter before the DM changes as a function of depth.If there is an aberration in the fold mirror before the DM, it can be corrected with the DM forimaging just below the cover slip, but this correction will not work for imaging deeper into thesample because the beam diameter on the fold mirror will have changed. Thus the improvementdue to depth correction may be negated by aberrations in optical components that areuncorrected as the system is focused into the sample. Figure 11 is an example of using a DMto focus through an adult C. elegans worm expressing a GFP sur-5 construct. The images inFig. 11(a) are from a three-dimensional data stack taken using the DM to focus in z, and arecomparable to the images taken in Fig. 11(b) using mechanical focusing. The same featuresare clearly visible in both images although the level of background fluorescence has changed.
DiscussionCorrecting depth aberrations with a DM improves both the peak intensities and thedeconvolution of images taken below the cover slip by removing the depth aberration. Thisallows the use of fast space-invariant deconvolution algorithms instead of depth-dependentalgorithms. This is significant because it improves both the signal-to-noise ratio and theresolution in biological imaging where photons are in short supply. Unfortunately, theperformance does not yet achieve what is theoretically possible.
Although the correction of a bead in glycerol, Fig. 6, shows an impressive improvement inintensity due to the correction, the factor of 2 increase in signal is still less than the factor of 4that should be possible based on the theoretical decrease in intensity predicted by the depth,NA and index of refraction mismatch. There are two important factors that contribute to this
Kner et al. Page 8
J Microsc. Author manuscript; available in PMC 2010 July 6.
NIH
-PA Author Manuscript
NIH
-PA Author Manuscript
NIH
-PA Author Manuscript

effect. The first is the effect of uncorrected aberrations from the sample and the optical path,which decrease the maximum intensity at the cover slip, but in a way that does not add linearlyto the depth aberration. Thus only a fraction of the dispersed photons can be restored to thecentral peak. In closed loop AO systems, system aberrations are automatically compensatedat each position (Wright et al., 2007), but in an open-loop system this is not possible. Thesecond factor is the inability of the mirror to precisely conform to the shape given by Eq. (1).The residual error of the mirror shape increases with depth (see Fig. 3c) so that as the imagingplane goes deeper and the possibility for improvement becomes greater, the improvement inpeak intensities decreases. To address the first problem we must reduce the residual aberrationsin the system as much as possible. The objective and tube lens will not be perfect (Juskaitis,2007), and the mirrors used in our system are also a potential source of aberrations. Most silvermirrors are specified to have a rms surface flatness of λ/10. According to the Marechal criterion(Hardy, 1998), this will result in a Strehl ratio of roughly 0.6. Thus having a few mirrors in thesystem can be a significant source of aberration.
Similar to the residual aberrations in the optical train, sample-induced aberrations can affectthe performance of the system in a nonlinear way and will affect the measured performance ofthe microscope in correcting depth aberrations. Scattering will also affect the ability of themicroscope to recover the intensity lost since scattering will disperse the light in a random wayso that it cannot be imaged.
Another important feature of three-dimensional wide-field microscopy is the out-of-focus lightpresent in the three-dimensional PSF. As can be seen in Figs 4 and 5, the PSF of the systemcontains a weak grid of points outside the central peak due to the print-through. In confocalmicroscopy, only light in the central peak is accepted by the pinhole; therefore, the PSF shouldnot be substantially altered although the intensity measured inside the pinhole is still less thanideal. In wide-field microscopy, the structure in the PSF can be visible in the image.Deconvolution is important for removing this structure, and the AIDA deconvolution packageworks well but could be further modified to explicitly address such features that arise inadaptive optics. Myopic deconvolution, allowing the PSF to vary under a harmonic constraintalong with optimization of the reconstruction, is an option in AIDA, and it would be interestingto tailor the PSF constraint for the case of adaptive optics where the spatial frequency of theprint-through is known, but its exact structure could be optimized to account for details of thePSF.
The ability to focus with the DM is very exciting for live imaging because it enables theacquisition of three-dimensional data rapidly without any movement or disturbance of thesample; DMs have typical response times of better than 200 Hz and modern cooled CCDcameras can capture 256 × 256 pixel images at faster than 60 fps. An active focus lockingsystem has been implemented with adaptive optics by (Poland et al., 2008) at over 200 Hz.Other motionless refocusing techniques are either not as fast (Tsai et al., 2007) or cannot correctfor the refractive index mismatch (Botcherby et al., 2007). The optical system can beredesigned to use optical components with better surface quality, and there is also the possibilitythat the system could be calibrated to correct for the aberrations at every focus position.
There are many modifications to the microscope design that we discuss here that could improvecorrection of depth aberrations and extend the design to the correction of sample-inducedaberrations. A DM with more actuators could be used to more faithfully approximate the depthcorrection term given by Eq. (1). One difficulty with this is that the dense-actuator devicestypically can deform by at most a few wavelengths. To get around this difficulty, a microscopewith two DMs in a ‘woofer-tweeter’ configuration could be designed using one large-throwactuator mirror and one dense-actuator low-throw mirror or liquid crystal device (Wright etal., 2006). Another possibility is to design a DM specifically to focus with a shape given by
Kner et al. Page 9
J Microsc. Author manuscript; available in PMC 2010 July 6.
NIH
-PA Author Manuscript
NIH
-PA Author Manuscript
NIH
-PA Author Manuscript
Eq. (2). This DM could be designed to have only one or at most a few actuators to control theshape and would not have the problems with print-through from a grid of actuators, allowingit to be smaller and faster as well. Lastly, the ultimate goal of applying adaptive optics inmicroscopy is to correct all aberrations including those introduced by the refractive indexvariations of the sample itself. Thus, inserting additional DMs conjugate to several planes inthe sample itself for correcting sample-induced variations over the field of view, as simulatedtheoretically (Kam et al., 2007), is an important future goal.
AcknowledgmentsWe thank Kaveh Ashrafi, Xeuying Wang, Yuri Strukov, Pete Carlton and Hesper Rego for help in preparing biologicalsamples. ZK is the Israel Pollak Professor of Biophysics. This work was supported by NIH Grants GM25101 (JWS)and GM31627 (DAA), the National Science Foundation through the Center for Biophotonics Science and Technologyunder Cooperative Agreement No. PHY 0120999, and by the Keck Laboratory for Advanced Microscopy. We thankSteve Lane at the Center for Biophotonics Science and Technology and members of the National Science FoundationScience and Technology Center for Adaptive Optics at the University of California at Santa Cruz for helpfuldiscussions.
ReferencesBooth MJ. Wavefront sensorless adaptive optics for large aberrations. Opt. Lett 2007;32:5–7. [PubMed:
17167565]Booth MJ, Neil MAA, Wilson T. Aberration correction for confocal imaging in refractive-index-
mismatched media. J. Microsc 1998;192:90–98.Booth MJ, Neil MA, Juskaitis R, Wilson T. Adaptive aberration correction in a confocal microscope.
Proc. Natl. Acad. Sci. USA 2002;99:5788–5792. [PubMed: 11959908]Botcherby EJ, Juskaitis R, Booth MJ, Wilson T. Aberrationfree optical refocusing in high numerical
aperture microscopy. Opt. Lett 2007;32:2007–2009. [PubMed: 17632625]Choi W, Fang-Yen C, Badizadegan K, Oh S, Lue N, Dasari RR, Feld MS. Tomographic phase
microscopy. Nat. Methods 2007;4:717–719. [PubMed: 17694065]Débarre D, Botcherby EJ, Booth MJ, Wilson T. Adaptive optics for structured illumination microscopy.
Opt. Exp 2008;16:9290–9305.Gavel, D. Suppressing anomalous localized waffle behavior in least squares wavefront reconstructors;
Proceedings of SPIE; Waikoloa, HI, USA: SPIE; 2003.Gibson SF, Lanni F. Experimental test of an analytical model of aberration in an oil-immersion objective
lens used in three-dimensional light microscopy. J. Opt. Soc. Am. A 1991;8:1601–1613.Gu, M. Advanced Optical Imaging Theory. Berlin: Springer Verlag; 1999.Gustafsson MG. Surpassing the lateral resolution limit by a factor of two using structured illumination
microscopy. J. Microsc 2000;198:82–87. [PubMed: 10810003]Hanser BM, Gustafsson MG, Agard DA, Sedat JW. Phase-retrieved pupil functions in wide-field
fluorescence microscopy. J. Microsc 2004;216:32–48. [PubMed: 15369481]Hardy, JW. Adaptive Optics for Astronomical Telescopes. New York: Oxford University Press; 1998.Henikoff S, Ahmad K, Platero JS, van Steensel B. Heterochromatic deposition of centromeric histone
H3-like proteins. Proc. Natl. Acad. Sci. USA 2000;97:716–721. [PubMed: 10639145]Hiraoka Y, Sedat JW, Agard DA. Determination of three-dimensional imaging properties of a light
microscope system. Partial confocal behavior in epifluorescence microscopy. Biophys. J1990;57:325–333. [PubMed: 2317554]
Hom EF, Marchis F, Lee TK, Haase S, Agard DA, Sedat JW. AIDA: an adaptive image deconvolutionalgorithm with application to multi-frame and three-dimensional data. J. Opt. Soc. Am. A. Opt. ImageSci. Vis 2007;24:1580–1600. [PubMed: 17491626]
Juskaitis, R. Characterizing high numerical aperture microscope objective lenses. In: Torok, P.; Kao, F-J., editors. Optical Imaging and Microscopy: Techniques and Advanced Systems. Berlin: SpringerVerlag; 2007.
Kner et al. Page 10
J Microsc. Author manuscript; available in PMC 2010 July 6.
NIH
-PA Author Manuscript
NIH
-PA Author Manuscript
NIH
-PA Author Manuscript
Kam Z, Hanser B, Gustafsson MG, Agard DA, Sedat JW. Computational adaptive optics for live three-dimensional biological imaging. Proc. Natl. Acad. Sci. USA 2001;98:3790–3795. [PubMed:11274396]
Kam Z, Kner P, Agard D, Sedat JW. Modelling the application of adaptive optics to wide-field microscopelive imaging. J. Microsc 2007;226:33–42. [PubMed: 17381707]
Marsh PN, Burns D, Girkin J. Practical implementation of adaptive optics in multiphoton microscopy.Opt. Exp 2003;11:1123–1130.
Murray JM, Appleton PL, Swedlow JR, Waters JC. Evaluating performance in three-dimensionalfluorescence microscopy. J. Microsc 2007;228:390–405. [PubMed: 18045334]
Newman, AA. Glycerol. Cleveland, Ohio: C.R.C. Press; 1968.Poland SP, Wright AJ, Girkin JM. Active focus locking in an optically sectioning microscope utilizing
a deformable membrane mirror. Opt. Lett 2008;33:419–421. [PubMed: 18311278]Potsaid B, Bellouard Y, Wen JT. Adaptive scanning optical microscope (ASOM): a multidisciplinary
optical microscope design for large field of view and high resolution imaging. Opt. Exp 2005;13(18):6504–6518.
Rueckel M, Mack-Bucher JA, Denk W. Adaptive wavefront correction in two-photon microscopy usingcoherence-gated wavefront sensing. Proc. Natl. Acad. Sci. USA 2006;103:17137–17142. [PubMed:17088565]
Schwertner M, MJB, Neil MAA, Wilson T. Measurement of specimen-induced aberrations of biologicalsamples using phase stepping interferometry. J. Microsc 2004;213:11–19. [PubMed: 14678508]
Shaevitz JW, Fletcher DA. Enhanced three-dimensional deconvolution microscopy using a measureddepth-varying point-spread function. J. Opt. Soc. Am. A. Opt. Image Sci. Vis 2007;24:2622–2627.[PubMed: 17767232]
Shaner NC, Steinbach PA, Tsien RY. A guide to choosing fluorescent proteins. Nat. Meth 2005;2:905–909.
Sherman L, Ye JY, Albert O, Norris TB. Adaptive correction of depth-induced aberrations in multiphotonscanning microscopy using a deformable mirror. J. Microsc 2002;206:65–71. [PubMed: 12000564]
Staudt T, Lang MC, Medda R, Engelhardt J, Hell SW. 2,2′-thiodiethanol: a new water soluble mountingmedium for high resolution optical microscopy. Microsc. Res. Tech 2007;70:1–9. [PubMed:17131355]
Swedlow, JR.; Sedat, JW.; Agard, DA. Deconvolution in Optical Microscopy. In: Jansson, PA., editor.Deconvolution of Images and Spectra. 2nd edn.. San Diego, California: Academic Press, Inc.; 1997.
Tsai PS, Migliori B, Campbell K, Kim TN, Kam Z, Groisman A, Kleinfeld D. Spherical aberrationcorrection in nonlinear microscopy and optical ablation using a transparent deformable membrane.Appl. Phys. Lett 2007;91:191102–191103.
Wolff, T. Histological techniques for the drosophila eye. Part I: larva and pupa. In: Sullivan, W.;Ashburner, M.; Hawley, RS., editors. Drosophila Protocols. 1st edn. New York: Cold Spring HarborLaboratory Press; 2000.
Wright AJ, Patterson BA, Poland SP, Girkin JM, Gibson GM, Padgett MJ. Dynamic closed-loop systemfor focus tracking using a spatial light modulator and a deformable membrane mirror. Opt. Exp2006;14:222–228.
Wright AJ, Poland SP, Girkin JM, Freudiger CW, Evans CL, Xie XS. Adaptive optics for enhanced signalin CARS microscopy. Opt. Exp 2007;15:18209–18219.
Wyckoff JB, Wang Y, Lin EY, et al. Direct visualization of macrophage-assisted tumor cell intravasationin mammary tumors. Cancer Res 2007;67:2649–2656. [PubMed: 17363585]
Kner et al. Page 11
J Microsc. Author manuscript; available in PMC 2010 July 6.
NIH
-PA Author Manuscript
NIH
-PA Author Manuscript
NIH
-PA Author Manuscript

Fig. 1.Ray diagram of the depth aberration. (a) Diagrams the path length difference (n2q-n1q’)between an unrefracted ray (dashed line) from a point a depth d below the cover slip and a raythat is refracted at the interface (solid line). Compensating for this path length difference in theback pupil plane will correct the spherical aberration. (b) Shows the path length difference(n2q-n1q’) between a ray from a point just below the cover slip (dashed line) and a ray a depthd below the interface. Compensating for this path length difference in the back pupil plane willfocus to a depth d and correct for spherical aberration.
Kner et al. Page 12
J Microsc. Author manuscript; available in PMC 2010 July 6.
NIH
-PA Author Manuscript
NIH
-PA Author Manuscript
NIH
-PA Author Manuscript

Fig. 2.Microscope layout. Grey represents the emission path. The blue striped beam is the excitationlight and the red striped beam is the reference beam. See text for details.
Kner et al. Page 13
J Microsc. Author manuscript; available in PMC 2010 July 6.
NIH
-PA Author Manuscript
NIH
-PA Author Manuscript
NIH
-PA Author Manuscript
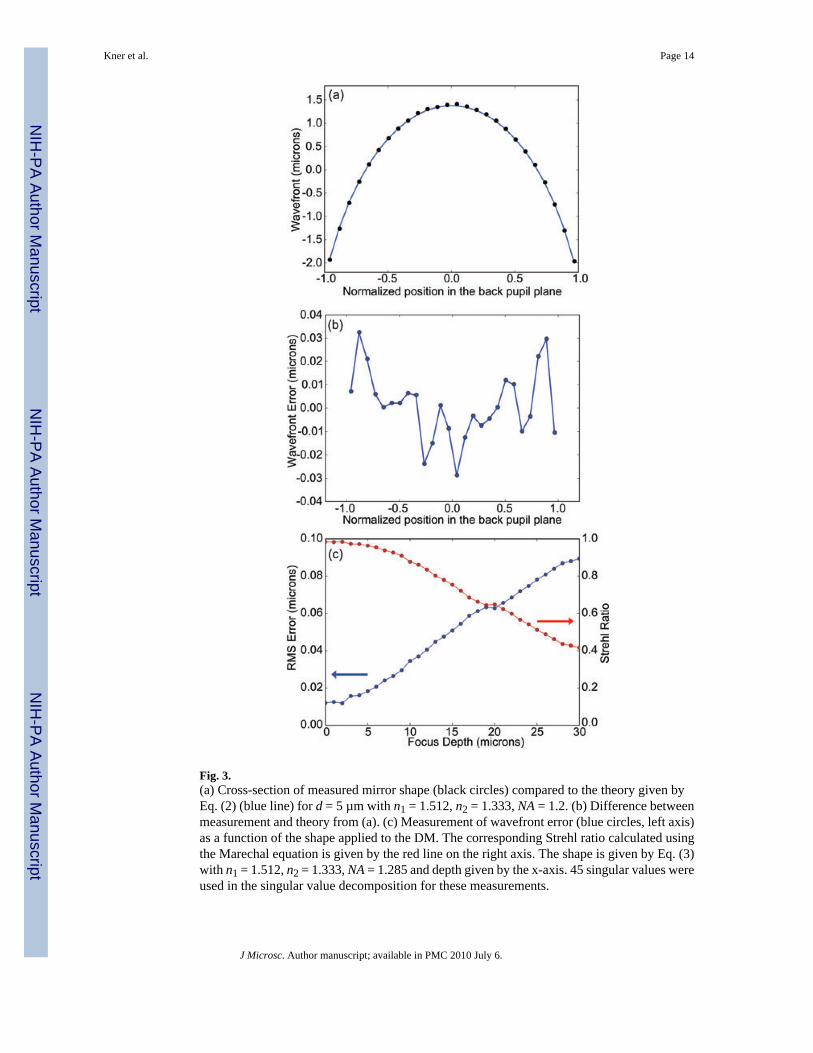
Fig. 3.(a) Cross-section of measured mirror shape (black circles) compared to the theory given byEq. (2) (blue line) for d = 5 µm with n1 = 1.512, n2 = 1.333, NA = 1.2. (b) Difference betweenmeasurement and theory from (a). (c) Measurement of wavefront error (blue circles, left axis)as a function of the shape applied to the DM. The corresponding Strehl ratio calculated usingthe Marechal equation is given by the red line on the right axis. The shape is given by Eq. (3)with n1 = 1.512, n2 = 1.333, NA = 1.285 and depth given by the x-axis. 45 singular values wereused in the singular value decomposition for these measurements.
Kner et al. Page 14
J Microsc. Author manuscript; available in PMC 2010 July 6.
NIH
-PA Author Manuscript
NIH
-PA Author Manuscript
NIH
-PA Author Manuscript
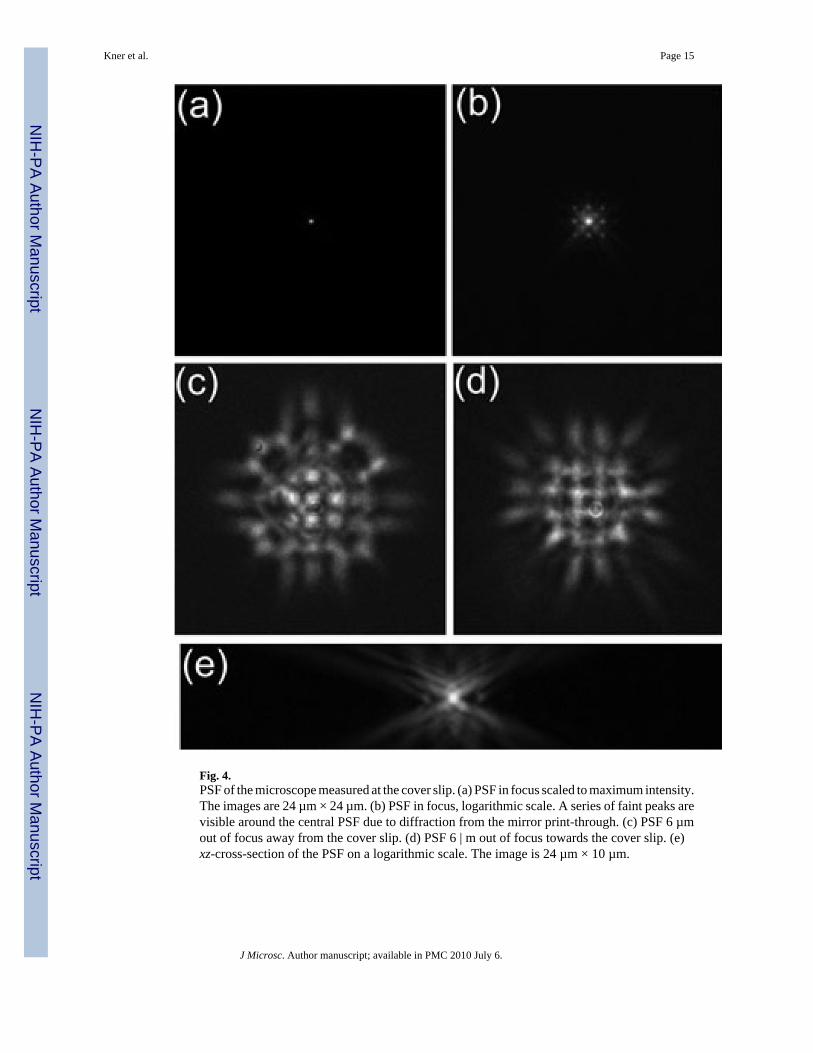
Fig. 4.PSF of the microscope measured at the cover slip. (a) PSF in focus scaled to maximum intensity.The images are 24 µm × 24 µm. (b) PSF in focus, logarithmic scale. A series of faint peaks arevisible around the central PSF due to diffraction from the mirror print-through. (c) PSF 6 µmout of focus away from the cover slip. (d) PSF 6 | m out of focus towards the cover slip. (e)xz-cross-section of the PSF on a logarithmic scale. The image is 24 µm × 10 µm.
Kner et al. Page 15
J Microsc. Author manuscript; available in PMC 2010 July 6.
NIH
-PA Author Manuscript
NIH
-PA Author Manuscript
NIH
-PA Author Manuscript

Fig. 5.Back pupil plane calculated by phase retrieval from the three-dimensional image of a 200 nmbead at the cover slip. Amplitude (left) and phase scaled from −π/2 to π/2 radians (right). TheDM print through is clearly visible. 20 of the actuators are at the edge of the mirror and thereforedo not produce a print-through bump.
Kner et al. Page 16
J Microsc. Author manuscript; available in PMC 2010 July 6.
NIH
-PA Author Manuscript
NIH
-PA Author Manuscript
NIH
-PA Author Manuscript

Fig. 6.Images of a 200 nm bead 67 µm below the cover slip in a water/glycerol mixture with n = 1.42.(a) Uncorrected image of in-focus plane. (b) Corrected image of in-focus plane: same scale as(a). (c) and (d) are the same as (a) and (b), respectively, but on a logarithmic scale. (e) and (f)are cross-sections through the focal plane on a linear scale. The scale bars are 1 µm. (g) and(h) are line profiles through of the intensity through the centre of the bead along a lateral andthe longitudinal axis, respectively. The dashed line is from the uncorrected image and the solidline is from the corrected image. (i) and (j) are simulations of the PSF. (i) corresponds to theuncorrected PSF 65 µm into a material with index 1.42 using a 1.2NA objective with a 1.512
Kner et al. Page 17
J Microsc. Author manuscript; available in PMC 2010 July 6.
NIH
-PA Author Manuscript
NIH
-PA Author Manuscript
NIH
-PA Author Manuscript

refractive index immersion oil. (j) is a simulated PSF at the cover slip. The peak intensity for(j) is 3.75 times the peak intensity for (i).
Kner et al. Page 18
J Microsc. Author manuscript; available in PMC 2010 July 6.
NIH
-PA Author Manuscript
NIH
-PA Author Manuscript
NIH
-PA Author Manuscript
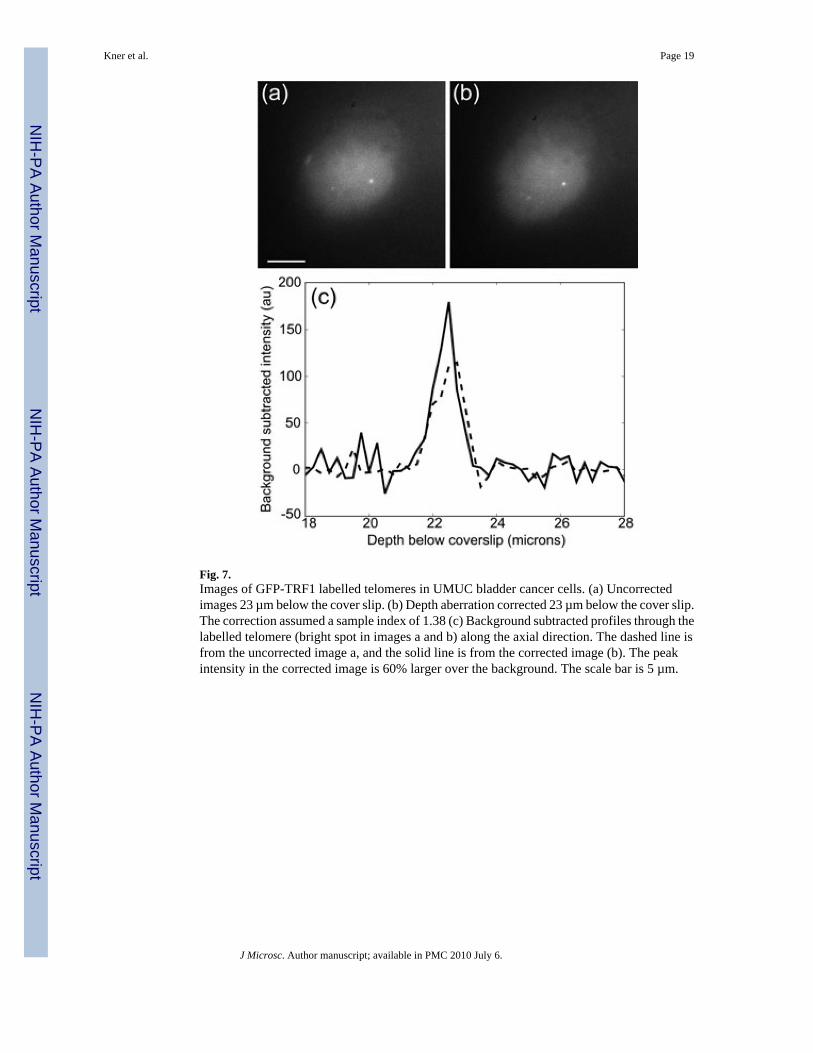
Fig. 7.Images of GFP-TRF1 labelled telomeres in UMUC bladder cancer cells. (a) Uncorrectedimages 23 µm below the cover slip. (b) Depth aberration corrected 23 µm below the cover slip.The correction assumed a sample index of 1.38 (c) Background subtracted profiles through thelabelled telomere (bright spot in images a and b) along the axial direction. The dashed line isfrom the uncorrected image a, and the solid line is from the corrected image (b). The peakintensity in the corrected image is 60% larger over the background. The scale bar is 5 µm.
Kner et al. Page 19
J Microsc. Author manuscript; available in PMC 2010 July 6.
NIH
-PA Author Manuscript
NIH
-PA Author Manuscript
NIH
-PA Author Manuscript
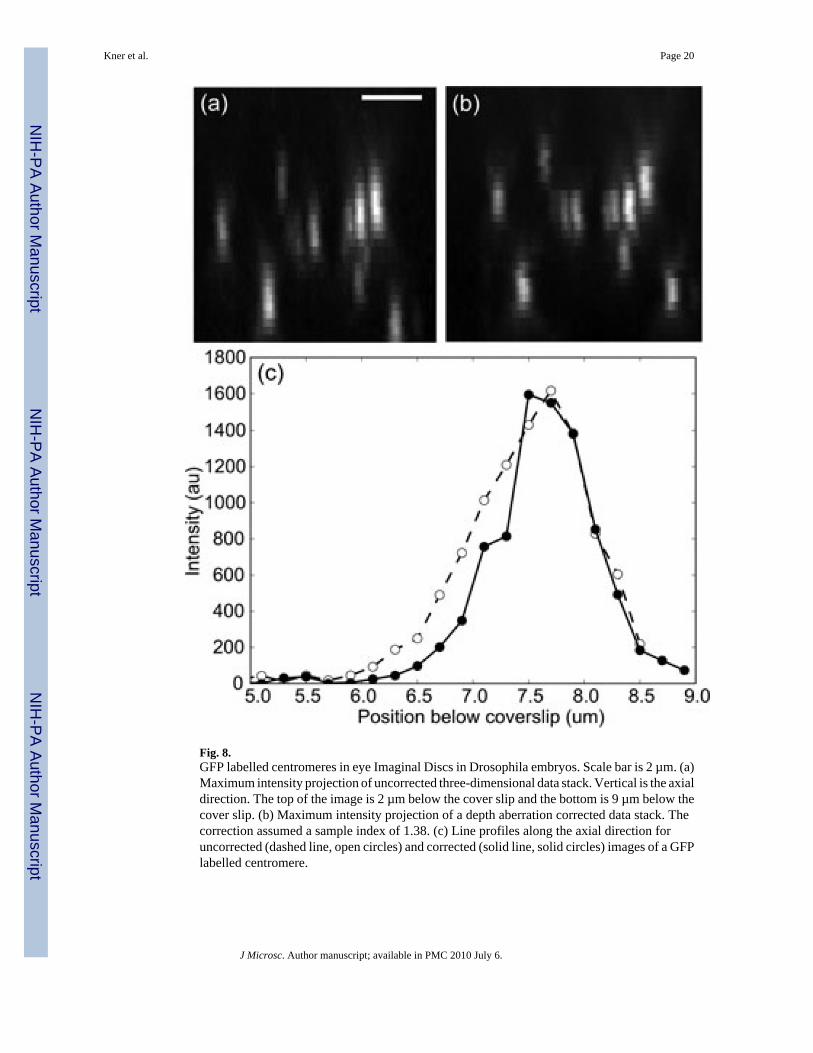
Fig. 8.GFP labelled centromeres in eye Imaginal Discs in Drosophila embryos. Scale bar is 2 µm. (a)Maximum intensity projection of uncorrected three-dimensional data stack. Vertical is the axialdirection. The top of the image is 2 µm below the cover slip and the bottom is 9 µm below thecover slip. (b) Maximum intensity projection of a depth aberration corrected data stack. Thecorrection assumed a sample index of 1.38. (c) Line profiles along the axial direction foruncorrected (dashed line, open circles) and corrected (solid line, solid circles) images of a GFPlabelled centromere.
Kner et al. Page 20
J Microsc. Author manuscript; available in PMC 2010 July 6.
NIH
-PA Author Manuscript
NIH
-PA Author Manuscript
NIH
-PA Author Manuscript

Fig. 9.Deconvolved images of alexa488-phalloidin labelled B16F10 mouse cells. Images are 4.4 µmbelow the cover slip. (a) Uncorrected image. (b) Uncorrected deconvolved image (c) imagecorrected by adaptive optics. The correction assumed a refractive index of 1.38 (d) imagecorrected by adaptive optics after deconvolution. The scale bar is 5 µm.
Kner et al. Page 21
J Microsc. Author manuscript; available in PMC 2010 July 6.
NIH
-PA Author Manuscript
NIH
-PA Author Manuscript
NIH
-PA Author Manuscript

Fig. 10.Maximum intensity projections of three-dimensional data stacks of 200 nm beads in agarose.The vertical direction is the axial direction and the total height of each image represents 22.5µm. The width of each image is 34 µm. The arrows point to the position of the cover slip.Image (a) was taken using the piezo for focusing. Image (b) was taken using the DM to focus.The DM shape was set by Eq. (2) using a sample refractive index of 1.34. (c) Shows close-ups,(i) and (ii), of the bead indicated by the red arrows in (a) and (b). The images are 1.6 µm × 8µm (16 × 16 pixels) cross-sections in the xz-plane, scaled to maximum intensity.
Kner et al. Page 22
J Microsc. Author manuscript; available in PMC 2010 July 6.
NIH
-PA Author Manuscript
NIH
-PA Author Manuscript
NIH
-PA Author Manuscript

Fig. 11.Comparison of images taken by focusing with the DM (a) and mechanical focusing (b). Imagesare of C. elegans expressing a GFP sur-5 construct; the bright feature along the right side isthe ventral nerve cord. The top images are taken 6 µm below the cover slip and the bottomimages are xz-cross-sections. The difference in image intensity is due to photobleaching. Eachimage is scaled to its maximum intensity. A sample refractive index of 1.36 was assumed forfocusing with the DM using Eq. (2). The scale bar is 2 µm.
Kner et al. Page 23
J Microsc. Author manuscript; available in PMC 2010 July 6.
NIH
-PA Author Manuscript
NIH
-PA Author Manuscript
NIH
-PA Author Manuscript