High-resolution multi-projector display walls and applications
7
High-resolution multi-projector display walls and applications Daniel R. Schikore Richard A. Fischer Randall Frank Ross Gaunt John Hobson Brad Whitlock Lawrence Livermore National Laboratory Recent advances in scientific simulation are rapidly leading to the generation of multi-terabyte sized datasets of unprecedented spatial and temporal resolution. The interactive visualization resources these datasets demand overwhelm the display capabilities of the typical desktop system, both in terms of raw graphics processing power and display resolution. The Accelerated Strategic Computing Initiative (ASCI) Program of the United States Department of Energy (DOE) is building a comprehensive environment for performing scientific simulation, visualization and analysis of such datasets 1 . As part of this environment, we are building visualization hardware and software systems with the capability to display up to fifteen times the number of pixels in a typical desktop display. The scientific simulations of interest at Lawrence Livermore National Laboratory (LLNL) have many different mesh type and computational zone characteristics, but share the same basic visualization problem. It is no longer possible to visualize the entire dataset at full resolution on typical desktop displays. The largest simulation performed to date is a turbulence calculation with a regular grid resolution of 2048x2048x1920, for a total of over 8 billion computational zones per timestep 2 . For visualization purposes, a single variable quantized to 8-bit resolution was saved at 274 timesteps, for a total of 2TB of time-varying visualization data. In the context of post-processing and analysis for terascale scientific simulations, display wall capabilities are desirable for several reasons. First and foremost, dataset resolution now exceeds that of any individual display device. Additional considerations include increased performance from multiple graphics cards and the physical size of the display, which is useful for presentation and collaboration in addition to enhancing the sense of immersion. For these reasons, we have pursued and deployed high-resolution tiled displays in conference rooms and offices at LLNL. The current visualization environment at LLNL centers around a pair of SGI Onyx2 visualization servers with several terabytes of Fiber Channel disk storage. The larger system is a 64 processor (R12000) machine with 16 Infinite Reality (IR) pipes. We currently use this system to drive a 15-projector display wall (see Figure 1) two 2x2 tiled flat-panel displays deployed in user offices, and classical desktop displays in several offices. Multi-pipe display systems A variety of multi-pipe multi-screen display systems have been introduced in recent years, initially in academic institutions and eventually as commercial products. The typical display includes multiple projectors situated for front or rear projection onto a screen. Screen geometry can be flat, curved, or surround, while the materials have included solid single piece walls, flexible screens and tiled panels, both opaque and transparent. Individual decisions are typically made to satisfy floor space, graphics hardware, interaction, and expense constraints. A number of high-level frameworks have been designed to facilitate the development of applications for display walls and similar display devices. Some of these frameworks are focused on virtual reality applications 345 , while others focus on the high- resolution display aspects of multi-pipe systems 678 . Figure 1: This conference room display wall consists of 15 rear-projected 1280x1024 panels.
Transcript of High-resolution multi-projector display walls and applications

High-resolution multi-projector display walls and applications
Daniel R. Schikore Richard A. Fischer Randall Frank Ross Gaunt John Hobson Brad Whitlock
Lawrence Livermore National Laboratory
Recent advances in scientific simulation are rapidly leading to the generation of multi-terabyte sized datasets of unprecedented spatial and temporal resolution. The interactive visualization resources these datasets demand overwhelm the display capabilities of the typical desktop system, both in terms of raw graphics processing power and display resolution. The Accelerated Strategic Computing Initiative (ASCI) Program of the United States Department of Energy (DOE) is building a comprehensive environment for performing scientific simulation, visualization and analysis of such datasets1. As part of this environment, we are building visualization hardware and software systems with the capability to display up to fifteen times the number of pixels in a typical desktop display. The scientific simulations of interest at Lawrence Livermore National Laboratory (LLNL) have many different mesh type and computational zone characteristics, but share the same basic visualization problem. It is no longer possible to visualize the entire dataset at full resolution on typical desktop displays. The largest simulation performed to date is a turbulence calculation with a regular grid resolution of 2048x2048x1920, for a total of over 8 billion computational zones per timestep2. For visualization purposes, a single variable quantized to 8-bit resolution was saved at 274 timesteps, for a total of 2TB of time-varying visualization data. In the context of post-processing and analysis for terascale scientific simulations, display wall capabilities are desirable for several reasons. First and foremost, dataset resolution now exceeds that of any individual display device. Additional considerations include increased performance from multiple graphics cards and the physical size of the display, which is useful for presentation and collaboration in addition to enhancing the sense of immersion. For these reasons, we have pursued and deployed high-resolution tiled displays in conference rooms and offices at LLNL.
The current visualization environment at LLNL centers around a pair of SGI Onyx2 visualization servers with several terabytes of Fiber Channel disk storage. The larger system is a 64 processor (R12000) machine with 16 Infinite Reality (IR) pipes. We currently use this system to drive a 15-projector display wall (see Figure 1) two 2x2 tiled flat-panel
displays deployed in user offices, and classical desktop displays in several offices.
Multi-pipe display systems A variety of multi-pipe multi-screen display systems have been introduced in recent years, initially in academic institutions and eventually as commercial products. The typical display includes multiple projectors situated for front or rear projection onto a screen. Screen geometry can be flat, curved, or surround, while the materials have included solid single piece walls, flexible screens and tiled panels, both opaque and transparent. Individual decisions are typically made to satisfy floor space, graphics hardware, interaction, and expense constraints. A number of high-level frameworks have been designed to facilitate the development of applications for display walls and similar display devices. Some of these frameworks are focused on virtual reality applications345, while others focus on the high-resolution display aspects of multi-pipe systems678.
Figure 1: This conference room display wall consists of 15 rear-projected 1280x1024 panels.
Toolkits such as IRIS Performer9 deliver an entire infrastructure for scene description and rendering for multi-pipe environments, while lower level libraries such as the Multi-Pipe Utilities (MPU)10 are designed as thin layers of abstraction which give more control to the programmer. In this paper we describe our experience in building tools for large display walls for scientific analysis and visualization. Our goal was to achieve high-performance rendering on large multi-pipe display systems, both for new applications and existing single-pipe applications. Our approach is similar to other multi-pipe systems, with a bias against placing restrictions on data formats and locality, a key feature for applications that handle terascale data. We will describe our hardware system design, low-level software library, and experiences with several applications that use the library for multi-pipe rendering. System design The 15 projectors of the display wall are arranged in a 5x3 array, producing a display of 6400x3072 pixels across a 16'x8' rear projection screen. A key goal of the display was to edge-match each projected image to its neighbor without overlap or separation lines. To maximize the number of pixels displayed, image blending across the display was deemed undesirable because blending would sacrifice a large percent of pixels, especially around the four edges of each center row image. Achieving edge-matched alignment of all 15 images is not practical with the use of traditional 3-gun CRT projectors. CRT projector convergence drifts over time and important areas such as the corners are the most troublesome to converge. We opted for single lens LCD-based projectors that maintain convergence for the life of the projector. Electrohome DLV-1280 projectors were selected for their high-resolution, high lumen output, color-balancing features, and for the key ability to finely adjust the lens position horizontally and vertically without moving the projector body. The lens adjustment controls physically move the lens, providing a more exact pixel alignment than electronic whole-pixel image positioning (although the DLV-1280 supports electronic positioning as well). Color-balancing all 15 projectors has proven to be a difficult task. The DLV-1280 allows for adjusting the red, green, and blue levels at six points along the gamma curve, resulting in 270 color settings for the entire wall display. Each projector varies slightly in color output, but the color output of Xenon lamps vary greatly between bulbs and drifts over time. A well color-balanced display will drift out of balance in just a few weeks of use. We are developing a
computer assisted color balancing system in which the output from a color analyzer is fed into a portable computer, compared to a standard setting, and used to adjust each projector's color through a serial input. We have also built and deployed tiled, high-resolution flat panel displays in offices. The displays consist of four LCD panels, arranged 2x2, closely spaced together in a single enclosure. The glass in the panels are butted together, bringing the distance between viewable pixels of neighboring panels to approximately 3/8”. Our current tiled office display brings over 5 million pixels to the user office in a 29” x 33” unit that mounts on the wall. Users can take advantage of this extra viewing space as extended console space or as a 2560x2048 mini display wall. From a software standpoint there is no fundamental difference between display walls of projectors or tiled flat panels. Low level library: VDL To make it easy for the application developer to support the wall and possible to achieve scalable rendering performance, we developed a low-level interface library, referred to as the Virtual Display Library (VDL). VDL provides a simple application interface for threaded, multi-pipe rendering that provides hooks for realizing application-specific data and geometry culling techniques. Our initial goals for this library include: • Provide a high level of abstraction so little effort
is required to modify an existing application to use a display wall.
• Allow access to lower levels of abstraction so that the programmer may optimize primitive submission for performance.
• Allow flexible and easy configuration for multiple, varied hardware configurations.
• Avoid imposing restrictions on application event handling.
• Avoid imposing restrictions on application data models and access patterns.
• Provide tiled offscreen rendering capabilities for generation of high-resolution movies or printing.
• Perform in a scalable manner. The layered architecture of the library is driven by the hardware used in constructing the display wall. At the lowest level are the projectors, or the physical displays. At the next level are the IR pipes, referred to as logical displays, which drive one or more physical displays. At the highest level of abstraction, there can be one or more virtual displays that represent a single high-resolution display system. A rectangular display region on the virtual display is referred to as a canvas, which is made up of multiple

tiles, one for each graphics pipe. An example display wall configuration is given in Figure 2. The library provides basic display management services for applications. VDL handles the creation and management of windows on multiple graphics pipes, creates and manages threads that render in parallel to the windows, performs view matrix transformations to provide a high-level abstraction to the application, and synchronizes the double buffering of multiple windows. VDL can also perform these operations for abstract devices, simplifying the creation of high-resolution movies through offscreen rendering and tiling. Because VDL is a low-level library, it is particularly important that the library not impose undue overhead on the application, limiting scalability. One measure of this overhead was taken from an in-house OpenGL performance analysis tool. The benchmark code displays a mesh consisting of over 318,000 triangles with an average strip length of 20. Each triangle is assigned a different color. Shown in Figure 3 are measurements of the frame rate of the original OpenGL benchmark for comparison with a version that has been modified for use with VDL. The modified version uses the high-level abstractions of VDL, performing no optimizations such as frustum culling for the individual tiles. Tests were performed using both immediate mode rendering and display lists. In order to isolate performance of the library from the fill-rate of the graphics pipes, the first three tests were performed with an increasing number of pipes managing a constant size VDL canvas of 984x984 pixels. As shown in the figure, there was a small performance drop for a single pipe due to the added function call overhead of the VDL interface. When scaled to two or four pipes, performance with display lists was better than for the single pipe application while the immediate mode tests showed signs of scalability limitations. In the last column, a four pipe test was performed, drawing to four times the number of pixels with negligible performance
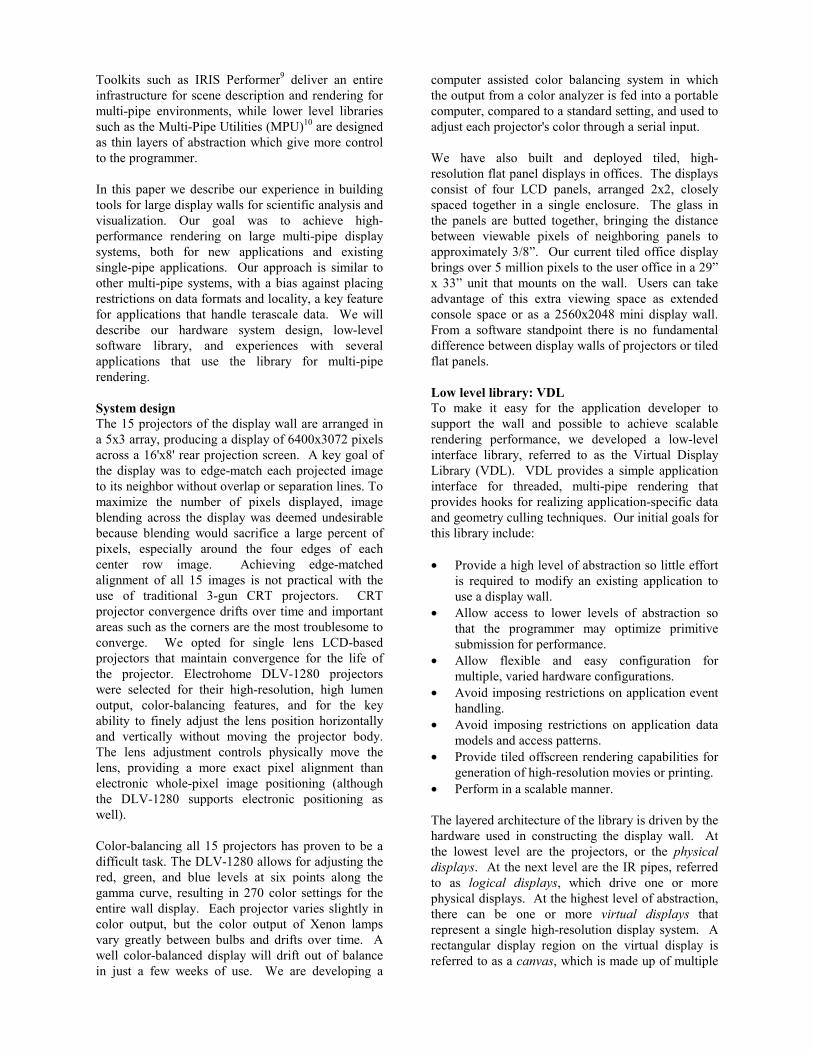
drop, indicating only that this benchmark was not fill-limited. Surface optimization The initial benchmark demonstrated that operating at the highest level of abstraction does not impose a performance penalty. However, it does not aggregate the capabilities of the multiple graphics pipes that make up the display wall. Taking the viewing frustum of each graphics pipe into account, it is possible to cull a conservative subset of the triangles that are not visible on an individual pipe, reducing both the amount of data and processing (transform, clipping, and rasterization) on each pipe. To make frustum culling more effective, a test surface was decomposed using regular spatial bins (see Figure 4). Scaling results for two large surfaces are presented in Figures 5 and 6. Results in Figure 5 are for an isosurface of approximately 2M triangles rendered on 1-4 pipes. Results for the partitioned triangle meshes are
(a) (b) (c) Figure 2: Layers of abstraction in describing high-resolution display walls. (a) a display wall made up of 4 projectors (physical displays). (b) Two logical displays correspond to two graphics pipes (c) On the full virtual display, a single canvas has been created, which is realized through the creation of two tiles.
VDL Performance Scalability
0
5
10
15
20
25
(a) (b) (c) (d) (e)Configuration
Fram
es/s
ec
Immediate ModeDisplay List
Figure 3: Performance tests for the high-level VDL abstract layers. (a) original benchmark application at 984x984 (b) 1-pipe VDL application (c) 2-pipe VDL with same window size (d) 4-pipe VDL with same window size (e) 4-pipe VDL at 1968x1968
Figure 4: Decomposition of an isosurface into 25 bins

compared with the performance achieved without partitioning. Two tests are performed for each configuration of the pipes. In the 1-pipe test, only one of the n pipes is actually utilized. Because our surfaces are roughly evenly distributed between the graphics pipes this is a test of the efficiency and overhead of the culling approach which gives an upper bound for the second test, the n-pipe test. In this test all n pipes are utilized, measuring the actual parallel rendering performance of the display wall system. The pixel resolution of the images was held constant at 1020x1020 in order to eliminate pixel fill-rate influences on performance. Results in Figure 6 are for a larger surface of 8M triangles, also rendered on 1-4 pipes. The first observation from the results is that overall performance degrades as pipes are added to the display wall if the surface is not segmented. This is similar to the immediate mode benchmark presented in the previous section. When the surface is segmented into clusters, performance improves as more pipes are added to the display wall because the load on each pipe is reduced. We are currently using axis-aligned bounding boxes to determine whether a particular cluster is potentially visible on a given pipe. Note that as the number of clusters is increased, performance is further improved. Initial results have been promising, and we hope to further improve results through the use of data-dependent clustering and improved bounding regions. Applications: Movie player A necessary, fundamental capability for large display walls is the ability to display precomputed animations at interactive frame rates. Despite the simplicity of the problem description, the data demands for large display walls (6400x3072 resolution) are daunting. The software design must balance disk storage, I/O bandwidth, graphics bandwidth, and processing
requirements to provide predictable and accurate frame rates. A static segmentation of the animation is not acceptable because of our desire to support dynamic pan and zoom capability for large movie frames across the entire display. In order to reduce the storage and I/O demands, we have incorporated both standard and customized movie file formats with a variety of compression techniques. Both I/O and decompression are performed in parallel for increased image streaming performance. The movie player is object-oriented in design, using C++ to isolate the thread management and synchronization logic in a base class. Extensions to this base class define the method for reading a frame from the animation, allowing for support of multiple formats. VDL is leveraged for the flexible display configurations and threaded display to multiple pipes. The first challenge is in getting frames from disk into memory as quickly as possible. We use a collection of k worker threads, with thread i responsible for frames i, 2i, ..., ni. Each thread maintains a local cache of three frames, allowing for efficient streaming in both forward and reverse directions. For common movie formats such as MPEG and QuickTime we utilize standard libraries to read frames from disk. This leads to a trade-off between a
Surface Rendering Performance (2M tri)
0123456789
1 2 4Number of Pipes
M tr
i/sec
1x1 1 tile1x1 n tile5x5 1 tile5x5 n tile7x7 1 tile7x7 n tile
Figure 5: Performance tests for an isosurface consisting of 2M triangles. The surface was subdivided into 25 and 49 clusters for improved culling performance.
Surface Rendering Performance (8M tri)
0123456789
10
1 2 4Number of Pipes
M tr
i/sec
7x7 1 tile7x7 n tile11x11 1 tile11x11 n tile
Figure 6: Performance tests for an isosurface consisting of 8M triangles. The surface was subdivided into 49 and 121 clusters for improved culling performance.
Window 0 Window 1 Window 2 t0 t1 t2 t3 t4 t0 t1 t2 t3 t4 t0 t1 Figure 7: Animations are formatted for high-performance I/O by aggregating consecutive frames into "windows". If the individual frames are compressed, a collection of threads performs decompression in parallel to achieve high framerates. Note that parallel I/O is achieved by setting the number of threads to be greater than the window size.

large number of threads for parallel decompression and a small number of I/O requests to avoid thrashing of the disk. To address this issue, we have developed a simple storage format that reduces the number of I/O requests by reading multiple compressed frames at a time. Shown in Figure 7 is an example scenario with five decompression threads and a window length of four. The first thread to make a request for a frame in a particular window will perform a read for the entire window of compressed frames. Additional threads requiring access to the same window will block until the read is completed, after which all threads will proceed to decompress the frames in parallel. This approach has proven effective for improving scalability to larger image resolutions while maintaining high frame-rates. Performance of the I/O and decompression infrastructure is presented in Figure 8. A movie was generated at a resolution of 2560x2048 pixels and filtered to create a smaller version at 1280x1024 pixels. The frames are compressed with a variant of RLE encoding and stored on a Fiber Channel disk array. Tests were performed with a varying number of worker threads for decompression. In each test case there were three I/O windows which each held eight frames of the animation. These results demonstrate scalability for streaming of high-resolution animations on a large SMP system. Once frames are decompressed in memory, the second bandwidth-limited operation is to send the appropriate pixels to each graphics pipe. We have experimented with both pixel transfer and texture
load operations for moving images to a graphics pipe, with similar results in each case. Culling is equally critical for 2D images as it was shown to be for 3D surfaces. When performing a texture load or image blit for a particular graphics pipe, the first step is to determine the smallest set of pixels that are required
to correctly render the given view. Depending on the interpolation used, this region may extend slightly outside the viewing frustum. Given this image size, a texture of the next highest power-of-two resolution is defined. Through the use of sub-image loading, a minimal amount of data is sent to each graphics pipe. With the interactive pan and zoom capability of the player, this tiling is performed dynamically for each frame of the animation. Applications: MeshTV One goal of VDL was to provide a means for existing console applications to use the display wall. MeshTV is a scalable parallel visualization tool developed at LLNL11. There were three tasks involved in enhancing MeshTV to render on the display wall. First it was necessary to revise MeshTV's underlying graphics library to support the VDL Interface requirements. Next we added controls to the MeshTV engine and implemented a new control window in the graphical user interface (GUI), allowing users to dynamically position graphics windows over the display wall. Finally, we modified the parallel version of MeshTV, which uses massively parallel software rendering techniques, to leverage VDL for hardware-accelerated parallel rendering. The bulk of the work in the first task involved ensuring thread safety in the graphics MeshTV driver interface, as required for parallel rendering by VDL. A VDL-specific device driver was derived from the existing OpenGL driver to utilize the VDL viewing transform and viewport manipulation functions. The second task involved adding display wall awareness to MeshTV. The first part of this phase required modification to the MeshTV engine to route rendering commands targeting a visualization window to a display wall. This change allowed any action performed in a visualization window to echo to a
Figure 9: Graphical drag-n-drop user interface for controlling layout of the display wall. The user controls the layout of the display wall from a traditional console display.
Movie I/O and Decompression Performance
020406080
100120
1 2 4 8 16Number of threads
Fram
es/s
ec
1280x1024
2560x2048
Figure 8: Streaming performance for compressed movies stored on disk. At larger resolutions the system bandwidth limits scalability.

display wall. In addition, new commands were implemented, allowing users to control how MeshTV utilizes a display wall. A control window for the display wall was added to the GUI, allowing users to specify the number of visualizations to appear on the display wall and how they are arranged. A layout editor splits the wall into smaller areas, allowing multiple visualization windows to be shown simultaneously on the same display wall. The control window allows users to intuitively map visualization windows via the Motif drag-and-drop mechanism (See Figure 9). The third development task involved modifying the parallel version of MeshTV to use a display wall. Parallel MeshTV works by splitting parts of a problem among separate processes in a distributed memory environment. Each process creates its own part of the problem geometry and uses software rendering to generate an image. The images from each process are composited into a single image via the message passing interface (MPI) library and displayed in a visualization window by the master process. This sort-last approach to parallel rendering was not able to exploit the multiple graphics engines of the display wall, which are a natural candidate for a sort-first rendering approach. To counter this, a distributed parallel graphics driver was developed. This driver transforms geometry from each distributed process into a display list representation that is communicated to the master process using MPI. This parallel graphics driver collects and buffers opcodes and data that represent the OpenGL functions that would have been generated by each process. The driver interprets the collective opcode/data stream and executes the appropriate OpenGL functions in multiple VDL rendering threads. Processing time is decreased because the geometry is created in parallel and offers opportunities to cull the data stream to individual tiles in parallel, potentially reducing the number of primitives submitted to each graphics context. Future Directions We continue to work in a number of areas to expand and improve on our present capabilities. A major effort is underway to incorporate view-dependent visual hierarchies into our scalable graphics system. This is a critical effort as the dataset sizes continue to increase and the current level of interaction is insufficient for head tracked immersive displays. With our recent addition of a FakeSpace VersaBench passive stereo display system, we have been considering how to leverage our existing VDL tools in the immersive space. High level interfaces to devices such as gloves and wands are planned for the interactive layers. We are actively pursuing natural gestural interaction interfaces, leveraging techniques
from computer vision, optimization and natural language research. As the performance of personal computer (PC) graphics cards improve, we will be considering driving these visualization displays from clusters of coupled PCs. We hope to leverage such scalable clusters to drive these displays at even higher rates, potentially by tiling to an even greater extent and utilizing a balance of sort-first and sort-last techniques. Finally, we must address the issue of remote visualization. The technology is rapidly reaching the point where it is feasible to place large numbers of LCD flat panel displays in a single office. This office could be across campus or across the country. Issues of graphics resource allocation, utilization and image/data transport play a key role in our deploying these tools into the hands of end users. The advent of digital video and new real-time compressed digital image transport over gigabit Ethernet will open the door to a number of new forms of office visualization delivery. Conclusions The use of large- and small-scale tiled displays is required to meet the demands of the current tera-scale visualization community. The LLNL efforts in this space have lead to the creation of one of the largest interactive tiled displays built to date and a number of new efforts for "personal" tiled displays. We have outlined the system implemented at LLNL for the creation and support of large tiled, multi-pipe graphics displays. The system is based around a simple, portable, parallel API for tiling OpenGL commands in parallel to multiple contexts on a set of X servers. This API has allowed us to retrofit existing visualization and analysis codes to support these displays with very little effort. We have successfully demonstrated the use of this system to provide scalable visualization of polygonal surfaces and movies. While this work represents a first step toward the ultimate goal of scalable visualization in individual office spaces, the result has been the creation of useful new visualization workspaces and tools for our users. Acknowledgments We would like to thank to a number of people who contributed to this project, including Sean Ahern, Eric Brugger, Mark Duchaineau, Dieter Fuss, Steve Louis, Kim Minuzzo, Lisa Roberts, Becky Springmeyer, Sam Uselton and Dave Wiltzius at LLNL, and Tom Ruwart and Paul Woodward of the University of Minnesota. This work was performed at Lawrence Livermore National Laboratory (LLNL) under contract W-7405-ENG-48 for the U.S. Department of Energy (DOE). It was supported in part by the Accelerated Strategic Computing Initiative and the Visual Interactive

Environment for Weapons Simulations (VIEWS) program. Readers may contact Schikore at Computational Engineering, International, 600 Airport Blvd, Suite 500 Morrisville, NC 27560, e-mail [email protected]. Contact Frank at Lawrence Livermore National Lab, P.O. Box 808, L-561, Livermore, CA 94550, e-mail [email protected]. 1 Heerman, Philip D., "First-Generation ASCI Production Visualization Environment," IEEE Computer Graphics & Applications, Vol. 19, No. 5, 1999, pp. 66-71. 2 Mirin, A. A., "Performance of Large-Scale Scientific Applications on the IBM ASCI Blue-Pacific System," Ninth SIAM Conference of Parallel Processing for Scientific Computing, March 24-27, 1999. 3 C. Cruz-Neira, D. J. Sandin, and T. A. DeFanti, "Surround-screen Projection-based Virtual Reality: The Design and Implementation of the CAVE," ACM Siggraph 1993, pp. 135-142. 4 C. Just, A. Bierbaum, A. Baker, and C. Cruz-Neira, "VRJuggler: A Framework for Virtual Reality Development," Immersive Projection Technology Workshop, March 1998. 5 Fakespace Systems, "VLIB: API and Software Tools for Fakespace Devices and Display Systems," February 1999. 6 G. Humphreys and P. Hanrahan, "A Distributed Graphics System for Large Tiled Displays," IEEE Visualization 1999, pp. XX-YY. 7 R. Samanta, J. Zheng, T. Funkhouser, K. Li, and J. P. Singh, "Load Balancing for Multi-Projector Rendering Systems," Siggraph/Eurographics Workshop on Graphics Hardware, August 1999. 8 University of Minnesota, "The Powerwall," http://www.lcse.umn.edu/research/powerwall/powerwall.html 9 J. Rohlf and J. Helman, "IRIS Performer: A High Performance Multiprocessing Toolkit for Real-Time 3D Graphics," ACM SIGGRAPH 1994, pp. 381-395. 10 Silicon Graphics, "Multipipe Utility: MPU," http://www.devprg.sgi.de/devtools/tools/MPU 11 Lawrence Livermore National Laboratory, MeshTV: Scientific Visualization and Analysis Software, http://www.llnl.gov/meshtv/
Daniel R. Schikore is a Senior Developer at Computational Engineering International (CEI). He received his PhD from Purdue University in 1997. His interests include feature extraction, surface extraction, multi-resolution data structures and algorithms, and rendering. He is a member of IEEE and ACM.
Richard A. Fischer
Randall Frank is a computer scientist at Lawrence Livermore National Laboratory working on the Visual Environment for Weapons Simulation Visualization project. He has received BS (1988) and MS (1996) degrees in Biomedical Engineering
from the University of Iowa. His interests include scientific visualization, rendering and medical imaging. He is a member of IEEE and ACM.
Ross Gaunt is a computer scientist at Lawrence Livermore National Laboratory working in the Visual Environment for Weapons Simulation Visualization project. He has a BS in computer science and mathematics. His interests include visualization, digital and analog video.
John Hobson is a computer scientist at Lawrence Livermore National Laboratory working in the Visual Environment for Weapons Simulation Visualization Project. He received a B.A. in mathematics from UC Santa Barbara and an M.A. in mathematics from UC Berkeley. His interests include object oriented software design, computer graphics, and visualization.
Brad Whitlock is a computer scientist at Lawrence Livermore National Laboratory working in the Visual Environment for Weapons Simulation Visualization project. He has a BS in computer science from California State University, Sacramento. His interests include visualization, parallel programming, and graphical user interface design.