High Prevalence and Fast Rising Incidence of Multiple Sclerosis in Caltanissetta, Sicily, Southern...
22
Original Paper Neuro Neuroepidemiology 2007;28:28-32 Published online: December 8, 2006 DO I : 10.1159/000097853 High Prevalence and Fast Rising Incidence of Multiple Sclerosis in Caltanissetta, Sicily, Southern Italy Luigi M.E. Grimaldi a Barbara Palmeri b Giuseppe Salemi b Giuseppe Gigliab Marco D'Amelio b Roberto Grimaldi a Gaetano Vitello a Paolo Ragoneseb Giovanni Savettierib a Unita Operativa di Neurologia, Fondazione Istituto San Raffaele G. Giglio, Cefalu, e b Dipartimento di Neuroscienze Cliniche, Palermo, Italia Key Words Multiple sclerosis incidence • Prevalence, Sicily Abstract Background: Epidemiological studies conducted in Sicily and Sardinia, the two major Mediterranean islands, showed elevated incidence and prevalence of multiple sclerosis (MS) and a recent increase in disease frequency. Objective: To confirm the central highlands of Sicily as areas of increasing MS prevalence and elevated incidence, we performed a fol- low-up study based on the town of Caltanissetta (Sicily), southern Italy. Methods: We made a formal diagnostic reap- praisal of all living patients found in the previous study per- formed in 1981. All possible information sources were used to search for patients affected by MS diagnosed according to the Poser criteria. We calculated prevalence ratios, for pa- tients affected by MS who were living and resident in the study area on December 31, 2002. Crude and age- and sex- specific incidence ratios were computed for the period from January 1, 1993, to December 31, 2002. Results: The preva- lence of definite MS rose in 20 years from 69.2 (retrospective prevalence rate) to 165.8/100,000 population. We calculated the incidence of definite MS for the period 1970-2000. These rates calculated for 5-year periods increased from 2.3 to 9.2/100,000/year. Conclusion: This survey shows the highest prevalence and incidence figures of MS in the Mediterra- nean area and confirms central Sicily as a very-high-risk area for MS. Copyright © 2007 S. Karger AG, Basel Introduction Epidemiological studies conducted in Sicily and Sar- dinia, the two major Mediterranean islands, have consis- tently shown elevated incidence and prevalence of mul- tiple sclerosis (MS) and a recent increase in disease fre- quency [1-3]. The prevalence ofMS reaches 151.9/100,000 in rural areas of central Sardinia [4], and 120.2/100,000 in the central and hilly Sicilian town of Enna [1]. The most recent incidence rates range from 5.7 (Sicily) to 6.4/100,000/year (Sardinia) [1, 3]. The first survey of MS prevalence performed 21 years ago in Caltanissetta, a town located 35 km east of Enna, unexpectedly demonstrated a high prevalence [5]. To confirm the central highlands of Sicily as areas of elevat- ed MS prevalence and in which the incidence may be in- creasing, we performed a follow-up study in Caltanis- setta. KAKG E R © 2007 S. Karger AG, Basel 0251-5350/07/0281-0028$23.50/0 Pax +41 61 306 12 34 H; Mail [email protected] Accessible online at: www.karger.com www.karger.com/ned Giovanni Savettieri, MD Department of Clinical Neurosciences, University of Palermo Via G. I.a Loggia, I 11-90129 Palermo (Italy) Tel. +39 091 655 5146, Fax +39 091 655 5147, E-Mail [email protected]
-
Upload
independent -
Category
Documents
-
view
4 -
download
0
Transcript of High Prevalence and Fast Rising Incidence of Multiple Sclerosis in Caltanissetta, Sicily, Southern...
Original Paper
NeuroNeuroepidemiology 2007;28:28-32 Published online: December 8, 2006
DO I : 10.1159/000097853
High Prevalence and Fast RisingIncidence of Multiple Sclerosis inCaltanissetta, Sicily, Southern Italy
Luigi M.E. Grimaldi a Barbara Palmeri b Giuseppe Salemi b Giuseppe Gigliab
Marco D'Amelio b Roberto Grimaldi a Gaetano Vitello a Paolo Ragoneseb
Giovanni Savettierib
a Unita Operativa di Neurologia, Fondazione Istituto San Raffaele G. Giglio, Cefalu, eb Dipartimento di Neuroscienze Cliniche, Palermo, Italia
Key WordsMultiple sclerosis incidence • Prevalence, Sicily
AbstractBackground: Epidemiological studies conducted in Sicily
and Sardinia, the two major Mediterranean islands, showed
elevated incidence and prevalence of multiple sclerosis (MS)
and a recent increase in disease frequency. Objective: Toconfirm the central highlands of Sicily as areas of increasing
MS prevalence and elevated incidence, we performed a fol-
low-up study based on the town of Caltanissetta (Sicily),southern Italy. Methods: We made a formal diagnostic reap-
praisal of all living patients found in the previous study per-
formed in 1981. All possible information sources were used
to search for patients affected by MS diagnosed according
to the Poser criteria. We calculated prevalence ratios, for pa-
tients affected by MS who were living and resident in the
study area on December 31, 2002. Crude and age- and sex-
specific incidence ratios were computed for the period from
January 1, 1993, to December 31, 2002. Results: The preva-
lence of definite MS rose in 20 years from 69.2 (retrospective
prevalence rate) to 165.8/100,000 population. We calculated
the incidence of definite MS for the period 1970-2000. These
rates calculated for 5-year periods increased from 2.3 to
9.2/100,000/year. Conclusion: This survey shows the highest
prevalence and incidence figures of MS in the Mediterra-nean area and confirms central Sicily as a very-high-risk area
for MS. Copyright © 2007 S. Karger AG, Basel
Introduction
Epidemiological studies conducted in Sicily and Sar-dinia, the two major Mediterranean islands, have consis-tently shown elevated incidence and prevalence of mul-tiple sclerosis (MS) and a recent increase in disease fre-quency [1-3]. The prevalence ofMS reaches 151.9/100,000in rural areas of central Sardinia [4], and 120.2/100,000in the central and hilly Sicilian town of Enna [1]. Themost recent incidence rates range from 5.7 (Sicily) to6.4/100,000/year (Sardinia) [1, 3].
The first survey of MS prevalence performed 21 yearsago in Caltanissetta, a town located 35 km east of Enna,unexpectedly demonstrated a high prevalence [5]. Toconfirm the central highlands of Sicily as areas of elevat-ed MS prevalence and in which the incidence may be in-creasing, we performed a follow-up study in Caltanis-setta.
KAKG E R © 2007 S. Karger AG, Basel0251-5350/07/0281-0028$23.50/0
Pax +41 61 306 12 34H; Mail [email protected] Accessible online at:www.karger.com www.karger.com/ned
Giovanni Savettieri, MDDepartment of Clinical Neurosciences, University of PalermoVia G. I.a Loggia, I11-90129 Palermo (Italy)Tel. +39 091 655 5146, Fax +39 091 655 5147, E-Mail [email protected]
Materials and Methods
Area of InvestigationThe city of Caltanissetta is located in central Sicily, at approx-
imately 567 in above sea level. The population size on December31, 2002, was 60,919 inhabitants compared to 60,713 inhabitantson December 31, 1981 (prevalence day of the previous study), in-dicating a stability of the population of this community in the last20 years.
The level of public medical care is relatively high in Caltanis-setta where a community-based department of neuroscience anda general hospital with a neurology unit have worked in conjunc-tion until recently.
Case Collection and AscertainmentWe used the previous prevalence study as the foundation for
the present survey. We made a formal diagnostic reappraisal of allsurviving patients from the 1981 prevalence study and of all pa-tients traced during the present survey. Personal contacts wereundertaken with all general practitioners and neurologists work-ing in the study area. The local branch of the Italian MS Associa-tion (AISM) was also involved in the study. Archives of the De-partment of Neuroscience of the `Azienda Unita Sanitaria Locale'No. 2, of the Neurological Unit of the Caltanissetta Hospital, ofthe Department of Neurology of the University of Palermo and oftwo major Italian MS centers (Gallarate and Milano San Raffaele)were searched. The retrospective prevalence for the 1981 serieswas estimated including patients who had had onset of MS beforethe prevalence day but were diagnosed subsequently (onset-ad-justed prevalence rate) [6]. Patients were classified according tothe criteria of Poser et al. [7] .
As onset of the disease was considered the year of appearanceof the first symptom or symptoms attributable to MS.
Data AnalysisTo calculate prevalence rates, we searched for patients affected
by MS resident in the study area on December 31, 2002. Crude aswell as age- and sex-specific prevalence ratios were calculated.Clinical features were also recorded. Crude and age- and sex-spe-cific incidence ratios, based on the reported first symptom of MS,were computed for the period from January 1, 1993, to December31, 2002.
Results
On December 31, 2002, 101 clinically definite MS pa-tients (31 men, 70 women) were resident in the study area.Thirteen of them were the survivors of the 31 subjectswith definite MS identified in the 1981 survey. Fifteen ofthe 31 were deceased and 3 were untraceable.
Eleven patients identified during the current surveyhad MS onset before January 1, 1981, but, at that time,they were not found and, as a consequence, had not beenincluded in the previous study.
The mean age at onset was 30.75 years (range 12-55),28.74 for men and 31.64 for women. The mean age on
the prevalence day was 43.22 years (range 15-74), 39.03for men and 45.07 for women. The mean interval be-tween onset of the disease and diagnosis was 4.63 years(range 1-31) for the whole cohort; it was higher in wom-en (5.34 years) than in men (2.96 years). The averageduration of MS from onset to prevalence day was 12.13years (range 1-38), 10.03 for men and 13.08 for women.Indeed the longest intervals between onset and diagno-sis have influenced these data. This is true for those pa-tients whose onset happened before 1981, but who werediagnosed after the first survey. The mean age at onsetof patients whose disease started after 1981 was 32.9years (30.2 in men, 34.2 in women). In this cohort themean age at diagnosis was 35.8 years (32.6 in men, 37.3in women) and the mean interval between onset and di-agnosis was 2.6 years (2.3 in men, 2.8 in women).
The overall prevalence was 165.8/100,000 population(95% confidence interval = 158.5-173.1), 107.6 for menand 218.0 for women. The age-specific prevalence wasfound to increase up to the age group of 35-44 years andto decrease thereafter (table 1). Seventy-seven (74.7%) pa-tients had a relapsing-remitting form of MS; 16 (15.5%)were affected by a secondary progressive form, 9 by a pri-mary progressive form (8.8 %), and 1 (1%) was affected bya primary progressive form with relapses. As shown intable 2, the retrospective prevalence rate for the 1981 sur-vey was 69.2/100,000 population.
Between January 1, 1993, and December 31, 2002, 56subjects (19 men and 37 women) had their first symp-toms of MS. The average annual incidence was9.2/100,000 population (95% confidence interval = 8.4-10.0), 6.6 for men and 11.5 for women. Age- and sex-spe-cific incidence rates of MS in Caltanissetta are shown intable 3.
The highest age-specific incidence rate was observedin the age group of 25-34 years for men and 35-44 yearsfor women. The mean interval between the onset and thediagnosis of the disease among incident patients was 1.8years.
Discussion
In this survey we found a prevalence of 165.8/100,000and an incidence rate of 9.2/100,000 population. Thesefigures (a 2.4 -fold increase in prevalence and an almost2 -fold increase in incidence across 2 decades) are thehighest found in the Mediterranean area including Sar-dinia and confirm the extremely high frequency of MS inSicily especially in the innermost part of the island. The
Epidemiology of Multiple Sclerosis in Neuroepidemiology 2007;28:28-32 29Sicily
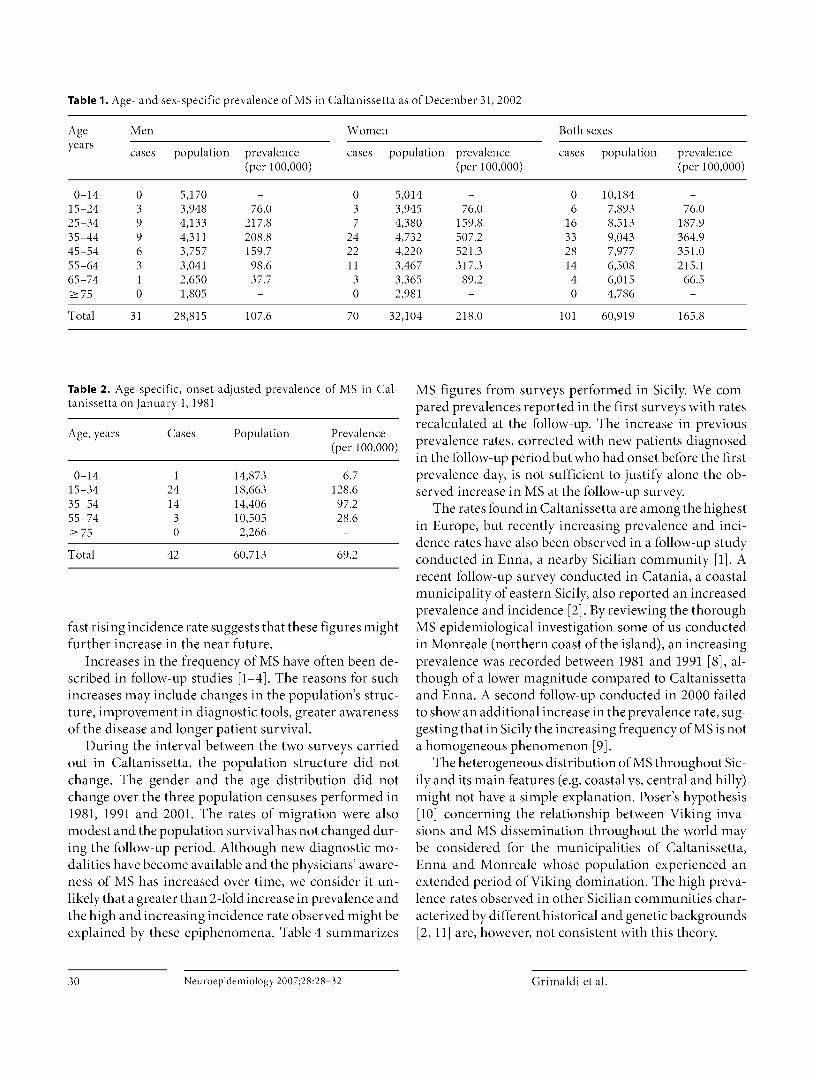
Table 1. Age- and sex-specific prevalence of MS in Caltanissetta as of December 31, 2002
Ageyears
Men
cases population prevalence(per 100,000)
Women
cases population prevalence(per 100,000)
Both sexes
cases population prevalence(per 100,000)
0-14 0 5,170 - 0 5,014 - 0 10,184 -15-24 3 3,948 76.0 3 3,945 76.0 6 7,893 76.025-34 9 4,133 217.8 7 4,380 159.8 16 8,513 187.935-44 9 4,311 208.8 24 4,732 507.2 33 9,043 364.945-54 6 3,757 159.7 22 4,220 521.3 28 7,977 351.055-64 3 3,041 98.6 11 3,467 317.3 14 6,508 215.165-74 1 2,650 37.7 3 3,365 89.2 4 6,015 66.5>_ 75 0 1,805 - 0 2,981 - 0 4,786 -
Total 31 28,815 107.6 70 32,104 218.0 101 60,919 165.8
Table 2. Age-specific, onset-adjusted prevalence of MS in Caltanissetta on January 1, 1981
Age, years Cases Population Prevalence(per 100,000)
0-14 1 14,873 6.715-34 24 18,663 128.635-54 14 14,406 97.255-74 3 10,505 28.6>_75 0 2,266 -
Total 42 60,713 69.2
fast rising incidence rate suggests that these figures mightfurther increase in the near future.
Increases in the frequency of MS have often been de-scribed in follow-up studies [1-4]. The reasons for suchincreases may include changes in the population's struc-ture, improvement in diagnostic tools, greater awarenessof the disease and longer patient survival.
During the interval between the two surveys carriedout in Caltanissetta, the population structure did notchange. The gender and the age distribution did notchange over the three population censuses performed in1981, 1991 and 2001. The rates of migration were alsomodest and the population survival has not changed dur-ing the follow-up period. Although new diagnostic mo-dalities have become available and the physicians' aware-ness of MS has increased over time, we consider it un-likely that a greater than 2 -fold increase in prevalence andthe high and increasing incidence rate observed might beexplained by these epiphenomena. Table 4 summarizes
MS figures from surveys performed in Sicily. We com-pared prevalences reported in the first surveys with ratesrecalculated at the follow-up. The increase in previousprevalence rates, corrected with new patients diagnosedin the follow-up period but who had onset before the firstprevalence day, is not sufficient to justify alone the ob-served increase in MS at the follow-up survey.
The rates found in Caltanissetta are among the highestin Europe, but recently increasing prevalence and inci-dence rates have also been observed in a follow-up studyconducted in Enna, a nearby Sicilian community [1]. Arecent follow-up survey conducted in Catania, a coastalmunicipality of eastern Sicily, also reported an increasedprevalence and incidence [2] . By reviewing the thoroughMS epidemiological investigation some of us conductedin Monreale (northern coast of the island), an increasingprevalence was recorded between 1981 and 1991 [8], al-though of a lower magnitude compared to Caltanissettaand Enna. A second follow-up conducted in 2000 failedto show an additional increase in the prevalence rate, sug-gesting that in Sicily the increasing frequency of MS is nota homogeneous phenomenon [9].
The heterogeneous distribution of MS throughout Sic-ily and its main features (e.g. coastal vs. central and hilly)might not have a simple explanation. Poser's hypothesis[10] concerning the relationship between Viking inva-sions and MS dissemination throughout the world maybe considered for the municipalities of Caltanissetta,Enna and Monreale whose population experienced anextended period of Viking domination. The high preva-lence rates observed in other Sicilian communities char-acterized by different historical and genetic backgrounds[2, 11] are, however, not consistent with this theory.
30 Neuroepidemiology 2007;28:28-32 Grimaldi et al.
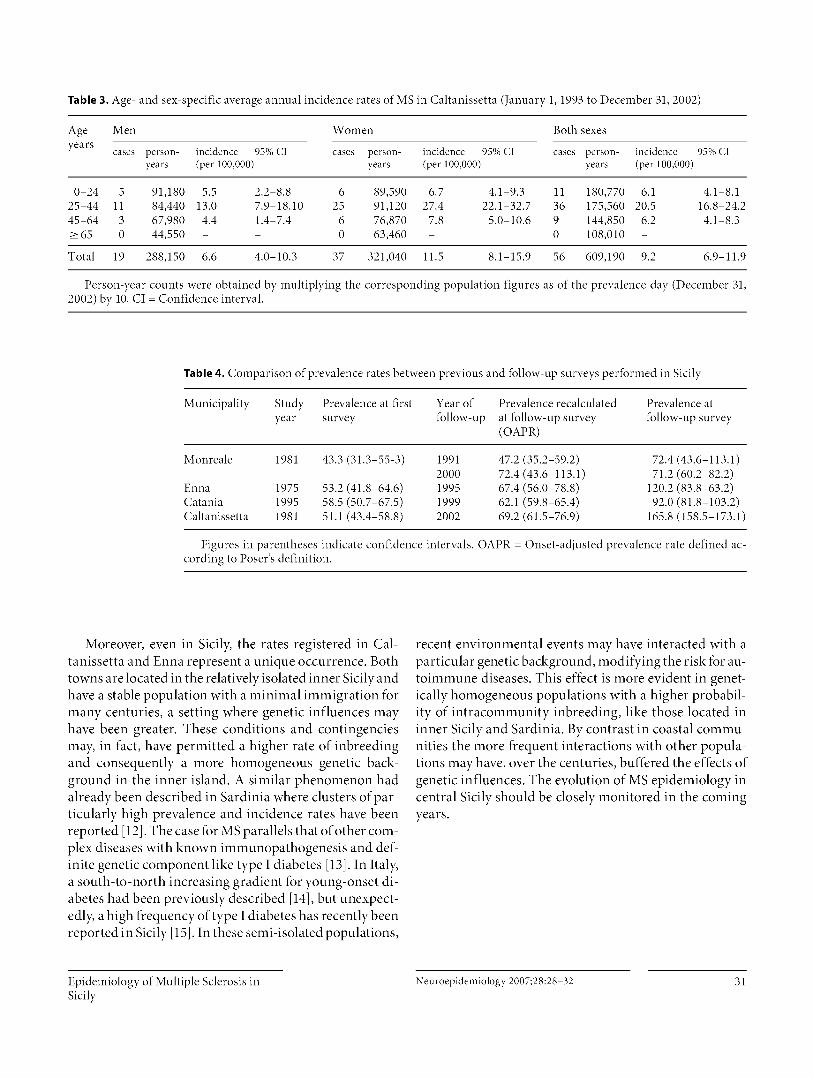
Table 3. Age- and sex-specific average annual incidence rates of MS in Caltanissetta (January 1, 1993 to December 31, 2002)
Age Men Women Both sexesyears
cases person- incidence 95% CI cases person- incidence 95% CI cases person- incidence 95% CIyears (per 100,000) years (per 100,000) years (per 100,000)
0-24 5 91,180 5.5 2.2-8.8 6 89,590 6.7 4.1-9.3 11 180,770 6.1 4.1-8.125-44 11 84,440 13.0 7.9-18.10 25 91,120 27.4 22.1-32.7 36 175,560 20.5 16.8-24.245-64 3 67,980 4.4 1.4-7.4 6 76,870 7.8 5.0-10.6 9 144,850 6.2 4.1-8.3>_65 0 44,550 - - 0 63,460 - 0 108,010 -
Total 19 288,150 6.6 4.0-10.3 37 321,040 11.5 8.1-15.9 56 609,190 9.2 6.9-11.9
Person-year counts were obtained by multiplying the corresponding population figures as of the prevalence day (December 31,2002) by 10. CI = Confidence interval.
Table 4. Comparison of prevalence rates between previous and follow-up surveys performed in Sicily
Municipality Studyyear
Prevalence at firstsurvey
Year offollow-up
Prevalence recalculatedat follow-up survey( OAPR)
Prevalence atfollow-up survey
Monreale 1981 43.3 (31.3-55-3) 1991 47.2 (35.2-59.2) 72.4 (43.6-113.1)2000 72.4 (43.6-113.1) 71.2 (60.2-82.2)
Enna 1975 53.2 (41.8-64.6) 1995 67.4 (56.0-78.8) 120.2 (83.8-63.2)Catania 1995 58.5 (50.7-67.5) 1999 62.1 (59.8-65.4) 92.0 (81.8-103.2)Caltanissetta 1981 51.1 (43.4-58.8) 2002 69.2 (61.5-76.9) 165.8 (158.5-173.1)
Figures in parentheses indicate confidence intervals. OAPR = Onset-adjusted prevalence rate defined ac-cording to Poser's definition.
Moreover, even in Sicily, the rates registered in Cal-tanissetta and Enna represent a unique occurrence. Bothtowns are located in the relatively isolated inner Sicily andhave a stable population with a minimal immigration formany centuries, a setting where genetic influences mayhave been greater. These conditions and contingenciesmay, in fact, have permitted a higher rate of inbreedingand consequently a more homogeneous genetic back-ground in the inner island. A similar phenomenon hadalready been described in Sardinia where clusters of par-ticularly high prevalence and incidence rates have beenreported [12] . The case for MS parallels that of other com-plex diseases with known immunopathogenesis and def-inite genetic component like type I diabetes [13]. In Italy,a south-to-north increasing gradient for young-onset di-abetes had been previously described [14] , but unexpect-edly, a high frequency of type I diabetes has recently beenreported in Sicily [15]. In these semi-isolated populations,
recent environmental events may have interacted with aparticular genetic background, modifying the risk for au-toimmune diseases. This effect is more evident in genet-ically homogeneous populations with a higher probabil-ity of intracommunity inbreeding, like those located ininner Sicily and Sardinia. By contrast in coastal commu-nities the more frequent interactions with other popula-tions may have, over the centuries, buffered the effects ofgenetic influences. The evolution of MS epidemiology incentral Sicily should be closely monitored in the comingyears.
Epidemiology of Multiple Sclerosis in Neuroepidemiology 2007;28:28-32 31Sicily
References
I Grimaldi LME, Salemi G, Grimaldi G, Rizzo
A, Marziolo R, Lo Presti C, Maimone D, Sa-vettieri G: High incidence and increasingprevalence of MS in Enna (Sicily), southern
Italy 2001. Neurology 2001;57:189.2 Nicoletti A, Patti F, Lo Fermo S, Corbello V,
Reggio F, Maimone D, Zappia M, Reggio A:Possible increasing risk of multiple sclerosisin Catania, Sicily. Neurology 2005;65:1259-1263.
3 Pugliatti M, Ruse T, Sotgiu A, Sotgiu S, SattaWM, Mannu L, Sanna G, Rosati G: Increas-ing incidence of multiple sclerosis in theprovi lice ofSassari, northern Sardinia. Neu-roepidemiology 2005;25:129-134.
4 Granieri F, Casetta I, Govoni V, Tola MR,Marchi D, Murgia SB, Ticca A, Pugliatti M,Murgia B, Rosati G: The increasing inci-
dence and prevalence of MS in a Sardinianprovince. Neurology 2000;55:842-848.
5 Savettieri G, Elian M, Giordano D, Grimaldi
G, Ventura A, Dean G: A further study on theprevalence of multiple sclerosis in Sicily:
Caltanissetta city. Acta Neurol Scand 1986;73:71-75.
6 Poser CM, Bendikz J, Hibberd PL: The epi-
demiology of multiple sclerosis: the Icelandmodel onset adjusted prevalence rate andother methodological considerations. J Neu-rol Sci 1992;111:143-152.
7 Poser CM, Paty DW, Scheinberg L, McDon-ald WI, Davis FA, Ebers GC, Johnson KP,Sibley WA, Silberberg DH, Tourtellotte WW:New diagnostic criteria for multiple sclero-sis: guidelines for research protocols. AnnNeurol 1983;13:227-231.
8 Savettieri G, Salemi G, Ragonese P, Aridon P,Scola G, Randisi G: Prevalence and inci-dence of multiple sclerosis in Monreale city,Italy. J Neurol 1998;245:40-43.
9 Ragonese P, Salemi G, D'Amelio M, Gam-mino M, Aridon P, Savettieri G: Multiplesclerosis in southern Europe: Monreale City,Italy - A twenty-year follow-up incidenceand prevalence study. Neuroepidemiology2004;23:306-309.
10 Poser CM: The dissemination of multiplesclerosis: a Viking saga? A historical essay.All Neurol. 1994;36(suppl 2):5231-243.
11 Salemi G, Ragonese P, Aridon P, Scola G,Saporito V, Conte S, Savettieri G: Incidenceof multiple sclerosis in Bagheria City, Sicily,Italy. Neurol Sci 2000;21:361-365.
12 Pugliatti M, Sotgiu S, Rosati G: The world-wide prevalence of multiple sclerosis. ClinNeurol Neurosurg 2002;104:182-191.
13 Sotgiu S, Pugliatti M, Sanna A, Sotgiu A, Pas-
tiglia P, Solinas G, Dolei A, Serra C, SonettiB, Rosati G: Multiple sclerosis complexity inselected populations: the challenge of Sar-dinia, insular Italy. Bur J Neurol 2002;9:329-341.
14 Carle F, Gesuita R, Bruno G, Coppa GV, Fa-lorni A, Lorini R, Martinucci ME, Bozzelli P,Prisco F, Sondini MT, Cherubini V, RIDIStudy Group: Diabetes incidence in 0- to 14-year age group in Italy: a 10-year prospectivestudy. Diabetes Care 2004 27:2790-2796.
15 Arpi ML, Fichera G, Mancuso M, Lucenti C,Italia S, Tomaselli L, Motta RM, Mazza A,Vigneri R, Purrello F, Squatrito S: A ten-year(1989-1998) perspective study of the inci-dence of Type I diabetes in the district ofCatania (Sicily) in a 0-14 year age group. JEndocrinol Invest 2002;25:414-419.
32 Neuroepidemiology 2007;28:28-32 Grimaldi et al.
journal of the
NeurologicalSciences
ELSEVIER Journal of the Neurological Sciences 213 (2003) 1 —6www.elsevier.com/locate/jns
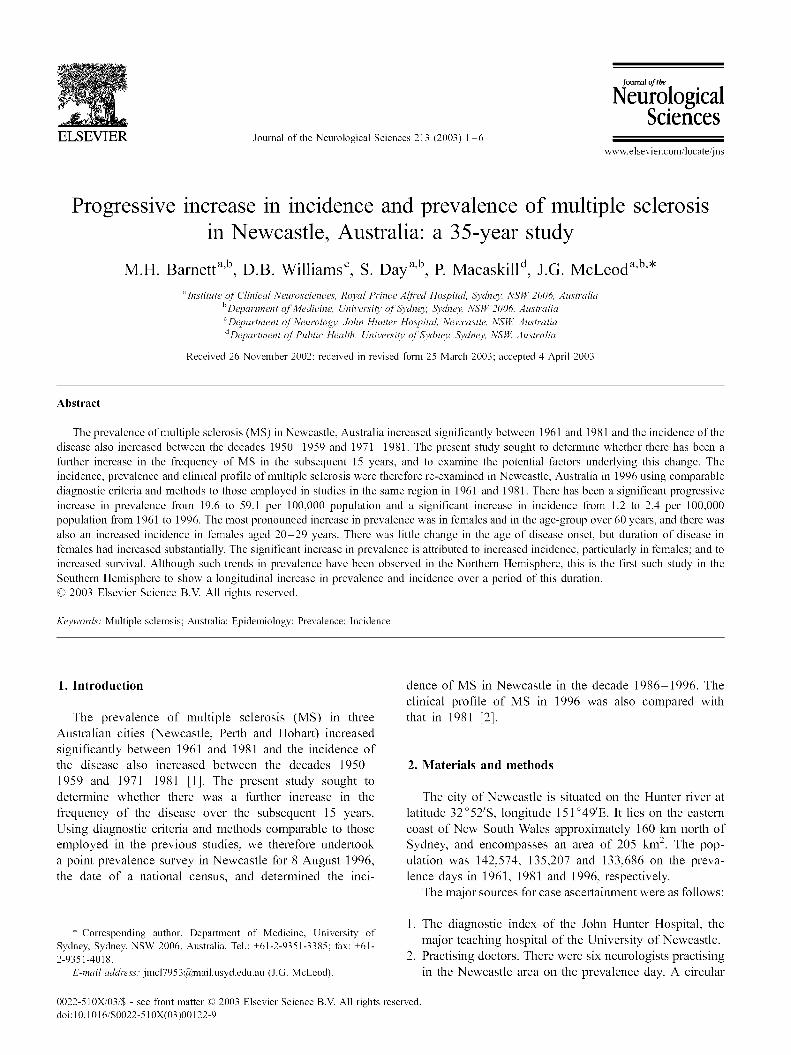
Progressive increase in incidence and prevalence of multiple sclerosisin Newcastle, Australia: a 35-year study
M.H. Barnett a 'b, D.B. Williams', S. Day a 'b , P. Macaskili d , J.G. McLeoda,b,*
"Institute of Clini al Neurosciences, Royal Prince Alfred Hospital, Sydney, NSW 2006, Australia
"Dep^irtmrnt of Medicine, University of Sydney, Sydney, NSW 2006, Australia
°Dep^u .nnrnt of Neuroloory, John Hunter Hospital, Newcastle, NSW, Australiad De • ^u .nnent of Public Heath, University of Sydney, Sydney, NSW, Australia
Received 26 November 2002; received in revised form 25 March 2003; accepted 4 April 2003
Abstract
The prevalence of multiple sclerosis (MS) in Newcas tle, Australia incre ased significantly between 1961 and 1981 and the incidence of thedisease also incre ased between the decades 1950-1959 and 1971-1981. The present study sought to determine whether there h as been afurther increase in the frequency of MS in the subsequent 15 years, and to examine the potential factors underlying this chang e. Theincidence, prevalence and clinical profile of multiple sclerosis were therefore re-examined in Newcastle, Australia in 1996 using comparablediagnostic criteria and methods to those employed in studies in the same region in 1961 and 1981. There h as been a significant progressiveincrease in prevalence from 19.6 to 59.1 per 100,000 population and a significant increase in incidence from 1.2 to 2.4 per 100,000population from 1961 to 1996. The most pronounced incre ase in prevalence w as in females and in the age-group over 60 years, and there wasalso an increased incidence in females aged 20-29 years. There was little change in the age of disease onset, but duration of dise ase infemales had increased substantially. The significant increase in prevalence is attributed to increased incidence, particularly in females; and toincreased survival. Although such trends in prevalence have been observed in the Northern Hemisphere, this is the first such study in theSouthern Hemisphere to show a longitudinal increase in prevalence and incidence over a period of this duration.
2003 Elsevier Science B.V. All rights reserved.
Keywords: Multiple sclerosis; Australia; Epidemiology; Prevalence; Incidence
1. Introduction
The prevalence of multiple sclerosis (MS) in threeAustralian cities (Newcastle, Perth and Hobart) increasedsignificantly between 1961 and 1981 and the incidence ofthe disease also increased between the decades 1950-1959 and 1971-1981 [1]. The present study sought todetermine whether there was a further increase in thefrequency of the disease over the subsequent 15 years.Using diagnostic criteria and methods comparable to thoseemployed in the previous studies, we therefore undertooka point prevalence survey in Newcastle for 8 August 1996,the date of a national census, and determined the inci-
* Corresponding author. Department of Medicine, University ofSydney, Sydney, NSW 2006, Australia. Tel.: +61-2-9351-3385; fax: +61-2-9351-4018.
E-mail address: [email protected] (J.G. McLeod).
dence of MS in Newcastle in the decade 1986-1996. Theclinical profile of MS in 1996 was also compared withthat in 1981 [2].
2. Materials and methods
The city of Newcastle is situated on the Hunter river atlatitude 32 0 52'S, longitude 151°49'E. It lies on the easterncoast of New South Wales approximately 160 km north ofSydney, and encompasses an area of 205 km2 . The pop-ulation was 142,574, 135,207 and 133,686 on the preva-lence days in 1961, 1981 and 1996, respectively.
The major sources for case ascertainment were as follows:
1. The diagnostic index of the John Hunter Hospital, themajor teaching hospital of the University of Newcastle.
2. Practising doctors. There were six neurologists practisingin the Newcastle area on the prevalence day. A circular
0022-510X/03/$ - see front matter 's 2003 Elsevier Science B.V. All rights reserved.doi:10.1016/S0022-510X(03)00122-9
2 M.H. Barnett et a[. / Journal of the Neurological Sciences 213 (2003) 1-6
was sent to all neurologists and general practitionersrequesting the name, most recent address, approximatedate of diagnosis and hospital where notes might befound of any patients known to them either currently orin the past in whom the likely diagnosis was MS. Followup procedures included a second mailing of this letter ifno reply was received to the first and personal telephonecalls were also made in some instances.
3. The New South Wales Multiple Sclerosis Society records.4. Patients included in the 1981 survey [1].5. Patients included in a trial of beta-interferon, commenced
in 1994 [3,4].
Details of doctors' records and hospital admission noteswere transferred to a standard protocol form designed tofacilitate entry of information into a computerised database.All patients were examined by a neurologist. All patients inwhom a diagnosis of MS was considered to be correct wereclassified according to the diagnostic criteria of Rose et al.[5] into clinically definite, probable or possible groups. As inthe previous surveys, laboratory results (e.g. cerebrospinalfluid (C SF) analysis, evoked potential studies and magneticresonance imaging (MRI)) were not considered in theallocation of individual patients to particular diagnosticcategories. The disability status of each patient on prevalenceday was assessed according to the Kurtzke disability statusscale (DSS) employed in the previous studies. Approval forthe study was obtained from the Hunter Area ResearchEthics Committee.
2.1. Definitions
Crude prevalence was defined as the ratio of persons withan acceptable diagnosis of MS living in the study area on theprevalence date of 8th August 1996, a national census day, tothe total number of persons in the same area on the same dayand was expressed per 100,000 population. The crudeprevalence of MS on both prevalence days was age-stand-ardized to the distribution of the total Australian populationon 8th August 1996 by the direct method. In addition, thecrude MS prevalence data from 1961 and 1981 were age-standardised to the same population distribution to facilitatedirect comparison.
Crude incidence was calculated from the number of casesin the study area on 8th August 1996 in whom onset ofsymptoms occurred during the decade mid-1986 to mid-1996, and is expressed per 100,000 person years using the1991 Newcastle census data as the denominator. The inci-dence data was age standardised using the direct method tothe distribution of the Australian population on 8th August1996. The crude incidence data for the decade mid-1971 tomid-1981 was age standardised to the same population tofacilitate direct comparison.
Age-specific incidence data for the 1950-1959 periodwas not available, and thus incidence data for this periodwas not age-standardised.
2.2. Statistical methods
Confidence intervals for crude prevalence and incidencemay be computed using the relationship between the Pois-son and chi-squared distributions [6]. A generalization ofthis approach was used to calculate confidence intervals forthe standardised rates [7]. Poisson regression [6] was used totest for a trend in prevalence across years by fitting year as acontinuous variable. Poisson regression was also used to testfor a difference in incidence between the decades 1971-1981 and 1986-1996.
The chi-squared statistic was used to test for associationbetween categorical variables. Analysis of variance wasused to test for differences between means. The MannWhitney U and Kruskall—Wallis (non-parametric) tests wereused to compare medians for two or more groups respec-tively when normality could not be assumed.
3. Results
3.1. Case ascertainment
All patients had been examined and were notified by aneurologist. 44% of the patients were also identified fromrecords of the Multiple Sclerosis Society; 33% had beenincluded in the 1981 epidemiological survey [1]; 21% wereascertained from hospital records; 15% were notified bygeneral practitioners; and 4% were known from the beta-interferon trial. The average number of sources reportingeach case was 2.2.
3.2. Diagnostic classification
In 1996, the proportion of patients with definite MS was81% (,i = 64); with probable MS 18% (,i = 14); and withpossible MS 1% (n — 1). There was no significant change inthe distribution of diagnostic categories between 1961 and1996 (7
2 =6 . 66 , 4 df, P — 0.16) (data not shown). TheAllison and Millar criteria [8] were used for the 1961 data,and their `probable', `early probable' and `possible' catego-ries have been considered equivalent to the `definite',`probable' and `possible' categories of Rose et al. [5].
3.3. Prevalence
The prevalence for all persons with MS in 1996 was 59.1per 100,000 persons, the highest ever reported in the New-castle region. In addition, age-standardisation of the crudeprevalence figures extracted from the previously published1961 and 1981 data' revealed an almost linear increase overthe period. Based on the Poisson regression model adjustedfor age, this trend was statistically significant ( 2 — 25.1, 1d f, P<0.001). Crude and age-standardised rates were notappreciably different (Table 1). The mean age on theprevalence day was 50.9 years in 1996. The ratio of
M.H. Barnett et a[. /J
y ^ N
o ^ x ^ ry ^ x .^f•'s~ y o .^ o x o^ ^n a
a o N x vl vl
Cw
C)r
a o o C x C m o (sy. O
y C4N N (N x
—(N-
E
U ^ NC7 p (NOv J 1
y o o n m o o ( Co ( o
.o y
>^ v^ v^ ,,^ x x x x r .p
y; C4 N C v v1 N
y N N
oy
cv x rn x
Ew _
O— c r r C—
U p N
cv x C v^ C rO x v vt (N (N O
3 yyz
x^ ^ 00(N 1 1 1 N 0(
Cry N
:a ^,^ N M v1 ^O 1^
'̂•0
O sy. Ois C4
v .'+ v rf--
= o x o C o o N
Ea o (N n n (N 0 0w
v v NG
ybU
sy. oC4 -^
x„^ ( x o(N (N --
C) oC' o v m tr m o o
U
ya v ny
nb aon on
,)urea[ of the Neurological Sciences 213 (2003) 1-6 10
160
—t-1961° 140o X- - - 1981° 12° 0 1996j5 100C
80
60
> 40 / X / \ r♦2a 2°
0-9 10-19 20-29 30-39 40-49 50-59 60-69 70+
Age (yrs)
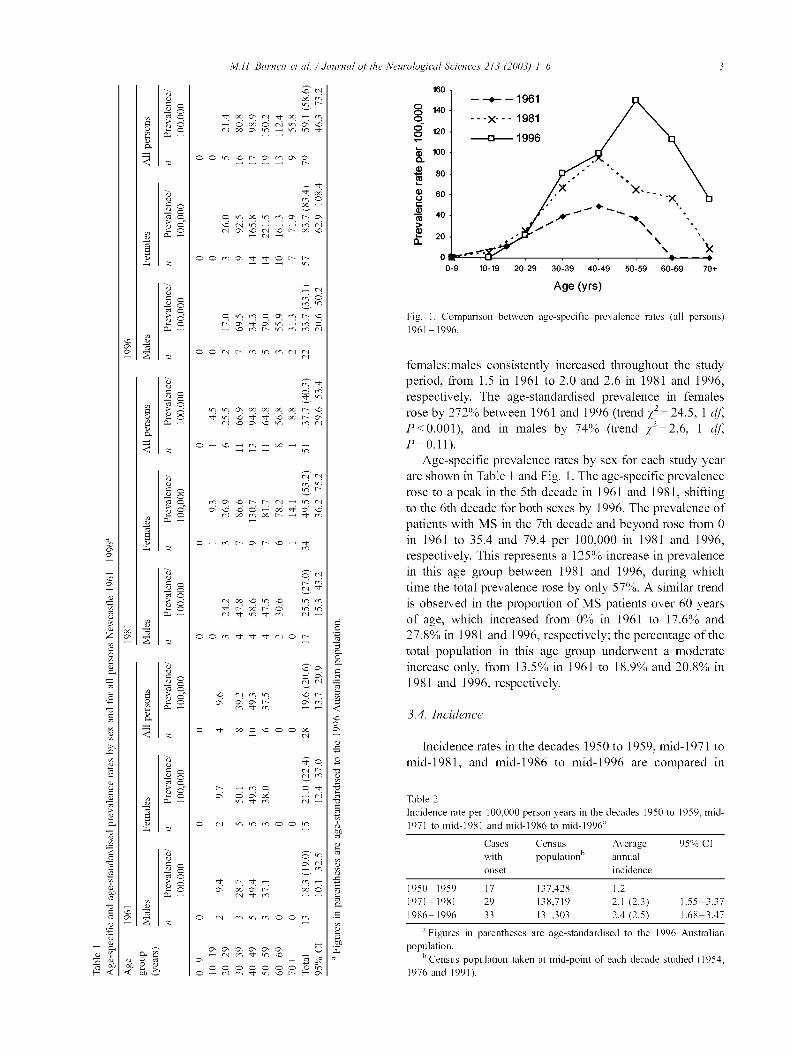
Fig. 1. Comparison between age-specific prevalence rates (all persons)
1961-1996.
females:males consistently increased throughout the studyperiod, from 1.5 in 1961 to 2.0 and 2.6 in 1981 and 1996,respectively. The age-standardised prevalence in femalesrose by 272% between 1961 and 1996 (trend 7
2 =24 . 5 , 1 d f,P<0.001), and in males by 74% (trend 72=2.6, 1 d f,P-0.11).
Age-specific prevalence rates by sex for each study yearare shown in Table 1 and Fig. 1. The age-specific prevalencerose to a peak in the 5th decade in 1961 and 1981, shiftingto the 6th decade for both sexes by 1996. The prevalence ofpatients with MS in the 7th decade and beyond rose from 0in 1961 to 35.4 and 79.4 per 100,000 in 1981 and 1996,respectively. This represents a 125% increase in prevalencein this age group between 1981 and 1996, during whichtime the total prevalence rose by only 57%. A similar trendis observed in the propo rtion of MS patients over 60 yearsof age, which increased from 0% in 1961 to 17.6% and27.8% in 1981 and 1996, respectively; the percentage of thetotal population in this age group underwent a moderateincrease only, from 13.5% in 1961 to 18.9% and 20.8% in1981 and 1996, respectively.
3.4. Incidence
Incidence rates in the decades 1950 to 1959, mid-1971 tomid-1981, and mid-1986 to mid-1996 are compared in
Table 2
Incidence rate per 100,000 person years in the decades 1950 to 1959, mid-1 971 to mid-1981 and mid-1986 to mid-1996'
Cases Census Average 95% CI
with population” annualonset incidence
1 950-1959 1 7 1 37,428 1.2
1 971-1981 29 1 38,719 2.1 (2.3) 1.55-3.37
1 986-1996 33 1 31,303 2.4 (2.5) 1.68-3.47
" Figures in parentheses are age-standardised to the 1996 Australian
population.
" Census population taken at mid-point of each decade studied (1954,
1 976 and 1991).
4 M.H. Barnett et a[. / Journal of the Neurological Sciences 213 (2003) 1-6
Table 3
Age-specific incidence rates in the decades mid-1971 to mid-1981 and mid-1986 to mid-1996 by sex and for all persons'
Age 1971- 1981 1986- 1996group
Males Females All persons Males Females All persons(years)
n Incidence/ n Incidence/ n Incidence/ n Incidence/ n Incidence/ n Incidence/
100,000 100,000 100,000 100,000 100,000 100,000
0-9 0 - 0 - 0 - 0 - 0 - 0 -10-19 2 1.62 2 1.66 4 1.64 0 - 0 - 0 -20-29 6 5.24 6 5.64 12 5.43 2 1.73 7 6.27 9 3.9630-39 2 2.64 5 6.73 7 4.66 6 6.13 5 5.35 11 5.7540-49 4 5.10 2 2.50 6 3.79 0 - 4 5.12 4 2.5650-59 0 - 0 - 0 - 1 1.67 4 6.48 5 4.1160-69 0 - 0 - 0 - 1 1.53 2 2.74 3 2.1770+ 0 - 0 - 0 - 0 - 0 - 0 -Total 14 2.05 (2.20) 15 2.13 (2.49) 29 2.09 (2.34) 10 1.56 (1.52) 22 3.27 (3.36) 32 2.44 (2.45)95% CI 1.21-3.79 1.34-4.03 1.55-3.37 0.74-2.85 2.07-5.02 1.68-3.47
" Figures in parentheses are age-standardised to the 1996 Australian population
Table 2. There was a substantial and statistically significantincrease in the overall crude incidence over the periodsranging from 1950 to 1996 (trend
72=5.67, P- 0.017). The
age-standardised incidence rate in females and all personsrose between the two decades 1971-1981 and 1986-1996,but did not change significantly in males (Table 3). The age-standardised F:M incidence ratio rose from 1.1 to 2.2between the two decades (P- 0.18). In addition, the peakincidence rate in males shifted from the 3rd to the 4thdecade, while that in females shifted from the 4th to the 3rddecade (Table 3). The age-specific incidence data for allpersons is illustrated in Table 3, from which it may be seenthat there has been a marked increase in the incidence of MSin groups aged over 50 years.
3.5. Clinical profile
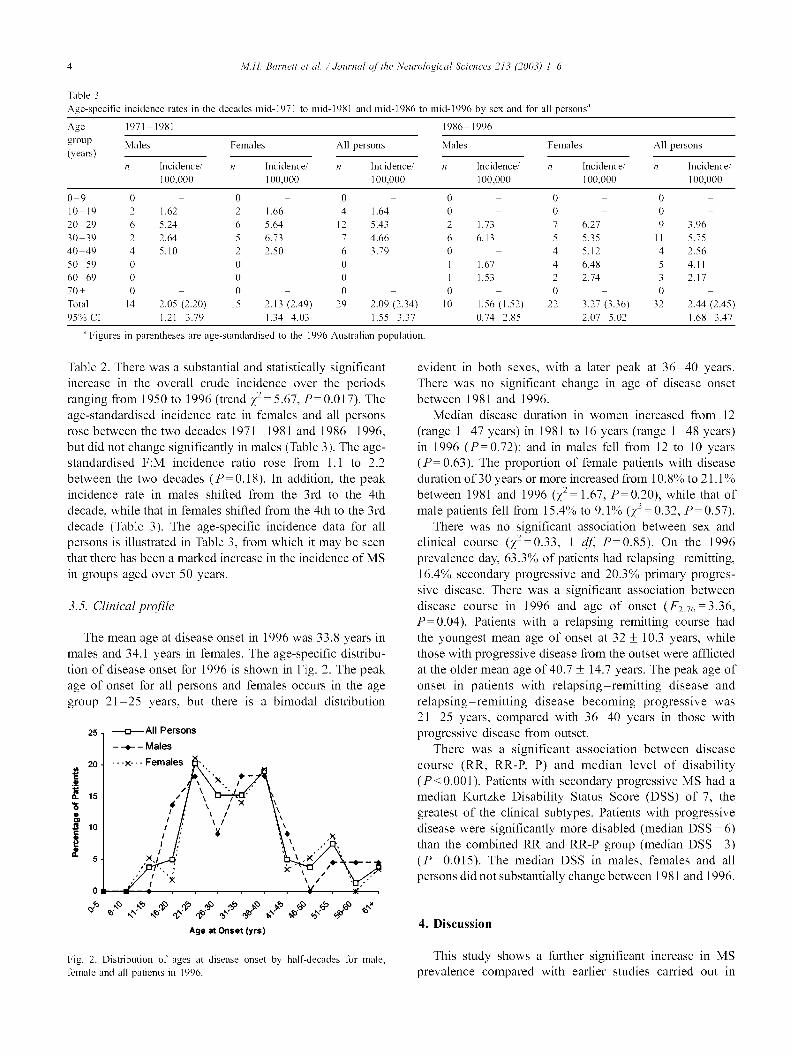
The mean age at disease onset in 1996 was 33.8 years inmales and 34.1 years in females. The age-specific distribu-tion of disease onset for 1996 is shown in Fig. 2. The peakage of onset for all persons and females occurs in the agegroup 21-25 years, but there is a bimodal distribution
25 -D.-- AII Persons
- t - Males
20 x--- Females
m \ x +-
,_, t Y • x^ t \
t ^5 x,, \ , x
^ 7C \ /
ot
y o .y yo ti`s ^o 4`' oo a`^ ho bb 60
Age at Onset (yrs)
Fig. 2. Distribution of ages at disease onset by half-decades for male,
female and all patients in 1996.
evident in both sexes, with a later peak at 36-40 years.There was no significant change in age of disease onsetbetween 1981 and 1996.
Median disease duration in women increased from 12(range 1-47 years) in 1981 to 16 years (range 1-48 years)in 1996 (P=0.72); and in males fell from 12 to 10 years(P- 0.63). The proportion of female patients with diseaseduration of 30 years or more increased from 10.8% to 2 1.1 %between 1981 and 1996
(725 1.67, P- 0.20), while that of
male patients fell from 15.4% to 9.1% (72=0.32,P=0.57).There was no significant association between sex and
clinical course (72=0
33 1 df, P=0.85). On the 1996prevalence day, 63.3% of patients had relapsing-remitting,16.4% secondary progressive and 20.3% primary progres-sive disease. There was a significant association betweendisease course in 1996 and age of onset (F2.76-3.36,P-0.04). Patients with a relapsing remitting course hadthe youngest mean age of onset at 32 ± 10.3 years, whilethose with progressive disease from the outset were afflictedat the older mean age of 40.7 ± 14.7 years. The peak age ofonset in patients with relapsing-remitting disease andrelapsing-remitting disease becoming progressive was21-25 years, compared with 36-40 years in those withprogressive disease from outset.
There was a significant association between diseasecourse (RR, RR-P, P) and median level of disability(P<0.001). Patients with secondary progressive MS had amedian Kurtzke Disability Status Score (DSS) of 7, thegreatest of the clinical subtypes. Patients with progressivedisease were significantly more disabled (median DSS ° 6)than the combined RR and RR-P group (median DSS ° 3)( P=0.015). The median DSS in males, females and allpersons did not substantially change between 1981 and 1996.
4. Discussion
This study shows a further significant increase in MSprevalence compared with earlier studies carried out in
M.H. Barnett et ai. / Journal of the Neurological Sciences 213 (2003) 1-6 5
Newcastle, Australia. The prevalence of MS in Newcastle in1996 of 59.1 per 100,000 is very close to that determined inthe Australian Capital Territory on the same prevalence date[9]. The increase in prevalence reflects similar trendsobserved in several studies carried out in the NorthernHemisphere [ 10-18]. The population size in Newcastle ofapproximately 135,000 is small enough, given the availableresources, to ensure thorough case ascertainment, and islarge enough to avoid the potential pitfalls of case cluster-ing. The use of identical diagnostic criteria and methods ofcase ascertainment employed in the previous 1981 New-castle MS epidemiological study justifies their direct com-parison after appropriate age standardisation. Comparisonwith the 1961 prevalence and incidence data is limitedsomewhat by use of the Allison and Millar [8] classificationin that study, and the use of the more recently developedcriteria [5] in both subsequent surveys. The older criteriaare, however, considered to be more inclusive; their usewould tend to have exaggerated the 1961 estimates andthereby to have diminished the increase in prevalence andincidence found in the present study [19].
Increased incidence in females is likely to have contrib-uted in part to the increased female prevalence found in1996 compared with 1981. Median duration of disease alsoincreased substantially from 1981 to 1996 in females andmay have played a role in the prevalence findings in thisgroup.
The possibility that better case ascertainment contributedto the increased incidence and prevalence figures cannot beexcluded. Resurvey of an area for a second or subsequenttime increases the prevalence yield because of improvedawareness in the at-risk population [10]. This finding isprincipally due to benign or early cases being missed in theinitial survey. Recent improvements in MS therapy, partic-ularly the introduction of the interferons in the 1990s, haveheightened public awareness of the disease and may havebrought patients to medical attention earlier. Althoughmodern investigatory techniques such as MRl were notincluded in the diagnostic criteria used, their availabilitymay have had a similar effect, consistent with the findingthat a greater proportion of patients with shorter diseaseduration (< 10 years) were included in the recent studyyears. A dominant contribution of females to increasingprevalence, as well as an increasing female:male ratio withserial surveys, has been previously noted [20] and mayindicate a diagnostic bias in females [ 11 ], but this fact aloneis unlikely to account for our findings. The stable proportionof immigrants in Newcastle (12.1% in 1961 vs. 12.2% in1996) also makes it unlikely that a change in populationgenetic susceptibility to disease contributed to the increasedincidence/prevalence. Rather, sharp changes in incidence,and therefore prevalence, point toward an undeterminedenvironmental or socio-economic factor.
Both increased incidence and survival contributed sig-nificantly to the increased prevalence of MS found inseveral previous epidemiological studies carried out in the
Northern hemisphere. In these reports, increased incidencehas been attributed to changes in local aetiological factors.Several serial MS epidemiological studies in Scandanaviahave shown a trend to increasing incidence, particularly incounties situated on the coastline; incidence in other regionshas, however, appeared to fluctuate [14]. Incidence in theprovince of Nuoro, Sardinia, has increased in each half-decade from 1955-1959 to 1990-1995, and this trend wasconfirmed for both sexes [12]. By contrast, incidence of MSin the present study increased in females between the studydecades 1971-1981 and 1986-1996, but did not changesignificantly in males. Such discrepancies may in part reflectdiffering methodologies, particularly case ascertainmentsources, between MS surveys and should be interpretedwith caution. Nevertheless, a substantial rise in total MSincidence has been shown in several populations in both thenorthern and now southern hemispheres. Interestingly, theincidence of other diseases with a probable autoimmunebasis has increased over the same period [21]. Pooled datasuggest that the incidence of Type 1 diabetes, for example,has increased by 3% annually between 1960 and 1996 [22].The condition is not fraught by the diagnostic pitfalls andascertainment biases which affect epidemiological studies ofmultiple sclerosis.
The present paper confirms a steady and significant risein MS prevalence and incidence from 1961 to 1996, and isthe first such study in the Southern Hemisphere to corrob-orate this trend over a prolonged period. The homogeneityof the population studied on each occasion and the appli-cation of identical study methods suggest a true increase inprevalence, which we attribute to increased incidence infemales and increased survival in the MS population ofNewcastle.
Acknowledgements
The authors are grateful to the Newcastle neurologists,Professor J.T. Holland and Drs. David Floate, Keith Burton,Jeffrey Blackie and Michael Katekar without whose patienceand support the study would not have been possible.
References
[I] Hammond SR, McLeod JG, Millingen KS, Stewart-Wynne EG, Eng-
lish D, Holland JT, et a]. The epidemiology of multiple sclerosis in
three Australian cities: Perth, Newcastle and Hobart. Brain 1988;
IIl(Pt l):1-25.
[2] Hammond SR, English D, de Wytt C, Maxwell IC, Millingen KS,
Stewart-Wynne EG, et al. The clinical profile of MS in Australia: a
comparison between medium- and high-frequency prevalence zones.
Neurology 1988;38:980-6.
[3] PRISMS (Prevention of Relapses and Disability by Interferon beta-la
Subcutaneously in Multiple Sclerosis) Study Group. PRISMS. Rand-
omised double-blind placebo-controlled study of interferon beta-la in
relapsing/remitting multiple sclerosis. Lancet 1998;352: 1498-504.
[4] Li DK, Zhao GJ, Paty DW. Randomized controlled trial of interferon-
M.H. Barnett et ai. / Journal of the Neurological Sciences 213 (2003) 1-6
beta-la in secondary progressive MS: MRI results. Neurology 2001;
56:1505-13.
[5] Rose AS, Ellison GW, Myers LW, Tourtellotte WW. Criteria for the
clinical diagnosis of multiple sclerosis. Neurology 1976;26:20-2.
[6] Armitage P. Berry G. Statistical methods in medical research. Oxford:
Blackwell; 1994.
[7] Dobson AJ, Kuulasmaa K, Eberle E, Scherer Y. Confidence intervals
for weighted sums of Poisson parameters. Stat Med 1991;10:457-62.
[8] Allison RD, Millar JHD. Prevalence and familial incidence of disse-
minated sclerosis. (A report to the Northern Ireland Hospitals Author-
ity on the results ofa three-year survey). Ulster Med J 1954;23:5-27.
[9] Simmons RD, Hall CA, Gleeson P. Everard G, Casse RF, O'Brien
ED. Prevalence survey of multiple sclerosis in the Australian capital
territory. Intern Med J 200131:161-7.
[10] Compston DA. Methods of genetic epidemiology in multiple sclero-
sis. In: Compston DA, editor. McAlpine's multiple sclerosis. London:
Churchill Livingstone; 1998. p. 45-61.
[11] Forbes RB, Wilson SV, Swingler RJ. The prevalence of multiple
sclerosis in Tayside, Scotland: do latitudinal gradients really exist?
J Neurol 1999,246:1033-40.
[12] Granieri E, Casetta I, Govoni V. Tola MR, Marchi D, Murgia SB, et al.
The increasing incidence and prevalence of MS in a Sardinian prov-
ince. Neurology 2000;55:842-8.
[13] Grimaldi LM, Salemi G, Grimaldi G, Rizzo A, Marziolo R, Lo PC,
et al. High incidence and increasing prevalence of MS in Enna
(Sicily), southern Italy. Neurology 200157:1891-3.
[14] Gronlie SA, Myrvoll E, Hansen G, Gronning M, Mellgren SI. Multi-
ple sclerosis in North Norway, and first appearance in an indigenous
population. J Neurol 2000;247:129— 1233.
[15] McDonnell GV, Hawkins SA. An epidemiologic study of multiple
sclerosis in Northern Ireland. Neurology 1998;50:423-8.
[16] Pugliatti M, Sotgiu S, Solinas G, Castiglia P. Pirastru MI, Murgia B,
et al. Multiple sclerosis epidemiology in Sardinia: evidence for a true
increasing risk. Acta Neurol Scand 2001;103:20-6.
[17] Sumelahti ML, Tienari PJ, Wikstrom J, Palo J, Hakama M. Increasing
prevalence of multiple sclerosis in Finland. Acta Neurol Scand 2001;
103:153-8.
[18] Wynn DR, Rodriguez M, O'Fallon WM, Kurland LT. A reappraisal of
the epidemiology of multiple sclerosis in Olmsted County, Minnesota.
Neurology 1990;40:780-6.
[19] Rice-Oxley M, Williams ES, Rees JE. A prevalence survey of multi-
ple sclerosis in Sussex. J Neurol Neurosurg Psychiatry 1995;58:
27-30.
[20] Noonan CW, Kathman SJ, White MC. Prevalence estimates for MS in
the United States and evidence of an increasing trend for women.
Neurology 2002;58:136-8.
[21] Jacobson DL, Gange SJ, Rose NR, Graham NM. Epidemiology and
estimated population burden of selected autoimmune diseases in the
United States. Clin Immunol Immunopathol 1997;84:223-43.
[22] Onkamo P. Vaananen S, Karvonen M, Tuomilehto J. Worldwide in-
crease in incidence of Type I diabetes the analysis of the data on
published incidence trends. Diabetologia 1999;42:1395-403.
The increasing incidence and prevalenceof MS in a Sardinian province
E. Granieri, MD; I. Casetta, MD; V. Govoni, MD; M.R. Tola, MD; D. Marchi, MD; S.B. Murgia, MD;A. Ticca, MD; M. Pugliatti, MD; B. Murgia, MD; and G. Rosati, MD
Article abstract—Objective: To verify incidence rates and their temporal trend in a homogeneous, ethnically, andgenetically distinct population of central Sardinia (the Nuoro province). Background: Intensive epidemiologic studiescarried out in Sardinia since the 1970s have suggested that the prevalence and incidence of MS are much higher in thisMediterranean island compared with those found on mainland Italy. Methods: The study area had a population ofapproximately 274,000 people in the 1991 census. The authors adopted a complete enumerative approach by reviewing allpossible sources of case collection available in the investigative area. Results: Based on 469 MS patients, the mean annualincidence for 1955 to 1995 was 4.18 per 100,000 (or 4.3 per 100,000 if age- and sex-adjusted to the European population).The incidence, averaging 1.95 per 100,000 during 1955 to 1959, rose progressively over time, reaching rates of 6.6 in thequinquiennium 1985 to 1989 and 6.4 per 100,000 in 1990 to 1995. On December 31, 1994, the crude prevalence, based on415 MS patients alive in the study area, was 151.9 per 100,000 (156.6 if adjusted to the European population). Conclusion:These incidence and prevalence rates are the highest to date that have been estimated for a large community in southernEurope, and they constitute some of the highest rates in the world. Based on other surveys, these results reinforce theposition of Sardinia as a higher and rising prevalence area for MS compared with other Mediterranean populations.Genetic and social–historic data strengthen the hypothesis of the environmental role and genetic factors among Sardin-ians in determining the notable difference in MS frequency between Sardinians and other Mediterraneans.
NEUROLOGY 2000;55:842-847
The epidemiologic studies of the last two decades indi-cate that the distribution of MS in southern Europe,particularly in Italy and Spain, is more complex thanwas supposed in the past, when a latitude-relatedmodel was commonly accepted. In fact, the MS fre-quency in Europe seems uneven, with substantialvariations between areas at the same latitude, andalso within countries. 4 - 7 With regard to the Mediter-ranean areas, all descriptive studies conducted inSardinia during the last two decades by our researchgroups indicate that this Italian island has twice theprevalence and incidence of MS compared with conti-nental Italy."- 11 The most recent survey performed innorthwestern Sardinia indicated a prevalence of102.6 cases per 100,000 population (in 1991) and anotable increase in MS incidence over time. Al-though averaging 2 per 100,000 from 1962 to 1971,MS incidence rose to 5 per 100,000 from 1977 to1991. 12 These results represent striking exceptionsto the north–south gradient in Europe and suggestthat this island may be considered an area of highand increased risk for MS. We sought to verify themorbidity estimates of MS and its temporal trend inthe well-defined areas of central Sardinia in theprovince of Nuoro, where studies in the 1980s indi-
cated a high risk for the disease. The living popula-tion of approximately 270,000 persons is a self-contained and genetically characterized communitythat was isolated for centuries and excluded fromany contact with other ethnically distinct popula-tions occupying the island.
Methods. Area of investigation. The province of Nuoroincludes 102 towns and villages. In the southern interiorpart of the province lies Barbagia, an area where MS epi-demiologic studies were performed by our research groupin the 1970s. 8 • 9 The mean population during 1955 through1995 was 273,248 people (135,950 men, 137,298 women).The mean population density was 39 inhabitants/km2(range, 8 to 228 inhabitants/km 2). Only 37,527 people in-habit the town of Nuoro, whereas the rest of the populationlives in two smaller towns (with a total population of ap-proximately 10,000 people), and rural or sparsely popu-lated areas.
The population is ethnically homogeneous, originatingfrom an early split in the Caucasoid group, and is differentfrom other European populations, Italians included. Theorigins of the Sardinian people in prehistory are not wellknown; however, historic, anthropologic, and genetic stud-ies indicate that they are an ethnically distinct, homoge-neous group. The original inhabitants of the island,
From the Multiple Sclerosis Center (Drs. Granieri, Casetta, Govoni, and Tola) Department of Neurology, University of Ferrara; the Section of Neurology andNeurorehabilitation (Drs. Marchi, S.B. Murgia, and Ticca), Nuoro Hospital; and the Department of Neurology, University of Sassari (Drs. Pugliatti, B.Murgia, and Rosati), Italy.
Supported by the Associazione Italiana Sclerosi Multipla and by the Istituto Superiore di Sanita.
Presented in part at the European Committee for Treatment and Research in Multiple Sclerosis, Stockholm, Sweden, September 12-14, 1998; and at the 4thAmerican Committee for Treatment and Research in Multiple Sclerosis, Montreal, Canada, October 18, 1998.
Received December 10, 1999. Accepted in final form May 24, 2000.
Address correspondence and reprint requests to Dr. Enrico Granieri, Clinica Neurologica, Universit y di Ferrara, Corso della Giovecca 203, I-44100 Ferrara,Italy; e-mail: [email protected]
842 Copyright © 2000 by AAN Enterprises, Inc.
particularly those who settled in the mountainous andhilly areas of the interior part of central Sardinia, giventhe inaccessibility of the territory, had been excluded fromany contact with other ethnically different populationswho occupied the coastal and flat parts of Sardinia in sub-sequent centuries. Successive waves of invasions by Phoe-nicians, Carthaginians, Romans, Vandals, Byzantines,Arabians, Ligurians, Tuscans, Spaniards, and Piedmon-tese failed to penetrate the wild and barbarous inland,which is represented mostly by the province of Nuoro andparticularly by Barbagia. Barbagia, the region of the bar-barians, according to the name assigned by the Romans,has preserved an ethnic and genetic peculiarity amongaboriginal Sardinians that differs from the remainder ofcontinental Italy. 13 The particular ethnic structure of Sar-dinians has also been emphasized in a review on MS ge-netic epidemiology in the world. 14 Comparative studies onhuman leukocyte antigen (HLA) allelic frequencies haveclearly demonstrated the genetic isolation of Sardiniansfrom other Italian and European populations.' 5" 6 The per-manence of certain linguistic relics in the Nuorese lan-guages and the singularity of the family names, which arecompletely different from those of the rest of Italy, givefurther support to the previous assumption.'7
From the end of World War II until 1980, there wasmass emigration from the province of Nuoro to the indus-trialized regions of northern Italy and central northernEurope (based on the official data, the average annualemigration from the province during this period was 520subjects per 100,000 population). Afterward, the migrationflux was unremarkable and did not change substantiallyover time. Almost all the migrants from and to the prov-ince of Nuoro are Sardinians, and the ethnic composition ofthe population has remained primarily stable over time.
The study area was rural by tradition, most workershaving been employed in agriculture and sheep breeding,the latter having been the most important activity in theprovince in the past. After the last war, the standard ofliving was low compared with the rest of Italy, where pro-cesses of modernization and industrialization were inprogress. During the last few decades, the structure of theeconomy has undergone a slight change and is now alsobased on the service and construction industries associatedwith urban development. There is only one minor indus-trial sector, whereas tourism has more recently been re-evaluated, mainly in the coastal zones. According to thedata of the 1991 General Census, the active working popu-lation is employed as follows: agriculture and breeding,19%; industry, 26.4%; and tertiary activities, 54.6%.
The health care system has been present in the area formany decades, and the level of medical organization isrelatively high. There is a general hospital with a neuro-logic ward and service, and a motor rehabilitation unitlocated in the town of Nuoro. Other neurologic outpatientservices and rehabilitation facilities are also available inthe study area. Some patients are cared for in other hospi-tals of the bordering provinces of Sardinia, mostly in theuniversity neurologic departments of Sassari and Cagliari,where MS centers have been operative for many years. Thelevel of medical organization has improved during thestudy period in parallel with the general improvementachieved throughout the rest of Italy as far as diagnostictools, medical facilities, and neurologic services are con-
cerned. As in other parts of Italy, detailed CSF studies andMRI became available routinely for patients referring tothe neurologic services of the Nuoro province in the middle1980s.
Case collection and ascertainment. Our research grouphas previously investigated MS scattered in Sardinia and,in particular, some areas of the province of Nuoro, Barba-gia, and Macomer. Therefore, MS patients traced duringprevious studies constituted the starting point for this sur-vey. Other MS patients were drawn from the followingsources: archives of discharge diagnoses from the hospitalof Nuoro, other hospitals on the island (Lanusei, Olbia,Oristano, Ozieri), the Sassari and Cagliari university hos-pitals, the neurologic practices serving the community,files from motor rehabilitation and chronic care services,membership rolls of the local branch of the Italian MSAssociation (AISM), and archives of the National PensionInstitute and National Health Insurance scheme. We re-viewed the sources from 1950 to the present by manualscreening of in- and outpatient records, and patient lists.Cooperation from general practitioners, chemists, and so-cial workers employed in the region was also obtained.Other sources included the archives of national centerswhere several patients from various parts of Italy go forclinical consultation. The active collaboration of somemembers of AISM and of other service organizations al-lowed us to recruit some MS patients who were not identi-fied from other sources.
All patients with diagnoses of MS, demyelinating dis-ease, encephalomyelitis, myelitis, myelopathy, optic neuri-tis, and ataxia were reviewed by trained neurologists ofour team. The inquiry included a detailed interview, clini-cal and neurologic examination, and further analysis of allclinical documents. For the deceased patients, close rela-tives were interviewed and available clinical files wereexamined. The senior neurologists of our team reviewed alldata collected for each patient to verify the validity of thediagnosis and to establish the date of clinical onset of thedisease, defined as the time of the first symptom referableto MS. Because criteria involving imaging procedures, lab-oratory, or other diagnostic tests were not applicable toevery patient in this survey setting, case definition wasbased on both the criteria of Poser et al. 18 and on clinicaldiagnostic criteria.' 9,20 Information regarding whether pa-tients were alive and residing in the study area at preva-lence day was obtained from register offices of thecommunes.
From the provisional list of 565 putative cases eligiblefrom the incidence estimate, we excluded 29 patients withonset outside the study area, 41 patients with onset before1955 or after 1995, 16 patients whose diagnosis of MS wasexcluded, and 10 patients whose clinical records did notallow us to make a probable or definitive diagnosis andwho were not available for further evaluation. From the orig-inal list of 564 patients potentially eligible for a prevalenceestimate, we excluded 48 patients living outside the provinceof Nuoro, 72 patients who died before the prevalence point,16 patients whose final diagnosis was other than MS, 6 pa-tients with disease onset after 1994, and 7 patients withsuspected or possible MS. Thus, the final study consisted of469 patients with MS onset occurring from 1955 through1995 while they were residing in the study area, and 415 MSpatients living in the study area on December 31, 1994.
September (2 of 2) 2000 NEUROLOGY 55 843
Table 1 Age- and sex-specific mean annual incidence rates of MSin the province of Nuoro, 1955 to 1995
Mean annual incidence rate per 100,000
Age group, y Total Men Women
10-14 1.13 0.5 1.8
15-19 8.5 6.1 11
20-24 14.35 8.3 20.6
25-29 13.4 11.5 15.2
30-34 10 6 13.8
35-39 9.2 6.45 11.8
40-44 7.86 5.6 10
45-49 3.8 3 4.5
50-54 1.5 1.1 2
55+ 0.5 0 0.98
Ninety-seven percent of patients included in this study wereborn within the study area (90%) or elsewhere in Sardinia.Most patients born in mainland Italy or abroad have typicalSardinian surnames.
Statistical analysis. Ninety-five percent CIs were cal-culated assuming a Poisson's distribution. 2 ' Crude rateswere directly adjusted to the Italian (1981 General Cen-sus) and European populations. 22 Student's t-test was usedto compare two averages, and the z test was used to com-pare two rates. The comparison between two adjustedrates was performed by calculating the variance of thedifference between two directly standardized rates and thez value. The statistical significance of temporal variationin incidence rates was evaluated with the Armitage testfor linear trends.23
Results. Incidence. From 1955 through 1995, 469 sub-jects (158 men and 311 women) living in the province ofNuoro first showed symptoms that were later determinedto represent the clinical onset of MS. They were consideredto be incidence cases in the year in which they showedonset of symptoms. The crude mean annual incidence ratewas 4.18 per 100,000 people (95% CI, 3.8 to 4.62). The twosexes differed (men: incidence rate, 2.83 per 100,000; 95%CI, 2.41 to 3.3; women: incidence rate, 5.52 per 100,000;95% CI, 4.9 to 6.18; z = 6.99, p < 0.01). The female-to-maleratio was 1.95.
The sex- and age-adjusted rate for the Italian popula-tion was 4.3 per 100,000 (2.98 for men, and 5.42 for wom-en). The directly adjusted rate for the European populationwas 4.3 per 100,000 people.
The age at onset (mean ± SD) was 28.5 ± 9.7 years forthe total population, 28.5 ± 9.7 years for men, and 27.9 ±9.5 years for women (a nonsignificant difference). Table 1shows the age- and sex-specific incidence rates. The high-est annual incidence rates were observed between ages 20and 24 for the total population (12.3 per 100,000) and forwomen (17.6 per 100,000), and between ages 25 and 29 formen (9.5 per 100,000). The difference in incidence betweenthe two genders was significant for the age groups 15 to 24years and 30 to 39 years (p < 0.05).
Table 2 shows the average annual incidence rates byyear of onset for 5-year intervals from 1955 to 1995. The
844 NEUROLOGY 55 September (2 of 2) 2000
Table 2 Incidence trend of MS in the province of Nuoro,1955 to 1995
Incidence rate Mean age at onset,Period No. of patients per 100,000 y; ± SD
1955-1959 26 1.95 28.6 ± 11
1960-1964 26 1.85 28.3 ± 10
1965-1969 33 2.3 30.8 ± 11
1970-1974 42 3 27.6 ± 9.4
1975-1979 67 4.8 28.4 ± 9.2
1980-1984 80 5.8 28.6 ± 9.8
1985-1989 91 6.6 28.0 ± 8.7
1990-1995 104 6.4 28.4 ± 9
Total 469 4.18 28.5 ± 9.7
observed incidences increased from 1.95 per 100,000 (95%CI, 1.27 to 2.86) from 1955 through 1959 to 6.6 per 100,000from 1985 to 1989 (95% CI, 5.3 to 8.1), to 6.4 per 100,000(95% CI, 5.25 to 7.8) during the last 6-year study period( X
2 = 91.48, df = 7, p < 0.001). The increasing trend wasconfirmed for both sexes (X 2 = 25.75 for men; X
2 = 66.28for women; df = 7, p < 0.001). During the study period, themean age at onset of the disease did not change over time(see table 2). The incidence rate did not change signifi-cantly (4.1 per 100,000 per year) if the patients were clas-sified according to widely used clinical diagnosticcriteria.19,20
Prevalence. On the day selected, December 31, 1994,415 MS patients (128 men and 287 women) were living inthe study area. Their mean age was 40.6 ± 12.6 years:41.6 ± 12.6 for men and 40.2 ± 12.5 for women, a nonsig-
nificant difference. The total population was 273,146 per-sons (134,905 men and 138,241 women), and the crudeprevalence rate was 151.9 cases per 100,000 population(95% CI, 137.6 to 167.7). The crude prevalence rate formen was 94.9 per 100,000 (95% CI, 79.5 to 113,2) and forwomen was 207.6 per 100,000 (95% CI, 184.7 to 234.4), asignificant difference (z = 7.6). The directly adjusted ratefor the Italian population was 148.8 per 100,000: 93.04 per100,000 for men and 250.5 per 100,000 for women. Theadjusted rate for the European population was 156.64 per100,000.
The mean duration of the disease from onset to preva-lence day was 16.3 ± 9.7 years: 16.1 ± 8.9 years for menand 16.5 ± 6 years for women (not significant).
Table 3 shows age- and sex-specific prevalence rates.They reached a maximum for the age groups 35 to 44 yearsfor the total population (323.7 per 100,000) and for menand women considered separately (219.3 per 100,000 formen and 434 per 100,000 for women). The significant dif-
ference in prevalence rates between men and women wasconfirmed in the age range 15 to 64 years.
The adjusted prevalence in 1994 was significantlyhigher than in 1985 (102 per 100,000 for men, 94 per100,000 for women; z = 4.56).
The prevalence rate was higher in the urban populationof the town of Nuoro than in the other communities andrural areas of the province (200 per 100,000 for Nuoroversus 144.4 per 100,000 for other communities and ruralareas; z = 2.28, p < 0.05).

Table 3 Prevalence rates (per 100,000) of MS in the Nuoroprovince (December 31, 1994)
Total Men Women
Age group, y N Rate N Rate N Rate
0-14 1 1.96 0 0 1 4
15-24 28 59.1 7 29 21 90.43
25-34 121 284.1 34 157.8 87 413.5
35-44 115 323.7 40 219.3 75 434
45-54 87 284.3 29 194.4 58 370
55-64 48 167.4 11 80.9 37 245.4
65-74 11 53.1 5 53.5 6 52.9
75+ 4 23.2 2 27.2 2 20.2
Other features. Disease course at onset was primaryprogressive in 12.9% of patients and relapsing-remittingin the remaining patients. According to Kurtzke's Ex-panded Disability Status Scale (EDSS), 24 56% of preva-lence patients showed either no disability or minimaldisability (EDSS score, 0 to 3.5 points), 17.5% exhibitedrelatively severe disability (EDSS score, 4 to 5.5 points)and 26.5% required partial or complete assistance (EDSSscore, >5.5 points).
The mean interval between symptom onset and diagno-sis was 4.61 years. The average lag time between symp-tomatic onset and diagnosis shortened over time from 6.3years for patients with onset before 1974 to 1.9 years forpatients with onset after 1984. The average lag time be-tween onset and diagnosis was less than 1 year for pa-tients with onset after 1990.
Pyramidal motor (40.1%) and sensory (42.9%) disorderswere the most common presenting symptoms.
The overall MS population included 19 sibling pairs and8 parent-children pairs.
Discussion. We found a prevalence of 152 per100,000 and an incidence rate of 4.2 per 100,000 peryear in the province of Nuoro. These are the highestrates estimated for a large community in southernEurope, and some of the highest in the world. 3 ' 25 Weadopted a complete enumerative approach by review-ing all possible sources of case collection throughoutthe study area and took advantage of a long-termepidemiologic surveillance in this region imple-mented by neurologists operating in Sardinia sincethe 1960s, most of whom belong to this researchgroup. 8 ' 9 ' 26 -29 The population size of this study can beconsidered suitable for accurate case finding becauseit was manageable within the resources of our re-search team, and for adequate precision. Conversely,the well-defined community residing in the provinceof Nuoro is not so small as to be subject to the quirksof clustering. Given the intensive methodological ap-proach of case ascertainment and the repeated sur-veys in the same area, which usually led to a morecareful case collection as a result of greater interestin the disease,'' ° any underascertainment was ex-pected to be minimal. Moreover, it is unlikely thatnewly diagnosed patients would go outside the island
for hospitalization, because Sardinia is quite farfrom the mainland and, at the same time, it offers awidespread network of well-equipped public generalhospitals, including two departments of neurology atthe universities of Sassari and Cagliari, and rehabil-itation facilities, providing national services to whichgeneral practitioners refer their patients.
On the basis of the previous surveys, our researchgroup cited evidence indicating that the risk for MSis higher in Sardinia than in other parts of Italy," -11
disproving the hypothesis that MS distribution fol-lows a latitude-related gradient, at least in Italy andin southern Europe, 2 and prompting the assumptionthat the frequency of MS in Sardinia is one of thehighest in the world. l An increasingly high MS inci-dence was reported from northwestern Sardinia bysome researchers of our team using the same meth-odology. 12 The incidence estimates from our studydid not seem to reflect a steady pattern that was alsopresent in previous years and was unrecognized be-cause of different case collection completeness, butrather because of an increasing incidence during thelast three decades. Some indications would confirmthe latter explanation: The study area has alreadybeen investigated intensively by our own researchgroup using the same methodology, giving morbidityfigures higher than that of the rest of Italy, but con-siderably lower than the current estimates. 8 ' 9 Analo-gous findings have emerged from the other studycarried out in the bordering northern area of Sardi-nia, where an epidemiologic long-term surveillancestudy has also been implemented.
The possibility that improvement in diagnostictechniques and medical facilities during the past de-cades could have led to an apparent excess of casesin the last few years, by allowing more completeascertainment even for mild and benign forms of MS,may be an alternative explanation. However, thepercentage of patients showing no disability or mini-mal disability in our prevalence patients (56%) wasclose to that (50%) reported in a previous prevalencestudy in the same area28 in 1971, suggesting that in-creased recognition of mild forms could not have playeda crucial role in the morbidity estimates over time.
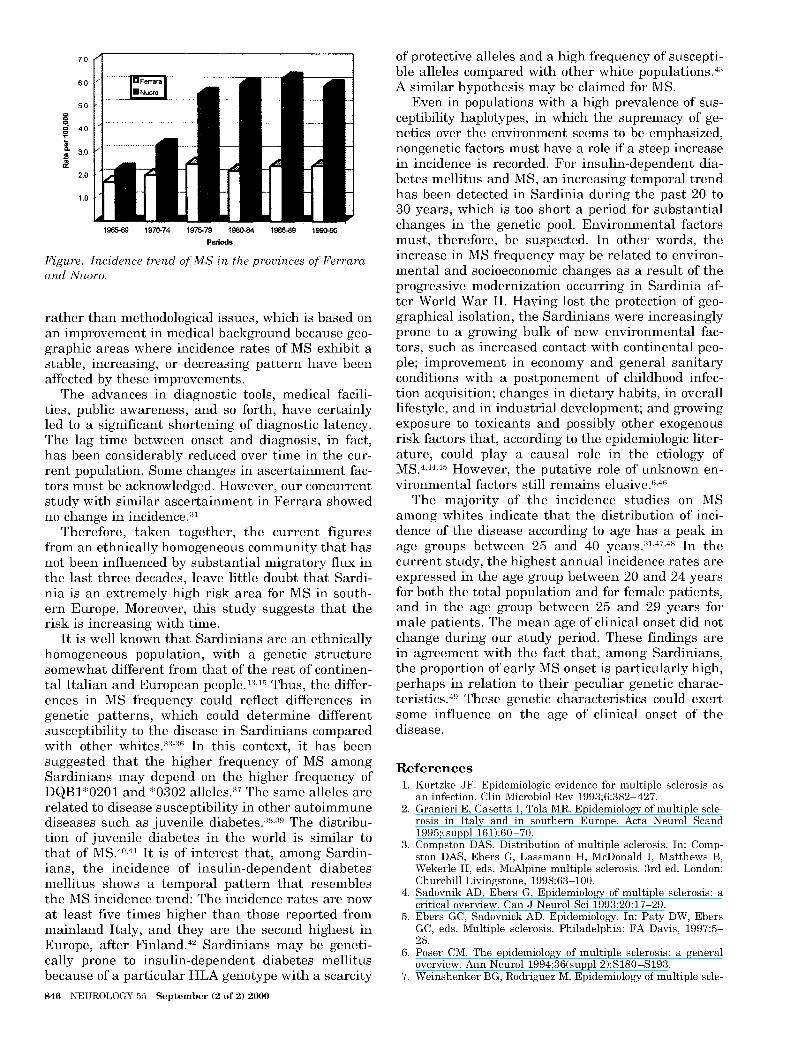
Moreover, substantial stability of incidence rateswas demonstrated in an analogous study, which weperformed using the same methodology in the prov-ince of Ferrara-in northeastern mainland Italy-where, on par with the current study area and in therest of Italy, new diagnostic tools have become avail-able during the last 15 years (figure). However, dif-ferences in case ascertainment as a result of newdiagnostic technology were reduced by using clinicalinclusion criteria, 19,20 which are strictly clinical and notinfluenced significantly by time-dependent use of mod-ern laboratory and imaging investigations. It is nowaccepted that the overall epidemiologic figures remainessentially unchanged when using either clinical crite-ria or the diagnostic criteria of Poser et al.32
Thus, a real change in disease frequency seems tobe a more likely explanation for the upward trend
September (2 of 2) 2000 NEUROLOGY 55 845
7.0
6.0
5.0
0g 4.0
3.0
2.0
1.0
1965-69 1970-74 1975-79 1980-84 198589 1990-95
Periods
Figure. Incidence trend of MS in the provinces of Ferraraand Nuoro.
rather than methodological issues, which is based onan improvement in medical background because geo-graphic areas where incidence rates of MS exhibit astable, increasing, or decreasing pattern have beenaffected by these improvements.
The advances in diagnostic tools, medical facili-ties, public awareness, and so forth, have certainlyled to a significant shortening of diagnostic latency.The lag time between onset and diagnosis, in fact,has been considerably reduced over time in the cur-rent population. Some changes in ascertainment fac-tors must be acknowledged. However, our concurrentstudy with similar ascertainment in Ferrara showedno change in incidence.3"
Therefore, taken together, the current figuresfrom an ethnically homogeneous community that hasnot been influenced by substantial migratory flux inthe last three decades, leave little doubt that Sardi-nia is an extremely high risk area for MS in south-ern Europe. Moreover, this study suggests that therisk is increasing with time.
It is well known that Sardinians are an ethnicallyhomogeneous population, with a genetic structuresomewhat different from that of the rest of continen-tal Italian and European people. 13 • 15 Thus, the differ-ences in MS frequency could reflect differences ingenetic patterns, which could determine differentsusceptibility to the disease in Sardinians comparedwith other whites. 33 - 36 In this context, it has beensuggested that the higher frequency of MS amongSardinians may depend on the higher frequency ofDQB1*0201 and *0302 alleles. 37 The same alleles arerelated to disease susceptibility in other autoimmunediseases such as juvenile diabetes. 338 ' 339 The distribu-tion of juvenile diabetes in the world is similar tothat of MS.
40,41 It is of interest that, among Sardin-
ians, the incidence of insulin-dependent diabetesmellitus shows a temporal pattern that resemblesthe MS incidence trend: The incidence rates are nowat least five times higher than those reported frommainland Italy, and they are the second highest inEurope, after Finland. 42 Sardinians may be geneti-cally prone to insulin-dependent diabetes mellitusbecause of a particular HLA genotype with a scarcity
846 NEUROLOGY 55 September (2 of 2) 2000
of protective alleles and a high frequency of suscepti-ble alleles compared with other white populations.43A similar hypothesis may be claimed for MS.
Even in populations with a high prevalence of sus-ceptibility haplotypes, in which the supremacy of ge-netics over the environment seems to be emphasized,nongenetic factors must have a role if a steep increasein incidence is recorded. For insulin-dependent dia-betes mellitus and MS, an increasing temporal trendhas been detected in Sardinia during the past 20 to30 years, which is too short a period for substantialchanges in the genetic pool. Environmental factorsmust, therefore, be suspected. In other words, theincrease in MS frequency may be related to environ-mental and socioeconomic changes as a result of theprogressive modernization occurring in Sardinia af-ter World War II. Having lost the protection of geo-graphical isolation, the Sardinians were increasinglyprone to a growing bulk of new environmental fac-tors, such as increased contact with continental peo-ple; improvement in economy and general sanitaryconditions with a postponement of childhood infec-tion acquisition; changes in dietary habits, in overalllifestyle, and in industrial development; and growingexposure to toxicants and possibly other exogenousrisk factors that, according to the epidemiologic liter-ature, could play a causal role in the etiology ofMS.
4,44,45 However, the putative role of unknown en-
vironmental factors still remains elusive.6,46The majority of the incidence studies on MS
among whites indicate that the distribution of inci-dence of the disease according to age has a peak inage groups between 25 and 40 years. ' 47 '48 In thecurrent study, the highest annual incidence rates areexpressed in the age group between 20 and 24 yearsfor both the total population and for female patients,and in the age group between 25 and 29 years formale patients. The mean age of clinical onset did notchange during our study period. These findings arein agreement with the fact that, among Sardinians,the proportion of early MS onset is particularly high,perhaps in relation to their peculiar genetic charac-teristics. 49 These genetic characteristics could exertsome influence on the age of clinical onset of thedisease.
References1. Kurtzke JF. Epidemiologic evidence for multiple sclerosis as
an infection. Clin Microbiol Rev 1993;6:382-427.2. Granieri E, Casetta I, Tola MR. Epidemiology of multiple scle-
rosis in Italy and in southern Europe. Acta Neurol Scand1995;(suppl 161):60-70.
3. Compston DAS. Distribution of multiple sclerosis. In: Comp-ston DAS, Ebers G, Lassmann H, McDonald I, Matthews B,Wekerle H, eds. McAlpine multiple sclerosis. 3rd ed. London:Churchill Livingstone, 1998:63-100.
4. Sadovnik AD, Ebers G. Epidemiology of multiple sclerosis: acritical overview. Can J Neurol Sci 1993;20:17-29.
5. Ebers GC, Sadovnick AD. Epidemiology. In: Paty DW, EbersGC, eds. Multiple sclerosis. Philadelphia: FA Davis, 1997:5-28.
6. Poser CM. The epidemiology of multiple sclerosis: a generaloverview. Ann Neurol 1994;36(suppl 2):S180—S193.
7. Weinshenker BG, Rodriguez M. Epidemiology of multiple scle-
rosis. In: Gorelick PB, Alter M, eds. Handbook of neuroepide-miology. New York: Marcel Dekker, 1994:533-567.
8. Granieri E, Rosati G. Italy. A medium- or high-risk area formultiple sclerosis? An epidemiological study in Barbagia, Sar-dinia, southern Italy. Neurology 1982;32:466-472.
9. Granieri E, Rosati G, Tola R, et al. The frequency of multiplesclerosis in Mediterranean Europe. An incidence and preva-lence study in Barbagia, Sardinia, insular Italy. Acta NeurolScand 1983;68:84-89.
10. Rosati G, Aiello I, Granieri E, et al. Incidence of multiplesclerosis in Macomer, Sardinia, 1912-1981. Neurology 1986;36:14-19.
11. Rosati G, Aiello I, Mannu L, et al. Incidence study of multiplesclerosis in the town of Sassari, Sardinia, 1965 to 1985: evi-dence for increasing occurrence of the disease. Neurology1988;38:384-388.
12. Rosati G, Aiello I, Pirastru MI, et al. Epidemiology of multiplesclerosis in northwestern Sardinia: further evidence for higherfrequency in Sardinians compared with other Italians. Neuro-epidemiology 1996;15:10-19.
13. Cavalli-Sforza LL, Menozzi P, Piazza A, eds. The history andgeography of human genes. Princeton: Princeton UniversityPress, 1994.
14. Compston DAS. Genetic susceptibility to multiple sclerosis.In: Compston DAS, Ebers G, Lassmann H, McDonald I, Mat-thews B, Wekerle H, eds. McAlpine multiple sclerosis. 3rd ed.London: Churchill Livingstone, 1998:101-142.
15. Piazza A, Mayr WC, Contu L, et al. Genetic and populationstructure of four Sardinian villages. Ann Hum Genet 1985;49:47-63.
16. Olivetti E, Rendine S, Cappello N, et al. The HLA system inItaly. Hum Hered 1986;36:357-372.
17. Zei G, Guglielmino Matessi R, Siri E, et al. Surnames inSardinia. 1. Fit of frequency distribution for neutral allelesand genetic population structure. Ann Hum Genet 1983;47:329-352.
18. Poser CM, Paty DW, Scheinberg L, et al. New diagnosticcriteria for multiple sclerosis: guidelines for research proto-cols. Ann Neurol 1983;13:227-231.
19. Allison RS, Millar JHD. Prevalence of multiple sclerosis innorthern Ireland. Ulster Med J 1954;23(suppl 2):1-92.
20. Schumacher GA, Bebe G, Kibler RF. Problems of experimen-tal trials in therapy in multiple sclerosis: report by panel onthe evaluation of experimental trials of therapy in multiplesclerosis. Ann NY Acad Sci 1965;122:552-568.
21. Schoenberg BS. Calculating confidence intervals for rates andratios: simplified method utilizing tabular values based in thePoisson distribution. Neuroepidemiology 1983;2:257-265.
22. Waterhause J, Muir C, Shanmungaratham K, Powell J. Can-cer incidence in five continents. IARC Sci Publ 1982;4:673-674.
23. Armitage P. Tests for linear trends in proportions and fre-quencies. Biometrics 1955;11:375-386.
24. Kurtzke JF. Further notes on disability evaluation in multiplesclerosis, with scale modifications. Neurology 1965;15:654-661.
25. Kurtzke JF. Multiple sclerosis epidemiology world wide: oneview of current status. Acta Neurol Scand 1995;161(suppl):23-33.
26. Hanau R. Sull'etiopatogenesi della sclerosi multipla, in rap-porto all'ambiente di vita della popolazione sarda. G PsichiatrNeuropatol 1961;89:29-67.
27. Mapelli G. Su di alcuni aspetti geomedici della sclerosi aplacche nella Sardegna centro-settentrionale. Riv Pat NeryMent 1963;83:253-275.
28. Rosati G, Pinna L, Granieri E, et al. The geographical distri-
bution of multiple sclerosis in Sardinia. Riv Pat Nery Ment1977;98:46-64.
29. Rosati G, Granieri E, Pinna L, et al. The geographical distri-bution of multiple sclerosis, rheumatoid arthritis, rheumaticheart disease and poststreptococcal nephritis in Sardinia: cli-matic and socioeconomic conditions. J Neurol 1978;219:27-35.
30. Stazio A, Paddeson RM, Kurland LT, et al. Multiple sclerosisin New Orleans, LA, and Winnipeg, MAN: follow-up of a pre-vious survey. J Chronic Dis 1967;20:311-332.
31. Granieri E, Malaga S, Casetta I, et al. Multiple sclerosis inItaly. A reappraisal of incidence and prevalence in Ferrara.Arch Neurol 1996;53:793-798.
32. Poser S, Scheidt P, Kitze B, et al. Impact of magnetic reso-nance imaging (MRI) on the epidemiology of MS. Acta NeurolScand 1991;83:172-175.
33. Granieri E, Conighi C, Tola MR, et al. HLA and multiplesclerosis in Italy. Two population studies in northern andinsular Italy. Acta Neurol 1987;9:124-133.
34. Marrosu MG, Muntoni F, Murru MR, et al. Sardinian multi-ple sclerosis is associated with HLA-DR4: a serologic and mo-lecular analysis. Neurology 1988;38:1749-1753.
35. Marrosu MG, Muntoni F, Murru MR, et al. Role of predispos-ing and protective HLA-DQA and HLA-DQB alleles in Sardi-nian multiple sclerosis. Arch Neurol 1993;50:256-260.
36. Haegert DG, Muntoni F, Murru MR, et al. HLA-DQA1 and-DQB1 associations with multiple sclerosis in Sardinia andFrench Canada: evidence for immunogenetically distinct pa-tient groups. Neurology 1993;43:548-552.
37. Marrosu MG, Muntoni F, Murru MR, et al. HLA-DQB1 geno-type in Sardinian multiple sclerosis: evidence for a key role ofDQB1 0201 and 0302 alleles. Neurology 1992;42:883-886.
38. Todd JA, Bell JI, McDevitt HO. HLA-DQbeta gene contributesto susceptibility and resistance to insulin-dependent diabetesmellitus. Nature 1987;329:599-604.
39. Rotter JI, Vadheim CM, Rimoin DL. Genetics of diabetes mel-litus. In: Rifkin H, Porte D Jr, eds. Ellenberg and Rifkin'sdiabetes mellitus: theory and practice. 4th ed. New York:Elsevier, 1990:378-413.
40. Rewers M, La Porte RE, King H, et al. Trends in the preva-lence and incidence of diabetes: insulin-dependent diabetesmellitus in childhood. World Health Stat Q 1988;41:179-189.
41. Bennett PH. Epidemiology of diabetes mellitus. In: Rifkin H,Porte D Jr, eds. Ellenberg and Rifkin's diabetes mellitus: the-ory and practice. 4th ed. New York: Elsevier, 1990:353-377.
42. Muntoni S, Songini M, Sardinian Collaborative Group for Ep-idemiology of IDDM. High incidence rate of IDDM in Sardi-nia. Diabetes Care 1992;15:1317-1322.
43. Muntoni S, Fonte MT, Stoduto S, et al. Incidence of insulin-dependent diabetes mellitus among Sardinian-heritage chil-dren born in Lazio region, Italy. Lancet 1997;349:160-162.
44. Lowis GW. The social epidemiology of multiple sclerosis. SciTotal Environ 1990;90:163-190.
45. Granieri E. The epidemiologic study of exogenous factors in inthe etiology of multiple sclerosis: introduction. Neurology1997;49(suppl 2):S1-S3.
46. Poser CM. Notes on the pathogenesis of multiple sclerosis.Clin Neurosci 1994;2:258-265.
47. Baum HM, Rothschild BB. The incidence and prevalence ofreported multiple sclerosis. Ann Neurol 1981;10:420-428.
48. Koch-Henriksen N, Bronnum-Hansen H, Hyllested K. Inci-dence of multiple sclerosis in Denmark 1948-1982: a descrip-tive nationwide study. Neuroepidemiology 1992;11:1-10.
49. Marrosu MG, Spinicci G, Pischedda MP, et al. High preva-lence of childhood-onset multiple sclerosis in Sardinian cases.In: Battaglia M, ed. An update on multiple sclerosis. Rome:AISM, 1988:33. Abstract.
September (2 of 2) 2000 NEUROLOGY 55 847
NEUROLOGY
High incidence and increasing prevalence of MS in Enna (Sicily), southern ItalyL. M.E. Grimaldi, G. Salemi, G. Grimaldi, A. Rizzo, R. Marziolo, C. Lo Presti, D.
Maimone and G. SavettieriNeurology 2001;57;1891-1893
This information is current as of October 3, 2007
The online version of this article, along with updated information and services, islocated on the World Wide Web at:
http://www.neurology.org/cgi/content/full /57/10/1891
Neurology® is the official journal of the American Academy of Neurology. Published continuouslysince 1951, it is now a weekly with 48 issues per year. Copyright © 2001 by AAN Enterprises, Inc.All rights reserved. Print ISSN: 0028-3878. Online ISSN: 1526-632X.
AMERICAN ACADEMY OF
NEUROLOGY
Downloaded from www.neurology.org by guest on October 3, 2007
High incidence and Article abstract-Twenty years after a first survey, a follow-up study wasperformed on the prevalence of MS in Enna (Sicily), southern Italy. The
increasing prevalence prevalence of definite MS rose from 53 to 120.2 per 100,000 population. The
of MS in Enna (Sicily), incidence of definite MS for the period 1986 to 1995 was 5.7 per 100,000 per
southern Italy year. The innermost part of Sicily shows an elevated prevalence of MS,second only to Sardinia in the Mediterranean area.
NEUROLOGY 2001;57:1891-1893
L.M.E. Grimaldi, MD; G. Salemi, MD; G. Grimaldi, MD; A. Rizzo, MD; R. Marziolo, MD; C. Lo Presti, MD;
D. Maimone, MD; and G. Savettieri, MD
Epidemiologic studies performed in the past decadesindicate that the latitude-related model proposed tointerpret the distribution of MS 1 does not apply tomany regions of the Mediterranean area. Sicily andSardinia, the two major Mediterranean islands,show an elevated frequency of MS and a recent in-crease in disease frequency. 2 -8 The prevalence of MSin rural areas of Sardinia reaches the rate of 151.9per 100,000 population. 2 The highest prevalence re-ported in Sicily so far has been in the town of Mon-reale (72.4 per 100,000 population). 7 The most recentincidence rates range from 3.3 (Sicily) to 4.2(Sardinia).2'7
The first survey demonstrating an unexpectedlyhigh prevalence of MS in Sicily was performed inEnna 25 years ago. To confirm the rise of MS prev-alence in the Mediterranean area we assessed theprevalence and incidence of MS in a follow-up studybased on the town of Enna.
Materials and methods. Area of investigation. Thecity of Enna is located in central Sicily, at the top of amountain (mean altitude, 931 m above the sea). The popu-lation, on prevalence day December 31, 1995, was 28,273inhabitants. The population on December 31, 1975 (i.e.,prevalence day of the previous study) was 28,189 inhabit-ants, indicating a substantial stability of this community.The size and the structure of the population did not changeover 20 years. We asked the Regional Epidemiologic Officefor particular events occurring in Enna during the past 25years (epidemics, changes in daily living, migrationalflows, diet).
The national health care system was established in thisarea in 1946. The level of public medical care is relativelyhigh: Enna hosts a general hospital with a neurology unit;other neurologic outpatient services and rehabilitation fa-cilities are available in the area.
From the Department of Neuroscience (Dr. L. Grimaldi), Azienda UnitaSanitaria Locale 2, Caltanissetta; Institute of Neuropsychiatry (Drs. Salemiand Savettieri), University of Palermo; Neurology Unit (Drs. G. Grimaldiand Rizzo), Umberto I Hospital, Enna; Neurology Unit (Dr. Marziolo),Sant'Elia Hospital, Caltanissetta; Sicilian Rehabilitation Consortium (Dr.Lo Presti), Enna; and Neurology Unit (Dr. Maimone), Garibaldi Hospital,Catania, Italy.
Received April 16, 2001. Accepted in final form August 7, 2001.
Address correspondence and reprint request to Dr. G. Savettieri, Instituteof Neuropsychiatry, University of Palermo, Via Gaetano La Loggia 1-90129Palermo, Italy; e-mail: [email protected]
Case collection and ascertainment. We employed vari-ous strategies to identify people suspected of having MS inthe town of Enna. The prevalence survey performed in1975 constituted the basis for the present survey. Wemade a formal diagnostic reappraisal of all living patientsconsidered in the original study. Personal contacts wereundertaken with all general practitioners and neurologistspracticing in Enna. The population was also informedthrough local TV. The local chapter of the Italian MS Asso-ciation was involved in the study and contributed to theidentification of patients. Archives of the Neurologic Unitof the Enna Hospital, of all major MS centers of Italy, andof all centers of rehabilitation located in Enna weresearched. Patients were classified according to the criteriaof Poser et al.9
Data analysis. To calculate prevalence ratios, wesearched for patients with MS who were living and resi-dent in the study area on December 31, 1995. Crude aswell as age- and sex-specific prevalence ratios were calcu-lated. Clinical features were also recorded.
Crude as well as age- and sex-specific incidence ratioswere computed for the period January 1, 1986 to December31, 1995.
Results. On December 31, 1995, 34 patients with clini-cally definite MS (15 men, 19 women) were resident in thestudy area. Five of them were the survivors of the 15subjects with definite MS identified during the 1975 sur-vey. In four subjects, MS began before January 1, 1975,but at that time they were not found and, as a conse-quence, not included in the previous study.
The mean age at onset was 24.3 years (range, 9 to 41years), 25.3 years for men and 23.5 years for women. Themean age on prevalence day was 37.6 years (range, 19 to67 years), 38.1 years for men and 35.4 years for women.The mean interval between onset of the disease and diag-nosis was 4.2 years (range, 1 to 15 years); it was higher inmen (5.7 years) than in women (3.0 years). The averageduration of MS from onset to prevalence day was 12.7years (range, 1 to 32 years), 13.0 years for men and 12.4years for women.
The overall prevalence was 120.2 per 100,000 popula-tion (95% CI, 83.8 to 167.2), 110.5 for men and 129.2 forwomen. Age-specific prevalence was higher between 25and 54 years and decreased thereafter (table 1).
Twenty-three patients have a relapsing-remittingcourse of disease; 10 patients were affected by a secondaryprogressive form, and one patient had a primary diseaseprogressive course.
Onset-adjusted prevalence calculated for the 1975 study
Copyright © 2001 by AAN Enterprises, Inc. 1891Downloaded from www.neurology.org by guest on October 3, 2007

Table 1 Age- and sex-specific prevalence of MS in Enna as of December 31, 1995
Age, y Cases, n
Men
PopulationPrevalence
(per 100,000) Cases, n
Women
PopulationPrevalence
(per 100,000) Cases, n
Both sexes
PopulationPrevalence
(per 100,000)
0-14 0 2,757 - 0 2,604 - 0 5,361 -
15-24 2 2,230 89.7 3 2,202 136.2 5 4,432 112.8
25-34 5 1,985 251.9 6 2,149 279.2 11 4,134 266.1
35-44 3 1,947 154.1 5 2,103 237.8 8 4,050 197.5
45-54 3 1,558 192.5 5 1,741 287.2 8 3,299 242.5
55-64 1 1,412 70.8 0 1,722 - 1 3,134 31.9
65-74 1 1,013 98.8 0 1,264 - 1 2,277 43.9
75+ 0 667 - 0 919 - 0 1,586 -
Total 15 13,569 110.5 19 14,704 129.2 34 28,273 120.2
was 67.4 per 100,000 population. Table 2 shows the age-specific, onset-adjusted prevalence on January 1, 1975.
Between January 1, 1986 and December 31, 1995, 16subjects (seven men and nine women) living in the studyarea had their first symptoms of MS. The average annualincidence was 5.7 per 100,000 population (95% CI, 2.0 to10.5), 5.1 for men and 6.1 for women. Sex- and age-specificincidence ratios of MS in Enna are shown in table 3. Thehighest ratio was observed in the age group 15 to 24 years.
The mean period between the onset and the diagnosis ofthe disease among incident patients was 3.0 years; it washigher in women (4.0 years) than in men (1.7 years). No
HLA characterization of the population of Enna is avail-
Table 2 Age-specific, onset-adjusted prevalence of MS in Enna atJanuary 1, 1975
PrevalenceAge, y Cases, n Population (per 100,000)
0-14 0 7,403 -
15-34 12 8,266 145.2
35-54 5 6,630 75.4
55-74 2 4,869 41.1
75+ 0 1,021 -
Total 19 28,189 67.4
able at present. No epidemics, changes of daily living, or
variation of migrational flows or diet have been recorded.
Discussion. We found a prevalence of 120.2 per100,000 and an incidence ratio of 5.7 per 100,000population in Enna City. These are among the high-est ratios found in the Mediterranean area (secondonly to Sardinia and at the level of northern Euro-pean countries) and confirm the high frequency ofMS in Sicily. Nonetheless, we might have even un-derestimated the ratios of MS in this area: assumingthe common male:female ratio of about 1:2, the ex-pected number of women with MS should have beenhigher than the observed. This discrepancy could berelated to a selective underreporting.
As in Sardinia2 and in Monreale, 7 the city of Ennashows an increase in MS prevalence. It is unknownwhether this increase depends on a true change inMS frequency, related to environmental or socioeco-nomic changes, or reflects an improved case ascer-tainment depending on greater awareness and onnew and more sophisticated diagnostic procedures.Incidence remained stable along the incidence periodstudied (1986 to 1995). Although the interval be-tween the onset and the diagnosis of MS was 3.9
Table 3 Age- and sex-specific average annual incidence rates of MS in Enna (January 1, 1986-December 31, 1995)
Men Women Both sexes
Incidence Incidence IncidenceAge, y Cases, n Person-years* (100,000) Cases, n Person-years* (100,000) Cases, n Person-years* (100,000)
0-14 0 27,570 - 1 26,040 3.8 1 53,610 1.9
15-24 4 22,300 17.9 5 22,020 22.7 9 44,320 20.3
25-34 3 19,850 15.1 2 21,490 9.3 5 41,340 12.1
35-44 0 19,470 - 1 21,030 4.7 1 40,500 2.5
45+ 0 46,500 - 0 56,460 - 0 102,960 -
Total 7 135,690 5.1 9 147,040 6.1 16 282,730 5.7
Person-year counts were obtained by multiplying the corresponding population figures as of the prevalence day (December 31, 1995)by 10.
1892 NEUROLOGY 57 November (2 of 2) 2001Downloaded from www.neurology.org by guest on October 3, 2007

years in the period 1986 to 1990 and 2.1 years in theperiod 1991 to 1995 (indicating an improvement indiagnostic efficiency), the twofold increase in preva-lence observed over 20 years strongly suggests a realincrease in the disease frequency. Unfortunately, the lackof previous data on the incidence of MS in Enna or thechanges in lag time between the onset and the diag-nosis, precludes comparison with the previous study.
The incidence found in Enna, together with thatreported in two other Sicilian cities (Monreale 7 andBagherias), is comparable to that reported either inSardinia2 or in Northern European countries; thisfurther supports the high frequency of MS in thisMediterranean island. The Regional EpidemiologicOffice has not detected particular events occurring inEnna during the past 20 years. Genetic predisposi-tion might, indeed, play a role in the recorded ele-vated frequency of MS. Because Enna was one of themajor centers of the Viking domination in Sicily, ourdata support Poser's 10 hypothesis on the contributionof Viking migrations to the dissemination of MS.
Acknowledgment
The authors thank the local branch of the Italian MS Association,and especially its former president, Dr. Angelo Campanile. Theyalso thank all the people, practitioners, and institutions thathelped them during this study.
References
1. Kurtzke JF. Epidemiology of multiple sclerosis. In: Vinken PJ,Bruyn GW, Klawans HL, eds. Handbook of clinical neurology.Amsterdam: Elsevier, 1985:259-287.
2. Granieri E, Casetta I, Govoni V, et al. The increasing inci-dence and prevalence of MS in a Sardinian province. Neurol-ogy 2000,55:842-848.
3. Dean G, Grimaldi G, Kelly R, Karhausen L. Multiple sclerosisin southern Europe: I: prevalence in Sicily in 1975. J Epide-miol Community Health 1979:33:107-110.
4. Dean G, Savettieri G, Giordano D, et al. The prevalence ofmultiple sclerosis in Sicily: II: Agrigento city. J EpidemiolCommunity Health 1981,35:118-122.
5. Savettieri G, Daricello B, Giordano D, Karhausen L, Dean G.The prevalence of multiple sclerosis in Sicily: I: Monreale city.J Epidemiol Community Health 1981,35:114-117.
6. Savettieri G, Elian M, Giordano D, Grimaldi G, Ventura A,Dean G. A further study on the prevalence of multiple sclero-sis in Sicily: Caltanissetta city. Acta Neurol Scand 1986,73:71-75.
7. Savettieri G, Salemi G, Ragonese P, Aridon P, Scola G, Ran-disi G. Prevalence and incidence of multiple sclerosis in Mon-reale city, Italy. J Neurol 1998,245:40-43.
8. Salemi G, Ragonese P, Aridon P, et al. Incidence of multiplesclerosis in Bagheria City, Sicily, Italy. Neurol Sci 2000,21:361-365.
9. Poser CM, Paty DW, Scheinberg L, et al. New diagnostic cri-teria for multiple sclerosis: guidelines for research protocols.Ann Neurol 1983,13:227-231.
10. Poser CM. The dissemination of multiple sclerosis: a Vikingsaga? A historical essay. Ann Neurol 1994,36(suppl 2):5231-S243.
Polymorphisms in thevicinity of the
hypocretin/orexin arenot associated withhuman narcolepsy
Article abstract-Human narcolepsy/cataplexy is associated with reducedhypocretin (orexin) transmission. A common preprophypocretin (HCRT) poly-morphism (-909C/T) was identified and tested in 502 subjects (105 triofamilies, 80 Caucasian narcolepsy cases, and 107 Caucasian control subjects).This polymorphism was not associated with the disease. The promoter and 5'untranslated (5'URT) regions of the HCRT gene (-320 to +21 from ATG)were also sequenced in 281 subjects. None of the subjects carried -22T, arare 5'UTR polymorphism previously reported to be associated with narco-lepsy. The HCRT locus is not a major narcolepsy susceptibility locus.
NEUROLOGY 2001;57:1893-1895
Marcel Hungs, MD, PhD; Ling Lin, MD, PhD; Michele Okun, MA; and Emmanuel Mignot, MD, PhD
Narcolepsy is characterized by excessive daytimesleepiness, cataplexy (a pathognomonic symptom),hypnagogic hallucinations, and sleep paralysis. Nar-colepsy/cataplexy affects 1/2,000 and usually beginsduring adolescence. 4 The disorder is tightly associatedwith HLA, suggesting an autoimmune mediation.,'
From the Stanford Center for Narcolepsy, Department of Psychiatry andBehavioral Sciences, Stanford University Medical Center, CA.
Supported by NIH (NS23724, NS33797, and HL59601) (E.M.) and DeutscheForschungsgemeinschaft (DFG-HU 827/2-1) (M.H.).
Received May 1, 2001. Accepted in final form August 1, 2001.
Address correspondence and reprint requests to Dr. E. Mignot, StanfordCenter for Narcolepsy, Department of Psychiatry and Behavioral Sciences,Stanford University Medical Center, 1201 Welch Road, Rm. P-114, Stan-ford, CA 94305-5485; e-mail: [email protected]
Most human cases have no family history, and monozy-gotic twins are frequently discordant, suggesting com-plex genetic inheritance and environmental effects.4
Recent studies have demonstrated a major role forhypocretins in the pathophysiology of narcolepsy. 2 Agenetically determined canine model is associated withhypocretin receptor-2 mutations. 33 In humans,hypocretin-1 is undetectable in the CSF of most cases.2Most strikingly, recent neuropathologic studies indi-cate an almost complete loss of hypocretin (HCRT)mRNA and peptides in human narcoleptic brains.6
In humans, hypocretin abnormalities are rarelydue to HCRT gene alterations. 6 An extensive muta-tion screening study in 74 selected cases identified asingle mutation in the signal sequence of the HCRT
Copyright © 2001 by AAN Enterprises, Inc. 1893Downloaded from www.neurology.org by guest on October 3, 2007
High incidence and increasing prevalence of MS in Enna (Sicily), southern ItalyL. M.E. Grimaldi, G. Salemi, G. Grimaldi, A. Rizzo, R. Marziolo, C. Lo Presti, D.
Maimone and G. SavettieriNeurology 2001;57;1891-1893
This information is current as of October 3, 2007
Updated Information including high-resolution figures, can be found at:& Services http:// -Nv.neurology.org/cgi/content/full/57/10/1891
Subspecialty Collections This article, along with others on similar topics, appears in thefollowing collection(s):Multiple sclerosishttp://«-Nv-Nv.neurology.org/cgi/collection/multiple sclerosis Allepidemiologyhttp://«-Nv-Nv.neurology.org/cgi/collection/all epidemiologyPrevalence studieshttp://«-Nv-Nv.neurology.org/cgi/collection/prevalence studiesIncidence studieshttp://«-Nv-Nv.neurology.org/cgi/collection/incidence studies
Permissions & Licensing Information about reproducing this article in parts (figures,tables) or in its entirety can be found online at:http://vvvvvv.neurology.org/misc/Permissions.shtmI
Reprints Information about ordering reprints can be found online:http://«-Nv-Nv.neurology. org/mi sc/reprints. shtm l
AMERICAN ACADEMY OF
NEUROLOGY
Downloaded from www.neurology.org by guest on October 3, 2007