High Pressure Investigations on Some Geophysically relevant ...
242
HIGH PRESSURE INVESTIGATIONS ON SOME GEOPHYSICALLY RELEVANT MATERIALS By AJAY KUMAR MISHRA PHYS01200804013 High Pressure & Synchrotron Radiation Physics Division Bhabha Atomic Research Centre Mumbai - 400085 INDIA A thesis submitted to the Board of Studies in Physical Sciences In partial fulfillment of requirements For the Degree of DOCTOR OF PHILOSOPHY of HOMI BHABHA NATIONAL INSTITUTE May, 2013
-
Upload
khangminh22 -
Category
Documents
-
view
4 -
download
0
Transcript of High Pressure Investigations on Some Geophysically relevant ...
HIGH PRESSURE INVESTIGATIONS ON SOME GEOPHYSICALLY
RELEVANT MATERIALS
By
AJAY KUMAR MISHRA
PHYS01200804013
High Pressure & Synchrotron Radiation Physics Division
Bhabha Atomic Research Centre
Mumbai - 400085
INDIA
A thesis submitted to the
Board of Studies in Physical Sciences
In partial fulfillment of requirements
For the Degree of
DOCTOR OF PHILOSOPHY
of
HOMI BHABHA NATIONAL INSTITUTE
May, 2013


Dedicated
to
My family
vi

ACKNOWLEDGEMENTS
At the outset I would like to thank all the people who have helped and motivated me
in any form during my doctoral thesis work.
My guide Prof. Surinder M. Sharma has played a crucial role in making my thesis
a reality. This thesis would not have been completed without his immense help. His
constant motivation encouraged me to complete my work enthusiastically. I would
also like to extend my thanks to the members of my doctoral committee; Prof. C.
S. Sunder, Prof. S. K. Gupta, Prof. S. L. Chaplot and Prof. S. C. Gupta for their
valuable suggestions and comments during long review sessions.
I am happy to have some wonderful colleagues like K.V. Shanavas, K. K. Pandey
and H K Poswal at my work place. I have learnt a lot through several insightful and
lively discussions with them. I am extremely grateful to Dr. Nandini Garg and Dr.
Chitra Murli, who have helped me in learning the basics of high pressure experiments.
In addition, I would also like to pay my sincere gratitude to both of them for critically
going through some of my chapters of the Thesis and for giving valuable suggestion
to improve upon.
I thank my all collaborators, teachers and persons who have helped me by sharing
their expertise and knowledge with me.
Last but not least, I would like to thank my parents and my elder brother for
supporting me throughout my life. I would like to express my very special thanks to
my wife Anita (Khusbu), for always being with me in all situations and for bearing
with me patiently during the writing of this thesis.

viii

Contents
Contents
Contents ix
List of Figures xv
List of Tables xxv
Synopsis xxviii
1 Introduction 3
1.1 Introduction to high pressure physics . . . . . . . . . . . . . . . . . . 3
1.2 Pressure as a Thermodynamic Variable . . . . . . . . . . . . . . . . . 6
1.3 An overview of high Pressure Research in Materials . . . . . . . . . . 9
1.4 Crystallography under High Pressure . . . . . . . . . . . . . . . . . . 17
1.5 Phase Stability and High Pressure . . . . . . . . . . . . . . . . . . . . 22
1.6 High Pressure Generation and measurements . . . . . . . . . . . . . . 25
1.6.1 High pressure Cells . . . . . . . . . . . . . . . . . . . . . . . . 25
1.6.2 Diamond anvil cell . . . . . . . . . . . . . . . . . . . . . . . . 25
1.6.3 Background for high pressure experiments . . . . . . . . . . . 28
1.6.3.1 Alignment of the DAC . . . . . . . . . . . . . . . . . 28
1.6.3.2 Choice of the gasket material . . . . . . . . . . . . . 29
1.6.3.3 Pressure transmitting medium . . . . . . . . . . . . . 31
1.6.3.4 Pressure calibration . . . . . . . . . . . . . . . . . . 32
ix

Contents
1.6.4 Synchrotron sources and diffraction technique . . . . . . . . . 37
1.6.4.1 Wavelength selection . . . . . . . . . . . . . . . . . . 38
1.6.4.2 In-situ angle dispersive x-ray diffraction . . . . . . . 39
1.6.4.3 In-situ energy dispersive x-ray diffraction . . . . . . . 43
1.6.5 Raman Spectroscopy . . . . . . . . . . . . . . . . . . . . . . . 44
1.7 Materials Studied . . . . . . . . . . . . . . . . . . . . . . . . . . . . . 48
1.7.1 Zircon Structured Materials . . . . . . . . . . . . . . . . . . . 48
1.7.2 Pyrochlores . . . . . . . . . . . . . . . . . . . . . . . . . . . . 49
1.7.3 Perovskites . . . . . . . . . . . . . . . . . . . . . . . . . . . . 50
1.7.4 Phosphate material . . . . . . . . . . . . . . . . . . . . . . . . 50
1.8 Plan of thesis . . . . . . . . . . . . . . . . . . . . . . . . . . . . . . . 51
2 Phase Transformation in Zircon and scheelite Structured Materials 53
2.1 Zircon Structured Chromates . . . . . . . . . . . . . . . . . . . . . . 54
2.1.1 Structural Details . . . . . . . . . . . . . . . . . . . . . . . . . 54
2.1.2 Introduction . . . . . . . . . . . . . . . . . . . . . . . . . . . . 55
2.1.3 Experimental Details . . . . . . . . . . . . . . . . . . . . . . . 58
2.1.4 Results and Discussion . . . . . . . . . . . . . . . . . . . . . . 59
2.1.4.1 The Raman spectroscopic studies . . . . . . . . . . . 59
2.1.4.2 X-ray diffraction studies at Elettra . . . . . . . . . . 62
2.1.4.3 X-ray diffraction studies at Spring8 . . . . . . . . . . 65
2.1.5 Conclusions . . . . . . . . . . . . . . . . . . . . . . . . . . . . 70
2.2 Scheelite Structured Fluoride . . . . . . . . . . . . . . . . . . . . . . 72
2.2.1 Structural Details . . . . . . . . . . . . . . . . . . . . . . . . . 72
2.2.2 Introduction . . . . . . . . . . . . . . . . . . . . . . . . . . . . 73
2.2.3 Experimental Methods . . . . . . . . . . . . . . . . . . . . . . 74
2.2.4 Results and Discussion . . . . . . . . . . . . . . . . . . . . . . 75
2.2.4.1 Structural Effects . . . . . . . . . . . . . . . . . . . . 75
x

Contents
2.2.4.2 Spectroscopic effects . . . . . . . . . . . . . . . . . . 80
2.2.5 Conclusion . . . . . . . . . . . . . . . . . . . . . . . . . . . . . 84
3 Structural Transition in Frustrated Titanate Pyrochlores 87
3.1 Structural details . . . . . . . . . . . . . . . . . . . . . . . . . . . . . 88
3.2 Introduction . . . . . . . . . . . . . . . . . . . . . . . . . . . . . . . . 89
3.3 Experimental Details . . . . . . . . . . . . . . . . . . . . . . . . . . . 91
3.4 Results and Discussion . . . . . . . . . . . . . . . . . . . . . . . . . . 93
3.4.1 Yb2Ti2O7 . . . . . . . . . . . . . . . . . . . . . . . . . . . . . 93
3.4.1.1 X-ray diffraction measurements . . . . . . . . . . . . 93
3.4.1.2 Raman spectra at high pressures . . . . . . . . . . . 97
3.4.1.3 Conclusions . . . . . . . . . . . . . . . . . . . . . . . 100
3.4.2 Dy2Ti2O7 . . . . . . . . . . . . . . . . . . . . . . . . . . . . . 101
3.4.2.1 Structural effects by XRD . . . . . . . . . . . . . . . 101
3.4.2.2 Raman Spectroscopic effect . . . . . . . . . . . . . . 104
3.4.2.3 Conclusions . . . . . . . . . . . . . . . . . . . . . . . 109
4 Structural Investigation of perovskites 111
4.1 Crystallography of the Perovskite structure . . . . . . . . . . . . . . . 113
4.2 Phase transitions in multiferroic BiFeO3 . . . . . . . . . . . . . . . . 115
4.2.1 Introduction . . . . . . . . . . . . . . . . . . . . . . . . . . . . 115
4.2.2 Methods . . . . . . . . . . . . . . . . . . . . . . . . . . . . . . 116
4.2.3 Results and Discussion . . . . . . . . . . . . . . . . . . . . . . 117
4.2.4 Bulk Modulus . . . . . . . . . . . . . . . . . . . . . . . . . . . 121
4.2.5 Conclusion . . . . . . . . . . . . . . . . . . . . . . . . . . . . . 123
4.3 Structural evolution of Sr2MgWO6 . . . . . . . . . . . . . . . . . . . 124
4.3.1 Structural Details . . . . . . . . . . . . . . . . . . . . . . . . . 124
4.3.2 Introduction . . . . . . . . . . . . . . . . . . . . . . . . . . . . 124
xi

Contents
4.3.3 Methods . . . . . . . . . . . . . . . . . . . . . . . . . . . . . . 125
4.3.4 Results and Discussion . . . . . . . . . . . . . . . . . . . . . . 126
4.3.5 Conclusion . . . . . . . . . . . . . . . . . . . . . . . . . . . . . 131
4.4 Structural stability of BaLiF3 . . . . . . . . . . . . . . . . . . . . . . 132
4.4.1 Introduction . . . . . . . . . . . . . . . . . . . . . . . . . . . . 132
4.4.2 Methods . . . . . . . . . . . . . . . . . . . . . . . . . . . . . . 133
4.4.3 Results and Discussion . . . . . . . . . . . . . . . . . . . . . . 134
4.4.3.1 X-ray diffraction . . . . . . . . . . . . . . . . . . . . 134
4.4.3.2 Bulk modulus by empirical methods . . . . . . . . . 136
4.4.3.3 Comparison with calculations . . . . . . . . . . . . . 140
4.4.4 Conclusions . . . . . . . . . . . . . . . . . . . . . . . . . . . . 143
5 Pressure induced phase transformation in U2O(PO4)2 145
5.1 Introduction . . . . . . . . . . . . . . . . . . . . . . . . . . . . . . . . 145
5.2 Structural Details . . . . . . . . . . . . . . . . . . . . . . . . . . . . . 147
5.3 Methods . . . . . . . . . . . . . . . . . . . . . . . . . . . . . . . . . . 148
5.3.1 Synthesis . . . . . . . . . . . . . . . . . . . . . . . . . . . . . 148
5.3.2 Experiemntal Details . . . . . . . . . . . . . . . . . . . . . . . 149
5.4 Results and Discussion . . . . . . . . . . . . . . . . . . . . . . . . . . 150
5.4.1 Raman Spectroscopy . . . . . . . . . . . . . . . . . . . . . . . 150
5.4.1.1 Raman modes under ambient conditions . . . . . . . 150
5.4.1.2 High Pressure Raman studies . . . . . . . . . . . . . 152
5.4.2 X-ray diffraction studies . . . . . . . . . . . . . . . . . . . . . 158
5.5 Conclusion . . . . . . . . . . . . . . . . . . . . . . . . . . . . . . . . . 162
6 Development of EDXRD Beamline 163
6.1 Introduction . . . . . . . . . . . . . . . . . . . . . . . . . . . . . . . . 163
6.2 Basic Principle . . . . . . . . . . . . . . . . . . . . . . . . . . . . . . 165
xii

Contents
6.3 EDXRD Beamline at Indus-2 . . . . . . . . . . . . . . . . . . . . . . 167
6.3.1 Design and Description . . . . . . . . . . . . . . . . . . . . . . 167
6.3.2 Sample Stage . . . . . . . . . . . . . . . . . . . . . . . . . . . 169
6.4 A few studies at high pressures . . . . . . . . . . . . . . . . . . . . . 171
6.4.1 Natural uranium . . . . . . . . . . . . . . . . . . . . . . . . . 171
6.4.2 Sesquioxides . . . . . . . . . . . . . . . . . . . . . . . . . . . . 172
6.5 Adaptation for high temperature studies . . . . . . . . . . . . . . . . 174
A Structure Determination 177
A.1 Indexing . . . . . . . . . . . . . . . . . . . . . . . . . . . . . . . . . . 178
A.2 Rietveld Refinement . . . . . . . . . . . . . . . . . . . . . . . . . . . 180
B List of Publications 185
References 189
xiii

Contents
xiv

List of Figures
List of Figures
1.1 Schematic of the Pressure Temperature- map of scientific interest . . 4
1.2 Variation of pressure with respect to radius of the earth . . . . . . . . 5
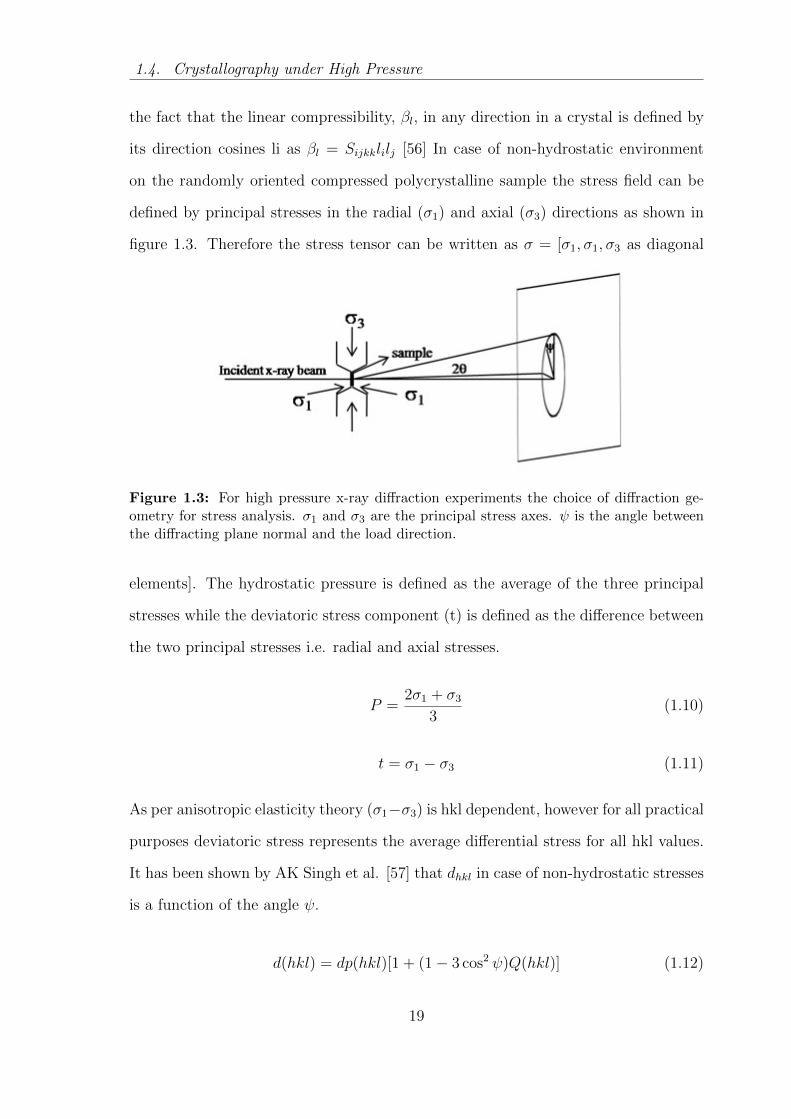
1.3 For high pressure x-ray diffraction experiments the choice of diffraction
geometry for stress analysis. σ1 and σ3 are the principal stress axes. ψ
is the angle between the diffracting plane normal and the load direction. 19
1.4 Configuration of opposed diamond anvil, a pre indented metallic gasket
with a hole is used as a sample chamber. . . . . . . . . . . . . . . . . 26
1.5 The side and top view of a brilliant cut diamond. . . . . . . . . . . . 27
1.6 (a) Hemispherical rocker and (b) cylindrical base plate. . . . . . . . . 28
1.7 schematic diagram of a lab based XRD set up for high pressure XRD
experiments. . . . . . . . . . . . . . . . . . . . . . . . . . . . . . . . . 41
1.8 RAG based high pressure XRD set up at laboratory. . . . . . . . . . 42
1.9 Depiction of stokes and antistokes Raman scattering. . . . . . . . . . 45
1.10 Micro Raman set up in confocal geometry for high pressure Raman
scattering measurement. . . . . . . . . . . . . . . . . . . . . . . . . . 46
1.11 Optical layout of dispersive Raman scattering set up. . . . . . . . . . 47
2.1 Crystal structure of Y CrO4/HoCrO4 in tetragonal zircon phase. . . . 54
2.2 Raman pattern of Y CrO4 at a few representative pressure. . . . . . . 60
2.3 Raman pattern of HoCrO4 at a few representative pressure. . . . . . 61
xv

List of Figures
2.4 Pressure induced variation of Raman shifts of (a) Y CrO4; triangle and
circle represent the prominent Raman mode corresponding to zircon
structure while the inverted triangle and square represent the Raman
modes for scheelite phase and (b) HoCrO4, square and circle represent
the main Raman mode corresponding to zircon and scheelite phase
respectively; here solid lines represent guide to an eye. . . . . . . . . . 62
2.5 Diffraction pattern of YCrO4 at a few representative pressures. . . . . 63
2.6 Diffraction pattern of HoCrO4 at a few representative pressures. . . . 64
2.7 The diffraction pattern of YCrO4 recorded at Spring8 at a few rep-
resentative pressures. The ambient pressure data has been indexed
with respect to the zircon structure. The diffraction peak marked as
(112) at high pressure refers to the scheelite phase. It is apparent that
background increases with pressure. . . . . . . . . . . . . . . . . . . . 66
2.8 The diffraction pattern of HoCrO4, recorded at Spring8 at a few rep-
resentative pressures. The ambient pressure data has been indexed
with respect to the zircon structure. The diffraction peaks of the high
pressure phase have been indicated by arrows. The diffraction peak
marked as (112) at high pressure refers to the scheelite phase. The
background of the lowest pressure phase has been subtracted from all
the subsequent pressure runs. . . . . . . . . . . . . . . . . . . . . . . 67
2.9 The increase in FWHM of some of the diffraction peaks of (a) YCrO4
at 4.6 GPa and (b) HoCrO4 at 6.5 GPa. The FWHM of the (200)
diffraction peak did not increase as the difference between the a and b
cell constants in the monoclinic phase is 0.01 %. . . . . . . . . . . . 68
xvi

List of Figures
2.10 Rietveld fits to the recorded diffraction pattern of YCrO4 at 4.6 GPa
(red) in the monoclinic structure. The blue line shows the subtracted
background and vertical bars give the expected positions of the diffrac-
tion peaks from the sample. The difference in the calculated and exper-
imental diffraction pattern is given at the bottom of the graph (green). 69
2.11 The (a) zircon and (b) monoclinic structure of YCrO4 as determined
from the diffraction data. The γ angle is 90.4◦. The chromium, Yt-
trium and oxygen atoms have been marked as Cr (grey), Y (blue) and
O (red) respectively. . . . . . . . . . . . . . . . . . . . . . . . . . . . 70
2.12 Crystal structure of LiErF4 in tetragonal scheelite phase. . . . . . . . 72
2.13 X-ray diffraction patterns of lithium erbium fluoride stacked at a few
representative pressures. . . . . . . . . . . . . . . . . . . . . . . . . . 76
2.14 Pressure induced variation of c and a lattice parameters of LiErF4 and
BaMoO4 in scheelite phase. Symbols and lines represent observed data
and linear fit to these data respectively. The data for BaMoO4 has been
taken from Panchal et al. 2006 . . . . . . . . . . . . . . . . . . . . . . 77
2.15 Pressure dependence of c/a ratio in the scheelite structure of LiErF4,
LiYF4, BaMoO4 and CaWO4. The data for LiErF4 are from present
study and LiYF4, BaMoO4 and CaWO4 data are taken from references
(Grzechnik et al. 2002, Panchal et al. 2006 and Errandonea et al. 2005)
respectively. . . . . . . . . . . . . . . . . . . . . . . . . . . . . . . . . 78
2.16 The high pressure fergusonite structure of LiErF4 obtained from the
scheelite structure. . . . . . . . . . . . . . . . . . . . . . . . . . . . . 79
2.17 Pressure versus volume of LiErF4. The circles and squares represent
the different experimental runs of the scheelite phase and the triangles
represent the fergusonite phase. The red line represents B-M fit for the
scheelite phase. . . . . . . . . . . . . . . . . . . . . . . . . . . . . . . 80
xvii

List of Figures
2.18 Raman spectra of lithium erbium fluoride stacked at ambient condi-
tions. The asterisk (*) presents the fluorescence for LiErF4. . . . . . . 82
2.19 Raman spectra of lithium erbium fluoride stacked at a few representa-
tive pressures. . . . . . . . . . . . . . . . . . . . . . . . . . . . . . . . 83
2.20 Variation of Raman shifts of LiErF4 with pressure. Solid lines are guide
to eye. . . . . . . . . . . . . . . . . . . . . . . . . . . . . . . . . . . . 84
3.1 (a)Polyhedra of Yb/Dy and Ti and (b)Crystal structure of Yb2Ti2O7/
Dy2Ti2O7 in the cubic phase. . . . . . . . . . . . . . . . . . . . . . . 89
3.2 Geometrical frustration in (a) triangular and (b) tetrahedral spin lat-
tices. (c) represents the spin ice behavior; a pair of spin pointing inward
and another pair of spin pointing outward. . . . . . . . . . . . . . . . 90
3.3 X-ray diffraction profiles of Yb2Ti2O7 at a few representative pressures.
Arrows indicate the x-ray diffraction peaks due to monoclinic phase at
high pressure. . . . . . . . . . . . . . . . . . . . . . . . . . . . . . . . 94
3.4 The observed P-V variation fitted with 3rd order Birch- Murnaghan
(B-M) equation of state for Yb2Ti2O7 pyrochlore and high pressure
monoclinic phase. The red solid line is B-M fit of the experimentally
observed P-V data while the blue dashed line represents the pressure
induced volume variation obtained by the first principles calculations
(Mishra et al. 2012). Upper inset shows the variation of the x-position
parameter of the O48f atoms at various pressures. Lower inset shows
the crystal structure of the high pressure monoclinic phase. . . . . . . 95
3.5 Rietveld refinement of diffraction pattern of Yb2Ti2O7 at 40.4 GPa.
The diffraction pattern consists of contributions from pyrochlore phase,
high pressure monoclinic phase, tungsten gasket and Cu pressure marker. 96
3.6 Raman spectrum of Yb2Ti2O7 pyrochlore at ambient pressure. The
different raman modes have been labeled as pk1 to pk8. . . . . . . . . 98
xviii
List of Figures
3.7 The evolution of the Raman modes of Yb2Ti2O7 at a few representative
pressures (R stands for Release). . . . . . . . . . . . . . . . . . . . . . 99
3.8 Pressure induced variation of Raman mode frequencies of Yb2Ti2O7 . 100
3.9 Diffraction pattern of Dy2Ti2O7 pyrochlore stacked at a few represen-
tative pressures . . . . . . . . . . . . . . . . . . . . . . . . . . . . . . 102
3.10 Full width at half maximum for different x-ray diffraction peaks of
Dy2Ti2O7 at various pressures. . . . . . . . . . . . . . . . . . . . . . . 103
3.11 Pressure induced variation of different dhkl values. . . . . . . . . . . . 104
3.12 Pressure induced variation of volume per unit cell. The black dot
symbols represent the observed data while the red solid line is obtained
from fitting the third order Birch-Murnaghan equation of state to the
observed variation of volume with pressure. . . . . . . . . . . . . . . . 105
3.13 Pressure induced variation of lattice parameter of pyrochlore phase. . 106
3.14 Raman spectrum of Dy2Ti2O7 pyrochlore at ambient pressure. The
different raman modes have been labeled as P1 to P11. . . . . . . . . 106
3.15 Raman spectra of Dy2Ti2O7 pyrochlore stacked at a few representative
pressures. . . . . . . . . . . . . . . . . . . . . . . . . . . . . . . . . . 107
3.16 Variation of Raman shift of different modes with pressure. . . . . . . 108
4.1 Unit cell of cubic perovskite. Gray, green and red spheres represent
the A cations, B cations and oxygen anions respectively. B cation with
oxygen atoms forms an octahedra. . . . . . . . . . . . . . . . . . . . . 113
4.2 Distorted cubic perovskite structure of BiFeO3 in R3c space group.
The grey colored spheres are bismuth atoms, the yellow colored are
iron atoms while the one with red colors represent oxygen atoms. . . 114
xix
List of Figures
4.3 X-ray diffraction pattern of BiFeO3 at a few representative pressures.
X-ray diffraction peaks marked with the star are from impurity while
the peaks marked with solid and dotted arrows are from the new high
pressure phases with space group P2221 and Pnma respectively. The
inset shows the zoomed view of diffraction pattern at 4.1 GPa and
highlights the fact that the new XRD peaks of P2221 phase are distinct
from the impurity peaks. . . . . . . . . . . . . . . . . . . . . . . . . . 118
4.4 Rietveld refined monoclinic (C2/m) structure (from reference Haumont
et al. 2009). (b) Relaxed monoclinic structure after theoretical struc-
tural optimization (Mishra et al. 2013). The resulting bond lengths for
Bi-O and Fe-O changed from 2.22A to 2.44A and 1.86A to 1.89A re-
spectively (c) Rietveld refined orthorhombic (P2221) structure (present
study, without relaxation). (d) Relaxed orthorhombic (P2221) struc-
ture after theoretical structural optimization (Mishra et al. 2013) . . 120
4.5 Rietveld refined diffraction pattern of BiFeO3 at three different pres-
sures (ambient, 5.0 GPa and 15.0 GPa) representing Rhombohedral
(R3c), Orthorhombic (P2221) and (Pnma) symmetries respectively.
For Rietveld refinement three contributions viz. from BiFeO3, tungsten
(gasket) and copper (the pressure marker) were used at each pressure.
The red, green and blue solid lines represent the calculated intensity,
background and difference from observed data respectively while the
black dots represent the experimental data. . . . . . . . . . . . . . . . 122
4.6 (a) Crystal structure of BiFeO3 at ambient conditions. (b) The struc-
ture of the first high pressure phase (P2221). (c) Structure of the
second high pressure phase (Pnma). . . . . . . . . . . . . . . . . . . . 123
xx

List of Figures
4.7 Observed variation in the volume (per formula unit) of BiFeO3 as a
function of pressure. Symbols represent the experimentally observed
data while solid lines are obtained from fitting the P-V data with third
order Birch-Murnaghan equation of state. . . . . . . . . . . . . . . . . 123
4.8 Tetragonal crystal structure of Sr2MgWO6 at ambient conditions (Space
group I4/m). . . . . . . . . . . . . . . . . . . . . . . . . . . . . . . . 125
4.9 Diffraction pattern of Sr2MgWO6 at a few representative pressures.
Peaks marked as (hkl), W and Cu are from the sample, gasket and pres-
sure marker respectively. Asterisk (*) represents the impurity peak. . 127
4.10 Rietveld refinement of diffraction pattern at ambient conditions. The
diffraction pattern consists of contributions from Sr2MgWO6, tungsten
gasket and Cu pressure marker. . . . . . . . . . . . . . . . . . . . . . 128
4.11 Variation of normalized lattice parameters with pressure. Symbols rep-
resent the experimental data and the solid lines represent the computed
data taken from Mishra et al. 2010 . . . . . . . . . . . . . . . . . . . 129
4.12 The observed P-V variation fitted with Birch- Murnaghan (B.M.) equa-
tion of state (red) for Sr2MgWO6. Symbols represent the observe data.
Dash-dot line represents the results of our first principles calculations
taken from Mishra et al. 2010 for comparison. . . . . . . . . . . . . . 130
4.13 Variation of the frequencies of two prominent Raman active mode of
Sr2MgWO6 with pressure. . . . . . . . . . . . . . . . . . . . . . . . . 131
4.14 Diffraction patterns of BaLiF3 at a few representative pressures. The
gasket and copper pressure marker peaks have been marked as W and
Cu respectively. The diffraction patterns of the released runs have been
marked with r. . . . . . . . . . . . . . . . . . . . . . . . . . . . . . . 134
4.15 The additional valence sum mismatch at both (Ba, Li) cation sites
(∆Vi (i = A, B) as a function of pressure. . . . . . . . . . . . . . . . 136
xxi

List of Figures
4.16 The observed P-V variation fitted with third order Birch-Murnaghan
equation of state for BaLiF3. The closed and open circles represent the
compression and decompression data respectively, while the red solid
line is the fitted curve with B-M equation of state. The dot-dashed
blue colour line shows the EOS obtained from ab-initio calculations of
Mishra et al. 2011 . . . . . . . . . . . . . . . . . . . . . . . . . . . . 137
4.17 Pressure induced variation of normalized volume of KF12 and BaF12
polyhedra for several fluoro-perovskites. For KZnF3 and KMgF3 the
data are from reference Aguado et al. 2008 while for KCoF3 data was
taken from Aguado et al. 2009. BaLiF3 data is from the present high
pressure x-ray diffraction experiments. . . . . . . . . . . . . . . . . . 138
5.1 Edge Shared UO7 (pentagonal bipyramids) and PO4 (tetrahedra) as in
U2O(PO4)2. . . . . . . . . . . . . . . . . . . . . . . . . . . . . . . . 147
5.2 The parent orthorhombic structure as viewed along [100]. . . . . . . 148
5.3 Correlation diagram of internal modes of U2O(PO4)2 based on PO4
smmetry group. The known frequencies of the isolated (PO4)3− tetra-
hedron are given in the parenthesis. . . . . . . . . . . . . . . . . . . . 150
5.4 Correlation diagram of internal vibrations of U2O(PO4)2 based on UO7
smmetry group. . . . . . . . . . . . . . . . . . . . . . . . . . . . . . . 151
5.5 Raman spectrum of U2O(PO4)2 at ambient conditions in the spectral
region 180-800 cm−1; * indicates unidentified peaks. . . . . . . . . . 152
5.6 Raman spectrum of U2O(PO4)2 at ambient conditions in the spectral
region 800-1300 cm−1. . . . . . . . . . . . . . . . . . . . . . . . . . . 152
5.7 Raman spectra of U2O(PO4)2 under quasi hydrostatic conditions in
the spectral region 180-800 cm−1. . . . . . . . . . . . . . . . . . . . . 153
5.8 Raman spectra of U2O(PO4)2 under quasi hydrostatic conditions in
the spectral region 800-1300 cm−1. . . . . . . . . . . . . . . . . . . . 153
xxii
List of Figures
5.9 Variation of Raman mode frequencies with pressure under hydrostatic
conditions. (Error bars are larger beyond 6 GPa due to broad Raman
peaks). . . . . . . . . . . . . . . . . . . . . . . . . . . . . . . . . . . . 154
5.10 Raman spectra of U2O(PO4)2 under non-hydrostatic conditions in the
spectral region (a) 180-800 cm−1 and (b) 800-1300 cm−1. . . . . . . . 155
5.11 Variation of Raman mode frequencies with respect to pressure under
non- hydrostatic conditions. . . . . . . . . . . . . . . . . . . . . . . . 155
5.12 Raman spectra of U2O(PO4)2 on release of pressure (h) denotes from
hydrostatic and (nh) denotes from non-hydrostatic conditions. . . . . 158
5.13 X-ray diffraction patterns of U2O(PO4)2 at a few representative pressures.159
5.14 Pressure induced variation of dhkl. . . . . . . . . . . . . . . . . . . . 160
5.15 Le Bail fit to the diffraction pattern at 6 GPa; both the parent or-
thorhombic and high pressure triclinic phase have been fitted. . . . . 161
5.16 V/V0 versus pressure for the orthorhombic phase. The solid line is fit
to Birch-Murnaghan equation of state. . . . . . . . . . . . . . . . . . 161
6.1 Schematic layout of EDXRD beamline. . . . . . . . . . . . . . . . . 167
6.2 Mechanical layout of EDXRD beamline in top view. . . . . . . . . . 168
6.3 Photograph of EDXRD beam line installed at port no BL 11 at Indus-2
from (a) inside (b) outside. . . . . . . . . . . . . . . . . . . . . . . . . 168
6.4 Diffracting lozenge as defined by incident and diffracted beam. . . . . 170
6.5 Sample stage with DAC mounted on it. . . . . . . . . . . . . . . . . . 171
6.6 First diffraction pattern of (a) gold and (b)copper. . . . . . . . . . . . 172
6.7 (a) Stacked diffraction pattern of natural uranium at a few pressures;
(b) equation of state of natural uranium, symbol represents the ob-
served data and red line is B-M fit as per A. Lindbaum et al. . . . . 173
6.8 (a) EDXRD pattern of Yb2O3 at few representative pressures; (b) Pres-
sure induced variation of volume of phase A and phase C. . . . . . . . 174
xxiii

List of Figures
6.9 High temperature furnace installed at EDXRD beamline. . . . . . . . 175
xxiv

List of Tables
List of Tables
1.1 Orders of magnitude of natural and man made pressures . . . . . . . 7
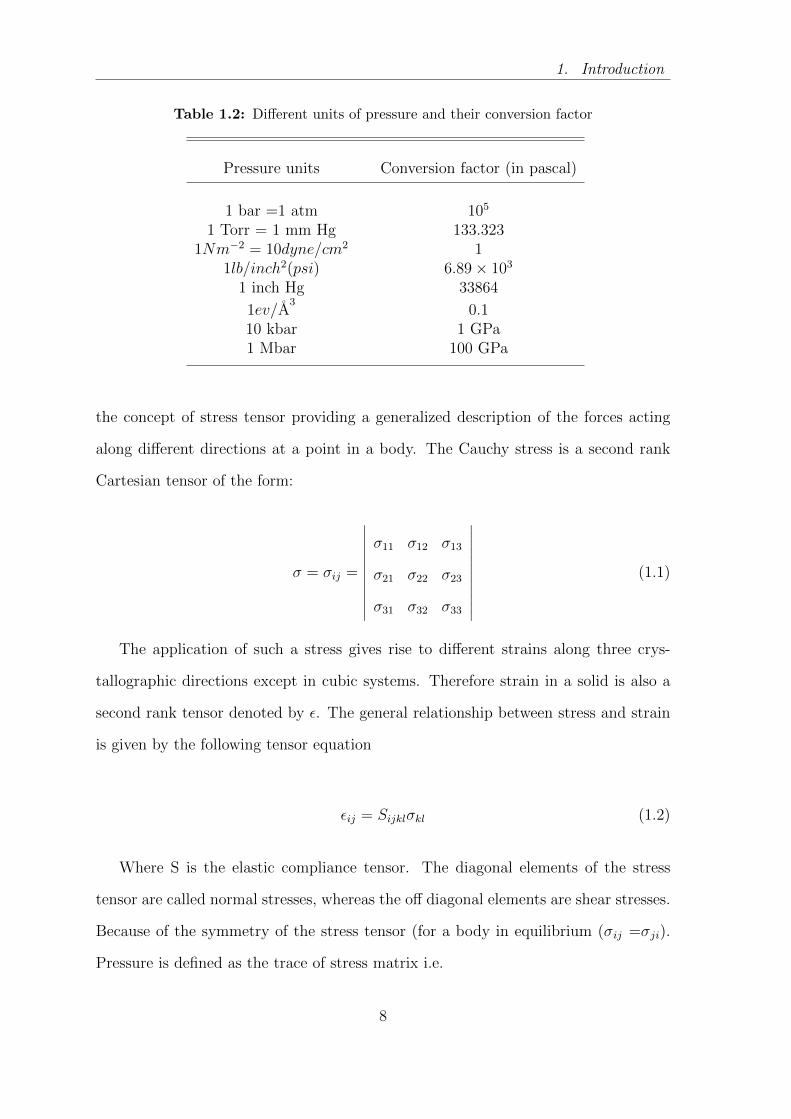
1.2 Different units of pressure and their conversion factor . . . . . . . . . 8
1.3 Different pressure transmitting mediums with their range of application. 33
2.1 Bulk Modulus of different ABO4 compounds. . . . . . . . . . . . . . . 81
2.2 Tentative assignment of Raman modes of LiErF4. . . . . . . . . . . . 82
3.1 The refined atomic coordinates of the high pressure monoclinic phase
of Yb2Ti2O7 at 30.5 GPa (Space Group: P21/c , lattice parameters
being a=5.544 A, b=3.963 A, c=4.578 A and γ=104.663◦). . . . . . . 97
3.2 Mode Gruneisen parameter of Raman modes. . . . . . . . . . . . . . 101
3.3 Assignment of Raman modes of Dy2Ti2O7. The origin of modes with
(phonon) assignment has been discussed in text. . . . . . . . . . . . . 107
3.4 Raman mode frequencies (ν), their pressure dependence (dν/dP) and
corresponding Grneisen parameters (γ) in the cubic pyrochlore phase
of Dy2Ti2O7 . . . . . . . . . . . . . . . . . . . . . . . . . . . . . . . . 108
4.1 Atomic positions in the cubic perovskite . . . . . . . . . . . . . . . . 113
4.2 Fractional coordinates of orthorhombic phase (Pnma) at 11 GPa (2nd
high pressure phase) a=5.531 A, b=7.687 A, c=5.359 A with Z= 4 . . 119
xxv
List of Tables
4.3 Fractional coordinates of orthorhombic phase (P2221) at 4.1 GPa (First
high pressure phase) a=5.4858 A, b=5.5577 A and c=14.4582 A with
Z= 8 . . . . . . . . . . . . . . . . . . . . . . . . . . . . . . . . . . . . 121
4.4 Bulk Modulii of various fluoro-perovskites determined from x-ray diffrac-
tion data as well as from the known elastic constants of these com-
pounds. Bulk moduli calculated using semi-empirical formulation of
Hazen et al and Errandonea et al are shown. Since both the octahedra
and dodecahedra have the same compressibilities the bulk modulii have
been calculated using the polyhedral cation formal charge and mean
cationanion distance (in A) of both the polyhedra (shown in column
7-10 of this table). It can be seen that the bulk moduli calculated
from our fit to the Scotts formulation 60 K0=(Y-Zλ)(V0)n where n =
0.1387, Y = 25.28 and Z = - 42.57 gives the closest agreement with
the experimental values. . . . . . . . . . . . . . . . . . . . . . . . . . 139
4.5 Ambient pressure elastic constants and moduli of ALiF3 (A= Ba, Sr,
Ca) determined from GGA ab-initio computations. For comparison
the experimentally determined elastic constants of BaLiF3 from Boum-
riche1994 have also been tabulated. . . . . . . . . . . . . . . . . . . . 141
4.6 Derived elastic constants characterizing mechanical stability (Mi eqs.
1-3) of BaLiF3 at different pressures, calculated from GGA ab-initio
computations reported in Mishra et al. 2011 . . . . . . . . . . . . . . 142
5.1 Tentative assignment of observed Raman modes of diuranium oxide
phosphate. . . . . . . . . . . . . . . . . . . . . . . . . . . . . . . . . . 151
5.2 Raman active mode frequencies (ω), their pressure dependence (dω/dP)
and corresponding Gruneisen parameters (γ) of the Orthorhombic Cmca
phase of U2O(PO4)2 . . . . . . . . . . . . . . . . . . . . . . . . . . . . 157
xxvi

List of Tables
6.1 Salient designed parameters of Indus-2 synchrotron source. . . . . . . 164
A.1 Lattice parameters for the seven crystal systems . . . . . . . . . . . . 179
xxvii

SYNOPSIS
Structural knowledge of materials is important from technological as well as sci-
entific point of view. Structure governs the physical properties of materials and it
changes with varying thermodynamic conditions like pressure and temperature. Pres-
sure, an important thermodynamic parameter, favours the close packing of materials.
It produces more prominent effect in the materials in comparison to the tempera-
ture and is also a comparatively cleaner variable in the sense that generally it leaves
entropy unaffected. The study of materials under high pressures is of direct rele-
vance in mineralogy, geophysics and geochemistry. These studies help to understand
the nature of materials inside earth which in turn could be used in modelling the
internal structure of earth. Materials have different types of bonding like covalent,
ionic, metallic, Van der Waals or hydrogen bonding and weak polyhedral linkages.
High pressure investigations of these materials are of importance in order to under-
stand the changes in nature of bonding and structure as well as physical properties
and phenomena. Most of the geophysical materials have open framework structures
having corner shared polyhedra. On application of pressure, the polyhedra in these
materials may rotate and/or distort to favor the close packing of materials. The dis-
tortion in polyhedra may lead to changes in coordination numbers and the material
under study may show phase transitions including amorphization [1] etc. Thus high
pressure studies could help unravel the mechanism of phase transition, order-disorder
phenomenon, structural properties of quenched phases and structural evolution. In
this thesis I have investigated the high pressure behavior of some geophysically rele-
vant materials encompassing wide range of polyhedral materials like zircon/Scheelite
structured materials [2,3], pyrochlores [4, 5], perovskites [6-8] and phosphate materials
[9,10] using in-situ experimental techniques like angle dispersive x-ray diffraction and
Raman scattering. The X-ray diffraction technique using up to sub angstrom range
of wavelengths (λ) gives the information about long range ordering and the structure
xxviii

of materials at high pressures can be determined by utilizing this technique. The Ra-
man scattering typically probes length scales of the order of a few hundred angstrom
and gives information about the vibrational modes i.e. external (lattice modes) and
internal (molecular) modes. This is a very powerful technique in case of materials
having low atomic number (Z) elements for example organic materials [11-14] which
are difficult to study with powder x-ray diffraction. The proposed thesis is to be
submitted to the Homi Bhabha National Institute for Doctor of Philosophy (Ph. D.)
degree. The thesis comprises of six chapters. A brief description of the contents of
different chapters is given below.
Chapter 1 is an introductory chapter of the proposed thesis and it describes briefly
about the physics and high pressure behavior of geophysically important materials
and motivation of this work. A brief overview of the pressure as an important thermo-
dynamic variable, high pressure crystallography, structural phase transitions, phase
stability and a broad overview of high pressure research has been discussed. In ad-
dition to this the description of different types of instrumentation especially related
to high pressure measurements such as diamond anvil cell technique has been dis-
cussed in detail. In-situ structural and spectroscopic investigation techniques like x-
ray diffraction measurement and Raman scattering measurement has been presented
and the role of these techniques regarding investigation of high pressure behavior of
materials has also been elucidated.
Chapter 2 focuses on zircon /scheelite structured materials. Zircon is an important
mineral found in earth′s crust mainly in igneous rocks and sediments. In this chapter
I have discussed the effect of high pressure on chromates (YCrO4 and HoCrO4) and
fluorides (LiErF4). In case of chromate materials high pressure x-ray diffraction
studies and Raman scattering measurements have been carried out up to ∼ 40 GPa
and 20 GPa respectively. Our x-ray diffraction analyses indicate that some of the XRD
peaks like (321), (312) and (332) show a large increase in full width at half maximum
xxix
(FWHM) compared to that in (101), (200) and (202). The diffraction pattern at
intermediate pressure (before transformation to scheelite structure) could be indexed
to monoclinic phase with space group (SG) no. =15. The structure of this monoclinic
phase is similar to that of the zircon phase except for a slight rotation of the chromate
tetrahedra. With these studies I have shown that zircon to scheelite transformation
occurs through an intermediate monoclinic phase in chromates (YCrO4 and HoCrO4)
[2]. I have also studied the scheelite structured LiErF4 compound using in-situ x-ray
diffraction technique up to 28 GPa. It transforms to monoclinic ferguosonite phase
at ∼11 GPa and to another high pressure phase at ∼15 GPa [3].
Chapter 3 deals with our study of pyrochlore structured materials which are not
only geophysically relevant but also show a lot of novel phenomenon under pressure.
Pyrochlores occur in pegmatites associated with alkali rocks. These materials are
geometrically frustrated with many other competing interactions and hence pressure
may be a very useful tool to study these materials. In this chapter I have described
about the high pressure effect on titanate pyrochlores for example on Yb2Ti2O7 and
Dy2Ti2O7. In order to study the structural changes in ytterbium titanate pyrochlore,
I have performed in-situ high pressure x-ray diffraction and Raman scattering exper-
iments up to 40 GPa and 50 GPa respectively . The x-ray diffraction studies indicate
that this compound undergoes a structural phase transition at ∼29 GPa. The high
pressure phase has been determined to be of monoclinic symmetry. The detailed
Rietveld analysis has provided the evolution of its x-coordinate of 48f oxygen. The
bulk modulus of pyrochlore and high pressure monoclinic phase has been determined.
The Raman scattering measurements corroborate the x-ray diffraction results. I have
performed high pressure x-ray diffraction studies on dysprosium titanate, a spin ice
pyrochlore compound, up to 34 GPa [5] and Raman scattering studies up to ∼29
GPa. Its pressure volume (P-V) behavior shows that this compound undergoes a
subtle transition at ∼9 GPa. The bulk modulus and its derivative with respect to
xxx
pressure has been determined using third order Birch-Murghnan equation of state.
The Raman modes observed at 309 and 521 cm−1 stiffen with pressure while the
Raman modes at 552 and 703 cm−1 shows discontinuity at ∼9 GPa. The Gruneisen
parameter for Raman modes has been determined.
Chapter 4 discusses about the high pressure studies on perovskite structured mate-
rials which are important as many minerals in earth′s mantle belong to this structure
and knowledge of the high pressure behavior of these can help the understanding of
basic physics underlying geodynamical phenomena. Specifically the results of high
pressure behaviour of perovskite materials BiFeO3, BaLiF3 and double perovskite
Sr2MgWO6 are presented in this chapter. High pressure x-ray diffraction studies
have been carried out on BiFeO3 up to 27 GPa [6]. It undergoes two structural phase
transition at 4.1 GPa and 6.4 GPa. We have determined both the high pressure
phases to be orthorhombic in nature in contrast to earlier studies which claimed the
first high pressure phase to be monoclinic. The bulk modulus for all the phases has
been determined. In this study I have used Rietveld refinement in combination with
first principles calculations to determine the correct structure of first high pressure
phase. BaLiF3 is an inverse perovskite structured material which crystallizes into
cubic structure. High pressure x-ray diffraction studies have been carried out on this
material up to ∼ 50 GPa [7]. Careful analyses of the data established the stability
of the initial phase up to the highest pressure of the study. I have also determined
the bulk modulus of this material and have compared it with that obtained from
empirical as well as first principles methods. Sr2MgWO6 is a double perovskite ma-
terial. High pressure x-ray diffraction and Raman scattering measurement have been
carried out on this material up to ∼28 GPa and ∼40 GPa respectively to know its
high pressure behavior [8]. This compound is found to be structurally stable up to
the highest pressure of our studies. Bulk modulus of ambient phase is determined to
be 128 GPa which is in close agreement with the theoretical value of bulk modulus,
xxxi

132 GPa, obtained using first principles calculations.
In Chapter 5, I have discussed about an important class of geophysically impor-
tant phosphate materials. Inside earth′s mantle a lot of materials are found in their
phosphate complex. I have performed high pressure Raman measurements and x-
ray diffraction experiments on U2O(PO4)2 [9,10] up to 14 GPa and 6.5 GPa respec-
tively. We have observed several changes in the Raman spectra as well as in the x-ray
diffraction patterns. These changes suggest that this compound undergoes a phase
transition at ∼6 GPa to a mixture of disordered ambient phase and a new high pres-
sure phase. The new phase resembles the triclinic mixed-valence phase of uranium
orthophosphate. On release of pressure the initial phase is not retrieved. The nature
of phase transition is determined to be first order.
Chapter 6 describes the development of energy dispersive x-ray diffraction (EDXRD)
beam line at Indus-2 synchrotron source [15]. It focuses on the design and parameter
freezing of different components of this beam line. In addition to this, installation,
standardization and adaptation for high pressure studies with a few example of high
pressure studies carried out on this beam line has also been discussed. The state of
the art experimental station of this beam line is discussed in detail.
References
1. Surinder M. Sharma and S.K. Sikka Pressure induced amorphization of
materials Progress in Materials Science 40, 1, 1996.
2. A.K. Mishra, Nandini Garg, K. K. Pandey, K. V. Shanavas, A. K. Tyagi
and Surinder M. Sharma Zircon-monoclinic-scheelite transformation in
nanocrystalline chromates Phys. Rev. B 81, 104109, 2010.
3. Nandini Garg, A.K. Mishra, A.K. Tyagi, and Surinder M. Sharma High pres-
sure behaviour of lithium erbium flouride DAE SSPS (India) 53, 245,
2008.
xxxii

4. A. K. Mishra, H. K. Poswal, Surinder M Sharma, Surajit Saha, D. V. S. Muthu,
Surjeet Singh, R. Suryanarayanan, A. Revcolevschi, and A. K. Sood The study
of pressure induced Structural phase transition in spin-frustrated
Yb2Ti2O7 pyrochlore J. Appl. Phys. 111, 033509, 2012.
5. A. K. Mishra, H. K. Poswal, Surinder M. Sharma and A. Revcolevschi and A
K Sood Lattice instability in Dy2Ti2O7 at high pressures, to be commu-
nicated to J. Phys.:Condens Matter.
6. A. K. Mishra, Shanavas K. V., H. K. Poswal, B. P. Mandal, Nandini Garg and
Surinder M. Sharma Pressure induced phase transitions in multiferroic
BiFeO3 Solid state communications 154, 72, 2013.
7. A.K. Mishra, Nandini Garg, K.V. Shanavas, S.N. Achary, A. K. Tyagi and
Surinder M. Sharma High pressure structural stability of BaLiF3 J. Appl.
Phys. 110, 123505, 2011.
8. A.K. Mishra, H.K. Poswal,S.N. Acharya, A.K. Tyagi and S.M. Sharma Struc-
tural evolution of double perovskite Sr2MgWO6 under high pressure
Phys. Status Solidi B, 247(7), 1773, 2010.
9. A.K. Mishra, Chitra Murli, A. Singhal and Surinder M. Sharma Pressure
induced phase transformation in U2O(PO4)2, J. Solid Chem. 181(5),
1240-1248, 2008.
10. A.K. Mishra, K. K. Pandey, S. Karmakar, Surinder M. Sharma High Pressure
X-ray Diffraction Study of U2O(PO4)2 DAE SSPS (India) 51, 91, 2006.
11. A. K. Mishra, Chitra Murli and Surinder M Sharma High Pressure Raman
spectroscopic study of deuterated γ- glycine, J. Phys. Chem. B 112(49),
15867-15874, 2008.
xxxiii

12. A.K. Mishra, Chitra Murli, Nandini Garg, R. Chitra and Surinder M Sharma
Pressure induced structural transformations in Bis (glycinium) ox-
alate,J. Phys. Chem. B 114, 17084-17091, 2010.
13. Chitra Murli, A. K. Mishra, Susy Thomas and Surinder M. Sharma Ring open-
ing polymerization in carnosine under pressure, J. Phys. Chem. B 116,
4671-4676, 2012.
14. A.K. Mishra, Chitra Murli Ashok K. Verma, Yango Song, M. R. Suresh Ku-
mar,and Surinder M. Sharma Conformation and hydrogen bond assisted
polymerisation in glycine lithium sulphate, Communicated to J. Phys.
Chem B.
15. K.K. Pandey, H.K. Poswal, A.K. Mishra, Abhilash Dwivedi, R. Vasanthi, Nan-
dini Garg and Surinder M. Sharma Energy dispersive x-ray diffraction
beam line at Indus-2 Synchrotron source, Pramana 80, 607-619, 2013.

List of Tables
2

1
Introduction
1.1 Introduction to high pressure physics
Pressure plays a vital role in materials research from basic science as well as tech-
nological point of view. It can induce myriads of structural as well as electronic
changes and can also produce altogether new phenomenon and physical properties
related with materials [1]. For example it can change graphite, a layered and lubri-
cating material, into metastable diamond, known to be the hardest material on the
earth. Pressure can also lead to a rich variety of different phenomenon like polymor-
phism, stabilization of different phases, metallization of insulators; dramatic changes
in superconducting properties etc. which provides the researchers a vast playing field.
High pressure plays a significant role in todays technology also whether it is re-
lated with synthesis of various technologically advanced materials, abrasives, ceramics
and composite materials, processing of food stuffs at high pressure etc. Pressure is
important in all scientific domains. The relevant range of pressure for high pressure
biology, high pressure chemistry and high pressure physics is estimated to be 0.01
GPa- 1 GPa, 0.1 GPa-10 GPa and 1GPa- 10 Mbar respectively as shown in figure 1.1
3

1. Introduction
Figure 1.1: Schematic of the Pressure Temperature- map of scientific interest
High pressure studies are of immense relevance to the geophysical and planetary
phenomenon which is revealed by recent studies on post perovskite phase of MgSiO3
[2] providing insight into the nature of earths interior. Our planet, Earth, is sub-
divided into the following broad categories: crust, mantle and core. As we traverse
deeper and deeper inside the earth the pressure and the temperature goes on increas-
ing. At the centre of the earth the pressure and temperature are expected to be ∼3.6
Mbar and ∼6000 K respectively. Structural and related properties of materials under
such extreme conditions, quite different from those under ambient conditions, can
only be obtained from high pressure investigations.
These studies can also provide clues towards the origin and nature of the seis-
mically anomalous layers of mantle and core-mantle boundary[3] . The sharp jumps
observed in the seismic velocities at 400 km and 660 km depth in the mantle can be
understood with help of our high pressure investigations as at these depths the pres-
4

1.1. Introduction to high pressure physics
sure is expected to be in the range of 10-25 GPa as shown in figure 1.2. In general our
high pressure studies in the pressure range 1MPa to 40 GPa are vital to understand
and model the physical phenomenon up to earths mantle. The application of pressure
Figure 1.2: Variation of pressure with respect to radius of the earth
reduces the inter atomic distances consequently reducing the lattice parameters and
changing the fractional coordinates of the atoms in the unit cell for crystalline solids.
Thus compression tends to bring about closer packing of atoms, ions or molecules and
hence the increase in density is observed for compressed material. Although the close
packed structures are generally simpler and more symmetric structures, sometimes
the opposite is also quite true. In fact pressure can induce order as well as disor-
der. In general, compression leads to increase in the local coordination number- for
example a progressive increase from tetrahedral to octahedral coordination in case
of silicates [4] under high pressure. In fact the increase in coordination number is
intimately linked to the changes in the electronic states. The decrease in inter atomic
distances leads to the increased overlap of electronic wave functions of the system
in ground state, changing the localized electronic states around nuclei and ions into
5

1. Introduction
delocalized or itinerant ones. Thus the electronic states which were sharper in energy
in ground state become broad continuum or a band compressed state. This can lead
to dramatic consequences not only in the structural sense but also in terms of other
physical properties, such as evolution of insulating to metallic state.
A lot of progress has been made in the field of generation of static as well as
dynamic high pressures. As for as the dynamic high pressure is concerned it is gen-
erated primarily either by gas gun or by using high power lasers. In this thesis I
have worked only with static high pressure. Generation of static high pressure has
seen tremendous progress starting from Bridgman who used large hydraulic presses
to generate pressure ∼10 GPa to the modern era of pressure generation where palm
sized devices are available which can reach up to mega bar (4 to 5 Mbar) pressures.
In this chapter, significance of pressure as a thermodynamic variable is discussed
along with an overview of high pressure research in materials. In the subsequent
sections I have discussed the effect of high pressure from crystallography and phase
stability point of view. In the latter sections I have discussed in detail about the high
pressure devices i.e. basically diamond anvil cells (DAC) and experimental methods
to perform the in-situ measurements on materials under high pressure. Later on I
have noted the relevance of geophysical materials studied as part of my thesis.
1.2 Pressure as a Thermodynamic Variable
Pressure is defined as the force acting on a unit area and is termed as a scalar
quantity. Systematic studies as a function of pressure have led to considerable insight
into the properties of matter, especially its electronic properties. In fact pressure is
a unique thermodynamic variable spanning over 60 orders of magnitude in nature [5]
as shown in table 1.1. At one end the pressure in the interiors of neutron stars are
∼ 1032 bar and at the other end quite low pressures in the remotest vacua of outer
6

1.2. Pressure as a Thermodynamic Variable
Table 1.1: Orders of magnitude of natural and man made pressures
Pressure[bar] Places
10−32 Interstellar space10−16 Best laboratory vacuum10−8 Atmosphere 300 miles above Earths surface10−2 Water vapor at triple point100 Atmosphere at sea level103 Bottom of Marianas trench106 Center of Earth109 Center of Sun1032 Center of neutron star
space are ∼10−32 bar. In the very early days the Nobel Laureate P. W. Bridgman
recognized the importance of pressure as a thermodynamic parameter for studying
the materials and in fact he measured the electrical resistance of Germanium under
quasi-hydrostatic pressures and observed sharp decrease in the electronic mobility of
Ge which is now understood as a result of crossing of the X[111] band minima with
the Γ [100] band minima upon increasing the pressure [6]. Pressure is a rather cleaner
and stronger thermodynamic variable in comparison to temperature. A material can
be quite easily compressed to ∼50 % of its initial volume with the help of modern days
high pressure diamond anvil cells while temperature in the range of 0 K to its melting
point can induce volume change of ∼ a few percent only. The effect of temperature is
also complicated by entropic changes such as caused by increasing phonon population
while pressure effect is only manifested through change in volume. The generally used
units of pressure and their conversion in units of pascal are given in table 1.2. An
atomic unit of pressure is Pau=e2/2a40 =147.2 Mbar where ’e’ and a0 are electronic
charge and Bohrs radius respectively.
Pressure on a solid material i.e. forces acting on a unit area of the object from
different directions can have different values; therefore, in most real high-pressure
experiments scalar description of pressure is insufficient. In 1827 Cauchy introduced
7
1. Introduction
Table 1.2: Different units of pressure and their conversion factor
Pressure units Conversion factor (in pascal)
1 bar =1 atm 105
1 Torr = 1 mm Hg 133.3231Nm−2 = 10dyne/cm2 1
1lb/inch2(psi) 6.89× 10³
1 inch Hg 33864
1ev/A3
0.110 kbar 1 GPa1 Mbar 100 GPa
the concept of stress tensor providing a generalized description of the forces acting
along different directions at a point in a body. The Cauchy stress is a second rank
Cartesian tensor of the form:
σ = σij =
∣∣∣∣∣∣∣∣∣∣∣∣
σ11 σ12 σ13
σ21 σ22 σ23
σ31 σ32 σ33
∣∣∣∣∣∣∣∣∣∣∣∣(1.1)
The application of such a stress gives rise to different strains along three crys-
tallographic directions except in cubic systems. Therefore strain in a solid is also a
second rank tensor denoted by ε. The general relationship between stress and strain
is given by the following tensor equation
εij = Sijklσkl (1.2)
Where S is the elastic compliance tensor. The diagonal elements of the stress
tensor are called normal stresses, whereas the off diagonal elements are shear stresses.
Because of the symmetry of the stress tensor (for a body in equilibrium (σij =σji).
Pressure is defined as the trace of stress matrix i.e.
8

1.3. An overview of high Pressure Research in Materials
P =1
3Tr(σ) =
1
3[σ11 + σ22 + σ33] (1.3)
Hydrostatic conditions can be defined in terms of the components of the stress
tensor. Ideal hydrostaticity requires all the normal stresses to be equal, and all the
shear stresses to be zero. In real experiments ideal hydrostaticity can be achieved
only with the use of fluid pressure media. Once pressure medium solidifies (either in
crystalline or amorphous state) the stress tensor can be at best described as quasi-
hydrostatic. For high pressure experiments carried out with solid pressure media
the components of the stress tensor are not only non-hydrostatic, but usually differ
from one point in space to another. e.g., in diamond anvil cell, assuming radial
symmetry, stress usually varies laterally, as a function of distance from the center of
the diamond anvil. However, in reality the heterogeneity in stresses could circumvent
the even radial symmetry.
1.3 An overview of high Pressure Research in Ma-
terials
Understanding the behaviour of condensed matter at high pressures has seen phe-
nomenal expansion with the advent of innovative and new pressure generating device
namely diamond anvil cells. For the first time P. W. Bridgman who received the Nobel
prize for the invention of high pressure generating device in 1946, [7] introduced the
opposed anvil devices and established the principles of high pressure technique. Us-
ing these devices Bridgman conducted several electrical resistance and compressibility
measurements up to 100 kbar. Later on Drickamer and his colleagues developed ultra-
high pressure supported tapered anvil devices and conducted several x-ray diffraction,
optical absorption, resistance and Mossbauer studies up to a few tens of GPa pressure
9

1. Introduction
enriching the high pressure behaviour of materials. Earlier, before the invention of
diamond anvil cell (DAC) researchers used to use large volume presses or tetrahedral
presses etc to generate high pressure. Opposed anvil design was used with anvils of
tungsten carbide to pressurise the samples or perform some studies on the quenched
samples. At the same time there have been tremendous improvements in the design of
piston cylinder device, multiple anvil devices and belt apparatus. These developments
provided very powerful tools for study of phase transition. Among above the tetra-
hedral press designed by Hall [8], the cubic [9] and the octahedral press [10] became
more useful for high pressure studies as well as material synthesis. Since diamond is
known to be hardest material it seemed logical to turn towards using diamond for
achieving higher pressures. Lawson and Tang [11] were the first to employ diamond
for containment of pressure and in 1950 a miniature piston cylinder cell with a 3 carat
single crystal diamond was developed for performing high pressure x-ray diffraction
studies. Later on, in 1958 Charlie Wier et al. [12] at National Bureau of Standards
and Jamieson, Lawson et al. [13] at the University of Chicago independently devel-
oped two different versions of the diamond anvil cell. Weir et al. were interested
in the infrared transmission measurements and adopted the 180◦ geometry in which
light beam is coincident with the stress axis while Jamieson et al. constructed a clamp
type DAC which was used in 90◦ configuration where x-ray beam is normal to the
stress axis. Since diamond is transparent over a wide range of electromagnetic wave
spectrum starting from visible and also for hard x-rays, invention of diamond anvil
cell has become an important milestone in the area of high pressure research. With
the advancement in diamond anvil cell technology the high pressure limit has been
enhanced by two orders of magnitude with the help of following major improvements.
1. Metallic gaskets with a hole inside it are used to create a sample chamber where
sample is loaded with a liquid medium to provide hydrostatic environment [14].
2. For measurement of pressure the usage of Ruby fluorescence technique provided
10
1.3. An overview of high Pressure Research in Materials
a simple and accurate method [15].
3. Alcohol mixtures (Methanol:ethanol::4:1) proved to be a very useful poor mans
liquid for hydrostatic environment up to 10 GPa [16] and for higher pressures
in the Mbar range helium and other rare gasses [17] are used as hydrostatic
medium.
4. The pressures in the Mbar range are achieved with bevelled diamond anvils [18].
It has been shown by finite element analysis method that bevelling parameter
of the anvil can be optimised to obtain the maximum and uniform pressure over
the entire culet region [19].
Concurrent with all the above developments there have been improvement in the
force generating mechanisms with the design of the mounts of anvils. Based on the
above force generating mechanism five types of DACs have evolved i.e. NBS Cell [20],
Merril-Besset Cell [21], Syassen-Holzaphel Cell [22], Mao-Bell Cell [23] and Membrane
Cell [24]. The detailed mechanism and working principle of DAC has been presented
in latter section of this chapter. The pressure increases from edge of the culet to
its centre and become maximum at the centre under loading. Primarily the shear
modulus of the diamond governs the maximum achievable pressure in a DAC. Earlier
it has been estimated based on the shear stress calculation of diamond crystal that
a DAC can reach up to the maximum pressure ∼400-540 GPa. [25, 26]. However
highest pressure achieved in a DAC depends on several other parameters, e.g., gasket
material thickness, its shear modulus, beveling parameters (beveling angle, diameter
of flat region). The maximum static pressure so far claimed to have been reached in a
DAC is 640 GPa using double stage diamond anvils and equation of state of rhenium
[27] has been extended up to 6.4 Mbar pressures. Interestingly ab initio molecular
dynamics simulations show that under hydrostatic compression, mechanical failure of
diamond occurs only at ∼30 Mbar of pressures, where diamond is expected to collapse
11

1. Introduction
into a denser and metallic form of carbon termed as SC4 [28]. Jayaraman[29] and
Eremets [30] have presented some of the initial diamond anvil cell techniques and
various experimental results.
Nowadays DACs are widely used to study the high pressure behaviour of materi-
als in the Mbar range in combination with several experimental techniques like Syn-
chrotron x-ray techniques (x-ray diffraction technique, x-ray absorption spectroscopy
(EXAFS and XANES) [31], x-ray emission spectroscopy, inelastic x-ray scattering,
x-ray magnetic circular dichroism etc.), optical spectroscopic techniques (Raman scat-
tering, Brillouin scattering, Photoluminescence, IR, optical absorption etc), electri-
cal resistivity measurements [32], Nuclear forward scattering[33] , Mossbauer spec-
troscopy [34] and thermoelectric power measurements [35] etc. As pressure squeezes
the material, it is expected that insulator may transform into metal under high pres-
sures. Monatomic hydrogen is like alkali metal and hence the molecular hydrogen
under pressure is expected to be metallic. That is why hydrogen metallization is one
of the most important sought after problem among many other relevant problems
in high pressure science. It is also important because it is speculated to be a room
temperature superconductor [36]. Recently Eremets et al.[37] claimed to observe the
conductive dense hydrogen in metallic state at 260-270 GPa. But later on WJ Nellis
et al. [38] found that there is no evidence of metallisation of hydrogen in the Eremetss
experiments. A lot of progress has also been made in the field of electrical resistivity
measurement by development of designer diamond anvil cells.
Nowadays in many studies, high pressure is applied in conjunction with other ther-
modynamic variables like temperature, magnetic field, electric field etc. The study
of behaviour of materials with high pressure and varying temperature is important
not only from its structural point of view but also from the physicochemical point
of view although the effect of temperature in changing in volume is relatively less
as compared to high pressure. Many materials are known to exhibit superconduct-
12

1.3. An overview of high Pressure Research in Materials
ing behaviour in a particular pressure temperature (P-T) range. For example iron
shows superconductivity in its non magnetic phase in the pressure range 15-20 GPa
and below 2K [39]. Pressure plays a role in changing the symmetry of the system
which in turn plays an important role in some of these types of studies. Pressure
induced enhancement of Tc has also been observed for some of cuprate systems and
iron chalocgenide systems. In fact highest Tc=164K has been observed for cuprate
system HgBa2CaCu3O8 at 30 GPa. For these type of studies miniature anvil devices
like clamp cells are used. In fact Eremets et al. have performed high pressure and
ultra low temperature studies up to 160 GPa and < 30mK [40].
High pressure in conjunction with high temperature is used mainly to determine
the phase behaviour (phase diagram) of geophysically relevant materials in a broader
range of pressure and temperature. In addition, HP-HT is also important for synthesis
of novel and technologically important materials under these extreme conditions.
High temperature in the DAC can be obtained by two methods; (1) external heating
with a resistance heater [41] which is located around the anvil and (2) local heating of
the sample with a laser beam, usually with a high power YAG laser which is capable
of delivering 50-100 W power. The laser heating technique was first introduced by
Ming and Bassett et al. [42] and they showed that sustained temperatures of 2000◦C
to 3000◦C could be obtained at pressures up to 26 GPa. In this case the temperature
was measured by optical pyrometry. The laser heating has the advantage that heating
effect is localised and hence the cell need not be specifically designed to be of heat
resistant material. But at the same time laser heating has a disadvantage of non
uniform heating and larger thermal gradients. In order to make it more uniform Mao
et al. introduced the double sided laser heating in DACs. On the other hand the
external heating produces a more uniform and reliable temperature, but weakens the
diamond support; the higher the temperature the lower the pressure limit. Arashi
and Ishigame [43] have claimed to reach ∼700◦C at pressures up to 7 GPa. Block
13
1. Introduction
et al. were able to achieve ∼700◦C and 3 GPa while Bassett et al. were able to
maintain 800◦C at pressures up to 30 GPa. In external heating the main problem is
that for more than 800◦C there is rapid graphitization of the diamonds and the loss
of strength of the diamond support. However Schiferl et al. [44] have developed a
HT-HP diamond anvil cell enclosed in a high vacuum chamber to prevent oxidation.
This cell can go up to 1200◦C and 11GPa. Boehler etal. [45] have devised a novel
method of heating, which is particularly suitable for metallic wires. They have also
employed a gasketed geometry, in which two T301 stainless-steel disks which are
electrically insulated by a disk of dense polycrystalline MgO of 0.05 mm thickness.
This serves the purpose of gaskets as well as electrical leads. Temperature is measured
by spectroradiometry using a diode array detector. Pressure calibration with the ruby
fluorescence method is not suitable for HT because with temperature the R1and R2
lines broaden. In this case generally internal standards such as gold is used for
pressure calibration. In laser heated DACs people have achieved temperatures ∼4000
K with pressures ∼200 GPa [46]. Temperatures ∼6000 K has also been reported at
lower pressures. These thermodynamic conditions are similar to that of environment
at the core of earth and inside the other giant planets of our solar system. Therefore
generating such conditions in Laboratories provide an ideal condition to understand
the phase and properties of the materials inside earth as well as inside other planets.
For example Iron and hydrogen are found inside Earth and Jupiter respectively. One
can also produce very high pressure and high temperature conditions by producing
shock with help of a gas-gun system. In this case the shock pressure is generated
by propelling a hard projectile usually with an air gun. The projectile then hits the
sample inside the target with great impact producing enormous pressure and heat.
The highest pressure and temperature achievable by this method can be as high as
600 GPa and 7500K [47]. But this HP-HT is sustained only for a few microseconds.
It is also possible to generate very high pressures ∼ 1 Gbar [48] by using pulsed
14

1.3. An overview of high Pressure Research in Materials
laser-generated shock waves in the solid materials. However the main advantage of
generating HP-HT conditions inside DAC over shock experiments is the stability of
pressure temperature conditions for a few hours. This makes it possible to investigate
the material by various techniques like x-ray diffraction, spectroscopic and visual
observations.
In order to understand the behaviour of physical properties, like transport prop-
erties (resistivity, magneto-conductance properties etc), dielectric properties, polar-
izability of materials under high pressure one has to conduct experiments under si-
multaneous application of pressure, temperature, magnetic field and electric field etc.
For magnetic measurement under high pressure one needs to use non magnetic cell,
for example made of Cu-Be alloy. Using superconducting quantum interference de-
vice (SQUID) magnetometers and Cu-Be high pressure cell it is possible to carry out
magnetotransport, magnetostriction and magnetisation measurements up to hydro-
static pressures of 5 GPa, temperatures down to sub Kelvin range and up to 20T of
magnetic field [49]. Susceptibility measurements have been performed up to very high
pressures ∼230 GPa using modified Mao-Bell kind of diamond anvil cell at very low
magnetic fields down to liquid helium temperature. Using ceramic type of diamond
anvil cells magneto optical measurements have also been carried out up to 7 GPa
down to liquid nitrogen temperature with pulsed magnetic field of 33T [50]. Several
other studies on magnetic behaviour of materials under high pressure and low tem-
perature have been performed like magneto-optical Kerr effect [51], Thermo-power
and magneto-resistance measurements [52], de hass-van Alphen effect [53], Mossbauer
effect [34], nuclear forward scattering [33], Nuclear magnetic resonance studies [54]
etc.
Neutron diffraction measurements have several advantages for the study of ma-
terials and complement the x-ray diffraction based studies specifically for materials
having low Z elements and for magnetic materials. The atomic scattering factor for
15

1. Introduction
x-ray is proportional to atomic number of elements and so higher the atomic num-
ber of the element higher the scattering. In contrast neutron scattering cross section
depends on its scattering length, a function of neutron and nucleus potential scat-
tering as well as resonance scattering due to absorption of neutrons by nucleus, with
different nuclei and it is not dependent on atomic number. It may be very random
across periodic table. It also varies drastically from one isotope to another isotope. In
addition to this, there may be magnetic scattering from the atoms. Hence the x-ray
diffraction pattern and neutron diffraction pattern may be quite different. Thus neu-
tron can be used to provide information about fractional coordinates of light elements,
their thermal motion and associated disorder if any. Since flux of neutron sources are
smaller than that of synchrotron sources and hence neutron diffraction studies under
high pressure are limited. With the recent improvements in the focussing of neutrons
using Ni-Ti super mirrors scientists have carried out high pressure neutron diffraction
studies up to 30 GPa using the new miniature Paris Edinburgh cell and up to 50 GPa
with small Kurchatov LLB cells [55]. The inelastic neutron scattering studies using
Paris Edinburgh Cell have been possible only up to 10 GPa.
To summarise, there have been tremendous improvements and innovations in the
design and development of pressure generating devices specifically for DACs. This has
propelled the detailed study of high pressure behaviour of condensed matter under
extreme conditions in combination with other thermodynamic parameters like high
temperature, low temperature, magnetic field, electric field etc. For further progress in
high pressure science it is advisable to use large volume samples without compromising
Pressure and temperature which demands for high strength anvil materials and larger
anvil sizes. This has resulted into quest for large CVD grown diamonds. Additionally
the third generation synchrotron sources, FELS and high power lasers are also going
to help in advancement of high pressure research on materials.
16

1.4. Crystallography under High Pressure
1.4 Crystallography under High Pressure
Structural studies of materials at ambient conditions using x-ray diffraction and /or
neutron diffraction are pertinent as the information of accurate structure sets the stage
for interpretation of why the materials are the way they are or in other words most of
the physical properties of materials can be understood by determining the structure of
the material and one can also engineer the materials of desired properties. Generally
crystal structure analysis includes the interpretation of observed diffraction pattern
(diffraction peaks with peak position and intensities) in terms of repeating unit i.e.
unit cell and the arrangement of atoms inside unit cell i.e. basis. The shape and size
of unit cell determines the diffraction peak positions while the intensity of these peaks
is determined by atomic arrangement in the unit cell. The variation of pressure adds
a new thermodynamic dimension to the crystal structure analyses. It may trigger new
chemical reactions or may bring about conformational and structural transformations
of molecules, polymerization, phase transitions, polymorphism affecting structure-
property relations. Essentially these studies opens up new fields like determination of
phase diagrams, polymorphism and dramatic changes in physical properties could lead
to a deeper understanding of matter at the atomic scale. In this section I will briefly
describe the salient features of high pressure crystallography. In case of high pressure
studies the crystal is under stress which may be either hydrostatic or nonhydrostatic.
In an opposed-anvil set up the stress state at the centre of the compressed sample is
given by
σij =
∣∣∣∣∣∣∣∣∣∣∣∣
σ11 0 0
0 σ22 0
0 0 σ33
∣∣∣∣∣∣∣∣∣∣∣∣=
∣∣∣∣∣∣∣∣∣∣∣∣
σp 0 0
0 σp 0
0 0 σp
∣∣∣∣∣∣∣∣∣∣∣∣+
∣∣∣∣∣∣∣∣∣∣∣∣
− t3
0 0
0 − t3
0
0 0 − t3
∣∣∣∣∣∣∣∣∣∣∣∣=σp +Dij(1.4)
Where σ11 and σ33 are radial and axial stress components respectively. σp is
17

1. Introduction
the mean normal stress which is equivalent to hydrostatic pressure. The uniaxial
stress component t=(σ33-σ33) and Dij is the deviatoric stress component. Thus for
hydrostatic compression the off diagonal stress components will be zero implying the
absence of any shear stress on the sample and the diagonal terms are equal to applied
pressure.
σkl = Pfork = l (1.5)
σkl = 0fork 6= l (1.6)
and hence for hydrostatic compression the stress strain relationship is given by
εij = PSijkk (1.7)
Here Sijkk is the elastic compliance tensor or elastic modulus tensor.
Therefore for crystal under stress the relative change of volume is given by the
sum of the diagonal term of the strain tensor,
∆V
V= Σεii = PΣSiikk (1.8)
The above equation implies that the isothermal volume compressibility is Siikk. Hence
the isothermal elastic compliances written out in matrix form can be related with the
isothermal bulk modulus K as
K = (S11 + S22 + S33 + 2S12 + 2S13 + 2S23)−1 (1.9)
which is true for all crystal systems. The relationship between individual elastic
compliances (Sijkk) and linear compressibilities (βl) of the axes can be obtained from
18
1.4. Crystallography under High Pressure
the fact that the linear compressibility, βl, in any direction in a crystal is defined by
its direction cosines li as βl = Sijkklilj [56] In case of non-hydrostatic environment
on the randomly oriented compressed polycrystalline sample the stress field can be
defined by principal stresses in the radial (σ1) and axial (σ3) directions as shown in
figure 1.3. Therefore the stress tensor can be written as σ = [σ1, σ1, σ3 as diagonal
Figure 1.3: For high pressure x-ray diffraction experiments the choice of diffraction ge-ometry for stress analysis. σ1 and σ3 are the principal stress axes. ψ is the angle betweenthe diffracting plane normal and the load direction.
elements]. The hydrostatic pressure is defined as the average of the three principal
stresses while the deviatoric stress component (t) is defined as the difference between
the two principal stresses i.e. radial and axial stresses.
P =2σ1 + σ3
3(1.10)
t = σ1 − σ3 (1.11)
As per anisotropic elasticity theory (σ1−σ3) is hkl dependent, however for all practical
purposes deviatoric stress represents the average differential stress for all hkl values.
It has been shown by AK Singh et al. [57] that dhkl in case of non-hydrostatic stresses
is a function of the angle ψ.
d(hkl) = dp(hkl)[1 + (1− 3 cos2 ψ)Q(hkl)] (1.12)
19

1. Introduction
where dp(hkl) is the d spacing under the hydrostatic pressure σp alone and Q(hkl) is
given by
Q(hkl) = (t/6)× [(α/GR) + ((1− α)/Gv)] (1.13)
Where GRand GV are the x-ray shear moduli calculated under the Reuss (iso-stress)
and Voigt (iso-strain) condition respectively. Here averaging is being done only over
the group of crystallites contributing to the diffracted intensity at the point of ob-
servation. Both the moduli are function of compliance coefficients, Sij. The nonzero
factor α which is less than 1 determines the relative weights of the strains calculated
under Reuss and Voight conditions. By plotting the equation (1.12) for several x-ray
diffraction peaks truly hydrostatic pressure dependence of the lattice parameters and
in turn the exact equation of state (EoS) can be determined.
With high pressure x-ray diffraction experiments the pressure induced variation of
unit-cell parameters of the sample are obtained and thereby the variation of volume
(or equivalently its density) with pressure is also deduced.
The pressure induced variation of volume of a solid is characterised by the bulk
modulus K = −V (∂P/∂V ). We generally parameterize the measured equations
of state in terms of the values of the bulk modulus and its pressure derivatives,
K’= ∂K/∂P and K”= ∂2K/∂P 2, determined at zero pressure. These zero pres-
sure (or almost room pressure) values are denoted by a subscript 0 thus : K0 =
−V0(∂P/∂V )(P=0), K0’= (∂K/∂P )(P=0)andK0”= (∂2K/∂P 2)(P=0) . The measured
variation of volume with pressure can be fitted with Murnaghan equation of state
[58] which can be derived from the assumption of linear variation of bulk modulus
with pressure.
V
V0
=
(1 +
K′P
K0
)−( 1
K′
)(1.14)
20

1.4. Crystallography under High Pressure
or as
P =K0
K ′
(V0
V
)K′
− 1
(1.15)
However the above equation of state is valid only for compressions up to 10% (i.e.
V/V0 > 0.9). Therefore to incorporate the higher compressions, Birch-Murnaghan
introduced a finite strain EoS, based upon the assumption [59] that the strain energy
of a compressed solid can be expressed as a Taylor series in the finite Eulerian strain,
fE =
[(V0
V )(2/3)
−1
]2
. By expanding the strain energy to the fourth order in strain we
get the following EoS.
P = 3K0fE (1 + 2fE)52
(1 +
3
2(K
′ − 4)fE +3
2
(K0K
” + (K′ − 4)(K
′ − 3) +35
9
)f 2E
)(1.16)
The third order truncation of strain energy where the coefficient of f 2E is set to
zero produces an EoS with three parameters as given below.
P = 3K0fE (1 + 2fE)52
(1 +
3
2(K
′ − 4)fE
)(1.17)
This equation fits the measured P-V data for compression up to 40 %. For V/V0
< 0.6 the finite strain EoS does not accurately represent the measured P-V data. For
simple solids under very high pressure Vinet EoS derived from a general inter-atomic
potential provides a more accurate fit to the pressure induced variation of volume.
P = 3K0(1− fV )
f 2V
exp(
3
2(K
′ − 1)(1− fV ))
(1.18)
Where fV =(VV0
) 13 The above equation (1.18) is also known as universal equation
of state which accurately describes the isothermal pressure-volume (P-V) relations
for a wide variety of materials.
21
1. Introduction
1.5 Phase Stability and High Pressure
Usually a phase transition means a transition between two equilibrium phases of mat-
ter whose signature is a singularity or discontinuity in some observable quantity which
characterises the phase of the matter. This may occur at a particular temperature or
pressure or by some other means such as by doping, or by applying electric and mag-
netic fields. In case of a structural phase transition, it is the crystal structure which is
altered abruptly. In such phase transition of solids, partial or complete rearrangement
of atoms, or only a slight rearrangement of their positions is required. Sometimes the
change may be quite small to be detected; but on the other hand dramatic changes
can also occur. It is important to realise that a crystal structure may be unstable
with respect to breaking of the symmetry (elastic instability), atomic motion (phonon
instability, displacive mode) or a combination of both. This can lead to phase trans-
formations in the materials. In terms of steric limit it has been shown by Sikka et al.
[60] that a crystal can go to the instability point under pressure when the distance
between the non-bonded atoms in the structure reaches a limiting value, called the
steric limit. This distance can be decreased either by direct bond compression or
by the bond angle bending during compression. In general it is understood that the
stability of a particular phase depends on its symmetry and the stiffness constants.
The most important physical quantity which determines the phase stability of
materials is Gibbs free energy given by
G = U + PV − TS (1.19)
Where U is the total internal energy, P is the pressure, T is the temperature, V is
the volume and S is the entropy of the system. For a phase to be thermodynamically
stable its Gibbs free energy has to be minimum. In real experiments pressure and
temperature are applied externally while internal energy, volume and entropy adjust
22

1.5. Phase Stability and High Pressure
to minimise the Gibbs free energy of the system. With the application of pressure
the phase transition can result as a crossover of Gibbs free energy of the system from
one phase to another phase. In case of isothermal pressure induced phase transitions
of first order the first derivative of Gibbs free energy G, for example volume V or
entropy S of the material changes discontinuously. Or in other words we can say
that ∆V 6= 0 and the P-V behaviour show hysteresis. In case of second order phase
transitions the first derivative of Gibbs free energy G for example volume and entropy
are continuous but the second derivative of G i.e. compressibility or specific heat
are discontinuous. Apart from equilibrium phase-boundaries of interest for a phase
transition, it is also interesting to understand detailed physical mechanisms causing
the structural changes including the kinetics of transformations. In case of 1st order
phase transition, the existence of a kinetic barrier prevents or delays transformation
to the equilibrium structure [61]. This leads to hysteresis in the transformation, i.e.,
progressive transformation of one distinct phase to another with phase coexistence
at constant pressure. But if there exists a third (metastable) structure having an
easier transformation path then the material may transform to the metastable phase.
Actually the name metastable phase is given to a state of a material in which the
material is in local and not in global free energy minimum. In strict sense there are no
metastable phases in classical thermodynamics, since any system should irreversibly
relax to the equilibrium state having least Gibbs free energy. However, long-lived
metastable solid phases exist whose life time at normal conditions exceeds the time
scale of the universe and hence their existence cannot be ignored.
Broadly the structural phase transitions can be classified into three types, recon-
structive, order-disorder, and displacive. A reconstructive phase transition is one in
which transition from one phase to another phase is brought about by bond breaking
and appropriate rejoining of bonds in the other phase such that the orientations of the
bonds in the two phases may be distinctly different or in other words the topological
23

1. Introduction
linkage pattern of the bonds in the two phases is drastically altered. Reconstructive
phase transitions are supposed to be slow (hours to seconds) in nature as atoms must
diffuse from one set of positions in one structure to different positions in another
structure so that a new set of bonds may be formed.
Order-disorder type of structural phase transitions can be divided in to two groups.
In a substitutional order-disorder phase transition both the parent and daughter
phases have very close orientation relations of the bonds. This type of phase transition
is also supposed to be sluggish. In an orientational order-disorder phase transition
small groups of atoms change their orientation by small amounts, and so they do not
alter the fundamental bonding in the material. Since in this type of phase transition
no long range diffusion is required, it is expected to occur relatively rapidly than
reconstructive phase transitions.
In a displacive phase transition bonds are not broken; instead the atoms are simply
displaced with respect to one another by small distances (compared to inter nuclear
distances). Therefore in these phase transitions the topology of the linkage pattern
in the two phases remains unaltered. Since the atomic movements are small, the
time required to complete this type of motion is ∼period of a phonon. Therefore
these types of phase transitions are faster (10−11 to 10−15 sec). Thus displacive
phase transitions usually involving relatively subtle changes in the crystal structure
may result in the interesting relationships between the two phases. This kind of
phase transition may take place continuously through a gradual change in the atomic
displacement, although the symmetry still changes abruptly at the transition point,
leading to a continuous or second order phase transition. On the other hand if there
exists a discontinuity in the volume of the crystal the transition is called first order.
In most cases, such transitions are related to soft mode. In order to observe and
stabilise the different phases under high pressure a lot of technological advances has
taken place which has been presented below.
24
1.6. High Pressure Generation and measurements
1.6 High Pressure Generation and measurements
1.6.1 High pressure Cells
As mentioned earlier in this chapter pressure is defined as force per unit area. Hence
in order to increase the pressure one can either increase the force or decrease the area.
Due to physical constraints, applied force cant be increased beyond a limit. Therefore
a trade off is established between applied force and area and one can generate a lot of
pressure with limited force applied on a very small area in contact. For high pressure
studies researchers in the initial years have used the first approach where they used
to apply as much force as possible using hydraulic press machines. But even with
cylinder of 5 mm diameter (for sample chamber) only moderate pressures of 5 GPa
have been achieved. These hydraulic presses are very bulky and could not be used
for most of the in-situ high pressure studies. In contrast diamond anvil cell (DAC)
based on the second approach. Using DACs one can generate pressure in the Mbar
range. In fact recently ∼ 6.4 Mbar static pressure has been generated using diamond
anvil cell [27]. This experiment had another innovation i.e. the usage of micro semi
balls made up of nano dimonds as second stage anvils in the conventional diamond
anvil cell. Using this device authors have studied the equation of state of rhenium up
to 640 GPa. Nowadays diamond anvil cells are basic work horses for generating very
high static pressure and for carrying out in-situ investigations of the high pressure
behaviour of materials.
1.6.2 Diamond anvil cell
A diamond cell essentially uses two flat parallel faces of two opposed diamond anvils,
as shown in figure 1.4. Force applied (as shown in figure 1.4) on these anvils pushes
these towards each other leading to the application of pressure on the sample loaded
into a metallic gasket. Depending on the way in which the force is generated and the
25
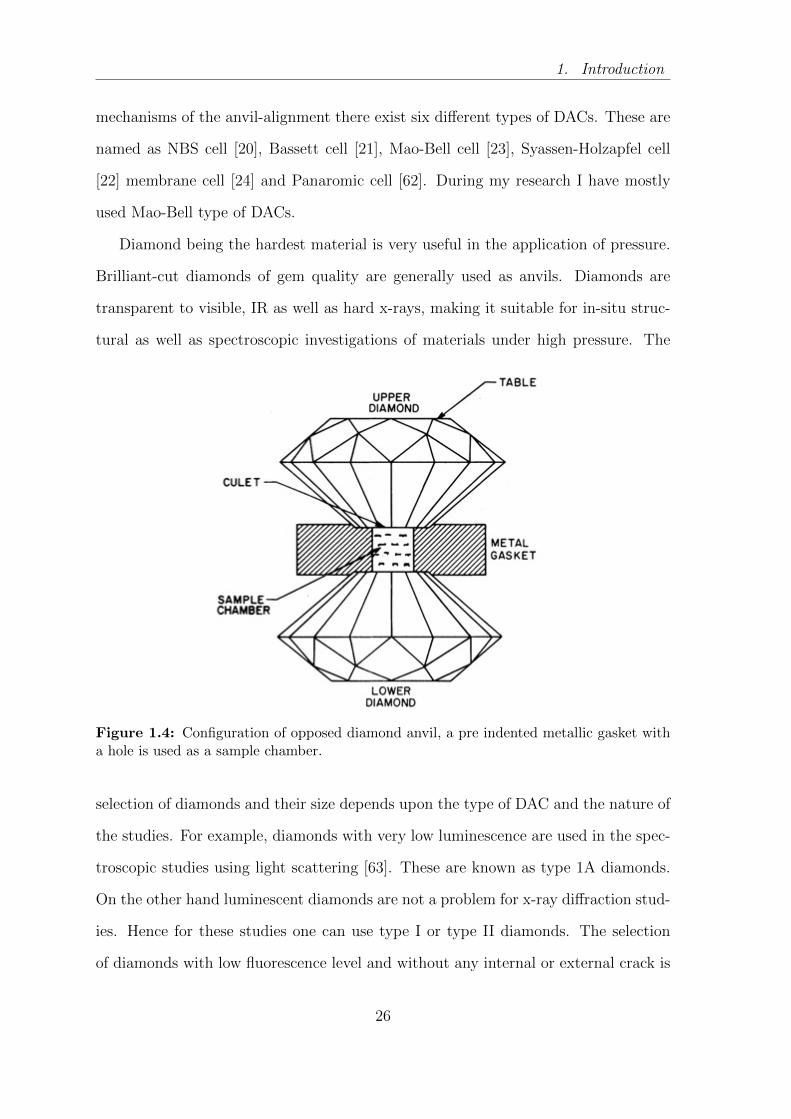
1. Introduction
mechanisms of the anvil-alignment there exist six different types of DACs. These are
named as NBS cell [20], Bassett cell [21], Mao-Bell cell [23], Syassen-Holzapfel cell
[22] membrane cell [24] and Panaromic cell [62]. During my research I have mostly
used Mao-Bell type of DACs.
Diamond being the hardest material is very useful in the application of pressure.
Brilliant-cut diamonds of gem quality are generally used as anvils. Diamonds are
transparent to visible, IR as well as hard x-rays, making it suitable for in-situ struc-
tural as well as spectroscopic investigations of materials under high pressure. The
Figure 1.4: Configuration of opposed diamond anvil, a pre indented metallic gasket witha hole is used as a sample chamber.
selection of diamonds and their size depends upon the type of DAC and the nature of
the studies. For example, diamonds with very low luminescence are used in the spec-
troscopic studies using light scattering [63]. These are known as type 1A diamonds.
On the other hand luminescent diamonds are not a problem for x-ray diffraction stud-
ies. Hence for these studies one can use type I or type II diamonds. The selection
of diamonds with low fluorescence level and without any internal or external crack is
26

1.6. High Pressure Generation and measurements
very crucial as a starting step for preparation of anvil. The pointed culet of a diamond
is truncated into a flat face ranging from 300-500 µm for pressure ranging below 1
Mbar. Actually the pointed culet of gem quality diamond is removed by grinding on
a flat surface. The culet is shaped in octagonal or in hexadecagonal with typical area
of approximately 0.2− 0.4mm2 as shown in figure 1.5. The size of the diamond may
vary from 1/8 to 1/2 carat (1 carat=0.2 gm). Mostly anvil flats with similar area and
shape are used in a DAC.
Figure 1.5: The side and top view of a brilliant cut diamond.
The anvil flat is usually set parallel to the (100) or the (110) plane of the diamond.
The opposite side of the anvil flat with octagonal surface is referred to as the table
as shown in the figure 1.4 and has a typical diagonal distance of 3.5-4.5 mm in larger
diamonds.
27

1. Introduction
1.6.3 Background for high pressure experiments
1.6.3.1 Alignment of the DAC
The diamonds are mounted on to two metallic supports known as rocker and base
plate as shown in figure 1.6. One of the simplest methods of mounting the diamond
to backing plates is to glue them down with some kind of superglue. While mounting
the diamonds with glue one has to be careful otherwise the glue may close the conical
opening.
Figure 1.6: (a) Hemispherical rocker and (b) cylindrical base plate.
The metallic supports are helpful in linear and angular movement of anvils. The
rocker and the base plate work as bases for piston and cylinder devices respectively.
Both the rocker and base plate have conical opening in the centre at the position
of diamond. This allows the hindrance free access to incident as well scattered X-
rays and visible light. The alignment of diamond anvil cell is performed optically
with the help of a (stereo) microscope. In order to align the diamond anvil the culet
faces of both the diamonds have to be matched laterally by translation along X-Y
direction. The translational alignment is checked optically by viewing from the side
of the two anvils. The tilt alignment is achieved through radial/rotational alignment
by viewing through the two anvils and observing the interference fringes, arising from
the air wedge between the nonparallel culet faces. When the two culet faces tend to
be parallel, the thickness of the air wedge decreases and the number of interference
fringes reduce until a homogeneous grey indicates the disappearance of fringes and
thus achievement of perfect parallelism.
28

1.6. High Pressure Generation and measurements
1.6.3.2 Choice of the gasket material
Before gasketed DAC, scientists performed high pressure experiments using piston
cylinder cell or large volume presses. Usage of metal gasket helps generation of
hydrostatic pressure employing fluid like substance inside the sample chamber. An
important role of the gasket is to provide mass support to the anvils. In this sense
gasket is one of the critical components of a diamond anvil cell. Alvin Van Valkenburg
was the first person to use metal gaskets [64]. The choice of gasket material and the
hole dimensions play a crucial role in determining the highest pressure a DAC can
achieve. Upon placing the metal gasket between the two diamonds the indented
portion of the gasket undergoes plastic deformation and the gasket material extrudes
outwards. The strain components within the gasket and its mechanical behavior
are governed by the frictional force (which is limited by the shear strength of the
metal) between the metal and the anvil. The pressure rises from the edge of the
culet towards the centre while the gradient is proportional to shear strength and
inversely proportional to the thickness of the gasket. A significant support is being
provided to the material between the diamonds by pre indented gaskets and this in
turn increases the pressure for a given gasket thickness by several GPa. The gasket
should always be sufficiently thin so that the sample hole contracts as the pressure
is raised. At higher pressure if the hole expands then one should terminate the run.
The sample chamber within the pre-indented gasket is prepared either by using spark
erosion or by mechanical drilling. The first technique is preferred over mechanical
drilling and is almost essential for the hardest materials such as tungsten and rhenium.
Depending upon the requirement of the experiment and the availability of material
a suitable metal sheet/foil (Inconel X750, tempered T301 stainless steel, waspalloy,
Cu-Be alloy, tungsten, rhenium, boron epoxy) is chosen as a gasket. The typical
initial thickness of the metal foil varies from 200 to 280 µm. Desirable thickness of
the pre indented portion is ∼30 to 100 µm depending upon the highest pressure to
29

1. Introduction
be achieved. Inconel or steel gaskets are quite suitable for the use in spectroscopic
(Raman experiments) and x-ray diffraction under high pressure. However for XRD
experiments at very high pressures using hard x-rays from synchrotron sources it is
preferable to use high Z metals like tungsten or rhenium as gaskets materials so as to
avoid the large background. For transport measurement like resistivity one prefers to
use non conducting gaskets like Al2O3 or MgO and for magnetic measurements under
high pressure since the gasket has to be nonmagnetic it is imperative to use Cu-Be
alloy. The amorphous boron mixed raisin epoxy in 4:1 ratio (by weight) is used in
case of high pressure experiments such as radial x-ray diffraction, nuclear resonant
inelastic scattering, inelastic x-ray scatterings and in laser heating experiments [65].
Due to high shear strength of amorphous boron, the thickness of sample chamber
can be maximised which in turn increases the pressure homogeneity. In addition to
this boron is also transparent to x-rays and so unwanted XRD peaks due to gaskets
are removed. Since amorphous boron is too porous to be used as a gasket material
directly, it is mixed with epoxy and thus obtained mixture is used for preparing gasket.
In order to prepare the amorphous boron gasket a hole slightly smaller than the anvil
culet dimension is drilled in a pre-indented metallic gasket and then it is filled with
boron epoxy mixture which is again compressed with anvil. In the compressed boron
part a hole is drilled of required dimension. Amorphous boron with boron nitride
seat has also been used to study the structure of amorphous iron up to 67 GPa
[66]. Use of amorphous boron gasket not only eliminates the XRD peaks from gasket
but also minimizes the x-ray absorption from it. In addition to this, experimenters
have also used bulk metallic glass gaskets for high pressure in-situ x-ray diffraction
experiments [67]. Amorphous metallic alloys lack long range order and exhibits very
good homogeneity and no microstructure discontinuities. Moreover these have higher
tensile fracture strength and hardness than those of crystalline counterparts. These
excellent physical properties make bulk metallic glasses good candidates as gaskets,
30

1.6. High Pressure Generation and measurements
though many times lack of ductility might lead to fracture of diamonds.
1.6.3.3 Pressure transmitting medium
For high pressure experiments it is of utmost importance to ensure that the force
applied to the sample is homogeneous and the sample is free of any shear strains or
any differential stress. In order to achieve this, sample within the pressure chamber
must be immersed in a medium which displays hydrostatic behaviour, for example a
liquid, a gas or a soft solid having very low shear stresses. Non-hydrostatic stresses
lead to considerable broadening and shift in the position of the x-ray diffraction peaks
or in the positions of Raman peaks and thus it can lead to inaccurate determination of
lattice parameters or Raman modes behaviour. Sometimes non-hydrostatic stresses
can also suppress or facilitate the phase transitions and hence can change the phase
transition pressure or can even change the phase diagram.
The pressure transmitting medium should not support any shear stress. In addi-
tion to this the pressure transmitting medium should be chosen in such a way that
it does not dissolve or react with the sample. Additionally it should not propagate
inside the open structured or cage like structured compounds. These criteria have
resulted into the usages of large variety of pressure transmitting media like soft solids,
condensed gases, mixture of alcohols, fluorocarbons and inert silicone oil depending
upon the type of experiments one needs to carry out.
One of the most commonly used pressure transmitting medium for high pressure
studies is the 4:1 metanol:ethanol mixture, which is supposed to remain hydrostatic
up to its glass transition temperature i.e. at 10.4 GPa and quasi hydrostatic up to ∼20
GPa . The methanol, ethanol and water mixture (16:3:1) remains hydrostatic up to
14.3 GPa. But the later one can be only applied for non hygroscopic samples. Table
1.3 summarises the pressure media that are generally used for various high pressure
studies. It has been shown by Loubeyre et al. That hydrogen remains a very good
31

1. Introduction
hydrostatic medium even in the very high pressure (Mbar) regime. However there
are some drawbacks of hydrogen due to its high chemical reactivity and diffusion in
anvil and gasket. Liquid helium (He) is considered as the next most suitable pressure
transmitting medium due to its low freezing point. Though the liquid He freezes
at pressure beyond 0.5 GPa and below 39 K, but the pressure still remains quasi
hydrostatic as frozen helium is the softest solid known. Argon is found to be better
than methanol:ethanol mixture. But with reduction in temperature, the pressure also
reduces inside DAC. It has been observed that mixture of liquids remain hydrostatic
at pressures more than the freezing pressure of individual liquids. Actually with
increasing pressure the viscosity of these fluids increases and after a critical pressure
called as glass transition pressure the fluid transforms into glass and the pressure
in the sample chamber becomes inhomogeneous and differential (generally uni-axial)
stress and shear stresses appear. Among different solidified gasses Argon is the poorest
transmitting medium while helium is best. In the 0-10 GPa range nitrogen is equally
hydrostatic to neon despite its lower solidification pressure i.e. 2.4 GPa compared to
4.8 GPa of neon [68].
1.6.3.4 Pressure calibration
In case of high pressure experiments it is one of the most important tasks to measure
the accurate pressure at the sample. The pressure at the sample can be measured
using the primary /absolute or secondary scale. A primary scale is based on the
fundamental physical laws for example on laws of conservation of mass, momentum
and energy. Generally primary scale is used to pre-calibrate the secondary scale.
The primary/absolute scale can be determined by using the shock Hugoniot of a
material[79] , by using piston cylinder [80] or by directly measuring the density and
elasticity [81].
In first case, shock hugoniot of a material can be considered as a primary scale.
32
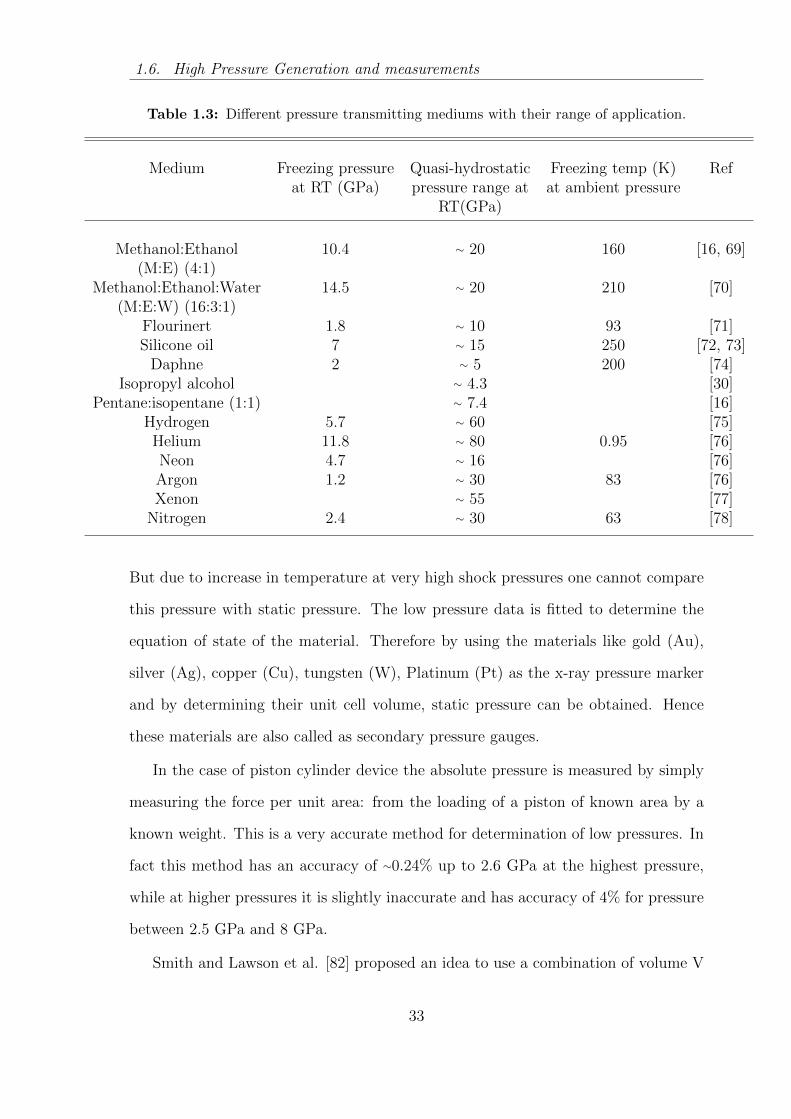
1.6. High Pressure Generation and measurements
Table 1.3: Different pressure transmitting mediums with their range of application.
Medium Freezing pressure Quasi-hydrostatic Freezing temp (K) Refat RT (GPa) pressure range at at ambient pressure
RT(GPa)
Methanol:Ethanol 10.4 ∼ 20 160 [16, 69](M:E) (4:1)
Methanol:Ethanol:Water 14.5 ∼ 20 210 [70](M:E:W) (16:3:1)
Flourinert 1.8 ∼ 10 93 [71]Silicone oil 7 ∼ 15 250 [72, 73]
Daphne 2 ∼ 5 200 [74]Isopropyl alcohol ∼ 4.3 [30]
Pentane:isopentane (1:1) ∼ 7.4 [16]Hydrogen 5.7 ∼ 60 [75]Helium 11.8 ∼ 80 0.95 [76]Neon 4.7 ∼ 16 [76]Argon 1.2 ∼ 30 83 [76]Xenon ∼ 55 [77]
Nitrogen 2.4 ∼ 30 63 [78]
But due to increase in temperature at very high shock pressures one cannot compare
this pressure with static pressure. The low pressure data is fitted to determine the
equation of state of the material. Therefore by using the materials like gold (Au),
silver (Ag), copper (Cu), tungsten (W), Platinum (Pt) as the x-ray pressure marker
and by determining their unit cell volume, static pressure can be obtained. Hence
these materials are also called as secondary pressure gauges.
In the case of piston cylinder device the absolute pressure is measured by simply
measuring the force per unit area: from the loading of a piston of known area by a
known weight. This is a very accurate method for determination of low pressures. In
fact this method has an accuracy of ∼0.24% up to 2.6 GPa at the highest pressure,
while at higher pressures it is slightly inaccurate and has accuracy of 4% for pressure
between 2.5 GPa and 8 GPa.
Smith and Lawson et al. [82] proposed an idea to use a combination of volume V
33

1. Introduction
and compressibility (isothermal bulk modulus KT ) to extract the true thermodynamic
pressure by integration of KT .
P =∫ (
KT
V
)×(∂V
∂P
)(1.20)
The above pressure scale has an accuracy of ∼1%.
The inaccuracy in direct calculation of pressure from applied load increases for
higher pressures due to both internal friction and plastic or elastic deformation of
gasket which absorbs an unknown amount of the load. Hence to overcome this,
secondary scale method is used where some standard material is employed and by
utilizing its physical properties and characteristic relative changes with pressure one
can determine the pressure applied on the sample. Secondary pressure standards
can be of fixed or continuous type. The fixed pressure scales are usually used to
calibrate the large volume presses. Reproducible phase transitions of some materials
like Bismuth (Bi), Thallium (Tl), Barium (Ba) can be used to define the practical
pressure scale. The large changes in volume or electrical resistance at the phase
transition pressure can be used to calibrate the pressure.
One of the most convenient and commonly used methods for determination of
pressure is based on the laser induced fluorescence measurement. This method has
the advantage that the luminescent crystal such as ruby or rare earth element-doped
oxyhalogenides used for this measurement has to be used in very less amount and
hence a lot of volume of the sample chamber can be occupied by the sample as well as
pressure transmitting medium itself. The precision of the measurement is equivalent
to ∼ 0.01 GPa.
Ruby fluorescence is a very important pressure gauge and is now commonly used
for pressure determination. Barnett et al. [83] and Piermarini et al. [84] calibrated
the shift in ruby fluorescence with the Dekker EOS of NaCl [85]. Ruby is Cr3+(0.05
34

1.6. High Pressure Generation and measurements
at.%) doped α-Al2O3 which is known to be stable and does not undergo a phase
transition up to the Mbar pressures. Ruby crystal excited by a laser line (in the
visible region), undergoes a transition to the Y and U band and these de-excite by
non radiative decay to the metastable states 2E (E1/2 and E3/2). De-excitation from
these states to the ground state i.e. (2E→ 4A2) gives two strong luminescence lines R1
(E1/2 →4A2) and R2 (E3/2 →4A2) at 6942A (14402 cm−1) and 6928.2A (14432 cm−1)
respectively [86]. These fluorescence lines blue shift with application of pressure, thus
making the ruby fluorescence signal a suitable pressure calibrant.
Later on Piermarini et al. found that the hydrostatic pressure inside the cell varies
approximately linearly with shift of the R1 and R2 ruby luminescence lines up to 19.5
GPa and it was determined that Pressure (P, in kbar) is related to the wavelength
shift (∆λ, in A) by the relation
P (kbar) = 2.746∆λ(A) (1.21)
This linear relation is no longer valid for pressures beyond ∼ 30 GPa. The line
width and the distance between the two peaks can be used as an indicator for the
hydrostaticity of the stresses inside the cell [87]. Later on the ruby pressure scale
was extended to Mbar region under quasi hydrostatic conditions by Mao et al [88]
by calibrating it against Cu as x-ray pressure marker in argon (Ar) medium and
tungsten (W) as pressure marker in neon (Ne) medium and the pressure dependence
of the ruby line shift has been shown to obey the following relation
P (GPa) =1904
B
(1 +∆λ
694.24
)B− 1
(1.22)
Here pressure (P) is in GPa, ∆λ is the ruby R1 line wavelength shift is in nm and
parameter B = 7.665 and 5 for quasi-hydrostatic and non hydrostatic conditions
respectively.
35

1. Introduction
Ruby fluorescence technique has a drawback that intensity of luminescence peaks
decreases with pressure. This technique is useful only up to a pressure of ∼150 GPa.
Beyond this pressure, the fluorescence signal from diamond interferes with ruby peaks.
But due to fact that the diamond fluorescence and the ruby life times differ by several
orders of magnitude and hence by chopping the excitation source one can separate
out both the signals and pressure can still be determined. However, Xu et al., have
shown that beyond 280 GPa ruby fluorescence reappears due to diminishing diamond
fluorescence and using this technique it has been possible to measure pressure up to
550 GPa [89]. In addition to pressure measurement the ruby fluorescence is also useful
in many other ways, e.g. by observing the R1-R2 line separation one can speculate
about the hydrostatic nature of the pressure transmitting medium. For the truly
hydrostatic pressure the R1-R2 separation remains constant else it changes for the
non hydrostatic case. The R1-R2 separation increases for the ruby strained along
the a-axis whereas it decreases for ruby strained along the c-axis. The increase or
decrease in splitting is because of the movement of the R1 line as it has been found
to red shift remarkably for non hydrostatic stresses while R2 line is independent
of non hydrostatic stresses. Generally with non hydrostatic stresses the ruby lines
broaden primarily because of inhomogeneous stress distribution. One can anneal
at higher temperatures and cool slowly to remove the stresses in the ruby chips.
Since temperature produced a wavelength shift of the ruby lines by a mean value
of ∼6.2 ×10⁻³ nm/K. Vos and Schouten [90] gave an empirically derived third order
polynomial. Later on Syassen et al. [91] suggested that since the effect of Cr3+ doping,
temperature and pressure are independent of each other and hence the frequency shift
can be expressed as a superposition of these i.e.
∆ν = ∆ν(cw) + ∆ν(T ) + ∆ν(P ) (1.23)
36

1.6. High Pressure Generation and measurements
here cw, T and P represents the Cr concentration, temperature and pressure respec-
tively.
For small ∆T the ∆ν(T ) can be written as
∆ν(T ) =
[(∂ν
∂V
)T
(∂V
∂T
)P
+
(∂ν
∂T
)V
](1.24)
here first part in the square bracket represents the contribution from thermal
expansion and second part is isochoric. For high pressure studies at elevated temper-
atures (HP-HT), ruby fluorescence technique is no more suitable because of the large
temperature induced frequency shifts of the ruby lines together with the broadening of
lines. Hence alternative fluorescence materials having small temperature dependent
shift and prominent pressure sensitivity are chosen to meet the requirement. One
such materials is Sm:YAG crystal (0.5 % Sm2+ concentration) with zero temperature
dependence and hence is used for pressure measurement in the HP-HT case [92] .
In addition to the above mentioned materials, Raman shifts of diamond 13C and of
cubic boron nitride, and Sm2+ fluorescence line shifts of SrB4O7: Sm2+ under high
pressures and high temperatures are also used to determine the pressure [up to P
∼100 GPa and T ∼850 K] [93, 94].
1.6.4 Synchrotron sources and diffraction technique
Synchrotron sources are electron accelerator based light sources with many more ad-
vantages over laboratory based x-ray tube sources such as rotating anode generator
type of x-ray sources etc. First and foremost thing is that their brightness is many
orders (∼104−10) higher compared to laboratory based x-ray sources. Hence incident
flux at the sample and diffracted intensity is excellent. The synchrotron radiation has
a wide energy (wavelength) range covering IR to hard x-rays and hence it is possible
to select a wavelength of choice and perform experiments. In addition to this the
37
1. Introduction
synchrotron radiation is a collimated beam (in vertical direction) with time structure
and plane polarised in the plane of the ring. In order to determine the crystal struc-
ture of a material x-ray diffraction, a ubiquitous technique, is most commonly used
and hence many more x-ray diffraction beam lines are operating at any synchrotron
facility.
1.6.4.1 Wavelength selection
Choice of the X-rays wavelength (λ) is another equally important factor in case of
high pressure x-ray diffraction experiments. Since this parameter directly affects the
range of d spacing and many other things hence it is of interest to discuss it briefly.
As we know that longer wavelengths produce stronger diffracted beams because the
scattering power of crystals varies as λ3 and the efficiency of most detector systems
also increases with larger wavelengths. But on the other hand the longer wavelengths
are quite strongly absorbed by both the samples and its surrounding like Be backing
plates, diamonds etc of DAC. In case of laboratory based sources, for example even
though the Cu (Kα)(λ = 1.5406A) radiation is of longer wavelength but it is un-
suitable for high pressure XRD experiments because the x-ray intensity transmission
through a pair of diamonds anvils each 1.5 mm thick will be only 0.9 %. Instead one
favours to use Mo(Kα)(λ = 0.7093) which has a transmission of ∼54 % under above
conditions. Although the Ag(Kα)(λ = 0.5594A) source has shorter wavelength than
Mo(Kα) and hence has better transmission with ∼67%under the above mentioned
conditions. But due to poor efficiency of many detectors at shorter wavelengths the
Ag x-ray tubes or Rotating anode generators based on Silver source are not prefer-
able. In addition to this the shorter wavelengths also generate higher background
and hence lower signal to noise ratios. With the use of monochromatic synchrotron
radiation one need not worry about the above discussed issues because at synchrotron
beam lines the incident as well as the diffracted intensity is generally more than suf-
38

1.6. High Pressure Generation and measurements
ficient. Moreover due to quite low divergence of synchrotron beam the diffraction
from anvil is also minimised. Hence one prefers to go for the shorter wavelengths
at synchrotron sources for high pressure XRD experiments. However, for shorter
wavelengths the background intensity increases due to increased Compton scattering
from the DAC as well as reduced absorption by the gasket. Hence for high pressure
XRD experiments one generally favours to use tungsten (W) or Rhenium (Rh) as
gasket materials. Hence the choice of suitable radiation wavelength is a kind of trade
off. The wavelength ∼0.6888 A is generally used for monochromatic x-ray diffraction
studies at high pressure.
1.6.4.2 In-situ angle dispersive x-ray diffraction
X-ray diffraction is one of the most important techniques to be used for structural
studies of materials. X-rays of sub angstrom wavelengths are generally employed to
determine the structure of any material under extreme conditions. When the basic
condition for the diffraction i.e. Bragg equation is satisfied, one gets the constructive
interference among scattered x-rays.
2dhkl sin θhkl = nλ (1.25)
where dhkl is the interplanar spacing, θhkl is the angle of specular reflection corre-
sponding to lattice planes with miller indices hkl and λ is the wavelength of the x-rays
used. Diffraction angle which is defined as the angle between incident and diffracted
x-rays is equal to 2θhkl. In order to find out the crystal structure of a material one
can either use monochromatic x-rays or white x-rays. The x-ray diffraction method
in which one uses monochromatic x-rays and data is collected by scanning the angle
is known as angle dispersive x-ray diffraction. Another variant of x-ray diffraction
where one uses polychromatic x-rays is known as energy dispersive x-ray diffraction
(EDXRD) method which has been discussed in latter section. Angle dispersive x-ray
39
1. Introduction
diffraction (ADXRD) has better resolution (∆dd
= 10−3to10−4) than EDXRD method.
Nowadays with the use of area detectors like imaging plate the data in ADXRD can
be collected in large two theta range simultaneously. Variation of intensity of XRD
peaks with temperature is taken care by Debye Waller factor
Iα exp−2M (1.26)
Where 2M = 16π2 < u2 > sin2 θ/λ2 ; u is atomic displacement, 2θ is bragg angle
and λ is the wavelength of x-ray radiation. Therefore intensities of the observed XRD
peaks at higher angular values suffer because of increasing Debye Waller factor and
reducing form factor at higher angular values.
X-ray diffraction data can be collected from powder sample as well as single crys-
tals. Powder diffraction technique has several advantages in terms of data collection
as well as sample handling etc. However it has some drawbacks like; it is inherently
one dimensional; there will be overlap of XRD peaks with similar d spacings, num-
ber of crystallites actually diffracting are small and crystallites may have preferred
orientation at high pressures giving rise to texture effects. In order to circumvent all
these difficulties single crystal x-ray diffraction (SXD) can be used which gives more
information and higher resolution than polycrystalline XRD. In principle SXD can
provide accurate electron density distributions. The ambiguities observed in XRD
peak positions and intensities in powder XRD data due to overlapping peaks can
be easily avoided in SXD experiments. Thus for accurate determination of lattice
parameters and atomic positions SXD is better than powder x-ray diffraction. More-
over the SXD data gives three dimensional information. However SXD experiments
under high pressure have its own difficulties due to limited access of diffraction angle,
x-ray absorption by diamonds, non uniform background as well as XRD peaks due
to gasket.
For my high pressure XRD studies presented here I have used laboratory as well
40
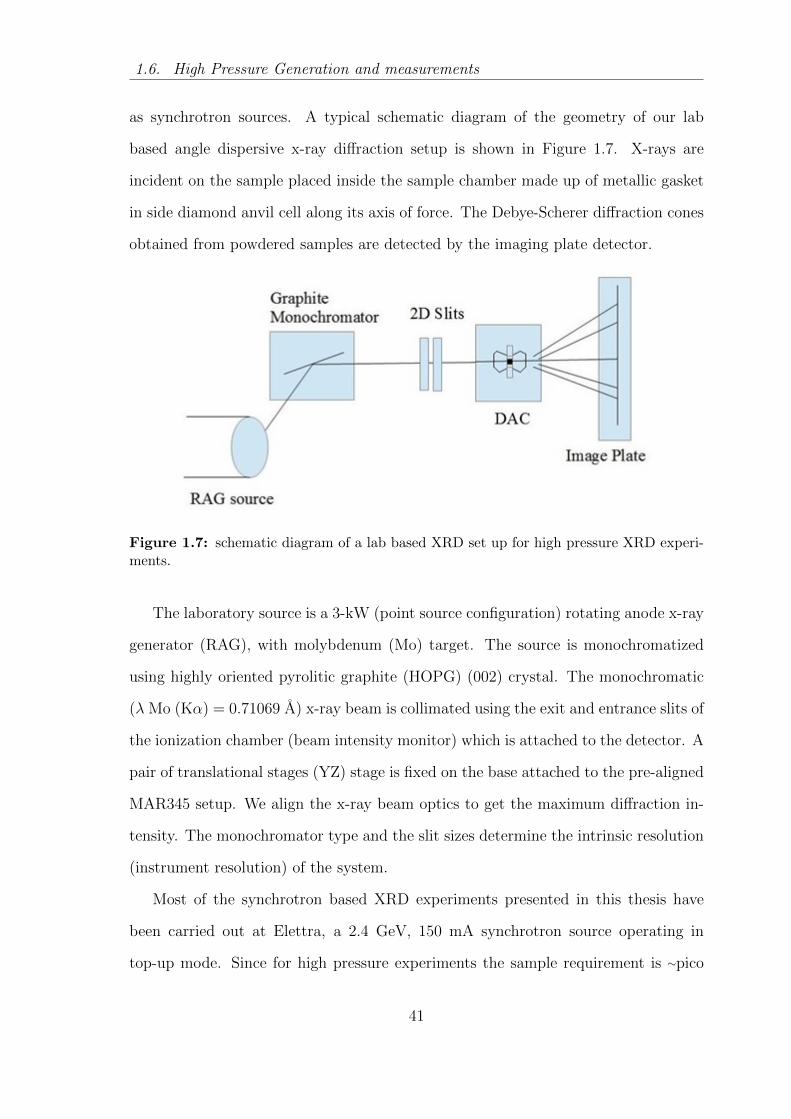
1.6. High Pressure Generation and measurements
as synchrotron sources. A typical schematic diagram of the geometry of our lab
based angle dispersive x-ray diffraction setup is shown in Figure 1.7. X-rays are
incident on the sample placed inside the sample chamber made up of metallic gasket
in side diamond anvil cell along its axis of force. The Debye-Scherer diffraction cones
obtained from powdered samples are detected by the imaging plate detector.
Figure 1.7: schematic diagram of a lab based XRD set up for high pressure XRD experi-ments.
The laboratory source is a 3-kW (point source configuration) rotating anode x-ray
generator (RAG), with molybdenum (Mo) target. The source is monochromatized
using highly oriented pyrolitic graphite (HOPG) (002) crystal. The monochromatic
(λ Mo (Kα) = 0.71069 A) x-ray beam is collimated using the exit and entrance slits of
the ionization chamber (beam intensity monitor) which is attached to the detector. A
pair of translational stages (YZ) stage is fixed on the base attached to the pre-aligned
MAR345 setup. We align the x-ray beam optics to get the maximum diffraction in-
tensity. The monochromator type and the slit sizes determine the intrinsic resolution
(instrument resolution) of the system.
Most of the synchrotron based XRD experiments presented in this thesis have
been carried out at Elettra, a 2.4 GeV, 150 mA synchrotron source operating in
top-up mode. Since for high pressure experiments the sample requirement is ∼pico
41

1. Introduction
litre hence one needs to use bright sources of x-rays. In case of BL 5.2R beamline at
Elettra synchrotron source, high flux x-ray is obtained from an insertion device which
is a hybrid multipole wiggler, composed of three sections for a total length of 4.5 m.
It has a fixed gap of 22mm with magnetic field strength B=1.6T. The white beam is
collimated in the vertical direction by a Pt coated cylindrical mirror with a radius of
curvature of 14.8 km. A Si (111) based double crystal monochromator (DCM) is used
to tune a specific wavelength and a bendable toroidal focusing mirror, with 55mm
and 9.3 km of sagittal and tangential radius, is used to focus the monochromatised
beam. Monochromatic x-rays of desired wavelength (typical, λ ∼ 0.6888 A), further
Figure 1.8: RAG based high pressure XRD set up at laboratory.
collimated through an 80 µm collimator, are incident on the sample inside DAC
and the diffracted x-rays are recorded either by Image plate detector or through
Pilatus detector. The collected x-ray diffraction data is in the form of two dimensional
image (powder rings). This 2-dimensional image is converted into one dimensional
diffraction profile using FIT2D [95] software. In order to calibrate or to find out
the tilt plane and rotation angle of image plate one needs to use a standard sample
like CeO2, LaB6 or NaCl before starting the high pressure experiments. With help of
42
1.6. High Pressure Generation and measurements
these standard measurements the sample to detector distance is also calibrated. Thus
obtained diffraction profiles are carefully analysed for crystallographic parameters
with the help of Le Bail and Rietveld refinements as incorporated into GSAS [96]
or FULLPROF [97]. Le Bail refinement is a full pattern refinement method which
only refines the lattice parameters while Rietveld refinement is a method where entire
diffraction pattern is fitted at once and the integrated intensity of each peak is used
to refine the positions of the atoms in the cell. The details about these refinement
methods are given in appendix A.
1.6.4.3 In-situ energy dispersive x-ray diffraction
For energy dispersive x-ray diffraction (EDXRD) method [98] the white x-ray beam is
incident on the sample and the diffracted x-rays are energy analyzed through a high
purity germanium detector kept at a fixed angle. This technique is very useful in case
of measurements with constrained geometry, such as for samples at high pressures
and/or high temperatures. In addition to this it is also particularly suited for the
kinetic studies on the samples. Since the EDXRD method can produce data over
a larger Q(2π/d) range, defined by energy range of the white synchrotron radiation
and the collection angle (θ), this can provide better real space structural resolution.
The only limitation of this technique is that the HPGe detector has inherent resultion
∼10−2 and hence this technique has resolution (∆d/d)∼10−2 only. For EDXRD , the
Bragg condition can be written as
Ehkldhkl sin θ = 6.1999 (1.27)
where Ehkl is the energy of x-ray photons (in keV) which satisfy the Bragg condi-
tion for lattice planes with Miller indices hkl having inter-planer distance of dhkl (in )
at a diffraction angle θ [99]. From above relation it is understandable that the higher
the energy of the x-rays the smaller the d-values can be probed and hence one can
43

1. Introduction
probe larger Q range. Synchrotron has a very wide range of energy and hence fulfils
this requirement. The perfectly collimated x-rays through a pair of precision slits is
incident on the sample inside DAC. The DAC is aligned with respect to synchrotron
radiation beam with the help of seven axis sample positioning system. The diffracted
x-rays are collected by energy resolving liquid nitrogen cooled high purity germanium
detector. In order to define the diffraction lozenge i.e. sample volume from which
diffraction data is being collected one needs to collect the diffracted data through a
pair of precision slis. The data is collected through Multichannel analyser (MCA)
and signals of different energy are collected in different channels. Details about this
EDXRD beam line, data collection and a few studies have been presented in chapter
6.
1.6.5 Raman Spectroscopy
Raman spectroscopy is one of the most widely used and versatile techniques for studies
of materials under extreme conditions like high pressure [100]. It probes elementary
excitations in materials by utilising inelastic scattering processes using a near ul-
traviolet, visible and near infrared monochromatic light source (laser). The Raman
spectroscopy has an advantage that it provides a large amount of easily analyzable
information very rapidly. The recorded Raman spectra can be utilised to characterise
the vibrational, electronic and magnetic subsystems by observing the corresponding
elementary excitations. It can also be used as a finger-printing technique for analysing
the materials. By in situ Raman spectroscopy one can observe the changes in the
Raman spectra with the application of pressure. These changes may be in the form of
energy of vibrational excitations, phase transformations (including melting), chemical
reactivity and magnetic and electronic transitions.
Raman scattering is defined as an inelastic scattering of monochromatic light with
a material giving information about its vibrational states. In classical descriptions,
44

1.6. High Pressure Generation and measurements
photons having energy h, where h is plancks constant and is frequency of the incident
radiation undergo collisions with molecules and if the collision is perfectly elastic, then
it will be deflected unchanged and is called Rayleigh scattering. In another case it
may also happen that energy is exchanged between photon and molecule during the
collision, being inelastic collision, the molecule may gain or lose amounts of energy
in accordance with the quantum laws. This is called Raman scattering. Out of the
scattered photon only a few photons (1 out of 106 incident photons) will be Raman
scattered. If the scattered photons have frequency less (creation of phonons) than the
incident photon then it is called stokes Raman scattering and if the scattered photon
have frequency more (absorption of phonons) than the incident photon frequency
then it is called anti stokes Raman scattering as shown in figure 1.9.
Figure 1.9: Depiction of stokes and antistokes Raman scattering.
Here the phonon is a quanta of vibrational energy corresponding to each of the
normal mode of vibration. During a vibrational motion, the charge distribution of
atoms in the unit cell changes. The incident electromagnetic radiation interacts with
various vibrational states of the material and this interaction is manifested in the
form of Raman scattering, IR absorption etc. If the dipole moment changes during a
vibration, then this mode is called infrared active mode. If the polarizability of the
45

1. Introduction
atoms in the unit cell is changed by the vibration, then the corresponding vibrational
mode is called Raman active mode. Within the harmonic approximation in a perfect
crystal, phonons of a given q have infinite lifetime. The corresponding first-order
Raman spectra should then be composed of δ-function-like peaks with a full width
at half maximum (FWHM) Γ determined by the spectrometer resolution. However
crystals are neither perfect nor exactly harmonic and hence there will be finite width
of the Raman peaks. The most natural imperfections are the mass fluctuations due
to the natural isotope abundances of the constituent atoms which gives rise to finite
lifetime of phonons. In addition to this another broadening mechanism is due to the
anharmonic decay of a given phonon into two phonons or more.
For recording Raman spectra under high pressure I have used indigenously devel-
oped confocal micro Raman set up in back-scattering geometry as shown in the figure
1.10. The micro Raman set up is built around a Jobin-Yvon HR 460 single stage
Figure 1.10: Micro Raman set up in confocal geometry for high pressure Raman scatteringmeasurement.
spectrograph with liquid nitrogen cooled charge coupled device (CCD). This spectro-
graph is of dispersive type having arrangements for an interchangeable dual grating
turret with gratings of groove density 1200 grooves/mm and 2400 grooves/mm in
Czerny-turner optical configuration. In this optical configuration two concave mir-
46

1.6. High Pressure Generation and measurements
rors and one plano diffraction grating is used as shown in figure 1.11. The detector
is back thinned Spectrum One CCD where charges are stored in the depletion region
of metal-oxide semiconductor capacitors. Due to back thinning it provides a better
signal to noise ratio. It has two major advantages over its other counterparts like
PMT; one is its quantum efficiency is up to 90% which is higher than that of PMT
and another is that CCD is very fast in comparison to PMT as several frequencies
can be detected simultaneously.
Figure 1.11: Optical layout of dispersive Raman scattering set up.
For excitation we either use diode pumped solid state laser (Nd-YAG) with wave-
length 532nm or an Ar ion laser (457nm, 488 nm and 514.5 nm) which serve our pur-
pose of being monochromatic with narrow line width and capable of providing high
irradiance at the sample. Since the Raman scattered light is very weak (two to four
orders lower) in comparison to Rayleigh scattered light hence a suitable supernotch or
edge filter is used to stop the Rayleigh scattered light. Edge filters exhibit good trans-
mission only on one side of the Rayleigh line, but now the holographic notch filters
can provide good transmission in both the Stokes and anti-Stokes regions. Usually
only the stokes lines are measured, since the intensity of the anti-Stokes lines is much
lower than that of the Stokes lines at ambient temperature. However the intensity
of anti-Stokes lines increases at high temperatures. Therefore the anti-Stokes Raman
47

1. Introduction
scattering is well suited to the in situ investigation of samples at high temperatures.
Thus the anti stokes lines can also be used during HP-HT measurement to estimate
the temperature at the sample.
The main advantages of holographic notch filters are: high attenuation of the
Rayleigh line; narrow bandwidth; sharp spectral edges; good transmission outside
the band, even at low wavenumbers; high damage threshold and stability to the
environment.
Spectral purity, a very important parameter for Raman spectrometer, is defined as
its ability to distinguish radiation of the narrow wavenumber band ν ±∆ν, to which
it is set, from radiation of other wavenumbers. The ability of a monochromator to
distinguish between different wavenumbers depends upon factors like resolving power,
dispersion, and slit width.
1.7 Materials Studied
In this section the materials studied for my doctoral research work are summarized
along with the emphasis on motivation to study these materials.
1.7.1 Zircon Structured Materials
Zircon, an important mineral found in the earths crust, mainly in igneous rocks
and sediments. It has important geophysical implications as well as technological
applications in the field of solid state scintillators [101, 102], laser-host materials
[103], and in other optoelectronic devices like eye-safe Raman lasers [104, 105, 106]
etc. These materials have several advantages over other scintillating materials due to
its relatively large X-ray absorption coefficient and scintillation output. These are the
reasons that have made these materials very popular for detecting X-rays and γ−rays
in medical applications [107]. Zircon (ZrSiO4) crystallizes into tetragonal space group
48

1.7. Materials Studied
(I41/amd with four formula units) and under goes to a first order phase transition
from zircon to the reidite (scheelite) phase at ∼23 GPa. Several isostructural ABO4-
type compounds, such as vandates, chromates, germinates also crystallizes into zircon
structure. But it is not known how the nano crystalline zircon or scheelite structured
material will behave under pressure. The scheelite strucuted materials are known
to transform to many competing monoclinic phases or may show dissociation under
pressure followed by pressure induced amorphisation.
With the aim to understand the high pressure behavior and mechanism of phase
transiton I have studied the nano crystalline chromates (Y CrO4, HoCrO4) using x-
ray diffraction and Raman technique. In addition to this I have also investigated
a flouroscheelite compound, Lithium erbium fluoride (LiErF4) to understand the
sequence of phase transitions.
1.7.2 Pyrochlores
Pyrochlores are another class of compounds which have not only geophysical relevance
but also show interesting physical phenomenon. There is a lot of technological interest
in these compounds as high permittivity ceramics, thermistors, thick film resistors,
electrodes for solar cells etc. These compounds have geometrically frustrated mag-
netic structure and several competing interactions like near neighbor dipolar, crystal
field interactions and quantum fluctuations etc can lift the degeneracy which can
result in various complex ground states, at very low temperatures, e.g. spin-liquid,
spin-ice and spin-glass. It will be highly interesting to study such compounds under
pressure because high pressure may change delicate balance among various compet-
ing interactions leading to realization of different physical states. The pyrochlore
materials are also potentially useful in nuclear engineering as a result of their utility
for actinide rich nuclear waste immobilization. Hence it is imperative to study the
stability and high pressure behavior of these compounds.
49

1. Introduction
I have investigated the high pressure behavior of titanate pyrochlores i.e. ytter-
bium titanate (Y b2Ti2O7) and dysprosium titanate (Dy2Ti2O7) and determined that
Y b2Ti2O7 undergoes a reversible phase transition from cubic to monoclinic struc-
ture while the Dy2Ti2O7 shows a volume discontinuity around 9 GPa indicating an
instability in its lattice.
1.7.3 Perovskites
Perovskites are an important class of materials not only from basic physics point of
view but also due to their technological relevance as ferroelectrics, piezoelectrics, re-
laxors, multiferroic matierials etc. Under extreme temperature and pressure several of
them undergo phase transformations to the post perovskite structures or decompose
into their respective oxides, making them relevant to the understanding of geophys-
ical phenomenon. In particular the studies on silicates, oxides and fluorides suggest
that the transformation to the post perovskite structure could be responsible for the
seismic discontinuity at the earths lower mantle-core boundary. Hence it is of utmost
importance to study the high pressure behavior of materials with perovskite struc-
ture. Therefore, high pressure behavior of perovskites like BiFeO3, BaLiF3 and a
double perovskite Sr2MgWO6 have been studied using x-ray diffraction and Raman
scattering technique.
1.7.4 Phosphate material
The phosphate materials are well known for their geophysical importance. As these
materials are found within mantle and could be visualised as interlinked polyhedral
motif. The pressure may change the polyhedral motif by either affecting the inter
polyhedral linkages or by distorting the polyhedra by increasing the polyhedral coor-
dination. It is of interest to study the behaviour of these open framework structured
materials on application of pressure. U2O(PO4)2 is one such important material which
50

1.8. Plan of thesis
not only shows negative thermal expansion (NTE) behaviour but also has potential
applications in the field of nuclear waste disposal. Hence we have investigated the high
pressure behaviour of such a phosphate material i.e. U2O(PO4)2 employing Raman
scattering and x-ray diffraction technique up to ∼14 GPa and 6.5 GPa respectively.
1.8 Plan of thesis
The following chapters have been arranged as follows. The chapter two describes
about the high pressure investigation on zircon and scheelite structured materials
while the studies carried out on pyrochlore materials have been presented in chapter
3. Chapter 4 is about perovskite materials and their studies. In chapter 5, I have
presented the detailed investigations on U2O(PO4)2. The development of EDXRD
beam line along with a few studies have been described in chapter 6.
51

1. Introduction
52

2
Phase Transformation in Zircon
and scheelite Structured Materials
ABX4 type of structures known as ternary compounds have important geophysical
and geochemical relevance as these are common minerals in various kinds of igneous
rocks in the Earths upper mantle and crust, and have been also found in meteorite
impact debris [108]. In addition to this zircon is an important host mineral for heat
producing radioactive elements in the Earths crust. Zircon and scheelite type of com-
pounds are technologically important materials having very attractive luminescence
properties and hence are used in solid state scintillators [101, 102], laser-host materi-
als [103], and in other optoelectronic devices [104, 105, 106]. These materials show a
variety of phase transitions for example, materials with zircon structure are known to
undergo zircon to scheelite transition while scheelite structured materials may trans-
form to many competing monoclinic structures like wolframite or fergusonite or may
dissociate under high pressure. I have chosen to study the high pressure behaviour of
zircon structured chromates and scheelite structured fluoride. In particular, the inter-
est is in nano crystalline chromates as the high pressure behaviour of nano materials
may be distinct from their bulk counterparts. These studies have been described in
53
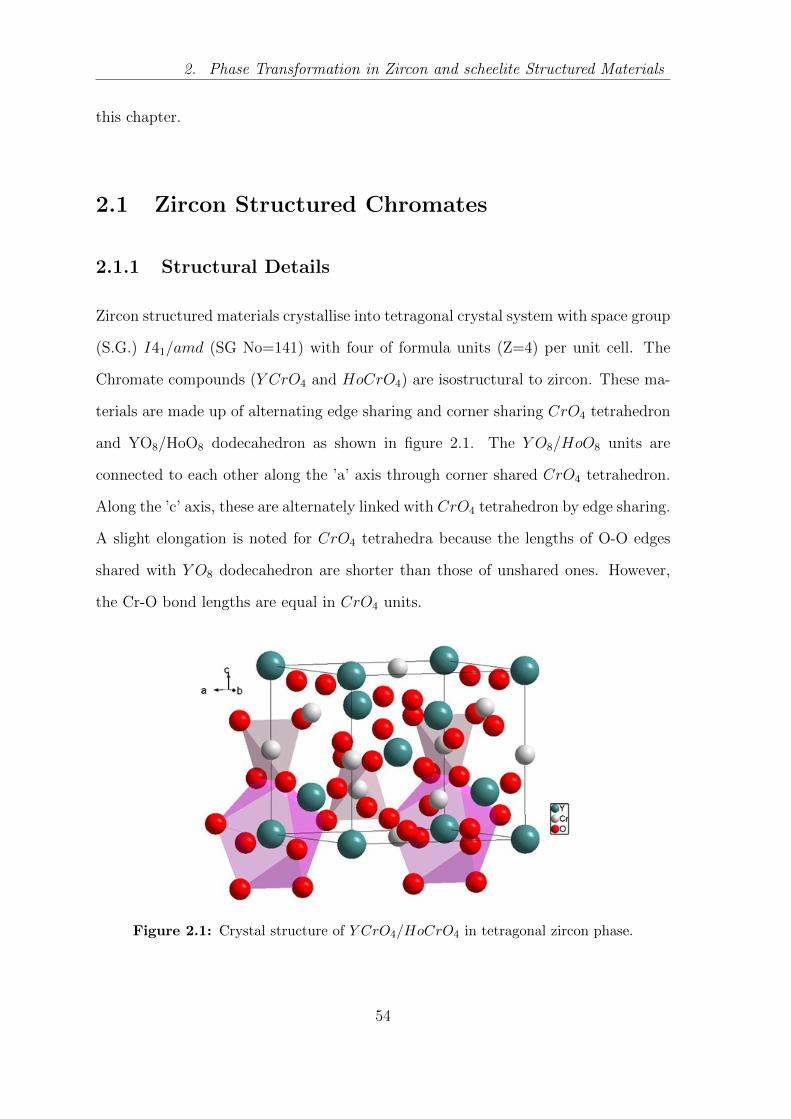
2. Phase Transformation in Zircon and scheelite Structured Materials
this chapter.
2.1 Zircon Structured Chromates
2.1.1 Structural Details
Zircon structured materials crystallise into tetragonal crystal system with space group
(S.G.) I41/amd (SG No=141) with four of formula units (Z=4) per unit cell. The
Chromate compounds (Y CrO4 and HoCrO4) are isostructural to zircon. These ma-
terials are made up of alternating edge sharing and corner sharing CrO4 tetrahedron
and YO8/HoO8 dodecahedron as shown in figure 2.1. The Y O8/HoO8 units are
connected to each other along the ’a’ axis through corner shared CrO4 tetrahedron.
Along the ’c’ axis, these are alternately linked with CrO4 tetrahedron by edge sharing.
A slight elongation is noted for CrO4 tetrahedra because the lengths of O-O edges
shared with Y O8 dodecahedron are shorter than those of unshared ones. However,
the Cr-O bond lengths are equal in CrO4 units.
Figure 2.1: Crystal structure of Y CrO4/HoCrO4 in tetragonal zircon phase.
54

2.1. Zircon Structured Chromates
2.1.2 Introduction
Zircon (ZrSiO4) is known to undergo first order crystalline phase transition from the
zircon (S.G. I41/amd, Z = 4) to the reidite (scheelite I41/a, Z=4) form at 23 GPa
[108]. Several iso-structural ABO4 type compounds, such as the vanadates, chro-
mates, germanates, also undergo the same high pressure phase transition, displaying
a typical density increase of 10% [109, 110, 111, 112]. Static as well as shock ex-
periments on ZrSiO4 support the martensitic nature of this phase transformation
[113, 114].
There are a few important issues regarding these compounds such as mechanism
of phase transition, effect of nano crystalline particle size as well as possibility of
pressure induced amorphization. Kusaba et al. have suggested that zircon to scheel-
ite transformation may be brought about by shear deformations involving two pro-
cesses. According to this mechanism in the first process a simple shearing i.e. elonga-
tion/compression along the two equivalent (110) directions in the basal plane of the
zircon phase occurs leading to an increase in density by about 10% . In the second
process a small displacement of the atoms and rotation of the SiO4 tetrahedra [115] is
enough to establish a scheelite type of structure. However, based on the observations
of abrupt changes observed in frequencies of the Raman internal modes across this
transition, Jayaraman et al. have argued that the transformation path cannot be this
simplistic [111]. They felt that the Raman results indicate a substantial rearrange-
ment of the cations and the anions, both in length and angle. Recent theoretical
ab-initio and shell model calculations on ZrSiO4 by Smirnov et al. [116] predicted
this structure to be stable due to absence of any mechanical instability up to ∼ 70
GPa. Therefore they concluded that hydrostatic compression alone cannot be respon-
sible for this phase transition and instead it must be caused by anisotropic strains.
Energy barrier heights obtained through the first principles calculations by Florez et
al., indicate that transient states between zircon and scheelite phases are likely to be
55

2. Phase Transformation in Zircon and scheelite Structured Materials
monoclinic [117].
Though not of direct relevance in terms of mechanism, it is worth mentioning
here that a recent Raman investigation on zircon structured TbPO4 shows that it
transforms to a monazite structured monoclinic phase at high pressure [118]. Iso-
structural compounds like YCrO4 [119], LuVO4, YbVO4 [120, 121], YVO4 [110], also
transform to the scheelite phase at 3, 8, 5.9 and 8.5 GPa respectively. If this phase
transformation in the chromates and the vanadates is primarily due to shear strains, as
proposed by Smirnov et al., it is difficult to explain, why these compounds transformed
even though they were well within the hydrostatic limits of the pressure transmitting
media viz., methanol : ethanol :: 4:1 and nitrogen. All these results imply that the
zircon to scheelite phase transformation path is yet not fully understood, despite a
large number of studies on zircon and iso-structural compounds.
Another very important issue which needs to be understood in this set of com-
pounds is the dependence of their high pressure behaviour on particle size. For
example, whether the high pressure behaviour of the nano particles would be same
as that of the bulk material? Would they undergo the same phase transition as that
observed in the bulk or they would tend to amorphize at high pressure? Earlier, pres-
sure induced amorphization has been explained as a meta stable state obtained by the
frustration of a kinetically hindered phase during transformation to a higher density
phase [122]. Several tetrahedral coordinated materials have been shown to become
amorphous under pressure. However, there are several compounds like silicon, TiO2
etc. which are poor glass formers and do not amorphize in the bulk, but are known
to amorphize in the nano form [123]. Till date neither bulk zircon nor its iso struc-
tural compounds have been amorphized under pressure. It would be interesting to
see whether zircon structured compounds with smaller particle size would facilitate
amorphization.
In general, the thermodynamic properties of nano-crystalline materials may dif-
56

2.1. Zircon Structured Chromates
fer significantly from their bulk counterparts due to large surface to volume ratio
[108, 124, 125, 126]. In fact Tolbert et al. [123] showed that in nano-crystalline
CdSe the transformation pressure for wurtzite to rocksalt transformation increased
on decreasing the particle size. Further, the increase or decrease in the transformation
pressure of the nano-crystalline materials has been shown to depend on the ratio of the
volume collapse in bulk and nano crystalline samples at the transformation pressure
and the differences between surface and the internal energies [127]. The surface versus
bulk free energy contributions also affects the stability of the crystalline phases and a
whole new phase diagram can be assigned to the nano-crystalline materials [124]. It
is well known that zircon and zircon structured compounds in the bulk form, are poor
glass formers and have not yet been amorphized at high pressures. Recent studies
have shown that bulk ZrSiO4 can be amorphized at room pressure when irradiated
with heavy ions [128]. However, when bulk ZrSiO4 was simultaneously subjected to
high pressure and heavy ion irradiation, it fragmented into nano-particles and then
transformed to the scheelite phase at ∼14.5 GPa i.e., at much lower pressures than
the bulk [129]. In contrast, another study has shown that the transition pressure
for zircon-scheelite phase change is higher for nano-crystalline zircon [130] Therefore,
there is an ambiguity about the size and transformation-pressure correlation. The
understanding of this would have implications on the usage of reidite (scheelite phase
of zircon) as a peak pressure indicator in meteoric impacts [115]. With the aim to
understand the above mentioned issues it is important to carry out high pressure
investigations on some nano-crystalline zircon structured compounds, which in the
bulk show transformation to the scheelite phase at very low pressures. Since the bulk
forms of YCrO4 and HoCrO4 transform to the scheelite phase at P < 5 GPa i.e. well
within the hydrostatic pressure regime of most of the pressure transmitting media
employed in diamond anvil cells, we have investigated the structural behavior of the
nano-crystalline chromates at high pressures. Our results show that the transition
57

2. Phase Transformation in Zircon and scheelite Structured Materials
from the zircon to scheelite phase in these chromates proceeds via an intermediate
monoclinic phase and hence it is not a one step process. Moreover, this intermedi-
ate monoclinic structure is distinct from the monazite structure observed earlier in
TbPO4 [118] and has been observed for the first time in the zircon structured com-
pounds. We also observed a partial amorphization of the zircon structured chromates
at high pressure.
2.1.3 Experimental Details
Fully characterized nano-crystalline RECrO4 (RE = Y, Ho), synthesized by gel-
combustion process, were subjected to hydrostatic high pressure conditions in a di-
amond anvil cell. In different experiments the powder samples of yttrium chromate
and holmium chromate along with appropriate pressure markers (Cu) or ruby were
loaded into a 100 µm hole of a pre-indented tungsten gasket (70 µm) in the diamond
anvil cell. 16:3:1 methanol-ethanol-water mixture was used as a pressure transmitting
medium and the pressure was determined from the ruby fluorescence technique [131]
or the known equation of state of copper [132]. To ensure that the sample environ-
ment was truly hydrostatic we ensured that the sample does not directly bridge the
diamonds and the gasket hole has substantial amount of pressure transmitting fluid.
The average crystallite size of these nano-crystalline chromates, as deduced from the
Scherrers formula was 69 nm. The x-ray diffraction experiments were carried out at
BL10XU beamline at Spring8 (λ = 0.308 A) and at XRD1 beamline at Elletra (λ =
0.6702 A ) synchrotron source.
For Raman spectroscopic measurements the sample was loaded in 100 m hole of
pre-indented tungsten gaskets of thickness 50 µm in diamond anvil cell. In this
case we used 4:1 methanol-ethanol mixture as well as 16:3:1 water, methanol, ethanol
mixture as pressure transmitting mediums. The pressure was determined from the
well known ruby fluorescence method [131]. High pressure Raman experiments were
58
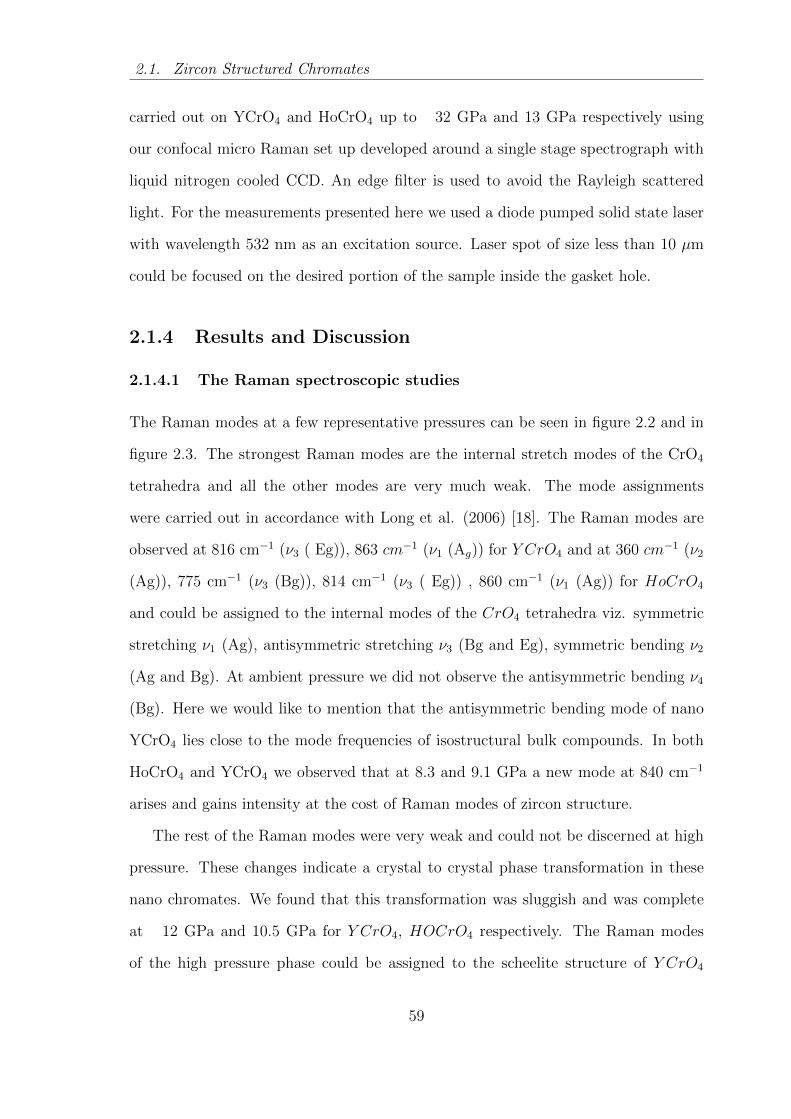
2.1. Zircon Structured Chromates
carried out on YCrO4 and HoCrO4 up to 32 GPa and 13 GPa respectively using
our confocal micro Raman set up developed around a single stage spectrograph with
liquid nitrogen cooled CCD. An edge filter is used to avoid the Rayleigh scattered
light. For the measurements presented here we used a diode pumped solid state laser
with wavelength 532 nm as an excitation source. Laser spot of size less than 10 µm
could be focused on the desired portion of the sample inside the gasket hole.
2.1.4 Results and Discussion
2.1.4.1 The Raman spectroscopic studies
The Raman modes at a few representative pressures can be seen in figure 2.2 and in
figure 2.3. The strongest Raman modes are the internal stretch modes of the CrO4
tetrahedra and all the other modes are very much weak. The mode assignments
were carried out in accordance with Long et al. (2006) [18]. The Raman modes are
observed at 816 cm−1 (ν3 ( Eg)), 863 cm−1 (ν1 (Ag)) for Y CrO4 and at 360 cm−1 (ν2
(Ag)), 775 cm−1 (ν3 (Bg)), 814 cm−1 (ν3 ( Eg)) , 860 cm−1 (ν1 (Ag)) for HoCrO4
and could be assigned to the internal modes of the CrO4 tetrahedra viz. symmetric
stretching ν1 (Ag), antisymmetric stretching ν3 (Bg and Eg), symmetric bending ν2
(Ag and Bg). At ambient pressure we did not observe the antisymmetric bending ν4
(Bg). Here we would like to mention that the antisymmetric bending mode of nano
YCrO4 lies close to the mode frequencies of isostructural bulk compounds. In both
HoCrO4 and YCrO4 we observed that at 8.3 and 9.1 GPa a new mode at 840 cm−1
arises and gains intensity at the cost of Raman modes of zircon structure.
The rest of the Raman modes were very weak and could not be discerned at high
pressure. These changes indicate a crystal to crystal phase transformation in these
nano chromates. We found that this transformation was sluggish and was complete
at 12 GPa and 10.5 GPa for Y CrO4, HOCrO4 respectively. The Raman modes
of the high pressure phase could be assigned to the scheelite structure of Y CrO4
59

2. Phase Transformation in Zircon and scheelite Structured Materials
Figure 2.2: Raman pattern of Y CrO4 at a few representative pressure.
in accordance with Long et al. [119]. These studies indicate that the pressure of
transformation from the zircon to the scheelite phase is higher than the transformation
pressure in bulk chromates. At still higher pressures of 32 GPa all the Raman modes
of Y CrO4 became too broad. This broadening could be due to pressure induced
structural disordering or due to nonhydrostaticity inside the sample chamber. On
release of pressure the two symmetric stretch modes of the chromate tetrahedra in
the scheelite phase were observed indicating that the transformation to the scheelite
phase was irreversible as observed in the bulk compounds.
The observed phonon frequencies of both the phases have been plotted as a func-
tion of pressure (figure 2.4). The pressure dependence of the ν1 mode in the nano
chromates (5.2 cm−1/GPa for Y CrO4 and 4.8 cm−1/GPa HoCrO4) are more than
that observed in bulk Y CrO4 (4.6 cm−1/GPa). This indicates that the rate of stiff-
60

2.1. Zircon Structured Chromates
Figure 2.3: Raman pattern of HoCrO4 at a few representative pressure.
ening of the symmetric mode is faster in the nano chromates.
The Raman spectroscopic results indicate that zircon structured nano chromates
transform to the scheelite phase at higher pressures than their bulk counterparts. At
high enough pressures the Raman modes become very weak and broad indicating that
there is some inherent disorder in the sample. It could also mean that the sample
had become partially amorphous at such high pressures. To ascertain the structure
of the high pressure phase we carried out angle dispersive x-ray diffraction studies on
these nano crystalline chromates.
61

2. Phase Transformation in Zircon and scheelite Structured Materials
Figure 2.4: Pressure induced variation of Raman shifts of (a) Y CrO4; triangle and circlerepresent the prominent Raman mode corresponding to zircon structure while the invertedtriangle and square represent the Raman modes for scheelite phase and (b) HoCrO4, squareand circle represent the main Raman mode corresponding to zircon and scheelite phaserespectively; here solid lines represent guide to an eye.
2.1.4.2 X-ray diffraction studies at Elettra
The diffraction data for both the nano chromates was collected at the Elettra syn-
chrotron source. The diffraction pattern of YCrO4 and HoCrO4 stacked at a few
representative pressures are shown in figure 2.5 and figure 2.6 respectively. The
diffraction patterns show that up to 10 GPa there is a monotonous shift and x-ray
diffraction peaks shift towards higher angular values for both the samples. Though
a small broad hump was observed at 12.8◦ which may correspond to two theta value
of the maximum intensity peak of the scheelite phase) at 11.8 GPa, it did not de-
velop into a discernible diffraction peak of the scheelite phase. The full width at half
maxima of the diffraction peaks from the zircon phase also show broadening with pres-
62

2.1. Zircon Structured Chromates
sure and beyond 10 GPa these diffraction peaks become very broad and are no longer
discernible, clearly indicating that the sample may have become disordered. These
diffraction patterns seem to suggest that the kinetics in nano crystalline samples is
such that the scheelite phase does not crystallize even up to ∼ 10 GPa. The diffraction
peaks which are visible at the highest pressure are from the pressure marker and from
the gasket material. Here we would like to mention that the FWHM of diffraction
peaks of copper (pressure marker) does not change much with pressure, indicating
that the pressure environment is quasi hydrostatic.
Figure 2.5: Diffraction pattern of YCrO4 at a few representative pressures.
These x-ray diffraction results seem to be contradicting our Raman spectroscopic
63

2. Phase Transformation in Zircon and scheelite Structured Materials
Figure 2.6: Diffraction pattern of HoCrO4 at a few representative pressures.
results. Our Raman studies indicate an irreversible crystal to crystal phase transfor-
mation whereas the x-ray diffraction experiments suggest the occurrence of pressure
induced amorphization. These contradicting results can be reconciled with an expla-
nation that the translational modes of the chromate tetrahedra are not observable
and the only new modes that are observable are weak and broad. Therefore we can
hypothesize that there is some sort of orientational disorder of the chromate tetra-
hedra which is leading to long range disorder as observed in the x-ray diffraction
experiments. As Raman spectra probes shorter length scales it is not surprising that
we could observe the internal modes of these tetrahedra. However, the second ex-
64
2.1. Zircon Structured Chromates
planation to these results could be that the new high pressure phase has a small
crystallite size due to multiple nucleation sites of new phase. It is known that when
solid- solid phase transitions are accompanied by a volume change, single crystals
fragment into much smaller crystallites [124].
However, these studies did not help us in ascertaining whether the high pres-
sure phase was disordered or poorly crystalline. To resolve this issue we carried out
experiments at a higher energy synchrotron source (Spring8).
2.1.4.3 X-ray diffraction studies at Spring8
The diffraction patterns of YCrO4 and HoCrO4 at a few representative pressures
are shown in figure 2.7 and in figure 2.8 respectively. The diffraction patterns from
both these compounds show that up to ∼6.5 GPa there is a monotonous shift in the
diffraction peaks towards higher two-theta values. On further raising the pressure
beyond 6.5 GPa, distinct new diffraction peaks were observed in the diffraction pat-
terns, as also indicated in figure 2.7 and figure 2.8. The diffraction patterns at these
pressures could be indexed to the tetragonal scheelite phase. As mentioned earlier
our Raman scattering measurements also establish the appearance of scheelite phase
beyond 6.5 GPa. Therefore clearly both these compounds do transform from zircon
to scheelite structure at high pressures unlike that observed in case of XRD data from
Elettra synchrotron soure. This may be due to fragmentation of larger nano particles
in to very small ones in high pressure phase resulting into non-observation of weak
diffraction peaks almost implying amorphization at low energy synchrotron source.
However the XRD peaks of zircon structure appeared to be broad. Earlier Tolbert
et al. [123] have established the shape changes of nano crystallites under pressure
and their role in the phase transformations [133, 134]. With this motivation I tried to
look into the FWHM of a few XRD peaks of zircon structured chromates. Figure 2.9
shows the FWHM of some of the diffraction peaks of the samples while their diffraction
65

2. Phase Transformation in Zircon and scheelite Structured Materials
Figure 2.7: The diffraction pattern of YCrO4 recorded at Spring8 at a few representativepressures. The ambient pressure data has been indexed with respect to the zircon structure.The diffraction peak marked as (112) at high pressure refers to the scheelite phase. It isapparent that background increases with pressure.
patterns can still be indexed as that of zircon phase. We find a large increase in the
FWHM of some of the diffraction peaks such as, (321), (312), (332) etc. whereas the
FWHM of the (101), (200), (202) diffraction peaks show relatively negligible change
from their ambient values. Earlier such variations have been ascribed to the shape
change of crystallites across a phase transformation.
To evaluate a similar possibility we note that zircon to scheelite phase transfor-
mation has been proposed to proceed through a shear in the basal plane such that
the angle of intersection between (100) and (010) direction changes from 90◦ to 115◦.
If this change is not abrupt, the intermediate state would not have a tetragonal sym-
metry and the unit cell would be essentially monoclinic. As mentioned earlier, recent
first principles calculations also suggests a similar transient intermediate monoclinic
phase [117].
On carrying out a Rietveld analysis of the diffraction pattern of YCrO4, at 4.6
66

2.1. Zircon Structured Chromates
Figure 2.8: The diffraction pattern of HoCrO4, recorded at Spring8 at a few representativepressures. The ambient pressure data has been indexed with respect to the zircon structure.The diffraction peaks of the high pressure phase have been indicated by arrows. The diffrac-tion peak marked as (112) at high pressure refers to the scheelite phase. The backgroundof the lowest pressure phase has been subtracted from all the subsequent pressure runs.
GPa we could fit the high pressure diffraction data to a monoclinic phase (SG: no.
15; I112/b, Z = 4, γ = 90.44◦) as shown in figure 2.10. In fact it was found that the
increased FWHM of some XRD peaks were because of overlapping XRD peaks from
monoclinic structure.
The structure of this monoclinic phase (MP) is similar to that of the zircon phase
(ZP) except for a slight rotation of the chromate tetrahedra as shown in figure 2.11
and a change in the gamma angle from 90◦ to 90.44◦. Similar monoclinic structure
also explains the results of HoCrO4 at 6.5 GPa. Thus the reduced symmetry of the
high pressure phase provides a rational explanation of unusual broadening of some of
the peaks as due to unresolved split peaks.
The existence of a monoclinic daughter phase has earlier been speculated, arising
possibly from softening of C66 shear elastic constant [135]. However, recent theoretical
67

2. Phase Transformation in Zircon and scheelite Structured Materials
Figure 2.9: The increase in FWHM of some of the diffraction peaks of (a) YCrO4 at 4.6GPa and (b) HoCrO4 at 6.5 GPa. The FWHM of the (200) diffraction peak did not increaseas the difference between the a and b cell constants in the monoclinic phase is 0.01 %.
calculations [116] have shown that this shear elastic constant is likely to soften only
at 70 GPa, making it a highly improbable cause of monoclinic distortion of the
parent tetragonal cell. The intermediate monoclinic phase determined by our Rietveld
analysis of XRD data is found to be energetically stable as per the first principles
calculations reported in [136]. This shows that in nano crystalline chromates the
observed monoclinic phase is not just an unstable transient phase but, has a range of
stability. The second high pressure phase i.e. scheelite was retained even on release
of pressure. For bulk YCrO4, an irreversible transformation to the scheelite phase at
∼ 3 GPa, has earlier been established through Raman measurements [119]. Though
there are no in-situ high pressure studies on bulk HoCrO4, the scheelite phase in this
compound too has been synthesized by subjecting its zircon phase to high temperature
(823 K) and pressure (4 GPa) in a belt type press [137]. Therefore, our results suggest
that the transformation to scheelite phase in nano-crystalline chromates occurs at
higher pressures than that observed in bulk. This is also consistent with the results
of M. Lang et al. on ZrSiO4 which shows only traces of reidite phase even at ∼ 36
GPa.
There are a few more useful features in the diffraction patterns shown in Figure
2.7 and figure 2.8 which are worth discussion. We note that the diffraction peaks of
68

2.1. Zircon Structured Chromates
Figure 2.10: Rietveld fits to the recorded diffraction pattern of YCrO4 at 4.6 GPa (red)in the monoclinic structure. The blue line shows the subtracted background and verticalbars give the expected positions of the diffraction peaks from the sample. The differencein the calculated and experimental diffraction pattern is given at the bottom of the graph(green).
the high pressure scheelite phase are very broad and are accompanied by an increasing
background. This could be due to small crystallite size (result of multiple nucleation
sites of new phase) of the new high pressure phase. In fact from the diffraction data
collected at Spring8 the calculated particle size of the high pressure phase is ∼7 nm
at 10 GPa. This is consistent with what is stated earlier in the section 2.1.4. (b),
that when solid- solid phase transitions are accompanied by a volume change, single
crystals fragment into much smaller crystallites [124]. Present experimental results
imply that at high pressure the chromate crystallites of ∼ 68 nm size have fragmented
into smaller nano particles and in this process some parts of the parent crystallites
may have become disordered leading to partial amorphization. This could be the
reason why amorphous like behaviour was observed with the lower flux synchrotron
69

2. Phase Transformation in Zircon and scheelite Structured Materials
Figure 2.11: The (a) zircon and (b) monoclinic structure of YCrO4 as determined fromthe diffraction data. The γ angle is 90.4◦. The chromium, Yttrium and oxygen atoms havebeen marked as Cr (grey), Y (blue) and O (red) respectively.
data.
Due to the lower symmetry of the intermediate phase, we also speculate, as pro-
posed by Toledano et al. [138], that the daughter phase may have multi domain
states. This could lead to structural mismatches of the sheared domains adjacent
to each other and finally result in fragmentation into still smaller nano particles.
Moreover, the fragmentation would not necessarily be of equal size and the smaller
nano-domains may significantly lose translational order due to relaxations of atoms
at the surfaces, contributing effectively to the observed increase in the background at
high pressure.
Hence our studies indicate that the zircon to scheelite phase transition in these
compounds may not be a one step process. Instead it is a two step process first
proceeding via a symmetry descent and then a symmetry ascent.
2.1.5 Conclusions
Our in-situ high pressure x-ray diffraction measurements and Raman scattering stud-
ies on zircon structured nano-crystalline chromates show that the structural phase
70

2.1. Zircon Structured Chromates
transformation from zircon to scheelite phase proceeds via an intermediate monoclinic
phase i.e. zircon → monoclinic → scheelite. Though there have been speculations
about zircon-scheelite phase transformation proceeding through an unstable transient
monoclinic phase in ZrSiO4, we have experimentally demonstrated the existence of a
similar intermediate stable state in a zircon structured compound for the first time.
For our nano-crystalline samples, the transformation pressure is found to be higher
than the bulk. This suggests that non-hydrostatic stresses or strains may not be
vital even in other iso-structural compounds where zircon-scheelite transformation
has been observed. However, in the present case, the intermediate monoclinic phase
(similar to the transient and hence unstable state proposed earlier [117] to delineate
the path of transformation) has been observed. This is similar to the case of the
B1-B2 phase transition in alkaline halides and oxides where an intermediate unsta-
ble monoclinic phase describes the transition pathway but is observed only in silver
chloride [139, 140]. We should also note that under certain thermodynamic condi-
tions, including the rate and step of the increase of pressure etc., it may be possible
to trap the intermediate transient structures - as was also observed in quartz [141].
However, in YCrO4, the observation of monoclinic phase in nano-crystalline samples
may purely be incidental, as theoretical results suggest the possibility of the same for
the bulk samples too, for which no in-situ x-ray diffraction investigations have been
carried out so far to the best of our knowledge.
The particle size of the scheelite phase has been found to be much smaller that the
parent phase, coexisting with a significant amorphous content. Also since reducing
particle size increases the transformation pressure in zircon structured compounds,
care must be taken when the pressures of meteoric impacts on radiation accumulated
zircon sites is determined from the presence of reidite.
71

2. Phase Transformation in Zircon and scheelite Structured Materials
2.2 Scheelite Structured Fluoride
2.2.1 Structural Details
In the earlier section 2.1 we described the zircon to scheelite phase transition in
chromates. For completeness we would like to mention that scheelite/reidite is the
name of a mineral calcium tungstate (CaWO4), which is used to describe the family of
all the minerals isostructural to it, like many tungstates, molybdates and fluorides etc.
Scheelite structured materials have tetragonal symmetry, appearing as dipyramidal
pseudo-octahedra and crystallise into space group (S.G.) I41/a (SG No = 88) with
four formula units (Z = 4) per unit cell. These materials posses distinct cleavage
planes and hence their single crystal can be cleaved very easily. The crystal structure
Figure 2.12: Crystal structure of LiErF4 in tetragonal scheelite phase.
of LiErF4 as shown in figure 2.12 can be visualised as made up of ErF8 dodecahedra
and LiF4 tetrahedra. The ErF8 dodecahedra are connected by edge shared ErF8
polyhedra and corner shared LiF4 tetrahedra in the a-c and a-b plane respectively.
72

2.2. Scheelite Structured Fluoride
2.2.2 Introduction
There is a lot of interest in the high pressure transitions of the scheelite struc-
tured compounds due to their possible geophysical implications. Several studies have
been carried out on the effects of pressure on the properties of scheelite structured
tungstates and molybdates [142, 143, 144, 145, 146, 147, 148, 149, 150] based on the
packing efficiency considerations, some of the earlier studies have predicted the wol-
framite to be one of preferred high pressure phase[151]. However some recent studies
have shown that these compounds may transform to any of the competing monoclinic
structures i.e. fergusonite or wolframite [152]. But till date very few studies [152, 153]
have been reported for scheelite structured fluoride compounds. These fluorides are
optically transparent insulators and hence find applications as important laser hosts,
scintillators and luminescence materials.
Lithium erbium fluoride belongs to the LiLnF4 (Ln = Eu - Lu) family which crys-
tallizes with the scheelite structure (I41/a, Z=4), a superstructure of fluorite CaF2
(Fm3m, Z=2). In this system the fluorine atoms are in a distorted simple cubic
arrangement as can be seen in Figure 2.12. Yttrium lithium fluoride an important
member of this family has been extensively studied by experimental as well as the-
oretical studies. These studies have shown that it undergoes two phase transitions
at high pressure [154]. LiLuF4 on the contrary has been shown to undergo only one
phase transition and LiGdF4 does not undergo any crystal to crystal phase transition
at high pressure, but progressively decomposes into a solid solution series [148, 155].
This behavior can be associated with the size of the Ln cation as we can see that
(R(Y) < R(Lu) < R(Gd)). Therefore we would expect the behavior of LiErF4 to lie
in between that of the end members LiYF4 and LiGdF4.
Another important aspect of these phase transitions in lanthanide fluorides, is the
structure of the first high pressure phase. Tungstate scheelites like CaWO4 trans-
forms from scheelite to wolframite (monoclinic) structure. The experiments and first
73

2. Phase Transformation in Zircon and scheelite Structured Materials
principles calculations indicate that the first high pressure phase in LiYF4 is simi-
lar to that of fergusonite (SG = I2/a) [156]. Molecular dynamical calculations show
that the structure is fergusonite like (SG =P21/c) [157]. In case of LiLuF4 the first
high pressure phase has been shown to be similar to that of fergusonite. It will be
interesting to see what happens in case of LiErF4 where Li-F is ionic in nature unlike
CaWO4 where W-O is predominantly covalent in nature.
We have carried out powder x-ray diffraction and Raman spectroscopic studies
on LiErF4, to ascertain whether its high pressure behavior is similar to that of the
lanthanide fluorides and to determine the structure of the first high pressure phase
and the nature of phase transition.
2.2.3 Experimental Methods
Lithium erbium fluoride has been prepared through the standard solid state route. AR
grade reactants, lithium fluoride and erbium fluoride, were mixed in stoichiometric
amounts. Well ground mixtures were heated in the pellet form at 1473 K for 36
hours. After this, the materials were reground, repelletized and heated at 1573 K
for 36 hours. In order to attain a better homogeneity, the products obtained after
second heating were again ground, pelletized and heated at 1673 K for 48 hours,
which was the final annealing temperature of all the specimens. The heating and
cooling was carried out at a rate of 2◦C per minute in a static air environment. The
compound thus formed has been characterized with the help of x-ray diffraction and
Raman spectroscopy. The lattice parameter of Lithium erbium fluoride is found to
be a = 5.159 ± 0.003 A, and c = 10.701 ± 0.002 A which is in good agreement
with the earlier reported value [158]. For x-ray diffraction experiments the powder
samples of Lithium erbium fluoride along with a few particles of gold ( pressure
markers) were loaded into a 100 µm hole of a pre-indented tungsten gasket (∼ 75
µm) in a diamond anvil cell. 4:1 methanol-ethanol mixture was used as a pressure
74

2.2. Scheelite Structured Fluoride
transmitting medium and the pressure was determined from the known equation of
state of gold [132]. These experiments were carried out at the XRD1 beamline of
the Elettra synchrotron source using the x-rays of wavelength 0.6702 A. The two
dimensional diffraction rings were converted to one dimensional diffraction patterns
using the FIT2D software [95]. The cell constants were determined by the Le Bail
method using the GSAS software [96]. The high pressure experiments were carried out
up to 28 GPa. For Raman measurements a single speck of a polycrystalline sample of
lithium erbium fluoride was loaded in a 100 µm hole of a pre-indented tungsten gasket
(∼ 75 µm) in a diamond anvil cell. In this case also we used 4:1 methanol-ethanol
mixture as a pressure transmitting medium and the pressure was determined from
the well known ruby fluorescence method [131]. Raman measurements under high
pressure were carried out up to ∼ 26 GPa using our confocal micro Raman system
which is already stated in chapter 1 Laser spot of size less than 10 µm could be focused
on the desired portion of the sample inside the gasket hole with the help of a viewing
system. This helps to reduce the background noise contributed by the diamond and
gasket substantially.
2.2.4 Results and Discussion
2.2.4.1 Structural Effects
X-ray diffraction pattern stacked at a few representative pressures are shown in figure
2.13. It has been observed that up to 10.7 GPa there is a monotonous shift of
the x-ray diffraction peaks towards higher two theta values. Beyond this pressure
the appearance of new x-ray diffraction peaks clearly indicates a structural phase
transition. At 15 GPa new x-ray diffraction peaks shown with arrow marks emerge
which implies the occurrence of second phase transition at this pressure. On further
pressurizing most of the x-ray diffraction peaks of LiErF4 disappear except two broad
humps at 7.5◦ and 12.5◦. This implies the loss of long range ordering at 25 GPa.
75

2. Phase Transformation in Zircon and scheelite Structured Materials
The complete pressure induced amorphization occurs across 28 GPa. We have also
Figure 2.13: X-ray diffraction patterns of lithium erbium fluoride stacked at a few repre-sentative pressures.
observed that the initial phase is retrieved when pressure is released from 15 GPa.
However, when it is released from 28 GPa the disordered phase is retained. The
pressure induced amorphization in this compound may be kinetically hindered as
observed in lithium gadolinium fluoride [155] beyond 11 GPa. Although the Mo-O
is covalent, the BaMoO4 transform from scheelite to monoclinic (fergusonite) phase.
Hence I have compared the variation of lattice parameters of LiErF4 with BaMoO4
with pressure.
The pressure induced variation of lattice parameters a and c of LiErF4 and
BaMoO4 are shown in figure 2.14. From the above figure we can note that the
rate of change of c lattice parameter of BaMoO4 is more than that of LiErF4 while
the rate of change of lattice parameter a is almost same in both the cases. The linear
axial compressibility of LiErF4 is determined to be 4.8 x 10⁻³ and 2.2 x10⁻³ /GPa
for a axis and c axis respectively while that for BaMoO4 is 5.4 x 10⁻³ and 8.4 x10⁻³
76

2.2. Scheelite Structured Fluoride
Figure 2.14: Pressure induced variation of c and a lattice parameters of LiErF4 andBaMoO4 in scheelite phase. Symbols and lines represent observed data and linear fit tothese data respectively. The data for BaMoO4 has been taken from Panchal et al. 2006
/GPa for a axis and c axis respectively. Figure 2.15 presents the pressure dependence
of the c/a ratio in the scheelite phase of LiErF4, LiYF4 and BaMoO4. The c/a ra-
tio of fluoro scheelite compounds increases with pressure while that of oxy scheelite
compounds decreases with pressure. Here we can note that the MoO4/WO4 tetrahe-
dra are rigid in comparison to LiF4 tetrahedra; Mo-O/W-O being covalent and Li-F
ionic. Therefore LiF4 tetrahedra may see larger changes compared to MoO4/WO4.
On the other hand the compression of Er-F (Ba-O) will be smaller (greater) com-
pared to Mo-O (W-O) bond compression in the same pressure range. Compression
leads to reduced interatomic distances and cation sizes which in turn increases the
cation-cation repulsive forces. As per Errandonea et al. [151] the reduction of anion
sizes due to compression increases the packing efficiency of anions in the cationic sub
lattice. The increase in the anionic packing efficiency increases the c/a ratio and leads
to different cationic coordination. While the increase in cationic repulsion decreases
77

2. Phase Transformation in Zircon and scheelite Structured Materials
Figure 2.15: Pressure dependence of c/a ratio in the scheelite structure of LiErF4, LiYF4,BaMoO4 and CaWO4. The data for LiErF4 are from present study and LiYF4, BaMoO4
and CaWO4 data are taken from references (Grzechnik et al. 2002, Panchal et al. 2006 andErrandonea et al. 2005) respectively.
the c/a ratio and leads to equal cation coordination. That is why the oxy fluorites
may transform to wolframite structure with cation coordination (6-6). While the flu-
oroscheelite compounds may transform to fergusonite structure with different cation
coordination (8-4) and (8-6). The observed x-ray diffraction pattern at each pressure
has been analyzed using Rietveld analysis and the lattice parameters have been de-
duced. Our Rietveld analysis indicates that the structure of the first high pressure
phase is similar to that of fergusonite phase. The diffraction pattern at 13.7 GPa as
shown in figure 2.13 has been indexed to the fergusonite structure. This structure is
a distorted and compressed version of scheelite structure and is obtained by a small
78

2.2. Scheelite Structured Fluoride
distortion of the cation matrix with significant displacements of the anions. This
Figure 2.16: The high pressure fergusonite structure of LiErF4 obtained from the scheelitestructure.
can be visualized from figure 2.16. Some reports indicate that the post fergusonite
phase under high pressure may be a phase isostructural to baddeleyite structure (SG:
P21/c) [157] or to the wolframite type of structure [159]. But these phases do not fit
to our post fergusonite diffraction pattern observed at 15 GPa. This leaves further
scope for structure determination of this new high pressure phase.
The pressure induced variation of volume of unit cell of scheelite and fergusonite
phase has been shown in figure 2.17. It can be clearly seen from this figure that within
experimental uncertainties there is no discontinuity in the volume at the first phase
transition. This behavior is similar to the x-ray diffraction results of YLiF4 [154].
In rare earth niobates, tantalates and tungstates, it is debatable whether this phase
transition is first order or second order. The earlier theoretical studies add to the
confusion as first principles calculations show that there is a 0.5% volume collapse in
YLiF4 whereas molecular dynamical calculations do not observe any discontinuity in
the volume across the transition pressure [156, 157]. In fact the P-V curve of LiLuF4
shows that the first phase transition has a tricritical nature [154]. Our studies suggest
79

2. Phase Transformation in Zircon and scheelite Structured Materials
Figure 2.17: Pressure versus volume of LiErF4. The circles and squares represent thedifferent experimental runs of the scheelite phase and the triangles represent the fergusonitephase. The red line represents B-M fit for the scheelite phase.
that this phase transition may be second order in nature.
The third order Birch Murnaghan equation of state was fitted to the pressure
volume data of the scheelite phase. The bulk modulus at zero pressure was determined
to be K = 81 GPa, with its pressure derivative K′ = 6.4. It is well known that the
compressibility of the scheelite and zircon structured compounds depend upon the
valence of the two different cations. It can be clearly seen from the table shown
below that it increases when the difference between the valence of the two cations
increases (table 2.2) and the valence of the tetrahedral cation is closer to the value 4.
We can see that the bulk modulus of LiErF4 does lie in between the (2, 6) and (3, 5)
compounds.
2.2.4.2 Spectroscopic effects
As stated earlier LiErF4 has body centered unit cell consisting of a pair of formula
units per basis point. Hence a primitive cell can be chosen with two numbers of
formula units per unit cell. This results into 36 vibrational modes at the centre of
the brillouin zone which are distributed among the irreducible representation of point
80

2.2. Scheelite Structured Fluoride
Table 2.1: Bulk Modulus of different ABO4 compounds.
ABO4 Formal charge of the cations Bulk Modulus(GPa)A B
AgReO4 1+ 7+ 31KReO4 1+ 7+ 18
BaMoO4 2+ 6+ 56BaWO4 2+ 6+ 57PbWO4 2+ 6+ 69PbMoO4 2+ 6+ 71LiErF4 3+ 1+ 81
LaNbO4 3+ 5+ 111YVO4 3+ 5+ 138
ZrGeO4 4+ 4+ 238HfGeO4 4+ 4+ 242ThGeO4 4+ 4+ 223ZrSiO4 4+ 4+ 301
group C4h as given below.
Γvib = 3Ag + 5Au + 5Bg + 3Bu + 5Eg + 5Eu (2.1)
Here one Au and one Eu mode corresponds to rigid translations of the whole crystal.
The other Au, Buand Eu modes are infrared active while the Ag, Bg and Eg modes
are Raman active. Thus it will have thirteen Raman-active modes: ΓRaman = 3 Ag+
5 Bg + 5 Eg. Figure 2.18 shows the observed Raman spectra of LiErF4 in the spectral
region 200-1000 cm−1.
We have observed five Raman modes for this compound. The observed Raman
modes given in table 2.3 have been tentatively assigned as per S. Salun et al. [153].
The peaks marked with * are fluorescence along with Raman modes observed
in this measurement. The broad bands in the region 500-800 cm−1 are fluorescence
corresponding to transition from 4S3/2 to 4I5/2. Figure 2.19 shows the observed Raman
81
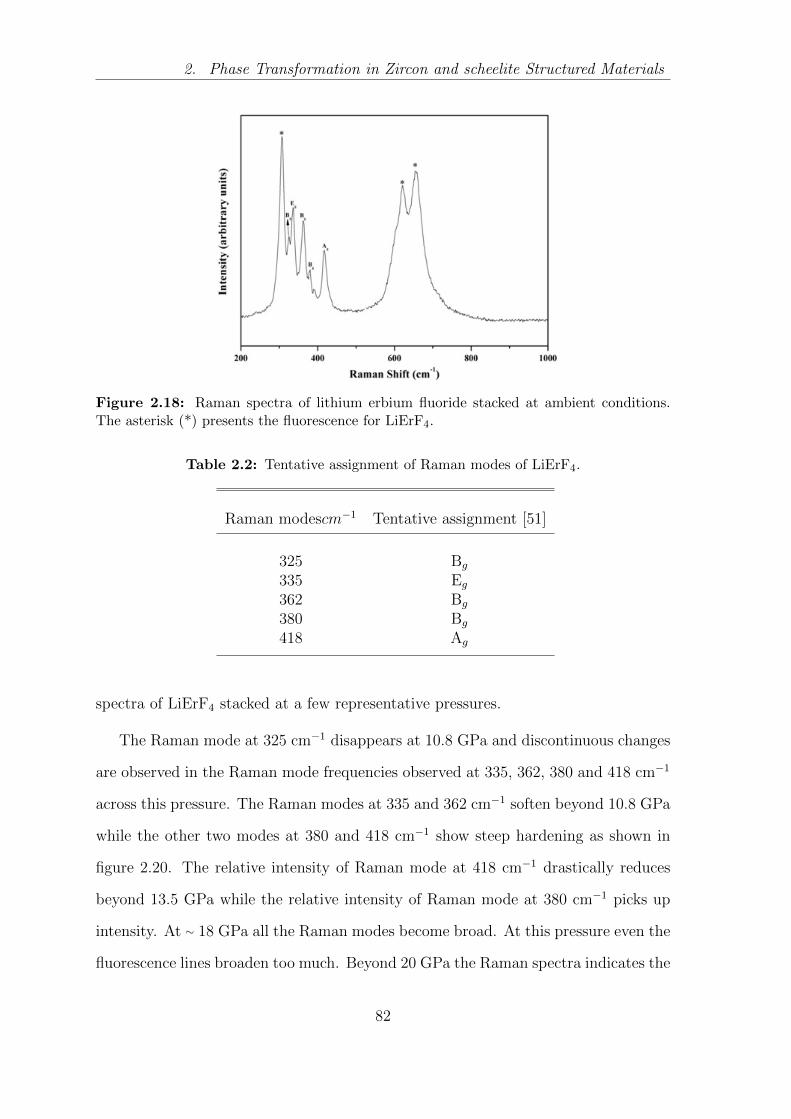
2. Phase Transformation in Zircon and scheelite Structured Materials
Figure 2.18: Raman spectra of lithium erbium fluoride stacked at ambient conditions.The asterisk (*) presents the fluorescence for LiErF4.
Table 2.2: Tentative assignment of Raman modes of LiErF4.
Raman modescm−1 Tentative assignment [51]
325 Bg
335 Eg
362 Bg
380 Bg
418 Ag
spectra of LiErF4 stacked at a few representative pressures.
The Raman mode at 325 cm−1 disappears at 10.8 GPa and discontinuous changes
are observed in the Raman mode frequencies observed at 335, 362, 380 and 418 cm−1
across this pressure. The Raman modes at 335 and 362 cm−1 soften beyond 10.8 GPa
while the other two modes at 380 and 418 cm−1 show steep hardening as shown in
figure 2.20. The relative intensity of Raman mode at 418 cm−1 drastically reduces
beyond 13.5 GPa while the relative intensity of Raman mode at 380 cm−1 picks up
intensity. At ∼ 18 GPa all the Raman modes become broad. At this pressure even the
fluorescence lines broaden too much. Beyond 20 GPa the Raman spectra indicates the
82
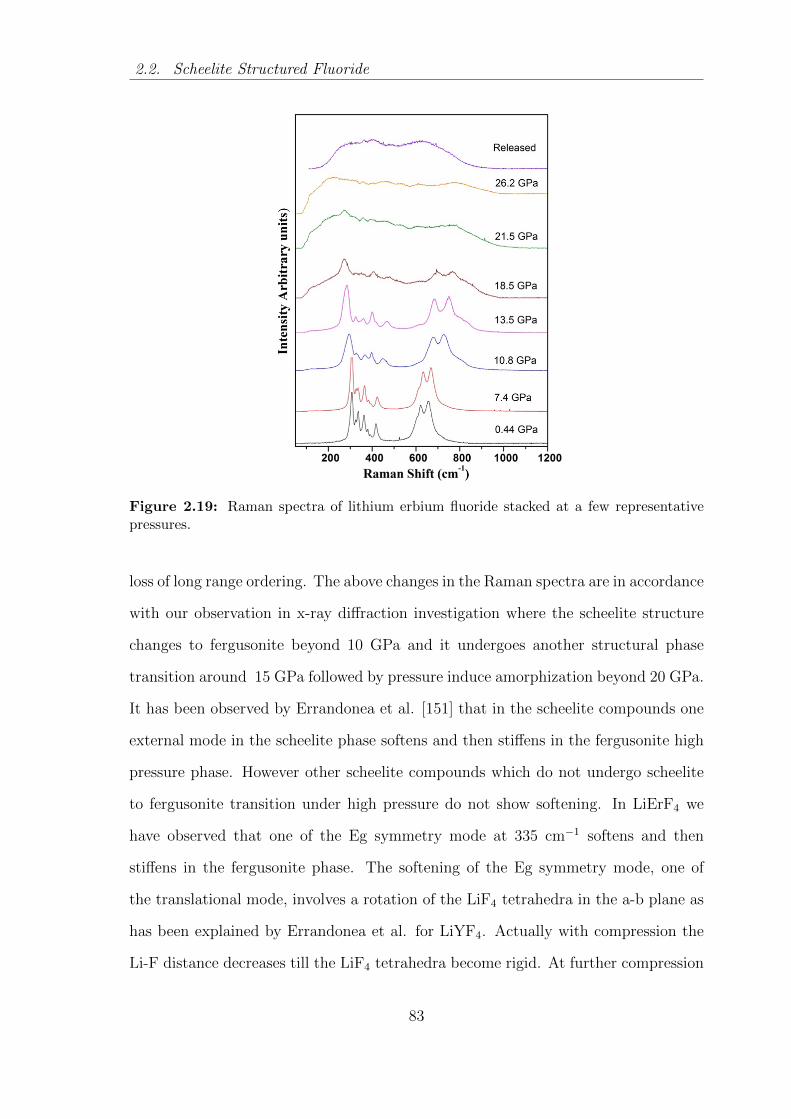
2.2. Scheelite Structured Fluoride
Figure 2.19: Raman spectra of lithium erbium fluoride stacked at a few representativepressures.
loss of long range ordering. The above changes in the Raman spectra are in accordance
with our observation in x-ray diffraction investigation where the scheelite structure
changes to fergusonite beyond 10 GPa and it undergoes another structural phase
transition around 15 GPa followed by pressure induce amorphization beyond 20 GPa.
It has been observed by Errandonea et al. [151] that in the scheelite compounds one
external mode in the scheelite phase softens and then stiffens in the fergusonite high
pressure phase. However other scheelite compounds which do not undergo scheelite
to fergusonite transition under high pressure do not show softening. In LiErF4 we
have observed that one of the Eg symmetry mode at 335 cm−1 softens and then
stiffens in the fergusonite phase. The softening of the Eg symmetry mode, one of
the translational mode, involves a rotation of the LiF4 tetrahedra in the a-b plane as
has been explained by Errandonea et al. for LiYF4. Actually with compression the
Li-F distance decreases till the LiF4 tetrahedra become rigid. At further compression
83

2. Phase Transformation in Zircon and scheelite Structured Materials
Figure 2.20: Variation of Raman shifts of LiErF4 with pressure. Solid lines are guide toeye.
the stiffening of the Li-F bond and continuous decrease in the a lattice parameter
forces the LiF4 tetrahedra to rotate around tetragonal c axis. This suggests that the
scheelite to fergusonite phase transition in LiErF4 is second order in nature. This is
in accordance with no volume drop observed across this phase transition in our x-ray
diffraction studies.
2.2.5 Conclusion
Our synchrotron based powder x-ray diffraction and Raman spectroscopic studies
show that LiErF4 undergoes two structural phase transitions from Scheelite to fergu-
sonite and from fergusonite to another high pressure phase beyond 10 GPa and at 15
GPa respectively. Pressure induced amorphization is observed at 28 GPa. Softening
of Eg mode is observed during the scheelite to fergusonite phase transition. No vol-
ume drop across this transition and mode softening implies the first phase transition
to be of second order in nature. The bulk modulus of LiErF4 in scheelite phase is
84

2.2. Scheelite Structured Fluoride
determined to be 81 GPa with its pressure derivative as 6.4. Our studies also show
that the high pressure behavior of lithium erbium fluoride does lie in between the end
members LiYF4 and LiGdF4. These studies indicate that as the size of the octahedral
cation increased the pressure of amorphization was lowered.
85

2. Phase Transformation in Zircon and scheelite Structured Materials
86

3
Structural Transition in Frustrated
Titanate Pyrochlores
The compounds with general formula A2B2O7 (where A and B are metallic cations)
known as ternary metallic oxides represent a family of phases iso structural to a
mineral pyrochlore, (NaCa)(NbTa)O6F/(OH). These minerals occur in pegmatites
associated with carbonatites alkali rocks. Its name is derived from the Greek as pyro
means fire and Khloros means green, the colour to which the mineral usually turns
on ignition. A large number of these compounds are invariably of cubic structure
and of ionic nature. In these compounds the B cation can be a transition metal
with variable oxidation state or a post transition metal and the A cation can be
a rare earth (Ln) or an element with inert lone-pair of electrons. This is why the
pyrochlores can exhibit a large variety of interesting physical properties. These can
be insulators, semiconductor or metallic. Many of its phases where A and B are in
highest oxidation state show promising dielectric, piezo-and ferro-electric behavior.
The pyrochlores with 3d transition element at B site and /or a rare earth at A site
also exhibit magnetic behaviour ranging from para- to ferro- to antiferro-magnetism
at and below 77 K. Apart from this, these materials have a variety of applications
87
3. Structural Transition in Frustrated Titanate Pyrochlores
ranging from refractory to high permittivity ceramics, switching elements, thick film
resistors, electrodes etc [160]. Pyrochlores are also useful in the disposal of radioactive
waste due to their enhanced resistance threshold to radiation damage [161, 162, 163].
High pressure can lift the delicate balance between various competing interactions
in pyrochlore compounds. As a result it can show very interesting new physical
phenomenon and stabilization of new phases. To unravel this I have carried out high
pressure studies on titanate pyrochlores, ytterbium titanate and dysprosium titanate
and the same has been presented in this chapter.
3.1 Structural details
The pyrochlores with general formula A2B2O6O′ crsyatllise in to space group Fd3m
with eight molecules per unit cell (Z = 8) and have four crystallographically nonequiv-
alent atoms. The structure is composed of two types of cation coordination polyhe-
dron as shown in figure 3.1 below. The larger A cations are eight coordinated and
are located within scalenohedra (distorted cubes) which contain six equally spaced
anions (O′-atoms) at a slightly shorter distance from the central cations while the
smaller B cations are six coordinated and are located within trigonal antiprisms with
all the six anions at equal distance. The pyrochlore structure has only one refinable
positional parameter which is oxygen x fractional coordinate. The A and B cations
are located at 16d and 16c Wyckoff sites respectively while the anions are located at
48f and 8b sites. The pyrochlore structure can also be visualized based on a fluorite
type cell where the cations A and B form a face centered cubic array and the anions
are located in the tetrahedral interstices of the cationic array. There exist three kinds
of tetrahedral interstices for anions: 48f positions having two A and two B cations as
their near neighbors, 8a positions having four B cations as their near neighbors and
8b positions having four A cations as near neighbors. In pyrochlore structures the 8a
88

3.2. Introduction
(a)
(b)
Figure 3.1: (a)Polyhedra of Yb/Dy and Ti and (b)Crystal structure of Yb2Ti2O7/Dy2Ti2O7 in the cubic phase.
positions are vacant.
3.2 Introduction
Most of the pyrochlore oxides which crystallize in to Kagome lattice and have mag-
netic A+ or B+cations are geometrically frustrated antiferromagnets [164]. Figure
3.2 (a) and (b) depicts the geometrical frustration in case of triangular and tetra-
hedral arrangement of spins where the spin marked with question mark ? is frus-
trated. In these geometrically frustrated magnets, frustration of spins to order and
minimize their exchange energies leads to a macroscopically degenerate ground state
[165]. However, competing interactions like near neighbor dipolar and crystal field
interactions and quantum fluctuations etc. can lift the degeneracy resulting into var-
ious complex ground states at very low temperatures, e.g., spin-liquid, spin-ice and
spin-glass. Subjecting such interesting compounds to high pressures can change the
delicate balance between the various competing interactions and may lead to the re-
alization of different physical states. For example, Tb2Ti2O7 is the only member of
the pyrochlore titanates that remains in spin-liquid state down to 70 mK[166]. How-
89
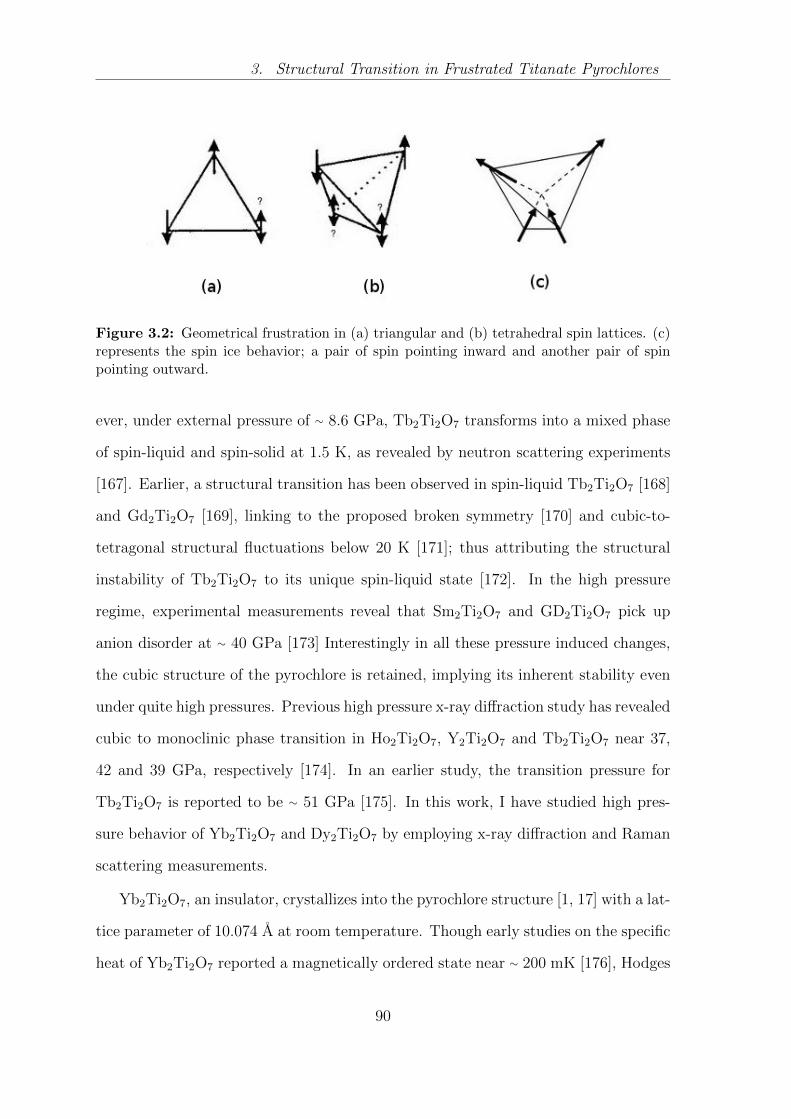
3. Structural Transition in Frustrated Titanate Pyrochlores
Figure 3.2: Geometrical frustration in (a) triangular and (b) tetrahedral spin lattices. (c)represents the spin ice behavior; a pair of spin pointing inward and another pair of spinpointing outward.
ever, under external pressure of ∼ 8.6 GPa, Tb2Ti2O7 transforms into a mixed phase
of spin-liquid and spin-solid at 1.5 K, as revealed by neutron scattering experiments
[167]. Earlier, a structural transition has been observed in spin-liquid Tb2Ti2O7 [168]
and Gd2Ti2O7 [169], linking to the proposed broken symmetry [170] and cubic-to-
tetragonal structural fluctuations below 20 K [171]; thus attributing the structural
instability of Tb2Ti2O7 to its unique spin-liquid state [172]. In the high pressure
regime, experimental measurements reveal that Sm2Ti2O7 and GD2Ti2O7 pick up
anion disorder at ∼ 40 GPa [173] Interestingly in all these pressure induced changes,
the cubic structure of the pyrochlore is retained, implying its inherent stability even
under quite high pressures. Previous high pressure x-ray diffraction study has revealed
cubic to monoclinic phase transition in Ho2Ti2O7, Y2Ti2O7 and Tb2Ti2O7 near 37,
42 and 39 GPa, respectively [174]. In an earlier study, the transition pressure for
Tb2Ti2O7 is reported to be ∼ 51 GPa [175]. In this work, I have studied high pres-
sure behavior of Yb2Ti2O7 and Dy2Ti2O7 by employing x-ray diffraction and Raman
scattering measurements.
Yb2Ti2O7, an insulator, crystallizes into the pyrochlore structure [1, 17] with a lat-
tice parameter of 10.074 A at room temperature. Though early studies on the specific
heat of Yb2Ti2O7 reported a magnetically ordered state near ∼ 200 mK [176], Hodges
90
3.3. Experimental Details
et al [177]concluded that the Yb3+ spin fluctuations slow down at low temperatures
by more than 3 order of magnitude without freezing completely. A polarized neutron
study by Gardner et al [178] ruled out a frozen magnetic ground state and confirmed
that the majority of the spins continue to fluctuate even below the 240 mK, while
a small amount of magnetic scattering was observed at (111) Bragg position at 90
mK. The absence of a long range order in Yb2Ti2O7 down to 90 mK (as in Tb2Ti2O7
up to 70 mK) owing to a structural instability motivated us for the present study on
Yb2Ti2O7 .
Dy2Ti2O7 also crystallizes into the pyrochlore structure with lattice parameter
10.109 A at room temperature. The Dy2Ti2O7 [179] and Ho2Ti2O7 [180] exhibit the
spin ice like ground state known as dipolar spin ice, a unique properties among all
the known titanate pyrochlores, at very low temperature. The spin ice ground state
is analogous to ordering of protons in ordinary water ice [181]. In this case a pair of
spins point in on an elementary tetrahedron and another pair of spins point out as
shown in figure 3.2c. The reported existence of magnetic monopoles in Dy2Ti2O7 has
also made it more interesting [182] to study.
In this study, using x-ray diffraction and Raman experiments at high pressures,
we show that the spin frustrated pyrochlore Yb2Ti2O7 undergoes a reversible cubic
to monoclinic phase transition at ∼ 28.6 GPa and the monoclinic phase picks up an
anion disorder at ∼ 46 GPa. While our studies on the spin ice Dy2Ti2O7 show a
structural distortion at ∼ 9 GPa with a possible lattice instability at this pressure.
3.3 Experimental Details
Stoichiometric amounts of Yb2O3 / Dy2O3 (99.99%) and TiO2 (99.99%) were mixed
thoroughly and heated at 1200 ◦C for about 15 hours. The resulting mixture was well
ground and isostatically pressed into rods of about 6 cm long and 5 mm diameter.
91

3. Structural Transition in Frustrated Titanate Pyrochlores
These rods were sintered at 1400 ◦C in air for about 72 hours. This procedure
was repeated until the compound Yb2Ti2O7 / Dy2Ti2O7 was formed, as revealed
by powder x-ray diffraction analysis, with no traces of any secondary phase. These
rods were then subjected to single-crystal growth by the floating-zone method in
an infrared image furnace under flowing oxygen. X-ray diffraction measurements,
carried out on the powder obtained by crushing a part of the single crystalline sample
and energy dispersive x-ray analysis carried out in a scanning electron microscope
confirmed the formation of a pure pyrochlore Yb2Ti2O7 / Dy2Ti2O7 phase. For high
pressure x-ray diffraction experiments, the finely powdered,Yb2Ti2O7 / Dy2Ti2O7 was
loaded (along with a few particles of Cu) in a hole of ∼ 100 µm diameter drilled in a
pre-indented (∼ 70 micron thick) tungsten gasket of a Mao-Bell type of diamond-anvil
cell (DAC). A methanol:ethanol (4:1) mixture was used as a pressure transmitting
medium. The pressure was determined from the known equation of state of copper
[132]. High-pressure angle dispersive x-ray-diffraction experiments were carried out
up to ∼ 40.4 / 34 GPa on powder samples of Yb2Ti2O7 / Dy2Ti2O7 at the 5.2R
(XRD1) beamline of Elettra Synchrotron source employing monochromatized x-rays
(λ = 0.68881 A). The diffraction patterns were recorded using a MAR345 imaging
plate detector kept at a distance of ∼ 20 cm from the sample. The diffraction profiles
were obtained by the radial integration of the two dimensional diffraction rings using
the FIT2D software [95]. High pressure Raman experiments were carried out upto
∼ 50 / 29 GPa using a confocal micro Raman set up in back-scattering geometry.
A tiny single crystalline Yb2Ti2O7 / Dy2Ti2O7 sample was loaded in a pre-indented
tungsten gasket. Methanol:ethanol (4:1) mixture was used as pressure transmitting
medium. A tiny ruby chip (∼ 20 µm) was also loaded in the gasket hole to monitor
the pressure. Raman spectra were recorded using 532 nm laser radiation from a diode
pumped solid state laser. The calibration (and any possible drift) of the spectrometer
was monitored using standard spectral neon lines.
92
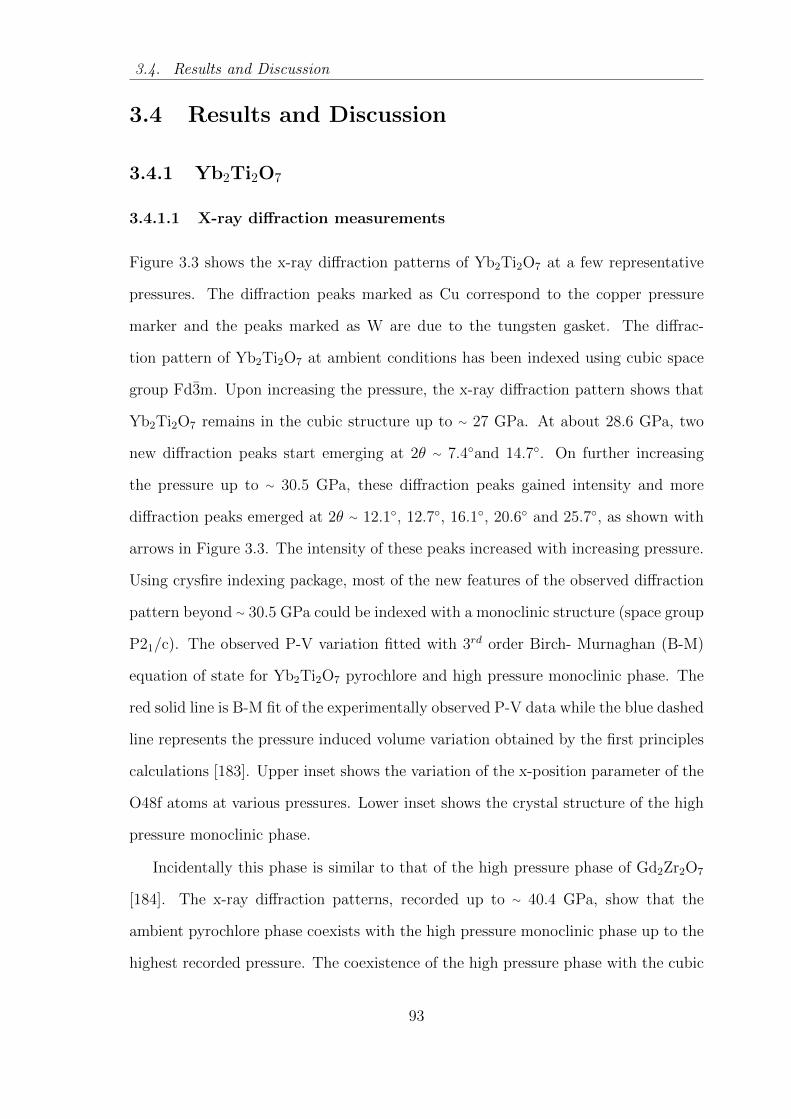
3.4. Results and Discussion
3.4 Results and Discussion
3.4.1 Yb2Ti2O7
3.4.1.1 X-ray diffraction measurements
Figure 3.3 shows the x-ray diffraction patterns of Yb2Ti2O7 at a few representative
pressures. The diffraction peaks marked as Cu correspond to the copper pressure
marker and the peaks marked as W are due to the tungsten gasket. The diffrac-
tion pattern of Yb2Ti2O7 at ambient conditions has been indexed using cubic space
group Fd3m. Upon increasing the pressure, the x-ray diffraction pattern shows that
Yb2Ti2O7 remains in the cubic structure up to ∼ 27 GPa. At about 28.6 GPa, two
new diffraction peaks start emerging at 2θ ∼ 7.4◦and 14.7◦. On further increasing
the pressure up to ∼ 30.5 GPa, these diffraction peaks gained intensity and more
diffraction peaks emerged at 2θ ∼ 12.1◦, 12.7◦, 16.1◦, 20.6◦ and 25.7◦, as shown with
arrows in Figure 3.3. The intensity of these peaks increased with increasing pressure.
Using crysfire indexing package, most of the new features of the observed diffraction
pattern beyond ∼ 30.5 GPa could be indexed with a monoclinic structure (space group
P21/c). The observed P-V variation fitted with 3rd order Birch- Murnaghan (B-M)
equation of state for Yb2Ti2O7 pyrochlore and high pressure monoclinic phase. The
red solid line is B-M fit of the experimentally observed P-V data while the blue dashed
line represents the pressure induced volume variation obtained by the first principles
calculations [183]. Upper inset shows the variation of the x-position parameter of the
O48f atoms at various pressures. Lower inset shows the crystal structure of the high
pressure monoclinic phase.
Incidentally this phase is similar to that of the high pressure phase of Gd2Zr2O7
[184]. The x-ray diffraction patterns, recorded up to ∼ 40.4 GPa, show that the
ambient pyrochlore phase coexists with the high pressure monoclinic phase up to the
highest recorded pressure. The coexistence of the high pressure phase with the cubic
93

3. Structural Transition in Frustrated Titanate Pyrochlores
Figure 3.3: X-ray diffraction profiles of Yb2Ti2O7 at a few representative pressures. Ar-rows indicate the x-ray diffraction peaks due to monoclinic phase at high pressure.
pyrochlore structure up to the highest pressure of our studies suggests a substantial
kinetic barrier for this transformation. This also suggests that the high pressure phase
is formed very slowly and the cations disordering in the high pressure phase may not
be complete even at highest pressure of our studies. However the phase fraction
analysis indicates that the fraction of monoclinic phase increases with pressure
All the diffraction patterns were analyzed using Rietveld refinement as imple-
mented in the GSAS [96]. Below ∼ 29 GPa, our refined coordinates imply that the
x-value of oxygen (O) at the 48f position increases with pressure (upper inset of figure
3.4).We have refined the lattice parameters as well as the atomic coordinates of the
new high pressure phase. The resulting fit is shown in figure 3.5 and the determined
structural parameters are listed in Table 3.1. It is well known that the pyrochlore
structure becomes an ideal fluorite structure when the x-value of the oxygen at 48f
94

3.4. Results and Discussion
Figure 3.4: The observed P-V variation fitted with 3rd order Birch- Murnaghan (B-M)equation of state for Yb2Ti2O7 pyrochlore and high pressure monoclinic phase. The red solidline is B-M fit of the experimentally observed P-V data while the blue dashed line representsthe pressure induced volume variation obtained by the first principles calculations (Mishraet al. 2012). Upper inset shows the variation of the x-position parameter of the O48f atomsat various pressures. Lower inset shows the crystal structure of the high pressure monoclinicphase.
Wyckoff site equals 0.375. Figure. 3.4 (upper inset) indicates that the pyrochlore
Yb2Ti2O7 may adopt a disordered-fluorite structure beyond ∼ 29 GPa. The new high
pressure monoclinic phase is shown in the lower inset of figure 3.4. It may be noted
from Table 3.1 that the new structure is a disordered structure having equal occu-
pancies for Yb and Ti atoms i.e. either one of these atoms occupy the two equivalent
sites. It may be noted here that recently it has been shown in Bi2Te3 that at high
pressures, either of two constituent atoms could occupy the bcc lattice sites [185].
Our results, though not implying indistinguishability of Yb and Ti, are similar in
terms of occupancies.The deduced variation of volume/formula unit with pressure is
given in Figure 3.4.
The observed volume drop of ∼ 14% at the transition pressure implies that the
95

3. Structural Transition in Frustrated Titanate Pyrochlores
Figure 3.5: Rietveld refinement of diffraction pattern of Yb2Ti2O7 at 40.4 GPa. Thediffraction pattern consists of contributions from pyrochlore phase, high pressure monoclinicphase, tungsten gasket and Cu pressure marker.
transformation to the monoclinic phase is of first order, consistent with the observa-
tion of co-existence of phases at higher pressures. The experimental pressure-volume
variation was fitted using third order Birch-Murnaghan equation of state [59] which
gives the bulk modulus B = 219 ± 6 GPa and its pressure derivative B′ = 3.2 ± 0.5.
The fit of the P-V data beyond 28.6 GPa give B = 355.7 ± 28 GPa and B′ = 0.03 ±
1.22 for the high pressure monoclinic phase. Relatively larger errors in the respective
values in the monoclinic phase are due to the limited number of data points. On
release of pressure, the high pressure phase reverts back to the pyrochlore structure
completely.
96

3.4. Results and Discussion
Table 3.1: The refined atomic coordinates of the high pressure monoclinic phase ofYb2Ti2O7 at 30.5 GPa (Space Group: P21/c , lattice parameters being a=5.544 A, b=3.963A, c=4.578 A and γ=104.663◦).
Atom Wyckoff x/a y/b z/c Occupancy
Yb 4e 0.218 0.0310 0.200 0.5Ti 4e 0.218 0.0310 0.200 0.5O1 4e 0.0705 0.3327 0.3447 0.75O2 4e 0.4499 0.7588 0.4793 1.0
3.4.1.2 Raman spectra at high pressures
According to group theoretical analysis, a pyrochlore structure have optical modes
given by the following representation
Γopt = A1g(R) + Eg(R) + 2F1g + 4F2g + 3A2u + 3E2u + 7F1u(IR) + 4F2u (3.1)
Out of which six are Raman (R) active modes and seven are infrared (IR) active
[186, 187].
Raman spectrum of Yb2Ti2O7 at ambient conditions, shown in the Figure 3.6,
exhibits eight Raman bands, marked as pk1 to pk8: pk1 = 212 cm−1, pk2 = 302
cm−1, pk3 = 329 cm−1, pk4 = 525 cm−1, pk5 = 539 cm−1, pk6 = 608 cm−1, pk7 =
715 cm−1 and pk8 = 750 cm−1.
The position and relative intensities of these bands are in agreement with the
earlier reports[168, 186, 188, 189]. On the basis of an earlier work [163] the Raman
modes Pk2, Pk5 and Pk6 are identified as F2g; Pk3 as Eg and Pk4 as A1g modes. The
fourth F2g mode, which is usually located near 450 cm−1 in the rare-earth titanates
(as discussed in the ref. [190, 191], could not be seen because of poor signal to noise
ratio. In the pyrochlore structure, all the Raman active modes involve the movement
of oxygen atoms. As discussed in the publication [168], pk1 is a disorder-induced
97

3. Structural Transition in Frustrated Titanate Pyrochlores
Figure 3.6: Raman spectrum of Yb2Ti2O7 pyrochlore at ambient pressure. The differentraman modes have been labeled as pk1 to pk8.
Raman active mode involving vibration of Ti4+ atoms that form a tetrahedral network
with vacant 8b-sites at the center of each tetrahedron. The Raman bands observed at
715 cm−1 (pk7) and 750 cm−1 (pk8) can be assigned to second order Raman spectra
[168, 189]. In addition, we have also observed two weak broad bands at ∼ 887 cm−1
and 1049 cm−1, which can also be second order Raman modes. Figure 3.7 shows
the Raman spectra of Yb2Ti2O7 at a few representative pressures. These data were
recorded under quasi hydrostatic conditions up to ∼ 50 GPa on compression as well
as on release of pressure. The corresponding pressure-induced changes in the Raman
frequencies, deduced from the spectra by fitting a sum of Lorentzian functions are
shown in figure 3.8. The intensity of the pk1 Raman mode is too weak and hence was
not followed at high pressures. On increase of pressure, the observed Raman modes
shift towards higher wave numbers. Using the bulk modulus of the ambient phase
the Grneisen parameters for these modes were calculated (Table 3.2).
The pk5 Raman mode disappears beyond 25 GPa. Most of the observed modes
show a slope change at ∼ 29.7 GPa, implying a phase transition at this pressure,
in agreement with our x-ray diffraction results. On increasing the pressure beyond
29.7 GPa, the observed Raman modes stiffen and broaden. Beyond 41.4 GPa the
98
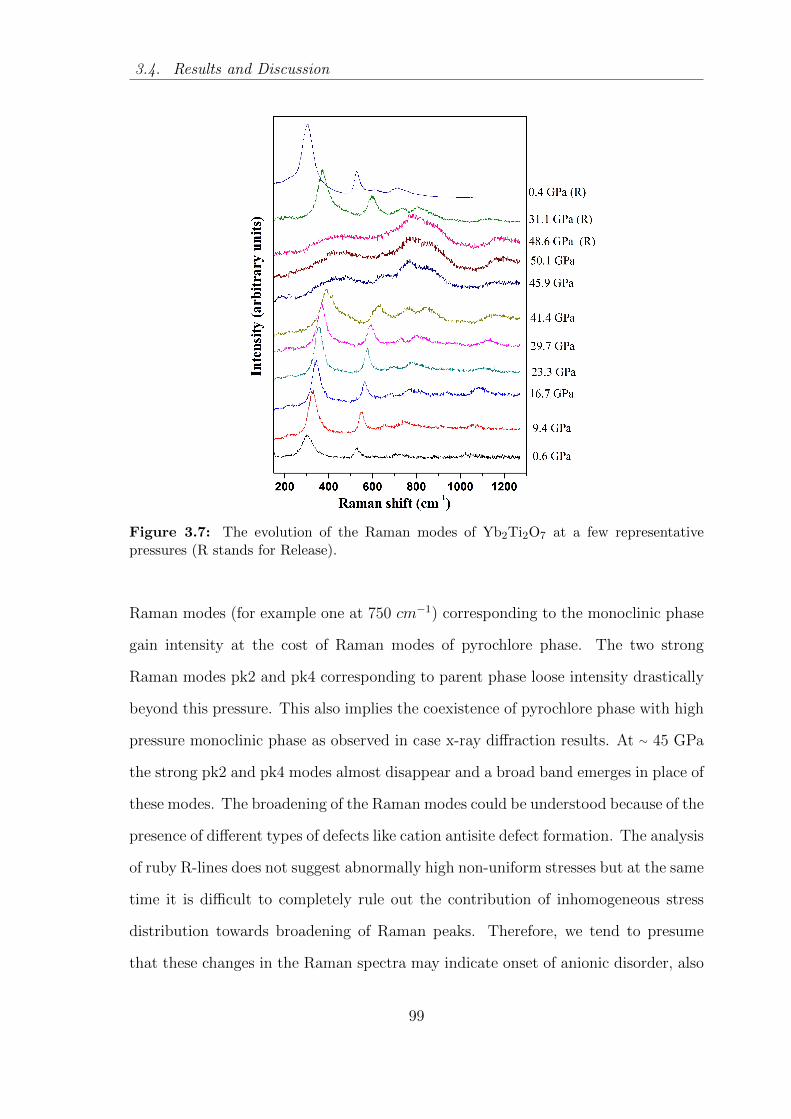
3.4. Results and Discussion
Figure 3.7: The evolution of the Raman modes of Yb2Ti2O7 at a few representativepressures (R stands for Release).
Raman modes (for example one at 750 cm−1) corresponding to the monoclinic phase
gain intensity at the cost of Raman modes of pyrochlore phase. The two strong
Raman modes pk2 and pk4 corresponding to parent phase loose intensity drastically
beyond this pressure. This also implies the coexistence of pyrochlore phase with high
pressure monoclinic phase as observed in case x-ray diffraction results. At ∼ 45 GPa
the strong pk2 and pk4 modes almost disappear and a broad band emerges in place of
these modes. The broadening of the Raman modes could be understood because of the
presence of different types of defects like cation antisite defect formation. The analysis
of ruby R-lines does not suggest abnormally high non-uniform stresses but at the same
time it is difficult to completely rule out the contribution of inhomogeneous stress
distribution towards broadening of Raman peaks. Therefore, we tend to presume
that these changes in the Raman spectra may indicate onset of anionic disorder, also
99

3. Structural Transition in Frustrated Titanate Pyrochlores
Figure 3.8: Pressure induced variation of Raman mode frequencies of Yb2Ti2O7 .
observed earlier in other pyrochlore compounds. Upon decompression, the broad
bands shift towards lower wave numbers up to ∼ 31 GPa. At this pressure the Raman
modes of the pyrochlore structure start re-appearing. On complete release of pressure,
all the Raman modes of the pyrochlore structure are fully recovered confirming the
reversibility of structural changes
3.4.1.3 Conclusions
Our in-situ x-ray diffraction and Raman measurements on pyrochlore Yb2Ti2O7 show
that it undergoes a structural phase transition from cubic (Fd3m) pyrochlore to a
monoclinic phase (P21/c) at ∼ 28.6 GPa. Interestingly, analysis of the x-ray data
suggests this high pressure phase to be substitutionally disordered, analogous to a
pressure induced disordered phase observed in Bi2Te3. The observed phase transition
is first order in nature. These results are shown to be consistent with our Raman
100

3.4. Results and Discussion
Table 3.2: Mode Gruneisen parameter of Raman modes.
Frequency (ω (cm−1)) dω/dP (cm−1 / GPa) Gruneisen parameter (γ)
302 2.2 1.6329 3.1 2.1525 2.2 0.9540 2.6 1.1608 3.9 1.4715 2.8 0.8750 2.2 0.6
scattering measurements. On release of the pressure, the initial structure is fully
recovered implying the reversibility of the phase transition. In the cubic phase the
bulk modulus of Yb2Ti2O7 is found to be 219 6 ± GPa and it increases substantially
to 355.7 ± 28 GPa across the phase transition to the monoclinic phase. New high
pressure phase is found to have structural occupancy disorder observed also in other
compounds recently.
3.4.2 Dy2Ti2O7
3.4.2.1 Structural effects by XRD
Figure 3.9 represents the stacked x-ray diffraction pattern of Dy2Ti2O7 at few repre-
sentative pressures. The x-ray diffraction pattern of Dy2Ti2O7 at ambient conditions
could be indexed with cubic structure in space group Fd3m.
The diffraction pattern at ambient conditions is Rietveld refined to determine the
lattice parameter as 10.109 (5)A which is in close agreement with the earlier reported
values for Dy2Ti2O7 [192]. The various (hkl) values for Dy2Ti2O7 have been written
along the x-ray diffraction peaks at ambient conditions. The x-ray diffraction peaks
corresponding to pressure marker copper (Cu) and gasket (W) has been written as Cu
(hkl) and W (hkl) respectively. The x-ray diffraction peaks from impurity phase has
101

3. Structural Transition in Frustrated Titanate Pyrochlores
Figure 3.9: Diffraction pattern of Dy2Ti2O7 pyrochlore stacked at a few representativepressures
been marked with asterisk (*). On compression the observed x-ray diffraction peaks
shift toward higher angular values. Beyond ∼15 GPa the x-ray diffraction peaks of the
sample broaden significantly, especially the (400) and (222) x-ray diffraction peaks as
shown in figure 3.10. While the XRD peak (111) of pressure marker Cu shows little
variation in its FWHM. This implies that sample is under quasi hydrostatic
environment and the broadening observed in the x-ray diffraction peaks of sample
is primarily because of inherent disorder or it may be due to transformation to low
symmetry phase having multiple peaks. The diffraction pattern corresponding to
each pressure has been refined using Le Bail and Rietveld refinement as incorporated
into GSAS package [96]. Figure 3.11 represents the variation of different dhkls with
respect to pressure. For better presentation purpose different dhkl have been plotted
in separate layers. A change in slope of dhkls is observed ∼9 GPa which implies a
102
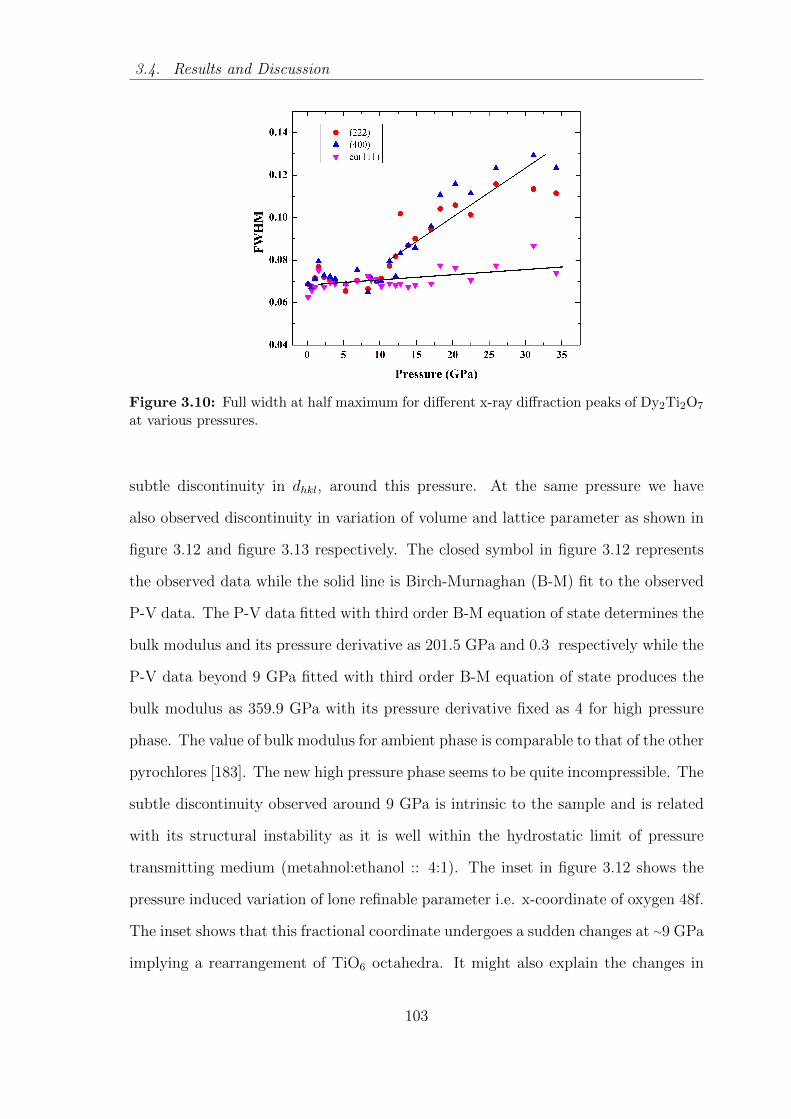
3.4. Results and Discussion
Figure 3.10: Full width at half maximum for different x-ray diffraction peaks of Dy2Ti2O7
at various pressures.
subtle discontinuity in dhkl, around this pressure. At the same pressure we have
also observed discontinuity in variation of volume and lattice parameter as shown in
figure 3.12 and figure 3.13 respectively. The closed symbol in figure 3.12 represents
the observed data while the solid line is Birch-Murnaghan (B-M) fit to the observed
P-V data. The P-V data fitted with third order B-M equation of state determines the
bulk modulus and its pressure derivative as 201.5 GPa and 0.3 respectively while the
P-V data beyond 9 GPa fitted with third order B-M equation of state produces the
bulk modulus as 359.9 GPa with its pressure derivative fixed as 4 for high pressure
phase. The value of bulk modulus for ambient phase is comparable to that of the other
pyrochlores [183]. The new high pressure phase seems to be quite incompressible. The
subtle discontinuity observed around 9 GPa is intrinsic to the sample and is related
with its structural instability as it is well within the hydrostatic limit of pressure
transmitting medium (metahnol:ethanol :: 4:1). The inset in figure 3.12 shows the
pressure induced variation of lone refinable parameter i.e. x-coordinate of oxygen 48f.
The inset shows that this fractional coordinate undergoes a sudden changes at ∼9 GPa
implying a rearrangement of TiO6 octahedra. It might also explain the changes in
103

3. Structural Transition in Frustrated Titanate Pyrochlores
Figure 3.11: Pressure induced variation of different dhkl values.
the compressibility of Dy2Ti2O7 around this pressure.
3.4.2.2 Raman Spectroscopic effect
As mentioned in the section 3.4.1 B a pyrochlore structure should have six Raman
optical modes Γopt =A1g+ Eg+ 4F2g.
Here, since cations occupy sites with inversion symmetry, therefore only O and O
anion atoms are responsile for Raman-active modes. The Raman spectra at ambient
conditions has been shown in the figure 3.14 and different Raman modes observed at
ambient conditions has been denoted with p1, p2 to p11. Different sections of the
Raman spectrum has been zoomed (written as X1, X2 etc in figure 3.14) appropriately
to show the Raman modes observed at ambient conditions. Assignment of various
observed Raman modes have been done following the earlier reported work works
[173, 190].
The Position and relative intensities of these Raman modes agree with the earlier
104
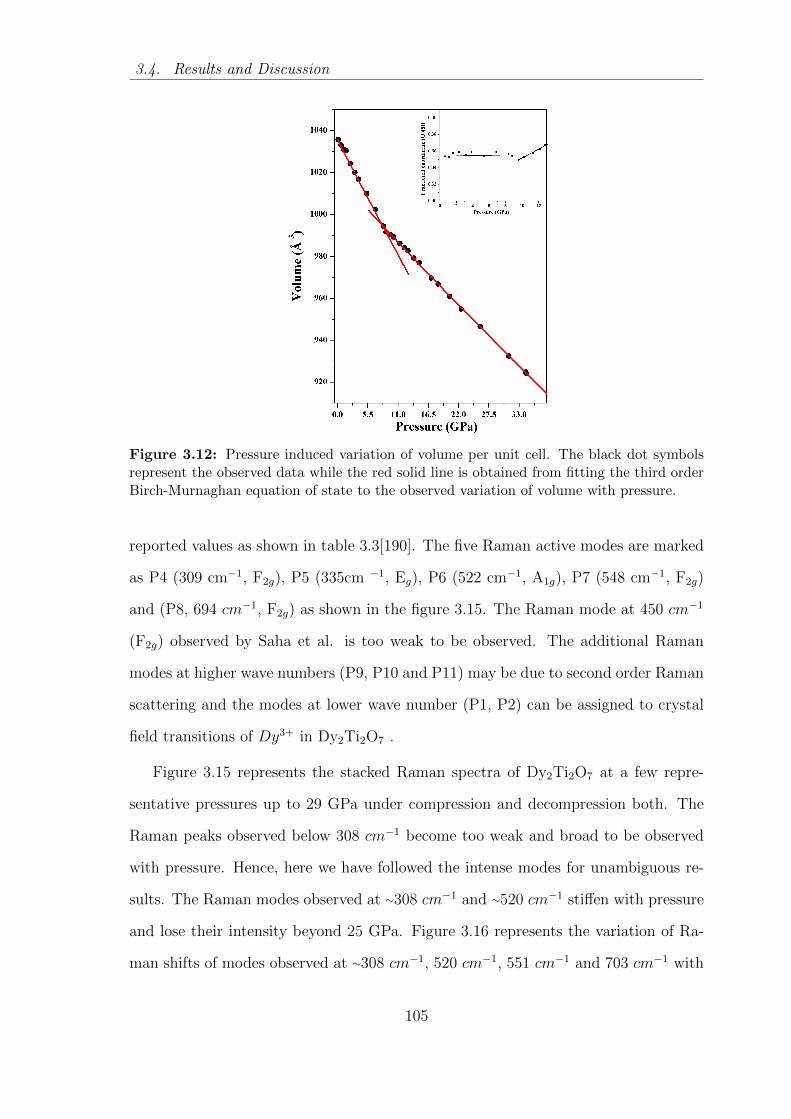
3.4. Results and Discussion
Figure 3.12: Pressure induced variation of volume per unit cell. The black dot symbolsrepresent the observed data while the red solid line is obtained from fitting the third orderBirch-Murnaghan equation of state to the observed variation of volume with pressure.
reported values as shown in table 3.3[190]. The five Raman active modes are marked
as P4 (309 cm−1, F2g), P5 (335cm −1, Eg), P6 (522 cm−1, A1g), P7 (548 cm−1, F2g)
and (P8, 694 cm−1, F2g) as shown in the figure 3.15. The Raman mode at 450 cm−1
(F2g) observed by Saha et al. is too weak to be observed. The additional Raman
modes at higher wave numbers (P9, P10 and P11) may be due to second order Raman
scattering and the modes at lower wave number (P1, P2) can be assigned to crystal
field transitions of Dy3+ in Dy2Ti2O7 .
Figure 3.15 represents the stacked Raman spectra of Dy2Ti2O7 at a few repre-
sentative pressures up to 29 GPa under compression and decompression both. The
Raman peaks observed below 308 cm−1 become too weak and broad to be observed
with pressure. Hence, here we have followed the intense modes for unambiguous re-
sults. The Raman modes observed at ∼308 cm−1 and ∼520 cm−1 stiffen with pressure
and lose their intensity beyond 25 GPa. Figure 3.16 represents the variation of Ra-
man shifts of modes observed at ∼308 cm−1, 520 cm−1, 551 cm−1 and 703 cm−1 with
105

3. Structural Transition in Frustrated Titanate Pyrochlores
Figure 3.13: Pressure induced variation of lattice parameter of pyrochlore phase.
Figure 3.14: Raman spectrum of Dy2Ti2O7 pyrochlore at ambient pressure. The differentraman modes have been labeled as P1 to P11.
pressure. Here the closed and open symbols represent the data during compression
and decompression respectively. It is noted from figure 3.16 that the Raman modes
observed at 551 cm−1 and 703 cm−1 show discontinuity around 9 GPa. This is in
accordance with changes observed in our x-ray diffraction based investigations.
Using the bulk modulus of ambient phase and slope of Raman shift, the Gruneisen
parameter of observed Raman modes has been deduced and the same has been shown
106

3.4. Results and Discussion
Table 3.3: Assignment of Raman modes of Dy2Ti2O7. The origin of modes with (phonon)assignment has been discussed in text.
Normal modes ν(cm−1)(this Expt.) ν(cm−1)(Saha etal.) Assignment
P1 137 126 phononP2 213 194 phononP3 273 287 phononP4 309 312 phononF2g
P5 335 330 phonon E2g
P6 522 515 phononA1g
P7 548 563 phononF2g
P8 694 680 phonon E2g
P9 718 712 overtoneP10 875 867 overtoneP11 1000 overtone
Figure 3.15: Raman spectra of Dy2Ti2O7 pyrochlore stacked at a few representativepressures.
107

3. Structural Transition in Frustrated Titanate Pyrochlores
Figure 3.16: Variation of Raman shift of different modes with pressure.
in table 3.4.
The maximum value of Gruneisen parameter (3.0) observed for the Raman mode
at 703 cm−1 signifies its maximum contribution towards specific of this compound
while lowest Gruneisen parameter (0.95) is observed for mode at 521 cm−1 implies
that the contribution of this mode towards specific heat is minimum. The low temper-
ature Raman spectroscopic studies carried out by Saha et al. [190] on this compound
indicated the appearance of a new Raman band at ∼287 cm−1 below 110 K. They
Table 3.4: Raman mode frequencies (ν), their pressure dependence (dν/dP) and corre-sponding Grneisen parameters (γ) in the cubic pyrochlore phase of Dy2Ti2O7 .
Frequency (ν (cm−1)) dν/dP (cm−1 / GPa) Gruneisen parameter (γ)
309 2.74 1.79521 2.45 0.96552 5.32 1.94703 10.48 3.0
108

3.4. Results and Discussion
attributed this to a Raman inactive phonon mode which becomes Raman active due
to site symmetry lowering as a result of local structural deformation below 110 K.
Based on the anomalous softening of this new band with low temperature they sug-
gested that spin-phonon coupling is not responsible for this behavior rather it is
strong phonon-phonon anharmonic interaction which leads to this anomalous behav-
ior. Later on Maczka et al. [193] argued that crystal field splitting is responsible
for the origin of Raman mode at low temperatures. They also suggested that the
anomalous behavior of the Raman modes may be because of combination of many
factors like strong bond bending character, stronger second-neighbor force constant
of O-O and availability of free x-co-ordinate of oxygen which affects the distortion of
TiO6 octahedra. The elastic constant studies by Nakanishi et al. also show a possible
lattice distortion. From our powder x-ray diffraction studies we have also observed a
volume discontinuity around 9 GPa. This can be related with a possible structural
distortion concomitant with lattice instability around this pressure. Since the cations
in Dy2Ti2O7 occupy the Wyckoff sites with inversion symmetry and the anions i.e
oxygen atoms participate in the Raman active modes. Hence, we speculate that a
subtle structural instability occurs due to deformation in the anionic sublattice of
Dy2Ti2O7 across 9 GPa.
3.4.2.3 Conclusions
Angle dispersive powder x-ray diffraction and Raman scattering studies have been
carried out on geometrically frustrated spin ice pyrochlore Dy2Ti2O7 up to ∼ 34.3
GPa and ∼ 29GPa repectively on compression and decompression. At ∼9 GPa a subtle
structural distortion is observed in the P-V diagram which shows the possibility of
lattice distortion at this pressure. This is in accordance with our results obtained
from Raman sacttering measurement. The observed pressure induced variation of
volume fitted with third order Birch-Murnaghan equation of state determines the
109

3. Structural Transition in Frustrated Titanate Pyrochlores
bulk modulus to be 201.5 ± 6.9 GPa with its pressure derivative as 0.3 ± 1.9.
110

4
Structural Investigation of
perovskites
The perovskite structure with general chemical formula ABX3 owes its name to miner-
alogist Lev. Aleksevich von Perovski. Its archetypal compound is CaTiO3 which was
first discovered by Gustav Rose in 1839 from samples found in the Ural mountains
in Russia [194]. Studies on perovskites are important not only from basic physics
point of view but also due to their technological applications [195]. Under extreme
temperature and pressure several of them undergo phase transformations to the post
perovskite structures or decompose into their respective oxides making them relevant
to the understanding of geophysical phenomena [196, 2]. In particular, the studies on
silicates, germanates, oxides and fluorides suggest that the transformation to the post
perovskite structure could be responsible for the seismic discontinuity at the earths
lower mantle-core boundary [197, 198, 199] . Since these perovskites are made up of
a network of corner linked polyhedra, tilt or distortion of the polyhedra, at low/high
temperatures or on application of pressure, plays a crucial role in their stability.
Based on empirical formulation Ross et al. have shown that the tilt of the octahedra
at high pressures is related to the compressibility of the constituent polyhedra [200].
111

4. Structural Investigation of perovskites
Perovskite materials exhibit many interesting and intriguing properties from appli-
cation point of view such as ferroelectricity, superconductivity, charge ordering, spin
dependent transport and the interplay of structural, magnetic electrical and trans-
port properties. These compounds having many technological applications are used
as sensors, switches, and catalyst electrodes in certain types of fuel cells etc [201]. The
perovskites can accommodate variety of elements as cations and anions exhibiting a
wide spectrum of physical properties. These compounds with transition metal cations
on the B site show a variety of intriguing electronic and/or magnetic properties. In
addition to the above mentioned chemical flexibility, the wide range of physical prop-
erties are mainly related to the complex character that transition metal cations play
in certain coordinations with oxygen or halides as anions [10]. While magnetism and
electronic correlations are usually related to unfilled 3d electron shells of the tran-
sition metal, pronounced dielectric properties are connected with filled 3d electron
shells. Multiferrocity, a coexistence of spontaneous ferroelectric and ferromagnetic
moments, has also been reported for perovskite type of compounds. These novel
properties are exploited in the usage of these materials in the field of data storage,
microelectronic devices, spintronics etc [202, 203]. Under compression the ideal cubic
perovskites become distorted perovskites having reduced symmetry, which is impor-
tant for their electric and magnetic properties. Cubic perovskites undergo structural
phase transitions by distortion/rotation of octahedral and/or movement of the central
cation, driven by Jahn-Teller distortions. Several of these also display ferroelectric
or ferroelastic instabilities leading to multiferroicity. The distortions are expected to
diminish on increase of temperature, as the structure tends towards the parent per-
ovskite form [204]. Effects of pressure on structure, however, are difficult to predict
due to the complex changes in the inter-ionic interactions coupled with the interplay
of several degrees of freedom such as distortion/rotation of octahedra, displacement
of ions etc. As mentioned above the perovskite structure with general stoichiometry
112

4.1. Crystallography of the Perovskite structure
ABX3, can have a variety of compositions possible as different A and B cations and X
as anions. Some of these can be ideal cubic perovskite, distorted perovskite, double
perovskites or inverse perovskite. I have chosen to study a multiferroic oxide distorted
perovskite BiFeO3, a double perovskite Sr2MgWO6 and an inverse perovskite BaLiF3
to understand the polymorphism and high pressure behavior of these compounds.
4.1 Crystallography of the Perovskite structure
The structure of an ideal cubic perovskite is shown in Figure 4.1 where the A cations
are shown at the corners of the cube, and the B cations in the centre with oxygen
ions in the face- centred positions. The space group for cubic perovskite is Pm3m (S.
G. No = 221). The atomic positions are shown in table 4.1.
Figure 4.1: Unit cell of cubic perovskite. Gray, green and red spheres represent the Acations, B cations and oxygen anions respectively. B cation with oxygen atoms forms anoctahedra.
Table 4.1: Atomic positions in the cubic perovskite
Atom site Wyckoff site Co-ordinates
A cation (1b) (0, 0, 0)B cation (1a) (0.5, 0.5, 0.5)X anion (3c) (0.5, 0.5, 0.0); (0.5, 0, 0.5); (0, 0.5, 0.5)
The distortion of cubic perovskite structure generate orthorhombic structures with
Pnma or Pbnm space group as well as rhombohedral structure with space groups R3c,
R3c etc. The rhombohedral structure is shown in figure 4.2.
113

4. Structural Investigation of perovskites
Figure 4.2: Distorted cubic perovskite structure of BiFeO3 in R3c space group. The greycolored spheres are bismuth atoms, the yellow colored are iron atoms while the one withred colors represent oxygen atoms.
Another way of describing the perfect cubic perovskite structure is to consider
it as made up of corner shared BO6 octahedra with interstitial A cations. If one
considers the atoms as rigid spheres then for an idealized cubic perovskite structure
each cation has to be in contact with an oxygen anion; the radii of the ions can be
related:
RA+RO =√
2× (RB +RO) (4.1)
Where RA, RB and RO are the ionic radii of A, B cations and the oxygen ion
respectively. However, with reducing A cation size, a point will come where the
cations will be too small to remain in contact with the anions in the cubic structure.
Hence the B-O-B links will bend a little bit to allow the tilting of BO6 octahedra which
will bring in some anions into contact with A cations. To allow for this distortion, a
constant t is introduced into the above equation, therefore
RA+RO = t×√
2× (RB +RO) (4.2)
The constant t is known as tolerance factor which is a measure of the degree of
distortion of a perovskite from ideal cubic structure. The closer the value of t to unity
the closer it will be to ideal cubic structure.
114

4.2. Phase transitions in multiferroic BiFeO3
4.2 Phase transitions in multiferroic BiFeO3
4.2.1 Introduction
Bismuth ferrite (BiFeO3) is a multiferroic in which the ferroelectricity arises due to
the 6s lone pair electrons of bismuth, [205, 206, 207] and the partially filled d orbitals
of Fe generate the magnetic ordering. At room temperature BiFeO3 crystallizes into
rhombohedrally distorted perovskites with space group R3c [208, 209] having 6 for-
mula units per unit cell (Z = 6). This structure is derived from cubic Pm3m structure
by displacement of Fe3+ and Bi3+ cations from their centro-symmetric positions along
[111] pseudo cubic direction and an antiphase tilting of the adjacent FeO6 octahedra.
It is one of the few perovskites which exhibits both the displacement of the cations
from their centro-symmetric position as well as the tilt of the octahedra.
The high pressure behavior of BiFeO3 has earlier been investigated by several
groups and has led to a multitude of, sometimes contradictory, observations [210, 211,
212, 213, 214, 215, 216, 217]. In one of the earliest studies, using Raman scattering and
Ar as pressure transmitting medium (PTM), Haumont et al [210] reported two high
pressure phase transitions at ∼3.5 GPa and ∼10 GPa to C2/m and Pnma respectively.
These were later confirmed by them with x-ray diffraction (XRD) measurements
employing a more hydrostatic (hydrogen) PTM [211]. However, XRD experiments
by Gavriliuk et al. [212] , using PTM like hydrogen and helium, did not show any
transition till 50 GPa, at which pressure BiFeO3 underwent a Mott transition to a
metallic phase. Subsequent XRD experiments [213] reported a single transition, but
at 10 GPa. In contrast Belik et al. [214] claimed the observation of three structural
transitions (using the 16:4:1 methanol:ethanol:water (M:E:W) mixture as PTM) viz.,
R3c→ orthorhombic1→ orthorhombic2→ Pnma. In fact Belik et al. also discussed
the presence of an Orthorhombic3 phase on release of pressure. However, it should
be noted that the samples used by these authors had impurities arising from the
115

4. Structural Investigation of perovskites
unreacted and intermediate reaction products. Measurements carried out on single
crystals of BiFeO3 by Guenno et al. [215] suggest that under hydrostatic conditions
there are two intermediate phases while under non-hydrostatic conditions there are
three phases. However, these authors did not report the crystal structures of the high
pressure phases.
Theoretical results are also similarly diverse: ab-initio calculations by Ravindran
et al. [216] indicated that BiFeO3 transforms to the Pnma phase at 10 GPa. However,
corroborating the results of Gavriliuk et al., ab initio calculations of Vazquez et al.
[217] also showed that BiFeO3 undergoes a first order phase transition from a high
spin (Fe3+) state phase to a low spin (Fe3+) state phase at 36 GPa. Recently, using
first principles methods, Dieguez et al. [218] have performed a systematic search
for the potentially stable phases of BiFeO3 and found a large number of possibly
competing structures.
Hence to determine the structure of the intermediate phase of BiFeO3 I have
carried out high pressure x-ray diffraction studies in detail. The first principles ab-
initio study on BiFeO3 as reported in Ref. [219] has helped to determine the accurate
fractional coordinates of the intermediate high pressure phase.
4.2.2 Methods
Equimolar amounts of Bi(NO3)3 and Fe(NO3)3 were dissolved in 2N HNO3 along
with tartaric acid in 1:1 molar ratio with respect to the metal ion. This solution was
heated under constant stirring at 200 ◦C till all the liquids evaporated. Finally this
dry powder was calcined at 500 ◦C for about half an hour to yield BiFeO3. This sample
was characterized with the help of x-ray diffraction. Rietveld refinement of this data
confirms the formation of rhombohedral (S.G. R3c) BiFeO3 and a small amount of (2
% in weight) Bi2Fe4O9 impurity. The unit-cell parameters were determined to be a
= 5.571(1) A and c = 13.827 (3) A (hexagonal setting), which are in good agreement
116
4.2. Phase transitions in multiferroic BiFeO3
with the earlier reported lattice constants of BiFeO3 [209, 220].
For high pressure experiments finely powdered sample of BiFeO3 was loaded along
with a few specs of copper in a hole, of ∼100 µm diameter, drilled in a pre indented (∼
70 micron thick) tungsten gasket of a diamond-anvil cell (DAC). Methanol: ethanol
(4:1) mixture was used as pressure transmitting medium. The pressure was deter-
mined from the known equation of state of copper [132]. High-pressure angle dis-
persive x-ray-diffraction experiments (λ = 0.68881 A), were carried out up to ∼ 27.0
GPa at the 5.2 R (XRD1) beamline of Elettra Synchrotron source. The diffraction
patterns were recorded using MAR345 imaging plate detector kept at a distance of ∼
20 cm from the sample. Two-dimensional x-ray diffraction patterns were transformed
to one-dimensional diffraction profiles by the radial integration of diffraction rings
using the FIT2D software [95].
4.2.3 Results and Discussion
The x-ray diffraction pattern of BiFeO3 at a few representative pressures is shown in
Figure 4.3.
The impurity peaks are very weak and have been marked with an asterisk (*)
. These peaks can be followed up to 3 GPa beyond which they are not discernible.
The appearance of new weak peaks in the diffraction pattern at 4.1 GPa indicate
that BiFeO3 has undergone a structural phase transition to a lower symmetry phase.
Inset shows that these new peaks are distinct from the impurity peaks. The diffraction
pattern appears to be similar to the first high pressure phase observed by Haumont
et al [211]. On comparing the 7.5 GPa diffraction pattern of Gavriliuk et al.[212]
we find that very weak diffraction peaks ignored by these authors actually have d
spacings ( at 5.21A, 3.1 A, 2.61 A) similar to those of the new peaks observed by us
and Haumont et al. [211]. Since the new diffraction peaks are very weak the authors
might have missed these new peaks, concluding the absence of any phase change upto
117

4. Structural Investigation of perovskites
Figure 4.3: X-ray diffraction pattern of BiFeO3 at a few representative pressures. X-raydiffraction peaks marked with the star are from impurity while the peaks marked withsolid and dotted arrows are from the new high pressure phases with space group P2221 andPnma respectively. The inset shows the zoomed view of diffraction pattern at 4.1 GPa andhighlights the fact that the new XRD peaks of P2221 phase are distinct from the impuritypeaks.
50 GPa. We have observed that in our studies these diffraction peaks remain weak
over the entire range of existence implying that the first high pressure phase may not
be very different from the initial phase and could be obtained by a slight distortion of
the R3C structure. On further increase of pressure new weak diffraction peaks start
appearing at 6.4 GPa indicating the onset of a second phase transition. By 11 GPa the
transformation seems to be complete as the new peaks become stronger and some of
the diffraction peaks of the first high pressure phase have disappeared. Coexistence of
both the high pressure phases over this pressure range implies the first order nature
of this transformation. On release of pressure the diffraction pattern of the initial
phase was retrieved indicating the reversibility of both the phase transitions.
The structure of the second high pressure phase at 11 GPa was found to be
118
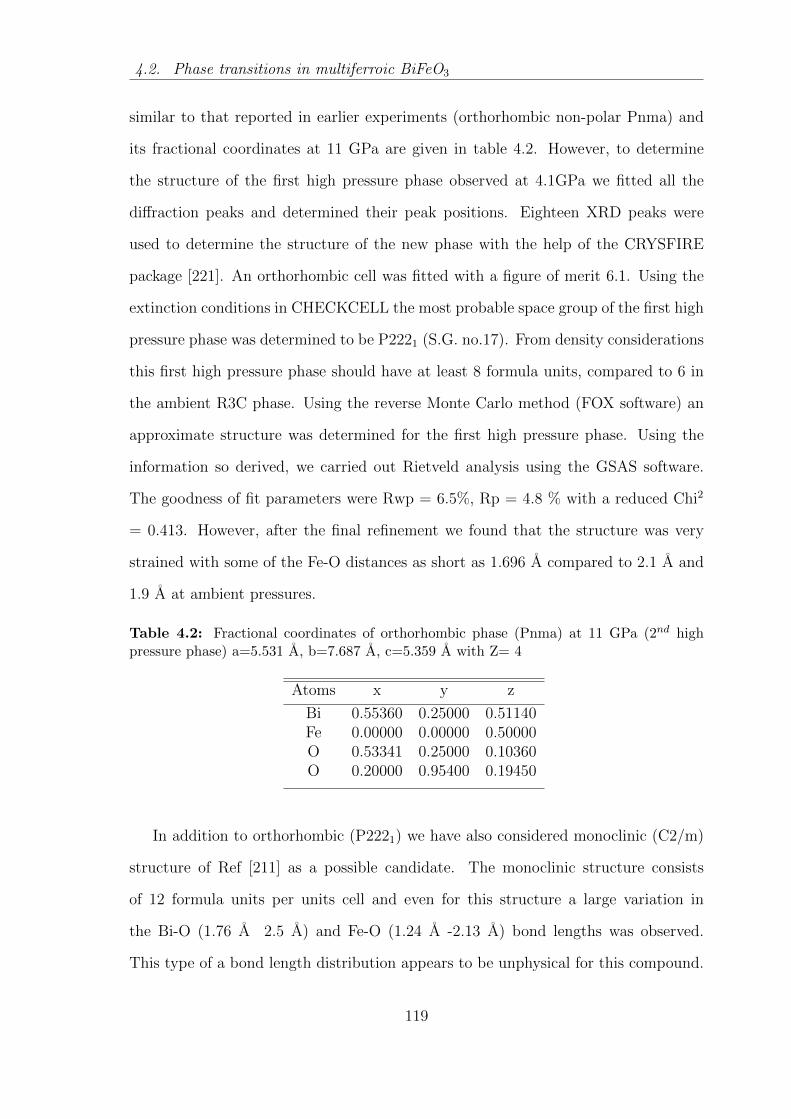
4.2. Phase transitions in multiferroic BiFeO3
similar to that reported in earlier experiments (orthorhombic non-polar Pnma) and
its fractional coordinates at 11 GPa are given in table 4.2. However, to determine
the structure of the first high pressure phase observed at 4.1GPa we fitted all the
diffraction peaks and determined their peak positions. Eighteen XRD peaks were
used to determine the structure of the new phase with the help of the CRYSFIRE
package [221]. An orthorhombic cell was fitted with a figure of merit 6.1. Using the
extinction conditions in CHECKCELL the most probable space group of the first high
pressure phase was determined to be P2221 (S.G. no.17). From density considerations
this first high pressure phase should have at least 8 formula units, compared to 6 in
the ambient R3C phase. Using the reverse Monte Carlo method (FOX software) an
approximate structure was determined for the first high pressure phase. Using the
information so derived, we carried out Rietveld analysis using the GSAS software.
The goodness of fit parameters were Rwp = 6.5%, Rp = 4.8 % with a reduced Chi2
= 0.413. However, after the final refinement we found that the structure was very
strained with some of the Fe-O distances as short as 1.696 A compared to 2.1 A and
1.9 A at ambient pressures.
Table 4.2: Fractional coordinates of orthorhombic phase (Pnma) at 11 GPa (2nd highpressure phase) a=5.531 A, b=7.687 A, c=5.359 A with Z= 4
Atoms x y z
Bi 0.55360 0.25000 0.51140Fe 0.00000 0.00000 0.50000O 0.53341 0.25000 0.10360O 0.20000 0.95400 0.19450
In addition to orthorhombic (P2221) we have also considered monoclinic (C2/m)
structure of Ref [211] as a possible candidate. The monoclinic structure consists
of 12 formula units per units cell and even for this structure a large variation in
the Bi-O (1.76 A 2.5 A) and Fe-O (1.24 A -2.13 A) bond lengths was observed.
This type of a bond length distribution appears to be unphysical for this compound.
119

4. Structural Investigation of perovskites
On refinement we found that despite the larger number of refinable parameters, the
measures of goodness of fit were poorer (Rwp = 10 %, Rp = 7 % with reduced Chi2
= 1.1) compared to those of P2221. Although fit with the orthorhombic structure is
better than the monoclinic, both structures are significantly strained at the end of
refinement. The first principles based structural optimization technique was used to
let the atomic coordinates evolve to minimize the local forces as mentioned in the Ref
[211]. Accordingly, starting from the experimentally obtained structural parameters,
coordinates in R3c, P2221 and C2/m phases at different volumes were optimized.
As expected, at higher volumes (or lower pressures), the rhombohedral R3c phase is
found to be energetically stable. The initial orthorhombic (P2221) and monoclinic
(C2/m) structure were also relaxed using first principles calculations. For comparison
I have presented here the structure and the nature of changes brought about by these
simulations [219] on both the structures in Figure 4.4.
Figure 4.4: Rietveld refined monoclinic (C2/m) structure (from reference Haumont et al.2009). (b) Relaxed monoclinic structure after theoretical structural optimization (Mishra etal. 2013). The resulting bond lengths for Bi-O and Fe-O changed from 2.22A to 2.44A and1.86A to 1.89A respectively (c) Rietveld refined orthorhombic (P2221) structure (presentstudy, without relaxation). (d) Relaxed orthorhombic (P2221) structure after theoreticalstructural optimization (Mishra et al. 2013)
I have used both of these optimized structures for the final Rietveld refinement.
The fit was found to be much better in the case of the P2221 phase and has been
shown in Figure 4.5. The goodness of fit parameters were found to be Rwp = 6.1%,
Rp = 4.4%, and reduced Chi2 = 0.414. As mentioned above, even with the relaxed
coordinates the fit of the C2/m phase was poorer than that of the P2221 phase with
120
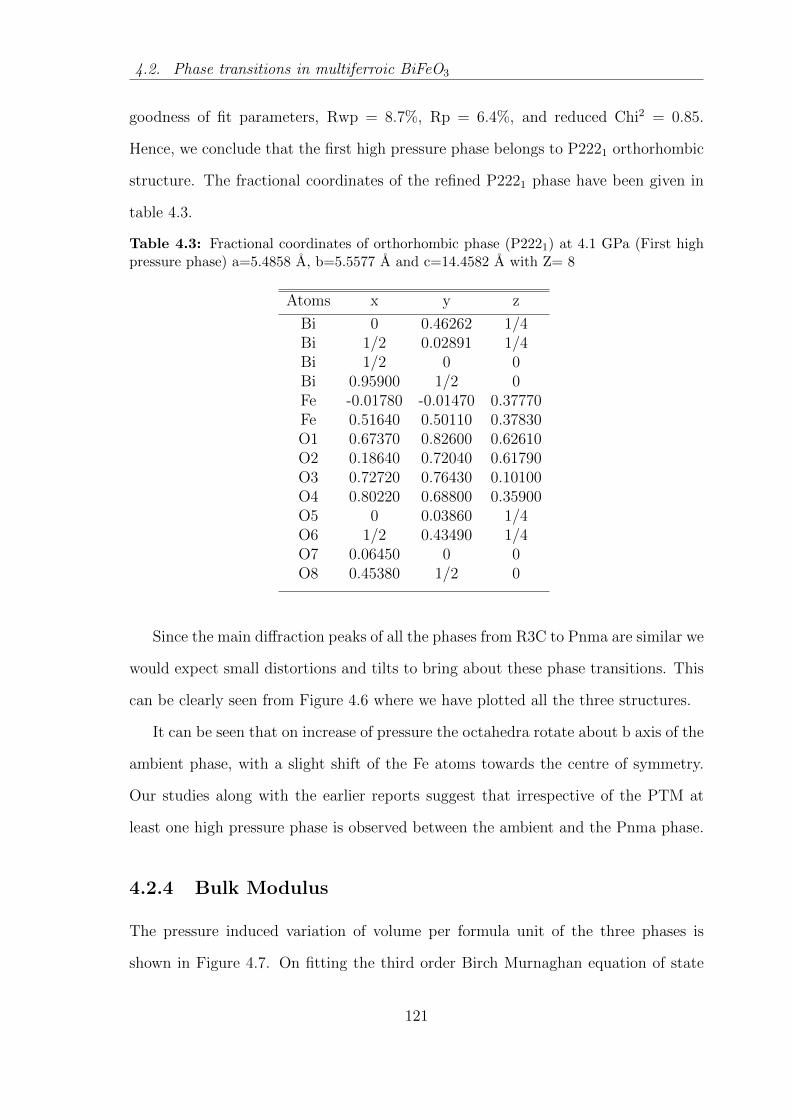
4.2. Phase transitions in multiferroic BiFeO3
goodness of fit parameters, Rwp = 8.7%, Rp = 6.4%, and reduced Chi2 = 0.85.
Hence, we conclude that the first high pressure phase belongs to P2221 orthorhombic
structure. The fractional coordinates of the refined P2221 phase have been given in
table 4.3.
Table 4.3: Fractional coordinates of orthorhombic phase (P2221) at 4.1 GPa (First highpressure phase) a=5.4858 A, b=5.5577 A and c=14.4582 A with Z= 8
Atoms x y z
Bi 0 0.46262 1/4Bi 1/2 0.02891 1/4Bi 1/2 0 0Bi 0.95900 1/2 0Fe -0.01780 -0.01470 0.37770Fe 0.51640 0.50110 0.37830O1 0.67370 0.82600 0.62610O2 0.18640 0.72040 0.61790O3 0.72720 0.76430 0.10100O4 0.80220 0.68800 0.35900O5 0 0.03860 1/4O6 1/2 0.43490 1/4O7 0.06450 0 0O8 0.45380 1/2 0
Since the main diffraction peaks of all the phases from R3C to Pnma are similar we
would expect small distortions and tilts to bring about these phase transitions. This
can be clearly seen from Figure 4.6 where we have plotted all the three structures.
It can be seen that on increase of pressure the octahedra rotate about b axis of the
ambient phase, with a slight shift of the Fe atoms towards the centre of symmetry.
Our studies along with the earlier reports suggest that irrespective of the PTM at
least one high pressure phase is observed between the ambient and the Pnma phase.
4.2.4 Bulk Modulus
The pressure induced variation of volume per formula unit of the three phases is
shown in Figure 4.7. On fitting the third order Birch Murnaghan equation of state
121

4. Structural Investigation of perovskites
Figure 4.5: Rietveld refined diffraction pattern of BiFeO3 at three different pressures(ambient, 5.0 GPa and 15.0 GPa) representing Rhombohedral (R3c), Orthorhombic (P2221)and (Pnma) symmetries respectively. For Rietveld refinement three contributions viz. fromBiFeO3, tungsten (gasket) and copper (the pressure marker) were used at each pressure. Thered, green and blue solid lines represent the calculated intensity, background and differencefrom observed data respectively while the black dots represent the experimental data.
[59] to all the three phases we found that the bulk moduli are as follows: R3c —
105.9±1.2 GPa, P2221— 110.5 ± 3.1 GPa, Pnma — 305.4±5.8 GPa. The pressure
derivative was fixed to be 4 in all the three cases. From these results we can see that
the R3c and P2221 phases have similar compressibility in contrast to the non polar
Pnma phase which is relatively incompressible. The bulk modulus of the R3c phase
is in close agreement with earlier determined values of 111 GPa [211] and 97 GPa
[213] respectively. However, using the PV data up to 40 GPa, Gavriliuk et al [212]
determined the bulk modulus of the R3c phase to be 75.5 GPa. Bulk modulus of
Pnma phase determined by us is in agreement with earlier studies [212, 213]. The
enhanced bulk modulus of Pnma phase is indicative of change in the nature of bonding
of BiFeO3 under pressure.
122

4.2. Phase transitions in multiferroic BiFeO3
Figure 4.6: (a) Crystal structure of BiFeO3 at ambient conditions. (b) The structureof the first high pressure phase (P2221). (c) Structure of the second high pressure phase(Pnma).
Figure 4.7: Observed variation in the volume (per formula unit) of BiFeO3 as a function ofpressure. Symbols represent the experimentally observed data while solid lines are obtainedfrom fitting the P-V data with third order Birch-Murnaghan equation of state.
4.2.5 Conclusion
Using synchrotron based angle dispersive x-ray diffraction measurements we have
studied the high pressure behavior of pervoskite BiFeO3. We report two structural
phase transitions under pressure viz, at ∼ 4.1 and ∼ 6.4 GPa. The Rietveld refinement
of the diffraction data suggest that both the high pressure phases are orthorhombic,
the first being P2221 and the second phase belonging to the space group Pnma. These
123

4. Structural Investigation of perovskites
results are in contrast to the previous studies such as the observation of monoclinic
phase below 10 GPa. The first high pressure phase has compressibility similar to
that of the ambient phase while the second high pressure phase becomes significantly
less compressible. Theoretical structural optimization in combination with Rietveld
refinement has helped to determine the accurate structure of the intermediate high
pressure phase.
4.3 Structural evolution of Sr2MgWO6
4.3.1 Structural Details
Sr2MgWO6 crystallizes into tetragonal crystal system with space group I4/m having
two number of formula units (Z=2) per unit cell. Its structure is made up of corner
sharing MgO6 and WO6 octahedra as shown in Figure 4.8. Along c axis these corner
sharing octahedra are linearly arranged while in the a-b plane these octahedra have
a particular tilt angle. Its lattice parameter at ambient conditions are a = 5.5791 A,
and c =7.9381 A.
4.3.2 Introduction
Sr2MgWO6, a double perovskite, is an analog compound to Sr2FeMoO6 which display
interesting coincident magnetic ordering, metal-insulator and a structural transfor-
mation [222, 223, 224, 225, 226]. Various compounds in this family are found to
have monoclinic, tetragonal and cubic structures and some of the compounds display
this sequence on increase of temperature. For example, Sr2MgWO6 transforms from
tetragonal to cubic structure (Fm3m) at high temperature. In contrast, Ca2MgWO6
and Sr2CaWO6 crystallize in the monoclinic structure (P21/n) at ambient conditions,
which transform first to the tetragonal structure (I4/m) and then to cubic structure
(Fm3m) on increase of temperature. It would be interesting to investigate whether
124

4.3. Structural evolution of Sr2MgWO6
Figure 4.8: Tetragonal crystal structure of Sr2MgWO6 at ambient conditions (Space groupI4/m).
these transformations are driven entirely by the changes in the inter-atomic distances,
which can also be easily brought about by subjecting the compounds to high pres-
sures. High pressure studies on Sr2CoWO6 shows favorable trend as it undergoes a
transition from tetragonal to monoclinic at 2.2 GPa. This has prompted us to inves-
tigate structural evolution of one of the simpler compounds of this double perovskite
family viz, without magnetic interactions, such as Sr2MgWO6. The results of the
experimental, synchrotron based x-ray diffraction and micro-Raman studies in this
compound are in accordance with first principles density functional reported in [227].
4.3.3 Methods
To synthesize Sr2MgWO6 appropriate amounts of SrCO3, MgO and WO3 were thor-
oughly homogenized and then heated at 1123 K for 24 h in a platinum boat. The
product obtained was further ground and pelletized (12 mm diameter and 810 mm
height) and heated at 1473 K for 30 h. The final product was characterized by pow-
der x-ray diffraction and it showed crystalline Sr2MgWO6 with a small amount of the
125
4. Structural Investigation of perovskites
SrWO4 impurity. The ambient structure of Sr2MgWO6 was confirmed to be tetrago-
nal (space group I4/m, Z=2) with lattice parameters, a = 5.5791 A and c = 7.9381 A
which compare well with the earlier reported values of a = 5.5876 A and c= 7.9490
A [228, 229].
For high pressure experiments finely powdered sample of Sr2MgWO6 was loaded
along with a few specs of copper in hole of ∼100 µm diameter drilled in a pre in-
dented (∼ 80 micron thick) tungsten gasket of a diamond-anvil cell (DAC). Methanol:
ethanol (4:1) mixture was used as pressure transmitting medium. The pressure was
determined from the known equation of state of copper[132]. High-pressure angle
dispersive x-ray-diffraction experiments, were carried out up to ∼ 28.0 GPa at the
5.2 R (XRD1) beamline of Elettra Synchrotron source with monochromatized x-rays
of λ = 0.68881 A. The diffraction patterns were recorded using MAR345 imaging
plate detector kept at a distance of ∼ 20 cm from the sample. Two-dimensional x-ray
diffraction patterns were transformed to one-dimensional diffraction profiles by the
radial integration of diffraction rings using the FIT2D software [95]. The Raman
spectra were recorded up to ∼ 40 GPa using our confocal micro Raman set up as
mentioned in chapter1.
4.3.4 Results and Discussion
Figure 4.9 shows the x-ray diffraction patterns of Sr2MgWO6 at a few representative
pressures. The ambient diffraction pattern has been indexed with respect to tetrag-
onal phase and the x-ray diffraction peaks marked as Cu and W represent the peaks
due to copper (the pressure marker) and tungsten (gasket) respectively.
Due to the fact that c ∼√
2a, several diffractions peaks coincidentally overlap and
in these cases only the dominant (hkl) is indicated. On application of pressure up
to ∼10 GPa all the x-ray diffraction peaks shift towards higher two-theta values. On
further raising the pressure the pairs of coincidentally overlapping diffraction peaks
126

4.3. Structural evolution of Sr2MgWO6
Figure 4.9: Diffraction pattern of Sr2MgWO6 at a few representative pressures. Peaksmarked as (hkl), W and Cu are from the sample, gasket and pressure marker respectively.Asterisk (*) represents the impurity peak.
viz., (002), (110), (103), (121), (004), (220) and (204), (312), observed at ∼ 9.9◦,
16.5◦, 20◦ and 24.6◦, show increasing separation. No other significant changes were
observed in the diffraction pattern up to ∼28 GPa. The structural evolution was
determined by carrying out Rietveld refinement using GSAS [96] on all the recorded
diffraction patterns. For this the diffraction profiles were analyzed using three phases
viz., tetragonal Sr2MgWO6, copper (pressure marker) and tungsten (gasket). Refine-
ment showed excellent fitting, e.g., RP=2.7%, RWP=4.1 % and RF2=9.9 % at the
ambient pressure. Figure 4.10 shows the Rietveld refinement of diffraction pattern
recorded at ambient conditions.
Figure 4.11 shows the variation of normalized lattice parameters i.e. a/a0 and c/c0
with pressure, establishing that the increased splitting of coincidentally overlapping
127

4. Structural Investigation of perovskites
Figure 4.10: Rietveld refinement of diffraction pattern at ambient conditions. The diffrac-tion pattern consists of contributions from Sr2MgWO6, tungsten gasket and Cu pressuremarker.
peaks is due to different compressibility along of a and c axes.
The anisotropic compressibility can in principle bring about significant electronic
properties changes, as observed in the Sr2FeMoO6 by Zhao et al [230]. However the
density of states (DOS) calculation on this compound as reported in [227]does not
show any appreciable change up to 100 GPa. On release of pressure all the results
display reversibility. Figure 4.12 shows the observed variation of V/V0 with pressure,
which when fitted to the third order Birch-Murnaghan equation of state gives the bulk
modulus and its pressure derivative to be 128 ± 4 GPa and 7.74±0.7 respectively.
The experimentally determined lattice parameters and volume are in agreement
with that obtained from computed one [227]. The experimentally determined bulk
modulus is also in agreement with the one obtained by fitting the energy-volume Birch
Murnaghan equation of state i.e. 132.6 GPa. Figure 4.13 shows the observed pressure
induced variations of two prominent Raman active modes of Sr2MgWO6 (viz., at 452
cm−1 and 857 cm−1, which correspond to bending and W-O stretching modes respec-
128

4.3. Structural evolution of Sr2MgWO6
Figure 4.11: Variation of normalized lattice parameters with pressure. Symbols representthe experimental data and the solid lines represent the computed data taken from Mishraet al. 2010
tively [231]. The Raman scattering measurements were carried out up to 40 GPa and
show no unusual change indicative of a transformation. Using the observed value of
the bulk modulus (i.e., 128 GPa) the Grneisen parameters [γ =[(B/ω)*(dω/dp)]] are
determined to be 0.56 and 0.73 for the modes mentioned above.
The structure of Sr2MgWO6 is made up of alternate corner shared octahedral
i.e. WO6 and MgO6. In a-b plane these octahedra are connected through O1 atoms
(ambient fractional co-ordinates (0.7709, 0.7117, 0.0)) and along the c-axis these are
connected by O2 atoms (ambient fractional co-ordinates (0.0, 0.0, 0.2548)). Due to
the special positions occupied by the Mg, O2 and W atoms along the c-axis, the bond
angle Mg-O2-W is constrained to remain 180◦. In contrast the calculated Mg-O1-W
129

4. Structural Investigation of perovskites
Figure 4.12: The observed P-V variation fitted with Birch- Murnaghan (B.M.) equationof state (red) for Sr2MgWO6. Symbols represent the observe data. Dash-dot line representsthe results of our first principles calculations taken from Mishra et al. 2010 for comparison.
bond angle at the ambient conditions is 163.3◦. Therefore, one may expect that
compression of Mg-O2 and W-O2 bonds may be more than Mg-O1 and W-O1 bonds,
as some compression may be accommodated by further bending of Mg-O1-W angle.
This is in accordance with the first principles calculations [227]. It has been shown
that this angle reduces slightly, to 154.7◦ at ∼ 100 GPa. However, the computed
variation of different cation-oxygen (i.e. Mg-O1, Mg-O2; W-O1, W-O2) bond lengths
shows that the Mg-O2 and W-O2 bonds are less compressible compared to Mg-O1
and W-O1 bonds, as shown in Ref. (SrMg paper) [227]. We speculate that the two
bonds formed by oxygen atom in the linear geometry are less compressible because
the presence of lone pair of oxygen atom heightens the repulsion on compression.
130
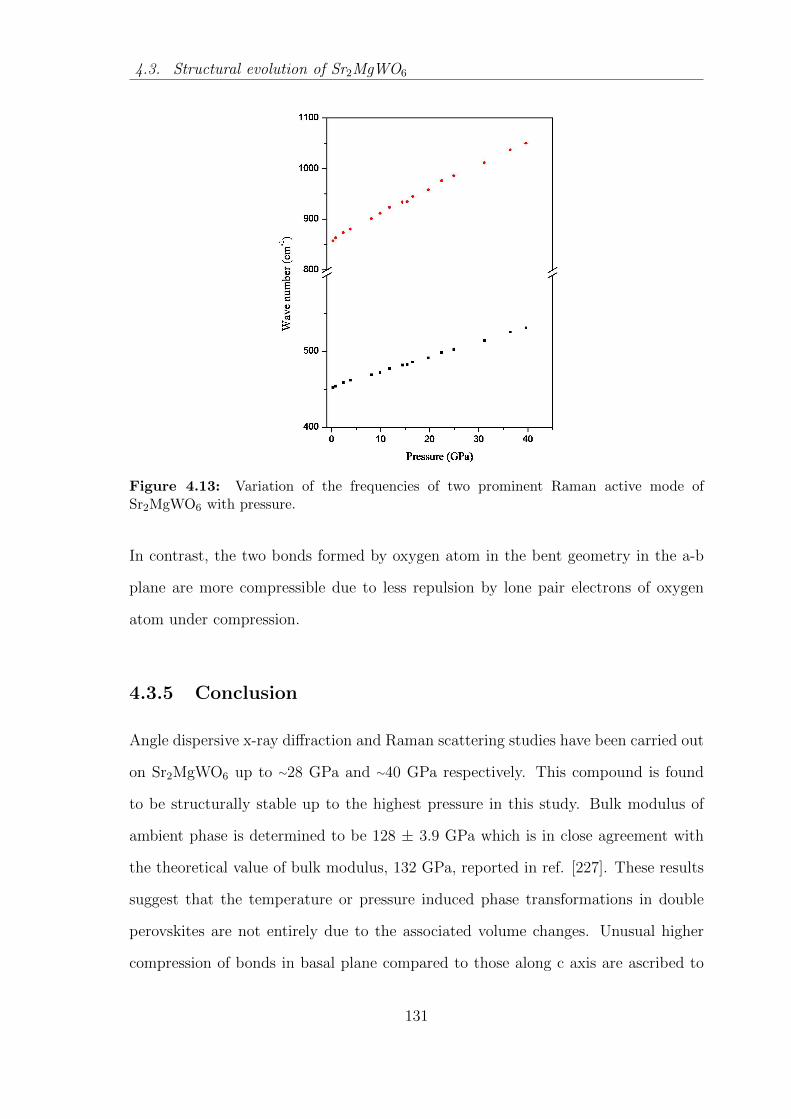
4.3. Structural evolution of Sr2MgWO6
Figure 4.13: Variation of the frequencies of two prominent Raman active mode ofSr2MgWO6 with pressure.
In contrast, the two bonds formed by oxygen atom in the bent geometry in the a-b
plane are more compressible due to less repulsion by lone pair electrons of oxygen
atom under compression.
4.3.5 Conclusion
Angle dispersive x-ray diffraction and Raman scattering studies have been carried out
on Sr2MgWO6 up to ∼28 GPa and ∼40 GPa respectively. This compound is found
to be structurally stable up to the highest pressure in this study. Bulk modulus of
ambient phase is determined to be 128 ± 3.9 GPa which is in close agreement with
the theoretical value of bulk modulus, 132 GPa, reported in ref. [227]. These results
suggest that the temperature or pressure induced phase transformations in double
perovskites are not entirely due to the associated volume changes. Unusual higher
compression of bonds in basal plane compared to those along c axis are ascribed to
131

4. Structural Investigation of perovskites
the presence of lone pair of electrons of oxygen. In contrast to this the compound
Sr2CaWO6 undergoes a phase transition on application of pressure [231]. It is inter-
esting to note that the smaller size of the cation Mg2+ with respect to Ca2+ may be
playing a role in the behavior of this material under high pressure.
4.4 Structural stability of BaLiF3
4.4.1 Introduction
BaLiF3 crystallizes in the cubic inverse perovskite structure. The high pressure struc-
tural stability of some group I-II flouro perovskites have been investigated, but there
is no experimental study on the structural stability of the I-II fluorides with the
inverse-perovskite structure. In the only high pressure study (limited to 20 GPa)
on BaLiF3, Korba et al. have calculated its electronic structure, density of states
and optical properties using density functional theory based on FP-LAPW method
[232]. With the help of their calculations they predicted that the valence band width
of BaLiF3 increases monotonically with pressure. Recent experiments and ab-initio
calculations on perovskite structured KMgF3 [48] and CsCdF3 [233] show that they
are structurally stable upto 40 and 60 GPa respectively and their pressure induced
band gap variation is similar to that of BaLiF3 [232]. In BaLiF3 the centre of the F−
octahedron is occupied by the small Li+ ion compared to the other cubic perovskites
where this position is occupied by the bigger B+2 cation. The smaller size of the
Li+ ion in the F− octahedral cage results in a larger anharmonicity of the Li+ ion.
Phase transitions in non-cubic NaMgF3 have been attributed to the anharmonicity
of the F− ion. Hence it is possible that even BaLiF3 may become structurally un-
stable at pressures higher than 20 GPa. Recently Xiao et al [234] have shown that
cubic perovskite PbCrO3 transforms to an iso-structural cubic form at ∼ 1.6 GPa.
This transition may be attributed to the presence of the transition metal ion at the
132

4.4. Structural stability of BaLiF3
centre of the octahedron. Hence to determine and compare the structural stability of
the cubic inverse-perovskite fluoride with the perovskite structured fluorides I have
carried out high pressure x-ray diffraction experiments up to 50 GPa.
4.4.2 Methods
Stoichiometric amounts of dried LiF (Riedel de Haen, 99 %) and BaF2 (Alfa 99.9%)
were homogenized and pelletized in an inert atmosphere. The pellets were wrapped
in a platinum foil and were sealed in a fused quartz tube in argon atmosphere and
were heated at 750 ◦C for 4 hrs. The heating and cooling was carried out very slowly
(5◦C/min). BaLiF3 thus obtained was characterized using powder x-ray diffraction.
In agreement with earlier studies its structure was found to be cubic inverse-perovskite
with (Space group No = 221, Pm3m) lattice parameter a = 3.995 A [52].
For the high pressure experiments, finely powdered sample of BaLiF3 along with a
few specs of copper was loaded in a hole of ∼100 µm diameter drilled in a pre-indented
(∼ 80 micron thick) tungsten gasket of a diamond-anvil cell (DAC). Methanol: ethanol
(4:1) mixture was used as a pressure transmitting medium. The pressure was deter-
mined from the known equation of state of copper [132]. High-pressure angle dis-
persive x-ray-diffraction experiments were carried out up to ∼ 50 GPa at the 5.2 R
(XRD1) beamline of Elettra Synchrotron source using monochromatized x-rays of
λ = 0.6888 A. The diffraction patterns were recorded using the MAR345 imaging
plate detector kept at a distance of ∼ 20 cm from the sample. Two-dimensional x-ray
diffraction patterns were transformed to one-dimensional diffraction profiles by the
radial integration of diffraction rings using the FIT2D software [95].
133
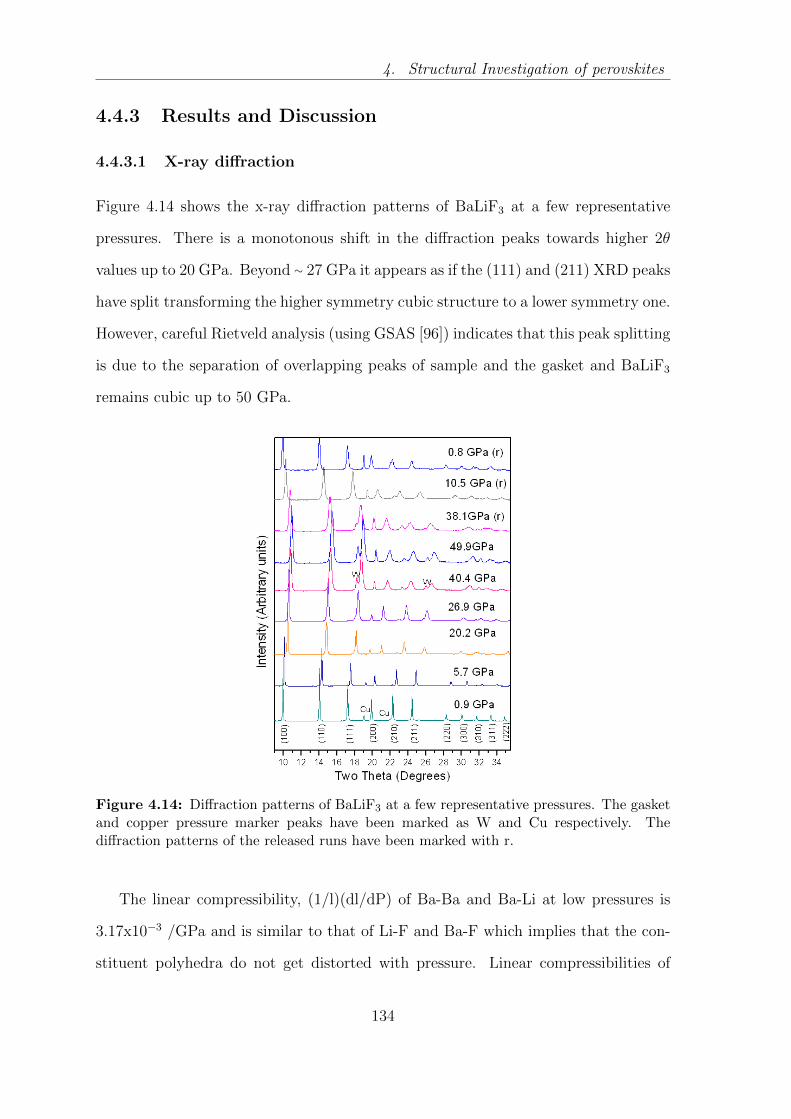
4. Structural Investigation of perovskites
4.4.3 Results and Discussion
4.4.3.1 X-ray diffraction
Figure 4.14 shows the x-ray diffraction patterns of BaLiF3 at a few representative
pressures. There is a monotonous shift in the diffraction peaks towards higher 2θ
values up to 20 GPa. Beyond ∼ 27 GPa it appears as if the (111) and (211) XRD peaks
have split transforming the higher symmetry cubic structure to a lower symmetry one.
However, careful Rietveld analysis (using GSAS [96]) indicates that this peak splitting
is due to the separation of overlapping peaks of sample and the gasket and BaLiF3
remains cubic up to 50 GPa.
Figure 4.14: Diffraction patterns of BaLiF3 at a few representative pressures. The gasketand copper pressure marker peaks have been marked as W and Cu respectively. Thediffraction patterns of the released runs have been marked with r.
The linear compressibility, (1/l)(dl/dP) of Ba-Ba and Ba-Li at low pressures is
3.17x10⁻³ /GPa and is similar to that of Li-F and Ba-F which implies that the con-
stituent polyhedra do not get distorted with pressure. Linear compressibilities of
134

4.4. Structural stability of BaLiF3
different cation-anion bonds in the cubic perovskite CsCdF3 were also found to be
equal (2.6 x10⁻³/GPa) indicating that the cation-anion bonds of the perovskites and
inverse-perovskites have similar compressibilities. On the basis of relative compress-
ibilities of the AX12 and BX6 polyhedra Ross et al [200] have formulated some general
rules for predicting phase transitions in oxide perovskites. Assuming that the addi-
tional valence sum mismatch induced by pressure at both the A and B cation sites is
same they have stated that if
βA / βB= MB/MA >1 the tilt angle of polyherda are reduced and perovskite struc-
ture becomes more symmetric
< 1 the tilt angle of polyherda increases resulting in symmetry lowering phase tran-
sitions
=1 the degree of distortion of the structure would not change with pressure (4.3)
(where β respresents the compressibility of the two polyhedra and M- represents the
variation of the bond valence sum at the cation of the polyhedra, due to change in
the average bond distance ).
While making these formulations they [235] have assumed that the additional sum
mismatch induced by pressure is same at both the A and B cation sites and therefore
βA/βB = MB/MA. However, as βA/βB for both compounds is equal to 1, but MA/MB
is ∼2.828 and ∼ 0.7 for BaLiF3 and CsCdF3 respectively, the relation βA/βB = MB/MA
does not hold for this class of compounds. Also, as seen in Figure 4.15 the additional
valence sum mismatch ∆Vi (i = A, B) due to application of pressure is not equal
at both the cation sites for BaLiF3 (Here Mi = (-Ri (dVi/dRi) ; Ri is average bond
distance, <Vi> is the total bond valence sum at the central cation I calculated on
135

4. Structural Investigation of perovskites
the basis of the average bond length). This indicates that the assumptions made by
Zhao et al [235] (i.e. the additional valence sum mismatch induced by pressure is
the same at both the A and B cation sites) cannot be extended to the perovskites
and inverse-perovskites crystallizing with the cubic structure and hence the ratio of
MA/MB cannot be used as a reliable predictor of their compression behavior.
Figure 4.15: The additional valence sum mismatch at both (Ba, Li) cation sites (∆Vi (i= A, B) as a function of pressure.
The bulk modulus K0 = 75.9 ± 1.3 GPa and its pressure derivative K′ = 5.35±
0.15 were determined by fitting the third order Birch-Murnaghan equation of state
[59] to the observed pressure induced variation of volume [Figure 4.16]. Using the
elastic constants measured by Shimamura et al. [236] the bulk modulus is calculated
to be K0 ∼ 74.3 GPa, close to our experimental value.
4.4.3.2 Bulk modulus by empirical methods
The bulk modulus of a material depends on the bulk moduli of the constituent poly-
hedra and the network structure linking these polyhedra. In the case of corner linked
structures the bulk moduli are known to be significantly less than their constituent
polyhedra because of the bending of linkages and not due to compression of the poly-
136
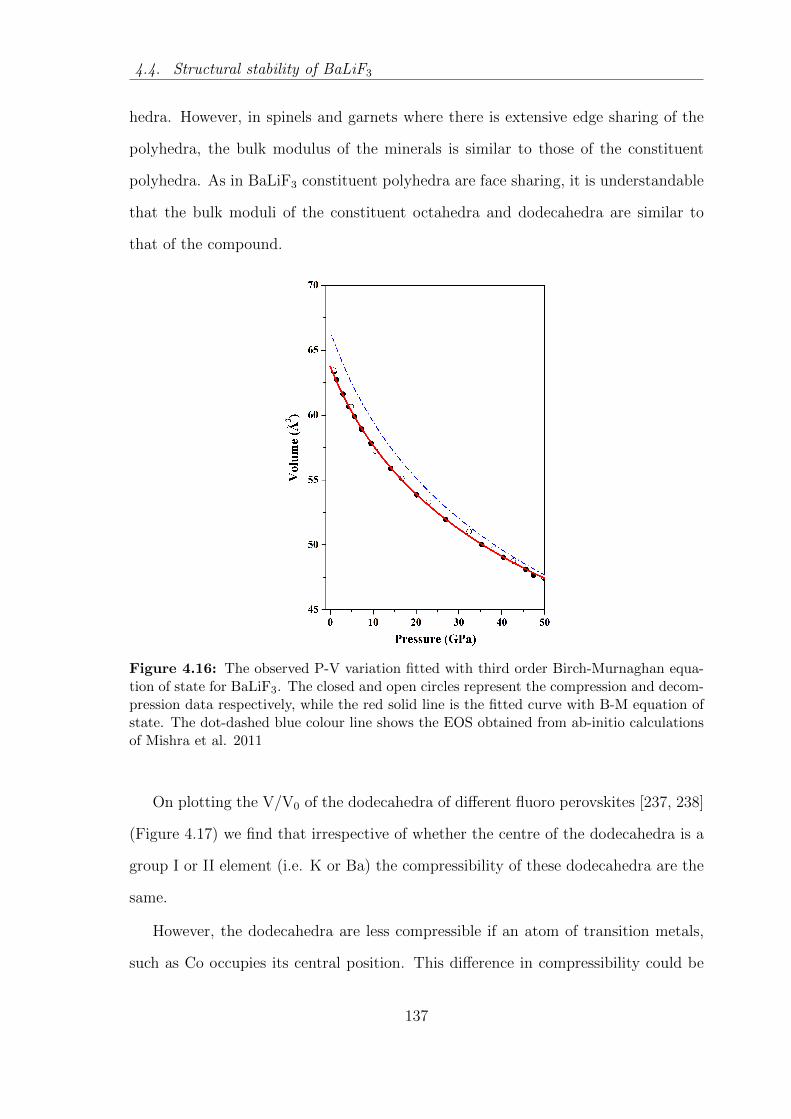
4.4. Structural stability of BaLiF3
hedra. However, in spinels and garnets where there is extensive edge sharing of the
polyhedra, the bulk modulus of the minerals is similar to those of the constituent
polyhedra. As in BaLiF3 constituent polyhedra are face sharing, it is understandable
that the bulk moduli of the constituent octahedra and dodecahedra are similar to
that of the compound.
Figure 4.16: The observed P-V variation fitted with third order Birch-Murnaghan equa-tion of state for BaLiF3. The closed and open circles represent the compression and decom-pression data respectively, while the red solid line is the fitted curve with B-M equation ofstate. The dot-dashed blue colour line shows the EOS obtained from ab-initio calculationsof Mishra et al. 2011
On plotting the V/V0 of the dodecahedra of different fluoro perovskites [237, 238]
(Figure 4.17) we find that irrespective of whether the centre of the dodecahedra is a
group I or II element (i.e. K or Ba) the compressibility of these dodecahedra are the
same.
However, the dodecahedra are less compressible if an atom of transition metals,
such as Co occupies its central position. This difference in compressibility could be
137

4. Structural Investigation of perovskites
Figure 4.17: Pressure induced variation of normalized volume of KF12 and BaF12 poly-hedra for several fluoro-perovskites. For KZnF3 and KMgF3 the data are from referenceAguado et al. 2008 while for KCoF3 data was taken from Aguado et al. 2009. BaLiF3 datais from the present high pressure x-ray diffraction experiments.
due to the presence of d electron bonding in the Co-F bond.
Hazen et al derived a semi-empirical formula (using the data for several metal
oxides and silicates) for estimating the bulk moduli of polyhedral compounds [239]
by relating it to the cation charge density of its constituent polyhedra. For these
compounds the polyhedral compressibilities are proportional to the average polyhe-
dral volumes divided by the formal charges of the cations. Hazen et al [239] found
that K0 (in GPa) is (750 *Zi ) /d3, where Zi is the cationic formal charge and d is the
mean cationanion distance (in A). However, fitting the experimentally determined
bulk moduli of several scheelite-structured compounds as a function of the A cationic
charge per unit volume of the AO8 polyhedra, Errandonea et al found that K0 (GPa)
is (610 *Zi) /d3 [240]. The difference in coefficients of the above two formulations
arose because Errandonea et al included only scheelite and scheelite-like structures
while Hazen et al included a more diverse set of compounds. In both these formula-
tions the more compressible polyhedron was used for determining the bulk modulus.
Since the fluoro-perovskites also are made up of a network of polyhedra we tried to
138

4.4. Structural stability of BaLiF3
Table 4.4: Bulk Modulii of various fluoro-perovskites determined from x-ray diffractiondata as well as from the known elastic constants of these compounds. Bulk moduli calculatedusing semi-empirical formulation of Hazen et al and Errandonea et al are shown. Since boththe octahedra and dodecahedra have the same compressibilities the bulk modulii have beencalculated using the polyhedral cation formal charge and mean cationanion distance (inA) of both the polyhedra (shown in column 7-10 of this table). It can be seen that thebulk moduli calculated from our fit to the Scotts formulation 60 K0=(Y-Zλ)(V0)n where n= 0.1387, Y = 25.28 and Z = - 42.57 gives the closest agreement with the experimentalvalues.
Material Lattice K0 K0 ’ Bulk Bulk K0 K0 K0 K0
parameter (exp) modulia modulib (Octa (Octa (dodeca (dodeca(A) hedra)c hedra)d hedra)c hedra)d
CsCdF3 4.4669 79 3.8 62.9 74.7 13.5 110 67 55KMgF3 3.989 71.2 4.7 70.4 75.3 189 154 95 77BaLiF3 3.995 e 75.9e 5.4 74.3 75.4 94.9 77.2 67 54KZnF3 4.053 77 79.9 75.8 180 147 90 73
NaMgF3 3.833 75 f 74.1 213 173 107 87RbCaF3 4.455 50.4 78.7 135 110 68 55CsCaF3 4.526 50.8 79.2 129 105 23 19KMnF3 4.182 64.7 76.7 164 133 29 24KFeF3 4.120 f 76.3 172 140 30 25KCoF3 4.071 78.7 75.9 178 145 31 26KNiF3 4.012 85.1 75.9 186 151 33 27
determine the bulk modulus of barium lithium fluoride using the formulation of both
Errandonea et al and Hazen et al. As both the polyhedral units of this compound
have the same compressibility, bulk modulus determined using either of the polyhe-
dra should give us the same result. However, as can be seen from table 4.4, the bulk
modulus calculated using the octahedra is very different from that determined from
the experiments.
These results imply that we cannot use the semi-empirical formulation of Hazen
[239] and Errandonea [240] to predict the bulk moduli of flouro perovskites. Hence
ain (GPa)From elastic constantsbCalculated using out fit to Scotts’s formulationcCalculated as per Hazen et al.dCalculated as per Errandonea et al.eFrom Mishra et al. 2011(BaliF3)findicates unavailability of elastic constants data.
139
4. Structural Investigation of perovskites
in order to predict the correct bulk modulus with the help of a semi-empirical for-
mulation we used the fact that the bulk moduli can be related to the ambient pres-
sure molar volume as suggested by Ming et al [241]. Using this correlation and
semi-theoretical formulation of Scott et al [242], we have fitted the relation K0 =
(Y-Zλ)(V0)n where λ is the Cohen polarization factor [243], V0 is the molar volume
(cm3mol−1), and Y, Z and n are the parameters obtained by fitting the known ex-
perimental values of different fluoro-perovskites. The fitted values of n,Y and Z are
0.1387, 25.28 and -42.57 respectively. Using our fitted values we have calculated the
bulk moduli of several fluoro-perovskites (tabulated in the sixth column of table 4.4).
The values of bulk moduli appear to be in agreement with the earlier experimentally
observed values. Till date the bulk moduli of a few fluoro-perovskites have been de-
termined using the equation of state. However, since the elastic constants of several
of these compounds were known [244] we calculated their bulk moduli, which are
shown in column 5 of table 4.4. From this table we can see that though there is
a large difference (25%) in the bulk moduli, determined from elastic constants and
equation of state for CsCdF3 the difference from our calculated value is small i.e.,
∼ 5%. This gives us the confidence that we can predict the bulk moduli of differ-
ent fluoro-perovskites using our fit to Scotts semi-empirical formulation [242]. Since
there is a large discrepancy in the bulk moduli of CsCaF3 and RbCaF3 (table 4.4) we
feel that x-ray diffraction experiments should be carried out on these compounds to
determine their bulk moduli..
4.4.3.3 Comparison with calculations
The experimentally determined bulk modulus (75.9 GPa) of BaLiF3 by our studies is
in close agreement with that obtained from elastic constants (73.9 GPa). It is also in
agreement with the one obtained from fitting the third order B-M equation of state
to computed E-V data (69.4 GPa) as reported in [245]. I have also compared the
140

4.4. Structural stability of BaLiF3
Table 4.5: Ambient pressure elastic constants and moduli of ALiF3 (A= Ba, Sr, Ca) deter-mined from GGA ab-initio computations. For comparison the experimentally determinedelastic constants of BaLiF3 from Boumriche1994 have also been tabulated.
Material K0=1/3 EOSa C11 C12 C44 C12/C44 G K/G(C11+2C12) (GPa) (GPa) (GPa) (GPa)
(GPa)
BaLiF3 73.9 69.4 136.4 42.8 47.1 0.91 47.02 1.57130b 46.5b 48.7b
CaLiF3 85.31 75.9 179.5 38.2 45.8 0.83 54.55 1.56SrLiF3 72.07 68.1 157.2 38.5 48 0.80 52.2 1.49
results from isostructural compounds SrLiF3 and CaLiF3. Table 4.5 indicate that all
the three inverse perovskites have similar compressibility.
The Variation in the elastic constants under pressure can provide useful informa-
tion about changes in the stability and stiffness of material. Cubic lattices have only
three independent constants, namely C11, C12 and C44. Calculated values at ambient
pressure are given in Table 4.5. It can be seen that for BaLiF3 these are in close
agreement with experimentally determined values [232]. For all the three compounds
the ratio C12/C44 is almost close to unity as predicted by the Cauchys law and this
indicates that the short range potentials are almost spherically symmetric.
Table 5.6 shows that the calculated elastic constants for the perovskite fluorides
are found to obey the modified stability criterion [247] (given below) for cubic crystals
under finite strain corresponding to pressures of ∼ 84 GPa i.e.,
M1 = (C11 + 2C12)/3 + P/3 > 0 (4.4)
M2 = C44 − P > 0 (4.5)
M3 = (C11 − C12)/2− P > 0 (4.6)
aimplies Bulk modulus determined from EOS obtained by ab-initio density functional calculationsas reported in A. K. Mishra et al. [245]
bshows that elastic constants taken from experimental data of reference [246]K is bulk and G isshear modulus
141

4. Structural Investigation of perovskites
Table 4.6: Derived elastic constants characterizing mechanical stability (Mi eqs. 1-3)of BaLiF3 at different pressures, calculated from GGA ab-initio computations reported inMishra et al. 2011
Pressure (GPa) K/G M1 M2 M3
0.0 1.57 73.9 47.13 46.791.74 1.65 79.94 46.67 45.539.09 1.59 100.56 53.49 50.8620.52 1.66 141.16 62.55 57.6738.58 1.73 201.03 74.45 63.9448.55 1.75 231.75 80.13 66.8667.74 1.79 290.98 90.03 71.7484.24 1.82 340.75 97.51 74.36
The angular character of atomic bonding can be described by the Cauchy pressure
(C12-C44). If this pressure is negative then the material is nonmetallic with directional
bonding and if it is positive then the material is expected to be metallic [248]. This
has been verified for ductile materials like Nickel and Aluminium and also for brittle
materials like Silicon. The fluorides that we have studied have a negative Cauchy
pressure at ambient condition, which increases towards positive values on application
of pressure.
Although the large bandgap of BaLiF3 at high pressures shows that it is still an
insulator, this change in sign of the Cauchy pressure could be indicative of reduction
in the angular character of the bonding. In fact for BaLiF3 we have observed that its
sign changes around 21 GPa where the increase in the band gap is very gentle and
then beyond 38 GPa the band gap starts decreasing, as mentioned in [245].
The plastic properties of materials can be linked by their elastic moduli using
pugh indicator (K/G). The shear modulus (G) of materials represents the resistance
to plastic deformation [249]. K/G ratio greater than 1.75 and poissons ratio greater
than 0.33 are associated with ductility of a material [250]. Our studies show that
Cauchy pressure, K/G and poissons ratio (ν) (Table 4.6) of BaLiF3 increases with
pressure indicating that application of pressure reduces the brittleness and angular
142

4.4. Structural stability of BaLiF3
nature of bonding of BaLiF3. Our studies also indicate that brittleness of BaLiF3 <
CaLiF3∼ SrLiF3.
4.4.4 Conclusions
High pressure x-ray diffraction studies on inverse-perovskite BaLiF3 show that this
compound is structurally stable up to ∼ 50 GPa. The bulk modulus of BaLiF3 is
determined to be 75.9 GPa which is in close agreement with that determined from semi
empirical formulation. Amongst the three alkaline earth fluoro perovskites (ALiF3,
A=Ba, Ca, Sr) which crystallize in the inverse -perovskite structures, BaLiF3 is the
least brittle at ambient conditions and also the degree of brittleness decreases at high
pressures. Since these fluorides do not undergo any structural phase transitions at
high pressures they can be used as an alternative pressure marker. By fitting the
observed pressure induced variation of volume with the third order Birch-Murnaghan
equation of state K0 and K′ were determined to be ∼75.9 ± 1.3 GPa and 5.35± 0.15
respectively. It has been shown that the compressibility of the perovskite and inverse-
perovskite fluorides is similar. The behavior of the elastic constants at high pressure
with apparent reduction in the band gap as reported in [245] indicates a decrease
in the directional nature of the bonding. Our studies also indicate that the ratio of
MA/MB cannot be used as a reliable predictor of the compressional behavior of cubic
inverse perovskites.
143

4. Structural Investigation of perovskites
144

5
Pressure induced phase
transformation in U2O(PO4)2
The phosphate materials having open framework structures and interlinked polyhe-
dral motif are well known for their geophysical importance. Under compression such
open structures may collapse which result in the rotation and/or distortion of con-
stituent polyhedral units. The high pressure structural investigations of these open
framework materials are therefore of interest from the point of view of basic material
research. U2O(PO4)2 is an important material with the potential applications in the
field of nuclear waste disposal [251]. In this chapter I have presented the high pressure
investigations on this material.
5.1 Introduction
The materials having framework structures display a large number of phase tran-
sitions due to different compressibilities of the constituent polyhedra and also due
to ease of bending across the polyhedral linkages. Prominent among this class of
materials are α-SiO2 (quartz), α-AlPO4, α-GaPO4, α-GeO2, etc., which are re-
ported to undergo pressure-induced phase transitions to higher coordinated structures
145

5. Pressure induced phase transformation in U2O(PO4)2
[252, 253, 254, 255] . Among these, the compounds having PO4 tetrahedra are found
to show interesting structural changes. For example, in α-AlPO4, AlO4 tetrahedra
are more easily transformed to octahedrally coordinated AlO6 resulting in the trans-
formation to orthorhombic Cmcm phase at ∼ 12 GPa. In contrast, the more rigid
PO4 retains its tretrahedral coordination to quite high pressures i.e. upto ∼ 70 GPa
[254, 255].
Diuranium oxide phosphate (U2O(PO4)2) belongs to a family of tetravalent metal
oxide phosphate which are represented by M2O(PO4)2 (where M=U, Zr, Th, etc.).
These compounds are used as thermal-shock resistant ceramics, composites and are
also considered as potential candidates for the long-term storage of nuclear waste due
to their low solubility in water [251, 256]. These materials are also of interest in
areas of ion exchange [257, 258] and protonic conduction [259, 260]. Due to the open
framework structure, these compounds can also provide some zeolitic features, such as
accessible open spaces, rigid frameworks, chemical/thermal stability, size and shape
selectivity and catalytically active sites [261, 262]. In particular, diuranium oxide
phosphate, iso-structural to Zr2O(PO4)2 (an ultra-low expansion ceramic), shows a
continuous thermal contraction [263].
At ambient conditions, U2O(PO4)2 exists in the orthorhombic structure with space
group Cmca (space group no.= 64) [264]. Earlier studies on its sintered rods implies
that U2O(PO4)2 has macroscopic negative thermal expansion (NTE) in the temper-
ature range 20-1000◦C [263]. However, subsequent studies [265] showed that it has
anisotropic thermal expansion behaviour; positive thermal expansion in [100] and
[001] directions and negative thermal expansion in [010] direction. Recent neutron
diffraction as well as x-ray diffraction studies have shown that its negative thermal
expansion behavior results mainly from a polyhedra rocking mechanism, somewhat
similar to what is now believed to be the cause of NTE in monodentate framework
structures such as α-ZrP2O7 [266] and ZrW2O8 [267].
146

5.2. Structural Details
In the recent years, the behaviour of several compounds which display nega-
tive thermal expansion such as Al2(WO4)3 [268], Sc2(WO4)3 [269], Y2(WO4)3 [270] ,
Zr(WO4)2 and Hf(WO4)2 [271, 272, 273] etc. has been investigated under pressure.
These studies suggest that for these compounds K′ (derivative of bulk modulus) is
either negative or very small [274]. These compounds also show many interesting
intermediate structural phase transformations before eventual amorphization at high
pressures.
As U2O(PO4)2, a NTE material, is made up of UO7 polyhedra and PO4 tetrahedra
it would be interesting to explore the nature of structural changes resulting from the
relative compressibilities of polyhedra under pressure. Our high pressure Raman and
x-ray diffraction studies on this compound up to 14 GPa and 6.5 GPa respectively
indeed reveal new high pressure phases of this compound.
5.2 Structural Details
Figure 5.1: Edge Shared UO7 (pentagonal bipyramids) and PO4 (tetrahedra) as inU2O(PO4)2.
The diuranium oxide phosphate crystallises into orthorhombic symmetry with
space group Cmca (space group no., 64). In this structure, distorted UO7 pentagonal
bi-pyramids share an O(1)-O(1) edge with three equivalent PO4 tetrahedra as shown
in Figure 5.1 and Figure 5.2 These pentagonal bi-pyramids are tightly connected as
147

5. Pressure induced phase transformation in U2O(PO4)2
Figure 5.2: The parent orthorhombic structure as viewed along [100].
pairs in the (100) plane by strong U-O(3)-U bridging and form infinite zigzag chains
along [100] by sharing O(1)-O(1) edges. The PO4 tetrahedra also share corners with
UO7 polyhedra.
5.3 Methods
5.3.1 Synthesis
The diuranium oxide phosphate has been synthesized using wet chemical route, as
given in reference [264]. To begin with, uranium metal is dissolved in 6M HCl to make
a concentrated solution of tetravalent uranium. This solution is then mixed with con-
centrated phosphoric acid (5M H3PO4), at room temperature. This mixture is evap-
orated and annealed under argon flow. Annealing under argon environment prohibits
the oxidation of U2O(PO4)2 and consequent formation of triclinic UIV (UV IO2)(PO4)2,
which otherwise takes place in air at ≥ 300 ◦C [275]. Thus prepared sample has been
characterised using x-rays of wavelength 0.71069 A obtained from rotating anode
generator x-ray source with molybdenum target in our laboratory. The sample was
found to crystallize into orthorhombic crystal structure. The unit cell parameters of
U2O(PO4)2 are determined to be a = 7.052 ± 0.003 A, b = 8.991 ± 0.004 A and c
= 12.673 ± 0.004 A as deduced from the observed powder x-ray diffraction pattern
148

5.3. Methods
of the above prepared sample. These values are in close agreement with the unit cell
parameters (a = 7.087 A, b = 9.036 A, c = 12.702 A) published earlier [264].
5.3.2 Experiemntal Details
The powdered sample of U2O(PO4)2 was loaded in a hole of ∼130 m diameter of a
tungsten gasket which was pre-indented to a thickness of 80 µm in a MaoBell type of
diamond anvil cell [76]. Raman scattering experiments have been carried out under
quasi-hydrostatic as well as non-hydrostatic pressures. For quasi-hydrostatic mea-
surements, 4:1 methanolethanol mixture was used as a pressure transmitting medium.
In the Raman experiments ruby R-lines were used for the pressure calibration [131],
whereas for the x-ray diffraction experiments platinum was used as a pressure marker.
In the latter case, the pressure on the sample was deduced using the equation of state
of platinum [132].
For Raman measurements, we have used our indigenous micro Raman system with
confocal optics. The Raman scattered light from the sample, which is excited by 532
nm laser line of the diode-pumped solid state laser, is collected using a CCD based
single stage spectrograph and a super-notch filter. The Raman modes in the spectral
range 180-1200 cm1 have been recorded as a function of pressure up to 14 GPa. Neon
(Ne) and Mercury (Hg) lines were used for calibration purpose.
Angle dispersive x-ray diffraction measurements have been carried out using Mo
(Kα) monochromatized x-rays (λ= 0.71069 A) from a Rigaku rotating anode x-ray
generator. The x-rays are collimated to ∼100 µm and the two dimensional diffraction
rings, collected on a MAR345 imaging plate, are converted to one dimensional diffrac-
tion profiles using the FIT2D software [95]. The cell parameters were determined
using Le Bail analysis as incorporated in the GSAS software [96]. The diffraction
pattern was recorded up to ∼ 7 GPa and on release of pressure.
149
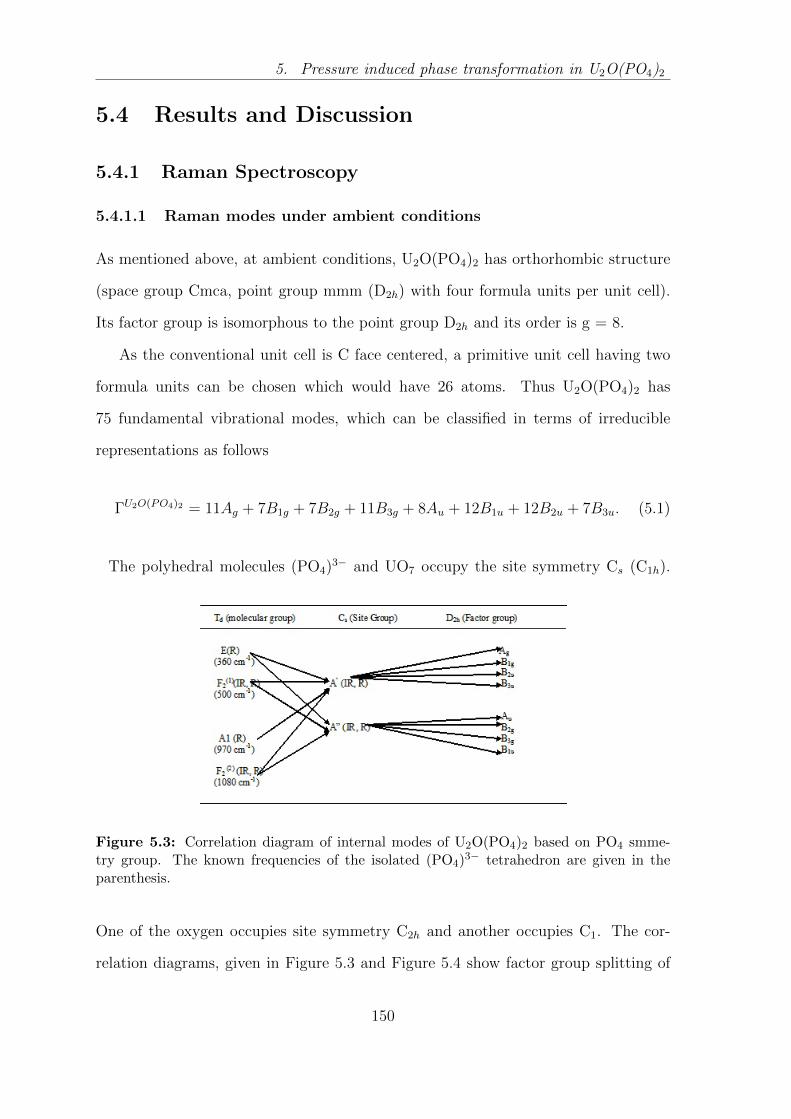
5. Pressure induced phase transformation in U2O(PO4)2
5.4 Results and Discussion
5.4.1 Raman Spectroscopy
5.4.1.1 Raman modes under ambient conditions
As mentioned above, at ambient conditions, U2O(PO4)2 has orthorhombic structure
(space group Cmca, point group mmm (D2h) with four formula units per unit cell).
Its factor group is isomorphous to the point group D2h and its order is g = 8.
As the conventional unit cell is C face centered, a primitive unit cell having two
formula units can be chosen which would have 26 atoms. Thus U2O(PO4)2 has
75 fundamental vibrational modes, which can be classified in terms of irreducible
representations as follows
ΓU2O(PO4)2 = 11Ag + 7B1g + 7B2g + 11B3g + 8Au + 12B1u + 12B2u + 7B3u. (5.1)
The polyhedral molecules (PO4)3− and UO7 occupy the site symmetry Cs (C1h).
Figure 5.3: Correlation diagram of internal modes of U2O(PO4)2 based on PO4 smme-try group. The known frequencies of the isolated (PO4)3− tetrahedron are given in theparenthesis.
One of the oxygen occupies site symmetry C2h and another occupies C1. The cor-
relation diagrams, given in Figure 5.3 and Figure 5.4 show factor group splitting of
150

5.4. Results and Discussion
Figure 5.4: Correlation diagram of internal vibrations of U2O(PO4)2 based on UO7 sm-metry group.
Table 5.1: Tentative assignment of observed Raman modes of diuranium oxide phosphate.
Frequencies(cm−1) Tentative assignment
207 External modes and/or U-O stretch mode247, 266 U-O stretch
433 δs(P-O) (symmetric bending mode)and/or Eg U-O stretch
629 δas (P-O) (asymmetric bending mode)and/or overtone of U-O stretch
881 Unassigned1002 νs (P-O)
1030, 1087 νas (P-O)
various modes of PO4 and UO7 in the orthorhombic system of U2O(PO4)2. Figure 5.5
and Figure 5.6 shows the observed Raman spectrum of this compound in the spectral
region 180-800 cm−1 and 800-1200 cm−1 respectively. As lattice dynamical calcula-
tions are not available in the literature for this compound, the mode assignments has
been carried out following the earlier infrared and Raman studies on various struc-
tural modifications of uranium phosphate [276, 277]. Thus the assignments for the
observed Raman modes, given in table 5.1, should be viewed as tentative.
151
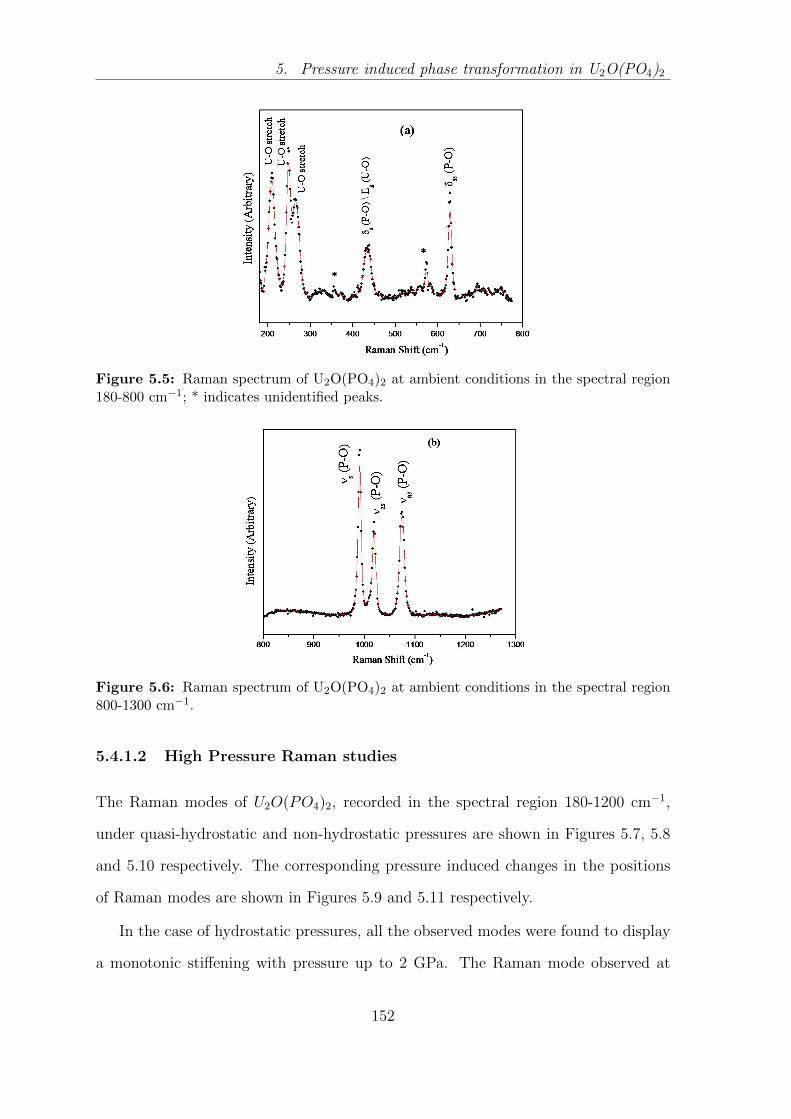
5. Pressure induced phase transformation in U2O(PO4)2
Figure 5.5: Raman spectrum of U2O(PO4)2 at ambient conditions in the spectral region180-800 cm−1; * indicates unidentified peaks.
Figure 5.6: Raman spectrum of U2O(PO4)2 at ambient conditions in the spectral region800-1300 cm−1.
5.4.1.2 High Pressure Raman studies
The Raman modes of U2O(PO4)2, recorded in the spectral region 180-1200 cm−1,
under quasi-hydrostatic and non-hydrostatic pressures are shown in Figures 5.7, 5.8
and 5.10 respectively. The corresponding pressure induced changes in the positions
of Raman modes are shown in Figures 5.9 and 5.11 respectively.
In the case of hydrostatic pressures, all the observed modes were found to display
a monotonic stiffening with pressure up to 2 GPa. The Raman mode observed at
152
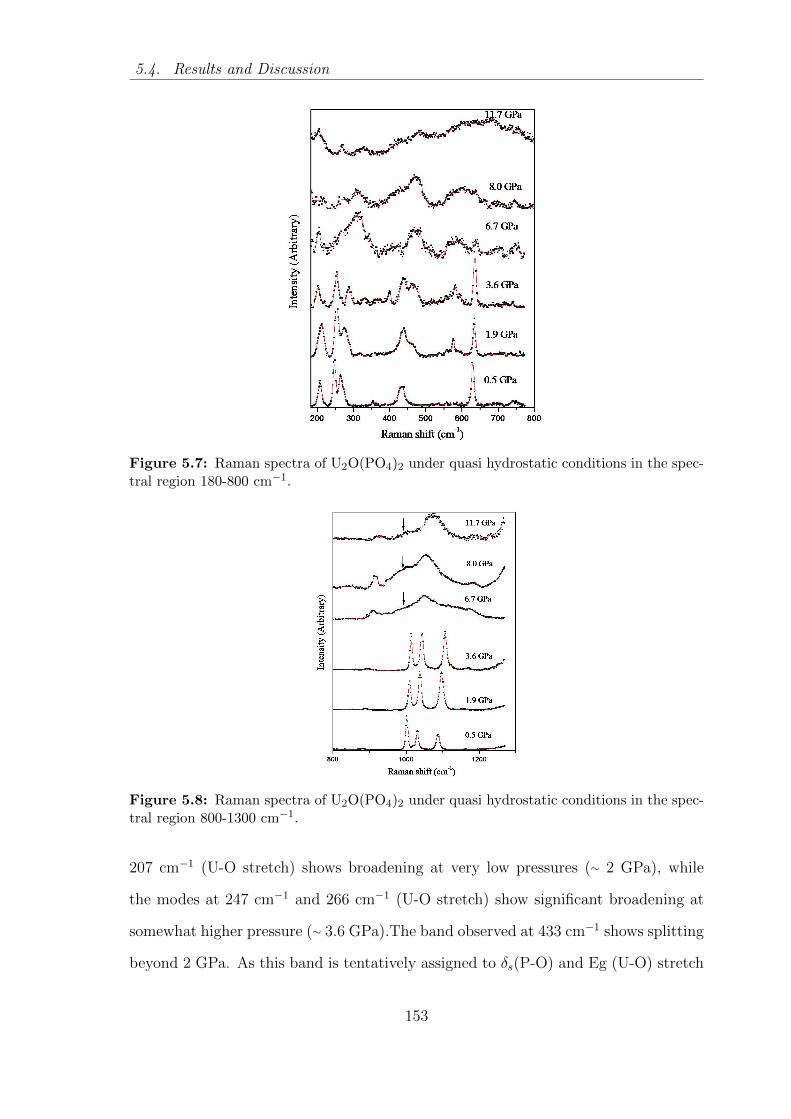
5.4. Results and Discussion
Figure 5.7: Raman spectra of U2O(PO4)2 under quasi hydrostatic conditions in the spec-tral region 180-800 cm−1.
Figure 5.8: Raman spectra of U2O(PO4)2 under quasi hydrostatic conditions in the spec-tral region 800-1300 cm−1.
207 cm−1 (U-O stretch) shows broadening at very low pressures (∼ 2 GPa), while
the modes at 247 cm−1 and 266 cm−1 (U-O stretch) show significant broadening at
somewhat higher pressure (∼ 3.6 GPa).The band observed at 433 cm−1 shows splitting
beyond 2 GPa. As this band is tentatively assigned to δs(P-O) and Eg (U-O) stretch
153

5. Pressure induced phase transformation in U2O(PO4)2
Figure 5.9: Variation of Raman mode frequencies with pressure under hydrostatic condi-tions. (Error bars are larger beyond 6 GPa due to broad Raman peaks).
modes, it is possible that these modes separate out at higher pressures. At the same
pressure, the PO4 asymmetric stretch mode at 1030 cm−1 (νas (P-O)) shows increase
in the relative intensity with respect to the mode at 1002 cm−1 (νs (P-O)).
The relative intensity of the U-O stretch mode observed at 207 cm−1 with the
respect to PO4 stretching modes reduces significantly at pressures above 6 GPa. We
also find that beyond 6.7 GPa, various Raman modes of the initial structure are
replaced by broad bands in the region 300-700 cm−1 and the intense mode νas (P-
O) observed at 629 cm−1 under ambient conditions becomes almost unobservable
beyond this pressure. The vanishing of intensity of this mode beyond 6.7 GPa is
found to be rather abrupt. At the same pressure, the Raman mode observed at 881
cm−1 ((νs (P-O)) is found to pick up intensity. Above 7 GPa, the sharper peaks
corresponding to PO4 modes are replaced by a red shifted broad band at ∼ 981 cm−1
around the asymmetric stretching mode. All the features mentioned above suggest
that the structure becomes increasingly disordered as the pressure is increased.
The results under non hydrostatic conditions do not display any significant intensity
redistribution amongst the internal PO4 modes, unlike under hydrostatic pressures.
154
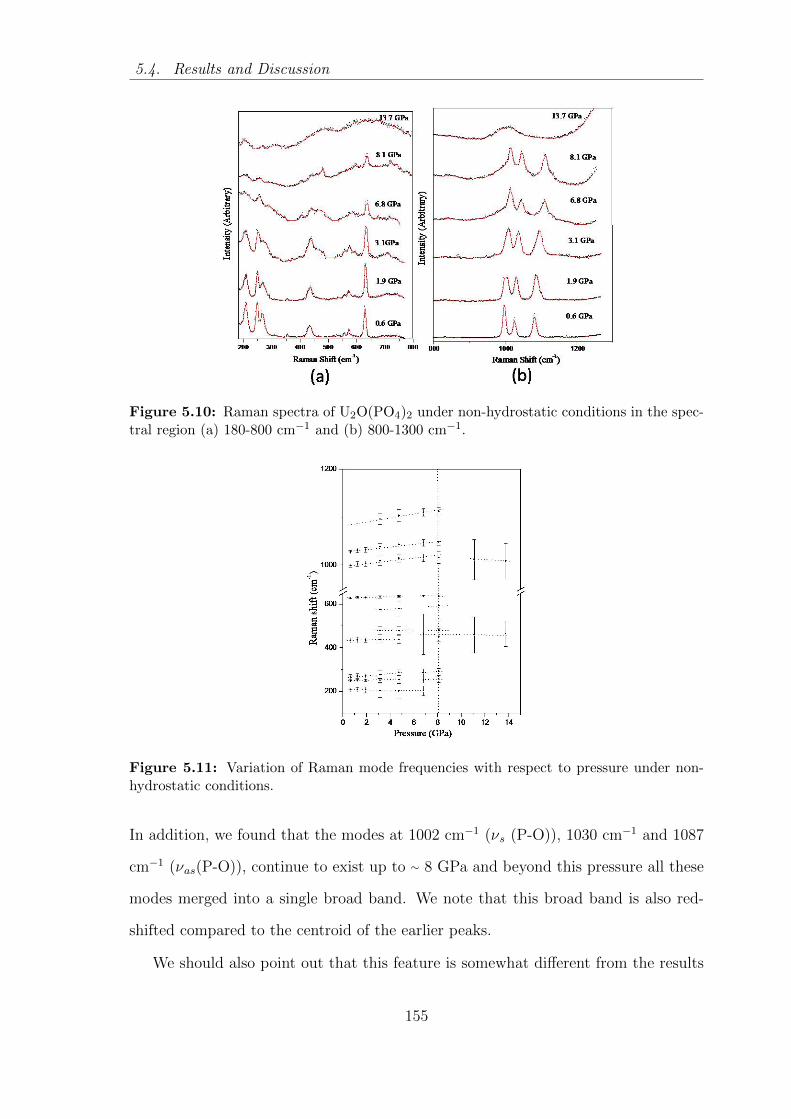
5.4. Results and Discussion
Figure 5.10: Raman spectra of U2O(PO4)2 under non-hydrostatic conditions in the spec-tral region (a) 180-800 cm−1 and (b) 800-1300 cm−1.
Figure 5.11: Variation of Raman mode frequencies with respect to pressure under non-hydrostatic conditions.
In addition, we found that the modes at 1002 cm−1 (νs (P-O)), 1030 cm−1 and 1087
cm−1 (νas(P-O)), continue to exist up to ∼ 8 GPa and beyond this pressure all these
modes merged into a single broad band. We note that this broad band is also red-
shifted compared to the centroid of the earlier peaks.
We should also point out that this feature is somewhat different from the results
155

5. Pressure induced phase transformation in U2O(PO4)2
under hydrostatic pressures, where we observed two bands, i.e. one corresponding to
the centroid of the evolving peaks and another one that is red-shifted with respect to
these (marked with arrow in Figure 5.8). This suggests that the kinetics of pressure
induced transformation is different for hydrostatic and non hydrostatic conditions.
The emergence of these red-shifted broad bands is similar to what has also been
reported earlier for Sc2(WO4)3 [269] where these were ascribed to the emergence
of higher coordinated disordered state. In general, as in the hydrostatic case, the
observed pressure induced broadening of the Raman modes of PO4 as well as UO7
polyhedra suggest that U2O(PO4)2 becomes progressively more disordered at higher
pressures.
To summarize, the overall evolution of the Raman modes and existence of a struc-
tural transition are common to both hydrostatic and non-hydrostatic conditions.
However, the transition pressure for the non-hydrostatic conditions (∼ 8 GPa) is
slightly higher than that for the hydrostatic pressures (∼ 6 GPa). Due to the fact
that non-hydrostatic pressures in a DAC also imply heterogeneous stress distribution,
one generally observes broadening of the peaks at lower pressures. In this sense the
loss of sharp Raman features at a higher pressure under non-hydrostatic conditions
is counter-intuitive and hence interesting which may encourage further work.
Earlier investigations on many negative thermal expansion materials have at-
tempted to interpret the observed negative thermal expansion using the Grneisen
parameters [265]. There has been varied opinions about the contribution of various
energy modes to negative thermal expansion and in earlier studies mostly the low
energy modes ( ≤10 meV) have been shown to be of relevance. We have given in
table 6.1, the slope of change of the Raman modes with pressure (dν/dP) and mode
Gruneisen parameters of all the observed modes of U2O(PO4)2. Among the observed
modes, the Raman mode observed at 207 cm−1 (∼ 25 mev) which is tentatively as-
signed to U-O stretching mode shows negative grneisen parameter. It is of interest
156

5.4. Results and Discussion
Table 5.2: Raman active mode frequencies (ω), their pressure dependence (dω/dP) andcorresponding Gruneisen parameters (γ) of the Orthorhombic Cmca phase of U2O(PO4)2 .
ω(cm−1) dω/dP (cm−1GPa1) γ
207 -1.37 -0.41247 1.65 0.41266 1.15 0.26433 0.71 0.10629 1.54 0.15881 3.79 0.261002 3.29 0.201030 3.71 0.221087 5.99 0.34
to note that in the high temperature study of U2O(PO4)2 one of the U-O bonds was
found to show negative thermal expansion coefficient [265]. Lattice dynamical calcu-
lations may throw more light on rigid unit modes (RUM) i.e. correlated polyhedral
rotations and its role in the NTE of this compound.
As shown in Figure 5.12 , Raman spectra on release of pressure are similar for
hydrostatic as well as non-hydrostatic conditions. However an interesting feature in
these spectra is the emergence of a new mode at ∼ 870 cm−1 .When the retrieved
sample from the hydrostatic experiments was coincidentally investigated after one
month, it showed that 870 cm−1 mode gains intensity and in addition the broad band
at ∼ 1000 cm−1 is replaced by some of the sharper modes. This observed Raman
spectrum closely resembles the spectrum of the U(UO2)(PO4)2, a mixed-valence phase
of uranium orthophosphate [278]. In this compound uranium exists in 4+ and 6+
state as evidenced by the observation of two types of binding energy for U(IV) and
U(VI) by P. Benard et al [278]. On compression there exists a possibility of charge
transfer from uranyl ion (U4+) to (UO2) 2+ and thus facilitating the conversion of
U2O(PO4)2 into mixed valence U(UO2)(PO4)2.
157
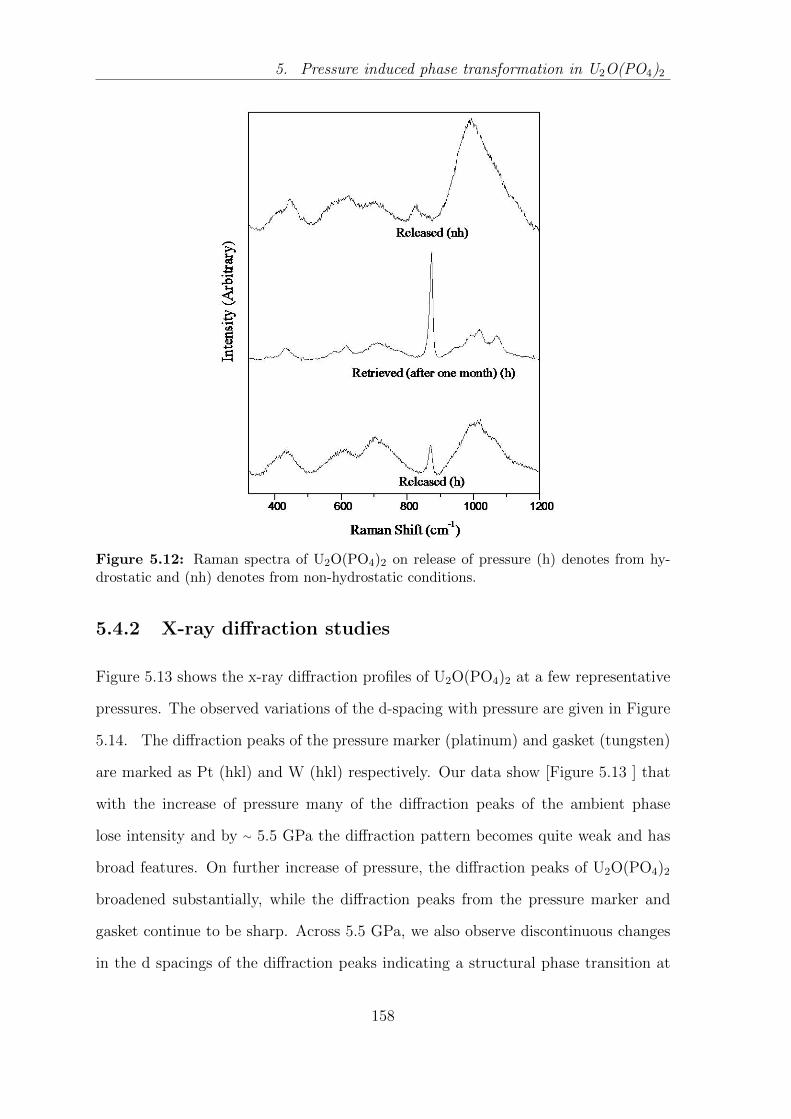
5. Pressure induced phase transformation in U2O(PO4)2
Figure 5.12: Raman spectra of U2O(PO4)2 on release of pressure (h) denotes from hy-drostatic and (nh) denotes from non-hydrostatic conditions.
5.4.2 X-ray diffraction studies
Figure 5.13 shows the x-ray diffraction profiles of U2O(PO4)2 at a few representative
pressures. The observed variations of the d-spacing with pressure are given in Figure
5.14. The diffraction peaks of the pressure marker (platinum) and gasket (tungsten)
are marked as Pt (hkl) and W (hkl) respectively. Our data show [Figure 5.13 ] that
with the increase of pressure many of the diffraction peaks of the ambient phase
lose intensity and by ∼ 5.5 GPa the diffraction pattern becomes quite weak and has
broad features. On further increase of pressure, the diffraction peaks of U2O(PO4)2
broadened substantially, while the diffraction peaks from the pressure marker and
gasket continue to be sharp. Across 5.5 GPa, we also observe discontinuous changes
in the d spacings of the diffraction peaks indicating a structural phase transition at
158

5.4. Results and Discussion
Figure 5.13: X-ray diffraction patterns of U2O(PO4)2 at a few representative pressures.
this pressure.
From the diffraction pattern at ∼ 6 GPa, we find that the remnant diffraction peaks
lie close to the known diffraction peaks of the lower symmetry triclinic phase of mixed
valence uranium orthophosphate U(UO2)(PO4)2. Consistent with our Raman results,
Le Bail fit to the diffraction data at ∼ 6 GPa as shown in Figure 5.16 indicates it to
be a mixture of initial orthorhombic and a new triclinic phase with cell parameters
as a = 8.795 ± 0.003 A, b = 9.302 ± 0.002 A, c = 5.483 ± 0.002 A, α = 102.810 ±
0.00030, β = 97.000 ± 0.00040, γ =102.040 ± 0.00050.
These values are reasonably close to the earlier reported cell parameters of the
mixed valence phase i.e., a = 8.8212 A, b = 9.2173 A, c = 5.4772 A, α = 102.6220, β
159
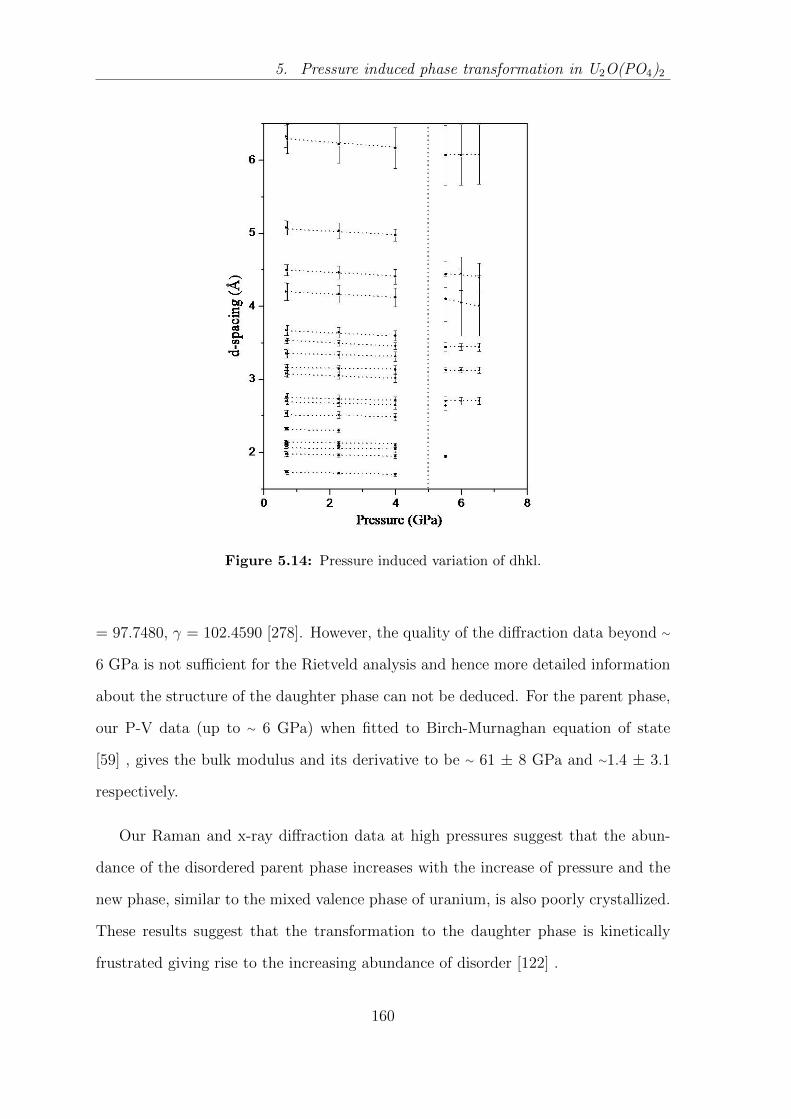
5. Pressure induced phase transformation in U2O(PO4)2
Figure 5.14: Pressure induced variation of dhkl.
= 97.7480, γ = 102.4590 [278]. However, the quality of the diffraction data beyond ∼
6 GPa is not sufficient for the Rietveld analysis and hence more detailed information
about the structure of the daughter phase can not be deduced. For the parent phase,
our P-V data (up to ∼ 6 GPa) when fitted to Birch-Murnaghan equation of state
[59] , gives the bulk modulus and its derivative to be ∼ 61 ± 8 GPa and ∼1.4 ± 3.1
respectively.
Our Raman and x-ray diffraction data at high pressures suggest that the abun-
dance of the disordered parent phase increases with the increase of pressure and the
new phase, similar to the mixed valence phase of uranium, is also poorly crystallized.
These results suggest that the transformation to the daughter phase is kinetically
frustrated giving rise to the increasing abundance of disorder [122] .
160

5.4. Results and Discussion
Figure 5.15: Le Bail fit to the diffraction pattern at 6 GPa; both the parent orthorhombicand high pressure triclinic phase have been fitted.
Figure 5.16: V/V0 versus pressure for the orthorhombic phase. The solid line is fit toBirch-Murnaghan equation of state.
161

5. Pressure induced phase transformation in U2O(PO4)2
5.5 Conclusion
We have investigated the high pressure behaviour of U2O(PO4)2 employing Raman
scattering and x-ray diffraction technique up to ∼14 and 6.5 GPa respectively. The ob-
served changes in the Raman spectra as well as the x-ray diffraction patterns suggest
that U2O(PO4)2undergoes a phase transition at ∼ 6 GPa to a mixture of a disordered
ambient pressure phase and a new high pressure phase. The new phase resembles
the triclinic mixed-valence phase of uranium orthophosphate (U(UO2)(PO4)2). On
release of pressure the initial phase is not retrieved implying the irreversibility of the
phase transition. Our Raman data also suggests the increase in abundance of the
triclinic phase with time.
162

6
Development of EDXRD Beamline
6.1 Introduction
For high pressure X-ray diffraction experiments employing diamond anvil cell the re-
quirement of small amount of samples (∼ pico litre) necessitates the use of brighter
x-ray sources. Moreover for mega bar experiments this requirement become more
stringent due to further reduction in sample volume. The XRD data from laboratory
based rotating anode x-ray sources or x-ray tubes have limited reliability in terms of
usefulness of data for detail structural refinement. The advent of synchrotron sources
is boon for material scientist especially for high pressure community because these
sources provide synchrotron beam (Infrared to hard X-rays) of high flux and of col-
limated nature with a particular time structure. In addition the synchrotron beam
is linearly polarized in the plane of ring and elliptically polarized out of this plane.
These qualities of the synchrotron beam widen the use of synchrotron sources in many
interesting areas including material research. With the availability of insertion de-
vices like wavelength shifter, wigglers and undulators at third generation synchrotron
sources the flux of the synchrotron beam further increases. Hence to harness the capa-
bility of synchrotron source, we have developed an Energy dispersive x-ray diffraction
163

6. Development of EDXRD Beamline
Table 6.1: Salient designed parameters of Indus-2 synchrotron source.
Parameters Values
Electron beam energy 2.5 GeVBeam emittance-horizontal 5.81E-08 m. rad
Beam emittance-vertical 5.81E-09 m. radElectron beam size σx 0.215 mm
σy 0.243 mmσx′ 0.352 mradσy′ 0.062 mrad
Dipole magnetic field 1.5 TCritical wavelength 1.986
Beam life time 24 HrsPower loss 186.6 KW
Bunch length 2.23 cmMaximum current 300 mA
Circumference 172.4743 mRevolution frequency 1.738 MHz
RF frequency 505.812 MHzHarmonic number 291
(EDXRD) beam line at a bending magnet port of 2.0/2.5 GeV Indus-2 synchrotron
source at RRCAT, Indore. Proposed design parameters of Indus-2 are listed in table
I, though presently it is operating at 2.5 GeV, ∼120mA maximum injected current
with a beam life time of nearly ∼ 7 hours. As, discussed in chapter1, for energy dis-
persive x-ray powder diffraction all the diffraction peaks are collected simultaneously
at a fixed scattering angle 2θ, therefore this technique is particularly useful for studies
of materials under extreme conditions such as high pressure and/or high temperature
which require constrained geometry. This technique is also suited for studying the
rapid phase transitions and kinetics of the sample. The availability of larger Q (2π/d)
range at synchrotron sources implies more reliable structural determination.
EDXRD beam line has been designed, developed, installed and commissioned [98]
at bending magnet port BL-11 of Indus-2, synchrotron source at RRCAT Indore.
This beam line utilizes white synchrotron radiation (SR) from a bending magnet,
164
6.2. Basic Principle
filtered through 200 µm thick water cooled Be window and collimated using precision
slits. The diffracted x-rays from the sample are analyzed using energy resolving high
purity germanium (HPGe) detector. Generally we can obtain white SR beam from
bending magnet up to 70 keV having good intensity. With the availability of a wide
range of 2θ angle (± 25◦), the diffraction data can be collected over a large Q range
(up to 15 A−1
) using this beamline.
6.2 Basic Principle
The basic principle of energy dispersive x-ray diffraction is Braggs law expressed in
energy space
Edhkl sin θ = C (6.1)
where E is the energy of the photons scattered at the fixed angle 2θ by the planes
with interplanar spacing dhkl. C is a constant equal to 6.19926 keV A [279].
Here, all the diffraction peaks are recorded simultaneously by an energy sensitive
detector and their profile is convolution of the detector resolution and broadening
due to the beam divergence. Assuming these contributions as Gaussian the width of
a diffraction peak ∆E is given by
∆E =[(∆ED)2 + (∆Eθ)
2]1/2
(6.2)
The broadening due to detector, at energy E, is given by
∆ED =[(∆Eamp)
2 + 2.35× (1/2)FεE]1/2
(6.3)
where ∆E amp is due to noise in the detector and preamplifier, F is Fano factor and
165

6. Development of EDXRD Beamline
ε is energy required for e−-hole pair generation.
∆Eθ = E cot θ∆Θ (6.4)
For simplicity the equation (6.2) can be written as
∆E =[k2
1 + k2E + (k3E)2]1/2
(6.5)
or
∆E/E =[k2
1/E2 + k2/E + (k3)2
]1/2(6.6)
Where k1, k2 are the constants of detector system and k3 is geometric constant
cot θ∆θ, ∆θ represents the total equatorial divergence of the incident The above
equation (6.5) implies that the relative energy width of a diffraction peak (∆E/E)
decreases with energy. It is observed that resolution is essentially detector limited
due to low divergence of synchrotron beam. For improved resolution one needs to
record the diffraction data at higher energies. Equation (6.1) implies that for peaks
at higher energies one needs to work at lower scattering angles. Form the variation of
resolution with scattering angle it is observed that resolution improves with decreas-
ing 2θ until cot θ shoots up and causes a rapid degradation of the resolution. Thus, a
trade off is established among various parameters like energy range, scattering angle,
sample thickness, d spacing of interest etc to optimize the resolution and intensity of
energy dispersive powder x-ray diffraction pattern.
166

6.3. EDXRD Beamline at Indus-2
6.3 EDXRD Beamline at Indus-2
6.3.1 Design and Description
The EDXRD beamline has been designed to collect the diffraction data in plane of the
ring by changing the scattering angle. The key parameters which play an important
role in the design of this beam line are the geometric resolution, detector resolution
and the divergence of the synchrotron beam. For Indus-2 the γ=m/m0, where m
and m0 are relativistic mass and rest mass of electron, is ∼5000, hence the vertical
divergence of the synchrotron beam which is proportional to 1/γ is 0.2 mrad and
horizontal divergence is defined by the first slit across the sweep of the synchrotron
beam.
Schematic layout of EDXRD beam line is shown in figure1. It comprises of water
cooled Be window, water cooled pneumatic copper beam stopper, Primary slit system,
Evacuation chamber with vacuum pumps, Precision slits systems etc. A Carefully
designed state of the art sample maneuvering system with eight axis goniometer is
an integral part of our experimental station. The diffracted data is collected after
passing through a pair of precision slits by an energy resolving High purity germanium
detector (Canberra Model) in multichannel analyzer mode. A mechanical layout of
Figure 6.1: Schematic layout of EDXRD beamline.
EDXRD beam line in top view is shown in figure 6.2 and the photograph of beam
167

6. Development of EDXRD Beamline
line viewed from inside and outside as installed is shown in Figure 6.3 (a) and Figure
6.3 (b) respectively. The synchrotron radiation is transported from storage ring to
beyond the concrete wall (Biological shield) through the front end optics. The
Figure 6.2: Mechanical layout of EDXRD beamline in top view.
Figure 6.3: Photograph of EDXRD beam line installed at port no BL 11 at Indus-2 from(a) inside (b) outside.
synchrotron beam is transported to the experimental station by collimating through
a few slits beyond the Be window of front end.
For EDXRD beamline the first slit is called the primary slit. Being the first
component of the beamline all the slit baldes are water cooled to avoid any heating
due to the heat load of synchrotron beam which is ∼30W/mrad. This slit system is at
∼16 m from the tangent point of the synchrotron source therefore for 0.2 mrad vertical
divergence, the slit opening is ∼ 3.2mm. The synchrotron radiation being of guasian
168
6.3. EDXRD Beamline at Indus-2
profile the high energy intense x-rays are in the central part of beam. Therefore we
select the synchrotron beam in the central region and further cut it down through
the independent movement of 4 tungsten carbide blades mounted in the vertical and
horizontal jaws. The movement range of these vertical and horizontal jaws are in the
range of -2 mm to 15 mm and from -2 mm to 30 mm respectively.
Using this slit an aperture for ∼ 0.5 mm2 synchrotron beam is selected out of
larger beam. This beam is further collimated through a pair of precision slits made
of ∼ 4 mm thick WC blades. In future we have planned to install a focusing optics,
such as Kirkpatrick-Baez mirror system, for focusing the white x-ray beam just before
the sample stage. This will provide the synchrotron beam ∼40 µm2 with an order
of improvement in the incident flux at the sample. This will increase the signal to
noise ratio. Especially in case of high pressure measurements the signal from gasket
peak can be avoided without compromising the flux. The sample is mounted on a
goniometric sample stage, capable of supporting and aligning a diamond anvil cell
for the high pressure studies. This is followed by point slits (which also define the
scattering angle 2θ) and HPGe detector, placed just behind the last point slit.
6.3.2 Sample Stage
For diffraction experiments especially under diamond anvil cell it is very important
to align the sample accurately with respect to synchrotron radiation. The diffracting
volume also known as the diffracting lozenge is defined by the slit system as the
volume of sample irradiated by the direct beam which is collected by the HPGe
detector. Therefore it is lozenge shaped volume of intersection of the incident beam
with the detector line of sight as shown in figure 6.4. For alignment of samples we have
designed the sample stage, shown in figure 6.5, which consists of linear translational
stages and rotational stages having resolution of micron level and millidegree level
respectively. At the bottom there is a pair of linear translational XY stages on which
169

6. Development of EDXRD Beamline
Figure 6.4: Diffracting lozenge as defined by incident and diffracted beam.
a rotational 2θ stage is mounted. This rotational 2θ stage has a detector arm attached
to it on which a pair of precision slit is mounted along with HPGe detector. The 2θ
arm is rotated with help of air pads. It is used to fix the scattering angle. On top
of this stage another θ rotational stage is mounted whose axis coincides with the 2θ
stage. The exact coincidence of 2θ and θ axis is necessary for accurate alignment of
the sample in EDXRD geometry. A set of linear translational stage i.e. xyz mounted
on top of the θ stage is used to maneuver the sample with respect to synchrotron
beam. For our high pressure experiments the diamond anvil cell is mounted on this
xyz stage. We have a provision for another rotational stage known as φ stage mounted
on top of xyz stage to align the single crystal samples in case of Laue x-ray diffraction.
Various components of EDXRD beamline has been aligned and the x-ray spot size at
the sample is kept at ∼ 100/200 µm depending upon the requirement. Using these
settings, and with Indus-2 operating at ∼ 2 GeV and 10 mA, we have recorded first set
of powder diffraction patterns of a few elemental metals for benchmarking purpose.
Some of these are shown in Figure 6.6. The energy resolution (∆E/E) of the detector
used, as reflected through the FWHM of the recorded fluorescence peaks, is 0.021 for
Au(Lα1) at 9.713 keV and 0.019 for Cu (Kα1) at 8.047 keV. These results show an
excellent signal to noise ratio of the recorded diffraction peaks.
170
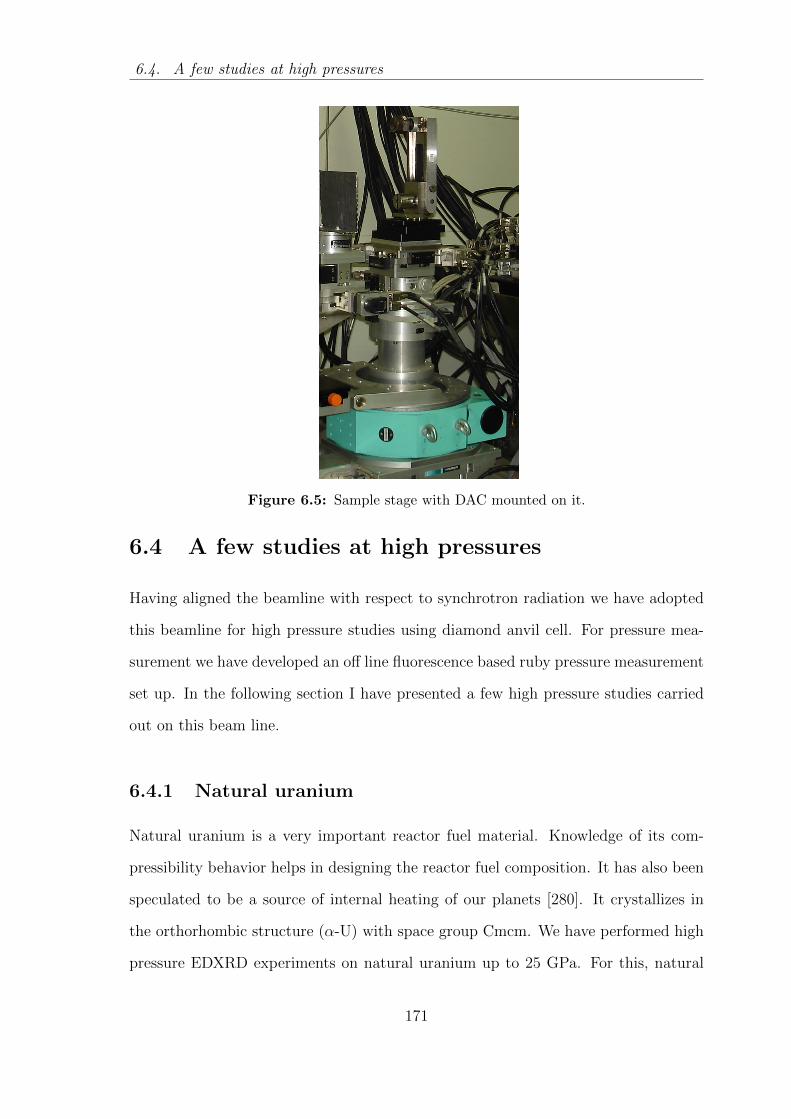
6.4. A few studies at high pressures
Figure 6.5: Sample stage with DAC mounted on it.
6.4 A few studies at high pressures
Having aligned the beamline with respect to synchrotron radiation we have adopted
this beamline for high pressure studies using diamond anvil cell. For pressure mea-
surement we have developed an off line fluorescence based ruby pressure measurement
set up. In the following section I have presented a few high pressure studies carried
out on this beam line.
6.4.1 Natural uranium
Natural uranium is a very important reactor fuel material. Knowledge of its com-
pressibility behavior helps in designing the reactor fuel composition. It has also been
speculated to be a source of internal heating of our planets [280]. It crystallizes in
the orthorhombic structure (α-U) with space group Cmcm. We have performed high
pressure EDXRD experiments on natural uranium up to 25 GPa. For this, natural
171

6. Development of EDXRD Beamline
(a) (b)
Figure 6.6: First diffraction pattern of (a) gold and (b)copper.
uranium sample along with a few specs of gold as a pressure marker was loaded in to a
pre indented tungsten gasket of thickness 80 µm with a hole diameter of 100 µm. Fig-
ure 6.7a represents the stacked diffraction pattern at a few representative pressures.
Its lattice parameter at ambient conditions a = 2.856 A, b = 5.876 A and c = 4.955
A are in excellent agreement with the earlier reported one [281]. Our measurements
show that α phase is stable up to the highest pressure studied and the observed P-V
data, fitted with third order B-M equation of state as shown in figure 6.8 gives its
bulk modulus and its derivatives as B0= 108 GPa and B′0= 6.2 respectively. These
values are in close agreement with the earlier reported experimental value [281].
6.4.2 Sesquioxides
The rare earth sesquioxides (RE2O3) are important materials from technological as
well as from basic physics point of view. These materials are applied in the fields
like data storage, cement additives, paints, coatings etc. From the physics point of
view their structural stability with pressure is still controversial. These materials
crystallize into three polymorphs with hexagonal (P3m1), monoclinic (C2/m) and
cubic (Ia3) structures. These are also known as A-type, B-type and C-type structures
172

6.4. A few studies at high pressures
(a)
(b)
Figure 6.7: (a) Stacked diffraction pattern of natural uranium at a few pressures; (b)equation of state of natural uranium, symbol represents the observed data and red line isB-M fit as per A. Lindbaum et al.
respectively [282].
The relative stabilities of these phases are understood in terms of the cationic
and anionic radius ratios [283]. A type phase is found to be stable from Lantahanum
(La) to Neodymium (Nd), B type from samaraium (Sm) to Gadolinium (Gd) and
C type phase for other rare earth sesquioxides. The decrease in molar volume has
been observed for sequence C to B to A. Earlier studies on Yb2O3 show discrepancies
about its transition from C to A [284]. To resolve this I have carried out high pressure
EDXRD studies on Yb2O3 up to ∼24 GPa. Figure 6.8 (a) shows the energy disper-
sive x-ray diffraction pattern of Yb2O3 stacked at few representative pressures. The
r letter in bracket alongside few pressures represents the diffraction pattern during
decompression. The x-ray diffraction peaks at ambient conditions marked as (hkl)
has been indexed to C-type cubic phase. The lattice parameter at ambient conditions
has been determined to be 10.433 A which is in close agreement with earlier reported
173

6. Development of EDXRD Beamline
(a)
(b)
Figure 6.8: (a) EDXRD pattern of Yb2O3 at few representative pressures; (b) Pressureinduced variation of volume of phase A and phase C.
values. Up to 15.9 GPa the x-ray diffraction peaks shift towards higher energy values
values. Beyond this pressure new x-ray diffraction peaks appear indicating the emer-
gence of a new phase. At 24.1 GPa this phase could be indexed to A-type hexagonal
phase (P3m1)
The observed P-V variation was fitted with third order B-M equation of state for
C - phase and A - phase as shown in Figure 6.8 (b) where symbols represent the
observed data and solid lines are obtained from B-M fit.
6.5 Adaptation for high temperature studies
This beam line has been adapted for carrying out EDXRD studies at high tempera-
tures. A high temperature set up as shown in figure 6.9 has been mounted with help
of proper adapter plate on top of xyz stage of experimental station.
It has been installed an aligned with respect to synchrotron beam for carrying
out in-situ energy dispersive x-ray diffraction measurements by varying temperature.
174

6.5. Adaptation for high temperature studies
Figure 6.9: High temperature furnace installed at EDXRD beamline.
This set up consists of graphite heating element with the provision for mounting and
rotating the sample filled capillary inside evacuated/inert environment.
The heating element is mounted from the top lid of the water cooled chamber.
Sample is filled in quartz capillaries for temperature up to 800 ◦C and for higher tem-
peratures it is mounted on platinum wires. Temperature is controlled by Eurotherm
temperature controller. The temperature at the sample is monitored through K type
thermocouple. High temperature studies on standard samples like quartz has been
carried out to calibrate the high temperature set up.
175

6. Development of EDXRD Beamline
176

Appendix A
Structure Determination
The basic principle of structure determination from XRD pattern has already been
introduced in chapter 1. Although single crystal XRD is more preferable for structure
determination of materials at ambient condition, however due to practical limitations
of this technique in case of experiments under high pressure and/or due to non avail-
ability of single crystal materials, the powder XRD becomes a preferred technique for
determination of crystal structure under high pressure. A powder x-ray diffraction
pattern contains a wealth of information to be extracted from it. Broadly speaking
a powder diffraction pattern constitutes two parts, one is background and another
is reflections/diffraction peaks. The background contains information about local
structure, amorphous fraction and lattice dynamics [285] along with Compton scat-
tering contribution to it. The diffraction peaks constitutes mainly three parts, its
position, intensity and profile which contain information about unit cell shape and
size, arrangement of atoms within unit cell and instrument broadening convoluted
with sample broadening respectively. Since the crystal structure determines diffrac-
tion pattern. Therefore it should be possible to go in the reverse direction and deduce
the structure with a given diffraction pattern.
The determination of an unknown crystal structure is accomplished in three major
177

Appendix A. Structure Determination
steps.
1. The shape and size of a unit cell is deduced from the positions of the diffraction
peaks. By making an assumption as to which of the seven crystal system the
unknown structure belongs to, the Miller indices are assigned and thus the
shape and size of the unit cell is deduced form the diffraction peaks. This step
is known as Indexing which has been discussed in detail in A1.
2. The number of atoms per unit cell is then calculated from the shape and size
of the unit cell, chemical formula unit of the sample and its measured density.
3. At last the positions of the atoms in the unit cell are deduced from the relative
intensities of the diffraction peaks
A.1 Indexing
For indexing a diffraction pattern the first step is to find out the accurate 2θ values
from it and then index the crystal system and unit cell dimensions. Each of the
diffraction peaks of a particular phase corresponds to reflection from a set of Brag
planes denoted by Miller indices (hkl). These are defined as set of integers inversely
proportional to the intercepts of crystal plane along the crystal axes. The interplanar
spacing dhkl measured at right angles to the planes is function of the plane indices
and the lattice constants (a, b, c, α, β, γ) and thus it depends on the crystal system
(shown in table A.1) involved. The dhkl’s for different crystal systems are given below.
Cubic1
d2=h2 + k2 + l2
a2(A.1)
Tetragonal1
d2=h2 + k2
a2+l2
c2(A.2)
178

A.1. Indexing
Table A.1: Lattice parameters for the seven crystal systems
Crystal System Lattice paramters
Triclinic a 6= b 6= c α 6= β 6= γMonoclinic a 6= b 6= c α = γ =90◦ 6= β
Orthorhombic a 6= b 6= c α = β = γ =90◦
Tetragonal a = b 6= c α = β = γ =90◦
Cubic a = b = c α = β = γ =90◦
Rhombohedral a = b = c α = β = γ 6= 90◦
Hexagonal a = b 6= c α = β =90◦, γ =120◦
Orthorhombic1
d2=h2
a2+k2
b2+l2
c2(A.3)
Hexagonal1
d2=
4
3
(h2 + hk + k2
a2
)+l2
c2(A.4)
Rhombohedral1
d2=
(h2 + k2 + l2) sin2 α + 2(hk + kl + hl) cos2 α− cosα
a20(1− 3 cos2 α + 2 cos3 α)
(A.5)
Monoclinic1
d2=
1
sin2 β
(h2
a2+k2 sin2 β
b2+l2
c2− 2hl cos β
ac
)(A.6)
Now consider the simplest case i.e. of cubic system Combining the Bragg equation
2dsinθ = λ with plane spacing equation A.1 we get
sin2 θ
h2 + k2 + l2=
sin2 θ
s=
λ2
4a2(A.7)
Since the sum (h2 + k2 + l2) is always integral and λ2/4a2 is a constant for any
pattern, hence the problem of indexing the pattern of a cubic material is equivalent
to finding a set of integers ’s’ such that these give constant quotient upon dividing
the various sin2θ values. Once the proper integers ’s’ are determined one can get the
set of h k l values such that sum of square of these numbers is equal to ’s’. For more
179

Appendix A. Structure Determination
complex systems the computer algorithms with auto indexing program must be used.
There are many indexing programs available from http://www.ccp14.ac.uk such as
Dicovl91, Crysfire or Checkcell. One can input the peak positions and wavelength into
these programs and these will generate cell parameters. Subsequently, best possible
space group is chosen based on the extinction conditions observed.
A.2 Rietveld Refinement
In principle the powder XRD peaks should appear as delta function peaks for an ideal
crystal diffracted with perfectly collimated x-ray beam. Therefore one can accurately
determine the position and intensity of diffraction peaks. However, in practice these
peaks are broadened and shifted slightly due to other effects such as finite instru-
ment resolution, crystallite size, thermal motion, stress, strain, preferred orientation,
stacking faults and other imperfections. In order to determine the correct structure
these effects should be deconvoluted.
The intensity of a diffraction peak is proportional to the square of the structure
factor (Fhkl), defined as
Fhkl =N∑j=1
fj exp[2πi(hxj + kyj + lzj)] (A.8)
Where fj is atomic scattering factor of atom j and (xj, yj, zj) is its fractional coordi-
nates.
Rietveld refinement is a whole pattern fitting where least square method is used
to minimise the sum of square of the differences of observed and calculated intensities
over all data points in the diffraction pattern [286].
S =∑
w(Io − Ic)2 (A.9)
180

A.2. Rietveld Refinement
Here Io and Ic are observed and calculated intensities respectively while w is weight
factor per data point. I have used GSAS program [96] with a graphical interface called
EXPGUI [287] for Rietveld refinement of the diffraction pattern. As per this program
the calculated intensity of a diffraction peak is given by
Ic = Ib + Id + Sh∑
SphYph] (A.10)
Where Ib represents the contribution from the background and is modelled as an
empirical function, Id is an additional contribution to the background due to diffuse
scattering, Sh and Sph are scaling factors for a particular XRD powder profile (called
a histogram) and for a particular phase within that profile respectively. Yph is the
intensity of the bragg peak which is related with the square of the structure factor
given in equation (A.8)
Yph = |Fph|2H(T − Tph)Kph (A.11)
Where Fph = Fhkl is the structure factor for a particular reflection, H(T-Tph) is a
profile peak shape function and Kph is a product of various geometric and other
correction factors. It is given by
Kph =EphAhOphMpL
Vp(A.12)
Where Eph, Ah, Oph, Mp, L and Vp are extinction correction, absorption correction,
preferred orientation correction, reflection multiplicity, Lorentz polarisation correction
and unit cell volume for the phase respectively. The Oph becomes especially useful in
the analysis of high pressure powder diffraction data.
In order to extract the observed structure factor (Fo) from an experimental diffrac-
tion profile we use the LeBail method [288]. This is performed by setting all the
calculated structure factors Fc=1 and running the least square algorithm to extract
Fo. The set of Fo′s from the first cycle are then used as the Fc
′s for the next cycle
181

Appendix A. Structure Determination
until a very good fit is observed. The lattice parameters and profile shape parameters
may also be refined at each step in this process, as these are not dependent on the
structure factor. The Le Bail method does not require detailed atomic arrangement
but only the knowledge of lattice parameters and space group which can be obtained
from indexing. The structure factors thus generated are then used in the Rietveld
refinement.
There are several possible profile function incorporated into GSAS. But we use
pseudo-voight [289] to describe the line shapes. It is a combination of Gaussian and
Lorentzian components having options for many refinable coefficients to adjust the
full width half maximum (FWHM), asymmetry parameters, Gaussian and lorentzian
fractions etc. For high pressure x-ray diffraction patterns it is advised not to use
many refinable parameters due to limited 2θ range of the pattern as well as large
background due to Compton scattering from diamond. In this case only the FWHM
of Gaussian and lorentzian components are refinable profile parameters.
Having done a good Le Bail refinement, the precise crystal structure is refined
using the Rietveld method. For fitting background scattering I have used Chebyshev
polynomial incorporated into GSAS program. These polynomials are a sequence of
orthogonal polynomials which are related to de Moivres formula. These provide an
approximation that is close to the polynomial of best approximation to a continuous
function and hence are useful for modelling the background function more robustly
in comparison to other functions.The atomic positions, fractional coordinates and
thermal motions can be refined using Rietveld refinement. The fraction of each phase
contributing to the diffraction pattern as well preferred orientation can also be refined
using Rietveld refinement method.
Finally the quality of the refined fit can be judged by visual inspection at the first
sight. In addition to this the agreement between the observed and calculated powder
182

A.2. Rietveld Refinement
patterns is judged by several indicators. The R-profile factors,
Rp =
∑ |Io − Ic|∑Io
andRwp =
√S∑WI2
o
(A.13)
characterise the adjustment between observed and calculated profiles at each in-
tensity steps. Rwp is one of the most important factors. The quality of the refined
structure model is better estimated with the R-structure factors, RB and RF , based
on the integrated intensity and structure factor amplitude of the reflections, respec-
tively. The factor RF is comparable to the R factor derived in structure determination
from single crystal diffraction.
RF =
∑ |Fo − Fc|∑Fo
andRwp =
√S∑WI2
o
(A.14)
Another parameter is Rexp =√
n−p∑WI2o
where n and p are number of data points
and number of variable parameters respectively. Another important parameter which
is used in GSAS is χ2 = (Rwp / Rexp)2. The χ2 should be close to unity for correct
refined model while its diverging values indicate the incorrect model and one has to
modify the initial model itself.
183

Appendix A. Structure Determination
184
Appendix B
List of Publications
1. A.K. Mishra, Nandini Garg, K.K. Pandey, K.V. Shanavas, A.K. Tyagi and
Surinder M Sharma Zircon- monoclinic-scheelite transformation in nanocrys-
talline chroamtes, Phys. Rev. B 81, 104109, 2010.
2. A. K. Mishra, Shanavas K. V., Nandini Garg, H. K. Poswal Balaji Mandal and
surinder M. Sharma Pressure induced phase transitions in BiFeO3, Solid
State Commun.154, 72-76, 2013.
3. A. K. Mishra, H. K. Poswal, Surinder M Sharma, Surajit Saha, D. V. S.
Muthu, Surjeet Singh, R. Suryanarayanan, A. Revcolevschi, and A. K. Sood
The study of pressure induced structural phase transition in spin-
frustrated Yb2Ti2O7 pyrochlore, J. Appl. Phys. 111, 033509, 2012.
4. A.K. Mishra, Nandini Garg, K.V. Shanavas, S.N. Achary, A. K. Tyagi and
Surinder M. SharmaHigh pressure structural stability of BaLiF3, J. Appl.
Phys. 110, 123505, 2011.
5. A.K. Mishra, H.K. Poswal,S.N. Acharya, A.K. Tyagi and S.M. Sharma Struc-
tural evolution of double perovskites Sr2MgWO6 under high pressure,
Phys. Sattus Solidi B 247 (7), 1773-1777, 2010.
185

Appendix B. List of Publications
6. K.K. Pandey, H.K. Poswal, A.K. Mishra, Abhilash Dwivedi, R. Vasanthi, Nan-
dini Garg and Surinder M. Sharma Energy dispersive x-ray diffraction
beam line at Indus-2 Synchrotron source, Pramana 80, 607-619, 2013.
7. A.K. Mishra, Chitra Murli, A. Singhal and Surinder M. Sharma Pressure
induced phase transformation in U2O(PO4)2, J. Solid Chem. 181(5),
1240-1248, 2008.
8. Pallavi S Mallavi, S Karmakar, Debjani Karmakar, A. K. Mishra, H. Bhatt
,N. N. Patel, and Surinder M. Sharma High pressure structural and vibra-
tional properties of the spin-gap system Cu2PO4 (OH) J.Phys.:Condens
Matter 25, 045402, 2013.
9. Chitra Murli, A. K. Mishra, Susy Thomas and Surinder M. Sharma Ring open-
ing polymerization in carnosine under pressure, J. Phys. Chem. B 116,
4671-4676, 2012.
10. A.K. Mishra, Chitra Murli, Nandini Garg, R. Chitra and Surinder M Sharma
Pressure induced structural transformations in Bis (glycinium) ox-
alate,J. Phys. Chem. B 114, 17084-17091, 2010.
11. A. K Mishra, Chitra Murli and Surinder M SharmaHigh Pressure Raman
spectroscopic study of deuterated γ- glycine, J. Phys. Chem. B 112(49),
15867-15874 , 2008.
12. A.K. Mishra, Nandini Garg, K.K. Pandey, Vineet Singh and Surinder M Sharma
Effect of the surfactant CTAB on the high pressure behavior of CdS
nano particles, J. Phys. : Conference Series 377, 012012, 2012.
13. K. K. Pandey, Nandini Garg, A. K. Mishra and Surimder M. Sharma High
pressure phase transition in Nd2O3, J. Phys. : Conference Series 377,
012006, 2012.
186

14. A. K. Mishra, Chitra Murli, Ashok K. Verma, Yango Song, M. R. Suresh Ku-
mar,and Surinder M. Sharma Conformation and hydrogen bond assisted
polymerisation in glycine lithium sulphate, C ommunicated to J. Phys.
Chem B.
15. A. K. Mishra, H. K. Poswal, Surinder M. Sharma and A. Revcolevschi and A
K Sood Lattice instability in Dy2Ti2O7 at high pressures, to be commu-
nicated to J. Phys.:Condens Matter.
16. A. K. Mishra, Nandini Garg, A. K. Tyagi and Surinder M. Sharma Structural
phase transitions in LiErF4, to be communicated to Phys. Rev. B.
187

Appendix B. List of Publications
188

References
References
[1] R J Hemley and N W Aschroft. The revealing role of pressure in the condensed-matter sciences. Physics Today, 51:26–32, 1998.
[2] M Murakami, K Hirose, K Kawamura, N Sata, and Y Ohishi. Post-perovskitephase transition in MgSiO3. Science, 304:855–858, 2004.
[3] E Knittle and R Jeanloz. Earth’s core mantle boundary: Results of experiemnstat high pressure and temperatures. Science, 25:1438–1443, 1991.
[4] S N Luo, O Tschauner, P D Asimow, and T J Ahrens. A new dense silicapolymorph: A possible link between tetrahedrally and octahedrally coordinatedsilica. American Mineralogist, 89:455–461, 2004.
[5] A Jayaraman. Ultrahigh pressures. Rev. Sci. Instrum., 57:1013–1031, 1986.
[6] P W Bridgman. Proc. Amer. Acad. Arts Sci., 81:167, 1952.
[7] P W Bridgman. The Physics of High Pressure. Bell London, 1949.
[8] H T Hall. Anvil guide device for multiple-anvil high pressure apparatus. Rev.Sci. Instrum., 33:1278–1280, 1962.
[9] J Osugi, K Shimizu, K Inoue, and K Yasunami. Rev. Phys. Chern. Jpn., 34:1,1964.
[10] A Ohtani, A Onodera, and N Kawai. Rev. Sci. Instrum., 50:308, 1979.
[11] A W Lawson and Ting-Yuan Tang. A diamond bomb for obtaining powderpictures at high pressures. Rev. Sci. Instrum., 21:815, 1950.
[12] C E Weir, E R Lippincott, Alvin Van Valkenburg, and E N Bunting. Thediamond cell is commercially available from high pressure diamond optics, inc.,mclean, va. J. Res. nat. Bur. Std., 63A:55, 1959.
[13] J C Jamieson, A W Lawson, and N D Nachtrieb. New device for obtainingx-ray diffraction patterns from substances exposed to high pressure. Rev. Sci.Instrum., 30:1016–1019, 1959.
[14] Alvin Van Valkenburg. Dimaond high pressure windows. Diamond Research,pages 17–19, 1964.
189

References
[15] R A Forman, G J Piermarini, J D Barnet, and S Block. Pressure measurementmade by the utilization of ruby sharp-line luminescence. Science, 176:284–285,1972.
[16] G J Piermarini, S Block, and J D Barnett. Hydrostatic limits in liquids andsolids to 100 kbar. J. Appl. Phys., 44:5377–5382, 1973.
[17] J M Besson and J P Pinceaux. Melting of helium at room temperature andhigh pressure. Science, 206:1073–1075, 1979.
[18] H K Mao. High-pressure physics: Sustained static generation of 1.36 to 1.72megabars. Science, 200:1145–1147, 1978.
[19] S Merkel, R J Hemley, and H K Mao. Finite-element modeling of diamonddeformation at multimegabar pressures. Appl. Phys. Lett., 74:656–658, 1999.
[20] G J Piermarini and et al. Calibration of the pressure dependence of the R1ruby fluorescence line to 195 kbar. J. Appl. Phys., 46:2774–2780, 1975.
[21] L Merrill and et al. Miniature diamond anvil pressure cell for single crystalx-ray diffraction studies. Rev. Sci. Instrum., 45:290–294, 1974.
[22] G Huber and et al. Pressure dependence of 4f levels in europium pentaphosphateup to 400 kbar. Phys. Rev. B, 15:5123–5128, 1977.
[23] H K Mao and P M Bell. Carniegie Institute of Washington Year Book. 1978.
[24] R LeToullec and et al. The membrane diamond anvil cell: A new device forgenerating continuous pressure and temperature variations. High Pressure Res.,1:77–90, 1988.
[25] N V Novikov, editor. Physical Properties of diamond: A handbook. NaukovaDumka, Kiev, 1987.
[26] N E Christensen, A L Ruoff, and C O Rodriguez. Pressure strengthening: Away to multimegabar static pressures. Phys. Rev. B, 52:9121–9124, 1995.
[27] L Dubrovinsky, N Dubrovinskaia, V B Prapanke, and A M Abakumov. Imple-mentation of micro-ball nanodiamond anvils for high pressure studies above 6mbar. Nature Communications, page 2160, 2012.
[28] S Scandolo and et al. Phys. Stat. Sol. (b), 198:389, 1996.
[29] A Jayraman. The diamond-anvil high-pressure cell. Scientific american,250(4):54–62, 1984.
[30] M I Eremets. High Pressure Experimental Methods. Oxford University Press,New York, 1996.
190

References
[31] G Aquilanti and S Pascarelli. EXAFS study of the local structure of InAs upto 80 GPa. J. Phys. Condens. Matter, 17:1811–1824, 2005.
[32] S T Weir, Jagannadham Akella, Chantel Aracene-Ruddle, Yogesh K Vohra, andShane A. Catledge. Epitaxial diamond encapsulation of metal microprobes forhigh pressure experiments. Appl. Phys. Lett., 77(21):3400–3403, 2000.
[33] L Zhang, F, J Stanek, S S Hafner, H Ahsbahs, H F Grunsteudel, J Metge, andRuffer R. 57fe nuclear forward scattering of synchrotron radiation in hedenber-gite CaFeSi2O6 at hydrostatic pressures up to 68 GPa. American Mineralogist,84:447–453, 1999.
[34] M P Pasternok, R D Taylor, R Jeanloz, X Li, J H Nguyen, and C A McCam-mon. High pressure collapse of magnetism in Fe0.94O: Mossbauer spectroscopybeyond 100 GPa. Phys. Rev. Lett., 79:5046–5059, 1997.
[35] S V Obsyannikov and et al. JETP, 81:167, 2005.
[36] C F Richardson and N W Ashcroft. High temperature superconductivity inmetallic hydrogen: Electron-electron enhancements. Phys. Rev. Lett., 78:118–121, 1997.
[37] M I Eremets, M Imets and I A Troyan. Conductive dense hydrogen. NatureMaterials, 10:927–931, 2011.
[38] W J Nellis, A L Ruoff, and I F Silvera. Has metallic hydrogen been made in adiamond anvil cell? Arxiv, arXiv:1201.0407 [cond-mat.other], 2012.
[39] K Shimizu, T Kimura, S Furomoto, K Takeda, K Kontani, Y Onuki, andK Amaya. Superconductivity in the non-magnetic state of iron under pres-sure. Nature, 412:316–318, 2001.
[40] M I Eremets and et al. Quantum dot exciton dynamics through a nanoaperture:Evidence for two confined states. Phys. Rev. Lett., 83:2797–2800, 2000.
[41] A W Bassett and T Takahashi. Silver iodide polymorphs. Am. Mineral, 50:1576,1965.
[42] L C Mingand and W A Bassett. Laser heating in the diamond anvil press up to2000 degreec sustained and 3000 degreec pulsed at pressures up to 260 kilobars.Rev. Sci. Instrum., 45:1115–1118, 1974.
[43] H Arashi and M lshigame. Diamond anvil pressure cell and pressure sensor forhigh-temperature use. Jpn. J. Appl. Phys., 21:1647–1649, 1982.
[44] Schiferl, A I Katz, C Vanderborgh, L C Schmidt, R L Mills, E F Skelton,S B Qadri, A W Webb, and W T Elam. In Proceedings of the Xth AIRAPTConference, Amsterdam, 1986.
191
References
[45] R Boehler, M Nicol, C S Zha, and M L Johnson. In Proceedings of the XthA/RAPT Conference, Amsterdam, 1985.
[46] R Boehler. Temperatures in the earth’s core from melting-point measurementsof iron at high static pressures. Nature, 363:534–536, 1993.
[47] C S Yoo, N C Holmes, M Ross, D J Webb, and C Pike. Shock temperaturesand melting of iron at earth core conditions. Phys. Rev. Lett., 70:3931–3934,1993.
[48] R Cauble, D W Phillion, T J Hoover, N C Holmes, J D Kilkenny, and R WLee. Demonstration of 0.75 Gbar planar shocks in x-ray driven colliding foils.Phys. Rev. Lett., 70:2102–2105, 1993.
[49] K Koyama, S Hane, K Kamishima, and T Goto. Instrument for high resolutionmagnetization measurements at high pressures, high magnetic fields and lowtemperatures. Rev. Sci. Instrum., 69:3009–3014, 1998.
[50] K Yamamoto, S Endo, A Yamagishi, H Mikami, H Hori, and M Date. Aceramic-type diamond anvil cell for optical measurements at high pressure inpulsed high magnetic fields. Rev. Sci. Instrum., 62(12):2988–2990, 1991.
[51] M Grimsditch and P Vavassori. The diffracted magneto-optic kerr effect: whatdoes it tell you? J. Phys. Condens. Matter, 16:R275–R294, 2004.
[52] V V Shchennikov and et al. High-pressure thermopower of sulfur. Phys. SolidState, 45:619–622, 2003.
[53] N Kimura and et al. De haas-van alphen effect in ZrZn2 under pressure:Crossover between two magnetic states. Phys. Rev. Lett., 92:197002–197005,2004.
[54] Michael G Pravica and Isaac F Silvera. Nuclear magnetic resonance in a dia-mond anvil cell at very high pressures. Rev. Sci. Instrum., 69:479–484, 1998.
[55] I N Goncharenko, J M Mignot, G Andre, O A Lavrova, I Mirebeau, and V ASomenkov. Neutron diffraction studies of magnetic structure and phase transi-tions at very high pressures. High Pressure Res., 14:41–53, 1995.
[56] J F Nye. Physical properties of crystals. Oxford University Press, Oxford, 1957.
[57] A K Singh, C Balasingh, Ho-kwang Mao, Russell J Hemley, and Jinfu Shu.Analysis of lattice strains measured under nonhydrostatic pressure. J. Appl.Phys., 83:7567–7575, 1998.
[58] F D Murnaghan. Finite deformations of an elastic solid. Am. J. Math, 49:235–260, 1937.
[59] F Birch. Finite elastic strain of cubic crystals. Phys. Rev., 71:809–824, 1947.
192
References
[60] Satinder Kumar Sikka, Surinder Mohan Sharma, and R Chidambaram. Highpressure science and technology. 1993.
[61] R Jeanloz. J. Geophys. Res., 92:10532, 1987.
[62] H K Mao, J Xu, V V Struzhkin, J Shu, R J Hemley, W Sturhahn, M Y Hu,E E Alp, L Vocadlo, D Alfe, G D Price, M J Gillan, M Schwoerer-Bohning,D Hausermann, P Eng, G Shen, H Giefers, R Lubbers, and G Wortmann.Phonon density of states of iron up to 153 gigapascals. Science, 292:914–916,2001.
[63] K R Hirscha and W B Holzapfel. Diamond anvil high-pressure cell for ramanspectroscopy. Rev. Sci. Instrum., 52:52–55, 1981.
[64] Alvin Van Valkenburg. In Conf. Int. sur les Hautes pressions, Le Creusot, Saoneet Loire, France, 1965.
[65] J F Lin, J Shu, H K Mao R J Hemley, and G Shen. Rev. Sci. Instrum.,74(11):4731, 2003.
[66] Guoyin Shen, Vitali B Prakapenka, Mark L Rivers, and Stephen R Sutton.Structural investigation of amorphous materials at high pressures using thediamond anvil cell. Rev. Sci. Instrum., 74:3021–3026, 2003.
[67] D He, Y Zhao, T U Sheng, R B Schwartz, J Quian, H K Mao, J Z Hu, J Shin,and J Xu. Bulk metallic glass gasket for high pressure, in situ x-ray diffraction.Rev. Sci. Instrum., 74(6):3012–3016, 2003.
[68] S Klotz, J C Chervin, P Munsch, and G Le marchand. Hydrostatic limits of 11pressure transmitting media. J. phys. D: Appl. Phy., 42:075413, 2009.
[69] J W Otto and Vassiliou J K. Nonhydrostatic compression of elasticallyanisotropic polycrystals. i. hydrostatic limits of 4:1 methanol-ethanol and paraf-fin oil. Phys. Rev. B, 57:3253–3263, 1998.
[70] I Fujishiro and et al. In T. Johannisson C.M. Backman and L. Tenger, editors,HighPressure in Science and Industry, 8th AIRAPT, Conf., 1982.
[71] T Varga, A P Wilkinson, and R J Angel. Fluorinert as a pressure-transmittingmedium for high-pressure diffraction studies. Rev. Sci. Instruments, 74:4564–4566, 2003.
[72] Yongrong Shen, Ravhi S. Kumar, Michael Pravica, and Malcolm F Nicol. Char-acteristics of silicone fluid as a pressure transmitting medium in diamond anvilcells. Rev. Sci. Instrum., 75:4450–4454, 2004.
[73] D D Ragan and et al. Silicone fluid as a high-pressure medium in diamond anvilcells. Rev. Sci. Instrum., 67:494–496, 1996.
193

References
[74] Keizo Murata, Harukazu Yoshino, Hari Om Yadav, Yoshiaki Honda, and NaokiShirakawa. Pt resistor thermometry and pressure calibration in a clampedpressure cell with the medium, daphne 7373. Rev. Sci. Instrum., 68(6):2490–2493, 1997.
[75] H K Mao and P M Bell. Observations of hydrogen at room temperature (25degree C) and high pressure (to 500 Kilobars). Science, 103:1004–1006, 1979.
[76] P M Bell and H K Mao, editors. Carnegie Inst. Yrbk, volume 80. 1981.
[77] D H Liebenberg. A new hydrostatic medium for diamond anvil cells to 300 kbarpressure. Phys. Lett. A, 73:74–76, 1979.
[78] R Lesar, S A Ekberg, L H Jones, R L Mills, L A Schwalbe, and D Schiferl.Raman spectroscopy of solid nitrogen up to 374 kbar. Solid State Comm.,32(2):131–134, 1979.
[79] J C Jamieson, J N Fritz, and M H Manghnani. High pressure research ingeophysics. 1982.
[80] G N Peggs. High pressure-high temperature. 12, 1980.
[81] Chang Sheng Zha, Ho-Kwang Mao, and Russel J. Hemley. Elasticity ofMgO and a primary pressure scale to 55 GPa. Proc. Natl. Acad. Sci. USA,97(25):13494–13499, 2000.
[82] A H Smith and A W Lawson. The velocity of sound in water as a function oftemperature and pressure. Journal of Chemical Physics, 22(3):351–359, 1954.
[83] J D Barnet, S Block, and G J Piermarini. An optical fluorescence systemfor quantitative pressure measurement in the diamond-anvil cell. Rev. Sci.Instrum., 44(1):1–8, 1973.
[84] G J Piermarini and S Block. Ultrahigh pressure diamond anvil cell and severalsemiconductor phase transition pressures in relation to the fixed point pressurescale. Rev. Sci. Instrum., 46:973–979, 1975.
[85] D L Decker. High pressure equation of state for NaCl, KCl, and CsCl. J. Appl.Phys., 42(8):3239–3244, 1971.
[86] S J Duclos, Y K Vohra, and A L Ruoff. Pressure dependence of the 4T2 and4T1 absorption bands of ruby to 35 GPa. Phys. Rev. B, 41:53725381, 1990.
[87] Sharma and et al. Theoretical analysis of R-line shifts of ruby subjected todifferent deformation conditions. Phys. Rev. B, 43(1):879–893, 1991.
[88] H K Mao and et al. Calibration of the ruby pressure gauge to 800 kbar underquasi-hydrostatic conditions. J. Geophys. Research:Solid Earth, 91:4673–4676,1986.
194

References
[89] J A Xu, H K Mao, and P M Bell. High-pressure ruby and diamond fluorescence:Observations at 0.21 to 0.55 terapascal. Science, 232:1404–1406, 1986.
[90] W L Vos and J A Schouten. On the temperature correction to the ruby pressurescale. J. Appl. Phys., 69(9):6744–6746, 1991.
[91] K Syassen. Ruby under pressure. High Pressure Res., 28(2):75, 2008.
[92] Carmen Sanchez-Valle, Isabelle Daniel, Bruno Reynard, Robert Abraham, andChristelle Goutaudier. Optimization of Sm3+ fluorescence in sm-doped yttriumaluminum garnet: Application to pressure calibration in diamond-anvil cell athigh temperature. J. Appl. Phys., 92:4349–4353, 2002.
[93] David Schiferl, Malcolm Nicol, Joseph M Zaug, S K Sharma, T F Cooney, S YWang, Thomas R Anthony, and James F Fleischer. The diamond 13C/12Cisotope raman pressure sensor system for high-temperature/pressure diamond-anvil cells with reactive samples. J. Appl. Phys., 82(7):3256–3265, 1997.
[94] A F Goncharov and et al. Optical calibration of pressure sensors for highpressures and temperatures. J. Appl. Phys., 97:094917, 2005.
[95] A P Hamersley, S O Svensson, M Hanfland, A N Fitch, and D Hausermann.Two-dimensional detector software: From real detector to idealised image ortwo-theta scan. High Pressure Res., 14:235–248, 1996.
[96] A C Larson and R B von Dreele. ”general structure analysis system (GSAS)”,los alamos national laboratory report laur, 2000.
[97] J Rodriguez-Carvajal. Recent advances in magnetic structure determination byneutron powder diffraction. Physica B, 192:55–69, 1993.
[98] K K Pandey, H K Poswal, A K Mishra, Abhilash Diwedi, R Vasanthi, NandiniGarg, and Surinder M. Sharma. Energy-dispersive x-ray diffraction beamlineat Indus-2. Pramana, 80(4):607–619, 2013.
[99] H Cole. Bragg’s law and energy sensitive detectors. J. Appl. Cryst., 3:405–406,1970.
[100] A. F. Goncharov. Raman spectroscopy at high pressures. International J. ofSpectr., 2012:617528–617543, 2011.
[101] A A Annenkov, M V Korzhik, and P Lecoq. Lead tungstate scintillation mate-rial. Nucl Instrum Methods Phys Res A, 490:30–50, 2002.
[102] M Kobayashi, M Ishi, Y Usuki, and H Yahagi. Scintillation characteristics ofPbWO4 single crystals at room temperature. Nucl Instrum Methods Phys ResA, 333:429–433, 1993.
195

References
[103] N Faure, C Borel, M Couchaud, G Basset, R Templier, and C Wyon. Opticalproperties and laser performance of neodymium doped scheelites CaWO4 andNaGd(WO4)2. Appl. Phys. B, 63:593–598, 1996.
[104] M Nikl, P Bohacek, N Mihokova, M Kobayashi, M Ishii, and Y Usuki. J.Lumin., 1136:87–89, 2000.
[105] M Nikl, P Bohacek, N Mihokova, N Solovieva, A Vedda, and M Martini. En-hanced efficiency of PbWO4:mo,nb scintillator. J. Appl. Phys., 91:5041, 2002.
[106] A Brenier, G Jia, and C Tu. Raman lasers at 1.171 and 1.517 m withself-frequency conversion in SrWO4:Nd3+ crystal. J. Phys. Condens. Matter,16:9103–9108, 2004.
[107] S Chernov, R Deych, L Grigorjeva, and D Millers. Luminescence and transientoptical absorption in CdWO4. Mater. Sci. Forum, 239:299–302, 1997.
[108] A Navrotsky. Rev. Mineral Geochem, 44:73, 2001.
[109] M Marques, M Florez, J M Recio, L Gerward, and J S Olsen. Structure andstability of ZrSiO4 under hydrostatic pressure. Phys. Rev. B, 74:014104–014112,2006.
[110] X Wang, I Loa, K Syassen, M Hanfland, and B Ferrand. Structural propertiesof the zircon- and scheelite-type phases of YVO4 at high pressure. Phys. Rev.B, 2004:064109–064114, 2004.
[111] A Jayaraman, G A Kourouklis, G P Espinosa, A S Cooper, and L G VanUitert. A high-pressure raman study of yttrium vanadate (YVO4) and thepressure-induced transition from the zircon-type to the scheelite-type structure.J. Phys. Chem. Sol., 48:755, 1987.
[112] S J Duclos, A Jayaraman, G P Espinosa, A S Oxper, and R G Maines. Ramanand optical absorption studies of the pressure-induced zircon to scheelite struc-ture transformation in TbVO4 and DyVO4. J. Phys. Chem. Sol., 50(8):769–775,1989.
[113] Elise Knittle and Q Williams. High-pressure raman spectroscopy of ZrSiO4:Observation of the zircon to scheelite transition at 300 k. Amercan Mineral,78:245–252, 1993.
[114] H Leroux, W U Reimold, C Koeberl, U Hornemann, and J C Doukhan. Experi-mental shock deformation in zircon: a transmission electron microscopic study.Earth & Planetary Science Lett., 169:291–301, 1999.
[115] K Kusaba, T Yagi, M Kikuchi, and Y Syono. Structural considerations on themechanism of the shock-induced zircon-scheelite transition in ZrSiO4. J. Phys.Chem. Sol., 47:675–679, 1986.
196

References
[116] M B Smirnov, A P Mirgorodsky, V Yu Kazimirov, and R Guinebretire. Bond-switching mechanism for the zircon-scheelite phase transition. Phys. Rev. B,78:094109–094119, 2008.
[117] M J Florez, J Conteras Garcıa, and J M Recio. Quantum-mechanical cal-culations of zircon to scheelite transition pathways in ZrSiO4. Phys. Rev. B,79:104101–14111, 2009.
[118] E Stavrou, A Tatsi, E Salpea, Y C Boulmetis, A G Kontos, Y S Raptis, andC Raptis. J. Phys. Conf. Series, 121:042016, 2008.
[119] Y W Long, L X Yang, Y Yu, F Y Li, R C Yu, S Ding, Y L Liu, and C QJin. High-pressure raman scattering and structural phase transition in YCrO4.Phys. Rev. B, 74:054110–054115, 2006.
[120] R Mittal, A B Garg, V Vijayakumar, S N Achary, A K Tyagi, B K Godwal,E Busetto, A Lausi, and S L Chaplot. Investigation of the phase stabilityof LuVO4 at high pressure using powder x-ray diffraction measurements andlattice dynamical calculations. J. Phys.:Condens. Mat., 20:075223, 2008.
[121] Alka B Garg, Rekha Rao, T Sakuntala, B N Wani, and V Vijayakumar. Phasestability of YbVO4 under pressure: In situ x-ray and raman spectroscopic in-vestigations. J. Appl. Phys., 106:063513, 2009.
[122] Surinder Mohan Sharma and Satinder Kumar Sikka. Pressure induced amor-phization of materials. Prog. Mater. Sci., 40(1):1–77, 1996.
[123] S H Tolbert and A P Alivisatos. The wurtzite to rock salt structural transforma-tion in CdSe nanocrystals under high pressure. J. Chem. Phys., 102:4642–4656,1995.
[124] A San-Miguel. Nanomaterials under high-pressure. Chem. Soc. Rev., 35:876,2006.
[125] J M McHale, A Auroux, A J Perrotta, and A Navrotsky. Surface energies andthermodynamic phase stability in nanocrystalline aluminas. Science, 277:788–791, 1997.
[126] M R Ranade, A Navrotsky, H Z Zhang, J F Banfield, S H Elder, A Zaban, P HBorse, S K Kulkarni, G S Doran, and H J Whitfield. PNAS, 99:6476, 2002.
[127] J Z Jiang. Phase transformations in nanocrystals. J. Mat. Sci, 39:5103, 2004.
[128] W J Weber, R C Ewing, and L M Wang. The radiation-induced crystalline-to-amorphous transition in zircon. J. Mater. Res., 9:688–698, 1994.
[129] U A Glasmacher, M Lang, H Keppler, F Langenhorst, R Neumann, D Schardt,C Trautmann, and G A Wagner. Phase transitions in solids stimulated bysimultaneous exposure to high pressure and relativistic heavy ions. Phys. Rev.Lett., 96:195701–195704, 2006.
197

References
[130] M Lang, F Zhang, J Lian, C Trautmann, R Neumann, and R C Ewing.Irradiation-induced stabilization of zircon (ZrSiO4) at high pressure. Earth& Planetary Science Lett., 269:291–295, 2008.
[131] H K Mao, J Xu, and P M Bell. Calibration of the ruby pressure gauge to 800kbar under quasi-hydrostatic conditions. J. Geophys., 91(B5):4673–4676, 1986.
[132] A Dewaele, P Loubeyre, and M Mezouar. Equations of state of six metals above94 GPa. Phys.Rev. B, 70:094112–094119, 2004.
[133] S H Tolbert, A B Herhold, Louis E Brus, and A P Alivisatos. Pressure-inducedstructural transformations in si nanocrystals: Surface and shape effects. Phys.Rev. Lett., 76:4384–4387, 1996.
[134] Juanita N Wickham, Amy B Herhold, and A P Alivisatos. Shape change as anindicator of mechanism in the high-pressure structural transformations of CdSenanocrystals. Phys. Rev. Lett., 84:923–926, 2000.
[135] H Ozkan and J C Jamieson. Pressure dependence of the elastic constants ofnonmetamict zircon. Phys. Chem. Minerals, 2:215–224, 1978.
[136] A. K. Mishra, Nandini Garg, K. K. Pandey, K. V. Shanavas, A. K. Tyagi, andSurinder M. Sharma. Zircon-monoclinic-scheelite transformation in nanocrys-talline chromates. Physical Review B, 81(10):104109, 2010. PRB.
[137] E C Pascual, J R de Paz, J M G Amores, and R S Puche. Solid State Science,9:574, 2007.
[138] P Toledano and D Macon. Structural mechanism leading to a ferroelastic glassstate: Interpretation of amorphization under pressure. Phys. Rev. B, 71:024210–024219, 2005.
[139] M Catti. On the P 21/m and pmmn pathways of the B1B2 phase transition inNaCl: a quantum-mechanical study. J. Phys.:Condens. Mat., 16:3909, 2004.
[140] P T Jochym and K Parlinski. Elastic properties and phase stability of AgBrunder pressure. Phys.Rev. B, 65:024106, 2001.
[141] M S Somayazulu, Surinder M Sharma, and S K Sikka. Structure of a new highpressure phase in α-Quartz determined by molecular dynamics studies. Phys.Rev. Lett., 73:98–101, 1994.
[142] A Jayaraman, B Batlogg, and L G VanUitert. High-pressure raman studyof alkaline-earth tungstates and a new pressure-induced phase transition inBaWO4. Phys. Rev. B, 28:4774–4777, 1983.
[143] A Jayaraman, B Batlogg, and L G VanUitert. Effect of high pressure on theraman and electronic absorption spectra of PbMoO4 and PbWO4. Phys. Rev.B, 31:5423–5427, 1985.
198
References
[144] D Christofilos, S Ves, and G A Kourouklis. Pressure induced phase transitionsin alkaline earth tungstates. Phys. Status Solidi (b), 198:539–544, 1996.
[145] D Christofilos, K Papagelis, S Ves, G A Kourouklis, and C Raptis. High-pressureraman study and lattice dynamical calculations for SrWO4. J. Phys.:Condens.Mat., 14:12641–12650, 2002.
[146] D Errandonea, M Somayazulu, and D Hausermann. CaWO4: A new high-pressure and high-temperature phase. Phys. Status Solidi (b), 231:R1–R3, 2002.
[147] D Errandonea, M Somayazulu, and D Hausermann. Phase transitions andamorphization of CaWO4 at high pressure. Phys. Status Solidi (b), 235:162–169, 2003.
[148] A Grzechnik, W A Crichton, M Hanfland, and S Van Smaalen. Scheelite CaWO4
at high pressures. J. Phys.:Condens. Mat., 15:7261–7270, 2003.
[149] V Panchal, N Garg, A K Chauhan, B Sangeeta, and S M Sharma. High pressurephase transitions in BaWO4. Solid State Communications, 130:203–208, 2004.
[150] D Errandonea, J Pellicer-Porres, F J Manjon, A Segura, Ch Ferrer-Roca, R SKumar, O Tschauner, P Rodriguez-Hernandez, J Lopez-Solano, A Mujica,A Munoz, and G Aquilanti. High-pressure structural study of the scheelitetungstates CaWO4 and SrWO4. Phys. Rev. B, 64:174106–174116, 2005.
[151] D Errandonea and et al. Effects of pressure on the local atomic structure ofCaWO4 and YLiF4: mechanism of the scheelite-to-wolframite and scheelite-to-fergusonite transitions. J. Solid State Chem., 177:1087–1097, 2004.
[152] A Sen, S L Chaplot, and R Mittal. Rigid ion model of lattice dynamics in thelaser host fluoroscheelites LiYF4 and LiYbF4. Phys. Rev. B, 64:024304–024309,2001.
[153] S Salun, M T Fornoni, A Bulou, M Rousseau, P Simon, and J Y Gesland. J.Phys.:Condens. Mat., 9:6957, 1997.
[154] A Grzechnik, K Syassen, I Loa, M Hanfland, and J Y Gesland. Scheelite to fer-gusonite phase transition in YLiF4 at high pressures. Phys. Rev. B, 65:104102–104107, 2002.
[155] A Grzechnik, W A Crichton, P Bouvier, V Dmitriev, and J Y Gesland. De-composition of LiGdF4 scheelite at high pressures. J. Phys.:Condens. Mat.,16:7779–7786, 2004.
[156] Sa Li, R. Ahuja, and B Johansson. Wolframite: the post-fergusonite phase inYLiF4. J. Phys.:Condens. Mat., 16:s983, 2004.
[157] A Sen, S L Chaplot, and R Mittal. Molecular dynamics simulation of pressure-induced phase transitions in LiYF4 and LiYbF4. Phys. Rev. B, 68:134105–1341112, 2003.
199

References
[158] R E Thoma, C F Wearer, H Insley, L A Harris, and H A Jr Yarkel. J. Phys. C:Solid State Phys., 65:1096, 1961.
[159] V Ya Markiv, N M Belyavina, M V Markiv, Yu A Titov, A M Sych, A NSokolov, A A Kapshuk, and M S Slobodyanyk. Peculiarities of polymorphictransformations in YbTaO4 and crystal structure of its modifications. J. Alloysand Compounds, 346:263–268, 2002.
[160] M A Subramanian, G Aravamudan, and G V Subba Rao. Prog. Solid StateChem., 15:55, 1983.
[161] A E Ringwood, S Kesson, N G Ware, W Hobberson, and A Major. Immobili-sation of high level nuclear reactor wastes in SYNROC. Nature, 278:219–223,1979.
[162] R C Ewing, W J Weber, and Lian. Nuclear waste disposal of pyrochlore(A2B2O7): Nuclear waste form for the immobilization of plutonium and mi-nor actinides. J. Appl. Phys., 95:5949–5971, 2004.
[163] K V G Kutty, E Asuvathraman, R R Madhavan, and H Jena. Actinide immo-bilization in crystalline matrix: a study of uranium incorporation in gadoliniumzirconate. J. Phys. Chem. Sol., 66:596–601, 2005.
[164] J E Greedan. Structure and magnetism in λ-MnO2. geometric frustration in adefect spinel. Chem. Mater., 10:3058–3067, 1998.
[165] R Moessner and A P Ramirez. Geometrical frustration. Phys. Today, 59(2):24–29, 2006.
[166] J S Gardner, S R Dunsiger, B D Gaulin, M J P Gingras, and et al. Coopera-tive paramagnetism in the geometrically frustrated pyrochlore antiferromagnetTb2Ti2O7. Phys. Rev. Lett., 82:1012–1015, 1999.
[167] Mirebeau, I N Goncharenko, P Cadavez-Peres, S T Bramwell, M J P Gingras,and J S Gardner. Pressure-induced crystallization of a spin liquid. Nature,420:54–57, 2002.
[168] Surajit Saha, D V S Muthu, C Pascanut, N Dragoe, R Suryanarayanan,GDhalenne, A Revcolevschi, Sukanta Karmakar, Surinder M Sharma, and A KSood. High-pressure raman and x-ray study of the spin-frustrated pyrochloreGd2Ti2O7. Phys. Rev. B, 74:064109–064115, 2006.
[169] Surajit Saha, D V S Muthu, Surjeet Singh, B Dkhil, R Suryanarayanan,G Dhalenne, H K Poswal, Sukanta Karmakar, Surinder M Sharma,A Revcolevschi, and A K Sood. Low-temperature and high-pressure raman andx-ray studies of pyrochlore Tb2Ti2O7: Phonon anomalies and possible phasetransition. Phys. Rev. B, 79:134112–134120, 2009.
200

References
[170] T T A Lummen, I P Handayani, M C Donker, D Fausti, G Dhalenne, P Berthet,A Revcolevschi, and P H M van Loosdrecht. Phonon and crystal field excita-tions in geometrically frustrated rare earth titanates. Phys. Rev. B, 77:214310–214320, 2008.
[171] J P C Ruff, B D Gaulin, J P Castellan, K C Rule, J P Clancy, J Rodriguez, andH A Dabkowska. Structural fluctuations in the spin-liquid state of Tb2Ti2O7.Phys. Rev. Lett., 99:237202–23205, 2007.
[172] S H Curnoe. Structural distortion and the spin liquid state in Tb2Ti2O7. Phys.Rev. B, 78:094418–094422, 2008.
[173] F X Zhang, B Manoun, S K Saxena, and C S Zha. Structure change of py-rochlore Sm2Ti2O7 at high pressures. Appl. Phys. Lett., 86:181906–181908,2005.
[174] P R Scott, A Midgley, O Musaev, D V S Muthu, S Singh, R Suryanarayanan,A Revcolevschi, A K Sood, and M B Kruger. High-pressure synchrotron x-raydiffraction study of the pyrochlores: Ho2Ti2O7, Y2Ti2O7 and Tb2Ti2O7. HighPressure Res., 31:219–227, 2011.
[175] R S Kumar, A L Cornelius, M F Nicol, K C Kam, A K Cheetham, and J SGardner. Pressure-induced structural transitions in Tb-pyrochlore oxides. Appl.Phys. Lett., 88:031903–031905, 2006.
[176] H W J Blote, R F Wielinga, and W J Huiskamp. Physica, 43:549, 1964.
[177] J A Hodges, P Bonville, A Forget, and et al. First-order transition in the spindynamics of geometrically frustrated Yb2Ti2O7. Phys. Rev. Lett., 88:077204–077207, 2002.
[178] J S Gardner, G Ehlers, N Rosov, R W Erwin, and C Peetrovic. Spin-spincorrelations in Yb2Ti2O7: A polarized neutron scattering study. Phys. Rev. B,70:180404 –180407(R), 2004.
[179] A P Ramirez and et al. Zero-point entropy in ’spin ice’. Nature, 399:333–335,1999.
[180] M J Harris and et al. Geometrical frustration in the ferromagnetic pyrochloreHo2Ti2O7. Phys. Rev. Lett., 79:2554–2557, 1997.
[181] Pauling, editor. The Nature of Chemical Bond. Cornell UNiversit Press, 1945.
[182] D J P Morris and et al. Dirac strings and magnetic monopoles in the spin iceDy2Ti2O7. Science, 326:411–414, 2009.
[183] A K Mishra, H K Poswal, M Sharma Suriinder, S Saha, D V S Muthu, S Singh,R Suryanarayanan, A Revcolevschi, and A K Sood. The study of pressureinduced structural phase transition in spin-frustrated Yb2Ti2O7 pyrochlore. J.Appl. P, 111:033509, 2012.
201

References
[184] F X Zhang, J Lian, U Becker, R C Ewing, Jingzhu Hu, and S K Saxena.High-pressure structural changes in the Gd2Zr2O7 pyrochlore. Phys. Rev. B,76:214104–214108, 2007.
[185] Li Zhu, H Wang, Y Wang, and et al. Substitutional alloy of Bi and Te at highpressure. Phys. Rev. Lett., 106:145501–145504, 2011.
[186] S Bhagavantam and T Venkatryudu. Raman effect in relation to crystal struc-ture. Proc. Indian Acad. Sci. Sect., A9(3):224–258, 1939.
[187] M T Vandenborre, E Husson, J P Chatry, and D Michel. Rare-earth titanatesand stannates of pyrochlore structure; vibrational spectra and force fields. J.Raman Spectros., 14:63–71, 1983.
[188] H C Gupta, Sonal Brown, Neelima Rani, and V B Gohel. Lattice dynamicinvestigation of the zone center wavenumbers of the cubic A2Ti2O7 pyrochlores.J. Raman Spectros., 32:41–44, 2001.
[189] M Maczka, J Hanuza, and K Henuza. You have full text access to thiscontenttemperature-dependent raman scattering studies of the geometricallyfrustrated pyrochlores Dy2Ti2O7, Gd2Ti2O7 and Er2Ti2O7. J. Raman Spec-tros., 39:537–544, 2008.
[190] Surajit Saha, Surjeet Singh, B Dkhil, S Dhar, R Suryanarayanan, G Dhalenne,A Revcolevschi, and A K Sood. Temperature-dependent raman and x-ray stud-ies of the spin-ice pyrochlore Dy2Ti2O7 and nonmagnetic pyrochlore Lu2Ti2O7.Phys. Rev. B, 78:214102–21411, 2008.
[191] Nandini Garg, K K Pandey, Chitra Murli, K V Shanavas, Balaji Mandal, A KTyagi, and Surinder M Sharma. Decomposition of lanthanum hafnate at highpressures. Phys. Rev. B, 77:214105–214112, 2008.
[192] L H Brixner. Preparation and properties of the Ln2Ti2O7-type rare earth ti-tanate. Inorg. Chem., 3:1065, 1964.
[193] M Maczka, M L Sanjuan, A F Fuentes, L Macalik, J Hanuja, K Matusuhira,and Z Hiroi. Temperature-dependent studies of the geometrically frustratedpyrochlores Ho2Ti2O7 and Dy2Ti2O7. Phys. Rev. B, 79:214437–214449, 2009.
[194] M W Davidson and G F Lofgren. Photomicrography in the geological sciences.Journal of Geological Education, 39:403–422, 1991.
[195] A Navrotsky. Perovskite: A Structure of Great Interest to Geophysics andMaterials Science. Am. Geophys. Union, Washington DC, 1991.
[196] S H Shim. The postperovskite transition. Annu. Rev. Earth Planet. Sci.,36:569–599, 2008.
202
References
[197] S Ono and A R Oganov. In situ observations of phase transition betweenperovskite and CaIrO3-type phase in MgSiO3 and pyrolitic mantle composition.Earth Planet. Sci. Lett., 236:914–932, 2005.
[198] C D Martin, W A Crichton, H Liu, and V Prakapenka. Phase transitions andcompressibility of NaMgF3 (neighborite) in perovskite- and post-perovskite-related structures. Geophys. Res. Lett., 33:L11305–L11308, 2006.
[199] S Yakovlev, M Avdeev, and M Mezouar. High-pressure structural behavior andequation of state of NaZnF3. Journal of Solid State Chemistry, 182:1545–1549,2009.
[200] R J Angel, J Zhao, and N L Ross. General rules for predicting phase transitionsin perovskites due to octahedral tilting. Phys. Rev. Lett, 95:025503–025506,2005.
[201] A Kulkarni, FT Ciacchi, S Giddey, C Munnings, S P S Badwal, J A Kimpton,and D Fini. Mixed ionic electronic conducting perovskite anode for direct carbonfuel cells. International Journal of Hydrogen Energy, 37(24):19092–19102, 2012.
[202] Y Tokura. Multiferroics as quantum electromagnets. Science, 312(1481):1481–1482, 2006.
[203] M Bibes and A Barthelemy. Multiferroics: Towards a magnetoelectric memory.Nature Material, 7:425–426, 2008.
[204] C J Howard and H T Stokes. Structures and phase transitions in perovskites -a group-theoretical approach. Acta Cryst, 61:93–111, 2005.
[205] N A Spaldon. J. Phys. Chem. B, 104:6694, 2000.
[206] R Ramesh and N A Spaldon. Multiferroics: progress and prospects in thinfilms. Nature Material, 6:21–29, 2007.
[207] S W Cheong and M Mostovoy. Multiferroics: a magnetic twist for ferroelectric-ity. Nature Material, 6:13–20, 2007.
[208] P Fischer, M Polomska, I Sosnowska, and M Szymanski. Temperature depen-dence of the crystal and magnetic structures of BiFeO3. J. Phys. C:Solid StatePhysics, 13:1931–1940, 1980.
[209] F Kubel and H Schmid. Perovskite-like fluorides. i. structures of KMnF3, KFeF3,KNiF3 and KZnF3. crystal field effects in the series and in KCrF3 and KCuF3.Acta Crystallogr. Sect. B: Struct. Sci., 46:698–702, 1990.
[210] R Haumont, J Kreisel, and P Bouvier. Raman scattering of the model multifer-roic oxide BiFeO3: effect of temperature, pressure and stress. Phase Transitions,79:1043–1064, 2006.
203

References
[211] R Haumont, P Bouvier, A Pashkin, K Rabia, S Frank, B Dkhil, W A Crichton,C A Kuntscher, and J Kreisel. Effect of high pressure on multiferroic BiFeO3.Phys. Rev. B, 79:184110–184119, 2009.
[212] A G Gavriliuk, V V Struzhkin, I S Lyubutin, S G Ovchinnokov, M Y Hu, andP Chow. Another mechanism for the insulator-metal transition observed inmott insulators. Phys. Rev. B, 77:15512, 2008.
[213] J L Zhu, S M Feng, L J Wang, C Q Jin, X H Wang, L T Li, Y C Li, X D Li,and J Liu. Structural stability of multiferroic BiFeO3. High Press. Research,30:265–272, 2010.
[214] A A Belik, H Yusa, N Hirao, Y Ohishi, and E Takayama-Muromachi. Structuralproperties of multiferroic BiFeO3 under hydrostatic pressure. Chem. Mater.,21(14):3400–3405, 2010.
[215] M Guennon, P Bouvier, R Haumont, G GarbarinoJ, and J Kriesel. High-pressure phase transitions in BiFeO3: hydrostatic vs. non-hydrostatic condi-tions. Phase Transitions, 84:474–482, 2011.
[216] P Ravindran, R Vidya, A Kjekshus, H Fjellvag, and O Eriksson. Theo-retical investigation of magnetoelectric behavior in BiFeO3. Phys. Rev. B,74(224412):224412–224429, 2006.
[217] O E G Vazquez and J Iniguez. Pressure-induced structural, electronic, andmagnetic effects in BiFeO3. Phys. Rev. B, 79:064102–064107, 2009.
[218] O Dieguez, O E Gonzalez-Vazquez, J C Wojdel, and J Iniguez. First-principles predictions of low-energy phases of multiferroic BiFeO3. Phys. Rev.B, 83:094105–094117, 2011.
[219] A K Mishra, K V Shanavas, H K Poswal, B P Mandal, Nandini Garg, andSurinder M. sharma. Pressure induced phase transitions in multiferroic BiFeO3.Solid State Communications, 154:72–76, 2013.
[220] J D Bucci, B K Robertson, and W J James. The precision determination ofthe lattice parameters and the coefficients of thermal expansion of BiFeO3. J.Applied Crystallography, 5:187–191, 1972.
[221] R. Shirley. The crysfire system for automatic powder indexing. 1999.
[222] K IKobayashi, T Kimura, H Sawada, K Terakura, and Y Tokura. Room-temperature magnetoresistance in an oxide material with an ordered double-perovskite structure. Nature, 395:677–680, 1998.
[223] M De Marco, H A Blackstead, J D Dow, M K Wu, D Y Chen, E Z Chien,H Haka, S Toorongian, and J Fridmann. Magnetic phase transition in super-conducting Sr2YRu0.95Cu0.05O6 observed by the 99ru mssbauer effect. Phys.Rev. B, 62:14301–14303, 2000.
204

References
[224] D D Sarma, S Ray, K Tanaka, M Kobayashi, A Fujimoi, P Sanyal, H R Kr-ishnamurthy, and C Dasgupta. Intergranular magnetoresistance in Sr2FeMoO6
from a magnetic tunnel barrier mechanism across grain boundaries. Phys. Rev.Lett., 98:157205–157208, 2007.
[225] O Chmaissem, R Kruk, B Dabrowski, D E Brown, X Xiong, S Kolesnik, J DJorgensen, and C W Kimball. Structural phase transition and the electronicand magnetic properties of Sr2FeMoO6. Phys. Rev. B, 62:14197–14206, 2000.
[226] Y Moritomo, S Xu, A Machida, T Akimoto, E Nishibori, M Takata, M Sakata,and K Ohoyama. Crystal and magnetic structure of conducting double per-ovskite Sr 2FeMoO6. J. Phys. Soc. Japan, 69:1723, 2000.
[227] A K Mishra, H K Poswal, S N Acharya, A K Tyagi, and Surinder M Sharma.Structural evolution of double perovskite Sr2MgWO6 under high pressure. Phys.Status Solidi B, 247(7):1773–1777, 2010.
[228] S N Achary, K R Chakraborty, S J Patwe, A B Shinde, P S R Krishna, andA K Tyagi. Anisotropic thermal expansion behavior in tetragonal Sr2MgWO6.Material, 41:674–682, 2006.
[229] S J Patwe, S N Achary, M D Mathews, and A K Tyagi. Synthesis, phasetransition and thermal expansion studies on M2MgWO6 (M = Ba2+ and Sr2+)double perovskites. Journal of alloys and compounds, 390:100, 2005.
[230] P Zhao, R C Yu, F Y Li, and Z X Liu. Structural stability and electricalproperties of Sr2FeMoO6 under high pressure. J. Appl. Phys., 92:1942–1944,2002.
[231] B Manoun, J M Igartua, M Gateshki, and S K Saxena. High-pressure ramanstudy of the Sr2CaWO6 double perovskite. J. Phys.: Condens. Matter, 16:8367,2004.
[232] S A Korba, H Meradji, S Ghemid, and B Bouhafs. First principles calculations ofstructural, electronic and optical properties of BaLiF3. Comput. Mat. Science,44:1265–1271, 2009.
[233] G Vaitheeswaran, V Kanchana, R S Kumar, A L Cornelius, M F Nicol, A Svane,N E Christensen, and O Eriksson. High-pressure structural study of fluoro-perovskite CsCdF3 up to 60 GPa: A combined experimental and theoreticalstudy. Phys. Rev. B, 81:075105–075110, 2010.
[234] W Xiaoa and et al. PNAS, 107:14026, 2010.
[235] J Zhao, N L Ross, and R J Angel. Estimation of polyhedral compressibilitiesand structural evolution of GdFeO3-type perovskites at high pressures. ActaCryst B, 62:431–439, 2006.
205

References
[236] K Shimamura, S L Baldochi, N Mujilatu, K Nakano, Z Liu, N Sarukura, andT Fukuda. Growth of Ce-doped LiCaAlF6 and LiSrAlF6 single crystals bythe czochralski technique under CF4atmosphere. J.Cryst.Growth, 211 : 302 −−307, 2000.
[237] F Aguado, F Rodriguez, S Hirai, J N Walsh, A R Lennie, and S A T Redfern.High-pressure behaviour of KMF3 perovskites. High Press. Research, 28:539–544, 2008.
[238] F Aguadoa, F Rodrgueza, and S A T Redfern. A-cation effect on the compress-ibility of ACoF3 perovskites. High Press. Research, 29:525–529, 2009.
[239] R M Hazen and L W Finger. Bulk modulus-volume relationship for cation-anionpolyhedra. J. Geophys. Res., 84:6723–6728, 1979.
[240] D Errandonea, J Pellicer-Porres, FJ Manjon, and et al. High-pressure structuralstudy of the scheelite tungstates CaWO4 and SrWO4. Phys. Rev. B, 72:174106–174119, 2005.
[241] LC Ming, A Jayaraman, S R Shieh, and Y H Kim. In situ high-pressure x-ray-diffraction study of TlReO4 to 14.5 GPa: Pressure-induced phase transforma-tions and the equation of state. Phys. Rev. B, 51:12100–12106, 1995.
[242] H P Scott, Q Williams, and E Knittle. Ultralow compressibility silicate withouthighly coordinated silicon. Phys. Rev. Lett, 88:015506–015509, 2002.
[243] M L Cohen. Calculation of bulk moduli of diamond and zinc-blende solids.Phys. Rev. B, 32:7988–7991, 1985.
[244] S Salaun and M Rousseau. Determination of the fluorine-fluorine potential influoroperovskites and prediction of phonon dispersion curves. Phys. Rev. B,51:15867–15872, 1995.
[245] A K Mishra, Nandini Garg, K V Shanavas, S N Achary, A K Tyagi, andSurinder M Sharma. High pressure structural stability of BaLiF3. Journalof Applied Physics, 110:123505, 2011.
[246] A Boumriche, J Y Gesland, A Bulou, and M Rousseau. Structure and dynamicsof the inverted perovskite BaLiF3. Solid State Communications, 91:125, 1994.
[247] J Wang, S Yip, S R Phillpot, and D Wolf. Crystal instabilities at finite strain.Phys. Rev. Lett, 71:4182–4185, 1993.
[248] D G Pettifor. Theoretical predictions of structure and related properties ofintermetallics. Material Science and technology, 8(4):345, 1992.
[249] S F Pugh. Relations between the elastic moduli and the plastic properties ofpolycrystalline pure metals. Phil. Mag., 45:823–843, 1954.
206

References
[250] K Chen, L R Zhao, J Rodgus, and J S Tse. Alloying effects on elastic propertiesof TiN-based nitrides. J. Phys. D. Appl. Phys., 36:2725–2729, 2003.
[251] W Schreyer and J F Schairer. Compositions and structural states of anhydrousmg-cordierite: a re-investigation of the central part of the system MgO-Al2O3-SiO2. J. Petrology, 2:324, 1961.
[252] Chitra Murli, Surinder Mohan Sharma, S K Kulshreshtha, and Satinder KumarSikka. High pressure study of phase transitions in alpha-FePO4. Pramana-Journal of Physics, 49:285–291, 1997.
[253] Suriinder Mohan Sharma, Nandini Garg, and Satinder Kumar Sikka. High-pressure x-ray-diffraction study of α-AlPO4. Phys. Rev. B, 62:8824–8827, 2000.
[254] Nandini Garg and Surinder Mohan Sharma. A molecular dynamical investiga-tion of high pressure phase transformations in berlinite (α − AlPO4). Journalof Condens. Matter, 12:375–397, 2000.
[255] J P Porres, A M Saitta, A Polian, J P Itie, and M Hanfland. Six-fold-coordinated phosphorous by oxygen in AlPO4 quartz homeotype under highpressure. Nature Materials, 6:700–702, 2007.
[256] B A Bender, T L Jessen, and S Browning. Ceram. Eng. Sci. Prod, 16:613, 1995.
[257] M M Olken, R N Biagioni, and A B Ellis. Excited-state properties of lamellarsolids derived from hydrogen uranyl phosphate. Inorg. Chem., 22:4128, 1983.
[258] M Pham-Thi and Ph Colombai. Morphological, x-ray and vibrational studyof various uranyl phosphate hydrates. J. Less-Common Mat., 108(2):189–216,1985.
[259] B Morosin. Hydrogen uranyl phosphate tetrahydrate, a hydrogen ion solidelectrolyte. Acta Crystallogr. Sect B, 34:3732–3734, 1978.
[260] B Morosin. Structural mechanism for H+ ion conductivity in HUP. Phys. Lett.A, 65:53–54, 1978.
[261] G J Hutchins, C S Heneghan, I D Hudson, and S H Taylor. Catalysts for thedestruction of chloro-organic compounds. Nature, 384:341–343, 1996.
[262] S H Taylor and S R Oileary. A study of uranium oxide based catalysts for theoxidative destruction of short chain alkanes. Applied Catalysis B: Environmen-tal, 25:137–149, 2000.
[263] H P Kirchner, K M Merz, and W R Brown. Thermal expansion of uraniumpyrophosphate and of ceramic bodies in the system UO2:UP2O7. J. Am. Ceram.Soc., 46(3):137–141, 1963.
207

References
[264] P Benard, D Louer, N Dacheux, V Brandel, and M Genet. Synthesis, ab initiostructure determination from powder diffraction and spectroscopic propertiesof a new diuranium oxide phosphate. Anal Quim., 92:79–87, 1996.
[265] G Wallez, S Launay, M Quarton, N Dacheux, and Jean-Louis Soubeyroux. Whydoes uranium oxide phosphate contract on heating? J. Solid State Chem.,177(10):3575–3580, 2004.
[266] N Khosrovani, V Korthnis, and A W Sleight. Unusual 180 P-O-P angles inZr2P2O7. Inorg. Chem., 35:485–498, 1996.
[267] T A Mary, J S O Evans, A W Sleight, and T Vogt. Negative thermal expansionfrom 0.3 K to 1050 K in ZrW2O8. Science, 272:90–92, 1996.
[268] Nandini Garg, Vinod Panchal, Avesh Kumar Tyagi, and Surinder MohanSharma. Pressure-induced phase transitions in Al2(WO4)3. Journal of SolidState Chemistry, 178:998–1002, 2005.
[269] Nandini Garg, Chitra Murli, Avesh Kumar Tyagi, and Surinder Mohan Sharma.Phase transitions in Sc2(WO4)3 under high pressure. Phys. Rev. B, 72:064106–064112, 2005.
[270] Sukanta Karmakar, Sudip Kumar Deb, Avesh Kumar Tyagi, and Surinder Mo-han Sharma. Pressure-induced amorphization in Y2(WO4)3: in situ x-raydiffraction and raman studies. Journal of Solid State Chemistry, 177(11):4087–4092, 2004.
[271] T R Ravindran, A K Arora, and T A Mary. High pressure behavior of ZrW2O8:Gruneisen parameter and thermal properties. Phys. Rev. Lett, 84:3879–3882,2000.
[272] T R Ravindran, A K Arora, and T A Mary. High-pressure raman spectroscopicstudy of zirconium tungstate. J. Phys.: Condens.Matter, 13:11573, 2001.
[273] B Chen, D V S Muthu, Z X Liu, and et al. High-pressure raman and infraredstudy of HfW2O8. Phys. Rev. B, 64:214111–214116, 2001.
[274] S K Sikka. Negative thermal expansion and its relation to high pressures. J.Phys.: Condens. Matter, 16:S1033, 2004.
[275] V Brandel, N Dacheux, M Genet, and R Podor. Hydrothermal synthesis andcharacterization of the thorium phosphate hydrogenphosphate, thorium hydrox-ide phosphate, and dithorium oxide phosphate. Journal of Solid State Chem-istry, 159(1):139–148, 2001.
[276] V Brandel, N Clavier, and N Dacheux. Synthesis and characterization of ura-nium (IV) phosphate-hydrogenphosphate hydrate and cerium (IV) phosphate-hydrogenphosphate hydrate. J. Solid State Chem., 178:1054–1063, 2005.
208

References
[277] S D Senanayake, R Roussean, D Colegrave, and H Idriss. Raman vibrationalspectra using 488 nm blue laser of polycrystalline UO2 and α-U3O8. J. NuclearMat., 342:179–187, 2005.
[278] P Benard, D Louer, N Dacheux, V Brandel, and M Genet. U(UO2)(PO4)2,a new mixed-valence uranium orthophosphate: Ab initio structure determina-tion from powder diffraction data and optical and x-ray photoelectron spectra.Chem. Mater., 6:1049–1058, 1994.
[279] H Cole. Bragg’s law and energy sensitive detectors. J. Appl. Cryst., 3:405, 1970.
[280] R D Schuiling. Is there a nuclear reactor at the center of the earth? Earth,Moon and Planets, 99:33–49, 2006.
[281] A Lindbaum and et al. High-pressure crystal structures of actinide elements to100 GPa. J. Phys.:Condens. matter, 15:S2297, 2003.
[282] M P Brown and K Austin. The New Physique. Publisher City, 2005.
[283] M P Brown and K Austin. Appl. Phys. Letters, 85:2503–2504, 2004.
[284] Hitoshi Yusa, Takumi Kikegawa, and et al. Investigations of high-pressurephase sequence in ytterbium sesquioxides at room temperature. Photon FactoryActivity Report, page 195, 2010.
[285] David L Bish. Modern Powder Diffraction.
[286] H M Rietveld. A profile refinement method for nuclear and magnetic structures.Journal of Applied Crystallography, 2:65–71, 1969.
[287] B H Toby. EXPGUI, a graphical user interface for GSAS. Journal of AppliedCrystallography, 34:210, 2001.
[288] LeBail, H Duroy, and J L Foourquet. Ab-initio structure determination ofLiSbWO6 by x-ray powder diffraction. Material Research Bulletin, 23:447–452,1988.
[289] P Thompson, D E Cox, and J B Hastings. Rietveld refinement of debye-scherrer synchrotron x-ray data from Al2O3. Journal of Applied Crystallography,20(2):79–83, 1987.
209