High pressure behavior of nano-crystalline CeO2up to 35 GPa: a Raman investigation
13
PLEASE SCROLL DOWN FOR ARTICLE This article was downloaded by: [CSIR eJournals Consortium] On: 20 May 2011 Access details: Access Details: [subscription number 934171170] Publisher Taylor & Francis Informa Ltd Registered in England and Wales Registered Number: 1072954 Registered office: Mortimer House, 37- 41 Mortimer Street, London W1T 3JH, UK High Pressure Research Publication details, including instructions for authors and subscription information: http://www.informaworld.com/smpp/title~content=t713679167 High pressure behavior of nano-crystalline CeO 2 up to 35 GPa: a Raman investigation Sugandha Dogra a ; Nita Dilawar Sharma a ; Jasveer Singh a ; Himanshu Kumar Poswal b ; S. M. Sharma b ; A. K. Bandyopadhyay a a Pressure and Vacuum Standards, National Physical Laboratory, New Delhi, India b Synchrotron Radiation Section, Bhabha Atomic Research Centre, Mumbai, India First published on: 03 May 2011 To cite this Article Dogra, Sugandha , Sharma, Nita Dilawar , Singh, Jasveer , Poswal, Himanshu Kumar , Sharma, S. M. and Bandyopadhyay, A. K.(2011) 'High pressure behavior of nano-crystalline CeO 2 up to 35 GPa: a Raman investigation', High Pressure Research, 31: 2, 292 — 303, First published on: 03 May 2011 (iFirst) To link to this Article: DOI: 10.1080/08957959.2011.576674 URL: http://dx.doi.org/10.1080/08957959.2011.576674 Full terms and conditions of use: http://www.informaworld.com/terms-and-conditions-of-access.pdf This article may be used for research, teaching and private study purposes. Any substantial or systematic reproduction, re-distribution, re-selling, loan or sub-licensing, systematic supply or distribution in any form to anyone is expressly forbidden. The publisher does not give any warranty express or implied or make any representation that the contents will be complete or accurate or up to date. The accuracy of any instructions, formulae and drug doses should be independently verified with primary sources. The publisher shall not be liable for any loss, actions, claims, proceedings, demand or costs or damages whatsoever or howsoever caused arising directly or indirectly in connection with or arising out of the use of this material.
Transcript of High pressure behavior of nano-crystalline CeO2up to 35 GPa: a Raman investigation
PLEASE SCROLL DOWN FOR ARTICLE
This article was downloaded by: [CSIR eJournals Consortium]On: 20 May 2011Access details: Access Details: [subscription number 934171170]Publisher Taylor & FrancisInforma Ltd Registered in England and Wales Registered Number: 1072954 Registered office: Mortimer House, 37-41 Mortimer Street, London W1T 3JH, UK
High Pressure ResearchPublication details, including instructions for authors and subscription information:http://www.informaworld.com/smpp/title~content=t713679167
High pressure behavior of nano-crystalline CeO2 up to 35 GPa: a RamaninvestigationSugandha Dograa; Nita Dilawar Sharmaa; Jasveer Singha; Himanshu Kumar Poswalb; S. M. Sharmab; A.K. Bandyopadhyaya
a Pressure and Vacuum Standards, National Physical Laboratory, New Delhi, India b SynchrotronRadiation Section, Bhabha Atomic Research Centre, Mumbai, India
First published on: 03 May 2011
To cite this Article Dogra, Sugandha , Sharma, Nita Dilawar , Singh, Jasveer , Poswal, Himanshu Kumar , Sharma, S. M.and Bandyopadhyay, A. K.(2011) 'High pressure behavior of nano-crystalline CeO2 up to 35 GPa: a Raman investigation',High Pressure Research, 31: 2, 292 — 303, First published on: 03 May 2011 (iFirst)To link to this Article: DOI: 10.1080/08957959.2011.576674URL: http://dx.doi.org/10.1080/08957959.2011.576674
Full terms and conditions of use: http://www.informaworld.com/terms-and-conditions-of-access.pdf
This article may be used for research, teaching and private study purposes. Any substantial orsystematic reproduction, re-distribution, re-selling, loan or sub-licensing, systematic supply ordistribution in any form to anyone is expressly forbidden.
The publisher does not give any warranty express or implied or make any representation that the contentswill be complete or accurate or up to date. The accuracy of any instructions, formulae and drug dosesshould be independently verified with primary sources. The publisher shall not be liable for any loss,actions, claims, proceedings, demand or costs or damages whatsoever or howsoever caused arising directlyor indirectly in connection with or arising out of the use of this material.
High Pressure ResearchVol. 31, No. 2, June 2011, 292–303
High pressure behavior of nano-crystalline CeO2 up to 35 GPa:a Raman investigation
Sugandha Dograa, Nita Dilawar Sharmaa*, Jasveer Singha, Himanshu Kumar Poswalb,S.M. Sharmab and A.K. Bandyopadhyaya
aPressure and Vacuum Standards, National Physical Laboratory, Dr K.S. Krishnan Road, New Delhi110012, India; bSynchrotron Radiation Section, Bhabha Atomic Research Centre, Mumbai, India
(Received 17 February 2011; final version received 28 March 2011 )
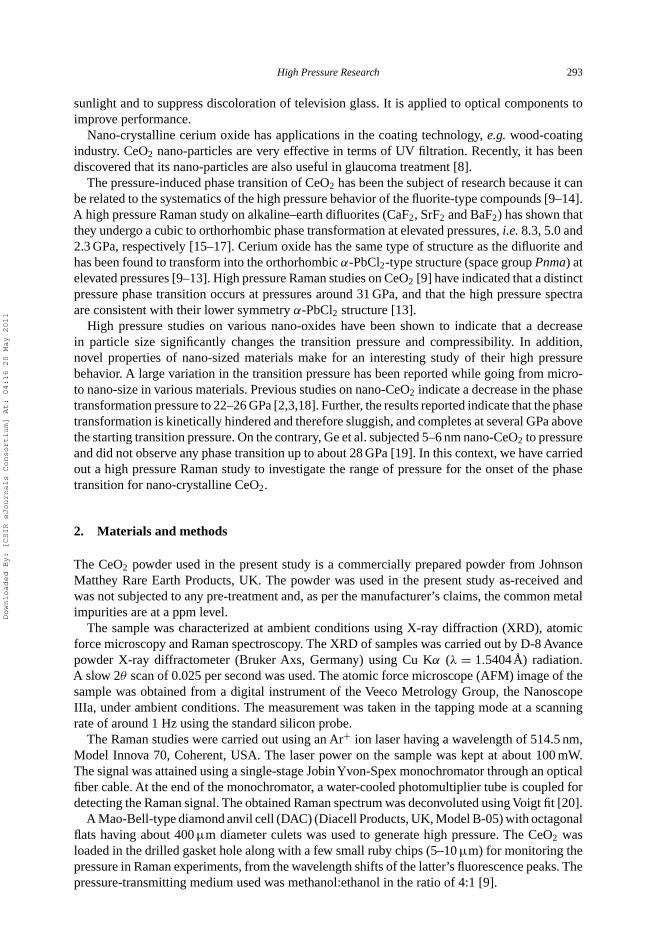
The present paper reports the results of in situ Raman studies carried out on nano-crystalline CeO2 up to apressure of 35 GPa at room temperature. The material was characterized at ambient conditions using X-raydiffraction and Raman spectroscopy and was found to have a cubic structure. We observed the Ramanpeak at ambient at 465 cm−1, which is characteristic of the cubic structure of the material. The samplewas pressurized using a diamond anvil cell using ruby fluorescence as the pressure monitor, and the phaseevolution was tracked by Raman spectroscopy. With an increase in the applied pressure, the cubic bandwas seen to steadily shift to higher wavenumbers. However, we observed the appearance of a numberof new peaks around a pressure of about 34.7 GPa. CeO2 was found to undergo a phase transition to anorthorhombic α-PbCl2-type structure at this pressure. With the release of the applied pressure, the observedpeaks steadily shift to lower wavenumbers. On decompression, the high pressure phase existed down to atotal release of pressure.
Keywords: high pressure; phase transitions; Raman spectroscopy; CeO2
1. Introduction
The rare earth oxide CeO2, or ceria, has been the subject of intense theoretical and experimentalstudy. Ceria is a hard material with a relatively high dielectric constant (C = 26) and a wideband gap. Under ambient conditions, it crystallizes in the cubic fluorite structure (space groupFm3m). It is widely applied in glass, ceramics and catalyst manufacture. Ceria-based materialshave been widely investigated experimentally, mainly for their catalytic and electrochemicalproperties [1–3]. In addition, due to the perfect match in the crystal lattice with that of a Si singlecrystal, CeO2 has also been studied as a promising candidate to act as the crystalline insulator layerin silicon-on-insulator epitaxial structures [4–6]. Cerium is known for its oxygen storage capacity,i.e. it can easily take up and release oxygen under oxidizing and reducing conditions, respectively[7]. The ability of cerium-doped glass to block out UV light is utilized in the manufacturing ofmedical glassware and aerospace windows. It is also used to prevent polymers from darkening in
*Corresponding author. Email: [email protected]
ISSN 0895-7959 print/ISSN 1477-2299 online© 2011 Taylor & FrancisDOI: 10.1080/08957959.2011.576674http://www.informaworld.com
Downloaded By: [CSIR eJournals Consortium] At: 04:16 20 May 2011
High Pressure Research 293
sunlight and to suppress discoloration of television glass. It is applied to optical components toimprove performance.
Nano-crystalline cerium oxide has applications in the coating technology, e.g. wood-coatingindustry. CeO2 nano-particles are very effective in terms of UV filtration. Recently, it has beendiscovered that its nano-particles are also useful in glaucoma treatment [8].
The pressure-induced phase transition of CeO2 has been the subject of research because it canbe related to the systematics of the high pressure behavior of the fluorite-type compounds [9–14].A high pressure Raman study on alkaline–earth difluorites (CaF2, SrF2 and BaF2) has shown thatthey undergo a cubic to orthorhombic phase transformation at elevated pressures, i.e. 8.3, 5.0 and2.3 GPa, respectively [15–17]. Cerium oxide has the same type of structure as the difluorite andhas been found to transform into the orthorhombic α-PbCl2-type structure (space group Pnma) atelevated pressures [9–13]. High pressure Raman studies on CeO2 [9] have indicated that a distinctpressure phase transition occurs at pressures around 31 GPa, and that the high pressure spectraare consistent with their lower symmetry α-PbCl2 structure [13].
High pressure studies on various nano-oxides have been shown to indicate that a decreasein particle size significantly changes the transition pressure and compressibility. In addition,novel properties of nano-sized materials make for an interesting study of their high pressurebehavior. A large variation in the transition pressure has been reported while going from micro-to nano-size in various materials. Previous studies on nano-CeO2 indicate a decrease in the phasetransformation pressure to 22–26 GPa [2,3,18]. Further, the results reported indicate that the phasetransformation is kinetically hindered and therefore sluggish, and completes at several GPa abovethe starting transition pressure. On the contrary, Ge et al. subjected 5–6 nm nano-CeO2 to pressureand did not observe any phase transition up to about 28 GPa [19]. In this context, we have carriedout a high pressure Raman study to investigate the range of pressure for the onset of the phasetransition for nano-crystalline CeO2.
2. Materials and methods
The CeO2 powder used in the present study is a commercially prepared powder from JohnsonMatthey Rare Earth Products, UK. The powder was used in the present study as-received andwas not subjected to any pre-treatment and, as per the manufacturer’s claims, the common metalimpurities are at a ppm level.
The sample was characterized at ambient conditions using X-ray diffraction (XRD), atomicforce microscopy and Raman spectroscopy. The XRD of samples was carried out by D-8 Avancepowder X-ray diffractometer (Bruker Axs, Germany) using Cu Kα (λ = 1.5404Å) radiation.A slow 2θ scan of 0.025 per second was used. The atomic force microscope (AFM) image of thesample was obtained from a digital instrument of the Veeco Metrology Group, the NanoscopeIIIa, under ambient conditions. The measurement was taken in the tapping mode at a scanningrate of around 1 Hz using the standard silicon probe.
The Raman studies were carried out using an Ar+ ion laser having a wavelength of 514.5 nm,Model Innova 70, Coherent, USA. The laser power on the sample was kept at about 100 mW.The signal was attained using a single-stage Jobin Yvon-Spex monochromator through an opticalfiber cable. At the end of the monochromator, a water-cooled photomultiplier tube is coupled fordetecting the Raman signal. The obtained Raman spectrum was deconvoluted using Voigt fit [20].
A Mao-Bell-type diamond anvil cell (DAC) (Diacell Products, UK, Model B-05) with octagonalflats having about 400 μm diameter culets was used to generate high pressure. The CeO2 wasloaded in the drilled gasket hole along with a few small ruby chips (5–10 μm) for monitoring thepressure in Raman experiments, from the wavelength shifts of the latter’s fluorescence peaks. Thepressure-transmitting medium used was methanol:ethanol in the ratio of 4:1 [9].
Downloaded By: [CSIR eJournals Consortium] At: 04:16 20 May 2011
294 S. Dogra et al.
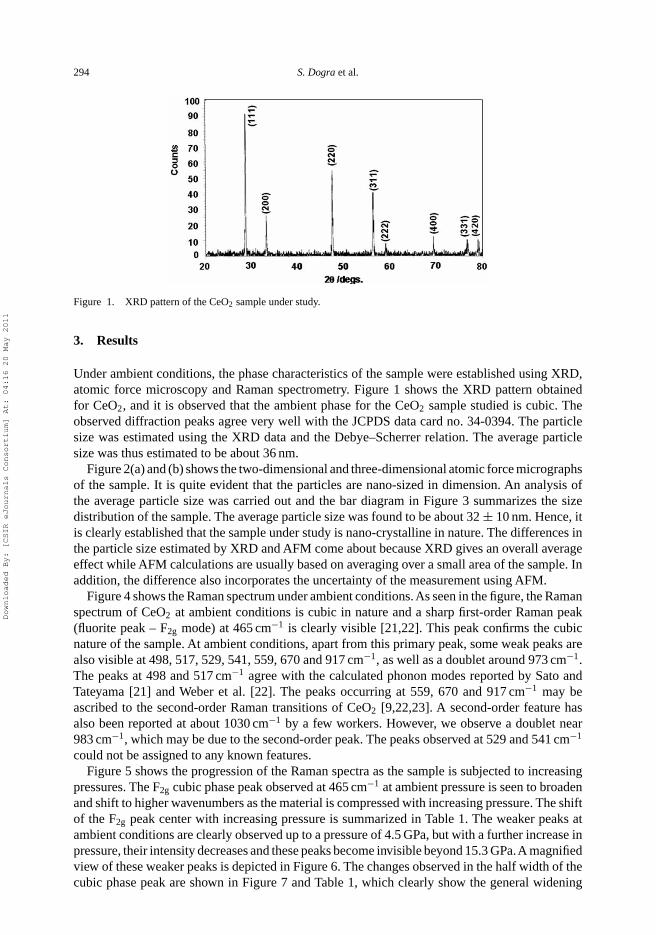
Figure 1. XRD pattern of the CeO2 sample under study.
3. Results
Under ambient conditions, the phase characteristics of the sample were established using XRD,atomic force microscopy and Raman spectrometry. Figure 1 shows the XRD pattern obtainedfor CeO2, and it is observed that the ambient phase for the CeO2 sample studied is cubic. Theobserved diffraction peaks agree very well with the JCPDS data card no. 34-0394. The particlesize was estimated using the XRD data and the Debye–Scherrer relation. The average particlesize was thus estimated to be about 36 nm.
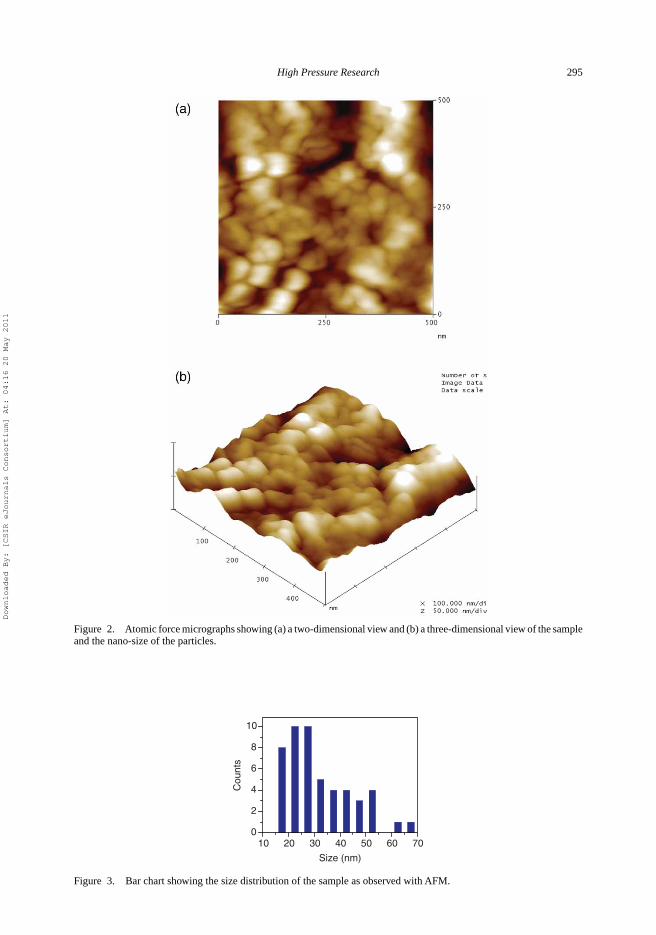
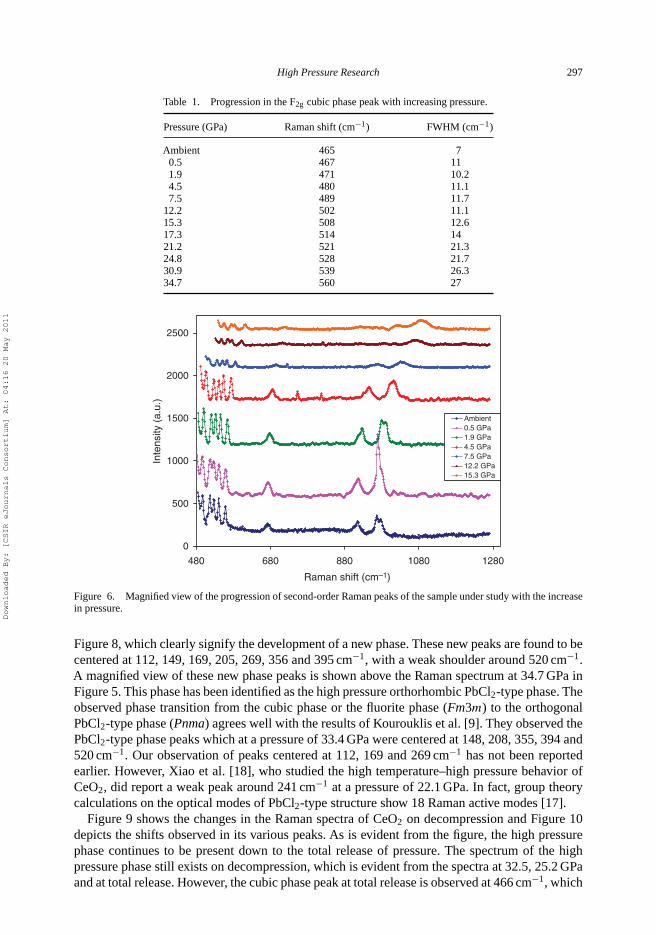
Figure 2(a) and (b) shows the two-dimensional and three-dimensional atomic force micrographsof the sample. It is quite evident that the particles are nano-sized in dimension. An analysis ofthe average particle size was carried out and the bar diagram in Figure 3 summarizes the sizedistribution of the sample. The average particle size was found to be about 32 ± 10 nm. Hence, itis clearly established that the sample under study is nano-crystalline in nature. The differences inthe particle size estimated by XRD and AFM come about because XRD gives an overall averageeffect while AFM calculations are usually based on averaging over a small area of the sample. Inaddition, the difference also incorporates the uncertainty of the measurement using AFM.
Figure 4 shows the Raman spectrum under ambient conditions. As seen in the figure, the Ramanspectrum of CeO2 at ambient conditions is cubic in nature and a sharp first-order Raman peak(fluorite peak – F2g mode) at 465 cm−1 is clearly visible [21,22]. This peak confirms the cubicnature of the sample. At ambient conditions, apart from this primary peak, some weak peaks arealso visible at 498, 517, 529, 541, 559, 670 and 917 cm−1, as well as a doublet around 973 cm−1.The peaks at 498 and 517 cm−1 agree with the calculated phonon modes reported by Sato andTateyama [21] and Weber et al. [22]. The peaks occurring at 559, 670 and 917 cm−1 may beascribed to the second-order Raman transitions of CeO2 [9,22,23]. A second-order feature hasalso been reported at about 1030 cm−1 by a few workers. However, we observe a doublet near983 cm−1, which may be due to the second-order peak. The peaks observed at 529 and 541 cm−1
could not be assigned to any known features.Figure 5 shows the progression of the Raman spectra as the sample is subjected to increasing
pressures. The F2g cubic phase peak observed at 465 cm−1 at ambient pressure is seen to broadenand shift to higher wavenumbers as the material is compressed with increasing pressure. The shiftof the F2g peak center with increasing pressure is summarized in Table 1. The weaker peaks atambient conditions are clearly observed up to a pressure of 4.5 GPa, but with a further increase inpressure, their intensity decreases and these peaks become invisible beyond 15.3 GPa.A magnifiedview of these weaker peaks is depicted in Figure 6. The changes observed in the half width of thecubic phase peak are shown in Figure 7 and Table 1, which clearly show the general widening
Downloaded By: [CSIR eJournals Consortium] At: 04:16 20 May 2011
High Pressure Research 295
Figure 2. Atomic force micrographs showing (a) a two-dimensional view and (b) a three-dimensional view of the sampleand the nano-size of the particles.
10 20 30 40 50 60 700
2
4
6
8
10
Cou
nts
Size (nm)
Figure 3. Bar chart showing the size distribution of the sample as observed with AFM.
Downloaded By: [CSIR eJournals Consortium] At: 04:16 20 May 2011

296 S. Dogra et al.
0
50
100
150
200
250
300
350
400
450
0 200 400 600 800 1000 1200 1400
Raman shift (cm–1)
Inte
nsity
(a.
u.)
9
11
13
15
17
19
480 680 880 1080
Raman shift (cm-1)
Inte
nsity
(A
rbit.
uni
ts)
Figure 4. The Raman spectrum of the sample under study at ambient conditions. The inset shows the magnified viewof the secord-order Raman peaks observed.
0
300
600
900
1200
1500
1800
2100
2400
100 300 500 700 900 1100
Raman shift (cm-1)
Inte
nsity
(a.
u.)
Ambient
15.3 GPa
1.9 GPa
4.5 GPa
0.5 GPa
12.2 GPa
7.5 GPa
2090
2290
2490
2690
2890
3090
3290
3490
3690
100 300 500 700 900 1100
Inte
nsity
(a.
u.)
34.7 GPa
17.3 GPa
21.2 GPa
24.8 GPa
30.9 GPa
Raman shift (cm-1)
Figure 5. The Raman shift of the peaks as observed with an increase in applied pressure. A magnified view of theorthorhombic phase peaks observed at lower wavenumbers at a pressure of 34.75 GPa is depicted above the respectivespectrum.
with an increase in pressure, which is known to occur due to the destabilization of the crystallinephase. However, this could also have contributions from non-hydrostatic stresses in the system.Theprogression of peak centers on compression is graphically depicted in Figure 8. It may be observedthat although the first-order fluorite peak broadens and shifts with the increment in pressure, itnevertheless still remains the most prominent peak until the highest pressure of 34.7 GPa.All otherpeaks except the primary peak (F2g mode) disappear between 17.3 and 30.9 GPa. At the higheststudied pressure of 34.7 GPa, a number of new peaks are observed, shown by the dotted line in
Downloaded By: [CSIR eJournals Consortium] At: 04:16 20 May 2011
High Pressure Research 297
Table 1. Progression in the F2g cubic phase peak with increasing pressure.
Pressure (GPa) Raman shift (cm−1) FWHM (cm−1)
Ambient 465 70.5 467 111.9 471 10.24.5 480 11.17.5 489 11.7
12.2 502 11.115.3 508 12.617.3 514 1421.2 521 21.324.8 528 21.730.9 539 26.334.7 560 27
0
500
1000
1500
2000
2500
480 680 880 1080 1280
Raman shift (cm–1)
Inte
nsity
(a.
u.)
Ambient0.5 GPa1.9 GPa4.5 GPa7.5 GPa12.2 GPa15.3 GPa
Figure 6. Magnified view of the progression of second-order Raman peaks of the sample under study with the increasein pressure.
Figure 8, which clearly signify the development of a new phase. These new peaks are found to becentered at 112, 149, 169, 205, 269, 356 and 395 cm−1, with a weak shoulder around 520 cm−1.A magnified view of these new phase peaks is shown above the Raman spectrum at 34.7 GPa inFigure 5. This phase has been identified as the high pressure orthorhombic PbCl2-type phase. Theobserved phase transition from the cubic phase or the fluorite phase (Fm3m) to the orthogonalPbCl2-type phase (Pnma) agrees well with the results of Kourouklis et al. [9]. They observed thePbCl2-type phase peaks which at a pressure of 33.4 GPa were centered at 148, 208, 355, 394 and520 cm−1. Our observation of peaks centered at 112, 169 and 269 cm−1 has not been reportedearlier. However, Xiao et al. [18], who studied the high temperature–high pressure behavior ofCeO2, did report a weak peak around 241 cm−1 at a pressure of 22.1 GPa. In fact, group theorycalculations on the optical modes of PbCl2-type structure show 18 Raman active modes [17].
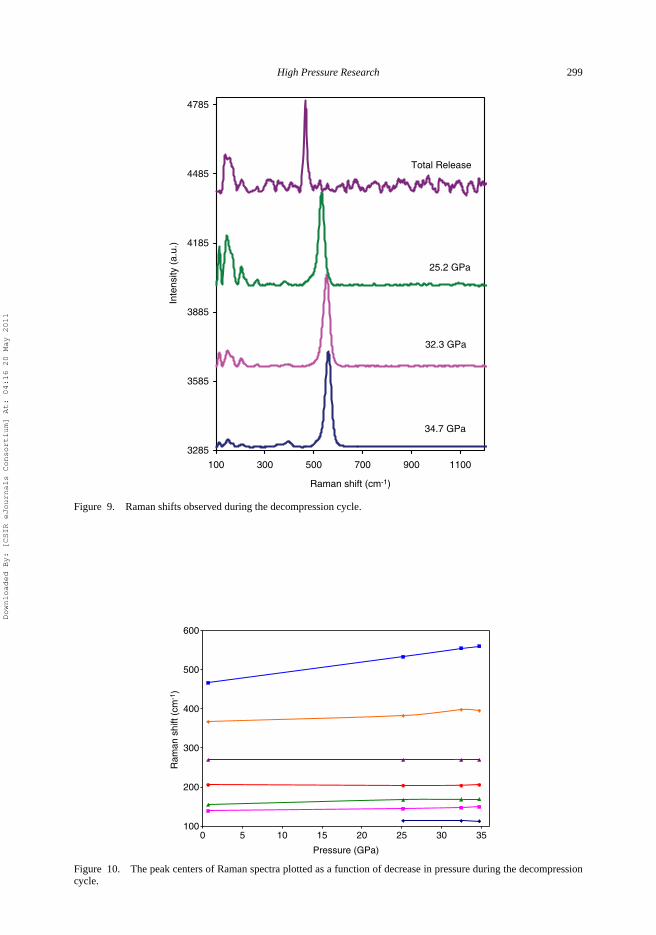
Figure 9 shows the changes in the Raman spectra of CeO2 on decompression and Figure 10depicts the shifts observed in its various peaks. As is evident from the figure, the high pressurephase continues to be present down to the total release of pressure. The spectrum of the highpressure phase still exists on decompression, which is evident from the spectra at 32.5, 25.2 GPaand at total release. However, the cubic phase peak at total release is observed at 466 cm−1, which
Downloaded By: [CSIR eJournals Consortium] At: 04:16 20 May 2011

298 S. Dogra et al.
5
10
15
20
25
30
0 5 10 15 20 25 30 35
Pressure (GPa)
FW
HM
Figure 7. Graphical depiction of the increase in the average half width of the F2g cubic phase peak with the increase inpressure.
75
175
275
375
475
575
675
775
875
975
Pressure (GPa)
Ram
an s
hift
(cm
-1)
0 5 10 15 20 25 30 35
Figure 8. Relative shift in Raman peaks with the increase in pressure. The dotted line on the right shows the positionof orthorhombic phase peaks at 34.7 GPa.
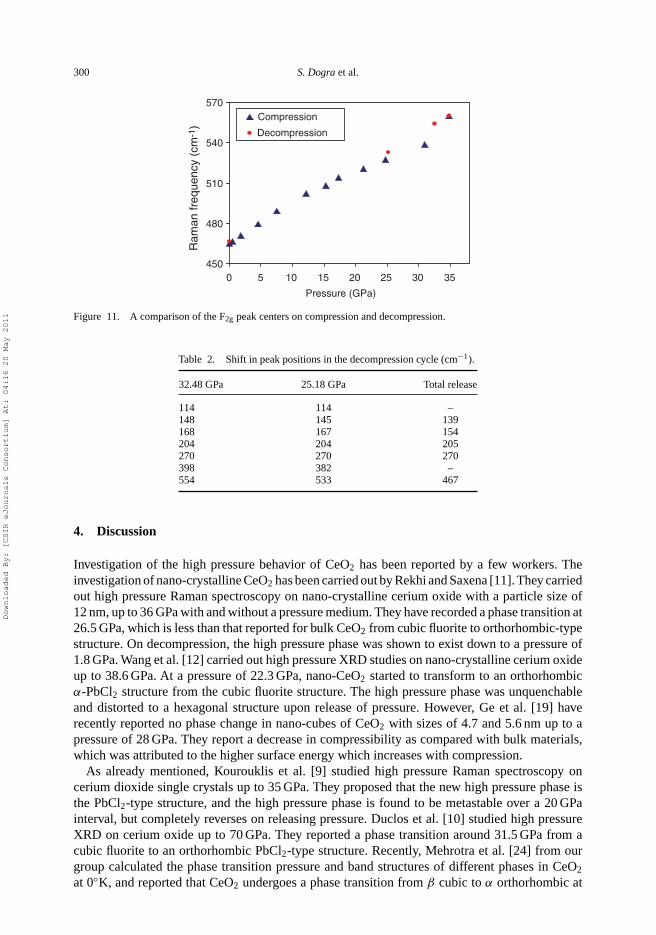
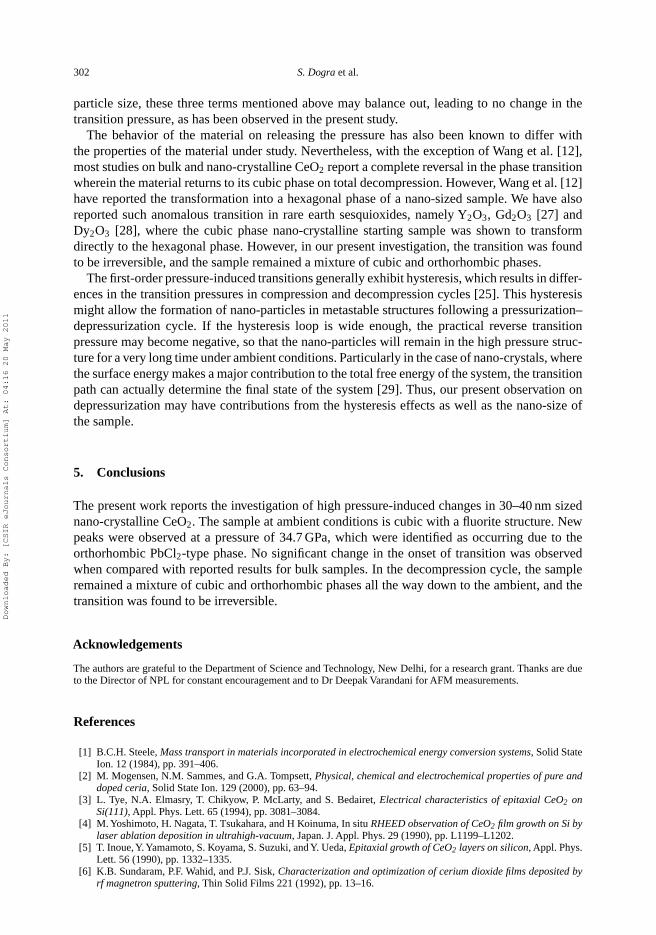
is very close to the position observed at ambient conditions. A comparison of the F2g peak oncompression and decompression is shown in Figure 11. On the contrary, Kourouklis et al. [9]observed a completely reverse cycle on releasing pressure. In our studies, the observed data oncomplete decompression are a mixture of orthorhombic and cubic phases, as the high pressurepeaks are also present. On decompression, the high pressure phase of CeO2 remains down to thetotal release of pressure and does not completely change back to the cubic structure at ambientconditions. Kourouklis et al. [9] and Rekhi and Saxena [11] reported that on decreasing pressure,the Raman peak of the high pressure phase continues to be present down to 12 and 1.8 ± 0.5 GPa,respectively. For the decompression cycle, our results at 25.2 GPa are similar to those of Kouroukliset al.’s 22.6 GPa [9]. The details of the observed peaks for releasing the pressure cycle are shownin Table 2.
The peak which appears at 112 cm−1 at 34.7 GPa is seen to disappear on total decompression.This peak has not been reported earlier. It may be possible that it shifted to wavenumbers lowerthan the minimum shown in the spectrum. For releasing the pressure cycle, the F2g peak hasbeen observed at 554, 532 and 466 cm−1 for 32.5, 25.2 GPa and for total release of pressure,respectively.
Downloaded By: [CSIR eJournals Consortium] At: 04:16 20 May 2011
High Pressure Research 299
3285
3585
3885
4185
4485
4785
100 300 500 700 900 1100
Raman shift (cm-1)
Inte
nsity
(a.
u.)
34.7 GPa
32.3 GPa
25.2 GPa
Total Release
Figure 9. Raman shifts observed during the decompression cycle.
100
200
300
400
500
600
0 5 10 15 20 25 30 35
Pressure (GPa)
Ram
an s
hift
(cm
-1)
Figure 10. The peak centers of Raman spectra plotted as a function of decrease in pressure during the decompressioncycle.
Downloaded By: [CSIR eJournals Consortium] At: 04:16 20 May 2011
300 S. Dogra et al.
450
480
510
540
570
0 5 10 15 20 25 30 35
Pressure (GPa)
Ram
an fr
eque
ncy
(cm
-1)
Compression
Decompression
Figure 11. A comparison of the F2g peak centers on compression and decompression.
Table 2. Shift in peak positions in the decompression cycle (cm−1).
32.48 GPa 25.18 GPa Total release
114 114 –148 145 139168 167 154204 204 205270 270 270398 382 –554 533 467
4. Discussion
Investigation of the high pressure behavior of CeO2 has been reported by a few workers. Theinvestigation of nano-crystalline CeO2 has been carried out by Rekhi and Saxena [11]. They carriedout high pressure Raman spectroscopy on nano-crystalline cerium oxide with a particle size of12 nm, up to 36 GPa with and without a pressure medium. They have recorded a phase transition at26.5 GPa, which is less than that reported for bulk CeO2 from cubic fluorite to orthorhombic-typestructure. On decompression, the high pressure phase was shown to exist down to a pressure of1.8 GPa. Wang et al. [12] carried out high pressure XRD studies on nano-crystalline cerium oxideup to 38.6 GPa. At a pressure of 22.3 GPa, nano-CeO2 started to transform to an orthorhombicα-PbCl2 structure from the cubic fluorite structure. The high pressure phase was unquenchableand distorted to a hexagonal structure upon release of pressure. However, Ge et al. [19] haverecently reported no phase change in nano-cubes of CeO2 with sizes of 4.7 and 5.6 nm up to apressure of 28 GPa. They report a decrease in compressibility as compared with bulk materials,which was attributed to the higher surface energy which increases with compression.
As already mentioned, Kourouklis et al. [9] studied high pressure Raman spectroscopy oncerium dioxide single crystals up to 35 GPa. They proposed that the new high pressure phase isthe PbCl2-type structure, and the high pressure phase is found to be metastable over a 20 GPainterval, but completely reverses on releasing pressure. Duclos et al. [10] studied high pressureXRD on cerium oxide up to 70 GPa. They reported a phase transition around 31.5 GPa from acubic fluorite to an orthorhombic PbCl2-type structure. Recently, Mehrotra et al. [24] from ourgroup calculated the phase transition pressure and band structures of different phases in CeO2
at 0◦K, and reported that CeO2 undergoes a phase transition from β cubic to α orthorhombic at
Downloaded By: [CSIR eJournals Consortium] At: 04:16 20 May 2011

High Pressure Research 301
about 47 GPa. The theoretically calculated transition pressure is greater than the experimentallyobtained results [9–13]. The error has been suggested to occur due to non-optimization of theratio of c/a and b/a parameters as a function of volume (or pressure). However, on transition,the splitting of bands was demonstrated, some of which merged with the conduction band, andthe relative decrease in the enthalpy at the transition was demonstrated.
In the present work, we have observed the structural change in nano-crystalline CeO2 at apressure of 34.7 GPa. The high pressure phase co-exists with the cubic phase down to the ambienton decompression of the sample.
Hence, we have observed a considerable difference in the transition onset pressure when com-pared with most of the previous reports for nano-crystalline materials except that of Ge et al. [19].In fact, the transition was observed to start near about the pressures reported for the single crystalas well as bulk CeO2. In most of the earlier reports, the particle size was considerably smaller,i.e. within the range of 9–15 nm when compared with our sample, which had an average sizebetween 32 and 36 nm. Our results differ slightly from the earlier reported results, and a numberof reasons may be ascribed to this behavior.
The pressure-induced phase transition from a fluorite to an orthorhombic PbCl2-type structureis a first-order transition, and the diffusion of metal atoms and reconstruction of bonds are alsoinvolved in the transition process. The transition can be visualized as the result of cations inthe (111) planes of the fluorite structure moving along the [111] axis into adjacent atom planes,which lowers the symmetry and increases the cation coordination from 8 to 9 in the orthorhombicPbCl2-type structure [17].
It is well known that the bulk properties of nano-crystalline materials depend on the high per-centage of grain boundaries, which, due to their high energy, are more responsive to externalinfluences and, hence, have also been shown to demonstrate a size-dependent transition pressure.For a number of materials, when the particle size decreases, an enhancement in the transition pres-sure observed experimentally has been attributed to the predictions of homogenous deformationtheories as well as large volume changes upon transition [25]. However, many nano-materials haveexhibited a decrease in the onset of transition pressure, which has been attributed to surface energydifferences in the phases involved. However, Ge et al. [18] attributed the same enhancement insurface energies for the hardening of the nano-material, which did not undergo any transition upto 28 GPa. The lower compressibility of the nano-crystal was shown to be directly related to theformation of stronger Ce–O bonds at the surface experiencing the pressure. According to Wanget al. [12], below a critical particle size, the nano-materials exhibit certain characteristics of bulkmaterials. However, in the present study, the particle size has been found to have no significantcontribution to the variation in pressure-induced effects and the phase transition has been observedto start at pressures comparable to the bulk material. Recently, such an observation has been madein a few reports where the particle size of the sample did not affect the onset of transition pressure[26].
The difference in the transition pressure between nano-crystals and bulk materials has beenreported to depend mainly on three parameters, viz. the ratio of volume collapse, the surface energydifferences and the internal energy differences.Whether there would be an enhancement, reductionor no change in transition pressure would depend upon the relative importance of these threeparameters. In general, large volume change upon compression favors lower transition pressure,while a large surface energy difference favors enhanced transition pressure [26]. However, ithas been reported that a fluorite to a PbCl2-type structural change in CeO2 involves a change involume, which is about 7.5% for bulk [10] and about 9.4% for 9–15 nm sized nano-particles [12].Therefore, the difference in volume change is not significant. Hence, the dynamics of the transitionwould primarily be driven by the surface and internal energy differences. For very small nano-crystals, the surface energy difference would dominate, leading to enhanced transition pressure,while for larger nano-crystals, the transition may be reduced. However, beyond a certain critical
Downloaded By: [CSIR eJournals Consortium] At: 04:16 20 May 2011
302 S. Dogra et al.
particle size, these three terms mentioned above may balance out, leading to no change in thetransition pressure, as has been observed in the present study.
The behavior of the material on releasing the pressure has also been known to differ withthe properties of the material under study. Nevertheless, with the exception of Wang et al. [12],most studies on bulk and nano-crystalline CeO2 report a complete reversal in the phase transitionwherein the material returns to its cubic phase on total decompression. However, Wang et al. [12]have reported the transformation into a hexagonal phase of a nano-sized sample. We have alsoreported such anomalous transition in rare earth sesquioxides, namely Y2O3, Gd2O3 [27] andDy2O3 [28], where the cubic phase nano-crystalline starting sample was shown to transformdirectly to the hexagonal phase. However, in our present investigation, the transition was foundto be irreversible, and the sample remained a mixture of cubic and orthorhombic phases.
The first-order pressure-induced transitions generally exhibit hysteresis, which results in differ-ences in the transition pressures in compression and decompression cycles [25]. This hysteresismight allow the formation of nano-particles in metastable structures following a pressurization–depressurization cycle. If the hysteresis loop is wide enough, the practical reverse transitionpressure may become negative, so that the nano-particles will remain in the high pressure struc-ture for a very long time under ambient conditions. Particularly in the case of nano-crystals, wherethe surface energy makes a major contribution to the total free energy of the system, the transitionpath can actually determine the final state of the system [29]. Thus, our present observation ondepressurization may have contributions from the hysteresis effects as well as the nano-size ofthe sample.
5. Conclusions
The present work reports the investigation of high pressure-induced changes in 30–40 nm sizednano-crystalline CeO2. The sample at ambient conditions is cubic with a fluorite structure. Newpeaks were observed at a pressure of 34.7 GPa, which were identified as occurring due to theorthorhombic PbCl2-type phase. No significant change in the onset of transition was observedwhen compared with reported results for bulk samples. In the decompression cycle, the sampleremained a mixture of cubic and orthorhombic phases all the way down to the ambient, and thetransition was found to be irreversible.
Acknowledgements
The authors are grateful to the Department of Science and Technology, New Delhi, for a research grant. Thanks are dueto the Director of NPL for constant encouragement and to Dr Deepak Varandani for AFM measurements.
References
[1] B.C.H. Steele, Mass transport in materials incorporated in electrochemical energy conversion systems, Solid StateIon. 12 (1984), pp. 391–406.
[2] M. Mogensen, N.M. Sammes, and G.A. Tompsett, Physical, chemical and electrochemical properties of pure anddoped ceria, Solid State Ion. 129 (2000), pp. 63–94.
[3] L. Tye, N.A. Elmasry, T. Chikyow, P. McLarty, and S. Bedairet, Electrical characteristics of epitaxial CeO2 onSi(111), Appl. Phys. Lett. 65 (1994), pp. 3081–3084.
[4] M. Yoshimoto, H. Nagata, T. Tsukahara, and H Koinuma, In situ RHEED observation of CeO2 film growth on Si bylaser ablation deposition in ultrahigh-vacuum, Japan. J. Appl. Phys. 29 (1990), pp. L1199–L1202.
[5] T. Inoue, Y. Yamamoto, S. Koyama, S. Suzuki, and Y. Ueda, Epitaxial growth of CeO2 layers on silicon, Appl. Phys.Lett. 56 (1990), pp. 1332–1335.
[6] K.B. Sundaram, P.F. Wahid, and P.J. Sisk, Characterization and optimization of cerium dioxide films deposited byrf magnetron sputtering, Thin Solid Films 221 (1992), pp. 13–16.
Downloaded By: [CSIR eJournals Consortium] At: 04:16 20 May 2011

High Pressure Research 303
[7] L.R. Shah, B. Ali, H. Zhu, W.G. Wang, Y.Q. Song H.W. Zhang, S.I. Shah, and J.Q. Xiao, Detailed study on therole of oxygen vacancies in structural, magnetic and transport behaviour of magnetic insulator Co-CeO2, J. Phys.Condens. Matter 21 (2009), pp. 486004-1–9.
[8] P. Wachter, The magnetic susceptibility of CEO@ has shown to be paramagnetic, in Valence Instabilities, P. Wachterand H. Boppart, eds., North–Holland, Amsterdam, 1982, p. 145.
[9] G.A. Kourouklis, A. Jayaraman, and G.P. Espinosa, High pressure Raman study of CeO2 to 35 GPa and pressure-induced phase transformation from the fluorite structure, Phys. Rev. B 37 (1988), pp. 4250–4253.
[10] S.J. Duclos, Y.K. Vohra, A. L. Ruoff, A. Jayaraman, and G.P. Espinosa, High pressure X-ray diffraction study ofCeO2 to 70 GPa and pressure induced phase transformation from the fluorite structure, Phys. Rev. B 38 (1988),pp. 7755–7756.
[11] S. Rekhi and S.K. Saxena, High pressure Raman study of nanocrystalline CeO2, J. Appl. Phys. 89 (2001),pp. 2968–2971.
[12] Z. Wang, S.K. Saxena, V. Pischedda, H.P. Liermann, and C.S. Zha, In situ X-ray diffraction study of the pressureinduced phase transformation in nanocrystalline CeO2, Phys. Rev. B 64 (2001), pp. 012102-1–4.
[13] A Jayaraman, G.A. Kourouklis and L.G.V. Uitert, A high pressure Raman study of ThO2 to 40 GPa and pressureinduced phase transition from fluorite structure, Pramana J. Phys. 30 (1988), pp. 225–231.
[14] G. Kaindl, G. Schmiester, E.V. Sampathkumaran, and P. Wachter, Pressure induced changes in LIII X-ray absorp-tion near edge structure of CeO2 and CeF4: relevance to 4f-electronic structure, Phys. Rev. B 38(14) (1988),pp. 10174–10177.
[15] G.A. Kourouklis and E. Anastassakis, Pressure induced phase transitions in SrF2: a Raman study, Phy. Rev. B 34(1986), pp. 1233–1237.
[16] G.A. Kourouklis and E. Anastassakis, Pressure induced phase transitions and anharmonicity study of alkaline earthfluorides, Phys. Status Solidi B 152 (1989), pp. 89–99.
[17] J.R. Kessler, E. Monberg, and M. Nicol, Studies of fluorite and related divalent fluoride systems at high pressure byRaman spectroscopy, J. Chem. Phys. 60 (1974), pp. 5057–5066.
[18] W. Xiao, D. Tan, Y. Li, and J. Liu, The effects of high temperature on the high pressure behaviour of CeO2, J. Phys.Cond. Matter 19 (2007), p. 425213.
[19] M.Y. Ge, Y.Z. Fang, H. Wang, W. Chen, Y. He, E.Z. Liu, N.H. Su, K. Stahl, Y.P. Feng, J.S. Tse, T. Kikegawa,S. Nakano, Z.L. Zhang, U. Kaiser, F.M. Hu, H.K. Mao, and J.Z. Jiang, Anomalous compressive behaviour in CeO2nanocubes under high pressure, New J. Phys. 10 (2008), pp. 123016-1–12.
[20] A.K. Bandyopadhyay, N. Dilawar, A.V. Kumar, D. Varandani, and D. Singh, A low cost laser Raman spectrometer,Bull. Mater. Sci. 21 (1998), pp. 433–438.
[21] T. Sato and S. Tateyama, Temperature dependence of the linewidth of the first order Raman spectrum for crystallineCeO2 Phys. Rev. B 26(4) (1982), pp. 2257–2260.
[22] W.H. Weber, K.C. Hass, and J.R. McBride, Raman study of CeO2: second order scattering, lattice dynamics andparticle size effects, Phys. Rev. B 48(1) (1993), pp. 178–185.
[23] A Jayaraman A and G A Kourouklis, A high pressure Raman study of TeO2 to 30 GPa and pressure induced phasechanges, Pramana J. Phys. 36 (1991), pp. 133–141.
[24] S. Mehrotra, P. Sharma, M. Rajagopalan, and A.K. Bandyopadhyay, High pressure phase transition and bandstructures of different phases in CeO2, Solid State Commun. 140 (2006), pp. 313–317.
[25] S.H. Tolbert and A.P. Alivisatos, Size dependence of a first order solid-solid phase transition: the wurtzite to rock-salttransformation in CdSe nanocrystals, Science 265 (1994), pp. 373–376.
[26] J.Z. Jiang, Phase transformation in nanocrystals, J. Mat. Sci. 39 (2004), pp. 5103–5110.[27] N. Dilawar, D. Varandani, S. Mehrotra, H. Poswal, S.M. Sharma, A.K. Bandyopadhyay, Anomalous high oressure
behaviour in nanocrystalline rare earth sesquioxides, Nanotechnology 19 (2008), pp. 115703-1–9.[28] N. Dilawar, J. Singh, S. Dogra, H.K. Poswal, S.M. Sharma, and A.K. Bandyopadhyay, Pressure induced anomalous
phase transition in nanocrystalline dysprosium sesquioxide, J. Raman Spect. 42 (2011), pp. 438–444.[29] A. San Miguel, Nanomaterials under high pressure, Chem. Soc. Rev. 35 (2006), pp. 876–889.
Downloaded By: [CSIR eJournals Consortium] At: 04:16 20 May 2011