High-Performance Modelling and Simulation for Big ... - Unpaywall
364
High-Performance Modelling and Simulation for Big Data Applications State-of-the-Art Survey LNCS 11400 Selected Results of the COST Action IC1406 cHiPSet Joanna Kołodziej Horacio González-Vélez (Eds.)
-
Upload
khangminh22 -
Category
Documents
-
view
0 -
download
0
Transcript of High-Performance Modelling and Simulation for Big ... - Unpaywall

High-Performance Modelling and Simulation for Big Data Applications
Stat
e-of
-the-
Art
Surv
eyLN
CS 1
1400
Selected Results of the COST Action IC1406 cHiPSet
Joanna KołodziejHoracio González-Vélez (Eds.)

Lecture Notes in Computer Science 11400
Commenced Publication in 1973Founding and Former Series Editors:Gerhard Goos, Juris Hartmanis, and Jan van Leeuwen
Editorial Board Members
David HutchisonLancaster University, Lancaster, UK
Takeo KanadeCarnegie Mellon University, Pittsburgh, PA, USA
Josef KittlerUniversity of Surrey, Guildford, UK
Jon M. KleinbergCornell University, Ithaca, NY, USA
Friedemann MatternETH Zurich, Zurich, Switzerland
John C. MitchellStanford University, Stanford, CA, USA
Moni NaorWeizmann Institute of Science, Rehovot, Israel
C. Pandu RanganIndian Institute of Technology Madras, Chennai, India
Bernhard SteffenTU Dortmund University, Dortmund, Germany
Demetri TerzopoulosUniversity of California, Los Angeles, CA, USA
Doug TygarUniversity of California, Berkeley, CA, USA

More information about this series at http://www.springer.com/series/7407

Joanna Kołodziej • Horacio González-Vélez (Eds.)
High-Performance Modellingand Simulation forBig Data Applications
Selected Results of the COST Action IC1406 cHiPSet

EditorsJoanna KołodziejCracow University of TechnologyCracow, Poland
Horacio González-VélezNational College of IrelandDublin, Ireland
ISSN 0302-9743 ISSN 1611-3349 (electronic)Lecture Notes in Computer ScienceISBN 978-3-030-16271-9 ISBN 978-3-030-16272-6 (eBook)https://doi.org/10.1007/978-3-030-16272-6
Library of Congress Control Number: 2019936007
LNCS Sublibrary: SL1 – Theoretical Computer Science and General Issues
Acknowledgement and DisclaimerThis publication is based upon work from the COST Action IC1406 High-Performance Modelling andSimulation for Big Data Applications (cHiPSet), supported by COST (European Cooperation in Science andTechnology).The book reflects only the authors’ views. Neither the COST Association nor any person acting on its behalfis responsible for the use, which might be made of the information contained in this publication. The COSTAssociation is not responsible for external websites or sources referred to in this publication.
© The Editor(s) (if applicable) and The Author(s) 2019. This book is an open access publication.Open Access This book is licensed under the terms of the Creative Commons Attribution 4.0 InternationalLicense (http://creativecommons.org/licenses/by/4.0/), which permits use, sharing, adaptation, distributionand reproduction in any medium or format, as long as you give appropriate credit to the original author(s) andthe source, provide a link to the Creative Commons license and indicate if changes were made.The images or other third party material in this book are included in the book’s Creative Commons license,unless indicated otherwise in a credit line to the material. If material is not included in the book’s CreativeCommons license and your intended use is not permitted by statutory regulation or exceeds the permitted use,you will need to obtain permission directly from the copyright holder.The use of general descriptive names, registered names, trademarks, service marks, etc. in this publicationdoes not imply, even in the absence of a specific statement, that such names are exempt from the relevantprotective laws and regulations and therefore free for general use.The publisher, the authors and the editors are safe to assume that the advice and information in this book arebelieved to be true and accurate at the date of publication. Neither the publisher nor the authors or the editorsgive a warranty, express or implied, with respect to the material contained herein or for any errors oromissions that may have been made. The publisher remains neutral with regard to jurisdictional claims inpublished maps and institutional affiliations.
This Springer imprint is published by the registered company Springer Nature Switzerland AGThe registered company address is: Gewerbestrasse 11, 6330 Cham, Switzerland

European Cooperation in Science and Technology (COST)
This publication is based upon work from COST Action IC1406 “High-PerformanceModelling and Simulation for Big Data Applications (cHiPSet)” supported by COST(European Cooperation in Science and Technology).
COST (European Cooperation in Science and Technology) is a funding agency forresearch and innovation networks. Our Actions help connect research initiatives acrossEurope and enable scientists to grow their ideas by sharing them with their peers. Thisboosts their research, career and innovation.
www.cost.eu
Funded by the Horizon 2020 Framework Programme of the European Union

Preface
Long considered important components of the scientific method, Modelling andSimulation (M–S) have evolved from traditional discrete numerical methods to complexdata-intensive continuous analytical optimisations. Resolution, scale, and accuracyhave become essential to predict and analyse natural and complex systems in scienceand engineering. When their level of abstraction rises to have a better discernmentof the domain at hand, their computational representation becomes increasinglydemanding for computational and data resources. It is not unusual to have models withhundreds of features, conditions, and constraints coupled with complex simulationswith large data sets. These complex systems do not easily lend themselves tostraightforward modular decompositions that support parallelisation and trivial com-putational support. They often require a significant amount of computational resourceswith associated data sets scattered across multiple sources and different geographicallocations.
It is then required to have a seamless interaction of large computational resourceswith M–S in order to store, compute, analyze, and visualize large data sets in scienceand engineering. To nurture such data-intensive computational M–S, the 4-yearcHiPSet Action enabled the cross-pollination of distinct expert communities:
1. High Performance Computing (HPC)2. Modelling and Simulation (M–S)3. Domain scientists and practitioners
Funded by the European Commission, cHiPSet has provided a dynamictrans-European forum for their members and distinguished guests to openly discussnovel perspectives and topics of interest for the M–S and HPC communities. Figure 1presents a schematic representation of cHiPSet.
Structured into 12 complementary chapters, this cHiPSet compendium presents aset of selected case studies related to data-intensive computational M–S in artificialintelligence, bioinformatics, electrical engineering, pharmacology, finance, healthcare,social media, and telecommunications. Its purpose is to illustrate the tangibleimprovement in the understanding of those domains, which has been faciliated bycHiPSet collaborations. All case studies are co-authored by individuals associatedwith cHiPSet who have worked together through dedicated meetings, workshops,short-term scientific missions, and summer schools.
– Grelck et al. introduce the overall cHiPSet aims and objectives with specialemphasis on how Big Data has both posed a challenge and offered developmentopportunities for HPC: how to efficiently turn massively large data into valuableinformation and meaningful knowledge. They also describe how M–S offer suitableabstractions to manage the complexity of analysing Big Data in various scientificand engineering domains.

– Larsson et al. describe two classes of algorithms for the numerical solution of largeelectromagnetic scattering problems and include results for a proof-of-conceptparallel implementation. They conclude by providing various perspectives onlarge-scale simulations that require parallel implementation.
– Rached and Larsson have furnished a survey of currently used parametric andnon-parametric methods for the non-statistical estimation of tail distributions andextreme quantiles. They also render some perspectives on how to move forwardwith non-parametric kernel-based estimation.
– Kilanioti et al. describe why social data streams raise a variety of practical chal-lenges, including the real-time generation of meaningful insights. They present amethodological approach to work with large-scale social media streams in order toefficiently perform content distribution, data diffusion, and data replication.
– Nejkovic et al. look into the forthcoming fifth generation of mobile networks,commonly known as 5G, which will significantly improve the bandwidth, capacity,and reliability of current telecommunication operators. They enumerate some key5G use cases from home entertainment to product manufacturing and healthcare.
– Brdar et al. focus on location data collected in mobile cellular networks and on howto identify patterns of human activity, interactions, and mobility. They also pointout the critical challenges to unlock the value of data coming from mobile cellularnetworks.
– Vitabile et al. report on recent developments in health monitoring technologies toenable diagnosis and treatment of patients with chronic diseases, older adults, andpeople with disabilities. They also highlight the value of sensor-supported pervasivehealthcare to facilitate independent living and disease management.
– Spolaor et al. enquire into HPC-enabled model reduction techniques to uncoveremergent behaviors in complex cellular systems. Their large-scale comprehensiveapproach aims to improve the understanding of cell behavior using multiple scalesof temporal and spatial organisation.
Fig. 1. Schematic representation of the cHiPSet action.
viii Preface

– Olgac et al. survey tools and workflows for cloud-based virtual screening, adata-intensive computational method for rational drug design and development.They explain its relevance to medicinal chemists, pharmacologists, and computa-tional scientists for the discovery and testing of novel pharmaceuticals.
– Kołodziej et al. introduce ultra wide band for wireless body area networks—interconnected structures of nodes attached to a human body, an external basestation, and possibly the Internet. Their survey describes cloud-based data storage,security, and analysis in the context of mobile health monitoring.
– Marechal et al. discuss the challenges involved in automatic human emotionrecognition. As an evolving area in artificial intelligence, it entails the developmentof data-driven systems for emotion representation, recognition, and prediction.
– Finally, Zamuda et al. outline the state of the art in forecasting cryptocurrency valueby sentiment analysis. Their contribution includes current challenges in thedeployment of distributed ledgers (blockchains) and sentiment analysis metricsusing large data streams and cloud platforms.
In summary, the cHiPSet COST Action facilitated the exchange of knowledge,experiences, and best practices between individuals with a track record in HPC anddomain scientists and engineers. Its tangible collaborative endeavors have arguablyenhanced the resolution and accuracy of M–S by deploying smart algorithms andtechniques on large-scale infrastructures. The cHiPSet COST Action has contributedtoward improving the understanding of natural phenomena and complex systems forEuropean academics and industry practitioners.
This compendium is based on collaborative endeavors partly supported by IC1406High-Performance Modelling and Simulation for Big Data Applications – cHiPSet(cHiPSet), an Action supported by COST (European Cooperation in Science andTechnology) from 2015 to 2019, as part of Horizon 2020—the EU Framework Pro-gramme for Research and Innovation.
We are grateful to all the contributors of this book, for their willingness to work onthis interdisciplinary book project. We thank the authors for their interesting proposalsof the book chapters, their time, efforts, and their research ideas, which makes thisvolume an interesting complete state-of-the-art monograph of the latest researchadvances and technology developments on the next generation of distributed andcomplex HPC M-S in the big data era. We also would like to express our sincere thanksto the reviewers, who helped us ensure the quality of this volume. We gratefullyacknowledge their time and valuable remarks and comments.
Our special thanks go to Alfred Hoffmann, Aliaksandr Birukou, Anna Kramer, andall the editorial team of Springer for their patience, valuable editorial assistance, andexcellent cooperative collaboration in this book project.
Finally, we would like to send our warmest gratitude to our friends and families fortheir patience, love, and support in the preparation of this volume.
January 2019 Joanna KołodziejHoracio González–Vélez
Preface ix

IC1406 Committee
Action Scientific Officer
Ralph Stübner Cost Association, Brussels, Belgium
Action Chair
Joanna Kołodziej Cracow University of Technology, Poland
Action Vice Chair
Horacio González–Vélez Cloud Competency Centre, National Collegeof Ireland, Dublin, Ireland
Scientific Coordinator
Clemens Grelck University of Amsterdam, The Netherlands
Working Group (WG) Leaders
WG1 Leader
Ewa Niewiadomska–Szynkiewicz
Warsaw University of Technology, Poland
WG2 Leader
Marco Aldinucci University of Turin, Italy
WG3 Leader
Andrea Bracciali University of Stirling, UK
WG4 Leader
Elisabeth Larsson University of Uppsala, Sweden
STSM Coordinator
Juan Carlos Burguillo-Rial University of Vigo, Spain
TS Coordinator
Ciprian Dobre University Politehnica of Bucharest, Romania

Dissemination Coordinator
Peter Kilpatrick Queen’s University, Belfast, UK
Industry Collaboration Coordinator
Dave Feenan Technology Ireland ICT Skillnet, Ireland
xii IC1406 Committee

Contents
Why High-Performance Modelling and Simulation for Big DataApplications Matters . . . . . . . . . . . . . . . . . . . . . . . . . . . . . . . . . . . . . . . . 1
Clemens Grelck, Ewa Niewiadomska-Szynkiewicz, Marco Aldinucci,Andrea Bracciali, and Elisabeth Larsson
Parallelization of Hierarchical Matrix Algorithms for ElectromagneticScattering Problems. . . . . . . . . . . . . . . . . . . . . . . . . . . . . . . . . . . . . . . . . 36
Elisabeth Larsson, Afshin Zafari, Marco Righero,M. Alessandro Francavilla, Giorgio Giordanengo, Francesca Vipiana,Giuseppe Vecchi, Christoph Kessler, Corinne Ancourt,and Clemens Grelck
Tail Distribution and Extreme Quantile Estimation UsingNon-parametric Approaches . . . . . . . . . . . . . . . . . . . . . . . . . . . . . . . . . . . 69
Imen Rached and Elisabeth Larsson
Towards Efficient and Scalable Data-Intensive Content Delivery:State-of-the-Art, Issues and Challenges . . . . . . . . . . . . . . . . . . . . . . . . . . . 88
Irene Kilanioti, Alejandro Fernández-Montes,Damián Fernández-Cerero, Anthony Karageorgos, Christos Mettouris,Valentina Nejkovic, Nikolas Albanis, Rabih Bashroush,and George A. Papadopoulos
Big Data in 5G Distributed Applications . . . . . . . . . . . . . . . . . . . . . . . . . . 138Valentina Nejkovic, Ari Visa, Milorad Tosic, Nenad Petrovic,Mikko Valkama, Mike Koivisto, Jukka Talvitie, Svetozar Rancic,Daniel Grzonka, Jacek Tchorzewski, Pierre Kuonen,and Francisco Gortazar
Big Data Processing, Analysis and Applications in MobileCellular Networks . . . . . . . . . . . . . . . . . . . . . . . . . . . . . . . . . . . . . . . . . . 163
Sanja Brdar, Olivera Novović, Nastasija Grujić,Horacio González–Vélez, Ciprian-Octavian Truică, Siegfried Benkner,Enes Bajrovic, and Apostolos Papadopoulos
Medical Data Processing and Analysis for Remote Healthand Activities Monitoring. . . . . . . . . . . . . . . . . . . . . . . . . . . . . . . . . . . . . 186
Salvatore Vitabile, Michal Marks, Dragan Stojanovic, Sabri Pllana,Jose M. Molina, Mateusz Krzyszton, Andrzej Sikora,Andrzej Jarynowski, Farhoud Hosseinpour, Agnieszka Jakobik,Aleksandra Stojnev Ilic, Ana Respicio, Dorin Moldovan, Cristina Pop,and Ioan Salomie

Towards Human Cell Simulation. . . . . . . . . . . . . . . . . . . . . . . . . . . . . . . . 221Simone Spolaor, Marco Gribaudo, Mauro Iacono, Tomas Kadavy,Zuzana Komínková Oplatková, Giancarlo Mauri, Sabri Pllana,Roman Senkerik, Natalija Stojanovic, Esko Turunen, Adam Viktorin,Salvatore Vitabile, Aleš Zamuda, and Marco S. Nobile
Cloud-Based High Throughput Virtual Screening in NovelDrug Discovery . . . . . . . . . . . . . . . . . . . . . . . . . . . . . . . . . . . . . . . . . . . 250
Abdurrahman Olğaç, Aslı Türe, Simla Olğaç, and Steffen Möller
Ultra Wide Band Body Area Networks: Design and Integrationwith Computational Clouds . . . . . . . . . . . . . . . . . . . . . . . . . . . . . . . . . . . 279
Joanna Kołodziej, Daniel Grzonka, Adrian Widłak,and Paweł Kisielewicz
Survey on AI-Based Multimodal Methods for Emotion Detection . . . . . . . . . 307Catherine Marechal, Dariusz Mikołajewski, Krzysztof Tyburek,Piotr Prokopowicz, Lamine Bougueroua, Corinne Ancourt,and Katarzyna Węgrzyn-Wolska
Forecasting Cryptocurrency Value by Sentiment Analysis:An HPC-Oriented Survey of the State-of-the-Art in the Cloud Era . . . . . . . . 325
Aleš Zamuda, Vincenzo Crescimanna, Juan C. Burguillo,Joana Matos Dias, Katarzyna Wegrzyn-Wolska, Imen Rached,Horacio González-Vélez, Roman Senkerik, Claudia Pop, Tudor Cioara,Ioan Salomie, and Andrea Bracciali
Author Index . . . . . . . . . . . . . . . . . . . . . . . . . . . . . . . . . . . . . . . . . . . . 351
xiv Contents

Why High-Performance Modellingand Simulation for Big Data
Applications Matters
Clemens Grelck1(B) , Ewa Niewiadomska-Szynkiewicz2 ,Marco Aldinucci3 , Andrea Bracciali4 , and Elisabeth Larsson5
1 University of Amsterdam, Amsterdam, [email protected]
2 Warsaw University of Technology, Warsaw, [email protected]
3 University of Turin, Turin, [email protected]
4 University of Stirling, Stirling, [email protected]
5 Uppsala University, Uppsala, [email protected]
Abstract. Modelling and Simulation (M&S) offer adequate abstrac-tions to manage the complexity of analysing big data in scientific andengineering domains. Unfortunately, big data problems are often not eas-ily amenable to efficient and effective use of High Performance Comput-ing (HPC) facilities and technologies. Furthermore, M&S communitiestypically lack the detailed expertise required to exploit the full potentialof HPC solutions while HPC specialists may not be fully aware of specificmodelling and simulation requirements and applications.
The COST Action IC1406 High-Performance Modelling and Simula-tion for Big Data Applications has created a strategic framework to fos-ter interaction between M&S experts from various application domainson the one hand and HPC experts on the other hand to develop effec-tive solutions for big data applications. One of the tangible outcomes ofthe COST Action is a collection of case studies from various computingdomains. Each case study brought together both HPC and M&S experts,giving witness of the effective cross-pollination facilitated by the COSTAction.
In this introductory article we argue why joining forces between M&Sand HPC communities is both timely in the big data era and crucial forsuccess in many application domains. Moreover, we provide an overviewon the state of the art in the various research areas concerned.
1 Introduction
The big data era poses a critically difficult challenge for high-performance com-puting (HPC): how to efficiently turn massively large and often unstructured orc© The Author(s) 2019J. Ko�lodziej and H. Gonzalez-Velez (Eds.): cHiPSet, LNCS 11400, pp. 1–35, 2019.https://doi.org/10.1007/978-3-030-16272-6_1

2 C. Grelck et al.
semi-structured data first into valuable information and then into meaningfulknowledge. HPC facilities and technologies are effectively required in a rapidlyincreasing number of data-intensive domains from life and physical sciences tosocioeconomic systems. Thus, the big data era likewise offers striking opportu-nities for HPC to widen its scope and to strengthen its societal and economicimpact.
High-performance Computing (HPC) and high throughput computing under-pin the large scale processing of grand challenge problems with data-intensiverequirements in order to enable complex applications in distinct scientific andtechnical fields such as high-energy physics, genomics, systems and syntheticbiology, industrial automation, social and economic data analytics and medicalinformatics. This has led to a substantial improvement in the understanding ofdiverse domains ranging from the evolution of the physical world to human soci-eties. Application performance in HPC systems is nowadays largely dominatedby remote and local data movement overhead (network messages, memory andstorage accesses). This poses new challenges to HPC modelling and program-ming languages, which should enhance data locality where possible and enablefast data transition where needed.
When investigating the behaviour and complexity of abstractions for large-scale big data systems, one employs a series of technologies that have their rootsin well-funded large compute cluster environments. With the advent of hard-ware accelerators (GPU, FPGA), pay-by-use cloud services, and the increasedperformance of general-purpose processors, HPC has become an option for manyscientific disciplines.
The COST Action IC1406 High-Performance Modelling and Simulation forBig Data Applications facilitates cross-pollination between the HPC commu-nity (both developers and users) and M&S disciplines for which the use of HPCfacilities, technologies and methodologies still is a novel, if any, phenomenon.Data-intensive domains make the issue of efficiency particularly relevant forproblems such as multi-dimensional and multi-level integration and model stateexplosion. Furthermore, these complex systems do not straightforwardly lendthemselves to modular decomposition, a crucial prerequisite for parallelisation,and, hence, HPC support. They often require a significant amount of compu-tational resources with data sets scattered across multiple sources and differentgeographical locations.
Modelling and Simulation (M&S) are widely considered essential tools inscience and engineering to substantiate the prediction and analysis of complexsystems and natural phenomena. Modelling has traditionally addressed complex-ity by raising the level of abstraction and aiming at an essential representationof the domain at hand. This has resulted in a complicated trade-off betweenaccuracy and efficiency. That is to say, the properties of a system can be studiedby reproducing (i.e., simulating) its behaviour through its abstract representa-tion. Arguably, the context of the application level should be reconsidered. Forinstance, Monte Carlo simulations must be fed with input data, store intermedi-ate results, and filter and merge output data in an adjusted and reliably robust

Why HPC Modelling and Simulation for Big Data Applications Matters 3
manner. Thus, M&S approaches are particularly affected by the data deluge phe-nomenon since they need to use large data sets to enhance resolution and scaleand distribute and analyse data in the different phases of the simulation-analysispipeline.
Both HPC and M&S are well established research areas each by themselves.However, a better integration of the two, aimed at applications from variousdomains, will bring substantial progress in addressing big data problems.
On the one hand, domain experts need HPC for simulation, modelling, anddata analysis, but are often unaware of performance and parallelism exploita-tion pitfalls in their designs. On the other hand, designers of HPC developmenttools and systems primarily focus on absolute performance measures, by defi-nition the raison d’etre for HPC. However, MIPS, FLOPS, and speedups neednot be the only measures. Domain-specific considerations may put some more oreven almost all emphasis on other factors, such as usability, productivity, eco-nomic cost and time to solution. By further improving collaboration with domainexperts HPC architects ought to be able to develop programming models andarchitectures better tailored to specific problems. Likewise, analysis and valida-tion tools ought to be improved for a better understanding of HPC systems bydomain experts.
The COST Action IC1406 High-Performance Modelling and Simulation forBig Data Applications is based on the idea that key aspects of HPC-enabledM&S must be jointly addressed by considering the needs and issues posed bythe two communities together. When multidimensional, heterogeneous, massivedata sets need to be analysed in a specific big data application domain, themethods required to suitably process the data are necessarily determined by thekind of data and analysis to be performed.
Consequently, the features of a programming language, library or executionmachinery supporting the efficient implementation of the analysis should not bethought of as independent of the specific data and analysis themselves. Analo-gously, data characteristics must drive the design and implementation of datastorage systems enabling efficient storage, access, and manipulation. Within thisvision, the COST Action addresses the specific challenges of both M&S and HPCin a unified way.
The participants of the COST Action jointly work towards a unified frame-work for the systematic advancement of M&S and big data endeavours supportedby leading HPC-enabled models and tools through a coordinated effort of HPCand M&S experts. The main objective is to create a long-lasting, sustainable,reference network of research links between the HPC community on the one handand the multiple M&S research communities addressing big data problems onthe other hand. Such links enable a novel and persisting collaboration frameworkacross HPC and M&S communities, covering both academia and industry acrossEurope and beyond with a common agenda: turning huge amounts of raw datainto useful knowledge.
The remainder of this paper is organised as follows: We first illustrate thebackground of our work and review the current state of the art in Sect. 2.

4 C. Grelck et al.
Following this introductory part, we have a closer look at the subjects relevantto the four working groups that make up the COST Action IC1406. We focus onEnabling Infrastructures and Middleware for Big-Data Modelling and Simulationin Sect. 3, Parallel Programming Models for Big-Data Modelling and Simulationin Sect. 4, HPC-enabled Modelling and Simulation for Life Sciences in Sect. 5,HPC-enabled Modelling and Simulation for Socio-Economical and Physical Sci-ences in Sect. 6, respectively. Last, but not least, we draw some conclusions inSect. 7.
2 Background and State of the Art
High-Performance Computing is currently undergoing a major change withexascale systems expected for the early 2020s. They will be very different fromtoday’s HPC systems and pose a number of technological challenges, from energyconsumption to the development of adequate programming models for millionsof computing elements. Several current exascale research programmes, therefore,span a 10 to 20-year period. Major experiments depend on HPC for the analysisand interpretation of data and the simulation of models.
Modelling and Simulation have traditionally been used where the complexityof the problem makes more direct analytical approaches unsuitable or impossi-ble. This is particularly true for big data problems where the support of HPCinfrastructures and programming models is essential. The design and optimisa-tion of HPC-enabled big data experiments and large scale HPC systems requirethe realistic description and modelling of the data access patterns, the dataflow across the local and wide area networks and the scheduling and workloadpresented by hundreds of jobs running concurrently and exchanging very largeamounts of data. Data-intensive (big data) HPC is arguably fundamental toaddress grand-challenge M&S problems.
In fact, several M&S approaches are based on discrete-event frameworks dueto their efficiency and scalability. M&S have addressed problems such as schedul-ing in distributed, heterogeneous environments, economy-driven resource alloca-tion, big data access in distributed environments and more generic HPC concur-rent, distributed and cloud architecture. As described in the CERN Big DataHPC infrastructure, stochastic data traffic, management of virtual machines, andjob allocation in data centers represent grand-challenge HPC-related problems,which require extensive use of M&S and HPC itself. Attempts to describe andanalyse hardware, middleware and application co-design, an important develop-ment direction for HPC, have been made, but they currently appear too costly.The complexity can be reduced by means of coarse-grained models, which needprecise measures of uncertainty and associated errors and statistical inference.Simulations have been run in this context for systems with one million cores.Recent trends aim to empower programmers to more easily control the hardwareperformance. Examples include the embedding of HPC facilities in standard OSdistributions.
From an application perspective, HPC-enabled M&S has started to play acrucial role in a number of diverse knowledge domains. Preliminary proposals

Why HPC Modelling and Simulation for Big Data Applications Matters 5
with direct porting of existing techniques in HPC (e.g. in climate modelling)and further developments are being sought. In computational electromagneticsmodelling problems with up to one billion variables have been addressed withboth memory- and CPU-intensive algorithms, solving major longstanding prob-lems. More structured approaches based on pattern-based parallel programmingeffectively cater for the design and development of parallel pipelines for M&S insystems biology and next generation sequencing [1,2], providing developers withportability across a variety of HPC platforms, like clusters of multi-cores [3,4]as well as cloud infrastructures [5].
However, HPC-enabled M&S has still not reached a fully satisfactory matu-rity, facing relevant problems in terms of computational efficiency and lackof generality and expressiveness when addressing data-intensive scenarios. Thedevelopment of new complex HPC-enabled M&S applications requires collabo-rative efforts from researchers with different domain knowledge and expertise.Since most of these applications belong to domains within the life, social andphysical sciences, their mainstream approaches are rooted in non-computationalabstractions and they are typically not HPC-enabled.
Recent surveys of the use of HPC in life sciences illustrate possible newscenarios for knowledge extraction and the management of large-scale and het-erogeneous data collections with numerous applications in medical informat-ics. Valuable big data diagnostic applications are being developed with the aimof improving diagnosis by integrating images and large multi-source data sets.These come at the extraordinary price of HPC-level infrastructure and sufferfrom the lack of standard protocols for big data representation and processing.Once computational results are obtained, large amounts of information needdomain-specific validation. For instance, in bio-medical studies, wet-lab valida-tion typically involves additional resource-intensive work that has to be gearedtowards a statistically significant distilled fragment of the computational results,suitable to confirm the bio-medical hypotheses and compatible with the availableresources.
Big data is an emerging paradigm whose size and features are beyond the abil-ity of the current M&S tools [6]. Datasets are heterogeneous, i.e., they are pro-duced by different sources and are of a large size with high in/out rates. big dataaccessibility and the capability to efficiently bring and combine data togetherwill be extremely valuable. Currently, many HPC-enabled M&S efforts havebeen proposed in several big data contexts, as diverse as performance evaluationand the management of HPC frameworks, research on blood anti-coagulants, thenumerical evaluation of quantum dynamics, computational social network analy-sis (e.g. the relationship between Internet use and specific emotions, human obe-sity or happiness) and genomic sequence discovery. Some approaches have beensuccessful, leading to potential industrial impact and supporting experimentsthat generate petabytes of data, like those performed at CERN for instance.
Furthermore, there are a growing number of new implementations of memory-demanding applications that have not yet been adapted for HPC environments,mainly because of limited communication between field experts and those with

6 C. Grelck et al.
suitable skills for the parallel implementation of data-intensive applications.Therefore, another natural objective of our work is to intelligently transfer theheterogeneous workflows in M&S to HPC, which will boost those scientific fieldsthat are essential for both M&S and HPC societies [7]. Benefits will be recipro-cal. M&S experts are be supported in their investigations by properly-enabledHPC frameworks, currently sought but missing. HPC architects in turn obtainaccess to a wealth of application domains by means of which they will betterunderstand the specific requirements of HPC in the big data era. Among others,we aim at the design of improved data-center oriented programming models andframeworks for HPC-enabled M&S.
3 Enabling Infrastructures and Middleware for Big-DataModelling and Simulation
From the inception of the Internet, one has witnessed an explosive growth in thevolume, speed and variety of electronic data created on a daily basis. Raw datacurrently originates from numerous sources including mobile devices, sensors,instruments (e.g., CERN LHC, MR scanners, etc.), computer files, Internet ofThings, governmental/open data archives, system software logs, social networks,commercial datasets, etc. The challenge is how to collect, integrate and store,with less hardware and software requirements, tremendous data sets generatedfrom distributed sources.
The so-called big data problem requires the continuous improvement ofservers, storage, and the whole network infrastructure in order to enable theefficient analysis and interpretation of data through on-hand data managementapplications, e.g. agent-based solutions in Agent Component in Oracle DataIntegrator (ODI). The main challenge in big data modelling and simulation is todefine a complete framework which includes intelligent management and com-munication, data fusion, mapping algorithms and protocols. The programmingabstractions and data manipulation techniques must, therefore, be designed for(a) the seamless implementation of application solutions with efficient levels ofvirtualisation of computational resources (communications, storage, and servers)and (b) the effective normalisation and merging of data with dissimilar types intoa consistent format (wide class of data services).
Energy-awareness is an important aspect of big data computing and sim-ulation. The goal is to reduce the gap between the capacity provided by dis-tributed computing environments and application requirements, especially dur-ing low workload periods. Various efforts are undertaken to develop energyefficient task scheduling and balancing of loads [8–11] and frequency scalingtechniques [12–14].
Infrastructure and Middleware for Big Data Processing. Numerous algorithms,computing infrastructures and middleware for HPC and big data processing havebeen developed during previous decades [15,16]. In general, current middleware

Why HPC Modelling and Simulation for Big Data Applications Matters 7
for parallel computating focuses on providing powerful mechanisms for manag-ing communication between processors and environments for parallel machinesand computer networks. High Performance Fortran (HPF), OpenMP, OpenACC,PVM, and MPI were designed to support communications for scalable applica-tions. The application paradigms were developed to perform calculations onshared memory machines and clusters of machines with distributed memory.However, the easy access to information offered by the internet led to a newidea: extending the connection between computers, so that distributed resources,including computing power, storage, applications, etc. could be accessed as eas-ily as information on web pages. The idea was implemented in many forms, butlately it has grown into three main computing environments: computing clus-ters, grids and clouds. A survey of software tools for supporting cluster, gridand cloud computing is provided in [15,17,18]. Examples of commonly knownkernels for cluster computing are MOSIX [19], OpenSSI [20] and Kerrighed [21].Uniform interfaces to computing resources in grids and toolkits for building grids(e.g. UNICORE [22] or Globus Toolkit [23]) are described in literature [24,25].Cloud computing infrastructures consisting of services delivered through com-mon centers and built on servers are discussed in [18].
An alternative to supercomputers and computing clusters—the (General-Purpose) Graphics Procession Unit (GPGPU)—is widely used in HPC simula-tion [26]. Using both CPU and GPU through CUDA or OpenCL many real-worldapplications can rather easily be implemented and run significantly faster thanon multi-processor or multi-core systems.
Tools and Platforms for Big Data Processing. Job scheduling, load balancingand management play a crucial role in HPC and big data simulation [27,28].TORQUE [29] is a distributed resource manager providing control over batchjobs and distributed compute nodes. Slurm [30] is an open source, fault-tolerantand highly scalable cluster management and job scheduling system for large andsmall Linux clusters. MapReduce [31] is a framework that simplifies the process-ing of massive volumes of data through using two subsequent functions, i.e. theMap function that sorts and splits the input data and the Reduce function that isresponsible for processing the intermediate output data. Resource managementand job scheduling technology like YARN [32] allows multiple data processingengines such as batch processing, real-time streaming, interactive SQL and datascience to handle data stored in a single platform. The Apache Hadoop softwarelibrary [32] supports the distributed, scalable batch processing of large data setsacross clusters of computers using a simple programming model. The power ofthe Hadoop platform is based on the Hadoop Distributed File System (HDFS), adistributed and scalable non-relational database HBase, MapReduce, YARN andmany other open source projects. Some of the best-known include: Spark, Pig,Hive, JAQL, Sqoop, Oozie, Mahout, etc. Apache Spark [33], a unified enginefor big data processing, provides an alternative to MapReduce that enablesworkloads to execute in memory, instead of on disk. Thus Spark avoids theresource-intensive disk operations that MapReduce requires. It processes data inRAM utilizing a data model based on the Resilient Distributed Dataset (RDD)

8 C. Grelck et al.
abstraction. Apache Storm [34] is a scalable, rapid, fault-tolerant platform fordistributed computing that has the advantage of handling real time data process-ing downloaded from synchronous and asynchronous systems. Apache Flink [35]can be used to batch and stream processing, event-time processing and statefulcomputations, well-suited for discrete-event simulation.
Platforms for Big Data Visualisation and Machine Learning. Numerous tools forbig data analysis, visualisation and machine learning have been made available.RapidMiner Studio [36], Orange [37] and Weka [38] belong to this group. Newsoftware applications have been developed for browsing, visualizing, interpretingand analyzing large-scale sequencing data. Some of them have been designedspecifically for visualisation of genome sequence assemblies, including Tablet[39]. Other tools, such as BamView [40] have been developed specifically tovisualise mapped read alignment data in the context of the reference sequence.Artemis [41] is a freely available integrated platform for visualisation and anal-ysis of large-scale experimental data. The survey of platforms and packages forsocial network analysis, simulation and visualisation that have wide applicationsincluding biology, finance and sociology is presented in [42].
Frameworks for Big Data Systems Simulation. Another issue is concerned withlarge-scale systems simulation. The combination of efficient and reliable simula-tion software and purpose-built hardware optimized for simulation workloads iscrucial to fully exploit the value of simulation and big data. Synchronous andasynchronous distributed simulation have been one of the options that couldimprove the scalability of a simulator both in term of application size and exe-cution speed, enabling large scale systems to be simulated in real time [43,44].ScalaTion [45] provides comprehensive support for discrete-event simulation andbig data analytics. A software framework for federated simulation of WSN andmobile ad-hoc networks is presented in [46]. The paper [47] reviews several large-scale military simulations and describes two frameworks for data managementbased on layered and service oriented architectures. GPU-based simulation plat-forms are mainly dedicated to massive data processing, e.g. high-performanceneural network simulators [48,49], simulation of P systems [50], large-scale vol-ume of data simulation and visualisation [51].
Numerous software platforms have been designed to simulate large-scale dis-tributed data centers and computer networks. JADE [52] is the heterogeneousmultiprocessor design simulation environment that allows to simulate network-on-chips, inter-chip networks and intra-rack networks using optical and electricalinterconnects. SimGrid [53] can be used to simulate grids, clouds, HPC or P2Psystems and evaluate heuristics or prototype applications. CloudSim [54] is oneof the most popular open source framework for modeling and simulation of cloudcomputing infrastructures and services. Multi2Sim [55] is a software platform forsimulation of new CPU and GPU technologies.

Why HPC Modelling and Simulation for Big Data Applications Matters 9
4 Parallel Programming Models for Big-Data Modellingand Simulation
A core challenge in modelling and simulation is the need to combine softwareexpertise and domain expertise. Even starting from well-defined mathematicalmodels, manual coding is inevitable. When parallel or distributed computing isrequired, the coding becomes much harder. This may impair time-to-solution,performance, and performance portability across different platforms. These prob-lems have been traditionally addressed by trying to lift software design anddevelopment to a higher level of abstraction.
In the domain-specific languages (DSL) approach abstractions aim to pro-vide domain experts with programming primitives that match specific conceptsin their domain. Performance and portability issues are ideally moved (withvarious degrees of effectiveness) to development tools. Examples include Verilogand VHDL hardware description languages, MATLAB for matrix programming,Mathematica and Maxima for symbolic mathematics, etc.
In general-purpose approaches such as model-driven engineering (MDE),general-purpose programming concepts are abstracted into high-level constructsenforcing extra-functional features by design, e.g. compositionality, portability,parallelisability. In this regard, the number and the quality of programming mod-els enabling the high-level management of parallelism have steadily increasedand, in some cases, these approaches have become mainstream for a range ofHPC, data-intensive and big data workloads: streaming (e.g. Storm [56] andSpark [57]), structured parallel programming and MapReduce [58] (e.g. Hadoop[59], Intel TBB [60], OpenMP [61], MPI [62]), SIMD (e.g. OpenACC [63]). Thislist can be extended by various academic approaches, including ones proposedand advocated by members of the COST Action (e.g. FastFlow [64,65]), SkePU[66], SaC [67], S-Net [68]).
A sensible result achieved by the working group on Parallel ProgrammingModels for Big-Data Modelling and Simulation has been the assessment of thestate of the art. A selection of the mainstream approaches in this area are pre-sented in Sect. 4.1, namely Google MapReduce, Apache Spark, Apache Flink,Apache Storm and Apache Beam. In Sect. 4.2 we describe a systematic mappingstudy, aimed to capture and categorise non-mainstream DSLs.
4.1 Languages and Frameworks for Big Data Analysis
Boosted by big data popularity new languages and frameworks for data ana-lytics are appearing at an increasing pace. Each of them introduces its ownconcepts and terminology and advocates a (real or alleged) superiority in termsof performance or expressiveness against its predecessors. In this hype, for auser approaching big data analytics (even an educated computer scientist) it isincreasingly difficult to retain a clear picture of the programming model under-neath these tools and the expressiveness they provide to solve some user-definedproblem.

10 C. Grelck et al.
To provide some order in the world of big data processing, a toolkit of modelsto identify their common features is introduced, starting from data layout.
Data-processing applications are divided into batch vs. stream processing.Batch programs process one or more finite datasets to produce a resulting finiteoutput dataset, whereas stream programs process possibly unbounded sequencesof data, called streams, in an incremental manner. Operations over streams mayalso have to respect a total data ordering, for instance to represent time ordering.
The comparison of different languages for big data analytics in terms ofthe expressiveness of their programming models is a non-trivial exercise. A for-malised approach requires to map them onto an unifying (and lower-level) com-putation model, i.e. the Dataflow model [69]. As shown in [70], it is able tocapture the distinctive features of all frameworks at all levels of abstraction,from the user-level API to the execution model. In the Dataflow model, appli-cations as a directed graph of actors. In its “modern” macro-data flow version[71], it naturally models independent (thus parallelizable) kernels starting froma graph of true data dependencies, where a kernel’s execution is triggered bydata availability.
The Dataflow model is expressive enough to describe batch, micro-batchand streaming models that are implemented in most tools for big data process-ing. Also, the Dataflow model helps in maturing the awareness that many bigdata analytics tools share almost the same base concepts, differing mostly intheir implementation choices. For a complete description of the Dataflow modelwe refer back to [6,70], where the main features of mainstream languages arepresented.
Google MapReduce. Google can be considered the pioneer of big data pro-cessing, as the publication of the MapReduce framework paper [72] made thismodel mainstream. Based on the map and reduce functions, commonly used inparallel and functional programming [73], MapReduce provides a native key-value model and built-in sorting facilities. These made MapReduce successfulfor several big data analytics scenarios.
A MapReduce program is built on the following user-defined functions:
1. a map function that is independently applied to each item from an inputkey-value dataset to produce an intermediate key-value dataset;
2. a reduce function that combines all the intermediate values associated witheach key (together with the key itself) into lists of reduced values (one perkey);
3. a partitioner function that is used while sorting the intermediate dataset(i.e., before being reduced), so that the order over the key space is respectedwithin each partition identified by the partitioner.
Parallel Execution. A simple form of data parallelism can be exploited on theflat-map side, by partitioning the input collection into n chunks and having nexecutors process a chunk. In Dataflow terms this corresponds to a graph with nactors, each processing a token that represents a chunk. Each flat-map executor

Why HPC Modelling and Simulation for Big Data Applications Matters 11
emits R (i.e. the number of intermediate partitions) chunks, each containing theintermediate key-value pairs mapped to a given partition.
The intermediate chunks are processed by R reduce executors. Each executor:
1. receives n chunks (one from each flat-map executor);2. merges the chunks into an intermediate partition and partially sorts it based
on keys, as discussed above;3. performs the reduction on a per-key basis.
Finally, a downstream collector gathers R tokens from the reduce executors andmerges them into the final result.
A key aspect in the depicted parallelisation is the shuffle phase in which datais distributed between flat-map and reduce operators, according to an all-to-allcommunication schema. This poses severe challenges from the implementationperspective.
Run-time Support. The most widespread implementation (i.e. Hadoop), is basedon a Master-Workers approach, in which the master retains the control overthe global state of the computation and informs the workers about the tasks toexecute.
A cornerstone of Hadoop is its distributed file system (HDFS), which is usedto exchange data among workers, in particular upon shuffling. As a key featureHDFS exposes the locality for stored data, thus enabling the principle of movingthe computation towards the data and to minimise communication. However,disk-based communication leads to performance problems when dealing withiterative computations, such as machine learning algorithms [74].
Apache Spark. Apache Spark [75] was proposed to overcome some limita-tions in Google’s MapReduce. Instead of a fixed processing schema, Spark allowsdatasets to be processed by means of arbitrarily composed primitives, construct-ing a directed acyclic graph (DAG). Moreover, instead of exclusively relying ondisks for communicating data among the processing units, in-memory caching isexploited to boost performance, in particular for iterative processing.
Parallel Execution and Runtime Support. From the application DAG, Sparkinfers a parallel execution dataflow, in which many parallel instances of actorsare created for each function and independent actors are grouped into stages. Dueto the Spark batch-oriented implementation, each stage that depends on someprevious stages has to wait for their completion before execution commences,equivalent to the classical Bulk Synchronous Parallelism (BSP) approach. Thus,a computation proceeds in a series of global supersteps, each consisting of:
1. concurrent computation, in which each actor processes its own partition;2. communication, where actors exchange data between themselves if necessary
(the shuffle phase);3. barrier synchronization, where actors wait until all other actors have reached
the same barrier.

12 C. Grelck et al.
Similar to the MapReduce implementation, Spark’s execution model relies onthe master-Workers model: a cluster manager (e.g. YARN) manages resourcesand supervises the execution of the program. It manages application schedulingto worker nodes, which execute the application logic (the DAG) that has beenserialized and sent by the master.
Apache Flink. Apache Flink [76] is similar to Spark, in particular from theAPI standpoint. However, Flink is based on streaming as a primary concept,rather than a mere linguistic extension on top of batch processing (as Spark).With the exception of iterative processing, stream parallelism is exploited toavoid expensive synchronizations among successive phases when executing bothbatch and stream programs.
Parallel Execution and Runtime Support. Flink transforms a JobGraph into anExecutionGraph, in which the JobVertex contains ExecutionVerteces (actors),one per parallel sub-task. A key difference compared to the Spark executiongraph is that, apart from iterative processing (that is still executed under BSP),there is no barrier among actors or verteces. Instead, there is effective pipelining.
Also Flink’s execution model relies on the master-workers model: a deploy-ment has at least one job manager process that receives Flink jobs and coordi-nates checkpointing and recovery. The job manager also schedules work acrossthe task manager processes (i.e. the workers), which usually reside on separatemachines and in turn execute the code.
Apache Storm. Apache Storm [56,77] is a framework that exclusively targetsstream processing. It is perhaps the first widely used large-scale stream process-ing framework in the open source world. Whereas Spark and Flink are based ona declarative data processing model, i.e., they provide as building blocks datacollections and operations on those collections, Storm, in contrast, is based on a“topological” approach in that it provides an API to explicitly build graphs.
Parallel Execution and Runtime Support. At execution level, each actor is repli-cated to increase the inter-actor parallelism, and each group of replicas corre-sponds to the Bolt/Spout in the semantics Dataflow. Each of these actors repre-sents independent data-parallel tasks, on which pipeline parallelism is exploited.Eventually, tasks are executed by a master-workers engine, as in the previouslydiscussed frameworks.
Google Cloud Platform and Apache Beam. Google Dataflow SDK [78]is part of the Google Cloud Platform. Google Dataflow supports a simplifiedpipeline development via Java and Python APIs in the Apache Beam SDK,which provides a set of windowing and session analysis primitives as well as anecosystem of source and sink connectors. Apache Beam allows the user to createpipelines that are executed by one of Beam’s supported distributed process-ing back-ends, which are called runners. Currently, they include, among others,Apache Flink, Apache Spark and Google Cloud Dataflow.

Why HPC Modelling and Simulation for Big Data Applications Matters 13
Parallel Execution and Runtime Support. The bounded (or unbounded) natureof a PCollection also affects how data is processed. Bounded PCollections can beprocessed using batch jobs, that might read the entire data set once and performprocessing as a finite job. Unbounded PCollections must be processed usingstreaming jobs—as the entire collection will never be available for processingat any one time—and bounded subcollections can be obtained through logicalfinite size windows.
As mentioned, Beam relies on the runner specified by the user. When exe-cuted, an entity called Beam Pipeline Runner (related to execution back-end)translates the data processing pipeline into the API compatible with the selecteddistributed processing back-end. Hence, it creates an execution graph from thePipeline, including all the Transforms and processing functions. That graph isthen executed using the appropriate distributed processing back-end, becomingan asynchronous job/process on that back-end. Thus, the final parallel executiongraph is generated by the back-end.
The parallel execution data flow is similar to the one in Spark and Flink.Parallelism is expressed in terms of data parallelism in Transforms (e.g. ParDofunction) and inter-actor parallelism on independent Transforms. In Beam’snomenclature this graph is called the Execution Graph. Similar to Flink pipelineparallelism is exploited among successive actors.
4.2 The Systematic Mapping Study on Parallel ProgrammingModels for Big-Data Modelling and Simulation
A major challenge undertaken within the working group on Parallel Program-ming Models for Big-Data Modelling and Simulation was that of trying to under-stand and classify the state of the art in this area and to better understand thelines of future development. In order to minimize the bias, given that manyAction participants actively design programming models and tools, the work-ing group refined and adopted a systematic methodology to study the state ofthe art, called systematic mapping study (SMS). The mapping study focusedon the main paradigms and properties of programming languages used in high-performance computing for gig data processing.
The SMS started from the definition of a workflow based on the methodologyproposed in [79] that is organised in five successive steps:
Research Questions aiming at formulating the research questions the SMSshould answer;
Search of Primary Studies aiming at detecting the largest number of primaryarticles related to the proposed research questions;
Selection of Primary Studies aiming at sieving false positive by a human-driven abstract inspection;
Quality Assessment aiming at validating the fitness of the articles against theaims of the SMS;
Data Extraction and Synthesis which aims at answering each research ques-tion for all selected articles.

14 C. Grelck et al.
Specifically, the SMS focused on domain-specific languages and explicitlyexcluded general-purpose languages, such as C, C++, OpenMP, Fortan, Java,Python, Scala, etc., combined with parallel exploitation libraries, such as MPI.
Quantitatively, in the SMS, the initial literature search resulted in 420 arti-cles; 152 articles were retained for final review after the evaluation of initialsearch results by domain experts. Results of our mapping study indicate, forinstance, that the majority of the used HPC languages in the context of bigdata are text-based general-purpose programming languages and target the end-user community. To evaluate the outcome of the mapping study, we developeda questionnaire and collected the opinions of domain experts. A comparison ofmapping study outcome with opinions of domain experts reveals that the key fea-tures of HPC programming languages for big data are portability, performanceand usability. We identified the language learning curve and interoperability asthe key issues that need more attention in future research.
5 HPC-Enabled Modelling and Simulation for LifeSciences
Life Sciences typically deal with and generate large amounts of data, e.g., theflux of terabytes about genes and their expression produced by state of the artsequencing and microarray equipment, or data relating to the dynamics of cellbiochemistry or organ functionality. Some modelling and simulation techniquesrequire the investigation of large numbers of different (virtual) experiments, e.g.,those addressing probabilistic, noise and robustness aspects [80–84], or basedon statistical approaches. Curation and mining of large, typically multimedia,medical datasets for therapeutic and analytics purposes, are computationallyexpensive. Recent and future developments, such as personalised medicine needto integrate a mix of genomics, Systems and Synthetic Biology and medicalinformation in a systemic description of a single individual. A surge of large-scale computational needs in these areas spans from the BBMRI (Biobanking andBiomolecular Resources Research Infrastructure) and the flagship effort HumanBrain Project, which targets simulating the behaviour of a human brain, toFP7 projects like PD-HUMMODEL and TRANSFORM. In fact, this COSTAction integrates well with the goals of the ESFRI Roadmap, promoted bythe EC. Requirements go from pure computational efficiency, to large data filemanagement and storage capabilities and vast memory-bound computationalpower.
This section focuses on the much-needed integration of HPC architects andLife Sciences modellers, with the goal of letting them develop and diffuse acoordinated, mature and productive use of HPC facilities. In order to bridgethese two communities, some big data problems, applications and modellingtechniques in the broad context of live sciences are discussed. We will considerapproaches for modelling healthcare and diseases as well as problems in systemsand synthetic biology. We will survey some themes on genomics and metabolicnetworks, then discuss efficient modelling and learning techniques, and finallyconsider also the modelling of the management of healthcare.

Why HPC Modelling and Simulation for Big Data Applications Matters 15
Healthcare and Disease Modelling. Understanding disease complexity is the def-inite scientific challenge of the 21st century medicine [85,86]. Using computa-tional models is the path to a technological medical revolution, where modellingwill have a truly catalytic effect in biomedical big data by bridging the largebody of knowledge produced by next generation genomic data with the clinicalquantities and the functional observable (for instance through self monitor andimplantable sensor devices). Biomedicine is essentially a big data field, and mod-elling is superior to the data-mining correlative approach in transforming datainto knowledge.
Taking into account only the DNA sequencing data, its rate of accumula-tion is much larger than other major generators of big data, such as astronomy,YouTube and Twitter. Recent estimates show that the total amount of sequenc-ing data produced is doubling approximately every seven months. The growthis driven by three main factors:
1. Biomedicine is heavily interdisciplinary and e-Healthcare requires physicians,bioinformaticians, computer scientists and engineers to team up. Althoughthey continuously produce results that are underutilised in medical prac-tice, such interdisciplinarity generates the need for large-scale data integra-tion. Areas such as systems medicine, clinical informatics, systems biologyand bioinformatics have large overlaps with classical fields of medicine, andextensively use biological information and computational methods to infernew knowledge towards understanding disease mechanism and diagnosis.
2. Many acute and chronic diseases originate as network diseases. A patient’scondition is characterised by multiple, complex and interrelated conditions,disorders or diseases [87,88]. A state of health can be defined as the capac-ity of absorbing accidents and showing metabolic flexibility, and is alteredby infections and ageing, that cause comorbidities to emerge. Therefore, agood-quality stratification of a patient requires lots of information. The bridgebetween the characterisation of a disease mechanism and the stratification of apatient would require a data-driven computational model. Current successfulapproaches focus on resource-intensive hybrid modelling approaches includingcellular automata, (stochastic) differential equations and agent-based mod-els. The more effective the diagnostic and prognostic markers are, the lessinformation will be needed to correctly stratify a patient. This aspect makesprecision medicine highly computation-resource intensive. In particular, com-plex disease management is mostly based on electronic health records col-lection and analysis, which are expensive processes. Analyses are presentedin a rather empirical and sometimes simplistic way, completely missing theopportunity of uncovering patterns of predictive relationships and meaningfulprofiles. Our chances to make the data the drivers of paths to cures for manycomplex diseases depends in a good percentage on extracting evidences fromlarge-scale electronic records comparison and on models of disease trajecto-ries. The medical approach to comorbidities represents an impressive compu-tational challenge, mainly because of data synergies leading to the integrationof heterogeneous sources of information, the definition of deep phenotyping

16 C. Grelck et al.
and markers re-modulation; the establishment of clinical decision support sys-tems. Computational model development is further complicated by aspects ofgeo-differentiation and ethnic balance, protocols for sharing of digital infor-mation, interoperability between different record types (structured and non-structured) to optimize the process of decision making in an actionable way.
3. A third important factor is the multi-scale nature of the biomedical infor-mation. The genome sequence is only the first level of understanding of thehuman biology. Bioinformatics data resources should be much more populatedwith longitudinal information gathered at intracellular, cell, intercellular andtissue levels. The longitudinal sampling could happen for important clinicalevents, such as hospitalisation or routinely perhaps a few times from uterineto elderly age. At the bioinformatics level, genome wide information of allthe different levels of biological information will be integrated and this mayinclude: Genomic sequence variations (haplotypes), levels of gene functioningfor different tissues and conditions (circadian and longitudinal data) (geneexpression), Epigenetic changes for different tissues (methylations and his-tonic modifications), information on chromatin conformation for different celltypes and conditions (FISH, HI-C, 5C, microscopy), protein and metabolitesabundances for different cell types and conditions, protein-protein interactionvariations (longitudinal data).
For instance by using the Next Generation Sequencing technology approachescancer clones, subtypes and metastasis could be appropriately traced. Micro-biome data (number, type and multi Omics) for different part of the body anddifferent conditions. Furthermore, gut microbiome could be regularly sampled,monitoring the diets and nutritional shifts. This could be of great importance forepigenetic data, which shows alteration with ageing, inflammatory diseases, obe-sity, cardiovascular and neurodegenerative diseases. Gene expression may varyin relation to the circadian cycle or ageing. Sampling may focus on determiningthe actual level of inflammation that is related to ageing rate (inflammaging).Large number of high-resolution images of the different parts of the patient’sbody such as MRI, PET, CT scan, including intravital microscopy techniques,can be used. The images will tend to be progressively enriched with genomicsand proteomics data information. A disease first emerges as a dysfunction at thenucleus level, then metabolic and signalling, cell level and is then translated atthe tissue level due to a change in the cell response. The tissue level is central tostem cells organisation in maintaining the mechanical properties of the tissue:the current thinking is that the dominant effect of reduced stem cell activity andfailing tissue maintenance is due to changes in the niches that support and con-trol stem cell activity. Therefore, tissue modelling can be thought as the missinglink between basic research and clinical practice and will require a conceptualframework for an efficient multi-scale analysis between the cell and tissue levels.The cell level will be represented with agent-based or ODE models that willbe specifically developed to handle millions of single cells. The tissue level willbe represented using image-based finite element modelling (partial differentialequation, PDE).

Why HPC Modelling and Simulation for Big Data Applications Matters 17
An important example is the bone system which is also related to the immuneand endocrine systems. The osteocytes in the bone act as sensitive mechanosen-sors so they react to microdamages that alter the tension; with their flattenedmorphology and long processes, they form a sensory network which allows thedetection of abnormal strain situations such as generated by microcracks. Nor-mal locomotion is thought to cause microdamage to bone material and, thus,stimulate osteoclasts and osteoblasts to remove and then replace damaged tissue.They can be modelled as agents driven by signals and could reflect concentra-tions and velocities. Osteocytes are connected to one another and to surfaceosteoblasts via gap junctions. In general, mechanical forces are experienced bymany osteoprogenitor cells which are present in the bone marrow and in the softmesenchymal tissues subjected to mechanical strain. Dependant on the mag-nitude of mechanical stress osteoprogenitors differentiate or transdifferentiateinto osteoblastlike cells that express characteristic proteins and can form bonematrix. Under physiological mechanical stimuli osteocytes prevent bone resorp-tion by changing the RANKL/osteoprotegerin (OPG) ratio. By communicatingthese signals to bone lining cells (the second terminally differentiated osteoblastcell type) or secrete factors that recruit osteoclasts, osteocytes initiate the repairof damaged bone. The functional behaviour of bone tissues is primarily describedin term of physical quantities such as pressures and forces to reflect deforma-tion, loading, stress, strain, etc. Such quantities, are usually considered to varyacross space and time, in a continuous fashion, and can be thus representedusing fields, and systems of partial differential equations (PDE). The transitionbetween a continuous representation and a discrete representation makes thecoupling of the models across the cell-tissue scale particularly difficult. Conven-tional homogenisation approaches, frequently used as relation models to linkto component models defined at different scales, are computationally resourcedemanding [89–92].
Modelling Problems in System and Synthetic Biology. Systems Biologyapproaches and methodologies are also very interesting in Synthetic Biologypipelines: in semi-synthetic minimal cells, for instance, liposomes are synthe-sized with some metabolic networks entrapped inside [93]. These devices, calledprotocells, share some properties in common with real biological cells, and canperform some biological action [94]. In wet-lab the problem is which metaboliccomponent to choose, among the several different ones that can perform the samebiological action. A combinatorial experimental approach is not affordable, sinceit requires a lot of time, budget and lab resources. A computational approach,instead, is very useful, as it can score the different hypotheses about the pro-tocell to synthesize, sorting out the best theoretically performing. Along thisresearch line, several papers have been published, based on computer simulationof the metabolic networks entrapped in the protocells [95], to understand thesolute distribution and enrichments processes [96,97] and the energetic balanceof complex biological processes like DNA transcription and RNA translation [98].

18 C. Grelck et al.
Genomics. In recent years, thanks to faster and cheaper sequencing machines,a huge amount of whole genomic sequences within the same population hasbecome available (e.g. [99]). Modern genomes analyses workflows have thus toface new challenges to perform functional annotations and comparative analy-sis, as there is no longer just a reference genome, but rather many of them thatcan have to be used all together as a control sequence. A collection of genomicsequences to be analysed jointly, or to be jointly used as a reference, is calledpangenome [100]. The reference genome is a representative example of the wholegenomic sequence of a species, acting as a control sequence against which frag-ments of a newly sequenced individual are mapped to be located, or againstwhich another whole genome is compared. A single well annotated referencegenome was - and mostly still is - traditionally used as a control sequence, asit could provide a good approximation of any individual genome. However, inloci where polymorphic variations occur (a polymorphism is a genetic variationof an individual or a population), such mappings and comparisons are likely tofail: this is where a multiple reference genome—a reference pan-genome—wouldbe a better control [101].
In the data structure literature, several different compressed representationshave been considered for sets of similar texts [102,103], as well as algorithmicmethods for their investigation [104]. We present here a natural representationof pan-genomes (whole genomes or their fragments): elastic-degenerate texts. Anelastic-degenerate text (ED-text) is a sequence compactly representing a multi-ple alignment of several closely-related sequences: substrings that match exactlyare collapsed, while those in positions where the sequences differ (by means ofsubstitutions, insertions, and deletions of substrings) are called degenerate, andtherein all possible variants observed at that location are listed [105]. Actually,ED-texts correspond exactly to the Variant Call Format (.vcf), the standardfor files storing genomic variations [106]. As an example, consider the follow-ing three closely-related sequences, where their similarity is highlighted by theiralignment, and where the symbol ‘−’ represents a deletion:
CAATGTGTGACCAGTCAAT-ACC--T-ACTGAC
These sequences can be compacted into the single ED-text:
T = C ·⎧⎨
⎩
AAAGε
⎫⎬
⎭· T ·
⎧⎨
⎩
GTGCAAAC
⎫⎬
⎭· T ·
{Gε
}
· AC (1)
where ε is the empty string. The length n of T is the total number of segments,and its size N is the total number of letters, that all belong to an alphabet Σ.Due to biotechnologies limitations, sequencing (that is, giving as input the invitro DNA and getting out an in silico text file) can only be done on a genomefragment of limited size. For this reason, before the sequencing process, a genomeis actually broken into many fragments of such limited size and then, whenever a

Why HPC Modelling and Simulation for Big Data Applications Matters 19
reference is available, the resulting in silico fragments (named reads) are mappedonto it. This mapping is a critical step and there is an ample literature aimingat making as efficient as possible. When the reference is an ED-text, the readsmapping problem translates into the problem of finding all matches of a deter-ministic pattern P (that is, P ∈ Σ∗) in text T . We call this the EDSM problem.
In [107] the problem has been solved for the simplest case of ED-text, inwhich a degenerate segment can only contain single letters. In [108] the problemhas been efficiently solved for the more general case of ED-texts introducing (i)an algorithmic framework that has been conserved also by more recent papers,and (ii) adding a very fast bit-vector based version of the same algorithm thatrequires the pattern to have size no longer than the machine word. In [109]the algorithmic framework has been extended to find approximate occurrencesof P , under both the Hamming and the edit distance model. In other words,occurrences of P are detected allowing up to a given amount of mismatches(Hamming distance model), or even insertions or deletions (edit distance model).In [110] the bit-vector algorithm of [108] has been extended to work with acollection of patterns P1, P2, . . . , Ph rather than a single string P , and in [111]a step of the algorithm presented in [108] has been improved by a factor
√|P |.Another natural problem that arises is the comparison of two ED-texts and, inparticular, whether the sets of strings the actually represent has a non emptyintersection. This problem has been efficiently solved in [112] with a linear timealgorithm for the case of non-elastic D-texts (a degenerate segment can onlycontain strings of the same size).
Once that a set of DNA fragments of an individual have been aligned, hap-lotype phasing is an important problem in the analysis of genomics informa-tion. It consists of determining which one of the possible alleles (alternativeforms of a gene) each fragment comes from. Haplotype information is relevantto gene regulation, epigenetics, genome-wide association studies, evolutionaryand population studies, and the study of mutations. Haplotyping is currentlyaddressed as an optimisation problem aiming at solutions that minimise, forinstance, error correction costs, where costs are a measure of the confidencein the accuracy of the information acquired from DNA sequencing. Solutionshave typically an exponential computational complexity. WHATSHAP [113] is aframework returning exact solutions to the problem of haplotyping which movescomputational complexity from DNA fragment length to fragment overlap, i.e.,coverage, and is hence of particular interest when considering sequencing tech-nology’s current trends that are producing longer fragments. Nonetheless, thecombinatorial nature of the problem makes larger coverages quickly intractable.An interesting experiment, paradigmatic of a HPC-supported modelling solu-tion, is pWHATSHAP [1,114], i.e. a freely-available, multicore parallelisationof WHATSHAP, based on the FastFlow parallel programming framework [65].This parallel implementation on multi-core architectures allows for a relevantreduction of the execution time for haplotyping, while the provided results enjoythe same high accuracy as that provided by WHATSHAP, which increases withcoverage.

20 C. Grelck et al.
Metabolic Network Robustness Analysis. Many functional modules are linkedtogether in a Metabolic Network for reproducing metabolic pathways anddescribing the entire cellular metabolism of an organism. An enormous interdis-ciplinary interest has grown for metabolic networks robustness studies in termsof errors and attacks tolerance. Scale-free networks based approaches suggestthat metabolic networks are tolerant to errors, but very vulnerable to targetedattacks against highly connected nodes. An integrated approach based on sta-tistical, topological, and functional analysis allows for obtaining a deep knowl-edge on overall metabolic network robustness. With more details, several soft-ware frameworks were developed to model a metabolic network and performthe Topological Analysis, the Flux Balance Analysis, and the Extreme Path-ways Analysis over it [115,116]. The simulation trials have demonstrated thatmetabolic network robustness is not simply associated to the network local prop-erties (low-connectivity-degree node or high-connectivity-degree node) but alsoto functional network properties. So, ultra-peripheral non-hub nodes can assumea fundamental role for network survival if they belong to network extreme path-ways, while hub nodes can have a limited impact on networks if they can bereplaced by alternative nodes and paths [115,116].
The same approach have been applied as a bio-inspired optimisation methodto different application domains. In [117] the use of the previous bio-inspired tech-niques allows for analysing the structural aspects of a road network, finding itsextreme pathways, and outlining the balanced flow combinations. The approachoptimises traffic flows over a road network, minimises road congestion and max-imises the number of vehicles reaching their destination target. In [118], the bio-inspired methodology has been applied to a class of digital ecosystems based ona scale-free architecture for both maximum information flow and fault/error tol-erance detection. Highly connected nodes, inter-module connectors and ultra-peripheral nodes can be identified by evaluating their impact on digital ecosystemsbehavior and addressing their strengthen, fault tolerance and protection counter-measures.
Modelling Methodologies. The computational analysis of complex biological sys-tems can be hindered by three main factors:
1. modelling the system so that it can be easily understood and analysed bynon-expert users is not always possible;
2. When the system is composed of hundreds or thousands of reactions andchemical species, the classic CPU-based simulators could not be appropriateto efficiently derive the behaviour of the system. To overcome these first twolimitations, [119] proposes a novel approach that combines the descriptivepower of Stochastic Symmetric Nets, a graphical mathematical formalism,with LASSIE, a GPU-powered deterministic simulator that offloads onto theGPU the calculations required to execute many simulations by following bothfine-grained and coarse-grained parallelisation strategies. The effectivenessof this approach was showed on a case study aimed at understanding therole of possible malfunctions in the cross-balancing mechanisms that regulate

Why HPC Modelling and Simulation for Big Data Applications Matters 21
peripheral tolerance of self-reactive T lymphocytes in case of a relapsing-remitting multiple sclerosis. From our experiments, LASSIE achieves around97 speed-up with respect to the sequential execution of the same number ofsimulations;
3. The determination of model structure and model parameters is difficult. Dueto economical and technical reasons, only part of these details are well char-acterised while the rest remains unknown. To deal with this aspect, manyparameter estimation and reverse engineering methods were developed. How-ever, these methods often need an amount of experimental data that notalways is available.
An alternative approach to deal with situations in which insufficient exper-imental data hamper the application of PE and RE methods was proposed in[120]. To overcome the lack of information concerning undetermined reactions anempirical biological knowledge was exploited to overcome model indeterminationsolving an optimisation problem (OP) with an objective function that, similarlyto Flux Balance Analysis, is derived from empirical biological knowledge anddoes not require large amounts of data. The system behaviour is described indetail by a system of ordinary differential equations (ODE) while model indeter-mination is resolved selecting time-varying coefficients that maximize/minimizethe objective function at each ODE integration step. As discussed by the authors,in this context approximation techniques in which OP is not solved at everyintegration step and/or parallelisation strategies are mandatory to speed-up thesolution process.
Learning-Based Modelling Approaches. Some interesting applications in this con-text are based on the study of integrated biological data and how they areorganised in complex systems. In particular, these approaches focus on multi-omic spaces and multi-view analysis. They are very complex applications thatrequire high-throughput analysis based on advanced machine learning (ML) and,more recently, deep learning (DL). One of the several applications in this field isdescribed by Bardozzo et al. [121], where high throughput omic analysis (HTO)is adopted with the aim to the end of describing the antibiotics efficacy withrespect to the bacterial adaptive mechanisms. Moreover, a specific survey onHTO is introduced by Suravajhala et al. [122]. Nevertheless, a general surveyoriented to high throughput biomedical data analysis with ML and DL is widelydescribed in the work of Serra et al. [123].
Healthcare Management Modelling. Globally healthcare faces many challengesthat result in increasing healthcare costs [124] and poor outcomes [125] (morbid-ity or mortality) depending on the setting and demographic. These challengeshave been traced to weak health systems whose symptoms can manifest in: lowproductivity, poor financial management, inadequate information for decisionmaking, insufficient strategic management, issues with managed care and othersystems dynamics [126].
The persistent challenges in the healthcare sector call for urgent review ofstrategies. Several industry application of operations management have been

22 C. Grelck et al.
documented [127]. There has also been diverse application of operations man-agement techniques in several domains including the health sector. While thereis still room for health use-case modification, adoption of innovations used inother domains has been slow. A major classification identified resource and facil-ity management, demand forecasting, inventory and supply chain management,and cost measurement as application groupings to prioritise [126].
An area of increasing interest is human resource planning that capturesrecruitment, rostering, scheduling and management of clinical and non-clinicalstaff, their retention, training, payment and incentives as well as performanceappraisal. Challenges do also arise around patient workflow: admission, schedul-ing, and resource allocation. To model solutions to these process and workflowchallenges, simple statistics, stochastic [128], mathematical [129], artificial intel-ligence [130], lean [131], agile [132], six-sigma [131] and total quality management[133] based models have been variously proposed and used. Sometimes, inade-quate data may warrant simulation to fill in deterministic and non-deterministicdata gaps [134,135]. This obviously comes with the need for adequate computingand storage capabilities.
The optimum framework for modelling and simulating a particular use-casedepends on the availability, structure and size of data [126]. Other considerationswill be if the system should be automated or not, if they are sophisticated, deter-ministic or not. The choice of model and/or simulation technique can ultimatelybe influenced by available computing power and storage space. How user-friendlysuch a system is, will be a major consideration as well. Opportunities for appli-cation of one or more of these modelling, simulation and prediction techniquesto address some of the lingering healthcare challenges is huge.
6 HPC-Enabled Modelling and Simulationfor Socio-Economical and Physical Sciences
Many types of decisions in society are supported by modelling and simulation.Some examples are political decisions based on predictive simulations of futureclimate changes, evacuation planning based on faster-than-real-time simulationof tsunamis, and financial market decisions based on mathematical models emu-lating current market conditions. In all of these situations, large amounts of datasuch as global geographical information, measurements of the current physicalor financial state, and historical data are used both in the model building andmodel calibration processes.
We can roughly divide the applications within the large and diverse area, thatwe here call socio-economical and physical sciences, into two groups. ClassicalHPC applications, where we build a large-scale complex model and simulatethis in order to produce data as a basis for decisions, and Big data applications,where the starting point is a data set, that is processed and analyzed to learnthe behaviour of a system, to find relevant features, and to make predictions ordecisions.

Why HPC Modelling and Simulation for Big Data Applications Matters 23
In classical HPC applications, the need for HPC arises from the fact that wehave a large-scale model or a computationally heavy software implementation,that needs to make use of large-scale computational resources, and potentiallyalso large-scale storage resources in order to deliver timely results.
Some particularly challenging problem features are high-dimensionality (e.g.,in finance or quantum physics) where the computational costs grow exponentiallywith the dimension, multi-scale physics (e.g., in climate and tsunami simulations)where scales that differ in orders of magnitude need to be resolved to capturethe relevant physical processes, and computations under uncertainty, where theimpact of uncertain measurements, parameters and models is quantified throughmultiple evaluations or extended models leading to an increased computationalcost (e.g., in safety critical decision problems).
Highly advanced algorithms and implementations for many different appli-cation areas have been developed over decades. A huge challenge is that theselegacy codes are not optimized for modern computer architectures and cannotefficiently exploit massively parallel systems [136]. HPC knowledge and innova-tion is needed to merge the software and hardware state-of-the-art into highlyefficient application simulation tools. An opportunity that is brought by theincrease in available computer power is instead that the limits of what can besimulated are expanding outwards. The recent increase in research on uncertaintyquantification [137] is one example of how this has changed the computationalresearch landscape.
Big data processing as opposed to classical HPC simulation is a relativelyyoung field. The amount of data that is being harvested is following an exponen-tial trend, while hardware development, often in relation to cloud environments,and software development with a specific focus on machine learning and AI isstruggling to keep up. The opportunities for using data in new ways are endless,but as is suggested in [138], data and algorithms together can provide the whats,while the innovation and imagination of human interpreters is still needed toanswer the whys. Areas where we see a rapidly growing need for HPC solutionsis the internet of things [139], where the expected vast amounts of data providesnew challenges for the extraction of knowledge, as well as in the social mediacontext [140], where all kinds of real world events or personal preferences providefootprints that can be tracked and exploited.
In the following paragraphs of this section, we highlight some of the workand contributions of the participants in this Action within the diverse subfieldsin the wider physical and socio-economical application area. Some of the topicsare also represented as individual chapters later in this volume.
Classical HPC Applications. In this sub-field, the interplay of the algorithmswith the parallel implementation is crucial, and we provide two examples, bothwith industrial design applications.
Wing design is one of the essential procedures of aircraft manufactures andit is a compromise between many competing factors and constraints. Efficientnumerical optimization methods are important to speed-up the design proce-dure, especially for design parameters of O(10–100). In wing shape optimization,

24 C. Grelck et al.
necessary derivatives can easily be calculated by applying finite-difference meth-ods. However, finite difference methods are in general significantly more expen-sive, requiring at least one additional flow solution per parameter. By using themethod of modular analysis and unified derivatives (MAUD), we can unify allmethods for computing total derivatives using a single equation with associateddistributed-memory, sparse data-passing schemes. Moreover, the wing designrequires a set of benchmark cases for the shape optimization to find solutions ofmany candidate shapes by applying computational fluid dynamics (CFD) anal-ysis with turbulence models. High-fidelity CFD simulations must be carried outin parallel to reduce the total run-time using HPC resources [141].
An application problem that is also discussed later in an individual chapteris electromagnetic scattering, with applications to, e.g., aircraft antenna design.These problems have millions or billions of unknown variables, and the codeneeds to run on a cluster due to the memory requirements. However, few of theexisting (legacy) implementations are parallelised for multicore-based computa-tional nodes. We show results from a pilot implementation using a task-parallelprogramming model [142], and discuss how to develop this further into a com-plete distributed implementation.
HPC in Computational Intelligence. As a thriving application platform, HPCexcels in supporting execution and it’s speedup through parallellisation whenrunning Computational Intelligence (CI) algorithms. The likes of CI algorithmssupported by this action includes development of some of most efficient opti-mization algorithms for continuous optimization as defined with benchmarkfunctions competition framework from Congress on Evolutionary Computation(CEC) 2017 [143,144]. Specifically useful, in [144] a Differential Evolution (DE)algorithm is enhanced with a new mechanism, the distance based parameteradaptation in the context of Success-History based DE (SHADE), the winnerstrategy of several previous CEC competitions. An important contribution ofan expert system for underwater glider path planning using DE was publishedin [145], where the application of SHADE strategy enabled significant advancesin improved path planning over mesoscale ocean current structures. Another CItechnique in learning pipeline is Stability Selection (SS), yet another computa-tionally demanding technique like DE, and SS was improved through a discreteoptimization algorithm [146]. In [147], a recent whole pipeline survey overviewfor black-box discrete optimization benchmarking (BB-DOB) is provided, defin-ing taxonomy, evaluation, and ranking for BB-DOB algorithms. Also, in the caseof EU project RIVR (Upgrading National Research Structures in Slovenia) sup-ported by European Regional Development Fund (ERDF), an important side-effect of cHiPSet COST action was leveraging it’s experts’ inclusiveness to gaincapacity recognition at a national ministry for co-financing HPC equipment1.In the view of future possibilities for modelling and simulation in CI context,gain from HPC is clearly seen in improving upon techniques with DE like in
1 https://www.rtvslo.si/znanost-in-tehnologija/v-mariboru-vzpostavljajo-superracunalniski-center/475543.

Why HPC Modelling and Simulation for Big Data Applications Matters 25
energy applications [148], constrained trajectory planning [149], artificial life offull ecosystems [150] including HPC-enabled evolutionary computer vision in2D [151,152] and 3D [151], many other well recognized real-world optimizationchallenges [153], or even insight to deep inner dynamics of DE over full bench-marks, requiring large HPC capacities [154].
IoT, Smart Cities, and Big Data Applications. Monitoring the real-world envi-ronment is a big challenge given the number of variables that can be sensed nowa-days in IoT environments, as for example GPS-position, temperature, humidity,presence, people location, ultraviolet radiation, air quality, hazardous gases, pres-sure, proximity, acceleration. IoT assumes that multiple sensors can be used tomonitor the real-world and this information can be stored and processed, jointlywith information from soft-sensor (RSS, web, etc.) [155], to for example assistelderly people in the street [156], develop intelligent interfaces [157] or detectanomalies in industrial environments [158]. In any case, the developed globalsystem needs to fuse heterogeneous data for obtaining a complete view of actualsituation and inferring future dangerous situations. These two tasks need Cloudcapabilities and HPC.
One of the critical aspects of management within the “smart city” conceptis Intelligent Transport Systems, and in particular road traffic control. Off-linetraffic simulation is perfect for designing road systems and planning traffic lighttimings, but does not allow to tackle unexpected or rare situation in real time.Short-term traffic forecasting [159], especially using data-driven (i.e. learning)methods, provides a complementary approach. With the availability of smartsensing technologies, like automatic vehicle counting from standard surveillancecameras, it is possible to devise decentralised solutions that measure the cur-rent situation of traffic flow on each road, perform local communication betweennodes, and forecast the conditions for the immediate future using machine learn-ing algorithms [160]. These may be augmented with evaluations of unexpect-edness and per-node traffic jam prediction. Concentration of these data at adecision-making location may also allow travel time estimation, exploitation ofnetwork locality information, as well as comparison with the estimates providedby a traffic management system, which can be evaluated for effectiveness on themedium term and possibly tuned accordingly.
Further topics that are discussed in later chapters of this volume look at suchdiverse questions as how to use data from mobile cellular networks for applica-tions such as urban sensing and event detection, and how sentiment analysis canbe applied to forecast the value of cryptocurrencies.
Small Data Applications. The growing big data processing field is well known,but in parallel, there is also a growing interest in a specific type of small dataapplications. With the increasing instability of the financial and political sys-tems, and of the global climate, there is an increased occurrence of extremeevents. Within the big data sets, there are small data sets, that sample theextreme events. To understand their behaviour has applications, e.g., in financial

26 C. Grelck et al.
risk management, in insurance, and in prediction of catastrophic climate events.In a later chapter, methods for extreme value estimation are surveyed.
7 Summary and Conclusion
HPC and M&S form two previously largely disjoint and disconnected researchcommunities. The COST Action IC1406 High-Performance Modelling and Simu-lation for Big Data Applications brings these two communities together to tacklethe challenges of big data applications from diverse application domains. Expertsfrom both communities jointly study these applications and application scenar-ios and cooperatively develop solutions that benefit from the cross-pollinationof expertise. Different perspectives on the same topic lead to creative solutionsand ultimately to the common goal of HPC-enabled M&S.
The purpose of this paper is to set the scene for individual applications bring-ing together HPC and M&S. We have argued why high-performance modellingmatters for big data applications. Following this line of reasoning we looked atthe subject matter from the four angles of the four working groups into whichthe COST Action is organised. Throughout the previous two sections we havepresented a myriad of application opportunities and technological challenges forHPC-enabled modelling and simulation in life, socio-economical and physicalsciences. These are complemented by comprehensive surveys of the current stateof the art with respect to HPC technology and tools, both from the perspectiveof programming models as well as from middleware solutions.
Bringing together specialists from all these communities is the central contri-bution of the COST Action. Having set the scene in this paper, the other papersof this volume exemplify the achievements of the COST Action. Each addressesa specific application or application scenario from the life, socio-economical orphysical sciences and explores how the application of state-of-the-art HPC toolsand technologies may lead to superior solutions in the near future.
Acknowledgments. This work was supported by the ICT COST Action IC1406High-Performance Modelling and Simulation for Big Data Applications. We would liketo thank all members of the COST Action for their direct or indirect contributions tothis work and the success of the COST Action in general.
We particularly thank Christoph Kessler, Linkoping University, Sweden; Salva-tore Vitabile, University of Palermo, Italy; Marco Beccuti, University of Torino, Italy;Lalit Garg, University of Malta, Malta; Jing Gong, KTH Royal Institute of Technol-ogy, Stockholm, Sweden; Ales Zamuda, University of Maribor, Slovenia; Jose ManuelMolina Lopez, Universidad Carlos III de Madrid, Spain; Amr Abdullatif, Alberto Cabri,Francesco Masulli, and Stefano Rovetta, University of Genova and Vega ResearchLaboratories, Genova, Italy, for their contributions to this chapter.

Why HPC Modelling and Simulation for Big Data Applications Matters 27
References
1. Bracciali, A., et al.: PWHATSHAP: efficient haplotyping for future generationsequencing. BMC Bioinform. 17, 342 (2016)
2. Misale, C., Ferrero, G., Torquati, M., Aldinucci, M.: Sequence alignment tools:one parallel pattern to rule them all? BioMed. Res. Int. 2014, 12 p. (2014). ArticleID 539410. https://doi.org/10.1155/2014/539410
3. Aldinucci, M., Ruggieri, S., Torquati, M.: Porting decision tree algorithms to mul-ticore using FastFlow. In: Balcazar, J.L., Bonchi, F., Gionis, A., Sebag, M. (eds.)ECML PKDD 2010. LNCS (LNAI), vol. 6321, pp. 7–23. Springer, Heidelberg(2010). https://doi.org/10.1007/978-3-642-15880-3 7
4. Buono, D., Danelutto, M., Lametti, S., Torquati, M.: Parallel patterns for gen-eral purpose many-core. In: 21st Euromicro International Conference on Parallel,Distributed, and Network-Based Processing, pp. 131–139 (2013)
5. Aldinucci, M., et al.: Parallel stochastic systems biology in the cloud. Brief. Bioin-form. 15, 798–813 (2014)
6. Aldinucci, M., Drocco, M., Misale, C., Tremblay, G.: Languages for big data anal-ysis. In: Sakr, S., Zomaya, A. (eds.) Encyclopedia of Big Data Technologies, pp.1–12. Springer, Cham (2018). https://doi.org/10.1007/978-3-319-63962-8 142-1
7. Tordini, F., Aldinucci, M., Viviani, P., Merelli, I., Lio, P.: Scientific workflowson clouds with heterogeneous and preemptible instances. In: Proceedings of theInternational Conference on Parallel Computing, ParCo 2017, 12–15 September2017, Bologna, Italy. Advances in Parallel Computing. IOS Press (2018)
8. Akhter, N., Othman, M.: Energy aware resource allocation of cloud data center:review and open issues. Cluster Comput. 19, 1163–1182 (2016)
9. Mastelic, T., Oleksiak, A., Claussen, H., Brandic, I., Pierson, J.M., Vasilakos,A.V.: Cloud computing: survey on energy efficiency. ACM Comput. Surv. 47, 33(2015)
10. Niewiadomska-Szynkiewicz, E., Sikora, A., Arabas, P., Kamola, M., Mincer, M.,Ko�lodziej, J.: Dynamic power management in energy-aware computer networksand data intensive systems. Future Gener. Comput. Syst. 37, 284–296 (2014)
11. Antal, M., et al.: MoSiCS: modeling, simulation and optimization of complexsystems - a case study on energy efficient datacenters. Simul. Model. Pract. Theory(2018). https://doi.org/10.1016/j.simpat.2018.12.004
12. Karpowicz, M.: Energy-efficient CPU frequency control for the Linux system.Concurrency Comput.: Pract. Exp. 28, 420–437 (2016)
13. Karpowicz, M.P., Arabas, P., Niewiadomska-Szynkiewicz, E.: Energy-aware mul-tilevel control system for a network of Linux software routers: design and imple-mentation. IEEE Syst. J. 12, 571–582 (2018)
14. Cotes-Ruiz, I., Prado, R., Garcia-Galan, S.: Dynamic voltage frequency scalingsimulator for real workflows energy-aware management in green cloud computing.PLoS ONE 12, e0169803 (2017)
15. Healy, P.D., Lynn, T., Barrett, E., Morrison, J.P.: Single system image: a survey.J. Parallel Distrib. Comput. 90–91, 35–51 (2016)
16. Oussous, A., Benjelloun, F., Lahcen, A.A., Belfkih, S.: Big data technologies: asurvey. J. King Saud Univ. - Comput. Inf. Sci. 30, 431–448 (2018)
17. Berman, F., Fox, G., Hey, A.: Grid Computing: Making the Global Infrastructurea Reality. Wiley, Hoboken (2003)
18. Sehgal, N., Bhatt, P.C.P.: Cloud Computing. Concepts and Practices. Springer,Heidelberg (2018). https://doi.org/10.1007/978-3-319-77839-6

28 C. Grelck et al.
19. MOSIX. www.mosix.org20. OpenSSI. www.openssi.org/cgi-bin/view?page=openssi.html21. Kerrighed. www.kerrighed.org22. UNICORE. www.unicore.eu23. Globus Toolkit. toolkit.globus.org24. Cannataro, M.: Handbook of Research on Computational Grid Technologies for
Life Sciences, Biomedicine, and Healthcare. IGI Global, Hershey (2009)25. Walters, R.J., Crouch, S., Bennett, P.: Building computational grids using ubiq-
uitous web technologies. In: Camarinha-Matos, L.M., Xu, L., Afsarmanesh, H.(eds.) PRO-VE 2012. IAICT, vol. 380, pp. 254–261. Springer, Heidelberg (2012).https://doi.org/10.1007/978-3-642-32775-9 26
26. Hwu, W.H. (ed.): GPU Computing Gems, Emerald edn. Morgan Kaufman,Waltham (2011)
27. Singh, A., Bhat, J., Raju, R., D’Souza, R.: Survey on various load balancingtechniques in cloud computing. Adv. Comput. 7, 28–34 (2017)
28. Zhang, J., Yu, F.R., Wang, S., Huang, T., Liu, Z., Liu, Y.: Load balancing in datacenter networks: a survey. IEEE Commun. Surv. Tutor. 20, 2324–2352 (2018)
29. Staples, G.: Torque resource manager. In: Proceedings of the 2006 ACM/IEEEConference on Supercomputing. ACM, New York (2006)
30. Slurm Workload Manager. slurm.schedmd.com31. Mohamed, E., Hong, Z.: Hadoop-MapReduce job scheduling algorithms survey. In:
2016 7th International Conference on Cloud Computing and Big Data (CCBD),pp. 237–242 (2016)
32. White, T.: Hadoop: The Definitive Guide. O’Reilly Media, Newton (2015)33. Apache Spark. spark.apache.org34. Apache Storm. storm.apache.org35. Apache Flink. flink.apache.org36. RapidMiner Studio. rapidminer.com37. Orange. orange.biolab.si38. Frank, E., Hall, M.A., Witten, I.H.: Data Mining: Practical Machine Learning
Tools and Techniques. Morgan Kaufmann, Burlington (2016)39. Milne, I., et al.: Tablet-next generation sequence assembly visualization. Bioin-
formatics 26, 401–403 (2010)40. Carver, T., Bohme, U., Otto, T., Parkhill, J., Berriman, M.: BamView: viewing
mapped read alignment data in the context of the reference sequence. Bioinfor-matics 26, 676–677 (2010)
41. Rutherford, K., et al.: Artemis: sequence visualization and annotation. Bioinfor-matics 16, 944–949 (2000)
42. Desale, D.: Top tools for social network analysis and visualisation (2018). www.kdnuggets.com/2015/06/top-30-social-network-analysis-visualization-tools.html/3
43. Sikora, A., Niewiadomska-Szynkiewicz, E.: A federated approach to parallel anddistributed simulation of complex systems. Int. J. Appl. Math. Comput. Sci. 17,99–106 (2007)
44. Inostrosa-Psijas, A., Gil-Costa, V., Marin, M., Wainer, G.: Semi-asynchronousapproximate parallel DEVS simulation of web search engines. Concurrency andComputation: Pract. Exp. 30, e4149 (2018)
45. Miller, J., Cotterell, M., Buckley, S.: Supporting a modeling continuum in scala-tion: from predictive analytics to simulation modeling. In: Proceedings of WinterSimulation Conference: Simulation: Making Decisions in a Complex World, pp.1191–1202. IEEE Press (2013)

Why HPC Modelling and Simulation for Big Data Applications Matters 29
46. Niewiadomska-Szynkiewicz, E., Sikora, A.: A software tool for federated simula-tion of wireless sensor networks and mobile ad hoc networks. In: Jonasson, K.(ed.) PARA 2010. LNCS, vol. 7133, pp. 303–313. Springer, Heidelberg (2012).https://doi.org/10.1007/978-3-642-28151-8 30
47. Song, X., Wu, Y., Ma, Y., Ciu, Y., Gong, G.: Military simulation big data: back-ground, state of the art, and challenges. Math. Probl. Eng. 2015, 1–20 (2015).https://doi.org/10.1155/2015/298356
48. Fidjeland, A.K., Roesch, E.B., Shanahan, M.P., Luk, W.: NeMo: a platform forneural modelling of spiking neurons using GPUS. In: 2009 20th IEEE Interna-tional Conference on Application-specific Systems, Architectures and Processors,pp. 137–144 (2009)
49. Szynkiewicz, P.: A novel GPU-enabled simulator for large scale spiking neuralnetworks. J. Telecommun. Inf. Technol. 2, 34–42 (2016)
50. Martınez-del-Amor, M.A., Macıas-Ramos, L.F., Valencia-Cabrera, L., Riscos-Nunez, A., Perez-Jimenez, M.J.: Accelerated simulation of P systems on the GPU:a survey. In: Pan, L., Paun, G., Perez-Jimenez, M.J., Song, T. (eds.) BIC-TA2014. CCIS, vol. 472, pp. 308–312. Springer, Heidelberg (2014). https://doi.org/10.1007/978-3-662-45049-9 50
51. Beyer, J., Hadwiger, M., Pfister, H.: A survey of GPU-based large-scale volumevisualization. In: Proceedings of the Eurographics Conference on Visualization(Eurovis 2014), pp. 1–19 (2014)
52. Maeda, R., et al.: Jade: a heterogeneous multiprocessor system simulationplatform using recorded and statistical application models. In: Proceedings ofHiPEAC Workshop on Advanced Interconnect Solutions and Technologies forEmerging Computing Systems, pp. 1–6 (2016)
53. Casanova, H., Giersch, A., Legrand, A., Quinson, M., Suter, F.: Versatile, scalable,and accurate simulation of distributed applications and platforms. J. ParallelDistrib. Comput. 74, 2899–2917 (2014)
54. Calheiros, R., Ranjan, R., Beloglazov, A., Rose, C.D., Buyya, R.: CloudSim: atoolkit for modeling and simulation of cloud computing environments and evalu-ation of resource provisioning algorithms. Softw. Pract. Exp. 41, 23–50 (2011)
55. Multi2Sim Workload Manager. www.multi2sim.org56. Nasir, M.A.U., Morales, G.D.F., Garcıa-Soriano, D., Kourtellis, N., Serafini, M.:
The power of both choices: practical load balancing for distributed stream pro-cessing engines. CoRR abs/1504.00788 (2015)
57. Zaharia, M., Chowdhury, M., Franklin, M.J., Shenker, S., Stoica, I.: Spark: clustercomputing with working sets. In: Proceedings of the 2nd USENIX Conference onHot Topics in Cloud Computing, HotCloud 2010, p. 10. USENIX Association,Berkeley (2010)
58. Dean, J., Ghemawat, S.: MapReduce: simplified data processing on large clusters.CACM 51, 107–113 (2008)
59. Apache Software Foundation: Hadoop. http://hadoop.apache.org/. Accessed 201860. Intel Corp.: Threading Building Blocks. Accessed 201861. Park, I., Voss, M.J., Kim, S.W., Eigenmann, R.: Parallel programming environ-
ment for OpenMP. Sci. Program. 9, 143–161 (2001)62. Pacheco, P.S.: Parallel Programming with MPI. Morgan Kaufmann Publishers
Inc., San Francisco (1996)63. Khronos Compute Working Group: OpenACC Directives for Accelerators. http://
www.openacc-standard.org. Accessed 2018

30 C. Grelck et al.
64. Aldinucci, M., Danelutto, M., Meneghin, M., Torquati, M., Kilpatrick, P.: Efficientstreaming applications on multi-core with FastFlow: the biosequence alignmenttest-bed. In: Advances in Parallel Computing, vol. 19. Elsevier, Amsterdam (2010)
65. Aldinucci, M., Danelutto, M., Kilpatrick, P., Torquati, M.: FastFlow: high-leveland efficient streaming on multi-core. In: Pllana, S., Xhafa, F. (eds.) Program-ming Multi-core and Many-core Computing Systems. Parallel and DistributedComputing. Wiley, New York (2017)
66. Enmyren, J., Kessler, C.W.: SkePU: a multi-backend skeleton programminglibrary for multi-GPU systems. In: Proceedings of the Fourth International Work-shop on High-level Parallel Programming and Applications, HLPP 2010, pp. 5–14.ACM, New York (2010)
67. Grelck, C., Scholz, S.: SAC: a functional array language for efficient multithreadedexecution. Int. J. Parallel Program. 34, 383–427 (2006)
68. Grelck, C., Scholz, S., Shafarenko, A.: Asynchronous stream processing with S-net. Int. J. Parallel Program. 38, 38–67 (2010)
69. Lee, E.A., Parks, T.M.: Dataflow process networks. Proc. IEEE 83, 773–801(1995)
70. Misale, C., Drocco, M., Aldinucci, M., Tremblay, G.: A comparison of big dataframeworks on a layered dataflow model. Parallel Process. Lett. 27, 1740003(2017)
71. Aldinucci, M., Danelutto, M., Anardu, L., Torquati, M., Kilpatrick, P.: Paral-lel patterns + macro data flow for multi-core programming. In: Proceedings ofInternational Euromicro PDP 2012: Parallel Distributed and Network-Based Pro-cessing, pp. 27–36. IEEE, Garching (2012)
72. Dean, J., Ghemawat, S.: MapReduce: simplified data processing on large clusters.In: Proceedings of 6th USENIX Symposium on Operating Systems Design &Implementation, pp. 137–150 (2004)
73. Cole, M.: Algorithmic Skeletons: Structured Management of Parallel Computa-tions. Research Monographs in Parallel and Distributed Computing. Pitman, Lon-don (1989)
74. Chu, C.T., et al.: Map-reduce for machine learning on multicore. In: Proceedingsof the 19th International Conference on Neural Information Processing Systems,pp. 281–288 (2006)
75. Zaharia, M., et al.: Resilient distributed datasets: a fault-tolerant abstraction forin-memory cluster computing. In: Proceedings of the 9th USENIX Conference onNetworked Systems Design and Implementation (2012)
76. Carbone, P., Fora, G., Ewen, S., Haridi, S., Tzoumas, K.: Lightweight asyn-chronous snapshots for distributed dataflows. CoRR abs/1506.08603 (2015)
77. Toshniwal, A., et al.: Storm@twitter. In: Proceedings of the ACM SIGMOD Inter-national Conference on Management of Data, pp. 147–156 (2014)
78. Akidau, T., et al.: The dataflow model: a practical approach to balancing correct-ness, latency, and cost in massive-scale, unbounded, out-of-order data processing.Proc. VLDB Endowment 8, 1792–1803 (2015)
79. Kitchenham, B., Brereton, O.P., Budgen, D., Turner, M., Bailey, J., Linkman,S.: Systematic literature reviews in software engineering - a systematic literaturereview. Inf. Softw. Technol. 51, 7–15 (2009)
80. Calzone, L., Fages, F., Soliman, S.: BIOCHAM: an environment for modelingbiological systems and formalizing experimental knowledge. Bioinformatics 22,1805–1807 (2006)
81. Zechner, C., Seelig, G., Rullan, M., Khammash, M.: Molecular circuits fordynamic noise filtering. Proc. Natl. Acad. Sci. 113, 4729–4734 (2016)

Why HPC Modelling and Simulation for Big Data Applications Matters 31
82. Fages, F., Soliman, S.: On robustness computation and optimization inBIOCHAM-4. In: Proceedings of Computational Methods in Systems Biology -16th International Conference, CMSB 2018, Brno, Czech Republic, 12–14 Septem-ber 2018, pp. 292–299 (2018)
83. Nasti, L., Gori, R., Milazzo, P.: Formalizing a notion of concentration robustnessfor biochemical networks. In: Mazzara, M., Ober, I., Salaun, G. (eds.) STAF 2018:Software Technologies: Applications and Foundations. LNCS, vol. 11176, pp. 81–97. Springer, Cham (2018). https://doi.org/10.1007/978-3-030-04771-9 8
84. Proceedings of the 12th International Joint Conference on Biomedical EngineeringSystems and Technologies. In: BIOINFORMATICS 2019 (2019, in Press)
85. Sansom, C., Castiglione, F., Lio, P.: Metabolic disorders: how can systems mod-elling help? Lancet Diabetes Endocrinol. 4, 306 (2016)
86. Bartocci, E., Lio, P.: Computational modeling, formal analysis, and tools forsystems biology. PLOS Comput. Biol. 12, 1–22 (2016)
87. Capobianco, E., Lio, P.: Comorbidity networks: beyond disease correlations. J.Complex Netw. 3, 319–332 (2015)
88. Capobianco, E., Lio, P.: Comorbidity: a multidimensional approach. Trends Mol.Med. 19, 515–521 (2013)
89. Bartocci, E., Lio, P., Merelli, E., Paoletti, N.: Multiple verification in complexbiological systems: the bone remodelling case study. In: Priami, C., Petre, I., deVink, E. (eds.) Transactions on Computational Systems Biology XIV. LNCS, vol.7625, pp. 53–76. Springer, Heidelberg (2012). https://doi.org/10.1007/978-3-642-35524-0 3
90. Lio, P., Paoletti, N., Moni, M., Atwell, K., Merelli, E., Viceconti, M.: Modellingosteomyelitis. BMC Bioinform. 13(Suppl. 14), S12 (2012)
91. Paoletti, N., Lio, P., Merelli, E., Viceconti, M.: Multilevel computational modelingand quantitative analysis of bone remodeling. IEEE/ACM Trans. Comput. Biol.Bioinform. 9, 1366–78 (2012)
92. Lio, P., Merelli, E., Paoletti, N., Viceconti, M.: A combined process algebraic andstochastic approach to bone remodeling. Electron. Notes Theor. Comput. Sci.277, 41–52 (2011). The Second International Workshop on Interactions BetweenComputer Science and Biology
93. Luisi, P.L., Ferri, F., Stano, P.: Approaches to semi-synthetic minimal cells: areview. Naturwissenschaften 93, 1–13 (2006)
94. Kuruma, Y., Stano, P., Ueda, T., Luisi, P.L.: A synthetic biology approach to theconstruction of membrane proteins in semi-synthetic minimal cells. Biochimica etBiophysica Acta (BBA)-Biomembranes 1788, 567–574 (2009)
95. Lorenzo, C., Ospri, L.L., Marangoni, R.: On fine stochastic simulations ofliposome-encapsulated pure systems. Commun. Comput. Inf. Sci. 587, 146–158(2016)
96. Lazzerini-Ospri, L., Stano, P., Luisi, P., Marangoni, R.: Characterization of theemergent properties of a synthetic quasi-cellular system. BMC Bioinform. 13, S9(2012)
97. Fanti, A., Gammuto, L., Mavelli, F., Stano, P., Marangoni, R.: Do protocells pref-erentially retain macromolecular solutes upon division/fragmentation? A studybased on the extrusion of POPC giant vesicles. Integr. Biol. 10, 6–17 (2017)
98. Calviello, L., Stano, P., Mavelli, F., Luisi, P.L., Marangoni, R.: Quasi-cellularsystems: stochastic simulation analysis at nanoscale range. BMC Bioinform. 14,S7 (2013)
99. The 1000 Genomes Project Consortium: A global reference for human geneticvariation. Nature 526, 68–74 (2015)

32 C. Grelck et al.
100. The Computational Pan-Genomics Consortium: Computational pan-genomics:status, promises and challenges. Brief. Bioinform. 19, 118–135 (2018)
101. Huang, L., Popic, V., Batzoglou, S.: Short read alignment with populations ofgenomes. Bioinformatics 29, 361–370 (2013)
102. Bille, P., Landau, G.M., Raman, R., Sadakane, K., Satti, S.R., Weimann, O.:Random access to grammar-compressed strings. In: 22nd Annual ACM-SIAMSymposium on Discrete Algorithms (SODA), pp. 373–389 (2011)
103. Navarro, G.: Indexing highly repetitive collections. In: 23rd International Work-shop on Combinatorial Algorithms (IWOCA), pp. 274–279 (2012)
104. Gagie, T., Gawrychowski, P., Puglisi, S.J.: Faster approximate pattern matchingin compressed repetitive texts. In: 22nd International Symposium on Algorithmsand Computation (ISAAC), pp. 653–662 (2011)
105. Iliopoulos, C.S., Kundu, R., Pissis, S.P.: Efficient pattern matching in elastic-degenerate texts. In: Drewes, F., Martın-Vide, C., Truthe, B. (eds.) LATA 2017.LNCS, vol. 10168, pp. 131–142. Springer, Cham (2017). https://doi.org/10.1007/978-3-319-53733-7 9
106. Danecek, P., et al.: The variant call format and VCFtools. Bioinformatics 27,2156–2158 (2011)
107. Holub, J., Smyth, W.F., Wang, S.: Fast pattern-matching on indeterminatestrings. J. Discret. Algorithms 6, 37–50 (2008)
108. Grossi, R., et al.: On-line pattern matching on a set of similar texts. In: CPM.LIPIcs (2017)
109. Bernardini, G., Pisanti, N., Pissis, S.P., Rosone, G.: Pattern matching on elastic-degenerate text with errors. In: Fici, G., Sciortino, M., Venturini, R. (eds.) SPIRE2017. LNCS, vol. 10508, pp. 74–90. Springer, Cham (2017). https://doi.org/10.1007/978-3-319-67428-5 7
110. Pissis, S.P., Retha, A.: Dictionary matching in elastic-degenerate texts with appli-cations in searching VCF files on-line. In: 17th International Symposium onExperimental Algorithms (SEA), pp. 16:1–16:14 (2018)
111. Aoyama, K., Nakashima, Y., Inenaga, S., Bannai, H., Takeda, M.: Faster onlineelastic degenerate string matching. In: 29th Annual Symposium on CombinatorialPattern Matching, (CPM). LIPIcs, pp. 9:1–9:10 (2018)
112. Alzamel, M., et al.: Degenerate string comparison and applications. In: 18th Inter-national Workshop on Algorithms in Bioinformatics (WABI). LIPIcs, pp. 21:1–21:14 (2018)
113. Patterson, M., et al.: WhatsHap: weighted haplotype assembly for future-generation sequencing reads. J. Comput. Biol. 22, 498–509 (2015). PMID:25658651
114. Aldinucci, M., Bracciali, A., Marschall, T., Patterson, M., Pisanti, N., Torquati,M.: High-performance haplotype assembly. In: di Serio, C., Lio, P., Nonis, A.,Tagliaferri, R. (eds.) CIBB 2014. LNCS, vol. 8623, pp. 245–258. Springer, Cham(2015). https://doi.org/10.1007/978-3-319-24462-4 21
115. Vitabile, S., Conti, V., Lanza, B., Cusumano, D., Sorbello, F.: Metabolic networksrobustness: theory, simulations and results. J. Interconnection Netw. 12, 221–240(2012)
116. Vitabile, S., Conti, V., Lanza, B., Cusumano, D., Sorbello, F.: Topological infor-mation, flux balance analysis, and extreme pathways extraction for metabolicnetworks behaviour investigation. IOSPress, no. 234, pp. 66–73 (2011)
117. Vitello, G., Alongi, A., Conti, V., Vitabile, S.: A bio-inspired cognitive agent forautonomous urban vehicles routing optimization. IEEE Trans. Cogn. Dev. Syst.9, 5–15 (2017)

Why HPC Modelling and Simulation for Big Data Applications Matters 33
118. Conti, V., Ruffo, S., Vitabile, S., Barolli, L.: BIAM: a new bio-inspired analy-sis methodology for digital ecosystems based on a scale-free architecture. SoftComput. 23(4), 1133–1150 (2019)
119. Beccuti, M., et al.: GPU accelerated analysis of treg-teff cross regulation inrelapsing-remitting multiple sclerosis. In: Mencagli, G., et al. (eds.) Euro-Par2018. LNCS, vol. 11339, pp. 626–637. Springer, Cham (2019). https://doi.org/10.1007/978-3-030-10549-5 49
120. Totis, N., et al.: Overcoming the lack of kinetic information in biochemical reac-tions networks. ACM SIGMETRICS Perform. Eval. Rev. 44, 91–102 (2017)
121. Bardozzo, F., Lio, P., Tagliaferri, R.: A study on multi-omic oscillations inEscherichia coli metabolic networks. BMC Bioinform. 19, 194 (2018)
122. Suravajhala, P., Kogelman, L.J.A., Kadarmideen, H.N.: Multi-omic data integra-tion and analysis using systems genomics approaches: methods and applicationsin animal production, health and welfare. Genet. Sel. Evol. 48, 38 (2016)
123. Serra, A., Galdi, P., Tagliaferri, R.: Machine learning for bioinformatics and neu-roimaging. Wiley Interdisc. Rev. Data Min. Knowl. Discov. 8, e1248 (2018)
124. McClean, S., Gillespie, J., Garg, L., Barton, M., Scotney, B., Kullerton, K.: Usingphase-type models to cost stroke patient care across health, social and communityservices. Eur. J. Oper. Res. 236, 190–199 (2014)
125. WHO: World Health Statistics 2018: Monitoring the SDGs. Technical report(2018)
126. Garg, L., McClean, S., Barton, M.: Can management science methods do moreto improve healthcare? (2014)
127. Jahangirian, M., et al.: A rapid review method for extremely large corpora ofliterature: applications to the domains of modelling, simulation, and management.Int. J. Inf. Manag. 31, 234–243 (2011)
128. Garg, L., Barton, M., Meenan, B.J., Fullerton, K.: Intelligent patient managementand resource planning for complex, heterogeneous, and stochastic healthcare sys-tems. IEEE Trans. Syst. Man Cybern. - Part A Syst. Hum. 42, 1332–1345 (2012)
129. Garnett, G., Cousens, S., Hallett, T., Steketee, R., Walker, N.: Mathematicalmodels in the evaluation of health programmes. Lancet 378, 515–525 (2011)
130. Shanmugam, S., Garg, L.: Model employee appraisal system with artificial intel-ligence capabilities. J. Cases Inf. Technol. 17, 30–40 (2015)
131. Aleem, S.: Translating 10 lessons from lean six sigma project in paper-basedtraining site to electronic health record-based primary care practice: challengesand opportunities. Qual. Manag. Health Care 22, 224 (2013)
132. Kannan, V., Fish, J.C., Willett, D.L.: Agile model driven development of elec-tronic health record-based specialty population registries (2016)
133. Heidari Gorji, A., Farooquie, J.: A comparative study of total quality managementof health care system in India and Iran. BMC Res. Notes 4, 566 (2011)
134. Garg, L., Dauwels, J., Earnest, A., Leong, K.P.: Tensor-based methods for han-dling missing data in quality-of-life questionnaires. IEEE J. Biomed. Heal Inform.18, 1571–1580 (2014)
135. McClean, S., Barton, M., Garg, L., Fullerton, K.: A modeling framework thatcombines Markov models and discrete-event simulation for stroke patient care.ACM Trans. Model. Comput. Simul. 21, 25 (2011)
136. Herlihy, M., Luchangco, V.: Distributed computing and the multicore revolution.SIGACT News 39, 62–72 (2008)
137. Smith, R.C.: Uncertainty Quantification: Theory, Implementation, and Applica-tions, vol. 12. SIAM (2013)

34 C. Grelck et al.
138. John Walker, S.: Big Data: A Revolution that will Transform How We Live, Work,and Think. Houghton Mifflin Harcourt, Boston (2014)
139. Al-Fuqaha, A., Guizani, M., Mohammadi, M., Aledhari, M., Ayyash, M.: Internetof Things: a survey on enabling technologies, protocols, and applications. IEEECommun. Surv. Tutor. 17, 2347–2376 (2015)
140. Kennedy, H.: Post, Mine, Repeat: Social Media Data Mining Becomes Ordinary.Springer, London (2016). https://doi.org/10.1057/978-1-137-35398-6
141. Zhang, M., Melin, T., Gong, J., Barth, M., Axner, L.: Mixed fidelity aerodynamicand aero-structural optimization for wings. In: 2018 International Conference onHigh Performance Computing and Simulation, pp. 476–483 (2018). QC 20180808
142. Zafari, A., et al.: Task parallel implementation of a solver for electromagneticscattering problems (2018). https://arxiv.org/abs/1801.03589
143. Viktorin, A., Senkerik, R., Pluhacek, M., Kadavy, T., Zamuda, A.: Distance basedparameter adaptation for differential evolution. In: 2017 IEEE Symposium Serieson Computational Intelligence (SSCI), pp. 1–7. IEEE (2017)
144. Viktorin, A., Senkerik, R., Pluhacek, M., Kadavy, T., Zamuda, A.: Distance basedparameter adaptation for success-history based differential evolution. Swarm Evol.Comput. (2018)
145. Zamuda, A., Sosa, J.D.H.: Success history applied to expert system for underwaterglider path planning using differential evolution. Expert Syst. Appl. 119, 155–170(2019)
146. Zamuda, A., Zarges, C., Stiglic, G., Hrovat, G.: Stability selection using a geneticalgorithm and logistic linear regression on healthcare records. In: Proceedingsof the Genetic and Evolutionary Computation Conference Companion (GECCO2017), pp. 143–144 (2017)
147. Zamuda, A., Nicolau, M., Zarges, C.: A black-box discrete optimization bench-marking (BB-DOB) pipeline survey: taxonomy, evaluation, and ranking. In: Pro-ceedings of the Genetic and Evolutionary Computation Conference Companion(GECCO 2018), pp. 1777–1782 (2018)
148. Glotic, A., Zamuda, A.: Short-term combined economic and emission hydrother-mal optimization by surrogate differential evolution. Appl. Energy 141, 42–56(2015)
149. Zamuda, A., Sosa, J.D.H., Adler, L.: Constrained differential evolution optimiza-tion for underwater glider path planning in sub-mesoscale eddy sampling. Appl.Soft Comput. 42, 93–118 (2016)
150. Zamuda, A., Brest, J.: Environmental framework to visualize emergent artificialforest ecosystems. Inf. Sci. 220, 522–540 (2013)
151. Zamuda, A., Brest, J.: Vectorized procedural models for animated trees recon-struction using differential evolution. Inf. Sci. 278, 1–21 (2014)
152. Zamuda, A., Mlakar, U.: Differential evolution control parameters study for self-adaptive triangular brushstrokes. Informatica - Int. J. Comput. Inform. 39, 105–113 (2015)
153. Zamuda, A., Brest, J.: On tenfold execution time in real world optimization prob-lems with differential evolution in perspective of algorithm design. In: 2018 25thInternational Conference on Systems, Signals and Image Processing (IWSSIP),pp. 1–5. IEEE (2018)
154. Zamuda, A., Brest, J.: Self-adaptive control parameters’ randomization frequencyand propagations in differential evolution. Swarm Evol. Comput. 25, 72–99 (2015)
155. Blazquez Gil, G., Berlanga, A., Molina, J.M.: InContexto: multisensor architec-ture to obtain people context from smartphones. Int. J. Distrib. Sens. Netw. 8(2012)

Why HPC Modelling and Simulation for Big Data Applications Matters 35
156. Cristina-Bicharra, A., Vivacqua, C., Sanchez-Pi, N., Martı, L., Molina, J.M.:Crowd-based ambient assisted living to monitor elderly health in outdoor set-tings. IEEE Softw. 34, 53–57 (2017)
157. Griol, D., Molina, J.M., Sanchis, A.: Integration of context-aware conversationalinterfaces to develop practical applications for mobile devices. J. Ambient Intell.Smart Environ. (JAISE) 9, 561–577 (2017)
158. Marti, L., Sanchez-Pi, N., Molina, J.M., Bicharra, A.C.: Anomaly detection basedon sensor data in petroleum industry applications. Sensors 15, 2774–2797 (2015)
159. Vlahogianni, E.I., Karlaftis, M.G., Golias, J.C.: Short-term traffic forecasting:where we are and where we’re going. Transp. Res. Part C: Emerg. Technol. 43,3–19 (2014)
160. Abdullatif, A., Masulli, F., Rovetta, S.: Tracking time evolving data streams forshort-term traffic forecasting. Data Sci. Eng. 2, 210–223 (2017)
Open Access This chapter is licensed under the terms of the Creative CommonsAttribution 4.0 International License (http://creativecommons.org/licenses/by/4.0/),which permits use, sharing, adaptation, distribution and reproduction in any mediumor format, as long as you give appropriate credit to the original author(s) and thesource, provide a link to the Creative Commons license and indicate if changes weremade.
The images or other third party material in this chapter are included in the chapter’sCreative Commons license, unless indicated otherwise in a credit line to the material. Ifmaterial is not included in the chapter’s Creative Commons license and your intendeduse is not permitted by statutory regulation or exceeds the permitted use, you willneed to obtain permission directly from the copyright holder.

Parallelization of Hierarchical MatrixAlgorithms for Electromagnetic
Scattering Problems
Elisabeth Larsson1(B) , Afshin Zafari1, Marco Righero2 ,M. Alessandro Francavilla3, Giorgio Giordanengo2, Francesca Vipiana4 ,
Giuseppe Vecchi4, Christoph Kessler5 , Corinne Ancourt6 ,and Clemens Grelck7
1 Scientific Computing, Department of Information Technology,Uppsala University, Uppsala, Sweden
[email protected], [email protected] Antenna and EMC Lab (LACE), LINKS Foundation, Turin, Italy{marco.righero,giorgio.giordanengo}@linksfoundation.com
3 ASML Netherlands BV, Veldhoven, [email protected]
4 Department of Electronics and Telecommunications,Politecnico di Torino, Turin, Italy
{francesca.vipiana,giuseppe.vecchi}@polito.it5 Department of Computer and Information Science, Linkoping University,
Linkoping, [email protected]
6 MINES ParisTech, PSL University, CRI, Paris, [email protected]
7 Informatics Institute, University of Amsterdam, Amsterdam, [email protected]
Abstract. Numerical solution methods for electromagnetic scatteringproblems lead to large systems of equations with millions or even billionsof unknown variables. The coefficient matrices are dense, leading to largecomputational costs and storage requirements if direct methods are used.A commonly used technique is to instead form a hierarchical representa-tion for the parts of the matrix that corresponds to far-field interactions.The overall computational cost and storage requirements can then bereduced to O(N log N). This still corresponds to a large-scale simulationthat requires parallel implementation. The hierarchical algorithms arerather complex, both regarding data dependencies and communicationpatterns, making parallelization non-trivial. In this chapter, we describetwo classes of algorithms in some detail, we provide a survey of existingsolutions, we show results for a proof-of-concept implementation, and weprovide various perspectives on different aspects of the problem.
The list of authors is organized into three subgroups, Larsson and Zafari (coordinationand proof-of-concept implementation), Righero, Francavilla, Giordanengo, Vipiana,and Vecchi (definition of and expertise relating to the application), Kessler, Ancourt,and Grelck (perspectives and parallel expertise).
c© The Author(s) 2019J. Ko�lodziej and H. Gonzalez-Velez (Eds.): cHiPSet, LNCS 11400, pp. 36–68, 2019.https://doi.org/10.1007/978-3-030-16272-6_2

Parallelization of Hierarchical Matrix Algorithms 37
Keywords: Electromagnetic scattering · Hierarchical matrix ·Task parallel · Fast multipole method ·Nested equivalent source approximation
1 Introduction
In this chapter, we consider how efficient solution algorithms for electromag-netic scattering problems can be implemented for current multicore-based andheterogeneous cluster architectures. Simulation of electromagnetic fields [42] isan important industrial problem with several application areas. One of the mostwell known is antenna design for aircraft, but electromagnetic behavior is impor-tant, e.g., also for other types of vehicles, for satellites, and for medical equip-ment. A common way to reduce the cost of the numerical simulation is to assumetime-harmonic solutions, and to reformulate the Maxwell equations describingthe electromagnetic waves in terms of surface currents [49]. That is, the resultingnumerical problem is time-independent and is solved on the surface of the bodybeing studied, see Fig. 1 for an example of a realistic aircraft surface model.
Fig. 1. Surface currents on an aircraft model from a boundary element simulation witharound 2 million unknowns.
The size N of the discretized problem, which for a boundary element dis-cretization takes the form of a system of equations with a dense coefficientmatrix, can still be very large, on the order of millions of unknowns going up tobillions, and this size increases with the wave frequency. If an iterative solutionmethod is applied to the full (dense) matrix, the cost for each matrix-vectormultiplication is O(N2), and direct storage of the matrix also requires mem-ory resources of O(N2). Different (approximate) factorizations of the matrices,that can reduce the costs to O(N log N) or even O(N), have been proposedin the literature such as the MultiLevel Fast Multipole Algorithm (MLFMA),see, e.g., [43,51]; FFT-based factorization, see, e.g., [50,57]; factorizations basedon the Adaptive Cross Approximation (ACA), see, e.g., [67]; or based on H2matrices as the Nested Equivalent Source Approximation (NESA) [37–39].
All these approximations can be seen as decomposing the original densematrix into a sparse matrix accounting for near field interactions, and a hier-archical matrix structure with low storage requirements accounting for far fieldinteractions.

38 E. Larsson et al.
A large investment in terms of research and development has been made inconstructing and implementing these rather complex algorithms efficiently. Alarge part of this effort was made before the advent of multicore architectures.Then, the focus was much more on minimizing the amount of computations,optimizing for a powerful server, potentially with a few processors (cores). Now,clusters are built from regular computers with large numbers of cores, and some-times the additional complexity of accelerators. Memory bandwidth is often thelimiting factor in this case. The question for companies as well as researcherswith advanced application codes is how to make these codes run on their ownor their customers’ clusters, with the least effort in terms of changes to thecode, and with the maximum output in terms of utilization of the cluster andcomputational efficiency.
Some of the properties of the hierarchical matrix algorithms that make par-allel implementation challenging are first the general form of the algorithm, withinterleaved stages of interactions in the vertical direction between parents andchildren in a tree structure, and horizontally between the different branches ateach level of the tree. The stages typically have different levels of parallelism andwork loads, and there is a bottleneck when the algorithm reaches the coarsestlevel of the tree structure, and the amount of parallelism is the smallest. Thatis, the algorithm itself is generally heterogeneous. Furthermore, the tree can beunbalanced in different ways due to the geometry of the underlying structure,and the groups at the finest level can contain different number of unknownsdepending on how the scattering surface cuts through space. An overview of thechallenges inherent in the implementation of the fast multipole method (FMM),which is one of the algorithms in this class, on modern computer architecturescan be found in [13].
In the following sections, we first provide a high-level description of twotypes of hierarchical algorithms for electromagnetic scattering. Then in Sect. 3we provide a survey of literature and software in this area. Section 4 discusses twotask-parallel implementations of a simplified algorithm for shared memory. Thenin Sect. 5, different perspectives regarding the question of how to eventually portthe software to clusters and heterogeneous architecture are given.
2 Two Classes of Algorithms and Their Properties
In this section, we will go deeper into the MLFMA and NESA algorithm classes,and describe their properties from the parallelization perspective. For the math-ematical details of the algorithms, see [43] for MLFMA and [37–39] for NESA.
2.1 Interaction Matrices
Solving a system of equations for the unknown surface currents given measuredfield values can be seen as an inverse problem. When using an iterative method,we transform the inverse problem to repeated solutions of the forward problem,which is easier to address.

Parallelization of Hierarchical Matrix Algorithms 39
The forward problem consists of computing an electromagnetic field givena distribution of sources/charges. We will use two examples to make it moreconcrete. A well known model problem is to compute the electrostatic potential,
φ(x) =N∑
j=1
K(x,xj)qj , (1)
generated by the point charges qj located at the points xj . The kernel K(·, ·),which is logarithmic in two dimensions and proportional to the inverse distancein three dimensions, represents the interaction between the field points and thecharges.
The corresponding scattering problem that is of real interest in industry andfor research has a similar structure and consists of computing the electric and/ormagnetic fields generated by surface currents on for example a metallic objectsuch as an aircraft. We write this in simplified form as
E(r) =∫
∂Ω
(G(r, r′)j(r′) +
1k2
∇ (G(r, r′)∇ · j(r′)))
dr′, (2)
where r is a point in space, ∂Ω is the surface of the object, and G(·, ·) is aGreen’s function.
To render the problems tractable for computer simulation, they are dis-cretized. In the first case, we already have discrete charges. In the second case,a boundary integral formulation of the problem is used, where we represent thefields and surface currents by a set of basis functions vj and corresponding coef-ficients, which we denote by Ej and qj , j = 1, . . . , N . Henceforth, we will referto qj as sources, and to individual basis functions as locations. The fields areevaluated in the same discrete locations as where the sources are located. Thisallows us to express the forward problem as a matrix–vector multiplication
E = Zq, (3)
where E is the vector of the field variables, Z is an N × N interaction matrixwhere element zij describes the contribution from a unit source at location j tothe field at location i, and q is the vector of source values.
2.2 The Hierarchical Algorithm
The basis for the fast algorithms is that interactions between locations near toeach other are stronger then distant interactions. In the algorithms, near-fieldinteractions are computed directly, while far-field interactions are approximatedin such a way that the required storage and the amount of computations isdecreased while still respecting a given error tolerance.
The computational domain is hierarchically divided into groups (boxes),which can be represented as an oct-tree (quad-tree in two dimensions) withlevels � = L0, . . . , �max. Since the charges are located only on the surface of the

40 E. Larsson et al.
body, many of the groups, especially on the finer levels, are empty of charges,and are pruned from the tree. When we construct the hierarchical algorithm,we consider interactions between groups. We let Ei denote the field variables ingroup i at level �max, and we let Ej
i be the contribution from group j at level�max to Ei, such that
Ei =∑
j
Eji . (4)
Using the direct matrix–vector multiplication, we have that
Eji = Zi,jQj , (5)
where Zi,j is a matrix block, and Qj is the vector of charges in group j at level�max. In the hierarchical fast matrix–vector multiplication algorithm, only thenear-field interactions are computed directly. These are here defined as interac-tions between groups that are neighbours at the finest level. The far-field inter-actions are instead approximated. At each level of the tree structure, startingfrom level L0, the far-field groups are identified as those that are not neighboursto the target group. As much of the far-field interaction as possible is treated ateach level, to minimize the total number of groups to interact with. In Fig. 2, weshow the layout of the near and far-field for computing the field at one location(the black box) in a two-dimensional geometry.
Fig. 2. Illustration of a two-dimensional domain that is hierarchically divided intothree levels of boxes. Charges are located on the wavy curve. For the black target box,the near-field consists of the six dark gray neighbouring boxes. The far-field at eachlevel consists of the four large, five medium, and five small light gray boxes that arenot neighbours of the target box.
The far-field approximation for one interaction has the following general form
Eji = Zi,jQj ≈ Ri P�max
�max−1 · · · P �+1�︸ ︷︷ ︸
descending
T �i,j P �
�+1 · · · P�max−1�max︸ ︷︷ ︸
ascending
SjQj , (6)
and can be described in terms of the five steps described in Algorithm 1.

Parallelization of Hierarchical Matrix Algorithms 41
Radiation:The sources Qj are converted into an intermediate representationX�max
j = SjQj .
Source transfer:The intermediate representation is propagated up through the parent groupsX�−1
j = P�−1� X�
j until level l, where the far-field interaction takes place.
Translation:The far-field interaction between groups i and j is computed at level �. Theresult is an intermediate field representation Y �
i = T �i,jX
�j .
Field transfer:The intermediate field representation is propagated down through the childgroups Y �+1
i = P�+1� Y �
i until the finest level is reached.
Reception:The intermediate field representation is evaluated at the actual fieldlocations, Ej
i = RiY�max
i .
Algorithm 1. The algorithm for computing one interaction term.
If we change the view, and instead see the algorithm from the perspective ofone particular group at level � that takes part in several interactions, the workrelated to that group can be expressed as Algorithm 2.
Upward Phase:if � = �max then
Compute X�maxj = SjQj for local sources.
elseReceive source contributions from all child groups.
endif � > L0 then
Send accumulated source contribution to parent.end
Translation Phase:Compute Y �
i = T �i,jX
�j according to interaction list.
Downward Phase:if � > L0 then
Receive field contribution from parent.endif � < �max then
Send field contribution to all child groups.else
Compute Ej = RjY�maxj for local target points.
end
Algorithm 2. The algorithm seen from the view of one particular group.

42 E. Larsson et al.
For the parallel implementation, there are several relevant aspects to keep inmind. For the upward and downward phases, communication is performed ver-tically in the tree, between parent and child groups. The translation operationson the other hand need horizontal communication. Due to the hierarchical struc-ture, each group has an interaction list of limited size. The three phases of thealgorithm can be overlapped, since different groups complete the phases at dif-ferent times. Even more important is that the near-field interactions for disjunctgroups are independent and can be interspersed with the far-field computations.
The memory savings that the fast algorithms provide stem from the fact thatthe far-field part of the interaction matrix is replaced with the operators in (6).These are the same for groups that have the same position relative to each other.That is, only a limited number of operators are needed at each level.
2.3 Specific Properties of the NESA Algorithm
In the NESA algorithm, all of the far-field operations consist in expressingsources and field in terms of equivalent charges. The actual sources in a groupat level �max can through a low rank approximation be represented by a set ofequivalent sources that generate a matching field at some control points locatedat an exterior test surface. In the same way, the equivalent sources in a childgroup can be represented by another set of equivalent sources at the parentgroup. This is schematically shown for a two-dimensional problem in Fig. 3. Thenumber of equivalent charges Q is the same in each group, which is why we cansave significantly in the far-field computation. The translation and field trans-fers are managed similarly. We will not go into all details here, instead we referto [37].
Fig. 3. A parent group and one of its children are illustrated. The points on the solidcircles are where the equivalent sources are located, and the points on the dashed circleare where the fields are matched.
To understand the computational properties of the NESA algorithm, we char-acterize each operation in terms of how much memory it needs to load counted indouble precision numbers, and how many floating point operations (flop) are per-formed. We also provide the computational intensity, in flop/double. The results

Parallelization of Hierarchical Matrix Algorithms 43
Table 1. Characterization of the matrix–vector products in the NESA algorithm. Thenumber of sources in group j is denoted by nj .
Operator Data size Compute size Intensity
Near field
Zi,j ni × nj 2ninj 2
Far field
Sj Q × nj 2njQ 2
P�−1� Q × Q 2Q2 2
T �i,j Q × Q 2Q2 2
P�+1� Q × Q 2Q2 2
Ri ni × Q 2niQ 2
are listed in Table 1. All of the operations in the NESA algorithm are densematrix–vector products, with the same computational intensity of 2 flop/dou-ble. For modern multicore architectures, a computational intensity of 30–40 isneeded in order to balance bandwidth capacity and floating point performance,see for example the trade-offs for the Tintin and Rackham systems at UPPMAX,Uppsala University, calculated in [64]. This means that we need to exploit datalocality (work on data that is cached locally) in order to overcome bandwidthlimitations and scale to the full number of available cores.
2.4 Specific Properties of the MLFMA Algorithm
In the MLFMA algorithm, the intermediate representation of sources and fieldsis given in terms of plane wave directions κ = (θ, φ), where θ is the polar angle,and φ is the azimuthal angle in a spherical coordinate system. When computingfar-field interactions, the Green’s function can be represented using an integralover the directions, which numerically is done through a quadrature method.The accuracy of the approximation depends on the number of directions thatare used. A difference compared with the NESA method is that the number ofdirections that are needed scale with the box size.
Table 2. An example of the number of directions N� needed at each level in theMLFMA algorithm, starting from the finest level � = �max.
�max − � 0 1 2 3 4 5 6 7 8 9
L� 5 7 10 15 23 38 66 120 224 428
N� 72 128 242 512 1152 3042 8978 29282 101250 368082
To compute the number of directions needed for a box at level �, we firstcompute the parameter L� from the wave number of the electromagnetic wave,

44 E. Larsson et al.
Fig. 4. A unit sphere discretized for L� = 23 with 24 points in θ (latitudes) and 48points in φ (longitudes).
the diagonal d� of the box, and the desired error tolerance τ [43, Sect. 5.3]. Thenthe box is discretized with L� + 1 points in the θ-direction and 2L� + 2 points inthe φ-direction giving a total number of N� = 2L2
� + 4L� + 2. Using a realistictolerance τ = 1e − 4 and an appropriate box size for the finest level leads tothe sequence of sizes given in Table 2. Figure 4 shows the discretized sphere forL� = 23. The wide range of sizes for the representations at different levels doespose a challenge for parallel implementations.
The interpolation step between parent and child or vice versa can be real-ized in different ways. Here, we consider the Lagrange interpolation methoddescribed in [43]. Then the value at one point at the new level is computed usingthe m nearest neighbours in each coordinate direction. The operations of oneinterpolation step are shown schematically in Fig. 5.
Fig. 5. To interpolate the data (middle) from a child L = 10 to a parent L = 15, asparse interpolation matrix (left, right) is applied to each of the data dimensions. Thematrix sizes are here 32 × 22, 22 × 17, and 17 × 16. The data matrix is extended withm/2 columns to each side to manage the periodicity at the poles.
Similarly as for the NESA algorithm in the previous subsection, we charac-terize the work performed during the algorithm and evaluate its computational

Parallelization of Hierarchical Matrix Algorithms 45
Table 3. Characterization of the steps in the MLFMA algorithm. The number ofsources in group j is denoted by nj .
Operator Data size Compute size Intensity
Near field
Zi,j ni × nj 2ninj 2
Far field
Sj N� × nj 2njN� 2
P�−1� (2L� × L�) 2m
(2L�L�−1 + 2L2
�−1
)2m
(L�−1
L�+
(L�−1
L�
)2)
T �i,j 2 (2L� × L�)
(2L2
�
)0.5
P�+1� (2L� × L�) 2m
(2L�L�+1 + 2L2
�+1
)2m
(L�+1
L�+
(L�+1
L�
)2)
Ri ni × N� 2niN� 2
intensity. The results are given in Table 3. The radiation and reception steps arematrix–vector products also in this case. The interpolation steps have a highercomputational intensity. For m = 6 and the child to parent operation, we get40–66 flop/data, while for the parent to child operations, we get 10–15 flop/data.The translation step is often a bottleneck in parallel implementation. It is anelementwise multiplication with an intensity less than one flop/data.
3 State of the Art
There is a rich literature on parallel implementation of hierarchical matrix algo-rithms. Many of the implementations are aimed at volume formulations (parti-cles/charges are located in a volume), as opposed to surface formulations as forthe scattering problem. The volume formulation is more likely to have a largenumber of particles in a group, and a more well-balanced tree structure.
The most common parallelization approach, targeting distributed memorysystems, is to partition the tree data structure over the computational nodes,and use an MPI-based parallelization [34]. The resulting performance is typicallya bit better for volume formulations then for boundary formulations, since thecomputational density is higher in the former case. A particular issue for theMLFMA formulation of electromagnetic scattering problems is that the work perelement (group) in the tree data structure increases with the level, and additionalpartitioning strategies are needed for the coarser part of the structure [6,30,56].
The ongoing trend in cluster hardware is an increasing number of cores percomputational node. When scaling to large numbers of cores, it is hard to fullyexploit the computational resources using a pure MPI implementation, due to therapid increase in the number of inter-node messages with the number of MPIprocesses for communication heavy algorithms [64]. As is pointed out in [35],a hybrid parallelization with MPI at the distributed level and threads withinthe computational nodes is more likely to perform well. That is, a need for

46 E. Larsson et al.
efficient shared memory parallelizations of hierarchical algorithms to be used incombination with the distributed MPI level arises.
The emerging method of choice for implementing complex algorithms on mul-ticore architectures is dependency-aware task-based parallel programming, whichis available, e.g, through the StarPU [5], OmpSs [46], and SuperGlue [54] frame-works, but also in OpenMP, since version 4.0. Starting with [7], where StarPUis used for a task parallel implementation of an FMM algorithm, several authorshave taken an interest in the problem. In [31], SuperGlue is used for a multicoreCPU+GPU implementation of an adaptive FMM. The Quark [61] run-time sys-tem is used for developing an FMM solver in [40]. Since tasks were introduced inOpenMP, a recurring question is if the OpenMP implementations can reach thesame performance as the specific run-times discussed above. An early OpenMPtask FMM implementation is found in [2]. This was before the depend clausewas introduced, allowing dependencies between sibling tasks. OpenMP, Cilk andother models are compared for FMM in [66], OpenMP and Klang/StarPU arecompared in [1], and different OpenMP implementations and task parallel run-times are compared with a special focus on locking and synchronization in [4]. Acommon conclusion from these comparisons is that the commutative clause pro-vided by most task parallel run-time systems is quite important for performance,and that this would be a useful upgrade of OpenMP tasks for the future.
An alternative track is to develop special purpose software components forthe class of FMM-like algorithms, see, e.g., PetFMM [12] and Tapas [21].
An open source implementation of MLFMA is available through the Puma-EM software [47], parallelized with MPI. An example of a commercial MLFMAsoftware is Efield [16] provided by ESI Group, parallelized for shared memory.
4 Proposed Solution and Proof of Concept
During the last decade task-parallel programming has emerged as the main pro-gramming paradigm to run scientific applications on modern multicore- andheterogeneous computer architectures. A recent and fairly complete overview ofthe current state of the art can be found in [52].
The key idea is that the programmer provides the sequential work-flow ofan algorithm in terms of tasks. These are then submitted to a run-time system,which analyses the data dependencies of the tasks and schedules them ontoavailable hardware resources to be executed in parallel. It can in some cases bepossible to obtain higher performance by hand-tuning a code, but the cost inprogramming effort and the renewed cost if the system configuration changesare usually considered too high.
There are several arguments for using task parallel programming for thehierarchical matrix–vector products considered here.
– The work flow is already described in terms of tasks operating on data asso-ciated with the individual groups. Therefore, the overhead of converting thealgorithm into a suitable form can be largely avoided.

Parallelization of Hierarchical Matrix Algorithms 47
– The data size varies between groups, the number of child groups and interac-tions across the tree structure. The amount of work varies with the level andthe phase of the algorithm. All of this indicates that the asynchronous taskexecution provided by a run-time system is more likely to be efficient than astatically determined schedule.
– The dependencies between tasks are complex, problem dependent, and hardto analyze manually. With the run-time scheduling, dependencies are auto-matically managed, and tasks can run as soon as their dependencies have beenmet. Furthermore, the run-time guarantees correctness in the sense that if thesequential task flow of the application code is described correctly, the parallelexecution guarantees to respect the order up to admissible interleavings.
As a proof of concept, we have implemented the NESA algorithm for theelectrostatic potential problem using the SuperGlue [54] framework. A detaileddescription of the implementation details and the results can be found in [63]. Abenefit of using the NESA algorithm is that the tasks are more similar both insize and type than for the MLFMA algorithm. The main arguments for choos-ing the SuperGlue framework are (i) that it has very low scheduling overhead,and can therefore handle small task sizes well, and (ii) that commutative dataaccesses are naturally included in the dependency management based on data-versioning. Commutative accesses relate to tasks that touch the same data, andthat can therefore not run concurrently, but that can otherwise run in any order.
We have also implemented the NESA algorithm using OpenMP tasks, andprovide some results and comments on how the two implementations compare.
In the following subsections, we provide a brief survey of task parallel pro-gramming frameworks, we discuss the SuperGlue and OpenMP implementations,and we provide some illustrative performance results.
4.1 A Task-Parallel Programming Overview
One of the key features of task parallel programming is that it makes it relativelyeasy for the programmer to produce a parallel application code that performswell. However, it is still important for the programmer to understand how towrite a task parallel program and how various aspects of the algorithm are likelyto impact performance.
The granularity of the tasks determines the number of tasks, which has adirect effect on the potential parallelism. As an application programmer, it isbeneficial to be aware of how tasks interact with each other and with the data.That is, to understand the character of the data dependencies. There may bedifferent ways of splitting the work that lead to different degrees of parallelism. Inthe NESA and MLFMA cases, a basic task size is given by the algorithm throughthe division of the domain into groups. The discussion to have is whether somegroups need splitting (the coarse levels in MLFMA) or merging (the leaf groups).
The granularity of tasks also has an effect on how the tasks interact with thememory hierarchy. If the tasks are small enough, data may fit into the cache.If the run-time system is locality-aware such that tasks are scheduled at the

48 E. Larsson et al.
cores where the data they need is cached, significant performance gains maybe secured. As was discussed in Sects. 2.3 and 2.4, the computational intensityprovided by the tasks of the NESA and MLFMA algorithms is not enough toscale well if all of the data is read from the main memory.
In [55] resource-aware task-scheduling is investigated. It is shown that theeffect of, e.g, bandwidth contention between tasks can be reduced by co-scheduling a mix of diverse tasks. However, in the NESA case, all of the taskshave a similar computational intensity, so that approach is not applicable.
From the user perspective, it would be ideal if there were only one frame-work for task parallelism, or at least one common standard for task parallelprogramming implemented by different frameworks. Steps are being taken inthis direction, see also the implementation in [62], but it will take some timeuntil it is in place. Meanwhile, we provide an overview of some of the morerelevant initiatives.
The StarPU framework [5,52] was initially developed to manage schedulingbetween the CPU and GPU resources in one computational node. It has overtime been developed in different ways and has become one of the most widelyadopted general purpose run-time systems. In StarPU, an important componentis the management of data transfers and data prefetching. Advanced performanceprediction based on performance measurements is used in the different schedulingalgorithms. StarPU has very good performance for large scale problems withrelatively large task sizes. When task sizes become too small, the overhead ofthe advanced scheduling is too large, and performance goes down.
Another important run-time system is OmpSs [15], which is the current rep-resentative of the StarSs family [46]. In OmpSs, the tasks are defined throughcompiler directives in the same way as in OpenMP. In fact, the development ofthe OpenMP standard in terms of tasks and task dependencies is driven by thedevelopment of OmpSs. In this way, the constructs and implementations are welltested before being adopted by the standard. The use of directives can be seenas less intrusive when transforming legacy code into task parallel code comparedwith the use of specific APIs for task submission.
LAPACK [3], which implements a large selection of linear algebra opera-tions, is one of the most widely used libraries in scientific computing. With theadvent of multicore architectures, a number of projects were started to providemulticore and GPU support. These have now converged into using the PaRSECrun-time system [8], which has excellent performance both for large and smalltask sizes. PaRSEC can be used for all types of algorithms, but it requires thetask dependencies to be expressed in a specific data flow language. This allowsto build a parametrized task graph that can be used efficiently by the run-timesystem, but it can be an obstacle for the application programmer.
The SuperGlue framework [54] was developed mainly for research purposeswith a focus on performance. It is a general-purpose task parallel framework formulticore architectures. It is very lightweight, it uses an efficient representationof dependencies through data versions, and has very low overhead, such thatcomparatively small tasks can be used without loosing performance.

Parallelization of Hierarchical Matrix Algorithms 49
Tasks with dependencies were introduced in OpenMP 4.0. The dependenciesare only between sibling tasks submitted in the same parallel region, and thereis not yet support for commutative tasks, which are relevant for the NESA andMLFMA types of algorithms. The main reason for using OpenMP is that it isa standard and is likely to remain, making it a relatively secure investment incoding.
4.2 The SuperGlue Task Parallel Implementation
SuperGlue is implemented in C++ as a headers only library. In order to writea task-based version of the NESA algorithm for SuperGlue, we need to definea SuperGlue task class for the matrix–vector product that is the computationalkernel used in all the tasks. In Program1.1 we show a slightly simplified codethat emphasizes the most relevant parts. The task class contains the data thatis touched by the task, a constructor, and a run method. In the constructor, thetypes of data accesses are registered. In this case, it is a commutative (add) accessto the output vector. The read accesses to the input data are not registered asthat data is not modified during execution. The access information is used fortracking dependencies, and extra dependencies increase the overhead cost.
The constructor is called at task submission, while the run method is calledat task execution time.
1 class SGTaskGemv : public Task <Options ,3>{2 private:3 SGMatrix *A,*x,*y;4 public:5 SGTaskGemv(SGMatrix &A_ , SGMatrix &x_ , SGMatrix &
y_)6 {7 A = &A_;8 x = &x_;9 y = &y_;
10 Handle <Options > &hy = y->get_handle ();11 register_access(ReadWriteAdd ::add , hy);12 }13
14 void run(){15 double *Mat= A->get_matrix ()->get_data_memory ();16 double *X = x->get_matrix ()->get_data_memory ();17 double *Y = y->get_matrix ()->get_data_memory ();18 cblas_dgemv(Mat , X, Y);19 }20 };
Program 1.1. The MVP task class

50 E. Larsson et al.
In the application code all former calls to the matrix–vector product sub-routine should be replaced by the corresponding task submission. If we hide thetask submission statement in a subroutine, the syntax of the application codedoes not need to change at all. The new subroutine that replaces the originalmatrix–vector product by the task submission is provided as Program1.2.
1 void gemv(SGMatrix &A, SGMatrix &x, SGMatrix &y){2 SGTaskGemv *t= new SGTaskGemv(A, x, y);3 sgEngine ->submit(t);4 }
Program 1.2. The subroutine that submits an MVP task.
There are also other small changes such as starting up the SuperGlue run-time, and the SGMatrix data type, which equips the ‘ordinary’ matrix type withthe data handle that is used when registering accesses. A longer description ofthe implementation can be found in [63], and the full implementation is availableat GitHub1.
4.3 The OpenMP Task-Parallel Implementation
An implementation with a similar functionality as the task-parallel implementa-tion described above can—with some care—be created with OpenMP as well. Asimple task construct was introduced in OpenMP 3.0, and a depend clause wasadded in OpenMP 4.0, to allow dependencies between sibling tasks, i.e, taskscreated within the same parallel region. This means that if we create several par-allel regions for different parts of the algorithm, there will effectively be barriersin between, and the tasks from different regions cannot mix.
1 #pragma omp parallel2 {3 #pragma omp single4 {5 // Submit tasks for near -field multiplication6 FMM:: mv_near_field(OT , C, Q);7 // Submit tasks for far -field multiplication8 FMM:: mv_far_field(OT , C, Q);9 }
10 }11 #pragma omp taskwait12 #pragma omp barrier
Program 1.3. The structure of the OpenMP implementation. There is one globalparallel region (lines 1–10), and within this region only one thread can submit tasks(lines 3–9).
1 https://github.com/afshin-zafari/FMM/.

Parallelization of Hierarchical Matrix Algorithms 51
The proper way to do it is to create one parallel region that covers the wholecomputation, and then make sure that only one thread generates tasks such thatthe sequential order is not compromised. An excerpt from the OpenMP main pro-gram that illustrates this is shown in Program1.3. The tasks are implicitly sub-mitted from the near-field and far-field subroutines, whenever the cblas dgemvsubroutine is invoked.
The tasks are defined using the task pragma with the depend clause, seeProgram 1.4. Only the (necessary) inout dependence for the output data vectoris included. Adding the (nonessential) read dependencies on the matrix and inputdata vector was shown in the experiments to degrade performance.
1 #pragma omp task depend(inout:Y[0:N])2 cblas_dgemv(Mat , X, Y);
Program 1.4. The OpenMP task pragma that defines a gemv task.
As can be seen, the implementation is not so difficult, but there are severalways to make mistakes that lead to suboptimal performance. The programmerneeds to understand how the task generation, the task scheduling, and the par-allel regions interact.
4.4 Performance Results
In this section we summarize the experimental results from [63] and relate theseto the arguments we gave for using a task-based parallel implementation. Theease of implementation was discussed in the previous two subsections. The nexttwo arguments concerned the benefits of asynchronous task execution, dynamicand automatic scheduling, and mixing of computational phases.
Execution traces for the SuperGlue implementation, when running on oneshared memory node of the Tintin cluster at the Uppsala Multidisciplinary Cen-ter for Advanced Computational Science (UPPMAX), are shown in Fig. 6. Thesimulation parameters P and Q are the average number of sources in one groupat the finest level (the average of nj), and the number of auxiliary sources ineach group, respectively. The near-field trace (top) nicely illustrates how tasks ofdifferent sizes are scheduled asynchronously onto 16 worker threads with no vis-ible idle time between the tasks. The far-field trace furthermore illustrates thatthe different computational phases can be interleaved to a large extent using aschedule that it would be difficult to construct statically. Finally the last traceshows that the far-field tasks can be embedded in the near-field computation.As will be discussed below, this is beneficial since the far-field tasks have a lowercomputational intensity, and in this case are also smaller. The idle time that canbe seen in the beginning for thread 0 in the middle and bottom panels is thetime for task submission.
Another question that was investigated using the proof of concept implemen-tation was how the task size impacts scalability, and how small tasks can be usedwithout loosing performance. The same problem with N = 100 000 source pointsis solved in all experiments, but the method parameters P (the average number

52 E. Larsson et al.
Fig. 6. Execution traces for the near field computation (top), the far field computation(middle), and the combined execution (bottom) for Q = 100 and P = 400. Eachtask is shown as a triangle, and the color indicates which phase of the algorithmit belongs to. Near-field (dark gray), radiation (medium gray), source transfer (lightgray), translation (black), field transfer (light gray), and reception (medium gray).
of source points at the finest level) and Q (the number of auxiliary points usedfor each group) are varied between the experiments.
We compute the speedup Sp using p cores as Sp = T1/Tp. Each node ofthe Tintin cluster consists of two AMD Opteron 6220 (Bulldozer) processors. Apeculiarity of the Bulldozer architecture is that each floating point unit (FPU) isshared between two cores. This means that the theoretical speedup when using2p threads (cores) is only p, and the highest theoretical speedup on one nodewith 16 threads is 8.
Figure 7 shows the results for different task sizes. The near-field computationscales relatively well for all of the task sizes, but the performance improves withsize P . For the far-field, there is no scalability when both P and Q are small.The situation improves when the sizes increase, but the scalability is significantlyworse than for the near-field. For the combined computation, the results are

Parallelization of Hierarchical Matrix Algorithms 53
better than the far-field results with the same sizes, and for the larger taskseven better than the near-field results. That is, the mixing of the two phasesallows the limited scalability of the far-field computation to be hidden behindthe better performance of the near-field computations. We can however concludethat Q = 10 and P = 50, which are reasonable numbers for the two-dimensionalcase results in tasks that are too small for scalability. Using Q = 100, which issuitable for the three-dimensional problem, is however enough for shared memoryscalability. This is an indication that the proof of concept approach can be usedfor the real three-dimensional problem.
Fig. 7. Speedup for the near-field computation (left), the far-field computation (mid-dle) for P = 400 (solid lines) and for P = 50 (dashed lines), and the combined compu-tation (right).
In Table 4, we compare the execution times, the speedup, and the utilizationfor execution with small tasks and with larger tasks. The utilization is definedas the fraction of the total execution time that is spent in executing tasks. That
Table 4. The parallel execution time Tp, the speedup Sp, the speedup in relation tothe theoretical speedup S∗
p , and the utilization Up computed as the fraction of timespent executing tasks, for two problem settings.
p Tp [ms] Sp Sp/S∗p Up
Q = 10, P = 50
1 244 1.0 1.00 0.90
4 111 2.2 1.10 0.55
8 137 1.8 0.44 0.29
16 156 1.6 0.20 0.21
Q = 100, P = 300
1 1192 1 1.00 0.99
4 401 3.0 1.49 0.98
8 228 5.2 1.31 0.98
16 163 7.3 0.92 0.96

54 E. Larsson et al.
is, the lack of utilization reveals overhead, idle time and load imbalance. For theproblem with larger tasks, both utilization and speed are close to optimal. Forthe problem with small tasks, the utilization goes down to 21% for 16 threads.Then one might expect that the execution time T16 = T1/16/0.21, leading to aspeedup S16 = 3.4, but this is not at all the case. Figure 8 shows the slowdownof individual task execution as a function of the number of threads. A factorof 2 is expected for 16 threads due to the Bulldozer architecture. This is alsothe case for the larger tasks. For the smaller tasks, the far-field computationsexhibit a slowdown of 4, which limits the potential scalability to maximum 4at 16 threads. The computational intensity does not change with the task size,but a potential explanation can be found when looking at the scheduling in therun-time system. For large enough tasks, the run-time system has time to usethe knowledge of which data is needed by a task to place it in the work queue ofthe thread where that data is cached, thereby ensuring data locality. However,for too small task sizes, task execution becomes faster than task submission, andthe opportunity to find the next task ‘in time’ is lost. Then the threads try tosteal work from each other. This results in contention on the work queues as wellas a loss of data locality.
2 4 6 8 10 12 14 161
1.5
2
2.5
3
3.5
4
Threads
Slo
wdo
wn
Q x QP x QP x P
2 4 6 8 10 12 14 161
1.5
2
2.5
3
3.5
4
Threads
Slo
wdo
wn
Q x QP x QP x P
Fig. 8. Increase in individual task execution times for the complete execution for P =50, Q = 10 (left) and for P = 300, Q = 100 (right).
The final question we ask in this section is whether OpenMP is efficientenough to use for this problem. We already mentioned the fact that OpenMPcurrently does not support commutative tasks. The performance of the OpenMPrun-time implementations has increased over time, and will most likely continueto do so.
The experiments were carried out both on a node of the Tintin cluster,described in the previous section, and on a local shared memory system with4 sockets of Intel Xeon E5-4650 Sandy Bridge processors, yielding a total of 64cores. On Tintin, the codes were compiled with gcc version 4.9.1 and OpenMP4.0, while on Sandy Bridge the compiler was gcc 6.3.0 combined with OpenMP4.5.

Parallelization of Hierarchical Matrix Algorithms 55
We compare the execution times using SuperGlue (SG) and using OpenMP(OMP) for the full execution and for two different task sizes. The results, given inTables 5 and 6, show that OpenMP is slower for small task sizes, and especiallywhen small sizes are combined with large numbers of threads. However, forthe larger problem sizes, the differences are small 5–10%, and the results varybetween the two hardware systems. We do not see the effect of the missingcommutative clause. As long as tasks are large enough. These results indicatethat OpenMP can be used for this type of problem.
Table 5. Execution times in ms for the SuperGlue (SG) and OpenMP (OMP) imple-mentations executed on a Tintin node.
p P = 50, Q = 10 P = 300, Q = 100
SG OMP OMP/SG SG OMP OMP/SG
1 244 285 1.17 1192 1186 1.00
4 111 134 1.21 363 345 0.95
8 137 110 0.80 210 186 0.89
16 156 254 1.63 145 139 0.96
Table 6. Execution times in ms for the SuperGlue (SG) and OpenMP (OMP) imple-mentations executed on the Sandy Bridge system.
p P = 50, Q = 10 P = 300, Q = 100
SG OMP OMP/SG SG OMP OMP/SG
1 438 476 1.09 2318 2556 1.10
4 166 260 1.57 811 913 1.13
8 100 197 1.97 422 469 1.11
16 107 170 1.59 244 253 1.04
32 135 237 1.76 154 157 1.02
64 141 535 3.79 127 133 1.05
5 Perspectives and Future Directions
Our proof-of-concept implementation demonstrates that a task parallel imple-mentation provides the expected benefits. As long as the task granularity is nottoo small relative to the overhead of the run-time system the proposed solutionperforms well. Thus, we can recommend this general direction of parallelization,but there are many further aspects to consider; we discuss some of them in thefollowing subsections.

56 E. Larsson et al.
5.1 Recommendations for a Task Parallel 3-D Implementation
When performing large scale three-dimensional simulations, it becomes neces-sary to use distributed computer systems, and hence distributed parallel pro-gramming (or a partitioned global address space (PGAS) model). In [64] it wasshown that a hierarchical task-parallel programming model was beneficial for thedistributed implementation. Larger tasks are communicated between computa-tional nodes, and then split into subtasks that are executed in parallel withineach node.
For the upward and downward phases it seems natural to let a larger task rep-resent operations within a subtree. For the communication-intensive translationphase, it is less clear what the best type of task is. Perhaps translations betweensubtrees can be performed as one larger task, but this reduces the opportunitiesto interleave the translation stage with the other stages.
The partitioning of the global tree structure into subtrees would be per-formed at a level where the number of groups is at least equal to the numberof computational nodes. Then the question is how to share the work and thedata for the levels above the splitting point. For the NESA algorithm, this is notsuch a big problem as the amount of work at these lower levels is small. How-ever, for the MLFMA algorithm, the work increases significantly for the lowerlevels, as can be seen in Table 2. In this case, the work for these levels needs tobe divided between the computational nodes, while the data could potentiallybe shared by all. A drawback of such an approach could be that this kind ofsplitting becomes more intrusive from the programming perspective, than justmaking each subroutine call into one task.
As we saw in the proof-of-concept implementation, small task sizes can alsobecome a problem, but from the programming perspective we do not want toexplicitly merge work into larger tasks. In a preliminary implementation, whichis not yet finished, we performed experiments with batching of small tasks. Whentasks are submitted to the run-time system, they are saved in a buffer until thereis enough work to actually start a batched task, which then executes all of themat once.
The question of which run-time system or programming model to use isa difficult one. Especially for a company, it is important to know what kindof long-term support of a programming model can be expected, and whetherpermissions and licenses for using it remain stable. This would be an argumentfor using OpenMP for the shared memory part. For distributed task-parallelprogramming, however, there is no similarly established standard as of yet. Thechoice is then to either develop a custom run-time which is unlikely to be asgood as the already existing ones, or to trust an existing one, which may atsome point no longer be supported.
5.2 Automatically Mapping Workloads to Accelerators
Applications that perform regular computations on a large number of data areoften good candidates for efficient execution on accelerators such as GPUs. How-ever, mapping some parts of the applications onto a GPU is not easy, especially

Parallelization of Hierarchical Matrix Algorithms 57
when the application is written in C++. Indeed, in C++ references to arrayelements or certain values such as loop bounds can be hidden in function calls.Automatic tools that detect data dependencies statically and generate paral-lel code and GPU kernels need this information explicitly. Otherwise, dynamicanalysis and code instrumentation are required.
Initially, the mapping consists in detecting loops that meet the criteria of theaccelerator. These criteria express the adequacy between the loop nest patternsand the target accelerator hierarchy: external parallel loops will be mappeddirectly to streaming cores and sequential internal loops in threads. The loopnest sizes must be large enough to compensate for communication time and lessthan the number of possible accelerator threads. Finally, an estimation of thekernel memory footprint is required to fit the overall memory of the GPU.
If we take into account only the pieces of application that naturally respectthese constraints, we miss many pieces of code that can benefit from optimiza-tion. Gouin presents a methodology to increase the number of application piecesthat can benefit from accelerator optimization and describes all necessary map-ping stages [24,25].
The actual programming of GPU kernels, preferably specified within thesame source file as the calling CPU code, and of the necessary device memorymanagement and data transfers to/from GPU device memory can be made eas-ier for the programmer by adopting a high-level parallel programming modelsupporting GPU execution. For example, OpenACC allows to write kernels byannotating sequential loop-based code in a style similar to OpenMP parallel loopannotations. The OpenMP task model supports code generation for GPU execu-tion of tasks since OpenMP 4.0/4.5 with the introduction of the target directivefor offloading computations to accelerator devices. SYCL (https://www.khronos.org/sycl) is a high-level programming layer atop OpenCL that provides a single-source abstraction for OpenCL based accelerator programming. For improvedprogrammability, task-based runtime systems for heterogeneous programmingsuch as StarPU can also be coupled with higher-level programming abstractionlayers such as SkePU [14], which, from high-level constructs such as skeletonfunction calls, automatically generate the API calls for the management of tasks,data buffers and their dependencies by the runtime system.
5.3 Optimizing the Task Sizes
In the application the basic task size is given by the algorithm through thedivision of the domain into groups. As the tiling transformation makes it possibleto optimize task granularity at the loop level, adjusting task and group sizes can:
– improve data locality– improve cache reuse and– reduce communication overhead.
The new decomposition must be performed in order to balance computa-tions and communications. Considering the OpenMP implementation and a large

58 E. Larsson et al.
number of small tasks, merging could also reduce the global thread creation over-heads and thread scheduling run-time.
Task and group sizes are multi-dimensional spaces and the optimal decom-position parameters depend on the target architecture constraints (memory size,number of cores). Finding these optimal parameters is complex since they aredynamic variables. Autotuner techniques combining profiling information mightbe used to develop heuristics and to limit the maximum task sizes at each levelof the application.
5.4 Limiting Recursive Task Creation on CPU
Task-based computations over recursively defined sparse hierarchical domainssuch as quadtrees/octrees could, if applicable for the underlying computationalproblem, choose to stop the recursive subdivision at a certain depth limit and,for example, switch to computations over dense representations below this limitor sequentialize the independent subcomputations instead of creating a smallertask for each of them. For example, OpenMP 4.x provides the if clause to thetask construct for conditional task creation. Such cut-off depth/condition, aswell as the degree of task unrolling in general, can be used as a tuning param-eter to balance the trade-off between computational work to perform, degree ofdata parallelism in tasks, and tasking and synchronization overhead. For exam-ple, Thoman et al. [53] describe a combined compiler and runtime approach foradaptive granularity control in recursive CPU task-parallel programs.
5.5 Techniques for Task and Data Granularity Adaptation on GPU
The task granularity in dynamically scheduled task-based computations on aheterogeneous system can have a major impact on overall performance. Eachtask executing on an accelerator typically contains just one kernel call, or possi-bly several kernel calls that execute in sequence on the same accelerator unit. Forthe application considered in this chapter, tasks/kernels of size 50 × 50 turn outto be too fine-grained for GPU execution in practice, as most of the GPU’s com-putation capacity remains unused and the task management overhead (which isfor StarPU in the order of several dozen microseconds) becomes large in relationto the task’s work.
A number of task-based programming environments allow to control taskgranularity already at task creation, in particular for CPU-based tasks by intro-ducing conditions for recursive task creation, as described in Sect. 5.4.
Moreover, a number of static and dynamic techniques exist for adapting taskgranularity in a GPU execution context. In the remainder of this section wereview a number of such granularity adaptation techniques specifically for GPUtask execution, which could be leveraged in future extensions of this work.
– Overpartitioning of a data-parallel computation into more than one task/ker-nel call leads to finer granularity, which can enable automated hybrid CPU-GPU computing but also incurs increased runtime overhead for the manage-ment of the additional tasks.

Parallelization of Hierarchical Matrix Algorithms 59
– Kernel fusion is an optimization for accelerator computations that tries tomerge fine-grained tasks/kernel calls into fewer, coarser-grained ones.
– Persistent kernels on GPU are applicable to scenarios with many subsequentkernel calls of one or few statically known types, and can significantly reducethe accumulated kernel latencies for small GPU tasks.
– Operand transfer fusion is a granularity coarsening optimization for the com-munication of kernel operand data between main memory and acceleratormemory.
Overpartitioning. Task-based computations can be generated from higher-levelparallel programming models. As an example, we could consider the skeletonprogramming framework SkePU (www.ida.liu.se/labs/pelab/skepu) for GPU-based systems [17,18]. SkePU provides for each supported skeleton (map, reduce,stencil etc.) multiple back-ends (target-specific implementations), e.g. for single-threaded CPU execution, multithreaded CPU execution using OpenMP, andGPU execution in CUDA or OpenCL. Moreover, SkePU also provides a back-endthat generates tasks for the StarPU runtime system [14]. From a single skeletoncall, a user-defined number of asynchronously executed tasks can be generated,by partitioning the work and thus converting some of the skeleton call’s dataparallelism into task parallelism. Such “overpartitioning” automatically exploitshybrid CPU-GPU computing via StarPU’s dynamic heterogeneous task sched-uler [32] at the expense of increased runtime overhead for the management ofthe additional tasks.
Kernel Fusion. Kernel fusion is an agglomeration optimization for acceleratorcomputations that merges multiple kernels resp. kernel calls into a single one.The purpose of this coarsening of the granularity of accelerator usage is to eitherimprove data locality, or to reduce kernel startup overhead, or to improve theoverall throughput by combining memory-bound with arithmetics-bound ker-nels. Kernel fusion is a special case of the classical loop fusion transformation,namely, for the case of parallel loops executing on an accelerator with manyparallel hardware threads, such as a GPU.
Kernel fusion can be done in two different ways: parallel fusion (by co-scheduling of independent kernels) or serial fusion (by serialization of possiblydependent kernels), see also Fig. 9 for illustration.
Serial fusion is particularly effective if it can internalize inter-kernel flow ofbulk operand data (i.e., intermediate (sub-)vectors or -matrices) between pro-ducer and consumer kernels, and moves the time points of production and con-sumption of each such data element much closer to each other. Hence, thesedata elements can now be stored and reused in registers or fast on-chip memory,which reduces the amount of slow off-chip memory accesses and thus increasesthe arithmetic intensity of the code.
In contrast, parallel fusion does not change the arithmetic intensity of thecode, but eliminates kernel startup time overhead, improves thread occupancyand thus utilization of the accelerator especially for kernels with relatively smalloperands. Moreover, it can lead to overall improved throughput by co-scheduling
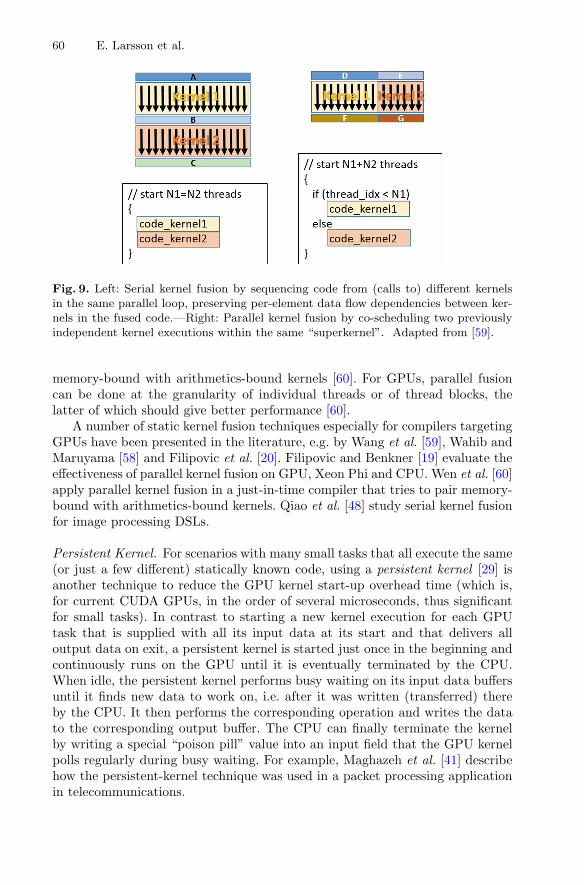
60 E. Larsson et al.
Fig. 9. Left: Serial kernel fusion by sequencing code from (calls to) different kernelsin the same parallel loop, preserving per-element data flow dependencies between ker-nels in the fused code.—Right: Parallel kernel fusion by co-scheduling two previouslyindependent kernel executions within the same “superkernel”. Adapted from [59].
memory-bound with arithmetics-bound kernels [60]. For GPUs, parallel fusioncan be done at the granularity of individual threads or of thread blocks, thelatter of which should give better performance [60].
A number of static kernel fusion techniques especially for compilers targetingGPUs have been presented in the literature, e.g. by Wang et al. [59], Wahib andMaruyama [58] and Filipovic et al. [20]. Filipovic and Benkner [19] evaluate theeffectiveness of parallel kernel fusion on GPU, Xeon Phi and CPU. Wen et al. [60]apply parallel kernel fusion in a just-in-time compiler that tries to pair memory-bound with arithmetics-bound kernels. Qiao et al. [48] study serial kernel fusionfor image processing DSLs.
Persistent Kernel. For scenarios with many small tasks that all execute the same(or just a few different) statically known code, using a persistent kernel [29] isanother technique to reduce the GPU kernel start-up overhead time (which is,for current CUDA GPUs, in the order of several microseconds, thus significantfor small tasks). In contrast to starting a new kernel execution for each GPUtask that is supplied with all its input data at its start and that delivers alloutput data on exit, a persistent kernel is started just once in the beginning andcontinuously runs on the GPU until it is eventually terminated by the CPU.When idle, the persistent kernel performs busy waiting on its input data buffersuntil it finds new data to work on, i.e. after it was written (transferred) thereby the CPU. It then performs the corresponding operation and writes the datato the corresponding output buffer. The CPU can finally terminate the kernelby writing a special “poison pill” value into an input field that the GPU kernelpolls regularly during busy waiting. For example, Maghazeh et al. [41] describehow the persistent-kernel technique was used in a packet processing applicationin telecommunications.

Parallelization of Hierarchical Matrix Algorithms 61
Operand Transfer Fusion. Heterogeneous systems that expose a (physically)distributed memory architecture to the low-level programmer require the explicitmemory allocation and transfer of not yet uploaded kernel operand data frommain memory to accelerator memory before kernel execution and the transferof the kernel’s output operands back to main memory (or possibly to otheraccelerator memories) if needed there for subsequent computations. AcceleratorAPIs provide functions for memory allocation and transfer of operands, such ascudaMalloc and cudaMemcpy, respectively.
The data transfer time for a bulk operand (e.g., a (sub-)vector or -matrix) ofN elements can generally be modeled by a linear cost function tcomm = α+βN ,which is characterized by the transfer startup time α and the word transfer timeβ. On PCIe 3.0-attached GPUs the startup time α can be in an order of about10μs, with α/β ≈ 104 floats [36]. For tasks with small operands, the transferstartup time is thus a none-negligible overhead. Likewise, there is a significantoverhead for device memory allocation where required.
A key observation is that multiple operands that can be stored adjacentlyin both main memory and accelerator memory can be transferred in a single,larger message, thus saving transfer startups compared to separate transfers foreach operand. Likewise, device memory can be allocated for such operands by asingle call to cudaMalloc.
Li and Kessler [36] present a dynamic optimization based on lazy allocation.They replace the standard API functions for lazy execution operand memoryallocation and operand transfer by lazy-execution variants that defer their effectuntil kernel call execution time. At the kernel call, the operands and their (non-)availability in accelerator memory (hence the need for allocation and transfer)are definitely known, even in cases where static analysis could not resolve thisinformation, e.g. due to variable aliasing or statically unknown task mapping.Then, operands to be transferred together will be allocated consecutively inmemory if possible. This greedy optimization applies to one kernel call at atime.
5.6 High-Level Macro-dataflow Coordination
A common characteristic of the task-parallel programming frameworks discussedso far is that they, despite all abstractions from concrete hardware, do requirea considerable expertise in parallel programming to get things right and evenmore such expertise to get things efficient. One reason is that they intertwinetwo different aspects of program execution: algorithmic behaviour, i.e., what isto be computed, and organization of task-parallel execution, i.e., how a compu-tation is performed on multiple execution units, including the necessary problemdecomposition, communication and synchronization requirements.
The aim of coordination programming is precisely to separate application-centric code from organization-centric code. The term goes back to the sem-inal work of Gelernter and Carriero [22], but has seen many variations since.For example, S-Net [27] is a declarative coordination language whose designthoroughly avoids the intertwining of computational and organizational aspects.

62 E. Larsson et al.
S-Net achieves a near complete separation of the concern of writing sequentialapplication building blocks (i.e., application engineering) from the concern ofcomposing these building blocks to form a parallel application (i.e., concurrencyengineering).
S-Net defines the coordination behaviour of networks of asynchronous, state-less components and their orderly interconnection via typed streams. We delib-erately restrict S-Net to coordination aspects and leave the specification of theconcrete operational behaviour of basic components, named boxes, to conven-tional programming languages.
An S-Net box is connected to the outside world by two typed streams, asingle input stream and a single output stream. The operational behaviour of abox is characterized by a stream transformer function that maps a single dataitem from the input stream to a (possibly empty) stream of data items on theoutput stream. S-Net effectively promotes functions implemented in a standardprogramming language into asynchronously executed stream-processing compo-nents.
In order to facilitate dynamic reconfiguration of networks, a box has no inter-nal state, and any access to external state (e.g. file system, environment vari-ables, etc.) is confined to using the streaming network. This allows us to cheaplymigrate boxes between computing resources and even having individual boxesprocess multiple data items concurrently. Boxes execute fully asynchronously: assoon as data is available on the input stream, a box may start computing andproducing data on the output stream. Boxes usually represent non-trivial unitsof computation instead of basic operations as in the original data-flow approach.Hence, S-Net effectively implements a macro data flow model.
It is a distinguishing feature of S-Net that it neither introduces streams asexplicit objects nor that it defines network connectivity through explicit wiring.Instead, it uses algebraic formulae to describe streaming networks. The restric-tion of boxes to a single input and a single output stream (SISO) is essential forthis. S-Net provides five network combinators: serial and parallel composition,serial and parallel replication as well as feedback. Any combinator preserves theSISO property: any network, regardless of its complexity, again is a SISO entity.
To summarize, S-Net is an abstract notation to express concurrency in appli-cation programs in an abstract and intuitive way. It avoids the typical annoy-ances of machine-level concurrent programming. Instead, S-Net borrows theidea of streaming networks of asynchronous, stateless components, which segre-gates applications into their natural building blocks and exposes the data flowbetween them. We have developed a highly tuned run-time system customizedto the specific needs of S-Net [23]. In addition we have developed DistributedS-Net for cluster architectures [26].
S-Net is not at all confined to classical streaming applications as we havedemonstrated through a number of numerical application case studies [28,44,45].We have not yet implemented any of the methods for electromagnetic scatteringproblems described earlier in this paper, and, unfortunately, for the time beingwe lack the resources to do so. However, the closest matching algorithm we do

Parallelization of Hierarchical Matrix Algorithms 63
have implemented with S-Net is Tiled Cholesky Factorization, another hierar-chical matrix algorithm [10]. Here, S-Net compared very favourably against yetanother established task-parallel approach: Intel’s Concurrent Collections (CnC)[9,11,33]. In fact, S-Net outperformed CnC both with respect to code size andease of programming as well as performance and scalability [65].
An interesting question for future work is whether or not—or better to whatextent—we may be able to re-produce these positive results for the not dissimilaralgorithms discussed in this paper.
6 Summary and Conclusions
In this chapter, we have discussed the properties of hierarchical matrix algo-rithms arising in electromagnetic scattering problems, and how to parallelizethese problems on multicore, heterogeneous, and distributed hardware architec-tures.
Two different classes of algorithms were discussed in more detail, MLFMAand NESA algorithms. The main difference between these from a parallelizationperspective is that in the former, the work performed for groups at differentlevels varies significantly, while in the latter, the work size per group is uni-form. Because of this, a fine-grained parallelization of MLFMA needs to be moreintrusive, since the work in coarse level groups needs to be split over threads/processes.
Both the data structures and the interaction patterns in the hierarchicalmatrix algorithms are irregular, which is why we suggest to use a parallel pro-gramming model that supports asynchronous execution. A pilot implementa-tion using a task parallel programming model for shared memory architec-tures showed promising results regarding the potential to mix the computationalphases during the execution and regarding the resulting utilization of the hard-ware. A challenging aspect was the relatively small work sizes for individualgroups. We discuss different approaches to managing task granularity that couldbe implemented in future projects.
When working with industrial, or academic, legacy codes, several potentiallyconflicting interests influence the choices. To change which algorithm is usedis typically a major investment, since it is unlikely that this part is well sepa-rated from the rest of the code. If the software was started from scratch today,perhaps other algorithmic choices would be made in light of the current prevail-ing hardware architectures. To achieve the best possible performance probablyrequires some refactoring of the code, while minimizing the changes to the exist-ing code is relevant both from a cost perspective and a maintainability perspec-tive. Finally, when using high-level programming models which build on someparticular implementation of a run-time system, external dependencies are intro-duced that complicate the administration of the software, and introduce a riskof future incompatibility or discontinuation.
In this chapter we have tried to shed light on some of these choices, to supportfurther work in the area.

64 E. Larsson et al.
References
1. Agullo, E., Aumage, O., Bramas, B., Coulaud, O., Pitoiset, S.: Bridging the gapbetween OpenMP and task-based runtime systems for the fast multipole method.IEEE Trans. Parallel Distrib. Syst. 28(10), 2794–2807 (2017). https://doi.org/10.1109/TPDS.2017.2697857
2. Agullo, E., Bramas, B., Coulaud, O., Darve, E., Messner, M., Takahashi, T.: Task-based FMM for multicore architectures. SIAM J. Sci. Comput. 36(1), C66–C93(2014). https://doi.org/10.1137/130915662
3. Anderson, E., et al.: LAPACK Users’ Guide, 3rd edn. Society for Industrial andApplied Mathematics, Philadelphia (1999)
4. Atkinson, P., McIntosh-Smith, S.: On the performance of parallel tasking runtimesfor an irregular fast multipole method application. In: de Supinski, B.R., Olivier,S.L., Terboven, C., Chapman, B.M., Muller, M.S. (eds.) IWOMP 2017. LNCS,vol. 10468, pp. 92–106. Springer, Cham (2017). https://doi.org/10.1007/978-3-319-65578-9 7
5. Augonnet, C., Thibault, S., Namyst, R., Wacrenier, P.: StarPU: a unified platformfor task scheduling on heterogeneous multicore architectures. Concurr. Comput.:Pract. Exper. 23(2), 187–198 (2011). https://doi.org/10.1002/cpe.1631
6. Benson, A.R., Poulson, J., Tran, K., Engquist, B., Ying, L.: A parallel directionalfast multipole method. SIAM J. Sci. Comput. 36(4), C335–C352 (2014). https://doi.org/10.1137/130945569
7. Bordage, C.: Parallelization on heterogeneous multicore and multi-GPU systemsof the fast multipole method for the Helmholtz equation using a runtime system.In: Omatu, S., Nguyen, T. (eds.) Proceedings of the Sixth International Confer-ence on Advanced Engineering Computing and Applications in Sciences, pp. 90–95. International Academy, Research, and Industry Association (IARIA), CurranAssociates Inc., Red Hook (2012)
8. Bosilca, G., Bouteiller, A., Danalis, A., Faverge, M., Herault, T., Dongarra, J.J.:PaRSEC: exploiting heterogeneity to enhance scalability. Comput. Sci. Eng. 15(6),36–45 (2013)
9. Budimlic, Z., Chandramowlishwaran, A., Knobe, K., Lowney, G., Sarkar, V., Treg-giari, L.: Multicore implementations of the Concurrent Collections programmingmodel. In: 14th Workshop on Compilers for Parallel Computing, Zurich, Switzer-land (2009)
10. Buttari, A., Langou, J., Kurzak, J., Dongarra, J.: A class of parallel tiled lin-ear algebra algorithms for multicore architectures. Parallel Comput. 35(1), 38–53(2009)
11. Chandramowlishwaran, A., Knobe, K., Vuduc, R.: Performance evaluation of Con-current Collections on high-performance multicore computing systems. In: 24thIEEE International Parallel and Distributed Processing Symposium (IPDPS 2010),Atlanta, USA, pp. 1–12. IEEE, April 2010
12. Cruz, F.A., Knepley, M.G., Barba, L.A.: PetFMM–a dynamically load-balancingparallel fast multipole library. Int. J. Numer. Methods Eng. 85(4), 403–428 (2011).https://doi.org/10.1002/nme.2972
13. Darve, E., Cecka, C., Takahashi, T.: The fast multipole method on parallel clusters,multicore processors, and graphics processing units. Comptes Rendus Mecanique339(2), 185–193 (2011). https://doi.org/10.1016/j.crme.2010.12.005

Parallelization of Hierarchical Matrix Algorithms 65
14. Dastgeer, U., Kessler, C., Thibault, S.: Flexible runtime support for efficient skele-ton programming on hybrid systems. In: Proceedings of the ParCo-2011 Inter-national Conference on Parallel Computing, Ghent, Belgium, September 2011.Advances in Parallel Computing, vol. 22, pp. 159–166. IOS press (2012). https://doi.org/10.3233/978-1-61499-041-3-159
15. Duran, A., et al.: OmpSs: a proposal for programming heterogeneous multi-corearchitectures. Parallel Proces. Lett. 21(02), 173–193 (2011)
16. Efield®. http://www.efieldsolutions.com/17. Enmyren, J., Kessler, C.: SkePU: a multi-backend skeleton programming library
for multi-GPU systems. In: Proceedings of the 4th Internatioanl Workshop onHigh-Level Parallel Programming and Applications (HLPP-2010). ACM, Septem-ber 2010. https://doi.org/10.1145/1863482.1863487
18. Ernstsson, A., Li, L., Kessler, C.: SkePU 2: flexible and type-safe skeleton program-ming for heterogeneous parallel systems. Int. J. Parallel Program. 46(1) (2018).https://doi.org/10.1007/s10766-017-0490-5
19. Filipovic, J., Benkner, S.: OpenCL kernel fusion for GPU, Xeon Phi and CPU.In: Proceedings of the 27th International Symposium on Computer Architectureand High-Performance Computing (SBAC-PAD 2015), pp. 98–105. IEEE (2015).https://doi.org/10.1109/SAC-PAD.2015.29
20. Filipovic, J., Madzin, M., Fousek, J., Matyska, L.: Optimizing CUDA code by ker-nel fusion: application on BLAS. J. Supercomput. 71, 3934–3957 (2015). https://doi.org/10.1007/s11227-015-1483-z
21. Fukuda, K., Matsuda, M., Maruyama, N., Yokota, R., Taura, K., Matsuoka,S.: Tapas: an implicitly parallel programming framework for hierarchical n-bodyalgorithms. In: 2016 IEEE 22nd International Conference on Parallel and Dis-tributed Systems (ICPADS), pp. 1100–1109, December 2016. https://doi.org/10.1109/ICPADS.2016.0145
22. Gelernter, D., Carriero, N.: Coordination languages and their significance. Com-mun. ACM 35(2), 97–107 (1992)
23. Gijsbers, B., Grelck, C.: An efficient scalable runtime system for macro data flowprocessing using S-Net. Int. J. Parallel Program. 42(6), 988–1011 (2014). https://doi.org/10.1007/s10766-013-0271-8
24. Gouin, F.: Methodology for image processing algorithms mapping on massivelyparallel architectures. Technical report, MINES ParisTech (2018)
25. Gouin, F., Ancourt, C., Guettier, C.: An up to date mapping methodology forGPUs. In: 20th Workshop on Compilers for Parallel Computing (CPC 2018),Dublin, Ireland, April 2018. https://hal-mines-paristech.archives-ouvertes.fr/hal-01759238
26. Grelck, C., Julku, J., Penczek, F.: Distributed S-Net: cluster and grid comput-ing without the hassle. In: 12th IEEE/ACM International Conference on Cluster,Cloud and Grid Computing (CCGrid 2012), Ottawa, Canada. IEEE ComputerSociety (2012). https://doi.org/10.1109/CCGrid.2012.140
27. Grelck, C., Scholz, S., Shafarenko, A.: Asynchronous stream processing with S-Net.Int. J. Parallel Program. 38(1), 38–67 (2010). https://doi.org/10.1007/s10766-009-0121-x
28. Grelck, C., Scholz, S.B., Shafarenko, A.: Coordinating data parallel SAC programswith S-Net. In: Proceedings of the 21st IEEE International Parallel and DistributedProcessing Symposium (IPDPS 2007), Long Beach, California, USA. IEEE Com-puter Society Press, Los Alamitos (2007). https://doi.org/10.1109/IPDPS.2007.370408

66 E. Larsson et al.
29. Gupta, K., Stuart, J.A., Owens, J.D.: A study of persistent threads style GPUprogramming for GPGPU workloads. In: Innovative Parallel Computing - Foun-dations and Applications of GPU, Manycore, and Heterogeneous Systems (INPAR2012), pp. 1–14. IEEE, May 2012. https://doi.org/10.1109/InPar.2012.6339596
30. Gurel, L., Ergul, O.: Hierarchical parallelization of the multilevel fast multipolealgorithm (MLFMA). Proc. IEEE 101(2), 332–341 (2013). https://doi.org/10.1109/JPROC.2012.2222331
31. Holm, M., Engblom, S., Goude, A., Holmgren, S.: Dynamic autotuning of adaptivefast multipole methods on hybrid multicore CPU and GPU systems. SIAM J. Sci.Comput. 36(4) (2014). https://doi.org/10.1137/130943595
32. Kessler, C., et al.: Programmability and performance portability aspects of hetero-geneous multi-/manycore systems. In: Proceedings of the DATE-2012 Conferenceon Design, Automation and Test in Europe, pp. 1403–1408. IEEE, March 2012.https://doi.org/10.1109/DATE.2012.6176582
33. Knobe, K.: Ease of use with Concurrent Collections (CnC). In: USENIX Workshopon Hot Topics in Parallelism (HotPar 2009), Berkeley USA (2009)
34. Kurzak, J., Pettitt, B.M.: Massively parallel implementation of a fast multipolemethod for distributed memory machines. J. Parallel Distrib. Comput. 65(7), 870–881 (2005). https://doi.org/10.1016/j.jpdc.2005.02.001
35. Lashuk, I., et al.: A massively parallel adaptive fast multipole method on hetero-geneous architectures. Commun. ACM 55(5), 101–109 (2012). https://doi.org/10.1145/2160718.2160740
36. Li, L., Kessler, C.: Lazy allocation and transfer fusion optimization for GPU-basedheterogeneous systems. In: Proceedings of the Euromicro PDP-2018 InternationalConference on Parallel, Distributed, and Network-Based Processing, pp. 311–315.IEEE, March 2018. https://doi.org/10.1109/PDP2018.2018.00054
37. Li, M., Francavilla, M., Vipiana, F., Vecchi, G., Chen, R.: Nested equivalent sourceapproximation for the modeling of multiscale structures. IEEE Trans. AntennasPropag. 62(7), 3664–3678 (2014)
38. Li, M., Francavilla, M., Vipiana, F., Vecchi, G., Fan, Z., Chen, R.: A doubly hierar-chical MoM for high-fidelity modeling of multiscale structures. IEEE Trans. Elec-tromagn. Compat. 56(5), 1103–1111 (2014)
39. Li, M., Francavilla, M.A., Chen, R., Vecchi, G.: Wideband fast kernel-independentmodeling of large multiscale structures via nested equivalent source approximation.IEEE Trans. Antennas Propag. 63(5), 2122–2134 (2015). https://doi.org/10.1109/TAP.2015.2402297
40. Ltaief, H., Yokota, R.: Data-driven execution of fast multipole methods. Concurr.Comput.: Pract. Exp. 26(11), 1935–1946 (2014). https://doi.org/10.1002/cpe.3132
41. Maghazeh, A., Bordoloi, U.D., Dastgeer, U., Andrei, A., Eles, P., Peng, Z.: Latency-aware packet processing on CPU-GPU heterogeneous systems. In: Proceedings ofthe Design Automation Conference (DAC), pp. 41:1–41:6. ACM (2017). https://doi.org/10.1145/3061639.3062269
42. Mautz, J.R., Harrington, R.F.: Electromagnetic scattering from homogeneousmaterial body of revolution. Arch. Electron. Ubertragungstech 33, 71–80 (1979)
43. Nilsson, M.: Fast numerical techniques for electromagnetic problems in frequencydomain. Ph.D. thesis, Division of Scientific Computing, Department of InformationTechnology, Uppsala University (2003)
44. Penczek, F., Cheng, W., Grelck, C., Kirner, R., Scheuermann, B., Shafarenko, A.: Adata-flow based coordination approach to concurrent software engineering. In: 2ndWorkshop on Data-Flow Execution Models for Extreme Scale Computing (DFM2012), Minneapolis, USA. IEEE (2012). https://doi.org/10.1109/DFM.2012.14

Parallelization of Hierarchical Matrix Algorithms 67
45. Penczek, F., et al.: Parallel signal processing with S-Net. Procedia Comput. Sci.1(1), 2079–2088 (2010). https://doi.org/10.1016/j.procs.2010.04.233. http://www.sciencedirect.com/science/article/B9865-506HM1Y-88/2/87fcf1cee7899f0eeaadc90bd0d56cd3, iCCS 2010
46. Perez, J.M., Badia, R.M., Labarta, J.: A dependency-aware task-based program-ming environment for multi-core architectures. In: Proceedings of the 2008 IEEEInternational Conference on Cluster Computing, Tsukuba, Japan, 29 September–1 October 2008, pp. 142–151 (2008). https://doi.org/10.1109/CLUSTR.2008.4663765
47. Puma-EM. https://sourceforge.net/projects/puma-em/48. Qiao, B., Reiche, O., Hannig, F., Teich, J.: Automatic kernel fusion for image
processing DSLs. In: Proceedings of the 21th International Workshop on Softwareand Compilers for Embedded Systems (SCOPES 2018). ACM, May 2018. https://doi.org/10.1145/3207719.3207723
49. Rao, S., Wilton, D., Glisson, A.: Electromagnetic scattering by surfaces of arbitraryshape. IEEE Trans. Antennas Propag. 30(3), 409–418 (1982)
50. Seo, S.M., Lee, J.F.: A fast IE-FFT algorithm for solving PEC scattering problems.IEEE Trans. Magn. 41(5), 1476–1479 (2005)
51. Song, J., Lu, C.C., Chew, W.C.: Multilevel fast multipole algorithm for electromag-netic scattering by large complex objects. IEEE Trans. Antennas Propag. 45(10),1488–1493 (1997)
52. Thibault, S.: On Runtime Systems for Task-based Programming on HeterogeneousPlatforms. Habilitation a diriger des recherches, L’Universite Bordeaux (2018)
53. Thoman, P., Jordan, H., Fahringer, T.: Adaptive granularity control in task parallelprograms using multiversioning. In: Wolf, F., Mohr, B., an Mey, D. (eds.) Euro-Par2013. LNCS, vol. 8097, pp. 164–177. Springer, Heidelberg (2013). https://doi.org/10.1007/978-3-642-40047-6 19
54. Tillenius, M.: SuperGlue: a shared memory framework using data versioning fordependency-aware task-based parallelization. SIAM J. Sci. Comput. 37(6) (2015).https://doi.org/10.1137/140989716
55. Tillenius, M., Larsson, E., Badia, R.M., Martorell, X.: Resource-aware task schedul-ing. ACM Trans. Embedded Comput. Syst. 14(1), 5:1–5:25 (2015). https://doi.org/10.1145/2638554
56. Velamparambil, S., Chew, W.C.: Analysis and performance of a distributed mem-ory multilevel fast multipole algorithm. IEEE Trans. Antennas Propag. 53(8),2719–2727 (2005). https://doi.org/10.1109/TAP.2005.851859
57. Vipiana, F., Francavilla, M., Vecchi, G.: EFIE modeling of high-definition multi-scale structures. IEEE Trans. Antennas Propag. 58(7), 2362–2374 (2010)
58. Wahib, M., Maruyama, N.: Scalable kernel fusion for memory-bound GPU applica-tions. In: Proceedings of the International Conference for High-Performance Com-puting, Networking, Storage and Analysis (SC 2014), pp. 191–202. IEEE (2014).https://doi.org/10.1109/SC.2014.21
59. Wang, G., Lin, Y., Yi, W.: Kernel fusion: an effective method for better powerefficiency on multithreaded GPU. In: Proceedings of the IEEE/ACM InternationalConference on Green Computing and Communications and International Confer-ence on Cyber, Physical and Social Computing, pp. 344–350 (2010). https://doi.org/10.1109/GreenCom-CPSCom.2010.102
60. Wen, Y., O’Boyle, M.F., Fensch, C.: MaxPair: enhance OpenCL concurrent kernelexecution by weighted maximum matching. In: Proceedings of the GPGPU-11.ACM (2018). https://doi.org/10.1145/3180270.3180272

68 E. Larsson et al.
61. YarKhan, A., Kurzak, J., Dongarra, J.: Quark users’ guide: queueing and runtimefor kernels. Technical report. ICL-UT-11-02 (2011)
62. Zafari, A.: TaskUniVerse: a task-based unified interface for versatile parallel exe-cution. In: Wyrzykowski, R., Dongarra, J., Deelman, E., Karczewski, K. (eds.)PPAM 2017. LNCS, vol. 10777, pp. 169–184. Springer, Cham (2018). https://doi.org/10.1007/978-3-319-78024-5 16
63. Zafari, A., et al.: Task parallel implementation of a solver for electromagnetic scat-tering problems. CoRR abs/1801.03589 (2018). http://arxiv.org/abs/1801.03589
64. Zafari, A., Larsson, E., Tillenius, M.: DuctTeip: an efficient programming modelfor distributed task-based parallel computing (2019, submitted)
65. Zaichenkov, P., Gijsbers, B., Grelck, C., Tveretina, O., Shafarenko, A.: The costand benefits of coordination programming: two case studies in Concurrent Collec-tions (CnC) and S-Net. Parallel Process. Lett. 26(3) (2016). https://doi.org/10.1142/S0129626416500110
66. Zhang, B.: Asynchronous task scheduling of the fast multipole method using var-ious runtime systems. In: 2014 Fourth Workshop on Data-Flow Execution Mod-els for Extreme Scale Computing, pp. 9–16 (2014). https://doi.org/10.1109/DFM.2014.14
67. Zhao, K., Vouvakis, M.N., Lee, J.F.: The adaptive cross approximation algorithmfor accelerated method of moments computations of EMC problems. IEEE Trans.Electromagn. Compat. 47(4), 763–773 (2005)
Open Access This chapter is licensed under the terms of the Creative CommonsAttribution 4.0 International License (http://creativecommons.org/licenses/by/4.0/),which permits use, sharing, adaptation, distribution and reproduction in any mediumor format, as long as you give appropriate credit to the original author(s) and thesource, provide a link to the Creative Commons license and indicate if changes weremade.
The images or other third party material in this chapter are included in the chapter’sCreative Commons license, unless indicated otherwise in a credit line to the material. Ifmaterial is not included in the chapter’s Creative Commons license and your intendeduse is not permitted by statutory regulation or exceeds the permitted use, you willneed to obtain permission directly from the copyright holder.

Tail Distribution and Extreme QuantileEstimation Using Non-parametric
Approaches
Imen Rached1(B) and Elisabeth Larsson2
1 Allianstic Research Laboratory, EFREI Paris, Ecole d’Ingenieurs GeneralisteInformatique et Technologies du Numerique,
30–32 Avenue de la Republique, 94800 Villejuif, [email protected]
2 Scientific Computing, Department of Information Technology, Uppsala University,Box 337, 751 05 Uppsala, [email protected]
Abstract. Estimation of tail distributions and extreme quantiles isimportant in areas such as risk management in finance and insurancein relation to extreme or catastrophic events. The main difficulty fromthe statistical perspective is that the available data to base the esti-mates on is very sparse, which calls for tailored estimation methods. Inthis chapter, we provide a survey of currently used parametric and non-parametric methods, and provide some perspectives on how to moveforward with non-parametric kernel-based estimation.
Keywords: Risk measures · Extreme value theory ·Kernel estimation · Bandwidth selection
1 Introduction
This chapter presents a position survey on the overall objectives and specificchallenges encompassing the state of the art in tail distribution and extremequantile estimation of currently used parametric and non-parametric approachesand their application to Financial Risk Measurement. What is envisioned, isan enhanced non-parametric estimation method based on the Extreme ValueTheory approach. The compounding perspectives of current challenges areaddressed, like the threshold level of excess data to be chosen for extreme valuesand the bandwidth selection from a bias reduction perspective. The applicationof the kernel estimation approach and the use of Expected Shortfall as a coher-ent risk measure instead of the Value at Risk are presented. The extension tomultivariate data is addressed and its challenges identified.
Overview of the Following Sections. In the following sections, Financial risk mea-sures are presented in Sect. 2. Section 3, covers Extreme Value Theory, Sect. 4,c© The Author(s) 2019J. Ko�lodziej and H. Gonzalez-Velez (Eds.): cHiPSet, LNCS 11400, pp. 69–87, 2019.https://doi.org/10.1007/978-3-030-16272-6_3

70 I. Rached and E. Larsson
Parametric estimation and Semi-parametric estimation methods, Sect. 5, Non-Parametric estimation methods and Sect. 6, the perspectives identified by theaddressed challenges when estimating the presented financial risk measures.
2 Financial Risk Measures
The Long Term Capital Management collapse and the 1998 Russian debt crisis,the Latin American and Asian currency crises and more recently, the U.S. mort-gage credit market turmoil, followed by the bankruptcy of Lehman Brothers andthe world’s biggest-ever trading loss at Societe Generale are some examples offinancial disasters during the last twenty years. In response to the serious finan-cial crises, like the recent global financial crisis (2007–2008), regulators havebecome more concerned about the protection of financial institutions againstcatastrophic market risks. We recall that market risk is the risk that the value ofan investment will decrease due to movements in market factors. The difficultyof modelling these rare but extreme events has been greatly reduced by recentadvances in Extreme Value Theory (EVT). Value at Risk (VaR) and the relatedconcept of Expected Shortfall (ES) have been the primary tools for measuringrisk exposure in the financial services industry for over two decades. Additionalliterature can be found in [39] for Quantitative Risk Management and in [42] orin [25] for the application of EVT in insurance, finance and other fields.
2.1 Value at Risk
Consider the loss X of a portfolio over a given time period δ, then VaR is a riskstatistic that measures the risk of holding the portfolio for the time period δ.Assume that X has a cumulative distribution function (cdf), FX , then we defineVaR at level α ∈ (0, 1) as
VaRδα(X) = inf{x ∈ R : P (X > x) ≤ 1 − α} = inf{x ∈ R, FX(x) ≥ α} = F ←
X (α), (1)
F←X is the generalized inverse of the cdf FX . Typical values of α are 0.95 and 0.99,
while δ usually is 1 day or 10 days. Value-at-Risk (VaR) has become a standardmeasure for risk management and is also recommended in the Basel II accord.For an overview on VaR in a more economic setting we refer to [37] and [23].Despite its widespread use, VaR has received criticism for failing to distinguishbetween light and heavy losses beyond the VaR. Additionally, the traditionalVaR method has been criticized for violating the requirement of sub-additivity[4]. Artzner et al. analysed risk measures and stated a set of properties/axiomsthat should be desirable for any risk measure. The four axioms they stated are:
– Monotonicity: Higher losses mean higher risk.– Translation Equivariance: Increasing (or decreasing) the loss increases
(decreases) the risk by the same amount.– Subadditivity: Diversification decreases risk.– Positive Homogeneity: Doubling the portfolio size doubles the risk.

Tail Distribution and Extreme Quantile Estimation 71
Any risk measure which satisfies these axioms is said to be coherent. A relatedconcept to VaR, which accounts for the tail mass is the conditional tail expecta-tion (CVaR), or Expected Shortfall (ES). ES is the average loss conditional onthe VaR being exceeded and gives risk managers additional valuable informationabout the tail risk of the distribution. Due to its usefulness as a risk measure,in 2013 the Basel Committee on Bank Supervision has even proposed replacingVaR with ES to measure market risk exposure.
2.2 Conditional Value at Risk or Expected Shortfall
CVaRα(X) := E[X|X ≥ VaRα(X)] (2)
Acerbi and Tasche proved in [1] that CVaR satisfies the above axioms and istherefore a coherent risk measure.
Conditional Value-at-Risk can be derived from VaR in the case of a continu-ous random variable and another possibility to calculate CVaR is to use Acerbi’sIntegral Formula:
CVaRα(X) =1
1 − α
∫ 1
α
VaRβ(X)dβ (3)
Estimating ES from the empirical distribution is generally more difficult thanestimating VaR due to the scarcity of observations in the tail. As in most riskapplications, we do not need to focus on the entire distribution. Extreme valuetheory is then a practical and useful tool for modeling and quantifying risk.Value at Risk and Extreme value theory is covered well in most books on riskmanagement and VaR in particular (also ES with much less extent), see forexample [33,37,39], and [22]. Vice versa, VaR is treated in some Extreme valuetheory literature, such as [26] and [17].
3 Extreme Value Theory: Two Main Approaches
Extreme value theory (EVT) is the theory of modelling and measuring eventswhich occur with very small probability: More precisely, having an X1, ...,Xn
sample of n random variables independently and identically following a distri-bution function F (·), we want to estimate the real xpn
defined by
xpn= F←(pn), with pn < 1/n. (4)
where pn is a known sequence and F←(u) = inf{x ∈ R, F (x) ≤ u}. F← is thegeneralized inverse of the survival function F (·) = 1−F (·). Note that xpn
is theorder quantile 1 − pn of the cumulative distribution function F .
A similar problem to the estimate of xpnis the estimate of “small probabili-
ties” pn or the estimation of the tail distribution. In other words, for a series offixed (cn) reals, we want to estimate the probability pn defined by
pn = P (X > cn), with cn > xn,n. (5)

72 I. Rached and E. Larsson
The main result of Extreme Value Theory states that the tails of all distri-butions fall into one of three categories, regardless of the overall shape of thedistribution. Two main approaches are used for implementing EVT in practice:Block maxima approach and Peaks Over Thresholds (POT).
3.1 Block Maxima Approach
The Fisher and Tippett [29] and Gnedenko [30] theorems are the fundamentalresults in EVT. The theorems state that the maximum of a sample of properlynormalized independent and identically distributed random variables convergesin distribution to one of the three possible distributions: the Weibull, Gumbelor the Frechet.
Theorem 1 (Fisher, Tippett, Gnedenko).Let X1, ...,Xn ∼i.i.d. F and X1,n ≤ ... ≤ Xn,n. If there exist two sequences an
and bn and a real γ such that
P
(Xn,n − an
bn≤ x
)−→ Hγ(x), (6)
when n −→ +∞, then
Hγ(x) ={
exp(−(1 + γx)−1/γ
)if γ �= 0, 1 + γx > 0.
exp(− exp(−x)) if γ = 0, x ∈ R.(7)
We say that F is in the domain of attraction of Hγ and denote this byF ∈ DA(Hγ). The distribution function Hγ(·) is called the Generalized ExtremeValue distribution (GEV).
This law depends only on the parameter called the tail index. The densityassociated is shown in Fig. 1 for different values of γ. According to the sign of γ,we define three areas of attraction:
−2 0 2 4 6 8 100
0.5
1
x
Hγ(x
)
Fig. 1. The GEV distribution for γ = −0.5 (solid line), γ = 0 (dashed line), andγ = 0.5 (dash-dot line).

Tail Distribution and Extreme Quantile Estimation 73
– If γ > 0, F ∈ DA (Frechet): This domain contains the laws for which thesurvival function decreases as a power function. Such tails are know as “fattails” or “heavy tails”. In this area of attraction, we find the laws of Pareto,Student, Cauchy, etc.
– If γ = 0, F ∈ DA (Gumbel): This domain groups laws for which the sur-vival function declines exponentially. This is the case of normal, gamma,log-normal, exponential, etc.
– if γ < 0, F ∈ DA (Weibull): This domain corresponds to thin tails where thedistribution has a finite endpoint. Examples in this class are the uniform andreverse Burr distributions.
The Weibull distribution clearly has a finite endpoint (s+(F ) = sup{x, F (x) <1}). This is usually the case of the distribution of mortality and insurance/re-insurance claims for example, see [20]. The Frechet tail is thicker than the Gum-bel’s. Yet, it is well known that the distributions of the return series in mostfinancial markets are heavy tailed (fat tails). The term “fat tails” can have sev-eral meanings, the most common being “extreme outcomes occur more frequentlythan predicted by the normal distribution”.
The block Maxima approach is based on the utilization of maximum or min-imum values of these observations within a certain sequence of constant length.For a sufficiently large number k of established blocks, the resulting peak val-ues of these k blocks of equal length can be used for estimation. The procedureis rather wasteful of data and a relatively large sample is needed for accurateestimate.
3.2 Peaks Over Threshold (POT) Approach
The POT (Peaks-Over-Threshold) approach consists of using the generalizedPareto distribution (GPD) to approximate the distribution of excesses over athreshold. This approach has been suggested originally by hydrologists. Thisapproach is generally preferred and forms the basis of our approach below. BothEVT approaches are equivalent by the Pickands-Balkema-de Haan theorem pre-sented in [5,40].
Theorem 2 (Pickands-Balkema-de Haan). For a large class of underlyingdistribution functions F ,
F ∈ DA(Hγ) ⇐⇒ supx∈[0, s+(F )[
|Fu(x) − Gγ, σ(u)(x)| u→s+(F )−→ 0, (8)
where s+(F ) = sup{x, F (x) < 1} is the end point of the distribution, Fu(x) =P(X − u ≤ x|X > u) is the distribution of excess, and Gγ, σ is the GeneralizedPareto Distribution (GPD) defined as
Gγ, σ(x) =
{1 − (1 +
γ
σx)−1/γ if γ �= 0, σ > 0,
1 − exp(−x/σ) if γ = 0, σ > 0.(9)

74 I. Rached and E. Larsson
This means that the conditional excess distribution function Fu, for u large, iswell approximated by a Generalized Pareto Distribution. Note that the tail indexγ is the same for both the GPD and GEV distributions. The tail shape parameterσ and the tail index are the fundamental parameters governing the extremebehavior of the distribution, and the effectiveness of EVT in forecasting dependsupon their reliable and accurate estimation. By incorporating information aboutthe tail through our estimates of γ and σ, we can obtain VaR and ES estimates,even beyond the reach of the empirical distribution.
4 Parametric and Semi-parametric Estimation Methods
The problem of estimating the tail index γ has been widely studied in the lit-erature. The most standard methods are of course the method of moments andmaximum likelihood. Unfortunately, there is no explicit form for the parameters,but numerical methods provide good estimates. More generally, the two commonapproaches to estimate the tail index are:
– Semi-parametric models (e.g., the Hill estimator).– Fully parametric models (e.g., the Generalized Pareto distribution or GPD).
4.1 Semi-parametric Estimation
The most known estimator for the tail index γ > 0 of fat tails distribution iswithout contest the Hill estimator [31]. The formal definition of fat tail distribu-tions comes from regular variation. The cumulative distribution is in the Frechetdomain if and only if as x → ∞, the tails are asymptotically Pareto-distributed:
F (x) ≈ 1 − Ax−τ , (10)
where A > 0 and τ = 1/γ. Based on this approximation, the Hill estimator iswritten according to the statistics order X1,n ≤ ... ≤ Xn,n as follows:
Hkn,n = 1/kn
kn∑j=1
lnXn−j+1,n − ln Xn−kn,n. (11)
where kn is a sequence so that 1 ≤ kn ≤ n. Other estimators of this indexhave have been proposed by Beirlant et al. [6,7] using a regression exponentialmodel to reduce the Hill estimator bias and by [28] that introduce a least squaresestimator. The use of a kernel in the Hill estimator has been studied by Csorgoet al. [18]. An effective estimator of the extreme value index has been proposedby Falk and Marohn in [27]. A more detailed list of the different works on theestimation of the index of extreme values is found in [19]. Note that the Hillestimator is sensitive to the choice of threshold u = Xn−kn,n (or the number ofexcess kn) and is only valid for fat-tailed data.

Tail Distribution and Extreme Quantile Estimation 75
4.2 Parametric Estimation
The principle of POT is to approximate the survival function of the excessdistribution by a GPD after estimating its parameters from the distributionof excess over a threshold u as explained in the following two steps:
– First step—Tail distribution estimationLet X1, ...,Xn follow a distribution F and let Y1, . . . , YNn
, (Yi = Xi − un) bethe exceedances over a chosen threshold un. The distribution of excess Fun
isgiven by:
Fun(y) = P (X − un ≤ y |X > un) (12)
and then, the distribution F , of the extreme observations, is given by:
F (un + y) = F (un) + Fun(y) × F (un) (13)
The distribution of excess Funis approximated by Gγ,σ(un) and the first
step consists in estimating the parameters of this last distribution using thesample (Y1, . . . , YNn
). The parameter estimations can be done using MLE.Different methods have been proposed to estimate the parameters of the GPD.Other estimation methods are presented in [26]. The Probability WeightedMoments (PWM) method proposed by Hosking and Wallis [32] for γ < 1/2was extended by Diebolt et al. [21] by a generalization of PWM estimatorsfor γ < 3/2, as for many applications, e.g., in insurance, distributions areknown to have a tail index larger than 1.
– Second step—Quantile estimation
In order to estimate the extreme quantile xp defined as
xpn: F (xpn
) = 1 − F (xpn) = pn, npn → 0. (14)
We estimate F (u) by its empirical counterpart Nu/n and we approximateFun
by the approximate Generalized Pareto Distribution GPD(γn, σn) inthe Eq. (1). Then, for the threshold u = Xn−k,n, the extreme quantile isestimated by
xpn,k = Xn−k,n + σn
(k
npn
)γn − 1
γn. (15)
The application of POT involves a number of challenges. The early stage ofdata analysis is very important in determining whether the data has the fat tailneeded to apply the EVT results. Also, the parameter estimates of the limit GPDdistributions depend on the number of extreme observations used. The choiceof a threshold should be large enough to satisfy the conditions to permit itsapplication (u tends towards infinity), while at the same time leaving sufficientobservations for the estimation. A high threshold would generate few excesses,thereby inflating the variance of our parameter estimates. Lowering the thresholdwould necessitate using samples that are no longer considered as being in thetails which would entail an increase in the bias.

76 I. Rached and E. Larsson
5 Non-parametric Estimation Methods
A main argument for using non-parametric estimation methods is that no spe-cific assumptions on the distribution of the data is made a priori. That is, modelspecification bias can be avoided. This is relevant when there is limited infor-mation about the ‘theoretical’ data distribution, when the data can potentiallycontain a mix of variables with different underlying distributions, or when nosuitable parametric model is available. In the context of extreme value distri-butions, the GPD and GEV distributions discussed in Sect. 3 are appropriateparametric models for the univariate case. However, for the multivariate casethere is no general parametric form.
We restrict the discussion here to one particular form of non-parametricestimation, kernel density estimation [44]. Classical kernel estimation performswell when the data is symmetric, but has problems when there is significantskewness [9,24,41].
A common way to deal with skewness is transformation kernel estimation[45], which we will discuss with some details below. The idea is to transform theskew data set into another variable that has a more symmetric distribution, andallows for efficient classical kernel estimation.
Another issue for kernel density estimation is boundary bias. This arisesbecause standard kernel estimates do not take knowledge of the domain ofthe data into account, and therefore the estimate does not reflect the actualbehaviour close to the boundaries of the domain. We will also review a few biascorrection techniques [34].
Even though kernel estimation is non-parametric with respect to the under-lying distribution, there is a parameter that needs to be decided. This is thebandwidth (scale) of the kernel function, which determines the smoothness ofthe density estimate. We consider techniques intended for constant bandwidth[35], and also take a brief look at variable bandwidth kernel estimation [36]. Inthe latter case, the bandwidth and the location is allowed to vary such that biascan be reduced compared with using fixed parameters.
Kernel density estimation can be applied to any type of application and data,but some examples where it is used for extreme value distributions are given in[8,9]. A non parametric method to estimate the VaR in extreme quantiles, basedon transformed kernel estimation (TKE) of the cdf of losses was proposed in [3].A kernel estimator of conditional ES is proposed in [13,14,43].
In the following subsections, we start by defining the classical kernel estima-tor, then we describe a selection of measures that are used for evaluating thequality of an estimate, and are needed, e.g, in the algorithms for bandwidth selec-tion. Finally, we go into the different subareas of kernel estimation mentionedabove in more detail.
5.1 Classical Kernel Estimation
Expressed in words, a classical kernel estimator approximates the probabilitydensity function associated with a data set through a sum of identical, symmetric

Tail Distribution and Extreme Quantile Estimation 77
kernel density functions that are centered at each data point. Then the sum isnormalized to have total probability mass one.
We formalize this in the following way: Let k(·) be a bounded and symmetricprobability distribution function (pdf), such as the normal distribution pdf orthe Epanechnikov pdf, which we refer to as the kernel function.
Given a sample of n independent and identically distributed observationsX1, . . . , Xn of a random variable X with pdf fX(x), the classical kernel estimatoris given by
fX(x) =1n
n∑i=1
kb(x − Xi), (16)
where kb(·) = 1b k( ·
b ) and b is the bandwidth. Similarly, the classical kernel esti-mator for the cumulative distribution function (cdf) is given by
FX(x) =1n
n∑i=1
Kb(x − Xi), (17)
where Kb(x) =∫ x
−∞ kb(t)dt. That is, K(·) is the cdf corresponding to the pdfk(·).
5.2 Selected Measures to Evaluate Kernel Estimates
A measure that we would like to minimize for the kernel estimate is the meanintegrated square error (MISE). This is expressed as
MISE(b) = E
[∫Ω
(fX(x) − fX(x)
)2
dx
], (18)
where Ω is the domain of support for fX(x), and the argument b is included toshow that minimizing MISE is one criterion for bandwidth selection. However,MISE can only be computed when the true density fX(x) is known. MISE canbe decomposed into two terms. The integrated square bias∫
Ω
(E
[fX(x)
]− fX(x)
)2
dx, (19)
and the integrated variance ∫Ω
Var[fX(x)
]dx. (20)
To understand these expressions, we first need to understand that fX is a randomvariable that changes with each sample realization. To illustrate what it means,we work through an example.
Example 1. Let X be uniformly distributed on Ω = [0, 1], and let k(·) be theGaussian kernel. Then
fX(x) ={
1, 0 ≤ x ≤ 10, otherwise. (21)

78 I. Rached and E. Larsson
For each kernel function centered at some data point y we have that
EX [kb(x − y)] =∫ 1
0
kb(x − y) · 1dy = Kb(x) − Kb(x − 1). (22)
If we apply that to the kernel estimator (16), we get the integrated square bias
∫ 1
0
(Kb(x) − Kb(x − 1) − 1)2 dx. (23)
By first using that Var(X) = E[X2] − E[X]2, we get the following expression forthe integrated variance
∫ 1
0
(∫ 1
0
kb(x − y)2 · 1dy − (Kb(x) − Kb(x − 1))2)
dx. (24)
The integrals are evaluated for the Gaussian kernel, and the results are shownin Fig. 2. The bias, which is largest at the boundaries, is minimized when thebandwidth is very large, but a large bandwidth also leads to a large variance.Hence, MISE is minimized by a bandwidth that provides a trade-off betweenbias and variance.
0 0.5 10
0.1
0.2
0.3
0.4
x
Squ
are
bias
0 0.5 10
0.2
0.4
0.6
0.8
x
Var
ianc
e
0.3 0.6 0.90
0.2
0.4
0.6
b
MIS
E
Fig. 2. The square bias (left) and the variance (middle) as a function of x for b =0.3, 0.4, 0.5, 0.6. The curve for b = 0.3 is shown with a dashed line in both cases. MISE(right) is shown as a function of b (solid line) together with the integrated square bias(dashed line) and the integrated variance (dash-dot line).
To simplify the analysis, MISE is often replaced with the asymptotic MISEapproximation (AMISE). This holds under certain conditions involving the sam-ple size and the bandwidth. The bandwidth depends on the sample size, and wecan write b = b(n). We require b(n) ↓ 0 as n −→ ∞, while nb(n) −→ ∞ asn −→ ∞. Furthermore, we need fX(x) to be twice continuously differentiable.We then have [44] the asymptotic approximation
AMISE(b) =1nb
R(k) +14m2(k)2b4R(f ′′), (25)

Tail Distribution and Extreme Quantile Estimation 79
where R(g) =∫
g(x)2 dx and mp(k) =∫
xpk(x) dx. The bandwidth that mini-mizes AMISE can be analytically derived to be
bopt =(
R(k)m2(k)2R(f ′′)
1n
) 15
, (26)
leading to
AMISE(bopt) =54
(m2(k)2R(k)4R(f ′′)
n4
) 15
. (27)
The optimal bandwidth can then be calculate for different kernel functions. Wehave, e.g., for the Gaussian kernel [11]
bGopt =
(1
2√
πR(f ′′)1n
) 15
. (28)
The difficulty in using AMISE is that the norm of second derivative of theunknown density needs to be estimated. This will be further discussed under thesubsection on bandwidth selectors.
We also mention the skewness γX of the data, which is a measure that canbe used to see if the data is suitable for classical kernel estimation. We estimateit as
γX =1n
∑ni=1(Xi − X)3(
1n
∑ni=1(Xi − X)2
) 32. (29)
It was shown in [44], see also [41], that minimizing the square integratederror (ISE) for a specific sample is equivalent to minimizing the cross-validationfunction
CV(b) =∫
Ω
(fX(x)
)2
dx − 2n
n∑i=1
fi(xi), (30)
where fi(·) is the kernel estimator obtained when leaving the observation xi out.Other useful measures of the goodness of fit are also discussed in [41].
5.3 Bias-Corrected Kernel Estimation
As was illustrated in Example 1, boundaries where the density does not go to zerogenerate bias. This happens because the kernel functions cross the boundary, andsome of the mass ends up outside the domain. We want from the kernel methodthat E[fX(x)] = fX(x) in all of the support Ω of the density function, but thiscondition does not hold at boundaries, unless we also have that the density iszero there. An overview of the topic, and of simple boundary correction methods,is given in [34]. By employing a linear bias correction method, we can make themoments of order 0 and 1 satisfy the consistency requirements m0 = 1 (totalprobability mass) and m1 = 0, such that the expectation is consistent to order

80 I. Rached and E. Larsson
b2 at the boundary. A general linear correction method for a density supportedon Ω = [x0,∞] that is shown to perform well in [34] has the form
kb(y) =(a2 − a1y)kb(y)
a0a2 − a21
, (31)
for a kernel function centered at the data location x. The coefficients aj = aj(b, x)are computed as
aj(b, x) =∫ z
x0
yjkb(x − y)dy, (32)
where z is the end point of the support of the kernel function. An examplewith modified Gaussian kernels close to a boundary is shown in Fig. 3. At theboundary, the amplitude of the kernels becomes higher to compensate for themass loss, while away from the boundary they resume the normal shape andsize. The kernel functions closest to the boundary become negative in a smallregion, but this does not affect the consistency of the estimate.
Fig. 3. Bias corrected kernel functions using the linear correction approach near aboundary (dashed line).
A more recent bias correction method is derived in [38], based on ideas from[15]. This type of correction is applied to the kernel estimator for the cdf, andcan be seen as a Taylor expansion. It also improves the capturing of valleys andpeaks in the distribution function, compared with the classical kernel estimator.It requires that the density is four times differentiable, that the kernel is sym-metric, and at least for the theoretical derivations, that the kernel is compactlysupported on Ω = [−1, 1]. The overall bias of the estimator is O(b4) as com-pared with O(b2) for the linear correction method, while the variance is similarto what is achieved with the uncorrected estimator. This boundary correctionapproach is used for estimating extreme value distributions in [9].
FX(x) =FX(x) + λ(F1(x) + F2(x))
1 + 2λ, (33)

Tail Distribution and Extreme Quantile Estimation 81
where F1,2(x) = FX(x ∓ �b) ± �bfX(x ∓ �b), and
�(λ) =
√(1 + 2λ)m2(k)
2λ. (34)
The parameter λ is kernel dependent, and should be chosen such that AMISE isminimized, but according to [15], the estimator is not that sensitive to the choice.An explicit expression for AMISE with this correction is derived in [38], and isalso cited in [9], where the value λ = 0.0799 is also given as an (approximate)minimizer of the variance for the Epanechnikov kernel.
5.4 Transformation Kernel Estimation
The objective in transformation kernel estimation is to find a transformationof the random variable X, which for example has a right-skewed distributioninto a symmetric random variable Y . Then classical kernel estimation can besuccessfully applied to Y .
The transformation function T (·) should be monotonic and increasing. For aright-skewed true density, it should also be concave. It also needs to have at leastone continuous derivative. The transformation is applied to the original data togenerate a transformed data sample
yi = T (xi), i = 1, . . . , n. (35)
For the pdfs of the two random variables it holds that
fX(x) = T ′(x)fY (y), (36)
and for the cdfs we have that FX(x) = FY (y). We apply the kernel densityestimator to the transformed data, leading to the following estimator for theoriginal density:
fX(x) = T ′(x)fY (y) = T ′(x)1n
n∑i=1
kb(T (x) − T (xi)). (37)
Several different transformation classes have been proposed for heavy taileddata. The shifted power transformation family was proposed in [45]
T (x) ={
sign(λ2)(x + λ1)λ2 , λ2 �= 0,ln(x + λ1), λ2 = 0,
(38)
where λ1 > −min(xi) and λ2 ≤ 1. An algorithm for choosing the transformationparameters is given in [10]. First a restriction is made to parameters λ1,2 thatgive close to zero skewness (29) for the transformed data. Then AMISE (27) ofthe classical kernel estimation for the density fY (y) is minimized assuming anasymptotically optimal bandwidth. This is equivalent to minimizing R(f ′′
Y ). As

82 I. Rached and E. Larsson
we do not know the true density, an estimator is needed. The estimator suggestedin [10] is
R(f ′′Y ) =
1n(n − 1)
n−1∑i=1
n∑j=1+1
1c5
k ∗ k(yi − yj), (39)
where the convolution k ∗ k(u) =∫
k(u − s)k(s)ds, and c is the bandwidth usedin this estimate.
The Mobius-like mapping introduced in [16] takes data in ΩX = [0,∞) andmaps it to ΩY = [−1, 1).
T (x) =xα − Mα
xα + Mα. (40)
The scale M is determined by minimizing R(f ′′Y ). Given a scale M , α is deter-
mined such that no probability mass spills over at the right boundary. That is,the resulting density does not have mass at (or beyond) infinity.
A modified Champernowne distribution transformation is derived in [12],with transformation function
T (x) =α(x + c)α−1((M + c)α) − cα
((x + c)α + (M + c)α − 2cα)2, (41)
where M can be chosen as the median of the data, and α and c are found bymaximizing a log likelihood function, see [12].
So far, we have only considered the possibility of performing one transfor-mation, but one can also transform the data iteratively, or perform two specificconsecutive transformations. Doubly transformed kernel estimation is discussed,e.g., in [9]. The idea is to first transform the data to something close to uniform,and then to apply an inverse beta transformation. This makes the final distri-bution close to a beta distribution, and the optimal bandwidth can then easilybe computed.
5.5 Bandwidth Selection
As briefly mentioned in Sects. 5.2 and 5.4, the choice of bandwidth b in kernelestimation has a significant impact on the quality of the estimator, but choosingthe appropriate bandwidth requires the use of one estimator or another. Therule-of-thumb bandwidth estimator of Silverman [44],
b =(
43n
) 15
σX , (42)
is often cited, but it assumes that the underlying density can be approximatedby a normal density. This is hence not appropriate for heavy-tailed, right-skeweddistributions.
Many bandwidth selection methods use a normal reference at some step inthe process [11], but this introduces a parametric step in the non-parametricestimation. An interesting alternative, the Improved Sheather-Jones bandwidth

Tail Distribution and Extreme Quantile Estimation 83
selection algorithm, is also described in [11], where the normal reference is elim-inated by formulating a non-linear equation for the optimal bandwidth.
We start from the point of how to estimate R(f ′′X) = ‖f ′′
x ‖2. There are atleast two possible plug-in estimators, based on the equality
‖f(j)X ‖2 = (−1)j
E[f (2j)]. (43)
The two types of estimators are
‖f (j)X ‖2 =
1n2
n∑k=1
n∑m=1
∫R
k(j)b (x − xk)k(j)
b (x − xm)dx (44)
and
(−1)j E[f (2j)] =
(−1)j
n2
n∑k=1
n∑m=1
k(2j)b (xk − xm). (45)
By requiring the two estimators to have the same asymptotic mean square error,we get a condition on the bandwidth. A derivation for the Gaussian kernel isprovided in [11], and we summarize these result here to illustrate the bandwidthselection algorithm. Requiring (44) and (45) to be asymptotically equivalentgives the following relation between the bandwidths for two consecutive deriva-tives:
b∗j =
⎛⎝1 + 1
2j+12
3(2j − 1)!!
N√
π2 ‖ f (j+1)‖2
⎞⎠
13+2j
≡ γj(b∗j+1), (46)
and, for the Gaussian kernel, (44) for j + 1 becomes
‖ f
(j+1)X ‖2 =
(−1)j
n2
n∑k=1
n∑m=1
k(2j)√
2b∗j+1
(xk − xm). (47)
The two relations (46) and (47) together define the function γj(b). We also haveEq. (28) for the bandwidth of the Gaussian kernel. Combining this with (46) forj = 1 allows us to eliminate ‖f ′′‖2 to get
b∗ =
(6√
2 − 37
) 15
b∗1 ≡ ξb∗
1. (48)
Now we can apply (46) recursively to get a relation
b∗ = ξγ[](b∗+1), (49)
where γ[](b) = γ1(· · · γ−1(γ(b)) · · · ), for � ≥ 1. Here, it would be possible toassume a normal distribution to estimate ‖f +2‖2 in order to compute b∗
+1,and then all the other bandwidths. However, this does not work well if the truedistribution is far from normal [11]. In the improved Sheather-Jones algorithm,

84 I. Rached and E. Larsson
we instead assume that b∗+1 = b for some large enough �. The experiments in
[11] indicate that � = 5 should be enough. We then get a non-linear equation tosolve for b
b = ξγ[](b). (50)
Using this relation, no assumptions on the true distribution are made, and thisbandwidth selector is shown to perform well also for non-normal distributions.
6 More Challenges in Estimating the RiskMeasures—Financial Time Series and MultivariateCase
A Dynamic Approach. Highlighting the underlying assumptions is relevant forunderstanding model uncertainty when estimating rare or extreme events. TheVaR and ES are estimated given that the distribution of asset returns does notchange over time. In the last two sections, when applying the POT approachto the returns in order to calculate these risk measures, their distribution wasassumed to be stationary. A dynamic model which captures current risk is thenmore realistic. EVT can also be used based on a stochastic time series model.These dynamic models use an ARCH/GARCH type process along with the POTto model VaR and ES which depend on and change due to the fluctuations ofthe market. This approach, studied in [2], reflects two stylized facts exhibited bymost financial return series, namely stochastic volatility and the fat-tailednessof conditional return distributions over short time horizons.
The Multivariate Case for EVT. When estimating the VaR of a multi-assetportfolio, under financial crises, correlations between assets often become morepositive and stronger. Assuming that the variables are independent and identi-cally distributed is a strong hypothesis. Portfolio losses are the result not only ofthe individual asset’s performance but also, and very importantly, the result ofthe interaction between assets. Hence, from the accuracy point of view, ideallywe would prefer the multivariate approach.
An extension of the univariate EVT models using a dependence structureleads to a parametric model and is then expected to be less efficient for scarcedata. A non-parametric approach should be preferred to estimate portfolio tailrisk. Transformation kernel density estimation is used in [8] for studying mul-tivariate extreme value distributions in temperature measurement data. Futuredirections involve to apply this type of methodology to real and simulated port-folio data.

Tail Distribution and Extreme Quantile Estimation 85
References
1. Acerbi, C., Tasche, D.: On the coherence of expected shortfall. J. Bank. Finance26(7), 1487–1503 (2002)
2. McNeil, A.J., Frey, R.: Estimation of tail-related risk measures for heteroscedasticfinancial time series: an extreme value approach. J. Empir. Finance 7, 271–300(2000)
3. Alemany, R., Bolance, C., Guillen, M.: A nonparametric approach to calculatingvalue-at-risk. Insur. Math. Econ. 52(2), 255–262 (2013)
4. Artzner, P., Delbaen, F., Eber, J.M., Heath, D.: Coherent measures of risk. Math.Finance 9(3), 203–228 (1999)
5. Balkema, A.A., de Haan, L.: Residual life time at great age. Ann. Probab. 2(5),792–804 (1974)
6. Beirlant, J., Dierckx, G., Goegebeur, Y., Matthys, G.: Tail index estimation andan exponential regression model. Extremes 2(2), 177–200 (1999)
7. Beirlant, J., Dierckx, G., Guillou, A., Staaricaa, C.: On exponential representationsof log-spacings of extreme order statistics. Extremes 5(2), 157–180 (2002)
8. Beranger, B., Duong, T., Perkins-Kirkpatrick, S.E., Sisson, S.A.: Exploratorydata analysis for moderate extreme values using non-parametric Kernel methods.arXiv:1602.08807 [stat.ME] (2016)
9. Bolance, C., Bahraoui, Z., Alemany, R.: Estimating extreme value cumulative dis-tribution functions using bias-corrected Kernel approaches. XREAP2015-01 (2015)
10. Bolance, C., Guillen, M., Perch Nielsen, J.: Kernel density estimation of actuarialloss functions. Insur. Math. Econ. 32(1), 19–36 (2003)
11. Botev, Z.I., Grotowski, J.F., Kroese, D.P.: Kernel density estimation via diffusion.Ann. Stat. 38(5), 2916–2957 (2010)
12. Buch-larsen, T., Nielsen, J.P., Guillen, M., Bolance, C.: Kernel density estimationfor heavy-tailed distributions using the Champernowne transformation. Statistics39(6), 503–516 (2005)
13. Cai, Z., Wang, X.: Nonparametric estimation of conditional VaR and expectedshortfall. J. Econ. 147(1), 120–130 (2008)
14. Chen, S.: Non-parametric estimation of expected shortfall. J. Financ. Econ. 6,87–107 (2008)
15. Choi, E., Hall, P.: On bias reduction in local linear smoothing. Biometrika 85(2),333–345 (1998)
16. Clements, A., Hurn, S., Lindsay, K.: Mobius-like mappings and their use in Kerneldensity estimation. J. Am. Stat. Assoc. 98(464), 993–1000 (2003)
17. Coles, S.: An Introduction to Statistical Modeling of Extreme Values. SpringerSeries in Statistics. Springer, London (2001). https://doi.org/10.1007/978-1-4471-3675-0
18. Csorgo, S., Deheuvels, P., Mason, D.: Kernel estimates of the tail index of a dis-tribution. Ann. Stat. 13(3), 1050–1077 (1985)
19. Csorgo, S., Viharos, L.: Estimating the tail index. In: Szyszkowicz, B. (ed.) Asymp-totic Methods in Probability and Statistics, pp. 833–881. North-Holland, Amster-dam (1998)
20. Danielsson, J.: Financial Risk Forecasting. Wiley, Hoboken (2011)21. Diebolt, J., Guillou, A., Rached, I.: Approximation of the distribution of excesses
through a generalized probability-weighted moments method. J. Stat. Plan. Infer.137(3), 841–857 (2007)
22. Dowd, K.: Measuring Market Risk. Wiley, Hoboken (2005)

86 I. Rached and E. Larsson
23. Duffie, D., Pan, J.: An overview of value at risk. J. Deriv. 4(3), 7–49 (1997)24. Eling, M.: Fitting insurance claims to skewed distributions: are the skew-normal
and skew-student good models? Insur. Math. Econ. 51(2), 239–248 (2012)25. Embrechts, P. (ed.): Extremes and Integrated Risk Management. Risk Books, Lon-
don (2000)26. Embrechts, P., Kluppelberg, C., Mikosch, T.: Modelling Extremal Events: for
Insurance and Finance. Springer, Heidelberg (1997). https://doi.org/10.1007/978-3-642-33483-2
27. Falk, M., Marohn, F.: Efficient estimation of the shape parameter in Pareto modelswith partially known scale. Stat. Decis. 15, 229–239 (1997)
28. Feuerverger, A., Hall, P.: Estimating a tail exponent by modelling departure froma Pareto distribution. Ann. Stat. 27(2), 760–781 (1999)
29. Fisher, R.A., Tippett, L.H.C.: Limiting forms of the frequency distribution of thelargest or smallest member of a sample. Math. Proc. Camb. Philos. Soc. 24(2),180–190 (1928)
30. Gnedenko, B.: Sur la distribution limite du terme maximum d’une serie aleatoire.Ann. Math. 44(3), 423–453 (1943)
31. Hill, B.M.: A simple general approach to inference about the tail of a distribution.Ann. Stat. 3, 1163–1174 (1975)
32. Hosking, J.R., Wallis, J.R.: Parameter and quantile estimation for the generalizedPareto distribution. Technometrics 29(3), 339–349 (1987)
33. Hull, J.C.: Risk Management and Financial Institutions. Prentice Hall, Upper Sad-dle River (2006)
34. Jones, M.C.: Simple boundary correction for Kernel density estimation. Stat. Com-put. 3(3), 135–146 (1993)
35. Jones, M.C., Marron, J.S., Sheather, S.J.: A brief survey of bandwidth selectionfor density estimation. J. Am. Stat. Assoc. 91(433), 401–407 (1996)
36. Jones, M.C., McKay, I.J., Hu, T.C.: Variable location and scale Kernel densityestimation. Ann. Inst. Stat. Math. 46(3), 521–535 (1994)
37. Jorion, P.: Value at Risk: The New Benchmark for Managing Financial Risk.McGraw-Hill, New York (2001)
38. Kim, C., Kim, S., Park, M., Lee, H.: A bias reducing technique in Kernel distribu-tion function estimation. Comput. Stat. 21(3–4), 589–601 (2006)
39. McNeil, A.J., Frey, R., Embrechts, P.: Quantitative Risk Management: Concepts,Techniques and Tools. Princeton Series in Finance. Princeton University Press,Princeton (2005)
40. Pickands, J.: Statistical inference using extreme order statistics. Ann. Stat. 3(1),119–131 (1975)
41. Pitt, D., Guillen, M., Bolance, C.: Estimation of parametric and nonparamet-ric models for univariate claim severity distributions - an approach using R.XREAP2011-06 (2011)
42. Reiss, R.D., Thomas, M.: Statistical Analysis of Extreme Values: with Applicationsto Insurance, Finance, Hydrology and Other Fields. Birkhauser, Basel (2007)
43. Scaillet, O.: Nonparametric estimation of conditional expected shortfall. Insur.Risk Manag. J. 74(1), 639–660 (2005)
44. Silverman, B.W.: Density Estimation for Statistics and Data Analysis, Monographson Statistics and Applied Probability, vol. 26. Chapman & Hall/CRC, London(1986)
45. Wand, M.P., Marron, J.S., Ruppert, D.: Transformations in density estimation. J.Am. Stat. Assoc. 86(414), 343–353 (1991)

Tail Distribution and Extreme Quantile Estimation 87
Open Access This chapter is licensed under the terms of the Creative CommonsAttribution 4.0 International License (http://creativecommons.org/licenses/by/4.0/),which permits use, sharing, adaptation, distribution and reproduction in any mediumor format, as long as you give appropriate credit to the original author(s) and thesource, provide a link to the Creative Commons license and indicate if changes weremade.
The images or other third party material in this chapter are included in the chapter’sCreative Commons license, unless indicated otherwise in a credit line to the material. Ifmaterial is not included in the chapter’s Creative Commons license and your intendeduse is not permitted by statutory regulation or exceeds the permitted use, you willneed to obtain permission directly from the copyright holder.
Towards Efficient and ScalableData-Intensive Content Delivery:
State-of-the-Art, Issues and Challenges
Irene Kilanioti1(B), Alejandro Fernandez-Montes2, Damian Fernandez-Cerero2,Anthony Karageorgos4, Christos Mettouris1, Valentina Nejkovic3,
Nikolas Albanis4, Rabih Bashroush5, and George A. Papadopoulos1
1 Department of Computer Science, University of Cyprus, Nicosia, [email protected], {mettour,george}@cs.ucy.ac.cy
2 Departamento de Lenguajes y Sistemas Informaticos, Universidad de Sevilla,Seville, Spain
{afdez,damiancerero}@us.es3 Faculty of Electronic Engineering, University of Nis, Nis, Serbia
[email protected] TEI of Thessaly, Karditsa, Greece
[email protected], [email protected] University of East London, London, UK
Abstract. This chapter presents the authors’ work for the Case Studyentitled “Delivering Social Media with Scalability” within the frameworkof High-Performance Modelling and Simulation for Big Data Applica-tions (cHiPSet) COST Action 1406. We identify some core research areasand give an outline of the publications we came up within the frameworkof the aforementioned action. The ease of user content generation withinsocial media platforms, e.g. check-in information, multimedia data, etc.,along with the proliferation of Global Positioning System (GPS)-enabled,always-connected capture devices lead to data streams of unprecedentedamount and a radical change in information sharing. Social data streamsraise a variety of practical challenges: derivation of real-time meaningfulinsights from effectively gathered social information, a paradigm shiftfor content distribution with the leverage of contextual data associatedwith user preferences, geographical characteristics and devices in general,etc. In this article we present the methodology we followed, the resultsof our work and the outline of a comprehensive survey, that depictsthe state-of-the-art situation and organizes challenges concerning socialmedia streams and the infrastructure of the data centers supporting theefficient access to data streams in terms of content distribution, datadiffusion, data replication, energy efficiency and network infrastructure.The challenges of enabling better provisioning of social media data havebeen identified and they were based on the context of users accessingthese resources. The existing literature has been systematized and themain research points and industrial efforts in the area were identified andanalyzed. In our works, in the framework of the Action, we came up with
c© The Author(s) 2019J. Ko�lodziej and H. Gonzalez-Velez (Eds.): cHiPSet, LNCS 11400, pp. 88–137, 2019.https://doi.org/10.1007/978-3-030-16272-6_4

Towards Efficient and Scalable Data-Intensive Content Delivery 89
potential solutions addressing the problems of the area and described howthese fit in the general ecosystem.
1 Introduction
1.1 Social Data Streams Features
Herein some basic terminology for the topic of our Case Study entitled “Deliv-ering Social Media with Scalability” within the framework of High-PerformanceModelling and Simulation for Big Data Applications (cHiPSet) COST Action1406 is introduced. The terminology appears in published works [111] and [108],as well.
Social networks, media and platforms enable communication, exchange, busi-ness and knowledge acquisition as well as social network users connection witheach other with the purpose of sharing content. Social data is the informationthat social media users share, e.g. check-in information, multimedia data, tags,annotations, and likes, and may include metadata such as the user’s location,native language, biographical data and shared links, whereas ’streams’ denotesvarious approaches have been performed that we do not refer to static datasets,but rather to dynamic information generated and transmitted over the OnlineSocial Network (OSN).
Formally, an OSN is depicted by a directed graph G = (V,E), where V isthe set of the vertices of the graph representing the nodes of the network andE are the edges between them, denoting various relationships among the edgesof the graph [69]. The semantics of these edges vary, and their interpretationis expanded for various OSNs from personal acquaintance, to common interests,microblogging services or business contact. As far as the directionality of theedges of the social graph is concerned, it is associated with the concept of theOSN: for Facebook, an edge denotes mutual friendship between the endpoints ofa link, for Twitter, if the edge between A and B points at B, A’s posts (tweets)appear in B’s main Twitter page, and so on. A social node centrality is indicativeof the importance of a node within a social network. It is given in terms of areal-valued function on the vertices of a graph, where the values produced areexpected to provide a ranking which identifies the most important nodes [40,41].
In Rogers’ classic work [150], the author defines information diffusion as theprocess in which an innovation is communicated through certain channels overtime among the members of a social system. In this context, the innovation isdefined as the first spread of information from an originator. A social cascade is aspecific case of information diffusion and practically occurs within an OSN, whena piece of information is extensively retransmitted after its initial publicationfrom a user. Cascades can be represented as rooted directed trees where theinitiator of the cascade is the root of the tree [26] and the length of the cascadeis the height of the resulting tree. Each vertex in the cascade tree can have theinformation of the user, and the identity of the item replicated in the cascade.Figure 1 depicts an example of the evolution of a social cascade in a directed

90 I. Kilanioti et al.
A
C D
F
H
B E
G
I
J
Social Cascade
height=4
Fig. 1. The evolution of a social cascade in Twitter
graph. The cascade follows the arrows’ direction. For example, in Twitter, B, C,D, E are followers of A, whereas the adopters of a new information piece couldbe the nodes, that after having been exposed in a video link, they retransmit it,contributing remarkably to Internet traffic [1].
1.2 Challenges for Distribution of Social Data Streams
In the survey [108] we wrote in the framework of (cHiPSet) COST Action 1406we identified the challenges of enabling better provisioning of social media databased on the context of users accessing these resources. In our works [109–111],that we produced in the framework of the Action, we came up with potentialsolutions addressing the problems of the area and described how these fit in thegeneral ecosystem.
Distributing social data streams largely depends on the exploitation of usagepatterns found in OSNs, and can be improved either through the selectiveprefetching of content (cost-effectiveness) or through the strategic place-ment/selection of the employed infrastructure (energy-efficiency). The costof scaling such content might be the number of replicas needed for a specificsource or it may take into account the optimal use of memory and processingtime of a social-aware built system. Optimization of energy efficiency for datacenters that support social data interaction and analysis includes tasks suchas data growth, data center federation and Content Delivery Network (CDN)-load-balancing at data center level. In our taxonomy (Fig. 2), pillars associatedwith cost-effectiveness include Context-aware Computing, Content/InformationDiffusion Models and Content Distribution challenges, whereas Software for

Towards Efficient and Scalable Data-Intensive Content Delivery 91
Challenges for Distribution of Social Data Streams
Context-aware Computing
Software for Infrastructure
Efficiency
Content Diffusion Models Content Distribution
VM Consolidation & Migration
Workload Consolidation & Shut-down Techniques
Energy-aware Scheduling Algorithms
Data Replication & Placement
- Limited Storage Space- Power Issues
- Heterogeneous H/W and S/W
- Limited Screen size
- Connectivity- Communication &
Data Exchange
Context Sensing
Context Representation &
Modelling
User Privacy
Ubiquitous Computing
5G Environments Social Data Streams
Architectures Systems Techniques 5G Solutions
Data Center Scheduling Frameworks
Fig. 2. Taxonomy of challenges for distribution of social data streams.
Infrastructure Efficiency is associated with energy-efficiency. This taxonomyincludes solutions or approaches to the ‘Challenges for Distribution of SocialData Streams’. These solutions or approaches require enough effort, hence theycan also be considered as a challenge for the research community.
Context-Aware Computing: Application of social contextual information,such as profiles, images, videos, biometrical, geolocation data and local data, insituations where conventional bandwidth-intensive content scaling is infeasible,could largely facilitate: the spreading of information, the identification of poten-tial information sources, as well as a paradigm shift in the way users access andcontrol their personal data. User-generated multimedia content is especially dif-ficult due to its long tail nature, with each item probably not popular enough tobe replicated in a global scale, but with the long-tail altogether getting sufficientaccesses [20]. Social analysis tasks interweaved with context-aware computingcould pave the ground for preactive caching mechanisms in the framework of acontent delivery infrastructure of streaming providers.
Software for Infrastructure Efficiency: The industry has made severalefforts to address challenges associated with optimization of energy efficiencyfor data centers that support social data interaction and analysis [42,129,163]such as data growth, isolation, real-time interactions, data center federation andCDN-load-balancing at data center level, but usually lacks from focusing onenergy consumption of the employed infrastructures. The challenges in the areaof energy-efficient data-centers include workload consolidation and shut-downtechniques, Virtual Machines (VMs) consolidation and migration, data replica-tion and placement, and energy-aware scheduling algorithms.

92 I. Kilanioti et al.
Content/Information Diffusion Models: Prevalence of OSNs has trans-formed the landscape of content exchange. Popularity of relatively data heavymultimedia user generated content (UGC) has also risen [6], resulting in datadeluge across all media platforms [12,127,141]. Measurement studies, such as[48], attribute the recent increases in HTTP/HTTPS traffic to the extended useof OSNs [28,49,69]. Elaborate data manipulation presupposes coping with thesize of social graphs with billions of nodes and edges [174]. Facebook, for exam-ple, reported that had 1.47 billion daily active users on average for June 2018and 2.23 billion monthly active users as of June 30, 2018 [4]. Its custom built-indata warehouse and analytics infrastructure [11] has to apply ad-hoc queries andcustom MapReduce jobs [55] in a continuous basis on over half a petabyte ofnew data every 24 h for the creation of meaningful aggregations and analysis.It is also acknowledged that a large proportion of bandwidth-intensive media isdistributed via reposted OSN links, contributing significantly to Internet traf-fic [1], [46]. These challenges are closely associated with the Content/InformationDiffusion Models used to represent the diffusion of information over OSNs andfacilitate relevant algorithmic solutions (Fig. 2).
Content Distribution: The delivery infrastructure of video operators is madeup of scattered geo-distributed servers, which with specific cache selection mech-anisms direct users to the closest servers hosting the requested data. Transmis-sion Control Protocol (TCP), however, is subject to delay jitter and throughputvariations and clients are required to preload a playout buffer before starting thevideo playback [111]. Thus, the quality of experience (QoE) of media platformusers is primarily determined by stalling effects on the application layer. Forthe YouTube case cache server selection is also highly Internet Service Provider(ISP)-specific, with geographical proximity not being the primary criterion andDNS level redirections for load-balancing purposes occurring quite frequentlyand substantially contributing to the initial startup delay of the playback. Sev-eral network-level and client-level approaches are focused on the detection of suchinterruptions, that negatively affect the user experience [94]. With the growingpopularity of OSNs and the increased traffic due to outspread of informationvia the latter, the improvement of user experience through scaling bandwidth-demanding content largely depends on the exploitation of usage patterns andgeolocation data associated with OSNs. These challenges are closely associatedwith the Architectures, Systems and Techniques within the 5G infrastructure.
Some key factors contributing to the problem of diffusion of bandwidth-intensive media content over OSNs are discussed below.
Large-Scale Datasets. In order to harness the power of social networks diffu-sion over CDN infrastructure, the key areas of interest that need to be exploredinclude the large size of the graphs, and also the fact that diffusion of links ismultiplied through dissemination over sites like YouTube, and amplified by theproliferation of smartphones and cheap broadband connections. The amount ofinformation in OSNs is an obstacle, since elaborate manipulation of the data

Towards Efficient and Scalable Data-Intensive Content Delivery 93
may be needed. An open problem is the efficient handling of graphs with billionsof nodes and edges.
The desired scaling property refers to the fact that the throughput of theproposed approaches should remain unchanged with the increase in the datainput size, such as the large datasets that social graphs comprise and the socialcascades phenomena that amplify the situation. Cost of scaling such content canbe expressed in different ways. For instance, it may be matched with the numberof replicas needed for a specific source. Future experimentations may take intoaccount the optimal use of memory and processing time of an OSN-aware builtsystem.
Internet of Things (IoT) is a global infrastructure that interconnectsthings based on interoperable information and communication technologies, andthrough identification, data capture, processing and communication capabilitiesenables advanced services [5]. Things are objects of the physical world (physi-cal things, such as devices, vehicles, buildings, living or inanimate objects aug-mented with sensors) or the information world (virtual things), capable of beingidentified and integrated into communication networks. It is estimated that thenumber of Internet-connected devices has surpassed the human population in2010 and that there will be about 50 million devices by 2020 [9]. Thus, the stillongoing significant IoT innovation is expected to generate massive amounts ofdata from diverse locations, that will need to be collected, indexed, stored, andanalyzed.
OSN Evolution. Existent works examine valuable insights into the dynamicworld by posing queries on an evolving sequence of social graphs (e.g. [146]).Time evolving graphs are increasingly used as a paradigm for the emerging areaof OSNs [71]. However, the ability to scalably process queries concerning theinformation diffusion remains to a great extent unstudied. With the exceptionof sporadic works on specialized problems, such as that of inference of dynamicnetworks based on information diffusion data [149], at the time of writing theauthors are not aware of relative studies on the information diffusion throughOSNs under the prism of graphs dynamicity.
5G Approaches. The demand for high-speed data applications that has risen inrecent decade lead to development of Fifth Generation Wireless (5G) communi-cations. Development of efficient mechanisms for supporting mobile multimediaand data services is prerequisite for 5G networks. Real bottleneck of todays’mobile networks is the radio access network and the backhaul. Caching in theintermediate nodes, servers, gateways, routers, and mobile users’ devices canreduce doubled transmission from content providers and core mobile networks.
Known caching techniques that can be used within 5G are: content distri-bution network, information-centric networks, content-centric networking, httpweb caching, evolved packet core caching, radio access network caching, device todevice caching, proactive caching, predictive caching, cooperative caching [23].Those techniques are using different algorithms and models. Analysis presented

94 I. Kilanioti et al.
in [23] has shown that the deployment of those caching techniques in mobile net-work can reduce redundant traffic in backhaul, minimize the traffic load, increasethe transfer rate in mobile network and reduce the latency. Correlation of severalcaching methods and procedures could result in improving network performanceand obtaining better results.
On the other hand, well known bottleneck that 5G brings is the complex het-erogeneity of the network. Particularly, network consists of different technologiesthat coexist, where some technologies could potentially disable the transmissionof data of equipment that use other technologies. Thus, we need a solution thatefficiently handles resources in space, frequency, and device dimensions. Semanticcoordination could alternatively be used in such networks [135,164].
The nodes in the system can communicate and share knowledge in terms ofthe spectrum utilization in the network. In [164], the authors proposed to modelthe spectrum usage coordination as an interactive process between a number ofdistributed communicating agents, where agents share their specific informationand knowledge. The information includes the current spectrum usage state, spa-tial coordinates of the device, available communication protocols, usage policy,spectrum sensing capabilities of the device, spectrum needs, etc. An approachfor such coordination is presented in [164] and it is based on semantic technolo-gies and communication between heterogeneous agents with potentially differentcapabilities and a minimal common compliance. The core knowledge is repre-sented by ontologies whose representation and usage is specified in a standardizedway. The approach is used as dynamic spectrum coordination algorithms used forcoordination among different wireless technologies in 5G networking [135,164].This semantic technologies based approach can be used for wide diapason ofproblems within 5G heterogeneous networks, such as network states predictions,network analysis, minimizing traffic load, content distribution coordination etc.This approach could be used in combination with caching techniques in order toimprove content distribution in 5G, but further research should be done in thisarea.
Mobile CDNs and the Cloud. Mobile computing (MC) [13] has created enor-mous demand for online experience, that OSN-aware CDNs are required to sat-isfy. Almost-ubiquitous Wi-Fi coverage and rapid extension of mobile-broadbandprovide undisrupted connectivity for mobile devices, whereas devices that hopseamlessly from WiFi to cellular networks, and technologies such as 5G, will beoptimised for uses that put a premium on continuous connectivity regardless ofthe user location [5]. Mobile-specific optimizations for applications along withdrastically simplified and more intuitive use of devices (e.g. with multi-touchinteractions instead of physical keyboards) contribute to mobile applicationsbecoming the premium mode of accessing the Internet, at least in the US [6].
Cellular networks have become the main way citizens connect to the Inter-net worldwide, specially in developing countries. Thanks to the development ofmobile devices and their networking capacities, as well as the arrival of fast andreliable networks such as 5G, a high quality connectivity is ensured everywhere

Towards Efficient and Scalable Data-Intensive Content Delivery 95
and any time. The irruption of new paradigms, such as IoT, has increased thenumber of connected devices (sensors, actuators, etc.) which requires infrastruc-tures that provide higher throughput networking, specially in use cases wherehigh definition videos are involved and even new scenarios are yet to emerge.
Mobile Computing entails the processing and transmission of data over amedium, that does not constraint the human-medium interaction to a specificlocation or a fixed physical link. Figure 3 depicts a general overview of the MCparadigm in its current form. It is the present decade that signifies the prolif-eration of MC around the world, although handheld devices have been widelyused for around two decades in the form of Personal Digital Assistants (PDAs)and early smartphones. Almost ubiquitous Wi-Fi coverage and rapid extension ofmobile-broadband (around 78 active subscriptions per 100 inhabitants in Europeand America) provide undisrupted connectivity for mobile devices, whereas 97%of the world’s population is reported to own a cellular subscription in 2015 [5].Moreover, the MC paradigm is nowadays further combined with other predomi-nant technology schemes leading to the paradigms of Mobile Cloud Computing[15], Mobile Edge Computing [8], Anticipatory Mobile Computing [138], etc.
Today’s mobile devices include smartphones, wearables, carputers, tabletPCs, and e-readers. They are not considered as mere communication devices,as they are in their majority equipped with sensors that can monitor a user’slocation, activity and social context. Thus, they foster the collection of Big Databy allowing the recording and extension of the human senses [115].
Mobile social networking involves the interactions between users with similarinterests or objectives through their mobile devices within virtual social net-works [44]. Recommendation of interesting groups based on common geo-socialpatterns, display of geo-tagged multimedia content associated to nearby places,as well as automatic exchange of data among mobile devices by inferring trustfrom social relationships are among the possible mobile social applications ben-efiting from real-time location and place information.
1. Industrial Applications: Maintenance, service, optimization of distributedplant operations is achieved through several distributed control points, so thatrisk is reduced and the reliability of massive industrial systems is improved[139].
2. Automotive Applications: Automotive applications capture data from sensorsembedded in the road that cooperate with car-based sensors. They aim atweather adaptive lighting in street lights, monitoring of parking spaces avail-ability, promotion of hands-free driving, as well as accident avoidance throughwarning messages and diversions according to climate conditions and trafficcongestion. Applications can promote massive vehicle data recording (stolenvehicle recovery, automatic crash notification, etc.) [7].
3. Retail Applications: Retail applications include, among many others, themonitoring of storage conditions along the supply chain, the automation ofrestocking process, as well as advising according to customer habits and pref-erences [139].

96 I. Kilanioti et al.
Dev
ices
Applica
tion
s
Push
Not
ifica
tion
Smartpho
ne
WirelessDevice
Smartpho
ne
Mob
iledevice
Gam
ing
SmartCities
eCom
merce
Healthcare
Custom
App
lication
Wi-FiAccessPoint
WirelessServer
Wi-FiAccessPoint
Cloud
let
Satellite
AccessPoint
BTS
Satellite
AccessPoint
BTS
Cloud
let
Servers
Datab
ase
HA
AAA
Mob
ileNetworkB
Servers
Datab
ase
HA
AAA
Mob
ileNetworkA
Analyt
ics
Cloud
A
Cloud
B
AAA
Authentication,
Autho
rization
,Accou
nting
HA
Hom
eAgent
BTS
BaseTransceiver
Station
Fig.3.Soci
aldata
stre
am
sov
erm
obile
com
puti
ng
[108].

Towards Efficient and Scalable Data-Intensive Content Delivery 97
4. Healthcare & Telemedicine Applications: Physical condition monitoring forpatients and the elderly, control of conditions inside freezers storing vaccines,medicines and organic elements, as well as more convenient access for peoplein remote locations with usage of telemedicine stations [98].
5. Building Management Applications: Video surveillance, monitoring of energyusage and building security, optimization of space in conference rooms andworkdesks [7].
6. Energy Applications: Applications that utilize assets, optimize processes andreduce risks in the energy supply chain. Energy consumption monitoring andmanagement [10,172], monitoring and optimization of performance in solarenergy plants [167].
7. Smart homes & Cities Applications: Monitoring of vibrations and materialconditions in buildings, bridges and historical monuments, urban noise moni-toring, measuring of electromagnetic fields, monitoring of vehicles and pedes-trian numbers to optimize driving and walking routes, waste management[81].
8. Embedded Mobile Applications: Applications for recommendation of interest-ing groups based on common geo-social patterns, infotainment, and auto-matic exchange of data among mobile devices by inferring trust from socialrelationships. Visual effects streaming workflow will give users on-demand,cloud-based access to visual effects tools, that can be accessed via web, givenenough low-latency bandwidth to maintain a connection for streaming theUser Interface from the cloud. Video Game streaming workflow will give play-ers the option of streaming graphically-rich content that requires near-instantinteraction between the game controller and the graphics on the TV screen[139].
9. Technology Applications: Hardware manufacture, among many others, isimproved by applications measuring peformance and predicting maintenanceneeds of the hardware production chain [139].
Roadmap: Our chapter is organized as follows: Sect. 2 discusses existent surveysconcerning modelling, simulation and performance evaluation in the examinedbibliographical field. The association of context-aware computing with socialnetworks is given in Sect. 3. Infrastructure efficiency of deployed data centersfor the distribution of social content is analyzed in Sect. 4 in terms of softwaresolutions, as well as data center scheduling frameworks. Section 5 presets a cat-egorization of most predominant models for the depiction of the informationdiffusion process in a social network. Section 6 discusses various architectures,systems and techniques for efficient content distribution based on social datastreams, along with diverse studies that corroborate them as well as the way 5Gnetwork infrastructure affects the social data streams. Section 7 concludes andfinally gives the outline of future research directions.

98 I. Kilanioti et al.
2 Related Work
In a manner that resembles the utilization of social data streams Anjum etal. [21] review the deployment of peer-assisted content delivery solutions. Theypresent challenges caused due to heterogeneity in user access patterns and thevariety of contextual information, such as interests and incentives of InternetService Providers, End-Users and Content Providers. Furthermore, Perera et al.[139] survey context awareness from an IoT perspective. They indicate that thetechnology in the IoT is expected to enable expansion of conventional contentdelivery systems to a broader network of connected devices. They systematize thecollection, modeling, reasoning, and distribution of context in relation to sensordata in a work that resembles the social data harvesting in terms of volume,variety and velocity. The survey also addresses a broad range of methods, models,systems, applications, and middleware solutions related to context awareness inthe realm of IoT, that could be potentially applicable to social data streams, too.
In [111] Kilanioti et al. study various experiments on a modified contentdelivery simulation framework and compare miscellaneous policies for dynamiccontent delivery based on analysis of social data streams. The incorporation ofan OSN-aware dynamic mechanism becomes indispensable for content deliveryservices, since (i) significantly large proportion of Internet traffic results frombandwidth-intensive multimedia content, that is produced via online media ser-vices and transmitted over OSNs, and (ii) multimedia content providers, suchas YouTube, often rely on ubiquitous content distribution infrastructures. Thepolicies presented take patterns of user activity over OSNs and exploit geo-socialproperties of users participating in extensive retransmissions of items over OSNs.The authors proceed to incorporate diverse caching schemes of the underlyinginfrastructure, miscellaneous policies for the handling of OSN data and variousapproaches that take into account the most efficient timing for content place-ment. The simulation framework introduced in [107] serves in this study as thebasis of further parameterized content delivery experimentation that exploitsinformation transmission over OSNs and decreases replication costs by selec-tively copying items to locations where items are bound to be consumed.
Downloads of large size multimedia contents are explored through severalstudies together with techniques that try to reduce doubled content transmis-sions using intelligent caching strategies in mobile networking [14,23,101]. Themain idea is redistribution of mobile multimedia traffic in order to eliminateduplicated downloads of popular contents. Intelligent caching strategies wouldenable access to popular contents from caches of nearby nodes of a mobile net-work operator. Those strategies allow content providers to reduce access delays tothe requested content. Many caching algorithms for content distribution alreadyexist [23]. Efficient caching strategy could enhance the energy efficiency of 5Gnetworks, thus the cooperative caching architecture is presented in [101]. Thisstrategy addressed the increasing demand for mobile multimedia and data ser-vices in energy efficiency in emerging 5G systems using content caching anddistribution.

Towards Efficient and Scalable Data-Intensive Content Delivery 99
We are not aware of surveys in the bibliography suggesting an holistic app-roach for the utilization of social data streams towards facilitation of contentdistribution decisions and social analysis tasks other than [108]. The diverseparameters we review in this work (modelling, simulation, performance evalua-tion) take into account low-level decisions and high-level considerations, includ-ing energy efficiency of employed data centers, in-memory keeping solutions andvarious network approaches for time-critical applications. We review combinedaspects such as optimal route selection, data redundancy, data localization anddata center optimizations.
3 Social Networks and Context-Aware Computing
A social network is a network of social bindings between people. Computer-Supported Cooperative Work (CSCW) has contributed much in offeringadvanced collaborative systems for leveraging human connections and improv-ing human interactions in workspace environments, but these systems mostlyfocus on business-driven interactions where connections among people tend tobe formal and structured [43]. Recently however, social and computing disciplinesfocused specifically on the design of social-networking services, i.e. applicationsthat support human social interactions and can be more informal.
The advancement of wireless networks, as well as mobile, context-aware andubiquitous computing, enabled the improvement of social-networking services byenabling social encounters between proximate users with common interests in ananywhere and anytime fashion, as in Ubiquitous Computing systems [43]. Thus,there has been a shift of the application focus from virtual to physical socialspaces using ubiquitous technologies [43]. This shift introduces a great number ofpossibilities, however it also introduces a number of challenges that are related toubiquitous computing. While social-network systems for ubiquitous computingenvironments are an emerging trend in social computing, due to the fact thatubiquitous-computing environments are more dynamic and heterogeneous thanInternet based environments, appropriate solutions and design guidelines arerequired to facilitate their ubiquitous aspect.
Ubiquitous Computing, first introduced in the nineties, refers to the shift-ing of the computing paradigm from the desktop Personal Computer (PC) to amore distributed and embedded form of computing [170]. Together with Perva-sive Computing (for many these terms are synonymous), Ubiquitous Computingintroduced the concept of “anywhere, anytime computing”, allowing users tointeract with computers embedded in every-day objects in an“anywhere andanytime” manner. Ubiquitous Computing specifies also that the interaction ofusers with such devices must be straightforward to the degree that the userwould not be aware of such an interaction. Thus, in order for ubiquitous andpervasiveness to be achieved, computers must disappear from the front-end, beembedded to common objects that humans use daily and provide computationaland informational services without expecting from users to explicitly and con-sciously interact with them.

100 I. Kilanioti et al.
Challenges in Ubiquitous Computing can be categorized to (Want and Per-ing [170]): (i) power management issues: refers to how mobile devices deal withprocessing power and storage space and the kind of wireless technology to use inevery given situation, (ii) limitations in connecting devices: this issue has to dowith how all these small devices will be connected and managed, (iii) user inter-face issues: since Ubiquitous Computing demands for many different small-scaledevices of various types of interfaces and displays of various sizes, the challengein user interfaces lies in developing user friendly and interactive interfaces to thelevel where users will be motivated in using them, (iv) issues related to LocationAware Computing. Henricksen et al. [88] add to the above list the challengeof managing heterogeneous devices of different hardware and software specifi-cations, such as sensors and actuators, embedded devices in objects such asshoes, home and office appliances such as videos, mobile devices and traditionaldesktop computers, in order for these devices to interact seamlessly. Anotherchallenge they mention has to do with maintaining network connections whiledevices move between networks of different nature and characteristics. In ubiq-uitous environments, people tend to use many devices simultaneously, thereforethere is a need for these devices to communicate and exchange data. Anotherchallenge Satyanarayanan [152] notes is tracking user intentions. This is impor-tant in Pervasive Computing in order for the system to understand what systemactions could help the user and not hinder him/her.
An important challenge on context-awareness is to build context-aware sys-tems that detect and manipulate the context in a human-like manner, i.e. makingdecisions proactively based on the context and provoke actions based on thosedecisions that assist the user through his/her task; the aforementioned shouldbe done without any user participation or disturbance, except maybe in case ofemergency. Another important issue is obtaining contextual information. Con-textual information can be any information related to the user, the computingsystem, the environment of the user and any other relevant information regardingthe interaction of the user and the system [63]. User’s personal computing spacecan be used as the user’s context (any information regarding the user takenfrom her personal profile, calendars, to-do lists etc.), various types of contextcan be sensed in real time like location, people and objects nearby, while contex-tual parameters could also include the current emotional and physiological stateof the user. Contextual challenges also include the way context is represented(ontologies can be used or other context modeling techniques), the way this infor-mation is to be combined with the system information, as well as how frequentlyshould context information be considered. Hinze and Buchanan [90] differen-tiate the static context from the fluent context. An example of static contextis users profile information, while fluent context is dynamic, real-time context,e.g. time. The authors propose that a context model should be defined for eachimportant entity, such as the user, the locations, etc. The authors mention aschallenges the capturing of the context (whether it should be done automaticallyat particular times or manually by the user) and the process of storing the con-text (whether it should be stored on the client, on the server or both). On the

Towards Efficient and Scalable Data-Intensive Content Delivery 101
process of accessing contextual information, Hinze and Buchanan propose thatcontext-awareness can help in reducing the amount of data to be accessed in realtime, by pre-retrieving any relevant pre-known data, e.g. the static context [90],to increase efficiency.
User modelling in another challenge in developing ubiquitous systems. Usermodeling in ubiquitous environments is challenging: a user often changes rolesdepending on the context and the current environment he acts into; the bigchallenge is how to capture these changes and how to react on them [90].
Perhaps one of the most important contextual parameters is location, as itplays an important role in context-aware systems and ubiquitous systems. Anissue with location as a contextual parameter is the type of location sensingtechnology to be used, while privacy is another issue. The issue with privacy iswhether user privacy should be sacrificed for location awareness and to whatextent. A third issue is the semantic (and contextual) representation of the loca-tion in order to utilize more contextual parameters than just the location itself.For example, by semantically representing locations, one can attach to themvarious information resources such as a webpage, a user profile, various objectswith semantic representation etc. Schilit et al. [154], proposed the movementfrom the simplified concept of location to more contextually rich notions ofplace where people and activities should also be considered. Possible problemstowards this concept include the difficulty in managing large scale positioningdata, privacy concerns regarding location-awareness and the challenge of how toassociate information objects, such as a web page, with a real-world location. Pri-vacy issues regarding location-awareness are related to human psychology: usersoften consider privacy issues when their location is to be known by a system, butat the same time they provide private information such as credit card numbersand addresses to online systems without hesitation. This happens because inthe first case they simply do not see the benefit of providing their location tobe used by a simple application (e.g. finding friends in the proximity), while atthe latter case they clearly see the benefit of buying goods online. The authorsalso argue that the centralized nature of the most location tracking applications(having a central server on which all user personal data are stored) discouragesusers from providing any personalized information, because centralized data canbe accessed by anyone, not only illegally (e.g. hackers) but also the government,corporations with interest in user data (e.g. advertisers) etc. A solution can bethe use of a decentralized schema where any personal data is stored and calcu-lated on the client side, i.e. the user’s device. An example of such a technology isthe well known Global Positioning System (GPS): the client device uses satellitelinks to calculate locally the user’s current position.
Context-Awareness and Adaptation related challenges and issues include
1. Modelling the context: which method is more appropriate to use2. Observing the context: automatically or manually3. Context sensing: how are contextual parameters retrieved (sensors, user
profiles etc.). In retrieving context data from various sources (e.g. sensors),how are inconsistencies between these data resolved

102 I. Kilanioti et al.
4. Accuracy of contextual information should be well known during thedesign of ubiquitous systems
5. Storing the context: on server (privacy issues), on client or on both6. Accessing the context7. Using the context8. How are the user and the environment connected and interact9. How will the application modify its behaviour (be adapted) based
on the context10. Systems should be more context-aware than just the location. A
place is more than a location (also a Location related challenge)11. Devices should not operate based only on their own context, but
based on the context of the whole system12. Contextual information should be used to reduce the amount of
input that is needed from users (also a Human-Computer Interactionrelated challenge)
13. How to capture changes in the user’s role deals with capturing thecurrent context (i.e. the environment and the various circumstances) anduser modelling (what possible role could a person play according to context)
14. Context should be processed and various components shouldadapt to it without interfering with user’s task – no user explicitinteraction should be necessary
15. Adaptation in ubiquitous environments: may need to adopt variousdevices separately and at the same time, while the user maintains a consis-tent view for the system/application
Context-aware computing has evolved over time from desktop applications,web applications, mobile computing, pervasive/ubiquitous computing to IoTover the last decade [139]. Context-aware computing became more popular withthe introduction of the term ‘ubiquitous computing’ by Mark Weiser, whilethe term ‘context-aware’ was first used by Schilit and Theimer [155] in 1994.Context-aware computing has proven to be successful in understanding sensordata. Advances in sensor technology led to more powerful, cheaper and smallersensors. The number of employed sensors is expected to grow over the nextdecade [161], generating ultimately big data [139,140].
In settings where social communities become mobile, i.e. users not only inter-act, meet and communicate via social networks, but are mobile as well (moveinto the environment, interact with others, etc.), the concept of group awarenessis met [53,134,176] where context related to the group is exploited to enableubiquitous applications and services to function and serve people’s concerns andneeds in a pervasive manner. There is a need, thus, for formulating dynamiccommunities aiming to facilitate people in performing common tasks. It is oftenthe case that such dynamic communities are resolved after the current goalshave been achieved [134]. It is evident, thus, that the context within which suchdynamic communities are created, act, achieve goals and are then resolved isimportant, and that, through this context, we can understand the groups’ inter-ests and, thus, personalize the applications and services offered [134].

Towards Efficient and Scalable Data-Intensive Content Delivery 103
A bibliography study [134] on mobile social network applications and plat-forms states that the context features that these applications and platforms usecan be summarized as follows: Location, Interest, Time, Personal, Activity andSocial Interaction. Here, context is “any information that can be used to char-acterize the situation of an entity” [62] and social context is “the informationrelevant to the characterization of a situation that influences the interactions ofone user with one or more other users” [169]. Moreover, in [134] a context-awareMobile Social Network model is proposed aiming to facilitate the creation ofdynamic social networks based on a combination of multiple contexts, includinglocation, users’ profile, domain specific data and OSN data, along with servicesfor fostering the interaction among users.
4 Infrastructure Efficiency
4.1 Software Solutions for Infrastructure Efficiency
Regarding infrastructure efficiency, various models have been proposed for theoptimization of such infrastructures that support social networks data centers.These approaches have also been proposed by industry partners addressing var-ious challenges [42,129,163]. Among these challenges, the following have beenidentified: (a) data volume increase, (b) confinement, (c) interactions made inreal-time or near real time, (d) federation of data center infrastructures and (e)cdn-load-balancing between data centers, but usually not focused on cost effec-tiveness. One of the main data center costs is energy consumption of both theIT equipment as well as the supporting Mechanical and Electrical (M&E) infras-tructure. A widely used indicator that measures the energy effectiveness of theM&E infrastructure overhead is Power Usage Effectiveness (PUE) [25], whichis calculated as the Total facility energy/Total IT energy and has a theoreticalminimum of 1.
Figure 2 shows the categories on which the research community and otherstakeholders have developed solutions for the improvement of costs and effi-ciency:
– Workload Consolidation and Shut-down Techniques,– VM Consolidation and Migration,– Data Replication and Placement, and– Energy-aware Scheduling Algorithms.
The main objective based on these solutions is to reduce the idleness ofcomputing and storage nodes (throttle resources), while switching off unusedmachines without jeopardizing Service Level Agreements. Some representativeexamples from each category are shown in Table 1.
Regarding Workload Consolidation and Shut-down Techniques,heuristics for energy-aware consolidation of jobs and maximization of resourceutilization are presented in [117]. These approaches estimate resource consump-tion in terms of CPU utilized by tasks and encourage resources to execute mul-tiple tasks in parallel. The proposal from [102] is an algorithm that search for a

104 I. Kilanioti et al.
minimum multi-objective function, taking into account energy-consumption andrunning time by combining resource allocation and heuristic rules and simulatingDirected Acyclic Graph (DAG) based workloads.
One of the most popular approaches to increase efficiency is to switch off idleservers [75,78], which is usually tested in dedicated simulation tools [74]. Severalmodels, including games theory models [72,73], are used to balance oppositerequirements in data centers, such as performance and energy consumption.Even models utilized for economic environments, such as Data EnvelopmentAnalysis, are employed to analyze the efficiency in various realistic large-scaledata centers and propose corrections to improve data-center efficiency [76].
In addition, techniques for energy conservation like Virtual Machine (VM)Migration and Consolidation are widely studied and already employed. In[35], a resource manager solution focused on virtualized data centers, whichenables lower energy consumption by applying VM migrations and allocationsbased on current CPU usage, is proposed. An extension of VM migration is pre-sented in [34] where Service Level Agreement (SLA) restrictions are considered.Allocation and migration of VMs is also the target in [159] where a BayesianBelief network algorithm is presented. Moreover, a day/night pattern is takeninto account for an energy manager in [148], based on the aggregation of trafficduring low usage periods and shutting down idle machines.
Solutions for improving energy proportionality through Data Replicationand Placement, are also available. A power-proportional distributed file systemapproach that tries to store data on non-overlapping subsets of machines ispresented in [18]. Such subsets of machines contain only one copy of each file andadministrators can decide how many subsets will be turned on to serve incomingrequests. On the other hand, a division of the cluster in non-overlapped zonesis proposed in [162], enabling operators to shut down zones. In a similar way, in[105] the authors present a variation of the Hadoop File System (HDFS) thatdivides the cluster in Hot Zones that store recent data and Cold Zones where low[e.g. spatial or temporal] popularity files are stored. Then a power off policy isapplied to the Cold Zones. A non-uniform replica placement on data popularityis also presented in [125].
Energy-Aware Scheduling Algorithms is the last family of solutions.A green scheduling algorithm based on neural networks is proposed by [68],focusing on the prediction of workload demand with the purpose of applyingpower-off policies to idle servers. Experiments presented simulate a medium sizeddata center that runs homogeneous workload that is intended to respond to end-user requests. Energy-aware scheduling policies combined with Dynamic Voltageand Frequency Scaling (DVFS) is presented in [100]. In [77], a multi-objectivescheduling algorithm is proposed, based on genetic algorithms, which takes intoaccount energy efficiency, performance and security constraints.
We have classified the related word under consideration in terms of theirfinal objective, including: (a) modelling, (b) simulation, (c) performance. Suchclassification is shown in Table 2.

Towards Efficient and Scalable Data-Intensive Content Delivery 105
Table 1. Related work summary
Ref Title: Performance evaluation of a green scheduling algorithmfor energy savings in cloud computing
Savings
[68] ∼ 45%
Category: Workload consolidation and power off policies (power offpolicy based on a neural network predictor)
Evaluation: [8-512] nodes cluster simulation
Workload: End user homogeneous requests that follow a day/night pattern
Ref Title: Energy efficient utilization of resources in cloudcomputing systems
Savings
[117] [5-30]%
Category: Workload consolidation and power off policies (energy-awaretask consolidation heuristic based on different cost functions)
Evaluation: Simulation of a not stated size cluster
Workload: Synthetic workload in terms of number of tasks, inter arrivaltime and resource usage
Ref Title: Saving energy in data center infrastructures Savings
[148] [20-70]%
Category: Workload consolidation and shut-down techniques (safetymargin power-off policy)
Evaluation: 100 and 5000 nodes cluster simulation
Workload: Synthetic workload that follows a day/night pattern
Ref Title: Energy efficient resource management in virtualizedcloud data centers
Savings
[35] ∼ 80%
Category: VM consolidation and migration
Evaluation: 100 nodes cluster simulation using CloudSim
Workload: Synthetic workload that simulates services that fulfill thecapacity of the cluster
Ref Title: dynamic energy-aware scheduling for parallel task-basedapplication in cloud computing
Savings
[102] [20-30]%
Category: Energy-aware scheduling algorithms (polynomial-time andmulti-objective scheduling algorithm for DAG jobs)
Evaluation: Experimentation on a 64 nodes cluster
Workload: Synthetic directed acyclic graph-based workload
4.2 Data Center Scheduling Frameworks
Resource managers have direct impact on the efficiency of the infrastructure sincethey are responsible for the application of energy-aware scheduling models. Theresponsibility for actually deciding resource negotiation and tasks deploymenthave range from traditional approaches to fully managed solutions such as datacenters which are used by many entities with multiple users and various kind ofapplications and requirements [30,38].

106 I. Kilanioti et al.
Table 2. Classification of approaches according to their objective. The green colorrepresents that the work focuses strongly on that objective, and the red color representsopposite.
The constraints imposed by diverse applications in terms of size, inter-arrivaland duration, may lead to various resource efficiency, latency rates and securitylevels.
Current trends aim to utilize the same hardware resources to deploy variouskind of applications and frameworks with diverse requirements, which increasesthe complexity since diverse data are to be processed.
We present the main categories of the scheduling resource-managing mod-els following several approaches and we show their limitations summarized inTable 3.
Monolithic models, where a centralized manager is responsible for all schedul-ing and resource managing decisions came first. Such models [96] are a goodchoice when the workload is composed of a relative low number of Batch jobs,due to these schedulers being omniscient [55], since such kind of workload doesnot usually have strict latency requirements [60]. Monolithic resource managersperform near-optimal scheduling operations [58,85,175] as they are able to com-pletely examine the data center. This detailed inspection allows the determi-nation in terms of performance implications and impact on shared resources.[83,128,133,158,173]. Due to this detailed cluster inspection, monolithic central-ized schedulers usually utilize resources at a higher level than other approaches[168]. Monolithic centralized schedulers also achieve high-quality decisions whichresult in shorter makespans, near-optimal load balancing and predictable per-formance and availability [59,156,177].

Towards Efficient and Scalable Data-Intensive Content Delivery 107
Table 3. Cluster scheduling approaches.
Frameworks Strategy Optimal environment Near-optimalenvironments
Paragon [58] Centralized Low number of long-running andnon-latency sensitive jobs
Mid and high number ofjobs
Quasar [59] Monolithic Mixed workloads
Borg [168]
YARN [166] CentralizedTwo-level
Mid number of diverselong-running, non latencysensitive jobs
Latency-sensitiveworkloads
Mesos [89]
Omega [156] CentralizedShared-state
Mid number of heterogeneousworkloads
High number of short andlatency-sensitive jobs
Canary [142] Distributed High number of short, nonresource-demanding,latency-sensitive jobs
Long,resource-demanding jobs
Tarcil [60] Mixed workloads
Sparrow [137]
Mercury [103] Hybrid Mixed workloads composed of90% of short, latency-sensitivejobs and 10% oflong-running,resource-demandingjobs
Homogeneous workloadsOther workloads patternsEvolving patterns
Hawk [57]
Eagle [56]
With the arrival of new computation paradigms such as microservices, cur-rent trends tend to divide jobs into smaller parts which usually are more latency-sensitive. This new scenario with huge amounts of small jobs overcome the capac-ity of Monolithic models. Two new centralized resource managing models wereproposed to overcome this limitation by dividing the responsibility of resourcemanaging and scheduling:
– Two-level resource managers, such as Mesos [89], and YARN [166] employa central resource manager which coordinates a set of independent sched-ulers. The parallel schedulers pessimistically block the data center in orderto make a scheduling decision. Such manager offers resource schedulers, andas a response, the set of schedulers perform scheduling decisions for decidingwhich machines will execute a particular task. The down side of this modelis that, opposed to Monolithic models, the schedulers are not omniscient. Inthis model, data-center state and tasks requirements are not always availableto make optimal scheduling decisions.
– Shared-state resource managers, such as Omega [156], employ a centralizedmanager which orchestrates a set of parallel scheduling agents. In contrast toTwo-level resource managers, each scheduling agent makes scheduling deci-sions based on a partially out-of-date copy of the whole data-center state.

108 I. Kilanioti et al.
Instead of blocking the data center to apply their decisions, they follow atransactional approach. If a transaction ends up in a conflict, the data-centerstate is requested and the scheduling restarts.
However, all the aforementioned proposals suffer from a performance bot-tlenecks when huge latency-sensitive workloads composed of millions of tasksare under consideration, as they employ centralized coordinators for resourcemanaging or even for resource managing as well as scheduling [137].
Distributed schedulers such as Sparrow and Canary [67,137,142,143] arebuilt to work optimally when the aforementioned scenarios are considered.Distributed models employ faster and simpler algorithms in order to analyzesmaller areas of the data center, which leads to sub-optimal decisions with higherthroughput and lower latency rates.
The frameworks and applications served by data centers are constantly evolv-ing. Current trends show that in most cases heterogeneous workloads are beingdeployed in large-scale realistic clusters [50,145]. Such workloads are composedby two main kinds of jobs: (a) Jobs such as web servers and data-center frame-works, which represent 10% of jobs. These jobs consume, however, more than80% of computing resources because they run for long periods; and (b) Jobs suchas MapReduce tasks, which represent 90% of jobs. These jobs run for shorterperiods and consume less than 20% of computing resources [19,144,147,175]. Insuch environment, sub-optimal scheduling operations may severely impact on theaforementioned large jobs. Hence, distributed models may achieve worse resultsin terms of performance compared to those achieved by centralized models.
Finally, hybrid models, such as Hawk and Mercury [56,57,103] were devel-oped to work well under the aforementioned scenario. These models employcentralized and distributed approaches in order to overcome the limitations dis-cussed. Hybrid models use a centralized scheduler for long-running jobs to pro-vide high-quality scheduling and, on the other hand, they employ a distributedapproach for those short jobs which need quick scheduling to achieve latencygoals.
Beyond workload consolidating and resource throttling, other research hasexplored the impact IT hardware refresh and optimization could have on datacentre energy consumption [31]. Additionally, it was shown that addressingenergy efficiency at the design stage of software systems presents a significantopportunity to reduce infrastructure energy consumption [32].
5 Content Diffusion Models for Social Data Streams
This section outlines the most predominant models for the depiction of the con-tent/information diffusion process in a social network described in [108]. Mostof the existent algorithmic solutions for content distribution are built on them,thus the assumption that content circulation over social data streams is depictedby one of them is of crucial importance for the suggested solutions. The mainalgorithmic problems studied in the bibliography are related with the discoveryof nodes that are most prone to diffuse content to the greatest extent, and the

Towards Efficient and Scalable Data-Intensive Content Delivery 109
categorization of nodes according to their influence degree. The categorizationof the models is depicted in Fig. 4. The models presented are the most recent inthe bibliography and there are no prior recent models to the best of our knowl-edge. The first-level discrimination of models is based on whether they takethe structure of the network into consideration (network-aware) or not (holis-tic). In other words the discrimination criterion is if they incorporate knowledgeabout underlying associations of the nodes (edges) or, to the contrary, follow anaggregate-level approach.
Information Diffusion Models Classification. Li et al. in [120] classify informa-tion diffusion issues as a “3W issue”, that is with regard to “What”, “Why” and“Where”. They consider “What” to refer to the question“what latent informa-tion is there to be found in social networks?” and they provide as an example thefindings, such as the way that an individual’s shopping habits relate to his/herprofession, that can be included in a large volume of consumer data. Further-more, their proposal considers “Why”, to refer to the question“why has theinformation propagated in this way?” This question refers to the factors thathave affected the diffusion result, for example the factors that have produced aparticular social cascade. Finally in their view “Where”, refers to the question“where will the information be diffused to in the future?”. This question refersto the future diffusion path that will be followed. For example if two influentialusers receive the same information from a common contact in a social network,but have a different perspective on the information, then it is important to esti-mate how they will respond and whether they will propagate the informationthrough the network.
Based on the “3W issue” they classify information diffusion models as predic-tive and explanatory. Explanatory models aim to discover answers to importantquestions concerning the information diffusion process, such the determination ofthe main factors that affect information diffusion and the most influential nodesin the network. Predictive models, on the other hand, are used to predict thefuture information diffusion process in social networks based on certain factors,for example the quality of information diffused.
In a similar manner Luu et al. in [126] classify information diffusion modelsin non-network and network diffusion models. The former refers to user commu-nities without any knowledge about the user relationship network and the latteris more applicable to the social networks where user relationships networks aregiven (e.g. Facebook, blog networks). For each model category Luu et al. describerepresentative models, notable model extensions, as well as model applications.The surveyed applications include Influence Maximization and ContaminationMinimization. Model extensions are asynchronous models that incorporate timedelay factors into the basic models.
An important class of information diffusion models are inspired from naturaland biological systems. A typical example is provided by Dewi and Kim [61], whopropose a bio-inspired model for information diffusion in complex networks usingant colony optimization. The model introduces selfishness in forwarder nodes andunacquainted nodes and employs ant colony optimization to find shortest path

110 I. Kilanioti et al.
and manage the selfish nodes and disjoined nodes. The authors provide simula-tion results in two types of networks: lattice networks and scale free networks,and the results show that the ant-colony model has higher performance andhigher reachability than a selected baseline epidemic model.
Influence Maximization. Influence maximization is an important issue in socialnetwork analysis domain which concerns finding the most influential nodes ina social network. Determining the influential nodes is made with respect toinformation diffusion models and is based on the observation that most of theexisting models only contain trust relationships. In this respect Hosseini-Pozvehet al. in [93] classify influence maximization models in two classes: cascade-based and threshold-based. They evaluate all models in comparison with selectedbenchmark models through two real data sets, the Epinions and Bitcoin OTC.Based on the evaluation results a main conclusion is drawn: when a distrusteduser performs an action or adopts an opinion, the target users may tend not todo it.
The efficiency of influence maximization algorithms is subject to activeresearch since the problem is known to be NP-hard. In this respect Kempe et al.proposed a greedy algorithm (referred to as SimpleGreedy) that guarantees 63%influence spread of its optimal solution [106]. Along this line Ko et al. in [113]propose an improved algorithm, termed Hybrid-IM, which by combines PBIM(Path Based Influence Maximization) and CB-IM (Community Based InfluenceMaximization). Ko et al. further provide evaluation results from extensive exper-iments with four real-world datasets. They show that Hybrid-IM achieves greatimprovement (up to 43 times) in performance over state-of-the-art methods andfinds the seed set that provides the influence spread very close to that of thestate-of-the-art methods.
5.1 Holistic View Models
Rogers’ theory [150] is quantified by the Bass model [33]. The Bass model isbased on the notion that “the probability of adopting by those who have notyet adopted is a linear function of those who had previously adopted” (F.Bass).It predicts the number of adopters n(t) ∈ N of an innovation at time t (in theinformation diffusion scenario the number of retransmitters of an informationpiece):
n(t) = pM + (q − p)N(t) − q/M ( N (t))2 (1)
where N(t) is the cumulative number of adopters by time t, M is the potentialmarket (the ultimate number of adopters), p ∈ [0, 1] is the coefficient of innova-tion (the external influences, expressing the individuals influenced by the massmedia), and q is the coefficient of imitation (internal influence, expressing theindividuals influenced by the early adopters). This approach, however, largelyignores the underlying network structure.

Towards Efficient and Scalable Data-Intensive Content Delivery 111
Models under the same concept of holistic view of the social behaviour makeuse of differential equations, and include, among others, the “multi-step flowmodel” by Katz and Lazarsfeld [104], the Daley-Kendall rumours model [54],and also, more recent ones, such as, the Van den Bulte and Joshi model ofinfluentials and imitators [47].
Fig. 4. Content/information diffusion models
5.2 Network-Aware Models
These include completely novel models, but also variations of the afore-mentioned (holistic) models, such as the Nekovee variation [136] of the Daley-Kendall model, and are separated in following categories, based on whether theyare mathematically formulated (Analytical models) and then applied or are theoutcome of empirical methods, such as regression, regression trees etc. (Empiricalmodels).
Analytical Models. The first mathematical models based on nodes’ thresholdsfor the depiction of information diffusion were developed by Schelling [157] andGranovetter [86]. A categorization of the most predominant models is presented.
Game-Theoretic Models. In [112], Kleinberg proposes a simple networked coor-dination games model. The author assumes that there are two behaviours a nodev ∈ V in the graph G = (V,E) can follow, A and B. The model is based on thenotion that for each individual the benefits of adopting a new behaviour increaseas more of its neighbours adopt the new behaviour. At discrete time steps eachnode updates its choice of A or B according to the behaviour of its neighbours.The objective of the nodes is to switch each time to the behaviour that reapsthe maximum benefit for them. For the nodes v and w there is a motivation for

112 I. Kilanioti et al.
behaviour matching, expressed in the following way, where parameter q is a realnumber 0 < q < 1:
– if v and w both choose behaviour A, they both receive a q payoff– if v and w both choose behaviour B, they both receive a 1 − q payoff– if v and w choose different behaviours, they both receive a 0 payoff
v’s payoff for choosing A is qdAv and for choosing B is (1 − q)dB
v . The overallpayoff for v playing the game with its neighbours in G is the sum of the individual(pairwise) payoffs; q is actually the threshold expressing the fraction of adoptingneighbours, since it easily results that v should adopt behaviour B if dB
v > qdv,and A if dB
v < qdv, where dv is the degree of the node, dAv the number of
its neighbours with behaviour A and dBv the number of its neighbours with
behaviour B.Initially there is a set S of nodes adopting behaviour B and hq(S) is the set
of nodes adopting B after one round of updating with threshold q. hkq (S) is the
set of nodes adopting B after k successive rounds. A set S is contagious (withrespect to hq) if “a new behaviour originating at S eventually spreads to the fullset of nodes”and the contagion threshold of a social network G is“the maximumq for which there exists a finite contagious set”.
The technical issue of progressive or non-progressive processes (monotonousor non-monotonous as referred to later on in the present study) refers to the factthat when a node v following till then the behaviour A updates to behaviourB in time step t, it will be following B in all subsequent time steps. Although,intuitively, we would expect progressive processes to give finite contagious setsmore easily (because of lack of early adopters setbacks that would hinder thecascade), Kleinberg points out that both the progressive and non-progressivemodels have the same contagion thresholds [131], which in both cases is at most1/2 (“a behaviour can’t spread very far if it requires a strict majority of yourfriends to adopt it”) [131].
More game-theoretic models can be found in the work of Arthur [22], whoproposes a simple cascade model of sequential decisions with positive externali-ties, manifested by a term that adds to the payoff of a decision. Namely in thescenario of two competing products, the latter become more valuable as theyare used by more users (for a social media site or a smartphone, for example, itwill aquire better third-party applications and support as its users grow). Alsogame-theoretic models are introduced by Banerjee [29] and Bikhchandani et al.[39], that are based on influence not due to positive externalities, but because ofinformation conveyed from earlier decisions. The proposed game-theoretic mod-els, however, have the drawback of not taking heterogeneity into consideration,in the notion that all nodes have the same threshold, and all their neighbourscontribute the same in making a node change its behaviour.
Bayes-Based Models. Combining nodes’ private information and their observa-tions of earlier adoptions, in [69], Kleinberg and Easley present a Bayes basedmodel to formulate information cascades, answering questions such as “What is

Towards Efficient and Scalable Data-Intensive Content Delivery 113
the probability this is the best restaurant given the reviews I have read and thecrowds I see there?”.
Pr [A|B] =Pr [A] Pr [B|A]
Pr [B](2)
Three factors are taken into consideration:
– The states of the world;– Payoffs; and– Signals.
The first factor expresses whether an option is good or bad (if a new restaurantis a good or a bad choice). Supposing that the two options of the world areK (the option is a good idea) and B (the option is a bad idea), the world isplaced in K with probability p and in B with probability 1 − p (Pr [K] = p,Pr [B] = 1 − Pr [K] = 1 − p). Payoffs for a node v are defined as follows:
– If v rejects the option, the payoff is 0.– If v adopts a good idea, it receives a positive vg > 0 payoff.– If v adopts a bad idea, it receives a negative vb > 0 payoff.– If v adopts without any prior knowledge, the payoff is 0.
The signals refer to private information each individual gets about the benefitor not of a decision: a high signal (H) suggests that adoption is a good idea,whereas a low signal (L) suggests that it is a bad idea. If accepting is indeed agood idea, then Pr [H|K] = q > 1
2 and Pr [H|K] = 1 − q < 12 . In the restaurant
example the private information could be a review that an individual reads aboutthe first restaurant, with a high signal corresponding to a review comparing itfavorably to restaurant B. If choosing the first restaurant is indeed good, thereshould be a higher number of such reviews, so Pr [H|K] = q > 1
2 . Kleinberg andEasley [69] consider how individual decisions are made using (Eq. 2) when theyget a sequence of independently generated signals consisting of a number of highsignals and a number of low signals, thus making interesting observations aboutsituations where individuals can observe others’ earlier decision, but do not haveaccess to their knowledge.
The basic propagation models on which most generalizations for informationdiffusion are based are the Linear Threshold Model (LTM) [86,157,171] and theIndependent Cascade Model (ICM) [82] with many proposed extensions (LTM:[106,171], ICM: [82,87,106]) and also a proposed unification [106].
Linear Threshold Model. Based on the assumption that some node can be eitheractive (adopts a new idea/transmits a piece of information) or inactive andtaking into account the monotonicity assumption, namely that nodes can turnfrom inactive to active with the pass of time but not the opposite, we can saythat the LTM is based on the following notion: Each node v has a predefinedactivation threshold θv ∈ [0, 1], which expresses how difficult it is for the nodeto be influenced when its neighbors are active (“the weighted fraction of the

114 I. Kilanioti et al.
neighbors of node that must become active in order for node to become active”),and is influenced by each one of its neighbors w according to a weight bvw,so that
∑w∈Γ (v) bvw ≤ 1. The thresholds can be produced randomly with a
uniform distribution, but some approaches investigate a uniform threshold forall the nodes of the network, e.g. [37]. The process takes place in discrete stepsand the nodes that satisfy the constraint
∑w∈Γ (v) bvw > θv are gradually added
as active to the initial set of nodes. It’s worth mentioning that LTM can resultas a modification of the networked coordinations game referred in the previousparagraph with the differentiation of payoffs for different pairs of nodes.
LTM expresses the idea that the influence of the neighbours of a node isadditive, but when the rule of influence can not be expressed by a simple weighedsum, for example a node becomes active when one of its acquaintances and twoof its co-workers do so, the arbitrary function gv substitutes the weighed sum.In the General Threshold Model for time steps t = 1, 2, 3... a node v becomesactive if the set of active neighbours at t satisfy gv(X) > θv.
Independent Cascade Model. Under the ICM model [82], there is also a setof initially active nodes, the process takes place in discrete steps, but whennode v becomes active, it has only one chance of activating each of its inactiveneighbors w until the end of the process with a probability pvw independent ofthe activations history and with an arbitrary order.
Exact evaluation of activation probabilities is exponential to the number ofedges of the graph. Improving the performance of the works in [86] and [160],there are works studying the calculation of these probabilities such as [84] (basedon a General Threshold Model with the assumption that each parent’s influenceis fixed), or [64] (based on the ICM). In the latter, sampling from the twitterdataset is conducted in an efficient Markov-Chain Monte Carlo fashion usingthe Metropolis-Hastings algorithm [51] and the problem is tackled with twodifferentiations, one of which considering the past paths of data known (retweetsfor the twitter dataset) and one considering only the past path endpoints known(hashtags and urls) and joint probabilities are taken into consideration, reflectingalso model uncertainty.
Epidemical Models. In the case of epidemical models a single activated(“infected”) node causes the change of state of a neighbour susceptible node,whereas in the afore-mentioned threshold and game-theoretic models a node hasto interact with multiple neighbour nodes to evolve (complex contagion).
Epidemical models were introduced on the assumption that informationwould propagate like diseases. They constitute another category with an almoststraightforward pairing with the ICM. The ICM captures the notion of contagionmore directly, and also allows us to incorporate the idea that a node’s receptive-ness to influence does not depend on the past history of interactions with itsneighbors.
Epidemical models variations include the simple branching processes model,where a node infects a number of nodes and the contagion proceeds in subsequentwaves with a probability π. This model is characterized by the basic reproductive

Towards Efficient and Scalable Data-Intensive Content Delivery 115
number of the disease R0 = kπ, where k is the number of new people somebodymeets, which expresses the anticipated number of new cases of the disease thata single node will cause.
Extensions of the epidemical models are the SIR, SIS, and SIRS models: Sstands for susceptible nodes, nodes that have not been infected yet and haveno immunity to the contagion. I stands for infected nodes, nodes contagious totheir susceptible neighbours, and R stands for recovered nodes, with the recoveryconsidered as permanent in SIR and temporary in the case of SIRS [114]. Thesequence of the letters in the acronyms of the models explains the flow of theepidemic. In SIR model nodes pass from the state of being susceptible to thestate of being infected and then recover. In SIS model nodes are immediatelysusceptible once they have recovered (like in the case of common cold, recoverydoes not imply immunity that lasts for long). In the SIRS model recovered nodesfree of infection may rejoin the susceptible nodes.
Markov Chain Models. Markov chains [65] are used to describe transitions fromone state of a system to another in a finite set of possible states. Their mem-oryless nature (Markov property) has to do with the fact that the next stateeach time is independent of the preceding states. More formally: With a set ofstates {ξ1, ξ2, .., ξr} the process moves successively from one state to anotherin so-called steps, and specifically from state ξi to state ξj with a probabilitypij (transition probability) independent of the previous states of the chains, orremains in the same state with a probability pii. A particular state is pickedfrom Ξ as the initial state. Markov chains are usually depicted with a directedgraph, where the edges’ labels denote the transition probabilities.
Markov models are widely used for analysing the web navigation of users.PageRank [45] is based on a Markov model and is used for ranking of infor-mation in the World Wide Web. By assigning weights that denote the relativeimportance of an hyperlinked document in a set of documents, the likelihoodthat a person will reach a specific page through random clicks is, essentially,represented.
In [160], Song et al. use a Continuous-Time Markov Chain Model (CTMC),namely a Markov model that describes the transition among states after sometime of stay in a particular state. This time is exponentially distributed and doesnot affect the transition probability to the next state. The information diffusionmodel is introduced on a network G(V , w, τ). G contains a set V of n nodes andE edges between nodes representing the information diffusion paths. w denotesthe set of the edges’ weights (“amount of information to flow from one node toanother”) and τ the set of the time delay on the information diffusion paths.Thus, the representation of the graph matches the CTMC in the notion thateach node represents a state, each weight a transition probability and the delayis represented as the time-to-stay in each state.
Voter Model. The basic voter model introduced by Clifford and Sudbury [52]and Holley and Liggett [91], is defined in an undirected network and allows thespread of two opinions. In discrete time steps, a node adopts the opinion of a

116 I. Kilanioti et al.
randomly chosen neighbour. For a node v ∈ V in graph G = (V,E), Γ (v) is theset of neighbors of v in G and initially the nodes are arbitrarily endowed with a0/1 state. At time step t each node adopts the opinion of one uniformly pickedneighbour. With an initial assignment f0 : V → {0, 1} inductively we define
ft+1(v) =
{1, with probability a0, with probability b
(3)
where a = |{u∈Γ (v):ft(u)=1}||Γ (v)| and b = |{u∈Γ (v):ft(u)=0}|
|Γ (v)| .Even-Dar and Shapira [70] argue that it is one of the most natural prob-
abilistic models to capture the information diffusion in a social network. It issuitable for depicting the spread of a technological product, as it is proved thatunder this model consensus is reached with probability 1. Even-Dar and Shapirarefer to the (almost) consensus of products such as Google as a search engine,YouTube as a video-sharing website etc.
Models from Physics. Models from physics include the Ising model [97] servingfor the description of magnetic systems, and bootstrap percolation [16] servingfor the description of magnetic systems, neuronal activity, glassy dynamics, etc.
The Ising model [97] was first proposed in statistical physics and encompassesthe notion of a ground state (in physics the state with the minimum energy),and that of the “self-optimizing” nature of the network.
Similarly to the basic voter model, there can be two competing “opinions”,in favour of or against a subject, let’s say depicted by a “+1” and a “−1”, whichin physics express the correspondence of an atom forming a network to a spinvariable (can be considered as the basic unit of magnetization) state σi = ±1.The total energy of the system under this model (Hamiltonian) is defined as:
H = H(σ) = −∑
<i,j>
Eσiσj −∑
i
Jσi (4)
for each configuration σ = (σ1, ..., σN ), with the parameter J associated withan “external magnetic field” and E with the“nearest-neighbours interaction”, Nthe number of the atoms. The ground state is the lowest energy configuration sg
(in physics the zero temperature configuration), so that sg ∈ argminsH(s). In asocial network can be seen as the state with the most likely opinion, minimizingconflicts among its members (atoms).
In the standard bootstrap percolation process [16] a node is initially eitheractive with a given probability f or inactive. It becomes active if k (k = 2, 3, ...)of its nearest neighbors are active. In that notion it resembles the k-core problemof random graphs [124], where k-core is the maximal subgraph within which allvertices have at least k neighbors, but whereas bootstrap percolation starts froma subset of seed vertices according to the above-mentioned activation rule, thek-core of the network can be found by a subsequent pruning of vertices whichhave less than k neighbors.

Towards Efficient and Scalable Data-Intensive Content Delivery 117
Empirical Models. Before the advent of machine-readable traces, the potentialof networks in the transmission of information and messages was stated alreadyby Milgram in his renowned experiment [130] or Christakis [79], who suggestedin a study of 12000 participants that risks, such as the risk of becoming obese orbenefits, such as stopping of smoking, are propagated through social ties. However,it is large scale and time-resolved machine-readable traces that, through the step-by-step track of interactions in OSNs (although not compulsorily easily accessible/collectible), have driven to the formulation of a plethora of empirical models.
Some generic observations concerning the empirical models are the following.Many of them lack insight of information content, unlike works, such as that ofHuberman et al. [24], who formulate a model taking into consideration solelythe features of an information item (a news item in Twitter). Sometimes thediscovered patterns in empirical models are at odds with the predictions basedon theoretical (analytical) models. For example, in unison with the epidemicalmodel, Leskovec et al. in [119] claim that cascades (depicting the blogosphereinformation diffusion) are mostly tree-like. More specifically, they notice thatthe number of edges in the cascade increases almost linearly with the number ofnodes, suggesting that the average degree in the cascade remains constant as thecascade grows (a trees property). Moreover, Leskovec et al. claim that these treesare balanced, as they notice that the cascade diameter increases logarithmicallywith the size of the cascade. In contradiction to the above, the trees derivedfrom the chain-letter diffusion model of Liben-Nowell and Kleinberg in [121] areinconsistent with the epidemic model, as they are very narrow and deep, withthe majority of their nodes having one child and a median distance from theirroot to the their leaves being of hundreds steps.
Precisely, in [121] the spread of a chain-letter is represented by a tree. Copiesof the chain-letter represent paths through the tree, the root represents theoriginator and the leaves represent the recipients of a message (w is a child ofv if w appends its name in the copy of the letter directly below v). In orderto produce trees with the characteristics mentioned in the previous paragraph,the probabilistic model suggested (i) incorporates asynchrony: after receiving amessage, each recipient waits for a time t before acting on it, and if it receivesmore copies of the item in this time interval, it acts upon only one of them,and (ii) encompasses a back-rate β, as a node can either forward the message toits neighbours with probability 1 − β or group-reply to his corecipients with aprobability β.
In [27], Bakshy et al. attempt to model the information diffusion in Twitterwith the use of regression trees. Twitter is convenient for information diffusionmodeling, since it is explicitly diffusion-oriented: users subscribe to the contentof other users. The retweet feature, moreover, helps in the acknowledgement(though does not guarantee it) of reposts. Seeders are users posting original (notretweeted) content and reposting instead of the conventional retweeting (RT@username) is taken into account. Influence is measured in terms of the sizeof the whole diffusion tree created, and not just the plain number of explicitretweets. The three different cases studied ascribe the influence to the first onehaving posted a link, the most recent one or follow a hybrid approach.

118 I. Kilanioti et al.
As far as the seed users are concerned, the predictors used include: the num-ber of followers, number of friends, number of tweets and date of joining, andregarding the past influence of seed users: the average, minimum and maximumtotal influence and average, minimum and maximum local influence (local refersto the average number of reposts by a user’s immediate friends over a period ofone month and total to the average total cascade size over that period).
Bakshy et al. [27] come to the conclusion that although large cascades havein their majority previously successful individuals with many followers as initia-tors, individuals with these characteristics are not necessarily bound to start alarge cascade. Thus, because of the fact that estimations cannot be made at anindividual level, marketers should rely on the average performance. By studyingthe return on investment, on the whole, with a cost function of the number offollowers per individual i: ci = acf + ficf , where a is acquisition cost cf cost perfollower and fi is the number of followers, they conclude that relatively ordinaryusers of average influence and connectivity are most cost-efficient.
Content-related features are, also, according to Bakshy et al. not expected todiscriminate initiators of large cascades from non-successful ones, due to the largenumber of non-successes. In order to take content into account, the regressionanalysis is repeated encompassing the following features: rated interestingness,perceived interestingness to an average person, rated positive feeling, willingnessto share via email, IM, Twitter, Facebook or Digg, some indicator variables fortype of URL, and some indicator variables for category of content.
Moreover, Lerman et al. [118] claim that exploiting the proximity of users inthe social graph can serve as an adding-value factor for the prediction of infor-mation diffusion. They discriminate proximity as coming from conservative ornon-conservative processes (denoting that the amount of spread information inthe network remains or not constant, respectively). For the case the underly-ing network is not fully known [132], Najar et al. focus on predicting the finalactivation state of the network when an initial activation is given. They findthe correspondence between the initial and final states of the network withoutconsidering the intermediate states. Their work is based on the analogy betweenpredictive and generative approaches for discrimination or regression problems(predictive models depicting a better performance, when the real data distribu-tion can’t be captured).
In [174], Yang and Leskovec use a time series model for modeling the globalinfluence of a node through the whole network. For each node u, an influencefunction Iu(l) is the number of mentions of an information l time units afterthe node u adopted the information (at tu), and with V (t) being the number ofnodes that mention the information at time t, it applies:
V (t + 1) =∑
u∈∈A(t)
Iu(t − tu) (5)
where A(t) are the nodes that got activated before t, tu ≤ t. For the modelingof the influence functions a non-parametric formulation followed allows greateraccuracy and deviation, as no assumptions are made.

Towards Efficient and Scalable Data-Intensive Content Delivery 119
A study of the social news aggregator Digg [66] crawling data from the site,story, user and social network perspective, suggests the presence of previouslyunconsidered factors for the steering of information spread in OSNs. Doerr et al.suggest, that, beyond the bare OSN topology two factors matter: the temporalalignment between user activities (i.e. whether users are visiting the site in thesame narrow time window) and a hidden logical layer of interaction patternsoccurring in their majority outside the social graph.
In the direction of studying the information diffusion as social graphs evolve,Ren et al. [146] study the evolution steps for shortest paths between two nodes,(so that they can ascribe them to a disjoint path, a short-circuiting bridge or anew friend between them), and furthermore, metrics such as closeness central-ity, and global metrics, like the graph diameter, across snapshots of graduallyevolving graphs. To this end, they adopt an efficient algorithm and an efficientstorage scheme.
Firstly, they cluster (in an incremental procedure not requiring all snapshotsto be present in memory) successive graphs exploiting their many resemblances(daily snapshots). As G∪ and G∩ essentially “bound” the graphs in the cluster,with G∩ being the intersection (the largest common subgraph) of all snapshots incluster C, and G∪ the union (the smallest common supergraph) of all snapshotsin C, grouping of snapshots into clusters can be based in the idea of the graphedit similarity between these two graphs (G∪, G∩). The graph edit similarity tocapture the similarity requirement of a cluster is defined as:
ges(Ga, Gb) =2 | E(Ga ∩ Gb) |
| E(Ga) | + | E(Gb) | (6)
Secondly, they exploit the idea that, denoting the shortest-path betweenthe vertices v and u, by P∗(u, v) in a graph G∗, where ∗ = 1, 2, ..., n,∩,∪, thesolution can easily be found by the intersection or union (two graphs) of graphsin the cluster, or be “fixed” using these two graphs, and they propose a“finding-verifying-fixing framework”.
As far as the storage schemes variations are concerned, for a cluster of snap-shots C = G1, ..., Gk the deltas Δ(Gi, G∩),∀1 ≤ i ≤ k consist a small fractionof the snapshot, and their size depends on the threshold value used for clus-ters’ similarity. The penalty of decompression overheads needed is surpassed bysavings in I/O. Variations of the storage schemes include the following:
SM1(C) = {G∩,Δ(G∪, G∩),Δ(Gi, G∩)|1 ≤ i ≤ k} (7)
SM2(C) = {G∩,Δ(G∪, G∩),Δ(G1, G∩),D(Gi, Gi−1)|2 ≤ i ≤ k} (8)
SM FV F (C) = {D(G∩, Gp∩),Δ(G∪, G∩),Δ(G1, G∩),D(Gi, Gi−1)|2 ≤ i ≤ k}(9)
In (7) the authors consider only the edge sets of Δ(Gi, G∩) and G∩ to executetheir algorithms on a snapshot Gi and the snapshots, Gi’s, of the cluster neednot be explicitly stored. For further compression of data of an evolving graphsequence similarity of successive snapshots is exploited: In (8) D(Gi, Gi−1) =

120 I. Kilanioti et al.
(E+i , E−
i ), where E+i = E(Gi) − E(Gi−1) and E−
i = E(Gi−1) − E(Gi) are thechanges made to snapshot Gi−1 to obtain the next snapshot Gi. Authors observethat the size of the set of edge changes D(Gi,Gi−1) is on average just 1/10 thesize of Δ(Gi, G∩). Hence, representing an EGS in terms of the D’s is much morespace efficient than in term of the Δ’s. Further compression can be achieved byexploiting inter-cluster redundancy (9).
6 Distribution of Social Data Streams
6.1 Content Distribution for Social Data Streams
This subsection provides a description of architectures, systems and techniques[108] for the distribution of social data content.
Architectures. In [99], Jacobson et al. introduce Content Centric Network-ing (CCN), noting that network use has evolved to be dominated by contentdistribution and retrieval. CCN has no notion of host at its lowest level - apacket “address” names content, not location, while simultaneously preservingthe design decisions that make TCP/IP simple, robust and scalable. Content istreated as a primitive, and with new approaches, Jacobson et al. simultaneouslyachieve scalability and performance.
To share resources within the context of a social network with the use of thecloud business model, Chard et al. in [49] propose the SocialCloud architecture.Users register in cloud services (computational capacity, photo storage etc.), andtheir friends can consume and provide these services through a Facebook appli-cation. The allocation of resources (trading or reciprocal use between friends)is conducted by an underlying market infrastructure, whereas the Social Cloudapplication passes a SLA to the service. The advertisement of the service, sothat it can be included in the market is done with XML based metadata storedin Globus Monitoring and Discovery System (MDS).
An interesting approach [116] applicable to the realm of content deliveryis based on an architecture which combines global learning and local cacheswith small population. It is shown that age-based thresholds can timely exploittime-varying popularities to improve caching performance. Moreover, the cachingefficiency is maximized by a combination of global learning and clustering ofaccess locations, accompanied by score mechanisms to help with practical issuesat local caches. Practical considerations include, though, the size of the contentthat circulates over OSN and the long-tail effect, since the goal of the authorsis first to learn a good estimate at the global point and then feed it back to thelocal caches in the form of content scores, thus, making the approach possiblyprohibitive for OSN-aware content delivery.
Systems. In Buzztraq [151], Sastry et al. build a prototype system that takesadvantage of the knowledge of the users’ friends’ location and number, to gener-ate hints for the placement of replicas closer to future accesses. Comparing their

Towards Efficient and Scalable Data-Intensive Content Delivery 121
strategy with location based placement, which instead uses the geographicallocation of recent users, they find substantial decrease of cost, when requests aspart of cascades are more than random accesses of content. Furthermore, theirsystem reacts faster when there is a new region shift, since it starts countingfriends of previous users in a new region, even before a request comes from thatregion. The key concept of Buzztraq is to place replicas of items already postedby a user closer to the locations of friends, anticipating future requests. Theintuition is that social cascades are rapidly spread through populations as socialepidemics. The experimental results indicated that social cascade prediction canlower the cost of user access compared to simple location-based placement. Buz-ztrack is a simple system that only provides hints as to where to place objects.Other more complex constraints that the present work covers, such as serverbandwidth and storage, are not taken into account. Moreover, social cascadeis indirectly analyzed because there has to be a third-party page where usersconnect to view the videos and have access to their social profile.
In the direction of distributing long-tailed content while lowering bandwidthcosts and improving QoS, although without considering storage constraints,Traverso et al. in [165] exploit the time differences between sites and the accesspatterns that users follow. Rather than naively pushing UGC immediately, whichmay not be consumed and contribute unnecessarily to a traffic spike in the uploadlink, the system can follow a pull-based approach, where the first friend of a userin a Point of Presence (PoP) asks for the content. Moreover, rather than push-ing content as soon as a user uploads, content can be pushed at the local timethat is off-peak for the uplink and be downloaded in a subsequent time bin,also off-peak for the downlink. The larger the difference is between the contentproduction bin and the bin in which the content is likely to be read, the betteris the performance of the system.
In [153], Scellato et al. study how Twitter can be used to examine social cas-cades of UGC from YouTube and discover popular objects for replication. Theyimprove the temporary caching policy by placing content after accounting forthe distance between users. For the model CDN system constructed and tested,Scellato et al. used the Limelight network properties with 19 clusters of serversworldwide. To test the system, two different video weights were used: geosocial,in which node locality values are calculated from all the users that have posted amessage about the item (even without being involved in a cascade), and geocas-cade, in which node locality values are calculated from the users participatingin the item’s social cascade. It was shown that the model improved performanceagainst a no weight policy, with geocascade weight performing better.
Techniques. The introduction of concrete, unified metrics for the characteriza-tion of the extent of the social dissemination (local or global cascades phenom-ena) is an open issue. A systematic incorporation of this quantified knowledgeinto the existent underlying content delivery infrastructure would be salutaryfor proactive steps towards the improvement of user experience.

122 I. Kilanioti et al.
Furthermore, novel techniques aim to incorporate the information extractedfrom OSNs in the way that users share content and in how the content ultimatelyreaches the users. Some of these works use the information directly from OSNs,whereas others use such information indirectly. The research goals vary: thedecision for copying content, improvement of policy for temporary caching, etc.
Zhou et al. [178] leverage the connection between content exchange and geo-graphic locality (using a Facebook dataset they identify significant geographiclocality not only concerning the connections in the social graph, but also theexchange of content) and the observation that an important fraction of contentis “created at the edge” (is user-generated), with a web based scheme for cachingusing the access patterns of friends. Content exchange is kept within the sameInternet Service Provider (ISP) with a drop-in component, that can be deployedby existing web browsers and is independent of the type of content exchanged.Browsing users online are protected with k-anonymity, where k is the number ofusers connected to the same proxy and are able to view the content.
In [92], Hoque and Gupta propose a technique with a logical addressingscheme for putting together in the disk blocks containing data from friends. Thelarge scale of OSNs and the predominant tail effect do not allow use of tech-niques such as those used in multimedia file systems or web servers, where itemsare globally popular, and, techniques keeping related blocks together trackingthe access pattern of blocks, respectively. To this purpose, in [92] the socialgraph is divided into communities. The organization of blocks in the disk isconducted with a greedy heuristic that finds a layout for the users within thecommunities and organizes the different communities on the disk by consideringinter-community tie strength. The system is implemented on top of the Neo4jgraph database as a layout manager.
Instead of optimizing the performance of UGC services exploiting spatial andtemporal locality in access patterns, Huguenin et al., in [95], show on a large(more than 650,000 videos) YouTube dataset that content locality (induced bythe related videos feature) and geographic locality are in fact correlated. Morespecifically, they show how the geographic view distribution of a video can beinferred to a large extent from that of its related videos, proposing a UGC storagesystem that proactively places videos close to the expected requests. Such anapproach could be extended with the leverage of information from OSNs.
Kilanioti et al. in [109–111] propose miscellaneous policies for dynamicOSN-aware content delivery over a content delivery simulation framework. Theauthors propose policies that take patterns of user activity over OSNs and exploitgeo-social properties of users participating in social cascades, proceed to incorpo-rate various caching schemes of the underlying infrastructure, different policiesfor the handling of OSN data and various approaches that take into account theefficient timing of prefetching. Given an efficient placement of surrogate serverswith maximum performance and minimum infrastructure cost, they apply con-textual features of the user as heuristics to find the best content diffusion place-ment, either in a global or in a local scale, i.e., which content will be copiedin the surrogate servers and to what extent, not overlooking memory, time and

Towards Efficient and Scalable Data-Intensive Content Delivery 123
computational cost. Moreover they study temporal aspects of diffusion, relatedto the most efficient timing of the content placement. The simulation frameworkthey introduce can serve as the basis of further parameterized content deliveryexperimentation that exploits information transmission over OSNs and decreasesreplication costs by selectively copying items to locations where items are likelyto be consumed.
In terms of performance, Kilanioti et al. note a significant improvement overthe respective improvement (39.43% only for the plain Social Prefetcher app-roach [107], up to 42.32% for selected caching mechanisms, compared to 30%in [165]) performing better than existent pull-based methods employed by mostCDNs, even though these methods additionally overlook storage issues of thedistributed infrastructure.
Last but not least, of more concurrent cascades happening it would be inter-esting to know which of them will evolve as global and which of them willevolve as local, possibly making some associations with their content or con-text features. It is challenging to discover contextual associations among thetopics, which are by nature implicit in the user-generated content exchangedover OSNs and spread via social cascades. In other words it would be useful toderive semantic relations. This way the identification of a popular topic can beconducted in a higher, more abstract level with the augmentation of a seman-tic annotation. While the topic of a single information disseminated through anOSN can be explicitly identified, it is not trivial to identify reliable and effectivemodels for the adoption of topics as time evolves [80,123] characterized withsome useful emergent semantics. Therefore efficient semantic annotation can beseen as a solution for the challenge of characterization of the extent of the socialdissemination.
6.2 Content Distribution in 5G Environments and Technologies
Content became the main information item exchanged between different actorsin the Internet. Video and multimedia content counts for 80–90% of the totalglobal traffic. Rich multimedia content lead to rapid mobile traffic growth thatcurrent mobile radio network, mobile backhaul, the capacity of the wireless linkand mobile core network cannot support. 5G could overcome these bottlenecksintroducing high increasing ratio of mobility communications and strong ori-entation towards content-related services and applications for content deliveryover wireless technology, high throughput, low data delivery latency, and highscalability enabling huge number of devices [17].
Environment. 5G represents the 5th generation network of mobile systemswhich opens new possibilities, increase radio link capacity and brings plenty ofnew trends such as [17,122]: heterogeneous networks (HetNets); new use casesbased on connections and communications between device to device, massiveMachine-Type Communications, and Internet of Things (IoT); evolution of radioaccess technologies; cloudification throughout SDN and network function virtual-ization (NFV) paradigms; flexible spectrum management; cell densification; etc.

124 I. Kilanioti et al.
NFV and SDN capabilities in 5G systems are expected to enable network pro-grammability. Content delivery could be affected by 5G cloudification throughdifferent SDN/NFV paradigms [122]. Programmable network control and the vir-tualization of all the RAN elements into virtual appliances by flexible NFV man-agement are included within 5G networks. This enable content focused resourcesallocation. Agile design of new network functions and their control are possible.Network providers could extend network with new function that includes customdesigned information, such as services that can offer to the online media serviceproviders. The collaboration between the network provider and the online mediaservice provider by means of the edge cache could be enabled by media deliverysolutions designed for 5G. The control of the network will be kept by the networkprovider. The network provider would give only the relevant information for theonline media service provider, while the online media service provider will keepthe control of the delivery process and decide whether the cache shall be used,what and how information or resources are cached [3].
Technologies. New technologies such as LTE-A, LTE-U, WiFi and ZigBee,SDN and NFV rapidly change networks and services and lead to changes tocontent delivery. For example, mobile video will generate more than 69% ofmobile data traffic by 2019 [2]. It is expected to witness an increase to 75% by2021, which is much greater from 46% in 2016 on the share of smart devices andconnections, while the amount of traffic offloaded from 4G was 63% at the endof 2016, and it will be 66% percent by 2021 [2].It is also expected to witnesshigher offload rates when the 5G network arrives. The main challenges in awireless or mobile environment that have impact on content delivery servicesare reflected to the limited spectrum and bandwidth in wireless, heterogeneousnetworks, wireless link characteristics that are dependent on location and time,radio congestion, handoff issues, etc.
5G Use Cases. Future 5G developments is dependent on service providers,technology enablers and customers. All these actors are directly involved in deci-sions which use cases to pursue first, as well what technology is needed for theuse cases. The 5G standards development process is also dependent on decisionswhich use cases first to deploy. All these ongoing developments will directly affectcontent delivery mechanisms, models and systems architectures. The main 5Guse cases currently are reflected to [3]:
1. Gigabit broadband to home, related to deliver streams rated from 100 Mbit/secto 1 Gbit/sec, which are needed to deliver television with higher resolution than4K, virtual and augmented reality. Specific applications require special networkconfiguration, for example in order to minimize latency in virtual reality appli-cations.
2. Next generation mobile user experience.3. Future corporate networks, addressed to better service providing, which
require operators to dynamically manage network and to use software definednetworking and network function virtualization.

Towards Efficient and Scalable Data-Intensive Content Delivery 125
4. Digital industrial ecosystems include agriculture, smart cities and healthcareapplications, which imply network configurations that every industry partic-ipant can benefit from.
5. Infrastructure as a service approach is for service providers that lack theresources to invest in nationwide 5G coverage.
5G Solutions and Approaches. The demand for high-speed data applicationshas been on the rise in the recent decade, which led to the development of 5G.Development of efficient mechanisms for supporting mobile multimedia and dataservices is prerequisite for 5G networks. The real bottleneck of todays’ mobilenetworks is access radio network and the backhaul. Caching in the intermediatenodes, servers, gateways, routers, and mobile users’ devices can reduce doubledtransmission from content providers and core mobile networks.
Known caching techniques that can be used within 5G are: content distri-bution network, information-centric networks, content-centric networking, httpweb caching, evolved packet core caching, radio access network caching, device todevice caching, proactive caching, predictive caching, cooperative caching [23].Those techniques are using different algorithms and models. Analysis presentedin [23] showed that the deployment of those caching techniques in mobile networkcan reduce redundant traffic in backhaul, minimize the traffic load, increase thetransfer rate in mobile network and reduce the latency. Correlation of severalcaching methods and procedures could result in improving network performanceand obtaining better results.
5G brings complex heterogeneity of the network with different technolo-gies that coexist, where some technologies could totally disable transmission ofdata of equipment that use other technologies. Solutions that efficiently handlesresources in space, frequency, and device dimensions are needed. One possibleefficient solution is semantic coordination in such networks is given in [135,164].
The nodes in the system can communicate and share knowledge of their per-spective of the spectrum utilization in the network. In [164] authors proposedto model the spectrum usage coordination as an interactive process betweena number of distributed communicating agents, where agents share their spe-cific information and knowledge. The information includes the current spectrumusage state, spatial coordinates of the device, available communication proto-cols, usage policy, spectrum sensing capabilities of the device, spectrum needs,etc. Approach for such coordination presented in [164] is based on semantictechnologies, and harmonize communication between heterogeneous agents withpotentially different capabilities with a minimal common compliance. The coreknowledge is represented by ontologies whose representation and usage is spec-ified in a standardized way. This semantic technologies-based approach can beused for a wide spectrum of problems within 5G heterogeneous networks, suchas network states predictions, network analysis, minimizing traffic load, contentdistribution coordination etc. This approach could be used in combination withcaching techniques in order to improve content distribution in 5G, but furtherresearch should be carried out in this area.

126 I. Kilanioti et al.
7 Conclusions
This article describes the results of the collaborative work performed as partof High-Performance Modelling and Simulation for Big Data Applications(cHiPSet) COST Action 1406. The presented case study focused on multime-dia big data from entertainment and social media, medical images, consumerimages, voice and video, that drives research and development of related tech-nologies and applications and is steadily becoming a valuable source of infor-mation and insights [109–111], [108]. In fact, this work describes the generallandscape and how our approach fits in the general ecosystem. Multimedia con-tent providers such as YouTube strive to efficiently deliver multimedia big datato a large amount of users over the Internet, with currently more than 300 hof video content being uploaded to the site every minute. Traditionally, thesecontent providers often rely on social data content distribution infrastructures.However, some measurement studies depict that a significantly large proportionof HTTP traffic results from bandwidth-intensive multimedia content circulat-ing through OSNs. Consequently the user activity extracted from OSNs can beexploited to reduce the bandwidth usage. By incorporating patterns of informa-tion transmission over OSNs into a simulated content distribution infrastruc-ture, the performance of content distribution mechanisms can be remarkablyimproved.
CDN services are increasingly being used to enable the delivery of bandwidth-demanding large media data to end-users of multimedia content providers andextend the capabilities of the Internet by deploying massively distributed infras-tructures to accelerate content delivery. Next generation CDNs are being lever-aged in an array of ways to overcome the challenges of providing a seamlesscustomer experience across multiple devices with varying connectivity and cor-responding to the call for enterprise application delivery. They have to go beyondefficient resource discovery and retrieval tasks of the established CDNs and sup-port refined mechanisms for data placement, replication and distribution for alarge variety of resource types and media formats. OSNs on the other hand cre-ate a potentially transformational change in user navigation and from this anglethe rapid proliferation of OSNs sites is expected to reshape the architecture anddesign of CDNs. The challenges and opportunities highlighted in the interdisci-plinary field of OSN-aware content delivery are bound to foster some interest-ing future developments, including innovative cache replacement strategies asa product of the systematic research of temporal, structural and geographicalproperties of social cascades.
Particularly today that HTTP traffic ascribed to media circulating over OSNshas grown, an OSN-awareness mechanism over content distribution schemes hasbecome essential. This mechanism aims to exploit patterns of social interactionsof the users to reduce the load on the origin server, the traffic on the Internet,and ultimately improve the user experience. By addressing the issue of whichcontent will be copied in the surrogate servers of a CDN, it ensures a near-optimal content diffusion placement. At the same time, it moderates the impacton bandwidth that the Big Data transmitted via OSNs has, offering scalable

Towards Efficient and Scalable Data-Intensive Content Delivery 127
solutions to existing CDNs or OSNs providers. Furthermore, it paves the wayfor experimentation with variations on caching schemes, timing parameters ofcontent delivery and context of the OSN and the media platform.
A future target is to potentially leverage the CDN services of cloud ser-vice providers in order to lower costs while increasing simplicity. CDNs, oftenoperated as Software as a Service (SaaS) in cloud providers (Amazon Cloud-Front, Microsoft Azure CDN, etc.) aim at addressing the problem of smoothand transparent content delivery. A CDN actually drives cloud adoption throughenhanced performance, scalability and cost reduction. With the limitation forboth CDNs and cloud services being the geographic distance between a user ask-ing for content and the server where the content resides, cloud acceleration andCDN networks are both complementary to achieving a goal of delivering data inthe fastest possible way. Cloud mainly handles. Utilization of OSN-aware CDNsin cloud computing, where content is constantly changing and, thus, not easilycached, is likely to have profound effects on large data download.
References
1. Alexa. http://alexa.com/topsites. Accessed 20 Dec 20182. Cisco visual networking index: global mobile data traffic forecast update, 2016–
2021 white paper3. Ericsson research blog. 5G media delivery. https://www.ericsson.com/research-
blog/5g-media-delivery/. Accessed 20 Dec 20184. Facebook Newsroom. http://newsroom.fb.com/Key-Facts. Accessed 20 Dec 20185. International Telecommunication Union. ICT facts and figures in 2017. https://
www.itu.int/en/ITU-D/Statistics/Documents/facts/ICTFactsFigures2017.pdf.Accessed 20 Dec 2018
6. Internet Society. Global Internet Report 2017. Mobile Evolution and Develop-ment of the Internet. https://future.internetsociety.org/wp-content/uploads/2017/09/2017-Internet-Society-Global-Internet-Report-Paths-to-Our-Digital-Future.pdf. Accessed 20 Dec 2018
7. Management of Networks with Constrained Devices: Use Cases. IETF InternetDraft. https://goo.gl/cT5pXr. Accessed 15 Mar 2016
8. Mobile-edge computing - introductory technical white paper. https://goo.gl/ybrCnq. Accessed 15 Mar 2016
9. The Internet of Things: how the next evolution of the Internet is changing every-thing. CISCO, San Jose, CA, USA, White Paper (2011). http://goo.gl/ugKAoN.Accessed 15 Mar 2016
10. The Smart Grid: An Introduction. US Department of Energy. http://goo.gl/jTNgf. Accessed 15 Mar 2016
11. Under the Hood: Scheduling MapReduce jobs more efficiently with Corona, Face-book engineering. goo.gl/XJRNN. Accessed 20 Dec 2018
12. YouTube Statistics. https://www.youtube.com/yt/press/statistics.html.Accessed 20 Dec 2018
13. cHiPSet - Research Work Results. Grant Period 1 (2017). http://chipset-cost.eu/wp-content/uploads/2017/05/report-1.pdf#page=13. Accessed 20 Dec 2018
14. Abedini, N., Shakkottai, S.: Content caching and scheduling in wireless networkswith elastic and inelastic traffic. IEEE/ACM Trans. Netw. 22(3), 864–874 (2014)

128 I. Kilanioti et al.
15. Abolfazli, S., Sanaei, Z., Ahmed, E., Gani, A., Buyya, R.: Cloud-based augmen-tation for mobile devices: motivation, taxonomies, and open challenges. IEEECommun. Surv. Tutor. 16(1), 337–368 (2014). https://doi.org/10.1109/SURV.2013.070813.00285
16. Aizenman, M., Lebowitz, J.L.: Metastability effects in bootstrap percolation. J.Phys. A: Math. Gen. 21(19), 3801 (1999)
17. Akpakwu, G.A., Silva, B.J., Hancke, G.P., Abu-Mahfouz, A.M.: A survey on 5Gnetworks for the internet of things: communication technologies and challenges.IEEE Access 6, 3619–3647 (2018)
18. Amur, H., Cipar, J., Gupta, V., Ganger, G.R., Kozuch, M.A., Schwan, K.: Robustand flexible power-proportional storage. In: Proceedings of the 1st ACM Sympo-sium on Cloud Computing, pp. 217–228. ACM (2010)
19. Ananthanarayanan, G., et al.: PACMan: coordinated memory caching for paral-lel jobs. In: Proceedings of the 9th USENIX Conference on Networked SystemsDesign and Implementation, p. 20. USENIX Association (2012)
20. Anderson, C.: The Long Tail: Why the Future of Business is Selling Less of More.Hyperion, Santa Clara (2008). Revised and Updated Edition
21. Anjum, N., Karamshuk, D., Shikh-Bahaei, M., Sastry, N.: Survey on peer-assistedcontent delivery networks. Comput. Netw. 116, 79–95 (2017)
22. Arthur, W.B.: Competing technologies, increasing returns, and lock-in by histor-ical events. Econ. J. 99(394), 116–131 (1989)
23. Assila, B., Kobbane, A., El Koutbi, M.: A survey on caching in 5G mobile network(2017)
24. Asur, R.B.S., Bandari, R., Huberman, B.: The pulse of news in social media: fore-casting popularity. In: Association for the Advancement of Artificial Intelligence,1202 (2012)
25. Avelar, V., Azevedo, D., French, A., Power, E.N.: PUE: a comprehensive exami-nation of the metric. White Paper 49 (2012)
26. Bakshy, E., Hofman, J.M., Mason, W.A., Watts, D.J.: Everyone’s an influencer:quantifying influence on Twitter. In: Proceedings of the Fourth ACM Interna-tional Conference on Web Search and Data Mining, pp. 65–74. ACM (2011)
27. Bakshy, E., Hofman, J.M., Mason, W.A., Watts, D.J.: Everyone’s an influ-encer: quantifying influence on Twitter. In: Proceedings of the Forth Interna-tional Conference on Web Search and Web Data Mining, WSDM 2011, HongKong, China, 9–12 February 2011, pp. 65–74 (2011). http://doi.acm.org/10.1145/1935826.1935845
28. Bakshy, E., Rosenn, I., Marlow, C., Adamic, L.A.: The role of social networks ininformation diffusion. In: Proceedings of the 21st World Wide Web Conference2012, WWW 2012, Lyon, France, 16–20 April 2012, pp. 519–528 (2012). http://doi.acm.org/10.1145/2187836.2187907
29. Banerjee, A.V.: A simple model of herd behavior. Q. J. Econ. 107(3), 797–817(1992)
30. Barroso, L.A., Clidaras, J., Holzle, U.: The datacenter as a computer: an intro-duction to the design of warehouse-scale machines. Synth. Lect. Comput. Arch.8(3), 1–154 (2013)
31. Bashroush, R.: A comprehensive reasoning framework for hardware refresh indata centers. IEEE Trans. Sustain. Comput. 3(4), 209–220 (2018)
32. Bashroush, R., Woods, E.: Architectural principles for energy-aware internet-scaleapplications. IEEE Softw. 34(3), 14–17 (2017)
33. Bass, F.M.: A new product growth for model consumer durables. Manag. Sci.15(5), 215–227 (1969)

Towards Efficient and Scalable Data-Intensive Content Delivery 129
34. Beloglazov, A., Abawajy, J., Buyya, R.: Energy-aware resource allocation heuris-tics for efficient management of data centers for cloud computing. Futur. Gener.Comput. Syst. 28(5), 755–768 (2012)
35. Beloglazov, A., Buyya, R.: Energy efficient resource management in virtualizedcloud data centers. In: Proceedings of the 2010 10th IEEE/ACM InternationalConference on Cluster, Cloud and Grid Computing, pp. 826–831. IEEE ComputerSociety (2010)
36. Beloglazov, A., Buyya, R.: Optimal online deterministic algorithms and adaptiveheuristics for energy and performance efficient dynamic consolidation of virtualmachines in cloud data centers. Concurr. Comput.: Pract. Exp. 24(13), 1397–1420(2012)
37. Berger, E.: Dynamic monopolies of constant size. J. Comb. Theory Ser. B 83(2),191–200 (2001)
38. Bhattacharya, A.A., Culler, D., Friedman, E., Ghodsi, A., Shenker, S., Stoica, I.:Hierarchical scheduling for diverse datacenter workloads. In: Proceedings of the4th Annual Symposium on Cloud Computing, p. 4. ACM (2013)
39. Bikhchandani, S., Hirshleifer, D., Welch, I.: A theory of fads, fashion, custom, andcultural change as informational cascades. J. Polit. Econ. 100, 992–1026 (1992)
40. Bonacich, P.: Power and centrality: a family of measures. Am. J. Sociol. 92, 1170–1182 (1987)
41. Borgatti, S.P.: Centrality and network flow. Soc. Netw. 27(1), 55–71 (2005).http://www.sciencedirect.com/science/article/pii/S0378873304000693
42. Borthakur, D., et al.: Apache Hadoop goes realtime at Facebook. In: Proceedingsof the 2011 ACM SIGMOD International Conference on Management of Data,pp. 1071–1080. ACM (2011)
43. Bottazzi, D., Montanari, R., Toninelli, A.: Context-aware middleware for anytime,anywhere social networks. IEEE Intell. Syst. 22(5), 23–32 (2007)
44. Boyd, D., Ellison, N.B.: Social network sites: definition, history, and scholarship.J. Comput.-Mediat. Commun. 13(1), 210–230 (2007). https://doi.org/10.1111/j.1083-6101.2007.00393.x
45. Brin, S., Page, L.: The anatomy of a large-scale hypertextual web search engine.Comput. Netw. ISDN Syst. 30(1), 107–117 (1998)
46. Brodersen, A., Scellato, S., Wattenhofer, M.: YouTube around the world: geo-graphic popularity of videos. In: Proceedings of the 21st International Conferenceon World Wide Web, pp. 241–250. ACM (2012)
47. Van den Bulte, C., Joshi, Y.V.: New product diffusion with influentials and imi-tators. Mark. Sci. 26(3), 400–421 (2007)
48. Cha, M., Kwak, H., Rodriguez, P., Ahn, Y., Moon, S.B.: I tube, you tube, every-body tubes: analyzing the world’s largest user generated content video system. In:Proceedings of the 7th ACM SIGCOMM Conference on Internet Measurement2007, San Diego, California, USA, 24–26 October 2007, pp. 1–14 (2007). https://doi.org/10.1145/1298306.1298309
49. Chard, K., Caton, S., Rana, O., Bubendorfer, K.: Social cloud: cloud computing insocial networks. In: IEEE International Conference on Cloud Computing, CLOUD2010, Miami, FL, USA, 5–10 July 2010, pp. 99–106 (2010). https://doi.org/10.1109/CLOUD.2010.28
50. Chen, Y., Alspaugh, S., Katz, R.: Interactive analytical processing in big datasystems: a cross-industry study of mapreduce workloads. Proc. VLDB Endow.5(12), 1802–1813 (2012)
51. Chib, S., Greenberg, E.: Understanding the metropolis-hastings algorithm. Am.Stat. 49(4), 327–335 (1995)

130 I. Kilanioti et al.
52. Clifford, P., Sudbury, A.: A model for spatial conflict. Biometrika 60(3), 581–588(1973)
53. Coutand, O., et al.: Context-aware group management in mobile environments.In: IST Mobile Summit (2005)
54. Daley, D., Kendall, D.G.: Stochastic rumours. IMA J. Appl. Math. 1(1), 42–55(1965)
55. Dean, J., Ghemawat, S.: MapReduce: simplified data processing on large clusters.Commun. ACM 51(1), 107–113 (2008)
56. Delgado, P., Didona, D., Dinu, F., Zwaenepoel, W.: Job-aware scheduling in eagle:divide and stick to your probes. In: Proceedings of the Seventh ACM Symposiumon Cloud Computing. No. EPFL-CONF-221125 (2016)
57. Delgado, P., Dinu, F., Kermarrec, A.M., Zwaenepoel, W.: Hawk: hybrid datacen-ter scheduling. In: USENIX Annual Technical Conference, pp. 499–510 (2015)
58. Delimitrou, C., Kozyrakis, C.: Paragon: QoS-aware scheduling for heterogeneousdatacenters. ACM SIGPLAN Not. 48, 77–88 (2013)
59. Delimitrou, C., Kozyrakis, C.: Quasar: resource-efficient and QoS-aware clustermanagement. ACM SIGPLAN Not. 49, 127–144 (2014)
60. Delimitrou, C., Sanchez, D., Kozyrakis, C.: Tarcil: reconciling scheduling speedand quality in large shared clusters. In: Proceedings of the Sixth ACM Symposiumon Cloud Computing, pp. 97–110. ACM (2015)
61. Dewi, R.R., Kim, T.-H.: A new approach to modeling of bio-inspired informationdiffusion with ant colony optimization in complex networks. In: Zelinka, I., Sug-anthan, P.N., Chen, G., Snasel, V., Abraham, A., Rossler, O. (eds.) Nostradamus2014: Prediction, Modeling and Analysis of Complex Systems. AISC, vol. 289, pp.131–140. Springer, Cham (2014). https://doi.org/10.1007/978-3-319-07401-6 13
62. Dey, A.K.: Understanding and using context. Pers. Ubiquit. Comput. 5(1), 4–7(2001)
63. Dey, A.K., Abowd, G.D., Salber, D.: A conceptual framework and a toolkit forsupporting the rapid prototyping of context-aware applications. Hum.-Comput.Interact. 16(2), 97–166 (2001)
64. Dickens, L., Molloy, I., Lobo, J., Cheng, P.C., Russo, A.: Learning stochasticmodels of information flow. In: 2012 IEEE 28th International Conference on DataEngineering (ICDE), pp. 570–581. IEEE (2012)
65. Dodge, Y., Cox, D., Commenges, D., Davison, A., Solomon, P., Wilson, S.: TheOxford Dictionary of Statistical Terms. Oxford University Press, Oxford (2006)
66. Doerr, C., Blenn, N., Tang, S., Van Mieghem, P.: Are friends overrated? A studyfor the social news aggregator digg.com. Comput. Commun. 35(7), 796–809 (2012)
67. Dogar, F.R., Karagiannis, T., Ballani, H., Rowstron, A.: Decentralized task-awarescheduling for data center networks. In: ACM SIGCOMM Computer Communi-cation Review, vol. 44, pp. 431–442. ACM (2014)
68. Duy, T.V.T., Sato, Y., Inoguchi, Y.: Performance evaluation of a green schedulingalgorithm for energy savings in cloud computing. In: 2010 IEEE InternationalSymposium on Parallel & Distributed Processing, Workshops and PhD Forum(IPDPSW), pp. 1–8. IEEE (2010)
69. Easley, D.A., Kleinberg, J.M.: Networks, Crowds, and Markets - Reasoning Abouta Highly Connected World. Cambridge University Press (2010). http://www.cambridge.org/gb/knowledge/isbn/item2705443/?site locale=en GB
70. Even-Dar, E., Shapira, A.: A note on maximizing the spread of influence in socialnetworks. Inf. Process. Lett. 111(4), 184–187 (2011). https://doi.org/10.1016/j.ipl.2010.11.015

Towards Efficient and Scalable Data-Intensive Content Delivery 131
71. Fard, A., Abdolrashidi, A., Ramaswamy, L., Miller, J.A.: Towards efficient queryprocessing on massive time-evolving graphs. In: 8th International Conference onCollaborative Computing: Networking, Applications and Worksharing, Collabo-rateCom 2012, Pittsburgh, PA, USA, 14–17 October 2012, pp. 567–574 (2012).http://dx.doi.org/10.4108/icst.collaboratecom.2012.250532
72. Fernandez-Cerero, D., Jakobik, A., Fernandez-Montes, A., Ko�lodziej, J.: Stack-elberg game-based models in energy-aware cloud scheduling. In: Nolle, L. (ed.)Proceedings of 32nd European Conference on Modelling and Simulation ECMS2018 (ECMS, Wilhelmshaven, Germany, May 2018), ECMS 2018, pp. 460–467.European Council for Modelling and Simulation, Dudweiler (2018)
73. Fernandez-Cerero, D., Jakobik, A., Fernandez-Montes, A., Kolodziej, J.: Game-score: game-based energy-aware cloud scheduler and simulator for computa-tional clouds. Simul. Model. Pract. Theory (2018). http://www.sciencedirect.com/science/article/pii/S1569190X18301229
74. Fernandez-Cerero, D., Fernandez-Montes, A., Jakobik, A., Kolodziej, J.,Toro, M.: Score: simulator for cloud optimization of resources andenergy consumption. Simul. Model. Pract. Theory 82, 160–173 (2018).http://www.sciencedirect.com/science/article/pii/S1569190X18300030
75. Fernandez-Cerero, D., Fernandez-Montes, A., Ortega, J.A.: Energy policies fordata-center monolithic schedulers. Expert. Syst. Appl. 110, 170–181 (2018).http://www.sciencedirect.com/science/article/pii/S0957417418303531
76. Fernandez-Cerero, D., Fernandez-Montes, A., Velasco, F.: Productive efficiency ofenergy-aware data centers. Energies 11(8), 2053 (2018). http://www.mdpi.com/1996-1073/11/8/2053
77. Fernandez-Cerero, D., Jakobik, A., Grzonka, D., Kolodziej, J., Fernandez-Montes,A.: Security supportive energy-aware scheduling and energy policies for cloudenvironments. J. Parallel Distrib. Comput. 119, 191–202 (2018). http://www.sciencedirect.com/science/article/pii/S0743731518302843
78. Fernandez-Montes, A., Fernandez-Cerero, D., Gonzalez-Abril, L., Alvarez Garcıa,J.A., Ortega, J.A.: Energy wasting at internet data centers due to fear. PatternRecognit. Lett. 67, 59–65 (2015). http://www.sciencedirect.com/science/article/pii/S0167865515001907. Cognitive Systems for Knowledge Discovery
79. Fowler, J., Christakis, N.: Connected: The Surprising Power of Our Social Net-works and How they Shape Our Lives. HarperCollins Publishers, New York City(2009)
80. Garcıa-Silva, A., Kang, J.H., Lerman, K., Corcho, O.: Characterising emergentsemantics in Twitter lists. In: Proceedings of the 9th International Conference onthe Semantic Web: Research and Applications (ESWC), Heraklion, Greece (2012)
81. Gea, T., Paradells, J., Lamarca, M., Roldan, D.: Smart cities as an application ofInternet of Things: experiences and lessons learnt in Barcelona. In: 2013 SeventhInternational Conference on Innovative Mobile and Internet Services in Ubiqui-tous Computing (IMIS), pp. 552–557. IEEE (2013)
82. Goldenberg, J., Libai, B., Muller, E.: Talk of the network: a complex systems lookat the underlying process of word-of-mouth. Mark. Lett. 12(3), 211–223 (2001)
83. Govindan, S., Liu, J., Kansal, A., Sivasubramaniam, A.: Cuanta: quantifyingeffects of shared on-chip resource interference for consolidated virtual machines.In: Proceedings of the 2nd ACM Symposium on Cloud Computing, p. 22. ACM(2011)
84. Goyal, A., Bonchi, F., Lakshmanan, L.V.: Learning influence probabilities insocial networks. In: Proceedings of the third ACM International Conference onWeb Search and Data Mining, pp. 241–250. ACM (2010)

132 I. Kilanioti et al.
85. Grandl, R., Ananthanarayanan, G., Kandula, S., Rao, S., Akella, A.: Multi-resource packing for cluster schedulers. ACM SIGCOMM Comput. Commun. Rev.44(4), 455–466 (2015)
86. Granovetter, M.: Threshold models of collective behavior. Am. J. Sociol. 83,1420–1443 (1978)
87. Gruhl, D., Guha, R., Liben-Nowell, D., Tomkins, A.: Information diffusionthrough Blogspace. In: Proceedings of the 13th International Conference on WorldWide Web, pp. 491–501. ACM (2004)
88. Henricksen, K., Indulska, J., Rakotonirainy, A.: Infrastructure for pervasive com-puting: challenges. In: GI Jahrestagung (1), pp. 214–222 (2001)
89. Hindman, B., et al.: Mesos: a platform for fine-grained resource sharing in thedata center. NSDI 11, 22 (2011)
90. Hinze, A., Buchanan, G.: Context-awareness in mobile tourist information sys-tems: challenges for user interaction. In: International Workshop on Context inMobile HCI at the Seventh International Conference on Human Computer Inter-action with Mobile Devices and Services (2005)
91. Holley, R.A., Liggett, T.M.: Ergodic theorems for weakly interacting infinite sys-tems and the voter model. Ann. Probab. 3, 643–663 (1975)
92. Hoque, I., Gupta, I.: Disk layout techniques for online social network data. IEEEInternet Comput. 16(3), 24–36 (2012)
93. Hosseini-Pozveh, M., Zamanifar, K., Naghsh-Nilchi, A.R.: Assessing informationdiffusion models for influence maximization in signed social networks. ExpertSyst. Appl. 119, 476–490 (2019)
94. Hoßfeld, T., Schatz, R., Biersack, E., Plissonneau, L.: Internet video deliveryin YouTube: from traffic measurements to quality of experience. In: Biersack, E.,Callegari, C., Matijasevic, M. (eds.) Data Traffic Monitoring and Analysis. LNCS,vol. 7754, pp. 264–301. Springer, Heidelberg (2013). https://doi.org/10.1007/978-3-642-36784-7 11
95. Huguenin, K., Kermarrec, A.M., Kloudas, K., Taıani, F.: Content and geograph-ical locality in user-generated content sharing systems. In: Proceedings of the22nd international workshop on Network and Operating System Support for Dig-ital Audio and Video, pp. 77–82. ACM (2012)
96. Isard, M., Prabhakaran, V., Currey, J., Wieder, U., Talwar, K., Goldberg, A.:Quincy: fair scheduling for distributed computing clusters. In: Proceedings of theACM SIGOPS 22nd Symposium on Operating Systems Principles, pp. 261–276.ACM (2009)
97. Ising, E.: Beitrag zur Theorie des Ferromagnetismus. Zeitschrift fur Physik AHadrons and Nuclei 31(1), 253–258 (1925)
98. Istepanian, R., Hu, S., Philip, N., Sungoor, A.: The potential of Internet of m-health Things m-IoT for non-invasive glucose level sensing. In: 2011 Annual Inter-national Conference of the IEEE Engineering in Medicine and Biology Society,EMBC, pp. 5264–5266. IEEE (2011)
99. Jacobson, V., Smetters, D.K., Thornton, J.D., Plass, M.F., Briggs, N., Braynard,R.: Networking named content. Commun. ACM 55(1), 117–124 (2012). https://doi.org/10.1145/2063176.2063204
100. Jakobik, A., Grzonka, D., Ko�lodziej, J.: Security supportive energy aware schedul-ing and scaling for cloud environments (2017)
101. Jiang, L., Feng, G., Qin, S.: Content distribution for 5G systems based on dis-tributed cloud service network architecture (2015)

Towards Efficient and Scalable Data-Intensive Content Delivery 133
102. Juarez, F., Ejarque, J., Badia, R.M.: Dynamic energy-aware scheduling for paralleltask-based application in cloud computing. Futur. Gener. Comput. Syst. 78, 257–271 (2016)
103. Karanasos, K., et al.: Mercury: hybrid centralized and distributed scheduling inlarge shared clusters. In: USENIX Annual Technical Conference, pp. 485–497(2015)
104. Katz, E., Lazarsfeld, P.F.: Personal Influence, the Part Played by People in theFlow of Mass Communications. Transaction Publishers, Piscataway (1966)
105. Kaushik, R.T., Bhandarkar, M.: GreenHDFS: towards an energy-conserving,storage-efficient, hybrid Hadoop compute cluster. In: Proceedings of the USENIXAnnual Technical Conference, p. 109 (2010)
106. Kempe, D., Kleinberg, J.M., Tardos, E.: Maximizing the spread of influencethrough a social network. In: Proceedings of the Ninth ACM SIGKDD Interna-tional Conference on Knowledge Discovery and Data Mining, pp. 137–146. ACM(2003)
107. Kilanioti, I.: Improving multimedia content delivery via augmentation with socialinformation. The social prefetcher approach. IEEE Trans. Multimed. 17(9), 1460–1470 (2015). https://doi.org/10.1109/TMM.2015.2459658
108. Kilanioti, I., et al.: A survey on cost-effective context-aware distribution of socialdata streams over energy-efficient data centres. Simul. Model. Pract. Theory(2018). http://www.sciencedirect.com/science/article/pii/S1569190X18301709
109. Kilanioti, I., Papadopoulos, G.A.: Delivering social multimedia content with scal-ability. In: Pop, F., Ko�lodziej, J., Di Martino, B. (eds.) Resource Management forBig Data Platforms. CCN, pp. 383–399. Springer, Cham (2016). https://doi.org/10.1007/978-3-319-44881-7 18
110. Kilanioti, I., Papadopoulos, G.A.: Predicting video virality on Twitter. In: Pop,F., Ko�lodziej, J., Di Martino, B. (eds.) Resource Management for Big Data Plat-forms. CCN, pp. 419–439. Springer, Cham (2016). https://doi.org/10.1007/978-3-319-44881-7 20
111. Kilanioti, I., Papadopoulos, G.A.: Content delivery simulations supported bysocial network-awareness. Simul. Model. Pract. Theory 71, 114–133 (2017)
112. Kleinberg, J.M.: Cascading behavior in networks: algorithmic and economicissues. In: Nisan, N., Roughgarden, T., Tardos, E., Vazirani, V. (eds.) AlgorithmicGame Theory, pp. 613–632. Cambridge University Press (2007)
113. Ko, Y.Y., Cho, K.J., Kim, S.W.: Efficient and effective influence maximization insocial networks: a hybrid-approach. Inf. Sci. 465, 144–161 (2018)
114. Kuperman, M., Abramson, G.: Small world effect in an epidemiological model.Phys. Rev. Lett. 86(13), 2909–2912 (2001)
115. Lane, N.D., Miluzzo, E., Lu, H., Peebles, D., Choudhury, T., Campbell, A.T.: Asurvey of mobile phone sensing. J. Supercomput. 48(9), 140–150 (2010). https://doi.org/10.1109/MCOM.2010.5560598
116. Leconte, M., Paschos, G., Gkatzikis, L., Draief, M., Vassilaras, S., Chouvardas, S.:Placing dynamic content in caches with small population. In: IEEE INFOCOM2016 - The 35th Annual IEEE International Conference on Computer Communi-cations, pp. 1–9, April 2016
117. Lee, Y.C., Zomaya, A.Y.: Energy efficient utilization of resources in cloud com-puting systems. J. Supercomput. 60(2), 268–280 (2012)
118. Lerman, K., Intagorn, S., Kang, J.H., Ghosh, R.: Using proximity to predictactivity in social networks. In: Proceedings of the 21st International Conferenceon World Wide Web, pp. 555–556. ACM (2012)

134 I. Kilanioti et al.
119. Leskovec, J., McGlohon, M., Faloutsos, C., Glance, N., Hurst, M.: Patterns ofcascading behavior in large blog graphs. In: Proceedings of SIAM InternationalConference on Data Mining (SDM) 2007. SIAM (2007)
120. Li, M., Wang, X., Gao, K., Zhang, S.: A survey on information diffusion in onlinesocial networks: models and methods. Information 8(4), 118 (2017)
121. Liben-Nowell, D., Kleinberg, J.: Tracing information flow on a global scale usingInternet chain-letter data. Proc. Natl. Acad. Sci. 105(12), 4633–4638 (2008)
122. Liberal, F., Kourtis, A., Fajardo, J.O., Koumaras, H.: Multimedia content deliveryin SDN and NFV-based towards 5G networks. IEEE COMSOC MMTC E-Lett.10(4), 6–10 (2015)
123. Lin, C.X., Mei, Q., Jiang, Y., Han, J., Qi, S.: Inferring the diffusion and evolutionof topics in social communities. Mind 3(d4), d5 (2011)
124. �Luczak, T.: Size and connectivity of the K-core of a random graph. Discrete Math.91(1), 61–68 (1991)
125. Luo, X., Wang, Y., Zhang, Z., Wang, H.: Superset: a non-uniform replica place-ment strategy towards high-performance and cost-effective distributed storage ser-vice. In: 2013 International Conference on Advanced Cloud and Big Data (CBD),pp. 139–146. IEEE (2013)
126. Luu, M.D., Hoang, T.A., Lim, E.P.: A survey of information diffusion models andrelevant problems (2011)
127. Maier, G., Feldmann, A., Paxson, V., Allman, M.: On dominant characteristics ofresidential broadband internet traffic. In: Proceedings of the 9th ACM SIGCOMMInternet Measurement Conference IMC, pp. 90–102. ACM (2009)
128. Mars, J., Tang, L.: Whare-map: heterogeneity in homogeneous warehouse-scalecomputers. In: ACM SIGARCH Computer Architecture News, vol. 41, pp. 619–630. ACM (2013)
129. Menon, A.: Big data@ Facebook. In: Proceedings of the 2012 Workshop on Man-agement of Big Data Systems, pp. 31–32. ACM (2012)
130. Milgram, S.: The small world problem. Psychol. Today 2(1), 60–67 (1967)131. Morris, S.: Contagion. Rev. Econ. Stud. 67(1), 57–78 (2000)132. Najar, A., Denoyer, L., Gallinari, P.: Predicting information diffusion on social
networks with partial knowledge. In: Proceedings of the 21st International Con-ference on World Wide Web, pp. 1197–1204. ACM (2012)
133. Nathuji, R., Kansal, A., Ghaffarkhah, A.: Q-clouds: managing performance inter-ference effects for QoS-aware clouds. In: Proceedings of the 5th European Con-ference on Computer Systems, pp. 237–250. ACM (2010)
134. Navarro, N.D.A.B., Da Costa, C.A., Barbosa, J.L.V., Righi, R.D.R.: A context-aware spontaneous mobile social network. In: Ubiquitous Intelligence and Com-puting and 2015 IEEE 12th International Conference on Autonomic and TrustedComputing and 2015 IEEE 15th International Conference on Scalable Comput-ing and Communications and Its Associated Workshops (UIC-ATC-ScalCom),pp. 85–92. IEEE (2015)
135. Nejkovic, V., Jelenkovic, F., Tosic, M., Milosevic, N., Nikolic, Z.: CoordSS: anontology framework for heterogeneous networks experimentation. Telfor J. 8(2),70–75 (2016)
136. Nekovee, M., Moreno, Y., Bianconi, G., Marsili, M.: Theory of rumour spreadingin complex social networks. Phys. A: Stat. Mech. its Appl. 374(1), 457–470 (2007)
137. Ousterhout, K., Wendell, P., Zaharia, M., Stoica, I.: Sparrow: distributed, lowlatency scheduling. In: Proceedings of the Twenty-Fourth ACM Symposium onOperating Systems Principles, pp. 69–84. ACM (2013)

Towards Efficient and Scalable Data-Intensive Content Delivery 135
138. Pejovic, V., Musolesi, M.: Anticipatory mobile computing: a survey of the state ofthe art and research challenges. ACM Comput. Surv. 47(3), 47 (2015). https://doi.org/10.1145/2693843
139. Perera, C., Zaslavsky, A., Christen, P., Georgakopoulos, D.: Context aware com-puting for the internet of things: a survey. IEEE Commun. Surv. Tutor. 16(1),414–454 (2014)
140. Perera, C., Zaslavsky, A., Christen, P., Georgakopoulos, D.: Sensing as a servicemodel for smart cities supported by internet of things. Trans. Emerg. Telecom-mun. Technol. 25(1), 81–93 (2014)
141. Plissonneau, L., Vu-Brugier, G.: Mobile data traffic analysis: how do you preferwatching videos? In: Proceedings of the 22nd International Teletraffic Congress(ITC), pp. 1–8. IEEE (2010)
142. Qu, H., Mashayekhi, O., Terei, D., Levis, P.: Canary: a scheduling architecturefor high performance cloud computing. arXiv preprint arXiv:1602.01412 (2016)
143. Rasley, J., Karanasos, K., Kandula, S., Fonseca, R., Vojnovic, M., Rao, S.: Effi-cient queue management for cluster scheduling. In: Proceedings of the EleventhEuropean Conference on Computer Systems, p. 36. ACM (2016)
144. Reiss, C., Tumanov, A., Ganger, G.R., Katz, R.H., Kozuch, M.A.: Heterogeneityand dynamicity of clouds at scale: Google trace analysis. In: Proceedings of theThird ACM Symposium on Cloud Computing, p. 7. ACM (2012)
145. Reiss, C., Wilkes, J., Hellerstein, J.L.: Google cluster-usage traces: format +schema. Technical report, Google Inc., Mountain View, CA, USA, November2011. http://code.google.com/p/googleclusterdata/wiki/TraceVersion2. Accessed20 Mar 2012
146. Ren, C., Lo, E., Kao, B., Zhu, X., Cheng, R.: On querying historial evolving graphsequences. Proc. VLDB Endow. 4(11), 726–737 (2011)
147. Ren, K., Kwon, Y., Balazinska, M., Howe, B.: Hadoop’s adolescence: an analysis ofhadoop usage in scientific workloads. Proc. VLDB Endow. 6(10), 853–864 (2013)
148. Ricciardi, S., Careglio, D., Sole-Pareta, J., Fiore, U., Palmieri, F., et al.: Savingenergy in data center infrastructures. In: 2011 First International Conference onData Compression, Communications and Processing (CCP), pp. 265–270. IEEE(2011)
149. Rodriguez, M.G., Leskovec, J., Scholkopf, B.: Structure and dynamics of informa-tion pathways in online media. In: Proceedings of ACM International Conferenceon Web Search and Data Mining (WSDM), Rome, Italy (2013)
150. Rogers, E.M.: Diffusion of Innovations. Simon and Schuster, New York (1995)151. Sastry, N., Yoneki, E., Crowcroft, J.: Buzztraq: predicting geographical access
patterns of social cascades using social networks. In: Proceedings of the SecondACM EuroSys Workshop on Social Network Systems, SNS 2009, Nuremberg,Germany, 31 March 2009, pp. 39–45 (2009). http://doi.acm.org/10.1145/1578002.1578009
152. Satyanarayanan, M.: Pervasive computing: vision and challenges. IEEE Pers.Commun. 8(4), 10–17 (2001)
153. Scellato, S., Mascolo, C., Musolesi, M., Crowcroft, J.: Track globally, deliverlocally: improving content delivery networks by tracking geographic social cas-cades. In: Proceedings of the 20th International Conference on World Wide Web,WWW 2011, Hyderabad, India, 28 March–1 April 2011, pp. 457–466 (2011).http://doi.acm.org/10.1145/1963405.1963471
154. Schilit, B.N., et al.: Challenge: ubiquitous location-aware computing and the placelab initiative. In: Proceedings of the 1st ACM International Workshop on WirelessMobile Applications and Services on WLAN Hotspots, pp. 29–35. ACM (2003)

136 I. Kilanioti et al.
155. Schilit, B.N., Theimer, M.M.: Disseminating active map information to mobilehosts. IEEE Netw. 8(5), 22–32 (1994)
156. Schwarzkopf, M., Konwinski, A., Abd-El-Malek, M., Wilkes, J.: Omega: flexible,scalable schedulers for large compute clusters. In: Proceedings of the 8th ACMEuropean Conference on Computer Systems, pp. 351–364. ACM (2013)
157. Sendling, T.C.: Micromotives and Macrobehavior. Norton, New York (1978)158. Shue, D., Freedman, M.J., Shaikh, A.: Performance isolation and fairness for
multi-tenant cloud storage. OSDI 12, 349–362 (2012)159. Sohrabi, S., Tang, A., Moser, I., Aleti, A.: Adaptive virtual machine migration
mechanism for energy efficiency. In: Proceedings of the 5th International Work-shop on Green and Sustainable Software, pp. 8–14. ACM (2016)
160. Song, X., Chi, Y., Hino, K., Tseng, B.L.: Information flow modeling based ondiffusion rate for prediction and ranking. In: Proceedings of the 16th InternationalConference on World Wide Web, pp. 191–200. ACM (2007)
161. Sundmaeker, H., Guillemin, P., Friess, P., Woelffle, S.: Vision and challenges forrealising the internet of things. Clust. Eur. Res. Proj. Internet Things Eur. Com-mision 3(3), 34–36 (2010)
162. Thereska, E., Donnelly, A., Narayanan, D.: Sierra: practical power-proportionalityfor data center storage. In: Proceedings of the Sixth Conference on Computersystems, pp. 169–182. ACM (2011)
163. Torres, R., Finamore, A., Kim, J.R., Mellia, M., Munafo, M.M., Rao, S.: Dissect-ing video server selection strategies in the YouTube CDN. In: 2011 31st Inter-national Conference on Distributed Computing Systems (ICDCS), pp. 248–257.IEEE (2011)
164. Tosic, M., et al.: Semantic coordination protocol for LTE and Wi-Fi coexistence.In: 2016 European Conference on Networks and Communications (EuCNC), pp.69–73. IEEE (2016)
165. Traverso, S., Huguenin, K., Trestian, I., Erramilli, V., Laoutaris, N., Papagian-naki, K.: TailGate: handling long-tail content with a little help from friends.In: Proceedings of the 21st World Wide Web Conference 2012, WWW 2012,Lyon, France, 16–20 April 2012, pp. 151–160 (2012). http://doi.acm.org/10.1145/2187836.2187858
166. Vavilapalli, V.K., et al.: Apache Hadoop YARN: yet another resource negotiator.In: Proceedings of the 4th Annual Symposium on Cloud Computing, p. 5. ACM(2013)
167. Vergara, E.J., Nadjm-Tehrani, S.: EnergyBox: a trace-driven tool for data trans-mission energy consumption studies. In: Energy Efficiency in Large Scale Dis-tributed Systems - COST IC0804 European Conference, EE-LSDS 2013, Vienna,Austria, 22–24 April 2013, Revised Selected Papers, pp. 19–34 (2013). http://dx.doi.org/10.1007/978-3-642-40517-4 2
168. Verma, A., Pedrosa, L., Korupolu, M., Oppenheimer, D., Tune, E., Wilkes, J.:Large-scale cluster management at Google with Borg. In: Proceedings of the TenthEuropean Conference on Computer Systems, p. 18. ACM (2015)
169. Wang, Z., Zhou, X., Yu, Z., Wang, H., Ni, H.: Quantitative evaluation of groupuser experience in smart spaces. Cybern. Syst.: Int. J. 41(2), 105–122 (2010)
170. Want, R., Pering, T.: System challenges for ubiquitous & pervasive computing.In: Proceedings of the 27th International Conference on Software Engineering,pp. 9–14. ACM (2005)
171. Watts, D.J.: A simple model of global cascades on random networks. Proc. Natl.Acad. Sci. 99(9), 5766–5771 (2002)

Towards Efficient and Scalable Data-Intensive Content Delivery 137
172. Yan, Y., Qian, Y., Sharif, H., Tipper, D.: A survey on smart grid communicationinfrastructures: motivations, requirements and challenges. IEEE Commun. Surv.Tutor. 15(1), 5–20 (2013)
173. Yang, H., Breslow, A., Mars, J., Tang, L.: Bubble-flux: precise online QoS manage-ment for increased utilization in warehouse scale computers. In: ACM SIGARCHComputer Architecture News, vol. 41, pp. 607–618. ACM (2013)
174. Yang, J., Leskovec, J.: Modeling information diffusion in implicit networks. In:Proceedings of the 10th IEEE International Conference on Data Mining (ICDM),pp. 599–608. IEEE (2010)
175. Zaharia, M., Borthakur, D., Sen Sarma, J., Elmeleegy, K., Shenker, S., Stoica,I.: Delay scheduling: a simple technique for achieving locality and fairness incluster scheduling. In: Proceedings of the 5th European Conference on ComputerSystems, pp. 265–278. ACM (2010)
176. Zhang, D., Yu, Z., Guo, B., Wang, Z.: Exploiting personal and community contextin mobile social networks. In: Chin, A., Zhang, D. (eds.) Mobile Social Networking.CSS, pp. 109–138. Springer, New York (2014). https://doi.org/10.1007/978-1-4614-8579-7 6
177. Zhang, X., Tune, E., Hagmann, R., Jnagal, R., Gokhale, V., Wilkes, J.: CPI 2:CPU performance isolation for shared compute clusters. In: Proceedings of the8th ACM European Conference on Computer Systems, pp. 379–391. ACM (2013)
178. Zhou, F., Zhang, L., Franco, E., Mislove, A., Revis, R., Sundaram, R.: WebCloud:recruiting social network users to assist in content distribution. In: Proceedingsof the 11th IEEE International Symposium on Network Computing and Applica-tions, Cambridge, MA, USA (2012)
Open Access This chapter is licensed under the terms of the Creative CommonsAttribution 4.0 International License (http://creativecommons.org/licenses/by/4.0/),which permits use, sharing, adaptation, distribution and reproduction in any mediumor format, as long as you give appropriate credit to the original author(s) and thesource, provide a link to the Creative Commons license and indicate if changes weremade.
The images or other third party material in this chapter are included in the chapter’sCreative Commons license, unless indicated otherwise in a credit line to the material. Ifmaterial is not included in the chapter’s Creative Commons license and your intendeduse is not permitted by statutory regulation or exceeds the permitted use, you willneed to obtain permission directly from the copyright holder.

Big Data in 5G Distributed Applications
Valentina Nejkovic1(&), Ari Visa2, Milorad Tosic1, Nenad Petrovic1,Mikko Valkama2, Mike Koivisto2, Jukka Talvitie2, Svetozar Rancic3,
Daniel Grzonka4, Jacek Tchorzewski4, Pierre Kuonen5,and Francisco Gortazar6
1 Faculty of Electronic Engineering, University of Nis, Nis, [email protected]
2 Faculty of Computing and Electrical Engineering,Tampere University of Technology, Tampere, Finland
3 Faculty of Science and Mathematics, University of Nis, Nis, Serbia4 Cracow University of Technology, Cracow, Poland
5 University of Applied Sciences of Western Switzerland, Fribourg, Switzerland6 Rey Juan Carlos University, Madrid, Spain
Abstract. Fifth generation mobile networks (5G) will rather supplement thanreplace current 4G networks by dramatically improving their bandwidth,capacity and reliability. This way, much more demanding use cases that simplyare not achievable with today’s networks will become reality - from homeentertainment, to product manufacturing and healthcare. However, many ofthem rely on Internet of Things (IoT) devices equipped with low-cost trans-mitters and sensors that generate enormous amount of data about their envi-ronment. Therefore, due to large scale of 5G systems, combined with theirinherent complexity and heterogeneity, Big Data and analysis techniques areconsidered as one of the main enablers of future mobile networks. In this work,we recognize 5G use cases from various application domains and list the basicrequirements for their development and realization.
Keywords: 5G � Big Data � Use cases
1 Introduction
The vision of 5G is becoming clearer as we move closer to the end of this decade. The5G will feature increased network speed, and machines, cars, city infrastructure besidepeople will be connected. It is expected that 5G networks will have always-on capa-bilities and to be energy efficient, which require new protocols and access technologies.The 5G network represents highly complex and heterogeneous network that integratesmassive amount of sensor nodes and diversity of devices such as macro and small cellswith different radio access technologies such as GSM, WCDMA, LTE, and Wi-Fi thatcoexist with one another. Such network vision is expected to lead to traffic volume oftens of exabytes per month that further demands networks capacity 1000 times higherthan now [1, 2]. Such traffic volume is not supported with nowadays cellular networks.Thus, practical deployment of 5G networking systems, in addition to traditionaltechnology drivers, needs some new critical issues to be resolved on different areas
© The Author(s) 2019J. Kołodziej and H. González-Vélez (Eds.): cHiPSet, LNCS 11400, pp. 138–162, 2019.https://doi.org/10.1007/978-3-030-16272-6_5

such as: (1) coordination mechanism [3], (2) power consumption [4], (3) networkingbehavior prediction [5], (4) positioning and location-awareness [6] etc. Some operatorsalready start their deployments and the standards process forward.
5G will be built upon the existing 4G LTE networks with features available as partof the LTE - Advanced standard. Some features will include carrier aggregation thatenable using of existing spectrum efficiently with network capacity increase and higherthroughput rates. Self-organizing networks will play key role as well as technologiessuch as coordinated multipoint that will enable operators to simultaneously transmitand process signals from multiple sites. Software-defined networks (SDN) and networkfunctions virtualization (NFV) will be very important for operators in order to scaletheir networks quickly in migration from 4G to 5G [7]. SDN will play key role forcarving virtual sub-networks, which can be used for huge bandwidth applications,which for example include video with requirement in speed of 10 Gb/s as well as lowerbandwidth applications, which for example connect different user equipment that areless demanding on the network.
The 5G architecture and deployment will depend upon how the network is used.For example, applications such as streaming video, video conferencing and virtualreality require high speed with growth in the video traffic. In order to achieve thisrequirement, the network needs a lot of small cell coverage and higher bandwidthspectrum. Further, 5G will be the network for Internet of Things (IoT) with support fora lot of devices [8]. Such IoT network should be efficient in low-bandwidth trans-missions with enhanced coverage. Because of the high scale of 5G systems combinedwith their inherent complexity and heterogeneity, Big Data techniques and analysis willbe one of the main enablers of the new 5G critical issues.
Big Data refers to large data sets whose size is growing at enormous speed makingit difficult to handle and manage them using the traditional techniques and softwaretools. It is a step forward from traditional data analysis, considering the followingaspects (so-called five “five Vs”) [9]: quantity of data (volume), different types of semi-structured and unstructured data (variety), the rate with which data is changing or howoften it is created (velocity), the importance of results extracted from data (value), dataquality, including trust, credibility and integrity (veracity). Taking into account theprediction that the number of connected devices will increase 10–100 by the time when5G will be commercially used [10], it can be concluded that Big Data techniques willplay an important role, as all the considered usage scenarios are based on extractingknowledge from the enormous amount of heterogeneous data generated by connecteddevices in order to support the decisioning and other mechanisms in future 5Gnetworks.
In this chapter, we identify use cases and scenarios that could benefit from newcapabilities provided by 5G network in synergy with Big Data technologies, list basicrequirements for their application development, and consider some future challengesaddressing positioning challenges and semantic-based solutions. The researcher com-munity and service providers (business stakeholders) could benefit from this chapter.From one side, it provides an insight of recent trends in 5G research and development,while, from the other side, it discusses how the research outcomes could be used fordevelopment of future services to satisfy customer demands.
Big Data in 5G Distributed Applications 139

Section 2 of this chapter gives list 5G use cases requirements, while Sect. 3 givesidentified 5g use case with short description of each. Section 4 gives future challengestargeting positioning systems, semantic based approaches, 5G security etc. Section 5concludes the chapter.
2 5G Use Cases Requirements
The introduction of big data techniques in 5G distributed applications poses a chal-lenge, as these techniques usually require huge computational resources. In general,there is a need for high performance computing infrastructure. This infrastructurewould typically be available as a private or public cloud or grid. Cloud or gridresources will allow for consuming, storing and processing huge amounts of data. Thisdata shall be prepared for consumption from the edge network. Depending on thenature of the data needed by end-users, we can envision two kinds of data processingmethods: online and offline. Offline methods are easier to handle as the processing canbe performed in the cloud or grid. This are supposed to be processes that are notcritical. Online processing is used when a response is needed in a given amount of time,and therefore both the time required to give a response and the latency would have highimpact on the set of use cases that will be available for 5G.
For online processing, in those cases where common off-the-shelf hardware isavailable at the edge, general Big Data solutions can be run on top of this commodityhardware, assuming that the constrained resources available are enough.
In general, we identify following requirements needed for 5G use cases:
• Network requirements: Network with 5G capabilities; faster and higher-capacitynetworks, which can deliver video and other content-rich services; massive con-nectivity of devices based on different technologies, etc.
• Application requirements: Consistent process mining over Big Data triple store;Network capability measurement module; Reasoning module; Learning and Pre-diction module (for example, Neural Network); Optimization module; Corre-sponding domain and application Ontologies; etc.
• Storage requirements: Big Data triple store; Possibility to handles large amounts (apetabyte or more) of data; Distributed redundant data storage; Massively parallelprocessing; Provides Semantic Big Data processing capabilities; Centrally managedand orchestrated.
Even though the 5G networks are primarily designed for enhanced communicationpurposes, high-accuracy positioning has been considered as one of the key features in5G. Moreover, the standardization organization third generation partnership project(3GPP) has already published several technical reports and specifications regardingpositioning in future 5G networks [11–14]. However, since the 5G specifications arestill under development, detailed descriptions of different positioning approaches andrelated positioning protocols are yet unavailable. Despite this, in order to facilitatedevelopment of various future 5G-enabled use cases, 3GPP has introduced the first setof performance requirements considering different types of position-reliant use casespresented in [13]. For each use case, a specific positioning accuracy, including both
140 V. Nejkovic et al.

horizontal and vertical directions, has been given according to the type of the area ofinterest and its 5G service characteristics. For certain use cases, when applicable, alsoaccuracy requirements for velocity estimation and device bearing estimation areprovided.
Similar to common 5G guidelines, besides focusing only on maximizing thepositioning accuracy, also other important positioning service aspects have beenconsidered in the existing reports given in [13]. One of the key performance indicatorsis positioning availability, which defines in which percent of the time the positioningmethod provides estimates with the specified accuracy level. Another important posi-tioning performance indicator is latency, which indicates the elapsed time betweentriggering the positioning process and finally obtaining the position estimates. More-over, the latency of the first position estimate at the initialization stage of the posi-tioning process, referred to as the time-to-first-fix, has been separately specifiedtypically with reduced performance requirements compared to the latency in general.
In addition to the above-described 5G positioning requirements, there are variousother aspects, which have not yet been appropriately addressed in the reports andspecifications, but should be considered according to the needs of users, operators and3rd parties. Such aspects include, for example, energy consumption, security andprivacy, estimation reliability and related confidence levels, and possible regulatoryrequirements (e.g., positioning during emergency calls) [12–14].
Mobile-network-based positioning approaches can be divided into two fundamentalcategories, which are network-centric positioning and user-centric positioning. Innetwork-centric positioning, the position estimates are obtained at the network sidebased on the signals transmitted by the user device. In this approach, all heavy com-putational load is located at the network side, which reduces the power consumption ofthe user device, and thus, increases the valuable battery life of the device. Moreover,when the positioning is done at the network side, all positioning related information,such as network BS locations, are already available for the positioning algorithmswithout introducing additional overhead from signaling the information over the radiointerface. The fact that the position information is fundamentally located at the networkside is especially useful for achieving the future targets of the 5G networks, as itfacilitates numerous 5G-enabled mission-critical use cases where the latency andreliability of the position estimates are in a crucial role. In the user-centric positioningapproach, where the user device performs the positioning based on the signals trans-mitted by the network nodes, the position information is not directly available at thenetwork side. This approach increases user security and privacy, but on the other hand,it requires additional signaling overhead in order to utilize the device positions jointlyas part of new 5G-enabled infrastructures such as traffic control and ITS, for instance.
3 5G Use Cases
In this section, we analyze how the current advances in 5G and related concepts can beleveraged in order to provide novel use cases that were not possible before or improvethe existing services and solutions.
Big Data in 5G Distributed Applications 141

3.1 5G Coordination Mechanisms
The 5G network indicates the need for coexistence of multiple wireless technologies inthe same environment [3, 15, 16]. The problem that raises in such environments ismutual interference among multiple wireless networks, which is consequence of anoverlapping in usage of the same set of resources. Typically, such case happens whensame radio frequencies are used for multiple communication channels that are based ondifferent radio technologies [3, 15]. Coordination protocols defined by the technologystandards traditionally address the problem when networks use same technology. Newcoordination concepts are needed in the case of co-existing networks based onheterogeneous technologies [16, 17].
We identify the following possible scenario. In a Home Network setting, a typicalhome can have several rooms each equipped with WiFi enabled HDTV set and anumber of streaming audio appliances. At the same time and in the same building, asensor network is used for home automation including presence detection, temperatureand lighting regulation, doorbell indication and security and safety monitoring. Mosthomes also have at least one microwave oven and a number of Bluetooth Low Energygadgets. During the typical evening, all of these devices are active and have to beactively coordinated in order to provide satisfactory level of service.
3.2 Power Consumption
A number of recently finished as well as currently on-going 5G related EU projectsconfirm a diversity of usage and applications of power consumption, efficiency andreliability in WSNs. These projects delivered a number of algorithms and protocols forreducing energy consumption that show the importance of the power consumption.Further, the design of the 5G wireless networks has to consider energy efficiency asvery important pillar in order to optimize economic, operational, and environmentalconcerns [1, 18]. In presence of enormous high traffic volume, data-driven techniquessuch as intelligent distribution of frequently accessed content over the network nodesand content caching can result in relevant energy consumption reductions and prolongthe lifetime of nodes that are low on battery energy.
3.3 Networking Behavior Prediction
Big Data Analytics solutions can predict how the needs in resources use change amongplaces and throughout the time within a complex large-scale system. A 5G network thatadopt such solution would have ability to learn from the previous situations and statesand intelligently adopt to new demands [5, 19]. Particularly, using appropriate learningtechniques the system will enable devices to learn from past observations in theirsurroundings.
For example, we identify the following use case scenario: (a) In a Smart City, trafficlights and pedestrian crossings (i.e. various presence detectors) are IEEE 802.15.4technology equipped while community WiFi network is mounted on a number of lightposts lining the same street. During rush hours, there is a high demand for WiFi trafficdue to a large number of people using personal devices potentially impacting traffic
142 V. Nejkovic et al.

management system; (b) Mobile users consume images, videos and music, whichincrease in volume over time. In such a case, network congestion is a consequence ofthe high dynamics in demands that exceeds the system potential for adaptability.
3.4 Positioning and Location-Awareness in Future 5G Networks
The world is changing rapidly. New services are needed and many of those newservices require location-awareness. Autonomous vehicles, transportation, traffic con-trol need this kind of service. If we consider the problem from the point of view of thesmart city we notice that there are many new user groups, such as pedestrians, cleaningand maintenance services, management and administration. There are several approa-ches to help with positioning. One started with Long Range Positioning systems likeDecca and LORAN and continued with Global Positioning System (GPS) that is apositioning system based on Medium Earth Orbit satellites. GPS is a part of GlobalNavigation Satellite System (GNSS) [20]. GNSS also includes, for example EuropeanGalileo and Russian GLONASS. However, satellites are not solving the positioningproblem totally. In many regions positioning needs help from mobile communicationnetworks that is called assisted GPS (A-GPS). The high latitudes in North and in Southand cities with skyscrapers are for examples problematic regions.
In contrast to the earlier and existing mobile generations, where positioning hasbeen only an add-on feature, future 5G radio networks will allow for highly accuratepositioning not only for personal navigation purposes but also for unforeseen location-aware services and applications like robotics, intelligent transportation systems (ITSs),and drones, just to name few. While seeking to meet the demanding communicationrequirements of 5G, e.g., in terms of capacity and data-rates, 5G networks will exploitlarge bandwidths and massive antenna arrays, which together with even denser basestation (BS) deployments create also a convenient environment for 5G-based radiopositioning. Hence, it is widely expected that future 5G networks should enable andeven improve indoor and outdoor positioning techniques embedded to a radio accessnetwork (RAN) [11] as well as the ones that utilizes RAN-external measurements fromGNSS or sensors.
3.5 Ultra/High Definition Live Video Streaming in Wireless Networks
In recent years, video streaming, both on-demand and live has become an importantpart of our everyday lives – from social networks, content delivery platforms toindustrial, robotic and experimentation systems. Due to rise of processor power andcamera sensor resolution of consumer devices, such as smartphones, the image qualitycriteria perceived by consumers has dramatically increased. High Definition video isbecoming a must for all the use cases where video streaming is involved. Not only that,but also new video formats are emerging, such as stereoscopic 3D, 360-degree videoand Ultra High Definition Video which contain even more data that has to be trans-mitted. Therefore, Internet service providers, mobile carriers and content providers areencountering many issues, as transmission of such content requires significantly largerbandwidth. Additionally, the issues become even more challenging due to devicemobility, which can affect the Quality of Service and Quality of Experience, especially
Big Data in 5G Distributed Applications 143

when it comes to live video broadcast in varying network conditions [21]. Here, weidentify a potential use case of novel networking paradigms – SDN and VNF, incombination with Big Data technologies. Large amount of network equipment andstatus data is analyzed. The results of data analysis are semantically annotated andstored into RDF triple store, so semantic reasoning can be performed in order to drawnew conclusions which could lead to re-deployment of virtual networking assets,generation of SDN rules, parameter tuning or other optimizations with objective tosatisfy user-defined QoS parameters and maintain the quality of high definition livevideo streaming in varying network conditions, where devices are moving intensively(such as mobile robotic and experimentation systems).
In several publications so far, this topic has been discussed, problems identified andseveral solutions proposed. However, in most cases, these solutions suffer from lowquality, large end-to-end latency in live streaming and frequent freezes in the videoplayout due to sudden drops of the available bandwidth [22]. In [22], it was shownnetwork-based prioritization introduced by an OpenFlow, SDN-enabled controller canreduce video freezes caused by network congestion. Therefore, the utilization of SDNtechnologies in this case seems promising. In [23], results confirm that it is nowpossible to realize a short-range THz wireless communication system for commercialapplications where Ultra HD video streaming is needed. However, it is not suitable foruse cases like experimentation and mobile robot where long-range wireless commu-nication is of utmost importance.
We can conclude that there are still many open questions in case of ultra/highdefinition live video streaming using wireless networks, which makes it suitable forfuture research and application of next generation networking in synergy with Big Dataand semantic technologies.
3.6 Multi-party Trust Based on Blockchain for Process Monitoring
IoT and smart objects are key-enabler technologies for monitoring of complex businessprocesses [24], especially in logistics domain and industrial production systems [25].However, most of these processes involve multiple parties. In absence of centralauthority, the trust between these parties becomes an important issue [25, 26]. Despitethe fact that artifact-driven monitoring enables to effectively keep track of the executionof processes where multiple organizations are involved, it does not fully solve theproblem of trust among them. As the devices involved in monitoring process mightbelong to different organizations, there is still a possibility that one of the parties canmisconfigure its devices in order to achieve some own goal in an illegal way, withpossibility to disrupt the process execution itself, affecting the final outcome.
Blockchain technology is recognized as a solution for issues related to trust inmulti-party process monitoring systems [25–27]. Blockchain provides a sharedimmutable ledger, which guarantees that the information can be accessed and validatedby all the participants of a process both during its execution and after it is completed,which builds the trust among them.
This use case represents a potential area where we can make use of synergy ofvarious novel technologies and paradigms, such as IoT, Big Data and next generationnetworking together with blockchain.
144 V. Nejkovic et al.

3.7 Trusted Friend Computing
With the advent of 5G networks, an increasing number of devices will be connectedpermanently and at high speed to the Internet and to each other. While many appli-cations will benefit from this new connectivity by being able to interact more quicklywith data providers, such as the cloud or other resources, there is also a growing needfor privacy-conscious data sharing. This is particularly the case in the context of BigData, which also includes the issue of moving large amounts of private data. Onepossible approach to this problem is to move calculations close to the data and provideaccess to both data and local computing resources.
The Trusted Friend Computing (TFC) concept aims to enable a community of usersto securely share their IT resources without a central organization collecting and storinginformation. It is a distributed, resource-centered paradigm where data, computingpower, software or the network can be shared reliably and resiliently. This paradigmdefines an original IT architecture built around the notion of a community of users(called friends) of a given software application. Instead of using the traditionalapproach where the IT architecture is middleware-centric to share resources, the TFCapproach focuses on the software application used by the community. One of theimportant advantages of this approach is to avoid heavy executable codes transferssince all friends already possess the calculation modules useful for the community.Inspired by the social network model and using a concept similar to virtual privatenetworks (VPNs), the idea is to allow friends to invite other users of the software tojoin the community to share their resources. The community is therefore built byindividual cooptation and is, by nature, distributed, decentralized and elastic.
To achieve this objective, several major technical challenges must be addressed.We can, among other things, mention:
• Clearly define a security model for sharing IT resources in the context of TFCapplications;
• The definition of community management and accounting needs;• The development of a platform to enable and facilitate the implementation of
applications that comply with the TFC model.
Finally, a user community focused on using a specific application must be identifiedand the application must be enhanced with TFC features. One of these communities isthat of physicians involved in the diagnosis of genetic diseases and using the Gen-searchNGS tool [28]. This Java software analyzes next-generation sequencing data(NGS) to detect changes in DNA sequences for the diagnosis of genetic diseases [29,30]. In order to be able to easily integrate into any Java software, including Gen-searchNGS, TFC capabilities the POP-Java tool [31, 32] was used. This tool has beenimproved to support the different functionalities required for TFC-compatible appli-cations [33].
TFC’s security model is based on the notion of a “confidence link” as presented in[34]. A confidence link is a two-way channel that allows two friends to communicate
Big Data in 5G Distributed Applications 145

safely at any time. The confidence link also authenticates users with a security cer-tificate, ensuring the identification of communicating partners. Each member of anetwork can extend the network by creating additional confidence links with otherfriends, thus adding new members to the network. All friends as well as all confidencelinks form a connected graph where the nodes are friends and the arcs are the confi-dence links. We call such a graph a “community of trusted friends” or more simply a“community”. None of the friends in the community have a global view of theinfrastructure. Each friend only knows his direct friends, i.e. the users with whom hehas established a confidence link.
Applications can publish resources on a network of friends or search and access theresources of other network members. When publishing a resource, specific accessrights can be given to limit access to the resource, for example by differentiatingbetween direct and indirect friends in a network.
The model also includes the ability to record the use of each member’s resources,which allows the use of resources to be billed based on their utilization rate, therebyencouraging members to share their resources.
Today, and certainly even more so tomorrow, the use of mobile networks forprofessional applications will be a reality. These applications are less and less confinedto work desktops but are now used outside the enterprise environment for efficiencyand ease of use. A concept such as TFC can truly benefit from a high-performancemobile communications network such as 5G networks to provide professional com-munities with secure access, anytime, anywhere, to vast computing and data resources.
3.8 Virtual and Augmented Reality Applications
Virtual (VR) and augmented reality (AR) applications are not exceptions when itcomes to potential use cases where utilization of 5G networks could be highly bene-ficial. The arrival of next-generation of mobile network will unlock the full potential ofVR and AR technology, which is still limited by current network characteristics. Thecomplex graphically-rich scenes and sophisticated input mechanisms that are used tocreate the VR and AR experiences require a large amount of data that has to beprocessed [35]. Lag, stutter, and stalls are unacceptable for user experience and comfort[36]. This is not a huge problem for local applications, but is quite challenging whendone remotely, if the user is on the move and not using the fixed network connection[35]. In this case, the quality of VR and AR experience is heavily dependent on threenetwork components: high capacity, low latency and uniform experience. This way,many novel services and applications that involve the usage of augmented and virtualreality would see lights of the day, such as immersive movies, video games, live shows,concerts, sport events, immersive education platforms, immersive social interactions,immersive professional project collaboration and many others [35–37]. To sum up,these services would affect the way that people play, learn and communicate [36].
146 V. Nejkovic et al.

4 Current Solutions and Future Challenges
4.1 5G Positioning
Possible Error Sources State of the ArtWhen considering the 5G positioning aspect, ultra-dense BS deployments, increasedtransmission bandwidths, and large antenna arrays enable efficient utilization of bothranging-based (e.g., time-of-arrival (ToA) and time-difference-of-arrival (TDoA)), andangle-based (e.g., direction-of-arrival (DoA)) positioning measurements. However, inorder to exploit these types of measurements for positioning, specific prior knowledgeabout the network and user device is often assumed available. In case of temporalmeasurements, the clocks of the user device and network nodes are often assumed to besynchronized. More specifically, with ToA measurements, all clocks in the network,including the user device and the BSs, are typically assumed to be synchronized amongeach other, whereas with TDoA measurements, only the BS clocks are assumed to besynchronized. Nonetheless, clock synchronization errors can result in large inaccura-cies in ranging measurements, and thus, has to be carefully considered in a practicalpositioning system implementation. Besides the aforementioned clock errors, theranging measurements as well as angle-based measurements can be deteriorated by theerrors related to BSs’ locations. In addition to the inaccurate BSs’ location information,uncertainties in the orientation of the BS antennas and/or the user device antennas maycause significant error to the positioning results when utilizing angle-based measure-ments like DoA measurements for positioning.
Whereas the BS position and antenna orientation error can be typically consideredtime-invariant, the clock errors are often time-variant with certain time-driftingbehavior. However, it is appropriate to assume that the time-variant behavior of the BSclocks can be sufficiently small, and thus, there can be only a possible constant clockoffset between the BS clocks. Nonetheless, any unknown (or uncertain) systemparameter, such as clock offset, BS positions and antenna orientation, can be estimatedusing classical simultaneous localization and mapping (SLAM) approaches, where theuser device position and the unknown system parameters are estimated simultaneouslywhile the user device is moving within the network coverage area.
Since the 5G specifications are still under development and 5G networks are onlybeginning to emerge to the market, the state-of-the-art 5G positioning studies rely onhigh computational load computer simulations using realistic radio wave propagationmodels with extensive 3D ray tracing algorithms. In [38], a network-centric positioningapproach was studied by considering asynchronous clocks in the user device and in thenetwork BSs. It was shown that regardless of the clock errors, sub-meter positioningaccuracy was achieved by using the ToA and DoA measurements. Moreover, while theuser device was moving in the network, the network BSs were synchronized similar tothe well-known SLAM principle. This type of approach was later used in [39] forinvestigating location-aware communications, including applications for proactiveradio resource management and location-based geometric beamforming.
A user-centric positioning approach based on signals from a single BS was studiedin [40]. In this case, by utilizing only a single BS for the positioning, requirements for
Big Data in 5G Distributed Applications 147

the clock synchronization can be considerably alleviated. Based on the ToA and angle-of-arrival (AoA) measurements, the user device position was estimated with sub-meteraccuracy and the antenna orientation of the user device with sub-degree accuracy.Moreover, the developed estimation algorithm was also designed to exploit reflected(or scattered) radio wave components, and therefore, it was able to provide positionestimates also for the reflection locations. This type of utilization of non-line-of-sightradio paths introduces various new communications aspects from advanced beam-forming techniques to environment-aware interference management. The user-centricpositioning approach was also studied in [41] for a high-speed train scenario utilizing5G-specified downlink synchronization signal blocks for positioning purposes. Again,despite of the challenging BS geometry of the train scenario, sub-meter positioningaccuracy was achieved by jointly using the ToA and AoA measurements.
The network-centric positioning with uncertain BS antenna orientations wasstudied in [42], where the positioning was based on type of signals used in conven-tional beam training procedures. By using beam-wise received signal power mea-surements the user device position and the unknown BS antenna orientations werejointly estimated achieving a sub-meter positioning error and a sub-degree antennaorientation error.
Semantic Analysis of Network Topology and Sensor Data for High-PrecisionLocalization in 5G Networks ChallengesHigh-accuracy positioning has been considered as one of the key features of futuregeneration network and still an open question in many areas, such as robotics, drone-based experimentation and exploration, autonomous vehicles and intelligent trans-portation systems.
This task becomes quite challenging in these cases, especially when it comes toindoor localization [43] and outdoor localization of fast-moving aerial devices [44] invarying network conditions (drones).
Mobile-network-based positioning can be divided in two categories: user-centricand network-centric. There are various positioning methods which perform with dif-ferent values of accuracy, latency and time-to-fix in certain conditions.
It is identified that current research in 5G localization is going towards cooperation[45, 46]. Therefore, the semantic coordination of both user and network operatordevices could be used for determining the precise location, taking into account twofactors:
1. Network topology: how the devices are arranged in space within the network, suchas distance, frequency band at which the device is operating etc. The informationabout network topology can be semantically annotated leveraging some domain-specific language as a representation.
2. Service utilization and sensor data: a large amount of service utilization and sensordata is collected from both the customer and network operator devices (such asmonitoring and status). It can be analyzed leveraging various data analysis tech-nique. Furthermore, the data can be semantically annotated according to the resultsobtained as output of data analysis techniques.
148 V. Nejkovic et al.

For this purpose, we define domain-specific ontologies and rules which are used toperform semantic reasoning about the precise location leveraging the semanticannotations about both the network topology and service utilization/sensor data,taking into account the user-defined performance metrics and QoS parameters, suchas accuracy, latency and time-to-fix (Fig. 1).
4.2 Infrastructure Design of Semantic Driven Big Data in 5G Networking
Semantic Driven Big Data State of the ArtProblems of 5G coordination, power consumption and network behavior predictionfeature smart adoption of high-volume data processing results by the system that wepropose to address using semantics. In particular, core of the proposed infrastructure isa server, centralized or distributed, that collects relevant knowledge in the givenenvironment and uses the knowledge to make necessary informative decisions, forexample about network coordination, network sensors power consumption etc. Theserver collects networking data and interprets data semantically. For the knowledgerepresentation, the server uses ontology framework approach. The first version of theframework has been previously successfully applied in the case of coordination oftechnologies that operate in the same unlicensed frequency band [17, 47]. The
Fig. 1. Semantic analysis of network topology and sensor data for high-precision localization in5G networks.
Big Data in 5G Distributed Applications 149

coordination and spectrum sensing is modelled as an interactive process, where systemnodes communicate and share knowledge about relevant spectrum conditions.Semantic channels are established within the system for the interaction between par-ticipating communication devices. The ontology framework could be extended fordifferent cases such as solution presented in [48] that could give further directions formanagement of semantic Big Data for intelligence.
System that incorporates sensors and 5G user equipment acquire large collection ofdata. Collecting, storing, analyzing and retrieving data from industrial sensors or othermachinery connected to the Internet of Things has become of increasing importance, asa growing number of organizations is looking to take advantage of available data.
One possible semantic framework approach has been successfully proven in manycases. In [17], the case of semantic LTE-U coordination is presented. The coordinationand spectrum sensing is modelled as an interactive process, where system nodescommunicate and share knowledge about relevant spectrum conditions. Ontologies areused for knowledge representation as bases for automatic reasoning about optimalchannel allocations and for coordination. Moreover, in [49] the semantic technologywas used for the implementation of network intelligence on top of the FIESTA-IoTplatform by using reasoning for the network state estimation in order to perform thespectrum coordination. On the other side, in [50, 51], a semantic-driven approach forunmanned vehicle mission coordination in robotic experimentation testbeds is pre-sented. In this case, the ontologies are used to represent the knowledge about devicecapabilities, constraints, domain expert knowledge and both the design-time (missioncode) and run-time (sensor data) aspects that are taken into account during the gen-eration of the coordinated device missions. Furthermore, in the paper [52] is presentedthe novel semantic-based approach and algorithm for automatic code generation withhuge potential with its extension to 5G applications.
Semantic Driven 5G System Architecture ChallengesThe challenge is to exploit semantic technologies at the backend as a flexible foun-dation for advanced frontend data processing tasks. Possible system architecture con-sists of five modules given in Fig. 2 and described in more details in the following.
(1) Data Acquisition Module (DAM): Redis is an in-memory database with option ofpersistence on disk, so it represents a tradeoff where very high write and readspeed is achieved at the price of the limitation of data sets that can’t be larger thanmemory [53–55]. We assume data sources at the order of million data series withabout million measurements annually for few tens of years with several bytes of adata item size. Hence, size of the total data load could be estimated at the order ofa petabyte (PB). The row data has low information density, and as such it is verysusceptible for compression. Hence, it can be expected that a 100 times com-pression rate can be achieved easily (e.g. simple run-length encoding). Big Datatechnologies can be used for ultra-large scale data sets processing. Distributedstorage and processing frameworks are used for that, such as the open sourceApache Hadoop Framework [56]. Apache Hadoop enables distributed data pro-cessing across clusters of computers. Popular MapReduce distributed data-processing model, Hadoop Distributed File System (HDFS), and distributed tablestore HBase [57] are Hadoop components.
150 V. Nejkovic et al.

(2) The Pre-Processing Module (PPM) identifies instability intervals that aresemantically annotated, stored, and retrieved later on during search by end user.Anomaly detection is an important problem that has been under extensive researchin diverse application domains. We distinguish two basic types of approaches withrespect to domain specification as well as online or offline processing. Theseapproaches are not mutually exclusive but, in opposite, they can be used togetherto achieve a synergy effect. Results obtained in such a way can be used for instantreaction but also for longer term planning activities. They can provide users avaluable information, which can be used proactively, further improve system
Fig. 2. System architecture for Semantic Driven Big Data in 5G networking.
Big Data in 5G Distributed Applications 151

efficiency and give competitive advantages. In most cases a refining of input datais needed as a first step. Anomaly detection in time series data obtained by sensors[58] is a very demanding task but really important in the same time.A simple low-complexity algorithm for instability intervals detection is envi-sioned. The process complexity shall be encapsulated into a separate instabilityparameters construction module that would extract the parameters from data seriesin an independent batch-processing manner. Semantic description of the insta-bility interval may be more or less complex depending on the end user applicationrequirements. However, it contains pointer to the corresponding row data recordthat are stored separately such that semantic search may retrieve row data also. Weestimate no more than 250 potential instability intervals within one series annuallywith average 1% of sensors detecting the instability at one measurement timeinstant, resulting in 250 � 0.01 � 4M = 10M instability intervals annually. If weassume semantic annotation of the intervals of 10 triplets per interval, it totals to100M triplets. This data size is proven to be practically successfully implementedon a off-the-shelf single server hardware with 64 GB of RAM. Note that thesystem is easily scalable by simple multiplication of the servers assuming fed-erated queries are implemented.
(3) Semantics Module (SM) is based on a platform for scalable linked data semanticdatasets management. The platform is envisioned to feature advanced Web basedcollaborative ontology editor and to be flexible with respect to the used triplestore.By default, we assume a triplestore that is based on Jena [59] as one of the mostproven Open Source semantic technologies on the market. Semantic data isrepresented in standard RDF/OWL formats [60] and manipulated by semanticqueries written in the standard SPARQL query language [61]. In this way, thetechnology would allow different reasoners to be adopted. The expected dataprocessing and storage efficiency is based on the effective use of semanticdescriptions of physical characteristics of sensors, their organization and place-ment, price, type of measurement units, etc. For the purpose a number of standardontologies may be loaded into the system and used, such as time ontology,measurements ontology, etc. For application specific purposes an online collab-orative ontology editor will be used to allow end-user to adjust existing ontologiesand develop new ones.When we have sensor data, attention on the ontologies for sensor data andmetadata should be put. The most corresponding is the Semantic Sensor Network(SSN) ontology. Systems that adopt the SSN ontology are built on an RDFdatabase - triple store. Big volume of sensor data collected are challenging totriple stores, because the evaluation of SPARQL queries becomes expensive.Triple stores are not optimized to evaluate time series interval queries. Emrooz isgood solution for such case. Emrooz is open source and scalable database capableof consuming SSN observations represented in RDF and evaluating SPARQLqueries for SSN observations [62]. Emrooz can be implemented on ApacheCassandra and Sesame [62, 63].
152 V. Nejkovic et al.

(4) End-User Web Application Module (WAM) is envisioned to be implemented asan advanced Ajax front-end that communicates with back-end using RESTfulservice API and SPARQL queries. It should consist of the following sub-modules:(a) NLP Sub-Module: user enters search query in simplified English, such that low
cognitive load for end user is required while in the same time certain domainlanguage specifics are exploited in order to lower complexity of the languageuse and processing. The input is then processed and converted to SPARQLquery for semantic search over the semantically annotated data. Data prepro-cessing algorithms can then be used to retrieve intervals of unstable states, withrecorded date and time of the start and end of the data sequence. Every timeseries is semantically annotated also: name of the physical property, type of themeasurement unit, name of the subsystem (and/or machine and/or location…),attached sensor, etc. Semantic descriptions of data are automatically generatedduring preprocessing and are later used for making autocomplete recommen-dations to the user, to help him easily search the time series descriptions. Then,key segments are identified related to the given search query, where each of thesegments can describe date, time, abnormality in measured physical unit (onsome sensor with some features), and all/some unstable data overlapping withan extracted instability interval [64]. In this way, we are able to make moreeffective and user friendly queries.
(b) Reporting & Analytics Sub-Module: Results of the data analysis are visuallypresented by means of visually appealing charts, graphs, tables, etc. Semanticfiltering is applied for powerful faceted search and browsing through thesearch results. Also, data analysts are able to reconfigure online data pre-sentation into simple web applications that could be instantly used by theother team members.Semantic similarity between the input query and annotations of the instabilityintervals is used as the indicator of coincidence between data sets and the searchquery. Multilingual support can be provided by existing features defined in thestandard RDF/XML language support. As a consequence of the NLP modulethat is based on representing concepts by the supporting ontologies, multilin-gualism is supported naturally. Though, some additional effort would berequired depending on the type and number of additional languages.Additional features: Different characterizations and taxonomies of the insta-bility intervals are possible including for example classification of theabnormal events as low, middle, high or critical. We can also specify theintensity of the abnormality as a percentage of the deviation of maximalmeasured value in the instability interval from the target value. For example,we may define abnormality as “deviation between 7% and 20%”. Estimationof conditional probability of overlapping of two or more instability intervalswill be based on simple analytics algorithms such as counting (“x of y” or“x/y”, 6 of 9 or 7/10, in searching results indicate overlapping of the insta-bility intervals). Advanced user-friendly simplified English based search forcausality chains for identification of the root cause is possible. Similarly, a setof intervals rooted by a specified interval can be determined as well.
Big Data in 5G Distributed Applications 153

(5) Reasoning and Predicting Module (RPM) is envisioned to be implemented as anadvanced neural network. Neural networks can be adopted for learning compo-nent of the RPM. Neural networks have been proven effective in interferencedetection and classification within wireless networks [65, 66] as well as in time-series prediction tasks [67] that are crucial for coordination.
4.3 5G Security Challenges
Security solutions for 5G can be divided into five groups: Software Defined Network(SDN), Network Function Virtualization (NFV), Mobile Cloud (MC), communicationchannels and privacy policies [68]. Primary focuses with target technologies describedin [68] are: security of centralized control points (SDN, NFV); flow rules verification inSDN switches (SDN); control access to SDN and core network elements (SDN, NFV,MC); isolation for VNFs and virtual slices (NFV); security of control channels (SDNand channels themselves); user identity verification for roaming and clouds services(privacy policies); security of users identity and location (privacy policies); encryptionand anti-malware technologies (privacy policies); security of data, storage systems andweb services in clouds (MC); service-based access control security for clouds (MC).
Each of this target and security technologies are deeply investigated in [68].Security of 5G will be a big challenge because it will connect branches of critical
infrastructures. However, to make 5G a safe technology, security solutions will con-sider not only this integrated critical infrastructure but also society as a whole, [68].The basic challenges mentioned in [68] and [69] are:
• High network traffic - a huge number of IoT devices.• Security of radio communications.• Cryptographic integrity of user data plane.• Roaming Security - updating security parameters between operators of networks.• Denial of Service and Distributed Denial of Service attacks on infrastructure and
end devices.• Coordination of distributed control systems (like Non-Access Stratum layers of
3GPP protocols).• Eavesdropping. This attack may lead to intercepting messages by an attacked
receiver and is very hard to detect.• Jamming. This attack may lead to disrupting a communication between legitimate
users or block access to radio resources. Very often is realized via an infectedreceiver.
• Man in The Middle attack. Attacker takes control over communication betweenlegitimate users.
• Basic requirements like authentication, authorization, availability or data confi-dentiality. Some of the current technologies fulfilling these requirements may be noteffective enough in 5G context.
154 V. Nejkovic et al.

4.4 5G Simulations
A very popular method of finding problems, predicting behavior and developingimprovements in system is analyzing the simulation of this system. In 5G cellularcommunication new simulation systems have to be developed because of a hugenumber of new services, applications requirements, and performance indicators, [70].There are three basic types of simulations: link-level, system-level, and network-level.Authors in [70] describe the following challenges connected to all of these three typesof simulation:
• Variety of application, technologies, environments and performance indicators.• Complexity of simulation and simulators. It is caused by growing memory demands
and time of simulation which is a result of huge MIMO and complexity of channels.• Integration of all these three types of simulations. Integration of link-level and
system-level simulation may be useful in the evaluation of nonlinear operations(like NOMA) in complex environments. Integration of system-level and network-level simulation is useful in the evaluation of the end to-end performance of allnetwork.
Other challenges, like reusability, scalability, flexibility, multiple levels of abstractionor parallel processing are deeply investigated in [70].
4.5 Radio-Access Research and Propagation Issues
One of the expectations for 5G is to ensure prospective radio-access technologieswhich will be integrated and will allow creating a long-term networked society [71].Seven main challenges in this field mentioned in [71] are multi-hop communication,device-to-device communication, cooperative devices, ultra-reliable communication,massive machine-type communication, inter-vehicular/vehicular-to-road communica-tion, and ultra-dense deployments.
The principals of propagation of centimeter waves are very similar to millimeterwaves but have different characteristic [72]. The most important differences in thosecharacteristics are free space path loss, diffraction, reflection and scattering, materialpenetration. These problems can be solved by deploying a Multi Input Single OutputSystem described in [72]. OFDM can be used as a base for developing a new system ofencoding digital data on multiple carrier frequencies [72]. OFDM will allow to avoidmultipath effect, gain spectral efficiency, and simplify equalization (in comparison withSingle-Carrier Systems) [72].
4.6 Millimeter Waves and 5G Standardization
Millimeter waves have a bigger spectrum in cellular frequency bands then centimeterswaves [71]. This provides new radio-design opportunities and challenges, like [71]:
• Very high capacity and data rates.• “Short wavelengths necessitating large array antenna solutions to maintain useful
link budgets”.• Antenna sizes will be smaller (design challenges).
Big Data in 5G Distributed Applications 155

Standardization of 5G is a still on-going process. However, some decisions have beenalready made. The World Radio Communication Conference promoted bands lowerthan 6 GHz or between 24–84 GHz in 2015 [71]. A Third Generation PartnershipProject (3GPP) completed first 5G specification in 2018. Below 6 GHz bandwidthrequirements regarding cellular network did not change because of similarity ofpropagation conditions in new and existing bands [71]. More technical informationabout higher bands and accepted by 3GPP standards can be found in [71] and [73].
4.7 5G Modulation Schemes
Extreme data rates, a huge number of IoT devices, high-speed high resolutionstreaming videos - this are only examples what 5G will be used for. The main challengeis to support very fast entry to the network, even for transferring trivial data, [74]. Toachieve this goal proper modulation scheme have to be chosen.
Orthogonal Frequency Division Multiplexing is a classic modulation scheme basedon dividing available bandwidth into several parallel sub-channels. Each of these sub-channels (called also sub-carriers) can transmit independent data. Multiplexing in timeand frequency is possible. However, authors in [74] proposed three modulationsschemes, with better Peak to Average Power Ratio and better spectrum efficiency.These modulations schemes are, [74]:
• Filter Bank Multi-carrier (FBMC) - each sub-carrier is filtered independently. Cycleprefix is not used. Offset-QAM is used for orthogonality.
• Generalized Frequency Division Multiplexing (GFDM) adaptable multiple carriertransmission methods. Each sub-carrier is filtered independently. There is noorthogonality. Available spectrum is spread into segments.
• Filtered Orthogonal Frequency Division Multiplexing (F-OFDM) - an extension ofclassic OFDM. Bandwidth is divided into sub-bands depending on the application.Each sub-band provide proper service. The spectrum is accommodating a range ofservices which optimize its usage.
Comparison of all these modulation schemes, results and conclusions can be foundin [63].
4.8 Machine Learning in Software Defined Networks
The 5G technology entails a significant increase in the amount of processed data. Thecontinuous collection and analysis of such data leads to a Big Data problems that arecaused by the volume, variety and velocity properties [75].
However, a key aspect of the operation of each network is its management andcontrol. Recently, most of a network functions (e.g. routing, switching, firewalling,conversion of protocols etc.) were realized by dedicated hardware. The complexity of anetwork infrastructure increases a number of challenges in organizing, managing andoptimizing network operations. The popular idea for solving these problems is Soft-ware Defined Networking (SDN) paradigm. SDN allows to migrate many of networkfunctions from the devices to the software-defined networking controllers. The SDNcontroller manages flow control, analyses network traffic and routes packets according
156 V. Nejkovic et al.

to forwarding policies. Consequently, SDN controller serves as a sort of operatingsystem for the network.
Taking into account aforementioned challenges and problem of processing largedata sets, there is a need for developing efficient and much more complex managementmethods. Such management methods require making decisions in the real time. Thereare a lot of known data processing methods. However, many of them cannot be directlyapplied for effective processing and management of large data sets in modern envi-ronments, such as 5G networks. Modern solutions require complex decision makingtechniques that analyze historical, temporal and frequency network data [76].
One of the possible solutions could be the application of Machine Learning(ML) methods, which are successfully used in the processing of Big Data [77–80]. Thecapabilities of SDN (e.g. centralized control, global view of the network, software-basednetwork analysis, and dynamic forwarding policies) may fit well to the application ofMachine Learning techniques [81]. These possibilities are included in the FCAPS(Fault, Configuration, Accounting, Performance, Security) management ISO standard[82]. In each of the following areas of application one can find intelligent methods [78]:
In the fault management area, ML methods allow not only detection, but also solvingthe causes of failures in networks. Automation dealing with failures will allow for min-imization of downtime and human intervention and, as a result, minimization of losses.
Machine Learning can play important role also in configuration management.Networks such as 5G are characterized by frequent topological changes. This requiresmodifications in the configuration, which can be prone to errors and difficult to opti-mize. Considering the multiplicity of configuration parameters, analyses of ML canhelp to automate this process, e.g. by dynamic resources allocation or services con-figuration. Appropriate methods can also allow verification of the used configurationand its possible withdrawal and rollback.
Accounting management is tightly connected with monitoring of network resourcesand pricing plans. ML methods can help identify fraud and dishonest activities ofnetwork users. It is also possible to analyze the use of resources and create new servicepackages. Smart solutions can also significantly improve the QoS level.
An important area of management is performance management. Guaranteeingadequate level of performance is a key factor for efficient network. The use of MLmethods can result in traffic load prediction, and, in result, proactive and adaptivenetwork performance management.
Security Management has become crucial issue in networks. Modern securityapproaches consist of tools for identifying threats and vulnerabilities. The use of MLmethods can help in detection of anomalies finding and abuses verification in thenetwork. However, this approach has a high risk of blocking the correct network traffic(high false positive rate). Identifying the nature of the cyber-attack is crucial tochoosing appropriate remedies allowed returning to the proper functioning of thenetwork.
The aforementioned opportunities show a wide field for applying ML methods inSoftware Defined Networking paradigm. Machine Learning can play the major role inautonomous network management for 5G networks. Some of the available solutions,such as IBM’s MAPE-K or CogNet, are successfully supported by Machine Learningmethods [76, 78].
Big Data in 5G Distributed Applications 157

5 Conclusion
Use case opportunities will increase enormously with 5G networks deployment. Notonly that the existing applications and solutions will be enhanced, but many novel usecases and scenarios will become feasible. The potential for further 5G use cases infuture services and applications is huge in industries and national priorities includingdomains from entertainment and telecommunication services, to healthcare, smartcities, remote industrial machine operation, virtual sports attendance and many others.
However, the future scenarios will place much more diverse requirements on thesystem that need to be explored and analyzed. It is identified that the main enablers offuture 5G networks are Internet of Things (IoT), Big Data technologies, together withnovel networking paradigms – Software-Defined Networking (SDN) and NetworkFunctions Virtualization (NFV). New architectures will rely on large number of con-nected smart devices generating enormous amount of data each moment. The generateddata needs to be analyzed in order to make the right decision as soon as possible,almost in real time. On the other side, the increased flexibility of network infrastructuremanagement and fine-grained control is also required, which is enabled by NFV andSDN. Furthermore, there is a need for evolution of the current architectures by addingthe additional network intelligence layer that would enable more complex scenarios,such as device coordination. The possible approaches for embedding the networkintelligence are either using the semantic technology or machine learning techniques.
The future may seem far ahead but the phase for defining the requirements is now.Any new technology or system that we design for 5G needs to be deployed andevaluated, and it is expected to last at least until the end of the next decade.
References
1. Buzzi, S., et al.: A survey of energy-efficient techniques for 5G networks and challengesahead. IEEE J. Sel. Areas Commun. 34(4), 697–709 (2016)
2. The 1000x data challenge, Qualcomm, Technical report. http://www.qualcomm.com/1000x.Accessed 29 Jan 2019
3. Yang, L., Zhang, W.: Introduction. In: Yang, L., Zhang, W. (eds.) Interference Coordinationfor 5G Cellular Networks. SpringerBriefs in Electrical and Computer Engineering, pp. 1–11.Springer, Cham (2015). https://doi.org/10.1007/978-3-319-24723-6_1
4. Salem, F.E., et al.: A energy consumption optimization in 5G networks using multilevelbeamforming and large scale antenna systems. In: Proceedings of 2016 IEEE WirelessCommunications and Networking Conference, pp. 1–6 (2016). https://doi.org/10.1109/wcnc.2016.7564904
5. López, B., et al.: An approach to data analysis in 5G networks. Entropy 19(74), 1–23 (2017).https://doi.org/10.3390/e19020074
6. Ejaz, W., et al.: Internet of Things (IoT) in 5G wireless communications. IEEE Access 4,10310–10314 (2016). https://doi.org/10.1109/ACCESS.2016.2646120
7. Pérez, M., et al.: Self-organizing capabilities in 5G networks: NFV & SDN coordination in acomplex use case. In: Proceedings of EuCNC 2018, pp. 1–5 (2018)
8. Khan, M., et al.: Location awareness in 5G networks using RSS measurements for publicsafety applications. IEEE Access 5, 21753–21762 (2017)
158 V. Nejkovic et al.

9. Mohammed, A.F., Humbe, V.T., Chowhan, S.S.: A review of big data environment and itsrelated technologies. In: Proceedings of 2016 International Conference on InformationCommunication and Embedded Systems (ICICES), pp. 1–5 (2016)
10. Hu, F.: Opportunities in 5G Networks: A Research and Development Perspective. CRCPress, Boca Raton (2016)
11. 3GPP, TS 38.455 (V15.1.0): NG-RAN; NR Positioning Protocol A (NRPPa) (2018)12. 3GPP, TR 38.913 (v14.3.0): Study on scenarios and requirements for next generation access
technologies (2017)13. 3GPP, TR 22.872 (v16.1.0): Study on positioning use cases; Stage 1 (2018)14. 3GPP, TR 38.305 (v15.1.0): Stage 2 functional specification of User Equipment (UE)
positioning in NG-RAN (2018)15. Soret, B., et al.: Interference coordination for 5G new radio. IEEE Wirel. Commun. 25(3),
131–137 (2018)16. Milosevic, N., Dimitrijevic, B., Drajic, D., Nikolic, Z., Tosic, M.: LTE and WiFi co-
existence in 5 GHz unlicensed band. Facta Universitatis, Electron. Energ. 30(3), 363–373(2017)
17. Tosic, M., et al.: Semantic coordination protocol for LTE and Wi-Fi coexistence. In:Proceedings of European Conference on Networks and Communications, EUCNC 2016,Athens, Greece, pp. 27–30 (2016)
18. Rizvi, S., et al.: An investigation of energy efficiency in 5G wireless networks. In:Proceedings of 2017 International Conference on Circuits, System and Simulation (ICCSS),pp. 142–145 (2017)
19. Abdalla, S., Ariffin, S.: The enhanced user history-based prediction in 5G. In: Proceedings ofthe Fourth International Conference on Advances in Computing, Communication andInformation Technology - CCIT, pp. 1–5 (2016)
20. What is GNSS? https://www.gsa.europa.eu/european-gnss/what-gnss. Accessed 29 Jan 201921. Kacianka, S., Hellwagner, H.: Adaptive video streaming for UAV networks. In: Proceedings
of the 7th ACM International Workshop on Mobile Video - MoVid 2015, pp. 25–30 (2015)22. Petrangeli, S., et al.: Live streaming of 4K ultra-high definition video over the Internet. In:
Proceedings of the 7th International Conference on Multimedia Systems Article No. 27,pp. 1–4 (2016). https://doi.org/10.1145/2910017.2910627
23. Nallappan, K., et al.: Live streaming of uncompressed 4K video using Terahertz wirelesslinks. In: Proceedings of 2018 IEEE International Conference on Communications (ICC),pp. 1–7 (2018). https://doi.org/10.1109/icc.2018.8422216
24. Meroni, G., Di Ciccio, C., Mendling, J.: Artifact-driven process monitoring: dynamicallybinding real-world objects to running processes. In: Proceedings of the Forum and DoctoralConsortium Papers Presented at the 29th International Conference on Advanced InformationSystems Engineering, CAiSE 2017, Essen, Germany, pp. 1–9 (2017)
25. Meroni, G., Plebani, P.: Combining artifact-driven monitoring with blockchain: analysis andsolutions. In: Matulevičius, R., Dijkman, R. (eds.) CAiSE 2018. LNBIP, vol. 316, pp. 103–114. Springer, Cham (2018). https://doi.org/10.1007/978-3-319-92898-2_8
26. Baresi, L., et al.: mArtifact: an artifact-driven process monitoring platform. In: Proceedingsof BPM Demo Track Co-Located with 15th International Conference on Business ProcessModeling, BPM 2017, Barcelona, Spain, pp. 1–5 (2017)
27. Weber, I., Xu, X., Riveret, R., Governatori, G., Ponomarev, A., Mendling, J.: Untrustedbusiness process monitoring and execution using blockchain. In: La Rosa, M., Loos, P.,Pastor, O. (eds.) BPM 2016. LNCS, vol. 9850, pp. 329–347. Springer, Cham (2016). https://doi.org/10.1007/978-3-319-45348-4_19
28. Wolf, B., et al.: DNAseq workflow in a diagnostic context, and an example of a user friendlyimplementation. J. Biomed. Biotechnol. 2015(3), 1–11 (2015)
Big Data in 5G Distributed Applications 159

29. Wolf, B., et al.: Safe variant annotation sharing across laboratories. In: Variant Detection2017, Spain (2017)
30. Böck, J., et al.: Single CpG hypermethylation, allele methylation errors, and decreasedexpression of multiple tumor suppressor genes in normal body cells of mutation-negativeearly-onset and high-risk breast cancer patients. Int. J. Cancer 143, 1416–1425 (2018)
31. POP-Java: Parallel Programming with Java. https://icosys.ch/pop-java. Accessed 29 Jan2019
32. Wolf, B., Kuonen, P., Dandekar, T.: POP-Java: Parallélisme et distribution orienté objet. In:Proceedings of the Conférence d’informatique en Parallélisme, Architecture et Système,Compas2014, Neuchâtel, Switzerland, pp. 1–13 (2014)
33. Wolf, B., Loïc, M., Kuonen, P.: FriendComputing: organic application centric distributedcomputing. In: Proceedings of the Second International Workshop on Sustainable UltrascaleComputing Systems, NESUS 2015, Krakow, Poland, pp. 117–119 (2015)
34. Kuonen, P., Clement, V., Bapst, F.: Securing the grid using virtualization: the ViSaG model.In: Proceedings of the Fifth International Conference on Cloud Computing, GRIDs, andVirtualization, Cloud Computing 2014, Venice, Italy, pp. 49–54 (2014)
35. Enabling Mobile Augmented and Virtual Reality with 5G Networks. AT&T (2018). https://about.att.com/content/dam/snrdocs/Foundry%20ARVR%20Public%20Whitepaper.pdf.Accessed 29 Jan 2019
36. VR and AR pushing connectivity limits. Qualcomm Technologies, Inc. (2018). https://www.qualcomm.com/media/documents/files/vr-and-ar-pushing-connectivity-limits.pdf. Accessed29 Jan 2019
37. Augmented and Virtual Reality: the First Wave of 5G Killer Apps. Qualcomm Technologies,Inc. (2017). https://www.qualcomm.com/media/documents/files/augmented-and-virtual-reality-the-first-wave-of-5g-killer-apps.pdf. Accessed 29 Jan 2019
38. Koivisto, M., et al.: Joint device positioning and clock synchronization in 5G ultra-densenetworks. IEEE Trans. Wirel. Commun. 16(5), 2866–2881 (2017)
39. Koivisto, M., Hakkarainen, A., Costa, M., Kela, P., Leppänen, K., Valkama, M.: High-efficiency device positioning and location-aware communications in dense 5G networks.IEEE Commun. Mag. 55(8), 188–195 (2017)
40. Talvitie, J., Valkama, M., Destino, G., Wymeersch, H.: Novel algorithms for high-accuracyjoint position and orientation estimation in 5G mmWave systems. In: Proceedings of IEEEGlobecom Workshops, pp. 1–7 (2017)
41. Talvitie, J., Levanen, T., Koivisto, M., Pajukoski K., Renfors, M., Valkama, M.: Positioningof high-speed trains using 5G new radio synchronization signals. In: Proceedings of IEEEWireless Communications and Networking Conference, WCNC 2018, pp. 1–6 (2018)
42. Rastorgueva-Foi, E., Costa, M., Koivisto, M., Talvitie, J., Leppänen, K., Valkama M.:Beam-based device positioning in mmWave 5G systems under orientation uncertainties. In:Proceedings of Asilomar Conference on Signals, Systems, and Computers (2018)
43. Witrisal, et al.: High-accuracy positioning for indoor applications: RFID, UWB, 5G, andbeyond. In: Proceedings of 2016 IEEE International Conference on RFID, pp. 1–7 (2016)
44. Nam, S.Y., Joshi, G.P.: Unmanned aerial vehicle localization using distributed sensors. Int.J. Distrib. Sens. Netw. 13(9), 1–8 (2017)
45. Zhang, P., Lu, J., Wang, Y., Wang, Q.: Cooperative localization in 5G networks: a survey.ICT Express 3(1), 27–32 (2017)
46. Dammann, A., Raulefs, R., Zhang, S.: On prospects of positioning in 5G. In: Proceedings of2015 IEEE International Conference on Communication Workshop (ICCW), pp. 1–7 (2015)
47. Tosic, M., Nikolic, Z., Nejkovic, Dimitrijevic, B., Milosevic, N.: Spectrum sensingcoordination for FIRE LTE testbeds, Invited Paper. In: Proceedings of 2nd InternationalConference on Electrical, Electronic and Computing Engineering, IcETRAN 2015 (2015)
160 V. Nejkovic et al.
48. Boury-Brisset, A.C.: Managing semantic big data for intelligence. Proc. STIDS 2013, 41–47(2013)
49. Nikolic, Z., Tosic, M., Milosevic, N., Nejkovic, V., Jelenkovic, F.: Spectrum coordinationfor intelligent wireless Internet of Things networks. In: Proceedings of 2017 25thTelecommunication Forum (TELFOR), Belgrade, Serbia, pp. 1–7 (2017). https://doi.org/10.1109/telfor.2017.8249326
50. Nejkovic, V., Petrovic, N., Milosevic, N., Tosic, M.: The SCOR ontologies framework forrobotics testbed. In: 2018 26th Telecommunication Forum (TELFOR), Belgrade, Serbia,pp. 1–4 (2018). https://doi.org/10.1109/telfor.2018.8611841
51. Petrovic, N., Nejkovic, V., Milosevic, N., Tosic, M.: A semantic framework for design-timeRIoT device mission coordination. In: Proceedings of 2018 26th Telecommunication Forum(TELFOR), Belgrade, Serbia, pp. 1–4 (2018). https://doi.org/10.1109/telfor.2018.8611845
52. Jelenkovic, F., Tosic, M., Nejkovic, V.: Semantic driven code generation for networkingtestbed experimentation. Enterp. Inf. Syst. 1–17 (2018). https://doi.org/10.1080/17517575.2018.1509135
53. Redis. http://redis.io/topics/faq. Accessed 29 Jan 201954. Cois, C.A., Palko, T.: High-volume data collection and real time analytics using Redis. In:
Proceedings of STRATA 2013. O’Reilly (2013)55. Nakamura, S.: LINE Storage: Storing billions of rows in Sharded-Redis and HBase per
Month. http://tech.naver.jp/blog/?p=142056. Apache Hadoop. http://hadoop.apache.org/. Accessed 29 Jan 201957. Apache HBase. http://hbase.apache.org/. Accessed 29 Jan 201958. Yao, Y., et al.: Online anomaly detection for sensor systems: a simple and efficient approach.
Perform. Eval. 67(11), 1059–1075 (2010)59. Apache Jena. http://jena.apache.org/. Accessed 29 Jan 201960. OWL Web Ontology Language Overview. http://www.w3.org/TR/owl-features/. Accessed
29 Jan 201961. Prud’Hommeaux, E., Seaborne, A.: SPARQL query language for RDF. W3C recommen-
dation, 15 (2008)62. Stocker, M., Shurpali, N., Taylor, K., Burba, G., Rönkkö, M., Kolehmainen M.: Emrooz: a
scalable database for SSN observations. In: Proceedings of First Joint InternationalWorkshop on Semantic Sensor Networks and Terra Cognita, SSN-TC/OrdRing@ISWC,pp. 1–12 (2015)
63. Broekstra, J., Kampman, A., van Harmelen, F.: Sesame: a generic architecture for storingand querying RDF and RDF schema. In: Horrocks, I., Hendler, J. (eds.) ISWC 2002. LNCS,vol. 2342, pp. 54–68. Springer, Heidelberg (2002). https://doi.org/10.1007/3-540-48005-6_7
64. Todorovic, B., Rancic, S., Markovic, I., Mulalic, E., Ilic, V.: Named entity recognition andclassification using context hidden Markov model. In: 2008, 9th Symposium on IEEEProceedings of Neural Network Applications in Electrical Engineering (NEUREL), pp. 1–4(2008)
65. Hermans, F., et al.: A lightweight approach to online detection and classification ofinterference in 802.15. 4-based sensor networks. ACM SIGBED Rev. 9(3), 11–20 (2012)
66. Iyer, V., Hermans, F., Voigt, T.: Detecting and avoiding multiple sources of interference inthe 2.4 GHz spectrum. In: Abdelzaher, T., Pereira, N., Tovar, E. (eds.) EWSN 2015. LNCS,vol. 8965, pp. 35–51. Springer, Cham (2015). https://doi.org/10.1007/978-3-319-15582-1_3
67. Schmidhuber, J.: Deep learning in neural networks: an overview. Neural Netw. 61, 85–117(2015)
68. Ahmad, I., et al.: 5G security: analysis of threats and solutions. In: Proceedings of 2017IEEE Conference 4 on Standards for Communications and Networking (CSCN), pp. 193–199 (2017)
Big Data in 5G Distributed Applications 161

69. Fang, D., Qian, Y., Hu, R.Q.: Security for 5G mobile wireless networks. IEEE Access 6,4850–4874 (2018)
70. Cho, S., et al.: System level simulation for 5G cellular communication systems. In:Proceedings of 2017 Ninth International Conference on Ubiquitous and Future Networks(ICUFN), pp. 296–299 (2017)
71. Mattisson, S.: Overview of 5G requirements and future wireless networks. In: Proceedings ofESSCIRC 2017 - 43rd IEEE European Solid State Circuits Conference, pp. 1–6 (2017)
72. Nichita, M.V., et al.: 5G propagation: current solutions and future proposals. In: Proceedingsof 2016 12th IEEE International Symposium on Electronics and Telecommunications(ISETC), pp. 47–50 (2016)
73. Third Generation Partnership Project. http://www.3gpp.org/. Accessed 29 Jan 201974. Nagul, S.: A review on 5G modulation schemes and their comparisons for future wireless
communications. In: Proceedings of 2018 Conference on Signal Processing and Commu-nication Engineering Systems (SPACES), pp. 72–76 (2018)
75. Suthaharan, S.: Big data classification: problems and challenges in network intrusionprediction with machine learning. SIGMETRICS Perform. Eval. Rev. 41, 70–73 (2014)
76. Casetti, C., et al.: Cognitive Network Management for 5G (white paper). In: 5GPPPWorking Group on Network Management and QoS (2017). https://bscw.5g-ppp.eu/pub/bscw.cgi/d154625/NetworkManagement_WhitePaper_1.pdf. Accessed 29 Jan 2019
77. Al-Jarrah, O.Y., et al.: Efficient machine learning for big data: a review. Big Data Res. 2, 87–93 (2015)
78. Ayoubi, S., et al.: Machine learning for cognitive network management. IEEE Commun.Mag. 56(1), 158–165 (2018)
79. Imran, A., Zoha, A., Abu-Dayya, A.: Challenges in 5G: how to empower SON with big datafor enabling 5G. IEEE Netw. 28(6), 27–33 (2014)
80. Jakóbik, A.: Big data security. In: Pop, F., Kołodziej, J., Di Martino, B. (eds.) ResourceManagement for Big Data Platforms. CCN, pp. 241–261. Springer, Cham (2016). https://doi.org/10.1007/978-3-319-44881-7_12
81. Xie, J., et al.: A survey of machine learning techniques applied to software definednetworking (SDN): research issues and challenges. IEEE Commun. Surv. Tutor. 1, 1–39(2018)
82. Abdallah, S., et al.: A network management framework for SDN. In: Proceedings of 20189th IFIP International Conference on New Technologies, Mobility and Security (NTMS),pp. 1–4 (2018)
Open Access This chapter is licensed under the terms of the Creative Commons Attribution 4.0International License (http://creativecommons.org/licenses/by/4.0/), which permits use, sharing,adaptation, distribution and reproduction in any medium or format, as long as you give appro-priate credit to the original author(s) and the source, provide a link to the Creative Commonslicense and indicate if changes were made.The images or other third party material in this chapter are included in the chapter’s Creative
Commons license, unless indicated otherwise in a credit line to the material. If material is notincluded in the chapter’s Creative Commons license and your intended use is not permitted bystatutory regulation or exceeds the permitted use, you will need to obtain permission directlyfrom the copyright holder.
162 V. Nejkovic et al.

Big Data Processing, Analysisand Applications in Mobile
Cellular Networks
Sanja Brdar1(B), Olivera Novovic1, Nastasija Grujic1,Horacio Gonzalez–Velez2, Ciprian-Octavian Truica3, Siegfried Benkner4,
Enes Bajrovic4, and Apostolos Papadopoulos5
1 BioSense Institute, University of Novi Sad, Novi Sad, Serbia{sanja.brdar,novovic,n.grujic}@biosense.rs
2 Cloud Competency Centre, National College of Ireland, Dublin 1, [email protected]
3 Computer Science and Engineering Department,Faculty of Automatic Control and Computers, University Politehnica of Bucharest,
Bucharest, [email protected]
4 Faculty of Computer Science, University of Vienna, Vienna, Austria{siegfried.benkner,enes.bajrovic}@univie.ac.at
5 Department of Informatics, Aristotle University of Thessaloniki,Thessaloniki, Greece
Abstract. When coupled with spatio-temporal context, location-baseddata collected in mobile cellular networks provide insights into patternsof human activity, interactions, and mobility. Whilst uncovered patternshave immense potential for improving services of telecom providers aswell as for external applications related to social wellbeing, its inherentmassive volume make such ‘Big Data’ sets complex to process. A sig-nificant number of studies involving such mobile phone data have beenpresented, but there still remain numerous open challenges to reach tech-nology readiness. They include efficient access in privacy-preserving man-ner, high performance computing environments, scalable data analytics,innovative data fusion with other sources–all finally linked into the appli-cations ready for operational mode. In this chapter, we provide a broadoverview of the entire workflow from raw data access to the final appli-cations and point out the critical challenges in each step that need tobe addressed to unlock the value of data generated by mobile cellularnetworks.
Keywords: Data analysis · HPC · Big Data · Cellular networks
This article is based upon work from COST Action IC1406 High-Performance Mod-elling and Simulation for Big Data Applications (cHiPSet), supported by COST (Euro-pean Cooperation in Science and Technology).
c© The Author(s) 2019J. Ko�lodziej and H. Gonzalez-Velez (Eds.): cHiPSet, LNCS 11400, pp. 163–185, 2019.https://doi.org/10.1007/978-3-030-16272-6_6

164 S. Brdar et al.
1 Mobile Cellular Networks - From Data to Applications
There is a tremendous growth of new applications that are based on the analysisof data generated within mobile cellular networks. Mobile phone service providerscollect large amounts of data with potential value for improving their servicesas well as to enable social good applications [7]. As an example, every time auser makes via mobile phone interaction (SMS, call, internet), a call detail record(CDR) is created and stored by a mobile network operator. CDRs not only logthe user activity for billing purposes and network management, but also pro-vide opportunities for different applications such as urban sensing [5], transportplanning [3,28], disaster management [38,46,64] socio-economic analysis [45,57]and monitoring epidemics of infectious diseases [10,11,36,62].
Several studies have reviewed applications to analyse CDRs, however mostfocus on specific aspects such as data analytics for internal use in telecom com-panies [26], graph analytics and applications [7], or public health [44]. This sur-vey aims to cover the entire workflow from raw data to final application, withemphasis on the gaps to advance technology readiness. Figure 1 depicts our mainconcept which shall be used to summarise the state of the art work and identifyopen challenges.
Fig. 1. Mobile cellular networks - from location data to applications.
The rest of this paper is structured as follows. Section 2 provides somebackground on mobile cellular networks and the nature of the data sets avail-able. It also sets the basis for different approaches to anonymization. Section 3presents a discussion of data-intensive approaches and architectures to dealwith the computationally-demanding nature of detecting patterns from telecomdata. Then, Sect. 4 discusses approaches to analyze mobile operators data setsvia graph analysis and machine learning. Section 5 enumerates some relevantexternal data sources that can complement mobile phone data, while Sect. 6

Mobile Cellular Networks 165
elaborates on diverse pertinent applications. Finally, Sect. 7 furnishes the sum-mary and objectives for future research efforts.
2 Data Anonymization and Access
With the pervasive adoption of smartphones in modern societies, in addition toCDRs, there is now a growing interest in xDRs, Extended Data Records. Theyenclose information on visited web sites, used applications, executed transac-tions, etc. Coupled with cell-tower triangulation, applications can infer fine-grain phone locations [29], thus making data volumes even larger. Telecom datatypically include spatial and temporal parameters to map device activity, con-nectivity, and mobility.
Telecom operators follow rigorous procedures for data anonymization to pre-serve privacy such that anonymized records cannot be linked to subscribers underany normal circumstances. Furthermore, before releasing any data to third par-ties, data sets are usually aggregated on temporal and/or spatial scales. Forexample, the numbers of calls as well as the duration of calls between any pairof antennas are aggregated hourly and movement trajectories are provided withreduced spatial resolution [1]. Differential privacy paradigm adds noise to orig-inal data up to the level not affecting the statistics significantly to preserveusers’ privacy. Another approach, suggested by the Open Algorithms (OPAL)initiative, proposes moving the algorithm to the data [35]. In their model, rawdata are never exposed to outside parties, only vetted algorithms run on telecomcompanies’ servers.
An example of preserving privacy of users by releasing only pre-aggregateddata is Telecom Italia Big Data Challenge [4]. Opened data sets accumulatedactivity and connectivity across defined spatial cells of the city of Milan andin the Province of Trentino in 10 min resolution. Despite aggregation, data setsare still rich source of information, especially when fused with other data suchas weather, news, social networks and electricity data from the city. To getsome useful insight about the data we further describe and visualize activityand connectivity maps from Telecom Italia data sets and mobility from TelekomSrbija data set.
2.1 Activity
The activity data set consists of records with square id, time interval, sms-inactivity, sms-out activity, call-in activity, call-out activity, internet traffic activityand country code, for each square of grid network. The data is aggregated inten minutes time slots. We did further aggregation on daily level to gain overallinsight into daily base activity. Figure 2 illustrates an aggregated activity ofmobile phone users in the city of Milan. We observe that areas with highestactivity refer to urban core of the city, whereas areas with lower activity levelsrefer to peripheral parts of the city. The same analysis is performed for theProvince of Trentino and corresponding results are presented in Fig. 3. Although

166 S. Brdar et al.
the inspected area of the Trentino Province exceeds significantly the urban areaof the city of Trentno, the same pattern in distribution of mobile phone activityis present - high activity in urban area along lower activity in rural areas. Fromthe visual inspection of Fig. 3 we observe that higher activity areas spatially referto transit areas with main roads, which was expected.
Fig. 2. Aggregated activity over spatial area of the city of Milan.
2.2 Connectivity
Connectivity data provides directional interaction strength among the squares(cells) of the grid network. Records consist of timestamp, square id1, square id2and strength which represents the value (weight) of aggregated telecom trafficmultiplied with a constant k to hide exact number of calls and sms recorded bysingle base station [4]. As in [43] we performed additional spatial aggregation,and analyzed connectivity patterns between different city zones of Milan throughthe lens of graph theory. For illustration purposes we created a single undirected,weighted graph for a typical working day from the data set. In Fig. 4 we presentthe obtained spatial graph of connectivity links. During the work week, the citycenter acts as a hub, the strongest links are gathered close to the city center,while on weekends and holidays the opposite pattern occurs [43].
The second type of connectivity data presents connectivity from the city ofMilan to other Provinces in Italy. Additional aggregation is applied to extract

Mobile Cellular Networks 167
Fig. 3. Aggregated activity over spatial area of Trentino Province
Fig. 4. Connectivity across the city of Milan

168 S. Brdar et al.
Fig. 5. Connectivity from the city of Milan to Provinces
daily base connectivity patterns. Figure 5 presents connectivity links from dif-ferent areas of the city of Milan to Provinces in Italy. We may conclude thatthe distribution of connectivity links is regular to all Provinces, and that themajority of links start from central areas of the city of Milan.
2.3 Mobility
Mobile phone data can reveal the approximate location of a user and its mobilitytrace based on geographical location of the Radio Base Stations which registered

Mobile Cellular Networks 169
Fig. 6. Mobility across the city of Novi Sad, Serbia
the traffic. In [16] the authors proposed a novel computational framework thatenables efficient and extensible discovery of mobility intelligence from large-scale spatial-temporal data such as CDR, GPS and Location Based Servicesdata. In [25] the authors focus on usage of Call Detail Records (CDR) in thecontext of mobility, transport and transport infrastructure analysis. They ana-lyzed CDR data associated with Radio Base Stations together with Open StreetMap road network to estimate users mobility. CDR data can provide general-ized view of users mobility, since data is collected only when the telecom traffichappens. To illustrate mobility data set we created Fig. 6 that presents a mapwith mobility traces across the city of Novi Sad on 3rd July 2017, for the timeinterval between 6am and 12pm extracted from raw CDR data through aggre-gation of visited locations’ sequences of anonymous users. Data originate fromSerbian national operator, Telekom Srbija, released under non-disclosure agree-ment. From mobility traces we can detect few locations in the city that acts astrajectory hubs.
3 Big Data Processing
The typical workflow applied for processing spatio-temporal data, such as mobilephone data used in this case study, contains numerous queries across loca-tions and timestamps of interest, spatial/time aggregations and summarization.

170 S. Brdar et al.
Existing solutions are rarely focusing on the execution time, scalability, andthroughput that are of high importance for the implementation and near real-time settings. In this section, we present briefly some important concepts andarchitectural issues related to processing Big Data.
3.1 Big Data Architectures
Over the last decade we have witnessed a tremendous progress and innovation inlarge-scale data processing systems and the associated data-driven computation.Among many others, these include MapReduce-based computational systems,data streaming technologies, and NoSQL database systems. A major challengeis to build systems that on the one hand could handle large volumes of batchdata and on the other hand offer the required scalability, performance and lowlatency required for integration and real-time processing of massive, continuousdata streams. In the following paragraphs, we discuss some of the architecturalprinciples underlying Big Data systems that address this challenge, in particularthe Lambda and the Kappa architectural alternatives.
Lambda Architecture. Big Data systems often face the challenge of how tointegrate processing of “new” data that is being constantly ingested into a systemwith historical (batch) data. Newly arriving (real-time) data is usually processedusing stream-based processing techniques, while historical data is periodicallyreprocessed using batch processing. The Lambda architecture [40] is a blueprintfor a Big Data system that unifies stream processing of real-time data and batchprocessing of historical data.
The Lambda architecture pursues a generalized approach to developing BigData systems with the goal of overcoming the complexities and limitations whentrying to scale traditional data systems based on incrementally updated rela-tional databases. In an incremental database system, the state of the database(i.e. its contents) is incrementally updated, usually when new data is processed.In contrast to incremental database systems, the Lambda architecture advocatesa functional approach relying on immutable data, i.e., new data is added on topof the immutable historical data (batch data) already present in the system.
As opposed to traditional distributed database systems, e.g., where distri-bution of tables across multiple machines has to be explicitly dealt with by thedeveloper, a key underlying principle of the Lambda architecture is to make thesystem aware of its distributed nature so that it can automatically manage distri-bution, replication and related issues. Another key aspect of the Lambda archi-tecture is its reliance on immutable data as opposed to incrementally updateddata in relational database systems. Reliance on immutable data is essential forachieving resilience with respect to human errors.
The Lambda architecture promises to tackle many important requirements ofBig Data systems, including scalability, robustness and fault tolerance (includingfault-tolerance with respect to human errors), support for low-latency reads andupdates, extensibility, easier debugging and maintainability. At a high-level of

Mobile Cellular Networks 171
abstraction, the Lambda architecture is comprised of three layers, the batchlayer, the serving layer, and the speed layer.
The batch layer stores the raw data (also often referred to as batch data,historical data, or master data set), which is immutable. Whenever new dataarrives, it is appended to the existing data in the batch layer. The batch layeris responsible for computing batch views taking into account all available data.The batch layer periodically recomputes the batch views from scratch so thatalso the new data that has been added to the system since the computation ofthe last batch views is processed.
The serving layer sits on top of the batch layer and provides read access tothe batch views that have been computed by the batch layer. The serving layerusually constitutes a distributed database, which is populated with the com-puted batch views, and ensures that the batch views can be randomly accessed.The serving layer is constantly updated with new batch views once these becomeavailable. Since the serving layer only needs to support batch updates and ran-dom reads, but no random writes (updates), it is usually significantly less com-plex than a database that needs to support random reads and writes. While theserving layer enables fast read-only access to the pre-computed batch views, itmust be clear that these views may not be completely up-to-date, since datathat has been acquired since the latest batch views have been computed havenot been considered.
The speed layer is provided on top of the serving layer in order to supportreal-time views on the data. The speed layer mitigates the high latency of thebatch layer by processing the data on-the-fly, as it arrives in the system, usingfast, incremental algorithms to compute real-time views of the data. As opposedto the batch layer, which periodically recomputes the batch views based on allhistorical data form scratch, the speed layer does not compute real-time viewsfrom scratch. To minimize latency, it only performs incremental updates of thereal-time views taking into account just the newly arrived data. The real-timeviews provided by the speed layer are of temporary nature. Once the new datahas arrived at the batch layer and has been included in the latest batch views,the corresponding real-time views can be discarded.
Figure 7 depicts the main architectural aspects of the Lambda architecture.Data streamed in from data sources (sensors, Web clients, etc.) is being fedin parallel both into the batch layer and the speed layer, which compute thecorresponding batch views and real-time views, respectively.
The lambda architecture can be seen as a trade-off between two conflictinggoals: speed and accuracy. While computation of real-time views is being donewith very short latencies, computation of batch views is typically a very high-latency process. On the other hand, since the speed layer does not take intoaccount all of the available data, real-time views are usually only approximations,while batch views provide accurate answers considering all data available in themaster data store at a certain point in time. In order to get a view of all theavailable data (batch data and new data) queries have to be resolved such that

172 S. Brdar et al.
Fig. 7. The Lambda architecture.
they combine the corresponding batch-views and real-time views, which caneither be done in the serving layer or by the client applications.
The Lambda architecture has been widely recognized as a viable approach tounifying batch and stream processing, by advocating real-time stream processingand batch re-processing on immutable data. There are, however, some potentialdrawbacks associated with the Lambda architecture. Although a major objectiveof the lambda architecture is to reduce the complexity as compared to traditionaldistributed database systems, this goal often cannot be fully realized. While thebatch layer usually hides complexity from the developers, typically by relying onsome high-level MapReduce framework (e.g., Hadoop), the speed layer may stillexhibit significant complexities to the developers of Big Data solutions. In addi-tion, having to develop and maintain two separate data processing components,the stream layer and the batch layer, adds to the overall complexity. Anotherpotential issue with the Lambda architecture is that constantly recomputingthe batch views from scratch might become prohibitively expensive in terms ofresource usage and latency.
Kappa Architecture. A limitation of the Lambda architecture is that twodifferent data processing systems, i.e., the stream layer and the batch layer, haveto be maintained. These layers need to perform the same analytics, howeverrealized with different technologies and tools. As a consequence, the systembecomes more complex and debugging and maintenance become more difficult.This drawback is being addressed by the Kappa architecture [31].
The Kappa architecture constitutes a simplification of the Lambda archi-tecture by uniformly treating real-time data and batch data as streams. Con-sequently, batch processing as done in the lambda architecture, is replaced by

Mobile Cellular Networks 173
Fig. 8. The Kappa architecture
stream processing. The Kappa architecture assumes that (historical) batch datacan also be viewed as a (bounded) stream, which is often the case. What isrequired, however, is that the stream processing component also supports effi-cient replay of historical data as a stream. Only if this is the case, batch viewscan be recomputed by the same stream analytics engine that is also responsiblefor processing real-time views. Besides the ability to replay historical data, theorder of all data events must be strictly preserved in the system in order toensure deterministic results.
Instead of a batch layer and a speed layer, the Kappa architecture relies ona single stream layer capable of handling the data volumes for computing bothreal-time views and batch views. Overall system complexity decreases with theKappa architecture as illustrated in Fig. 8. However, it should be noted that theKappa architecture is not a replacement of the Lambda architecture, since itwill not be suitable for all use cases.
3.2 Big Data Frameworks
There is a plethora of Big Data frameworks and tools that have been devel-oped in the past decade. As a result, both the Lambda architecture and Kappaarchitecture can be implemented using a variety of different technologies for thedifferent system components. In the following, we briefly discuss a few frame-works that are most typically used to implement Big Data systems based on theLambda or Kappa architecture.
Hadoop. The Apache Hadoop ecosystem is a collection of tools for developingscalable Big Data processing systems [63]. The Hadoop File System (HDFS)is a distributed file system for storing large volumes of data on distributedmemory machines (clusters) transparently handling the details of data distri-bution, replication and fail-over. The Hadoop MapReduce engine utilizes HDFSto support transparent parallelism of large-scale batch processing that can be

174 S. Brdar et al.
formulated according to the MapReduce programming model. Hadoop is oftenused to implement the batch layer in data processing systems that implementthe Lambda Architecture.
Spark. Apache Spark introduces Resilient Distributed Data sets (RDDs) andData Frames (DFs) [65,66]. Spark can work nicely within the Hadoop ecosys-tem, although this is not mandatory, since Spark is self-contained with respectto task scheduling and fault tolerance. Moreover, it supports a large collection ofdata sources, including HDFS. Spark supports iterative MapReduce tasks andimproves performance by explicitly enabling caching of distributed data sets. Awide range of functions support categorization of application components intodata transformations and actions. In addition, Spark provides stream processingfunctionality, a rich machine learning library, a powerful library for SQL pro-cessing on top of Data Frames and also a library specifically designed for graphprocessing (GraphX). Spark is often used for implementing the speed layer in aLambda or the stream layer in a Kappa architecture.
Kafka. Apache Kafka [30,60] is a scalable message queuing and log aggregationplatform for real-time data feeds. It provides a distributed message queue anda publish/subscribe messaging model for streams of data records, supportingdistributed, fault-tolerant data storage. The framework is run as a so-calledKafka cluster on multiple servers that can scale over multiple data centers. Kafkasupports efficient replay of data streams and thus it is often used to implementsystems that resemble the Kappa architecture.
Samza. Apache Samza [42] is a scalable, distributed real-time stream processingplatform that has been developed in conjunction with Apache Kafka and that isoften used for implementing Big Data systems based on the Kappa architecture.Samza can be integrated easily with the YARN resource management framework.
Resource Management Frameworks. YARN is a resource negotiatorincluded with Apache Hadoop. YARN decouples the programming paradigmof MapReduce from its resource management capabilities, and delegates manyscheduling functions (e.g., task fault-tolerance) to per-application components.Apache Mesos is a fine-grained resource negotiation engine that supports shar-ing and management of a large cluster of machines between different computingframeworks, including Hadoop, MPI, Spark, Kafka, etc. The main differencebetween YARN and Mesos is the resource negotiation model. Whereas YARNimplements a push-based resource negotiation approach, where clients specifytheir resource requirements and deployment preferences, Mesos uses a pull-basedapproach, where the negotiator offers resources to clients which they can acceptor decline.

Mobile Cellular Networks 175
4 Data Analysis
Data Analysis is the scientific process of examining data sets in order to discoverpatterns and draw insights about the information they contain. In the case ofdata collected by mobile phone providers, typically in the form of CDRs, theanalysis focuses in two main directions: (i) graph analysis and (ii) machine learn-ing. Moreover, the data analysis must incorporate the spatial-temporal charac-teristics of such data.
4.1 Graph Analytics
Graph mining is a heavily active research direction with numerous applica-tions [2,15] that uses novel approaches for mining and performing useful analysison datasets represented by graph structures. Current research directions can becategorized into the following groups [52]: (i) Graph clustering used for group-ing vertices into clusters; (ii) Graph Classification used for classifying separate,individual graphs into two or more categories; (iii) Subgraph mining used forproducing a set of subgraphs occurring in at least some given threshold of thegiven input example graphs.
One of the core research directions in the area of graph clustering is thediscovery of meaningful communities in a large network [20] from the perspec-tive of spatial-temporal data that evolves over time. In the majority of real-lifeapplications, graphs are extremely sparse usually following power-law degreedistribution. However, the original graph may contain groups of vertices, calledcommunities, where vertices in the same community are more well-connectedthan vertices across communities. In the case of CDR data, the graph corre-sponds to user interactions and communities correspond to groups of people withstrong pair-wise activity within the group delimited by spacial-temporal bound-aries. To enable efficient community detection in potentially massive amounts ofdata, the following problems must be tackled [58]: (i) the algorithmic techniquesapplied must scale well with respect to the size of the data, which means thatthe algorithmic complexity should stay below O(n2) (where n is the number ofgraph nodes), and (ii) since these techniques are unsupervised, the algorithmsused must be flexible enough to be able to infer the number of communities dur-ing the course of the algorithm. Moreover, the temporal dimension of the datamust be taken into account when detecting communities to better understandthe natural evolution of user interactions. Some algorithms that qualify for thistask are Louvain [8], Infomap [54], Walktrap [50], FastGreedy [14], etc.
The result of community detection analysis is a set of grouped vertices thathave very strong inner connectivity. The results could be presented on the map,since telecom data is georeferenced. In Fig. 9 we present geographical map ofMilan city with wide suburban area overlayed with the results of communitydetection analysis in 3D. Communities that have smaller overall area are pre-sented with higher bars. From visual inspection of Fig. 9 we can notice that thedense urban area of the city has a larger number of small communities, while

176 S. Brdar et al.
in the sparsely populated suburban area there are a few very large communi-ties. High number of communities within small spatial area is reflecting dynamicnature of telecom traffic in urban areas, which is strongly related to people flowand its dynamic across the city.
Fig. 9. Communities over the city of Milan in 3D.
Collective classification and label propagation are two important researchdirections in the area of graph classification for vertex classification. Iterativeclassification is used for collective classification to capture the similarity amongthe points where each vertex represents one data point either labeled or unla-belled [55]. Label propagation is a converging iterative algorithm where verticesare assigned labels based on the majority vote on the labels of their neigh-bors [67]. In the case of CDR data, these algorithms can be used to draw insightsabout users and their neighborhoods by finding the correlations between the labelof a user and (i) its observed attributes, (ii) the observed attributes (includingobserved labels) of other users in its neighborhood, (iii) the unobserved labels ofusers in its neighborhood. The spatial-temporal dimension of the data also playsan important role as the correlations will bring new insight into the propagationof labels and the way user neighborhood is built.
Subgraph mining deals with the identification of frequent graphs and sub-graphs that can be used for classification tasks, graph clustering and buildingindices [51]. In the case of CDR data, subgraph mining can help to detect hiddenpatterns in active user communities delimited into spatial-temporal boundariesby contrasting the support of frequent graphs between various different graphclasses or to classify user interaction by considering frequent patterns using thespatial-temporal dimensions as a cardinal feature.

Mobile Cellular Networks 177
4.2 Machine Learning
Spatial-temporal data analysis is an important and evolving domain of machinelearning. The main direction when dealing with such data is forecasting andprediction in support of the decision-making process.
Classical machine learning techniques, from simple ones for sequential pat-tern mining (e.g., Apriori, Generalized Sequential Pattern, FreeSpan, PrefixS-pan, SPADE) to more complex ones (e.g., Linear, Multilinear, Logistic, Poissonor Nonlinear Regression), can be used to capture the dependencies between spa-tial and temporal components and help with making accurate predictions intothe future and extract new knowledge about the evolution of users and theirinterests.
With the increasing evolution and adoption of neural networks, new deeplearning architectures are developed for the analysis of spatial-temporal data andused for making and quantifying the uncertainty associated with predictions [56].These techniques can be employed in the process of making accurate predictionsfor spatial-temporal data when working in both big data and data scarce regimesmanaging to quantify the uncertainty associated with predictions in a real-timemanner.
5 Data Fusion
Identified patterns from telecom data reach true value when combined withother sources. As illustrated in Fig. 10 processed and analyzed telecom data canbe fused with diverse data sources in context of various applications. We summa-rized several fusion scenarios in Table 1. The list is not exhaustive, only highlightsdiversity of the combinations, and some of the examples might integrate mobilephone data with more than one external source. Satellite data, environmentaldata, IoT, Points-of-Interests (POI), National statistics and other sources canadd to the value of mobile phone data. For example, satellite data can provideinformation on land cover types and changes and IoT can collect valuable groundtruth measurements.
Bringing together heterogeneous datasets with mobile phone data and usingthem jointly is challenging due to typical mismatch in the resolutions of data,multimodal and dynamic nature of data. Some applications on mobile phonedata demand external sources only for training and validation (e.g. learningmodel to predict socio-economic indicators based on features extracted fromtelecom data). Here special attention is needed to understand the bias and avoidspurious correlations. Other scenarios demand continuous information flow fromexternal source and dynamic integration (e.g. air quality measurements fusedwith aggregated mobility from telecom data). The main challenge here is thetimely processing of external data and proper alignment with mobile phonedata.
Fusion scenarios reported in Table 1 illustrate heterogeneity of external datasources, all having an important role in unlocking the value of mobile phone datacoming from telecom operators. The quality of final application depends on the
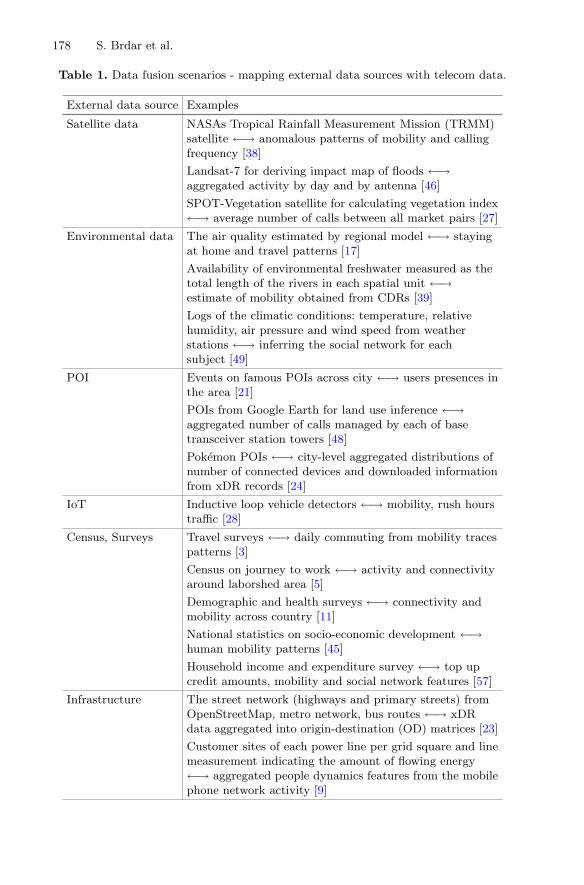
178 S. Brdar et al.
Table 1. Data fusion scenarios - mapping external data sources with telecom data.
External data source Examples
Satellite data NASAs Tropical Rainfall Measurement Mission (TRMM)satellite ←→ anomalous patterns of mobility and callingfrequency [38]
Landsat-7 for deriving impact map of floods ←→aggregated activity by day and by antenna [46]
SPOT-Vegetation satellite for calculating vegetation index←→ average number of calls between all market pairs [27]
Environmental data The air quality estimated by regional model ←→ stayingat home and travel patterns [17]
Availability of environmental freshwater measured as thetotal length of the rivers in each spatial unit ←→estimate of mobility obtained from CDRs [39]
Logs of the climatic conditions: temperature, relativehumidity, air pressure and wind speed from weatherstations ←→ inferring the social network for eachsubject [49]
POI Events on famous POIs across city ←→ users presences inthe area [21]
POIs from Google Earth for land use inference ←→aggregated number of calls managed by each of basetransceiver station towers [48]
Pokemon POIs ←→ city-level aggregated distributions ofnumber of connected devices and downloaded informationfrom xDR records [24]
IoT Inductive loop vehicle detectors ←→ mobility, rush hourstraffic [28]
Census, Surveys Travel surveys ←→ daily commuting from mobility tracespatterns [3]
Census on journey to work ←→ activity and connectivityaround laborshed area [5]
Demographic and health surveys ←→ connectivity andmobility across country [11]
National statistics on socio-economic development ←→human mobility patterns [45]
Household income and expenditure survey ←→ top upcredit amounts, mobility and social network features [57]
Infrastructure The street network (highways and primary streets) fromOpenStreetMap, metro network, bus routes ←→ xDRdata aggregated into origin-destination (OD) matrices [23]
Customer sites of each power line per grid square and linemeasurement indicating the amount of flowing energy←→ aggregated people dynamics features from the mobilephone network activity [9]

Mobile Cellular Networks 179
Fig. 10. Fusion of mobile phone data with other sources.
availability of external sources, efficiency of data processing and the quality ofdelivered information and its integration.
6 Applications
A plethora of research work has been published related to the usage of telecomdata for a multitude of purposes. Telecom data contains rich user behaviour infor-mation, and it can reveal mobility patterns, activity related to specific locations,peak hours or unusual events. Extracting frequent trajectories, home and worklocation detection, origin destination matrices are further examples of knowl-edge that may be mined from rich telecom data. Telecom operators have a greatinterest to analyze collected data for optimizing their services. For example,time-dependent pricing schemes can maximize operators profit, as well as usersgrade of service. Dynamic data pricing frameworks combining both spatial andtemporal traffic patterns [18] allow estimating optimal pricing rewards given thecurrent network capacity.
Telecom data significantly enriched many different fields and boosted externalsocial good applications. Studies in transportation, urban and energy planning,public health, economy and tourism have benefited most from this valuable newresource that surpasses all alternative sources in population coverage, spatialand temporal resolution.
Transportation planning applications need information on different modesof trips, purposes, and times of day. With telecom data transportation modelscan effectively utilize mobility footprints at large scale and resolution. This wasvalidated by an MIT study [3] on the Boston metropolitan area where the authors

180 S. Brdar et al.
demonstrated how CDR data can be used to represent distinct mobility patterns.In another example, origin destination matrices inferred from mobile phone datahelped IBM to redesign the bus routes [6] in the largest city of Ivory Coast -Abidjan.
Mobility patterns derived from telecom data could be very valuable for pub-lic health applications, in particular epidemiology. Surveillance, prioritizationand prevention are key efforts in epidemiology. Mobile phone data demonstratedutility for dengue [62], HIV [11,22], malaria [61], schistosomiasis [39], Ebolaepidemic [47], and cholera outbreaks [19]. Another suitable public health appli-cation is concerned with air quality where recent studies embraced telecom datato better quantify individual and population level expose to air pollution. In [17]the authors highlighted the need to dynamically assess exposure to NO2 thathas high impact on peoples health. Their method incorporated individual travelpatterns.
Urban studies highly explored the potential of mobile phone data and discov-ered that it can be used for urban planning [5], detecting social function of landuse [48], in particular residential and office areas as well as leisure-commerce andrush hour patterns [53], and extracting relevant information about the structureof the cities [37]. Recent applications propose an analytical process able to dis-cover, understand and characterize city events from CDR data [21] and a methodto predict the population at a large spatio-temporal scale in a city [13]. All urbanstudies fit into the wider context of smart city applications and therefore morebreakthroughs on the usage of mobile phone data are expected.
With the growing role of tourism there is increased interest to investigateutility of mobile phone data to understand tourists experiences, evaluate mar-keting strategies and estimate revenues generated by touristic events. Mobilityand behaviour patterns have been recently used to derive trust and reputationmodels and scalable data analytics for the tourism industry [33,59]. The Andorracase study has proposed indicators in high spatial and temporal resolutions suchas tourist flows per country of origin, flows of new tourists, revisiting patterns,profiling of tourist interests to uncover valuable patterns for tourism [34]. Specialattention is given to large scale events that attract foreign people [12]. Arguably,tourists via their mobile devices have quickly become data sources for crowd-sourced aggregation with dynamic spatial and temporal resolutions [32].
Other high impact applications include social and economical develop-ment [45,57], disaster events management such as cyclones landfall [38] or earth-quakes [64], and food security [27,68].
Although many studies demonstrated utility of mobile phone data in variousapplications, reaching the operational level is still not that close. If we recallthe summary of workflow’s steps provided in Fig. 1, all further described in theprevious sections, we can realize that technologies used in each step need tomatch with specific application.

Mobile Cellular Networks 181
7 Summary and Vision
This chapter provided an overview of all steps in discovering knowledge fromraw telecom data in the context of different applications. Knowledge about howpeople move across a city, where they are gathering, what are home, work andleisure locations along with corresponding time component are valuable for manyapplications. The biggest challenges in this process are privacy and regulation,real-time settings and data fusion with external sources.
Efforts directed toward providing access to telecom large-scale human behav-ioral data in a privacy-preserving manner [41] are necessary. Real-time settingsraise critical issues concerning computational infrastructure, big data frame-works and analytics. There is a lack of research and benchmark studies thatevaluate different computational architectures and big data frameworks. Only afew studies tackled issues of parallelization and distributed processing. In [16]authors proposed mobility intelligence framework based on Apache Spark forprocessing and analytics of large scale mobile phone data. Another example is thestudy [58] that provided computational pipeline for the community detection inmobile phone data, developed in Apache Hive and Spark technology, and bench-marked different architectures and settings. More of these studies are neededto choose the right architecture and processing frameworks. Graph analyticstogether with machine learning have become indispensable tools for telecomdata analytics, but the streaming nature of data demands for change detectionand online adaption. External data sources mentioned in the data fusion sectionare also advancing (e.g., new satellites launched, enhanced IoT ecosystems) andwill help us to understand spatio-temporal context better.
Future research must address all critical aspects to reach technology readinessfor operational environment. This will enable applications based on mobile phonedata to have high impact on decision making in urban, transport, public healthand other domains and will certainly open opportunities for new applications.
References
1. Acs, G., Castelluccia, C.: A case study: privacy preserving release of spatio-temporal density in Paris. In: 20th ACM SIGKDD International Conference onKnowledge Discovery and Data Mining-KDD 2014, pp. 1679–1688. ACM, NewYork (2014). https://doi.org/10.1145/2623330.2623361
2. Aggarwal, C.C., Wang, H.: Managing and Mining Graph Data. Springer, New York(2010). https://doi.org/10.1007/978-1-4419-6045-0
3. Alexander, L., Jiang, S., Murga, M., Gonzalez, M.C.: Origin-destination trips bypurpose and time of day inferred from mobile phone data. Transp. Res. Part C:Emerg. Technol. 58, 240–250 (2015). https://doi.org/10.1016/j.trc.2015.02.018
4. Barlacchi, G., et al.: A multi-source dataset of urban life in the city of milan andthe province of trentino. Sci. Data 2, 150055 (2015)
5. Becker, R.A., et al.: A tale of one city: using cellular network data for urbanplanning. IEEE Pervasive Comput. 10(4), 18–26 (2011). https://doi.org/10.1109/MPRV.2011.44

182 S. Brdar et al.
6. Berlingerio, M., Calabrese, F., Di Lorenzo, G., Nair, R., Pinelli, F., Sbodio, M.L.:AllAboard: a system for exploring urban mobility and optimizing public transportusing cellphone data. In: Blockeel, H., Kersting, K., Nijssen, S., Zelezny, F. (eds.)ECML PKDD 2013. LNCS (LNAI), vol. 8190, pp. 663–666. Springer, Heidelberg(2013). https://doi.org/10.1007/978-3-642-40994-3 50
7. Blondel, V.D., Decuyper, A., Krings, G.: A survey of results on mobile phonedatasets analysis. EPJ Data Sci. 4(1). https://doi.org/10.1140/epjds/s13688-015-0046-0
8. Blondel, V.D., Guillaume, J.L., Lambiotte, R., Lefebvre, E.: Fast unfolding ofcommunities in large networks. J. Stat. Mech.: Theory Exp. 2008(10), P10008(2008). https://doi.org/10.1088/1742-5468/2008/10/P10008
9. Bogomolov, A., Lepri, B., Larcher, R., Antonelli, F., Pianesi, F., Pentland, A.:Energy consumption prediction using people dynamics derived from cellular net-work data. EPJ Data Sci. 5(1), 13 (2016). https://doi.org/10.1140/epjds/s13688-016-0075-3
10. Bosetti, P., Poletti, P., Stella, M., Lepri, B., Merler, S., De Domenico, M.: Reducingmeasles risk in turkey through social integration of Syrian refugees. arXiv preprintarXiv:1901.04214 (2019)
11. Brdar, S., Gavric, K., Culibrk, D., Crnojevic, V.: Unveiling spatial epidemiol-ogy of HIV with mobile phone data. Sci. Rep. 6 (2016). https://doi.org/10.1038/srep19342
12. Callegari, C., Garroppo, R.G., Giordano, S.: Inferring social information on for-eign people from mobile traffic data. In: 2017 IEEE International Conference onCommunications (ICC), pp. 1–6. IEEE (2017)
13. Chen, J., et al.: Fine-grained prediction of urban population using mobile phonelocation data. Int. J. Geogr. Inf. Sci. 32, 1770–1786 (2018)
14. Clauset, A., Newman, M.E., Moore, C.: Finding community structure in very largenetworks. Phys. Rev. E 70(6), 066111 (2004)
15. Cook, D.J., Holder, L.B.: Mining Graph Data. Wiley, Hoboken (2006). https://doi.org/10.1002/0470073047
16. Dang, T.A., et al.: Mobility genomeTM-a framework for mobility intelligence fromlarge-scale spatio-temporal data. In: 2017 IEEE International Conference on DataScience and Advanced Analytics (DSAA), pp. 449–458. IEEE (2017)
17. Dewulf, B., et al.: Dynamic assessment of exposure to air pollution using mobilephone data. Int. J. Health Geogr. 15(1), 14 (2016)
18. Ding, J., Li, Y., Zhang, P., Jin, D.: Time dependent pricing for large-scale mobilenetworks of urban environment: feasibility and adaptability. IEEE Trans. Serv.Comput. (2017)
19. Finger, F., et al.: Mobile phone data highlights the role of mass gatherings in thespreading of cholera outbreaks. Proc. Natl. Acad. Sci. 113(23), 6421–6426 (2016)
20. Fortunato, S.: Community detection in graphs. Phys. Rep. 483(3), 75–174 (2010).https://doi.org/10.1016/j.physrep.2009.11.002
21. Furletti, B., Trasarti, R., Cintia, P., Gabrielli, L.: Discovering and understandingcity events with big data: the case of rome. Information 8(3), 74 (2017)
22. Gavric, K., Brdar, S., Culibrk, D., Crnojevic, V.: Linking the human mobility andconnectivity patterns with spatial HIV distribution. NetMob D4D Challenge, pp.1–6 (2013)
23. Graells-Garrido, E., Caro, D., Parra, D.: Inferring modes of transportation usingmobile phone data. EPJ Data Sci. 7(1), 49 (2018)
24. Graells-Garrido, E., Ferres, L., Caro, D., Bravo, L.: The effect of Pokemon go onthe pulse of the city: a natural experiment. EPJ Data Sci. 6(1), 23 (2017)

Mobile Cellular Networks 183
25. Gundlegard, D., Rydergren, C., Breyer, N., Rajna, B.: Travel demand estimationand network assignment based on cellular network data. Comput. Commun. 95,29–42 (2016)
26. He, Y., Yu, F.R., Zhao, N., Yin, H., Yao, H., Qiu, R.C.: Big data analytics inmobile cellular networks. IEEE Access 4, 1985–1996 (2016)
27. Jacques, D.C., et al.: Social capital and transaction costs in millet markets. Heliyon4(1), e00505 (2018)
28. Jarv, O., Ahas, R., Saluveer, E., Derudder, B., Witlox, F.: Mobile phones in atraffic flow: a geographical perspective to evening rush hour traffic analysis usingcall detail records. PloS ONE 7(11), 1–12 (2012). https://doi.org/10.1371/journal.pone.0049171
29. Jiang, S., Fiore, G.A., Yang, Y., Ferreira Jr., J., Frazzoli, E., Gonzalez, M.C.: Areview of urban computing for mobile phone traces: current methods, challengesand opportunities. In: Proceedings of the 2nd ACM SIGKDD International Work-shop on Urban Computing, p. 2. ACM (2013)
30. Kreps, J.: Kafka: a distributed messaging system for log processing. In: Proceedingsof the 6th International Workshop on Networking Meets Databases (NetDB) (2011)
31. Kreps, J.: Questioning the Lambda Architecture, July 2014. https://www.oreilly.com/ideas/questioning-the-lambda-architecture. Accessed 15 Dec 2018
32. Leal, F., Malheiro, B., Gonzalez-Velez, H., Burguillo, J.C.: Trust-based modellingof multi-criteria crowdsourced data. Data Sci. Eng. 2(3), 199–209 (2017). https://doi.org/10.1007/s41019-017-0045-1
33. Leal, F., Veloso, B.M., Malheiro, B., Gonzlez-Vlez, H., Burguillo, J.C.: Scalablemodelling and recommendation using Wiki-based crowdsourced repositories. Elec-tron. Commer. Res. Appl. 33, 100817 (2019). https://doi.org/10.1016/j.elerap.2018.11.004
34. Leng, Y., Noriega, A., Pentland, A., Winder, I., Lutz, N., Alonso, L.: Analysisof tourism dynamics and special events through mobile phone metadata. arXivpreprint arXiv:1610.08342 (2016)
35. Lepri, B., Oliver, N., Letouze, E., Pentland, A., Vinck, P.: Fair, transparent, andaccountable algorithmic decision-making processes. Philos. Technol. 31, 611–627(2018)
36. Lima, A., De Domenico, M., Pejovic, V., Musolesi, M.: Disease containment strate-gies based on mobility and information dissemination. Sci. Rep. 5 (2015). https://doi.org/10.1038/srep10650
37. Louail, T., et al.: From mobile phone data to the spatial structure of cities. Sci.Rep. 4, 5276 (2014)
38. Lu, X., et al.: Detecting climate adaptation with mobile network data inBangladesh: anomalies in communication, mobility and consumption patterns dur-ing cyclone Mahasen. Climatic Change 138(3–4), 505–519 (2016)
39. Mari, L., et al.: Big-data-driven modeling unveils country-wide drivers of endemicschistosomiasis. Sci. Rep. 7(1), 489 (2017)
40. Marz, N., Warren, J.: Big Data Principles and Best Practices of Scalable RealtimeData Systems. Manning, New York City (2006)
41. de Montjoye, Y.A., et al.: On the privacy-conscientious use of mobile phone data.Sci. Data 5, 180286 EP– (2018). https://doi.org/10.1038/sdata.2018.286
42. Noghabi, S.A., Paramasivam, K., Pan, Y., Ramesh, N., Bringhurst, J., Gupta,I., Campbell, R.H.: Samza: stateful scalable stream processing at linkedin. Proc.VLDB Endow. 10(12), 1634–1645 (2017)

184 S. Brdar et al.
43. Novovic, O., Brdar, S., Crnojevic, V.: Evolving connectivity graphs in mobile phonedata. In: NetMob, The Main Conference on the Scientific Analysis of Mobile PhoneDatasets, pp. 73–75. Vodafone (2015)
44. Oliver, N., Matic, A., Frias-Martinez, E.: Mobile network data for public health:opportunities and challenges. Front. Publ. Health 3, 189 (2015)
45. Pappalardo, L., Pedreschi, D., Smoreda, Z., Giannotti, F.: Using big data to studythe link between human mobility and socio-economic development. In: 2015 IEEEInternational Conference on Big Data (Big Data), pp. 871–878 (2015). https://doi.org/10.1109/BigData.2015.7363835
46. Pastor-Escuredo, D., et al.: Flooding through the lens of mobile phone activity. In:2014 IEEE Global Humanitarian Technology Conference (GHTC), pp. 279–286.IEEE, October 2014. https://doi.org/10.1109/GHTC.2014.6970293
47. Peak, C.M., et al.: Population mobility reductions associated with travel restric-tions during the Ebola epidemic in Sierra Leone: use of mobile phone data. Int. J.Epidemiol. 47(5), 1562–1570 (2018)
48. Pei, T., Sobolevsky, S., Ratti, C., Shaw, S.L., Li, T., Zhou, C.: A new insight intoland use classification based on aggregated mobile phone data. Int. J. Geogr. Inf.Sci. 28(9), 1988–2007 (2014)
49. Phithakkitnukoon, S., Leong, T.W., Smoreda, Z., Olivier, P.: Weather effects onmobile social interactions: a case study of mobile phone users in Lisbon, Portugal.PloS ONE 7(10), e45745 (2012)
50. Pons, P., Latapy, M.: Computing communities in large networks using randomwalks. J. Graph Algorithms Appl. 10(2), 191–218 (2006)
51. Ramraj, T., Prabhakar, R.: Frequent subgraph mining algorithms - a survey. Pro-cedia Comput. Sci. 47, 197–204 (2015). https://doi.org/10.1016/j.procs.2015.03.198
52. Rehman, S.U., Khan, A.U., Fong, S.: Graph mining: a survey of graph mining tech-niques. In: International Conference on Digital Information Management (ICDIM2012), pp. 88–92 (2012). https://doi.org/10.1109/ICDIM.2012.6360146
53. Rıos, S.A., Munoz, R.: Land use detection with cell phone data using topic models:Case Santiago, Chile. Comput. Environ. Urban Syst. 61, 39–48 (2017)
54. Rosvall, M., Bergstrom, C.T.: Maps of random walks on complex networks revealcommunity structure. Proc. Natl. Acad. Sci. 105(4), 1118–1123 (2008). https://doi.org/10.1073/pnas.0706851105
55. Sen, P., Namata, G., Bilgic, M., Getoor, L., Galligher, B., Eliassi-Rad, T.: Collec-tive classification in network data. AI Mag. 29(3), 93 (2008)
56. Senanayake, R., Jean, N., Ramos, F., Chowdhary, G.: Modeling and decision-making in the spatiotemporal domain. In: Conference on Neural Information Pro-cessing Systems (2018)
57. Steele, J.E., et al.: Mapping poverty using mobile phone and satellite data. J. Roy.Soc. Interface 14(127) (2017). https://doi.org/10.1098/rsif.2016.0690
58. Truica, C.-O., Novovic, O., Brdar, S., Papadopoulos, A.N.: Community detectionin who-calls-whom social networks. In: Ordonez, C., Bellatreche, L. (eds.) DaWaK2018. LNCS, vol. 11031, pp. 19–33. Springer, Cham (2018). https://doi.org/10.1007/978-3-319-98539-8 2
59. Veloso, B., Leal, F., Gonzalez-Velez, H., Malheiro, B., Burguillo, J.: Scalable dataanalytics using crowdsourced repositories and streams. J. Parallel Distrib. Comput.122, 1–10 (2018). https://doi.org/10.1016/j.jpdc.2018.06.013
60. Wang, G., et al.: Building a replicated logging system with Apache Kafka.Proc. VLDB Endow. 8(12), 1654–1655 (2015). https://doi.org/10.14778/2824032.2824063

Mobile Cellular Networks 185
61. Wesolowski, A., et al.: Quantifying the impact of human mobility on Malaria.Science 338(6104), 267–270 (2012)
62. Wesolowski, A., et al.: Impact of human mobility on the emergence of dengue epi-demics in Pakistan. Proc. Natl. Acad. Sci. 112(38), 11887–11892 (2015). https://doi.org/10.1073/pnas.1504964112
63. White, T.: Hadoop: The Definitive Guide, 4th edn. O’Reilly, Newton (2015)64. Wilson, R., et al.: Rapid and near real-time assessments of popula-
tion displacement using mobile phone data following disasters: the 2015Nepal Earthquake. PLoS Curr. 8 (2016).https://doi.org/10.1371/currents.dis.d073fbece328e4c39087bc086d694b5c
65. Zaharia, M., et al.: Resilient distributed datasets: a fault-tolerant abstraction forin-memory cluster computing. In: Proceedings of the 9th USENIX Conference onNetworked Systems Design and Implementation, NSDI 2012, p. 2. USENIX Asso-ciation, Berkeley (2012). http://dl.acm.org/citation.cfm?id=2228298.2228301
66. Zaharia, M., et al.: Apache spark: a unified engine for big dataprocessing. Commun.ACM 59(11), 56–65 (2016). https://doi.org/10.1145/2934664
67. Zhu, X., Ghahramani, Z.: Learning from labeled and unlabeled data with labelpropagation. Technical report CMU-CALD-02-107, Carnegie Mellon University,June 2002
68. Zufiria, P.J., et al.: Identifying seasonal mobility profiles from anonymized andaggregated mobile phone data. Application in food security. PloS ONE 13(4),e0195714 (2018)
Open Access This chapter is licensed under the terms of the Creative CommonsAttribution 4.0 International License (http://creativecommons.org/licenses/by/4.0/),which permits use, sharing, adaptation, distribution and reproduction in any mediumor format, as long as you give appropriate credit to the original author(s) and thesource, provide a link to the Creative Commons license and indicate if changes weremade.
The images or other third party material in this chapter are included in the chapter’sCreative Commons license, unless indicated otherwise in a credit line to the material. Ifmaterial is not included in the chapter’s Creative Commons license and your intendeduse is not permitted by statutory regulation or exceeds the permitted use, you willneed to obtain permission directly from the copyright holder.

Medical Data Processing and Analysisfor Remote Health and Activities
Monitoring
Salvatore Vitabile1(B) , Michal Marks2 , Dragan Stojanovic3 ,Sabri Pllana4 , Jose M. Molina5 , Mateusz Krzyszton2 , Andrzej Sikora2 ,
Andrzej Jarynowski6 , Farhoud Hosseinpour7 , Agnieszka Jakobik8 ,Aleksandra Stojnev Ilic3 , Ana Respicio9 , Dorin Moldovan10 ,
Cristina Pop10 , and Ioan Salomie10
1 University of Palermo, Palermo, [email protected]
2 Research and Academic Computer Network, Warsaw, Poland{michal.marks,mateusz.krzyszton,andrzej.sikora}@nask.pl
3 University of Nis, Nis, Serbia{dragan.stojanovic,aleksandra.stojnev}@elfak.ni.ac.rs
4 Linnaeus University, Vaxjo, [email protected]
5 Universidad Carlos III de Madrid, Madrid, [email protected]
6 Interdisciplinary Research Institute in Wroclaw, Wroc�law, [email protected]
7 University of Turku, Turku, [email protected]
8 Cracow University of Technology, Krakow, [email protected]
9 Universidade de Lisboa, Lisbon, [email protected]
10 Technical University of Cluj-Napoca, Cluj-Napoca, [email protected]
Abstract. Recent developments in sensor technology, wearable com-puting, Internet of Things (IoT), and wireless communication havegiven rise to research in ubiquitous healthcare and remote monitoringof human’s health and activities. Health monitoring systems involve pro-cessing and analysis of data retrieved from smartphones, smart watches,smart bracelets, as well as various sensors and wearable devices. Such sys-tems enable continuous monitoring of patients psychological and healthconditions by sensing and transmitting measurements such as heart rate,electrocardiogram, body temperature, respiratory rate, chest sounds, orblood pressure. Pervasive healthcare, as a relevant application domainin this context, aims at revolutionizing the delivery of medical servicesthrough a medical assistive environment and facilitates the independentliving of patients. In this chapter, we discuss (1) data collection, fusion,ownership and privacy issues; (2) models, technologies and solutions for
c© The Author(s) 2019J. Ko�lodziej and H. Gonzalez-Velez (Eds.): cHiPSet, LNCS 11400, pp. 186–220, 2019.https://doi.org/10.1007/978-3-030-16272-6_7

Medical Data Processing and Analysis 187
medical data processing and analysis; (3) big medical data analytics forremote health monitoring; (4) research challenges and opportunities inmedical data analytics; (5) examples of case studies and practical solu-tions.
Keywords: e-Health · Internet of Things (IoT) ·Remote health monitoring · Pervasive healthcare (PH)
1 Introduction
Recent developments in sensor technologies, wearable computing, Internet ofThings (IoT), and wireless communications have given rise to research on mobileand ubiquitous health-care and remote monitoring of peoples health and activ-ities [61]. Health monitoring systems include processing and analysis of dataretrieved from smart-phones, smart watches, smart bracelets (that is, wrist-bands), as well as various connected sensors and wearable devices [69]. Suchsystems enable continuous monitoring of patients psychological and health con-ditions by sensing and transmitting measurements such as heart rate, electro-cardiogram (ECG), body temperature, respiratory rate, chest sounds, and bloodpressure. Collected, fused, and analyzed sensor data are important for diagno-sis and treatment of patients with chronic diseases (such as, hypertension anddiabetes) or for monitoring and assistance of elderly people. The area of healthinformatics is explored by researchers with different academic backgrounds: com-puter scientists, physicians, mathematicians, statisticians, and sociologists. Allof them have something to contribute: from medical knowledge, though com-puter science (that is, simulations and data analysis), to sociological and mar-keting know-how (such as, apps dissemination and social interventions). Thereare mathematical/computational models (for instance, differential equations orsystem dynamics) that can be involved in understanding of health-relevant pro-cesses. For example, infectious disease models can use sensoric data that arecollected from human contacts; these models can be useful in risk assessment ofpatients.
This chapter addresses major challenges and opportunities related to themedical data collection, modelling and processing in the context of monitoringof human’s health and behavior. To illustrate the use of discussed concepts andtechnologies we present three case studies. The first case study describes a BigData solution for remote health monitoring that considers challenges pertainingto monitoring the health and activities of patients. We present the design andimplementation of a remote health monitoring system architecture that may beemployed in a public, private or hybrid cloud. The second case study describesa system designed to support distributed monitoring of human health duringa trip. It is assumed that a travel agency that organizes a trip to high moun-tains equips the guide and tourists with sensors that monitor health parameters.The third case study describes the use of machine learning in the context ofmonitoring daily living activities of people with dementia. Detected anomalies

188 S. Vitabile et al.
in the daily living activities of people with dementia may help medical expertsto distinguish between health decline symptoms caused by dementia and healthdecline symptoms incurred by the side effects of the prescribed medications.
The rest of this chapter is structured as follows. Section 2 discusses datacollection, fusion, ownership and privacy issues. Models, technologies and solu-tions for medical data processing and analysis are addressed in Sect. 3. Section 4discusses big medical data analytics for remote health monitoring. Researchchallenges and opportunities in medical data analytics are addressed in Sect. 5.Section 6 describes examples of case studies and practical scenarios. The chapteris concluded in Sect. 7.
2 Medical Data Collection, Fusion, Ownershipand Privacy
2.1 Medical Data Collection
Medicine has always been trying to measure properties of patients (such as,clinical picture) and how to understand their health and disease. Computer sci-ence would then incorporate the results of these measurements, experiments andobservation into models. Recently, the utilisation of IT tools for medicine (suchas, machine learning) has undergone an accelerating growth, however all mod-els of such system are incomplete without real data, especially register-based.For example with patient Electronic Health Record/Documentation (EHR/D)data can be provided with reasonably accuracy on clinical picture, procedures,or co-morbidity. International standard - HL7 (Health Level Seven) allows inter-operability between IT providers and solutions. However, still in many countriesmost of medical data is analog and must be digitized (e.g. image and sound pro-cessing). Moreover, powerful computer facilities and ubiquitous wearable deviceswith multiple sensors have made possible the collection, processing and storageof data on individual or group of patients. Individual data can be used for riskassessment for a particular health disorder. For example the risk of being affectedby an infectious disease can be calculated based on sensor data and question-naires [36]. Data collected from group of patients potentially being in contactcan be used for infectious disease risk assessment in given community. There isconcern about Data Protection Act in EU from legal perspective about provid-ing such kind of data analysis, which will be described in detail in this chapter.The consent of each patient should be requested, which could be very difficultto obtain.
2.2 Blockchain for Privacy and Security
The main application of Blockchain in medicine is traceability of drugs in manyactors setup. Such a technique has been already applied in Sub-Saharian Africaand South-East Asia for verifying originality of drugs (fake drugs are big prob-lem there). Blockchain technology can also help in investigating food-borne out-breaks, where tractability of items in supply chain with storage/transport char-acteristics is crucial.

Medical Data Processing and Analysis 189
2.3 Data Fusion
Data fusion (DF) is a multi-domain growing field aiming to provide data forsituation understanding. Globally, threat detection and facility protection aresome of the vital areas in DF research [49]. Fusion systems aim to integrate sensordata and information in databases, knowledge bases, contextual information,user mission, etc., in order to describe dynamically-changing situations [32]. Ina sense, the goal of information fusion is to attain a real-time simulation of asubset of the world based on partial observations of it [50].
The ability to fuse digital data into useful information is hampered by the factthat the inputs, whether device-derived or text-based, are generated in differentformats, some of them unstructured. Whether the information is unstructuredby nature or the fact that information exchange (metadata) standards are lack-ing (or not adhered to) all of this hinders automatic processing by computers.Furthermore, the data to be fused may be inaccurate, incomplete, ambiguous, orcontradictory; it may be false or corrupted by hostile measures. Moreover, muchinformation may be hard to formalize, i.e., imaging information. Consequently,information exchange is often overly complex. In many instances, there is a lackof communication between the various information sources, simply because thereis no mechanism to support this exchange.
The high data flow, either device-based or text-based, is unable to processand leads to time delays, extra costs, and even inappropriate decisions due tomissing or incomplete information [13,63].
The key aspect in modern DF applications is the appropriate integration ofall types of information or knowledge: observational data, knowledge models (apriori or inductively learned), and contextual information [28,73]. Each of thesecategories has a distinctive nature and potential support to the result of thefusion process.
– Observational Data: Observational data are the fundamental data about theindividual, as collected from some observational capability (sensors of anytype). These data are about the observable characteristic of a person that areof interest [40].
– Contextual Information: Context and the elements of what could be calledContextual Information could be defined as “the set of circumstances sur-rounding the acquired data that are potentially of relevance to its comple-tion.” Because of its data-relevance, fusion implies the development of a best-possible estimate taking into account this lateral knowledge [29]. We can seethe context as background, i.e., not the specific entity, event, or behaviour ofprime interest but that information which is influential to the formation of abest estimate of these items [27].
– Learned Knowledge: In those cases where a priori knowledge for DF pro-cess development cannot be formed, one possibility is to try and excise theknowledge through online machine learning processes operating on the obser-vational and other data [59]. These are procedural and algorithmic methodsfor discovering relationships among concepts of interest that being capturedby the system (sensor data and contextual information). There is a tradeoff

190 S. Vitabile et al.
involved in trying to develop fully-automated algorithmic DF processes forcomplex problems where the insertion of human intelligence at some point inthe process may be a much more judicious choice [23].
At this time, there are a multitude of problem-specific solutions to fusion,most of which are centred in specific applications, producing problem-specificresults [26]. The ability to automatically combine the results of smaller problemsinto a larger context is still missing.
2.4 Medical Data Security Requirements Enforced by the Lawand Related Ownership and Privacy Issues
All organizations that are collecting, processing and storing medical are obligedby the international and local law regulations and standards to improve theirdata protection strategies. The example of data protection laws required by USAis the The Health Insurance Portability and Accountability Act (HIPAA)1, usedfor compliance and secure adoption of electronic health records (EHR).
HIPAA sets the rules for sensitive patient data protection with its Privacy andSecurity Rules. According to HIPA, a company that processes protected healthinformation must store it in a system that is secure as far as physical, network,and process security is concerned. Security Rule of HIPAA defines requirementsfor health information that is held or transferred in electronic form. It requiresthat HIPAA-covered entities implement the following protections:
– Ensure the confidentiality, integrity, and availability of all e-PHI they create,receive, maintain or transmit;
– Identify and protect against reasonably anticipated threats to the security orintegrity of the information;
– Protect against reasonably anticipated, impermissible uses or disclosures; and– Ensure compliance by their workforce.
Additionally, it regulates technical safeguards when hosting sensitive patientdata, including facility access in place, as well as policies for using workstations,electronic media, and all processes of transferring, removing, disposing, and re-using electronic media or electronic information. It enforces authorized uniqueuser IDs, emergency access procedures, automatic log off, encryption of data,and audit reports. Also, activity tracking logs of all activity on hardware andsoftware are necessary.
Health-care organizations must ensure the security and availability of patientsdata for both health-care professionals and patients.
The complete suite of HIPAA Administrative Simplification Regulations canbe found at 45 CFR Part 160, Part 162, and Part 164, and includes:
– Transactions and Code Set Standards;– Identifier Standards;
1 https://www.hhs.gov/hipaa.

Medical Data Processing and Analysis 191
– Privacy Rule;– Security Rule;– Enforcement Rule;– Breach Notification Rule.
General Data Protection Regulation (GDPR)2 is a regulation in EU law ondata protection and privacy within the European Union (EU) and the EuropeanEconomic Area (EEA). It also specifies the conditions for exporting of personaldata outside the EU and EEA areas. It specifies:
– Rights of the data subject– Controller role– Transfers of personal data to third countries or international organizations– Independent supervisory authorities– Cooperation and consistency– Remedies, liability and penalties– Delegated acts and implementing acts
It specifies actions to be taken that enforces the processing on systems that areprocessing medical data. Several examples may be:
– Data holders must notify the authorities in case of breach;– Subjects have a right to access their data;– The right to be forgotten that gives individuals the power to request the
removal of their personal data;– Privacy must be designed in;– Privacy is included by default, not by unticking a box;– Right to rectification, the data shall have the right to obtain from the con-
troller without undue delay. The data subject have the right to have incom-plete personal data completed, including by means of providing a supplemen-tary statement.
– Every organization holding personal third party data must have a data pro-tection officer.
The GDPR imposes stiff fines on data controllers and processors for non-compliance, up to 20 million, or 4% of the worldwide annual revenue of the priorfinancial year, in case of braking the basic principles for processing medical data.
To obtain the HIPAA required security level, the company may follow twopaths:
1. choose a reputable HIPAA training company that offers certification creden-tials, and analyze the company procedures and systems by itself;
2. obtain evaluation by an independent, third party auditor, like for instance,Coalfire Systems3 or ComplySmart4.
2 https://eur-lex.europa.eu/eli/reg/2016/679/oj.3 http://www.coalfire.com.4 http://www.complysmart.com.

192 S. Vitabile et al.
For ensuring GRPD standards, the company may:
1. obtain the customized GDPR certificate for protection officers5;2. hire authorized experts6;
For both HIPAA and GDPR compliance there is no one main central inde-pendent party that may certify the company.
GDPR specific challenges rises inside remote systems. First of all, under theGDPR personal data may not be stored longer then needed. This is why, reten-tion procedures have to be implemented and when the data expired they have tobe removed from systems. Data can be stored on multiple locations, under mul-tiple vendors, processed by many services. The deletion of data completely haveto consider also backups and copies of data stored on the remote equipment.Additionally, breaching response may also be the issue. Breach notification haveto be shared among data holders. A breach event have to be well defined.
Processing of personal data outside the European Economic Area (EEA)is the next problem due to multiple location. Controllers will need to define amulti-country data strategy taking into account localization laws.
The transparency of security procedures of medical systems or third partycertificates are necessary to ensure security controllers about the quality of secu-rity services.
Medical service providers must be subject of an audit to perform a controlframework with privacy and privacy by design control measures.
Medical services should be monitored to address any changes in technologyand recommended updates to the system. It includes newly introduced equip-ment, and sensors.
During processing large set of data, visibility regarding metadata and dataanonymization is a big challenge. The level of protection of metadata, the respec-tive ownership rights, rights to process the collections of metadata, intended usesof metadata should be examined carefully.
2.5 Publicly Available Medical Datasets and Reuse of AlreadyCollected Data
Comprehensive and real-world personal health and activities datasets have avery important role in data processing and analysis; therefore several attemptshave been made to create big and representative examples of real-world datasets[67].
Examples of such datasets are UbiqLog [68] and CrowdSignals [82], whichcontains both the data from the smartphones, and from wearable devices, smartwatch/bracelet.
Biomedical signals datasets can be found at PhysioNet7 which offers freeWeb access to large collections of recorded physiologic signals (PhysioBank) andrelated open-source software for collecting them (PhysioToolkit).5 https://www.eugdpr.institute/gdpr-certification/.6 https://www.forcepoint.com.7 www.physionet.org.

Medical Data Processing and Analysis 193
The ExtraSensory dataset contains data from 60 users and more than 300Klabeled examples (minutes) originated from smartphone and smartwatch sensors.The dataset is publicly available for context recognition research [77].
Within already implemented Hospital Information System (HIS) frameworka lot of data is collected (e.g. for administrative purposes), but not have beenanalysed from patients health perspective. Organizational structure as dedicat-ing staff to patients, transport paths rerouting, shift distributions, geo-localizingisolated/cohorted patients, etc. can be used for example in infectious diseasefield. There are models and tools describing the possible spread of pathogensand could indicate an effective strategy in the fight against infectious diseases8,however available solutions are not using HPC as it would be possible.
3 Models, Technologies and Solutions for Medical DataProcessing and Analysis
Usability of e-health can rely on collecting techniques and data analysis. Variousdata sets (survey, diagnosis and tests, time series, spatial, panel, longitudinaldata, etc.) shall be analysed by different methods (regressions, decision trees,structural equation modelling, social network analysis, agent-based modelling,machine learning, etc.).
3.1 Innovative Use of Commercial Electronic Devices (Smartphonesand Watches, Bracelets, Wearables,...) for Remote Monitoring
Low-power and low cost electronic devices can be easily purchased and used.Some properties as body temperature and blood pulse can be measured withhigh accuracy, but developer are trying to target more and more features. FDA(Federal Drug Agency) as well as EMA (European Medicines Agency) certifydigital Health Software and Devices. Most of devices on the market do notsatisfy minimum conditions for certification and accreditation. Some of them asair quality monitoring devices (e.g. PM2.5 laser dust sensor for less than 5$) havebeen massively used in heavily polluted cities. However no medical organizationrecommends using home devices due to very low data quality and data providedfrom certified official stations should be enough. More data is not always betteras it is shown in this example.
Some issues come with digital health apps and software (mhealth). Nowadaysan app can be found for almost everything. Let’s consider advances in imagerecognition using deep learning by a smartphone for measuring blood pressureby photoplethysmography. The biggest advantage of this method is simplicity,so nothing more than smartphone is needed. However, even it works well aftercalibration for most users, there are patients for whom the error of this proce-dure can reach 30%. So apps offering this feature (like icare and HDCH) weretaken away from Google Play and App Store, but their equivalents are still verypopular, for example in China.8 www.sirsz.pl.

194 S. Vitabile et al.
Another type of sensors are bluetooth beacons to track social interactionsthat can be used for infectious disease control and psychological health (oneof certified suppliers for these beacons is kontakt.io). Smartphone or wearablesensors can communicate between each other and collect contact data.
3.2 IoT Platforms for e-Health Applications
Thinger.io. The IoT platform is an open source alternative. Thinger.io is rela-tively new to the IoT ecosystem but is being used extensively in different researchprojects [25,43,48], or even for education [38]. It provides a ready to use cloudservice for connecting devices to the Internet to perform any remote sensing oractuation over the Internet. It offers a free tier for connecting a limited numberof devices, but it is also possible to install the software outside the cloud for aprivate management of the data and devices connected to the platform, withoutany limitation.
Fig. 1. Thinger.io platform
This platform is hardware agnostic, so it is possible to connect any devicewith Internet connectivity, from Arduino devices, Raspberry Pi, Sigfox devices,Lora solutions over gateways, or ARM devices, to mention a few. The platform

Medical Data Processing and Analysis 195
provides some out of the box features like device registry; bi-directional com-munication in real-time, both for sensing or actuation; data and configurationstorage, so it is possible to store time series data; identity and access management(IAM), to allow third party entities to access the platform and device resourcesover REST/Websocket APIs; third party Webhooks, so the devices can easilycall other Web services, send emails, SMS, push data to other clouds, etc. It alsoprovides a web interface to manage all the resources and generate dashboards forremote monitoring. The general overview of this platform is available at Fig. 1.The main benefit of using this platform, aside that it is open source, is the pos-sibility to obtain a bi-directional communication with the devices, in real-time,by using standard REST-API interfaces. This way, it is possible to develop anyapplication, i.e., desktop, mobile, Web service, that interacts with devices byusing a well-known and proven interface based on REST [62]. Meanwhile, thedevices can use more efficient (in terms of bandwidth, or memory footprint)binary protocols to communicate with the cloud. In the other way, this platformprovides client libraries for connecting several state of the art IoT devices likeArduino-based, ESP8266, ESP32, LinkitOne, Texas Instruments CC3200, Libel-lium Waspmotes, Raspberry Pi, etc. The client libraries provide a comprehensiveway of connecting devices and sending information to the cloud, without havingto deal with complex IoT protocols.
Libelium MySignals. This is a development platform for medical devices andeHealth applications. The platform can be used to develop eHealth web applica-tions and to test own sensors for medical applications. MySignals is an exampleof commercial product which is offered and supported by a Spanish companycalled Libelium9. It allows measurement of more than 20 biometric parameterssuch as pulse, breath rate, oxygen in blood, electrocardiogram signals, bloodpressure, muscle electromyography signals, glucose levels, galvanic skin response,lung capacity, snore waves, patient position, airflow and body scale parameters.Data gathered by sensors can be stored in the MySignals or third party Cloudto be visualized in external Web and mobile app’s. Libelium offers an API fordevelopers to access the information as well as Open source HW version whichis based on Arduino. One of the drawbacks is the restriction for sending theinformation coming from MySignals to a third party cloud server using directlyWiFi radio which is limited only for HW version – option is not available forSW version running on libelium Atmega 2560 node.
FIWARE. FIWARE10 is an open source IoT platform “combining compo-nents that enable the connection to IoT with Context Information Managementand Big Data services in the cloud” [8]. FIWARE uses rather simple standardAPIs for data management and exchange that can be used to develop smartapplications. It provides enhanced OpenStack-based cloud hosting capabilities
9 www.libelium.com/product/mysignals.10 https://www.fiware.org/.

196 S. Vitabile et al.
and a number of components for functions offered as a Service. The adoptionof FIWARE technology by the eHealth market is promoted by the industrialaccelerator FICHe project [9] launched by European Commission and severalindustrial projects that have been developed in the FICHe context. CardioWeel[6] is an advanced driver assistance system that provides information aboutdrivers health status using the human electrocardiogram (ECG) acquired fromthe drivers hands. This system is hosted on FIWARE cloud using the availablevirtual machines. The development of healthcare applications using FIWAREcomponents is described in [75] and in [19].
4 Big Medical Data Analytics for Remote HealthMonitoring
With the advance of remote health monitoring and pervasive healthcare con-cepts, an increased research work has been published to cover the topics rangingfrom theory, concepts, and systems, to applications of Big medical data systemsfor ubiquitous healthcare services.
4.1 Big Medical Data System Architecture
The analysis and health problem detection can be performed on a mobile device(phone, watch, bracelet, etc.) leveraging edge computing principles, or at anearby computing infrastructure, e.g. IoT gateway, or a home/hospital server[22].
Physiological, health and social media data, providing insight into peopleactivities and health conditions, could be enriched and correlated with exter-nal and environmental data collected within Smart City infrastructure (weatherconditions, environment pollution/noise, temperature, city events, traffic con-ditions, etc.). As such, fusion, analysis and mining of IoT medical data andexternal/environmental data could better detect potential health problems andtheir cause-effect relationships with the environment.
The fusion, processing and analytics of sensor data, collected from personalmobile and health devices, as well as Smart city infrastructure are performed atthe edge/fog computing components providing efficiency and minimal latency indetection of critical medical conditions that requires prompt actions. Also, thiscan provide a personalized health system for general well-being where individualscan be provided with healthcare tailored to their needs.
Moreover, such system should support efficient collection and analysis ofmassive quantities of heterogeneous and continuous health and activities data(Big Data) from a group, or a crowd of users. The storage, aggregation, process-ing and analysis of Big health data could be performed within public, private orhybrid cloud infrastructure. The results of data analysis and mining are providedto physicians, healthcare professionals, medical organisations, pharmaceuticalcompanies, etc. through tailored visual analytics, dashboard applications. Thereis a number of research and development challenges that must be addressed

Medical Data Processing and Analysis 197
Fig. 2. A system for remote monitoring of people health and activities - general archi-tecture
prior to wider application of such personalized healthcare systems that continu-ously monitor peoples health and activities and respond appropriately on criticalevents and conditions. These include, but are not limited to security, privacy anddata ownership, sensor data fusion, scalable algorithms and systems for analyticsand data mining, and edge-cloud models for processing and analytics.
The general architecture of a large-scale distributed system based on medicalIoT devices and Big Data processing and analytics for remote monitoring ofpeoples health and activities is given in Fig. 2.
Remote monitoring systems can operate at multiple scales, providing per-sonal and global sensing. As illustrated in [44], there are three distinct scales forsensing: personal, group and community sensing.
Personal or individual monitoring systems are designed for single individ-ual, and are often focused on personal data collection and analysis. Typicalscenarios include tracking the users exercise routines, measuring activity levelsor identification of symptoms connected with psychological disorders. Althoughcollected data might be for sole consumption of the user, sharing with medical

198 S. Vitabile et al.
professional is common. Popular personal monitoring technologies are GoogleGlassTM, FitBitTM and The Nike+ FuelBandTM.
If individuals share a common interest, concern or goal while participatingin monitoring applications they form a group. Group monitoring systems can bepopular in social networks or connected groups, where data can be shared freely,or with privacy protection. Common examples are health monitoring applica-tions including contests related to specific goals: running distance, weight loss,calorie intake, etc.
If a number of people participating in health and activities monitoring is verylarge, it is called community or crowd monitoring. Crowd modeling and moni-toring implies collective data analytics for the good of the community. However,it involves cooperation of persons who will not trust each other, highlightingthe need for strong privacy protection and possibly low commitment levels fromusers. Examples of community monitoring involve tracking the spread of diseasesacross area, finding patterns for specific medical conditions etc. The impact ofscaling to monitoring applications is to be explored, but many research issuesrelated to information sharing, data ownership, data fusion, security and privacy,algorithms used for data mining, providing useful feedback, etc. remain open.
Khan et al. in [41] presented the latest research and development efforts andachievements in the field of smart healthcare regarding high performance com-puting (HPC) and large-scale healthcare architectures, data quality and large-scale machine learning models for smart healthcare, Internet-of-Things, fog com-puting, and m-Health, as well as wearable computing, Quality of Service (QoS),and context-awareness for smart healthcare.
The challenges in designing algorithms, methods and systems for health-care analytics and applications have been examined in [45], along with a surveyon smart healthcare technologies and solutions. The next-generation healthcareapplications, services and systems related to Big healthcare data analytics arereviewed and challenges in developing such systems are discussed.
The current state and projected future directions for integration of remotehealth monitoring technologies into clinical and medicine practice have beenpresented in [31]. Several of the challenges in sensing, analytics, and visualizationthat need to be addressed before systems can be designed for seamless integrationinto clinical practice are highlighted and described.
4.2 Big IoT Data for Remote Health Monitoring
With the development of Internet of Things (IoT) concepts, the idea of IoThealthcare systems has been an interesting topic for large number of researchers.Baker et al. in [16] have presented state-of-the-art research related to wearableIoT healthcare system. A standard model for application in future IoT health-care system was proposed, along with an overview of existing challenges includ-ing security, privacy, wearability and low-power operation. Also, the authorsreviewed several research works that address IoT healthcare challenges relatedto rehabilitation, diabetes management, disease monitoring, heart-attack detec-tion and general activity and health monitoring purposes. Furthermore, a four-

Medical Data Processing and Analysis 199
part model was proposed as an aid in the development of future IoT healthcaresystems, and it includes:
– wearable sensor and central nodes,– short range communications,– long range communications,– secure cloud storage architecture and machine learning.
Islam et al. in [34] have given an overview of existing IoT–based healthcarenetwork studies, and state-of-the-art network architectures, platforms, applica-tions, and industrial trends in this area. Furthermore, they highlighted securityand privacy issues and proposed a security model aiming to minimize securityrisk related to health care. Specifically, they presented an extensive overviewof IoT healthcare systems, one of them being the Internet of m-Health Things(m-IoT): an operating symbiosis of mobile computing, medical sensors, and com-munications technologies for healthcare services.
An important part of IoT healthcare is obtaining insights from large datagenerated by IoT devices. The focus of [53] was on IoT architecture, opportu-nities and challenges, but from the data analysis point of view. In this paper abrief overview of research efforts directed toward IoT data analytics, as well asthe relationship between Big Data analytics and IoT were given. Furthermore,analytic types, methods and technologies for big IoT data mining are discussed.
In [77], authors have used smartphone and smartwatch sensors to recognizedetailed situations of people in their natural behavior. Initial tests were con-ducted over labeled data from over 300k minutes from 60 subjects. A dedicatedapplication for data retrieval was implemented and presented. As stated in thepaper, the main contribution is the emphasis on in-the-wild conditions, namelynaturally used devices, unconstrained device placement, natural environmentand natural behavioral content. The main challenge when recognizing context innon-controlled conditions is high diversity and variance of the data. However, itwas shown that everyday devices, in their natural usage, can capture informationabout a wide range of behavioral attributes.
In [57] a distributed framework based on the IoT paradigm has been pro-posed for monitoring human biomedical signals in activities involving physicalexertion. Also, a validation use case study was presented which includes mon-itoring footballers heart rates during a football match, and it was shown thatdata from BAN devices can be used to predict not only situations of suddendeath but also possible injuries.
Ma et al. in [52] have presented a Big health application system based onhealth IoT devices and Big Data. The authors presented the architecture ofhealth care application leveraging IoT and Big Data and introduced technologychallenges and possible m-health applications based on this architecture.
One important subset of the data used for healthcare and improved qualityof life are the data retrieved from healthcare services running on smarthphonessuch as Endomondo, Nike+, RunKeeper, and Runtastic. These applications canprovide data about different lifestyles, such as sleep, diet and exercise habits all of

200 S. Vitabile et al.
which can be correlated with various medical conditions. In such manner, physi-cians can calculate risk for conditions or in cases of diagnosed ones, can adapttreatments or provide emergency responses when needed. Cortes et al. in [21]have provided an extensive analysis of traces gathered from Endomondo sporttracker service. The main Big Data challenges associated with analysis of thedata retrieved from this type of applications were discussed. They include dataacquisition (data redundancy, workload, flow rate), data cleaning (invalid anduncertain data from sensors), data integration, aggregation and representation(define common data representation across various applications, spatio-temporalproperties of the data), query processing, data modeling and analysis (queriesare important aspect of knowledge discovery), and interpretation (online andoffline analysis).
The concept of smart health (s-Health), which integrates context-awaremobile health principles with sensors and information originated in smart cities,has been introduced in [74]. The authors provided a detailed overview of thesmart health principles and discussed the main research challenges and oppor-tunities in augmentation of smart healthcare with smart city concepts.
4.3 Processing and Analysis of Big Health and Mobility DataStreams
The healthcare industry generates large amounts of data, driven by record keep-ing, compliance and regulatory requirements and patient care [65]. The currenttrend is toward rapid digitalization of these massive amounts of data, and theirfusion with data retrieved from personal and mobility sensors. When it comes tohealth care in terms of patient records, treatment plans, prescription informationetc., everything needs to be done quickly, accurately and in some cases transpar-ently enough to satisfy stringent industry regulations. However, with extendeddatasets, effective data processing and analysis can uncover hidden insights thatimprove patient care. If the data is collected out of the medical offices, theycan model a patient’s behavior more accurately. Furthermore, the results can beused to provide better real-time healthcare at lower cost. Real-time componentrequires that systems for analysis and processing must deal not only with hugeamounts of data, but also with Big Data streams. This requirement has led to aproliferation of studies related to processing and analysis of big, heterogeneousstreams for healthcare purposes. These streams have all main characteristics ofBig Data:
– Volume: in order to create a complete overview of person’s or group health, itis necessary to take into account data collected from related sources, obtainednot only from medical instruments and BAN sensors, but also from socialmedia, mobile devices or machine-to-machine data. This data can be fromterabytes to exabytes, does not need to be stored, but must be effectively andanalyzed and processed in timely manner.
– Velocity: Data streams with unparalleled rate and speed are generated andmust be processed and analysed accordingly. In order to be effective, and to

Medical Data Processing and Analysis 201
provide responses in emergency situations, healthcare systems must processand analyze torrents of data in real time, but also be capable to performlong-term batch operations.
– Variety: Data comes in all varieties, from structured, numeric data obtainedfrom sensors and medical devices to unstructured text documents, email,video, audio and mobility data. Systems must be capable of processing allvarieties of data from text to graph data.
In order to effectively process and analyze Big health data streams, tech-niques for Big Data must be taken into account and adapted for data streams.Big Data in health informatics is a pool of technologies, tools, and techniquesthat manage, manipulate, and organize enormous, varied, and intricate datasetsin order to improve the quality of patients’ status. Fang et al. in [24] have givena comprehensive overview of challenges and techniques for big computationalhealth informatics, both historical and state-of-the art. Several techniques andalgorithms in machine learning were characterized and compared. Identified chal-lenges were summarized into four categories, depending on Big Data characteris-tics they tackle (i.e., volume, velocity, variety, and veracity). Furthermore, a gen-eral pipeline for healthcare data processing was proposed. This pipeline includesdata capturing, storing, sharing, analyzing, searching, and decision support.
Wang et al. in [81] have presented strategic implications of Big Data in health-care, including but not limited to historical development, architectural designand component functionalities of Big Data analytics. Different capabilities ofhealthcare data analytics were recognized from different implementation cases,and various benefits were identified. Recognized capabilities include:
– Analytical capability for patterns of care - analytical techniques typicallyused in a Big Data analytics system to process data with an immense vol-ume, variety, and velocity via unique data storage, management, analysis,and visualization technologies.
– Unstructured data analytical capability - unstructured and semi-structureddata in healthcare refer to information that can neither be stored in a tradi-tional relational database nor fit into predefined data models.
– Decision support capability - the ability to produce reports about dailyhealthcare services to aid managers’ decisions and actions.
– Predictive capability - ability to build and assess a model aimed at generat-ing accurate predictions of new observations, where new can be interpretedtemporally and or cross-sectionally.
– Traceability - ability to track output data from all the system’s IT componentsthroughout the organization’s service units.
As a result, the best practice for Big Data analytics architecture has been pro-posed. This architecture loosely consists of five main architectural layers: data,data aggregation, analytics, information exploration, and data governance. Maet al. in [51] have underlined the importance of data fusion based approach toprovide more valuable personal and group services, such as personalized healthguidance and public health warnings. Various technologies and areas that are

202 S. Vitabile et al.
related to this topic were covered, including mobile, wearable and cloud com-puting, Big Data, IoT and Cyber Physical systems. Authors proposed cloud- andbig-data-assisted layered architecture, and described each layer along with toolsand technologies that can be used. Also, different applications were identifiedrelated to medical recommendations and wearable healthcare systems.
4.4 High Performance Data Analytics
Efficient analytics of large amounts of data in health care (such as, patientgenomic data or X-ray images) demands computational, communication andmemory resources of High Performance Computing (HPC) architectures.
HPC involves the use of many interconnected processing elements to reducethe time to solution of given a problem. Many powerful HPC systems are het-erogeneous, in the sense that they combine general-purpose CPUs with accelera-tors such as, Graphics Processing Units (GPUs), or Field Programmable GatesArrays (FPGAs). For instance ORNL’s Summit—which is currently credited asthe leading HPC system in the TOP500 list of most powerful computer systems[76]—is equipped with 4608 computing nodes and each node comprises two IBMPower9 22-core CPUs and six NVIDIA V100 GPUs, for a theoretical peak powerof approximately 200 petaflops.
Many approaches have proposed for using HPC systems [18,39,56,60]. Whilemulti-core CPUs are suitable for general-purpose tasks, many-core processors(such as the Intel Xeon Phi [20] or GPU [58]) comprise a larger number of lowerfrequency cores and perform well on scalable applications [54] (such as, DNAsequence analysis [55] or deep learning [79]).
5 Medical Data Analytics: Research Challengesand Opportunities
5.1 Adaptive Edge/Cloud Processing and Analytics
In the context of medical IoT, the particular benefits could arise from the fogand edge computing paradigms. They represent the model where sensitive datagenerated by body worn medical devices and smart phone sensors are processed,analyzed and mined close to where it is generated, on these devices themselves,instead of sending vast amounts of sensor data to the cloud, that could exhaustnetwork, processing or storage resources and violate user privacy. Only aggre-gated, context enriched data/events are sent to the cloud for further process-ing and analytics. The right balance between Edge-Cloud should provide fastresponse to detected events, as well as conservation of network bandwidth, min-imization of latency, security and preservation of privacy.
Typically, Internet of Things (IoT) is composed of small, resource constraineddevices that are connected to the Internet. In essence, they are dedicated toperform specific tasks without the need of providing a general means for per-forming complicated, resource-consuming computations. This means that most

Medical Data Processing and Analysis 203
of the data is transmitted to the cloud without prepossessing or analysis. Thisimplies that the amount of data that is transmitted to the cloud is increasingeven more rapidly than the number of IoT devices itself. Indeed, cloud comput-ing is being recognized as a success factor for IoT, providing ubiquity, reliability,high-performance and scalability. However, IoT solutions based on cloud com-puting fail in applications that require very low and predictable latency or areimplemented in a geographically distributed manner with a lot of wireless links.A promising technology to tackle the low-latency and geographical distributionrequired by IoT devices is fog computing.
The fog computing layer is an intermediate layer between the edge of thenetwork and the cloud layer. The fog computing layer extends the computationparadigm geographically providing local computing and storage for local services.Fog computing does not outsource cloud computing. It aims to provide a com-puting and storage platform physically closer to the end nodes provisioning newbreed of applications and services with an efficient interplay with the cloud layer.The expected benefit is a better quality of service for applications that requirelow latency. Lower latency is obtained by performing data analysis already at thefog computing layer. Data analysis at the fog computing layer is lightweight, andtherefore more advanced analyses and processing should be done at the cloudlayer. Naturally, some applications do not require real-time computation, or theyneed high processing power, and therefore they are performed at the cloud layer.For example, in the case of a smart community, where homes in a neighborhoodare connected to provide community services, low latency is expected for makingurgent decisions, and thus computation is performed within the neighborhood,instead of a cloud layer which can be located on another continent [33].
5.2 Virtualisation Technologies in e-Health
To support multi-tenancy of different applications and to achieve elasticity inlarge-scale shared resources, fog computing takes advantages of virtualizationtechnologies. Virtualization and application partitioning techniques are the twokey technology solutions that are employed in a fog computing platform. Vir-tualization includes the process of abstracting and slicing the heterogeneouscomputing nodes into virtual machines (VMs), hiding the details about the het-erogeneity of hardware devices from the applications that are running on the foglayer. Among different virtualization technologies, Linux containers, i.e., con-tainerization, has advantages in short implementation time, efficient resourceutilization and low management cost. Application partitioning divides each taskinto smaller sub-tasks to be executed concurrently on distributed grids, whichcan improve the task offloading efficiency of applications when the node is over-loaded by computationally intensive applications.
Containers provide OS level virtualization without a need for deployment ofa virtual OS. Hence, they are lightweight and significantly smaller in size thanVMs. Containers provide a self-contained and isolated computing environmentfor applications and facilitate lightweight portability and interoperability for IoT

204 S. Vitabile et al.
applications. Moreover, data and resource isolation in containers offers improvedsecurity for the applications running in fog nodes [17].
Recently, researchers have shown increased interest in studying and deployingcontainer-based healthcare applications. Kaceniauskas et al. [37] have developeda software to simulate blood flows through aortic valves, as a cloud service. Theyhave experimentally evaluated the performance of XEN VMs, KVM VMs andDocker containers and have found that Docker containers outperform KVM andXEN VMs. In [35] a framework to monitor patients symptoms has been proposed.This solution employs a Raspberry Pi that read the medical data through thesensors attached and sent it to a server. The server is running Docker containers.
A home-based healthcare framework has been proposed by Li et al. [47].Different sensors send streams of medical data to docker containers for process-ing. Koliogeorgi et al. [42] has presented the cloud infrastructure of the AEGLEproject, which integrates cloud technologies and heterogeneous reconfigurablecomputing in large scale healthcare system for Big Bio-Data analytics. AEGLEruns each service and library in different Docker containers. It also uses Kuber-netes for fault tolerant, management and scaling of the containerized applica-tions.
A conceptual model and minimal viable product implementation, thatenables the analyses of genomic data, harvested by a portable genome sequencerusing mobile devices, has been proposed by Araujo et al. [14]. They have usedDocker to process the data and to ensure that their system will work across dif-ferent devices and operating systems. Moreover they would like to prepare theDocker image available for mobile phones. In this way, it will be possible to runtheir system containers on mobile phones. Rassias et al. [66] has introduced aweb-based platform for real-time teleconsultation services on medical imaging.Their platform consists of a client application and an ecosystem of microservices.Each system’s service is running in Docker container.
Bahrami et al. [15] has proposed a method to better protect sensitive data.Their method provides real-time resource recommendation for a container sched-uler according to HIPAA’s (Health Insurance Portability and AccountabilityAct) regulations. Finally, a recent paper by Sahoo et al. [70] presents a faulttolerant scheduling framework for distribution of healthcare jobs based on theirtypes. They have evaluated the framework with both hypervisor-based virtual-ization and container-based virtualization. Containers achieved faster start-uptime and less response time for both CPU-intensive and data-intensive task.
6 Case Studies and Practical Solutions
6.1 Big Data Solution for Remote Health Monitoring
Taking into account all the challenges related to health/activities monitoringdata and control flows that should be employed in a public, private or hybridcloud, we have designed Remote Health Monitoring system architecture and haveimplemented the system tailored to analysis of mobility data for the purposes

Medical Data Processing and Analysis 205
Fig. 3. The general architecture of remote health monitoring cloud infrastructure
of healthcare. The general architecture of Remote Health Monitoring system isgiven in Fig. 3.
To provide collection of massive and fast sensor data streams, a distributedmessage broker is employed that maintain a set of topics, for different usersor medical conditions, where different sensor data and events will be streamed.These topics would be monitored by number of processing and analytics jobswithin Big Data stream engine. Each job acquires only the data from the topicsof interest, so different jobs are used to identify specific medical condition andpatient behaviour. This architecture could be applied to both personalized andgroup healthcare systems. The main advantages are:
– Data decoupling: every measurement is streamed as a separate record to apredefined topic, so occurrence of missing data in records is easily detectable:they are absent from the topic; if data from certain sensors is missing, it canbe easily left out.
– The separation at jobs level: jobs can monitor only a subset of topics; providesa perfect ground for implementation of different privacy protocols for eachjob.
– The user level separation: this model allows both personal and collectiveanalysis as jobs can monitor data on individual, or a group level.
– Comprehensive visualization: the results from each jobs can be visualizedseparately, which can simplify the visualization itself; however, alerts andnotifications from different jobs can be combined and visualized to providean insight to general state.
Big health data stream processing and analysis currently relies on systems formassive stream analytics. A comparative analysis of the existing state-of-the artstream processing solutions is presented in [72], including both open source solu-tions such as Storm, Spark Streaming and S4, and commercial streaming solu-tions such as Amazon Kinesis and IBM Infosphere Stream. Comparison includesprocessing model and latency, data pipeline, fault tolerance and data guarantees.These and similar solutions can be used in healthcare use cases.
206 S. Vitabile et al.
For the implementation of prototype system Apache Kafka11 and ApacheSpark Streaming12 have been used. Kafka is chosen as it can support differ-ent topics, and messaging capabilities necessary for handling Big Data streams.Apache Spark Streaming is selected because of its main paradigm which impliesthat stream data is treated as series of bounded batch data, a technique calledmicro batching, and for its machine learning library MLlib. We do not use amobile health application for data collection, but we created a simulation of mul-tiple users based on pre-recorded personal health/activities data used for stream-ing such data to the system. Each users simulation component reads a file thatcontains different records in csv format, and publishes them to adequate Kafkatopic. Actual data have been obtained from UbiqLog [68] and CrowdSignals [82]datasets. These datasets contain information retrieved from smartphones andsmart bracelets, such as a heart rate, step count, accelerometer and gyroscopedata, location, application usage and WiFi. A distinct record is generated forevery measurement or event, and it contains user id, topic, and value. Id is usedto separate different users, topic to identify type of measurement or event, andvalue to hold actual data. For each type of record there is a predefined Kafkatopic. These topic streams are monitored by a number of Apache Spark Stream-ing jobs. Each job acquires the data from monitored topics, and performs specifichealth and activities related analysis. We implemented a demo job for predic-tion of skin temperature based on heart rate and step count values. Firstly, inoffline mode we created a regression model for these parameters. Then, in SparkStreaming job, we loaded that model, and generated alert in the form of consolenotification if predicted temperature is higher than the predefined threshold.This illustrates that the system can be used for complex event processing. Ourvision is to create jobs that can detect complex events, extrapolate valuableinformation, and run spatio-temporal mining algorithms on available data. Fur-thermore, visualization and alert generating component of the system will beimplemented.
6.2 Smartphone Ad Hoc Network (SPAN) for e-Health Application
Practical Scenario. In this section, we propose a system designed to supportdistributed monitoring of trip participants’ health. Let’s assume that there isa travel agency which organizes the climbing in a high mountains, e.g. Kili-manjaro. As the agency makes reasonable policy, they equip the guide and theparticipants with sensors that measure health parameters (heart rate, pressure,body temperature, etc.) in order to monitor the people’s health.
The guide-leader is equipped with a satellite mobile phone and can exchangeinformation with the agency and rescue teams. The communication between theguide and the participants is organized in ad hoc manner using Bluetooth. Eachparticipant is equipped with a smartphone and the health sensor. The sensor isconnected to the smartphone by Bluetooth Low Energy.
11 kafka.apache.org.12 spark.apache.org/streaming/.

Medical Data Processing and Analysis 207
Technology. One of the trends observed recently in the global telecommunica-tions is a constant growth of the number of smart devices. Mobile devices aregetting richer in functionality thanks to more and more computing resources,better batteries and more advanced embedded equipment (e.g. sensors, cameras,localization modules). An important parts of each mobile device are the wirelesscommunication interfaces (e.g. WiFi, Bluetooth), which are used to exchangedata between the mobile device and peripheral devices (e.g. headphones, hands-free system, etc.) or other mobile devices. Thanks to the wireless communicationit is also possible to integrate smartphones with external sensors.
Thus Sikora et al. [71] decided to create the SmartGroup@Net (SGN) mobileapplication which allows on direct communication between people without thenecessity to be in a range of cellular network infrastructure. The communicationis realized over Bluetooth Low Energy (BLE) to create mobile network allowinglocal exchange of messages, which contain selected information about the state ofthe network nodes. This is an example of Smart Phone Ad hoc Network (SPAN)solution13. In the considered test study the Polar H7 Bluetooth Smart 4.0 heartrate sensor and Wiko Sunny phones are used – see Fig. 4.
Fig. 4. A smartphone with SGN application running together with Polar H7 heart ratesensor.
Mobile Application. SmartGroup@Net (SGN) is the mobile application,which allows on supporting outdoor search actions performed by group of people.The application is useful for different public services, that could be supportedduring rescue action by civilian volunteers equipped with mobile phones. Otherpotential applications of SGN include: increasing safety of people moving in
13 SPAN network can be formed by portable devices (e.g. smartphones, tablets, etc.)which communicate over WiFi or Bluetooth and operate in ad-hoc mode. The mainadvantage of the SPAN network is independence not only from the network operator,but also from the tariff plan – the communication in an ad-hoc mode is free of charges.

208 S. Vitabile et al.
Fig. 5. An example of the SGN application user screen with buttons and fields descrip-tion
groups in areas with limited access to the mobile network – like high mountainsclimbing, coordination and management of rescue actions in a crisis situationarea (e.g. earthquake, plane crash etc.) and other coordinated actions involvingsensors carried by people or self-propelled devices. In all mentioned scenarios itis important to maintain a proper group formation and topology.
An exemplary screen of the SGN application is shown in Fig. 5. Informationabout the current location and the destination of the mobile phone user as wellas the locations of other participants of the action are presented on the mapdownloaded online from the Open Street Map service14 and stored in the cacheor installed in the offline mode as image file.
The presented application uses the BLE protocol for local exchange of infor-mation between the participants of the action. The information sent by eachparticipant include his identification data (action number, user’s name and id),location (geographical coordinates), status (normal or emergency), heart rate.These data are saved in the broadcast packet, encrypted and sent to other usersdepending on the radio transmission range. Each of the participants of the actioncan simultaneously broadcast messages with their own data and listen to mes-sages from the other group members. Thus the leader (guide) can obtain theinformation about health status of the participants. Depending on the situationappropriate preventive measures can be taken.
14 http://www.openstreetmap.org.

Medical Data Processing and Analysis 209
6.3 Machine Learning for Monitoring Daily Living Activitiesof People with Dementia
Dementia is a very complex condition affecting the mental health of people andhaving a negative impact upon their daily life, independence and abilities. Thecurrent statistics show that dementia has a rapid spread worldwide as each yeararound 10 million new cases are reported [7]. Moreover, it is estimated that since2016, dementia has become the 5th cause of deaths worldwide [12]. Even if thereis no cure for dementia, the lives of people with dementia could be improved bydetecting and treating challenging behavioural and psychological symptoms [7].In this context, our vision is to leverage on novel Big Data ICT technologies andMachine Learning (ML) algorithms to analyze the daily living activities of thepeople with dementia aiming to determine anomalies in the pattern of their dailyliving activities. Such patterns might be analyzed by medical experts or profes-sional caregivers to take actions to improve patients overall health. For example,the anomalies found in the daily living activities of people with dementia couldhelp medical experts in differentiating between health decline symptoms intro-duced by dementia and health decline symptoms generated by the side effectsof the prescribed medications and their interactions (i.e. polypharmacy side-effects). This would allow medical experts to better evaluate the health statusof a patient and better adjust its medication plan.
This section proposes a system designed based on the Lambda architecturefor the real-time analysis of daily living activities of people with dementia usingmachine learning algorithms. The system collects data about the daily livingactivities patterns of the monitored persons using a set of Raspberry Pi’s thatare installed in the house of the monitored person. The collected data is sent toa Big Data platform where machine learning algorithms are applied to identifyanomalies in the behavior of people with dementia. The proposed system hasbeen implemented in the context of the MEDGUIDE project [10] which is aninnovative Ambient Assisted Living (AAL) project that aims to provide solutionsfor supporting the well-being of people with dementia and their caregivers.
Challenges of ML for Heterogeneous Data Streams. ML for data streamsis a subclass of the machine learning domain in which the analyzed data isgenerated in real-time. In [46] several challenges that might appear when ML isapplied on heterogeneous distributed data streams are identified: (a) the inputdata is generated by many sources, (b) the data formats are both structuredand unstructured, (c) the streaming data has a high speed, (d) the data isnot completely available for processing (in some cases), (e) the data might benoisy, characterized by missing values and of poor quality. Moreover several MLalgorithms must be adapted to larger datasets because they were designed forsmaller sets of data and the samples usually have many features because thedata is monitored by a big number of sensors. According to [64] several criticalissues that must be considered when analyzing real time data streams are: dataincompleteness, data streams heterogeneity, high speed of data streams and datalarge scale.

210 S. Vitabile et al.
In [78] two major approaches for data streams processing are presented. Inthe first approach the in-memory persists only a small part of the elements whichcharacterize the entire data stream while in the second approach fixed lengthwindows are used. In the second approach a selection of fixed parts of data areloaded temporarily into a memory buffer and the ML algorithms take as inputthe data from that memory buffer.
The authors of [30] identify another major challenge that might exist when theML algorithms are applied on data streams: in many cases the speed of the under-lying ML algorithm is much slower than the speed of the coming data. A possiblesolution for this challenge is to skip some of the instances from the data stream.However, in that case the outcome might be negative if the instances that areskipped contain insightful information. In [80] two steps that are typically appliedfor predictive analytics and for prescriptive analytics are presented. The first stepis the analytic model building – in which the analytic model is generated by tryingout different approaches iteratively. The second step is dedicated to the analyticmodel validation – when the model is tested on different datasets and improvedeither by changing the configurable parameters or the complete algorithm.
The Experimental Platform. Our system design is based on Lambda archi-tecture and that can be used for the real-time analysis of the daily living activitiesof the people that have dementia using different ML algorithms.
Fig. 6. System for analyzing daily living activities of people with dementia using MLalgorithms
Figure 6 presents the high-level architecture of a system that is used forthe analysis of the daily living activities of people with dementia. The systemapplies ML algorithms to detect anomalies in the daily living activities patternsof the monitored patients that might require special attention from a specializedhealthcare professional.

Medical Data Processing and Analysis 211
The system collects data about the daily living activities patterns of themonitored persons using a set of Raspberry Pi’s that are installed in the houseof the monitored person. The Raspberry Pi’s collect information about differenttypes of activities such as sleeping, feeding, hygiene, indoor activities and out-door activities. The number of times that the elder goes to the toilet and thewandering behavior during night can be used as indicatives of different stagesof dementia. The caregiver being notified that the monitored patient presentsanomalous behavior with respect to the regular pattern of activities may takepreventive actions as to minimize the effects of dementia.
The data collected by the Raspberry Pi’s is sent in the form of AVRO mes-sages to a Big Data platform created using the following technologies: ApacheZookeeper [5], Apache Kafka [3], Apache Spark [4] and Apache Cassandra [2].Zookeeper is a server that manages the coordination of tasks for the nodes of thedistributed system that is used for the processing of the streaming data. Kafkais a streaming platform that handles the real-time data. The data comes in theform of AVRO messages and is inserted in the system through the Kafka RESTserver. The Kafka REST server uses an AVRO schema that is persisted in theSchema Registry server to get the information from the messages. The AVROschema imposes a set of restrictions on the messages such as the number of fieldsand the data types of the fields. The data is then processed in an implementationof a Lambda architecture.
Kafka Connect is a server that takes the messages from the Kafka topics andinserts them in Cassandra. In the case of batch processing the entire data storedin the database is used as training data for the classification algorithms that areused for the prediction of the daily living activities of the people with dementia,while in the case of stream processing only the last streaming information isconsidered. The function in the case of Lambda architecture is represented bythe ML algorithm that is used for the prediction of the daily living activities.In the case of stream processing, it is unfeasible to retrain the ML algorithmeach time new streaming data comes into the system because this process wouldtake too much time compared to the time in which the prediction should bemade. Considering this time restriction, depending on the size of the streamingdata, the ML algorithms should be retrained at a frequency of several minutesor several hours.
The predicted data can then be sent to the caregivers or to the healthcareprofessionals using a healthcare application created with Spring and Angular.Spring is used for back-end and for the communication with Apache Cassandraand also for retrieving the data generated by the monitoring sensors and theresults obtained after the application of the ML algorithms. Spring is also usedfor sending notifications to the caregivers if corrective measures must be taken.Angular is a JavaScript framework that is used for the creation of the front-end side. By using the healthcare system the caregivers should be able to seedata analytics, to detect anomalies in the daily living activities of the monitoredpersons and should also be able to take immediate actions when they are notified.

212 S. Vitabile et al.
Detecting the Side-Effects of Polypharmacy upon the Daily LifeActivities of People with Dementia Using Machine LearningAlgorithms. This section presents how we have used the previously describedexperimental platform in the context of detecting the deviations in the daily lifeactivities, and their polypharmacy-related causes, of people with dementia usingML algorithms. We have chosen to focus on polypharmacy as it represents oneof the main challenges in the treatment of dementia affecting over 21% of theelders with dementia. In particular, the Random Forest Classification algorithmhas been used for detecting the deviations of the daily life activities from thepatients’ baseline routine, while the k-Means clustering algorithm has been usedfor correlating these deviations with the side-effects of drug-drug interactions.The two ML algorithms have been implemented using two Spark jobs.
Concepts Definitions. In our approach, a day containing monitored activities isdefined as:
day = (duration(a1), duration(a2), . . . duration(an)) (1)
where duration(ai) represents the total duration in hours of the activity aiwhile n is the number of total activities considered. In our approach, wehave considered the following five types of daily life activities as significantenough for allowing the detection of polypharmacy side effects: a1 = sleeping,a2 = feeding, a3 = toilet hygiene, a4 = functional mobility and a5 = communitymobility. Table 1 presents an example with information provided by sensorsregarding the activities performed by a patient with dementia during January2nd, 2018.
Table 1. Information provided from sensors regarding the activities performed by apatient with dementia during a day
Start time End time Activity
2018.01.02 00:00:00 2018.01.02 7:00:00 Sleeping
2018.01.02 7:00:00 2018.01.02 7:30:00 Toilet hygiene
2018.01.02 7:30:00 2018.01.02 8:00:00 Feeding
2018.01.02 8:00:00 2018.01.02 12:00:00 Functional mobility
2018.01.02 12:00:00 2018.01.02 13:30:00 Sleeping
2018.01.02 13:30:00 2018.01.02 14:00:00 Feeding
2018.01.02 14:00:00 2018.01.02 16:00:00 Community mobility
2018.01.02 16:00:00 2018.01.02 18:00:00 Functional mobility
2018.01.02 18:00:00 2018.01.02 18:30:00 Feeding
2018.01.02 18:30:00 2018.01.02 19:00:00 Toilet hygiene
2018.01.02 19:00:00 2018.01.02 21:00:00 Functional mobility
2018.01.02 21:00:00 2018.01.02 23:59:59 Sleeping

Medical Data Processing and Analysis 213
The representation of the day January 2nd, 2018 according to (1) isday = (10.5, 1.5, 1, 8, 2).
The baseline for a patient with dementia is a day when the patient has atypical behavior and it is represented similar to the representation of a day (see(1)). In our approach, the baseline for each monitored patient is defined by thedoctor based on discussions with the patient, its family and caregivers.
We consider that a monitored day is a deviated day if it contains at least oneactivity which has the total duration higher or lower than a pre-defined thresholdcompared to the same activity type in the baseline. A deviated day may beassociated with a semantic annotation consisting of a drug-drug interaction andan associated side-effect. The information regarding dementia drugs, drug-druginteractions and associated side-effects are stored as instances in a PolypharmacyManagement Ontology we have designed. This ontology is a simplified versionof the Drug-Drug Interactions Ontology (DINTO) [83] enhanced with drugs sideeffects taken from [1].
Classifying a Day as Normal or as Having Significant Deviations from the Base-line Using the Random Forest Classification Algorithm. To classify a day asnormal or as having significant deviations from the baseline we have used theRandom Forest algorithm suitable for Big Data classification provided by ApacheSpark [11]. We have trained the Random Forest classification algorithm using adata set consisting of days labeled as having or not having a significant deviationfrom the normal baseline.
In the testing phase, a set of new monitored days is classified, based on thedata set used in the training phase, as having/not having a deviation from thebaseline.
Identifying the Causes that Produced the Deviation of a Day from the Baseline.To identify the causes which led to a deviation in the daily life activities of apatient with dementia we have defined a k-Means clustering method consistingof two steps:
1. Cluster the deviated days. The Spark MLlib implementation of the K-Meansclustering algorithm [11] has been applied on a set of deviated days, eachday being annotated with a drug-drug interaction and a side-effect causingthe deviation. Each cluster will contain similar annotated days and will belabeled with the annotation (i.e. drug-drug interaction and its adverse effect)of the cluster’s centroid.
2. Assign a new deviated day to a cluster resulted in the previous step. A newdeviated day will be assigned to the cluster for which the Euclidean distancebetween that day and the cluster’s centroid is minimum. Consequently, thedeviated day will be annotated with the drug-drug interaction and its adverseeffect corresponding to the assigned cluster’s centroid.
Figure 7 presents the resources and the data flows for detecting the side-effects of polypharmacy upon the daily life activities of people with dementiausing the Random Forrest Classifier and the k-Means Clustering Method.

214 S. Vitabile et al.
Fig. 7. The resources and the data flows for detecting the side-effects of polypharmacyupon the daily life activities of people with dementia
7 Summary
Health informatics is already an established scientific field and advances ofe-health and m-health are already part of clinical practices of the XXI cen-tury medicine. Digital medicine enables optimization of decision-making pro-cesses and precise/personal medicine through the possibility of analyzing a hugeamount of data at low cost. The computer assisted decision-making tools maybe more efficient and safer than “analog” approaches that involve a physician.
In this chapter we have described (1) data collection, fusion, ownership andprivacy issues; (2) models, technologies and solutions for medical data processingand analysis; (3) big medical data analytics for remote health monitoring; (4)research challenges and opportunities in medical data analytics; (5) three casestudies. The first case study described a Big Data solution for remote healthmonitoring that considers challenges pertaining to monitoring the health andactivities of patients. The second case study described a system designed tosupport distributed monitoring of human health during a trip. The third casestudy described the use of machine learning in the context of monitoring dailyliving activities of people with dementia.
References
1. https://www.drugs.com/2. Apache Cassandra. http://cassandra.apache.org/3. Apache Kafka: A distributed streaming platform. https://kafka.apache.org/

Medical Data Processing and Analysis 215
4. Apache Spark: Lightning-fast cluster computing. http://spark.apache.org/5. Apache Zookeeper. https://zookeeper.apache.org/6. CardioWheel. https://www.cardio-id.com/cardiowheel7. Dementia. https://www.who.int/en/news-room/fact-sheets/detail/dementia8. FIWARE. https://www.fiware.org/9. FIWARE Accelerator Programme: FICHe project. https://www.f6s.com/fiche
10. ICT integrated system for coordinated polypharmacy management in elders withdementia. https://dsrl.coned.utcluj.ro/medguide/
11. Machine learning library (MLlib) guide. https://spark.apache.org/docs/latest/ml-guide.html
12. The top 10 causes of death. https://www.who.int/news-room/fact-sheets/detail/the-top-10-causes-of-death
13. Akbar, A., et al.: Real-time probabilistic data fusion for large-scale IoT appli-cations. IEEE Access 6, 10015–10027 (2018). https://doi.org/10.1109/ACCESS.2018.2804623
14. Araujo, R., Kim, A., Crisan, A.: EpiMobile: pathogen point of care diagnosis andglobal surveillance using mobile devices (2017)
15. Bahrami, M., Malvankar, A., Budhraja, K.K., Kundu, C., Singhal, M., Kundu, A.:Compliance-aware provisioning of containers on cloud. In: 2017 IEEE 10th Inter-national Conference on Cloud Computing (CLOUD), pp. 696–700. IEEE (2017)
16. Baker, S.B., Xiang, W., Atkinson, I.: Internet of Things for smart healthcare:technologies, challenges, and opportunities. IEEE Access 5, 26521–26544 (2017).https://doi.org/10.1109/ACCESS.2017.2775180
17. Bellavista, P., Zanni, A.: Feasibility of fog computing deployment based on Dockercontainerization over RaspberryPi. In: Proceedings of the 18th International Con-ference on Distributed Computing and Networking, ICDCN 2017, pp. 16:1–16:10.ACM, New York (2017)
18. Benkner, S., et al.: PEPPHER: efficient and productive usage of hybrid computingsystems. IEEE Micro 31(5), 28–41 (2011). https://doi.org/10.1109/MM.2011.67
19. Celesti, A., et al.: How to develop IoT cloud e-health systems based on FIWARE:a lesson learnt. J. Sens. Actuator Netw. 8(1), 7 (2019)
20. Chrysos, G.: Intel R© Xeon Phi Coprocessor-the Architecture. Intel Whitepaper(2014)
21. Cortes, R., Bonnaire, X., Marin, O., Sens, P.: Stream processing of healthcaresensor data: studying user traces to identify challenges from a big data perspective.Procedia Comput. Sci. 52, 1004–1009 (2015)
22. Dubey, H., et al.: Fog computing in medical Internet-of-Things: architecture, imple-mentation, and applications. In: Khan, S.U., Zomaya, A.Y., Abbas, A. (eds.) Hand-book of Large-Scale Distributed Computing in Smart Healthcare. SCC, pp. 281–321. Springer, Cham (2017). https://doi.org/10.1007/978-3-319-58280-1 11
23. Esteban, A.P., Patricio, M.A., Garcıa, J., Molina, J.M.: A feature selection app-roach to the group behavior recognition issue using static context information.IJDSN 9 (2013). https://doi.org/10.1155/2013/383906
24. Fang, R., Pouyanfar, S., Yang, Y., Chen, S.C., Iyengar, S.S.: Computational healthinformatics in the big data age: a survey. ACM Comput. Surv. 49(1), 12:1–12:36(2016). https://doi.org/10.1145/2932707. http://doi.acm.org/10.1145/2932707
25. Fisher, D.K., Fletcher, R.S., Anapalli, S.S., Pringle III, H.: Development of anopen-source cloud-connected sensor-monitoring platform. Adv. Internet Things8(01), 1 (2017)

216 S. Vitabile et al.
26. Garcia, A.C.B., Vivacqua, A.S., Pi, N.S., Martı, L., Molina, J.M.: Crowd-basedambient assisted living to monitor the elderly’s health outdoors. IEEE Softw. 34(6),53–57 (2017). https://doi.org/10.1109/MS.2017.4121217
27. Gil, G.B., de Jesus, A.B., Molina, J.M.: InContexto: multisensor architecture toobtain people context from smartphones. IJDSN 8 (2012). https://doi.org/10.1155/2012/758789
28. Gomez-Romero, J., Serrano, M.A., Garcıa, J., Molina, J.M., Rogova, G.L.:Context-based multi-level information fusion for harbor surveillance. Inf. Fusion21, 173–186 (2015). https://doi.org/10.1016/j.inffus.2014.01.011
29. Gomez-Romero, J., Serrano, M.A., Patricio, M.A., Garcıa, J., Molina, J.M.:Context-based scene recognition from visual data in smarthomes: an informationfusion approach. Pers. Ubiquit. Comput. 16(7), 835–857 (2012). https://doi.org/10.1007/s00779-011-0450-9
30. Hapfelmeier, A., Mertes, C., Schmidt, J., Kramer, S.: Towards real-time machinelearning. In: Proceedings of the ECML PKDD 2012 Workshop on Instant Interac-tive Data Mining (2012)
31. Hassanalieragh, M., et al.: Health monitoring and management using Internet-of-Things (IoT) sensing with cloud-based processing: opportunities and challenges.In: 2015 IEEE International Conference on Services Computing, pp. 285–292, June2015. https://doi.org/10.1109/SCC.2015.47
32. Herrero, J.G., Patricio, M.A., Molina, J.M., Cardoso, L.A.: Contextual and humanfactors in information fusion. In: Human Systems Integration to Enhance MaritimeDomain Awareness for Port/Harbour Security, pp. 79–92 (2010). https://doi.org/10.3233/978-1-60750-621-8-79
33. Hosseinpour, F., Meng, Y., Westerlund, T., Plosila, J., Liu, R., Tenhunen, H.: Areview on fog computing systems. Int. J. Adv. Comput. Technol. 8, 48–61 (2016)
34. Islam, S.M.R., Kwak, D., Kabir, M.H., Hossain, M., Kwak, K.: The Internet ofThings for health care: a comprehensive survey. IEEE Access 3, 678–708 (2015).https://doi.org/10.1109/ACCESS.2015.2437951
35. Jaiswal, K., Sobhanayak, S., Mohanta, B.K., Jena, D.: IoT-cloud based frame-work for patient’s data collection in smart healthcare system using Raspberry-Pi.In: 2017 International Conference on Electrical and Computing Technologies andApplications (ICECTA), pp. 1–4, November 2017
36. Jarynowski, A., Marchewka, D., Buda, A.: Internet-assisted risk assessment ofinfectious diseases in women sexual and reproductive health. E-methodology, pp.135–144 (2017)
37. Kaceniauskas, A., Pacevic, R., Starikovicius, V., Maknickas, A., Staskuniene, M.,Davidavicius, G.: Development of cloud services for patient-specific simulations ofblood flows through aortic valves. Adv. Eng. Softw. 103, 57–64 (2017)
38. Kamar, I., Chatterjee, P., Hamie, A.: Internet of Things in learning systems-aperspective of platforms. Int. J. Adv. Res. Comput. Sci. 7(2), 52–59 (2016)
39. Kessler, C., et al.: Programmability and performance portability aspects of het-erogeneous multi-/manycore systems. In: Design, Automation and Test in EuropeConference and Exhibition (DATE), pp. 1403–1408. IEEE (2012)
40. Khaleghi, B., Khamis, A.M., Karray, F., Razavi, S.N.: Multisensor data fusion: areview of the state-of-the-art. Inf. Fusion 14(1), 28–44 (2013). https://doi.org/10.1016/j.inffus.2011.08.001
41. Khan, S.U., Zomaya, A.Y., Abbas, A. (eds.): Handbook of Large-Scale DistributedComputing in Smart Healthcare. SCC. Springer, Cham (2017). https://doi.org/10.1007/978-3-319-58280-1

Medical Data Processing and Analysis 217
42. Koliogeorgi, K., et al.: AEGLE’s cloud infrastructure for resource monitoring andcontainerized accelerated analytics. In: 2017 IEEE Computer Society Annual Sym-posium on VLSI (ISVLSI), pp. 362–367. IEEE (2017)
43. La Ode Hasnuddin, S.S., Abidin, M.S.: Internet of Things for early detection oflanslides. In: Prosiding Seminar Nasional Riset Kuantitatif Terapan 2017, vol. 1(2018)
44. Lane, N.D., Miluzzo, E., Lu, H., Peebles, D., Choudhury, T., Campbell, A.T.:A survey of mobile phone sensing. IEEE Commun. Mag. 48(9), 140–150 (2010).https://doi.org/10.1109/MCOM.2010.5560598
45. Lee, C., et al.: Big healthcare data analytics: challenges and applications. In: Khan,S.U., Zomaya, A.Y., Abbas, A. (eds.) Handbook of Large-Scale Distributed Com-puting in Smart Healthcare. SCC, pp. 11–41. Springer, Cham (2017). https://doi.org/10.1007/978-3-319-58280-1 2
46. L’Heureux, A., Grolinger, K., Elyamany, H.F., Capretz, M.A.M.:Machine learning with big data: challenges and approaches. IEEE Access5, 7776–7797 (2017). https://doi.org/10.1109/ACCESS.2017.2696365.https://ieeexplore.ieee.org/document/7906512
47. Li, P., Xu, C., Luo, Y., Cao, Y., Mathew, J., Ma, Y.: CareNet: building a securesoftware-defined infrastructure for home-based healthcare. In: Proceedings of theACM International Workshop on Security in Software Defined Networks & #38;Network Function Virtualization, SDN-NFVSec 2017, pp. 69–72. ACM, New York(2017)
48. Likotiko, E., Petrov, D., Mwangoka, J., Hilleringmann, U.: Real time solid wastemonitoring using cloud and sensors technologies. Online J. Sci. Technol. 8(1), 106–116 (2018)
49. Llinas, J.: Information fusion process design issues for hard and soft information:developing an initial prototype. In: Yager, R.R., Reformat, M.Z., Alajlan, N. (eds.)Intelligent Methods for Cyber Warfare. SCI, vol. 563, pp. 129–149. Springer, Cham(2015). https://doi.org/10.1007/978-3-319-08624-8 6
50. Lopez, J.M.M., Herrero, J.G., Rodrıguez, F.J.J., Corredera, J.R.C.: Cooperativemanagement of a net of intelligent surveillance agent sensor. Int. J. Intell. Syst.18(3), 279–307 (2003). https://doi.org/10.1002/int.10089
51. Ma, X., Wang, Z., Zhou, S., Wen, H., Zhang, Y.: Intelligent healthcare systemsassisted by data analytics and mobile computing. Wirel. Commun. Mob. Comput.2018, 16 (2018). Article ID 3928080
52. Ma, Y., Wang, Y., Yang, J., Miao, Y., Li, W.: Big health application system basedon health Internet of Things and big data. IEEE Access 5, 7885–7897 (2017).https://doi.org/10.1109/ACCESS.2016.2638449
53. Marjani, M., et al.: Big IoT data analytics: architecture, opportunities, and openresearch challenges. IEEE Access 5, 5247–5261 (2017). https://doi.org/10.1109/ACCESS.2017.2689040
54. Memeti, S., Li, L., Pllana, S., Kolodziej, J., Kessler, C.: Benchmarking OpenCL,OpenACC, OpenMP, and CUDA: programming productivity, performance, andenergy consumption. In: Proceedings of the 2017 Workshop on Adaptive ResourceManagement and Scheduling for Cloud Computing, ARMS-CC 2017, pp. 1–6.ACM, New York (2017). https://doi.org/10.1145/3110355.3110356
55. Memeti, S., Pllana, S.: Accelerating DNA sequence analysis using Intel R© XeonPhiTM. In: 2015 IEEE Trustcom/BigDataSE/ISPA, vol. 3, pp. 222–227, August2015

218 S. Vitabile et al.
56. Memeti, S., Pllana, S.: HSTREAM: a directive-based language extension for het-erogeneous stream computing. In: 2018 IEEE International Conference on Compu-tational Science and Engineering (CSE), pp. 138–145, October 2018. https://doi.org/10.1109/CSE.2018.00026
57. Mora, H.M., Gil, D., Terol, R.M., Lopez, J.A., Szymanski, J.: An IoT-based com-putational framework for healthcare monitoring in mobile environments. Sensors17, 2302 (2017)
58. NVIDIA: What is GPU-Accelerated Computing? April 2017. http://www.nvidia.com/object/what-is-gpu-computing.html. Accessed 03 Nov 2018
59. Padilla, W.R., Garcıa, J., Molina, J.M.: Information fusion and machine learning inspatial prediction for local agricultural markets. In: Bajo, J., et al. (eds.) PAAMS2018. CCIS, vol. 887, pp. 235–246. Springer, Cham (2018). https://doi.org/10.1007/978-3-319-94779-2 21
60. Padua, D. (ed.): Encyclopedia of Parallel Computing. Springer, Boston (2011).https://doi.org/10.1007/978-0-387-09766-4
61. Perez, D., Memeti, S., Pllana, S.: A simulation study of a smart living IoT solu-tion for remote elderly care. In: 2018 Third International Conference on Fog andMobile Edge Computing (FMEC), pp. 227–232, April 2018. https://doi.org/10.1109/FMEC.2018.8364069
62. Sanchez-Pi, N., Martı, L., Bustamante, A.L., Molina, J.M.: How machine learningcould detect anomalies on thinger.io platform? In: Bajo, J., et al. (eds.) PAAMS2018. CCIS, vol. 887, pp. 259–269. Springer, Cham (2018). https://doi.org/10.1007/978-3-319-94779-2 23
63. Sanchez-Pi, N., Martı, L., Molina, J.M., Bicharra Garcıa, A.C.: Information fusionfor improving decision-making in big data applications. In: Pop, F., Ko�lodziej, J.,Di Martino, B. (eds.) Resource Management for Big Data Platforms. CCN, pp.171–188. Springer, Cham (2016). https://doi.org/10.1007/978-3-319-44881-7 9
64. Qiu, J., Wu, Q., Ding, G., Xu, Y., Feng, S.: A survey of machine learn-ing for big data processing. EURASIP J. Adv. Sig. Proces. (1) (2016).https://doi.org/10.1186/s13634-016-0355-x. https://link.springer.com/article/10.1186/s13634-016-0355-x
65. Raghupathi, W., Raghupathi, V.: Big data analytics in healthcare: promise andpotential. Health Inf. Sci. Syst. 2(1), 3 (2014)
66. Rassias, G., Andrikos, C.O., Tsanakas, P., Maglogiannis, I.: Versatile cloud col-laboration services for device-transparent medical imaging teleconsultations. In:2017 IEEE 30th International Symposium on Computer-Based Medical Systems(CBMS), pp. 306–311. IEEE (2017)
67. Rawassizadeh, R., Kotz, D.: Datasets for mobile, wearable and IoT research.GetMobile: Mob. Comput. Commun. 20(4), 5–7 (2017). https://doi.org/10.1145/3081016.3081018. http://doi.acm.org/10.1145/3081016.3081018
68. Rawassizadeh, R., Momeni, E., Dobbins, C., Mirza-Babaei, P., Rahnamoun, R.:Lesson learned from collecting quantified self information via mobile and wearabledevices. J. Sens. Actuator Netw. 4(4), 315–335 (2015). https://doi.org/10.3390/jsan4040315
69. Rodgers, M.M., Pai, V.M., Conroy, R.S.: Recent advances in wearable sensors forhealth monitoring. IEEE Sens. J. 15(6), 3119–3126 (2015). https://doi.org/10.1109/JSEN.2014.2357257
70. Sahoo, P.K., Dehury, C.K.: Efficient data and CPU-intensive job scheduling algo-rithms for healthcare cloud. Comput. Electr. Eng. 68, 119–139 (2018)

Medical Data Processing and Analysis 219
71. Sikora, A., Krzyszto, M., Marks, M.: Application of bluetooth low energy proto-col for communication in mobile networks. In: 2018 International Conference onMilitary Communications and Information Systems (ICMCIS), pp. 1–6, May 2018.https://doi.org/10.1109/ICMCIS.2018.8398689
72. Singh, M.P., Hoque, M.A., Tarkoma, S.: A survey of systems for massive streamanalytics. arXiv preprint arXiv:1605.09021 (2016)
73. Snidaro, L., Garcıa, J., Llinas, J.: Context-based information fusion: a survey anddiscussion. Inf. Fusion 25, 16–31 (2015). https://doi.org/10.1016/j.inffus.2015.01.002
74. Solanas, A., et al.: Smart health: a context-aware health paradigm within smartcities. IEEE Commun. Mag. 52(8), 74–81 (2014). https://doi.org/10.1109/MCOM.2014.6871673
75. Sotiriadis, S., Vakanas, L., Petrakis, E., Zampognaro, P., Bessis, N.: Automaticmigration and deployment of cloud services for healthcare application developmentin FIWARE. In: 2016 30th International Conference on Advanced InformationNetworking and Applications Workshops (WAINA), pp. 416–419. IEEE (2016)
76. TOP500: The TOP500 List of Most Powerful Computer Systems (2018). http://www.top500.org/. Accessed 24 Dec 2018
77. Vaizman, Y., Ellis, K., Lanckriet, G.: Recognizing detailed human context in thewild from smartphones and smartwatches. IEEE Pervasive Comput. 16(4), 62–74(2017). https://doi.org/10.1109/MPRV.2017.3971131
78. Valsamis, A., Tserpes, K., Zissis, D., Anagnostopoulos, D., Varvarigou, T.: Employ-ing traditional machine learning algorithms for big data stream analysis: the caseof object trajectory prediction. J. Syst. Softw. 127, 249–257 (2017). https://doi.org/10.1016/j.jss.2016.06.016. https://dl.acm.org/citation.cfm?id=3066671
79. Viebke, A., Pllana, S.: The potential of the Intel (R) Xeon Phi for superviseddeep learning. In: 2015 IEEE 17th International Conference on High PerformanceComputing and Communications, pp. 758–765, August 2015. https://doi.org/10.1109/HPCC-CSS-ICESS.2015.45
80. Waehner, K.: How to apply machine learning to event processing (2016). https://www.rtinsights.com/big-data-machine-learning-software-event-processing-analytics/
81. Wang, Y., Kung, L., Byrd, T.A.: Big data analytics: understanding its capa-bilities and potential benefits for healthcare organizations. Technol. Forecast.Soc. Change 126, 3–13 (2018). https://doi.org/10.1016/j.techfore.2015.12.019.http://www.sciencedirect.com/science/article/pii/S0040162516000500
82. Welbourne, E., Tapia, E.M.: CrowdSignals: a call to crowdfund the community’slargest mobile dataset. In: Proceedings of the 2014 ACM International Joint Con-ference on Pervasive and Ubiquitous Computing: Adjunct Publication, UbiComp2014 Adjunct, pp. 873–877. ACM, New York (2014). https://doi.org/10.1145/2638728.2641309
83. Zazo, M.H., Hastings, J., Segura-Bedmar, I., Croset, S., Martinez, P., Steinbeck,C.: An ontology for drug-drug interactions. In: Proceedings of the 6th Interna-tional Workshop on Semantic Web Applications and Tools for Life Sciences (2014).http://ceur-ws.org/Vol-1114/Session3 Herrero-Zazo.pdf

220 S. Vitabile et al.
Open Access This chapter is licensed under the terms of the Creative CommonsAttribution 4.0 International License (http://creativecommons.org/licenses/by/4.0/),which permits use, sharing, adaptation, distribution and reproduction in any mediumor format, as long as you give appropriate credit to the original author(s) and thesource, provide a link to the Creative Commons license and indicate if changes weremade.
The images or other third party material in this chapter are included in the chapter’sCreative Commons license, unless indicated otherwise in a credit line to the material. Ifmaterial is not included in the chapter’s Creative Commons license and your intendeduse is not permitted by statutory regulation or exceeds the permitted use, you willneed to obtain permission directly from the copyright holder.

Towards Human Cell Simulation
Simone Spolaor1,5 , Marco Gribaudo2 , Mauro Iacono3 , Tomas Kadavy4 ,Zuzana Komınkova Oplatkova4 , Giancarlo Mauri1,5 , Sabri Pllana6 ,
Roman Senkerik4 , Natalija Stojanovic7, Esko Turunen8 , Adam Viktorin4 ,Salvatore Vitabile9 , Ales Zamuda10 , and Marco S. Nobile1,5(B)
1 Department of Informatics, Systems and Communication,University of Milano-Bicocca, Milan, Italy
[email protected] Dipartimento di Elettronica, Informazione e Bioingegneria,
Politecnico di Milano, Milan, Italy3 Dipartimento di Matematica e Fisica,
Universita degli Studi della Campania “Luigi Vanvitelli”, Caserta, Italy4 Faculty of Applied Informatics, Tomas Bata University in Zlin,
Zlin, Czech Republic5 SYSBIO.IT Centre for Systems Biology, Milan, Italy
6 Department of Computer Science, Linnaeus University, Vaxjo, Sweden7 Department of Computer Science, University of Nis, Nis, Serbia
8 Department of Mathematics, Tampere University of Technology, Tampere, Finland9 Department of Biopathology and Medical Biotechnologies,
University of Palermo, Palermo, Italy10 Faculty of Electrical Engineering and Computer Science,
University of Maribor, Maribor, Slovenia
Abstract. The faithful reproduction and accurate prediction of the phe-notypes and emergent behaviors of complex cellular systems are amongthe most challenging goals in Systems Biology. Although mathematicalmodels that describe the interactions among all biochemical processes ina cell are theoretically feasible, their simulation is generally hard becauseof a variety of reasons. For instance, many quantitative data (e.g., kineticrates) are usually not available, a problem that hinders the execution ofsimulation algorithms as long as some parameter estimation methods areused. Though, even with a candidate parameterization, the simulationof mechanistic models could be challenging due to the extreme compu-tational effort required. In this context, model reduction techniques andHigh-Performance Computing infrastructures could be leveraged to mit-igate these issues. In addition, as cellular processes are characterized bymultiple scales of temporal and spatial organization, novel hybrid simula-tors able to harmonize different modeling approaches (e.g., logic-based,constraint-based, continuous deterministic, discrete stochastic, spatial)should be designed. This chapter describes a putative unified approachto tackle these challenging tasks, hopefully paving the way to the defini-tion of large-scale comprehensive models that aim at the comprehensionof the cell behavior by means of computational tools.
c© The Author(s) 2019J. Ko�lodziej and H. Gonzalez-Velez (Eds.): cHiPSet, LNCS 11400, pp. 221–249, 2019.https://doi.org/10.1007/978-3-030-16272-6_8

222 S. Spolaor et al.
Keywords: Agent-based simulation · Big data ·Biochemical simulation · Computational intelligence ·Constraint-based modeling · Fuzzy logic ·High-performance computing · Model reduction ·Multi-scale modeling · Parameter estimation ·Reaction-based modeling · Systems biology
1 Introduction
Cells are inherently complex systems, composed by a wide variety of moleculetypes, whose functioning is finely regulated by an intricate network of interac-tions. In order for cells to respond to environmental cues, surviving and reproduc-ing, all of their components have to act together in a orchestrated manner. Thiswealth of complexity is the main reason for the richness of cellular behavioursthat can be found in nature, but is also a major issue in advancing to a completeunderstanding of these systems.
In the last decades, mathematical modeling and simulation proved to beessential tools to understand and describe how biological functions emerge fromthe complex network of interactions existing between cellular components [139].However, even though modeling and simulation proved successful in describingsingle processes or a limited amount of interacting pathways, extending thisapproach to define and simulate a whole-cell turned out to be an unfeasible task(besides the notable exception reported in [58], as it will be mentioned below),especially in the case of human cells. As a matter of fact, the definition andsimulation of whole-cell models is challenging for several reasons. In particular,the problem is exacerbated by the complex organization of cell systems; thedifficulties encountered in integrating different data sources and mathematicalformalisms in a single modeling framework; the huge demand of computationalpower needed to perform the simulation. Although some of these challengeswere already discussed and highlighted before (see for example [67]), we herebyprovide a brief summary of the main challenges in the definition and simulationof whole-cell models:
– biomolecular systems are composed of a wide variety of heterogeneous compo-nents, ranging from small molecules, complex polymers (including proteins,sugars and ribonucleic acids) and protein complexes. All these components arefurther organized in functionally coherent pathways and organized in special-ized compartments (e.g. the organelles in eukaryotic cells), ultimately givingrise to complex (observable) phenotypes;
– cells display a complex spatial and functional hierarchical organization, thatresults in phenomena occurring at a wide range of spatial and temporalscales [30]. Moreover, this organization often gives rise to complex non-lineardynamics;
– cellular systems are inherently stochastic, that is, the dynamics of cellularprocesses is characterized by biological noise [39], which is exploited by thecell to obtain specific responses that would be impossible in its absence [37].

Towards Human Cell Simulation 223
Thus, some cellular pathways (e.g., gene expression) must be modeled andsimulated as stochastic processes;
– the different nature of the cell components entails that they are measuredwith different experimental techniques. Some of these components can bemeasured with a high accuracy and with a high throughput (e.g., genomicor RNA sequencing, mass spectrometry), while others are very difficult orimpossible to measure (e.g., kinetic information on the reaction rates). Thus,modelers have to take into account the presence of vast amounts of data, oftenin qualitative, or semi-quantitative form, together with limited quantitativeinformation;
– the availability of multiple types of data, and the need to model differentlayers of organization, led to the definition of multiple modelling frameworks[118]. Because of this, models of biochemical systems are usually focusedon one of the three main layers in which cellular processes are generallydivided, namely: signalling (perceive environmental changes, process infor-mation and regulation of behaviour); gene regulation (control of expressionlevels of gene products); metabolism, i.e., the production and consumption,driven by enzymes, of small molecules essential for the life of cells. Eventhough attempts to define a single framework were made before [23], theintegration of multiple modeling approaches is still challenging. However, aunified modeling framework for these three layers would provide a reliablemeans to capture their peculiarities [45], as was shown in [58].
– the availability of large amounts of experimental data, combined with themassive complexity of cells components, leads to huge computational require-ments, even when considering the simulation of a single cell. Thus, dynamicmechanistic whole-cell models—encompassing all knowledge about biochemi-cal reactions—are basically impossible to simulate on any existing computingarchitecture. However, we will see that by means of some assumptions aboutthe system, such complexity can be mitigated using hybrid modeling, andmodel reduction techniques.
Considering all these challenges together, it comes to no surprise that, up todate, the only available example of whole-cell model is the one presented in thepioneering work of Karr et al. [58]. In this seminal work, the authors succeeded insimulating a whole-cell of one of the simplest known organisms, the Mycoplasmagenitalium, adopting for each cellular process a suitable mathematical formal-ism. In particular, the authors showed the feasibility of predicting different cellphenotypes from a genotype, by relying on computational approaches. To thebest of our knowledge, this results was not achieved again for any more complexorganism. However, the integration of multiple formalism into a single modelingframework was already explored to smaller extents also in human cell models,for example in [41]. It is out of question that the simulation of whole-cell modelswill prove to be a challenge for modelers and computer scientists in the comingdecades, and this is especially true in the case of human cells. Here, we proposea set of modeling approaches and techniques that would allow us to advancetowards the simulation of human whole-cell models.

224 S. Spolaor et al.
A dynamic whole-cell model would prove useful to understand how pheno-types emerge from the complex interactions existing between cellular compo-nents. Achieving dynamic simulation of a human cell in silico would have aneven more considerable impact in the fields of molecular and systems biology,bioengineering and medicine [67]. Such a model, once validated, could allow touncover new and potential unknown processes inside human cells, providing areliable platform to generate new hypothesis to be tested in laboratory. In thisregard, in silico tests would guide the experimental design, greatly reducingthe costs, both in term of time and resources, of a “wet” laboratory. Moreover,human cell models could be exploited to automatically assess the effects of a vastnumber of perturbations in physiological or pathological conditions, in order tounveil potentially new drug targets or test known drugs in a high-throughputmanner. We envision that human cell models could lead to breakthroughs inmany fields of application, including medicine and personalized medicine, phar-macology and drug discovery, biotechnology and synthetic biology.
Regardless of the methodology used to create a whole-cell model, thereare some aspects that will always characterize this kind of approach: High-Performance Computing (HPC) is necessary to mitigate the huge computa-tional effort, in particular by distributing the computations over massively par-allel machines and co-processors; dynamics modelling requires a proper kineticparameterization to perform predictive simulations, and such parameters areoften difficult—or even impossible—to measure by means of laboratory experi-ments, leading to a problem of parameter estimation; biological models are oftencharacterized by multiple scales (temporal and spatial) which are not easy tohandle; to reduce the huge computational effort due to large-scale models, bothmodel reduction techniques or phenomenological simplifications can be lever-aged. All these topics will be introduced and discussed in this paper.
This manuscript is organized as follows: in Sect. 2 we describe how HPC canmitigate the exceptional computational demand required by the simulation ofwhole-cell models; in Sect. 3 we propose modeling approaches for the definitionof whole-cell models, while in Sect. 4 we suggest some techniques that could beemployed to tackle the problems mentioned above in order to create a unifiedmodeling approach; finally, in Sect. 5 we give some final remarks and highlightpotential future directions.
2 High Performance Computing and Big Data
As it was highlighted in the previous section, High Performance Computing(HPC) architectures and handling of huge amounts of data will be necessaryand enabling tools for the simulation of a human cell model. HPC involves theuse of many interconnected processing elements to reduce the time to solutionof given a problem. Many powerful HPC systems are heterogeneous, in the sensethat they combine general-purpose CPUs with accelerators such as, GraphicsProcessing Units (GPUs), or Field Programmable Gates Arrays (FPGAs).
There exist several HPC approaches [11,60,89] developed to improve the per-formance of advanced and data intensive modeling and simulation applications.

Towards Human Cell Simulation 225
Parallel computing paradigm may be used on multi-core CPUs, many-core pro-cessing units (such as, GPUs [77]), re-configurable hardware platforms (such as,FPGAs), or over distributed infrastructure (such as, cluster, Grid, or Cloud).While multi-core CPUs are suitable for general-purpose tasks, many-core pro-cessors (such as the Intel Xeon Phi [24] or GPU [85]) comprise a larger number oflower frequency cores and perform well on scalable applications (such as, DNAsequence analysis [71], biochemical simulation [53,76,81,123] or deep learning[129]).
Widely used parallel programming frameworks [70] for heterogeneous sys-tems include OpenACC [138], OpenCL [115], OpenMP [88], and NVIDIA CUDA[84]. OpenMP is a set of compiler directives, library routines, and environmentvariables for programming shared-memory parallel computing systems. Further-more, OpenMP has been extended to support programming of heterogeneoussystems that contain CPUs and accelerators. OpenCL supports portable pro-gramming of hardware provided by various vendors, while CUDA runs only onNVIDIA hardware. CUDA C/C++ compiler, libraries, and run-time softwareenable programmers to develop and accelerate data-intensive applications onGPU.
As concerns distributed parallel computing, the available frameworks includethe Message Passing Interface (MPI) [48], MapReduce/Hadoop [51] or ApacheSpark [112]. MPI is a specification of library routines helpful for users thatwrite portable message-passing programs in C/C++, Fortran or Python. Basicassumption behind MPI is that multiple processes work concurrently using mes-sages to communicate and collaborate with each other. The MapReduce frame-work, and its open-source implementation Hadoop software stack, hides thedetails about data distribution, data availability and fault-tolerance, and allowsto scale up to thousands of nodes inside cluster or Cloud computing systems.Lastly, Apache Spark [112] is a large-scale parallel computing platform thatprovides a wide variety of tools for structured data processing, including SQLqueries (SparkSQL), streaming applications (Spark Streaming), machine learn-ing (MLlib) and graph operations (GraphX), by means of various programminginterfaces in Java, Scala, Python and R.
The data size in Bioinformatics, Computational Biology, and Systems Biol-ogy is increasing dramatically in the recent years. The European BioinformaticsInstitute (EBI), one of the largest biology-data repositories, had approximately40 petabytes of data about genes, proteins, and small molecules in 2014, in com-parison to 18 petabytes in 2013 [56]. Big data problems in these fields are notonly characterized by Velocity, Volume, Value, Variety, and Veracity, but also byincremental and geographically distributed data. While part of these data maybe transferred over the Internet, the remaining are not transferable due to theirsize, cost, privacy, and other ethical issues [69]. Moreover, the computationaltime required by algorithms designed for the simulation of detailed mechanis-tic models (see Sect. 3.1) scales poorly when the models are characterized by ahuge number of components. Thus, in recent years, research in Bioinformatics,

226 S. Spolaor et al.
Computational Biology and Systems Biology started to adopt different HPCapproaches to deal with Big Data.
In [86] Hadoop Blast (Basic Local Alignment Search Tool), in short HBlast,a parallelized BLAST algorithm is presented. HBlast exploits the MapReduceprogramming framework, adopting a hybrid “virtual partitioning” approach thatautomatically adjusts the database partition size depending on the Hadoop clus-ter size, as well as the number of input query sequences.
Sadasivam et al. considered in [100] a time efficient approach to multiplesequence alignment, as essential tool in molecular biology. They proposed a novelapproach that combines the dynamic programming algorithm with the compu-tational parallelism of Hadoop data grids to improve accuracy and to accelerateof multiple sequence alignment.
Li et al. developed in [65] ClustaWMPI, an accelerated version of ClustalWtool for aligning multiple protein or nucleotide sequences. In ClustalWMPIadopts MPI and runs on distributed workstation clusters as well as on tradi-tional parallel computers.
The work presented in [15] describes a new Molecular Dynamics approach,named Desmond, that achieves unusually high parallel scalability and overallsimulation throughput on commodity clusters by using new distributed-memoryparallel algorithms. Desmond adopts a novel parallel decomposition methodthat greatly reduces the requirement for inter-processor communication, a novelmessage-passing technique that reduces the number of inter-processor messages,and novel highly efficient communication primitives that further reduce commu-nication time.
The estimation of kinetic parameters, mandatory to perform cellular simu-lations, can be performed using population-based global optimization methods(see Sect. 4.2 for additional information). These algorithms are intrinsically par-allel and can be accelerated using GPUs [78,79]. In [124] acceleration of theDifferential Evolution algorithm is considered. In this work, a parallel imple-mentation of an enhanced DE using Spark is proposed. Two different platformshave been used for the evaluation, a local cluster and the Microsoft Azure publiccloud. The proposal drastically reduces the execution time, by means of includ-ing a selected local search and exploiting the available distributed resources.The performance of the proposal has been thoroughly assessed using challeng-ing parameter estimation problems from the domain of computational systemsbiology. Additionally, it has been also compared with other parallel approaches,a MapReduce implementation and MPI implementation.
Coulier et al. presented in [29] a new framework, named Orchestral, forconstructing and simulating high-fidelity models of multicellular systems fromexisting frameworks for single-cell simulation. They combined the many existingframeworks for single-cell resolution reaction-diffusion models with the diverselandscape of models of cell mechanics. They decoupled the simulation of reaction-diffusion kinetics inside the cells from the simulation of molecular cell-cell inter-actions occurring on the boundaries between cells. Orchestral provides a modelfor simulating the resulting model massively in parallel over a wide range of

Towards Human Cell Simulation 227
distributed computing environments. They proved the flexibility and scalabilityof the framework by using the popular single-cell simulation software eGFRD toconstruct and simulate a multicellular model of Notch-Delta signaling over theOpenStack cloud infrastructure.
Finally, HPC is exploited to accelerate the simulation of biochemical mod-els that are defined according to mechanistic formalisms [118] (refer also toSect. 3.1 for some examples). In this context, GPUs [77] were already success-fully employed to achieve a considerable reduction in the computational timesrequired by the simulation of both deterministic [53,76,123] and stochastic mod-els [81,150]. Besides accelerating single simulations of such models, these meth-ods prove to be particularly useful when there is a need of running multipleindependent simulations of the same model. Hundreds (or even thousands) ofsimulations are often necessary to perform a wide variety of analysis on validatedmodels (e.g., sensitivity analysis of kinetic parameters, or parameter sweep anal-ysis), but also to perform parameter estimation (PE) during the definition ofsuch models (please, refer to Sect. 4.2 for an extensive description). This kind oftasks leverages at most the availability of the many cores of the GPUs, greatlyreducing the overall running time that is required to perform them [82,83].
3 Modeling Approach
In the field of Systems Biology, several modeling approaches have been defined[114,118]. Each approach exploits a different mathematical formalism and wasdeveloped to address the challenges posed by a specific (subset of) biochemicalprocesses (e.g. metabolism [117], gene regulation, or signaling). The definition ofa single, homogeneous mathematical framework to model and simulate a whole-cell seems currently unfeasible, while the integration of multiple formalisms hasalready proved to be able to achieve outstanding results [58]. Following thisprinciple, we decided to define our human cell modeling framework by inte-grating multiple modeling approaches, namely: (i) mechanism-based models (inparticular reaction-based and agent-based models); (ii) constraint-based mod-els; (iii) logic-based models (in particular boolean and fuzzy logic-based models).These approaches, together with their peculiarities and limitations, will be brieflydescribed in the following subsections.
3.1 Reaction-Based Modeling
Biochemical systems are traditionally formalized as mechanistic and fully param-eterized reaction-based models (RBMs) [12]. A RBM is defined by specifying thefollowing sets:
– the set S = {S1, . . . , SN} of molecular species;– the set R = {R1, . . . , RM} of biochemical reactions that describe the inter-
actions among the species in S;– the set K = {k1, . . . , kM} of kinetic constants associated with the reactions
in R;

228 S. Spolaor et al.
– the set of the initial concentration Yi ∈ R+0 , with i = 1, . . . , N , for each species
Si ∈ S.
Any RBM can be represented in a compact matrix-vector form AS K−→ BS,where S = (S1, . . . , SN )�, K = (k1, . . . , kM )�, and A,B ∈ N
M×N are the sto-ichiometric matrices whose elements [A]i,j and [B]i,j represent the number ofreactants and products occurring in the reactions, respectively. Given an RBMand assuming the law of mass-action [22], the system of coupled Ordinary Dif-ferential Equations (ODEs) describing the variation in time of the species con-centrations is obtained as follows:
dYdt
= (B − A)�[K � YA], (1)
where Y = (Y1, . . . , YN ) represents the state of the system at time t, YA
denotes the vector-matrix exponentiation form [22], while the symbol � denotesthe Hadamard product. The system can then be simulated using a numericalmethod, which is usually based on implicit integration (e.g., Backward Differen-tiation Formulae [19]) due to the stiffness that characterizes these models.
When the chemical species have a low concentration, the dynamics of thesystem becomes instrinsically stochastic and the biochemical system should besimulated using specific approaches like Gillespie’s Stochastic Simulation Algo-rithm (SSA) [43]. In SSA, the simulation proceeds one reaction at a time. Boththe reaction to be fired and the time interval τ before the reactions occur aredetermined in a probabilistic fashion. Thus, the simulated trajectory of the sys-tem can radically diverge from the one predicted by a deterministic simulation,allowing the investigation of the emergent effects due to the intrinsic noise andproviding a deeper knowledge of the system’s behavior. In the case of stochasticmodeling, the state of the system represents the exact number of molecules; Kdenotes the vector of the stochastic constants, encompassing all the physical andchemical properties of the reactions. These parameters are used to calculate thepropensity functions, ultimately determining the probability of each reaction Rm
to occur. Propensity functions are defined as:
am(Y) = km · dm(Y), (2)
where dm(Y) is the number of distinct combinations of reactant molecules occur-ring in Rm. The delay time τ before the next reaction will occur is calculatedaccording to the following equation:
τ =1
a0(Y)· ln
1rnd
, (3)
where a0(Y) =∑M
m=1 am(Y) and rnd is random number sampled with uniformdistribution in [0, 1).
Mechanistic modeling is considered the most likely candidate to achieve adetailed comprehension of biological systems [20], since it can lead to quantita-tive predictions of cellular dynamics, thanks to its capability to reproduce the

Towards Human Cell Simulation 229
temporal evolution of all molecular species occurring in the model. Nonetheless,the computational complexity of the simulation and analysis of such modelsincreases with the size (in terms of components and interactions) of the systems,limiting the feasibility of this approach. Moreover the usual lack of quantita-tive parameters (e.g., kinetic constants, initial molecular concentrations of thespecies) and the partial lack of knowledge about the molecular mechanisms,sometimes due to the difficulty or impossibility to perform ad hoc experiments,represent further limits to a wide applicability of this modeling approach. Theproblems of simulation performances and parameter estimation are discussed inthe next Sections.
3.2 Constraint-Based Modeling
Constraint-Based Modeling (CBM) is based on the idea that phenotypes of agiven biological system must satisfy a number of constraints. Hence, by restrict-ing the space of all possible systems states, it is possible to determine the func-tional states that a biochemical (in particular, metabolic) network can or cannotachieve. The fundamental assumption of constraint-based modeling is that theorganism will reach a quasi-steady state that satisfies the given constraints [20].
The starting point of CBM is the transposed stoichiometric matrix S =(B−A)T, i.e., a matrix in which each row corresponds to a chemical species (e.g.,metabolites), while columns correspond to reactions involving those species.Since metabolic networks typically include more reactions (“fluxes”) than meta-bolites, the stoichiometric constraints and the steady assumption alone lead to anunder-determined system in which a bounded solution space of all feasible fluxdistributions can be identified. Additional constraints should be incorporatedto further restrict the solution space; this is usually performed by specifyinglinear bounds to minimum and maximum values of fluxes. Additioanl capacityconstraints are generally set according to experimental data.
On top of CBM, Flux Balance Analysis (FBA) can be used to identify opti-mal distribution of fluxes with respect to a given objective function. Thanks tothe linear definitions of fluxes, constraints and objective function, the solutionspace is a multi-dimensional convex polytope. FBA exploits a simplex method toefficiently identify the optimal fluxes that maximize, or minimize, the objectivefunction (e.g., the maximization of ATP [128] in the context of mithocondriaenergy metabolism). CBM methods do not perform an actual simulation of thebiochemical system, but can be used—under a quasi-steady state assumption—to investigate the distribution of fluxes. Interestingly, FBA has a very limitedcomputational complexity, so that it can be leveraged to study the behavior ofa metabolic systems on a whole-cell level.
3.3 Markovian Agents
Markovian agents [13] are a modeling tool that is specially suitable for largescale phenomena composed of groups of single entities that behave as Markovchains. Such entities, said agents, are individuals belonging to classes that are

230 S. Spolaor et al.
characterized by a common description of their dynamics. Agents may influenceeach other by means of a technique called induction, which accounts for theirposition in a logic map that represents the space in which they can move or bepositioned in the system. The system is described by considering for each classthe density of agents in each state and the probability of transition betweenstates, so that, thanks to a mean-field approach, the evolution in time of thedensity in states may be approximately described by differential equations anda closed form solution may be obtained, with the significant advantage that thehigher is the number of agents in a class, the best the approximation describes thesystem. The communication mechanism acts by enabling or disabling transitions,thus influencing the probability of transitions between states. This analyticaldescription is suitable to study both transient and regime behavior of the system.
Markovian agents may be used to describe the interactions of reactions thathappen in a cell in a large number of independent instances, including the effectsof inhibiting factors, as well as for describing the expression of cells in tissuesand organs. The technique has been applied to study biological pathways [27],cancer cells [28], whole ecosystems, such as forestry landscape [142], and othercomplex real-world systems [7,21,47]. The Markovian property make them suit-able to describe processes that are characterized by exponentially distributedinterarrival time in their evolution.
From the formal point of view, let a Markovian agents model be composedby different classes, with each class c characterized by a Markov chain withnc states: the space Σ in which agents are located and can move is finite andcan be continuous or discrete. The distribution of agents in the space can berepresented by a density function δ : Σ → R
+ so that, considering any sub-space U ⊂ Σ, the number of agents in U is described by a Poisson distributionwith mean
∫ ∫U
δ(x)dx. The model evolves by accounting for state changes ofagents in their class and induction effects, birth of agents and death of agents:its evaluation can be obtained as a counting process per each class that countsthe number of agents in each state of its Markov chain, in each position in spaceand in each instant.
Let χc(l, t) = |χ[c]i (l, t)| be a vector of size n[c], with each element χ
[c]i (l, t)
representing the average number of agents of class c in state i at time t and inlocation l. If the space is discrete, the evolution of the counting process is thusdescribed by a set of ordinary differential Equations 4 for each class c and inlocation l:
dχc(l, t)dt
= bc([χ], l, t) + χc(l, t) · Kc([χ], l, t) (4)
where [χ] denotes the dependency on all the state of all agents in the modelin any time instant, matrix Kc is the main transition kernel that accounts forspontaneous and induced actions contribution and bc is the birth vector of newagents for the class in a state.
If the space is continuous, movement of agents is described by a diagonalvelocity matrix ωc, described in Eq. 5, that can be obtained by summing thecontributions for each direction:

Towards Human Cell Simulation 231
∂(ωc([χ], l, t) · χc(l, t))∂l
=∂(ωxc([χ], l, t) · χc(l, t))
∂lx+
∂(ωyc([χ], l, t) · χc(l, t))∂ly
+. . .
(5)and Eq. 4 is modified accordingly and becomes Eq. 6:
∂χc(l, t)∂t
+∂(ωc([χ], l, t) · χc(l, t))
∂l= bc([χ], l, t) + χc(l, t) · Kc([χ], l, t) (6)
in which the second term accounts for the effects of agents movement by vc.
3.4 Logic-Based Modeling
In contrast with mechanism- and constraint-based models, logic-based model donot require kinetic or stoichiometric information to be defined. Although thesemodels can describe the system under consideration only in qualitative terms,they provide an efficient way to simulate the dynamic evolution of complexsystems, even when precise kinetic information is not available. Thanks to theircloseness to human language, logic-based models are able to leverage qualitativeand semi-quantitative data and they are generally regarded as more intepretableby human experts. Moreover, their flexibility allow modelers to represent inthe same model highly heterogeneous components and the interactions existingamong them.
Logic-based models are defined by a set of υ variables V and a set of φIF-THEN logic rules F , describing the interactions existing between the compo-nents. Evaluation of the rules in discrete time steps drives the system’s dynam-ics: this can be achieved by either a synchronous (deterministic) or asynchronous(stochastic) update policy [141]. Logic-based models are commonly employed insystems biology to model gene regulatory networks and signal processing [74].Among them, Boolean models are the most simple and widely used: in this kindof models, variables can assume only two discrete states, often represented as 0and 1, active or inactive, present or not present. Different Boolean logic modelswere successful in predicting cellular behaviours [141], however these assump-tions often limit their ability of representing biomolecular processes.
In order to overcome these limitations, more recently fuzzy logic was proposedas an alternative to the modeling of complex biochemical systems [3]. Fuzzy logicis a powerful, multi-valued extension of boolean logic, which allows variables toassume multiple states in a continuous manner (i.e., between [0,1]) and dealwith any uncertainty related to the system. More in particular, fuzzy IF-THENinference systems are composed of φ rules of type:
IF v1 is in V1,1 and v2 is in V1,2 and ... and vυ is in V1,υ THEN o is in O1
IF v1 is in V2,1 and v2 is in V2,2 and ... and vυ is in V2,υ THEN o is in O2
· · ·IF v1 is in Vσ,1 and v2 is in Vσ,2 and ... and vυ is in Vσ,υ THEN o is in Oσ,

232 S. Spolaor et al.
where vj , o ∈ V, with i = 1, . . . , υ, while the sets Vi,j and Oi, with i = 1, . . . , σ,and j = 1, . . . , υ are fuzzy (sub-)sets, that is, the membership of the valueassumed by a generic variable v ∈ V for the fuzzy subset V is equal to a degreeα ∈ [0, 1]. This is denoted by μV (v) = α. If all the considered sets are classicalsets (i.e. always holds μV (v) ∈ {0, 1}), then the inference system is boolean.
An advantage of fuzzy reasoning is that, thanks to the fuzzy sets, it canhandle uncertainty and conflicting conclusions drawn from the logic rules [126].Thus, it can allow for the dynamic simulation of qualitative and semiquantitativemodels, even when precise kinetic information is missing. Fuzzy logic has beenapplied to vastly different fields of research, ranging from automatic control [36]to medicine [99], but it was successfully applied also in the field of cellular biology,for example, to model signaling pathways [3] and gene regulatory networks [63].
We plan to exploit fuzzy logic in our hybrid framework to overcome the lackof kinetic parameters [14,66] and model those cellular processes that still are notunderstood in mechanistic detail, or whose components cannot be representedby crisp, real-valued variables (e.g., complex phenotype as apoptosis/survival,microscopy imaging data, etc.).
4 A Unified Modeling Approach
In principle, the SSA algorithm described in Sect. 3.1 can be used to simulate astochastic trajectory of any biological model, including a whole-cell model, andsuch dynamics would be exact with respect to the Chemical Master Equation(CME) underlying the corresponding set of biochemical reactions. This approachcould be even extended to consider the diffusion of molecules inside the cell, likein the case of the Next Subvolume Method (NSM) [38]). However, both SSA andNSM perform the simulations by applying a single reaction at a time, proceedingwith time steps that are inversely proportional to the sum of the propensities (seeEq. 3) which, in turn, is proportional to the amount of reactants in the system.These circumstances generally cause an explosion of the computational effort dueto exact stochastic simulation, making it unfeasible for whole-cell simulation.
An approximate but faster version of SSA, called tau-leaping [44], was pro-posed by Gillespie to reduce the computational burden typical of SSA: by assum-ing that the propensities do not change during a given time-interval (the so-calledleap condition) the number of reactions firing can be approximated by Poissonrandom variables.
When the number of estimated reaction firings for all reactions increases,the Poisson processes can be approximated by a normal distribution with samemean and variance [44]. In this case, Stochastic Differential Equations (SDEs)like the Langevin equations can be exploited to model the system, which is thensimulated using numeric solvers like the Euler-Maruyama method [119], stronglyreducing the overall computational effort. Finally, when the propensities becomeextremely large, the noise term in the SDEs becomes negligible and can beremoved, so that the system can be modeled using simple ODEs [44].
The proper modeling approach must be carefully selected according to thecharacteristics of the chemical system. Unfortunately, cellular mechanisms are

Towards Human Cell Simulation 233
controlled by reactions and pathways spanning over multiple scales, so that noneof these modeling methods is really adequate. By partitioning the reactions setR into multiple regimes, according to their characteristics (e.g., their propensityvalues), it is possible to simulate each subsystem using the optimal modelingapproach. It is clear that the firing of reactions in one regime can have a hugeimpact to the others, so that the synchronization phase—necessary to propagatethe information across the regimes—becomes a mandatory and very delicatephases of multi-scale hybrid simulators, like in the case of the Partitioned LeapingAlgorithm (PLA) [52].
By extending PLA by considering the additional modeling approachesdescribed in Sect. 3.1, it is possible to achieve whole-cell models [58]. In thisproject, we pursue the integration of these modeling approaches, pushing thelimits of human cells simulation. In order to mitigate the huge computationalrequirements, we plan to exploit model reduction and automatic simplificationalgorithms. We also plan to perform an automatic inference of some missingparts of the model (e.g., reactions, rules, parameters), exploiting state-of-the-artevolutionary and statistical methods. Finally, we will test multi-agent approachesto work on multiple scales (e.g., multiple cells or tissue simulation). All theseapproaches will be described in the next subsections.
4.1 Model Reduction and Simplification
The complexity of cellular systems poses some limitations on the scale of themodels that can be simulated. In this context, model reduction techniques canbe used to tame the complexity before the execution of simulation algorithms isperformed.
The theory of complex networks has raised a great development over therecent years. The empirical and theoretical results analyzing several real sys-tems show that complex networks can be classified using its probability distri-bution function P (k), i.e. the probability that a node is connected to k nodes ofa network. A scale-free network has the grades distribution function fitting thepower-law function [57]. Several studies examining the cellular metabolism ofdifferent organisms have been conducted for determining the topological struc-ture of a metabolic network [57]. In this direction, studies of Barabasi and Alberthave also analyzed many issues in scale-free networks [2].
In many organism, the metabolic networks are composed of interconnectedfunctional modules and follow the scale-free model [49,61]. Three statistical mea-sures can be considered in a scale-free network: the connectivity degree, thediameter of the graph, and the clustering coefficient [2]. The connectivity degreeof a node is the number of incident arcs and it allows also for calculating thedistribution function of the connectivity degree. The diameter provides an esti-mation of the average number of hops between any pair of nodes in the network.It is also linked to the shortest paths between each node pair as well as to thenumber of paths in the network. Finally, the clustering coefficient gives a measureof the properties of nodes to form agglomerates. In addition, metabolic networknodes can be classified into distinct groups considering the following parameters
234 S. Spolaor et al.
[49]: the within-module degree, i.e., the membership degree of a node into itsfunctional module, and the participation coefficient, i.e., a measure of the nodeinteraction with network functional modules. The above parameters can be usedto define non-hub and hub nodes as well as peripheral, provincial, connector,and kinless nodes [49,64]. These metrics pave the way to the topological analy-sis of a network, providing information on the connectivity and the participationdegrees of each node within the network.
The topological analysis of a network can be completed by functional analy-sis. A cellular network is hierarchically organized with several functional modules[5,57]. Methods for a rational decomposition of the network into independentfunctional subsets are essential to understand their modularity and organizationprinciples.
Using the modularization approach commonly used in the area of controltheory, a cellular network can be viewed as an assembly of basic building blockswith its specific structures, characteristics, and interactions [103,135]. Modu-larization reduces the difficulty in investigating a complex network. Networkdecomposition is also needed for cellular functional analysis through pathwayanalysis methods that are often troubled by the problem of combinatorial explo-sion due to the complexity of those networks.
Two main methods can be used for network functional analysis and, as a con-sequence, for network model reduction and simplification: Flux Balance Analysis(FBA) and Extreme Pathways Analysis (ExPA) [59,103,137].
FBA is a mathematical technique based on fundamental physical and che-mical laws that quantitatively describe the metabolisms of living cells. FBA is aconstraint-based modeling approach [96]: it assumes that an organism reaches asteady-state (under any given environmental condition) that satisfies the physic-ochemical constraints and uses the mass and energy balance to describe thepotential cellular behavior. FBA model has been developed considering the massand energy conservation law: for each node/metabolite, the sum of incomingfluxes must be equal to the sum of the outgoing ones. The space of all feasiblesolutions of a linear equation constrained system lies within a three-dimensionalconvex polyhedron, in which each point of this space satisfies the constraintsof the system [96]. When the system has an optimal and limited solution, thisis unique and it is located on a polyhedron vertex. However, the system canhave multiple optimal solutions (axis or plan) that are used to detect networkredundancies [96].
ExPA analysis detects the vital pathways in a network. They are the uniqueset of vectors that completely characterize the steady-state capabilities of a net-work. A network steady-state operation is constrained to the region within acone, defined as the feasible set. In some special cases, under certain constraints,this feasible set collapse in a single point inside the cone. The algorithm detectsthe extreme rays/generating vectors of convex polyhedral cones. Algorithm timeexecution is proportional to the number of nodes and pathways [137].
Many software frameworks for cellular networks analysis and simulationhave been developed. Some solutions, such as Pajek [34], allows for either large

Towards Human Cell Simulation 235
complex networks analysis and visualization or network structural properties andquantities analysis. CellNetAnalyzer [62] is a MATLAB package for performingbiochemical networks functional and structural analysis.
The BIAM framework implements an integrated analysis methodology basedon topological analysis, FBA analysis, and Extreme Pathways analysis [26,134].The framework supplies the needed tools for drawing a network and analyzingits structural and functional properties. Several scale-free network architectures,dealing with different application domains, have been simulated and validated[26,136]. Topological and functional analysis can be combined to select the mainfunctional nodes and paths of a cellular network. Redundant nodes and non-vitalpaths could be ignored before the execution of time-constrained simulation algo-rithms, reducing the overall computational complexity of large scale simulation.
4.2 Parameter Estimation
Mechanistic models are characterized by a kinetic parameterization (i.e., the Kvector described in Sect. 3.1). A precise estimation of such parameters is manda-tory to perform faithful simulations of the system’s dynamics. The problem ofParameter Estimation (PE) can be formulated as a minimization problem: thegoal is to reduce to zero a distance between the target experimental discrete-time time-series and a simulated dynamics performed with the optimal vectorof parameters [83]. Due to the characteristics of the fitness landscapes definedby the PE problem (i.e., multi-modal, non-linear, non-convex, noisy), classicoptimization methods cannot be employed efficiently. On the contrary, Compu-tational Intelligence (CI) methods based on evolutionary computation or swarmintelligence were shown to be effective for this problem [35,83], in particularthe settings-free variant of PSO named Fuzzy Self-Tuning PSO [80]. Moreover,CI methods can be combined with probabilistic frameworks (e.g. expectation-maximization methods [55]) to efficiently tackle the PE of stochastic models (seefor example [95]). However, when the number of missing parameters in the modelbecomes extremely large, like in the case of whole-cell models, conventional CImethods can show some limitations and large-scale methods must be employed.
Among the existing CI algorithms for large number of parameters, Differ-ential Evolution (DE) [116] variants like the recent DISH [132] algorithm couldbe exploited. DE algorithm was introduced in 1995 by Storn and Price [116]and since then formed a basis for a set of successful algorithms for optimizationdomains, such as continuous, discrete, mixed-integer, or other search spaces andfeatures [146]. The whole encompassing research field around DE was surveyedmost recently in [32] and even since then, several other domain- and feature-specific surveys, studies, and comparisons have also followed [1,90,92,93]. The-oretical insight and insights to inner workings and behaviors of DE during con-secutive generations has been studied in the works like [87,122,133,144].
As the continuing research in DE enhancements and insight supports a muchvigorous research community, the DE algorithm variants have also steadilyplaced top in competitions held annually at Congress on Evolutionary Com-putation (CEC) [16,17,31,68,73,97,98,140]. For this reason, we expect these

236 S. Spolaor et al.
advanced versions of DE to be effective for the PE problem and outperformclassic algorithms, especially on high dimensional problem.
The most recent variants’ strain of DE is the Success-History based Adap-tive Differential Evolution (SHADE) [120], which has a line of recent improve-ments following a taxonomy [1] stemming from JADE [149] that is based onjDE [16,144], upgraded as L-SHADE [121], SPS-L-SHADE-EIG [50], LSHADE-cnEpSin [4], jSO [18], aL-SHADE [91], and most recently, DISH [132]. Thesealgorithms include different mechanisms and to describe the basic outline work-ing principle to apply DE, from the following paragraph on, the basic canonical1995 DE is described.
The canonical 1995 DE is based on parameter estimation through evolutionfrom a randomly generated set of solutions using population P , which has apreset size of NP. Each individual (a set of estimated parameter values) in thispopulation P consists of a vector x with a of length D. Each vector x compo-nent corresponds to one attribute of the optimized task for which parametersare being estimated. The objective function value f (x ) evaluates quality of thesolution. The individuals in the population create improved offspring for the nextgeneration. This process is repeated until the stopping criterion is met (eitherthe maximum number of generations, or the maximum number of objective func-tion evaluations, or the population diversity lower limit, or overall computationaltime), creating a chain of subsequent generations, where each following genera-tion consists of eventually better solutions than those in previous generations.
Some of most used computational operators operating on population Pover each generation and its vectors, are parameter adaptation, mutation [149],crossover [121], selection [132], and population restructuring including adapta-tion of population size [144]. First, all vectors in the initial population are uni-formly generated at random between bounds [xlower,j , xupper,j ], ∀j = 1, . . . , D:
xi = {U [xlower,j , xupper,j ]};∀j = 1, . . . , D;∀i = 1, . . . , NP, (7)
then, three mutually and from current vector index i different, indices r1, r2,and r3, are used to computing a differential vector (hence the name DE foralgorithm) and combine it in a scaled difference manner:
vi = xr1 + F (xr2 − xr3) , (8)
which is then taken into crossover with the current vector at index i:
uj,i ={
vj,i if U [0, 1] ≤ CRi or j = jrand
xj,i otherwise , (9)
finally through selection yielding a new vector xi,G+1 at this location i for nextgeneration G + 1:
xi,G+1 ={ui,G if f (ui,G) ≤ f (xi,G)xi,G otherwise . (10)
As mentioned in the beginning of this subsection, the work on DE is ongo-ing and still challenging. To apply DE most efficiently on a new challenge for

Towards Human Cell Simulation 237
parameter estimation like the discussed simulation in this chapter, one of effec-tive DE variants should be taken and adapted for the domain challenge at hand,following recent experiences on DE applications in e.g. image processing [143],energy scheduling [145], and autonomous vehicle navigation [147,148].
To assess the feasibility of DISH for the large-scale PE problem, we planto compare its performances against state-of-the-art methods, in particular theaforementioned variants of DE and those algorithms that were shown effectivefor the PE in previous studies (i.e., PSO [35] and FST-PSO [83]).
Another approach for DE that may be beneficial for the given application isthrough unconventional synergy of the DE with several different research fieldsbelonging to the computational intelligence paradigm, which are the stochasticsprocesses, complex chaotic dynamics, and complex networks (CN).
As the key operation in metaheuristic algorithms is the randomness, thepopularity of hybridizing them with deterministic chaos is growing every year,due to its unique features. Recent research in chaotic approach for metaheuris-tics mostly uses straightforwardly various chaotic maps in the place of pseudo-random number generators. The observed performance of enhanced optimizeris (significantly) different, mostly the chaotic maps secured very fast progresstowards function extreme, but often followed by premature convergence, thusoverall statistics has given mixed results. Nevertheless, as reported in [106], thethe chaos driven heuristics is performing very well [104,107], especially for someinstances in the discrete domain [33,72].
The CN approach is utilized to show the linkage between different individualsin the population. Interactions in a swarm/evolutionary algorithms during theoptimization process can be considered like user interactions in social networksor just people in society. The population is visualized as an evolving CN thatexhibits non-trivial features - e.g., degree distribution, clustering, and centrali-ties. These features can be then utilized for the adaptive population control aswell as parameter control during the metaheuristic run. Analysis of CNs from DEalgorithm can be found in [105,108,109,130,131]; and also in a comprehensivestudy discussing the usability of network types [110].
4.3 Automatic Inference of Fuzzy Rules
Fuzzy IF–THEN inference systems are typically constructed by consultinghuman experts, who give the related fuzzy rules, shapes of the correspondingfuzzy sets and all the other required information. However, when human expertsare not available or in the presence of numerous system components and/or rules,the definition of the inference system results to be particularly time consumingand laborious. An alternative approach is exploiting data mining methods, inorder to automatically build inference systems by leveraging available data.
In particular, here we focus on GUHA (General Unary Hypotheses Automa-ton), a method of automatic generation of hypotheses based on empirical data.GUHA is based on a particular first order logic language, which allows totreat symbolically sentences such as α appears often simultaneously with β,in most cases α implies β, α makes β very probable, etc. The GUHA method

238 S. Spolaor et al.
is implemented in the LISpMiner software [127], which is freely downloadablefrom https://lispminer.vse.cz/. Once the user provides relevant analytic ques-tions regarding the data, the LISpMiner software outputs the dependenciesbetween the variables that are supported by the data. In practice, LISpMinerruns through millions of fourfold contingency tables, from which it outputs thosewhich support the dependence provided by the user. From these findings, theIF-THEN inference system can then be constructed.
GUHA and LISpMiner were already successfully employed in different fields[127]: in the context of human cell modeling, this approach could be exploitedin order to automatically build large fuzzy inference systems. In particular, thisdata mining method could leverage the vast availability of transcriptomic data[54], which nowadays can be generated in short time, for a reasonable cost andat single-cell resolution [113]. In such a way, we envision that the automaticgeneration of large-scale dynamic fuzzy models of cellular processes would befeasible. Such models would represent a significant step forward towards theintegration of cellular processes that are not known in full mechanistic detail, ornecessitate of a qualitative or semi-quantitative representation, inside a unifiedframework for human cell modelling and simulation.
4.4 Multiformalism Approaches
Given the complexity and the heterogeneity of the sub-problems that charac-terize the challenge posed by whole-cell modeling, a promising approach can beprovided by multiformalism modeling [46]. Multiformalism modeling offers thepossibility of obtaining complex models by allowing the coexistence of differ-ent modeling formalisms in the same model, using model composition, modelgeneration, model abstraction on the basis of different supporting mechanisms.Multiformalism approaches allow the representation of each subsystem with themost appropriate representation, or with the description that is more familiarfor the developer of that submodel, easing the interaction between experts fromdifferent domains without forcing any of them to relinquish established model-ing practices: this allows to preserve existing know how and minimizes the effortneeded to integrate the overall model, that is a process that is supported by aproper specialist in formalism design. Multiformalism models may be supportedby closed frameworks [25,102,125], that support a predefined set of formalisms,or by open frameworks [6,42], that are designed to allow the definition of newformalisms.
The solution, or analysis, of multiformalism models may be performed bygenerating a specific solvable model, by generating or instantiating a simula-tion tool, by orchestrating specific solvers for different submodels, by producingexecutable code. Solution can be obtained by means of simulation, analyticaltechniques or by applying multisolution, that is the possibility of using alter-nate tools, explicitly decided by the modeler or automatically chosen accordingto the characteristics of the model, to perform the analysis. This approach alsopreserves, in general, tracking of numerical results back to logical elements in themodel, and can provide model-wide or submodel-wide results, such as properties

Towards Human Cell Simulation 239
of parts of the system that emerge from element-related results, and may alsobe used to interface existing tools with new solvers, extending their applicabil-ity [10]. Multiformalism modeling approaches may support combinatorial for-malisms [125], logic modeling [25], discrete state space based formalisms [6,42],continuous state space based formalisms [6], and hybrid formalisms [8] (thatmay use specialized solution techniques [9]). More details about multiformalismmodeling concepts and principles are available for the reader in [46] and [101].For a similar and wider concept, namely multiparadigm modeling, the reader canrefer to [75].
5 Future Developments
In this chapter we described a putative hybrid modeling and simulation frame-work—exploiting several different approaches (e.g., RMBs, CBMs, boolean andfuzzy rules) and leveraging High-Performance Computing—designed to performlarge-scale cell simulations. In this context, we highlighted some issues that pre-vent the simulation of whole-cell models, proposing some approaches in order toachieve this challenging task.
In particular, we propose the use of population-based metaheuristics forglobal optimization to estimate the large number of missing kinetic parame-ters. The emphasis in future research will be on modifying and testing robustalgorithms based on DE/DISH inspired by techniques successfully adopted forsolving highly constrained, large-scale and multi-objective problems. We willcompare this class of algorithms against swarm intelligence techniques (e.g., PSO[94] and FST-PSO [80]) that were shown to be the most effective in previousempirical studies [35,83].
Furthermore, a thorough analysis of the relatively good results of geneticalgorithms can help to develop powerful metaheuristics. Moreover, it is neces-sary to emphasize the fact that, like most of the above mentioned metaheuristicmethods, they are inspired by natural evolution, and their development can beconsidered as a form of evolution. Such a fact is mentioned in the paper [93]that even incremental steps in algorithm development, including failures, maybe the inspiration for the development of robust and powerful metaheuristics.Future directions in DE can be discussed not only in the journals like Swarm andEvolutionary Computation, IEEE Transactions on Evolutionary Computation,or Evolutionary Computation, but also at forthcoming conferences like Swarm,Evolutionary and Memetic Computing Conference (SEMCCO), IEEE Congresson Evolutionary Computation (CEC), and The Genetic and Evolutionary Com-putation Conference (GECCO), all forthcoming also for year 2019.
A lot of work still needs to be done, in order to achieve a faithful repre-sentation of a human cell in silico. The unified approach that we propose inthis work, although challenging to achieve and possibly able to capture a widevariety of cellular behaviors, must be considered just as a starting point. Asa matter of fact, many additional layers of complexity can still be considered.We assume that the biochemical systems is well-stirred, but this is often not

240 S. Spolaor et al.
the case. Spatial modeling and simulation can be leveraged to capture the orga-nization in space of molecules (e.g., membrane receptors), cell organelles andcell shape itself. The combinatorial complexity of the formation of huge proteincomplexes or bio-polymers can also be tackled by means of specific modeling[40] and simulation frameworks [111]. Moreover, cells are not closed systems:they respond to environmental cues and they continuously interact with withother cells by exchanging chemical signals. Furthermore, cell’s life cycle is coor-dinated by a complex cell cycle program, that allows them to grow and divide,and they are constantly subjected to the evolutionary pressure posed by theenvironment. External signals and cell cycle both require additional complexmodeling approaches that are currently not considered in our approach. Whilstwe envision that human cell simulation will remain a challenging task for thecoming decades, we are working in that direction as it carries the promise ofelucidating the very basic mechanisms governing the functioning of our bodiesand life itself.
Acknowledgements. This chapter is based upon work from the COST Action IC1406cHiPSet, supported by COST (European Cooperation in Science and Technology). Theauthor AZ acknowledges the financial support from the Slovenian Research Agency(research core funding No. P2-0041). AZ also acknowledges EU support under projectno. 5442-24/2017/6 (HPC – RIVR). This chapter is also based upon work from COSTAction CA15140 “Improving Applicability of Nature-Inspired Optimisation by JoiningTheory and Practice (ImAppNIO)” supported by COST. The authors RS and ZKOalso acknowledges that work was supported by the Ministry of Education, Youth andSports of the Czech Republic within the National Sustainability Programme ProjectNo. LO1303 (MSMT-7778/2014), further supported by the European Regional Devel-opment Fund under the Project CEBIA-Tech no. CZ.1.05/2.1.00/03.0089. Furtherauthors TK and AV acknowledges the support of Internal Grant Agency of TomasBata University under the Projects no. IGA/CebiaTech/2019/002.
References
1. Al-Dabbagh, R.D., Neri, F., Idris, N., Baba, M.S.: Algorithmic design issues inadaptive differential evolution schemes: review and taxonomy. Swarm Evol. Com-put. (2018). https://doi.org/10.1016/j.swevo.2018.03.008
2. Albert, R., Barabasi, A.L.: Statistical mechanics of complex networks. Rev. Mod.Phys. 74(1), 47 (2002)
3. Aldridge, B.B., Saez-Rodriguez, J., Muhlich, J.L., Sorger, P.K., Lauffenburger,D.A.: Fuzzy logic analysis of kinase pathway crosstalk in TNF/EGF/insulin-induced signaling. PLoS Comput. Biol. 5(4), e1000340 (2009)
4. Awad, N.H., Ali, M.Z., Suganthan, P.N., Reynolds, R.G.: An ensemble sinusoidalparameter adaptation incorporated with L-SHADE for solving CEC2014 bench-mark problems. In: 2016 IEEE Congress on Evolutionary Computation (CEC),pp. 2958–2965. IEEE (2016)
5. Barabasi, A.L., Oltvai, Z.N.: Network biology: understanding the cell’s functionalorganization. Nat. Rev. Genet. 5(2), 101 (2004)
6. Barbierato, E., Bobbio, A., Gribaudo, M., Iacono, M.: Multiformalism to supportsoftware rejuvenation modeling, pp. 271–276 (2012)

Towards Human Cell Simulation 241
7. Barbierato, E., Gribaudo, M., Iacono, M.: Modeling and evaluating the effectsof Big Data storage resource allocation in global scale cloud architectures. Int.J. Data Warehous. Min. 12(2), 1–20 (2016). https://doi.org/10.4018/IJDWM.2016040101
8. Barbierato, E., Gribaudo, M., Iacono, M.: Modeling hybrid systems inSIMTHESys. Electron. Notes Theor. Comput. Sci. 327, 5–25 (2016)
9. Barbierato, E., Gribaudo, M., Iacono, M.: Simulating hybrid systems withinSIMTHESys multi-formalism models. In: Fiems, D., Paolieri, M., Platis, A.N.(eds.) EPEW 2016. LNCS, vol. 9951, pp. 189–203. Springer, Cham (2016).https://doi.org/10.1007/978-3-319-46433-6 13
10. Barbierato, E., Gribaudo, M., Iacono, M., Jakobik, A.: Exploiting CloudSim in amultiformalism modeling approach for cloud based systems. Simul. Model. Pract.Theory (2018)
11. Benkner, S., et al.: PEPPHER: Efficient and productive usage of hybrid com-puting systems. IEEE Micro 31(5), 28–41 (2011). https://doi.org/10.1109/MM.2011.67
12. Besozzi, D.: Reaction-based models of biochemical networks. In: Beckmann, A.,Bienvenu, L., Jonoska, N. (eds.) CiE 2016. LNCS, vol. 9709, pp. 24–34. Springer,Cham (2016). https://doi.org/10.1007/978-3-319-40189-8 3
13. Bobbio, A., Cerotti, D., Gribaudo, M., Iacono, M., Manini, D.: Markovian agentmodels: a dynamic population of interdependent Markovian agents. In: Al-Begain,K., Bargiela, A. (eds.) Seminal Contributions to Modelling and Simulation.SFMA, pp. 185–203. Springer, Cham (2016). https://doi.org/10.1007/978-3-319-33786-9 13
14. Bordon, J., Moskon, M., Zimic, N., Mraz, M.: Fuzzy logic as a computationaltool for quantitative modelling of biological systems with uncertain kinetic data.IEEE/ACM Trans. Comput. Biol. Bioinform. 12(5), 1199–1205 (2015)
15. Bowers, K.J., et al.: Scalable algorithms for molecular dynamics simulations oncommodity clusters. In: Proceedings of the ACM/IEEE SC 2006 Conference, p.43. IEEE (2006)
16. Brest, J., Greiner, S., Boskovic, B., Mernik, M., Boskovic, V.: Self-adapting con-trol parameters in differential evolution: a comparative study on numerical bench-mark problems. IEEE Trans. Evol. Comput. 10(6), 646–657 (2006)
17. Brest, J., Korosec, P., Silc, J., Zamuda, A., Boskovic, B., Maucec, M.S.: Differen-tial evolution and differential ant-stigmergy on dynamic optimisation problems.Int. J. Syst. Sci. 44(4), 663–679 (2013)
18. Brest, J., Maucec, M.S., Boskovic, B.: Single objective real-parameter optimiza-tion: algorithm jSO. In: 2017 IEEE Congress on Evolutionary Computation(CEC), pp. 1311–1318. IEEE (2017)
19. Cash, J.R.: Backward differentiation formulae. In: Engquist, B. (ed.) Encyclopediaof Applied and Computational Mathematics, pp. 97–101. Springer, Heidelberg(2015). https://doi.org/10.1007/978-3-540-70529-1 94. Computational Science &Engineering, 1 (edn.) Springer, Heidelberg
20. Cazzaniga, P., et al.: Computational strategies for a system-level understandingof metabolism. Metabolites 4(4), 1034–1087 (2014)
21. Cerotti, D., Gribaudo, M., Bobbio, A., Calafate, C.T., Manzoni, P.: A Marko-vian agent model for fire propagation in outdoor environments. In: Aldini, A.,Bernardo, M., Bononi, L., Cortellessa, V. (eds.) EPEW 2010. LNCS, vol. 6342, pp.131–146. Springer, Heidelberg (2010). https://doi.org/10.1007/978-3-642-15784-4 9

242 S. Spolaor et al.
22. Chellaboina, V., Bhat, S., Haddad, W., Bernstein, D.: Modeling and analysis ofmass-action kinetics. IEEE Control Syst. Mag. 29(4), 60–78 (2009). https://doi.org/10.1109/MCS.2009.932926
23. Chiappino-Pepe, A., Pandey, V., Ataman, M., Hatzimanikatis, V.: Integrationof metabolic, regulatory and signaling networks towards analysis of perturbationand dynamic responses. Curr. Opin. Syst. Biol. 2, 59–66 (2017)
24. Chrysos, G.: Intel R© Xeon PhiTM Coprocessor-the Architecture. Intel Whitepaper(2014)
25. Ciardo, G., Jones III, R.L., Miner, A.S., Siminiceanu, R.I.: Logic and stochasticmodeling with smart. Perform. Eval. 63(6), 578–608 (2006)
26. Conti, V., Ruffo, S.S., Vitabile, S., Barolli, L.: BIAM: a new bio-inspired anal-ysis methodology for digital ecosystems based on a scale-free architecture. SoftComput. 23, 1–18 (2017)
27. Cordero, F., Manini, D., Gribaudo, M.: Modeling biological pathways: an object-oriented likemethodology based onmean field analysis. In: 2009Third InternationalConference on Advanced Engineering Computing and Applications in Sciences, pp.117–122, October 2009. https://doi.org/10.1109/ADVCOMP.2009.25
28. Cordero, F., Fornari, C., Gribaudo, M., Manini, D.: Markovian agents popula-tion models to study cancer evolution. In: Sericola, B., Telek, M., Horvath, G.(eds.) Analytical and Stochastic Modeling Techniques and Applications, pp. 16–32. Springer, Cham (2014). https://doi.org/10.1007/978-3-319-08219-6 2
29. Coulier, A., Hellander, A.: Orchestral: a lightweight framework for parallel simu-lations of cell-cell communication. arXiv preprint arXiv:1806.10889 (2018)
30. Dada, J.O., Mendes, P.: Multi-scale modelling and simulation in systems biology.Integr. Biol. 3(2), 86–96 (2011)
31. Das, S., Abraham, A., Chakraborty, U.K., Konar, A.: Differential evolution usinga neighborhood-based mutation operator. IEEE Trans. Evol. Comput. 13(3), 526–553 (2009)
32. Das, S., Mullick, S.S., Suganthan, P.N.: Recent advances in differential evolution– an updated survey. Swarm Evol. Comput. 27, 1–30 (2016)
33. Davendra, D., Bialic-Davendra, M., Senkerik, R.: Scheduling the lot-streamingflowshop scheduling problem with setup time with the chaos-induced enhanceddifferential evolution. In: 2013 IEEE Symposium on Differential Evolution (SDE),pp. 119–126. IEEE (2013)
34. De Nooy, W., Mrvar, A., Batagelj, V.: Exploratory Social Network Analysis withPajek. Cambridge University Press, Cambridge (2018)
35. Drager, A., Kronfeld, M., Ziller, M.J., Supper, J., Planatscher, H., Magnus, J.B.:Modeling metabolic networks in C. glutamicum: a comparison of rate laws incombination with various parameter optimization strategies. BMC Syst. Biol.3(1), 5 (2009)
36. Dubrovin, T., Jolma, A., Turunen, E.: Fuzzy model for real-time reservoir oper-ation. J. Water Resour. Plan. Manag. 128(1), 66–73 (2002)
37. Eldar, A., Elowitz, M.B.: Functional roles for noise in genetic circuits. Nature467(7312), 167 (2010)
38. Elf, J., Ehrenberg, M.: Spontaneous separation of bi-stable biochemical systemsinto spatial domains of opposite phases. IEE Proc.-Syst. Biol. 1(2), 230–236 (2004)
39. Elowitz, M.B., Levine, A.J., Siggia, E.D., Swain, P.S.: Stochastic gene expressionin a single cell. Science 297(5584), 1183–1186 (2002)
40. Faeder, J.R., Blinov, M.L., Hlavacek, W.S.: Rule-based modeling of biochemi-cal systems with BioNetGen. In: Maly, I. (ed.) Systems Biology, pp. 113–167.Springer, Heidelberg (2009). https://doi.org/10.1007/978-1-59745-525-1 5

Towards Human Cell Simulation 243
41. Fisher, C.P., Plant, N.J., Moore, J.B., Kierzek, A.M.: QSSPN: dynamic simulationof molecular interaction networks describing gene regulation, signalling and whole-cell metabolism in human cells. Bioinformatics 29(24), 3181–3190 (2013)
42. Franceschinis, G., Gribaudo, M., Iacono, M., Marrone, S., Mazzocca, N., Vit-torini, V.: Compositional modeling of complex systems: contact center scenariosin OsMoSys. In: ICATPN 2004, pp. 177–196 (2004)
43. Gillespie, D.T.: A general method for numerically simulating the stochastic timeevolution of coupled chemical reactions. J. Comput. Phys. 22(4), 403–434 (1976)
44. Gillespie, D.T.: Approximate accelerated stochastic simulation of chemicallyreacting systems. J. Chem. Phys. 115(4), 1716–1733 (2001)
45. Goncalves, E., et al.: Bridging the layers: towards integration of signal transduc-tion, regulation and metabolism into mathematical models. Mol. BioSyst. 9(7),1576–1583 (2013)
46. Gribaudo, M., Iacono, M.: An introduction to multiformalism modeling (2013)47. Gribaudo, M., Iacono, M., Levis, A.H.: An IoT-based monitoring approach for
cultural heritage sites: the Matera case. Concurr. Comput.: Pract. Exp. 29, e4153(2017). https://doi.org/10.1002/cpe.4153
48. Gropp, W., Lusk, E., Skjellum, A.: Using MPI: Portable Parallel Programmingwith the Message-Passing Interface, vol. 1. MIT Press, Cambridge (1999)
49. Guimera, R., Amaral, L.A.N.: Functional cartography of complex metabolic net-works. Nature 433(7028), 895 (2005)
50. Guo, S.M., Tsai, J.S.H., Yang, C.C., Hsu, P.H.: A self-optimization approach forL-SHADE incorporated with eigenvector-based crossover and successful-parent-selecting framework on CEC 2015 benchmark set. In: 2015 IEEE Congress onEvolutionary Computation (CEC), pp. 1003–1010. IEEE (2015)
51. Hadoop, A.: Apache Hadoop project. https://hadoop.apache.org/. Accessed 03Nov 2018
52. Harris, L.A., Clancy, P.: A “partitioned leaping” approach for multiscale modelingof chemical reaction dynamics. J. Chem. Phys. 125(14), 144107 (2006)
53. Harris, L.A., et al.: GPU-powered model analysis with PySB/cupSODA. Bioin-formatics 33(21), 3492–3494 (2017)
54. Hecker, M., Lambeck, S., Toepfer, S., Van Someren, E., Guthke, R.: Gene regu-latory network inference: data integration in dynamic models review. Biosystems96(1), 86–103 (2009)
55. Horvath, A., Manini, D.: Parameter estimation of kinetic rates in stochastic reac-tion networks by the EM method. In: International Conference on BioMedicalEngineering and Informatics, BMEI 2008, vol. 1, pp. 713–717. IEEE (2008)
56. European Bioinformatics Institute: EMBL-EBI annual scientific report2013. https://www.embl.fr/aboutus/communication outreach/publications/ebiar/ebi ar 2013.pdf. Accessed 07 Dec 2018
57. Jeong, H., Tombor, B., Albert, R., Oltvai, Z.N., Barabasi, A.L.: The large-scaleorganization of metabolic networks. Nature 407(6804), 651 (2000)
58. Karr, J.R., et al.: A whole-cell computational model predicts phenotype fromgenotype. Cell 150(2), 389–401 (2012)
59. Kauffman, K.J., Prakash, P., Edwards, J.S.: Advances in flux balance analysis.Curr. Opin. Biotechnol. 14(5), 491–496 (2003)
60. Kessler, C., et al.: Programmability and performance portability aspects of het-erogeneous multi-/manycore systems. In: Design, Automation & Test in EuropeConference & Exhibition (DATE), pp. 1403–1408. IEEE (2012)
61. Kitano, H.: Systems biology: a brief overview. Science 295(5560), 1662–1664(2002)

244 S. Spolaor et al.
62. Klamt, S., Saez-Rodriguez, J., Gilles, E.D.: Structural and functional analysis ofcellular networks with CellNetAnalyzer. BMC Syst. Biol. 1(1), 2 (2007)
63. Kuffner, R., Petri, T., Windhager, L., Zimmer, R.: Petri nets with fuzzy logic(PNFL): reverse engineering and parametrization. PLoS ONE 5(9), e12807 (2010)
64. Lacroix, V., Cottret, L., Thebault, P., Sagot, M.F.: An introduction to metabolicnetworks and their structural analysis. IEEE/ACM Trans. Comput. Biol. Bioin-form. (TCBB) 5(4), 594–617 (2008)
65. Li, K.B.: ClustalW-MPI: ClustalW analysis using distributed and parallelcomputing. Bioinformatics 19(12), 1585–1586 (2003). https://doi.org/10.1093/bioinformatics/btg192
66. Liu, F., Heiner, M., Yang, M.: Fuzzy stochastic Petri nets for modeling biologicalsystems with uncertain kinetic parameters. PloS ONE 11(2), e0149674 (2016)
67. Macklin, D.N., Ruggero, N.A., Covert, M.W.: The future of whole-cell modeling.Curr. Opin. Biotechnol. 28, 111–115 (2014)
68. Mallipeddi, R., Suganthan, P.N., Pan, Q.K., Tasgetiren, M.F.: Differential evolu-tion algorithm with ensemble of parameters and mutation strategies. Appl. SoftComput. 11(2), 1679–1696 (2011)
69. Marx, V.: Biology: the big challenges of big data. Nature 498, 255–260 (2013)70. Memeti, S., Li, L., Pllana, S., Kolodziej, J., Kessler, C.: Benchmarking OpenCL,
OpenACC, OpenMP, and CUDA: programming productivity, performance, andenergy consumption. In: Proceedings of the 2017 Workshop on Adaptive ResourceManagement and Scheduling for Cloud Computing, ARMS-CC 2017, pp. 1–6.ACM, New York (2017). https://doi.org/10.1145/3110355.3110356
71. Memeti, S., Pllana, S.: Accelerating DNA sequence analysis using Intel R© XeonPhiTM. In: 2015 IEEE Trustcom/BigDataSE/ISPA, vol. 3, pp. 222–227, August2015
72. Metlicka, M., Davendra, D.: Chaos driven discrete artificial bee algorithm forlocation and assignment optimisation problems. Swarm Evol. Comput. 25, 15–28(2015)
73. Mininno, E., Neri, F., Cupertino, F., Naso, D.: Compact differential evolution.IEEE Trans. Evol. Comput. 15(1), 32–54 (2011)
74. Morris, M.K., Saez-Rodriguez, J., Sorger, P.K., Lauffenburger, D.A.: Logic-basedmodels for the analysis of cell signaling networks. Biochemistry 49(15), 3216–3224(2010)
75. Mosterman, P.J., Vangheluwe, H.: Computer automated multi-paradigm model-ing: an introduction. Simulation 80(9), 433–450 (2004). https://doi.org/10.1177/0037549704050532
76. Nobile, M.S., Besozzi, D., Cazzaniga, P., Mauri, G.: GPU-accelerated simulationsof mass-action kinetics models with cupSODA. J. Supercomput. 69(1), 17–24(2014)
77. Nobile, M.S., Cazzaniga, P., Tangherloni, A., Besozzi, D.: Graphics processingunits in bioinformatics, computational biology and systems biology. Brief. Bioin-form. 18(5), 870–885 (2017). https://doi.org/10.1093/bib/bbw058
78. Nobile, M.S., Besozzi, D., Cazzaniga, P., Mauri, G., Pescini, D.: A GPU-basedmulti-swarm PSO method for parameter estimation in stochastic biological sys-tems exploiting discrete-time target series. In: Giacobini, M., Vanneschi, L., Bush,W.S. (eds.) EvoBIO 2012. LNCS, vol. 7246, pp. 74–85. Springer, Heidelberg(2012). https://doi.org/10.1007/978-3-642-29066-4 7

Towards Human Cell Simulation 245
79. Nobile, M.S., Besozzi, D., Cazzaniga, P., Mauri, G., Pescini, D.: Estimating reac-tion constants in stochastic biological systems with a multi-swarm PSO runningon GPUs. In: Proceedings of the 14th Annual Conference Companion on Geneticand Evolutionary Computation, pp. 1421–1422. ACM (2012)
80. Nobile, M.S., Cazzaniga, P., Besozzi, D., Colombo, R., Mauri, G., Pasi, G.: Fuzzyself-tuning PSO: a settings-free algorithm for global optimization. Swarm Evol.Comput. 39, 70–85 (2018)
81. Nobile, M.S., Cazzaniga, P., Besozzi, D., Pescini, D., Mauri, G.: cuTauLeaping:a GPU-powered tau-leaping stochastic simulator for massive parallel analyses ofbiological systems. PLoS ONE 9(3), e91963 (2014)
82. Nobile, M.S., Mauri, G.: Accelerated analysis of biological parameters space usingGPUs. In: Malyshkin, V. (ed.) PaCT 2017. LNCS, vol. 10421, pp. 70–81. Springer,Cham (2017). https://doi.org/10.1007/978-3-319-62932-2 6
83. Nobile, M.S., et al.: Computational intelligence for parameter estimation of bio-chemical systems. In: 2018 IEEE Congress on Evolutionary Computation (CEC),pp. 1–8. IEEE (2018)
84. NVIDIA: CUDA C Programming Guide, September 2016. http://docs.nvidia.com/cuda/cuda-c-programming-guide/. Accessed 06 Nov 2018
85. NVIDIA: What is GPU-Accelerated Computing? April 2017. http://www.nvidia.com/object/what-is-gpu-computing.html. Accessed 03 Nov 2018
86. O’Driscoll, A., et al.: HBLAST: parallelised sequence similarity–a HadoopMapReducable basic local alignment search tool. J. Biomed. Inform. 54, 58–64 (2015). https://doi.org/10.1016/j.jbi.2015.01.008, http://www.sciencedirect.com/science/article/pii/S1532046415000106
87. Opara, K.R., Arabas, J.: Differential evolution: a survey of theoretical analyses.Swarm Evol. Comput. (2018). https://doi.org/10.1016/j.swevo.2018.06.010
88. OpenMP: OpenMP 4.0 Specifications, July 2013. http://www.openmp.org/specifications/. Accessed 10 Mar 2018
89. Padua, D.: Encyclopedia of Parallel Computing. Springer, Heidelberg (2011)90. Piotrowski, A.P.: Review of differential evolution population size. Swarm Evol.
Comput. 32, 1–24 (2017)91. Piotrowski, A.P.: aL-SHADE optimization algorithms with population-wide iner-
tia. Inf. Sci. 468, 117–141 (2018)92. Piotrowski, A.P., Napiorkowski, J.J.: Some metaheuristics should be simplified.
Inf. Sci. 427, 32–62 (2018)93. Piotrowski, A.P., Napiorkowski, J.J.: Step-by-step improvement of JADE and
SHADE-based algorithms: success or failure? Swarm Evol. Comput. (2018).https://doi.org/10.1016/j.swevo.2018.03.007
94. Poli, R., Kennedy, J., Blackwell, T.: Particle swarm optimization. Swarm Intell.1(1), 33–57 (2007)
95. Poovathingal, S.K., Gunawan, R.: Global parameter estimation methods forstochastic biochemical systems. BMC Bioinform. 11(1), 414 (2010)
96. Provost, A., Bastin, G.: Metabolic flux analysis: an approach for solving non-stationary underdetermined systems. In: CD-Rom Proceedings 5th MATHMODConference, Paper, vol. 207. Citeseer (2006)
97. Qin, A.K., Huang, V.L., Suganthan, P.N.: Differential evolution algorithm withstrategy adaptation for global numerical optimization. IEEE Trans. Evol. Com-put. 13(2), 398–417 (2009)
98. Qu, B.Y., Suganthan, P.N., Liang, J.J.: Differential evolution with neighborhoodmutation for multimodal optimization. IEEE Trans. Evol. Comput. 16(5), 601–614 (2012)

246 S. Spolaor et al.
99. Saastamoinen, K., Ketola, J., Turunen, E.: Defining athlete’s anaerobic and aer-obic thresholds by using similarity measures and differential evolution. In: 2004IEEE International Conference on Systems, Man and Cybernetics, vol. 2, pp.1331–1335. IEEE (2004)
100. Sadasivam, G.S., Baktavatchalam, G.: A novel approach to multiple sequencealignment using Hadoop data grids. In: Proceedings of the 2010 Workshop onMassive Data Analytics on the Cloud, MDAC 2010, pp. 2:1–2:7. ACM, New York(2010). https://doi.org/10.1145/1779599.1779601
101. Sanders, W.H.: Integrated frameworks for multi-level and multi-formalism mod-eling. In: Proceedings 8th International Workshop on Petri Nets and PerformanceModels (Cat. No. PR00331), pp. 2–9, September 1999. https://doi.org/10.1109/PNPM.1999.796527
102. Sanders, W.H., Courtney, T., Deavours, D.D., Daly, D., Derisavi, S., Lam, V.V.:Multi-formalism and multi-solution-method modeling frameworks: the Mobiusapproach (2003)
103. Schilling, C.H., Letscher, D., Palsson, B.Ø.: Theory for the systemic definitionof metabolic pathways and their use in interpreting metabolic function from apathway-oriented perspective. J. Theor. Biol. 203(3), 229–248 (2000)
104. Senkerik, R., Pluhacek, M., Oplatkova, Z.K., Davendra, D., Zelinka, I.: Investi-gation on the differential evolution driven by selected six chaotic systems in thetask of reactor geometry optimization. In: 2013 IEEE Congress on EvolutionaryComputation (CEC), pp. 3087–3094. IEEE (2013)
105. Senkerik, R., Viktorin, A., Pluhacek, M., Janostik, J., Davendra, D.: On theinfluence of different randomization and complex network analysis for differentialevolution. In: 2016 IEEE Congress on Evolutionary Computation (CEC), pp.3346–3353. IEEE (2016)
106. Senkerik, R., Viktorin, A., Pluhacek, M., Kadavy, T., Oplatkova, Z.K.: Differentialevolution and chaotic series. In: 2018 25th International Conference on Systems,Signals and Image Processing (IWSSIP), pp. 1–5. IEEE (2018)
107. Senkerik, R., Zelinka, I., Pluhacek, M., Davendra, D., Oplatkova Kominkova,Z.: Chaos enhanced differential evolution in the task of evolutionary control ofselected set of discrete chaotic systems. Sci. World J. 2014, 1–12 (2014)
108. Skanderova, L., Fabian, T.: Differential evolution dynamics analysis by complexnetworks. Soft Comput. 21(7), 1817–1831 (2017)
109. Skanderova, L., Fabian, T., Zelinka, I.: Differential evolution dynamics modeledby longitudinal social network. J. Intell. Syst. 26(3), 523–529 (2017)
110. Skanderova, L., Fabian, T., Zelinka, I.: Analysis of causality-driven changes ofdiffusion speed in non-Markovian temporal networks generated on the basis ofdifferential evolution dynamics. Swarm Evol. Comput. 44, 212–227 (2018)
111. Sneddon, M.W., Faeder, J.R., Emonet, T.: Efficient modeling, simulation andcoarse-graining of biological complexity with NFsim. Nat. Methods 8(2), 177(2011)
112. Spark, A.: Apache Spark project. https://spark.apache.org/. Accessed 03 Nov2018
113. Stegle, O., Teichmann, S.A., Marioni, J.C.: Computational and analytical chal-lenges in single-cell transcriptomics. Nat. Rev. Genet. 16(3), 133 (2015)
114. Stelling, J.: Mathematical models in microbial systems biology. Curr. Opin. Micro-biol. 7(5), 513–518 (2004)
115. Stone, J.E., Gohara, D., Shi, G.: OpenCL: a parallel programming standard forheterogeneous computing systems. Comput. Sci. Eng. 12(1–3), 66–73 (2010)

Towards Human Cell Simulation 247
116. Storn, R., Price, K.: Differential evolution–a simple and efficient heuristic forglobal optimization over continuous spaces. J. Glob. Optim. 11, 341–359 (1997)
117. Swainston, N., et al.: Recon 2.2: from reconstruction to model of humanmetabolism. Metabolomics 12(7), 109 (2016)
118. Szallasi, Z., Stelling, J., Periwal, V.: System Modeling in Cellular Biology: FromConcepts to Nuts and Bolts. The MIT Press, Cambridge (2006)
119. Talay, D.: Numerical Solution of Stochastic Differential Equations. Taylor & Fran-cis, Milton Park (1994)
120. Tanabe, R., Fukunaga, A.: Success-history based parameter adaptation for differ-ential evolution. In: 2013 IEEE Congress on Evolutionary Computation (CEC),pp. 71–78. IEEE (2013)
121. Tanabe, R., Fukunaga, A.S.: Improving the search performance of SHADE usinglinear population size reduction. In: 2014 IEEE Congress on Evolutionary Com-putation (CEC), pp. 1658–1665. IEEE (2014)
122. Tanabe, R., Fukunaga, A.S.: How far are we from an optimal, adaptive DE? In:14th International Conference on Parallel Problem Solving from Nature (PPSNXIV). IEEE (2016, accepted)
123. Tangherloni, A., Nobile, M.S., Besozzi, D., Mauri, G., Cazzaniga, P.: LASSIE:simulating large-scale models of biochemical systems on GPUs. BMC Bioinform.18(1), 246 (2017)
124. Teijeiro, D., Pardo, X.C., Penas, D.R., Gonzalez, P., Banga, J.R., Doallo, R.: Acloud-based enhanced differential evolution algorithm for parameter estimationproblems in computational systems biology. Clust. Comput. 20(3), 1937–1950(2017)
125. Trivedi, K.S.: SHARPE 2002: symbolic hierarchical automated reliability andperformance evaluator. In: Proceedings International Conference on DependableSystems and Networks, p. 544, June 2002. https://doi.org/10.1109/DSN.2002.1028975
126. Turunen, E.: Mathematics Behind Fuzzy Logic. Physica-Verlag, Heidelberg (1999)127. Turunen, E.: Using GUHA data mining method in analyzing road traffic accidents
occurred in the years 2004–2008 in Finland. Data Sci. Eng. 2(3), 224–231 (2017)128. Vazquez, A., Liu, J., Zhou, Y., Oltvai, Z.N.: Catabolic efficiency of aerobic gly-
colysis: the Warburg effect revisited. BMC Syst. Biol. 4(1), 58 (2010)129. Viebke, A., Pllana, S.: The potential of the Intel (R) Xeon Phi for supervised
deep learning. In: 2015 IEEE 17th International Conference on High PerformanceComputing and Communications, pp. 758–765, August 2015. https://doi.org/10.1109/HPCC-CSS-ICESS.2015.45
130. Viktorin, A., Pluhacek, M., Senkerik, R.: Network based linear population sizereduction in shade. In: 2016 International Conference on Intelligent Networkingand Collaborative Systems (INCoS), pp. 86–93. IEEE (2016)
131. Viktorin, A., Senkerik, R., Pluhacek, M., Kadavy, T.: Towards better populationsizing for differential evolution through active population analysis with complexnetwork. In: Barolli, L., Terzo, O. (eds.) CISIS 2017. AISC, vol. 611, pp. 225–235.Springer, Cham (2018). https://doi.org/10.1007/978-3-319-61566-0 22
132. Viktorin, A., Senkerik, R., Pluhacek, M., Kadavy, T., Zamuda, A.: Distance basedparameter adaptation for success-history based differential evolution. Swarm Evol.Comput. https://doi.org/10.1016/j.swevo.2018.10.013. Accessed 12 Nov 2018
133. Viktorin, A., Senkerik, R., Pluhacek, M., Zamuda, A.: Steady success clusters indifferential evolution. In: 2016 IEEE Symposium Series on Computational Intel-ligence (SSCI), pp. 1–8. IEEE (2016)

248 S. Spolaor et al.
134. Vitabile, S., Conti, V., Lanza, B., Cusumano, D., Sorbello, F.: Metabolic networksrobustness: theory, simulations and results. J. Interconnect. Netw. 12(03), 221–240 (2011)
135. Vitabile, S., Conti, V., Lanza, L., Cusumano, D., Sorbello, F.: Topological infor-mation, flux balance analysis, and extreme pathways extraction for metabolicnetworks behaviour investigation. In: Workshop on Italian Neural Network, vol.234, pp. 66–73. IOS Press (2011)
136. Vitello, G., Alongi, A., Conti, V., Vitabile, S.: A bio-inspired cognitive agent forautonomous urban vehicles routing optimization. IEEE Trans. Cogn. Dev. Syst.9(1), 5–15 (2017)
137. Wiback, S.J., Palsson, B.O.: Extreme pathway analysis of human red blood cellmetabolism. Biophys. J. 83(2), 808–818 (2002)
138. Wienke, S., Springer, P., Terboven, C., an Mey, D.: OpenACC—first experienceswith real-world applications. In: Kaklamanis, C., Papatheodorou, T., Spirakis,P.G. (eds.) Euro-Par 2012. LNCS, vol. 7484, pp. 859–870. Springer, Heidelberg(2012). https://doi.org/10.1007/978-3-642-32820-6 85
139. Wolkenhauer, O.: Why model? Front. Physiol. 5, 21 (2014)140. Wu, G., Shen, X., Li, H., Chen, H., Lin, A., Suganthan, P.N.: Ensemble of differ-
ential evolution variants. Inf. Sci. 423, 172–186 (2018)141. Wynn, M.L., Consul, N., Merajver, S.D., Schnell, S.: Logic-based models in sys-
tems biology: a predictive and parameter-free network analysis method. Integr.Biol. 4(11), 1323–1337 (2012)
142. Zamuda, A., Brest, J.: Environmental framework to visualize emergent artificialforest ecosystems. Inf. Sci. 220, 522–540 (2013). https://doi.org/10.1016/j.ins.2012.07.031
143. Zamuda, A., Brest, J.: Vectorized procedural models for animated trees recon-struction using differential evolution. Inf. Sci. 278, 1–21 (2014)
144. Zamuda, A., Brest, J.: Self-adaptive control parameters’ randomization frequencyand propagations in differential evolution. Swarm Evol. Comput. 25, 72–99 (2015)
145. Zamuda, A., Hernandez Sosa, J.D.: Differential evolution and underwater gliderpath planning applied to the short-term opportunistic sampling of dynamicmesoscale ocean structures. Appl. Soft Comput. 24, 95–108 (2014)
146. Zamuda, A., Nicolau, M., Zarges, C.: A black-box discrete optimization bench-marking (BB-DOB) pipeline survey: taxonomy, evaluation, and ranking. In: Pro-ceedings of the Genetic and Evolutionary Computation Conference Companion(GECCO 2018), pp. 1777–1782 (2018)
147. Zamuda, A., Sosa, J.D.H., Adler, L.: Constrained differential evolution optimiza-tion for underwater glider path planning in sub-mesoscale eddy sampling. Appl.Soft Comput. 42, 93–118 (2016)
148. Zamuda, A., Sosa, J.D.H.: Success history applied to expert system for underwaterglider path planning using differential evolution. Expert. Syst. Appl. 119, 155–170(2019)
149. Zhang, J., Sanderson, A.C.: JADE: adaptive differential evolution with optionalexternal archive. IEEE Trans. Evol. Comput. 13(5), 945–958 (2009)
150. Zhou, Y., Liepe, J., Sheng, X., Stumpf, M.P., Barnes, C.: GPU accelerated bio-chemical network simulation. Bioinformatics 27(6), 874–876 (2011)

Towards Human Cell Simulation 249
Open Access This chapter is licensed under the terms of the Creative CommonsAttribution 4.0 International License (http://creativecommons.org/licenses/by/4.0/),which permits use, sharing, adaptation, distribution and reproduction in any mediumor format, as long as you give appropriate credit to the original author(s) and thesource, provide a link to the Creative Commons license and indicate if changes weremade.
The images or other third party material in this chapter are included in the chapter’sCreative Commons license, unless indicated otherwise in a credit line to the material. Ifmaterial is not included in the chapter’s Creative Commons license and your intendeduse is not permitted by statutory regulation or exceeds the permitted use, you willneed to obtain permission directly from the copyright holder.

Cloud-Based High Throughput VirtualScreening in Novel Drug Discovery
Abdurrahman Olğaç1,2(&) , Aslı Türe3 , Simla Olğaç4 ,and Steffen Möller5
1 Laboratory of Molecular Modeling, Evias Pharmaceutical R&D Ltd.,06830 Ankara, Turkey
[email protected] Department of Pharmaceutical Chemistry, Faculty of Pharmacy,
Gazi University, 06330 Ankara, [email protected]
3 Department of Pharmaceutical Chemistry, Faculty of Pharmacy,Marmara University, 34668 Istanbul, [email protected]
4 Department of Biochemistry, Faculty of Pharmacy,Gazi University, 06330 Ankara, Turkey
[email protected] Institute for Biostatistics and Informatics in Medicine and Ageing Research
(IBIMA), Rostock University Medical Center, 18057 Rostock, [email protected]
Abstract. Drug discovery and development requires the integration of multiplescientific and technological disciplines in chemistry, biology and extensive useof information technology. Computer Aided Drug Discovery (CADD) methodsare being used in this work area with several different workflows. Virtualscreening (VS) is one of the most often applied CADD methods used in rationaldrug design, which may be applied in early stages of drug discovery pipeline.The increasing number of modular and scalable cloud-based computationalplatforms can assist the needs in VS studies. Such platforms are being developedto try to help researchers with various types of applications to prepare and guidethe drug discovery and development pipeline. They are designed to perform VSefficiently, aimed to identify commercially available lead-like and drug-likecompounds to be acquired and tested. Chemical datasets can be built, librariescan be analyzed, and structure-based or ligand-based VS studies can be per-formed with cloud technologies. Such platforms could also be adapted to beincluded in different stages of the pharmaceutical R&D process to rationalize theneeds, e.g. to repurpose drugs, with various computational scalability options.This chapter introduces basic concepts and tools by outlining the generalworkflows of VS, and their integration to the cloud platforms. This may be aseed for further inter-disciplinary development of VS to be applied by drughunters.
Keywords: Drug discovery � Virtual screening �High performance computing � Cloud computing
© The Author(s) 2019J. Kołodziej and H. González-Vélez (Eds.): cHiPSet, LNCS 11400, pp. 250–278, 2019.https://doi.org/10.1007/978-3-030-16272-6_9

1 Introduction
Pharmaceutical drug discovery is a long-lasting and costly process, spanning over 12 to15 years and costing about 1–2 billion US Dollars [1]. The process to identify newactive pharmaceutical ingredients (API) [2] starts with target identification and vali-dation steps and follows hit identification, lead discovery and lead optimization toacquire safe and effective new drug molecules at the preclinical stage [3]. Biologicalscreening is used to identify possible target of a hit molecule as a developable drug-candidate as the first step in drug discovery. Advances in systematic biologicalscreening have generated automated parallel biological screening technologies, calledhigh throughput screening (HTS) [4]. Virtual screening (VS) is a widely appliedcomputational approach, which is performed as a hit identification method in earlystages of drug discovery pipeline. VS protocols involve searching chemical libraries toidentify hit compounds with a putative affinity for a specific biological target (enzymeor a receptor) for further development.
CADD methods in conjunction with VS studies emerged as valuable tools to speedup this long process and limit the cost expansion of R&D. Such studies demand astrong combination of computational resources and skills, biochemical understandingand medicinal motivation.
Effects of drugs in the human body are investigated with two main parameters,namely pharmacokinetics and pharmacodynamics [5]. While pharmacokinetic studiesinvestigate the fate of drug substances during absorption, distribution, metabolism andelimination (ADME) processes, pharmacodynamics determines the required concen-tration of drug to be delivered at the site of action and the biochemical and physio-logical effect, which may be responsible for the targeted biological response.
Fig. 1. Drug discovery pipeline presented together with some of the computational approacheswhich are used to rationalize the process.
Cloud-Based High Throughput Virtual Screening in Novel Drug Discovery 251

CADD implementations deal with computational calculations of both pharma-cokinetics and pharmacodynamics parameters. Therefore, ADME and even toxicity(Tox) properties of a given compound can be predicted with computational chemistryprograms prior to any experimental studies. Furthermore, in silico approaches can alsobe applied to determine the putative interactions between a ligand and a receptor(Fig. 1).
In this chapter, we briefly address challenges and applications of biochemical - andcomputational-drug discovery and development approaches, and their transformation inVS to be applied in cloud platforms.
2 Background
2.1 Drug Discovery and Development
Until the 19th century, the drug discovery and development process was based on thetrial and error learning approach for diagnosis and curing the diseases. The therapeuticeffect was completely produced with natural products (NPs) [6]. These drugs wereobtained from the whole or a fraction of the NPs that contain the active pharmaceuticalingredient [7]. Natural compounds are an important source for drugs, helped withimproved sensitivity and better means for their biochemical separation [8].
Starting with the first successful in vitro organic synthesis in laboratory by Wöhler[9], it was clear that organic compounds could be produced out of the bodies of theliving organisms. However, to synthesize chemically different organic compounds,structural information had to be explained in a more efficient way. In 1858, Kekuléproposed structural theories which successfully followed by different theories from thedifferent scientists [10] leading to the discoveries of new findings [11].
Research Paradigms in Classical Terms of Drug DiscoveryMendelian Inheritance. Gregor Mendel stated that at least one dominant or tworecessive gene pair are required for mutations causing phenotype-observable properties(e.g. diseases) [12] (Fig. 2).
Magic Bullet. The term of magic bullet was created by Paul Ehrlich, who started thefirst systematic pharmaceutical screening and won the Nobel Prize in Physiology orMedicine in 1908. He found out that chemical compounds can directly be delivered andbound only to its biological target, called ‘chemoreceptors’ [13]. In light of thisinformation, biological targets are determined to play role in the first step of the drugdiscovery depending on the developing technologies and knowledge [14] (Fig. 3).
Fig. 2. Mendelian genetics presumed phenotypic traits to depend on single genetic variation.
252 A. Olğaç et al.

Research Paradigms in Modern Terms of Drug DiscoveryPolygenicity. It has been shown that many common diseases can occur as a result ofmutations on multiple genes, such as diabetes, asthma and heart disease. Such diseasesmay develop as a result of an interplay of genetical inheritance, mutations on multiplegenes or contribution of environmental factors [15] (Fig. 4).
Magic Shotgun. The term of magic shotgun has emerged as a result of the detection ofsecondary effect properties, such as adverse effects associated with the ability of thedrug to affect multiple targets. This concept is related to the development of drugs withhigh selectivity, and to predict the potential adverse effects prior to clinical trials [16](Fig. 5).
Fig. 3. Summary of the biological understanding after the “magic bullet” approach.
Fig. 4. Common diseases are polygenic, and this is one of the biggest challenges in the field.
Fig. 5. Single compound may affect multiple targets. Such side-effects may be positive orundesired.
Cloud-Based High Throughput Virtual Screening in Novel Drug Discovery 253

Several in silico approaches have been developed to predict side-effects and torepurpose drugs that are already on the market.
Individualized Medicine. The genetic polymorphisms of drug targets, metabolizingenzymes, or transporters may explain differences in the molecular pathophysiology ofpatients, even of those who are assigned with the same diagnosis [17]. The aim is tofind drugs to compensate genetic deficiencies, i.e. to fight the disease at its roots. As oftoday, with the transcriptome and the genetic parameters obtained from a patient’stissue or blood, one can be informed about their contributions to disorders [18]. Forinstance, pharmacogenetics investigates how a genetic variation affects the binding siteof a drug. That may suggest a higher dosage because of a disturbed molecularrecognition.
Target Fishing. It can be regarded as the inverse screening wherein the ligand isprofiled against a wide array of biological targets to elucidate its molecular mechanismof action by experimental or computational means.
Drug Repositioning. An approach to identify new medicinal applications for approveddrugs to treat other diseases because the drugs may bind to other receptors.
Polypharmacology. Special ligand design approach to exert an effect on multipledisease-associated biological targets.
2.2 Molecular Recognition Theories
Key and Lock. In 1894, Emil Fischer proposed the model of key and lock for themolecules bearing potential effects on biological systems. According to this model, it isassumed that a ligand binds to the active site of its target which behaves like a key thatfits its lock [19, 20] (Fig. 6).
Induced Fit. In 1958, it was proposed by Daniel Koshland to consider the confor-mational changes during the interaction between the ligand and its biological target,which wasn’t considered in the lock-and-key theory of Fischer. In this model,optimum-compatible binding is occurred by small but expected conformational chan-ges during the interaction between the ligand and the biological target [36, 37]. Later,this specific conformation of the ligand has been referenced as the bioactive confor-mation (Fig. 7).
Fig. 6. Key and lock model.
254 A. Olğaç et al.

Thermodynamics in Ligand-Protein Binding. During the binding process of ligands totheir biological targets, it is known that conformational arrangements and desolvationoccur, with the help of specific physicochemical interactions [38] (Fig. 8).
The most important strategy in the process of developing novel drug candidates is toincrease the affinity of binding of the ligand to its target. The energy change after thebinding process is quantitatively expressed by logarithm of Kd or Ki values. Thesevalues are related to Gibbs free energy of binding [21].
DGbinding ¼ RTlnKd �RTlnKi ð1Þ
In this equation, R is the gas constant, T is the absolute temperature, Kd is theequilibrium constant and Ki is the inhibitory constant that exist in the Cheng-Prusoffequation [40].
In non-covalent thermodynamic binding process, ligand-protein binding energychange is occurred and two thermodynamic quantities, the enthalpy change (DH) andentropy change (-TDS), determine the sign and magnitude of the binding free energy[33, 39].
DGbinding ¼ DHbinding � TDSbinding ð2Þ
Fig. 7. Induced fit model.
Fig. 8. Desolvation effect and thermodynamics in ligand-protein binding.
Cloud-Based High Throughput Virtual Screening in Novel Drug Discovery 255

2.3 Chemical Space
In 1996, Regine Bohacek, generated predictions about possible chemical compoundtypes that might be chemically accessed. Her estimation was pointing to 1060 chemicalcompounds making up “chemical space” that was virtually identified by using carbon,oxygen or nitrogen atoms, and by considering linear molecules with up to 30 atoms.While making the predictions, Bohacek regarded chemical groups to be stable andchemical branches, ring structures and stereochemical possibilities were taken intoaccount [22].
In later studies, “the limits of the chemical space” was drawn to be between 1018–10200, according to the results of the analyses by different methods and descriptors.Although there are many reports about this range to be accepted as Bohacek defined.But it is expected that this number will continuously increase by the discovery of newchemical skeletons [23–26]. Additionally, the number of organic compounds accessedexperimentally is 108, according to CAS and Beilstein databases which contain recordsobtained from the scientific papers, those have been published by the scientific com-munity, since 1771 [27, 28].
2.4 Rational Drug Design
The increasing scientific knowledge for novel drug discovery has opened new horizonsand generated useful technological developments for the researchers in the field. Whenthese new tools are wisely brought together with recent knowledge, they would providemany advantages in drug design and development studies. Moreover, the availabletheoretical and experimental knowledge about drug safety and the idea of beingappropriate for human use generate extra difficulties for drug design and development[29]. It is known that not all candidate molecules with high potency can reach to a drugstatus due to several reasons such as inefficient systemic exposure, unwanted sideeffects and off-target effects. Also, a drug may not be right for every patient due to thegenetic variations and off-target binding. This also effects drugs that are already on themarket (Table 1).
However, molecular reasoning may give second chances for drugs that once failedin late clinical studies (at great expense) or that have been retracted from clinical use.With an improved molecular understanding, and with hindsight from the now feasiblepharmacogenetics and –genomics, these compounds have a chance to find their nichefor a reentry.
Conventional drug design and development approaches are associated with highaffinity binding of a ligand to its target. In rational drug discovery studies, evaluatingthe ligands by only trial-and-error approach has lost its validity and assessing theirbinding to the target related diseases is insufficient [30]. By taking control of someparameters like off-target binding, ADME-Tox and bioavailability properties of themolecules that have appropriate binding properties should also be discovered for thedrug candidates [49]. Therefore, revising the classical strategies with “rational”approaches has become substantial. This process is called reverse pharmacology ortarget-based drug discovery. In this recent approach, the questions about “Whichchemotypes will be worked on?” and “Why?” should also be considered during drug
256 A. Olğaç et al.

design and development studies, before directly evaluating the target binding propertiesof the molecules [29, 30].
3 Computer Aided Drug Design (CADD)
Development of mathematical formulas to calculate the potential and kinetic energiesof biomolecular systems has made possible the implementation of such complex cal-culations with computers [34]. CADD is applicable for hit molecule discovery for newdifferent chemotypes and for designing new derivatives.
CADD processes may be divided into molecular mechanical methods and quantummechanical methods. In both techniques, the results are obtained through energy-basedcalculations. Molecular mechanics deals with the calculations at the molecular levelthat can be performed on an atomic basis, while quantum mechanics involves electronrelated complex calculations performed at the quantum level [34].
During existence of the obscurity in drug discovery studies, it is hard to reach thedesired target. But, the physicochemical parameter as a factor can be useful about thistopic by measuring the ADME properties [30, 35]. Also, the drug-candidate should bebound to its target with high affinity [30]. In relation to that, drug design processes arecarried out within the framework of selected strategies, with the acquisition of three-dimensional bioactive conformation of the ligands. CADD is used for identifying anddesigning biologically active compounds and this field can be synergistically integratedwith all other medicinal chemistry related fields like pharmacology, biology andchemistry [36].
3.1 Ligand-Based Drug Discovery
It is possible to store the chemical and biological information in special databases topreserve the molecular features and their biological effects obtained from a series of
Table 1. Definition of the key terms related with informatic approaches used in early stage drugdiscovery.
Bioinformatics. The discipline responsible for biological data recording and interpretation using information technologies. Some of its applications on drug discovery include the de-tection of protein binding pocket, prediction of protein-protein interactions, occurrence of mutations, analysis of the biological sequences of macromolecules (e.g. similarity searches and fingerprint matches), estimation of 3D structures of biological macromolecules [31].
Cheminformatics. The discipline which accumulates and processes the chemistry related data, using information technologies. Some of its applications on drug discovery include construction of the 2D and 3D structures, storing and searching the chemical data, building chemical compound databases and datasets, QSAR / QSPR, estimation of ADME-Tox prop-erties [31]. It can also be used to map the chemical space of compound libraries.
Pharmacoinformatics. The discipline which combines the cheminformatics and bioinformat-ics tools for pharma-related processes [32, 33].
Cloud-Based High Throughput Virtual Screening in Novel Drug Discovery 257

assays. If there is no molecular level structural data about the biological target, pre-viously obtained structure-activity data can be used in CADD studies to find andanalyze the trend between the known compounds and their activity retrospectively,then to design and discover new chemical entities prospectively [37]. A main workflowof ligand-based studies addresses the generation of a model by training on a series ofcompounds and subsequent testing stage of the model with test series of compounds.Later, the generated model(s) can be validated with an external series of compoundswhich were not used during model generation. Then the model can be used to virtuallyscreen chemical databases within the applicability domain of the model (Fig. 9).
Quantitative Structure Activity/Property Relationships (QSAR/QSPR). In 1863,an approach about the relationship between chemical structure and biological activitywas proposed by Cros [38]. After that, in 1868 Crum-Brown and Fraser evaluated thiscorrelation in molecular level and described following equation to computationallypredict the biological response (U) to be identified as the function of the chemicalcompound (C) [38, 39].
U ¼ f ðCÞ ð3Þ
In the course of the history, many researchers have conducted studies to relatephysicochemical properties and biological effects of compounds with differentapproaches. Through these studies, the necessity to consider molecular substitutionshas emerged to try to explain biological effect or physicochemical property of achemical structure. In 1937, Louis Hammett compared ionization rates of benzenederivatives substituted in various positions [40]. The first quantitative parameter wasdetermined as sigma (r), the potential electronic contribution value, which is definedby calculating electronic substituent constant values. This was the first identifiedquantitative parameter [38]. Then the first steric parameter for ester hydrolysis wasdetermined by Taft as Es constant [41]. Many other two-dimensional parameters havebeen continued to be developed for being used in QSAR studies [38]. Later, a multi-parametric formula was presented by Corwin Hansch that brought these parameterstogether. The formula was designed to calculate minimal concentration needed tomathematically formulate the biological activity, as logarithm of concentration and wasmeasured with several independent factors in different cases; such as partition coeffi-cient (log P), aromatic substituent constant (p), electronic substituent constant (r),
Fig. 9. Basic workflow of ligand-based modeling applications.
258 A. Olğaç et al.

steric parameter (Es). Free-Wilson [42], Fujita-Ban [43], A Mixed Approach - Based onHansch and Free-Wilson Analysis [44], and Kubinyi Bilinear Analysis Method [45] aresome of the first generated models used in QSAR analysis.
When all the steps are evaluated, it can be observed that QSAR has differentapplications. Structural activity or physicochemical property studies performed withone independent variable are named 0D-QSAR calculations and the studies withmultivariate equations are called 1D-QSAR. In such equations, log P and Hammettconstant can be used as independent variables. Studies that take into account themolecular descriptors and fingerprints containing information about structural andbonding characteristics resulting from the two-dimensional molecular presentation arecalled 2D-QSAR, if extra structural information (e.g. chirality) is included in studiesthese studies are named as 2.5D QSAR [46].
The efforts to explain the binding orientations of the ligands have emerged 3D-QSAR, together with the help of the developments in 3D molecular understandingthrough the experimental methods, force-field methods and improved molecularvisualization technologies. Implementation of this approach is accomplished byforming equally divided grids in the 3D coordinate system and the surface interactionareas of the chemical compounds are determined by the following analysis methods[47] (Table 2).
Pharmacophore Modeling. A pharmacophore aggregates functional groups of chem-ical compounds which are responsible for the biological response and which exhibitappropriate interaction with biological target. The term pharmacophore modeling refersto the identification and 3D display of important pharmacophore groups to illustrate thebasic interactions between the ligand and the receptor. Pharmacophore modeling isgenerally applied to determine common structural features within a series of similar ordiverse molecules by subtracting 3D maps. Once determined, the generated pharma-cophore hypotheses may be used to virtually screen and to predict the biological activity
Table 2. Summary of some of the 3D-QSAR approaches.
Comparative Molecular Field Analysis (CoMFA). CoMFA is a subtype of the 3D-QSAR study, which includes steric and electronic fields (Lennard-Jones and Coulomb potentials) generated on the bioactive conformation of the compounds in the training set. In CoMFA studies, it is only possible to analyze the effects of enthalpic properties on ligand-protein binding [47].
Comparative Molecular Similarity Index Analysis (CoMSIA). To explain the structure activi-ty relationships by considering major contributions obtained by steric, electrostatic, hydro-phobic, and hydrogen bond donors (HBD) or hydrogen bond acceptors (HBA) properties are added into CoMFA and this generated CoMSIA analysis [48].
Receptor-based QSAR. In this study model, which is carried out using a combination of ligand-based and structure-based approaches, bioactive conformation of the ligands is ob-tained by structure-based methods. Afterwards, 3D-QSAR studies are conducted through this bioactive conformation [47].
Cloud-Based High Throughput Virtual Screening in Novel Drug Discovery 259

of other molecules [37]. The model is generally obtained from the information belongingto the ligands. However, it is also possible to generate a pharmacophore model from thereceptor itself or with a combined approach as well.
After the formation of possible bioactive conformers of the compounds, pharma-cophore model can be generated in 3D by aligning the structures and mapping the 3Dbinding properties. More than one pharmacophore hypothesis can be generated and themost suitable one(s) can be identified by enrichment factor within their applicabilitydomain. While generating the model(s), the optimum volume of each pharmacophoreproperty takes the major interest.
The aim of pharmacophore modeling is to determine the optimum volume for theidentified properties. If identified volumes are larger than required, the selectivity ofactive compounds by this model decreases and active and inactive compounds can befound together by using this model. Conversely, if the fields are smaller than they needto be, the active compounds cannot be identified by pharmacophore screening. Whilecreating a pharmacophore model; HBA and HBD features, hydrophobic (aliphatic oraromatic) properties and negative/positive charges can be used. Besides, it is possibleto identify the desirable/undesirable regions or features without any specificity [37].Most pharmacophore modeling programs create these properties according to opti-mized ligand-receptor interactions. The ideas behind pharmacophores are also appliedto specify new compounds that aggregate as many pharmacophores, e.g. from a seriesof in silico ligand docking experiments or after a first in vitro validation. The assemblyof new compounds can be iterative, i.e. growing from existing binders, or starting a denovo design of novel drugs.
Machine Learning (ML). Relations between ligand/receptor structural properties andbiochemical effects are found by statistical models. With the advent of computationalchemistry and advances in structural biology, an increasing number of features may beidentified in silico for any given ligand and receptor, which may affect virtualscreening. The integration of all these data sources and tools allows for the formulationof many models.
ML covers the computer-aided development of models (or rules) and their evalu-ation. The use of ML techniques for drug discovery has been increasing recently bothin ligand-based and structure-based studies to find rules from a set of molecular fea-tures and to predict a specific property [49]. Estimation of ADME-Tox properties bythe use of physicochemical descriptors, generation of hit or lead molecules with thestudies on prediction of biological activity, development of homology models, deter-mination of bioactive conformation by the help of docking studies or pharmacophoremodeling are some of the examples of ML applications in drug discovery [49].
ML can be applied as regression or classification models [49]. In the regressionmodel, quantitative models are formed automatically. Statistically the most appropriatemodel is selected from the generated ones. Classifiers utilize such models to cluster thedata. The learning process is carried out by known characteristics of the molecules topredict their activities/properties. In the classification model, the branches are formedon a classification tree. Biological and chemical data are placed on the leaves of the
260 A. Olğaç et al.

branches of the tree. It can be generated and used for various statistical decision-making scenarios. Artificial neural networks, support vector machines, decision treesand random forest techniques are some of the most applied ML techniques used in drugdiscovery studies [49].
3.2 Structure-Based Drug Design
Experimental studies on elucidation of the 3D structures of biological macromoleculesare generally performed by x-ray crystallography and NMR methods [50] (Fig. 10).Obtained structural information about the macromolecules is stored in regional proteindatabases. There are three major regional databases (Protein Data Bank, PDB) forstoring 3D the crystal structures of these macromolecules such as RCSB PDB [51–54](USA), PDBe [54, 55] (Europe), PDBj [54, 56] (Japan). Likewise, the 3D structures ofrelatively small biological macromolecules obtained by NMR techniques are stored inthe Biological Magnetic Resonance Data Bank [54, 57] (BMRB). Records stored inthese databases are synchronized via the Worldwide PDB [54] (wwPDB) organization.
Homology Modeling. Homology modeling techniques are used to predict 3D repre-sentations of biomolecular structures. The model generation is done with the sequenceof monomers (nucleotides or amino acids). The applied algorithm transfers spatialarrangements from high-resolution crystal structures of other phylogeneticallysequence-similar biological structures [58].
Protein sequence information is stored in reference databases such as UniProt [59],where the information on the protein sequence and its functions are collected in oneplace. The UniProt database offers other web services such as BLAST [60, 61] andClustal Omega [62] where sequence similarity and alignment can be retrieved. Con-sensus annotation across protein families across species is aggregated in PFAM [63]with functional annotation (Fig. 11).
Fig. 10. Obtaining the 3D protein structure.
Cloud-Based High Throughput Virtual Screening in Novel Drug Discovery 261

Docking. A structure-based simulation method which is used to predict the 3D bindingmodes and molecular interactions between ligands and their biological targets(Table 3). This technique is based on the thermodynamic calculations by following thedetermination of the possible binding orientation of the ligands and the proteins withappropriate interactions in the active site. The docking scores are determined based onthese interactions and conformational rearrangement costs which help evaluating thegenerated results [58, 64, 65] (Fig. 12).
Fig. 11. Basic workflow for homology model generation.
Table 3. Docking concepts, and their limitations.
Technology Limitations
Rigid Docking. Receptor structure is treatedas a rigid body and the ligands are preparedwith conformational sample(s), then fit intothe active site of the protein
The overall protein structure and its activesite residues are flexible, this affects thebinding orientations of the ligands in dockingresults
Induced-fit Docking. Flexibility of the activesite residues is considered for the protein andthese flexible active site residues flexiblyadapt to accommodate the ligand
It is a computationally expensive approachthat requires careful arrangement of thedocking parameters and cuts off the valuesprior to docking simulation
Covalent Docking. In this method, bindingregion of the receptor that ligands bindcovalently is identified and the dockingprocedure is performed in this specificcondition
This method may generate chemically wrongbinding pattern and incorrect binding posebut lowers the computational search costs ofdocking
Peptide Docking. Peptide docking method isused to determine binding modes of peptidestructures in the active site of its biologicaltarget
Peptides, or fractions of proteins, are largeand flexible ligands and hence difficult toparameterize and computationally expensivecompared to the small molecules
Protein-Protein Docking. It is the generalname of the docking method that is used topredict protein-protein or protein-DNAinteractions those are taking placebiologically
This is the most computationally demandingapproach to simulate the interactions, due tothe size and complexity of themacromolecules
Reverse Docking. It can be applied for targetfishing the drugs or active substances, or tobecome aware of side-effects
Conceptionally, this approach requires acatalog of configurations for screening manytargets by docking [66]
262 A. Olğaç et al.

Molecular Dynamics (MD). MD is a technique to simulate the dynamics of con-nected atoms in a joint molecular system of ligands and their biological targets byconsidering environmental factors (temperature, solvents, ions, membrane, pressure,temperature, etc.). The simulation may be run within a specified time interval, alldepending on the ambient conditions set by the force-field [64, 67]. The most preferredbinding orientation of the conformational samples that emerge during the simulationcan be obtained by analysing the energy of the whole or a portion of the simulation andby visualizing and analyzing the inter/intra-molecular interactions (Fig. 13).
4 Application of Virtual Screening
VS is a chemical search to match ligands with their biological targets. The process canbe applied by either ligand-based or structure-based approaches. Related to the prin-ciples of the method used to find a hit molecule, VS covers various concepts.Regardless of the CADD approach, the process starts with a chemical database to beprepared for each molecular entry. This can be followed with in silico predictions of thepharmacokinetic and pharmacodynamic profiles of the molecules and a filtering ofmolecules within the database to obtain statistically significant and manageable sub-clusters of the chemical space [6] (Fig. 14).
Fig. 12. Basic workflow for docking simulations.
Fig. 13. General workflow for MD simulations.
Cloud-Based High Throughput Virtual Screening in Novel Drug Discovery 263

4.1 Accessing Compound Databases
Chemical compound databases represent significant chemical catalogues for the dis-covery of hit molecules with biological activity, which compile large numbers ofchemically different entities from either synthetic or natural origin [68]. They can begenerated with in-house data, a combination of compound databases (previously testedor untested screening compound series) or in silico synthesis with building blocks.Compound databases of curated biological activity data, commercial sources of themolecules and pharmaceutical reference databases of the marketed drugs can be seen inTable 4.
Fig. 14. General VS workflow.
264 A. Olğaç et al.

4.2 Preparing Ligands for Virtual Screening
It is important to assign the correct stereoisomeric or tautomeric forms and protonationstates of each ligand at a specified pH to avoid changing physicochemical and con-formational behavior of the molecules. Parameterization during this stage must be donevery carefully for a VS study, because the molecules are generally stored in 1D or 2Dwithin the databases. For example, a chiral entry within the database may be in a singleenantiomer or a racemic mixture or a molecule may not be neutral as it is stored in thedatabase and may be at different protonation states at different pH values.
Conformational flexibility of ligands is also important and computationally moreexpensive. Every additional rotation increases the number of conformations that needsto be generated and this results with a computationally more expensive VS process.
Table 4. Compound databases.
Database/URL Comment
BindingDB [69]www.bindingdb.org
Around 1.5 million binding affinity data points are availablewhich are obtained from patents and scientific articles
chEMBL [70]www.ebi.ac.uk/chembl
More than 15 million biological activity results are availablecurated from scientific papers and patents
ChemSpider [71] www.chemspider.com
Contains over 67 million structural data, obtained fromdifferent data sources
DrugBank [72–76] www.drugbank.ca
Database of drug entries linked to their biological targets
DrugPortwww.ebi.ac.uk/thornton-srv/databases/drugport
Structural representation of drugs with their receptors withdata from DrugBank and PDB
eMoleculeswww.emolecules.com
Database comprises over 7 million screening compounds and1.5 million building blocks, which are ready to order
Molportwww.molport.com
Comprising around 20 million ready to be synthetizedmolecules, over 7 million screening compounds and around0.5 million building blocks, which are ready to order
MMsINC [77]mms.dsfarm.unipd.it/MMsINC/search
Helps to search subsets of the database, containing over 4million unique compounds with tautomeric and ionic states atphysiological conditions as well as possible stable conformerfor each molecular entry
Open PHACTS [78]www.openphacts.org
Large knowledge-base of data integration for compounds,their receptors, and pathways
PubChem [79]pubchem.ncbi.nlm.nih.gov
Contains around 100 million compounds and 250 millionbioactivity data records
ZINC [80] zinc.docking.org Contains around 740 million purchasable molecules in 2D and220 million purchasable lead-like molecules in 3D
Cloud-Based High Throughput Virtual Screening in Novel Drug Discovery 265

4.3 Compound Filtering
The main idea of compound filtering is to exclude the molecules which are not carryingsuitable pharmacokinetic or pharmacodynamic properties. The aim is to prevent pos-sible risks in preclinical or clinical phases of the studies. This also helps to keep downcomputational costs in VS studies.
Clustering by Chemical Diversity. It is possible to estimate the chemical similaritiesof the compounds by computer-based calculations. This lets identification of similar ordiverse subsets of the libraries. Many different techniques are used for this purpose.The basic approach is to use similarity algorithms based on mathematical parametersobtained from chemical descriptors [81, 82]. Such calculations are generally done bycalculating molecular fingerprints, which are a way of encoding the structure of amolecule, usually as binary digits used to symbolize the presence or absence of achemical substructure within the molecule allowing for a similarity search in achemical database. The most common similarity and classification algorithm is Tani-moto’s similarity estimation and classification practice that regulate mathematicalclassification studies [82].
Filtering with Physicochemical Parameters. One of the major examples of filteringby pharmacokinetics related approaches is based on the scientific analysis of the drugs.Most drugs in the market can be used orally and it is found that there is a generallyapplicable rule to determine whether a biologically active compound has physico-chemical properties that would make it an orally administrable drug in humans. In1997, it is formulated by Christopher Lipinski [83, 84] and called Lipinski’s rule of five(RO5). It is designed to evaluate drug-likeness of a compound, to be used in drugdiscovery and development studies. The properties of RO5 depend on; a molecularweight less than 500 Dalton, an octanol-water partition coefficient (log P) less than 5,equal or less than 5 HBD groups, equal or less than 10 HBA. Drug candidates whichhave properties of the RO5 tend to have more success in clinical trials, so have morechance to reach to the market. Such approaches let the identification of drug-likechemical space to fall within the biologically relevant subspace with a better phar-macokinetic profile of a vast unbounded chemical space.
Filtering with Ligand-Based or Receptor-Based Screening of Chemical Librar-ies. Ligand-based approaches focus on model generation with pre-established bindingaffinity data of small molecules against biological targets. These approaches are usedwith calculated descriptors to predict the characteristics within the molecular database.Though, structure-based approaches don’t necessarily rely on existing data and try toplace the molecules in the binding sites of the target and evaluate their potential affinityby binding scores within the complex biomolecular structures. Such computationallyexpensive calculations are preferred to run on distributed compute platforms to speedup the in silico screening process.
Ties with Pre-clinical Research. The search for new biologically relevant compoundsis not possible without a laboratory result in which theories are confirmed, refined ordisproved. Considerable time and effort are needed to be invested into the developmentof such tests. Eventually, it is needed to transfer the findings to human tissues.
266 A. Olğaç et al.

VS may support the selection of the ligands for testing once a drug target is iden-tified. This process is long and demands deep insights into the molecular understandingof the pathology of a disease. The selection of a target is likely to be supported fromgenetic studies, i.e. an observed association of DNA variation with disease phenotypes,hints the gene to target. Knock-down/out experiments are performed in the laboratoriesto confirm the molecular mechanism that trigger the disease.
Many researchers on rare diseases do not have industrial partners, and no drugs maybe marketed for such “orphan” diseases. There are many rare diseases and conse-quentially many patients. To find new drugs, the availability of in silico approachesmay be a significant guidance for the researchers, e.g. for repositioning drugs alreadyon the market. The same approach can be applied to identify the biological targets oftraditional medicines obtained from NPs [6].
Ties with Individualized Medicine. Individualized medicine identifies genetic varia-tions that are causative for a disorder for every patient and adjusts therapy accordingly.Once a compound binds to its receptor, this yields a detailed molecular understandinghow the drug works.
Such insights are of interest whenever a genetic variation may affect the binding of adrug to its receptor. Some drugs address cells with a high mutation rate, like a virus or atumor cell. Mutations appear at random, but when the pathogen/cell benefits from itbecause of a lower binding affinity to the drug, it will continue to divide and pass thatgenetic information on. Thus, the pathogen or tumor evades the therapy. For thatreason, The FightAIDS@Home project has searched for compounds with strongbinding affinities to many sequence variations of the viral protein target [85].
Today, cancer patients are monitored by DNA sequencing to learn the changes inrelative frequencies of genetic variations of the disease-tissue [86]. The adoption ofnext-generation sequencing technologies is a recent development. It will indicate thefrequency of “escape routes” that may be closed with new drugs for the same target,possibly in the same binding pocket. It is with the same modeling technology that is atthe root of in silico screening that this data can be interpreted. Without a molecularinterpretation, clinicians would need to wait for insights from observations of hownuclear variation and subsequent therapy decisions affect the clinical outcome.A molecular reasoning, in contrast, is possible for every patient individually.
Automation. Several tools are available to prepare receptors and ligands. Glue lan-guage can be used to integrate different processes of such calculations [87]. In addition,there are workflow environments for CADD in particular like OPAL [88] or KNIME[89]. The users can easily develop any integration of CADD workflow that needs to beautomated. Recent works integrate formal descriptions in databases (like bio.tools) [90]for content-dependent semantics-driven execution of the tools [91].
4.4 Experimental Evaluation and Validation
For biological research, in silico produced findings are needed to be evaluated within vitro or in vivo biological assays. It is preferable to know the statistical strength ofthe model to evaluate the functionality of the model with retrospective studies, prior tobiological testing. That test is likely to be performed in several stages and can be
Cloud-Based High Throughput Virtual Screening in Novel Drug Discovery 267

exemplified as given below. It should be noted that this stage of the work strictlydepends on the nature of the target:
(a) Test of binding affinities (calorimetry, SPR)(b) Induced structural changes (co-crystallization, NMR)(c) Gene/Protein-function inhibition/induction (cell line, tissue sample)(d) Effect on disease models (animal trials)
These tests are expensive, may cost the lives of animals. If the wrong compoundsare chosen for testing, then this delays the treatment of humans. Testing diverse sets ofcompounds is preferred with respect to their binding mode and chemical structure.
5 Infrastructures and Computational Needs
Virtual screening is a data parallel process. The throughput of ligands tested in thecomputer almost linearly scales with the number of processors contributing. A secondconcern is the number of applications contributing – to the screening itself. Theavailability of high-performance computing (HPC) infrastructure is needed to speed upthe in silico screening studies. In addition, accessing stronger HPC facilities has directimpact on covering bigger chemical and conformational space of compounds in VSstudies or testing higher numbers of druggable targets to identify biomolecular targetsof the compounds in target fishing studies.
When it is applied on thousands or millions of a series of chemical compounds, thetotal VS simulation time exceeds the limits of single workstations. For example, amolecular docking-based VS run, covering chemical space of millions of compounds,may take years of computation time on a single workstation. The overall compute timeis fixed, also with multiple machines contributing. But by distributing the load, theeffective wall-clock time can be lowered. The same VS run can be taken to months-scale by accessing hundreds of central processing unit (CPU) cores with an in-housesmall or medium scale HPC infrastructure or hours/days-scale by accessing thousandsof CPU cores with supercomputers or on-demand cloud resources. Recent technicaladvancements to employ graphical processing unit (GPU) for parallel computing havefostered the concept to apply on data, i.e. deep learning or molecular dynamics.
We here discuss alternative sources for computational infrastructures and single outunique properties of the cloud environments.
5.1 Local Compute Cluster
Many computers are integrated in a local network and combined with a grid software todistribute compute jobs. The concept of a batch system is familiar to IT specialists whomaintain such hardware. Larger clusters with special hardware to allow for fast I/O arereferred to as HPC environments. The VS is mostly compute-intensive, data parallelcomputation with individual compute nodes which do not need to communicate witheach other during the computations.
268 A. Olğaç et al.

5.2 Volunteer Computing
Volunteer computing refers to the concept of having a program running in the back-ground addressing a scientific problem. If several thousand individuals contribute, thenone has a compute power or storage resource that can compete with the large com-putational clusters. It should be noted that one needs to interact with the community tokeep the momentum.
Several in silico screening runs have been performed voluntarily. One of the mostwell-known was the search for an HIV protease inhibitor in FightAIDS@Home [85]with the underlying BOINC technology [92]. Because of the enormous compute poweracquired by devices that are not operated by humans, the decentralization of computingis a strategically important route. Tapping into these resources for computing and togenerally support the interaction of devices at the periphery is called as edgecomputing.
5.3 Cloud Computing
Cloud technologies are a means to integrate different workflows and tools ondynamically allocated resources. These instances share respective services in theirspecification of CADD studies, and cloud computing is an emerging solution for VSneeds. The infancy of cloud solutions was in “IaaS”, i.e. dynamically configured andstarted machines that were paid on use. Today, IaaS services are provided by manycompute centers at very competitive price levels. Setups are easy to use for individualsfamiliar with remote access with command line interface (CLI) or graphical userinterfaces (GUI).
Researchers in both academia and industry are likely to have access to a localcompute cluster. But this is costly when the expenses of hardware upgrades, electricityand maintenance are added. Remote sources are highly competitive in pricing. This ismeant for IT-savvy individuals who could use local resources if they had them. There istechnology allowing these remote resources to behave much like an extension of a localcluster.
The most known cloud service providers are Amazon Web Services [93] andGoogle Cloud [94] but there are increasing numbers of open source cloud solutions thatmay be of interest. The OpenStack middleware [95] has evolved into a de factostandard to set up public or private cloud environment. When a software is accessed viaa web interface, the server-side implementation becomes hidden. A look to the side,e.g. how payments are performed online with an interplay of many service providers,tell what clouds also mean: An interplay of services that scale.
Anticipating variants of VS principles to be employed in different and barelypredictable ways are outlined in the next section. One may expect a cloud-based glue-layer of molecular modeling and genomics to emerge. But there are no CADD-Microservices/Functions as a Service, yet (Table 5).
Cloud-Based High Throughput Virtual Screening in Novel Drug Discovery 269

5.4 Cloud-Based Solutions
Recent reviews [97, 98] and the “Click2Drug” catalog [99] give a vivid expression ondescribing many different sources for many partial solutions – available as semi-automated web services or as instances that may be started at one’s independentdisposal. How exactly a transfer of information between these tools should be per-formed, or how these tools should be run to generate redundant findings with thenhigher confidence – all this is yet to be clarified – both semantically and technically.
In silico approaches have been integrated in drug discovery pipeline and bigpharmaceutical companies are likely to perform these often. Cloud environments areused for their advantages to reduce setup costs for professionals. Also, for creative newapproaches in tackling a disease, the information on which selected target is alreadycrucial not to lose competitive advantage. This may not be acceptable to be computedin extra mural facilities. However, for common targets, the interception of individualVS results, e.g. from a volunteer computing project, may not be considered critical.
Table 6 shows remote services that may use cloud services internally or that areoffered for integration with a self-implemented workflow. Most services are agnosticwith respect to the source of a request. However, some may fall back to the cloudprovider’s infrastructure for monetary compensation. Thus, the cloud becomes anintegral part of the VS tool’s deployment.
Table 5. Classification of cloud services.
IaaS: Infrastructure as a Service is a service model which to provide remote access on de-mand to client-specified compute environments. Besides the typical virtualized setups with multiple users sharing a single processor, for HPC also “bare metal” setups are available. CADD tools may be readily usable deployed as a cloud image or be installed posteriori to a running image.
PaaS: Platform as a Service is a technical concept for an aggregation of services to facilitate software running in support of IaaS to scale in multi-user, multi-project environments.
SaaS: Software as a Service runs remotely, and stars copies of itself on multiple nodes in an IaaS environment to scale to whatever size of a problem or to as many users as there may be. The software is typically presented as a web interface, but the concept has found broad adoption from business applications to the gaming industry.
FaaS: Function as a Service. Element of a SaaS that may be invoked without context. Of-fered by all major cloud vendors, an open source implementation is Open Whisk [96]. This technology offers a route for VS-associated services to integrate into larger workflows.
270 A. Olğaç et al.

Table 6. Cloud-based solutions for virtual screening and target fishing. The table lists servicesthat describe features of ligands or their receptors, receptor-based and ligand-based services.Services integrating multiple tools are tagged as a workflow. F stands for “Feature”, R for“Receptor-based”, L for “Ligand-based” and W for “Workflows”.
Service Properties URL CommentF R L W
3decision X X X 3decision.discngine.com Collaboration environment forresearchers to exchangeopinions on ligand-receptorinteractions
AceCloud [100] X www.acellera.com/products/acecloud-molecular-dynamics-cloud-computing
Cloud image to run MDsimulations with CLI onAmazon Cloud, can be used forhigh-throughput MD [101]
Achilles [102] X X bio-hpc.ucam.edu/achilles
Blind docking server with webinterface
BindScope [103] X X X X playmolecule.com/BindScope
Structure-based bindingprediction tool
DINC WebServer[104]
X dinc.kavrakilab.org A meta-docking web servicefor large ligands
DOCK Blaster[105]
X blaster.docking.org Automated molecular docking-based VS web service
DockingServer[106]
X www.dockingserver.com Molecular docking and VSservice
Evias CloudVirtual ScreeningTool [107]
X X www.evias.com.tr/vst Integrated with chemicallibrary management system asa scalable HPC platform forstructure-based VS service as aweb service
HDOCK [108] X hdock.phys.hust.edu.cn Protein-protein and protein-nucleic acid docking server
HADDOCK WebServer [109]
X milou.science.uu.nl/services/HADDOCK2.2/haddock.php
Web-based biomolecularstructure docking service
idock [110] X istar.cse.cuhk.edu.hk/idock
Flexible docking-based VS toolwith web interface
iScreen [111] X X iscreen.cmu.edu.tw/intro.php
A web server which startedwith docking of traditionalChinese medicine
LigandScoutRemote [112]
X X X X www.inteligand.com A desktop application, lettingaccess to the cloud-based HPCfor VS studies
mCule [113] X X X X mcule.com Integrates structure-based VStools with purchasablechemical space
(continued)
Cloud-Based High Throughput Virtual Screening in Novel Drug Discovery 271

6 Conclusions
The goal of VS is to identify novel hit molecules within the vast chemical space toameliorate symptoms of a disease. Hereto, the compound interacts with a target proteinand changes its action in a pathological condition. None of the in silico molecularmodeling techniques can generate perfect models for all kinds of biochemical pro-cesses. However, a large variety of tools is provided by the scientific community.
Table 6. (continued)
Service Properties URL CommentF R L W
MEDock [114] X X medock.ee.ncku.edu.tw A web server for predictingbinding site and generatingdocking calculations
MTiOpenScreen[115]
X X bioserv.rpbs.univ-paris-diderot.fr/services/MTiOpenScreen
Integration of AutoDock andMTiOpenScreen inbioinformatics Mobyleenvironment
ParDOCK [116] X www.scfbio-iitd.res.in/dock/pardock.jsp
Fully automated rigid dockingserver, based on Monte Carlosearch technique
PatchDock [117,118]
X bioinfo3d.cs.tau.ac.il/PatchDock
A web-server for generatingdocking simulations withgeometry and shapecomplementarity principles
PolypharmacologyBrowser 2 (PPB2)[119]
X ppb2.gdb.tools A web server letting targetprediction for the ligands
ProBiS [120] X X X probis.cmm.ki.si A web-based analysis tool forbinding site identification
ProBiS-CHARMMing[121]
probis.nih.gov In addition to ProBis, it ispossible to do energyminimization on ligand-proteincomplexes
Py-CoMFA X X www.3d-qsar.com Web-based platform thatallows generation andvalidation of 3D-QSAR models
SwissDock [122] X X www.swissdock.ch Web-based docking service topredict ligand-protein binding
USR-VS [123] X usr.marseille.inserm.fr Ligand-based VS web serverusing shape recognitiontechniques
ZincPharmer [124] X X zincpharmer.csb.pitt.edu Online pharmacophore-basedVS tool for screening thepurchasable subset of the ZINCor Molport databases
272 A. Olğaç et al.

Alone or in combination, there are available VS technologies which suite the problemat hand. With clouds as HPC resources, complete workflows have been established todirectly address the needs of medicinal chemists. The same technology also supportscollaborative efforts with computational chemists to adjust workflows to emergingpreclinical demands.
Another problem to address is the demand for HPC facilities for VS projects. Theseare indirect costs when using workflows already prepared as a cloud service. Cloudsare attractive both for scaling with computational demands and for the enormousdiversity of tools one can integrate. To minimize the costs and to complete the com-putation as quickly as possible, workflows should be well considered to select whichtool to use while performing VS studies.
VS projects demand the investment of considerable time prior to the computationfor their preparation and afterwards for in vitro analyses. For any isolated project it islikely to be more cost effective to share the compute facilities and expertise by usingcloud-based solutions.
The authors of this text hope to have helped with an initial team building forinterdisciplinary projects: There is a lot of good work to be done, algorithmically or onpre-clinical data at hand, but few groups can develop and use these techniques all ontheir own.
Acknowledgement. This work was partially supported by the Scientific and TechnologicalResearch Council of Turkey (Technology and Innovation Funding Programmes DirectorateGrant No. 7141231 and Academic Research Funding Program Directorate Grant No. 112S596)and EU financial support, received through the cHiPSet COST Action IC1406.
References
1. U.S. Food and Drug Administration (FDA) - The Drug Development Process. https://www.fda.gov/ForPatients/Approvals/Drugs. Accessed 31 Dec 2018
2. Kopp, S.: Definition of active pharmaceutical ingredient revised, pp. 1–4 (2011)3. Hughes, J.P., Rees, S.S., Kalindjian, S.B., Philpott, K.L.: Principles of early drug
discovery. Br. J. Pharmacol. 162, 1239–1249 (2011)4. Cronk, D.: High-throughput screening. In: Drug Discovery and Development, pp. 95–117.
Elsevier, Amsterdam (2013)5. Introduction to pharmacokinetics and pharmacodynamics. In: Concepts in Clinical
Pharmacokinetics, pp. 1–18. ASHP (2014)6. Olğaç, A., Orhan, I.E., Banoglu, E.: The potential role of in silico approaches to identify
novel bioactive molecules from natural resources. Future Med. Chem. 9, 1663–1684 (2017)7. Kinghorn, A.D., Pan, L., Fletcher, J.N., Chai, H.: The relevance of higher plants in lead
compound discovery. J. Nat. Prod. 74, 1539–1555 (2011)8. Taylor, P., Mueller-Kuhrt, L.: Successful, but often unconventional: the continued and
long-term contribution of natural products to healthcare (2015)9. Wöhler, F.: Ueber künstliche Bildung des Harnstoffs. Ann. Phys. 88, 253–256 (1828)10. Hafner, V.K.: Gmewue 91. Angewandte Chemie 91, 685–695 (1979)11. Hoffmann, R.W.: Natural product synthesis: changes over time. Angewandte Chemie - Int.
Ed. 52, 123–130 (2013)12. Mendel, G.: Versuche über Plflanzenhybriden. Verhand-lungen des naturforschenden
Vereines Brünn, Bd. IV für das Jahr 1865, Abhandlungen, pp. 3–47 (1866)
Cloud-Based High Throughput Virtual Screening in Novel Drug Discovery 273

13. Kaufmann, S.H.E.: Paul Ehrlich: founder of chemotherapy. Nat. Rev. Drug Discov. 7, 373(2008)
14. Strebhardt, K., Ullrich, A.: Paul Ehrlich’s magic bullet concept: 100 years of progress. Nat.Rev. Cancer 8, 473–480 (2008)
15. Burghes, A.H.M., Vaessin, H.E.F., de la Chapelle, A.: The land between mendelian andmultifactorial inheritance. Science 293, 2213–2214 (2001)
16. Roth, B.L., Sheggler, D.J., Kroeze, W.K.: Magic shotguns versus magic bullets: selectivelynon-selective drugs for mood disorders and schizophrenia. Nat. Rev. Drug Discov. 3, 353–359 (2004)
17. Ma, Q., Lu, A.Y.H.: Pharmacogenetics, pharmacogenomics, and individualized medicine.Pharmacol. Rev. 63, 437–459 (2011)
18. Cariaso, M., Lennon, G.: SNPedia: a wiki supporting personal genome annotation,interpretation and analysis. Nucleic Acids Res. 40, 1308–1312 (2012)
19. Fischer, E.: Ueber die optischen Isomeren des Traubenzuckers, der Gluconsaure und derZuckersaure. Berichte der Dtsch. Chem. Gesellschaft. 23, 2611–2624 (1890)
20. Fischer, E.: Einfluss der Configuration auf die Wirkung der Enzyme. Berichte der Dtsch.Chem. Gesellschaft. 27, 2985–2993 (1894)
21. Ferenczy, G.G., Keseru, G.M.: Thermodynamics guided lead discovery and optimization.Drug Discov. Today 15(21–22), 919–932 (2010)
22. Bohacek, R.S., McMartin, C., Guida, W.C.: The art and practice of structure-based drugdesign: a molecular modeling perspective. Med. Res. Rev. 16, 3–50 (1996)
23. Kirkpatrick, P.: New horizons in chemical space. Nat. Rev. Drug Discov. 3, 375 (2004)24. Kirkpatrick, P., Ellis, C.: Chemical space. Nature 432, 823 (2004)25. Dobson, C.M.: Chemical space and biology. Nature 432, 824–828 (2004)26. Lipinski, C., Hopkins, A.: Navigating chemical space for biology and medicine. Nature
432, 855–861 (2004)27. Chemical Abstracts Service (CAS) - CAS Databases. https://www.cas.org/content/cas-
databases28. Heller, S.R.: The Beilstein online database. In: ACS Symposium Series, vol. 436, pp. 1–9
(1990)29. Huggins, D.J., Sherman, W., Tidor, B.: Rational approaches to improve selectivity in drug
design. J. Med. Chem. 55, 1424–1444 (2012)30. Oprea, T.I., Davis, A.M., Teague, S.J., Leeson, P.D.: Is there a difference between leads
and drugs? A historical perspective. J. Chem. Inf. Comput. Sci. 41, 1308–1315 (2001)31. Villoutreix, B.O., Lagorce, D., Labbe, C.M., Sperandio, O., Miteva, M.A.: One hundred
thousand mouse clicks down the road: selected online resources supporting drug discoverycollected over a decade. Drug Discov. Today 18, 1081–1089 (2013)
32. Jelliffe, R.W., Tahani, B.: Pharmacoinformatics: equations for serum drug assay errorpatterns; implications for therapeutic drug monitoring and dosage. In: Proceedings of theAnnual Symposium on Computer Application in Medical Care, pp. 517–521 (1993)
33. Olgaç, A., Carotti, A.: Pharmacoinformatics in drug R&D process. In: GPSS, p. 45 (2015)34. Levitt, M.: The birth of computational structural biology. Nat. Struct. Biol. 8, 392–393
(2001)35. Hopkins, A.L., Groom, C.R., Alex, A.: Ligand efficiency: a useful metric for lead selection.
Drug Discov. Today 9, 430–431 (2004)36. Guedes, R., Serra, P., Salvador, J., Guedes, R.: Computational approaches for the discovery
of human proteasome inhibitors: an overview. Molecules 21, 1–27 (2016)37. Petterson, I., Balle, T., Liljefors, T.: Ligand based drug design. In: Textbook of Drug
Design and Discovery, pp. 43–57 (2010)38. Aki-Yalcin, E., Yalcin, I.: Kantitatif Yapı-Etki İlişkileri Analizleri (QSAR). Ankara
Üniversitesi Eczacılık Fakültesi Yayınları (2003)
274 A. Olğaç et al.

39. Crum-Brown, A., Fraser, T.R.: On the connection between chemical constitution andphysiological action. Part II - on the physiological action of the ammonium bases derivedfrom Atropia and Conia. Trans. R. Soc. Edinburgh 25, 693 (1869)
40. Hammett, L.P.: Effect of structure upon the reactions of organic compounds. Benzenederivatives. J. Am. Chem. Soc. 59, 96–103 (1937)
41. Taft, R.W.: Steric Effects in Organic Chemistry (1956)42. Free, S.M., Wilson, J.W.: A mathematical contribution to structure-activity studies. J. Med.
Chem. 7, 395–399 (1964)43. Fujita, T., Ban, T.: Structure-activity study of phenethylamines as substrates of biosynthetic
enzymes of sympathetic transmitters. J. Med. Chem. 14, 148–152 (1971)44. Kubinyi, H.: Quantitative structure-activity relationships. 2. A mixed approach, based on
Hansch and Free-Wilson analysis. J. Med. Chem. 19, 587–600 (1976)45. Kubinyi, H.: Quantitative structure-activity relationships. 7. The bilinear model, a new
model for nonlinear dependence of biological activity on hydrophobic character. J. Med.Chem. 20, 625–629 (1977)
46. Polanski, J.: Receptor dependent multidimensional QSAR for modeling drug - receptorinteractions. Curr. Med. Chem. 16, 3243–3257 (2009)
47. Sippl, W.: 3D-QSAR - Applications, recent advances, and limitations. In: Recent Advancesin QSAR Studies, pp. 103–126 (2010)
48. Klebe, G., Abraham, U., Mietzner, T.: Molecular similarity indices in a comparativeanalysis (CoMSIA) of drug molecules to correlate and predict their biological activity.J. Med. Chem. 37, 4130–4146 (1994)
49. Lima, A.N., Philot, E.A., Trossini, G.H.G., Scott, L.P.B., Maltarollo, V.G., Honorio, K.M.:Use of machine learning approaches for novel drug discovery. Expert Opin. Drug Discov.11, 225–239 (2016)
50. van der Kamp, M.W., Shaw, K.E., Woods, C.J., Mulholland, A.J.: Biomolecular simulationand modelling: status, progress and prospects. J. R. Soc. Interface 5(Suppl. 3), S173–S190(2008)
51. Berman, H.M., et al.: The Protein Data Bank. Nucleic Acids Res. 28, 235–242 (2000)52. Rose, P.W., et al.: The RCSB Protein Data Bank: views of structural biology for basic and
applied research and education. Nucleic Acids Res. 43, D345–D356 (2015)53. RCSB Protein Data Bank. http://www.rcsb.org. Accessed 31 Dec 201854. Berman, H., Henrick, K., Nakamura, H., Markley, J.L.: The worldwide Protein Data Bank
(wwPDB): ensuring a single, uniform archive of PDB data. Nucleic Acids Res. 35, 2006–2008 (2007)
55. Protein Data Bank in Europe. http://www.ebi.ac.uk/pdbe. Accessed 31 Dec 201856. Protein Data Bank Japan. https://pdbj.org. Accessed 31 Dec 201857. Biological Magnetic Resonance Data Bank. http://www.bmrb.wisc.edu58. Jorgensen, F.S., Kastrup, J.S.: Biostructure based modeling. In: Textbook of Drug Design
and Discovery, pp. 29–42 (2010)59. Bateman, A., et al.: UniProt: A hub for protein information. Nucleic Acids Res. 43, D204–
D212 (2015)60. Lopez, R., Silventoinen, V., Robinson, S., Kibria, A., Gish, W.: WU-Blast2 server at the
European Bioinformatics Institute. Nucleic Acids Res. 31, 3795–3798 (2003)61. Altschul, S.: Gapped BLAST and PSI-BLAST: a new generation of protein database search
programs. Nucleic Acids Res. 25, 3389–3402 (1997)62. Goujon, M., et al.: A new bioinformatics analysis tools framework at EMBL-EBI. Nucleic
Acids Res. 38, 695–699 (2010)63. Finn, R.D., et al.: Pfam: the protein families database. Nucleic Acids Res. 42, 222–230
(2014)
Cloud-Based High Throughput Virtual Screening in Novel Drug Discovery 275

64. Fenu, L.A., Lewis, R.A., Good, A.C., Bodkin, M., Essex, J.W.: Scoring functions. In: Jhoti,H., Leach, A.R. (eds.) Structure-Based Drug Discovery, pp. 223–245. Springer, Dordrecht(2007). https://doi.org/10.1007/1-4020-4407-0_9
65. Forli, S., Huey, R., Pique, M.E., Sanner, M.F., Goodsell, D.S., Olson, A.J.: Computationalprotein–ligand docking and virtual drug screening with the AutoDock suite. Nat. Protoc.11, 905–919 (2016)
66. Schomburg, K.T., Bietz, S., Briem, H., Henzler, A.M., Urbaczek, S., Rarey, M.: Facing thechallenges of structure-based target prediction by inverse virtual screening. J. Chem. Inf.Model. 54, 1676–1686 (2014)
67. Rognan, D.: Structure-based approaches to target fishing and ligand profiling. Mol. Inform.29, 176–187 (2010)
68. Moura Barbosa, A.J., Del Rio, A.: Freely accessible databases of commercial compoundsfor high-throughput virtual screenings. Curr. Top. Med. Chem. 12, 866–877 (2012)
69. Liu, T., Lin, Y., Wen, X., Jorissen, R.N., Gilson, M.K.: BindingDB: a web-accessibledatabase of experimentally determined protein – ligand binding affinities. Nucleic AcidsRes. 35, 198–201 (2007)
70. Gaulton, A., et al.: The ChEMBL database in 2017. Nucleic Acids Res. 45, 1–10 (2016)71. Pence, H.E., Williams, A.: ChemSpider: an online chemical information resource. J. Chem.
Educ. 87, 1123–1124 (2010)72. Wishart, D.S., et al.: DrugBank: a comprehensive resource for in silico drug discovery and
exploration. Nucleic Acids Res. 34, D668–D672 (2006)73. Wishart, D.S., et al.: DrugBank: a knowledgebase for drugs, drug actions and drug targets.
Nucleic Acids Res. 36, 901–906 (2008)74. Knox, C., et al.: DrugBank 3.0: a comprehensive resource for “Omics” research on drugs.
Nucleic Acids Res. 39, 1035–1041 (2011)75. Law, V., et al.: DrugBank 40: shedding new light on drug metabolism. Nucleic Acids Res.
42, 1091–1097 (2014)76. Xue, R., Fang, Z., Zhang, M., Yi, Z., Wen, C., Shi, T.: TCMID: traditional Chinese
medicine integrative database for herb molecular mechanism analysis. Nucleic Acids Res.41, 1089–1095 (2013)
77. Masciocchi, J., et al.: MMsINC: a large-scale chemoinformatics database. Nucleic AcidsRes. 37, 284–290 (2009)
78. Williams, A.J., et al.: Open PHACTS: Semantic interoperability for drug discovery. DrugDiscov. Today. 17, 1188–1198 (2012)
79. Kim, S., et al.: PubChem substance and compound databases. Nucleic Acids Res. 44,D1202–D1213 (2016)
80. Irwin, J.J., Sterling, T., Mysinger, M.M., Bolstad, E.S., Coleman, R.G.: ZINC: a free tool todiscover chemistry for biology. J. Chem. Inf. Model. 52, 1757–1768 (2012)
81. Koutsoukas, A., et al.: From in silico target prediction to multi-target drug design: currentdatabases, methods and applications (2011)
82. Tanimoto, T.T.: An elementary mathematical theory of classification and prediction.International Business Machines Corporation (1958)
83. Lipinski, C.A., Lombardo, F., Dominy, B.W., Feeney, P.J.: Experimental and computa-tional approaches to estimate solubility and permeability in drug discovery anddevelopment settings. Adv. Drug Deliv. Rev. 23, 3–25 (1997)
84. Lipinski, C.A.: Lead- and drug-like compounds: the rule-of-five revolution (2004)85. Chang, M.W., Lindstrom, W., Olson, A.J., Belew, R.K.: Analysis of HIV wild-type and
mutant structures via in silico docking against diverse ligand libraries. J. Chem. Inf. Model.47, 1258–1262 (2007)
86. Xue, Y., Wilcox, W.R.: Changing paradigm of cancer therapy: precision medicine by next-generation sequencing. Cancer Biol. Med. 13, 12–18 (2016)
276 A. Olğaç et al.

87. Möller, S., et al.: Robust cross-platform workflows: how technical and scientificcommunities collaborate to develop, test and share best practices for data analysis. DataSci. Eng. 2, 232–244 (2017)
88. Ren, J., Williams, N., Clementi, L., Krishnan, S., Li, W.W.: Opal web services forbiomedical applications. Nucleic Acids Res. 38, 724–731 (2010)
89. Berthold, M.R., et al.: KNIME - the Konstanz information miner. SIGKDD Explor. 11, 26–31 (2009)
90. Ison, J., et al.: Tools and data services registry: a community effort to documentbioinformatics resources. Nucleic Acids Res. 44, 38–47 (2016)
91. Palmblad, M., Lamprecht, A.-L., Ison, J., Schwämmle, V.: Automated workflowcomposition in mass spectrometry based proteomics. Bioinformatics 35(4), 656–664(2019). https://www.ncbi.nlm.nih.gov/pubmed/30060113
92. Balan, D.M., Malinauskas, T., Prins, P., Möller, S.: High-throughput molecular dockingnow in reach for a wider biochemical community. In: 20th Euromicro InternationalConference on Parallel, Distributed and Network-Based Processing, pp. 617–621 (2012)
93. Amazon Web Services. https://aws.amazon.com. Accessed 31 Dec 201894. Google Cloud. https://cloud.google.com. Accessed 31 Dec 201895. Open Stack. https://www.openstack.org/. Accessed 31 Dec 201896. Open Whisk. https://openwhisk.apache.org/. Accessed 31 Dec 201897. Banegas-Luna, A.J., et al.: Advances in distributed computing with modern drug discovery.
Expert Opin. Drug Discov. 14, 9–22 (2019)98. Potemkin, V., Grishina, M., Potemkin, A.: Internet resources for drug discovery and design.
Curr. Top. Med. Chem. 18(22), 1955–1975 (2018). https://www.ncbi.nlm.nih.gov/pubmed/30499394
99. Click2Drug Catalog. https://www.click2drug.org/directory_Docking.html. Accessed 31Dec 2018
100. Harvey, M.J., De Fabritiis, G.: AceCloud: molecular dynamics simulations in the cloud.J. Chem. Inf. Model. 55, 909–914 (2015)
101. Doerr, S., Harvey, M.J., Noé, F., De Fabritiis, G.: HTMD: High-throughput moleculardynamics for molecular discovery. J. Chem. Theory Comput. 12, 1845–1852 (2016)
102. Sánchez-linares, I., Pérez-sánchez, H., Cecilia, J.M., García, J.M.: High-throughput parallelblind virtual screening using BINDSURF. BMC Bioinform. 13, S13 (2012)
103. Skalic, M., Martinez-Rosell, G., Jimenez, J., De Fabritiis, G.: PlayMolecule BindScope:large scale CNN-based virtual screening on the web. Bioinformatics 1–2 (2018)
104. Antunes, D.A.,Moll,M., Devaurs, D., Jackson, K.R., Kavraki, L.E., Liz, G.: DINC 2.0: a newprotein – peptide docking webserver using an incremental approach, pp. 2017–2020 (2017)
105. Irwin, J.J., et al.: Automated docking screens: a feasibility study, 5712–5720 (2009)106. Bikadi, Z., Hazai, E.: Application of the PM6 semi-empirical method to modeling proteins
enhances docking accuracy of AutoDock. J. Cheminform. 16, 1–16 (2009)107. Olgac, A., Budak, G., Cobanoglu, S., Nuti, R., Carotti, A., Banoglu, E.: Evias web services:
cloud-based drug discovery platform. In: EuroQSAR 2016, p. 79 (2016)108. Yan, Y., Zhang, D., Zhou, P., Li, B., Huang, S.Y.: HDOCK: a web server for protein-
protein and protein-DNA/RNA docking based on a hybrid strategy. Nucleic Acids Res. 45,W365–W373 (2017)
109. Zundert, G.C.P., et al.: The HADDOCK2.2 web server: user-friendly integrative modelingof biomolecular complexes. J. Mol. Biol. 128, 720–725 (2016)
110. Li, H., Leung, K.S., Wong, M.H.: idock: A multithreaded virtual screening tool for flexibleligand docking. In: 2012 IEEE Symposium on Computational Intelligence in Bioinfor-matics and Computational Biology, CIBCB 2012, pp. 77–84 (2012)
Cloud-Based High Throughput Virtual Screening in Novel Drug Discovery 277

111. Tsai, T.-Y., Chang, K.-W., Chen, C.Y.-C.: iScreen: world’s first cloud-computing webserver for virtual screening and de novo drug design based on TCM [email protected]. Comput. Aided Mol. Des. 25, 525–531 (2011)
112. Kainrad, T., Hunold, S., Seidel, T., Langer, T.: LigandScout remote : a new user-friendlyinterface for HPC and cloud resources, 1–9 (2018)
113. Kiss, R., Sandor, M., Szalai, F.A.: http://Mcule.com: a public web service for drugdiscovery. J. Cheminform. 4, P17 (2012)
114. Chang, D.T.H., Oyang, Y.J., Lin, J.H.: MEDock: a web server for efficient prediction ofligand binding sites based on a novel optimization algorithm. Nucleic Acids Res. 33, 233–238 (2005)
115. Labbe, C.M., et al.: MTiOpenScreen: a web server for structure-based virtual screening.Nucleic Acids Res. 43, 448–454 (2015)
116. Gupta, A., Gandhimathi, A., Sharma, P., Jayaram, B.: ParDOCK: an all atom energy basedMonte Carlo docking protocol for protein-ligand complexes. Protein Pept. Lett. 14, 632–646(2007)
117. Schneidman-Duhovny, D., Inbar, Y., Nussinov, R., Wolfson, H.J.: PatchDock andSymmDock: servers for rigid and symmetric docking.NucleicAcids Res. 33, 363–367 (2005)
118. Duhovny, D., Nussinov, R., Wolfson, H.J.: Efficient unbound docking of rigid molecules,185–200 (2002)
119. Awale, M., Reymond, J.: The polypharmacology browser PPB2: target predictioncombining nearest neighbors with machine learning. J. Chem. Inf. Model. 59(1), 10–17(2019). https://www.ncbi.nlm.nih.gov/pubmed/30558418
120. Konc, J., Janezic, D.: ProBiS: a web server for detection of structurally similar proteinbinding sites. Nucleic Acids Res. 38, 436–440 (2010)
121. Konc, J., et al.: ProBiS-CHARMMing: web interface for prediction and optimization ofligands in protein binding sites. J. Chem. Inf. Model. 55, 2308–2314 (2015)
122. Grosdidier, A., Zoete, V., Michielin, O.: SwissDock, a protein-small molecule docking webservice based on EADock DSS. Nucleic Acids Res. 39, 270–277 (2011)
123. Li, H., Leung, K.-S., Wong, M.-H., Ballester, P.J.: USR-VS: a web server for large-scaleprospective virtual screening using ultrafast shape recognition techniques. Nucleic AcidsRes. 44, W436–W441 (2016)
124. Koes, D.R., Camacho, C.J.: ZINCPharmer: pharmacophore search of the ZINC database.Nucleic Acids Res. 40, 409–414 (2012)
Open Access This chapter is licensed under the terms of the Creative Commons Attribution 4.0International License (http://creativecommons.org/licenses/by/4.0/), which permits use, sharing,adaptation, distribution and reproduction in any medium or format, as long as you give appro-priate credit to the original author(s) and the source, provide a link to the Creative Commonslicense and indicate if changes were made.The images or other third party material in this chapter are included in the chapter’s Creative
Commons license, unless indicated otherwise in a credit line to the material. If material is notincluded in the chapter’s Creative Commons license and your intended use is not permitted bystatutory regulation or exceeds the permitted use, you will need to obtain permission directlyfrom the copyright holder.
278 A. Olğaç et al.

Ultra Wide Band Body Area Networks:Design and Integration
with Computational Clouds
Joanna Ko�lodziej(B) , Daniel Grzonka , Adrian Wid�lak ,and Pawe�l Kisielewicz
Department of Computer Science, Cracow University of Technology,ul. Warszawska 24, 31-115 Cracow, Poland
Abstract. Body Area Networks (BANs) connect together nodesattached to a human body and transfer the data to an external infras-tructure. The wireless communication channel and a variety of minia-ture sensor devices have lead to many useful applications of BANs, suchas healthcare monitoring, military and emergency coordination, rescueservices, sports, and entertainment. The Ultra Wide Band (UWB) com-munication model is widely used in wireless body area networks. UWBRadio Frequency (RF) technology provides robust and energy efficienttransmission of data and signals through wireless networks. This chaptersurveys recent models, applications and research challenges for futuregeneration UWB RF technology for BANs. The chapter also discussesthe state-of-the art in the cloud-based support for data storage and anal-ysis in mobile health monitoring. Security issues for BANs in generaland mobile health monitoring are addressed as a key aspect of the recentdevelopments in the domain.
Keywords: Cloud computing · Body area networks ·Sensor networks · Ultra wideband communication · Medical services ·Wireless communications
1 Introduction
Based on the IEEE 802.15 standards, Body Area Network (BAN) can be definedas “a communication standard optimized for low power devices and operationon, in or around the human body (but not limited to humans) to serve a varietyof applications including medical, consumer electronics/personal entertainmentand others [5]”. REcently, technological advancements in ultra low-power RadioFrequency (RF) technology, low-power integrated circuits, energy harvesting andstorage, and wireless communications have lead to the design of lightweight, intel-ligent, and low-cost medical devices and sensors. With all these achievements,the thought of widespread deployment of pervasive wireless BANs for diverse
c© The Author(s) 2019J. Ko�lodziej and H. Gonzalez-Velez (Eds.): cHiPSet, LNCS 11400, pp. 279–306, 2019.https://doi.org/10.1007/978-3-030-16272-6_10

280 J. Ko�lodziej et al.
applications, such as health monitoring and military coordination, seems to bea reality of the near future [27].
Typical BAN connects self-regulating nodes (sensors, artificial skin, etc.)attached to the surface of body or implanted in the body [85]. The focus in BANshas been on medical and quality of life applications [70]. In such applicationsthe network’s nodes can be implanted medical devices, such as electrocardio-gram (ECG) electrodes, activity sensors and actuators, or devices for storage ofthe medical data [70]. The Wireless Body Area Network (WBAN) sensors anddevices may be classified based on their location into the following two maincategories [3]:
– in-body nodes,– on-body area network nodes.
Figure 1 presents the generic model of typical WBAN in-body and on-bodynodes distribution with the wrist node as a local (central) base station.
CENTRAL NODE
SENSOR NODE
WBANWrist Watch
Drug Delivery
Blood Pressure
Hearing Aids
ECG
Capsule Endoscopy
Total KneeReplacement
Fig. 1. Generic sample model of wireless BAN [18]
The key requirements for BANs are: (i) small network scale, (ii) long batterylife, (iii) short range communications and (iv) security awareness [32,85]. Manypowerful sensor platforms have been developed for various applications in thepast decade [75]. In the case of transceivers, decreasing the amount of energyrequired to transmit a bit of data means: (a) reducing the turn on/off times andpower during transients, and (b) duty cycling the radio operation [41].
The Ultra Wide Band (UWB) is the key technology for data transmissionin WBANs through the low-power transmission and low-power duty cycle [47].In Ultra Wide Band Body Area Networks (UWB-BANs), the human tissuesare not affected by closely placed WBAN devices. Low-power transmission and

Ultra Wide Band Body Area Networks 281
duty cycle also enable lower power consumption in the network nodes and longbattery time, which is the basic requirement for such systems. UWB technologyalso conforms to the size and cost constraints of BAN devices [27]. From theimplementation perspective, the major advantages of using UWB radios are:(a) low implementation complexity, (b) low duty cycling operation, and (c) bitrate scalability [22].
UWB BANs have been surveyed already from the different aspects [12,47]such as communication channel models [8,72,73,81], transmitter design [34,70],antenna design [38,72], and performance evaluation [13,23,73]. This chaptersummarizes all the above surveys and gives the general and wider view on thedesign, architecture and technological issues. It addresses the main challengesrelated to BANs and UWB-BANs and presents the recently developed mod-els based on the cloud computing support for the patient’s health monitoring,patients’ data storage, analysis and processing with the security criterion forinter and intra-cloud communication and data access.
The rest of the chapter is organized as follows. BANs application areasare discussed in Sect. 2.1. Section 2.2 presents the classification of the wirelesstechnologies used in WBANs. In Sect. 2.3, some practical issues and relationsbetween different requirements of BANs are discussed. Sections 2.4 and 3 definethe research challenges and state-of-the art in UWB BANs. The concept ofcloud–based support for WBANs is presented in Sect. 4. Security aspects relatedto the cloud support in mobile health applications based on UWB–BANs arediscussed in Sect. 5. The chapter ends with the conclusions and highlights of thefuture research directions in the domain specified in Sect. 6.
2 BAN’s Applications and Challenges
Various types of the main BANs components, namely, vital sign monitoring sen-sors, motion detectors (through accelerometers) and communication protocolsfor data processing and system access, make these networks very useful in pro-viding numerous services in healthcare, research, lifestyle, emergency, sports, andmilitary [12,26,32]. In this section we first discuss the major application areasfor BANs, present the candidate technologies for wireless communication anddata transmission, and then highlight the most important practical and researchchallenges regarding WBAN technologies.
2.1 Applications of BANs
The major areas of applications of BANs can be specified as follows.
Healthcare: BANs are used to connect sensor devices with remote monitor-ing and assistance systems for physically disabled and elderly persons. Mobiledevices can be used to send and receive data to hospitals from the ambulancescarrying patients to alert the concerned authorities and to get information aboutproviding first aid to save people’s lives [32]. BANs also enable a continuous mon-itoring of patient’s condition by sensing and transmitting vital signs, such as

282 J. Ko�lodziej et al.
heart rate, ECG, body temperature, respiratory rate, chest sounds, blood pres-sure, etc. [9,41]. It makes BANs an important tool for diagnosis and treatmentof patients with chronic diseases, such as hypertension, diabetes, etc. BANsare also beneficial to hospital patients who are monitored pervasively regard-less of their location. Pervasive in-patient monitoring through implanted devicesenables medical staff to predict, diagnose, and start treatment before the patientreaches an adverse stage of the disease [26,77]. BANs are also highly beneficialfor monitoring and assistance of elderly people, as more and more people demanda better quality of life.
Work and Emergency Services: BANs are used in emergency services likerescue systems, firefighting, etc. [47]. Using miniature sensors, the condition andlocation of firefighters is monitored. These sensors are also used to transfer infor-mation to a person, e.g., a commander who is not present at the site. Based onthe information provided by sensors, the commander can coordinate emergencieswith the team carrying out the rescue operation.
Lifestyle and Sports: BANs are also beneficial in providing quality of lifeand sport healthcare monitoring [83]. Such applications may include wearableentertainment systems, car navigation systems, and tour guides. In sports, BANsare used to monitor a player vital signs, such as the heart rate of a marathonrunner.
Military: BANs are also used in war and combat scenarios by the military andpolice personnel. Wearable sensors are integrated into the uniforms of soldiers.This network can then be used to connect different devices, such as health sen-sors, surveillance cameras, and Personal Digital Assistants (PDAs) installed ondifferent personnel body parts [16].
It is envisioned that wireless body area networks will become the heart of thefuture Internet and will play a vital role in access and exchange of information inorder to provide better facilities in healthcare, education, and lifestyle [41]. Real-time patients vital signs monitoring, emergency and battlefield coordination maybe read as a part of science fiction and movies. But one such ambitious project isunderway at University of Washington, to display real-time information gatheredfrom different body sensors through LEDs built in contact lenses [58].
2.2 Candidate Wireless Technologies
In this section, various wireless technologies that are leading competitors in theupcoming market of BANs are discussed. Communication between sensor devicesis called intra-BAN communication while BAN communication with other net-works is called extra-BAN communication [37]. Selection of appropriate technol-ogy for intra-BAN communication is a research issue where end-to-end perfor-mance of candidate wireless technologies is determined by the complete protocolstack (i.e., including Physical layer (PHY) and upper protocol layers).
Bluetooth Classic: Bluetooth is a short range wireless communication stan-dard that defines the link and application layers to support data and voice

Ultra Wide Band Body Area Networks 283
applications. Piconet is a short range network made up of up to eight Blue-tooth devices. Bluetooth Special Interest Group has developed the BluetoothHealth Device Profile (HDP) that defines the requirements for qualified Blue-tooth healthcare and fitness device implementations. Bluetooth is widely adoptedwireless technology for intra-BAN communication in WBANs [66].
Bluetooth Low Energy: Bluetooth Low Energy (BTLE) is another candidatewireless technology for BANs. It provides simple device discovery and reliablepoint-to-multipoint data transfer, with encryption, power save functionalities,and ultra low power idle mode operation. The key advantages of BTLE are thestrength of the Bluetooth brand, the promise of interoperability with Bluetoothradios in mobile phones and low-power operations [66].
ZigBee: ZigBee defines a network, security, and application layer protocol suiteon top of the PHY and Media Access Control (MAC) layers defined by theIEEE 802.15.4 Wireless Personal Area Network (WPAN) standard. The PHYlayer exploits the direct sequence spread spectrum technique for interferencetolerance and MAC layer exploits carrier sense multiple access with collisionavoidance (CSMA/CA) for channel access. ZigBee also provides support for per-sonal health devices complying with the IEEE 11073 standard, including electro-cardiographs, glucometers, pulse oximeters, blood pressure monitors, thermome-ters, weight scales, and respirometers [12].
ANT: ANT is a proprietary technology designed for general purpose wirelesspersonal area network applications. ANT features low latency, simple design,ability to trade off a data rate against power consumption, and a net data rateof 20 kb/s (over-the-air data rate is 1 Mb/s) [12].
Sensium: Sensium is a proprietary ultra-low-power transceiver platform cus-tom designed for healthcare and lifestyle management applications. The net-work adopts a master-slave architecture where joining and leaving the networkis managed centrally and all communications are single-hop [12].
Zarlink: Zarlink has developed an ultra-low-power RF transceiver, ZL70101,for medical implantable applications. It uses a Reed-Solomon coding schemetogether with cyclic redundancy check (CRC) in order to achieve a highly reliablelink. The key features of Zarlink ZL70101 are extremely low power consumption,ultra-low power wakeup circuit, MedRadio compliance and security [12].
Other Technologies: Proprietary RF technologies such as BodyLAN and Z-Wave are also emerging on the horizon. Inductive coupling (IC) and body coupledcommunications (BCC) technologies are also promising. The data rate of ICis limited, and it cannot initiate communication from inside the body. BCCtransceivers are capacitively coupled to the skin and use the human body as achannel to exchange data. BCC is energy efficient, and alleviates interference andcoexistence issues. BCC can also be used for user identification and automaticformation of BANs [66].

284 J. Ko�lodziej et al.
2.3 Practical Challenges
BANs face several important challenging issues regarding their efficiency, practi-cal deployment, and social adoption [32,54]. These issues constrain the solutionspace, and need to be considered carefully when designing mechanisms for datasecurity and privacy in WBANs.
Conflict Between Security and Efficiency: High efficiency is stronglydemanded for data security in WBANs because of the resource constraints.Wearable sensors are often extremely small and have insufficient power sup-plies, which render them inferior in computation and storage capabilities. Thus,the cryptographic primitives used by the sensor nodes should be as lightweightas possible, in terms of both fast computation and low storage overhead [41].
Conflict Between Security and Safety: Whether the data can be obtainedwhenever needed or not can be very crucial for patients’ safety. Too strict andinflexible data access control may prevent the medical information from beingaccessed on time by legitimate medical staff, especially in emergency scenarioswhere the patient may be unconscious and unable to respond. On the other hand,a loose access control scheme opens back doors to malintent users. It is hard toensure strong data security and privacy while allowing flexible access [20].
Conflict Between Security and Usability: The devices should be easy to useand foolproof, since the users might be non-expert patients. As the setup processof the data security procedures is patient-related, it should involve as few inter-actions with humans as possible. For instance, to bootstrap initial secure com-munication between all the nodes in a WBAN for secure data communication,device pairing techniques can be adopted [20]. The devices should offer secu-rity services during the phase of data collecting and processing by the advanceddata processing centers like, Cloud or Big Data processing systems [78], but notdisturbing their daily usage.
Requirement for Device Interoperability: Patients can buy sensor devicesfrom different manufacturers, it may be difficult to pre-share any cryptographicmaterials among them. It would be hardly possible to establish data securityprocedures that require minimum settings and efforts, and can work with a widerange of devices [54].
2.4 Research Challenges
In this section we summarize different research challenges associated withBANs [12,26,66]. These issues need to be addressed for the widespread deploy-ment of BANs. BANs brings forward a number of research issues that need tobe considered in the design of RF wireless systems. Users can carry several BANdevices globally, hence, BAN radios are required to operate worldwide. Thereis an abundance of high power technologies in Industrial, Scientific, and Med-ical radio bands (ISM bands) that can cast performance degradation on thelow-power BAN devices which thus makes them less appealing for high fidelity

Ultra Wide Band Body Area Networks 285
medical applications. Wireless Medical Telemetry Service (WMTS) bands areheavily used but their use is restricted to healthcare facilities in the UnitedStates. UWB can be exploited for wearable applications but it raises the issueof coexistence with high-datarate multimedia applications [12]. The rules forMedRadio wing band are very strict and limiting [21]. These issues have pro-voked the Federal Communication Commission (FCC) to think about openingup 2360–2400 MHz range for medical BANs. This is planned to hold up wide-band entrenched micro-stimulator devices that can serve as an artificial nervoussystem to reinstate sensation, mobility, and function to paralyzed limbs andorgans [66].
Another research issue in BANs is a channel model design. The channelmodel plays a vital role in the design of PHY technologies. Experimental channelmodeling for embedded and wearable devices is difficult because humans andhealthcare facilities are involved and both are governed by regulations [72].
An antenna design for body area networks is yet another challenging issuedue to limitations on the size, stuff, and form of the antenna [84]. Only non-caustic and biocompatible material, such as titanium or platinum, can be usedfor implants, which results in degraded performance when compared with theantennas made of copper. Organ and location of antenna decides its shape andsize which further restricts the choice of designer [66,82].
A physical layer protocol design requires reducing power consumption with-out affecting reliability. Flawless connectivity should be maintained in dynamicenvironments without the slightest possible performance degradation in termsof throughput, data loss, and latency. Rapid turnaround time from transmissionto reception and speedy wakeup from sleep mode can add significance to powersavings [26].
Energy efficient hardware is also an issue; existing wireless technologies drawrelatively high peak current and mainly rely on duty cycling the radio betweensleep and active modes to minimize the average current drawn. Researchershave been exploring several promising techniques, such as low-power listeningand wake-up radios, which are intended to minimize power consumed by idlelistening [47].
Coexistence of multiple BANs in crowded places, such as hospitals, needs arobust MAC protocol. The MAC protocol should be able to cope with topologychanges caused by movement of nodes. Channel migration protocols need to bedeveloped to be able to migrate to a quiet channel when serious hindrance isnoticed [26].
Medical devices are subject to strict regulations to promote the safety andwelfare of users. Compliance to applicable regulations set forth by the FCC, U.S.Food and Drug Administration (FDA), European Telecommunications Stan-dards Institute (ETSI), and other regulatory agencies is essential [66].
3 UWB Solutions for BANs
Communication and efficient data transmission are the crucial issues in thedesign and management of modern WBANs. The Federal Communication Com-mission urges the use of WMTS for medical applications. However, the people

286 J. Ko�lodziej et al.
Table 1. Main properties of communication and data transmission bands for BANsand WBANs [66].
Frequency (MHz) Acronym Scalability to BAN applications
Merits Demerits
401–406 MedRadio Worldwide availability,good propagationcharacteristics, quietchannel, medical only
Secondary usage,body-worn applicationsnot allowed in402–405MHz coreband, large antennasize, limitedbandwidth, stringentrules
433.05–434.79 GeneralTelemetry
Good propagationcharacteristics
Not internationallyagreed,EU/AU/NZ/SA only,crowded spectrum,large antenna, limitedbandwidth
608–6141395–14001427–1432
WMTS Good propagationcharacteristics, medicalonly, antenna sizereasonable
Licensed secondary uselimited to healthcareproviders insidehealthcare facilities inUS, limited spectrum,heavily used
868–870 GeneralTelemetry
Good propagationcharacteristics,excellent buildingpenetrationcharacteristics
EU only, limitedspectrum, heavily used
902–928 ISM Good propagationcharacteristics
US/Canada only,crowded spectrum,used by low poweredunlicensed devices,harmful interference
2400–2483.52400–2500
ISM Worldwide availability,small antenna, largebandwidth
Crowded spectrum,many standards andtechnologies
5725–5850 ISM Worldwide availability,small antenna, largebandwidth
Existing standards andtechnologies, severeattenuation
4200–48007250–8500
UWB Worldwide availability,short range, low power,huge bandwidth, doesnot interfere largely
Coexistence with highdata rate multimediaapplications, severeattenuation

Ultra Wide Band Body Area Networks 287
who are authorized to use this band are physicians and trained technicians [64].Other technologies include unlicensed ISM, Medical Implant CommunicationsService (MICS), and UWB. ISM band is usually utilized to protect adjacentchannel interference, and additionally it is used by other classical Wireless Sen-sor Network (WSN) technologies. In this context UWB technology seems to bethe most promising band candidate for the future generation WBANs.
In Table 1 we compare the main properties of the communication and datatransmission bands in BAN and WBAN networks.
In this section we first define the main concept of UWB technology and thenpresent possible benefits of the deployment of this mechanism in WBANs. Wefocus on the aspects of the whole system and transmitter design, communicationchannel modeling and the project of the physical layer of WBAN. The models arepresented along with a short survey of the most notable and projects proposedin the literature.
3.1 UWB Technology
UWB RF technology allows a robust and energy effective data and signals trans-mission through wireless networks. By using a wide bandwidth, UWB offers aneffective and low-cost combination of data and energy management systems byutilizing bands within the frequency range of 3.1–10.6 GHz. UWB signals havean inherent noise-like behavior due to their extremely low maximum effectiveisotropically radiated power. This makes them difficult to detect, which is crucialin the medical applications, where security aspects are very important. There arevarious implementations of UWB technology which differ in frequency band andsignal characteristics. The most common UWB model is based on a specificationof the multi-layer WiMedia Alliance protocol1 presented in Fig. 2.
Applications
UWBMedia Access Control (MAC)
Layer
UWB BasedPhysical (PHY) Layer
CO
MM
ON
RA
DIO
PLA
TFO
RM
Additional Protocols(Bluetooth, Wireless-USB, etc.)
Fig. 2. WiMedia UWB protocol (see also [6])
1 www.wimedia.org/en/index.asp.

288 J. Ko�lodziej et al.
Two main layers of the WiMedia Alliance protocol are UWB based Physical(PHY) and Media Access Control (MAC) layer, which together form the “com-mon radio platform” in the protocol stack. In PHY layer the frequency spectrumis divided into 14 bands and 6 band groups as shown in Fig. 3.
BAND GROUP 1 BAND GROUP 2 BAND GROUP 3 BAND GROUP 4
BAND GROUP 6
BAND GROUP 5
1029
6 M
Hz
BA
ND
1
BA
ND
3
BA
ND
2
BA
ND
5
BA
ND
4
BA
ND
6
BA
ND
11
BA
ND
10
BA
ND
14
BA
ND
13
BA
ND
12
BA
ND
8
BA
ND
9
BA
ND
7
7656
MH
z
8184
MH
z
6072
MH
z
9240
MH
z
8712
MH
z
9768
MH
z
6600
MH
z
7128
MH
z
4488
MH
z
5544
MH
z
3960
MH
z
3432
MH
z
5016
MH
z
Fig. 3. UWB frequencies and band groups
Additional technical specifications for UWB include: (a) Multi-band Orthog-onal Frequency Division Multiplexing with over 110 sub-carriers per chan-nel (4.125 MHz bandwidth sub-carrier bandwidth), (b) a channel bandwidthof 528 MHz, and (c) a low broadcast power that allows same-channel coexis-tence with the other close band devices such as 802.11a/b/g/n and Bluetoothradios [6]. The MAC protocol defines a multi-frame (Super-frame [6]) structurewith sequentially executed beacon and data periods (see Fig. 4).
BEACONS
BEACON PERIOD
FRAME K
DATA PERIOD
DATA BEACONS
BEACON PERIOD
FRAME K+1
DATA PERIOD
DATA
Fig. 4. UWB MAC frames
Beacons are transmitted by the UWB device(s) in order to provide the timingand resource access information, which is passed on and transmitted during thedata phase. The PHY and MAC layers can be additionally combined with theother wireless protocols, such as Wireless-USB or Bluetooth 3.0, as an additionaloption for integration into mobile devices.

Ultra Wide Band Body Area Networks 289
3.2 UWB BAN System Model
There is no standardized architecture or system design for UWB BANs, butresearch is being done in this area and a number of works have been proposedwith different designs for the architecture of BAN system. In [69], Roy et al. haveproposed a promising architecture for body area networks, i.e., a multi-sensormulti-antenna architecture. In this approach, every sensor carries an antennaand the sink is placed in closed vicinity of a body. This sink is the central deviceand it supports an antenna array. Most of the computational complexity lies inthe sink. Authors have proposed a complete analytical channel model for the on-body diffracted waves mechanism. IEEE 802.15.4a group has developed a lowcost, low complexity, low power and low range physical layer based on UWBtechnology. The under discussion architecture is also built on the channel modelof IEEE 802.15.4a. UWB is chosen because its low power spectral density andlarge bandwidth offers many advantages, such as low interference, low sensibilityto fading, and accurate positioning. This architecture is expected to exploitthe array gain and in turn increase the (Signal to Noise Ratio) SNR. Sincepower saving is a critical issue in such systems, the architecture minimizes thetransmission power requirement and increases the battery lifetime of sensors.Different measurements were taken to test the proposed architecture in differentscenarios. Issues like path loss, tapped delay time, and correlation aspects arediscussed in detail. Tap mean amplitude decays with the delay and is describedby a dual-slope power law. Parameters depend on the locations of transmittingand receiving antennas. This work only considers the first waves interfering withthe human body. More research needs to be done on the delayed waves whichare coming after reflection through the surroundings.
In [39], Kim et al. have proposed an UWB system employing binary zerocorrelation duration (ZCD) code for wireless BANs. As different devices aremounted on human body so there are chances of multiple access interference(MAI); in order to avoid this and to enhance the performance, binary ZCD isused as a spreading code for ultra wide band. This work shows that systemperformance can be enhanced considerably without adding much complexity byapplying ZCD code.
In [68], Rajagopal et al. have proposed a chaotic based UWB system. Thesystem meets the ultra low power requirements of body area networks whileproviding 100 kbps to 10 Mbps data rates, thus enabling a wide range of appli-cations. Chaotic UWB modulation scheme is used to attain spectrum flexibilityat minimum cost and power.
In [15], Chen et al. have explored the application of cooperative commu-nications in UWB body area networks. Cooperative communications makeuse of available user terminals as relays that cooperate together to form avirtual antenna array. This work focuses on the system deployment scenariowhen the subject is in sitting posture. Vital channel parameters, such as pathloss, power delay profile, power variation, and effective received power cross-correlation, are investigated. The main feature of this work is that it utilizesthe directional antennas in such a way so as to minimize human exposure to

290 J. Ko�lodziej et al.
electromagnetic radiation keeping health concerns in mind. This work also pro-vides a full-bandwidth view of a body-centric channel through a time-domainapparatus. The method used calculates the system diversity levels and it isexpected to serve as a standard for assessing the performance of various diver-sity based techniques in body centric scenarios.
3.3 UWB Transmitter Design for BANs
The power saving requirements of BANs impose some constraints on thetransceiver architecture and UWB signaling strategy. Implementation of UWBtransceivers is still in the phase of research and conventional trends cannot befollowed because of these constraints. So, the logical alternative is to look foranalog front end implementations and simplest possible transceiver architectures.Low power UWB implementation for BANs have to meet the following designguidelines:
1. Low duty cycle signaling,2. Non-coherent architecture at the receiver,3. Pulse generator consuming low power, and4. In order to comply with regulations, increase spreading factor in case of short
pulse waveforms. That is, the average power concentrated in a pulse durationis spread into the spreading factor.
UWB-based systems use pulse position modulation (PPM) to transmit infor-mation with the 40 MHz clock frequency of modulator. In [70], Ryckaert et al.highlight the potential of UWB for short-range communication. Most of theUWB transmitter building blocks are switched off between the pulses, whichallows to minimize the energy consumption. Authors have evaluated the overallpower consumption of the transmitter through a link budget analysis in a wire-less BAN context, taking into account explicit channel models. A comparison ofnarrow-band implementations with UWB shows great reduction in power con-sumption. In [34], Kohno et al. have presented an ultra low power transceiverdesign for BANs. Transmitters and detectors are also described. System is ana-lyzed in terms of packet error ratio, link budget, and power consumption. Thiscan be done by adopting the IEEE 802.15.6 standard.
If research maintains its current momentum in this area, further enhance-ments are expected both at circuit and algorithmic level which will make UWBa promising and key technology for ultra-low-power communications.
3.4 WBANs Antennas for UWB Frequencies
Another important issue of WBANs is the antenna design which should meet thesize limit and biocompatibility requirements. The antenna for a wireless bodyarea network faces numerous RF challenges. Several antenna designs have beenproposed in the literature, a few of them are discussed below.
In [84], Yazdandoost et al. have presented an antenna design which operatesin UWB frequency from 3.1 to 5.1 GHz. Two layers of substrate are used in the

Ultra Wide Band Body Area Networks 291
antenna to cancel the effects of human body on performance of the antenna.Performance is then analyzed in free space as well as close to the human body.Experiments in different scenarios are performed without making any changesto the antenna design. The antennas become directional when placed close tothe human body as it affects the radiation patterns of antenna. Similarly, humanbody absorbs a large amount of output power which affects performance. Theproposed antenna design provides better performance when placed close to thehuman body due to the second substrate layer.
In [38], Attari et al. have presented a small size ultra wide band antenna forBANs. The proposed antenna works in the range of 3.1–10.6 GHz in free space,which is then modified by using a PEC (perfect electric conducting) plane. PECis used as a reflector to enhance performance when antenna is in close proximityto the human body. Simulation results show that the modified antenna hasbetter performance in frequency and time domain. The proposed antenna designreduces the effect of the body on the antenna, thus, increasing the gain of antennawhen placed close to the human body by using a PEC plane.
In [2], Almpanis et al. have presented an inverted truncated annular dielec-tric resonator antenna for BANs. The antenna operates at 3.4–5.0 GHz. Theproperties of antenna are discussed theoretically and practically. Performance isanalyzed in free space and close to human body and demonstrates good resultsin frequency, as well as time domain. Although the design is presented specif-ically for BANs, the design concepts are general and it can be used for otherapplications with minor modifications.
3.5 Using UWB for Transmission Channel Modeling in WBANs
The high capacity transmission channel of the UWB systems is one of the mostimportant advantage due to which UWB is employed in on-body and in-bodymedical monitoring systems. Research has been done on the study of path lossfor various onbody and in-body devices. As data rate for BANs is very low andthe range is limited, UWB is being considered as most suitable air-interface. Alot of work has been done on path loss model but the propagation channel hasnot been discussed in detail so far. When two sensors are communicating on thehuman body, a receiver can receive the signal in 3 ways: (a) propagating throughthe body, (b) diffracting around the body, and (c) reflections off nearby scattersand then back toward the body. The human body itself is a quite complexenvironment and no one has studied it explicitly from the perspective of wirelesscommunication. Several channel models are presented in [8,72,73,81].
In [72], Takizawa et al. have proposed stochastic channel models on powerdelay profile and path loss. All the models are derived from CTF (channel trans-fer functions) in a hospital room. Path loss model is presented for several bandswhile power delay profile is only presented for UWB.
In [73], Aoyagi et al. have provided channel models for BANs in UWB fre-quency band. The statistical model and parameters are extracted directly frommeasured channel CFTs. Channel models are derived on both path loss andpower delay profile. In [8], Betancur et al. have proposed a similar statisticalchannel model.

292 J. Ko�lodziej et al.
3.6 UWB BAN Physical Layer
According to the technical requirement of the WBAN task group, many com-panies and research institutes have proposed physical layer architectures to pro-vide fundamental technologies for WBAN communication systems. Since thereare various service scenarios for in-body or on-body applications, the physi-cal layer proposals include UWB and narrowband techniques [14]. The physicallayer is responsible for: (a) activation and deactivation of the radio transceiver,(b) Clear Channel Assessment (CCA) within the current channel, and (c) datatransmission and reception.
In [17], Choi et al. have proposed the design of a PHY simulator for wirelessBAN system in IEEE 802.15.6. As there are varying scenarios for body area net-works, including in-body and on-body scenarios depending on the application,the physical layer proposals include UWB, as well as narrowband techniques. Inthe WBAN PHY case, the modulation method is adjusted according to frequencyband and data rate. Several works on performance evaluation based on differentchannel models for UWB BANs are present in the literature. In [13], Chang etal. have investigated the performance of UWB-MIMO for BAN channel capac-ity through extensive measurements for both spatial and polar antenna arrays.Channel frequency responses were measured in 3–10 GHz frequency range thatcovers the whole UWB band. Effects of bandwidth, array spacing, antenna polar-ization, and propagation conditions, from the measured channels, were analyzedon the UWB-MIMO channel capacity. MIMO channels are formed by combin-ing a number of single input single output channel responses. It was observedthat the MIMO channel capacity decreases with bandwidth and frequency; fur-thermore, the receiving power decreases when frequency band is increased. Highfrequency components have low power, so they don’t contribute much to thechannel capacity. Similarly, when the receiving array spacing is increased, thechannel capacity and the spatial correlation co-efficient are decreased in most ofcases, and the maximum value of power difference between any two sub-channelsis increased. In order to achieve maximum channel capacity, array spacing of thespatial array should be lower than one wavelength. Device compactness can beachieved without sacrificing channel capacity in case of a polar array, in contrastto spatial arrays in non-line of sight (NLOS) conditions; in line of sight (LOS)conditions the maximum achievable capacity of a spatial array is higher thanthat of the polar array.
In [71], Sangodoyin et al. have investigate on the impact of body mass index(BMI) on the body-to-body propagation channels. They provided a detaileddescription of a measurement campaign for wireless body-to-body propagationchannels. Measurements were done in an anechoic chamber to clearly work outthe impact of the body. Channel frequency responses were measured in 2–10 GHzfrequency range.
In [73], Takizawa et al. have presented performance evaluation of UWB wire-less BANs, which shows that the modulation scheme has to pay much penaltyif it uses a non-coherent receiver as compared to coherent detection. In [23],Domenicali et al. have analyzed the performance of BAN composed of IEEE

Ultra Wide Band Body Area Networks 293
802.15.4a UWB sensors. The parameters used for performance evaluation areBER (bit error rate), network lifetime, and throughput. The work presents aunique case by analyzing performance in the presence of an external interferingnetwork. BAN performance can be improved by using an optimized time hoppingcode assignment strategy.
In [80], and [22], performance evaluation method is presented which observesthe waveform distribution along the signal path. Performance of a transceiveris evaluated in terms of BER. Results show that the human body casts moreeffect on performance than the environment, especially in case of NLOS pathfor a propagation channel. Selection of suitable pulse shape depends upon themodulation schemes used.
3.7 Optimal Locations for Sensors in UWB BANs
Knowledge of precise locations of sensors is necessary for successful data trans-mission in many medical applications. In WBAN these locations must be esti-mated with a very high (millimeter-scale) precision. Localization in WSNs hasbeen actively studied during the last few years. Many methodologies effec-tive in the standard wireless architectures, such as the received-signal-strength-indicator (RSSI) technique [35] and time-of-flight (TOF) measurement tech-nique [10], can be successfully applied in WBANs and other medical applica-tions.
In [1], Abbasi et al. have investigated the optimum locations for placing sen-sors on human body. Experiments were performed on more than 100 transceiverlocations for LOS and NLOS scenarios. Path loss models were developed and per-formance was evaluated for different scenarios. An orthogonal frequency-domainmultiplexing (OFDM) based UWB system was used and calculations were per-formed on the basis of BER values (see Table 2), on selected locations. Bestpossible locations identified by this work are legs and arms for LOS and NLOSscenarios, respectively.
Table 2. BER values for different parts of human body [1]
Body part On-body
LOS (Front side) NLOS (Back side)
BER BER
Trunk (Rx23/Rx75) 3.7e−2 9.98e−4
Left arm (Rx27/Rx90) 3.89e−5 5.1e−5
Right arm (Rx38/Rx89) 4.76e−3 7.67e−5
Left leg (Rx44/Rx104) 4.83e−6 2.34e−5
Right leg (Rx47/Rx101) 1.83e−5 1.26e−4
Head (Rx54/Rx57) 9.99e−4 6.54e−4

294 J. Ko�lodziej et al.
State-of-the-art of 3D localization systems have been surveyed in [42]. In [40]the authors present a methodology of the transmission of a 300 ps Gaussian pulse,which is modulated by an 8 GHz carrier signal as a direct support to a local-ization system for indoor WBANs that provides accuracy in the 1–10 mm rangeand seems to be one of the most promising solutions for the future generationpositioning techniques.
4 Cloud Support to Mobile e-Health Systemsand WBANs
E-health system was considered as a solution for the presented model becauseit is the most powerful and it allows to interact remotely between patients andprofessionals. Due to providing data from WBAN to this system, these can helpto solve many of the patient’s medical problems. Although communication pro-tocols and efficient data transmission between sensors, network body, local basenode, and the external network base station (signal receivers) are crucial inthe design of modern WBANs, data processing and replication, remote patientmonitoring by medical personnel, and a fast and secure access to the data stillremain challenging and complex issues in today’s IT-based health care systems.Conventional medical systems are still built on workflows that consist of papermedical records, duplicated test results, handwritten notes. The U.S. Depart-ment of Health and Human Services has published in 2009 the Health Infor-mation Technology for Economic and Clinical Health (HITECH) Act [33] whichcontains a format known as an Electronic Medical Record (EMR) [44] for digi-tizing the patients’ data and medical tests to make them transparent to patientstogether with health plan costs, covered services, and health insurance. A suc-cessful practical implementation of such U.S digitization idea (and its extensionto be a global system) needs a low-cost scalable IT infrastructure that allows afast remote access of patients and doctors to the system and data. This systemmust be easily adaptable to various patients’ and other users’ needs, departmen-tal policies and organizational sizes, and security and data protection must bethe paramount system’s characteristics. Recently, cloud computing seems to be agood candidate for supporting IT-based health medical systems as it successfullyoffers multiple benefits for enterprise computing environments [67].
Cloud computing enables convenient and on-demand access to a shared con-figurable computing resources of various types, namely physical infrastructures(servers, datacenters, networks), virtual servers and web-based services to dis-tributed users [31]. All these resources are provisioned by the service providersand local resource providers with possible minimal cost and management effortsand interactions. Major characteristics of cloud computing which are impor-tant in medical data storage, data analysis and processing, can be defined asfollows [11,46]:

Ultra Wide Band Body Area Networks 295
– on-demand self-service: each cloud user can deploy and configure the cloudservers and services himself, no interactions with service providers are neces-sary;
– multitenancy: the resources and costs are shared across a large communityof cloud users;
– scalability: an efficient and low-cost configuration and assignment of systemresources according to consumer demand;
– easy system access: cloud resources and services are accessed through stan-dard (Internet) protocols, using standard web browsers regardless of theirlocation and platform, e.g., smart phones.
– meeting security demand: dedicated services for higher security require-ments, [76].
Model described above is supported by cloud-based architecture. Data frombody sensors in WBANs are received by Cloud Client and then, they are sentdirectly to the cloud, which consist with the providers of the service such as:Software as a Service (SaaS) that is a cloud computing model in which theapplication is running on the service provider’s computers and it is available tousers via the Internet; Platform as a Service (PaaS) which provides the runtimeenvironment and the system on which the application runs; Infrastructure asa Service (Iaas) which provides the appropriate equipment to implement thedescribed model and allows to its scalability at any time [30]. These services col-lect received from Cloud Client data from sensors in a Data center with access toCloud Storage Facilities. The general architecture of cloud-based WBAN supportinfrastructure is presented in Fig. 5.
Cloud Client
Cloud Architecture
Body Sensors
SaaS
IaaS
PaaSData center
Cloud Storage Facilities
Fig. 5. Cloud-based support to WBANs
In this model a patient, equipped with BAN sensors and a mobile device,such as smart phone or a tablet, communicates to the cloud system through acloud web client or a specially designed standalone application. The base sen-sor module in WBAN collects the patient’s data and transmits it to the mobiledevice (often via Bluetooth) without the patient’s intervention. The cloud client(cloud platform interface), installed at the mobile device, forwards the patient’s

296 J. Ko�lodziej et al.
data to the appropriate web service installed at the cloud platform. The collecteddata is stored, analyzed, and processed by a software module. The results of thisanalysis (and possible diagnosis) are disseminated to the patient, his doctor,who can be another mobile cloud user, emergency services (if necessary), hospi-tal etc., at specified time intervals or just single time period (point). Patient’shistorical medical reports are available for retrieval from the cloud after userauthentication.
Although many popular cloud computing platforms, either free (e.g.,iCloud [36] and DropBox [25]) or commercial (e.g., GoGrid [28], AmazonAWS [4], Google Cloud Platform [29]) are already available for pervasive man-agement of large volumes of user’s data, they may not be suitable for manyhealth care applications. Moreover, cloud computing for health care needs high-est level of availability, security, and privacy for the patients’ data in order togain acceptance in the marketplace. Development of high security and accessibil-ity of cloud computing services and personalization of processed patients’ dataare contentious issues in the design of scalable IT-based systems supportingWBANs [37].
4.1 State-of-the Art
The integration of WBANs and cloud service providers to provide mobile healthfacilities has transformed from a vision of future to a nowday facility. Numerousrenowned hospitals in Europe and US provide e-health services based on Elec-tronic Health Records (EHR) with cloud integration [58]. In the following lineswe discuss the state-of-the art research proposals regarding ubiquitous healthbased on WBAN-cloud integration.
In [46] the authors present the could-based support for the analysis of theelectrocardiogram (ECG) data. The proposed system model consist of the threetraditional cloud layers, that is: (a) Software, (b) Platform, and (c) Infrastruc-ture. The software layer provides data upload, storage, and analysis facilities.The platform layer consists of three modules: (a) container scaling manager, (b)workflow engine [45], and (c) Aneka scheduling environment [79]. The workflowengine is installed inside the container and manages the execution of the work-flow process in ECG analysis. The ECG data processed in this workflow can beeither numerical or graphical (ECG) [7], and are calculated and compared withthe patients historical data and standard values. The container scaling managercreates new containers according to the number of incoming requests (tasks).The tasks composed in the workflow module are submitted to the Aneka [79]scheduling environment. This scheduling system plays the role of a workflowdistribution and management platform based on the conventional master-slavemodel adopted in cloud systems. The Aneka master is installed on the platformcloud layer while the slaves are task executors installed on the infrastructureentities (virtual machines) of the cloud. For the security of data communica-tion between different layers, a third party Public Key Infrastructure (PKI) isproposed. This model is a good example of the utilization of the public cloudenvironment for real-time monitoring the patient’s health condition.

Ultra Wide Band Body Area Networks 297
Similar idea is presented as the HealthCloud project in [24]. The cloud ser-vice client is designed as a web application for the Android OS consisting of:(a) Patient Health Record module which retrieves patient records form thecloud, (b) Medical Imaging module that decodes and displays the image accord-ing to the Digital Imaging and Communications in Medicine (DICOM) [19]and JPEG2000 compression standard. The Amazon’s S3 cloud service [4] hasbeen utilized for the evaluation of the developed model in WLAN and 3G net-works with different JPEG2000 compression parameters. SSL data encryptionis proposed to secure data communication. A similar model based on Internetof Things (IoT) communication framework for mobile health care is describedin [48].
Doherty et al. [60] have proposed a physiological lifelogged data frameworkthat stores lifetime events of a person over a cloud. While the lifelogged datacan help people remember what they were doing at a particular moment, it canalso be analyzed to find out potential reasons behind a medical condition. Theproposed ‘SmartLogger’ system provides three interfaces to view the physiolog-ical data. The query interface allows a user to search data based on temporalqueries. The chart interface provides graphical images of physiological activities,such as the heart rate measured by a ECG sensor. The context interface providesadditional information gathered from various bio-sensors such as the location ofthe user, images of the surroundings, and audio data that might be helpful inclassifying a temporal event.
Research has also been done on cloud-sensor integration to build community-centric information sensing and dispensing applications that work on the basisof publication subscription model [50]. A publication-subscription broker thatdelivers information to users via a cloud service application consists of: (a) asensor data stream monitoring and processing component, (b) a registry com-ponent that saves information about user subscriptions to different applications,(c) an analyzer component that maps data streams to corresponding applica-tions, and (d) a disseminator component that sends data to a subscribed userusing an event matching algorithm.
WBAN-cloud integration for mobile health care systems is a novel idea withbenefits of computational and storage offloading. However, researchers haveopposed cloud computing approach to ubiquitous healthcare due to the com-municational overhead such a system incurs, delays experienced, and continuousconnectivity requirement with the cloud [49]. Instead, a ubiquitous healthcaresystem based on a resource provisioning framework that harnesses the compu-tational and storage capabilities of computing devices lying in close vicinity isproposed. The authors of [49] have proposed a wireless communication modelto transmit patient data and to prioritize data streams based on severity ofpatient’s condition. The model is a two-tier hierarchical architecture consistingof inter and intra-BAN communications. Inside each BAN, a cluster head (CH)is selected based on higher computational and communicational power to act asa gateway for all inter-BAN sensor nodes. The CH may himself act as a bro-ker or offload the tasks to a base station. The broker of the proposed system is

298 J. Ko�lodziej et al.
composed of a workflow manager and a scheduler/optimizer. The workflow man-ager receives service requests from sensors. The optimizer identifies the appropri-ate service providers in the vicinity for service distribution. The service providesvolunteer themselves or they are identified by request-response messages. Thesemessages contain the computational (CPU cycles) and storage (bytes) facilityavailable at a service provider. In this manner ubiquitous health can be providedwithout the requirement of cloud connectivity.
5 Security Challenges and Solutions
BANs are meant to support medical applications mainly. Hence, privacy, secu-rity, (Quality of Service) QoS, and reliability are important factors besides energyefficiency. Traditional security and privacy techniques are not appropriate forBANs due to bounded processing power, memory, and energy, as well as the lackof a user interface, unskilled users and global roaming. Hence, novel lightweightand resource-efficient methods have to be developed for BANs [66]. Global roam-ing over heterogeneous infrastructure networks further complicates end-to-endsecurity provisions. Cloud integration of mobile health applications has givenrise to new security concerns such as trustworthiness of the cloud client andsecure extra-BAN communication.
Security and privacy of patients’ data when it is stored in and retrievedfrom the cloud, user authentication and authorization for access to the data,and internal management of data by the cloud provider are major concernsin the cloud-based mobile health applications. Researchers have proposed theuse of TSL/SSL protocol to secure communication between the cloud and thepatient [24,59]. The trust between the cloud and the patient is still a majorresearch issue to be dwelled upon. The process of authentication between a userand a service provider for the identification of proper authorization level is basedon trusted third party certification authority in many cloud based applications.The trusted third party certification authority is responsible for the implemen-tation of the authentication and authorization system based on the PKI. Cloudsupport provides the opportunity to offload computationally intensive jobs formthe mobile devices to the cloud. In the following lines we present state-of-the artresearch proposals for security challenges in WBAN and WBAN cloud integra-tion.
Nkosi and Mekuria [43] propose a security service provision framework basedon the cloud services as a solution for mobile health concerns. Security is pro-vided as a service to the mobile devices like other services provided by the cloud.In this model, the mobile devices are cloned over the cloud infrastructure. Whenthe mobile device faces a computationally intensive task, it transfers the task toits clone over the cloud. The task is executed in the cloud and the output is sentback to the mobile device. The only concern about Security As a Service (SasS)model is the security of the communication channel between the cloud and themobile device. This threat is mitigated by implementation of secure communica-tion protocols. Similar task off-loading scheme has been presented in [55]. Task

Ultra Wide Band Body Area Networks 299
offloading techniques help the resource constrained mobile devices and sensors toexecute their task over the cloud, but they also incur communication overhead.
Wang et al. [57] have proposed a distributed dynamic integrity check and datastorage scheme for WSNs. The data to be encrypted is divided into n blocks.Each data block is encrypted using a secret key. Each encrypted data blockis distributed among n neighbors, thus providing secure data storage. Whenan integrity check is required for the data, each node having a share of the nblocks of the data computes and broadcasts its integrity checksum. Thus, thedistributed storage and computation reduces the memory overhead on a singlesensor node.
To secure medical data from a determined adversary, Pietro et al. [62] haveproposed a data survivability scheme based on continuous movement of datafrom one sensor node to another. It is assumed that the adversary knows theorigins of the target data and can compromise a subset of nodes to capture thatdata. The continuous data communication, replication, and encryption appliedin this scheme makes it impractical for energy constrained WBANs.
Access privileges to medical data in WBANs can be maintained by imple-menting a Role-Based Access Control (RBAC) model [65]. The participatingWBAN entities are assigned groups according to their roles, such as physiciansand patients. Each user role is mapped to user-privilege set in one to many map-pings. RBAC is simplistic and well suited for the requirements of WBANs. AnRBAC scheme based on secret key encryption for medical WBANs is proposedin [63]. The proposed scheme utilizes the random key predistribution methodsdefined in [53]. By predistributing encryption keys, a user can establish a pair-wise keys with all entities in the WBAN. Each pairwise key is mapped to a role,thus, access privileges are assigned to each pair of keys. The predistributionand pairwise key management make this scheme impractical for large WBANsconfigurations.
In [74] a secure data communication model for scalable cloud computingapplications is presented. The model adds a Security Manager entity to thegeneric cloud model. The security manager is a trusted third extension of thecloud provider. The security manager generates public and private keys of eachuser, regenerates keys after expiry, generates session keys and maintains accesscontrol list for each data set.
A data re-encryption scheme proposed in [52] is used to offer confidentialdata storage that is even private to a cloud provider. A user encrypts the databefore sending it to the cloud where the security manager re-encrypts the databefore it is stored in the cloud. The authors have also provided a variation of themodel in which data encryption is offloaded to the security manger while datare-encryption is performed by the cloud provider.
In [56] researchers have presented a novel cross-cloud domain based trustmodel. A trust value is associated with each client and domain entity. Whenan entity A wants to communicate with an entity B, it compares the entityB’s trust value with its trust threshold. If the trust value is greater than thetrust threshold, it will continue with the transaction. Otherwise it will abort

300 J. Ko�lodziej et al.
the operation. Trust values are updated on the basis of completed transactionswhich have not violated trust relationship between two entities.
Sorber et al. [61] have proposed a novel mHealth model based on a wrist-watchlike wearable device, Amulet. An Amulet provides many advantages overmobile and PDA based mHealth modes such as: (a) Amulet is tightly coupledwith the patient’s body unlike mobile devices and PDA’s, which can be outof transmission range of the sensor devices, (b) Amulet uses special-purposehardware to support secure mHealth applications. Unlike mobile devices, theAmulet provides secure storage of encryption keys, (c) the Amulet providesinteroperability between sensor and mobile devices by implementing multiplelow-power radios supporting diverse wireless technologies, and (d) Amulet isable to authenticate the wearer by various physiological parameters, such aspulse and galvanic skin response (GSR).
Researchers [51] have proposed a Plug-n-Test approach to secure medicaldata sensing and processing in mobile phones based on plug-in smart cards thatprovide a trusted computing platform. The smart card provides processing andstorage of encrypted data. The smart card thus exchanges keys with medicalsensors and the back-end cloud for sending and receiving encrypted data. Thetest model includes a JavaCard applet and two Android phones with smat-card integration. The test model implementation shows 20% energy consumptionoverhead in worst case, 59–69% increase in latency time, and 44% communicationoverhead while ensuring data confidentiality and integrity.
The proposals discussed in the above section ensure data security which iscritical in the context of medical health records but each proposal also incurscomputational and communicational overheads while ensuring data security. Alightweight, universally accepted security framework for WBANs providing ubiq-uitous health facilities is an area with great research potential.
6 Conclusions and Future Directions
The WBAN is an emerging and promising technology that is expected to changepeople’s daily life and healthcare experiences. Data security, safety, efficiency,and privacy in WBANs are the key research issues, and a number of considerablechallenges still remain to overcome. The research in this area is still in its infancy,but it is believed it will draw a huge amount of interest in next few years.
This chapter has highlighted many research and practical issues related toWBANs supported by the UWB wireless technologies. UWB wireless technologyfor intra-BAN communications is one of the most promising methodology forthe effective data transmission in today’s medical applications. However, someearly results on the application of the other technologies, such as Bluetoothand ZigBee, are also available, but no standard has been developed so far forWBANs.
There is a big potential in designing a physical layer for WBANs. Previouswork includes some UWB and narrow band techniques. A channel modelingfield is also in a research phase and the complex environment of the human

Ultra Wide Band Body Area Networks 301
body poses many challenges to researchers in this regard. There is no standardantenna design for wireless BAN devices. Antenna needs to be comfortable andcompatible with the human body. The issues of directionality, antenna gainneeds to be investigated in detail when working around the human body. Neithera transmitter design has not been finalized yet. Different transmitter designshave been proposed with the focus on low-power transmitters. Apart from thesetechnical details, there are a lot more issues to be resolved for social acceptanceof BANs. These include conflicts between different requirements, such as securityand efficiency.
Cloud computing infrastructure provides a cost effective and easy to use datasharing and access platform which is ideal for the IT enabled healthcare systems.Requirements of such a cloud supported health system is high availability ofdata for healthcare personnel and security of the patients’ data. Authenticationand authorization solutions provided by third parties have been proposed as asolution for data confidentiality requirements.
Catering all these challenges is most likely to require new methods and proto-cols for MAC and PHY, and state-of-the-art antenna design, transmitter design,and lightweight security protocols. UWB is being considered as most promisingcandidate for BANs. The state-of-the-art in system design, channel modeling,performance evaluation, transmitter design, and antenna design of UWB BANsis also presented in this chapter. The WBAN-cloud integration and related secu-rity challenges have also been thoroughly surveyed. Researchers, engineers, andpractitioners from various disciplines, must come together to overcome technicalroadblocks in order to bring the vision of a ubiquitous body area network toreality.
References
1. Abbasi, Q.H., Khan, M.M., Alomainy, A., Hao, Y.: Characterization and modellingof ultra wideband radio links for optimum performance of body area network inhealth care applications. In: 2011 International Workshop on Antenna Technology(iWAT), pp. 206–209 (2011)
2. Almpanis, G., Fumeaux, C., Frohlich, J., Vahldieck, R.: A truncated conical dielec-tric resonator antenna for body-area network applications. IEEE Antennas Wirel.Propag. Lett. 8, 279–282 (2009)
3. Drude, S.: Requirements and application scenarios for body area networks. In:Mobile and Wireless Communications Summit (2008)
4. Amazon Web Services. aws.amazon.com5. IEEE 802.15. www.ieee802.org/15/pub/TG6.html6. Ayar, E.: UWB Wireless Video Transmission Technology in Medical Applications.
NDS Surgical Imaging (NDSsi) White Paper-Report (2010)7. Bahoura, M., Hassani, M., Hubin, M.: DSP implementation of wavelet transform
for real time ECG wave forms detection and heart rate analysis. Comput. MethodsPrograms Biomed. 52(1), 35–44 (1997)
8. Betancur, L., Cardona, N., Navarro, A., Traver, L.: A statistical channel model foron body area networks in ultra wide band communications. In: Proceedings of theIEEE Radio and Wireless Symposium, vol. 1, pp. 715–718 (2008)

302 J. Ko�lodziej et al.
9. Basu, S., Sarkar, M., Nagaraj, S., Chinara, S.: A survey on ultra wideband andultrasonic communication for body area networks. Int. J. Ultra Wideband Com-mun. Syst. 3(3), 143–154 (2016)
10. Baunach, M., Kolla, R., Mvihlberger, C.: Beyond theory: development of a realworld localization application as low power WSN. In: Proceedings of IEEE Con-ference on Local Computer Networks, Dublin, Ireland, 15–18 October 2007, pp.872–884 (2007)
11. Buyya, R., Broberg, J., Goscinski, A. (eds.): Cloud Computing: Principles andParadigms. Wiley, Hoboken (2011)
12. Cao, H., Leung, V., Chow, C., Chan, H.: Enabling technologies for wireless bodyarea networks: a survey and outlook. IEEE Commun. Mag. 47(12), 84–93 (2009)
13. Chang, W.J., Tarng, J.-H., Peng, S.-Y.: Frequency-space-polarization on UWBMIMO performance for body area network applications. IEEE Antennas Wirel.Propag. Lett. 7, 577–580 (2008)
14. Cwalina, K., S�lawomir, A., Rajchowski, P.: An off-body narrowband and ultra-wideband channel model for body area networks in a ferry environment. In: Proceedingsof the IRACON 7th MC Meeting and 7th Technical Meeting, pp. 1–20 (2018)
15. Teo, Y.J., et al.: Cooperative communications in ultra-wideband wireless bodyarea networks: channel modeling and system diversity analysis. IEEE J. Sel. AreasCommun. 27(1), 5–16 (2009)
16. Hoyt, R., Reifman, J., Coster, T., Buller, M.: Combat medical informatics: presentand future. In: Proceedings of the AMIA 2002 Annual Symposium, San Antonio,TX, pp. 335–339 (2002)
17. Choi, B.K., Kim, B.S., Lee, S., Wang, K.Y., Kim, Y.J., Chung, D.: Narrowbandphysical layer design for WBAN system. In: Proceedings of the First InternationalConference on Pervasive Computing, Signal Processing and Applications, pp. 154–157 (2010)
18. Contaldo, M., Banerjee, B., Ruffieux, D., Chabloz, J., Le Roux, E., Enz, C.C.:A 2.4-GHz BAW-based transceiver for wireless body area networks. IEEE Trans.Biomed. Circuits Syst. 4(6), 391–399 (2010)
19. The Digital Imaging and Communications in Medicine (DICOM) Standard.medical.nema.org
20. Mare, S., Sorber, J., Shin, M., Cornelius, C., Kotz, D.: Adaptive security andprivacy for mHealth sensing. In: Proceedings of the 2nd USENIX Conference onHealth Security and Privacy (HealthSec 2011), pp. 2–12. USENIX Association,Berkeley (2011)
21. Merli, F., Skrivervik, A.K.: Design and measurement considerations for implantableantennas for telemetry applications. In: Proceedings of 4th European Conferenceon Antennas and Propagation EuCAP, pp. 1–5 (2010)
22. De Santis, V., Feliziani, M., Maradei, F.: Safety assessment of UWB radio systemsfor body area network by the FD2TD method. IEEE Trans. Magn. 46(8), 3245–3248 (2010)
23. Domenicali, D., De Nardis, L., Di Benedetto, M.-G.: UWB body area networkcoexistence by interference mitigation. In: Proceedings of IEEE International Con-ference on Ultra-Wideband, ICUWB 2009, Vancouver, Canada, 9–11 September2009, pp. 713–717 (2009)
24. Doukas, C., Pliakas, T., Maglogiannis, I.: Mobile healthcare information man-agement utilizing cloud computing and android OS. In: Proceedings of the 32ndAnnual International Conference of the IEEE EMBS Buenos Aires, Argentina, 31August–4 September 2010, pp. 1037–1040 (2010)

Ultra Wide Band Body Area Networks 303
25. DropBox. www.dropbox.com26. Drude, S.: Requirements and application scenarios for body area networks. In: 16th
IST Mobile And Wireless Communications Summit, pp. 1–5 (2008)27. Gerrits, J.F.M., Farserotu, J.R., Long, J.R.: Low-complexity Ultra-Wide-Band
communications. IEEE Trans. Circuits Syst. 55(4), 329–333 (2008)28. GoGrid Storage Services. www.gogrid.com29. Google Cloud Platform. cloud.google.com30. Grzonka, D.: The analysis of OpenStack cloud computing platform: features and
performance. J. Telecommun. Inf. Technol. 3, 52–57 (2015)31. Grzonka, D., Szczygiel, M., Bernasiewicz, A., Wilczynski, A., Liszka, M.: Short
analysis of implementation and resource utilization for the OpenStack cloud com-puting platform. In: Proceedings of 29th European Conference on Modelling andSimulation, ECMS 2015, pp. 608–614 (2015)
32. Hanson, M.A., et al.: Body area sensor networks: challenges and opportunities.Computer 42(1), 58–65 (2009)
33. HITECH. www.hhs.gov/ocr/privacy/hipaa/administrative/enforcementrule/hitechenforcementifr.html
34. Hernandez, M., Kohno, R.: Ultra low power UWB transceiver design for body areanetworks. In: 2nd International Symposium on Applied Sciences in Biomedical andCommunication Technologies, Israel 2009, pp. 1–4 (2009)
35. Hjortland, H.A., Lande, T.S.: CTBV integrated impulse radio design for biomedicalapplications. IEEE Trans. Biomed. Circuits Syst. 3(2), 79–88 (2009)
36. iCloud. www.icloud37. Val, J., et al.: Mobihealth: mobile health services based on body area networks.
In: Istepanian, R.S.H., Laxminarayan, S., Pattichis, C.S. (eds.) M-Health. Topicsin Biomedical Engineering, pp. 219–236. Springer, Boston (2006). https://doi.org/10.1007/0-387-26559-7 16
38. Karimabadi, S.S., Attari, A.R.: Gain enhancement of small size UWB antennafor wireless body area network applications. In: IEEE Proceedings of ICEE 2010,11–13 May 2010, pp. 50–53 (2010)
39. Kim, E.C., Park, S., Cha, J.S., Kim, J.Y.: Improved performance of UWB systemfor wireless body area networks. IEEE Trans. Consum. Electron. 56(3), 1373–1379(2010)
40. Kuhn, M., Zhang, C., Mahfouz, M., Fathy, A.E.: Real-time UWB indoor posi-tioning system with millimeter 3-D dynamic accuracy. In: Proceedings of IEEEAntennas and Propagation Society International Symposium, Charleston, CS, 1–5June 2009 (2009)
41. Latre, B., Braem, B., Moerman, I., Blondia, C., Demeester, P.: A survey on wirelessbody area networks. Wireless Netw. 17(1), 1–18 (2011)
42. Meier, C., Terzis, A., Lindenmeier, S.: A robust 3D high precision radio locationsystem. In: Proceedings of IEEE/MTT-S International Microwave Symposium,Honolulu, HI, 3–8 June 2007, pp. 397–400 (2007)
43. Nkosi, M.T., Mekuria, F.: Cloud computing for enhanced mobile health applica-tions. In: Proceedings of the IEEE 2nd International Conference on Cloud Com-puting Technology and Science, CloudCom 2010, pp. 629–633 (2010)
44. Open Clinical Knowledge Managemnt for Medical Care. www.openclinical.org/emr.html
45. Pandey, S., Voorsluys, W., Rahman, M., Buyya, R., Dobson, J., Chiu, K.: A gridworkflow environment for brain imaging analysis on distributed systems. Concurr.Comput. Pract. Exp. 21(16), 2118–2139 (2009)

304 J. Ko�lodziej et al.
46. Pandey, S., Voorsluys, W., Niu, S., Khandoker, A., Buyya, R.: An autonomic cloudenvironment for hosting ECG data analysis services. Future Gener. Comput. Syst.20, 147–154 (2012)
47. Chen, M., Gonzalez, S., Vasilakos, A., Cao, H., Leung, V.C.: Body area networks:a survey. Mob. Netw. Appl. 16(2), 171–193 (2011)
48. Bui, N., Zorzi, M.: Health care applications: a solution based on the Internet ofThings. In: Proceedings of the 4th International Symposium on Applied Sciencesin Biomedical and Communication Technologies (ISABEL 2011). ACM, New York(2011). Article 131, 5 p
49. Viswanathan, H., Chen, B., Pompili, D.: Research challenges in computation, com-munication, and context awareness for ubiquitous healthcare. IEEE Commun. Mag.50(5), 92–99 (2012)
50. Hassan, M.M., Song, B., Huh, E.-N.: A framework of sensor-cloud integrationopportunities and challenges. In: Proceedings of the 3rd International Conferenceon Ubiquitous Information Management and Communication (ICUIMC 2009), pp.618–626. ACM, New York (2009)
51. Sorber, J.M., Shin, M., Peterson, R., Kotz, D.: Plug-n-trust: practical trusted sens-ing for mhealth. In: Proceedings of the 10th International Conference on MobileSystems, Applications, and Services (MobiSys 2012), pp. 309–322. ACM, New York(2012)
52. Ateniese, G., Fu, K., Green, M., Hohenberger, S.: Improved proxy re-encryptionschemes with applications to secure distributed storage. ACM Trans. Inf. Syst.Secur. 9, 1–30 (2006)
53. Wenliang, D., Deng, J., Han, Y.S., Varshney, P.K., Katz, J., Khalili, A.: A pairwisekey predistribution scheme for wireless sensor networks. ACM Trans. Inf. Syst.Secur. 8, 2 (2005)
54. Li, M., Lou, W., Ren, K.: Data security and privacy in wireless body area networks.Wireless Commun. 17, 1 (2010)
55. Chun, B.-G., Maniatis, P.: Augmented smartphone applications through clonecloud execution. In: Proceedings of the 12th Conference on Hot Topics in OperatingSystems (HotOS 2009), p. 8-8. USENIX Association, Berkeley (2009)
56. Li, W., Ping, L.: Trust model to enhance security and interoperability of cloudenvironment. In: Jaatun, M.G., Zhao, G., Rong, C. (eds.) CloudCom 2009. LNCS,vol. 5931, pp. 69–79. Springer, Heidelberg (2009). https://doi.org/10.1007/978-3-642-10665-1 7
57. Wang, Q., et al.: Dependable and secure sensor data storage with dynamic integrityassurance. In: Proceedings of the IEEE INFOCOM, pp. 954–962 (2009)
58. Weiss, A.: Health and biomedical informatics. netWorker 13(4), 18–25 (2009)59. Kurschl, W., Beer, W.: Combining cloud computing and wireless sensor networks.
In: Proceedings of the 11th International Conference on Information Integrationand Web-based Applications and Services (iiWAS 2009), pp. 512–518. ACM, NewYork (2009)
60. Doherty, A.R., Tolle, K.M., Smeaton, A.F.: Utilising contextual memory retrievalcues and the ubiquity of the cell phone to review lifelogged physiological activities.In: Proceedings of the 1st International Workshop on Interactive Multimedia forConsumer Electronics (IMCE 2009), pp. 19–26. ACM, New York (2009)
61. Sorber, J., et al.: An amulet for trustworthy wearable mHealth. In: Proceedings ofthe Twelfth Workshop on Mobile Computing Systems and Applications (HotMobile2012). ACM, New York (2012). Article 7

Ultra Wide Band Body Area Networks 305
62. Di Pietro, R., et al.: Catch me (if you can): data survival in unattended sen-sor networks. In: 2008 Sixth Annual IEEE International Conference on PervasiveComputing and Communications (PerCom), pp. 185–194 (2008)
63. Morchon, O.G., Baldus, H.: Efficient distributed security for wireless medical sen-sor networks. In: 2008 International Conference on Intelligent Sensors, Sensor Net-works and Information Processing, pp. 249–254 (2008)
64. Istepanian, R.S.H., Laxminarayan, S., Pattichis, C.S.: M-Health: Emerging MobileHealth Systems. Springer, New York (2005). https://doi.org/10.1007/b137697
65. Venkatasubramanian, K.K., Gupta, S.K.S.: Security solutions for pervasive health-care. In: Xiao, Y. (ed.) Security in Distributed Grid Mobile and Pervasive Com-puting, pp. 443–464. Auerbach, Boston (2007)
66. Patel, M., Wang, J.: Applications, challenges, and prospective in emerging bodyarea networking technologies. IEEE Wirel. Commun. 17(1), 80–88 (2010)
67. Qiu, X., et al.: Cloud technologies for bioinformatics applications. In: Proceedingsof the 2nd Workshop on Many-Task Computing on Grids and Supercomputers, pp.1–10. ACM (2009)
68. Rajagopal, S., Kang, N.-G., Park, S.-H., Bynam, K., Cho, C., Won, E.T.: ChaoticUWB based system design for ultra low power body area networks. IEEE Trans.Microw. Theory Tech. 56(10), 15–18 (2008)
69. Roy, S., Oestges, C., Horlin, F., De Doncker, P.: A comprehensive channel modelfor UWB multisensor multiantenna body area networks. IEEE Trans. AntennasPropag. 58(1), 163–170 (2010)
70. Ryckaert, J., et al.: Ultra-WideBand transmitter for wireless body area networks.IEEE Trans. Circuits Syst. I 52(12), 2515–2525 (2005)
71. Sangodoyin, S., Molisch, A.F.: Experimental investigation of the impact of BMI onultrawideband MIMO body-to-body networks. In: Proceedings of the IEEE 87thVehicular Technology Conference (VTC Spring), pp. 1–5 (2018)
72. Takizawa, K., et al.: Channel models for wireless body area networks. In: Proceed-ings of the 30th Annual Conference of IEEE Engineering in Medicine and BiologySociety, pp. 1549–1552 (2008)
73. Takizawa, K., Aoyagi, T., Kohno, R.: Channel modeling and performance evalua-tion of UWB-based wireless body area networks. In: IEEE ICC 2009 (2009)
74. Tysowski, P.K., Hasan, M.A.: Re-encryption-based key management towardssecure and scalable mobile applications in clouds. In: IACR Cryptology ePrintArchive, pp. 668–668 (2011)
75. Lorincz, K., et al.: Mercury: a wearable sensor network platform for high-fidelitymotion analysis. In: Proceedings of the 7th ACM Conference on Embedded Net-worked Sensor Systems (SenSys 2009), pp. 183–196. ACM, New York (2009)
76. Jakobik, A., Grzonka, D., Palmieri, F.: Non-deterministic security driven metascheduler for distributed cloud organizations. Simul. Model. Pract. Theory 76,67–81 (2017)
77. Varshney, U.: Pervasive healthcare and wireless health monitoring. Mob. Netw.Appl. 12, 113–127 (2007)
78. Jakobik, A.: Big data security. In: Pop, F., Ko�lodziej, J., Di Martino, B. (eds.)Resource Management for Big Data Platforms: Algorithms, Modelling, and High-Performance Computing Techniques. CCN, pp. 241–261. Springer, Cham (2016).https://doi.org/10.1007/978-3-319-44881-7 12
79. Vecchiola, C., Chu, X., Buyya, R.: Aneka: a software platform for .NET-basedcould computing. In: High Speed and Large Scale Scientific Computing, pp. 267–295. IOS Press (2009)

306 J. Ko�lodziej et al.
80. Wang, S., Park, J.-T.: Modeling and analysis of multi-type failures in wireless bodyarea networks with semi-Markov model. IEEE Commun. Lett. 14(1), 6–8 (2010)
81. Xia, L., Redfield, S., Chiang, P.: Experimental characterization of a UWB channelfor body area networks. EURASIP J. Wirel. Commun. Netw. 2011, Article ID703239, 11 p. (2011). https://doi.org/10.1155/2011/703239
82. Yan, S., Soh, P.J., Vandenbosch, G.A.E.: Wearable ultrawideband technology-areview of ultrawideband antennas, propagation channels, and applications in wire-less body area networks. IEEE Access 6, 42177–42185 (2018)
83. Yang, G.-Z. (ed.): Body Sensor Networks. Springer, London (2006). https://doi.org/10.1007/1-84628-484-8
84. Yazdandoost, K.Y., Kohno, R.: UWB antenna for wireless body area network. In:Proceedings of the Asia-Pacific Microwave Conference, APMC 2006, pp. 1647–1652(2006)
85. Zasowski, T., Wittneben, A.: Performance of UWB receivers with partial CSI usinga simple body area network channel model. IEEE J. Sel. Areas Commun. 27(1),10 (2009)
Open Access This chapter is licensed under the terms of the Creative CommonsAttribution 4.0 International License (http://creativecommons.org/licenses/by/4.0/),which permits use, sharing, adaptation, distribution and reproduction in any mediumor format, as long as you give appropriate credit to the original author(s) and thesource, provide a link to the Creative Commons license and indicate if changes weremade.
The images or other third party material in this chapter are included in the chapter’sCreative Commons license, unless indicated otherwise in a credit line to the material. Ifmaterial is not included in the chapter’s Creative Commons license and your intendeduse is not permitted by statutory regulation or exceeds the permitted use, you willneed to obtain permission directly from the copyright holder.

Survey on AI-Based Multimodal Methodsfor Emotion Detection
Catherine Marechal1 , Dariusz Mikołajewski2,3 ,Krzysztof Tyburek2 , Piotr Prokopowicz2 ,Lamine Bougueroua1 , Corinne Ancourt4 ,
and Katarzyna Węgrzyn-Wolska1(&)
1 Allianstic Research Laboratory, Efrei Paris, Villejuif, France{catherine.marechal,lamine.bougueroua,
katarzyna.wegrzyn-wolska}@efrei.fr2 Institute of Mechanics and Applied Computer Science,
Kazimierz Wielki University, Bydgoszcz, Poland{dmikolaj,krzysiekkt,piotrek}@ukw.edu.pl
3 Neurocognitive Laboratory, Centre for Modern Interdisciplinary Technologies,Nicolaus Copernicus University, Toruń, Poland
[email protected] MINES ParisTech, PSL University, CRI, Paris, France
Abstract. Automatic emotion recognition constitutes one of the great chal-lenges providing new tools for more objective and quicker diagnosis, commu-nication and research. Quick and accurate emotion recognition may increasepossibilities of computers, robots, and integrated environments to recognizehuman emotions, and response accordingly to them a social rules. The purposeof this paper is to investigate the possibility of automated emotion representa-tion, recognition and prediction its state-of-the-art and main directions for fur-ther research. We focus on the impact of emotion analysis and state of the arts ofmultimodal emotion detection. We present existing works, possibilities andexisting methods to analyze emotion in text, sound, image, video and physio-logical signals. We also emphasize the most important features for all availableemotion recognition modes. Finally, we present the available platform andoutlines the existing projects, which deal with multimodal emotion analysis.
Keywords: Affective computing � Emotion detection �Automatic data processing � Data collection � Expressed emotion � Big data �Artificial intelligence
1 Introduction
Affective Computing (AC) has been a popular area of research for several years. Manyresearch has been conducted to enable machines detect and understand human affectivestates, such as emotions, interests and the behavior. It attempts to bridge the com-munication gap between human users and computers with “soulless” and “emotionless”
© The Author(s) 2019J. Kołodziej and H. González-Vélez (Eds.): cHiPSet, LNCS 11400, pp. 307–324, 2019.https://doi.org/10.1007/978-3-030-16272-6_11

feeling. The inability of today’s systems to recognize, express and feel emotions limitstheir ability to act intelligently and interact naturally with humans.
To become more user-friendly and effective, systems need to become sensitive tohuman emotions. Verbal and nonverbal information is very important because itcomplements the verbal message and provides a better interpretation of the message. Itis very useful to design and develop systems that can measure the emotional state of aperson based on, for example, gestures (body movements and postures), facialexpression, acoustic characteristics and emotions expressed in the text. In the practicalcase, body signals and facial expressions recorded in real-time by sensors and camerascan be associated with predetermined emotions.
It is interesting to merge the multimodal information retrieved by these deviceswith information from analysis of emotions and intensity in text. For example, theultimate goal may be to improve the system’s decisions so that they can reactaccordingly to recognized emotions, which will allow better human-machineinteraction.
Conventional wisdom says that 70–90% of communication between humans isnonverbal. The studies conducted by Albert Mehrabian in 1967 established the 7%–
38%–55% rule, also known as the “3V rule”: 7% of the communication is verbal, 38%of the communication is vocal and 55% of the communication is visual [1]. Thisjustifies the interest and importance of nonverbal communication.
The first study in the field of emotion detection was born during thesixties/seventies. The most prominent example is that of mood rings [2]. The principleis simple; rings contain thermotropic liquid crystals that react with body temperature.When a person has stressed, his mood ring take on a darker color.
The scientific publications of Rosalind Picard (MIT) have introduced a great pro-gress in this field since the nineties [3, 4]. He is one of the pioneers of affectivecomputing. In his book “Affective Computing”, Picard proposed that emotion can bemodeled using the nonlinear sigmoid function. Over the last 20 years, the developmentof technology has allowed the implementation of relatively good system market andefficient such as ambient intelligence (AMI), virtual reality (VR) and augmented reality(AR).
Nowadays, in the automotive field for example, an on-board computer that is ableto detect confusion, interest or fatigue can increase safety. The AutoEmotive (MITMedia Lab) is a prototype equipped with sensors and a camera placed on the steeringwheel [5]. This vehicle measures the level of stress and fatigue of the driver. When theneed arises, he puts a background music, changes the temperature and light in thevehicle interior, or still proposes to follow a less stressful journey.
We have structured the remainder of the paper as follows. Section 2 describes ingeneral existing works dealing with the emotion detection and multimodal emotionanalysis problem. Section 3 presents the basic modalities and methods used for emo-tion analysis. We have presented the related existing projects dealt with this problem inSect. 4. We summarize the survey and introduce some directions for future research inSect. 5.
308 C. Marechal et al.

2 Multimodal Emotion Analysis
Traditional emotion recognition and classification associate the “value” to at leastseveral basic emotions such as happiness, joy, neutrality, surprise, sadness, disgust,anger, or fear.
Multimodal emotion analysis becomes very popular research domain. Started fromthe classic language-based definition of sentiment analysis was extended to a multi-modal with other relevant modalities (video, audio, sensor data, etc.). Different tech-niques and methods are combined to achieve it; very often, they are based on big datamethods; semantic rules and machine learning.
A novel multimodal implicit emotion recognition system can be built upon an AI-based model designed to extract information on the emotion from different devices. Tofeed such a model, a video data captured by the camera embedded in the user’s device(laptop, desktop, tablet, etc.), an audio signals collected from microphones embeddedin mobile devices, and motion signals generated by sensors in wearable devices can beused.
Several multimodal datasets include sentiment annotations. Zadeh et al. introducedthe first multimodal dataset (MOSI) with opinion-level sentiment intensity annotationsand studying the prototypical interaction patterns between facial gestures and spokenwords when inferring sentiment intensity. They proposed a new computational rep-resentation, called multimodal dictionary, based on a language-gesture study andevaluated the proposed approach in a speaker-independent model for sentimentintensity prediction [6]. For other examples of data sets we can cite ICT-MMMO [7]and MOUD [8] datasets.
One of the most challenges in multimodal emotion analysis is to model the inter-actions between language, visual and acoustic behaviors that change the observation ofthe expressed emotion (named the inter-modality dynamics). A second challenge inmultimodal emotion analysis (named intra-modality dynamics) is to efficiently exploreemotion, not only on one but on highly expressive nature modality (ex. spoken lan-guage where proper language structure is often ignored, video and acoustic modalitieswhich are expressed through both space and time. To solve this problem, Zadehintroduced the Tensor Fusion Network (TFN), which combine the intra-modality andinter-modality models. Inter-modality dynamics is modeled with a new multimodalfusion approach, named Tensor Fusion, which explicitly aggregates unimodal, bimodaland trimodal interactions. Intra-modality dynamics is modeled through three ModalityEmbedding Subnetworks, for language, visual and acoustic modalities, respectively[9]. Interesting work is realized by Poria et al., who developed a LTSM-based networkto extract contextual features from the video for multimodal sentiment analysis [10].
Additionally, they presented a multimodal sentiment analysis framework, whichincludes sets of relevant features for text and visual data, as well as a simple techniquefor fusing the features extracted from different modalities [11].
The previous presented methods combine and analyze data from various types ofmodality, the basis for all these analyzes is appropriate detection of emotion on eachmodality input. At the same time, we must point out that for each modality individually
Survey on AI-Based Multimodal Methods for Emotion Detection 309

we can also perform emotion analysis. In the next chapter, we will describe themethods of emotion analysis for each modality separately.
3 Basic Modalities for Emotion Analysis
3.1 Emotion in Text
Opinion Mining (OM) and Sentiments Analysis (SA) consists in identifying orientationor intensity of sentiments and opinion in pieces of texts (blogs, forums, user comments,review websites, community websites, etc.). It enables determining whether a sentenceor a document expresses positive, negative or neutral sentiment towards some object ormore. In addition, it allows for classification of opinions/sentiments according tointensity degrees.
Definition. An opinion is a quadruple (O, F, H, S) where O is a target object, F is a setof features of the object O, H is a set of opinion’s holders, S is the set ofsentiment/opinion value of the opinion’s holder on feature fi 2 F of the object O.
According to Liu [12] “sentiment analysis is the field of study that analyses peo-ple’s opinions, sentiments, evaluations, appraisals, attitudes, and emotions towardentities such as products, services, organizations, and their attributes. It represents alarge problem space. There are also many names and slightly different tasks, e.g.,sentiment analysis, opinion mining, opinion extraction, sentiment mining, subjectivityanalysis, affect analysis, emotion analysis, review mining, etc.”
Sentiments analysis is a complex technique. Sentiments and opinions can often beexpressed in a subtle manner that creates difficulty in the identification of their emo-tional value. Moreover, opinions and sentiments are highly sensitive to the context andthe field in which they are used: the same string might be positive in one context andnegative in another. In addition, on the Internet, everyone uses his or her own style andvocabulary, what adds extra difficulty to the task. It is not yet possible to find out anideal case to marking the opinion in a text written by different users, because the textdoes not follow the rules. Therefore, it is impossible to schedule every possible case.Moreover, very often the same phrase can be considered as positive for one person andnegative for another one.
Text analysis and social network analysis have gained importance with growinginterest in Big Data. Both deal with large amounts of data, largely unstructured, and theBig Data benefit comes from the application of these two methods of data analysis. Wewill begin by examining some of the ways in which text analysis can be applied tosentiment analysis before moving on to social network analysis.
Text AnalysisSentiment Analysis (SA) [13] is a computational study of how opinions, attitudes,emoticons and perspectives are expressed in language. Sentiment Detection, or in itssimplified form – Polarity Classification, is a tedious and complex task. Contextualchanges of polarity indicating words, such as negation, sarcasm as well as weaksyntactic structures make it troublesome for both machines and humans to safelydetermine polarity of messages.
310 C. Marechal et al.

Sentiment analysis methods involve building a system to collect and categorizeopinions about a product. This consists in examining natural language conversationshappening around a certain product for tracking the mood of the public. The analysis isperformed on large collections of texts, including web pages, online news, Internetdiscussion groups, online reviews, web blogs, and social media. Opinion Mining aimsto determine polarity and intensity of a given text, i.e., whether it is positive, negative,or neutral and to what extent. To classify the intensity of opinions, we can use methodsintroduced in [14–16].
Social NetworksSocial Networks are indisputably popular nowadays and show no sign of slowdown.According to the Kepios study [17], the number of active users of social networksincreased by 13% in 2017 to reach 3.3 billion users in April 2018. For example,Facebook attracts more than 2.2 billion users a month. Penetrating ever more aspects ofour daily life, they become not only a considerable threat to our privacy, but also anencompassing tool for analyzing opinions, habits, trends and some would even say –
thoughts.In the current growth of artificial intelligence, machine learning and natural lan-
guage processing, driven by new technological possibilities, it is possible to automatethe analysis of vast amounts of publicly published data.
Text Mining and Social Network Analysis have become a necessity for analyzingnot only information but also the connections across them. The main objective is toidentify the necessary information as efficiently as possible, finding the relationshipsbetween available information by applying algorithmic, statistical, and data manage-ment methods on the knowledge. The automation of sentiment detection on these socialnetworks has gained attention for various purposes [18–20].
Twitter is a social network that allows the user to freely publish short messages,called Tweets via the Internet, instant messaging or SMS. These messages are limitedto 140 characters (more exactly, NFC normalized code points [21]). With about 330million monthly active users (as of 2018, Twitter Inc.), Twitter is a leading socialnetwork, which is known for its ease of use for mobile devices (90% of users access thesocial network via mobile devices). Twitter known by the diversity of content, as wellas its comprehensive list of APIs offered to developers. With an average of 500 millionmessages sent per day, the platform seems ideal for tracking opinions on varioussubjects. Furthermore, the very short format messages facilitate classification sinceshort messages rarely discuss more than one topic.
However, automated interpretation is complicated by embedded links, abbrevia-tions and misspellings. Facing these challenges is becoming increasingly important forEconomic and Market Intelligence in order to successfully recognize trends and threats.
The frequent expression of negative emotion words on social media has been linkedto depression. The aim of [22] was to report on the associations between depressionseverity and the variability (time-unstructured) and instability (time-structured) inemotion word expression on Facebook and Twitter across status updates. Severalworks on depression have emerged. They are based on social networks: Twitter [23,24] and Facebook [25, 26].
Survey on AI-Based Multimodal Methods for Emotion Detection 311

Several authors have been interested in the use of emoticons to complete thesentiment analysis. Authors in [27] utilize Twitter API to get training data that containemoticons like :) and :(. They use these emoticons as noisy labels. Tweets with :) arethought to be positive training data and tweets with :( are thought to be negativetraining data. In [28], authors present the ESLAM (Emoticon Smoothed LAnguageModels) which combine fully supervised methods and distantly supervised methods.Although many TSA (Twitter Sentiment Analysis) methods have been presented. Theauthors in [29] explored the influence of emoticons on TSA.
3.2 Emotion Detection in the Sound
Automatic emotion recognition based on utterance level prosodic features may play animportant role within speaker-independent emotion recognition [30]. The recognitionof emotions based on the voice has been studied for decades [31–34]. However, mostof the work-concerned data collected in a controlled environment in which the data areclean without significant noise and directly well segmented. In addition, the majority ofsuch a system are speech-oriented. In the real world, the process is much more com-plex. There are many factors such as background noise and not speech voice like alaugh, a whimper, a cry, a sigh, etc., which greatly aggravate the results obtained in acontrolled environment. These factors will make the real emotion recognition trainedon the data from the controlled environment unsuccessful.
The author in [35] focused on mono-modal systems with speech as only inputchannel. He proposed FAU Aibo Emotion Corpus, which is a speech corpus withnaturally occurring emotion-related states. FAU Aibo is a corpus of spontaneous,emotionally colored speech of German children at the age of 10 to 13 years interactingwith the Sony Robot Aibo. Eleven emotion-related states are labeled on the word level.Best results have been obtained on the chunk level where a classwise averagedrecognition rate of almost 70% for the 4-class problem anger, emphatic, neutral andmotherese has been achieved.
Voice-based emotion recognition system relying on audio input has low require-ments for hardware. Especially the recent emerging of speech-based artificial assistant,e.g. Google Home, Amazon Alexa, etc., provides the ready-to-employ platform forvoice-based emotion recognition system.
Audio Analysis: BackgroundNowadays human speech recognition (HSR) and automatic speech recognition(ASR) systems have a very wide application. This aspect is also referred to therecognition of emotion state. Emotion recognition by research human speech is con-nected with two research areas. First is related to synthetic approach, which allowsgenerating artificial speech samples filled specific emotions. The second issue concernsmachine recognition of the speaker’s emotions. In order to possible, a machine (ITsystem) has to learn human emotions expressed out of speech like speech intonation,articulation, etc. By the recognizing emotions from human speech, we can notice whichkind of emotion is dominant during conversation. Possible to recognize emotions statelike sadness, fear, embarrassment, terror, etc. Connected with this, machines could helppeople in making right decisions by recognizing emotions, especially in irrational
312 C. Marechal et al.

situations where decisions have to be made faster than a rational performing mind.Sometimes it is valuable to artificially influence mental and emotional states to get abetter individual performance in stress-related occupations and prevent mental disor-ders from happening [36]. Recent research has shown that under certain circumstancesmultimodal emotion recognition is possible even in real time [37].
Feature ExtractionSound signals (including human speech) is one of the main mediums of communicationand it can be processed to recognize the speaker or even emotion. This diagnosis ispossible through signal decomposition and time-frequency analysis. During thisanalysis, key physical features are found which are clearly able to describe the emo-tional background of the speaker. Analyzing speech as a sound and not the meaning ofspoken words is possible eliminate the language barrier by focusing only on theemotional message. This can be obtained by calculating the values of descriptors beable to describe such features as the ratio of amplitudes in particular parts of the signal,the shape of the signal waveform, the frequency distribution, etc. The basic principlebehind emotion recognition lies with analyzing the acoustic difference that occurs whentalking about the same thing under different emotional situations [38].
The accurate selection of descriptors and their combination, allows to determinewhich emotions are dominant in conversation - that is, their worth is very important forclassification. It is therefore necessary to index the speech signal to evaluate thespeaker’s emotions. Acquiring features is possible by investigating time domain andfrequency domain speech signals. This way, it is practicable to obtain feature vectorwhich can be able to automatic objects classification - it means, automatic classificationof emotion state too. During research is necessary concentrate on insightful researchfrequency domain, not forgetting the time domain descriptors either. There are somephysical features applied for indexing speech, like: spectrum irregularity, wide andnarrow band spectrograms, speech signals filtering and processing, enhancement andmanipulation of specific frequency regions, segmentation and labeling of words, syl-lables and individual phonemes [37]. Moreover, the Mel-Frequency Cepstral Coeffi-cients (MFCC) is widely used in speech classification experiments due to its goodperformance. It extracts and represents features of speech signal - including kinds ofemotions. The Mel-Cepstral takes short-time spectral shape with important data aboutthe quality of voice and production effects. To calculate these coefficients the inversecosine transform of decimal logarithm of the Mel filtered short-term spectrum of energymust be done. The purpose of improving results of experiment and searching effectivespectral feature vector, constant spectral resolution is used [39]. For the reduction ofleakage effect, the Hamming window is implemented. This is necessary for increasingthe efficiency of frequency in human speech [38].
There is MPEG 7 standard, which gives many descriptors definitions for thephysical features of sound (including human speech). These descriptors are defined onthe base of analysis of digital signals and index of most important their factors.The MPEG 7 Audio standard contains descriptors and description schemes that can bedivided into two classes: generic low-level tools and application-specific tools [40].MPEG 7 descriptors are being very helpful for assessment features of human speech in
Survey on AI-Based Multimodal Methods for Emotion Detection 313

a general sense. They can be used to assess the emotions because each emotional stateexpressed in speech contains specific numeric values of MPEG 7 descriptors.
After the extraction of features, the machine learning part of the generic systemshould analyze features and find statistical relationships between particular features andemotional states. This part of the system is also called “classifier”. Most commonlyused classification algorithms are Artificial Neural Networks (ANN), k-NearestNeighbor (k-NN) and Support Vector Machines (SVM), decision trees. Furthermore,probabilistic models such as the Gaussian mixture model (GMM) or stochastic modelssuch as Hidden Markov Model (HMM) can be applied [36].
AccuracyEmotion analysis of speech is possible; however, it highly depends of the language.Automatic and universal emotion analysis is very challenging. Analyze of emotion ismore efficient when perform for one dedicated language. Study by Chaspari et al.showed that emotion classification in speech (Greek language) achieved accuracy up to75.15% [41]. Similar study by Arruti et al. showed mean accuracy of 80.05% emotionrecognition rate in Basque and a 74.82% in Spanish [42].
3.3 Emotion in Image and Video
Nonverbal behavior constitutes useful means of communication in addition to spokenlanguage. It allows to communicate even complex social concepts, in various contexts,thus may be regarded not only supplementary, but also as basic way of emotionrecognition. It is possible to easily reading the affects, emotions and intentions fromface expressions and gestures. Indeed, Ekman (one of the pioneers in the study of facialexpressions and emotions) [43] identifies at least six characteristics from posed facialactions that enable emotion recognition: morphology, symmetry, duration, speed ofonset, coordination of apexes and ballistic trajectory. They are common to all humansconfirming Darwin’s evolutionary thesis. Therefore, an emotional recognition toolsbased on facial video is universal.
However, automatic and either - automatic semi recognition of the meaning of faceexpressions and gesture still constitutes true challenge. We will focus on facialexpressions.
3.4 Automatic Facial Emotion
The human face, as a modality for emotion detection takes a dominant position in thestudy of affect. It is possible to register the facial information automatically in real-time,without requiring any specialized equipment except a simple video camera. Thus, facialexpressions as a noninvasive method are used in behavioral science and in clinical.Therefore, automatic recognition of facial expressions is an important component foremotion detection and modeling the natural human-machine interfaces.
The face is equipped with a large number of independent muscles, which can beactivated at different levels of intensity. Consequently, the face is capable of generatinga high number of complex dynamic facial expression patterns. There are three maindimensions of facial variation: morphology, complexion and dynamics. As first two
314 C. Marechal et al.

dimensions, morphology and complexion, deals with static dimensions, there are veryuseful for facial recognition but their role for emotion analyze is not significant. Thethird one, the dynamics, play the most important role for emotion face analysis [44].Although mapping of facial expressions to affective states is possible, the automaticrecognizing of humans’ emotion from the facial expressions, without effort or delay isstill a challenge.
Automatic detection of emotions from facial expressions are not simple and theirinterpretation is largely context-driven. To reduce the complexity of automatic affectiveinference, measurement and interpretation of facial expressions, Ekman and Friesendeveloped in 1978 special system for objectively measuring facial movement; theFacial Action Coding System (FACS) [45]. FACS, based on a system originallydeveloped by a Swedish anatomist named Hjortsjö [46] became the standard foridentifying any movement of the face. Later, Ekman and Sejnowski studied alsocomputer based facial measurements [47].
FACS is a common standard to systematically categorize and to index the physicalexpression of emotions. The basic values of FACE are Action Units (AUs). AUs are thefundamental actions of individual muscles or groups of muscles. The AUs are groupedin several categories and identified by a number: main codes, head movement codes,eye movement codes, visibility codes, and gross behavior codes. The intensities of AUsare annotated in five categories, by appending letters A–E to the AUs (A for minimalintensity-trace, B for slight intensity, C for marked, D for severe, E for maximumintensity). For example, AU1A signifies the weakest trace of AU1 and AU1E is themaximum intensity possible of AU1 for the individual person.
The eyes and mouth have high importance to emotion detection; therefore, tosuccessfully recognize an emotion, the observations mostly rely on the eye and mouthregions. Furthermore, the actions of eyes and mouth allowed grouping the expressionsin a continuous space, ranging from sadness and fear (reliance on the eyes) to disgustand happiness (mouth). Combining these observations with facial AUs increaseknowledge about the areas involved in displaying each emotion. For example, “happy”denoted by AU6 + AU12, comprises AU6 (Cheek Raiser) and AU12 (Lip CornerPuller), whereas ‘sad’ (AI1 + AU4 + AU15) comprises AU1 (Inner Brow Raiser), AU4(Brow Lowerer) and AU15 (Lip Corner Depressor).
The computer algorithm for facial coding extracts the main features of the face(mouth, eyebrows, etc.) and analyzes movement, shape and texture composition ofthese regions to identify facial action units (AUs). Therefore, it is possible to track tinymovements of facial muscles in individuals’ face and translate them into universalfacial expressions like happiness, surprise, sadness, anger and others.
Very important is also the way, how the emotional representation is created. Afzalet al. [48] performed studies differences between human raters’ judgments of emotionalexpressions and three automatically generated representations in video clips. First, thepoint-based display was created from the output of a commercial automatic face-tracker[49] on a black background. Second one, stick figure models, which connecting theautomatically tracked feature-points using straight lines and sketching eyes usingtypical shape. The last one, 3D XFace Animation was a 3D animated facial expressionsand displays created using XFace open source toolkit. Their experiences confirmed that
Survey on AI-Based Multimodal Methods for Emotion Detection 315

the human judgement is still the best one, with the highest recognition rates, followedby stick-figure models, point-light displays, and then XFace animations.
3.4.1 Existing Tools for Automatic Facial Emotion RecognitionFacial emotion recognition is one of the most important methods for nonverbal emotiondetection. Several popular commercial packages offer specific facial image analysistasks, including facial expression recognition, facial attribute analysis, and facetracking. We cite below few examples:
IntraFace (IF) [50], a publicly available software package offering:
• automated facial feature tracking,• head pose estimation,• facial attribute recognition,• facial expression analysis from video,• unsupervised synchrony detection to discover correlated facial behavior between
two or more persons.
It also measure an audience reaction to a talk given or synchrony for smiling invideos of parent-infant interaction.
The Emotion API (Microsoft Azure)Microsoft Azure proposes on-line API to recognize emotions in images and in videos[51]. The Emotion API permits input data directly as an image or as “bounding box”from Face API. In the output, it returns the confidence across a set of eight emotions:anger, contempt, disgust, fear, happiness, neutral, sadness, and surprise. Emotion APIis able to track how a person or a crowd responds to your content over time.
Emotion API provide the interface for C#, cURL, Java, JavaScript, PHP, Python,Ruby. It is also possible to implement these API in R [52].
Micro Expressions Training ToolEkman has created several training tools [53] to enhance understanding of emotionsand relationships:
• Micro Expressions Training Tool (METT and intensive MEITT) to teach how todetect and interpret micro expressions,
• Subtle Expressions Training Tool (SETT) to learn how to see emotions as theydevelop. SETT provides foundational knowledge of how emotions emerge in justone region on the face.
• Micro Expressions Profile Training Tool (MEPT): you to identify micro expressionsfrom different angles.
3.5 Emotion Detected by the Physiological and Motor Signals
Recently the physiological and motor data are accessible by IoT technology. People areinterested in purchasing connected objects in order to monitor their healthy like heartrate, blood pressure, number of burned calories and analyze their movements. We canfind a lot work for healthcare applications but at the same time, this technology can be
316 C. Marechal et al.

used to emotion detection. As an example, we can cite work done by Amira et al. [54]as a good example of using the emotion analyze for healthcare purpose. This worktakes into consideration the emotional state of the peoples (stress, happiness, sadness,among) and analyze that using the appropriate AI tools to detect emotion, to categorizeit and then analyze its impact on cardiovascular disease.
Physiological SignalsAutomatic emotion recognition based on physiological signals is a key topic for manyadvanced applications (safe driving, security, mHealth, etc.). Main analyzed physio-logical signals useful for emotion detection and classification are:
• electromyogram (EMG) - recording of the electrical activity produced by skeletalmuscles,
• galvanic skin response (GSR) - reflecting skin resistance, which varies with the stateof sweat glands in the skin controlled by the sympathetic nervous system, whereconductance is an indication of psychological or physiological state,
• respiratory volume (RV) - referring to the volume of air associated with differentphases of the respiratory cycle,
• skin temperature (SKT) - referring to the fluctuations of normal human bodytemperature,
• blood volume pulse (BVP) - measures the heart rate,• heart rate (HR),• electrooculogram (EOG) - measuring the corneo-retinal standing potential between
the front and the back of the human eye,• photoplethysmography (PPG) - measuring blood volume pulse (BVP), which is the
phasic change in blood volume with each heartbeat, etc.
The recognition of emotions based on physiological signals covers differentaspects: emotional models, methods for generating emotions, common emotional datasets, characteristics used and choices of classifiers. The whole framework of emotionrecognition based on physiological signals has recently been described by [55].
Decision-level weight fusion strategy for emotion recognition in multichannelphysiological signals using MAHNOB-HCI database has been recently described [56].Various classification tools may be used, including artificial neural networks (ANN),support vector machine (SVM), k-nearest neighbors (KNN), and many more. Moreadvanced emotion representation models, including clustering of responses, are createdfor purposes of further studies and increased recognition accuracy.
Özerdem and Polat used EEG signal, discrete wavelet transform and machinelearning techniques (multilayer perceptron neural network - MLPNN, and k-nearestneighbors - kNN algorithms) [57].
Research by Jang et al. used ECG, EDA, SKT and more sophistical machinelearning (ML) algorithms [58]:
• linear discriminant analysis (LDA) - finds a linear combination of features thatcharacterizes or separates two or more classes of objects or events,
• classification and regression trees (CART) - uses a decision tree as a predictivemodel to go from observations about an item represented in the branches, to con-clusions about the item’s target value represented in the leaves,
Survey on AI-Based Multimodal Methods for Emotion Detection 317

• self-organizing map (SOM) - a type of artificial neural network that is trained usingunsupervised learning to produce a low-dimensional, discretized representation ofthe input space of the training samples, called a map,
• Naïve Bayes algorithm - based on applying Bayes’ theorem with strong (=naive)independence assumptions between the features,
• Support Vector Machine (SVM) - supervised learning models with associatedlearning algorithms analyzing data used for classification and regression analysis.
Kortelainen et al. showed results of combining physiological signals (heart rate vari-ability parameters, respiration frequency) and facial expressions were studied [59].
Motor SignalsBody posture and movement is one of the most expressive modalities for humans.Researchers have recently started to exploit the possibilities for emotion recognitionbased on different motor signals. Zachartos et al. present well done analyze of emergingtechniques and modalities related to automated emotion recognition based on bodymovement and describes application areas and notation systems and explains theimportance of movement segmentation [60]. At the same time, this work outlines thatthis field still requires further studies. To recognize the emotion different postural,kinematic and geometrical feature are used. Tsui et al. use the keystroke typing patterns(usually on a standard keyboard) for automatic recognizing of emotional state [61].
Li et al. proposed another way to solve this problem by analyzing the humanpattern of movement of the limbs (gait) recorded by Microsoft Kinect [62]. The gaitpattern for every subject was extracted from 3-dimensional coordinates of 14 mainbody joints using Fourier transformation and Principal Component Analysis (PCA). Toclassify signals’ features four ML algorithms were trained and evaluated:
• Naive Bayes (described above),• Random Forests - an ensemble learning method for classification, regression and
other tasks, that operate by constructing a multitude of decision trees at trainingtime and outputting the class that is the mode of the classes (classification) or meanprediction (regression) of the individual trees,
• LibSVM - an integrated software for support vector classification, regression, anddistribution estimation,
• Sequential Minimal Optimization (SMO) - is an algorithm for solving the quadraticprogramming problem arising during the training of support vector machines.
They showed that human gait reflects the walker’s emotional state.
AccuracyAccuracy of the emotion recognition and classification based on physiological signalsidentification have improved significantly. Research by Goshvarpour et al. using HRVand PRV, and fusion rules (feature level, decision level) showed classification ratesimproved up to 92% (sensitivity: 95%, specificity: 83.33%) [63]. Previous studies haveprovided evidence for general recognition rate from 57,77% to 85,46% for differentemotional states, that more higher set of analyzed signals and more recognized emo-tions provides better results [64–66]. High-observed recognition accuracy was also inresearch by Jang et al.: 84.7% [58].
318 C. Marechal et al.

Özerdem and Polat used EEG signal - resultant average overall accuracy was77.14% (using MLPNN) and 72.92% (using kNN) [56]. The highest accuracy achievedby Li et al. was 80.5% [62]. Accuracy for combining heart rate variability, respirationfrequency, and facial expressions was relatively low: 54.5% [59]. Results of the 2011i2b2/VA/Cincinnati Medical Natural Language Processing Challenge showed that thebest of 24 participants’ teams achieved accuracy of 61.39% [67].
It should be noted that all algorithm must be personalized to each person in order tobe reliable.
4 Related Project
4.1 openSMILE (Speech & Music Interpretation by Large-SpaceExtraction) [68]
Originally created in the scope of the European EU-FP7 research project SEMAINE(http://www.semaine-project.eu). OpenSMILE is a modular and flexible featureextractor for signal processing and machine learning applications. However, due totheir high degree of abstraction, openSMILE components can also be used to analyzesignals from other modalities, such as physiological signals, visual signals, and otherphysical sensors, given suitable input components.
4.2 openEAR (Emotion and Affect Recognition)
It consists of three major components: the core component is the SMILE (Speech andMusic Interpretation by Large-Space Extraction) signal processing and featureextraction tool, which is capable generating >500 k features in real-time (Real-TimeFactor (RTF) < 0.1), either from live audio input or from offline media [69]. Theadvantages of this solution are: open-source, multi-threaded, real-time emotionrecognition framework providing an extensible, platform independent feature extractorimplemented in C++, pre-trained models on six databases which are ready-to-use foron-line emotion and affect recognition, and supporting scripts for model building,evaluation, and visualization. This framework is compatible with related tool-kits, suchas HTK and WEKA by supporting their data-formats.
4.3 ASC-Inclusion (Interactive Emotion Games for Children with Autism)
Understand and express emotions through facial expressions, vocal intonation andbody gestures. This project aims to create an internet-based platform that will assistchildren with Autism Spectrum Condition (ASC) to improve their socio-emotionalcommunication skills. The project will attend both the recognition and the expressionof socio-emotional cues, aiming to provide an interactive-game where to give scores onthe prototypically and on the naturalness of child’s expressions. It will combine severalstate-of-the-art technologies in one comprehensive virtual world environment, com-bining voice, face and body gesture analysis, providing corrective feedback regardingthe appropriateness of the child’s expressions [70].
Survey on AI-Based Multimodal Methods for Emotion Detection 319

4.4 INTERSPEECH - Computational Paralinguistics ChallengE(ComParE)
In this Challenge, authors introduced four paralinguistic tasks, which are important forthe realm of affective human-computer interaction, yet some of them go beyond thetraditional tasks of emotion recognition. Thus, as a milestone, ComParE 2013 laid thefoundation for a successful series of follow-up ComParEs to date, exploring more andmore the paralinguistic facets of human speech in tomorrow’s real-life information,communication and entertainment systems [71].
5 Conclusion
In this paper, we presented existing multimodal approaches and methods of emotiondetection and analysis.Our study includes emotion analyze in text, in sound, in image/videoand physiological signals.We showed that automated emotion analysis is possible and canbe very useful for improving the exactness of the computer/machine reaction and makingpossible to anticipate the emotional state of the interlocutor more quickly.
Not only basic emotions can be analyzed, but also the cognitive assessment (in-terpretation of stimuli in the environment) and their physiological response. Such anapproach may cause quicker development of more user-friendly systems and envi-ronments supporting everyday life and work.
Automatic emotion analysis requires advanced recognition and modeling, veryoften based on artificial intelligence systems. Presented approach may be successful,but the limitations of the current knowledge and experience still concern tools forautomatic non-invasive emotion measurement and analysis.
We should be aware that among requirements on automatic emotion recognitionkey might constitute portability, non-intrusiveness, and low price. Novel intelligentsystems may be friendlier, preventing the computers from acting inappropriately.
In this state of the arts, we have addressed, of course only some most importantissues. No doubt, there is need for further effort of scientists and engineers toward moreadvanced AI-based automatic emotion recognition systems. Further research mayconstitute an important part of future technological, clinical, and scientific progress.
Acknowledgement (COST + PHC Polonium). This state of the art was published in cooper-ation with the COST Action IC1406 High-Performance Modelling and Simulation for Big DataApplications (cHiPSet), supported by COST (European Cooperation in Science and Technology).
This article is based upon the work done under the project PHC POLONIUM 2018 (PRO-JECT N° 40557VL), realized between the AlliansTIC Research Laboratory of Efrei ParisEngineering School (France) and the Institute of Mechanics and Applied Computer Science,Kazimierz Wielki University in Bydgoszcz (Poland).
320 C. Marechal et al.

References
1. Mehrabian, A., Ferris, S.R.: Inference of attitudes from nonverbal communication in twochannels. J. Consult. Psychol. 31(3), 248 (1967)
2. Mood Ring Monitors Your State of Mind, Chicago Tribune, 8 October 1975, at C1: RingBuyers Warm Up to Quartz Jewelry That Is Said to Reflect Their Emotions. The Wall StreetJournal, 14 October 1975, at p. 16; and “A Ring Around the Mood Market”, TheWashington Post, 24 November 1975, at B9
3. Picard, R.W.: Affective Computing. MIT Press, Cambridge (1997)4. Picard, R.W., Vyzas, E., Healey, J.: Towardmachine emotional intelligence: analysis of affective
physiological state. IEEE Trans. Pattern Anal. Mach. Intell. 23(10), 1175–1191 (2001)5. Hernandez, J., et al.: AutoEmotive: bringing empathy to the driving experience to manage
stress. In: DIS 2014, 21–25 June 2014, Vancouver, BC, Canada. ACM (2014). http://dx.doi.org/10.1145/2598784.2602780. 978-1-4503-2903-3/14/06
6. Zadeh, A., Zellers, R., Pincus, E., Morency, L.P.: Multimodal sentiment intensity analysis invideos: facial gestures and verbal messages. IEEE Intell. Syst. 31(6), 82–88 (2016). https://doi.org/10.1109/mis.2016.94
7. Wöllmer, M., et al.: YouTube movie reviews: sentiment analysis in an audio-visual context.IEEE Intell. Syst. 28(3), 46–53 (2013)
8. Perez-Rosas, V., Mihalcea, R., Morency, L.P.: Utterance-level multimodal sentimentanalysis. In: ACL, vol. 1, pp. 973–982 (2013)
9. Zadeh, A., Chen, M., Poria, S., Cambria, E., Morency, L.P.: Tensor fusion network formultimodal sentiment analysis, arXiv:1707.07250. In: Proceedings of the 2017 Conferenceon Empirical Methods in Natural Language Processing, 7–11 September 2017, Copenhagen,Denmark, pp. 1103–1114. Association for Computational Linguistics
10. Poria, S., Cambria, E., Hazarika, D., Majumder, N., Zadeh, A., Morency, L.P.: Context-dependent sentiment analysis in user-generated videos. In: Proceedings of the 55th AnnualMeeting of the Association for Computational Linguistics, vol. 1, pp. 873–883 (2017)
11. Poria, S., Cambria, E., Howard, N., Huang, G.B., Hussain, A.: Fusing audio, visual andtextual clues for sentiment analysis from multimodal content. Neurocomputing 174(Part A),50–59 (2016). https://doi.org/10.1016/j.neucom.2015.01.095. ISSN 0925-2312
12. Liu, B.: Sentiment analysis and opinion mining. Synth. Lect. Hum. Lang. Technol. 5(1), 1–167 (2012)
13. Pang, B., Lee, L.: Opinion mining and sentiment analysis. J. Found. Trends Inf. Retrieval 2(1–2), 1–135 (2008)
14. Dziczkowski, G., Wegrzyn-Wolska, K.: RRSS - rating reviews support system purpose builtfor movies recommendation. In: Wegrzyn-Wolska, K.M., Szczepaniak, P.S. (eds.) Advancesin Intelligent Web Mastering. Advances in Soft Computing, vol. 43, pp. 87–93. Springer,Berlin (2007). https://doi.org/10.1007/978-3-540-72575-6_14
15. Dziczkowski, G., Węgrzyn-Wolska, K.: An autonomous system designed for automaticdetection and rating of film. Extraction and linguistic analysis of sentiments. In: Proceedingsof WIC, Sydney (2008)
16. Dziczkowski, G., Węgrzyn-Wolska, K.: Tool of the intelligence economic: recognitionfunction of reviews critics. In: ICSOFT 2008 Proceedings. INSTICC Press (2008)
17. Kepios: Digital in 2018, essential insights into internet, social media, mobile, andecommerce use around the world, April 2018. https://kepios.com/data/
18. Ghiassi, M., Skinner, J., Zimbra, D.: Twitter brand sentiment analysis: a hybrid system usingn-gram analysis and dynamic artificial neural network. Expert Syst. Appl. 40(16), 6266–6282 (2013)
Survey on AI-Based Multimodal Methods for Emotion Detection 321

19. Zhou, X., Tao, X., Yong, J., Yang, Z.: Sentiment analysis on tweets for social events. In:Proceedings of the 2013 IEEE 17th International Conference on Computer SupportedCooperative Work in Design, CSCWD 2013, 27–29 June 2013, pp. 557–562 (2013)
20. Salathé, M., Vu, D.Q., Khandelwal, S., Hunter, D.R.: The dynamics of health behaviorsentiments on a large online social network. EPJ Data Sci. 2, 4 (2013). https://doi.org/10.1140/epjds16
21. Sriram, B., Fuhry, D., Demir, E., Ferhatosmanoglu, H., Demirbas, M.: Short textclassification in Twitter to improve information filtering. In: Proceedings of the 33rdInternational ACM SIGIR Conference on Research and Development in InformationRetrieval, 19–23 July 2010, pp. 841–842. http://doi.acm.org/10.1145/1835449.1835643
22. Seabrook, E.M., Kern, M.L., Fulcher, B.D., Rickard, N.S.: Predicting depression fromlanguage-based emotion dynamics: longitudinal analysis of Facebook and Twitter statusupdates. J. Med. Internet Res. 20(5), e168 (2018). https://doi.org/10.2196/jmir.9267
23. Wang, W., Hernandez, I., Newman, D.A., He, J., Bian, J.: Twitter analysis: studying USweekly trends in work stress and emotion. Appl. Psychol. 65(2), 355–378 (2016)
24. Reece, A.G., Reagan, A.J., Lix, K.L., Dodds, P.S., Danforth, C.M., Langer, E.J.: Forecastingthe onset and course of mental illness with Twitter data (Unpublished manuscript). https://arxiv.org/pdf/1608.07740.pdf
25. Park, J., Lee, D.S., Shablack, H., et al.: When perceptions defy reality: the relationshipsbetween depression and actual and perceived Facebook social support. J. Affect. Disord.200, 37–44 (2016)
26. Burke, M., Develin, M.: Once more with feeling: supportive responses to social sharing onFacebook. In: Proceedings of the ACM 2016 Conference on Computer SupportedCooperative Work, pp. 1462–1474 (2016)
27. Go, A., Bhayani, R., Huang, L.: Twitter sentiment classification using distant supervision.J. CS224N Proj. Rep., Stanford 1, 12 (2009)
28. Liu, K.L., Li, W.J., Guo, M.: Emoticon smoothed language models for Twitter sentimentanalysis. In: AAAI (2012)
29. Węgrzyn-Wolska, K., Bougueroua, L., Yu, H., Zhong, J.: Explore the effects of emoticonson Twitter sentiment analysis. In: Proceedings of Third International Conference onComputer Science & Engineering (CSEN 2016), 27–28 August 2016, Dubai, UAE
30. Bitouk, D., Verma, R., Nenkova, A.: Class-level spectral features for emotion recognition.Speech Commun. 52(7–8), 613–625 (2010)
31. Busso, C., et al.: Analysis of emotion recognition using facial expressions, speech andmultimodal information. In: Sixth International Conference on Multimodal Interfaces, ICMI2004, October 2004, State College, PA, pp. 205–211. ACM Press (2004)
32. Dellaert, F., Polzin, T., Waibel, A.: Recognizing emotion in speech. In: InternationalConference on Spoken Language (ICSLP 1996), October 1996, Philadelphia, PA, USA, vol.3, pp. 1970–1973 (1996)
33. Lee, C.M., et al.: Emotion recognition based on phoneme classes. In: 8th InternationalConference on Spoken Language Processing (ICSLP 2004), October 2004, Jeju Island,Korea, pp. 889–892 (2004)
34. Deng, J., Xu, X., Zhang, Z., Frühholz, S., Grandjean, D., Schuller, B.: Fisher kernels onphase-based features for speech emotion recognition. In: Jokinen, K., Wilcock, G. (eds.)Dialogues with Social Robots. LNEE, vol. 427, pp. 195–203. Springer, Singapore (2017).https://doi.org/10.1007/978-981-10-2585-3_15
35. Steidl, S.: Automatic classification of emotion-related user states in spontaneous children’sspeech. Ph.D. thesis, Erlangen (2009)
36. Lugovic, S., Horvat, M., Dunder, I.: Techniques and applications of emotion recognition inspeech. In: MIPRO 2016/CIS (2016)
322 C. Marechal et al.

37. Kukolja, D., Popović, S., Horvat, M., Kovač, B., Ćosić, K.: Comparative analysis of emotionestimation methods based on physiological measurements for real-time applications. Int.J. Hum.-Comput. Stud. 72(10), 717–727 (2014)
38. Davletcharova, A., Sugathan, S., Abraham, B., James, A.P.: Detection and analysis ofemotion from speech signals. Procedia Comput. Sci. 58, 91–96 (2015)
39. Tyburek, K., Prokopowicz, P., Kotlarz, P.: Fuzzy system for the classification of sounds ofbirds based on the audio descriptors. In: Rutkowski, L., Korytkowski, M., Scherer, R.,Tadeusiewicz, R., Zadeh, L.A., Zurada, J.M. (eds.) ICAISC 2014. LNCS (LNAI), vol. 8468,pp. 700–709. Springer, Cham (2014). https://doi.org/10.1007/978-3-319-07176-3_61
40. Tyburek, K., Prokopowicz, P., Kotlarz, P., Michal, R.: Comparison of the efficiency of timeand frequency descriptors based on different classification conceptions. In: Rutkowski, L.,Korytkowski, M., Scherer, R., Tadeusiewicz, R., Zadeh, L.A., Zurada, J.M. (eds.) ICAISC2015. LNCS (LNAI), vol. 9119, pp. 491–502. Springer, Cham (2015). https://doi.org/10.1007/978-3-319-19324-3_44
41. Chaspari, T., Soldatos, C., Maragos, P.: The development of the Athens Emotional StatesInventory (AESI): collection, validation and automatic processing of emotionally loadedsentences. World J. Biol. Psychiatry 16(5), 312–322 (2015)
42. Arruti, A., Cearreta, I., Alvarez, A., Lazkano, E., Sierra, B.: Feature selection for speechemotion recognition in Spanish and Basque: on the use of machine learning to improvehuman-computer interaction. PLoS ONE 9(10), e108975 (2014)
43. Ekman, P.: Facial expression and emotion. Am. Psychol. 48, 384–392 (1993)44. Jack, R.E., Schyns, P.G.: The human face as a dynamic tool for social communication. Curr.
Biol. Rev. 25(14), R621–R634 (2015). https://doi.org/10.1016/j.cub.2015.05.05245. Ekman, P., Friesen, W., Hager, J.: Facial action coding system: Research Nexus. Network
Research Information, Salt Lake City (2002)46. Hjorztsjö, C.H.: Man’s face and mimic language (1969). https://books.google.com/books/
about/Man_s_Face_and_Mimic_Laguage.html?id=BakQAQAAIAAJ47. Ekman, P., Huang, T.S., Sejnowski, T.J., et al.: Final report to NSF of the planning
workshop on facial expression understanding, vol. 378. Human Interaction Laboratory,University of California, San Francisco (1993)
48. Afzal, S., Sezgin, T.M., Gao, Y., Robinson, P.: Perception of emotional expressions indifferent representations using facial feature points. IEEE (2009). 978-1-4244-4799
49. http://www.nevenvision.com. Licensed from Google Inc.50. De la Torre, F., Chu, W.S., Xiong, X., Vicente, F., Ding, X., Cohn, J.: IntraFace. In: IEEE
International Conference on Automatic Face and Gesture Recognition Workshops (2015).https://doi.org/10.1109/fg.2015.7163082
51. https://azure.microsoft.com/en-us/services/cognitive-services/emotion/52. http://thinktostart.com/analyze-face-emotions-r/53. https://www.paulekman.com/micro-expressions-training-tools/54. Amira, T., Dan, I., Az-Eddine, B., et al.: Monitoring chronic disease at home using
connected devices. In: 2018 13th Annual Conference on System of Systems Engineering(SoSE), pp. 400–407. IEEE (2018)
55. Shu, L., et al.: A review of emotion recognition using physiological signals. Sensors (Basel)18(7), 2074 (2018)
56. Wei, W., Jia, Q., Feng, Y., Chen, G.: Emotion recognition based on weighted fusion strategyof multichannel physiological signals. Comput. Intell. Neurosci. 2018, 9 (2018). 5296523
57. Özerdem, M.S., Polat, H.: Emotion recognition based on EEG features in movie clips withchannel selection. Brain Inform. 4(4), 241–252 (2017)
58. Jang, E.H., Park, B.J., Park, M.S., Kim, S.H., Sohn, J.H.: Analysis of physiological signalsfor recognition of boredom, pain, and surprise emotions. J. Physiol. Anthropol. 34, 25 (2015)
Survey on AI-Based Multimodal Methods for Emotion Detection 323

59. Kortelainen, J., Tiinanen, S., Huang, X., Li, X., Laukka, S., Pietikäinen, M., Seppänen, T.:Multimodal emotion recognition by combining physiological signals and facial expressions:a preliminary study. In: Conference Proceeding of the IEEE Engineering in Medicine andBiology Society, vol. 2012, pp. 5238–5241 (2012)
60. Zacharatos, H., Gatzoulis, C., Chrysanthou, Y.L.: Automatic emotion recognition based onbody movement analysis: a survey. IEEE Comput. Graph Appl. 34(6), 35–45 (2014)
61. Tsui, W.H., Lee, P., Hsiao, T.C.: The effect of emotion on keystroke: an experimental studyusing facial feedback hypothesis. In: Conference Proceedings of the IEEE Engineering inMedicine and Biology Society, pp. 2870–2873 (2013)
62. Li, S., Cui, L., Zhu, C., Li, B., Zhao, N., Zhu, T.: Emotion recognition using Kinect motioncapture data of human gaits. PeerJ 4, e2364 (2016)
63. Goshvarpour, A., Abbasi, A.: Goshvarpour, A: Fusion of heart rate variability and pulse ratevariability for emotion recognition using lagged poincare plots. Australas. Phys. Eng. Sci.Med. 40(3), 617–629 (2017)
64. Khezri, M., Firoozabadi, M., Sharafat, A.R.: Reliable emotion recognition system based ondynamic adaptive fusion of forehead biopotentials and physiological signals. Comput.Methods Programs Biomed. 122(2), 149–164 (2015)
65. Gouizi, K., Bereksi Reguig, F., Maaoui, C.: Emotion recognition from physiological signals.J. Med. Eng. Technol. 35(6–7), 300–307 (2011)
66. Verma, G.K., Tiwary, U.S.: Multimodal fusion framework: a multiresolution approach foremotion classification and recognition from physiological signals. Neuroimage 102(Part 1),162–172 (2014)
67. Yang, H., Willis, A., de Roeck, A., Nuseibeh, B.: A hybrid model for automatic emotionrecognition in suicide notes. Biomed. Inform. Insights 5(Suppl. 1), 17–30 (2012)
68. Eyben, F., Weninger, F., Wöllmer, M., Shuller, B.: Open-Source Media Interpretation byLarge Feature-Space Extraction, November 2016. openSMILE by audFERING
69. Eyben, F., Wöllmer, M., Shuller, B.: openEAR - introducing the munich open-sourceemotion and affect recognition toolkit. In: 2009 3rd International Conference on AffectiveComputing and Intelligent Interaction and Workshops. https://doi.org/10.1109/acii.2009.5349350
70. O’Reilly, H., et al.: The EU-emotion stimulus set: a validation study. Behav. Res. 48, 567–576 (2016). https://doi.org/10.3758/s13428-015-0601-4. Psychonomic Society, Inc. 2015
71. Schuller, B., et al.: Affective and behavioural computing: lessons learnt from the firstcomputational paralinguistics challenge. Comput. Speech Lang. 53, 156–180 (2019).Elsevier, ScienceDirect
Open Access This chapter is licensed under the terms of the Creative Commons Attribution 4.0International License (http://creativecommons.org/licenses/by/4.0/), which permits use, sharing,adaptation, distribution and reproduction in any medium or format, as long as you give appro-priate credit to the original author(s) and the source, provide a link to the Creative Commonslicense and indicate if changes were made.The images or other third party material in this chapter are included in the chapter’s Creative
Commons license, unless indicated otherwise in a credit line to the material. If material is notincluded in the chapter’s Creative Commons license and your intended use is not permitted bystatutory regulation or exceeds the permitted use, you will need to obtain permission directlyfrom the copyright holder.
324 C. Marechal et al.

Forecasting Cryptocurrency Valueby Sentiment Analysis: An HPC-Oriented
Survey of the State-of-the-Artin the Cloud Era
Ales Zamuda1(B) , Vincenzo Crescimanna2 , Juan C. Burguillo3 ,Joana Matos Dias4 , Katarzyna Wegrzyn-Wolska5 , Imen Rached5 ,
Horacio Gonzalez-Velez6 , Roman Senkerik7 , Claudia Pop8 ,Tudor Cioara8 , Ioan Salomie8 , and Andrea Bracciali2
1 Faculty of Electrical Engineering and Computer Science, University of Maribor,Koroska cesta 46, 2000 Maribor, Slovenia
[email protected] Department of Computing Science and Mathematics, University of Stirling,
Stirling FK9 4LA, [email protected],[email protected]
3 Department of Telematic Engineering, University of Vigo,Campus Universitario, 36310 Vigo, Spain
[email protected] Faculty of Economics, University of Coimbra,
Av. Dias da Silva 165, 3004-512 Coimbra, [email protected]
5 Allianstic Research Laboratory, EFREI Paris,Ecole d’ingenieurs generaliste Informatique et technologies du numerique,
30-32 Avenue de la Republique, 94800 Villejuif, France{katarzyna.wegrzyn-wolska,imen.rached}@efrei.fr
6 Cloud Competency Centre, National College of Ireland,Mayor Street Lower – IFSC, Dublin 1, Ireland
[email protected] Faculty of Applied Informatics, Tomas Bata University in Zlin,
T. G. Masaryka 5555, 760 01 Zlin, Czech [email protected]
8 Computer Science Department, Technical University of Cluj-Napoca,26-28 Baritiu Street, 400027 Cluj-Napoca, Romania
{claudia.pop,tudor.cioara,ioan.salomie}@cs.utcluj.ro
Abstract. This chapter surveys the state-of-the-art in forecasting cryp-tocurrency value by Sentiment Analysis. Key compounding perspectivesof current challenges are addressed, including blockchains, data collec-tion, annotation, and filtering, and sentiment analysis metrics using datastreams and cloud platforms. We have explored the domain based on thisproblem-solving metric perspective, i.e., as technical analysis, forecast-ing, and estimation using a standardized ledger-based technology. Theenvisioned tools based on forecasting are then suggested, i.e., ranking
c© The Author(s) 2019J. Ko�lodziej and H. Gonzalez-Velez (Eds.): cHiPSet, LNCS 11400, pp. 325–349, 2019.https://doi.org/10.1007/978-3-030-16272-6_12

326 A. Zamuda et al.
Initial Coin Offering (ICO) values for incoming cryptocurrencies, trad-ing strategies employing the new Sentiment Analysis metrics, and riskaversion in cryptocurrencies trading through a multi-objective portfolioselection. Our perspective is rationalized on the perspective on elasticdemand of computational resources for cloud infrastructures.
Keywords: Cryptocurrency · Blockchain · Sentiment Analysis ·Forecasting · ICO · CSAI · Cloud computing
1 Introduction
This chapter presents a position survey on the overall objective and specificchallenges encompassing the state of the art in forecasting cryptocurrency valueby Sentiment Analysis. The compounding perspectives of current challenges areaddressed, such as the blockchain technologies, underlying data collection ofitems from social media, the annotation, and filtering of such items, and theSentiment Analysis as a resulting metric of the observed data streams.
We describe a Cryptocurrency Sentiment Analysis Indicator (CSAI) andidentify its required inner workings compounding perspectives. Further possibil-ities are then explored, based on this new metric perspective, such as technicalanalysis, forecasting, and beyond. The envisioned tools based on forecasting arethen suggested, i.e., ranking Initial Coin Offering (ICO) values for incoming cryp-tocurrencies, trading strategies employing the new Sentiment Analysis metrics,and risk aversion in cryptocurrencies’ trading through multi-objective portfolioselection. Since the introduction of Bitcoin [94] and rise of blockchain-relatedalgorithms [96] and technologies [10,74,98,130,137], there has been a significantincrease in their recognition and analysis. In this chapter, we focus on the specificaspect of value for the blockchain projects related to cryptocurrencies.
While High-Performance Computing (HPC) and Cloud Computing are notsine qua non for cryptocurrencies, their use has become pervasive in their trans-action verification (“mining”). Cryptocurrencies rely on powerful computationalnodes to verify transactions, convert them into groups “blocks”, and add them tothe blockchain. Such verification is based on well-established complex cryptologyalgorithms [70] (ergo, the term cryptocurrencies) which assure user anonymityand payment untraceability. With the convergence of HPC and clouds [102],elastic computational resource utilization has become commonplace in differentdomains, including of course, Cryptocurrencies. Moreover, a recent survey onopen challenges and trends in cloud computing [18] recognizes blockchain as adisruptive influencer of the field.
In the following section, related work is provided, introducing sentiment anal-ysis, cryptocurrencies, and their value forecasting. Section 3 highlights for theinterested reader, more about cryptocurrencies and blockchain, in general, andlists an example blockchain application for energy markets. After Sect. 3, spe-cific challenges are addressed, listing the specific perspectives. Section 4 coversinfluence pertaining to social media, Sect. 5, social media data annotation and

Forecasting Cryptocurrency Value by Sentiment Analysis 327
sentiment dictionary, Sect. 6, Filtering of Tweets, Sect. 7, the perspective oncore resulting Sentiment Analysis for cryptocurrencies, Sect. 8, technical anal-ysis, Sect. 9, ranking of ICOs, Sect. 10, portfolio selection using multi-objectiveoptimization, and Sect. 11, investment approaches. Then, the Conclusion sectionsummarizes the surveyed perspectives.
2 Related Work
As this chapter focuses on the objective of Sentiment Analysis for cryptocurren-cies, the more recent related work leading to the formation of this objective isinitially presented in this section. Namely, when analyzing the impact of cryp-tocurrencies, there are different possibilities on which to focus, like prediction ofvalue or some other underlying principles and features of technologies enablingthese cryptocurrencies.
We first focus on the Bitcoin cryptocurrency and the trading volumes of Bit-coin as introduced using Google Search Engine as the media feed [87]. In [126],search engine query trends are predicted for Bitcoin. A connection between Bit-coin search queries on Google Trends and Wikipedia is established in [68], wheretheir relationship is also studied. An attempt to explain Bitcoin prices and adop-tion rates using Google Search is made in [109]. Returns and volatility perspec-tive when using Bitcoin volume analysis is discussed in [9]. A text mining froman online forum which analyzes user opinions and aims to predict value fluctua-tions for Bitcoin is reported in [67]. A survey of methods and models for textualsentiment in finance is presented in [63]. Dynamic topic modeling for cryptocur-rency community forums is introduced in [76]. A crowdsourced perspective ispresented in [80], listing future directions in international financial integrationresearch. For Bitcoin value formation, a model based on an empirical study isgiven in [57]. In [101], high frequency volatility is forecasted for cryptocurren-cies. Some of the underlying determinants, including technology and economicfactors influencing exchange rates for cryptocurrencies, are presented for thecase of Bitcoin in [73]. A cryptocurrency price prediction using news and socialmedia sentiment was first introduced in [69], followed shortly by the predictingof cryptocurrency price bubbles using social media data and epidemic model-ing in [104]. The popular modern techniques from Artificial Intelligence andgeneral softcomputing paradigms have been utilized in recent work [89], whereprice prediction based on historical price values was compared over machinelearning with different types of neural networks, and further, in [72], where thesentiment-based prediction of alternative cryptocurrency price fluctuations usinga gradient boosting tree model is given. In [105], a mutual-excitation of cryp-tocurrency market returns and social media topics is investigated, whereas thepaper [84] reports a recent study considering the impact of social media on Bit-coin value. Finally, a study measuring the interaction between media sentiment,based on news articles as well as blog posts and the Bitcoin price, is given in[136]. Another broader time-series analysis used to study the general relation-ships between Bitcoin prices and fundamental economic variables, technological

328 A. Zamuda et al.
factors and measurements of collective mood derived from Twitter feeds waspresented in [51].
An example type of media data feeds’ content influencing cryptocurrencysentiment are social media channels’ posts about ransomware and email-basedhacker attacks, mostly influencing the sentiment as negative sentiment posts. Thecybersecurity threads’ (i.e., computer malware, ransomware, virus, worm, trojanhorse, retrovirus, botnet, etc.) [129] development and their impact on society andfinancial markets are a significant topic today. Hackers enjoy anonymity underblockchain technology, that may have high social cost [82]. For example, thepaper [6] shows that a substantial amount of Bitcoin blockchain operations andaddresses are involved in ransomware money processing. Ransomware representsa type of software cyber-attack, where the hackers take advantage of victims’operating system vulnerabilities to deploy dedicated ransomware code. Once ithas happened, the major harmful activity lies in the encryption of files with cer-tain extensions that are expected to be highly personally important (documents,photos, etc.). The victim still can access (boot) the operating system, usually get-ting a message specifying the amount of ransom in cryptocurrency, the hacker’swallet address and the time left to pay the ransom in exchange to get the decryp-tion key. On the other hand, the email-based hacker attacks are more frequentand easier to perform. The victim usually receives an email stating some mix oftechnical info and blackmailing based description of a situation that the hackertakes over the control of web browser, email, and social networks applicationsremotely, and will send some private information to all gathered contacts, unlessa certain amount in cryptocurrency is paid within a given time slot. Both of thecybersecurity threads mentioned above are influencing the blockchain value andshould be taken into consideration in any future developed forecasting sentimentaggregator to achieve better accuracy. The reasons and relations are given in anoriginal work [122], where the author investigates how the cybersecurity shocksaffect the demand for blockchain settlement, transaction fees, mining reward, andcryptocurrency exchanges. That paper also explores in detail the theory givenin [44], and their findings show that sudden shocks to the exogenous demandfor blockchain settlement are resulting in an increase in transaction fees and areduction in the endogenous demand [122].
Following the ongoing research and published works listed in this section, theperspectives compounding the presented research topic of this chapter are identi-fied in Sects. 4–11 as specific challenges in sentiment analysis for cryptocurrencyvalue forecasting.
3 Background: Cryptocurrencies and Blockchain
Widely considered immutable time-stamped data structures, blockchains imple-ment peer-to-peer networks where participants can verify interactions concur-rently using decentralized peer-to-peer consensus protocols. As an emerging tech-nology trend, different research [115] and industrial [29] perspectives are beingassembled to document its potential disruptive impact [22].

Forecasting Cryptocurrency Value by Sentiment Analysis 329
Blockchains have five unique characteristics, namely:
1. Peer-to-peer communication without a central authority.2. Transparent transaction processing with optionally-disclosed ownership.3. Decentralized transaction history verifiable by all participants.4. Immutability of records assuring chronological sequence and accessibility.5. Logic-based processing to trigger algorithms and events.
The aforementioned characteristics have made blockchain particularly suit-able to manage cryptocurrencies: Electronic cash systems administered via peer-to-peer consensus. Indeed, the most widely known for cryptocurrency, the Bit-coin [94], remains something like the gold Standard for financial blockchain appli-cations. Nonetheless, while blockchains have been used extensively in financialentities, their decentralized immutability characteristics have made them par-ticularly suitable for applications in other domains as diverse as Law [92], FoodTraceability [50], and Open-source Software Management [42]. To highlight theimportance of blockchain technologies evaluation, an example in surroundingblockchain technologies for Energy markets follows in the next subsection.
3.1 Blockchain Technologies for Energy Markets
The energy grid is moving to a new era, shifting from centralized broadcast-like energy systems to decentralized smart energy systems by incorporating alarge number of small-scale Distributed Energy Prosumers (DEP). The adventof intermittent decentralized renewable energy sources is completely changingthe way in which electricity grids are managed, supporting the shift to moredecentralized smart energy systems. Variations in energy production, either sur-plus or deficit, may threaten the security of supply, leading to energy distribu-tion systems’ overload, and culminating in power outages or service disruptions,forcing the DEPs to shed or shift their energy demand to deal with peak loadperiods [34,108,131].
The centralized energy systems take limited account of local conditions andare difficult to be optimized, and offer no incentives for consumers to manageand adjust their consumption according the generation profiles. In this context,the H2020 eDREAM project [45] contributes to the transformation of the tra-ditional energy systems into novel decentralized and community-driven ones, byleveraging on blockchain technology to exploit local capacities and constraintsfully at micro-grid level to preserve the continuity and security of supply ataffordable costs at smart grid level. The grid is modeled as a collection of DEPs’resources able to coordinate through a blockchain based infrastructure to sup-port fully decentralized management, control and stable grid operation. TheeDREAM project presents a blockchain decentralized management relying onthe implementation of [34]:
– A distributed ledger for storing DEPs’ energy data at the micro-grid level. Allmonitored energy data recorded at the level of a DEP are registered and storedas immutable transactions. Therefore, the individual energy production or

330 A. Zamuda et al.
energy consumption values are aggregated in blocks which are then replicatedin the ledger.
– A set of self-enforcing smart contracts for decentralized energy managementand control. Through specific mechanisms, these contracts enable the peer-to-peer-trading of energy among DEPs and offer-demand matching and decen-tralized coordinated control for energy stakeholders, such as the DSO (Dis-tribution System Operator). The contracts are able to assess and trace theshare of contracted flexibility services actually activated in real-time by theaggregators (from their enrolled prosumers).
– Consensus based validation for transactions’ validation and financial settle-ment. The project offers the solution of a novel blockchain-based validationthat goes in the direction of increased reliability of the smart grid systemoperation, better energy incentives for DEPs, and increased usage of renew-able energy.
Three types of smart management scenarios are supported with self-enforcingsmart contracts [33]: (i) The provisioning of energy flexibility services by theDSO leveraging on aggregators, (ii) The implementation of a decentralized greenenergy market at the micro-grid level promoting the consumption of renewableenergy where it is produced, and (iii) The creation of a community based coali-tion of prosumers, allowing them to participate in the national energy or capacitymarket.
The Provisioning of Flexibility Services supposes that prosumers are able tooffer and trade their flexibility in terms of loads’ modulation. They are involvedvia enabling aggregators, or directly with the DSO via direct Demand Responseand control of DEP’s energy assets. Using smart contracts, the DSO is able toassess and trace the share of contracted flexibility services, actually activated inreal-time by the aggregators (from their enrolled prosumers) at the grid level. Atthe same time, the self-enforcing smart contracts act as a decentralized controlmechanism used to manage the levels of energy flexibility from aggregators andenrolled prosumers on one side, and from aggregators to the DSO on the otherside, associating incentive and penalties’ rates. If relevant deviations betweenthe expected energy flexibility request and the actual delivered flexibility aredetected by smart contracts, specific actions are taken to rebalance the energydemand with the energy production.
The Decentralized Green Energy Market designed at the micro-grid levelenacts any small-scale prosumer to participate and trade energy directly. Themarket acts as a management mechanism by rewarding the consumption ofrenewable energy when it is available, leveraging on green energy tokens, makingsure that the potential energy imbalances at the micro-grid level are addressedlocally and not exported to higher smart grid management levels. The non-fungible tokens are generated at a rate proportional with the forecast renewableenergy production [103], transforming the energy in a transactable digital asset.The producers and consumers use the generated tokens to participate in the elec-tricity market sessions and leverage on self-enforcing smart contracts to submitenergy bids/offers and transact energy in a peer-to-peer fashion.

Forecasting Cryptocurrency Value by Sentiment Analysis 331
The Creation of Virtual Power Plants (VPP) addresses the increasing needto optimize the output from multiple local generation assets (i.e. wind-turbines,small hydro, photovoltaic, back-up generators, etc.) that serve primarily localcommunities and have export connections at the power distribution network.The benefits behind creating such coalitions are that a mix of different energygeneration resources, which have different energy generation models and scale,may be interested to cooperate in a convenient way, with a view to achievingpre-defined smart grid sustainability objectives. The VPP aims at maximizingthe utilization and revenues from RES and classic generation sources throughaccessing different markets as an aggregated portfolio, bringing its capacity tothe optimum paying service at any time. The DEPs can ultimately participateon other higher-level energy markets, such as a flexibility service provider to aTSO (Transmission System Operator) or a wholesale capacity provider on thewholesale or capacity market.
The adoption of the above presented blockchain based managementapproaches will transform the smart grid into a democratic community thatno longer relies on a central authority, but can take any decision through smartcontracts rules, enforced and verified by each DEP of the grid. At the same time,it is in line with the European strategic vision of creating a secure and sustain-able energy system by 2050, and reducing the greenhouse gas emissions by atleast 80% [46].
4 Specific Challenge A: Influence on Social Media
Social networks are enabling people to interact, and are ever-changing theirhuman relations to the virtual world. People utilize these media platforms fordifferent activities; to express their opinions and their sentiments, to share theirexperiences, to react to another person. We can observe in this space differenthuman interactions, and we can define many roles related to relations betweendifferent users.
We can observe, among others, influential, trusted, or popular individuals.These roles of users in social networks are significant and useful in various dis-ciplines, such as Economy, Finance, Marketing, political and social campaigns,and recommendations. Defining, distinguishing, and measuring the strength ofthose relations becomes challenging, both in the theoretical and practical fields.The roles of trusted or influential users, users with high reputation, and popularusers, can be used in various ways. An interesting work to define, classify, andpresent a hierarchy of all the terms was done by Rakoczy [111]. In this survey,we are interested in particular in influence approach, the relation which, as wesuggest, has the strongest correlation between social media and the cryptocur-rency tendency, and, in general, with the financial trends. The research involvinginfluence and influential users is an important part of social network analysis.
The term influence is used widely and intuitively means the capacity toinfluence the character, development, or behavior of someone or something, orthe effect itself. We name influencer the person exerting the influence action.

332 A. Zamuda et al.
Although this intuitive meaning is well understood, in social network analysis,influence seems to be an ambiguous term that depends strictly on the presumedassumptions. For instance, Kempe et al. [64] focused on influence in the infor-mation flow and spread sense. On the other hand, other works, e.g. [56] and[140], targeted the quantity aspect of influence, targeting mainly users in centralpositions in a social network. The analysis of influence is an interdisciplinarydomain, involving not only social network analysis, but also social sciences, e.g.Sociology, use of graph theory, statistics, and others [100].
The existing state-of-the-art methods considering influence regard this topicin two different approaches, which are: (i) Influential users’ discovery and (ii)Influence diffusion information spread within the network with particular focuson the most optimized way to diffuse the information in a social network maxi-mally.
4.1 Influential Users’ Discovery
The methods for influential users discovery try to find users who have an impacton the network and the users who, in some way (structurally, by modifying thebehavior, adding information to network, etc.), try to answer the following ques-tion: Which users are in such a position and are making such a difference toother users that the structure of the network, behavior, actions, or preferencesof other users is changed because of this influential activity? Here, we can findtwo approaches: Based only on the central position of the user (topology-basedapproaches: Degree centrality, closeness centrality, and betweenness centrality[142]), or more complex, which takes into account more aspects, like a user’s his-tory, content, and other influence properties. Many methods which used topologycriteria are based on PageRank [23,56,128,138].
Alternatively, there are also some works that have used additional informa-tion provided directly from users about the topic, namely hashtags. RetweetRankand MentionRank [140] are examples of such approaches that are using hash-tag information in order to group users together via subject. There have beenapproaches to provision cloud resources elastically, based on social media, poten-tially for disaster situations [121]. These methods are similar, using as a basefor the network either retweets or mentions. Additionally to the works presentedabove, there are obviously other works that also deal with the influence evalu-ation. In the famous work of Hirsh [58], the author presents a metric that aimsto calculate the influence of researches, based on individual’s publications.
4.2 Influence Diffusion and Influence Maximization
The issue of influence diffusion is a general problem of how the informationspreads within a network, where users (nodes) are connected by edges whichsignify the influence. The best known methods are the Linear Threshold (LT)model [64], the modified LT named Delayed LT (DLT) model [93], or IndependentCascade (IC) model [64].

Forecasting Cryptocurrency Value by Sentiment Analysis 333
Influence maximization is a particular subproblem originating directly fromthe influence diffusion problem, that is particularly interesting and studiedwidely. Influence maximization is searching the answer to the following ques-tion: Which users to target for spreading some information in order to havemaximum possible users in a social network talking/knowing about this infor-mation? Hence, such methods aim to find users who will share the informationmost widely (propagate it further). On the contrary to approaches for the influ-ential users’ discovery, these methods are connected strictly with diffusion ofinformation.
4.3 General Model
A general and simple model for for evaluating the influence between a user’snetwork platform is Action-Reaction-Influence-Model (ARIM). It is based onthe users’ proactive and reactive behaviors, that can be found on basically anysocial networking site, and can be used with different data sets. A few interestingapproaches based on ARIM were proposed: e.g., method to calculate influencein time-dependent citation networks [113], and an algorithm to predict the repu-tation using the known influence value [114]. Finally, a very interesting and newapproach of micro-influencer was defined [112].
5 Specific Challenge B: Social Media Feeds’ Annotationand Dictionary Definition
A market sentiment dictionary for financial social media data applications is pre-sented in [27], and then a fine-grained analysis of financial Tweets is describedin [26]. The dictionary in [27] with 8,331 words, 112 hashtags, and 115 emojis isavailable publicly at http://nlg.csie.ntu.edu.tw/nlpresource/NTUSD-Fin/ underCC BY-NC-SA 4.0 license. It is built from posts in the StockTwits dataset [71], atthat time providing 334,798 labeled posts from 13,059 users and crawled throughStockTwits API (https://api.stocktwits.com/developers/docs). The dictionarystores unstemmed tokens appearing at least ten times and showning signifi-cant difference in chi-squared test (significance level 0.05) between expected andobserved frequency. Also, stopwords, punctuations, digits, URLs, user ids, andtickers are removed from the input posts, while still specifically processing emo-jis. Input posts with less than two words are also removed. As the paper alsoanalyses sentiment, it is discussed that based on this dictionary, the sentiment ofinvestors may depend on the positions they hold (e.g. positive investor sentimentdoes not imply bullish market sentiment due to the target of the investor).
The FiQA 2018 Task 1 (https://sites.google.com/view/fiqa/home) is sup-ported by Social Sentiment Index (SSIX) Horizon 2020 project (https://ssix-project.eu/), and it includes 675 training instances to predict continuous senti-ment. In [26], utilizing the dictionary [27], the FiQA 2018 Task 1 is evaluated overdifferent neural network models with Keras (https://github.com/keras-team/keras): Convolution Neural Network (CNN), Bidirectional Long Short-TermMemory (Bi-LSTM), and Convolution Recurrent Neural Network (CRNN).

334 A. Zamuda et al.
6 Specific Challenge C: Filtering Tweets
As Sentiment Analysis (SA) usually works on top of Twitter feeds, it is neces-sary to pre-process the Tweets before SA, as described in the following. Pre-processing the data, as defined in [55], is the process of cleaning and preparingthe text for classification. This phase has a relevant role in sentiment analysistasks, indeed, reducing the redundancy and the noise intrinsic in the online data,allowing a better and fast classification [55]. The pre-processing method can bedistinguished in two stages: Transformation and filtering. The first stage is quitestandard, consisting in operations like white space removal, expanding abbrevi-ation, stemming, stop words removal, and negation handling, while, instead, thesecond stage regards the choice and selection of the features, which, in MachineLearning, is called feature selection [145].
Such task can be described mathematically as the problem to find an optimalfunction f : T → S, where T is the (cleaned) text space and S ⊂ Rd the featurespace; where the optimum is defined according to a certain metric that is defineda priori.
In a text mining context, the feature selection task is composed by three steps:Choice of the type of features, giving a weight to each feature, and selecting therelevant features [145]; i.e. scoring each potential feature according to a particularmetric, and then taking the n best features. According to the mathematicaldescription given above, the problem is equivalent to choosing the metric withwhich to evaluate the embedding map. We note that, differently from other fieldslike image or audio processing, when a combination of features does not have anymeaning, then the type of features must be chosen by the user. In this section, wewill focus on the third step: The possible methods to extract features specific forSentiment Analysis, while the ranking of these features is addressed in Sect. 9.For a complete review of the possible type of features, we refer to [1] and [55],and for a description of the weight models and for a complete review on featureselection on text mining we refer to [25,49,54].
The most common metric in feature selection is the χ2 (chi-squared), a mea-sure expressing the divergence between the feature and the class. A drawbackof this metric is that it works only when the dataset is big and there are norare features. Another two popular metrics are the Accuracy, measuring theexpected accuracy of a simple classifier built from the single feature, and the F1,the harmonic mean of the precision and recall.
As observed in [49], all these metrics are equivalent, and one outperformsthe others according to the dataset. In the review where twelve metrics are com-pared, Forman [49], proposed a new metric, the Bi-Normal Separation (BNS),an extension of the χ2 where also the frequency of the appearance of the featureis considered. This metric is good in most common cases, but, when predictionsmove outside of this set, good results are not guaranteed. For example, in ahighly skewed data context, the BNS does not work better and two informationtheoretic measures outperform it: Information Gain and ITF · IDF2, [77].

Forecasting Cryptocurrency Value by Sentiment Analysis 335
7 Specific Challenge D: Sentiment Analysis
Sentiment Analysis, also known as opinion mining, refers to the use of naturallanguage, text analysis and computational linguistics to identify or extract sub-jective information from the attitude of a speaker/writer from a set of customerresources in order to classify the polarity. From the point of view of text mining,Sentiment Analysis is an automatic classification massive task as a function ofthe positive or negative emotions transmitted by the textual message.
In general, Sentiment Analysis tries to determine the opinion from a personwith respect to a topic. Such opinion may involve an evaluation, the emotionalstate of the user at the time of writing, or the emotional communicative intention,i.e., how the customer tries to influence the reader or interlocutor.
Present approaches can be grouped into three main categories: Knowledge-based, statistical methods, and hybrid techniques [21].
– Knowledge-based techniques classify text into emotional categories based onthe presence of unambiguous affective words like happy, sad, bored, etc. [97].These methods also imply the use of lexical affinity to assign arbitrary wordsa certain affinity to particular emotions [125].
– Statistical methods take advantage of Machine Learning techniques like Sup-port Vector Machines, mutual inference, semantic analysis, etc. [134]. Moresophisticated methods try to detect the emotion and what is the target of suchfeeling [66]. Grammar dependent relations among words are usually appliedto achieve such complex purpose, implying a deep grammar analysis of themessage [41].
– Hybrid approaches leverage on both knowledge representation and MachineLearning techniques. These methods take advantage of knowledge represen-tation models like ontologies and semantic nets, being able to extract implicitinformation [19].
On the one hand there are open source tools that use Machine Learningtechniques, statistics, and natural language processing to automate the process-ing of huge amounts of data [41], including web pages, online news, discus-sion fora, social networks, web blogs, micro-blogging, etc. On the other hand,knowledge based systems use public access resources like SentiWordNet [7] orSenticNet [20] to extract semantic and affective information linked to naturallanguage concepts. Sentiment Analysis can also be performed on visual content,i.e., images and videos (denoted as Multimodal sentiment analysis). One of thefirst approaches in this direction was SentiBank [14], utilizing an adjective nounpair representation of visual content.
In order to measure the precision and recall of a Sentiment Analysis tool, it isusually compared with human judgments about others’ opinions [59]. However,humans when evaluated in the same way only show an 80% of precision onaverage, and this means that a program with a 75% of precision works almostas well as humans [99].

336 A. Zamuda et al.
8 Specific Challenge E: Technical Analysisand Forecasting
SA has a wide range of applications [48], for example monitoring the review ofconsumer products, evaluating the popularity of public people or discovering afraud; but, the SA can also be applied in prediction settings. Indeed, SA wasused with good results to predict: Elections [132], football matches [110], stockprices [13,85,147], and cryptocurrency fluctuations [2,68,124]. In this survey, weare interested in the latter application, but in all the different contexts describedin this paragraph, the prediction problem, from a mathematical point of view,can be described in the same way: Find a function f : S → R, such thatgiven the sentiment st (called the dependant or the explanatory variable), theassociated value is the prediction (unknown a priori) of (the independent orresponse variable) xt+1, i.e. f(st) = xt+1. A simple linear regression model couldbe summarized by the equation:
xt+1 = βst + ε,
where other unobserved factors determining xt+1 are captured by the error termε. The dependent variable xt+1 in the textual sentiment finance literature istypically Bitcoin price and/or trade volume [2,37,51,61,67,136] or Bitcoin returnand volatility, as in [30].
Logistic regression is used if the response variable is dichotomous. Here, thedependent variable is a binary variable, whose value is equal to 1 if a certain eventhas happened, and 0 otherwise. The idea is to examine if Sentiment Analysis isassociated significantly with a certain event.
In almost all the examples listed above in this section, the models usedto estimate the function f are restricted to the linear ones: Linear or logisticregression in case the features are correlated, or Naive Bayes when the datasetis relatively small [141]. The only exception is represented by [13], where theauthors used Fuzzy Neural Networks, a hybrid system that combines the the-ories of Fuzzy Logic and Neural Networks, [95]. Before proceeding with thedescription of recent forecasting models for cryptocurrency, it is worth under-lining two points: First, such simple models are used because the feature spaceS is, in general, low dimensional; indeed, more complex models like SupportVector Machines or Neural Network architectures suffer from overfitting. Sec-ond, although many works show the relationship between the market and thesocial sentiments [85,117,147] as highlighted by [148], if the financial instrumentsattract sufficient messages, in general, the sentiments do not lead financial mar-kets in a statistically significant way. The latter observation can explain thereason why most of the work on cryptocurrency forecasting based on SA aretested with the well-known cryptocurrency Bitcoin, see e.g. [35], or with a spe-cific cryptocurrency, like ZClassic, [72]. For financial time series analysis, in orderto overcome the problem of the incomplete reliability of sentiments, it is usualto combine SA with auto-regressive models (see e.g. [53] and reference therein,with such approach being suggested also for cryptocurrency), indeed as shown

Forecasting Cryptocurrency Value by Sentiment Analysis 337
in [12], where the traded volume is driven primarily by past returns. This ideaconsiders multimodal architectures, and although it is suggested in many works[12,24], it is still not applied.
When forecasting cryptocurrencies’ values, a key topic is to consider if theyshould be classed as currencies, assets, or investment vehicles. If they are tradedfor investment purposes, like hedging or pricing instruments, investigating thevolatility of these cryptocurrencies becomes important, and could help othersmake better informed decisions in terms of portfolio and risk management.Specifically, cryptocurrencies’ volatility levels are usually much higher than tra-ditional currencies [39]. Volatility models were used in [139] to test the effects ofsentiment or sentiment-related variables on the second moment of stock returns.GARCH-type models and the “realized volatility” approach were employed. Astock volatility prediction using Recurrent Neural Networks with SA was pre-sented in [79]. In [62], the ability of several GARCH models to explain the Bitcoinprice volatility was studied, and the optimal model was presented in terms ofgoodness-of-fit to the data. GARCH modeling of 7 other Cryptocurrencies waspresented in [32]. A study on forecasting high frequency volatility for cryptocur-rencies and traditional currencies with Support Vector Regression was presentedin [101].
As another approach to forecasting, in [133], a fuzzy inference system forforecasting cryptocurrency price variation is developed, with trading rules beingoptimized through the use of a Genetic Algorithm (the use of Genetic Algo-rithms to determine trading rules has also been used before in Foreign Exchangemarkets, FX [90]). One of the advantages of this type of methodology comparedwith black box machine learning models, is its interpretability.
9 Specific Challenge F: Ranking ICOs
After the introduction of a new measurement indicator like CSAI, such introduc-tion brings with it a new challenge of how to include the new indicator withinexisting schemes that fuse different indicators to then support decision-making.
In fusing the different data streams together, one approach is to assignweights or ranks to indicators. The Machine Learning algorithm designs oper-ating on Big Data, such as stability selection [145], might be used on top ofindicator values when tackling the ranking of ICOs. As stability selection alsohighlights outliers, it might also be helpful in optimizing [144] real-world valuechains like energy efficiency and sustainability [52], given a proper access toblockchain data including cryptocurrencies, as well as possible Big Data fromthe SA streams.
10 Specific Challenge H: Multi-objective CryptocurrencyPortfolio Selection
As cryptocurrency evaluation usually includes taking into account risk [47], sev-eral cryptocurrencies might be needed as a set to balance this risk. Namely, a

338 A. Zamuda et al.
portfolio selection of cryptocurrencies might increase robustness when trading.In portfolio selection, multi-objective optimization algorithms are applied, andare gaining importance [4,91,107,149], as their applicability over global opti-mization problems contributes towards better multiple criteria decision-making.As a perspective therefore, this is an important challenge to be listed amongfuture directions connected to cryptocurrency analysis.
In [16] it is stated that it is possible to reduce investment risk substan-tially by adding several different cryptocurrencies to a portfolio, using the tradi-tional Markowitz model. In a similar manner in [106], performance of an equallyweighted portfolio and an optimal Markowitz portfolio considering four popularcryptocurrencies is compared, considering different levels of risk-aversion, andreaching the conclusion that there are no significant differences between the twoportfolios. In [36], the diversification advantages of including cryptocurrenciesin short-term investment portfolios is analyzed, justified by the fact that cryp-tocurrencies are highly connected to each other but not to other financial assets.In [78], data from ten cryptocurrencies are used, and the conclusion is reachedthat, through diversification, investment results can be reached.
Portfolio selection is inherently a multi-objective problem, even when usingmono-objective models like the Markowitz mean-variance framework. The opti-mal portfolio will always be a compromise solution between risk and return. Bychanging parameters in the Markowitz model, it is possible to define an effi-cient frontier that will exhibit the existing risk-return compromises. There isevidence that cryptocurrencies can be seen more as a speculative asset than as acurrency [11,17]. These findings justify the use of optimization models for deter-mining optimal portfolios that also consider investments in cryptocurrencies. Ifthere are metrics capable of calculating expected risk and return for cryptocur-rencies’ investments, then most of the available methodologies can be used inthis setting.
In [88], a copula-based approach is presented considering the multiperiodportfolio optimization, using Differential Evolution (DE). DE is a metaheuris-tic for global optimization [38,127,135,143] that is also applied successfully tomany other challenges, like [52,146], therefore improvements in DE can also havepotential impact on portfolio selection and, hence, cryptocurrency analysis. Ina multiperiod problem [88], investors have the possibility of changing the allo-cation of their investments during the considered horizon. In [88] it is statedthat this flexibility of rebalancing the portfolio is advantageous, especially dueto the high volatility that cryptocurrencies present. Portfolio rebalancing is alsoconsidered in [65], where information about the market psychology is included,evaluated using fuzzy reasoning processes that are able to be determined underoverevaluation possibilities. The investor profile will, hence, determine the effi-cient solution that is most adequate to his/her risk aversion preferences.

Forecasting Cryptocurrency Value by Sentiment Analysis 339
10.1 Optimization Algorithms
Metaheuristics have long been used for portfolio optimization. In [91] a review ispresented of Evolutionary Algorithms used for multi-objective portfolio manage-ment. As a recent contribution, a review of Swarm Intelligence methods appliedto portfolio optimization can be found in [47].
A Genetic Algorithm that takes into consideration transaction costs is intro-duced in [5]. A Genetic Algorithm is also used in [120]. The authors considercardinality constraints, floor constraints, and also round-lot constraints. Theobjective functions consider the maximization of return and minimization of risk,along with the maximization of the sampling distance. This last objective is onlyused to improve the behavior of the optimization algorithm. A multi-objectiveevolutionary approach that is able to produce an efficient frontier of portfoliosis introduced in [31], taking into account some constraints, like lower and upperlimits to the investment that can be made in each asset, or the maximum andminimum number of assets that the portfolio should consider. This type of car-dinality constraints is also considered in the work of [118], where the authorsdescribe a hybrid algorithm combining Evolutionary Algorithms, quadratic pro-gramming, and a pruning heuristic. Five different multi-objective EvolutionaryAlgorithms are compared in [3] for the mean-variance cardinality constrainedportfolio optimization problem. The authors conclude that SPEA2 seems to bebetter, but all multi-objective approaches perform better than single-objectiveones. A mean-semivariance framework, taking into account adverse return vari-ations only, is described in [83]. Two different Genetic Algorithms are compared(NSGAII and SPEA2), embedding the use of technical analysis indicators. Otherapplications of Genetic Algorithms can be found in [75,123].
Ant Colony Optimization is the methodology chosen in [43] to tackle multi-objective portfolio selection, and the authors realize that there are some efficientportfolios that are extremely difficult to find. The authors report better resultsthan the ones obtained with simulated annealing and NSGA. Particle SwarmOptimization is used by [40]. The method seems to be particularly well suited tobe used for low-risk investment portfolios. An Artificial Bee Colony metaheuris-tic is described in [28] for portfolio optimization, interpreting returns as fuzzynumbers. Varying the risk tolerance parameter will lead to different efficientportfolios. The authors acknowledge that real-world constraints have an impor-tant impact on the investment strategy. Fuzzy numbers are also used by [119]to represent the uncertainty in future returns. Three objectives are consideredthere simultaneously: The maximization of the possibilistic expected returns,the minimization of the downside risk (absolute semi-deviation below mean),and the minimization of the skewness of every portfolio. Cardinality constraintsare also included.
The multi-objective portfolio optimization is transformed into a mono-object-ive problem using fuzzy normalization and uniform design method in [116]. Theresulting model is then solved using an invasive weed optimization algorithm.The original model considers two more objectives in addition to the Markowitzmean-variance model: the stock profit gained relative to its market price, and

340 A. Zamuda et al.
the representation of experts’ recommendations. Fuzzy numbers are also used in[86], to describe asset returns and develop a multi-objective approach based ona genetic algorithm. In [81] an approach is presented that uses a self-organizingFuzzy Neural Network embedded into an heuristic that explores simplex localsearches. Finally, [60] use machine learning tools, namely, deep reinforcementlearning, to define cryptocurrencies’ portfolios based on technical aspects only(price and movement).
11 Specific Challenge G: Investment Approaches withthe New ICO Sentiment Indicator
The technical analysis covered in this chapter is the SA (Sect. 7) with forecast-ing (Sect. 8) and indicators fusion (Sect. 9), followed by optimization algorithms’supported multi-objective portfolio selection (Sect. 10). Besides technical analy-sis however, investment approaches with cryptocurrencies must take into accountparticular characteristics, like the herding effect, as identified in [15]. Risks fromthese characteristics can be caused through a lack of diversification of cryp-tocurrencies’ portfolios, making investors more exposed to investment risk, asexplained in the previous section. These characteristics also include long mem-ory, stochastic volatility, and leverage [104]. Keeping pertained characteristicsin mind and together through technical analysis, a trader might then evaluate acryptocurrency as a whole and trade the cryptocurrency as a financial asset [8].
12 Conclusion
This chapter covered the different aspects of necessary perspectives needed whenpreparing forecasting and investment, supported by cryptocurrency social mediaSentiment Analysis. Eight specific perspectives were identified, and the currentstate-of-the-art was covered in separate sections of the chapter, all focusingaround a new type of indicator, the CSAI. In the following work, some morespecific implementations and experimental results could be presented, based onthe guidelines, outlines, and integration possibilities presented in this chapter.
Acknowledgements. This chapter is based upon work from COST Action IC1406High-Performance Modelling and Simulation for Big Data Applications (cHiPSet), sup-ported by COST (European Cooperation in Science and Technology). The author AZacknowledges the financial support from the Slovenian Research Agency (ResearchCore Funding No. P2-0041). AZ also acknowledges EU support under Project No. 5442-24/2017/6 (HPC – RIVR). This chapter is also based upon work from COST ActionCA15140 “Improving Applicability of Nature-Inspired Optimisation by Joining The-ory and Practice (ImAppNIO)” supported by COST. The authors CP, TC and IS alsoacknowledge that the work presented in this chapter is supported financially by theeDREAM Project Grant number 774478, co-funded by the European Commission aspart of the H2020 Framework Programme. This work was supported by the Fundacaopara a Ciencia e a Tecnologia (FCT) under Project Grant UID/Multi/00308/2019.Author RS also acknowledges that work was supported by the Ministry of Education,

Forecasting Cryptocurrency Value by Sentiment Analysis 341
Youth and Sports of the Czech Republic within the National Sustainability ProgrammeProject No. LO1303 (MSMT-7778/2014), further supported by the European RegionalDevelopment Fund under the Project CEBIA-Tech no. CZ.1.05/2.1.00/03.0089.
References
1. Abbasi, A., Chen, H., Salem, A.: Sentiment analysis in multiple languages: featureselection for opinion classification in Web forums. ACM Trans. Inf. Syst. (TOIS)26(3), 12 (2008)
2. Abraham, J., Higdon, D., Nelson, J., Ibarra, J.: Cryptocurrency price predictionusing tweet volumes and sentiment analysis. SMU Data Sci. Rev. 1(3), 1 (2018)
3. Anagnostopoulos, K.P., Mamanis, G.: The mean-variance cardinality constrainedportfolio optimization problem: an experimental evaluation of five multiobjectiveevolutionary algorithms. Expert Syst. Appl. 38(11), 14208–14217 (2011)
4. Aouni, B., Doumpos, M., Perez-Gladish, B., Steuer, R.E.: On the increasingimportance of multiple criteria decision aid methods for portfolio selection. J.Oper. Res. Soc. 69, 1525–1542 (2018)
5. Aranha, C., Iba, H.: Modelling cost into a genetic algorithm-based portfolio opti-mization system by seeding and objective sharing. In: 2007 IEEE Congress onEvolutionary Computation, pp. 196–203. IEEE, Singapore (2007)
6. Athey, S., Parashkevov, I., Sarukkai, V., Xia, J.: Bitcoin pricing, adoption, andusage: theory and evidence. Stanford University Graduate School of BusinessResearch Paper No. 16–42 (2016). https://ssrn.com/abstract=2826674
7. Baccianella, S., Esuli, A., Sebastiani, F.: SentiWordNet 3.0: an enhanced lexicalresource for sentiment analysis and opinion mining. In: Seventh InternationalConference on Language Resources and Evaluation (LREC), vol. 10, pp. 2200–2204 (2010)
8. Bagheri, A., Peyhani, H.M., Akbari, M.: Financial forecasting using ANFIS net-works with quantum-behaved particle swarm optimization. Expert Syst. Appl.41(14), 6235–6250 (2014)
9. Balcilar, M., Bouri, E., Gupta, R., Roubaud, D.: Can volume predict Bitcoinreturns and volatility? A quantiles-based approach. Econ. Model. 64, 74–81 (2017)
10. Bartoletti, M., Bracciali, A., Lande, S., Pompianu, L.: A general framework forBitcoin analytics. arXiv preprint arXiv:1707.01021 (2017)
11. Baur, D.G., Hong, K., Lee, A.D.: Bitcoin: medium of exchange or speculativeassets? J. Int. Fin. Markets Inst. Money 54, 177–189 (2018)
12. Bianchi, D.: Cryptocurrencies as an asset class? An empirical assessment (6 June,2018). WBS Finance Group Research Paper (2017)
13. Bollen, J., Mao, H., Zeng, X.: Twitter mood predicts the stock market. J. Comput.Sci. 2(1), 1–8 (2011)
14. Borth, D., Ji, R., Chen, T., Breuel, T., Chang, S.F.: Large-scale visual sentimentontology and detectors using adjective noun pairs. In: Proceedings of the 21stACM International Conference on Multimedia, pp. 223–232. ACM (2013)
15. Bouri, E., Gupta, R., Roubaud, D.: Herding behaviour in cryptocurrencies. Fin.Res. Lett. (2018). https://doi.org/10.1016/j.frl.2018.07.008
16. Brauneis, A., Mestel, R.: Cryptocurrency-portfolios in a mean-variance frame-work. Fin. Res. Lett. (2018). https://doi.org/10.1016/j.frl.2018.05.008
17. Brauneis, A., Mestel, R.: Price discovery of cryptocurrencies: Bitcoin and beyond.Econ. Lett. 165, 58–61 (2018)

342 A. Zamuda et al.
18. Buyya, R., et al.: A manifesto for future generation cloud computing: researchdirections for the next decade. ACM Comput. Surv. 51(5), 105:1–105:38 (2018)
19. Cambria, E., Hussain, A.: Sentic Computing: Techniques, Tools, and Applications,vol. 2. Springer, Dordrecht (2012). https://doi.org/10.1007/978-94-007-5070-8
20. Cambria, E., Olsher, D., Rajagopal, D.: SenticNet 3: a common and common-sense knowledge base for cognition-driven sentiment analysis. In: Twenty-EighthAAAI Conference on Artificial Intelligence (2014)
21. Cambria, E., Schuller, B., Xia, Y., Havasi, C.: New avenues in opinion miningand sentiment analysis. IEEE Intell. Syst. 28(2), 15–21 (2013)
22. Casino, F., Dasaklis, T.K., Patsakis, C.: A systematic literature review ofblockchain-based applications: current status, classification and open issues.Telematics Inform. (2018, in Press) https://doi.org/10.1016/j.tele.2018.11.006
23. Cataldi, M., Aufaure, M.A.: The 10 million follower fallacy: audience size doesnot prove domain-influence on Twitter. Knowl. Inf. Syst. 44(3), 559–580 (2015)
24. Catania, L., Grassi, S., Ravazzolo, F.: Forecasting cryptocurrencies financial timeseries. CAMP Working Paper Series No. 5 (2018)
25. Chandrashekar, G., Sahin, F.: A survey on feature selection methods. Comput.Electr. Eng. 40(1), 16–28 (2014)
26. Chen, C.C., Huang, H.H., Chen, H.H.: Fine-grained analysis of financial Tweets.In: Companion of the Web Conference 2018 on the Web Conference 2018,pp. 1943–1949. International World Wide Web Conferences Steering Committee(2018)
27. Chen, C.C., Huang, H.H., Chen, H.H.: NTUSD-Fin: a market sentiment dic-tionary for financial social media data applications. In: Proceedings of the 1stFinancial Narrative Processing Workshop (FNP 2018) (2018)
28. Chen, W.: Artificial bee colony algorithm for constrained possibilistic portfoliooptimization problem. Phys. A: Stat. Mech. Appl. 429, 125–139 (2015)
29. Chen, Y.: Blockchain tokens and the potential democratization of entrepreneur-ship and innovation. Bus. Horiz. 61(4), 567–575 (2018)
30. Cheoljun, E., Kaizoji, T., Kang, S.H., Pichl, L.: Bitcoin and investor sentiment:statistical characteristics and predictability. Physica A 514, 511–521 (2019)
31. Chiam, S.C., Al Mamun, A., Low, Y.L.: A realistic approach to evolutionarymultiobjective portfolio optimization. In: 2007 IEEE Congress on EvolutionaryComputation, pp. 204–211. IEEE (2007)
32. Chu, J., Stephen, C., Saralees, N., Joerg, O.: GARCH modeling of cryptocurren-cies. J. Risk Fin. Manag. 10(4), 1–15 (2017)
33. Cioara, T., et al.: Enabling new technologies for demand response decentralizedvalidation using blockchain. In: 2018 IEEE International Conference on Envi-ronment and Electrical Engineering and 2018 IEEE Industrial and CommercialPower Systems Europe, pp. 1–4. IEEE (2018)
34. Claudia, P., Tudor, C., Marcel, A., Ionut, A., Ioan, S., Massimo, B.: Blockchainbased decentralized management of demand response programs in smart energygrids. Sensors 18, 162 (2018)
35. Colianni, S., Rosales, S., Signorotti, M.: Algorithmic trading of cryptocurrencybased on Twitter sentiment analysis. CS229 Project (2015)
36. Corbet, S., Meegan, A., Larkin, C., Lucey, B., Yarovaya, L.: Exploring thedynamic relationships between cryptocurrencies and other financial assets. Econ.Lett. 165, 28–34 (2018)
37. Cretarola, A., Figa-Talamanca, G., Patacca, M.: A sentiment-based model for theBitCoin: theory, estimation and option pricing (2017). https://doi.org/10.2139/ssrn.3042029. https://ssrn.com/abstract=3042029

Forecasting Cryptocurrency Value by Sentiment Analysis 343
38. Das, S., Mullick, S.S., Suganthan, P.: Recent advances in differential evolution -an updated survey. Swarm Evol. Comput. 27, 1–30 (2016)
39. David, Y.: Handbook of Digital Currency Bitcoin, Innovation, Financial Instru-ments, and Big Data. Elsevier, Amsterdam (2015). https://doi.org/10.1016/B978-0-12-802117-0.00002-3
40. Deng, G.F., Lin, W.T., Lo, C.C.: Markowitz-based portfolio selection with cardi-nality constraints using improved particle swarm optimization. Expert Syst. Appl.39(4), 4558–4566 (2012)
41. Dey, L., Haque, S.M.: Opinion mining from noisy text data. Int. J. Doc. Anal.Recogn. (IJDAR) 12(3), 205–226 (2009)
42. D’mello, G., Gonzalez-Velez, H.: Distributed software dependency managementusing blockchain. In: 27th Euromicro International Conference on Parallel, Dis-tributed and Network-Based Processing, PDP 2019, pp. 1–8. IEEE, Pavia (2019,to appear)
43. Doerner, K., Gutjahr, W.J., Hartl, R.F., Strauss, C., Stummer, C.: Pareto antcolony optimization: a metaheuristic approach to multiobjective portfolio selec-tion. Ann. Oper. Res. 131(1–4), 79–99 (2004)
44. Easley, D., O’Hara, M., Basu, S.: From Mining to Markets: The Evolution ofBitcoin Transaction Fees. SSRN 3055380 (2018)
45. eDREAM: H2020 eDREAM Project. http://edream-h2020.eu/en/46. Energy4Europe, European Commission: Energy Strategy and Energy Union,
Secure, Competitive, and sustainable Energy. https://ec.europa.eu/energy/en/topics/energy-strategy-and-energy-union
47. Ertenlice, O., Kalayci, C.B.: A survey of swarm intelligence for portfolio opti-mization: algorithms and applications. Swarm Evol. Comput. 39, 36–52 (2018)
48. Feldman, R.: Techniques and applications for sentiment analysis. Commun. ACM56(4), 82–89 (2013)
49. Forman, G.: An extensive empirical study of feature selection metrics for textclassification. J. Mach. Learn. Res. 3(Mar), 1289–1305 (2003)
50. Galvez, J.F., Mejuto, J., Simal-Gandara, J.: Future challenges on the use ofblockchain for food traceability analysis. TrAC Trends Anal. Chem. 107, 222–232 (2018)
51. Georgoula, I., Pournarakis, D., Bilanakos, C., Sotiropoulos, D.N., Giaglis, G.M.:Using time series and sentiment analysis to detect the determinants of Bitcoinprices. In: MCIS 2015 Proceedings 20 (2015). https://aisel.aisnet.org/mcis2015/20/
52. Glotic, A., Zamuda, A.: Short-term combined economic and emission hydrother-mal optimization by surrogate differential evolution. Appl. Energy 141, 42–56(2015)
53. Guidolin, M., Hyde, S., McMillan, D., Ono, S.: Non-linear predictability in stockand bond returns: when and where is it exploitable? Int. J. Forecast. 25(2), 373–399 (2009)
54. Guyon, I., Elisseeff, A.: An introduction to variable and feature selection. J. Mach.Learn. Res. 3(Mar), 1157–1182 (2003)
55. Haddi, E., Liu, X., Shi, Y.: The role of text pre-processing in sentiment analysis.Procedia Comput. Sci. 17, 26–32 (2013)
56. Haveliwala, T.H.: Topic-sensitive PageRank. In: Proceedings of the 11th Interna-tional Conference on World Wide Web, pp. 517–526. ACM (2002)
57. Hayes, A.S.: Cryptocurrency value formation: an empirical analysis leading to acost of production model for valuing Bitcoin. Telematics Inform. 34(7), 1308–1321(2017)

344 A. Zamuda et al.
58. Hirsch, J.E.: An index to quantify an individual’s scientific research output. Proc.Nat. Acad. Sci. U.S.A. 102(46), 16569 (2005)
59. Hussein, D.M.E.D.M.: A survey on sentiment analysis challenges. J. King SaudUniv.-Eng. Sci. 30(4), 330–338 (2018)
60. Jiang, Z., Liang, J.: Cryptocurrency portfolio management with deep reinforce-ment learning. In: 2017 Intelligent Systems Conference (IntelliSys), pp. 905–913.IEEE (2017)
61. Kaminski, J.C.: Nowcasting the Bitcoin market with Twitter signals. arXivpreprint arXiv:1406.7577v3 (2016). https://arxiv.org/pdf/1406.7577v3.pdf
62. Katsiampa, P.: Volatility estimation for Bitcoin: a comparison of GARCH models.Econ. Lett. 158, 3–6 (2017)
63. Kearney, C., Liu, S.: Textual sentiment in finance: a survey of methods and mod-els. Int. Rev. Fin. Anal. 33, 171–185 (2014)
64. Kempe, D., Kleinberg, J., Tardos, E.: Maximizing the spread of influence througha social network. In: Proceedings of the Ninth ACM SIGKDD International Con-ference on Knowledge Discovery and Data Mining, pp. 137–146. ACM (2003)
65. Khayamim, A., Mirzazadeh, A., Naderi, B.: Portfolio rebalancing with respectto market psychology in a fuzzy environment: a case study in Tehran StockExchange. Appl. Soft Comput. 64, 244–259 (2018)
66. Kim, S.M., Hovy, E.: Identifying and analyzing judgment opinions. In: Proceed-ings of the Main Conference on Human Language Technology Conference of theNorth American Chapter of the Association of Computational Linguistics, pp.200–207. Association for Computational Linguistics (2006)
67. Kim, Y.B., Lee, J., Park, N., Choo, J., Kim, J.H., Kim, C.H.: When Bitcoinencounters information in an online forum: using text mining to analyse useropinions and predict value fluctuation. PloS One 12(5), e0177630 (2017)
68. Ladislav, K.: BitCoin meets Google Trends and Wikipedia: quantifying the rela-tionship between phenomena of the Internet era (2013). https://www.nature.com/srep/
69. Lamon, C., Nielsen, E., Redondo, E.: Cryptocurrency Price Prediction UsingNews and Social Media Sentiment (2016). http://cs229.stanford.edu/proj2017/final-reports/5237280.pdf
70. Law, L., Sabett, S., Solinas, J.: How to make a mint: the cryptography of anony-mous electronic cash. Technical report, National Security Agency, Office of Infor-mation Security Research and Technology, Cryptology Division, 1001 Pennsylva-nia Avenue, DC, USA, June 1996
71. Li, Q., Shah, S.: Learning stock market sentiment lexicon and sentiment-orientedword vector from StockTwits. In: Proceedings of the 21st Conference on Compu-tational Natural Language Learning (CoNLL 2017), pp. 301–310 (2017)
72. Li, T.R., Chamrajnagar, A.S., Fong, X.R., Rizik, N.R., Fu, F.: Sentiment-basedprediction of alternative cryptocurrency price fluctuations using gradient boostingtree model. arXiv preprint arXiv:1805.00558 (2018)
73. Li, X., Wang, C.A.: The technology and economic determinants of cryptocurrencyexchange rates: the case of Bitcoin. Decis. Support Syst. 95, 49–60 (2017)
74. Lim, S.Y., et al.: Blockchain technology the identity management and authen-tication service disruptor: a survey. Int. J. Adv. Sci. Eng. Inf. Technol. 8(4–2),1735–1745 (2018)
75. Lin, C.C., Liu, Y.T.: Genetic algorithms for portfolio selection problems withminimum transaction lots. Eur. J. Oper. Res. 185(1), 393–404 (2008)

Forecasting Cryptocurrency Value by Sentiment Analysis 345
76. Linton, M., Teo, E.G.S., Bommes, E., Chen, C.Y., Hardle, W.K.: Dynamic topicmodelling for cryptocurrency community forums. In: Hardle, W.K., Chen, C.Y.H.,Overbeck, L. (eds.) Applied Quantitative Finance. SC, pp. 355–372. Springer,Heidelberg (2017). https://doi.org/10.1007/978-3-662-54486-0 18
77. Liu, C., Kubler, S., Yu, N.: Feature selection for highly skewed sentiment analysistasks. In: Proceedings of the Second Workshop on Natural Language Processingfor Social Media (SocialNLP), pp. 2–11 (2014)
78. Liu, W.: Portfolio diversification across cryptocurrencies. Fin. Res. Lett. (2018).https://doi.org/10.1016/j.frl.2018.07.010
79. Liu, Y., Qin, Z., Li, P., Wan, T.: Stock volatility prediction using recurrent neuralnetworks with sentiment analysis. In: Benferhat, S., Tabia, K., Ali, M. (eds.)IEA/AIE 2017. LNCS (LNAI), vol. 10350, pp. 192–201. Springer, Cham (2017).https://doi.org/10.1007/978-3-319-60042-0 22
80. Lucey, B.M., et al.: Future directions in international financial integration research- A crowdsourced perspective. Int. Rev. Fin. Anal. 55, 35–49 (2018)
81. Lumanpauw, E., Pasquier, M., Quek, C.: MNFS-FPM: a novel memetic neuro-fuzzy system based financial portfolio management. In: 2007 IEEE Congress onEvolutionary Computation, pp. 2554–2561. IEEE, Singapore (2007)
82. Ma, J., Gans, J.S., Tourky, R.: Market structure in Bitcoin mining. Technicalreport, National Bureau of Economic Research (2018)
83. Macedo, L.L., Godinho, P., Alves, M.J.: Mean-semivariance portfolio optimizationwith multiobjective evolutionary algorithms and technical analysis rules. ExpertSyst. Appl. 79, 33–43 (2017)
84. Mai, F., Shan, Z., Bai, Q., Wang, X., Chiang, R.H.: How does social media impactBitcoin value? a test of the silent majority hypothesis. J. Manag. Inf. Syst. 35(1),19–52 (2018)
85. Mao, Y., Wei, W., Wang, B., Liu, B.: Correlating S&P 500 stocks with Twitterdata. In: Proceedings of the First ACM International Workshop on Hot Topicson Interdisciplinary Social Networks Research, pp. 69–72. ACM (2012)
86. Mashayekhi, Z., Omrani, H.: An integrated multi-objective Markowitz-DEA cross-efficiency model with fuzzy returns for portfolio selection problem. Appl. SoftComput. 38, 1–9 (2016)
87. Matta, M., Lunesu, I., Marchesi, M.: The predictor impact of Web search media onBitcoin trading volumes. In: 2015 7th International Joint Conference on Knowl-edge Discovery, Knowledge Engineering and Knowledge Management (IC3K), vol.1, pp. 620–626. IEEE (2015)
88. Mba, J.C., Pindza, E., Koumba, U.: A differential evolution copula-based app-roach for a multi-period cryptocurrency portfolio optimization. Fin. Markets Port-folio Manag. 32(4), 399–418 (2018)
89. McNally, S., Roche, J., Caton, S.: Predicting the price of Bitcoin using machinelearning. In: 2018 26th Euromicro International Conference on Parallel, Dis-tributed and Network-Based Processing (PDP), pp. 339–343. IEEE (2018)
90. Mendes, L., Godinho, P., Dias, J.: A forex trading system based on a geneticalgorithm. J. Heuristics 18(4), 627–656 (2012)
91. Metaxiotis, K., Liagkouras, K.: Multiobjective evolutionary algorithms for port-folio management: a comprehensive literature review. Expert Syst. Appl. 39(14),11685–11698 (2012)
92. Millard, C.: Blockchain and law: incompatible codes? Comput. Law Secur. Rev.34(4), 843–846 (2018)
93. Mohammadi, A., Saraee, M., Mirzaei, A.: Time-sensitive influence maximizationin social networks. J. Inf. Sci. 41(6), 765–778 (2015)

346 A. Zamuda et al.
94. Nakamoto, S.: Bitcoin: a peer-to-peer electronic cash system. Bitcoin.org (2008)95. Nauck, D., Klawonn, F., Kruse, R.: Foundations of Neuro-Fuzzy Systems. Wiley,
Hoboken (1997)96. Nguyen, G.T., Kim, K.: A survey about consensus algorithms used in blockchain.
J. Inf. Process. Syst. 14(1), 101–128 (2018)97. Ortony, A., Clore, G.L., Collins, A.: The Cognitive Structure of Emotions. Cam-
bridge University Press, Cambridge (1990)98. Panarello, A., Tapas, N., Merlino, G., Longo, F., Puliafito, A.: Blockchain and
IoT integration: a systematic survey. Sensors 18(8), 2575 (2018)99. Pang, B., Lee, L.: Seeing stars: exploiting class relationships for sentiment catego-
rization with respect to rating scales. In: Proceedings of the 43rd Annual Meetingon Association for Computational Linguistics, pp. 115–124. Association for Com-putational Linguistics (2005)
100. Peng, S., Zhou, Y., Cao, L., Yu, S., Niu, J., Jia, W.: Influence analysis in socialnetworks: a survey. J. Netw. Comput. Appl. 106, 17–32 (2018)
101. Peng, Y., Albuquerque, P.H.M., de Sa, J.M.C., Padula, A.J.A., Montenegro, M.R.:The best of two worlds: forecasting high frequency volatility for cryptocurrenciesand traditional currencies with Support Vector Regression. Expert Syst. Appl.97, 177–192 (2018)
102. Petcu, D., Gonzalez–Velez, H., Nicolae, B., Garcıa–Gomez, J.M., Fuster–Garcia,E., Sheridan, C.: Next generation HPC clouds: a view for large-scale scientificand data-intensive applications. In: Lopes, L., et al. (eds.) Euro-Par 2014. LNCS,vol. 8806, pp. 26–37. Springer, Cham (2014). https://doi.org/10.1007/978-3-319-14313-2 3
103. Petrican, T., et al.: Evaluating forecasting techniques for integrating householdenergy prosumers into smart grids. In: 14th International Conference on Intelli-gent Computer Communication and Processing, pp. 79–85. IEEE (2018)
104. Phillips, R.C., Gorse, D.: Predicting cryptocurrency price bubbles using socialmedia data and epidemic modelling. In: 2017 IEEE Symposium Series on Com-putational Intelligence (SSCI), pp. 1–7. IEEE (2017)
105. Phillips, R.C., Gorse, D.: Mutual-excitation of cryptocurrency market returnsand social media topics. In: Proceedings of the 4th International Conference onFrontiers of Educational Technologies, pp. 80–86. ACM (2018)
106. Platanakis, E., Sutcliffe, C., Urquhart, A.: Optimal vs naıve diversification incryptocurrencies. Econ. Lett. 171, 93–96 (2018)
107. Ponsich, A., Jaimes, A.L., Coello, C.A.C.: A survey on multiobjective evolutionaryalgorithms for the solution of the portfolio optimization problem and other financeand economics applications. IEEE Trans. Evol. Comput. 17(3), 321–344 (2013)
108. Pop, C., et al.: Decentralizing the stock exchange using blockchain an ethereum-based implementation of the Bucharest Stock Exchange. In: 14th InternationalConference on Intelligent Computer Communication and Processing, pp. 459–466.IEEE (2018)
109. Puri, V.: Decrypting Bitcoin prices and adoption rates using Google search. CMCSenior Theses 1418 (2016)
110. Radosavljevic, V., Grbovic, M., Djuric, N., Bhamidipati, N.: Large-scale WorldCup 2014 outcome prediction based on Tumblr posts. In: KDD Workshop onLarge-Scale Sports Analytics (2014)
111. Rakoczy, M., Bouzeghoub, A., Wegrzyn-Wolska, K., Gancarski, L.A.: Users viewson others - analysis of confused relation-based terms in social network. In:Debruyne, C., et al. (eds.) OTM 2016. LNCS, vol. 10033, pp. 155–174. Springer,Cham (2016). https://doi.org/10.1007/978-3-319-48472-3 9

Forecasting Cryptocurrency Value by Sentiment Analysis 347
112. Rakoczy, M.E., Bouzeghoub, A., Lopes, G.A., Wegrzyn-Wolska, K.: In the searchof quality influence on a small scale – micro-influencers discovery. In: Panetto, H.,Debruyne, C., Proper, H., Ardagna, C., Roman, D., Meersman, R. (eds.) OTM2018. LNCS, vol. 11230. Springer, Cham (2018). https://doi.org/10.1007/978-3-030-02671-4 8
113. Rakoczy, M.E., Bouzeghoub, A., Gancarski, A.L., Wegrzyn-Wolska, K.: Influ-ence in time-dependent citation networks. In: 12th International Conference onResearch Challenges in Information Science, RCIS 2018, 29–31 May 2018, Nantes,France, pp. 1–11 (2018)
114. Rakoczy, M.E., Bouzeghoub, A., Gancarski, A.L., Wegrzyn-Wolska, K.: Reputa-tion prediction using influence conversion. In: 17th IEEE International Confer-ence on Trust, Security and Privacy in Computing and Communications/12thIEEE International Conference on Big Data Science and Engineering, Trust-Com/BigDataSE 2018, 1–3 August 2018, New York, NY, USA, pp. 43–48 (2018)
115. Reyna, A., Martın, C., Chen, J., Soler, E., Daız, M.: On blockchain and its inte-gration with IoT. Challenges and opportunities. Future Gener. Comput. Syst. 88,173–190 (2018)
116. Rezaei Pouya, A., Solimanpur, M., Jahangoshai Rezaee, M.: Solving multi-objective portfolio optimization problem using invasive weed optimization. SwarmEvol. Comput. 28, 42–57 (2016)
117. Ruiz, E.J., Hristidis, V., Castillo, C., Gionis, A., Jaimes, A.: Correlating finan-cial time series with micro-blogging activity. In: Proceedings of the Fifth ACMInternational Conference on Web Search and Data Mining, pp. 513–522. ACM(2012)
118. Ruiz-Torrubiano, R., Suarez, A.: Use of heuristic rules in evolutionary methodsfor the selection of optimal investment portfolios. In: 2007 IEEE Congress onEvolutionary Computation, pp. 212–219. IEEE (2007)
119. Saborido, R., Ruiz, A.B., Bermudez, J.D., Vercher, E., Luque, M.: Evolutionarymulti-objective optimization algorithms for fuzzy portfolio selection. Appl. SoftComput. 39, 48–63 (2016)
120. Skolpadungket, P., Dahal, K., Harnpornchai, N.: Portfolio optimization usingmulti-objective genetic algorithms. In: 2007 IEEE Congress on Evolutionary Com-putation, pp. 516–523. IEEE (2007)
121. Smith, P., Gonzalez-Velez, H., Caton, S.: Social auto-scaling. In: 26th EuromicroInternational Conference on Parallel, Distributed and Network-Based Processing,PDP 2018, pp. 186–195. IEEE, Cambridge (2018)
122. Sokolov, K.: Ransomware Activity, Demand for Blockchain Settlement and theUpper Bound of Congestion-Induced Mining Reward. SSRN Working Paper(2018). https://ssrn.com/abstract=3175986
123. Soleimani, H., Golmakani, H.R., Salimi, M.H.: Markowitz-based portfolio selec-tion with minimum transaction lots, cardinality constraints and regarding sec-tor capitalization using genetic algorithm. Expert Syst. Appl. 36(3), 5058–5063(2009)
124. Stenqvist, E., Lonno, J.: Predicting Bitcoin price fluctuation with Twitter senti-ment analysis (2017)
125. Stevenson, R.A., Mikels, J.A., James, T.W.: Characterization of the affectivenorms for english words by discrete emotional categories. Behav. Res. Methods39(4), 1020–1024 (2007)
126. Stocchi, M., Lunesu, I., Ibba, S., Baralla, G., Marchesi, M.: The future of Bitcoin:a synchrosqueezing wavelet transform to predict search engine query trends. In:KDWeb (2016)

348 A. Zamuda et al.
127. Storn, R., Price, K.: Differential evolution - a simple and efficient heuristic forglobal optimization over continuous spaces. J. Global Optim. 11, 341–359 (1997)
128. Sung, J., Moon, S., Lee, J.-G.: The influence in Twitter: are they really influenced?In: Cao, L., et al. (eds.) BSI/BSIC 2013. LNCS (LNAI), vol. 8178, pp. 95–105.Springer, Cham (2013). https://doi.org/10.1007/978-3-319-04048-6 9
129. Szor, P.: The Art of Computer Virus Research and Defense. Pearson Education,London (2005)
130. Tonelli, R., Ducasse, S., Fenu, G., Bracciali, A.: 2018 IEEE 1st InternationalWorkshop on Blockchain Oriented Software Engineering (IWBOSE), 20 March2018, Campobasso, Italy. IEEE (2018)
131. Tudor, C., et al.: Optimized flexibility management enacting data centres partic-ipation in smart demand response programs. Future Gener. Comput. Syst. 78,330–342 (2018)
132. Tumasjan, A., Sprenger, T.O., Sandner, P.G., Welpe, I.M.: Predicting electionswith Twitter: what 140 characters reveal about political sentiment. In: Interna-tional AAAI Conference on Web and Social Media, Fourth International AAAIConference on Weblogs and Social Media, vol. 10, no. 1, pp. 178–185 (2010)
133. Tupinambas, T.M., Leao, R.A., Lemos, A.P.: Cryptocurrencies transactions advi-sor using a genetic Mamdani-type fuzzy rules based system. In: IEEE Interna-tional Conference on Fuzzy Systems, p. 7 (2018)
134. Turney, P.D.: Thumbs up or thumbs down?: semantic orientation applied to unsu-pervised classification of reviews. In: Proceedings of the 40th Annual Meeting onAssociation for Computational Linguistics, pp. 417–424. Association for Compu-tational Linguistics (2002)
135. Viktorin, A., Senkerik, R., Pluhacek, M., Kadavy, T., Zamuda, A.: Distance basedparameter adaptation for success-history based differential evolution. Swarm Evol.Comput., 12 November 2018. https://doi.org/10.1016/j.swevo.2018.10.013
136. Vytautas, K., Niels, D., Jochen, D.W.: Using sentiment analysis to predict inter-day Bitcoin price movements. J. Risk Fin. 19(1), 56–75 (2018)
137. Wang, W., et al.: A survey on consensus mechanisms and mining management inblockchain networks. arXiv preprint arXiv:1805.02707 (2018)
138. Weng, J., Lim, E.P., Jiang, J., He, Q.: TwitterRank: finding topic-sensitive influ-ential Twitterers. In: Proceedings of the Third ACM International Conference onWeb Search and Data Mining, pp. 261–270. ACM (2010)
139. Werner, A., Murray, Z.F.: Is all that talk just noise? The information content ofinternet stock message boards. J. Fin. 59, 1259–1294 (2004)
140. Xiao, F., Noro, T., Tokuda, T.: Finding news-topic oriented influential Twitterusers based on topic related hashtag community detection. J. Web Eng. 13(5&6),405–429 (2014)
141. Yogatama, D., Dyer, C., Ling, W., Blunsom, P.: Generative and discriminativetext classification with recurrent neural networks. In: Thirty-Fourth InternationalConference on Machine Learning (ICML 2017) (2017)
142. Zafarani, R., Abbasi, M.A., Liu, H.: Social Media Mining: An Introduction. Cam-bridge University Press, New York (2014)
143. Zamuda, A., Brest, J.: Self-adaptive control parameters’ randomization frequencyand propagations in differential evolution. Swarm Evol. Comput. 25, 72–99 (2015)
144. Zamuda, A., Nicolau, M., Zarges, C.: A black-box discrete optimization bench-marking (BB-DOB) pipeline survey: taxonomy, evaluation, and ranking. In: Pro-ceedings of the Genetic and Evolutionary Computation Conference Companion(GECCO 2018), pp. 1777–1782 (2018)

Forecasting Cryptocurrency Value by Sentiment Analysis 349
145. Zamuda, A., Zarges, C., Stiglic, G., Hrovat, G.: Stability selection using a geneticalgorithm and logistic linear regression on healthcare records. In: Proceedingsof the Genetic and Evolutionary Computation Conference Companion (GECCO2017), pp. 143–144 (2017)
146. Zamuda, A., Sosa, J.D.H.: Success history applied to expert system for underwaterglider path planning using differential evolution. Expert Syst. Appl. 119(1 April2019), 155–170 (2019)
147. Zhang, X., Fuehres, H., Gloor, P.A.: Predicting stock market indicators throughTwitter “I hope it is not as bad as I fear”. Procedia-Soc. Behav. Sci. 26, 55–62(2011)
148. Zheludev, I., Smith, R., Aste, T.: When can social media lead financial markets?Sci. Rep. 4, 4213 (2014)
149. Zopounidis, C., Galariotis, E., Doumpos, M., Sarri, S., AndriosopouloS, K.: Mul-tiple criteria decision aiding for finance: an updated bibliographic survey. Eur. J.Oper. Res. 247(2), 339–348 (2015)
Open Access This chapter is licensed under the terms of the Creative CommonsAttribution 4.0 International License (http://creativecommons.org/licenses/by/4.0/),which permits use, sharing, adaptation, distribution and reproduction in any mediumor format, as long as you give appropriate credit to the original author(s) and thesource, provide a link to the Creative Commons license and indicate if changes weremade.
The images or other third party material in this chapter are included in the chapter’sCreative Commons license, unless indicated otherwise in a credit line to the material. Ifmaterial is not included in the chapter’s Creative Commons license and your intendeduse is not permitted by statutory regulation or exceeds the permitted use, you willneed to obtain permission directly from the copyright holder.

Author Index
Albanis, Nikolas 88Aldinucci, Marco 1Ancourt, Corinne 36, 307
Bajrovic, Enes 163Bashroush, Rabih 88Benkner, Siegfried 163Bougueroua, Lamine 307Bracciali, Andrea 1, 325Brdar, Sanja 163Burguillo, Juan C. 325
Cioara, Tudor 325Crescimanna, Vincenzo 325
Fernández-Cerero, Damián 88Fernández-Montes, Alejandro 88Francavilla, M. Alessandro 36
Giordanengo, Giorgio 36González-Vélez, Horacio 163, 325Gortazar, Francisco 138Grelck, Clemens 1, 36Gribaudo, Marco 221Grujić, Nastasija 163Grzonka, Daniel 138, 279
Hosseinpour, Farhoud 186
Iacono, Mauro 221
Jakobik, Agnieszka 186Jarynowski, Andrzej 186
Kadavy, Tomas 221Karageorgos, Anthony 88Kessler, Christoph 36Kilanioti, Irene 88Kisielewicz, Paweł 279Koivisto, Mike 138
Kołodziej, Joanna 279Komínková Oplatková, Zuzana 221Krzyszton, Mateusz 186Kuonen, Pierre 138
Larsson, Elisabeth 1, 36, 69
Marechal, Catherine 307Marks, Michal 186Matos Dias, Joana 325Mauri, Giancarlo 221Mettouris, Christos 88Mikołajewski, Dariusz 307Moldovan, Dorin 186Molina, Jose M. 186Möller, Steffen 250
Nejkovic, Valentina 88, 138Niewiadomska-Szynkiewicz, Ewa 1Nobile, Marco S. 221Novović, Olivera 163
Olğaç, Abdurrahman 250Olğaç, Simla 250
Papadopoulos, Apostolos 163Papadopoulos, George A. 88Petrovic, Nenad 138Pllana, Sabri 186, 221Pop, Claudia 325Pop, Cristina 186Prokopowicz, Piotr 307
Rached, Imen 69, 325Rancic, Svetozar 138Respicio, Ana 186Righero, Marco 36
Salomie, Ioan 186, 325Senkerik, Roman 221, 325

Sikora, Andrzej 186Spolaor, Simone 221Stojanovic, Dragan 186Stojanovic, Natalija 221Stojnev Ilic, Aleksandra 186
Talvitie, Jukka 138Tchorzewski, Jacek 138Tosic, Milorad 138Truică, Ciprian-Octavian 163Türe, Aslı 250Turunen, Esko 221Tyburek, Krzysztof 307
Valkama, Mikko 138Vecchi, Giuseppe 36Viktorin, Adam 221Vipiana, Francesca 36Visa, Ari 138Vitabile, Salvatore 186, 221
Węgrzyn-Wolska, Katarzyna 307, 325Widłak, Adrian 279
Zafari, Afshin 36Zamuda, Aleš 221, 325
352 Author Index