


High Performance Drupal
263
www.it-ebooks.info
Transcript of High Performance Drupal
Praise for High Performance Drupal
“Tag1 has been my go-to partner for performance and scalability for the last decade. Thisbook, based on their experience scaling the largest (Drupal) sites on the Internet, is a must-
read for any Drupal developer or system administrator.”— Michael Meyers
Vice President, Large Scale Drupal at Acquia
“An exhaustive, baremetal-to-browser treatment of both the factors governing Drupalperformance, and the tools for working in each layer.”
— Sam Boyer Manager, Enterprise Architecture at NBCUniversal
“It’s been wonderful to work with the brilliant minds at Tag1 Consulting (Jeff, Narayan, Natand others) on a number of enterprise-class Drupal projects. I’m always blown away by the
depth of their knowledge and how they’re able to apply what they know totroubleshoot performance bottlenecks.
This book is a wonderful window into this team’s collective experience and skills. Anyonewho’s serious about Drupal will have this book on their “must have”
list of Drupal references."— Kevin Millecam
Partner, WebWise Solutions
“Jeff and Narayan have always amazed me with their knowledge and experience with highperformance hosting, especially with regards to Drupal. From their experience at the OSUOpen Source Lab working on Drupal.org to working at Tag1 they are very much my go to
resource for high performance knowledge.”— Lance Albertson
Director, Oregon State University, Open Source Lab
www.it-ebooks.info

“I first worked with the authors of this book in 2007 to dig Drupal.org out of its downtimewoes and, later, on some of Drupal’s largest commercial projects. Their prolific
contributions to infrastructure designs have shaped the industry standard.Until today, I’ve declined to recommend any Drupal performance books that I’ve reviewed.I’m proud to say this book has changed my mind. I’ll be ordering copies for my co-workers
and colleagues as soon as it’s released."— David Strauss
CTO and Cofounder, Pantheon Systems
“Narayan, Nat and Jeff bring together an understanding of Drupal that extends far insideand outside of Drupal. High Performance Drupal provides concrete examples for
building highly scalable Drupal websites."— Rudy Grigar
Sr. Systems Architect, OSU Open Source Lab
“Does Drupal scale? This book answers that with a resounding yes!”— Dave O’Donovan
Director Technology at archetypes.com
“Authored by some of the Drupal community’s most knowledgeable experts, HighPerformance Drupal is bound to become your most valued resource. With this book as a
guide, you’ll be able to create systems and processes that make running your site moreefficient and maximize your site’s potential.”
— Holly Ross Executive Director, Drupal Association
www.it-ebooks.info
Jeff Sheltren, Narayan Newton,and Nathaniel Catchpole
High Performance Drupal
www.it-ebooks.info

High Performance Drupalby Jeff Sheltren, Narayan Newton, and Nathaniel Catchpole
Copyright © 2014 Tag1 Consulting. All rights reserved.
Printed in the United States of America.
Published by O’Reilly Media, Inc., 1005 Gravenstein Highway North, Sebastopol, CA 95472.
O’Reilly books may be purchased for educational, business, or sales promotional use. Online editions arealso available for most titles (http://my.safaribooksonline.com). For more information, contact our corporate/institutional sales department: 800-998-9938 or [email protected].
Editor: Meghan BlanchetteProduction Editor: Christopher HearseCopyeditor: Rachel HeadProofreader: Amanda Kersey
Indexer: WordCo Indexing Services, Inc. Cover Designer: Karen MontgomeryInterior Designer: David FutatoIllustrator: Rebecca Demarest
October 2013: First Edition
Revision History for the First Edition:
2013-10-11: First release
See http://oreilly.com/catalog/errata.csp?isbn=9781449392611 for release details.
Nutshell Handbook, the Nutshell Handbook logo, and the O’Reilly logo are registered trademarks of O’ReillyMedia, Inc. High Performance Drupal, the image of a Red-shouldered Hawk, and related trade dress aretrademarks of O’Reilly Media, Inc.
Many of the designations used by manufacturers and sellers to distinguish their products are claimed astrademarks. Where those designations appear in this book, and O’Reilly Media, Inc., was aware of a trade‐mark claim, the designations have been printed in caps or initial caps.
While every precaution has been taken in the preparation of this book, the publisher and authors assumeno responsibility for errors or omissions, or for damages resulting from the use of the information containedherein.
ISBN: 978-1-449-39261-1
[LSI]
www.it-ebooks.info
Table of Contents
Preface. . . . . . . . . . . . . . . . . . . . . . . . . . . . . . . . . . . . . . . . . . . . . . . . . . . . . . . . . . . . . . . . . . . . . . . xi
1. Beginning a Performance Project. . . . . . . . . . . . . . . . . . . . . . . . . . . . . . . . . . . . . . . . . . . . . . 1Getting Started with Performance Improvements 1Establishing a Performance Baseline 3Setting Goals for Website Performance 4The Many Aspects of Drupal Performance 5Creating a Prioritized List of Improvements 6
2. Frontend Performance. . . . . . . . . . . . . . . . . . . . . . . . . . . . . . . . . . . . . . . . . . . . . . . . . . . . . . . 9Limiting HTTP Requests 9
Audits 10Image Requests 12Minification 13
Minification On the Fly 14Preminification for Modules/Themes 14Minifying During the Build Process 14
Compression 15Cacheable Headers 15CDNs 16Keep Third-Party Libraries Up to Date 16
jQuery Update 16External Scripts 17Single Points of Failure (SPOFs) 17
3. Drupal Performance Out of the Box. . . . . . . . . . . . . . . . . . . . . . . . . . . . . . . . . . . . . . . . . . . 21Page Caching 21When Should You Use Page Caching? 22
Internal Page Caching 23
iii
www.it-ebooks.info

Reverse Proxy Caching 24CSS and JavaScript Aggregation 25Logging 26The Cache and Other Swappable Storage 26Cron 27Views 27
4. Drupal Coding for Optimal Performance. . . . . . . . . . . . . . . . . . . . . . . . . . . . . . . . . . . . . . . 29Context Matters 29False Optimizations 30Listing Entities 32
entityQuery() 32Multiple Entity Loading 32
Caching 34Static Caching 34Persistent Caching 37
Queues and Workers 43Cache Stampedes and Race Conditions 44
5. Drupal Coding for Abysmal Performance. . . . . . . . . . . . . . . . . . . . . . . . . . . . . . . . . . . . . . . 47variable_set() Abuse 47External Requests 49Sessions 50Excessive Cache Granularity 51PHP Errors 52Debug Code in the Code Base 53Development Settings 53
6. Verifying Changes. . . . . . . . . . . . . . . . . . . . . . . . . . . . . . . . . . . . . . . . . . . . . . . . . . . . . . . . . . 55Analyzing Frontend Performance 55
YSlow and Google PageSpeed 55Waterfall Charts 56Real User Monitoring 58
Analyzing Application Performance 59The Devel Module 60Xdebug 65XHProf 66strace 74
7. Infrastructure Design and Planning. . . . . . . . . . . . . . . . . . . . . . . . . . . . . . . . . . . . . . . . . . . 79Horizontal and Vertical Scaling 79Service Categorization 82
iv | Table of Contents
www.it-ebooks.info
Working Well Together 83Example Two-Layer Configuration 84Example Larger-Scale Infrastructure 85Development and Staging Environments 87Internal Network Layout 88Utility Servers 90High Availability and Failover 91Hosting Considerations 91Summary 93
8. Service Monitoring. . . . . . . . . . . . . . . . . . . . . . . . . . . . . . . . . . . . . . . . . . . . . . . . . . . . . . . . . 95The Importance of Monitoring Services 95Monitoring Alerts with Icinga 96
What to Monitor 96How to Tune Monitoring 97
Graphing Monitoring Data 98Internal Versus Remote Monitoring 99
9. “DevOps”: Breaking Down Barriers Between Development and Operations. . . . . . . . 101Revision Control Systems 102
Locally Hosted or External Service 102Not Just for Code 102
Configuration Management Systems 103Which System to Use 103
Pulling It Together: In-Depth Example with Puppet and Git 103Development Virtual Machines 106
How to Distribute Development VMs with Vagrant 107Deployment Workflow 107
Example Workflow with Git 108Deployment with Jenkins CI 110
10. File Storage for Multiple Web Servers. . . . . . . . . . . . . . . . . . . . . . . . . . . . . . . . . . . . . . . . 113rsync 113GlusterFS 114
Example Configuration 115Single NFS Server 115HA NFS Cluster 116
Example Configuration 117Setting Up DRBD 117Setting Up Heartbeat 119Setting Up NFS 119Testing 119
Table of Contents | v
www.it-ebooks.info
Storage Area Networks (SANs) 120
11. Drupal and Cloud Deployments. . . . . . . . . . . . . . . . . . . . . . . . . . . . . . . . . . . . . . . . . . . . . . 121What Is the Cloud? 121Why Use the Cloud? 121Infrastructure Overhead 122Prepackaged Clouds 122Common Issues with Cloud Deployments and Their Mitigations 123
12. Failover Configuration. . . . . . . . . . . . . . . . . . . . . . . . . . . . . . . . . . . . . . . . . . . . . . . . . . . . . 125IP Failover Versus DNS Failover 126Service-Level Issues 126Heartbeat 127
Installation 127Configuration 127Usage 129
13. MySQL. . . . . . . . . . . . . . . . . . . . . . . . . . . . . . . . . . . . . . . . . . . . . . . . . . . . . . . . . . . . . . . . . . . 131Drupal and MySQL Engines 131Versions of MySQL 132
Oracle MySQL 132MariaDB 132Percona Server 133
General Configuration 133Global Configuration 133Per-Thread Configuration 134Storage Engine Configuration 135
Replication 136Virtualized Deployments 137
14. Tools for Managing and Monitoring MySQL. . . . . . . . . . . . . . . . . . . . . . . . . . . . . . . . . . . . 139Percona Toolkit 139Openark Kit 140mysqlreport 141Percona Monitoring Plug-Ins 145
15. MySQL Query Optimization. . . . . . . . . . . . . . . . . . . . . . . . . . . . . . . . . . . . . . . . . . . . . . . . . 147Index Basics 147Base Tables and Join Order 148Common Issues 149
The ORDER BY on an Unrelated Table 150The Useless DISTINCT (“In Case of Accidents!”) 150
vi | Table of Contents
www.it-ebooks.info

Starfish Syndrome (All LEFT JOINS) 151Node Access 151
16. Alternative Storage and Cache Backends. . . . . . . . . . . . . . . . . . . . . . . . . . . . . . . . . . . . . . 153Cache, Lock, and Session Storage 154Memcache In Depth 155
PHP Extensions for Memcache 155Assigning Memcached Servers and Bins 156Memcache Locking and Stampede Protection 157What to Store in Memcache 158Configuring the Memcache Daemon 158
How to Break Your Site with Memcache 159Inconsistent Caching 159Constant Evictions 160Vanishing Sessions 160
Entity/Field Storage 161EntityFieldQuery/EntityQuery 162CRUD 162MongoDB 162
17. Solr Search. . . . . . . . . . . . . . . . . . . . . . . . . . . . . . . . . . . . . . . . . . . . . . . . . . . . . . . . . . . . . . . 165Performance and Scalability Considerations 165Integrating Solr with Drupal 166Solr Configuration 166Indexing Content 167Infrastructure Considerations 168Solr Replication 168Drupal Module Installation 169
18. PHP and httpd Configuration. . . . . . . . . . . . . . . . . . . . . . . . . . . . . . . . . . . . . . . . . . . . . . . 171APC: PHP Opcode Cache 171php.ini Settings 173PHP Apache Module Versus CGI 174Apache MPM Settings 175Prefork Thread Settings 176KeepAlive 178Cache Headers 178Logging 179Server Signature 181Administrative Directory or VirtualHost 181Nginx 182
Table of Contents | vii
www.it-ebooks.info

Why Not Use Nginx Everywhere? 183
19. Reverse Proxies and Content Delivery Networks. . . . . . . . . . . . . . . . . . . . . . . . . . . . . . . . 185Using a Reverse Proxy with Drupal 185Understanding Varnish Configuration Language 187
Defining a Backend 188Directors: Dealing with Multiple Backend Servers 189Built-in VCL Subroutines 191Customizing Subroutines 192
Cookies and Varnish 195Caching for Authenticated Users 196Edge-Side Includes 196Serving Expired Content 197Error Pages 198Memory Allocation 199Logging and Monitoring Varnish 199Sample VCL for Drupal 200Content Delivery Networks 204
Serving Static Content Through a CDN 204When to Use a CDN 205Choosing Between a CDN and a Reverse Proxy 205
20. Load Testing. . . . . . . . . . . . . . . . . . . . . . . . . . . . . . . . . . . . . . . . . . . . . . . . . . . . . . . . . . . . . . 207Different Types of Load Tests 207Creating a Valid Test 208When to Test 209
Continuous Integration (CI) 209Periodic Testing 209Manual Targeted Testing 209
Interpreting Test Results 209Server Monitoring During Load Tests 210Where to Test 211Example Load Test Using JMeter 212
Global Test Settings 213Thread Groups 216Handling Cookies 217Login Controller 218Browse Controller 220Output Configuration 221Running a Test 222
viii | Table of Contents
www.it-ebooks.info

Reading Test Results 222
21. Where to Next?. . . . . . . . . . . . . . . . . . . . . . . . . . . . . . . . . . . . . . . . . . . . . . . . . . . . . . . . . . . 225Official Book Website 225High Performance Drupal Group 225Drupal Watchdog 225Revision Control with Git 226Varnish 226Configuration Management 226Vagrant 226Jenkins 226MySQL Performance 227InnoDB Index Structures 227
Index. . . . . . . . . . . . . . . . . . . . . . . . . . . . . . . . . . . . . . . . . . . . . . . . . . . . . . . . . . . . . . . . . . . . . . . 229
Table of Contents | ix
www.it-ebooks.info
Preface
Drupal has come a long way since becoming an open source project in 2001. What wasonce a fairly limited content management system has become a very powerful frame‐work that runs millions of websites. Everything from personal blogs and small neigh‐borhood businesses to Internet startups, universities, governments, and global compa‐nies are running Drupal. There are hundreds of Drupal-focused companies offeringdevelopment, hosting, and performance tuning services, and new Drupal sites, smalland large, are coming online everyday.
Does Drupal Scale?The three of us authors all work at Tag1 Consulting, where we focus specifically on theperformance and scalability of Drupal websites. If there is one question we see askedmore than any other, it’s, “Does Drupal scale?” The question may be asked in manydifferent forms: “I want to do X (insert super dynamic, cool feature here), and it needsto support millions of users”; “We’re thinking of using Drupal for this project, but wehear that using Views is terribly slow”; or focusing on the infrastructure components,“We’re confident in Drupal, but pretty sure that MySQL can’t keep up with our traffic.”In the end, it all boils down to, “Can Drupal scale?” because when we say “Drupal” inthis context, we actually mean the entire stack of infrastructure and software that sup‐ports a Drupal site. The short answer is, of course, “Yes,” but if it were that simple, thisbook could start and end with this introduction. As you might expect, the actual answerof how to achieve performance while scaling up a large Drupal site is much more com‐plicated.
We deal with clients of all types and with many varying needs. We repeatedly see manyof the same issues arise: pages aren’t caching properly, servers are overloaded, databasequeries are running too slowly. All of these issues contribute to the overall question ofwhether and how Drupal can scale. While it would be impossible to cover all the possiblereasons for any potential problems in a single book, the best practices and guidanceprovided here will cover the most common problems encountered while scaling Drupal
xi
www.it-ebooks.info

websites. We provide a strong base of knowledge that can be used to plan for and over‐come more difficult or unique performance issues.
Goals of This BookThe primary goal of this book is to help you solve Drupal performance and scalabilityissues. Drupal makes creating websites incredibly easy; however, if you aren’t careful, itcan quickly turn into a performance nightmare. This book is full of information on bestpractices for running a high performance Drupal site. This is not just limited to “enablethese performance settings in the Drupal configuration”; rather, we take a holistic ap‐proach to website performance, covering Drupal internals, coding, and infrastructuretechniques that all come together to build a high-performing and scalable website.
This is a technical book providing in-depth explanations and examples of commonmethods used to improve Drupal site performance. It is expected that readers of thisbook have a basic understanding of Drupal and the LAMP stack and are familiar withcommon hardware and infrastructure concepts. We’ve designed this book to be usefulto both developers and system administrators. A site cannot perform at a high levelunless attention is given to both code and infrastructure.
Supported Drupal VersionsThe main focus of the book will be on Drupal versions 7 and 8, with Drupal 8 plannedfor release shortly after this book goes to press. There are still many websites runningDrupal 6, and while our infrastructure advice and examples are still very relevant forolder versions of Drupal, be aware that the code examples and discussion of Drupalinternals have generally changed for the newer versions of Drupal.
How This Book Is OrganizedWe cover a wide range of topics within this book and have grouped them into thefollowing topical sections.
Performance AnalysisChapter 1, Beginning a Performance Project, discusses the various aspects of a websitethat all contribute to the big picture of website performance. Here, we also introduce aprocess for analyzing websites and approaching performance improvement projects.
Application PerformanceThis section covers a wide variety of Drupal application performance issues, startingwith Chapter 2, Frontend Performance, where we describe best practices for frontend
xii | Preface
www.it-ebooks.info

optimization, looking at network utilization, code optimization, and issues specific tomobile performance.
Chapter 3, Drupal Performance Out of the Box, discusses Drupal configuration settingsthat can improve performance. This includes an overview of the Drupal caching system,CSS and JavaScript aggregation, and other configuration options related to Drupal core.
We go into more depth on code-level optimizations in Chapter 4, Drupal Coding forOptimal Performance. This chapter covers important issues that should be addressedwhen writing or extending custom code in Drupal, giving best practices for items suchas entities, the cache API, and the use of queues and workers. On the flip side, Chapter 5,Drupal Coding for Abysmal Performance, talks about common pitfalls that should beavoided, and explains why certain code can greatly reduce website performance.
Chapter 6, Verifying Changes, outlines the importance of tracking performance metricsfor a site and using that information to understand how changes to the site affect per‐formance for better or worse.
InfrastructureWe begin the section on infrastructure issues with Chapter 7, Infrastructure Design andPlanning, which describes best practices for designing and infrastructure to host a Dru‐pal website and related services. Early planning of infrastructure design will help awebsite to easily scale as it grows.
Chapter 8, Service Monitoring, covers how to monitor services and infrastructure inorder to be alerted of potential issues before they affect a website and how to trackperformance and usage baselines in order to better understand how services react underload.
Chapter 9, “DevOps”: Breaking Down Barriers Between Development and Operations,introduces many common infrastructure ideas and best practices to break down barriersbetween development and operations. This chapter discusses revision control systems,system configuration management, deployment workflow, and development virtualmachines.
Chapter 10, File Storage for Multiple Web Servers, analyzes the difficulties faced withsharing a single Drupal files/ directory between multiple web servers and gives examplesof common file sharing options including NFS, rsync, and GlusterFS.
Chapter 11, Drupal and Cloud Deployments, introduces the idea of virtualized hostingand cloud-based infrastructures. Here we discuss the performance and scalability ben‐efits of using a virtualized infrastructure, as well as some of the trade-offs between usingvirtual servers as opposed to physical servers.
Chapter 12, Failover Configuration, explains how to provide highly available services,using technologies such as Heartbeat to handle failover when a service goes offline.
Preface | xiii
www.it-ebooks.info
DatabasesChapters 13, 14, and 15 all cover MySQL database information related to Drupal.Chapter 13, MySQL, provides an in-depth look at MySQL performance considerationsand general configuration settings. It also contains an introduction to MySQL storageengines, with specific focus on InnoDB for performance and scalability. Chapter 14,Tools for Managing and Monitoring MySQL, introduces a number of tools commonlyused for tuning, managing, and monitoring MySQL servers. Chapter 15, MySQL QueryOptimization, wraps up the MySQL discussion by focusing on methods for locating andoptimizing slow queries.
Chapter 16, Alternative Storage and Cache Backends, describes how alternative databaseand data storage engines can be used with Drupal to improve performance. This chapterincludes examples on how to implement Memcache, Redis, and MongoDB backendswith Drupal.
Chapter 17, Solr Search, discusses using Solr as an alternative search option for Drupal.We look at some of the benefits and added functionality that can be achieved by shiftingthe search backend out of MySQL.
Web Servers and Reverse ProxiesFor an optimally performing site, it’s important to have a properly tuned web server.Chapter 18, PHP and httpd Configuration, discusses how to best configure the webserver and PHP for a Drupal website. httpd.conf is nothing to be scared of—we coverthread settings, keepalive, logging, and other useful configuration options for Apachehttpd. This chapter also discusses PHP configurations and the importance of using anopcode cache.
Chapter 19, Reverse Proxies and Content Delivery Networks, introduces the concept ofusing a reverse proxy to cache website content. We give detailed examples of how to useVarnish with Drupal, including specific Varnish Configuration Language (VCL) con‐figurations that can dramatically increase website performance. This chapter also coverscontent delivery networks (CDNs) and explains options for integrating Drupal with aCDN.
Ongoing TestingOne important lesson in this book is that website performance is not a one-time task;it’s something that needs to be done continually in order to have a website perform atits best and be able to scale to meet increasing traffic needs. Chapter 20, Load Testing,discusses load testing tools and the importance of ongoing testing in order to catchperformance issues before they become major problems.
xiv | Preface
www.it-ebooks.info

Where to Next?Wrapping up the book, Chapter 21, Where to Next?, provides some external resourcesto extend upon ideas presented in the book.
Conventions Used in This BookThe following typographical conventions are used in this book:Italic
Indicates new terms, URLs, email addresses, file and path names, and file exten‐sions.
Constant width
Used for program listings, as well as within paragraphs to refer to program elementssuch as variable or function names, databases, data types, environment variables,statements, and keywords. Also used for commands and command-line options.
Constant width bold
Shows commands or other text that should be typed literally by the user.
Constant width italic
Shows text that should be replaced with user-supplied values or by values deter‐mined by context.
This icon signifies a tip, suggestion, or general note.
This icon indicates a warning or caution.
Using Code ExamplesSupplemental material (code examples, exercises, etc.) is available for download athttps://github.com/tag1consulting/high-performance-drupal.
This book is here to help you get your job done. In general, if example code is offeredwith this book, you may use it in your programs and documentation. You do not needto contact us for permission unless you’re reproducing a significant portion of the code.For example, writing a program that uses several chunks of code from this book doesnot require permission. Selling or distributing a CD-ROM of examples from O’Reillybooks does require permission. Answering a question by citing this book and quoting
Preface | xv
www.it-ebooks.info

example code does not require permission. Incorporating a significant amount of ex‐ample code from this book into your product’s documentation does require permission.
We appreciate, but do not require, attribution. An attribution usually includes the title,author, publisher, and ISBN. For example: “High Performance Drupal by Jeff Sheltren,Narayan Newton, and Nathaniel Catchpole (O’Reilly). Copyright 2014 Tag1 Consulting,978-1-449-39261-1.”
If you feel your use of code examples falls outside fair use or the permission given above,feel free to contact us at [email protected].
Safari® Books OnlineSafari Books Online is an on-demand digital library that deliversexpert content in both book and video form from the world’s lead‐ing authors in technology and business.
Technology professionals, software developers, web designers, and business and crea‐tive professionals use Safari Books Online as their primary resource for research, prob‐lem solving, learning, and certification training.
Safari Books Online offers a range of product mixes and pricing programs for organi‐zations, government agencies, and individuals. Subscribers have access to thousands ofbooks, training videos, and prepublication manuscripts in one fully searchable databasefrom publishers like O’Reilly Media, Prentice Hall Professional, Addison-Wesley Pro‐fessional, Microsoft Press, Sams, Que, Peachpit Press, Focal Press, Cisco Press, JohnWiley & Sons, Syngress, Morgan Kaufmann, IBM Redbooks, Packt, Adobe Press, FTPress, Apress, Manning, New Riders, McGraw-Hill, Jones & Bartlett, Course Technol‐ogy, and dozens more. For more information about Safari Books Online, please visit usonline.
How to Contact UsPlease address comments and questions concerning this book to the publisher:
O’Reilly Media, Inc.1005 Gravenstein Highway NorthSebastopol, CA 95472800-998-9938 (in the United States or Canada)707-829-0515 (international or local)707-829-0104 (fax)
We have a web page for this book, where we list errata, examples, and any additionalinformation. You can access this page at http://oreil.ly/HP-Drupal.
xvi | Preface
www.it-ebooks.info

To comment or ask technical questions about this book, send email to [email protected].
For more information about our books, courses, conferences, and news, see our websiteat http://www.oreilly.com.
Find us on Facebook: http://facebook.com/oreilly
Follow us on Twitter: http://twitter.com/oreillymedia
Watch us on YouTube: http://www.youtube.com/oreillymedia
AcknowledgmentsThis book has been quite an undertaking for all of us, and we couldn’t have done itwithout the help and support of many people. First of all, thanks to all of the Drupalcontributors who have made Drupal into the amazing platform it is today. Specifically,we would like to thank our wonderful technical editors for their thoughtful reviews andideas: Fabian Franz, Rudy Grigar, and Mark Sonnabaum.
We’d also like to give a special thanks to Jeremy Andrews for his endless hours spentreviewing the book, for providing ideas for concepts to cover, and for constantly pushingus to provide better explanations for things we may take for granted. His encouragementand ongoing assistance with all aspects of the book were absolutely priceless. The bookwould not be anywhere as good as it is without him.
We also need to thank Tag1 Consulting, our employer, for providing us the flexibilityto work on the book over such a long period of time. And thanks as well to MeghanBlanchette, our O’Reilly editor, for pushing for us to write this book, and for putting upwith our seemingly endless delays.
From JeffFirst and foremost I need to thank my wife, Sara, for being so supportive and encour‐aging throughout this process, and also for her understanding throughout all of the latenights and weekends I spent cooped up in the office writing. Thanks also to all my familyand friends for your support and excitement about the book, in spite of the fact that itdoes not involve a zombie apocalypse.
This book was a true collaborative effort, and I really appreciate the hard work done byNarayan and Nat, who both brought their amazing expertise and insight. I can’t evenimagine how Nat was able to write so much content for the book even as he was in themidst of the Drupal 8 release as the branch maintainer.
Preface | xvii
www.it-ebooks.info

From NarayanFirstly I need to thank Jeff, who was the major motivation for getting this book doneand the driving force to keep it moving forward. Secondly, I must thank my very tolerantwife, Candice, who somehow didn’t get too upset at the concept of us doing just onemore thing. Lastly, we all very much thank Jeremy, Peta, and all of our coworkers atTag1 Consulting for creating the time for us to work on this.
From NatMassive thanks go to my wife Shoko and daughter Amile for putting up with yet anotherDrupal project, Jeff for keeping the book on track, Tag1 Consulting for interesting con‐sulting projects that allow me to spend more time on these issues than is probablyhealthy, and all of the Drupal core and contributed module contributors for workingon the software that both runs into these issues and also attempts to solve them.
xviii | Preface
www.it-ebooks.info

CHAPTER 1
Beginning a Performance Project
So you’re ready to jump in and start improving your website’s performance. This canbe a daunting task. There are so many services, underlying technologies, and possibleproblems that it can be difficult to pick a starting point. It is easy to run around in circles,checking and fixing many small issues but never addressing your major problems (oreven discovering what they are). Knowing where to start and which issues are of highpriority can be one of the most difficult parts of optimizing a site.
Due to these common issues of discovery and prioritization, good performance engi‐neers and system administrators tend to do a lot more gathering of metrics and statisticsthan most people think. A complete understanding of the problem points of a website(problem pages, blocks, or views) and server metrics during average- and high-loadsituations is a requirement for making good decisions. Whenever we approach a newinfrastructure or website project, the investigation and metrics collection period is oftenthe most important time and will determine how effective the entire optimizationproject is.
Getting Started with Performance ImprovementsWe will discuss tools and methodologies for collecting performance information in laterchapters. For now, let us assume we have a spreadsheet of problem pages or requestsand some server information (CPU, load, I/O usage, etc.) during some peak load peri‐ods. The next important step in optimizing a site is defining goals and usage patterns.This is important for similar reasons to having accurate metrics: it prevents you fromendlessly fixing issues that may be legitimate, but are not the problems preventing thesite from meeting its goals. For example, if you have a site that needs to serve 10,000pages a day to only anonymous users, you can review all of the Views for this site andensure they are all performing well, but it would be a waste of time when you could getbetter performance faster by ensuring the page cache is working effectively.
1
www.it-ebooks.info

Everything we have discussed so far is considered quite pedantic and seems to be littlemore than bookkeeping. As technical people, we like to walk into a bad situation, im‐mediately pinpoint the problem, and fix it in a few minutes. It’s nice when this works,but often it fails or succeeds only partially, or worse, temporarily. The methodology weare proposing of performing a robust discovery phase and having a lot of quality in‐formation (metrics, expected site usage, and goals) for the site is much better for boththe long-term sustainability of the site and your own longer-term sanity. You cannotalways immediately pinpoint the problem, but a method based on information andmetrics is always going to be effective.
There are a number of approaches that can be used to collect this information anddevelop a performance plan. However, we typically follow a straightforward approachthat attempts to focus on low-hanging fruit and the real site problems. We also tend tofocus on iteration, as often when you solve one large problem, it uncovers other issuesthat used to be hidden.
Let’s outline the steps involved in this process—we will go into more detail on each steplater in this chapter:
1. Measure and record the current site performance. This is your “performance base‐line,” which will be used to analyze potential performance improvements. Docu‐ment any known issues with the site, such as individual or groups of pages that areconsistently slow, servers that are always under high load, or anything else thatmight have an effect on performance or scaling. We will go into the tools and meth‐ods for doing this in later chapters, as its a very broad topic and can be a somewhatnebulous task.
2. Define goals and requirements for the site. For example, “The front page must loadin under two seconds for anonymous traffic,” and “A site search must not take morethan three seconds on average to return results.” The “must” and “should” wordingin these statements is important, as it separates requirements (“must”) and goals(“should”)—more on this in the next section.
3. Actually perform your review. This often involves running a load test, reviewingconfiguration files, profiling pages, and reviewing slow query logs. Many engineersconsider this the only step, but the problem with such an approach is that it lacksbaseline information and a structured list of goals, as defined in the previous twosteps. There will be many chapters in this book on the various topics that this stepencompasses.
4. Define a list of potential improvements based on the site goals and requirements,using the information gathered in the performance baseline and your review. Thelist should be prioritized based on a few factors:
• Does the item contribute to achieving a requirement or goal for the website?• What is the expected benefit of the change?
2 | Chapter 1: Beginning a Performance Project
www.it-ebooks.info

• What is the cost of the improvement, both in terms of staff time and any hardwareor software purchases that may be necessary for the change?
• Once an improvement has been made, what impact does it have?
If you are working for a client, step 4 is particularly important. However, even if you areworking for yourself or for your company, it’s incredibly important to develop a list ofpotential improvements and ensure they are both prioritized and tracked for effective‐ness. Returning to a site two or three weeks later without a good record of what wasdone previously and the impact of those changes will make your job much more difficult.
As to the prioritization of fixes, there is no hard and fast rule, but a good approach is towork on items that will give you the most bang for your buck—that is, those fixes thateither don’t take much effort compared to their impact or provide a vast improvement.
Establishing a Performance BaselineMeasuring current website performance will give you a baseline that you can compareto the performance after making a change. Knowing how the site was performing ini‐tially makes it easy to tell whether changes have had the expected effect, or when theyresulted in only a minor improvement—or worse, decreased performance! Dependingon your needs, determining the performance baseline could be as simple as trackingfull page load times for a selection of pages on your site, or as intricate as trackingmemory and CPU usage for key functions used to display one or more pages on yoursite. What’s important here is that you decide what measurements are important to you.If this is a first pass at improving the performance of a site, generally it will be sufficientto choose one or two pages of each type that you have on your site (e.g. “article categorydisplay,” “article,” “author bio,” “forum overview page,” “forum topic page”). For each ofthose types, you’ll want to measure some predefined set of data—what data is trackedwill vary based on your needs, but if you’re looking simply to improve page load time,there are a few data points that can be focused on to start:Time to first byte
This is how long it takes your server to start to deliver data back to the client afterthe client’s browser has requested the page from your site. It is at this point that theuser’s browser can begin displaying data on the screen and, more importantly, beginfetching CSS and JavaScript files.
Time for a full page loadThis is how long it takes for an entire page to be loaded in a user’s browser window.
Frontend display timesThis includes the JavaScript completion time, DOM load time, etc. We won’t coverthis in much depth in this book, as an entire books have been written on this subject.
Establishing a Performance Baseline | 3
www.it-ebooks.info

While frontend display times are very important for user interaction, a slow fron‐tend usually won’t bring down a backend server.
Before fully understanding the performance implications, many people assume that thefull page load time will be the most important factor in the site feeling fast to a user. Infact, the time to first byte can be much more important (there are exceptions, of course),because it’s at that point that the user’s browser starts working on displaying the datasent from your site. That’s not to say you should focus entirely on the time to first byte,though it’s quite important to at the very least look at both of these measurements.
Setting Goals for Website PerformanceOnce you have a good understanding of the website’s baseline performance and havestarted to track down some of the current bottlenecks, it will be possible to start settingsome well-defined and attainable performance goals for the site. Setting realistic goalsis important for a number of reasons:
• Performance improvements on a website are a continual process. Setting concretegoals allows for work to be split up incrementally.
• Defining a set of goals with site developers can help prevent the addition of featuresthat may be “nice to have” but have a serious adverse affect on performance. If goalshave been well defined and have buy-in from all involved parties, they can be re‐ferred to later as a reason why or why not to implement certain features and tech‐nologies on the site.
• If goals are arbitrarily set without knowing the current performance of the site orthe actual near-term requirements, you may set yourself up to fail with goals thatare impossible to achieve with the resources you have at your disposal. Always focuson reality, not what you would like reality to be.
Potential improvements could include (but are not limited to) the following:Reducing average page load time
This could be set as an overall goal for the site, and also more specifically for certainpage types or common entry points into the site (the front page, marketing landingpages, etc.). Example goals: “Decrease the average page load time for all pages acrossthe site from five seconds to three seconds. Average page load time for the frontpage should be under two seconds.”
Decreasing maximum page load timeAgain, this goal could be set overall for the site as well as for specific pages or pagetypes. Example goals: “The maximum page load time across the entire site shouldalways remain below eight seconds. Article pages should have a maximum pageload time of five seconds. The front page of the site should have a maximum pageload time of three seconds.”
4 | Chapter 1: Beginning a Performance Project
www.it-ebooks.info

Improving page load times for first-time visitorsHow long are your pages taking to load for visitors who do not have any of yourassets (think images, JavaScript, etc.) cached locally in their browsers? This can bedrastically different than page load times for visitors who have been to your siterecently and may have most of those items in a local browser cache. If first-timevisitors are important to you (and they likely are!), then it’s important to considerpage load performance specific to that group of users. Example goal: “The averagepage load time for the front page of the site should be under three seconds for first-time visitors and under two seconds for repeat visitors.”
Once you’ve created a list of performance goals for the site, you can start to look atspecific tasks that will help you to achieve those goals and problems with the currentsite preventing you from reaching those goals. Much of the rest of this book is dedicatedto giving specific examples of common slow points on Drupal websites and ways toimprove performance for those specific issues. As you start to dive in to make adjust‐ments to the site, always keep an eye on the goals and requirements that you havedeveloped. As you work, some of the goals may need to be adjusted because they wereeither too optimistic or perhaps didn’t take into account certain aspects of your site orinfrastructure that you are unable to change.
The Many Aspects of Drupal PerformanceWebsites—especially Drupal websites—are built up of multiple components, each ofwhich could be suffering from a performance problem. Some of the major aspects thatshould be examined are:
• Frontend performance: page rendering time in a site visitor’s browser• PHP execution time on the web server• Time spent for the web server to serve a request• Time spent fetching and storing items in the cache• Database query execution time• Network traffic for each link along the path of a request: user→web server→cache
server→database server, etcetera• External requests, either server-side or client-side—for example, code that calls an
external API (think Twitter, Facebook, etc.) or pulls in external files or images
All of these items contribute to the big picture of how a website performs. By breakingdown requests and analyzing the performance of each of these various pieces, we canisolate the worst-performing parts of the site and focus our improvement efforts onthose in order to get the most benefit from our work. In addition, understanding wherethe performance bottlenecks are can save you from blindly working on general perfor‐
The Many Aspects of Drupal Performance | 5
www.it-ebooks.info

mance improvements that may not have much effect on the overall performance of thesite.
For example, consider a page that takes five seconds to deliver the first byte of data toa client browser. Let’s say that one second of that is spent on the web server serving therequest and executing PHP, 3.75 seconds are spent on database queries for the page, and0.25 seconds are spent pulling items from cache storage. Now, it’s pretty clear that thereis not much benefit to be had by working on the caching layer. The best place to startperformance work in this case would be to look at the queries that are being run on thedatabase to figure out which of them are slow—we may be able to improve the queryspeed by changing the logic, or figure out a way to better cache the query results to avoidrunning queries repeatedly. Had we not broken down the different components, wecould have wasted a lot of time trying to improve PHP execution time or trying toincrease the speed of cached requests when those are not likely to give us much overallimprovement in the performance of the page.
We’ll get into more specifics on how to measure and analyze performance for variousaspects of a site later. It is a complicated topic, and one that much of this book is devotedto. For now, it’s just important to understand that there are multiple pieces contributingto overall page load performance. Understanding where the bottlenecks are makes itpossible to focus performance improvements on areas that will have the greatest effecton the overall page load time.
Creating a Prioritized List of ImprovementsDuring a performance review or site analysis, it is important to either have very detailednotes or to build your “prioritized list of improvements” during the review. As we havealready explained, a single page load is a complicated matter. We are all “standing onthe shoulders of giants” in the computer industry; those giants created the subsystems,drivers, architectures, services, caching daemons, httpd daemons, and opcode cacheswe rely on, and even Drupal itself. Although many were not particularly tall (Dries—the founder of Drupal pictured in Figure 1-1—is a notable exception), they are not calledgiants for nothing—each layer is immensely complex, some more so than others.
Due to this complexity, if you don’t consistently keep priority in mind and look for the“low-hanging fruit”, it is very easy to lose your way or forget something you’ve found.Perhaps while instrumenting the Apache process of your site, you noted that too manydirectory lookups are happening. However, if you have SQL queries on your home pagethat are taking five to six seconds to execute, are Apache’s foibles your highest priority?For every performance engineer solving client-facing problems, there is at least oneother optimizing something entirely pointless.
6 | Chapter 1: Beginning a Performance Project
www.it-ebooks.info

Figure 1-1. Dries Buytaert
Not only does keeping a priority list or priority-driven notes force you to focus on realproblems, but it also allows you to cross reference and remember what you’ve seen. Theissues you observe in different subsystems may be related, but it can be hard to drawthe correct correlations without the issues noted down. Not everyone can connect thedots entirely in his head.
Creating a Prioritized List of Improvements | 7
www.it-ebooks.info

Once you have your list of issues, you can review them and prioritize them based onwhat you believe are the most important issues, or the ones that will be very easy to solverelative to their impact. Because you started building them during the review, most ofthe list items should be fairly detailed and actionable.
8 | Chapter 1: Beginning a Performance Project
www.it-ebooks.info

CHAPTER 2
Frontend Performance
The principles of frontend performance apply regardless of the underlying applicationused to create a website. The browser receives an HTML document and, based on itscontents, downloads CSS, JavaScript, fonts, and images; it then renders the page usingall of these. The 14 rules defined by Steve Souders’s High Performance Websites (O’Reilly)remain a good reference point for examining the pages served by a site and identifyingareas for improvement (see this page for a refresher). Google’s PageSpeed and Yahoo!’sYSlow will quickly grade a single page of your site and identify the highest-priority areasfor improvement. For this chapter we’re going to assume you have a working grasp ofthe rules (cacheable headers, compression, minimizing HTTP requests, etc.) and, ratherthan discussing them, we’ll look at the challenges specific to developing Drupal websiteswhen implementing those rules.
Limiting HTTP RequestsDrupal provides CSS and JavaScript aggregation via a configuration option. This allowspotentially dozens of individual requests for CSS and JavaScript files to be reduced tojust a few. While enabling this option in production should be one of the first steps youtake to optimize frontend performance, there are several other steps you can take tominimize HTTP requests that require some more work on your part. Especially onmobile devices, or slow Internet connections in general, the number of HTTP requestscan have the most serious negative impact, taking into account both back- and frontendperformance. HTTP request latency applies for every file required to build a page, andcan be hundreds of milliseconds multiplied by the number of files on the page. Assumingyour code and infrastructure can scale to handle the traffic that comes to the site, thisshould be the very next thing you look at with regard to the overall user experience andperformance of the site.
9
www.it-ebooks.info

AuditsMany Drupal sites operate without any custom JavaScript and, if using a stock contrib‐uted theme or base theme, may only have a small amount of custom CSS. This, however,doesn’t mean that the site itself is running with a small amount of JavaScript or CSS, asboth core and contributed modules provide their own files. As with many other Drupalperformance issues, the most common cause of problems is particular combinations ofconfiguration and site structure and how these interact with modules that are unableto know exactly how they’re used on every individual site.
When identifying bottlenecks, select two or three pages of different types to start with.Ideally these will be the most popular types of page on the site—for example, articlepages or user profiles, as well as a landing page such as the front page.
What you audit depends on your priorities for optimization. When auditing, start bydisabling JavaScript and CSS aggregation, then view the pages as either an anonymoususer or an authenticated user. This allows you to see all the individual CSS and JavaScriptfiles being added to the page. Do not look for performance issues while logged in as anadministrator unless you’re specifically trying to find issues affecting administrators,since toolbars, contextual links, and the like add a lot of page weight that will often showup as frontend (and sometimes backend) performance issues, obscuring issues thataffect users without access to those features.
Once you’re ready, look at the CSS and JavaScript requests in a tool such as Firebug orChrome Developer Tools.
If there are no JavaScript-heavy features such as carousels or slideshows on these pages,the first thing to check is whether any JavaScript is loaded at all. If it’s not necessary,loading no JavaScript at all saves the most possible HTTP requests (no requests arebetter than any nonzero number of requests), as well as other overhead such as initial‐ization of jQuery.
Drupal 6 and Drupal 8 will not add any core JavaScript to the page if no modules orthemes add their own (this isn’t the case for Drupal 7 at the time of writing, but seehttps://drupal.org/node/1279226 for a core bug report). However, it’s often the case thatcontributed or custom themes will add small (or even large) JavaScript files to everypage for every user via the scripts[] property in .info files, or via hook_init().
In addition to serving pages without any JavaScript at all, Drupal 8 also makes it morelikely that pages can be served without jQuery. For basic event handling, DOM selection,etc., native JavaScript functions are often perfectly adequate with modern browsers, andcore JavaScript is being refactored to take advantage of these where possible. Scripts thatrequire jQuery should explicitly declare it as a dependency, and if you have only ahandful of .js files on a page but jQuery is one of them, look at whether both the filesthemselves and the jQuery dependencies within them are really necessary.
10 | Chapter 2: Frontend Performance
www.it-ebooks.info

If you’re not expecting to see any JavaScript on the page you’re looking at, take a noteof each filename, then grep the code base for where it’s added. Start with the files loadedlast, since the early files like jQuery and drupal.js may only be loaded due to depen‐dencies. While all pages on Drupal sites will include CSS, a very similar approach canbe taken when trying to reduce the amount of CSS loaded overall.
There are several common reasons why files might be added to a page despite not beingactually needed:
• The file has been added via the scripts[] or styles[] .info property, despite notbeing needed on every request. Try to find which markup the file actually affects,then file a bug report for the module on Drupal.org to add it conditionally via#attached instead. For example, if a JavaScript file is only used when nodes aredisplayed in full view mode, it can be moved from .info to hook_node_view() asfollows.Before:
example.infoname = Exampledescription = Example modulecore = 7.xscripts[] = js/example.js
After:
<?php/** * Implements hook_node_view(). */function example_node_view($node, $view_mode, $langcode) { if ($view_mode == 'full') { $path = drupal_get_path('module', 'example’') . '/js/example.js'; $node->content['foo']['#attached']['js'][$path] = array('every_page' => TRUE); }}?>
• The file is associated with a feature that is only available to users with a certainpermission but has been added to the page outside the permission check. File a bugreport for the module on Drupal.org to make including the file conditional on theaccess check.
• Often CSS and JavaScript files apply to more than one feature. Following coreguidelines for CSS organization ensures that admin-only CSS is only served toadmins, and that files are easier to override for themes. Similarly, with JavaScript,it’s worth evaluating if a file should be split up—aggregation puts it back togetherwhen needed anyway.
Limiting HTTP Requests | 11
www.it-ebooks.info

• Sometimes files are related to a specific feature but are still added site wide. This isusually an error, but in some cases, there might be CSS that applies to a search box,header menu, or similar feature that appears on every page, or a very high percent‐age of pages. Having this CSS in the site-wide aggregate saves it being duplicatedin each per-page aggregate, reducing their size and increasing the effectiveness ofthe browser cache. In general this makes more sense for CSS than JavaScript—allpages need CSS, but some might render without any JavaScript at all.
After reviewing the site with aggregation disabled, reenable it and view the pages again.This time it won’t be possible to see which individual files are being included, but insteadyou can look at the resulting aggregates of the pages and their comparative sizes.
A common problem with both the Drupal 7.x/8.x and Drupal 6.x aggregation strategiesis that they’re fragile when files are added incorrectly—for example, if they’re added indifferent orders by different modules, or if the every_page option is set for conditionallyadded files. This can have the result that even if very similar JavaScript or CSS filesappear in two or more pages, different aggregate filenames get created, resulting in lowercache hit rates, more bytes to download, and a greater workload server side generatingthe aggregates.
To track down issues like this, first compare the list of aggregate filenames, locate anyfilenames that are unique to any of the pages being compared, and then look at the sizeand/or contents of those files to see if they’re actually different. On a live site that’s beenrunning for some time, checking the number and date of aggregates in the css and jsdirectories can also be an indicator of how many unique aggregates are being created.One or two small aggregates differing between pages is expected if the JavaScript addedis genuinely different, but very minor changes between files or several files changingmay indicate an underlying issue.
A further option to reduce HTTP requests with JavaScript, assuming only minimalJavaScript usage on a site (i.e., no jQuery dependency), is to add it inline rather thanusing an external file. Drupal’s JavaScript API supports this via the inline option.
Image RequestsImages embedded in content via the <img> tag are relatively hard to optimize in termsof the number of requests. You can optimize images for bandwidth using image deriv‐atives, which ensure the images are scaled or cropped to the size they will be served at.Drupal 8 goes further by supporting responsive images via the Picture module (alsoavailable in Drupal 7 as a contributed module), so that the correct image derivative—and only that image derivative—is loaded based on breakpoints. For very image-heavypages, you may want to explore more advanced techniques like deferred image loadingvia JavaScript.
12 | Chapter 2: Frontend Performance
www.it-ebooks.info

For images loaded via CSS, there are more options. Go back to Firebug or ChromeDevTools to look for image requests; the paths will tell you whether they come fromcore, contributed, or custom modules, or themes.
Most Drupal 8 modules do not provide much default styling, with the exception ofcontent forms, administrative features and user-facing menus which do have someicons.
There are several approaches for reducing image requests:
• Image sprites combine several images into a single file, then use CSS to display onlythe specific image needed. Creating and maintaining sprites can be quite time-consuming, but tools like SASS allow for automation of this process.
• Images can be base64 encoded within CSS files using data-uri. This means theyare served as part of the CSS file itself rather than downloaded separately, saving anHTTP request for each image that’s inlined. Remember that the larger your CSS fileis, the longer it takes before the browser can download and parse it and move onto other things (like downloading images served via img tags), so this is a trade-offthat needs to be made carefully if at all. This is supported by a contributed modulefor Drupal called CSS Embedded Images that automatically inlines images whenthe CSS is preprocessed.
• Icon fonts allow for arbitrary images to be combined in a single font file. This hasthe same advantages as a sprite in terms of reducing HTTP requests, but since fontsuse vector graphics, it also allows the icons to be scaled or presented in differentcolors without any modification to the original image. Fonts can be embedded intoCSS using data-uri as well, saving a further HTTP request.
• Another approach is to use browser support for scalable vector graphics (SVG)directly. As with fonts, this allows for scaling, recoloring, etc., without modificationof the original image. Since SVG files are XML, it’s also possible to style the SVGitself with CSS. SVGs can be used via a URI, embedded into CSS via data-uri, orembedded into HTML using either data-uri or the SVG format itself, which pro‐vides a great deal of flexibility in terms of how they’re served.
Both icon fonts and SVG have significant advantages over the older techniques of spritesand base64 encoding of binary images; however, some older browsers don’t supportthem, so you may need to include a polyfill library if your site requires them.
MinificationDrupal provides very rudimentary on-the-fly CSS whitespace and comment strippingas part of the core aggregation support. There is no core support for JavaScript minifi‐
Minification | 13
www.it-ebooks.info

cation—files are concatenated together when aggregation is enabled, but the contentsare left unchanged.
This leaves three options for minifying/uglifying JavaScript files, as discussed in thefollowing sections.
Minification On the FlyDrupal 8 has added the Assetic library, which amongst other things provides supportfor minification of JavaScript and CSS via preprocessors. At the time of writing, thework to replace core’s own file aggregate generation with Assetic has not been comple‐ted; however, if this lands for Drupal 8, it will allow files served from Drupal to bepreprocessed via any of the pluggable backends that Assetic supports. It should be simpleto implement as a contributed project if support isn’t available in core. The main ad‐vantage of Assetic over previous on-the-fly preprocessors from contributed modules isthat it supports native JavaScript backends such as uglify.js. While uglify.js (which re‐quires Node.js) introduces an additional hosting requirement, the resulting minifiedcode is much more efficient than that produced by PHP preprocessors, which are notwell supported, use more server resources, and result in larger files.
Preminification for Modules/ThemesDrupal core ships with minified versions of jQuery and other external JavaScript libra‐ries. Minification does not yet happen for JavaScript provided by Drupal core itself, norfor many contributed modules and themes that provide dedicated JavaScript files. En‐suring that external libraries are shipped as their minified versions (or both minifiedand unminified) allows sites to serve these by default without taking any additionalsteps, but it does introduce overhead for core or contrib developers whenever a filechanges, and thus far there is not a system in place to support this. The Speedy moduleprovides minified versions (via uglify.js) of core JavaScript files, which is a good one-stop solution for core, even if it will leave contributed projects unminified until they’reindividually supported. Preminification also solves the problem of retaining licenseinformation in minified files, which is a requirement for open source JavaScript libraries.
Minifying During the Build ProcessIf you have automated code deployment, minification could be added as a step in build‐ing releases (this is also something that could be considered for Drupal.org projectpackages). This is really a site-specific version of using/contributing to the Speedymodule and is only mentioned here for completeness.
14 | Chapter 2: Frontend Performance
www.it-ebooks.info

CompressionServing files with gzip compression and respecting Accept headers allows file size to bereduced drastically. Drupal handles this via PHP for cached pages via a setting, andvia .htaccess rules for JavaScript/CSS aggregates (both gzipped and uncompressed filesare saved during the aggregation process, then the .htaccess rule rewrites them). Com‐pression for uncached HTML pages is not supported by core so needs to be handled atthe server level via mod_deflate or equivalent, in which case the PHP gzip support forcached pages should be disabled via configuration as well. You may want to disable PHPgzipping of CSS and JavaScript files as well and handle this at the server level. This canbe done via settings.php or variable_set() in Drupal 7, or via the configuration APIin Drupal 8. You will also need to edit your .htaccess to comment out the rules forrewriting filenames, since the Apache module will be handling serving the correct fileinstead. Note that there’s no UI provided for this in the administration screens. To seethe configuration options in Drupal 8, either review the aggregation code itself, or lookat system.performance.yml:
cache: page: use_internal: '0' max_age: '0'css: preprocess: '0' gzip: '1'fast_404: enabled: '1' paths: '/\.(?:txt|png|gif|jpe?g|css|js|ico|swf|flv|cgi|bat|pl|dll|exe|asp)$/i' exclude_paths: '/\/(?:styles|imagecache)\//' html: '<!DOCTYPE html><html><head><title>404 Not Found</title></head> <body><h1>Not Found</h1><p>The requested URL "@path" was not found on this server.</p></body></html>'js: preprocess: '0' gzip: '1'response: gzip: '0'stale_file_threshold: '2592000'
Cacheable HeadersDrupal sets cacheable headers for all CSS, JavaScript, and images, as well as for cachedHTML pages. The HTML max_age value of the Cache-Control header can be set viaadmin/config/development/performance or the configuration API; assets are set to havean Expires header of two weeks via .htaccess if mod_expires is enabled in Apache. Forsites that aren’t undergoing frequent releases, you may want to tweak this upward. If
Compression | 15
www.it-ebooks.info

you’re not using Apache, you’ll need to ensure that you handle cacheable headers forstatic assets in the web server you’re using.
CDNsContent delivery networks have two primary goals. First, they allow files (and potentiallywhole pages via custom configuration) to be served from a location as close as theirinfrastructure allows to the visitor requesting a site. Therefore, a site hosted in the USbut visited by a user in France may have all JavaScript, CSS, and images served fromservers in France, dramatically reducing the latency of those requests. As a secondarybenefit, they reduce the number of requests to your own infrastructure, freeing upbandwidth and server resources to serve only uncached requests that can’t be handledby the CDN.
See Chapter 19 for more information on CDNs.
Keep Third-Party Libraries Up to DateDrupal 6 and 7 have frozen versions of jQuery. This means that the latest stable Drupal6 release ships with jQuery 1.2.6 (released in 2008) and the latest stable version of Drupal7 ships with jQuery 1.4.4 (released in 2010). jQuery’s release schedule is considerablyfaster than Drupal core’s for major releases, which means its developers often dropsupport for the version of jQuery shipped with the latest stable version Drupal corewhile the new Drupal release is still under development. To compensate for this, thecontributed jQuery Update project exists: it includes more recent versions of jQuery,as well as replacing particular core JavaScript files dynamically if they’re incompatiblewith the newer versions. While sites usually install jQuery Update due to a frontendfeature that specifies it as a dependency, the jQuery team is constantly adding opti‐mizations to jQuery with each release. Simply installing jquery_update may result inboth a smaller file size and access to performance optimizations within jQuery itself,such as faster selectors.
Drupal 8.x at the time of writing includes jQuery 2.0.0, and unlike Drupal 6 and 7, it’sintended to update third-party JavaScript libraries as they become available with pointreleases of Drupal 8, with an option for a site to pin/downgrade its jQuery version tothe older one if necessary. This will be a first for Drupal core but may mean that jQueryUpdate is not necessary for Drupal 8 sites.
jQuery UpdatejQuery Update also provides an option to serve the minified jQuery file via Google’sCDN rather than from the module folder. If you’re not already using a CDN, this allowsquite a large file to be served via a CDN “for free.” There’s also the potential that sitevisitors will have visited other sites that serve the same jQuery version prior to visiting
16 | Chapter 2: Frontend Performance
www.it-ebooks.info

yours and already have it cached, although how likely this is depends on the trafficpatterns of your site’s visitors and overall adoption of the Google CDN. If you have afamily of sites all running Drupal with lots of traffic between them, the chances of thishappening might be increased.
However, this does mean an extra DNS request, a dependency on Google’s infrastruc‐ture, and an extra HTTP request, since jQuery will no longer be included in aggregates,so be aware that there are trade-offs in both directions.
External ScriptsRegardless of the quality and performance of Drupal core, contributed modules, andyour own custom module or themes, all of that optimization and thought can go towaste—or at least be cancelled out—as soon as you add analytics, social widgets, ad‐vertising, and similar external services to a site.
Services like these often drive either revenue or traffic (or both) to websites, and whenbuilding commercial or community websites, there’s often a lot of pressure (from eitherend users or business owners) to add as many as possible. This can result in manydifferent JavaScript snippets from different services being included, which in turn mayload other JavaScript files, CSS, and images.
All external services are different, but there are several rules of thumb that apply to most.We’ll look at some of them in the next section.
Single Points of Failure (SPOFs)When JavaScript is loaded synchronously, browsers block all rendering until the file hasfinished downloading. If an external service is down or having performance trouble,this may cause a script included on your page to take longer than usual to load, or failto load altogether.
Synchronous loading just means putting a normal JavaScript file in a normal scripttag:
<script>http://example.com/some/file.js</script>
If example.com is unable to serve the request in a timely manner, browsers will waituntil either it eventually serves the request, or the request times out before renderingthe full page. This can result in large blank sections below where the script is includedor even entirely blank pages, depending on the browser and the location of the scripttag, not to mention potential delays of 30 seconds or more. Most of the optimizationsin this chapter have focused on changes that are likely to save milliseconds, hundredsof milliseconds, or perhaps a couple of seconds at most; yet a single external script can
External Scripts | 17
www.it-ebooks.info

render a site unusable—potentially as unusable as an outage on your own infrastructure,in terms of the end user experience.
The SPOF-O-Matic browser plug-in by Patrick Meenan both flagslikely single points of failure and can simulate complete failure for anyexternal script it finds on your pages. This allows SPOFs to be foundeasily and provides an easy way to demo just how bad they are toanyone who might question the importance of handling externalscripts carefully!
Many of the more popular services now provide asynchronous snippets that will notblock page rendering; this is usually achieved by providing inline JavaScript, which thendynamically creates a script tag so that the JavaScript is loaded asynchronously.
Even scripts loaded asynchronously can block the browser onload event, on which realuser monitoring, analytics, and in some cases site functionality might rely. A furtheroptimization is executing the JavaScript within a dynamically created iframe so that it’sisolated from the parent window’s onload event. Note that techniques in this area changefrequently; some services still support (and advertise in their documentation) snippetsthey provided several years ago and that might be found on sites in the wild, and someservices have ignored these techniques and exclusively provide snippets that will causea SPOF.
To avoid this, ensure you audit sites for SPOFs; SPOF-O-Matic is great for this. Whenadding scripts, avoid any temptation to embed markup or script tags directly into apage.tpl.php, head.tpl.php, or any other template or custom block, and use Drupal APIssuch as #attached and drupal_add_html_head() instead. Better still, if a contributedmodule supports the service, consider enabling the widget or analytics via that moduleinstead of custom code, as the contributed project has a better chance of keeping upwith newer versions of the snippet than you do.
As well as SPOFs, it’s also worth checking for cacheable headers on any assets that scriptsload themselves. Frontend audits of sites have often found CSS or secondary JavaScriptfiles from external services loaded without minification or compression, and withoutcacheable HTTP headers—whoops!
18 | Chapter 2: Frontend Performance
www.it-ebooks.info

For social widgets in particular, also consider their usage on the site itself. Most sitespresent lists of content on a single page, and it’s quite possible to have several socialwidgets enabled for each node teaser on such pages. For example, let’s take a pageshowing 20 node teasers. If widgets make requests back to services to load informationsuch as Like/comment/+1 counts, that’s 20 times as many of those requests, as well asthe JavaScript itself being executed 20 times for each request. A poorly optimized widgetthat appears once is bad enough, but when there are 20 of the same thing on a page, itcould go from a sluggish response to crashing a browser.
Single Points of Failure (SPOFs) | 19
www.it-ebooks.info

CHAPTER 3
Drupal Performance Out of the Box
Drupal provides several features and configuration options both in the core install andin contributed modules that can affect a site’s performance and scalability. Making useof these can provide dramatic improvements in site performance compared to Drupal’sdefault settings. While many of these settings are essential when running a large Drupalwebsite in production, they are not enabled by default on new installs and can easily beforgotten when moving a site from development to production. It’s therefore quitecommon to see newly launched sites with one or more configuration options disabled,leading to performance and scalability issues that could have been avoided with, in manycases, just a few minutes work.
In addition to modules and configuration options that provide quick wins for improvingperformance, we’ll also discuss some common pitfalls.
Page CachingThe majority of requests served by a Drupal site will either be requests for full HTMLpages served to browsers or read-only requests for content in other formats, such asRSS or JSON-LD. Serving a request from Drupal involves the following:
• Parsing the request• Loading various necessary services and modules• Locating the correct route controller and executing it• Rendering in the desired format
The single biggest improvement to application performance that can be made is simplyto skip as many of these steps as possible via page caching. When a request comes in,the URL itself (and other request context in Drupal 8) is used as a cache identifier. If
21
www.it-ebooks.info

there’s a cache hit, the output is sent from the cache rather than built from scratch inPHP.
While cached pages are served in a fraction of the time of a “normal” Drupal request,how much benefit a particular site might get from page caching varies greatly based onsite usage. Understanding the strengths and limitations of page caching is importantwhen considering more advanced optimization techniques.
When Should You Use Page Caching?As a general rule of thumb, page caching is effective as long as the time saved by cachehits exceeds the overhead of having page caching enabled for cache misses.
Let’s take an example of a site with a very low cache hit rate—say, a 1:30 hit/miss ratio.Note that all the numbers here are entirely for illustration purposes and don’t necessarilyreflect any real websites:
Time to serve a page without caching: 300msOverhead of page caching on cache misses: 2msTime to serve a page from cache: 5ms
The 30 cache misses add an additional 60 ms across all requests (time spent checkingand then writing back to the cache).
However, the single cache hit saves 295 ms compared to building the page from scratch,meaning that there is a net gain of 235 ms across all requests even with such a low hitrate.
The numbers will vary dramatically depending on the site, although 300 ms can be quiteconservative to generate a full page on a complex site.
There are various types of sites and traffic patterns that can lower hit rates or make pagecaching unviable:Authenticated traffic
Page caching does not work if a visitor has an authenticated PHP session. By default,Drupal customizes pages for authenticated users, for example, displaying theirusername or administrative links based on their roles. A site that has 100% au‐thenticated traffic—for example, a private intranet or ticket tracker—will not getany benefit from full page caching.
Breadth of contentIf a site has a large number of articles or similar content and regularly gets trafficto this content via search engine referrals, external links, crawlers, etc., page cachingcan be of limited value. To show this contrast, consider that one page visited 1,000times within the length of the cache TTL will give 999 cache hits, whereas 1,000pages visited once each during the same period will give 0 cache hits. Many siteswill have traffic patterns that encompass both of these extremes. Due to the relatively
22 | Chapter 3: Drupal Performance Out of the Box
www.it-ebooks.info

low cost of writing a page to cache versus building it each time, it’s usually worthenabling page caching.
Frequent updatesBy default the page cache is invalidated every time content is posted, deleted, orupdated on the site. This means you can enable page caching without being con‐cerned that site visitors will see out-of-date content. However, it also means that asite that is updated every minute will invalidate the entire page cache every minute,vastly reducing the chance of a cache hit. On the other hand, if you have infrequentlyposted content, flurries of activity with long pauses in between, or updates at par‐ticular times of the day, page caching will be effective for the bulk of the time. Thissituation may be improved for both cases in Drupal 8, which has introduced cachetags for smarter cache invalidation. Cache tags allow cache entries to be associatedwith the specific content entities that are rendered so that they can be invalidatedwhen those entities are updated or deleted; however, at the time of writing, this hasnot been integrated with the page cache.
PHP sessions for anonymous usersThe page cache is bypassed for any anonymous users with a PHP session. SinceDrupal 7, PHP sessions are initialized on demand when something is written to$_SESSION, so whether a user has a session depends on enabled code and useractivity. Actions such as adding an item to a shopping cart often trigger a PHPsession, and this is something to be generally aware of when writing code for customor contributed modules.
Customized content based on request parametersSome sites customize the user experience for anonymous users at the same path.This may involve using browser settings for preferred language to determine whichtranslation of a text to show, showing region-specific content based on IP address,changing rendered output based on a cookie, switching to a mobile-specific themebased on user agent, or showing content in different formats based on Acceptheaders. Since the path is used as the cache key, Drupal is only able to cache andserve one copy of the content, meaning that users see incorrect content when sucha feature coexists with core page caching. Drupal 8 natively handles Content-TypeAccept headers as part of the page cache key, so that different versions of a pagewill be saved for different content types, but it does not handle the other cases yet.
Internal Page CachingDrupal core provides its own internal page cache. The configuration option is accessedvia admin/config/development/performance and allows the full rendered HTML outputto be stored using Drupal’s own cache API. When the option is enabled, Drupal loadsand executes the minimum possible PHP code to check the cache item and serve the
When Should You Use Page Caching? | 23
www.it-ebooks.info

page request. This can require as little as one database lookup, meaning pages can beserved from PHP in a matter of a few milliseconds.
The configuration settings $conf['page_cache_invoke_hooks'] = TRUE and$conf['page _cache_without_database'] = TRUE allow Drupal 7 to skip even moreof its usual bootstrap when serving cached pages, so that pages may be served withoutany database or cache lookups except for the page cache item itself.
This can make the difference between a site being able to serve tens of requests persecond or hundreds, including in shared hosting environments.
Drupal also provides an option to compress cached pages. This makes use of gzip com‐pression when the client supports it, which can dramatically reduce the payload ofHTML sent to the browser. If you have control over your server configuration, however,you may want to enable compression within your web server or reverse proxy insteadof from within Drupal. Drupal’s own page compression only works for pages servedfrom the internal page cache, whereas mod_deflate and similar work for all requests tothe site, whether cached or not.
Reverse Proxy CachingThe “Expiration of cached pages” option is located at admin/config/development/perfor‐mance. Setting this option affects the max_age value of the Cache-Control header sentby Drupal, which allows reverse proxies to cache pages. The most common reverseproxy used for Drupal sites is Varnish, so we’ll use that as the example here; however,many of these assumptions also apply to other caching options such as serving pagesvia a CDN, or Nginx proxy caching.
Using a reverse proxy such as Varnish to serve cached pages has advantages over theinternal page cache, since Varnish is able to serve the entire page request without havingto call back to Apache and PHP. This significantly reduces server load by completelyavoiding the web server, PHP, and the database. Note that Varnish is not typically avail‐able in a shared hosting environment and may not be an option for everyone, althoughmany Drupal-specific hosting providers do offer it.
When serving cached pages, there is one limitation that Varnish has compared to Dru‐pal’s internal page cache: Drupal, by default, can’t expire pages from Varnish when con‐tent is updated.
There are two options for handling this:
1. Set up Drupal to purge Varnish entries via the command interface or a PURGE HTTPrequest based on updates to the site. This requires a custom Varnish configuration,so it may not be available to all site owners. Assuming you have this option, though,contributed projects such as the Varnish HTTP Accelerator Integration module orthe Purge module make it easy to set up your Drupal site to purge items in Varnish,
24 | Chapter 3: Drupal Performance Out of the Box
www.it-ebooks.info
and more granular purging can be enabled via projects such as the Expire or CacheActions or CacheTags modules.
2. Set the max_age to a low value, such as five minutes, while keeping the internal pagecache enabled. This keeps pages fresh in Varnish at the cost of a lower cache hitrate, while ensuring that Drupal only builds a full page from scratch when necessary.However, it requires some additional storage since pages are cached in two loca‐tions.
CSS and JavaScript AggregationFrontend performance best practices recommend combining page resources into as fewrequests as possible, and Drupal core provides an option to do exactly this out of thebox. CSS and JavaScript may be added to pages by Drupal core; any enabled core, contrib,and custom modules; and themes. By default, each file is added to the page individuallyin the HTML markup, meaning potentially dozens of HTTP requests on each page aseach file is requested individually by the browser. Aggregation in Drupal has particularchallenges that make it more complex to get this right than it might be for a custom webapplication. The assets added to the page depend on:
• Which modules are enabled• Whether the enabled modules define global assets to be added to every page
and/or conditional assets added only on certain types of request• Which theme is active for the request, and whether that theme defines global or
conditional assets
Therefore, when assets are added to the page, they’re added with particular metadata,and with information about whether they’re part of the base application, from a module,or from the theme. The aggregation logic in Drupal 7 breaks these into the followinggroups:
• Assets from System module added on every page• Assets from System module added conditionally• Module assets added on every page• Module assets added conditionally• Theme assets added on every page• Theme assets added conditionally
In Drupal 8 these are being consolidated into two groups, a change that may be back‐ported to Drupal 7:
CSS and JavaScript Aggregation | 25
www.it-ebooks.info

• Assets added on every page• Assets added conditionally
Files will not be aggregated if they define custom attributes or a specific media type.
Separating files that are added to every page from those added conditionally reducesthe potential that users will download multiple large aggregates containing lots of du‐plicate assets as they browse around different pages of the site. This was the case withDrupal 6’s aggregation strategy, which relied on a single aggregate per page.
Two other behaviors are enabled when CSS and JavaScript aggregation are switched on.First, Drupal will write gzipped versions of each file and try to serve them to clients thataccept gzipped content via default .htaccess rules. You may want to consider disablingthis behavior in .htaccess if already using mod_gzip/mod_deflate or equivalent.
Additionally, CSS files are stripped of whitespace and comments. No preprocessing isdone for JavaScript files, but several core JavaScript files are already minified, and theSpeedy module helps by replacing those that aren’t with minified versions.
LoggingAlso provided by core but requiring a certain level of control over your hosting envi‐ronment is the syslog module. Drupal enables the database logging (dblog) module bydefault, which directs all watchdog() calls to the database. Modules that log verboselyor that generate PHP notices and warnings can cause a large number of database writes.Verbose logging and PHP errors should be fixed at source, by auditing the logs period‐ically and fixing custom code or submitting patches to contributed code to avoid thelogging or errors. Switching to syslog allows any remaining or unexpected messages tobe logged by the operating system rather than the database, which can help to reduceoverall load on an overworked database server.
The Cache and Other Swappable StorageDrupal’s cache API (used for internal page caching, as well as many other things neededduring the course of a request) uses the database storage implementation by default. Aswith logging, simply setting up the cache to write to somewhere else will take some ofthe load off the database server. Additionally, some cache backends have further benefitsover database caching, such as improved performance or the ability to scale horizontally.Less frequently accessed but equally swappable are the queue and lock storage backends.
Core doesn’t provide a useful alternative storage implementation (except for a null im‐plementation useful for development, or if you believe the YouTube video “MongoDBIs Web Scale”), but contributed projects are available providing support for Memcache,Redis, MongoDB, APC, and Files.
26 | Chapter 3: Drupal Performance Out of the Box
www.it-ebooks.info

CronDrupal core and many contributed modules rely on hook_cron() for tasks such asindexing or garbage collection. Up until Drupal 7, site administrators were requiredeither to set up a cron job to execute hook_cron() on their servers or to install thePoormanscron module, which triggers the cron job automatically via PHP upon thefirst request after a certain time limit. If neither of these was set up, garbage collectiondidn’t run, which could lead to watchdog and cache tables growing indefinitely as ex‐pired items were never cleared up.
From Drupal 7, the functionality of the Poormanscron module was moved into coreand is enabled by default. Drupal will execute these periodic cron jobs inline during apage request every three hours, meaning the user that triggered the cron run may havepage serving delayed by seconds or minutes while the various jobs finish.
To avoid both of these scenarios, ensure that Drupal cron is configured to run frequently.This can be done using a cron job or a more advanced job scheduler, such as Jenkins.Cron also has high resource/memory requirements, so it should be run via drush toavoid taking up a web server process and artificially inflating PHP memory limit re‐quirements with mod_php.
ViewsViews (both the Drupal 8.x core version and the Drupal 7 contributed module) shipswith a built-in time-based caching system, while additional modules can also providealternative caching implementations.
Caching settings are located under the advanced section in the Views UI. After enablingcaching, there are two settings available:Query results
This caches only the results of the main listing query configured in the View, usingthe query itself as the cache key. Views allows very complex queries to be created,and caching the results is the quickest way to reduce the performance impact of thequeries on a site.
Rendered outputThis caches the rendering of the items in the View, once the results have beenretrieved. This can also be expensive—it may involve loading entities, running ad‐ditional queries for field values, as well as invoking the theme system. Since thecache is time-based, an entity update such as changing a node title won’t be reflectedin the cache until the items have expired.
Cron | 27
www.it-ebooks.info

Where possible, both of these should be set to the maximum possible time. If you’reconcerned about cache coherency, setting a longer value for query caching and a shortervalue for rendered output is a good compromise.
Configuring caching for Views is often forgotten in the process of site building, and thisis one of the first simple changes to look at making (after page caching) when a site runsinto performance issues.
If you want to ensure that you never forget to enable caching for aView, consider installing the Views Cache Bully module, which enfor‐ces time-based caching on any View where it’s not configured.
28 | Chapter 3: Drupal Performance Out of the Box
www.it-ebooks.info

CHAPTER 4
Drupal Coding for Optimal Performance
One of the great things about Drupal is the ease with which you can extend or overridecore functionality in order to customize it for your specific needs. However, if you arenot careful with how you code, you may introduce a huge performance bottleneck intoyour contributed or custom module. This chapter will give an overview of Drupal APIsrelevant to performance and scalability, common coding best practices, and pitfalls tobe aware of when trying to approach common tasks.
Context MattersBefore discussing the APIs and patterns that Drupal provides, it’s worth discussingwhich types of issues are often introduced when writing Drupal code.
Performance and scalability issues in code can affect CPU, memory, filesystem, database,and network usage, either individually or in combination. All code uses at least someCPU and memory, and all sites will access the database and filesystem and potentiallymake network requests. Whether any of these turns out to be a performance bottleneckis always down to context.
There are no hard and fast rules about what makes code “fast” or “slow”—exactly thesame code could be acceptable in one situation but not in another, and performanceoften needs to be balanced against other programming issues such as testability, read‐ability, and maintainability.
When writing or reviewing code, it’s important to think of the context the code will beexecuted in—both the immediate use case and whether it might also be applied to othercontexts. The following are some general questions to ask, before you start trying tooptimize at all:
• Does the code get executed on every request?
29
www.it-ebooks.info

• Could it run more than once during a request? If so, a few times, or hundreds orthousands?
• If the code runs less frequently, will it affect end user performance? And how criticalis end user performance in that case?
• Does the code have side effects that could affect the performance of other requests,such as writing to the database or flushing caches?
• Is the code an isolated unit, or will it be affected by other code or the configurationand state of the Drupal installation it runs on? For example, the amount of content,users, themes, or modules installed can dramatically change the characteristics ofhow code performs.
Only after considering these questions should you attempt to apply one or more of theapproaches outlined here.
False OptimizationsIt’s entirely possible to make the performance of code worse by “optimizing” it. Thishappens when additional code is added to avoid expensive processing, but the expensiveprocessing happens anyway. The result is that both the original expensive code and thenew code run, adding additional overhead to an already bad situation.
An example of this is the fairly common micro-optimization of replacing array_key_exists() with isset(). (Please note that this is used only as an example, and we’re notexplicitly recommending doing so!):isset()
This is a language construct that tells you whether a variable is set or not, and returnsfalse if that variable is explicitly set to NULL.
array_key_exists()
This is a function that tells you if an array key exists regardless of the value.
Function calls in PHP have more overhead than language constructs, so isset() takesless time than a function call, and while the semantics are different, they can be usedinterchangeably if you don’t need to explicitly check for array keys set to NULL. Hence,a common micro-optimization is to use isset() unless it’s absolutely necessary to checkfor NULL.
Let’s assume you had some code that definitely needed to use array_key_exists()because of the NULL check, but you wanted to try to run the faster isset() first, to skipthe function call when it’s not needed. You might write code like this:
<?php$array = array('foo' => NULL);
30 | Chapter 4: Drupal Coding for Optimal Performance
www.it-ebooks.info

isset($array['foo']); // returns FALSE.
array_key_exists('foo', $array); // returns TRUE.
isset($array['foo']) || array_key_exists('foo', $array); // returns TRUE.?>
The last example is semantically identical to just an array_key_exists() call, but inthe case that $array[‘foo’] is set to a non-NULL value, only the isset() check needsto be made, avoiding the more expensive function call.
However, if $array[‘foo’] doesn’t exist or is set to NULL, then the code actually has todo more work—checking isset() then the array_key_exists(), as well as the ||operator—all of which is going to be slower than just running array_key_exists() inthe first place!
The only way to know the effect of this is to create a realistic scenario or test on a realinstall, and see which code execution path is actually the most common. This comesback to context—it’s not so much the content of the code itself that determines its per‐formance, but how exactly it is executed.
Whether this kind of optimization is a problem depends on the relative performanceincrease you hope to gain.
For example, when checking access rights, you may need to check an administrativepermission via user_access() as well as access permissions based on an entity ID,which requires loading the entity via entity_load() first. Both checks are necessaryregardless, but the order is important.
While very few users might have the administrative permission, a call to user_access() takes a fraction of the resources that loading and access-checking an entity doesand won’t cause a measurable delay. It’s worth doing the cheaper check first even if thesecond, more expensive check will run too.
This is the same with almost any pattern that attempts to circumvent code executionrather than completely rewriting it. For example, adding persistent caching to a functionthat is a cache miss in 99.9% of cases will mean extra time spent checking and writingto the cache, as well as extra space being taken up in cache storage, on top of the originalcode being executed. However, if the code being executed is very expensive, then theoverhead of cache misses may well be outweighed regardless.
With this in mind, we’ll first cover a common task for Drupal custom and contributedmodules, and look at ways to ensure that this task is executed as fast as possible. Thenwe’ll move on to the APIs that Drupal provides specifically to aid with performance andscaling.
False Optimizations | 31
www.it-ebooks.info

Listing EntitiesWhether it’s on the front page of a blog or in a gallery of images or a comment thread,much of the work done on a Drupal site involves getting a list of entities and thenrendering them.
There are two APIs introduced in Drupal 7, and only slightly changed in Drupal 8, thathelp with this: entityQuery() and entity_load_multiple().
entityQuery()Rather than a direct database query to entity and field tables, EntityQuery() relies ona storage controller to handle building and executing the query for the appropriate entitystorage backend. This has the advantage that any query run through entityQuery() isstorage agnostic, so if you’re writing a contributed module or working on a site whereit might be necessary to move to alternative entity storage in the future, all your querieswill transparently use the new storage backend without any refactoring. EntityQuery() can be used whether you’re writing queries by hand in custom code or via theentityQuery() Views backend.
Multiple Entity LoadingOnce you have some entities to list, you’ll need to load and then render them.
A common pattern would be to loop over each node and load them individually:
<?php/** * Provide an array of rendered entities given the IDs. * * @param array $ids * The entity IDs to load * * @return $rendered_entities * The array of rendered entities.function render_entities($ids) { $rendered_entities = array(); foreach ($ids as $id) { $rendered_entities[$id] = entity_view(entity_load($id)); } return $rendered_entities;}?>
Drupal 7 introduced multiple entity loading and rendering so that tasks such as fetchingfield values from the database could be done once for all nodes with an IN() query ratherthan executed individually:
32 | Chapter 4: Drupal Coding for Optimal Performance
www.it-ebooks.info

<?phpfunction render_entities($ids) { $entities = entity_load_multiple($ids); return = entity_view_multiple($entities);}?>
By using the multiple load and view functions, assuming 10 nodes need to be loadedand rendered, 10 similar queries to the same table can be reduced to just one. Since anindividual node load could require 10 or 20 database queries, this can result in dozensor hundreds of database queries saved when loading and rendering multiple nodes atthe same time.
Note that this applies to hook implementations as well; for example, hook_entity_load() acts on an array of entities.
One often overlooked hook is hook_entity_prepare_view(). Often, custom themeswill need to add fields from user accounts/profiles when rendering nodes or comments—this could be the user’s full name, avatar, registration date, etc. A common pattern forthis is preprocess. Let’s take nodes as an example:
<?phptemplate_preprocess_node(&$variables) { $node = $variables['node']; $variables['account'] = user_load($node->uid); // Set up custom variables based on account here.}?>
When rendering several different nodes or comments by different authors, this patterncan result in a lot of round trips to the database as each account is fetched individually.The following example provides the same functionality while resolving the performanceissue:
<?phphook_entity_prepare_view($entity_type, $entities) { if ($entity_type != 'node') { return; } $uids = array(); foreach ($entities as $entity) { $uids[] = $entity->uid; } $accounts = user_load_multiple($uids); foreach ($entities as $entity) { $entity->account = $accounts[$entity->uid]; }}?>
Then $entity->account is available in preprocess:
Listing Entities | 33
www.it-ebooks.info

<?phptemplate_preprocess_node(&$variables) { $account = $variables['node']->account;}?>
CachingCaching is often the quickest way to solve a performance issue. By adding caching in aparticular code path, you can ensure that it will only be executed on cache misses.
Before adding caching, though, there are a few things to consider:
• Is it possible to optimize the code so that it doesn’t need to be cached?• Is there already caching of the code at a higher level, for example page caching, that
might affect the hit rate?• Will the cached code path be considerably quicker than the current code path?• Does the cache need to be cleared on particular events? Is it OK for it to be stale
sometimes?• Is the code run multiple times with the same output during a single request?
Static CachingWhen code is run multiple times per request, a common optimization is to add a staticcache around it. For example, you might rewrite the following code:
<?phpfunction my_function() { return something_expensive();}
as
<?phpfunction my_function() { static $foo; if (!isset($foo)) { $foo = something_expensive(); } return $foo;}?>
Because $foo is declared as static, it will be held in memory for the duration of therequest regardless of how many times the function gets called. This means once thisfunction has run once, it will run the isset() check and then immediately return.
34 | Chapter 4: Drupal Coding for Optimal Performance
www.it-ebooks.info

While it only takes a couple of lines of code to add a static cache, doing so has impli‐cations that aren’t always immediately obvious.
Let’s look at the code inside something_expensive():
<?phpfunction something_expensive() { return friends_count($GLOBALS['user']);}?>
Whoops. If $GLOBALS[‘user’] changes during the request, then something_expensive() will return different output. This often happens during automated tests usingDrupal’s simpletest adaption, or in a drush process that might be sending emails tomultiple different users.
It’s not impossible to fix this, of course. For example, we can key the cache based on theglobal user’s ID:
<?phpfunction my_function() { static $foo; global $user; if (!isset($foo[$user->uid])) { $foo[$user->uid] = something_expensive(); } return $foo[$user->uid];}?>
Now, regardless of how many times the global user object is swapped out during therequest, our function will return correctly, whilst still statically caching the results.
But the problems don’t end there. What if the number of friends the user has changesduring the request as well? This might well happen during a functional test or a long-running drush job. Additionally, this is where memory usage starts to be a problem: adrush job processing one million users could eventually end up with a million items inthis static cache.
Drupal core has a solution for this in the form of the drupal_static() function. Thisoperates similarly to static caching, except that the static cache can be accessed fromdifferent functions, both for retrieval and for reset.
Now our function looks like this:
<?phpfunction my_function() { // Only this line changes. $foo = &drupal_static(__FUNCTION__); global $user; if (!isset($foo[$user->uid])) {
Caching | 35
www.it-ebooks.info

$foo[$user->uid] = something_expensive(); } return $foo[$user->uid];}?>
Code in unit tests that updates the user’s friends count or needs to reclaim some PHPmemory can then call drupal_static_reset(‘my_function’) to empty the staticcache.
Since drupal_static() is a function call, it has a lot more overhead than declaring staticand including an isset() check. This can lead to a situation where static caching isadded to micro-optimize a function, then converted to drupal_static() for testingpurposes, which leads to the function being slower than when it had no caching at all.If you absolutely need to use drupal_static() and your function is going to be calleddozens or hundreds of times during a request, there’s the drupal_static_fast pattern:
<?phpfunction my_function() { static $drupal_static_fast; if (!isset($drupal_static_fast)) { $drupal_static_fast['foo'] = &drupal_static(__FUNCTION__); } $foo = $drupal_static_fast['foo']; global $user; if (!isset($foo[$user->uid])) { $foo[$user->uid] = something_expensive(); } return $foo[$user->uid];}?>
This adds testability and performance at the expense of quite a bit of complexity.
There are two issues with my_function() now. One is a development process issue, andthe other is architectural.
In terms of process, if we look back at the original function, we can see it’s only a wrapperaround something_expensive(). While a real example probably wouldn’t be a one-linewrapper, if the only thing that needs caching is something_expensive(), this isn’t theright place to add that caching. What we should have done was add the caching directlyto something_expensive(), which also knows about any global state it depends on andany other factors that might influence the result (and, if you’re lucky, is in a contributedmodule rather than your custom code).
When you add caching to a wrapper rather than to the function itself, the following badthings happen:
36 | Chapter 4: Drupal Coding for Optimal Performance
www.it-ebooks.info

• Any other code that calls the function (here, something_expensive()) does not getthe benefit of the static caching.
• If the function or another function that calls it adds static caching at a later point,the same data will be added to the cache twice, leading to both higher memory usageand potentially hard-to-find cache invalidation bugs.
From an architectural/readability perspective, we can see the gradual change from avery simple function to one that is balancing various variables in global state. A majorchange in Drupal 8 has been the migration from procedural APIs to object-orientedcode based on dependency injection. Most classes are loaded via a factory method orplug-in manager, or accessed from the dependency injection container. When this isthe case, simply using class properties is sufficient for managing state between methods,and no static caching is necessary at all.
Persistent CachingDrupal core ships with a rich caching API, defaulting to database caching but withcontributed support for files, Memcache, Redis, MongoDB, APC, and other backends.
While static caching allows code to skip execution when called within a single PHPrequest, persistent caching is shared between PHP processes and can retain data foranything from a few seconds to several weeks.
The Cache interface is well documented on the Drupal API site, and there are numerousexamples of basic usage in core modules. Rather than duplicating that information here,we’ll discuss some of the lesser known features and ones new to Drupal 8.
Cache chainsA new feature in Drupal 8 is the cache chain backend, a means of stringing togetherdifferent cache storage backends in a way that is transparent to the calling code. Thisfeature is primarily designed for combining two persistent storage backends together—for example, APC and database caching—in order to get the best of both. With anAPC and database chain, the cache will check APC first and return immediately if anitem is found. If not, it will check the database and then write back to APC if the itemis found there; and on cache misses, it will write to both. It’s also possible to use thememory backend shipped with Drupal core and any other persistent backend to emulatethe static + persistent caching pattern shown earlier, without the code complexity.
Cache binsDrupal core defines several different cache bins, including “bootstrap” for informationrequired on every request, the default cache bin, and use-case-specific bins such as“page” which is only used for cached HTML pages. The cache API not only allows forstorage to be swapped out but also allows it to be changed for each cache bin, via the
Caching | 37
www.it-ebooks.info

$conf[cache_backends] variable in Drupal 7 and the dependency injection containerin Drupal 8.
The bootstrap cache bin is designed for items needed for every request; it’s used pri‐marily by low-level Drupal APIs such as the theme registry or hook system. The cacheitems in this bin tend to be invalidated infrequently—often when a module is enabledor disabled—and since they’re requested all the time will have an extremely high hitrate.
On the other hand, the “block” cache bin is used to cache the output of Drupal’s blockssystem. Blocks may have different cache items per role, per user, and/or per page, whichcan result in hundreds of thousands or more potential entries in the bin. The bin is alsocleared often on content updates, so it has a high insert/delete/update rate.
In most cases, sites will want to set up a single cache backend such as Memcache orRedis to handle all cache bins, but the option is there to use different backends withdifferent bins if desired.
When using the cache API, you’ll likely use the default cache bin, or create a custombin. A custom bin should only be used if there’s going to be a very large amount of datato cache.
getMultiple()/setMultiple()/deleteMultiple()As with entity loading, the cache API allows for loading, setting, and deleting multiplecache objects at once. Any situation where you know the cache IDs of multiple objectsin advance is a candidate for using these methods, and many different storage backendsnatively support multiple get, allowing a single round trip to the cache storage and ashorter code execution path.
Cache tagsA new feature of the core cache API in Drupal 8 is cache tags.
There is often confusion between cache tags as a concept and cache IDs, so let’s explaincache IDs first.
When creating a cache ID in Drupal, the following conventions are important:
• Use the module name or another unique prefix at the start of the cache ID to avoidnaming conflicts with others.
• Where a cache ID depends on context, include enough information about thiscontext in the ID to ensure uniqueness. That is, for a cache item that varies per user,you might use:
<?php $cid = 'my_module:' . $uid; ?>
If it varies by language as well, then use:
38 | Chapter 4: Drupal Coding for Optimal Performance
www.it-ebooks.info

<?php $cid = 'my_module:' . $uid . ':' $langcode; ?>
In this case, the semantics of what makes up the cache ID aren’t important; all thatmatters is that one user doesn’t get presented content that was cached for another useror translated in a different language to the one they’re viewing the content in..
One exception to this is key-based invalidation—using the updatedtimestamp of an entity as part of the cache key means that when theentity is updated, so is the cache key, resulting in a cache miss and newcache entry without having to explicitly clear the old key.
Cache tags, rather than guaranteeing the uniqueness of cache items, are intended forcache invalidation.
A good example of this is entity rendering. Entities may be rendered on their own withmultiple view modes, as part of a listing of multiple entities via Views, as part of a block,or embedded within the rendering of another entity via entity references.
A rendered node may include information from referenced entities, such as the nameof the user that authored the node and that user’s avatar. A Views listing might includemultiple nodes like this.
To maintain coherency when entities are updated, there are two common approaches:Set long TTLs and clear all caches of rendered content
The cache will be completely emptied whenever a single item of content is updated,even though the majority of the cache will be unaffected. On sites with frequentcontent updates, this approach can lead to low hit rates and the potential for cachestampedes. However, the cache will always be accurate.
Set short TTLs so that content is only stale for a few seconds or minutesThis results in lower hit rates regardless of the frequency of content updates. How‐ever, not explicitly clearing the cache all at once when an item is updated meansthere’s less likelihood of cache stampedes.
Cache tags allow for a “best of both worlds” scenario, where all cache items that includean entity are tagged with that entity’s ID, and saving the entity invalidates those cacheitems but no others. This allows for both cache coherency (assuming consistent taggingin the first place) and longer TTLs.
CacheArray
CacheArray was originally added to Drupal 8 but has been backported to Drupal 7,along with several patches integrating it with core subsystems. As a highly dynamicsystem, and with so much functionality provided by modules, Drupal has evolved tocarry a lot of metadata about what functionality is provided from where. This includes
Caching | 39
www.it-ebooks.info

the theme registry (a large array of all theme hooks, templates, and preprocessors), theschema cache (which contains metadata about every database table defined by a module,which often reaches 200 or so), and several other registries. On a default install of Drupalcore, these usually reach a few hundred kilobytes at most; however, many Drupal sitesend up with as many as a hundred or even several hundred contributed modules enabled,each of which may be defining new database tables, theme templates, and the like.
Prior to Drupal 7.7, each subsystem would store these arrays in one large cache item.This meant that for the theme registry, every theme function or template registered ona particular site would be loaded on every page—including theme functions for specificadministrative tables that might not be used, or for functionality that might not beexposed on the site itself due to configuration. For the schema cache, while the schemametadata is only used for tables passed to drupal_write_record() or drupal_schema_fields_sql()—often as few as 10–15 tables on most sites—metadata about everydatabase table on the site would nevertheless be loaded from the cache for every request.
CacheArray provides a mechanism to drastically reduce the size of these cache entriesby emulating a PHP array using ArrayAccess. When an array key is requested that hasn’talready been cached, it’s treated as a cache miss and looked up, and then the array ispopulated with the returned value. At the end of the request, any newly found arraykeys and values get written back to the cache entry so that they’ll be a cache hit for thenext request. This allows the cache item to be built on demand, populated only withdata that is actually in use on the site and often excluding infrequently accessed itemssuch as those used for administrative pages that may not be visited during normal siteoperation. Relatively few contributed modules need to maintain as much metadata assome of these core subsystems, but CacheArray provides a solution to this problemwhen you run into it.
CacheArray is in the process of being replaced by CacheCollector inDrupal 8. CacheCollector has the same internal logic but uses pub‐lic methods for get and set instead of ArrayAccess.
Render cachingDrupal’s render API takes a structured array of data and converts it to HTML, runningit through the theme system and collecting associated assets such as CSS and JavaScript.One of the more powerful but underused features of the render system is its integratedcache handling.
When writing code that generates HTML, there are two main phases that the contentgoes through:
• Building the array of data (e.g., a list of nodes based on the results of a query)
40 | Chapter 4: Drupal Coding for Optimal Performance
www.it-ebooks.info
• Rendering the array to HTML, which mainly involves running it through the themesystem
Render caching allows the majority of time spent in these operations to be skipped. We’lltake the example of a custom block that shows the five most recently published articletitles, taking it from no caching at all to using the render cache as much as possible:
/** * Implements hook_block_info(). */function example_block_info() { $blocks['example_render_cache'] = array( 'info' => t('Render caching example.'), 'cache' => DRUPAL_CACHE_CUSTOM, ); return $blocks;}
/** * Implements hook_block_view(). */function example_block_view($delta = '') { switch ($delta) { case 'example_render_cache': $query = new EntityFieldQuery(); $query->entityCondition('entity_type', 'node') ->entityCondition('bundle', 'article') ->propertyCondition('status', 1) ->range(0, 5) ->propertyOrderBy('created', 'ASC'); $result = $query->execute(); $nids = array_keys($result['node']); $nodes = node_load_multiple($nids); $titles = array(); foreach ($nodes as $node) { $titles[] = l($node->title, 'node/' . $node->nid); } $block['subject'] = t('Render caching example'); $block['content'] = array( '#theme' => 'item_list', '#items' => $titles, ); break; } return $block;}
When the block is rendered with each request, first the hook_block_view() imple‐mentation is called. Then the resulting render array is run through drupal_render()(the second phase).
Caching | 41
www.it-ebooks.info
Just adding #cache to the render array would skip theming, but the entity query andloading would continue to happen with every request without some reorganization.Render caching allows us to skip that work as well, by moving that code to a #pre_render callback. This is the most complicated aspect of using render caching, so rather thanadding the cache first, we’ll start by moving that code around.
hook_block_view() now looks like this:
/** * Implements hook_block_view(). */function example_block_view($delta = '') { switch ($delta) { case 'example_render_cache': $block['subject'] = t('Render caching example'); $block['content'] = array( '#theme' => 'item_list', '#pre_render' => array('_example_render_cache_block_pre_render'), ); break; } return $block;}
/** * Pre-render callback for example_render_cache block. */function _example_render_cache_block_pre_render($element) { $query = new EntityFieldQuery(); $query->entityCondition('entity_type', 'node') ->entityCondition('bundle', 'article') ->propertyCondition('status', 1) ->range(0, 5) ->propertyOrderBy('created', 'ASC'); $result = $query->execute(); $nids = array_keys($result['node']); $nodes = node_load_multiple($nids); $items = array(); foreach ($nodes as $node) { $items[] = l($node->title, 'node/' . $node->nid); } $element['#items'] = $items;
return $element;}
hook_block_view() now returns only the minimum metadata needed; the bulk of thework is transferred to the render callback, which will be called by drupal_render()itself when the element is rendered.
Once this is done, adding caching requires only a small change to hook_block_view():
42 | Chapter 4: Drupal Coding for Optimal Performance
www.it-ebooks.info

/** * Implements hook_block_view(). */function example_block_view($delta = '') { switch ($delta) { case 'example_render_cache': $block['subject'] = t('Render caching example'); $block['content'] = array( '#theme' => 'item_list', '#pre_render' => array('_example_render_cache_block_pre_render'), '#cache' => array( 'keys' => array('example_render_cache'), ), ); break; } return $block;}
Adding #cache means that drupal_render() will check for a cache item before doingany other processing of the render array, including the #pre_render callback. Profilinga page with this block before and after should show that the EntityFieldQuery andnode loading has been removed on cache hits. See Chapter 6 for more information abouthow to check this.
Queues and WorkersDrupal core ships with a robust queue API, defaulting to MySQL but with contributedprojects providing support for Redis, Beanstalkd, and others.
The queue API is most useful when you have expensive operations triggered by actionson the site. For example, saving a node or comment may require updating the searchindex, sending email notifications to multiple recipients, and clearing various caches.Performing all of these actions directly in hook_node_update() will mean the requestthat actually saves the node takes considerably longer, and introduces single points offailure in the critical path of updating content. Depending on the implementation, fail‐ures in search indexing or sending emails may show up as errors to the end user orinterrupt the content saving process altogether.
Instead of doing all this work inline, in your hook_node_update() implementation, youcan create a queue item for that node; then, in the worker callback, you can performwhichever tasks on it are necessary.
This has the following advantages:
• Expensive processing is taken out of the critical path of saving nodes into a back‐ground process. This allows the Apache process to be freed up quicker and pagesto be served more quickly to users.
Queues and Workers | 43
www.it-ebooks.info

• The background process may be run by drush or a queue daemon. Any operationsthat require high memory limits won’t bloat Apache, and they don’t necessarily needto run on the main web server at all. If queues are processed by Jenkins, it’s alsopossible to isolate reporting of failures for particular queues.
• Multiple queue workers may run at the same time, allowing infrastructure usage tobe maximized when there are lots of items in various queues. In contrast, Drupal’shook_cron() only allows one cron invocation to run at a time.
• Queue items are processed individually and can be returned to the queue if notsuccessful. For example, if a queue item needs to call an external service but theAPI call fails with a 503 response, it can be returned to the queue to be retried later.
In sum, pages can be served to end users faster, you have more flexibility when scalingup your infrastructure, and your application will be more robust against failures orperformance issues in external providers.
Cache Stampedes and Race ConditionsAs sites reach large numbers of simultaneous processes, the potential for stampedes andrace conditions increases.
A stampede can happen when a cache item is empty or invalid and multiple processesattempt to populate it at the same time. Here’s an example with Drupal 7’s variable cache:
• Process A requests the variable cache, but there is no valid entry, so it starts loadingthe variables from the database and unserializing them.
• Process B then comes in; there is no cache entry yet, so it also queries the variablesfrom the database.
• Process C comes in and does the same thing.
• Process A finishes building the page and caches it.
• Process D requests the page and gets the cached item.
• Processes B and C finish and overwrite the cache item with their own identicalversions.
In this case, only one cache item was needed, but it was created three times.
If this is an expensive task, it can put the server under high load as multiple differentprocesses all do duplicate work.
There are two approaches to handling this scenario:
• When it’s OK for a few requests to be served an invalid cache item, it’s possible touse the $allow_invalid parameter to $cache->get() so that invalidated but stillpresent cache items are returned by the API. The first request to get an invalid cache
44 | Chapter 4: Drupal Coding for Optimal Performance
www.it-ebooks.info
item can acquire a lock using Drupal core’s lock API, then proceed to build the newcache item and return it to the caller. Subsequent requests will fail to acquire thelock and can immediately return the stale cache item; this will happen until the newcache item is available.
• When the cache item must be up to date at all times, or if a cache item is completelyempty, it’s not possible to serve stale content. The first process to get a cache misswill still acquire a lock and proceed to build the fresh cache item. If the item is veryexpensive to build, then subsequent requests can be put into a holding pattern using$lock->wait(). This will return as soon as the lock is released, after which the cacheshould be available.
Using the locking system can have its own problems—when a cache stampede turnsinto a lock stampede—and it would be remiss not to discuss these:
• By default, acquiring a lock requires a database write, and polling for locks queriesthe database quite frequently. Locking to save one inexpensive database query canbe counterproductive in terms of performance since it may have as much overheadas rebuilding the cache item. The lock API has pluggable storage, so this can beimproved by installing one of the alternative backends.
• Items that are cached per page are less likely to be requested simultaneously thanitems cached once for the whole site. Where there is very little chance of a cachestampede, the extra overhead of acquiring the lock is not worth it for these items.
• Items that are invalidated very frequently—say, every 10 seconds—will result in aconstant acquiring and freeing of locks. Since processes that don’t acquire locksusually poll to see if the item is created, they may miss the window of the valid cacheitem and continue to poll.
If you are running into issues with locking, consider whether the lock may be makingthings worse rather than better. Alternatively, it may be necessary to rethink the func‐tionality altogether; for example, refactoring a per-page element to work across all pageson the site.
Cache Stampedes and Race Conditions | 45
www.it-ebooks.info

CHAPTER 5
Drupal Coding for Abysmal Performance
Having looked at some Drupal best practices for performance, we’ll now take a look atsome worst practices and antipatterns. No one intentionally writes abysmally perform‐ing code, but as with any system, misuse of Drupal APIs can lead to unexpected andhard-to-predict performance issues that are often hidden in the implementation detailsof a specific API.
It’s not possible to provide an exhaustive list of antipatterns in Drupal that are bad forperformance, but one API in particular gets abused very frequently and can cause quiteserious and hard-to-track-down performance issues on high-traffic sites with particularconfigurations.
variable_set() AbuseThe variables system prior to Drupal 8 is one of the simplest, most central, and mostcommonly used APIs, to the point where it’s very rare to find a module that doesn’t useit. It’s also one of the most frequently abused APIs, including in Drupal core, so it pro‐vides a good example of how a simple API can come to be misused over time as usecases change. As you’ll see, this API no longer exists in Drupal 8.
We’ll start with a brief explanation of the API and its implementation in Drupal core.
Variables are stored in a single table with a name and a serialized value. Early in eachpage request, every variable is loaded into the $conf global from the cache (or the cacheitem is rebuilt if it’s missing). Individual variables are accessed, set, or deleted via thevariable_get(), variable_set(), and variable_del() functions. system_settings_form() provides a degree of automation between administrative configurationpages and the variables they control.
Over the years, as well as storing configuration, the variables system has been used forstoring other things as well:
47
www.it-ebooks.info

• Cache items that are updated infrequently and expensive to rebuild• Site “state,” or metadata tracking the status of a specific site, which can’t be recreated
in the same way a cache entry should be (so can’t be deleted when all caches areflushed), but is set dynamically by code rather than triggered by configuration UIchanges
Prior to Drupal 8, core did not provide a dedicated key/value store, so the variablessystem was reused for this as the next closest thing.
Examples of where variables are used to store state in Drupal core include for trackingwhether outgoing HTTP requests are failing, the time of the last cron run, and thefilenames and file collections for generated CSS and JavaScript aggregates.
When a variable is set, three things can happen:
1. The database row is updated. Updating the database invalidates the MySQL querycache and may cause issues with locking on high-traffic tables, but is usually a fastoperation with a well-indexed query affecting just one row.
2. The cache is cleared. Clearing a cache itself is very cheap.3. The next request to the site discovers that there’s no cache entry for the variable
table, so it loads every variable (sometimes 2,000–3,000 of them on complex sites)from the variables table, unserializes them, then writes the cache entry. This couldtake anything from a few milliseconds to a couple of hundred milliseconds de‐pending on the number of variables, site load, etc. No Drupal request can be servedwithout all variables being loaded, so if a previous request has cleared the variablecache, the next request will try to rebuild it. If multiple requests hit the site beforethe cache item has been set, one of the following occurs:
• (Drupal 6) All requests that get a cache miss will each rebuild the variables cacheentry and write it back to the cache table.
• (Drupal 7 and Drupal 6 Pressflow) The first request acquires a lock, rebuilds andwrites back the cache entry; other requests wait for the lock to be released, theneither build it if there’s still no cache entry, or read from the cache and continue.
If variable_set() ends up being called very frequently, this can result in either a cachestampede, where dozens of requests are constantly updating the cache entry, or a lockstampede, where processes are constantly waiting for a new variable cache entry thatmay be invalidated again before they’re able to retrieve it from the cache.
What makes this problem worse is that it can be relatively hard to track down the cause,for a few reasons:
48 | Chapter 5: Drupal Coding for Abysmal Performance
www.it-ebooks.info

• When profiling a page, variable_set() won’t show up as one of the most expensiveoperations—the set itself is fairly quick, so it could easily be skipped over.
• While generating the variables cache entry is quite expensive, there’s no way to tellfrom these requirements why the variables cache was empty. It’s not possible toknow which variable was cleared without reviewing code or debugging, so evenprofiling a page where the variables cache was previously invalidated doesn’t givean indication of whether this was due to state tracking or via a configuration formsubmission.
If you find a module doing this in Drupal 7, consider checking that the value of thevariable has changed before saving it, converting the code to use the cache system ifthat’s feasible, saving the value in a dedicated table if it’s not requested frequently, or,like drupal_http_request(), just logging the change via watchdog().
In Drupal 8, the variables system has been completely removed and replaced with threedistinct APIs:Settings
Low-level configuration required before storage is available to the system as a whole;settings can only be changed in settings.php.
ConfigurationThe majority of module configuration is stored as YAML, providing the ability tostage configuration changes between sites.
State and key/value storeA new key/value store interface and implementation have been added, and a “state”service is made available by default using this API. All the things that previouslywould have been abusing the variables system to store state can now use the stateservice. Since state is separated from overall site configuration, updating values inthe state system won’t invalidate the entire configuration cache.
External RequestsIncreasingly, site development includes interacting with external APIs, whether for so‐cial sharing, login, content sharing, or similar purposes. When making HTTP requestsfrom PHP code, it’s easy to introduce a single point of failure in your architecture, andin the case of requests to an external API, it’s one that you will have no control over ifthe service happens to be sluggish or go down due to network or infrastructure issues.
Examples of where this can go wrong include features such as allowing users to specifyan RSS feed in their profile pages and then displaying it in a block, or using the PHPAPIs for services such as Facebook and Twitter. If the request to the external service
External Requests | 49
www.it-ebooks.info
takes several seconds, times out, or returns a bad status code, will your page still beserved in a timely manner, or at all?
External HTTP requests can also be a hidden cause of performance issues on a site,since they may be intermittent and will not cause high CPU or disk load in the sameway poorly optimized PHP algorithms or slow database queries can.
There are several steps that can be taken to reduce the potential for catastrophic failure.We’ll use a user-specific RSS feed displayed in a block on the user’s profile page as anexample:
1. Add caching. A call to an external API can easily take 200–300 ms. If that call is asimple GET request for a list of posts or the like, it will be very straightforward tocache the results using Drupal’s caching API. If the site has empty caches, this won’tprevent downtime, so just adding caching won’t be sufficient, but it will mean thatsites with a warm cache entry won’t depend on the service being available.
2. Add a timeout. If an API can’t respond within a second or two, can you afford towait any longer before serving the page? If not, adding a timeout to the HTTPrequest ensures that your code will continue.
3. Move the HTTP request out of the critical path. It may be possible to move theHTTP request to hook_cron() (for example, precaching the RSS feeds for each useronce per hour instead of checking each time the block is viewed) or a queue. Al‐ternatively, the block could be moved to an AJAX callback, with JavaScript on theparent page requesting the block and inserting it into the DOM (known as a client-side include). You can also use both methods: if the HTTP request fails, cron mighttake a bit longer, or the AJAX request might not return, but the main request itselfwill still be able to complete and be served.
SessionsSince Drupal 7, sessions are only created for unauthenticated users once something isactually put into $_SESSION. Once a user has a session, page caching is disabled to avoidserving incorrect content based on the contents of the user’s session, such as the contentsof a shopping cart, or status messages. This happens when using both the internal pagecache and a reverse proxy, if using a standard configuration.
$_SESSION should therefore only be used for situations where storing the informationfor the anonymous user should also prevent pages being cached for that user. An ex‐ample would be a user’s shopping cart choices, where the shopping cart contents maybe displayed on each page, and the site may want to preserve the choices in the sessionwhen the user logs in. While adding items to a shopping cart is a valid reason to disablecaching, attention should be paid if a user removes an item from the cart. A common
50 | Chapter 5: Drupal Coding for Abysmal Performance
www.it-ebooks.info
mistake is to set $_SESSION['foo'] ='' or $_SESSION['foo'] = array() when emp‐tying out a session variable; using anything other than unset($_SESSION['foo']) willleave the session open.
Excessive Cache GranularityWhen you’re working on a project, requests may come in to make particular contentuser specific (per user, geolocated), or to vary things on every page—for example, ex‐cluding the article in the main content area from a list of featured articles in the sidebar.Often these requests are unavoidable, but the details of how this extra information isadded to or removed from pages can have profound effects on a site’s performance.
Let’s take for example a snippet that shows the latest three articles added to a site. Asimplified version of the block on a Drupal 7 site might look like:
<?php $nids = db_query_range(' SELECT nid FROM {node} WHERE status = 1 ORDER BY created DESC', 0, 3)->fetchCol(); $nodes = node_load_multiple($nids); return node_view_multiple($nodes, 'block_listing');?>
However, when you’re on the node/n page for one of the nodes in this block, you mightwant to exclude it from the list and show the fourth-most-recent node instead:
<?php $current_node = menu_get_object(); $nids = db_query_range(' SELECT nid FROM {node} WHERE status = 1 AND nid <> :nid ORDER BY created DESC', 0, 3, array(‘:nid’ => $current_node->nid))->fetchCol(); $nodes = node_load_multiple($nids); return node_view_multiple($nodes, 'block_listing');?>
Only one condition was added, but this fundamentally changes the performance of thisblock. With the first version, despite potentially being displayed on tens of thousandsof node pages across the site, the query was always exactly the same. This allowed it tobe cached in a single cache entry, both by the MySQL query cache and in Drupal’s cacheAPI if desired. With the second version of the query, however, a different version willbe run on every node page. A million node pages might mean a million variations onthe query, vastly reducing the effectiveness of both the MySQL query cache and Drupal’sown cache layer.
Excessive Cache Granularity | 51
www.it-ebooks.info
Rather than excluding the current node ID in SQL, we could do it in PHP:
<?php $current_node = menu_get_object(); // This time load four nodes. $nids = db_query_range(' SELECT nid FROM {node} WHERE status = 1 ORDER BY created DESC', 0, 4)->fetchCol();
foreach ($nids as $key => $nid) { // If one of the nodes is the current one, remove it. if ($nid == $current_node->nid) { unset($nids[$key]); } } // Ensure only three nodes are loaded. array_splice($nids, 3); $nodes = node_load_multiple($nids); return node_view_multiple($nodes, 'block_listing');?>
This allows the same query to be cached across the whole site again, but still the markupwill need to be cached per page. A further optimization in terms of cacheability wouldbe to render four nodes every time, then implement the same logic for removing eitherthe current node or the fourth-most-recent node in JavaScript, allowing the block to besafely cached in a reverse proxy via edge-side or client-side includes. At this point, it’sa trade-off between caching the rendered output and the additional JavaScript require‐ment.
A similar issue exists with per-user markup. Drupal traditionally adds per-user markupto many site elements: for example, “new” or “updated” markers on nodes and com‐ments based on the last time the user visited a node, or quick administration links suchas contextual links. Drupal 8 will continue to add user-specific markup in these places,but it does so via JavaScript replacement so that the markup generated for the blocksthemselves is the same regardless of the user. For examples of this implementation, seethe Comment and History modules in Drupal 8.
PHP ErrorsWhile Drupal core complies with E_STRICT by default and has fairly comprehensive testcoverage, it is common when reviewing a live site to find PHP notices and warningslogged on every request (in some cases, tens per request). When using Drupal’s defaultdatabase logging (dblog) module for logging, this means potentially hundreds of addi‐tional database writes per second on a high-traffic site. Even if using syslog or anotheralternative log implementation, PHP error handling is expensive and should be avoided.
52 | Chapter 5: Drupal Coding for Abysmal Performance
www.it-ebooks.info

PHP errors and notices may well be a sign of underlying functional bugs, but even ifthey’re not, there’s no excuse for writing and deploying code that’s not E_ALL compliant.
Debug Code in the Code BaseCode review as part of the development process should prevent this, but “emergency”fixes can result in debug code being committed to the live code base. This could includethings like clearing the entity cache before loading entities, disabling the theme registryor locale caching, excessive logging, and various other operations that are both expen‐sive and unnecessary on a production site.
Development SettingsWhile not strictly a “coding” matter, a common issue on live websites is leaving one ofthe many debug features provided by modules and themes enabled, such as rebuildingthe theme registry on every request. Settings like this should never, ever be enabled inthe user interface, but rather overwritten by settings.local.php in $conf, which canbe different for development, staging, and live environments (see Chapter 9). Similarly,development modules should be enabled locally by developers after each database re‐fresh and never enabled on a live environment. While this may be standard practice forsome readers, others may recognize the frustration of discovering that a downtime issuewas due to a forgotten development setting that was never switched off.
Debug Code in the Code Base | 53
www.it-ebooks.info

CHAPTER 6
Verifying Changes
When optimizing a site that’s under development or in production, the most importantstep before any other is to gather data on what the performance and scalability bottle‐necks are. Without data, a lot of effort can be expended on optimizing code that’s actuallyperforming OK, and conversely, poorly performing code might be overlooked. Withoutbeing able to identify and quantify specific performance issues, it’s not possible to verifythat improvements have been made. A site might seem “faster” after a change was rolledout to production, but you’ll never know whether this was because of the change itself,or perhaps because crawler traffic or even a distributed denial-of-service (DDoS) attacksubsided at the same time.
Analyzing Frontend PerformanceFrontend performance monitoring falls into roughly four categories:
• Getting a summary of a page’s performance based on rules for high-performancewebsites
• Waterfall and timeline charts for individual pages• Real user monitoring• Profiling of CSS and JavaScript
YSlow and Google PageSpeedOften the first step toward analyzing a site’s frontend performance is looking at thesummary report produced by a tool such as YSlow and PageSpeed. Given a URL, or viaa browser plug-in, they’ll analyze a request to an individual web page and give you scoresfor specific areas such as number of HTTP requests, cacheable headers, etc. Drillingdown on these items will show specific recommendations. Both of these tools are very
55
www.it-ebooks.info

easy to use and have great documentation, so doing a walkthrough here would be re‐dundant. However, the reports they generate are only useful if you have an understand‐ing of the underlying principles of frontend performance and the effort it’s likely to taketo fix the issues that are identified. Chapter 2 goes into detail about Drupal-specificadvice on how to deal with many of these issues, based loosely on the categories thatare highlighted by these reports.
While generating a summary report from YSlow or PageSpeed is a very quick task, thisis commonly treated as a manual step to be taken by an individual developer and so canoften be overlooked during the development process, or done much less frequently thanchanges are made that impact the frontend performance of the site. However good yourintentions may be, automating frontend performance testing as part of your continuousintegration process helps to ensure that your site is regularly put through its paces andhelps you discover changes that may negatively impact performance before they’re de‐ployed.
PhantomJS is a headless WebKit implementation including a Java‐Script API for which there is a YSlow plug-in. This allows you to triggera YSlow report from the command line and write the output in astructured format such as JUnit.
Once you have a summary of a page’s performance, it’s often necessary to drill down toindividual requests to see what’s going on.
Waterfall ChartsWaterfall charts show the sequential process of loading a web page. Primarily this showspage resources as they’re requested and downloaded by the browser, as well as timingsfor “start render” and “document complete” events, represented by the green and bluevertical bars on the chart. See Figure 6-1 for an example waterfall chart, created for aload of http://drupal.org.
Each horizontal bar on the waterfall chart represents a separate request. Each requestis further broken down into the following components:DNS lookup
The address lookup for each domain that resources are served from. This occursonce per domain/subdomain rather than once per resource on the page, and maybe skipped if the browser implements DNS caching and has a warm cache for thedomains on the page.
56 | Chapter 6: Verifying Changes
www.it-ebooks.info

Figure 6-1. Waterfall chart for the Drupal home page
Initial connectionThe upstream connection to request the resource from the server. This is con‐strained by upstream bandwidth, so tends to be worst for mobile connections. It’salso affected by the number/size of cookies that the browser needs to send with eachrequest—these are sent upstream for every request the browser makes that it hascookies set for.
SSL negotiationThe process of checking SSL certificates (only for SSL requests, of course).
Time to first byteThe time until the browser downloads the very first part of the resource. This de‐pends on the speed of response of the server (is it under load, and was the file servedby Varnish from memory or by Apache from disk, or even generated by PHP dy‐namically?).
Content downloadThis depends mainly on file size—whether the file is optimized to the correct size,gzipped, etc.
Analyzing Frontend Performance | 57
www.it-ebooks.info

Drupal.org is quite well optimized at 23 requests on the front page, but looking closelyat the waterfall chart, it’s still possible to see room for improvement. For example, btn-search.png is a single-use image for the search button, which could be consolidated intoone of the existing sprites since the same styling is used for other buttons on the page.Any request for an image that’s not associated with content should be treated with sus‐picion! Even when images are consolidated into sprites, consider whether it might bepossible to replace them with typographic or CSS features instead.
Follow along with the issue we filed for this while writing this chapter.
While webpagetest was used for generating this example, you’ll normally get richerinformation from local browsers using tools such as Firebug for Firefox, Chrome De‐veloper Tools or Safari Developer Tools. These provide the ability to view all the HTTPheaders for a request, as well as a timeline of the browser rendering layer itself, whichcan help to identify issues such as how many reflows and repaints happen on the page(i.e., due to images included in the page without dimensions).
Real User MonitoringWhen testing frontend performance, a key point to bear in mind is that as a developer(or Jenkins job) running synthetic tests on a site that you’re working on, you representabsolute best-case conditions for frontend performance in nearly all cases. Developersare most likely to be:
• On fast Internet connections• Running powerful hardware• Using recent operating system and browser versions• From a location geographically close to the origin server
Whereas visitors to a site could be from multiple continents, running old hardware without-of-date browser versions over public WiFi or 3G networks.
While an improvement made for the best-case scenario is usually an improvement forthe worst-case scenario, too, particularly in the case of network latency and browserrendering speeds, differences in visitors’ connections and hardware can mean extremevariation in results for the same page. A visitor with a slow 3G connection is likely tospend a much greater proportion of the page load time making upstream requests tothe server (so watch those cookies!). A visitor with an older smartphone is much morelikely to experience sluggish rendering performance due to poorly optimized markup,
58 | Chapter 6: Verifying Changes
www.it-ebooks.info

CSS, and JavaScript, because that device will have significantly less CPU available thanthe average laptop.
In response to this, there is increased reliance on real user monitoring (RUM) to collectperformance metrics from actual visits to sites in addition to “clean” tests.
RUM tends to be dominated by commercial Software as a Service (SaaS) solutions, sinceit requires capturing, storing, and presenting large volumes of information that manyorganizations do not have the ability to maintain in-house. However, there are opensource alternatives, such as Jiffy (open sourced by Netflix) and Steve Souders’ WebEpisodes, and free commercial alternatives such as the page timing feature of GoogleAnalytics. There’s also a Drupal contributed module for the navigation timing API thatcan be used to directly collect information from requests to the site within Drupal,although this is not suitable for production sites.
Regardless of the mechanism used, the end result is collecting real requests to the siteby visitors, including timings such as time to first byte and page complete, via a snippetof JavaScript included in the web page. By recording this data for all requests made toa site, it’s possible to generate reports that show overall trends for end user performanceon the site—which pages are slow, whether particular browsers have a particularlyslower experience than others, which countries are getting the best and worst responsetimes, etc.
Depending on the tool used, it may be possible to collect diagnostic information as well.However, more often this information can be used to feed back into synthetic tests tomake them better reflect reality, or to target them on specific areas of the site that needimprovement or that experience the most traffic.
Analyzing Application PerformanceApplication performance is often the black sheep of site optimization, with efforts fo‐cused primarily on frontend performance and infrastructure. In our case, applicationperformance means… Drupal! More specifically, we want to look at the PHP code anddatabase queries that Drupal needs to run to serve a request. Application performanceis not the same as the performance of your site overall. If 90% of requests are servedfrom Varnish, then Drupal is only involved in the other 10%—but these 10% will be theslowest, and they may come all at once if the Varnish cache is cleared.
Measuring and understanding application performance is not at all the same thing asload testing. While load testing frameworks often include performance measurements,this is measuring the end-to-end performance, including infrastructure and networklayers. Load tests are likely to only find the most glaring application performance issues,since there can be a high variation in response times between tests. See Chapter 20 formore discussion on how to run load tests and what to look for.
Analyzing Application Performance | 59
www.it-ebooks.info

By contrast, understanding application performance means examining how the codethat runs your application performs, more or less in isolation from external factors. Thisis done by profiling the code.
The Devel ModuleThe Devel module provides a number of debugging tools for developers. Amongst theseare tools for monitoring page timing, memory consumption, and the query log, and forXHProf profiling. Most of the features discussed here apply across the Drupal 6, 7, and8 versions of the module.
Page timing
Devel’s own page timing uses microtime to measure the time from drupal_bootstrap_configuration() to PHP shutdown and requires no PHP extensions to be en‐abled: just check the box on admin/config/development/devel. Microtime across a fullpage request can be extremely variable, so to ensure a like for like comparison, refreshthe pages several times to ensure all application caches (as well as the opcode cache,MySQL query cache, etc.) have been primed, or expect very different results each time.There is one exception to this: when timing cache misses, you should ensure that allcaches really are empty. The page timer can be used for a quick sanity check as to whethera page is taking dozens, hundreds, or thousands of milliseconds to load and is useful insituations where there is no opportunity to install lower-level tools, but usually it’s betterto go straight to one of the other techniques for measuring page execution time discussedin the following sections.
Memory usage
Memory usage in the Devel module is measured using memory_get_usage() and memory_get_peak_usage() during shutdown. As with page timings, no PHP extension isrequired, and the option can be enabled at admin/config/development/devel. Since thisinformation is taken from PHP itself, it can be relied upon more than the page timings,but there are still some caveats. If you’re trying to find out how much memory a pageis going to use, ensure that other debugging tools like Xdebug, XHProf, and the querylog are disabled, since these will increase memory usage. Also ensure that any opcodecaches are enabled (unless specifically testing memory usage without an opcode cache),since these can impact memory usage by several megabytes. Finally, bear in mind thatDrupal’s memory usage varies widely depending on whether caches are primed or not.Often for memory usage, the worst case should be measured as opposed to the best case—an Apache process will always have a memory footprint of the worst PHP page itserved from memory, not the best.
60 | Chapter 6: Verifying Changes
www.it-ebooks.info
Query log
Devel’s query log measures database queries from devel_boot() until PHP shutdown.Since it uses the APIs within Drupal’s own database layer, it’s able to present the exactqueries that were triggered on the page in question. This makes it a very useful alter‐native to mytop.
Drupal may execute some database queries before hook_boot() runs,depending on whether the database cache backend is used and whichDrupal version is being tested.
Like the options for measuring page timing and memory usage, the query log optioncan be enabled at admin/config/development/devel. There are two options that allowcustomization of the query log display:Sort Query Log
The query log is sorted “by source” by default, showing the queries in the order theywere executed. Changing this to “by duration” shows the queries in the order ofexecution time, slowest first. This is useful to quickly identify slow queries on thepage, but bear in mind that query timings may change on each request due to theinfluence of the MySQL query cache, server load, or just margin of error, and thiscan make it difficult to identify the same query across different page requests sinceit may change position each time.
Slow Query HighlightingThis defaults to 5 ms, and any query taking longer will be highlighted in red in thequery log. Five milliseconds is not particularly slow, but most queries executed byDrupal should be well indexed, may be in the query cache, and are likely to havesmall result sets, so they should execute in well under 1 ms in most cases. Thereforeeven leaving this option at the default setting should not result in any highlightedqueries on a stock install.
While not specific to the query log, there’s one other Devel setting that affects the querylog and other performance measurements taken by Devel: “Display redirection page.”Drupal form submissions make a $_POST request to the same page as the form. Oncethe form has been processed, the page gets redirected. Since the query log only collectsqueries during the request, the redirect prevents the log from ever being rendered.“Display redirection page” provides an intermediary page that allows the output to beprinted, along with a link to the page that was going to be redirected to. This is aninvaluable option when trying to examine queries executed after submitted content orsearches, which would otherwise be invisible except at the MySQL level.
Analyzing Application Performance | 61
www.it-ebooks.info
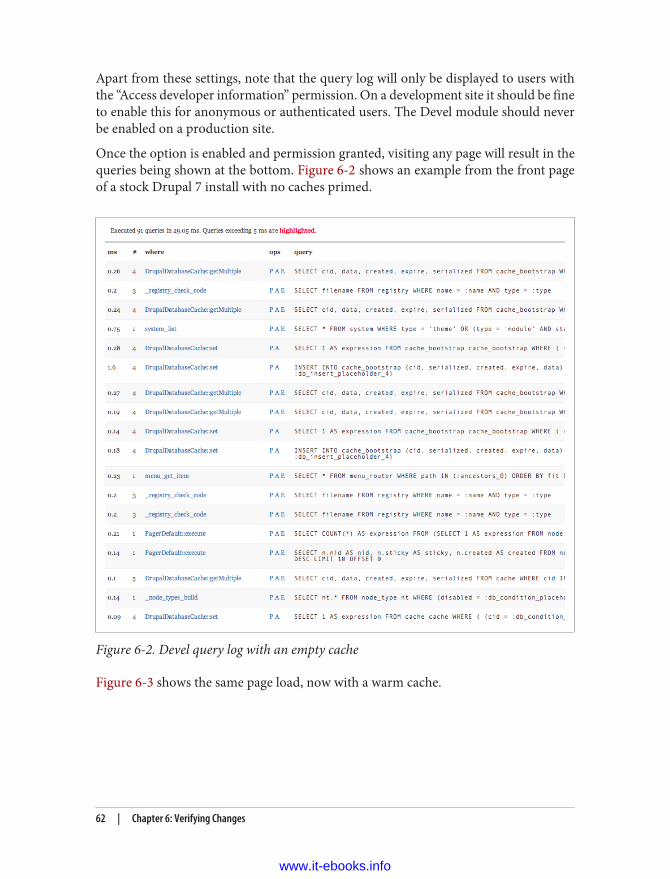
Apart from these settings, note that the query log will only be displayed to users withthe “Access developer information” permission. On a development site it should be fineto enable this for anonymous or authenticated users. The Devel module should neverbe enabled on a production site.
Once the option is enabled and permission granted, visiting any page will result in thequeries being shown at the bottom. Figure 6-2 shows an example from the front pageof a stock Drupal 7 install with no caches primed.
Figure 6-2. Devel query log with an empty cache
Figure 6-3 shows the same page load, now with a warm cache.
62 | Chapter 6: Verifying Changes
www.it-ebooks.info

Figure 6-3. Devel query log with a warm cache
At the top of the first query log is the summary:
Executed 91 queries in 29.05 ms. Queries exceeding 5 ms are highlighted.
And the second query log has the summary:
Executed 33 queries in 10.27ms. Queries exceeding 5 ms are highlighted.
While brief, this summary provides two fundamental pieces of information that indicatewhat problems might be present on the page:Total time
This is the combined time taken for all queries on the page. In this example, thetime is approximately 10 ms with a warm cache, which is likely to be a relativelysmall percentage of the overall time taken for the page request. An unindexed query
Analyzing Application Performance | 63
www.it-ebooks.info

with filesorts and table scans on a large data set could take hundreds of millisecondsor several seconds, so a high number here should be an immediate red flag.
Number of queriesDepending on the contributed and custom modules installed on a site, and thecomplexity of the page being rendered, the number of database queries executedon a Drupal page can vary from under 10 to several hundred or even thousands. Aslow query taking seconds is more likely to be making a website hard to scale, buthaving to make hundreds of round trips to the database is likely to be a majorcontributor to slow page-building performance and will increase the overall loadon the database server.
By dividing the number of queries by the total time spent executing queries on thesepages, we can see that each query took approximately 0.3 ms on average. This kind ofperformance is expected with a stock core install and a very small data set.
After the summary, each query is listed in a table with the following columns:ms
The number of milliseconds taken to execute the query.
#The number of times the query was executed during the request. Note that fromDrupal 7, the Devel module ignores placeholder values when counting queries, sotwo queries with different placeholder values are treated as the same query. There‐fore, this may not show actual duplicates, but it will indicate when lots of queriesare running that are very similar.
whereThe caller that executed the query. This links to api.drupal.org by default but canbe set up to link to a custom API site if desired.
ops and queryAdded in Drupal 7, the ops column provides three ways to view the query itself,shown in the neighboring (query) column. The default is P, meaning PHP DataObject (PDO) placeholders (for example, :cids) are displayed:
SELECT cid, data, created, expire, serialized FROM cache WHERE cid IN (:cids_0)
A query run via db_query() will have named placeholders as writtenin the code calling db_query(). When queries are run via db_select(), Drupal’s query builder generates the placeholders dynamical‐ly, so they end up being called db_condition_placeholder.
64 | Chapter 6: Verifying Changes
www.it-ebooks.info

Selecting the A linkShows the actual query executed, with placeholders replaced. This is ideal for copy‐ing and pasting into a MySQL client to check the result set or to try different var‐iations:
SELECT cid, data, created, expire, serialized FROM cache_bootstrap WHERE cid IN('foo')
Selecting the E linkShows an EXPLAIN for the query, saving you the step of copying and pasting thequery into a MySQL client in order to get this information. EXPLAIN shows the stepsthat MySQL goes through to solve a given query and can be very useful to trackdown why a query may suffer from performance issues. Table 6-1 shows Devel’sEXPLAIN output for a query.
Table 6-1. Devel module query EXPLAINid select_type table type possible_keys key key_len ref rows Extra
1 SIMPLE cache_bootstrap const PRIMARY PRIMARY 767 const 1
TargetThis is the database target for the query, which could either be the primary databaseor a separate database being accessed via the database API.
XdebugXdebug is a PHP profiling and debugging extension authored by Derick Rethans. It’svery stable and as a debugger is more or less required for developing in PHP. Xdebugprofiling generates cachegrind files, which can then be viewed in an interface such asKCacheGrind, which is available for most operating systems; or webgrind, which iswritten in PHP and has a web interface, as the name suggests.
Enabling profiling with Xdebug is done via one of two methods. This enables profilingfor every request:
xdebug.profiler_enable =1
This allows profiling to be triggered via an XDEBUG_PROFILE cookie or a $_GET or $_POSTparameter:
xdebug.profiler_enable_trigger =1
Xdebug will then write cachegrind files to xdebug.profiler_output_dir.
There are two more php.ini settings to be aware of:xdebug.profiler_output_name
configures the filename to be written to. By default this is the process ID, whichmeans a single Apache process will write to the same filename with every request.
Analyzing Application Performance | 65
www.it-ebooks.info

xdebug.profiler_append
configures whether cachegrind files written to the same location will be appendedto the existing content or overwrite it.
The combination of these two configuration options is very important to bear in mindthe first time you try profiling. Since the default configuration is to write with the processID and overwrite files each time, visiting a Drupal page that triggers an AJAX request(which several Drupal core modules do) is likely to result in the cachegrind file holdingthe profile of the AJAX request rather than the initial one you intended to profile. In‐cluding %r (random string) as part of xdebug.profile_output_name guarantees aunique file each time, and %R ($_SERVER['request_uri']) means that page requestscan easily be associated to the profile output. See this page for more filename options.
Profiling with Xdebug carries a lot of overhead, so it’s important to only leave it enabledwhen profiling. Also, just having the Xdebug extension enabled (without profiling) hasa performance impact, so ensure you disable it entirely before doing other kinds ofperformance testing.
XHProfXHProf isa profiler for PHP, developed and open sourced by Facebook. XHProf doesnot contain a debugger and exists solely as a profiler. As a profiler, XHProf has severaladvantages over Xdebug and is our preferred profiling tool for Drupal. These include:
• The ability to collect data on memory usage as well as CPU usage and wall timewhile profiling. Xdebug has the capability to collect memory usage data via functiontraces, but this is less convenient since it’s a separate mechanism to collecting ca‐chegrind, and there is not the range of UIs available for examining the output.
• Less overhead from being enabled. Unlike Xdebug, XHProf does not add significantoverhead simply by being enabled, allowing it to be installed on production webservers.
• Considerably less overhead when profiling. In addition, xhprof_enable() hasXHPROF_FLAGS_CPU and XHPROF_FLAGS_MEMORY options that determine whetherCPU and memory usage data will be collected, allowing a custom balance betweenthe amount of data collected and performance overhead. While profiling does havea measurable overhead, this is low enough that XHProf can be considered forprofiling a sample of requests on production sites if desired.
XHProf is available via PECL, so assuming you have PECL available already, it can beinstalled with:
$ sudo pecl install xhprof
66 | Chapter 6: Verifying Changes
www.it-ebooks.info

Or, if you have PECL set to stable releases only:
$ sudo pecl install channel://pecl.php.net/xhprof-0.9.3
Many resources on the Internet recommend compiling XHProf fromsource because the previous 0.9.2 release would not install from PECLsuccessfully. However, this was fixed with version 0.9.3, released in May2013, so compiling manually is no longer necessary.
You may also need to enable the xhprof extension yourself in php.ini:extension=xhprof.so
XHProf ships with a web interface built in PHP. This is found in the xhprof_html folder(usually found in /usr/share or /usr/local/share). To use this, set up a virtual hostand /etc/hosts entry so that it’s available at http://xhprof.localhost or similar. There arealso third-party user interfaces available, but we’ll focus on the default interface for thepurposes of this discussion.
XHProf profiling is enabled via the xhprof_enable() and xhprof_disable() func‐tions. This allows profiling to be conditionally enabled or disabled in runtime code—for example, if you were trying to sample requests in a QA or production environment,profiling could be restricted to a particular Drupal user or path, or to a 1/1,000 sample.This also allows profiling to be restricted to a particular section of code if desired.
Most commonly, however, when profiling a website, you’ll want to profile the entirerequest each time, in order to put the numbers in context. There are several ways to dothis:
• The Devel module provides an xhprof setting at admin/config/development/devel.Enabling XHProf profiling, adding the path to xhprof_lib, and adding the URLto the web interface is all that’s necessary to begin profiling requests. The Develmodule uses hook_boot(), so it will not profile code that runs prior to that. Onceprofiling is enabled, all pages will have a link to “XHProf Output” at the bottom.
• The XHProf module is similar to Devel in that it allows XHProf profiling to beenabled via configuration; however, it also provides a Drupal interface for exam‐ining the output.
• auto_prepend_file and auto_append_file allow arbitrary PHP files to be in‐cluded at the beginning and end of each request via .htaccess when using mod_php.This allows the entire Drupal request to be profiled, since XHProf is enabled beforeany Drupal code runs.
Analyzing Application Performance | 67
www.it-ebooks.info

The last method requires some manual steps compared to use of the Devel and XHProfmodules, so we’ll detail those here. Two files are required:
<?php include '/path/to/xhprof/xhprof_lib/utils/xhprof_lib.php'; include '/path/to/xhprof/xhprof_lib/utils/xhprof_runs.php'; xhprof_enable(XHPROF_FLAGS_CPU + XHPROF_FLAGS_MEMORY);?>
<?php $host = $_SERVER['HTTP_HOST']; $xhprof_data = xhprof_disable(); $xhprof_runs = new XHProfRuns_Default(); $run_id = $xhprof_runs->save_run($xhprof_data, $host); $source = urlencode($host); $url = "http://xhprof.localhost/index.php?run=$run_id&source=$source"; echo '<a href="'. $url .'" target="_blank">Profiler output</a>';?>
Then, in the .htaccess file at the root of your Drupal install, add these two lines:
php_value auto_prepend_file 'var/www/xhprof/header.php'php_value auto_append_file '/var/www/xhprof/footer.php'
When you request a page in your Drupal installation, you should now see the text“Profiler output” at the bottom of the page.
Now that XHProf is up and running, you can profile a request, look for issues, thenevaluate a way to fix them.
Starting with an 8.x install, with the standard profile, create a single node, then visitnode/1 as an anonymous user. Drupal has several caches to build on that page, so ensureyou visit it two to three times before looking at the profiler output (unless you’re ex‐plicitly looking to see what happens on a cache miss).
When viewing the default XHProf UI, the first thing you’ll see is a summary like theone in Table 6-2.
Table 6-2. XHProf overall summaryTotal Incl. Wall Time (microsec): 257,290 microsecs
Total Incl. CPU (microsecs): 233,884 microsecs
Total Incl. MemUse (bytes): 19,927,040 bytes
Total Incl. PeakMemUse (bytes): 20,004,696 bytes
Number of Function Calls: 51,151
68 | Chapter 6: Verifying Changes
www.it-ebooks.info

Each category is worth looking at:Total Incl. Wall Time
This is the actual elapsed time (i.e., time on the clock, which might be on the wall).
Total Incl. CPUThis represents time spent by the CPU. Time not spent by the CPU would includenetwork round trips—external requests, database and cache queries, etc.
Total Incl. MemUseThis is the total memory used by the script by the time XHProf profiling ends. Itincludes the impact of loading files as well as any objects, static caches, etc. createdduring the request.
Total Incl. PeakMemUseRoughly equivalent to memory_get_peak_usage(); this is the peak memory allo‐cated at any time during the request.
Number of Function CallsThe total number of function and method calls recorded by XHProf.
Just the summary gives us quite a bit of information to work with. Total wall time is 257ms, and total CPU time is 233 ms. That shows us that the vast majority of time is spentexecuting PHP. The remaining time is likely to be spent in the database, in the cachesystem, or on HTTP requests, since those external calls are not counted as PHP execu‐tion. Since this site is using the database cache layer, that only leaves two options.
To verify this, we can jump ahead a bit to check an individual function. Searching thepage for “PDO” finds PDOStatement::execute(), the lowest-level function in Drupal8 that executes database queries. Table 6-3 shows a truncated version of the resultsdisplayed on the metrics page.
Table 6-3. XHProf results for the PDOStatement::execute() methodFunction Name Calls Calls% Incl. Wall Time
(microsec)IWall% Incl. CPU
(microsecs)ICpu% Incl.MemUse
(bytes)IMemUse%
PDOStatement::execute
119 94.4% 29,269 11.4% 6,400 2.7% 728,144 3.7%
As you can see, 29 ms was spent overall, of which 6 ms was CPU time, leaving approx‐imately 23 ms remaining. This confirms that the 23 ms of “missing” time was actuallyspent on the round trip to the MySQL server, which XHProf doesn’t count as CPU time.
Analyzing Application Performance | 69
www.it-ebooks.info

Note that these numbers are quite optimistic for the database, be‐cause the database server is local and is not under load. Longer net‐work round trip times or a server under load could dramatically in‐crease the impact of those database queries, as well as larger table sizesonce the site has some content, due to slower queries. Also remem‐ber that while it’s easy to add additional web servers, scaling MySQLis considerably more complicated, so the sheer number of queriesexecuted per second could end up being an issue on a high-traffic site.
However, in terms of performance, more than 90% of the time spent serving this requestwas in PHP, so we need to keep looking to find the main source of slowness.
The default XHProf ordering by inclusive wall time shows which functions take themost time. XHProf and Xdebug both make a distinction between inclusive time (timespent in the function and any functions it calls) and exclusive time (time spent only inthe function itself). A function that has a high inclusive wall time may not do anythingparticularly expensive, but may just call functions that do. However, once you’re familiarwith Drupal’s bootstrap and rendering process, it gets easier to spot anomalies.
Let’s look at the top few functions for inclusive wall time for this request. Table 6-4 showswhat the table on the metrics page looks like, again truncated to fit the width of the page.
Table 6-4. Functions with the highest inclusive wall time for our requestFunction Name Calls Calls
%Incl. WallTime(microsec)
IWall% Incl. CPU(microsecs)
ICpu%
Incl.MemUse(bytes)
IMemUse%
main() 1 0.0% 257,290 100.0% 105 0.0% 233,884 100.0%
drupal_handle_request 1 0.0% 257,012 99.9% 67 0.0% 233,605 99.9%
Drupal\Core\DrupalKernel::handle
1 0.0% 219,670 85.4% 17 0.0% 201,148 86.0%
Drupal\Core\HttpKernel::handle 1 0.0% 218,776 85.0% 32 0.0% 200,254 85.6%
Symfony\Component\HttpKernel\HttpKernel::handle
1 0.0% 218,640 85.0% 6 0.0% 200,118 85.6%
Symfony\Component\HttpKernel\HttpKernel::handleRaw
1 0.0% 218,634 85.0% 131 0.1% 200,111 85.6%
Symfony\Component\EventDispatcher\ContainerAwareEventDispatcher::dispatch
34 0.1% 193,842 75.3% 230 0.1% 176,492 75.5%
call_user_func 46 0.1% 181,808 70.7% 241 0.1% 163,983 70.1%
Symfony\Component\EventDispatcher\EventDispatcher::dispatch
34 0.1% 178,259 69.3% 360 0.1% 161,182 68.9%
70 | Chapter 6: Verifying Changes
www.it-ebooks.info

Function Name Calls Calls%
Incl. WallTime(microsec)
IWall% Incl. CPU(microsecs)
ICpu%
Incl.MemUse(bytes)
IMemUse%
Symfony\Component\EventDispatcher\EventDispatcher::doDispatch
19 0.0% 177,054 68.8% 238 0.1% 159,968 68.4%
Drupal\Core\EventSubscriber\ViewSubscriber::onView
1 0.0% 133,762 52.0% 30 0.0% 124,379 53.2%
Drupal\Core\EventSubscriber\ViewSubscriber::onHtml
1 0.0% 133,667 52.0% 21 0.0% 124,283 53.1%
drupal_render_page 1 0.0% 133,135 51.7% 130 0.1% 123,751 52.9%
call_user_func_array 81 0.2% 72,108 28.0% 406 0.2% 65,780 28.1%
drupal_render 2 0.0% 67,728 26.3% 55 0.0% 62,663 26.8%
theme 4 0.0% 67,318 26.2% 332 0.1% 62,258 26.6%
block_page_build 1 0.0% 64,377 25.0% 63 0.0% 59,428 25.4%
block_get_blocks_by_region 17 0.0% 63,782 24.8% 56 0.0% 58,844 25.2%
Symfony\Component\ClassLoader\ClassLoader::loadClass
242 0.5% 59,264 23.0% 2,878 1.1% 59,593 25.5%
_block_get_renderable_region 4 0.0% 51,872 20.2% 190 0.1% 48,477 20.7%
entity_view 6 0.0% 47,140 18.3% 80 0.0% 43,696 18.7%
This profiling was done with a Drupal 8.x alpha relese; exact profil‐ing results will differ for later releases.
Looking down the list, we can see that most of the functions are called only one or twotimes. While no guarantee, this usually suggests that they’re high-level functions thathave a deep call stack, and may not be easy to optimize or may need caching added.However, also in the list is Symfony\Component\ClassLoader\ClassLoader::loadClass, called 242 times and taking 59 ms. Clicking on the function name will show allthe parent functions/callers of this function, as well as all the child functions/callees.
Drupal 8 (as of Alpha 2) provides two options for class loading: Symfony\Component\ClassLoader\ClassLoader and Symfony\Component\ClassLoader\ApcClassLoader.
Let’s see what happens when we swap in ApcClassLoader and compare the results. Openup setting.php and uncomment the following line:
<?php$settings['class_loader'] = 'apc';?>
Analyzing Application Performance | 71
www.it-ebooks.info

Then visit node/1 again (twice, to allow the APC cache to be populated).
Searching the page for “loadClass” reveals that it’s dropped down nearly to the bottomof the top 100 functions, nested between node_access() and _menu_translate(), andhas taken only 21 ms this time (as illustrated in Table 6-5). That’s nearly a two-thirdsreduction in the time spent on this function.
Table 6-5. Results for the loadClass() method with the APC class loader enabledFunction Name Calls Calls% Incl. Wall
Time(microsec)
IWall% Incl. CPU(microsecs)
ICpu% Incl.MemUse(bytes)
IMemUse%
node_access 7 0.0% 21,506 10.0% 107 0.0% 20,736 10.9%
Symfony\Component\ClassLoader\ApcClassLoader::loadClass
242 0.6% 21,443 9.9% 2,957 1.4% 21,845 11.4%
_menu_translate 6 0.0% 21,318 9.9% 218 0.1% 18,549 9.7%
To see where the remaining time is spent, click on loadClass and scroll down to the“Child functions” section. Table 6-6 shows the top few.
Table 6-6. loadClass() child functionsFunction Name Calls Calls% Incl. Wall
Time(microsec)
IWall% Incl. CPU(microsecs)
ICpu% Incl.MemUse(bytes)
IMemUse%
Symfony\Component\ClassLoader\ApcClassLoader::findFile
242 33.8% 2,026 9.4% 2,253 10.3% 54,312 0.7%
run_init::Entity/Role.php 1 0.1% 562 2.6% 563 2.6% 263,016 3.5%
run_init::mysql/Select.php 1 0.1% 411 1.9% 412 1.9% 193,624 2.6%
run_init::Entity/EntityDisplay.php
1 0.1% 337 1.6% 339 1.6% 176,624 2.4%
run_init::Entity/Node.php 1 0.1% 317 1.5% 320 1.5% 185,192 2.5%
run_init::Field/Field.php 1 0.1% 250 1.2% 251 1.1% 90,368 1.2%
run_init::user/RoleStorageController.php
1 0.1% 242 1.1% 243 1.1% 97,360 1.3%
run_init::formatter/TextDefaultFormatter.php
1 0.1% 229 1.1% 231 1.1% 72,272 1.0%
run_init::Entity/EntityManager.php
1 0.1% 222 1.0% 223 1.0% 51,416 0.7%
The top function is findFile(), also with 242 calls and taking 2 ms. findFile() lookslike this in the code base:
72 | Chapter 6: Verifying Changes
www.it-ebooks.info

<?php /** * Finds a file by class name while caching lookups to APC. * * @param string $class A class name to resolve to file * * @return string|null */ public function findFile($class) { if (false === $file = apc_fetch($this->prefix.$class)) { apc_store($this->prefix.$class, $file = $this->decorated->findFile($class)); }
return $file; }?>
Clicking on findFile() confirms that it only calls apc_fetch(). Comparing before/after, in Table 6-7 we can see that there were 429 calls to file_exists(), 12,164 tostrpos(), 838 to str_replace(), 834 to substr(), and 428 to strrpos() using ClassLoader, all of which have been replaced with 428 calls to apc_fetch() with the ApcClassLoader, with a reduction of 41 ms down to 3 ms (see Table 6-8).
Table 6-7. findFile() details with ClassLoaderFunction Name Calls Calls% Incl. Wall Time
(microsec)IWall% Incl. CPU
(microsecs)ICpu% Incl.
MemUse(bytes)
IMemUse%
Symfony\Component\ClassLoader\ClassLoader::findFile
428 2.8% 41,274 16.0% 41,662 17.8% 108,000 0.5%
Exclusive Metrics for Current Function
35,456 85.9% 22,436 53.9% -83,256 -77.1%
Child functions
file_exists 429 2.9% 2,571 6.2% 2,918 7.0% 1,128 1.0%
strpos 12,164 82.9% 1,448 3.5% 13,131 31.5% 1,120 1.0%
str_replace 838 5.7% 918 2.2% 1,378 3.3% 126,648 117.3%
substr 820 5.6% 506 1.2% 1,162 2.8% 61,240 56.7%
strrpos 428 2.9% 375 0.9% 637 1.5% 1,120 1.0%
Analyzing Application Performance | 73
www.it-ebooks.info

Table 6-8. findFile() details with ApcClassLoaderFunction Name Calls Calls% Incl. Wall
Time(microsec)
IWall% Incl. CPU(microsecs)
ICpu% Incl.MemUse(bytes)
IMemUse%
Symfony\Component\ClassLoader\ApcClassLoader::findFile
428 49.6% 3,164 1.5% 3,572 1.9% 100,936 0.5%
Exclusive Metrics for Current Function
1,908 60.3% 1,965 55.0% 41,776 41.4%
Child function
apc_fetch 428 100.0% 1,256 39.7% 1,607 45.0% 59,160 58.6%
The remaining records are all for file execution (run_init), which can’t be optimizedwithin the application itself.
straceSometimes it’s necessary to go to the system level to understand what’s happening withyour application. This is particularly true for system calls made by PHP, which won’tshow up in Xdebug or XHProf at all. strace is a great tool for looking at what happenshere, and we’ll use it as an example to examine how Drupal includes module files.
In Drupal 7, file existence is checked before the module is loaded indrupal_load(), via a file_exists() check in drupal_get_filename(). This avoids errors being thrown when a module is moved inthe filesystem without the module list being updated in the database.Drupal 8’s \Drupal\Core\Extension\ModuleHandlerInter
face::load() assumes that the module list is correct, and attempts toload the file with include_once() regardless (a PHP warning will betriggered if the file doesn’t exist, but this is an error condition so isconsidered valid).
PHP’s documentation states that file_exists() is cached when the file is present onthe file system, but not cached when it’s missing. A file_exists() will show up inXHProf whether it caches internally or not, so strace is an ideal tool to test the behaviorat a lower level.
First, we need to attach strace to Apache. strace can be attached to an individual processID or to Apache itself when it’s started. On a local machine the only traffic should beyour own testing, and restarting Apache isn’t going to cause a site outage, so this is thesimplest mechanism to get strace output:
74 | Chapter 6: Verifying Changes
www.it-ebooks.info

$ sudo /etc/init.d/apache2 stop$ sudo strace -f -o /tmp/strace.txt /etc/init.d/apache2 start
Creating the following test file in the root of a Drupal 8 directory covers the threevariations:
<?phpdefine('DRUPAL_ROOT', getcwd());
// Just include_onceinclude_once DRUPAL_ROOT . '/core/modules/system/system.module';
// A file_exists() where the file is present on the file system:if (file_exists(DRUPAL_ROOT . '/core/modules/tracker/tracker.module')) { include_once DRUPAL_ROOT . '/core/modules/tracker/tracker.module';}
// A file exists where the file is not present on the file system:file_exists(DRUPAL_ROOT . '/core/modules/foo/foo.module');?>
Once Apache is restarted, visiting the page in the browser should lead to some straceoutput in /tmp/strace.txt, which you can then open up in your browser.
Let’s first of all focus on the request to system.module via include_once(), with nofile_exists() check. Since this is the first request to Apache after a restart, the realpathcache is empty, meaning there are some additional lstat calls to be made:
26378 lstat("/var/www/8/core/modules/system/system.module", {st_mode=S_IFREG|0664, st_size=12685, ...}) = 026378 lstat("/var/www/8/core/modules/system", {st_mode=S_IFDIR|0755, st_size=4096, ...}) = 026378 lstat("/var/www/8/core/modules", {st_mode=S_IFDIR|0755, st_size=4096, ...}) = 026378 open("/var/www/8/core/modules/system/system.module", O_RDONLY) = 1226378 fstat(12, {st_mode=S_IFREG|0664, st_size=12685, ...}) = 026378 fstat(12, {st_mode=S_IFREG|0664, st_size=12685, ...}) = 026378 fstat(12, {st_mode=S_IFREG|0664, st_size=12685, ...}) = 026378 fstat(12, {st_mode=S_IFREG|0664, st_size=12685, ...}) = 026378 mmap(NULL, 12685, PROT_READ, MAP_SHARED, 12, 0) = 0x7f31caf9e00026378 stat("/var/www/8/core/modules/system/system.module", {st_mode=S_IFREG|0664, st_size=12685, ...}) = 0
Hitting the page again, those lstat calls disappear:
26606 open("/var/www/8/core/modules/system/system.module", O_RDONLY) = 1226606 fstat(12, {st_mode=S_IFREG|0664, st_size=12685, ...}) = 026606 fstat(12, {st_mode=S_IFREG|0664, st_size=12685, ...}) = 026606 fstat(12, {st_mode=S_IFREG|0664, st_size=12685, ...}) = 026606 fstat(12, {st_mode=S_IFREG|0664, st_size=12685, ...}) = 026606 mmap(NULL, 12685, PROT_READ, MAP_SHARED, 12, 0) = 0x7fc6b917d00026606 stat("/var/www/8/core/modules/system/system.module", {st_mode=S_IFREG|0664, st_size=12685, ...}) = 0
Analyzing Application Performance | 75
www.it-ebooks.info

With the realpath cache warmed, let’s take a look at the existing tracker.module filewrapped in a file_exists():
26606 access("/var/www/8/core/modules/tracker/tracker.module", F_OK) = 026606 open("/var/www/8/core/modules/tracker/tracker.module", O_RDONLY) = 1226606 fstat(12, {st_mode=S_IFREG|0664, st_size=12685, ...}) = 026606 fstat(12, {st_mode=S_IFREG|0664, st_size=12685, ...}) = 026606 fstat(12, {st_mode=S_IFREG|0664, st_size=12685, ...}) = 026606 fstat(12, {st_mode=S_IFREG|0664, st_size=12685, ...}) = 026606 mmap(NULL, 12685, PROT_READ, MAP_SHARED, 12, 0) = 0x7fc6b917d00026606 stat("/var/www/8/core/modules/tracker/tracker.module", {st_mode=S_IFREG|0664, st_size=12685, ...}) = 0
The file_exists() is represented by this line:
26606 access("/var/www/8/core/modules/tracker/tracker.module", F_OK) = 0
Remember, the PHP documentation for file_exists() states that the results offile_exists() are cached in the stat cache when the file is present on the file system.What it doesn’t mention is that the stat cache is per-request, meaning each request toDrupal starts with an empty cache. This differs from the realpath cache, which is per-process.
When the file_exists() fails, no inclusion happens, so the only line in the straceoutput is the access call. Note that the return value changes from 0 to -1 ENOENT (Nosuch file or directory):
26378 access("/var/www/8/core/modules/foo/foo.module", F_OK) = -1 ENOENT (No such file or directory)
As a further example, enable apc.stat = 0 in php.ini, then test the include_once()again.
Without apc.stat = 0, notice the stat call at the end:
26606 open("/var/www/8/core/modules/system/system.module", O_RDONLY) = 1226606 fstat(12, {st_mode=S_IFREG|0664, st_size=12685, ...}) = 026606 fstat(12, {st_mode=S_IFREG|0664, st_size=12685, ...}) = 026606 fstat(12, {st_mode=S_IFREG|0664, st_size=12685, ...}) = 026606 fstat(12, {st_mode=S_IFREG|0664, st_size=12685, ...}) = 026606 mmap(NULL, 12685, PROT_READ, MAP_SHARED, 12, 0) = 0x7fc6b917d00026606 stat("/var/www/8/core/modules/system/system.module", {st_mode=S_IFREG|0664, st_size=12685, ...}) = 0
With apc.stat = 0, that stat call disappears, as you’d expect:
26606 open("/var/www/8/core/modules/system/system.module", O_RDONLY) = 1226606 fstat(12, {st_mode=S_IFREG|0664, st_size=12685, ...}) = 026606 fstat(12, {st_mode=S_IFREG|0664, st_size=12685, ...}) = 026606 fstat(12, {st_mode=S_IFREG|0664, st_size=12685, ...}) = 026606 fstat(12, {st_mode=S_IFREG|0664, st_size=12685, ...}) = 026606 mmap(NULL, 12685, PROT_READ, MAP_SHARED, 12, 0) = 0x7fc6b917d000
76 | Chapter 6: Verifying Changes
www.it-ebooks.info

Note that apc.stat has some administrative overhead—you’ll need to be able to clearthe APC cache when code is deployed, for example. See Chapter 18 for more informationon opcode caches.
Use of the tools in this chapter allows you to see exactly what’s happening when code isexecuted, and therefore to verify accurately whether changes made for performancepurposes are successfully reducing the amount of work being done at different levels ofthe application. While we cover load testing in Chapter 20, load testing tools shouldalmost never be used for before/after performance testing of specific changes, sincethey’re unable to provide the accuracy, detail, or introspection necessary to verify theimpact of what are often quite small individual changes.
Analyzing Application Performance | 77
www.it-ebooks.info

CHAPTER 7
Infrastructure Design and Planning
Whether you are beginning to plan for the launch of a large website or managing thegrowing pains of an existing site, you will quickly come to the point where one serveris not enough to handle the traffic to your site, or you need more reliability than a singleserver can provide. However, the leap from a single server to a multiserver infrastructureis a large one. There are a number of ways to architect your environment to ensure fastresponse times to your visitors and allow you the potential to further scale in the future.
Your infrastructure design will vary greatly based on your website’s requirements. Whatkind of high availability do you require? What response times will your users or yourmanagement consider acceptable? Does your site require any “extra” services or appli‐cations, outside of a standard LAMP stack? All of these considerations and (of course,expected traffic to the site) will need to be taken into account when designing, building,and maintaining a multiserver hosting environment. There is no silver bullet solutionfor everyone, but we can provide some guidelines that should make it easy to find theright solution for your particular needs.
Horizontal and Vertical ScalingThere are two approaches to scaling out an infrastructure to add additional resources: horizontal scaling (“scaling out”) and vertical scaling (“scaling up”). Horizontal scalinginvolves adding additional servers while vertical scaling involves adding more resourcesto existing servers. A good infrastructure plan will take both of these scaling approachesinto account, as there are times when one may be more appropriate than the other.Initially, this consideration may be used to consider when to migrate from one serverto multiple servers. For larger infrastructures, the same logic can be applied at a largerscale. As an example, let’s consider a single-server infrastructure like that shown inFigure 7-1.
79
www.it-ebooks.info

Figure 7-1. Single server running web and database services
Not all site admins have the resources to launch a site with multiple servers. This is notnecessarily a bad thing—many sites can get away with using only one server, which givesa cost savings over hosting multiple servers as well as keeping system administrationoverhead to a minimum. With today’s multicore CPUs and inexpensive RAM, it’s easyand relatively cheap to host your site on a machine with enough power to run all therequired services. But how do you know when one server is no longer enough?
There are a number of factors to consider when trying to answer the question of whetherit’s time to add another server:Resources
As your resource usage increases due to additional site features or an increase intraffic to the site, you may start to see resource contention on the server. For ex‐ample, two processes both needing a lot of disk I/O can dramatically slow each otherdown. Can your current server be allocated more resources (RAM, CPU, etc.)? Thisis generally easier to do for virtual machines than for physical servers. For example,you may be able to solve an issue by adding more RAM to a server. However, it isalso important to consider if adding more RAM to a server might mean that youare now limited by CPU, network, or I/O resources on the server—and you maynot have the ability to increase those resources quite as easily.
CostsThis doesn’t just mean additional hosting costs, but may also mean more systemsmanagement overhead. As your infrastructure grows to include multiple servers,adding one more server should not mean a huge increase in systems managementoverhead (read up on configuration management in Chapter 9); however, makingthe initial jump from one server to multiple servers likely means you will need tostep back and reanalyze your management plan, potentially starting to use a con‐figuration management system for the first time.
80 | Chapter 7: Infrastructure Design and Planning
www.it-ebooks.info

High availability (HA)If your entire site is hosted on a single server, it just takes that one server goingoffline for your site to go down. If this situation is unacceptable to clients or businessowners, you will likely need multiple servers to offer better reliability. In essence,services will be offered by several servers, and any data will be synchronized acrossthem.
Generally, outside of HA considerations, it’s fairly common to scale vertically to theextent that is cost effective to do so—once you reach the point that scaling vertically isgoing to be more expensive than scaling horizontally, it is time to start adding moreservers. However, this doesn’t always hold true in practice, for a couple of reasons:
1. Adding resources to a server can be more difficult and time-consuming than simplyadding an additional server to your infrastructure. It also can involve bringing theserver offline, which is not ideal.
2. As sites grow to the point where they need additional resources, usually by thatpoint there are business requirements in place that necessitate some form of highavailability.
3. As a single server becomes larger and more important, the ability to take it downfor security and feature updates starts to disappear. Eventually you end up with asingle outdated and complex server, which is very problematic from a systems per‐spective.
Therefore, most infrastructure managers figure out a general server specification thatwill work for them and provide some room for growth—usually this server specificationwill differ between different services (e.g., one spec for web servers, one spec for DBservers). When a new server is needed, it is deployed with those predetermined speci‐fications. This may be a more powerful server than is necessary for the short term, butit will give the service room for growth and ensures you have some standardization inservers (making them easier to manage).
Many times, knowing when to scale horizontally is more difficult than knowing how toscale horizontally. The world is filled with infrastructures where there are many webservers, all bottlenecking on a shared Memcache instance. To this end, we will nowdiscuss methodologies for categorizing services and knowing when (and where) to addmore servers.
Horizontal and Vertical Scaling | 81
www.it-ebooks.info

Service CategorizationA basic Drupal site can be separated into two distinct services: web frontend, and da‐tabase backend. The web service is responsible for handling incoming requests, pro‐cessing Drupal’s PHP code, and returning the results back to the requesting client. Thedatabase back end is queried during Drupal’s PHP execution in order to pull out settingsand data for the site. Every Drupal website will need infrastructure to support at leastthese two services. However, there are many more services that are often required toadd features or enhance performance and scalability. These services can be groupedroughly into the following categories (starting with the web and database services wealready mentioned):Web
Apache, Nginx, or another web server of your choice, plus PHP
DatabaseMost commonly MySQL, though Drupal core supports many other databases to alesser degree, including PostgreSQL, Microsoft SQL Server, Oracle, and SQLite
Frontend proxiesVarnish, CDN, Nginx, or other proxy caches
Other caches and data storesMemcache, Redis, MongoDB, etc.
Search backendsApache Solr, Elasticsearch, Sphinx, etc.
Load balancersHAProxy, Nginx, IPVS, etc.
This generally categorizes most services that would be run as part of a Drupal website.The next step, once you’ve categorized your services, is to figure out which services mayrequire their own server (or servers), and which services can safely coexist on the sameserver. Separating services into the different categories will give you the opportunity toscale out each service as it becomes a bottleneck for your site. As a visualization tool,we can represent each service category as a layer of the overall infrastructure, as illus‐trated in Figure 7-2—each layer can be expanded out horizontally by adding additionalservers.
82 | Chapter 7: Infrastructure Design and Planning
www.it-ebooks.info

Figure 7-2. Infrastructure layers
Working Well TogetherIt’s important to analyze your services to figure out which may or may not work welltogether on a server. Some services require substantial memory, CPU, or disk I/O re‐sources. Those may run fine on a server with another service that requires minimalresources, but you most likely won’t want to combine two I/O-intensive services on thesame server, since they would be competing for resources. As services are split ontoseparate servers, network traffic also becomes a significant factor. Let’s take a look at afew common services and what their typical resource consumption is like. The followingexamples are intended to give a general idea of resource requirements, but your re‐quirements may be very different depending on your site’s specifics:Web services
Web services will consume a moderate amount of CPU for PHP processing. Youwill also need enough RAM to support large numbers of web server processes asyour traffic spikes. While this is a general rule for any website, Drupal in particularand many PHP CMSs in general have fairly high I/O latency requirements due tohow many PHP files are loaded to serve each request. While opcode caches suchas APC can help with this, you don’t necessarily want to put an I/O-bound serviceon your web nodes since performance will deteriorate as it competes with the Dru‐pal PHP processes.
DatabaseDatabases typically will consume large amounts of RAM and can require moderateCPU resources. A well-tuned database will not touch the system disk often, exceptif it is write-heavy. However, you want the disk I/O to be as fast as possible when itis required. Because databases can require so many resources and for optimal per‐formance may need to “hog” disk or CPU resources in spikes, the database is gen‐
Working Well Together | 83
www.it-ebooks.info

erally the first thing to be separated onto its own server, where it can be finely tunedand guaranteed its own resources.
Reverse proxyVarnish is a common example of a reverse proxy used as a frontend cache sittingin front of your web server. While Varnish should be allocated a moderate amountof RAM, its CPU and disk usage are fairly minimal.
Alternate Drupal cacheMemcache, often used as an alternative cache for Drupal, can be used to offloadcache queries from your database server. Much like Varnish, Memcached (theMemcache daemon) will require RAM—a small to moderate amount dependingon your site’s needs—but will not consume a lot of CPU or disk resources.
Additional servicesOf course, additional services will vary greatly in their resource utilization, so youwill need to analyze each service independently. Solr, for example, can be memory-and I/O-heavy, depending on its usage.
Once you understand the resource requirements for the services you will be using, itwill be easier to see which services can coexist on the same server without competingfor resources.
Example Two-Layer ConfigurationAs mentioned previously, one of the most common ways to split services for a Drupalsite is to use two servers, with the first server dedicated to web services and the seconddedicated to the database. If high availability is a requirement for your site, then thiswould become four servers: two web nodes and two database servers, all with some formof load balancing and/or failover mechanisms. For the sake of a simple example, we’llassume no HA requirements in this setup and start with only two servers.
Let’s assume that we want to run Varnish as a reverse proxy and Memcache as an alter‐nate Drupal cache (these configurations are covered in depth in Chapters 19 and 16,respectively). Considering that we are working with two servers, it makes the most senseto run those services on the web server, along with Apache, httpd, Nginx, or whicheverweb server you have selected.
In most environments, we will isolate the database service on its own server if at allpossible. As we went over earlier, this is so that it can be guaranteed resources and won’timpact other services with its I/O and memory demands. Both Varnish and Memcacheare able to run on the web node without stealing too much CPU time away from httpd—they will both have a memory limit, so that httpd is sure to have enough to deal withtraffic spikes when it may need to spin up a lot of processes. Figure 7-3 shows whichservices are running on which server in this setup.
84 | Chapter 7: Infrastructure Design and Planning
www.it-ebooks.info

Figure 7-3. Two server configuration
As your site grows in complexity and traffic, you are likely to see performance bottle‐necks in either the web layer or the database layer, or sometimes both. An examplebottleneck in the web layer would be if you are consistently serving a high number ofclients and the web node is not able to handle them all. An example bottleneck in thedatabase layer would be if you have a large number of queries or a few large queries thatare slowing down the database response time.
In order to deal with the increased demands of the site, you can scale each of the layershorizontally by adding more servers. Most services are pretty trivial to scale in thismanner, and growing the infrastructure in this way allows you to specifically scale upeach service layer as it becomes a priority. (The database layer requires a bit morethought and strategy to scale beyond one server; we’ll go into more detail in Chap‐ter 13 on scaling strategies specific to the database layer.)
This “two-layer” approach can work for some time, though eventually you may want toreassess your layer definitions and potentially separate things even further. For example,if you want to add Solr search to your site, that may not fit well on your current webnodes, and it’s not typically something that you would want to run on the databaseservers due to I/O and RAM contention. Thus, we often add an additional layer for theSolr service. Another example would be if Varnish needs more RAM than is availablefor it on the web servers: in that case, you could separate it into its own layer of serversthat sit in front of the web nodes. The benefit here is that you can then scale out eitherthe frontend caching layer or the web layer separately, as needed. Our next example willshow a larger infrastructure with such a setup.
Example Larger-Scale InfrastructureThe majority of websites will get along quite well following the preceding example of atwo-layer setup separating web services (and some additional caching services) into one
Example Larger-Scale Infrastructure | 85
www.it-ebooks.info

layer of servers and databases into a second layer. But for larger sites, or those that havespecific HA, security, or performance requirements, it may be necessary to implementan infrastructure with more than two layers. As in the previous example, in this case,we will strive to separate services out into their own layers so that they can be managedand scaled separately.
As soon as your infrastructure includes more than one web server, youwill need to configure some sort of shared or synced file system for theDrupal files/ directory. We cover a number of options for sharing filesbetween servers in Chapter 10.
For this example, we’ll assume that the requirements for a frontend cache (we’ll useVarnish in this example) are large enough that it warrants having its own dedicated layerof servers. We’ll also assume that the site will use Solr heavily enough that the Solr serviceshould be separated off into its own layer. Add to that the web and database layers, andwe end up with the service layers shown in Figure 7-4.
Figure 7-4. Example multilayer configuration
One benefit of separating Varnish onto its own servers is that it can then provide loadbalancing and fault tolerance for your web nodes. Given a pool of web servers, Varnishcan distribute the load between them during normal service, and if one of the webservers goes offline, Varnish will notice the failing server and stop using it for backendweb requests. While some larger infrastructures will have their own dedicated load
86 | Chapter 7: Infrastructure Design and Planning
www.it-ebooks.info

balancing devices, for many people, using Varnish to provide basic load balancing workswell and is cost-effective.
Going into such an infrastructure design, it’s likely that you will want some form of highavailability for the site, so we’ll assume you’re starting with at least two servers per layerin order to avoid a single point of failure.
Each service layer here starts with two servers, and the servers within a layer have rep‐lication or shared data between them such that if one server in a layer goes away, theother server is able to serve requests in its place. During times that all servers are online,load is shared between all servers in a layer in order to improve performance. Refer toChapter 19 (Varnish), Chapter 18 (httpd), Chapter 13 (MySQL), and Chapter 17 (Solr)for specific setup and configuration settings for a similar infrastructure design.
Development and Staging EnvironmentsOnce you have designed your production infrastructure, an important next step is toallocate resources for development and staging environments. As the complexity andavailability requirements of your site grow, it becomes even more critical to have aseparate staging environment to test out code changes, module updates, and configu‐ration changes.
For a staging environment to provide the most benefit, it should mimic the productionenvironment as closely as possible, complete with load balancers, database replication,and any other configuration found in the production environment. Obviously this canbecome quite expensive if you are literally doubling your infrastructure to provide astaging environment. There are a number of ways to cut costs for the staging environ‐ment, but it’s important to keep in mind the trade-offs you are making when you don’thave an exact replica of the production environment. Some frequently used methodsfor cutting costs when setting up a staging environment include: Reducing the number of redundant servers
For example, the production environment may have five or six different web servers.For staging, you could likely get by with only two servers set up in a similar fashion.While this doesn’t mimic production 100%, the configuration should be closeenough to catch most bugs triggered by having multiple web nodes.
Virtualizing resourcesEven if your production environment is mostly or entirely run on physical servers,it’s possible that you could run a staging environment using some or all virtualservers. It’s important to remember, though that this—like any difference betweenthe two environments—means that you may run into bugs in production that youdon’t hit in the staging (or vice versa).
Development and Staging Environments | 87
www.it-ebooks.info
Using lower-end serversIt is possible to use less expensive servers to host your staging environment. How‐ever, this can lead to a couple of issues. First of all, as with the previous examples,this can lead to bugs or performance issues in the production environment that arenot repeatable in the staging environment. Secondly, if the staging servers are sounderpowered that they don’t perform well at all, it could lead to developers totallyignoring the staging environment because “it’s too much of a pain,” which in turncould lead to untested or poorly tested code making its way to production.
The staging environment should be used not only to test code and database updates,but also to test software and OS updates. Because these servers closely mimic yourproduction servers, testing software updates on staging servers can help prevent down‐time in the production environment when an update has unexpected consequences.
Providing a stable environment for your developers is another important considerationwhen designing an infrastructure. As mentioned previously, one way to implement adevelopment environment is to share the staging server resources—for example, settingup separate development virtual hosts and databases on the same servers used for stag‐ing. Another option would be to use virtualized resources (or a lower-cost virtualizedserver if your other servers are already virtualized). In order to cut costs, sites with lowerdevelopment activity could get away with only spinning up the development virtualizedenvironment occasionally, when needed, instead of leaving it running all the time. Athird option is to distribute the development environment so that it can be run locallyby your developers on their workstations or laptops. Most developers can’t or won’t wantto deal with setting up the system-level applications such as httpd or mysqld; however,by providing a virtual machine image (or using a tool such as Vagrant to build one onthe fly using Puppet or Chef configuration management scripts), developers can prettyeasily run a virtual machine that pretty closely mimics the production and staging con‐figuration. We cover Vagrant in more depth in Chapter 9.
Internal Network LayoutIf you are in a hosted environment, you may not have much choice about how thenetwork is configured. However, if possible, it’s preferable to set up a separate backendnetwork for your devices to communicate on instead of using their public networkinterfaces. It’s best that most servers not even be accessible on a public IP address —only those with user-facing services need to have a public IP.
Setting up a backend network not only can improve performance, but also can increasesecurity. In almost every case, there is no reason for your database servers or other not-public-facing services to be open to the Internet. In order to access the servers, you canconnect through one of your public-facing services or, even better, create a dedicated“jump host” that is accessible to the outside world and is used specifically to access yourinternal hosts (see Figure 7-5). Don’t overlook the importance of securing your jump
88 | Chapter 7: Infrastructure Design and Planning
www.it-ebooks.info

host; it does no good to segregate your hosts onto a separate network if it’s easy for anattacker to gain access through your jump host.
When your frontend web nodes are experiencing high traffic, if they also had to com‐municate with the database over the same network interface you would start to seeslower database response times as well. Using a separate network for backend requestssuch as database traffic, as shown in Figure 7-6, means that you won’t be competingwith network traffic from external sources when trying to communicate with your in‐ternal hosts. By offloading this traffic onto its own internal network, you can also avoidpotential traffic charges with your hosting company and avoid possibly congesting thepublic-facing firewall or router with additional traffic.
Figure 7-5. Jump host
Figure 7-6. Backend network traffic
Internal Network Layout | 89
www.it-ebooks.info

Be sure to ask your provider about the availability of its “backendnetwork.” While providers spend a lot of money on redundant net‐working equipment for the public network, the backend networksometimes doesn’t get as much attention. If a backend switch goingdown can take down your website, it doesn’t matter how many redun‐dant switches are on the public network.
Utility ServersAs your site and infrastructure grow, you may end up with a number of services thatdon’t directly power your website, but are used to manage the servers, monitor services,or host code repositories. In many situations, infrastructures are deployed without autility server and all of these “side” services end up littered across various servers withoutmuch thought being given to where they should reside. This is not a very good solutionand can lead to problems as you scale. As you are planning your infrastructure, you maywant to consider a utility server that is built specifically for these sorts of supportingservices, or a VM host to create dedicated VMs for “one-off ” services.
Here are some common uses for a utility server:Continuous integration
Depending on your workflow, you may be using a continuous integration serversuch as Jenkins in order to test and deploy code between environments.
Code revision controlThe utility server provides a place to host your revision control system, such as Gitor Subversion.
MonitoringAs discussed earlier in this book, it’s important to monitor servers and services forperformance and stability. A utility server is potentially a good place to run suchmonitoring services.
Periodic jobsA utility server can provide a place to run all the “odds and ends” scripts that dosomething against either the website or the database—for example, Drupal cronand queue workers that need to run perodically and may require more resourcesthan a typical web request.
Configuration managementAs the number of servers you are managing increases, you’ll benefit immensely byusing a configuration management system (popular options include Puppet, Chef,and CFEngine). The utility server would be an ideal choice to run as the centralconfiguration management server.
90 | Chapter 7: Infrastructure Design and Planning
www.it-ebooks.info

There are, of course, other things that you could run on a utility server; the main ideais to have a secure, internal server that can be used to run jobs and services that mayrequire trusted access to other servers. In general, this should not include any servicesthat are publicly accessible from the Internet, because this host typically ends up beingtrusted to some degree on all of your other hosts—and that makes it an ideal target forattackers.
High Availability and FailoverFor many sites, being offline for any significant amount of time is unacceptable. Forthose situations, it is necessary to set up redundant servers and a method for detectingfailures and automatically switching over to the secondary server.
At the very least, for a Drupal site to remain online during downtime for a server, youwill need to plan failover for web and database services. If you have additional servicesthat are used by your Drupal site, you may consider it acceptable for those to be offlinefor some period of time as long as the core website is functioning.
There are different ways to approach high availability, and your approach may dependon a number of factors:
• Business requirements set for acceptable downtime• Whether or not failover needs to be completely automated• Whether certain failures could put the site in a “read-only” mode (for database
access and/or file uploads)• Whether you have a budget for hardware and staff time to implement high availa‐
bility
In subsequent chapters, we cover specific configurations to accomplish high availabilitywith various services. At this point, it’s important to figure out if HA is something yourequire (or may require in the future) for your website, and to look at the various serv‐ices, servers, and network equipment you will be hosting to get an idea of all the singlepoints of failure you may have in your infrastructure.
Hosting ConsiderationsSome websites end up being hosted internally if there are sufficient hosting resources;other situations call for paying for an external server (or service) host. If you are lookingfor an external hosting provider, there are many important aspects to consider, includ‐ing:
High Availability and Failover | 91
www.it-ebooks.info

CostAnalyze the cost for hosting your planned infrastructure. Include additional band‐width costs that you may incur. Also, look at how cost will increase should you needto grow your infrastructure by adding additional servers or dealing with increasedbandwidth requirements.
UptimeWhat kind of uptime does the host guarantee, and what is its average uptime forservices, etc.? Consider reading through public customer forums or hosting “status”sites, if it has such a thing. What kind of redundancy does it have in place for power,network, and cooling?
SupportWhat type of support is offered, and how does this correspond to your supportneeds? For example, do you want a host who will support only its own equipment,leaving you to handle all OS and application support? Or would you rather have ahost who manages the servers for you, so you only have to deal with Drupal specif‐ically? Does support cost extra, or is it included with your hosting plan (and to whatextent)?
BackupsAre servers backed up, and if so, on what schedule? Is backup size limited? Howlong are backups kept? Does the backup service cost extra? Where are the backupsstored, and are they mirrored to another location?
SecurityWhat kind of physical and network/server-based security is provided?
Failover and geographic distributionDoes the host offer servers at different geographic locations that could be used forfailover in the event of a disaster at one data center?
Virtualized Versus physical serversAre you looking to host physical servers (owned by you, or rented from the host),or virtualized resources? How will this decision affect your ability to scale in thefuture and to deal with estimated traffic loads now? Does the host offer the abilityto mix physical hosts and virtualized hosts as part of the same hosting plan?
We’ll cover specific details about virtualized and cloud hosting inChapter 11.
With the sheer number of hosting providers out there, it’s often very easy to find onethat appears to fit all of your needs, but it can be very difficult to find one that actually
92 | Chapter 7: Infrastructure Design and Planning
www.it-ebooks.info

delivers. Be sure to ask around and do some due diligence research before committingto any hosting provider. If possible, don’t jump into a long-term contract before you’reable to test out its service and support for at least a couple of months to be sure you arehappy.
SummaryScaling an infrastructure can be difficult, but when you take the time to plan out yourinfrastructure design in advance, it becomes a lot easier. Your infrastructure plan doesn’tneed to be set in stone, but it should be clear and forward-thinking enough to be usedas your infrastructure grows and changes during the lifetime of your site. Going throughthe process of categorizing potential service layers and plans for horizontal and verticalgrowth will ensure that you are much better equipped to deal with any infrastructurechange requirements you may be presented with in the future—either growth due toperformance requirements, or coping with adding or removing services to support yoursite.
It’s important to plan not only for a production infrastructure to directly support yoursite, but also for dedicated development and staging environments (some sites also adda separate QA or demo environment). In addition, it’s best to have at least one dedicatedutility server to host your central and supporting services that help the site and infra‐structure run, but don’t directly power the site itself.
Decide whether or not you need high availability for your site, and plan your infra‐structure resources accordingly. Supporting high availability for services generallymeans you are doubling the number of server resources in your infrastructure andincreasing your management overhead.
There are a number of things to consider when selecting a provider to host your website.Be sure to consider your options carefully and select a host that meets all of your needs—hopefully without breaking the bank.
Summary | 93
www.it-ebooks.info
CHAPTER 8
Service Monitoring
Running a website without service monitoring is an exercise in flying blind. Nobodycares about monitoring when everything is going well, but as soon as something goeswrong, the additional information and warnings provided can be instrumental inquickly and correctly diagnosing the problem.
There are different types of service monitoring. Tools like Icinga and Nagios are de‐signed to watch hosts and services, sending alerts when a service check falls outside anacceptable range. Other tools, such as Cacti and Munin, provide a graphical look atserver and service information in order to give historical context to performance andusage statistics. Still other applications, such as Zabbix, aim to combine these two typesof monitoring. Throughout this chapter, we’ll take a look at the various types of mon‐itoring systems and give examples of how they can be used to ensure your site is stableand performing optimally.
The Importance of Monitoring ServicesImagine a situation where you are using an alternate cache backend for Drupal, suchas Memcache—we’ll provide details on how to implement this in Chapter 16. Your cacheitems are now only accessible if the Memcached service is running. Imagine if the servicestopped responding, unexpectedly causing your entire Drupal cache to disappear. Thiswould force a great deal more load on your database server. Without service monitoringin place, it may take some time to figure out what the problem is; all you know for sureis that the site feels slower than normal. You might not realize what’s wrong until youstart going through recent Drupal log entries.
If you had a monitoring server that was configured to run periodic tests to ensure theMemcached service was responding as expected, you would receive an email or textmessage alerting you as soon as the service failed to respond. You would know exactlywhat was happening before you even logged into the server. Being able to respond to
95
www.it-ebooks.info

issues immediately, or even be warned as services start to deteriorate, is extremely im‐portant—especially if things can be fixed before users realize something is wrong.
Another important aspect of monitoring is collecting data over time. Having a stronggrasp of the baseline usage of your servers and services makes it easy to see when some‐thing out of the ordinary is occurring. One example is tracking general things such asserver load going up during times of increased traffic on the site. Going beyond that,monitoring could be used to track specific service information, like if and when yourAPC opcode cache (see Chapter 18) fills up. By setting up a thorough and reliable mon‐itoring system, you will be able to stay ahead of problems with your site as well asproviding yourself with an indispensable troubleshooting tool.
Monitoring Alerts with IcingaNagios is a very popular open source monitoring system that was initially released in1999. It gained popularity in the following years, though there were complaints in thedevelopment community about bugs going unfixed and general lack of transparencywithin the core of Nagios. In 2009 this led to a core group of Nagios developers (whofelt that their efforts to contribute to Nagios core were being ignored) to fork off a newproject, which they named Icinga.
Since forking, the Icinga project has grown substantially in both developers and users;it includes many bug fixes and feature improvements that are not found in Nagios whileremaining compatible with all external plug-ins. One of these improvements is a newweb interface that was designed to be more modern and configurable than that providedby Nagios. If you don’t have much of a preference of which system to use, then ouropinion is that the new web interface alone should be enough to encourage you to adoptIcinga over Nagios, unless you are paying for the Enterprise version of Nagios.
There are other open source and commercial monitoring options as well: these in‐clude OpenNMS, Sensu, Zabbix, and ZenOSS, to name just a few open source options.However, our past experiences have kept us coming back to Icinga when we need to setup a monitoring system. For that reason, we will be using Icinga-specific examples here,but we encourage you to review other options and pick the one that works best for you.
What to MonitorDeciding what to monitor and with what failure conditions should be viewed as aniterative task, where you continually improve the monitoring configuration in responseto false positives, or lack of alerts when expected. On the one hand, you want to monitoras many different aspects of your infrastructure as possible; but on the other hand, iftoo many alerts are being generated (or worse, false positives), they will be ignored andimportant alerts may go unseen. We recommend striving for the middle ground—
96 | Chapter 8: Service Monitoring
www.it-ebooks.info

monitoring as much as possible without becoming the monitoring system that crieswolf.
There are actually two things to consider when choosing what to monitor: first is whichservices and information to monitor, and second is how to set your thresholds. We’llstart with “what to monitor,” and then discuss how to select and refine threshold values.
It’s obvious that you would want to monitor all of your core servers and services. Thisgenerally means starting with simple checks such as ping or ssh checks against servers,and overall health checks against services—for example, checking that your websitereturns a 200 OK status code, or that the MySQL server accepts connections. Beyondthose simple checks, there is a virtually unlimited number of things that you can monitorwithin each server or service. For example, server monitoring might include:
• RAM and swap usage• Disk usage• CPU usage• Network connection count
And service monitoring might include things like web server response time to serve arequest or a whole wealth of MySQL information, such as:
• MySQL thread and connection counts• MySQL replication status• MySQL query activity• InnoDB buffer usage
It’s advisable to start with at least a set of “simple” checks for the various server resources(RAM, CPU, disk, network). Service-specific checks are more subjective and dependon what is important in your environment. You’ll definitely want some simple up/downchecks for services such as web and MySQL services (plus any others running in yourenvironment). Beyond that, review some of the common checks for MySQL to see whatyou feel is important. For example, if you know your InnoDB buffer pool is relativelyfull, it would be prudent to monitor its usage in order to have a warning before it com‐pletely fills up.
How to Tune MonitoringMost prepackaged and third-party checks for Icinga will come with suggested thresholdvalues when needed for warnings and errors. If you are creating your own checks, youwill need to set those thresholds yourself. In that case, it’s important to set them lowenough that you are sure they will trigger before or during a problem. A monitoringcheck does no good if it is configured to such a high value that the site can become
Monitoring Alerts with Icinga | 97
www.it-ebooks.info

unusably slow or go offline completely without the alert actually catching anything. Fornew sites and infrastructures, this can be a bit of a guessing game until you have estab‐lished some baseline data. Remember, you can always increase the alert thresholds ifyou are receiving too many false positives.
All plug-ins include options for setting warning and critical thresholds. When defininga check in Icinga, these command-line flags are passed either in the service or thecommand configuration file as part of the check_command option. Icinga will automat‐ically configure the hostname for the check command based on the host_name valueset in the service configuration file.
A service definition for checking the HTTP response time of your website might looksomething like the following to warn if the page takes longer than three seconds torespond, or send a critical alert if the HTTP response time is longer than five seconds:
define service{ host_name www1 service_description WEB_RESPONSE_TIME check_command check_http!3!5 }
Graphing Monitoring DataIn addition to setting up an active monitoring system to send alerts, it’s also very usefulto be able to view historic data for your servers and services. Building on the precedingexample, it’s great to receive an alert when the website begins to load slowly, but in orderto troubleshoot what might be causing the slowdown, it would be ideal to be able toview information like the number of Apache processes over the last hour, how loadedthe database has been over the last day, etc. By implementing a monitoring tool to trackresources over time, you can have this and other important graphs at your fingertips,whether for urgently debugging a problem or just for a periodic review of how servicesare performing.
Two systems that we use the most for this capability are Cacti and Munin. Both are verycapable applications, and the choice between them (or one of the many other options)can often boil down to personal preference. In the case of Munin and Cacti, both useRRDTool to graph their data and make it available from a web interface, and both havea plug-in system for monitoring various applications and server resources (generally,people find Munin plug-ins easier to implement). Figure 8-1 shows a sample Muninload graph.
98 | Chapter 8: Service Monitoring
www.it-ebooks.info

Figure 8-1. Munin load graph
There are many plug-ins available for Munin, Cacti, and other monitoring systems. Wegenerally try to graph as much data as possible, because even if something isn’t a problemtoday, it might end up being important at some point in the future. When consideringwhat to monitor, we recommend looking through the default and popular plug-ins forwhatever system you select. However, here is a list of things that we generally monitor:System data
This includes disk I/O, disk usage, network traffic and errors for all network inter‐faces, network connections, email activity/queues, CPU load, memory usage, totalswap usage, and swap activity.
Web server dataThis can include the number of Apache processes; APC memory usage and evic‐tions; Varnish requests, hit rates, and evictions; Memcache (or other external cache)memory usage, hit rates, and evictions.
Database dataMySQL has a ton of data, most of which is worth tracking: this includes slave lag;command types and counts; connections; InnoDB information such as buffer poolsize, activity, and I/O; query cache information such as memory usage and hits/inserts/prunes; slow query counts; table locks; and temp table types and counts.
Internal Versus Remote MonitoringThe location—internal or external to the rest of your server and network infrastructure—of your monitoring server(s) is very important. There is a case to be made for eitherlocation, and generally those that want to be very thorough in their monitoring will endup with both an internal and an external monitoring system in order to benefit fromeach. In fact, the services can and should be set up to complement each other insteadof duplicating all monitoring in both locations.
Internal Versus Remote Monitoring | 99
www.it-ebooks.info

The use of an external (hosted on a separate network, and generally geographicallydispersed) monitoring system is important for the ability to monitor externally facingservices. The reason for externally monitoring those services is quite easy to understand:you want to see the same thing your users are seeing. For example, testing a web pageload over a local network won’t see any delays introduced on your outbound network(or worse, if that network goes down). If you are testing from a separate network, how‐ever, the monitoring system will see those faults and delays. For this reason, we generallyrecommend setting up an external monitoring server to do at least basic ping and webpage load checks.
An internal monitoring system is much better suited to monitoring backend services(MySQL, Memcached, Solr, etc.) and server resources. Keeping that monitoring internalmeans you don’t need to worry about external network bandwidth or the security im‐plications of allowing an external host to connect to your internal services. As you addmore servers and service checks to your monitoring system, having it on a low-latencylocal connection can help improve monitoring performance.
100 | Chapter 8: Service Monitoring
www.it-ebooks.info
CHAPTER 9
“DevOps”: Breaking Down BarriersBetween Development and Operations
Historically, there has been a strict separation between development and infrastructure.In recent years, the “DevOps” methodology has become very popular, stressing theintegration of development and infrastructure operations in order to improve the codedeployment process. There are many aspects to DevOps, including close collaborationbetween development and infrastructure teams, easing the deployment process withautomation, and standardizing development and QA environments. This methodologybecomes even more important as infrastructure demands increase with new technolo‐gies, as development teams move toward rapid-release models (agile/iterative develop‐ment), and when dealing with distributed teams.
While you may not feel that you need to fully embrace DevOps for your environment,there are still many ideas that stem from DevOps culture that can prove beneficial. Forexample, ideas that are commonly used in DevOps environments that can help simplifydeployments and reduce the chances of regressions when deploying to the productionenvironment include having the ability to track changes to both code and infrastructureand roll back should something not work; maintaining separate (but nearly identical)environments for development, testing, and staging for code and infrastructure changes;and the use of revision control systems and continuous integration systems for codedeployment.
This chapter shouldn’t be considered a set of instructions on “how to do DevOps”;instead, it will focus on some of the underlying ideas and technologies that we hit onthroughout the rest of the book.
101
www.it-ebooks.info

Revision Control SystemsRevision control systems have a bit of an upfront learning curve, but once you get overthat, you will never go back to not using one. Generally these days, the argument is notover whether or not to use a revision control system for your code, but which revisioncontrol system to use. We’ll stay out of the “which revision control system is best” holywar here, and just stick with Git for our examples since Git is used for Drupal.org andall projects hosted there. If you’re not already sold on a particular revision control sys‐tem, here are some of the features you should consider when selecting one: Distributed system versus central system
Distributed systems have become much more popular of late, and with good reason—every copy of the repository stores all files and history locally, which not onlyspeeds up many commands, but allows developers to work offline.
Branching modelDepending on your development workflow and team size, having a revision controlsystem with a powerful branching model can be very useful (even mandatory). Thismakes collaboration and testing changes very easy.
PerformanceIs the system you’ve chosen fast enough for your common tasks?
That said, it’s not especially important which revision control system you use, just thatyou use one at all! While the trend has been toward distributed systems recently, andthose do provide some definite benefits, what’s important is that you choose somethingthat fits in with your workflow and the technical skill level of your team.
Locally Hosted or External ServiceOne of the first decisions you’ll need to make when implementing a revision controlsystem is whether to host it on a local server or to use an external service (potentially apaid service). There are many services, such as BitBucket and GitHub, that providehosting for code repositories. Some people prefer to use these services, not only for theease of use (and setup) they offer, but for the additional features, such as user manage‐ment and, in the case of GitHub, the easy forking and pull request model, which makesit simple for developers to review and discuss proposed changes. That said, any modernrevision control system can be set up locally with just a few commands, so if you don’twant or need the additional features offered by the hosted services, it’s cheap and rela‐tively easy to host yourself.
Not Just for CodeGenerally, your actual website code will be the first thing you think about when imple‐menting a revision control system. However, it’s also very useful for other things, such
102 | Chapter 9: “DevOps”: Breaking Down Barriers Between Development and Operations
www.it-ebooks.info

as keeping your system configuration management scripts in a code repository. Bystoring configuration management or other scripts in a revision control system, you getan automatic log of system changes, the ability to easily collaborate with other developersand/or system administrators, and an easy way to roll back changes.
Configuration Management SystemsLike revision control systems, configuration management systems are something thatpeople generally are reluctant to use at first, but once they get comfortable with them,there is no turning back (in a good way). Configuration management systems allow youto write code (in various languages, depending on the underlying system) to define howa system is configured. This has many benefits; for example, it provides a sort of “livedocumentation” for your servers, and it means you won’t have 50 manually copiedconfiguration files on a server (httpd.conf.bak, httpd.conf.old, httpd.conf.not.working…don’t pretend you’ve never seen something like that before!). An example of what youcan do with a configuration management system is store your custom PHP and Apacheconfiguration files on a web server, and ensure that Apache is running and configuredto start on boot. While this may seem like a very simple example, think of what happenswhen you have multiple servers and you suddenly need to make a configuration changeor bring up a new service. What if there are some special commands you use whendeploying something manually? It is much better to keep those commands in a config‐uration management system so that they are documented and not forgotten. Likewise,what happens if one of your servers crashes and needs to be rebuilt? With a configurationmanagement system that becomes a simple task, and you can ensure that everythingwill be configured as it was before.
Which System to UseThere are many popular configuration management systems. The most widely usedare CFEngine, Chef, and Puppet. A relative newcomer is Ansible, which aims to keepconfiguration management as simple as possible. While these all have the common goalof allowing you to write configuration to define a system, they go about it in slightlydifferent ways, using different languages for their configuration and different underly‐ing programming languages. All of these systems have active communities and devel‐opment and are fairly well supported by most Linux distributions. We suggest tryingthem each out and selecting the system that you are most comfortable with.
Pulling It Together: In-Depth Example with Puppet andGitWe mentioned the usefulness of keeping your configuration management scripts inrevision control, but what does that look like exactly? For this example, we’ll use Puppet
Configuration Management Systems | 103
www.it-ebooks.info

and Git, though it is just as applicable to other configuration management and revisioncontrol systems. There are a few pieces involved:
1. A master repository to which changes will be pushed.2. A mechanism to update the scripts on the master server (puppetmasterd) when
changes are pushed to the master repository. This could be a post-receive Git hook,or something external such as a Jenkins job.
3. Local clones of the repository where each developer/administrator can do workand then push it back to the master repository for review and/or implemenation.
For this example, let’s assume we have a utility server that will serve as both the Puppetmaster server and the host of the master Git repository.
First, we’ll set up a Git repository. This could be at any path you choose, but we’ll gowith something under /srv:
# mkdir -p /srv/git/infrastructure.git# cd /srv/git/infrastructure.git# git --bare init
The git init command creates an empty Git repository for us. In this case, the --bare flag is used in order to skip creating a working directory; since this is on a server,that’s exactly what we want.
That’s all that’s needed to start an empty Git repository, but we’ll also run a couple ofcommands to configure the git repository for a shared environment (multiple peoplecontributing to the same repository). Here we assume that you’ve set up an “infrastruc‐ture” Linux group—anyone with membership in that group will have read and writeaccess to the repository:
# git config core.sharedrepository 1# git config receive.denyNonFastforwards true# chgrp -R infrastructure .# find . -type d -exec chmod 2770 {} \;
The find/chmod command will set the sgid bit on directories in order to retain groupownership on new files created there—this will help keep permissions correct as peoplepush to the repository.
The Git repo can now be cloned by any user with SSH access to that machine whobelongs to the infrastructure group:
$ git clone util.example.com:/srv/git/infrastructure.git
Now that you have a local clone of the repository, you can add some files and push themback to the central repository. For this example we’ll assume we have a Puppet directorytree something like that in Figure 9-1.
104 | Chapter 9: “DevOps”: Breaking Down Barriers Between Development and Operations
www.it-ebooks.info

Figure 9-1. Puppet directory structure
When setting up the Pupppet master server, we will use a Git clone of this repositoryto populate the Puppet manifests/ and modules/ directories. In this case, we’ll configurePuppet to look in /srv/puppet for those files:
# mkdir /srv/puppet# git clone /srv/git/infrastructure.git /srv/puppet
You’ll need to edit your puppet.conf to point to that directory.
Next, for the automation bit. You don’t want to have to log in to the server, changedirectories, and do a git pull every time you push changes to the configuration man‐agement scripts! Instead, we’ll use a hook in order to update the Puppet master scriptseach time new changes are pushed to the repository.
Most revision control systems have the idea of hooks. A hook in thiscase is a script that gets run before or after a specified action (e.g.,before a code push is accepted, or after a code push). Each revisioncontrol system has slightly different hooks and names, but the basicidea is the same across them all.
In this case we’ll use the git post-receive hook, which is run after new code is pushedinto the repository. To implement this, we need to create the post-receive script in thehooks/ directory inside the git repository (on the server). The file we’ll put there needsto be named post-receive and be an executable script. We’ll use the following script:
#!/bin/shcd /srv/puppet/bin/echo "`/usr/bin/whoami` is updating puppet master config @ `/bin/pwd`"/usr/bin/git pull
Simply name that file post-receive, copy it into /srv/git/infrastructure.git/hooks/, andensure that it has executable permissions. Of course, the destination directory needs tohave permissions set such that anyone pushing to the git repository can update files
Pulling It Together: In-Depth Example with Puppet and Git | 105
www.it-ebooks.info

there. Following the same permissions as used for the git repository in /srv/git wouldwork well.
To test the new hook, commit some changes to your local Git clone and then push itback to the central repository. You should see the script output informing you that thedirectory is being updated.
Development Virtual MachinesIt can be difficult for developers if they are working in a development environment(think a local laptop) that is set up completely differently than the staging and produc‐tion environments. There are various ways to work around this—some people chooseto set up a development server with Apache virtual hosts for each developer and letthem develop on that server directly. However, this has the downside that developersaren’t able to test certain (infrastructure) changes without affecting other developers.What if it were possible to give each developer a local (virtual) environment that closelymatched production, and gave the developers the power to test any code and/or infra‐structure changes locally? There are a number of ways to do this, but if you already havea configuration management system in place, a tool called Vagrant will provide a veryeasy solution for creating just such a virtual machine (VM) environment.
Vagrant provides an easy way to create development VMs. It ships withsupport for VirtualBox, but also has a plug-in system that allows youto use Vagrant with other virtualization providers, such as VMware orAWS. More documentation is available at the official project website.
Typical Vagrant usage is to start with a bare-bones “base box,” which is a virtual machineimage with minimal packages and services installed. Vagrant provides support for mul‐tiple provisioners, which are the scripts run against the base box in order to configureit to meet your needs. In the most simple form, you could use a set of shell scripts to dothe provisioning; however, Vagrant really shines when used with a configuration man‐agement system (currently support is provided for Ansible, Chef, and Puppet). If youare already using a configuration management system with your production infra‐structure, it is very easy to integrate it into Vagrant in order to create an easily repro‐ducible development environment that closely matches the production server config‐uration.
Distributing a small base box image and then doing all configuration with a configu‐ration management system provides a few benefits:
• Initial download of the VM image is faster, since it isn’t very large.
106 | Chapter 9: “DevOps”: Breaking Down Barriers Between Development and Operations
www.it-ebooks.info

• Although the initial provisioning step may take a while (and transfer many packagesfrom the Internet), future changes to the VM can be made by updating the config‐uration management scripts instead of having developers download a full VM im‐age simply to make a few small changes.
• Infrastructure and configuration management changes can be easily tested on alocal Vagrant VM in order to give some assurance that things will work similarlyin other (test, staging, production) environments.
How to Distribute Development VMs with VagrantGenerally, you will want to start with a small base box image, and it should match theoperating system you are using on your production infrastructure. You can either createyour own (instructions are provided in the Vagrant documentation), or use one of themany base boxes that are publicly available on sites such as http://vagrantbox.es. Oneimportant thing to look out for is that you use a base box that includes support forwhichever configuration management provider you will use. This simply means that,for example, Puppet is installed on the VM image if you are going to be using Puppetfor provisioning.
Once you’ve settled on a base box, you can start integrating your existing configurationmanagement system. Most things will just work if you’ve done a good job of writingyour configuration management scripts; however, since the Vagrant image is startingout mostly unconfigured, it’s very important that your dependency order is set correctlyfor everything so that all services will work correctly after one run of the provisioningscripts. Depending on how you are doing code and database deployments in your pro‐duction environment, you may need to create additional scripts for deploying the sitecode onto the VM—for example, a “sitedeploy” Puppet module that gets a copy of thesite code from your configuration management system, imports initial data into thedatabase, and ensures that the Drupal database user is granted correct permissions.
Now, distributing the system to all developers and admins becomes a matter of distrib‐uting a copy of your Vagrantfile (Vagrant configuration directives) and the configura‐tion management scripts. The Vagrantfile can automate the downloading of a standardbase box image. Generally we keep all the configuration in a revision control system sothat it’s easy to make updates and everyone can pick them up with a git pull or similar.
Deployment WorkflowNow that your developers can quickly provision local virtual machines that closelymatch the production configuration, it’s time to take advantage of them to test changesto Drupal. We’ve mentioned the importance of a revision control system for managingyour site’s code, but it doesn’t stop there. Once you have a revision control system in
Deployment Workflow | 107
www.it-ebooks.info

place, you will also need a well-defined workflow in place for your developers, as wellas for code deployments to individual environments. A well-defined workflow will im‐prove site stability (you are testing code first and not editing directly on your productionsite) and should allow developers to easily collaborate on changes for upcoming releases,while still giving the ability to make quick “hotfixes” when a bug is found that requiresimmediate attention. There are a number of widely used and accepted workflows, andgenerally there is no wrong way as long as you find something that works for you andeveryone on your team agrees to stick to it.
Example Workflow with GitAs we mentioned, there are almost endless options for how to approach your develop‐ment and deployment workflow. We’ll give an example consisting of three environ‐ments: development, staging, and production. This is a standard setup that we stronglyrecommend. The Git branching model described here is based on a workflow initiallywritten about by Vincent Driessen and referred to as “Git Flow,” which is also the nameof the set of optional Git plug-ins used to easily work in the model. For the sake ofsimplicity, we won’t use so-called release branches; however, some people will find thosevery useful and should read Vincent’s full article for more information.
There are a couple of things to consider here: the Git branching workflow, and thedeployment workflow. The deployment workflow is easy to understand from a highlevel—we want new code to start in the development environment, then be pushed tostaging for testing before finally being pushed to production when it’s deemed ready.Figure 9-2 illustrates this workflow.
Figure 9-2. Code deployment workflow
We’ll get more in depth into the code deployment process in the next section. For now,it’s only important to understand that code changes flow in only one direction, exceptin the case of hotfixes, and that code is never edited directly on the servers, but is insteadalways pushed through the revision control system (although some sites make an ex‐ception for this rule when working in the development environment, with the caveatthat developers clean up after themselves so that the automated deployment tools con‐tinue to work as expected).
There are a number rules and guidelines that shape the development workflow and Gitbranching model:
108 | Chapter 9: “DevOps”: Breaking Down Barriers Between Development and Operations
www.it-ebooks.info
• Production is run from the master branch (specifically, from a Git tag pointing toa commit on the master branch).
• Staging is run from tags created from the develop branch.• Development is run from the HEAD of the develop branch.• Developers create branches off of the develop branch to do their work, and those
are merged back into develop once they’ve been reviewed.• If a hotfix is ever needed, a hotfix branch is created off of master and then merged
into develop for testing (and inclusion in the next full release). After testing, it ismerged back into master for deployment to production.
This gives us three distinct environments, with active development happening in thedevelopment environment, testing and QA happening in the staging environment, andcode being pushed to the production environment once QA is complete in the stagingenvironment.
To see exactly how this all works together, we can look at a specific developer branch asit makes its way through the workflow and eventually is deployed to the productionenvironment:
1. The developer creates a branch (we’ll call the branch “feature-go-faster”) off of thecurrent develop branch.
2. Code is committed to the developer’s branch, feature-go-faster, and the branch ispushed to the central repository for review.
3. The feature-go-faster branch is reviewed, and once it passes review it is merged intothe main develop branch.
4. Code on the development web server is updated with the latest code in the devel‐op branch. This may also involve syncing the current database and files from stagingor production back into the development environment.
5. Basic (or extensive, if that’s your thing) testing is performed in the developmentenvironment. At some schedule—which could be weekly, biweekly, monthly, or just“when there are enough changes to warrant a new release”—a release tag is createdpointing to the current state of the develop branch.
6. The new release tag is deployed to the staging environment. In many cases, this alsoinvolves syncing the current database and files from the production environmentinto the staging environment.
7. Testing is performed in the staging environment.8. Once testing is complete, the code from that tag is merged into the master branch
and a new release tag is generated.
Deployment Workflow | 109
www.it-ebooks.info

9. The new release tag is deployed to the production environment and any final QAtesting is performed there.
This design can be considered a starting point that can be adapted to fit your specificneeds. Smaller sites may choose to combine the development and staging environmentssince they have fewer developers and changes, or potentially fewer testing requirements.Other sites may add additional testing or maintenance environments.
Deployment with Jenkins CIAs demonstrated in the preceding workflow example, there are a few interactions be‐tween the various environments that need to happen during deployment. This includesthe actual code deployment (usually some sort of git pull or git checkout command);syncing files and the database back from production or staging; and potentially someadditional tasks such as running database updates, clearing the cache, taking a databasesnapshot, or even rebuilding Solr search indexes. There are many ways that these taskscan be run, but one popular option is to use Jenkins, which can connect over SSH (orwith Jenkins “slaves”) to the various server environments and run shell scripts, drushcommands, etc. on each server as needed. Using a continuous integration (CI) serversuch as Jenkins provides a number of benefits, such as job health and history tracking,job scheduling (time- or event-based), a fine-grained permissions system, and a webuser interface for those that aren’t comfortable running scripts from the command line.
Other popular deployment options include Capistrano or, if usingChef, the built-in Chef deploy resource.
It’s advisable to run Jenkins from an internal utility server if you have one. It’s importantthat access to Jenkins is limited as much as possible because once it’s configured, it willhave access to make changes to all of your site environments, including the productionsite. Access can be restricted with the Jenkins users/permissions system; in addition,access can be controlled with a firewall, or Jenkins can be configured to listen only onthe local interface, requiring users to use SSH port forwarding in order to connect tothe Jenkins web interface.
SSH port forwarding is a useful trick for connecting to Jenkins, as wellas other services that may be protected behind a firewall. Forwardingports over SSH can be done with the -L flag. For example, if Jenkins islistening on port 8080 only on the local interface on the server, youcould use ssh -L 8080:localhost:8080 servername.com and thenaccess Jenkins by pointing your browser to http://localhost:8080.
110 | Chapter 9: “DevOps”: Breaking Down Barriers Between Development and Operations
www.it-ebooks.info

In a simple setup, the jenkins user on the server running the Jenkins service can be givenan SSH key pair. Then, on each server that Jenkins needs to access (generally this wouldbe limited to only your web servers, but it depends on exactly what you are configuringJenkins to do), a local user can be created granting login access with the jenkins user’spublic key. In this manner, jobs can be configured to use drush (with a properly con‐figured drush aliases file), or by calling SSH directly:
'ssh deploy@webhost /usr/local/bin/deploy_script.sh'
The deploy user on the web servers can be given any username you like. In some cases,the account may need access to run scripts as another user—for example, running acache clear as the apache (or www-data) user so that it has access to remove files fromthe Drupal files/ directory. Those commands should be configured in sudo as needed.The following is an example file that can be placed in /etc/sudoers.d/deploy:
Defaults:deploy !requirettyDefaults:deploy !env_resetdeploy ALL=(apache) NOPASSWD: /usr/local/bin/site_cache_clear.sh
Note that the requiretty option must be disabled for the user that Jenkins is connectingas, since it will not be running from a valid terminal.
There are a number of different types of scripts that are typically run from Jenkins:Code deployment
These are scripts that connect to a revision control system to update/deploy codeonto the web servers.
Deployment helpersThese scripts are for handling tasks related to a deployment—for example, takinga database snapshot before an update, putting the site into maintenance mode,performing a cache clear, performing database updates, etc.
Environment synchronizationThese scripts are for syncing the Drupal files/ directory and the database betweenenvironments. While code is deployed from development to staging to production,database and files/ sync happens in reverse: the production database and files/ aresynchronized to staging, and then from there to development.
Site managementThese are periodic scripts that support the site—for example, running Drupal cron,daily database backups, etc.
Deployment with Jenkins CI | 111
www.it-ebooks.info

CHAPTER 10
File Storage for Multiple Web Servers
In this chapter, we will discuss the options for file storage in infrastructures with multipleweb nodes. Ensuring your file storage is coherent and synchronized between your webnodes is often the redheaded stepchild of infrastructure design—most everyone is awarethat you need all your web nodes to agree on database information, and quite a fewknow that your object cache needs to be coherent. However, the complication of en‐suring your static files are synchronized between web nodes is often overlooked.
Why is this important? Imagine that a user goes to your site and uploads an avatar. Thatuser’s avatar is written to disk on webnode1. If there is a delay in that file becomingavailable on webnode2—or worse, if its not synchronized at all—users will start seeingbroken image links for that file. Even if your site doesn’t accept user uploads, Drupalcreates its own JS/CSS aggregate files on disk, and if those don’t exist on both web nodes,you will quickly hit issues on the web node without them. Keep this in mind whiledebugging “strange issues” that may come up on your infrastructure (certain users notseeing CSS correctly, 404s on only certain web nodes, etc.). It is easy to forget howimportant coherent file storage is to a functional website.
Now that we understand why this is important, we can cover a few different methodsof maintaining this consistency when using multiple web nodes. In this chapter, we willdiscuss some of the more popular methods for Drupal deployments and their variousadvantages and disadvantages.
rsyncThe first option we should consider is, at first glance, the simplest. In this configuration,you would simply set up rsync processes between your web nodes to ensure that everyfile on webnode1 is also on webnode2, webnode3, and so on. This setup has a few prob‐lems, though. First, there will always be some sort of delay in file syncing. It must beacceptable to have broken links on pages during this sync delay. Additionally, this con‐
113
www.it-ebooks.info
figuration virtually requires session affinity. Having a missing user avatar during thesync delay for some users is a problem, but having the user who uploaded that avatarnot able to see it on his own profile page is a critical problem. Because of this, sessionaffinity is usually a requirement as it “resolves” the issue by ensuring that a user whouploads an avatar remains on the webnode he uploaded it on.
Even if you are entirely fine with having session affinity enabled and with the synchro‐nization delay, there are other complications. For example, there is no clear method forremoving files from web nodes where the file removal did not originally take place.During an rsync from point A to point B, how do you differentiate between a file havingnot yet been synced and a file having been deleted? Issues like this are why “just usingrsync” is becoming less of an answer to this problem.
GlusterFSGluster is one of the most popular options for file storage, and in particular file storagein cloud deployments (discussed in the next chapter). It is popular for good reason—Gluster is simple to set up, does not create a single point of failure, and works extremelywell for many types of deployments. It is in essence a clustering filesystem, but onedesigned for standard deployments and not necessarily an enterprise configuration(meaning it doesn’t assume you have access to high-quality disk backends, etc.).
GlusterFS works as follows. First, you define storage “bricks,” the servers and mountpoints where the actual data will be stored. Note that these can be the web nodes them‐selves; all that matters is that they exist, are relatively stable, and have a low-latencynetwork connection. You then can “combine” these bricks together using GlusterFS“translators.” This sounds complicated, but the default configuration is fairly good andlargely just creates a redundant array of these bricks with locking, caching, prefetching,and other performance and feature translators layered on top. You can then mount theGluster volume on each web node, and the Gluster translators will do the work of en‐suring both that files are kept in sync and that there are replicas of the files across thebrick cluster. Figure 10-1 illustrates a Gluster mount across two servers and the under‐lying Gluster brick on each server.
There are multiple ways to mount the Gluster volume: you can mount it via Gluster’snative protocol, using the FUSE (File Systems in User Space) driver, or you can mountthe volume over NFS (Gluster has an NFS emulation layer). There are mixed reports asto which is better, with many people agreeing that NFS is somewhat less stable, but betterfor high concurrency. Most people tend to use the native FUSE driver.
114 | Chapter 10: File Storage for Multiple Web Servers
www.it-ebooks.info
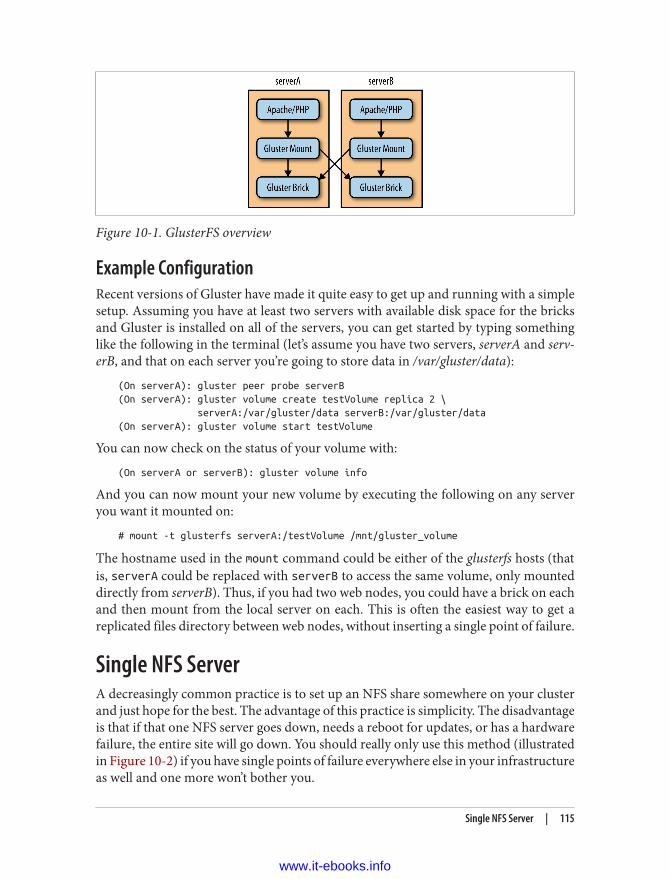
Figure 10-1. GlusterFS overview
Example ConfigurationRecent versions of Gluster have made it quite easy to get up and running with a simplesetup. Assuming you have at least two servers with available disk space for the bricksand Gluster is installed on all of the servers, you can get started by typing somethinglike the following in the terminal (let’s assume you have two servers, serverA and serv‐erB, and that on each server you’re going to store data in /var/gluster/data):
(On serverA): gluster peer probe serverB(On serverA): gluster volume create testVolume replica 2 \ serverA:/var/gluster/data serverB:/var/gluster/data(On serverA): gluster volume start testVolume
You can now check on the status of your volume with:
(On serverA or serverB): gluster volume info
And you can now mount your new volume by executing the following on any serveryou want it mounted on:
# mount -t glusterfs serverA:/testVolume /mnt/gluster_volume
The hostname used in the mount command could be either of the glusterfs hosts (thatis, serverA could be replaced with serverB to access the same volume, only mounteddirectly from serverB). Thus, if you had two web nodes, you could have a brick on eachand then mount from the local server on each. This is often the easiest way to get areplicated files directory between web nodes, without inserting a single point of failure.
Single NFS ServerA decreasingly common practice is to set up an NFS share somewhere on your clusterand just hope for the best. The advantage of this practice is simplicity. The disadvantageis that if that one NFS server goes down, needs a reboot for updates, or has a hardwarefailure, the entire site will go down. You should really only use this method (illustratedin Figure 10-2) if you have single points of failure everywhere else in your infrastructureas well and one more won’t bother you.
Single NFS Server | 115
www.it-ebooks.info

Figure 10-2. Single NFS server
HA NFS ClusterWhile a single NFS server is usually a poor idea, there are other configurations that arequite useful and still use NFS as the protocol of choice. One such setup is to use DRBD(a kernel-level distributed remote block device) to replicate the actual block device NFSis hosted on. This allows you (with some significant configuration) to successfully failover an NFS mount without having stale file handles on the client side. This configu‐ration (shown in Figure 10-3) is somewhat difficult to get correct, but is one of the fewways to have truly highly available NFS.
Figure 10-3. HA NFS cluster
116 | Chapter 10: File Storage for Multiple Web Servers
www.it-ebooks.info

Example ConfigurationThe configuration of HA-NFS actually has very little to do with NFS and more to dowith having a truly (and absolutely) replicated block device. NFSv3 has no concept offailover, so when you do actually failover between two servers, the challenge is con‐vincing it to “look over there” during the failover and then pretend like nothing hap‐pened. Heartbeat and DRBD are surprisingly good at this.
This whole system depends on two things. Firstly, NFS file handles on the client sidenot only depend on the IP address and NFS statd hostname, but also on the inode onthe server itself. DRBD allows you to have these inodes be the same between two servers,which is a core requirement, since if all the inodes suddenly changed, everything wouldbreak. Secondly, NFS has a directory where it stores state information, and DRBD isaccurate enough that you can synchronize this directory between the two servers, aswell as the data itself. Once you have the data and this state information perfectly re‐plicated between the two servers, failover becomes much more possible, as the eventitself looks like just a momentary network failure to the NFS clients.
Setting Up DRBDThe first step in setting up DRBD is to create two identical partitions on two servers.They must literally be exactly the same size. You must then install DRBD—this willinclude the userland utilities and a kernel module. Start the DRBD service and you canbegin with the standard setup procedure.
We assume DRBD version 8.4 in the following discussion, if you areusing 8.3, we recommend following the instructions on the DRBDwebsite (http://www.drbd.org).
Edit /etc/drbd.conf (or global.conf and r0.res in /etc/drbd.d, depending on your distri‐bution). There are two sections in the drbd.conf file: the global/common section andthe resource section. (These two sections map to the two different files in some distri‐butions.) The global/common section is very simple and should contain something likethis:
global { usage-count yes;}common { net { protocol C; }}
HA NFS Cluster | 117
www.it-ebooks.info

The resource section is where you define your volume and should have something likethis in it:
resource resourceName { on server1 { device /dev/drbd0; disk /dev/sdb1; address 192.168.1.2:7789; meta-disk internal; } on server2 { device /dev/drbd0; disk /dev/sdb1; address 192.168.1.3:7789; meta-disk internal; }}
Once you have this file in place and exactly the same on both servers, start the DRBDservice and proceed to set up the volume. The following commands will need to be runon both servers:
# drbdadm create-md resourceName# drbdadm up resourceName
At this point, you should be able to run cat /proc/drbd and see the state of the volume.It should list the two servers as both up, in the “Secondary/Secondary” state, and “In‐consistent.” This means that the two physical devices are not synchronized and thatneither server considers itself the “primary” (the server receiving reads/writes with thevolume mounted). Now let’s perform our first synchronization. Run the following com‐mand on the server you want to be the primary:
# drbdadm primary --force resourceName
Note that this will copy every bit of data on the physical device on this server to thesecondary server. This is important if there is actual “legitimate” data on one of thesedevices—in that case, you would run this command on the server with legitimate data.This is an important consideration when resynchronizing a cluster or replacing a DRBDnode.
You can monitor the process of the synchronization via cat /proc/drbd. Once the syncis complete, you can format and mount this new DRBD resource on your primary server.The device name will be /dev/drbd0, and it can be treated exactly like a new partition(i.e., you format and mount it the same way).
This is a very general description of how to set up DRBD; you really should go to theDRBD website and read the detailed documentation there before ever attempting to useit in production. It is a complicated system, but exceptionally useful in many situations.
118 | Chapter 10: File Storage for Multiple Web Servers
www.it-ebooks.info
Setting Up HeartbeatThe part of this configuration that actually detects failure and then takes action on thatfailure is Heartbeat. This software is packaged in most distributions and should be easyto install. There are two ways to configure Heartbeat: the “v1” way and the “pacemaker”way. We recommend the v1 method for most people as it’s quite simple, and for a NFS-DRBD cluster, you don’t need anything more complicated. Heartbeat is used repeatedlyin many sections of this book (and many infrastructures), and most of Chapter 12 isdedicated to it.
Setting Up NFSThe NFS setup is mostly normal, with a few exceptions (they are weird exceptions,though!):
1. Stop nfs.2. Set the statd hostname to the same thing on both servers. On Red Hat-based sys‐
tems, this is located in /etc/sysconfig/nfs.3. Unmount rpc_pipefs. This may be difficult, and you may have to force the umount.
This is a virtual file system used for NFS4, and it’s mounted into the NFS statedirectory. We want to move this directory, so we need to unmount it.
4. Copy /var/lib/nfs to the DRBD mount and then delete the original /var/lib/nfs andsymlink the directory from the DRBD mount back to /var/lib/nfs.
5. Remount rpc_pipefs.6. Finally, on the other server, ensure that the statd hostname is changed, unmount
rpc_pipefs, and symlink /var/lib/nfs to the path where the NFS state directory wouldbe if the DRBD volume was mounted. (The same symlink command you ran onthe primary server will work here. This directory will only actually exist on thisserver when the DRBD volume is failed over. This is important, as this state direc‐tory must be synchronized between the two machines.)
TestingWe recommend starting Heartbeat (drbd, nfs, etc.) on the primary, mounting NFS onanother server, and either attempting a failover via the Heartbeat utilities or just shuttingdown the server you’re testing. For example (given heartbeat/drbd/nfs running on serv‐erA and serverB):
(on serverA): cat /proc/drbd# verify that you are master(on serverA): /etc/init.d/heartbeat stop(on serverA): tail -f /var/log/messages# watch it failing over and ensure there are no errors
HA NFS Cluster | 119
www.it-ebooks.info

(on serverB): cat /proc/drbd#verify that it is master(on serverA): /etc/init.d/heartbeat start(on serverA): tail -f /var/log/messages# watch it failing back and ensure there are no errors(on serverA): cat /proc/drbd# ensure that serverA is now master--there may be a resync period shown
During all of the above, your test website should never go down. (There may be briefstalls in service, but it shouldn’t go down completely.) If your website does becomeunavailable for a few minutes at a time around a failover event, consider mounting theNFS volume over UDP and not TCP. Some additional information and tips on thismethod of HA-NFS is available here.
Storage Area Networks (SANs)It is difficult to really discuss a SAN device (an enterprise appliance specifically designedto provide highly available shared storage) while comparing it to these other options.Very few people have the money or inclination to buy a SAN device for a single website.If you do have both the money and the inclination, you also probably have a very largesite (or, more likely, several). The summary here is that every option presented so farin this chapter is designed to get you partially to the feature set and reliability of a realSAN device. If a SAN is an option for you, then it is the obvious choice. However, it isa rarity that it is a realistic option.
If you rent space on a SAN from a provider, get details on exactly whattype of SAN it is (i.e., what brand it is) and how much it is provi‐sioned (how saturated it is). Providers have a tendency to oversatu‐rate SANs or call a regular file server a “SAN.”
120 | Chapter 10: File Storage for Multiple Web Servers
www.it-ebooks.info
CHAPTER 11
Drupal and Cloud Deployments
You’ve probably heard one of two things about “the Cloud”:
1. Cloud deployments are the future and the present; the be all and end all of flexible,dynamic, enterprise-grade, and agile infrastructure design.
2. Cloud deployments are entirely a marketing innovation and are championed bypeople who probably should be in the PR department, but somehow wandered intothe wrong meetings too many times and are now on the technical staff.
You can easily hear both of these arguments at any major conference (usually in thesame conversation and at high volume). You might say there is some disagreement inthe community on the merits of the cloud. We will try to clear up some of the confusionin this chapter.
What Is the Cloud?That this question must be asked is one reason some people find the concept of “thecloud” annoying. The term is used so often that it now means basically nothing (aphenomenon now known as “cloud washing”). For our purposes, we will be definingthe cloud as a virtualized hosting solution, where VMs can be created and destroyed ondemand via an API with no human interaction. This is a very common definition andfits clouds such as Amazon EC2 and Rackspace Cloud. Just to be absolutely clear, by“API” we mean a client-visible API that allows you to script automatic growth andshrinking of an array of servers.
Why Use the Cloud?The major advantage of a cloud deployment is flexibility. If you need 10 web nodestoday, 30 tomorrow, and 5 the next day, that’s something the cloud can give you that a
121
www.it-ebooks.info

typical hosting environment struggles with. This makes cloud deployments incrediblygood for startups and any venture where traffic varies greatly. They can also be excellentfor testing, as you often only need a VM for a matter of hours.
This flexibility is definitely revolutionary and is why the cloud is such a big deal rightnow. The ability to design a system that actively scales itself up (i.e., increases VM counts)as load increases allows for infrastructures that used to be impossible without a hugeinvestment. Some clouds even allow you to integrate into an existing hardware infra‐structure; for example, having a web node array to supplement your hardware web nodesduring times of high load.
This ability to dynamically adjust your infrastructure, and to treat hardware as a service,opens up huge possibilities and is very exciting.
Infrastructure OverheadOne of the reasons that, despite all of these exciting aspects, some people are still an‐noyed with “the cloud” is that there is a significant cost to building up the automationrequired for using it well. This cost (technical overhead) is glossed over by many, andas a result, people end up with virtualized infrastructures that are not doing them anygood (and may in fact be doing them significant damage). Let’s discuss an example.
Suppose you are currently testing your site with two web nodes and a database server,and you decide to move to a cloud deployment. You start the two web nodes and DBserver on this cloud deployment. You don’t have any automation, so you must configureeach of the web nodes by hand (at least partially—let’s say you have part of your webstack automated, but not all of it). What are you gaining at this point? Your new VMsare likely less powerful than the hardware you had before and they are certainly lessreliable—remember that these clouds are designed for automation, and a VM “disap‐pearing” is not unexpected. At least you can scale automatically though, right? No.Unless your automation is complete (meaning able to go from an “empty” VM or a savedimage to a working web node without interaction), your response to a load increase willbe very limited. You can manually start and set up new VMs, but that’s not going to beexceptionally effective. This is the big issue: to leverage the cloud, you must have fullyworking automation. There is a very real cost for this, and it’s a cost that is often ignored.
Prepackaged CloudsThere are other options besides trying to build this automation entirely yourself. Thereare providers that have built “managed clouds,” allowing you you to input your codeand database on one side and have your site hosted on their reliable, autoscaling infra‐structure on the other. The tools you are given are somewhat more detailed than this,but the idea of a black box for the infrastructure component is valid. Acquia Cloud andPantheon are examples of providers offering prepackaged cloud services for Drupal.
122 | Chapter 11: Drupal and Cloud Deployments
www.it-ebooks.info

The advantages to this are: you get some of the autoscaling benefits of cloud deploy‐ments, without the large investment in infrastructure building. The disadvantage hereis flexibility. If your site doesn’t fit the provider’s expectations for build or usage, youwill not have a good experience.
There is also a middle ground where you get to manage your own infrastructure, butmany tools and scripts are provided to help you automate it. An example of this isRightScale. There is still a lot of infrastructure investment required for this option, butless than if you were to start from scratch, and they give you a significant amount ofdocumentation.
Common Issues with Cloud Deployments and TheirMitigationsObviously this isn’t a book on virtualization, and your issues with cloud deploymentswill vary widely by what type of site you are hosting, its usage, and what technologiesyou are using. However, we can go over some common issues and how to mitigate them:Slow IO
This varies by provider, depending on what type of IO backend they use. Manycloud hosting providers have very slow IO backends when compared to a typicalhardware-based RAID host. This often impacts database servers the most, but itcan also slow down web requests depending on how many PHP files are touchedduring Drupal’s bootstrap. Mitigating this concern involves ensuring that you tunethe real-path cache, possibly turning off apc.stat, and ensuring that your DB serverhas enough memory and is configured to fully cache your data. These topics arecovered in Chapters 13 and 18.
Disappearing or failing VMsVirtual machines on most cloud providers are treated as a variable resource. Thisisn’t a failure of clouds at all; it’s by design. Hardware as a service cuts both ways.When designing your infrastructure, you need to be able to both take advantage ofthis (increase resources when needed, reduce when not) and prevent the negativeaspects from taking your site down. Test your high availability plan to ensure thatit will really work, as it will eventually need to be used.
Limited IP failoverA common method of building high availability into a system is to have a floatingIP address that moves between two servers in the event of a failure. This method isnot supported (or not supported well) by most clouds—for example, some cloudshave the ability to fail over IPs, but with a variable delay to the failover. Thus, al‐ternate solutions are often required. Many providers have these solutions built intotheir clouds; if not, you may need application layer failover or DNS failover. Wediscuss this to some degree in Chapter 12.
Common Issues with Cloud Deployments and Their Mitigations | 123
www.it-ebooks.info

In summary, there are very real advantages to cloud hosting and hardware as a service.It is very exciting to be able to handle load and build infrastructures that would neverhave been possible for smaller companies before. However, the hype around cloudhosting needs to be managed carefully. There should be a real reason for you to usecloud hosting, and you must actually plan for its use and the automation it requires.
124 | Chapter 11: Drupal and Cloud Deployments
www.it-ebooks.info

CHAPTER 12
Failover Configuration
A few chapters earlier in this book, we mentioned that we would cover how to actuallydirect traffic in a failover situation in a later chapter. Congratulations, this is that chapter!Your patience has paid off. Sadly, the wait may not be entirely worth it. Being able toconsistently direct traffic between two servers, depending on which one is marked “ac‐tive,” is tremendously important for high availability in general and many services thatback Drupal sites specifically. Having an HA MySQL cluster, NFS cluster, Solr cluster,and load balancing cluster all depend on this. However, it’s not the most exciting thingin the world. The general concept is very simple: you run a daemon on two servers, andthose two daemons ping each other fairly constantly. When serverA’s daemon doesn’tget a response from serverB’s daemon within a certain failure criterion, serverB is markeddown and traffic is directed to serverA. The interesting issues with failover configura‐tions are:
• What are the failure conditions?• Can we insert other conditions besides just a full host down? Service-level failure
conditions, perhaps?• How do you direct traffic consistently?• How do you deal with split-brain?• Wait, what is split-brain?• It is not a problem with my brain specifically, is it?• This seems scary; can’t we just take a downtime?
We will cover some of these issues here, starting with traffic direction.
125
www.it-ebooks.info

In most cases, we are assuming that whatever service you are failingover is already prepared for failover (i.e., set up to be synchronizedbetween the two servers in question).
IP Failover Versus DNS FailoverThere are two types of failover that are commonly deployed: IP-based failover and DNS-based failover. In essence, these two methodologies only differ in what “resource” ischanged in order to direct traffic. IP-based failover, not surprisingly, directs traffic viamoving an IP between two machines. Its major advantages are simplicity and very “im‐mediate” results. However, it is problematic to use in most cloud environments (usuallyyou cannot get an extra IP assigned for the failover IP, also called the virtual IP or VIP)and can be somewhat difficult to manage for those not used to it. This is as comparedto DNS failover, which involves changing a DNS record to point to the “new” server inorder to direct traffic.
DNS failover is a fairly common method of implementing HA in cloud environmentsand can be easier to set up, especially with some specific DNS services designed for it.However, the failover is definitely not as immediate or dependable as IP-based methods.DNS names have some implied caching in many cases, and services such as the NameService Cache Daemon (NSCD) can cause issues with failover lag. Due to this, you mustplan for the possibility of a “slow” failover, where some traffic continues to hit the “oldmaster” before the “new master” fully takes over.
In most cases, this decision will be heavily influenced, if not entirely decided, by howopen your provider is to IP failover/moving IP addresses between your servers. Someproviders won’t allow you to have an additional IP address assigned to your server touse for failover, and others are nervous about IP failover confusing their switches.However, these issues are fairly rare for dedicated server providers.
Service-Level IssuesOne might note that much of our discussion so far has centered on host-level issues.We have discussed directing network traffic between two full hosts and checking wheth‐er hosts are up from a network and OS perspective. This is nice, but it is fairly rare (orat least it should be) for an entire host to fail. More commonly a service will fail or startresponding slowly. In cases like this, an HA cluster must detect this and start a failover.Likewise, simply moving traffic from serverA to serverB sometimes isn’t enough to ac‐tually failover a service. Many times there are other actions that need to be taken, suchas setting read_only to false on a MySQL slave.
The failover system we introduce here doesn’t really handle service-level detection andfailover in and of itself, but instead uses external services and scripts. For example, to
126 | Chapter 12: Failover Configuration
www.it-ebooks.info

failover a MySQL service using Heartbeat, you could write a “mysql resource” script.This script would perform the failover and would be triggered in the event of a MySQLfailover scenario. As far as monitoring is concerned, the system we will cover here caneasily be triggered by an external source (i.e., it can be told to “failover this host”). Thus,you can use another monitoring system for services and have it trigger failovers. Acommon choice for this is Mon (not to be confused with Monit), a very simple frame‐work that can check for service health and then trigger Heartbeat upon a detected failure.
HeartbeatHeartbeat has been the de facto Linux failover tool for a very long time. It is quite stable,very well supported, and decently documented. However, it comes in two “versions,”and the difference between the two can be quite confusing. Heartbeat by itself (some‐times called Heartbeat v1) is a simple failover tool that moves resources and IP addressesbetween two services. It only supports two servers and is quite simple to set up and use.Heartbeat+Pacemaker (formerly called Heartbeat v2 or Heartbeat+CRM) is a full clus‐tering suite that is quite complicated to set up and use but supports complex configu‐rations and more than two servers. This level of complication is simply not needed forthe services that back most Drupal deployments. Because of this, we will only be cov‐ering Heartbeat v1 (henceforth just called Heartbeat).
Discussion of v1 versus v2 doesn’t imply actual software changes, butjust different types of configuration. The Heartbeat package and ac‐tual software are the same in both versions.
InstallationMost Linux distributions and *BSDs will have a Heartbeat package. It may also installPacemaker, but you can mostly just ignore that unless you really need advanced clus‐tering. Thus, to install Heartbeat you can just use one of the following commands:
# *yum install heartbeat*# *apt-get install heartbeat*
ConfigurationThere are three important configuration files for Heartbeat:authkeys
This sets the type of authentication for the cluster and the hash to use for authen‐tication.
Heartbeat | 127
www.it-ebooks.info

ha.cfThis is the general configuration file, defining the two nodes of the cluster, failuretimeouts, failback settings, and other major configuration options.
haresourcesThis defines the resources Heartbeat will be controlling. Usually this means IP re‐sources and various services to be started/stopped during resource acquisition andfailover.
We’ll look at some examples of these files next. In these examples, we have two serversthat are load balancing MySQL, named node1 and node2.
The authkeys file needs to be the same on both servers—they both needto have the same key to successfully be a cluster. Likewise, this file needsto be secured (not group or “other” readable/writeable).
Here’s an example authkeys configuration:
auth 1 1 sha1 your_secret_key_here
You can generate a secret key like this: dd if=/dev/urandom count=42>/dev/null | md5sum | cut -c1-32.
And here’s an example ha.cf configuration:
ucast eth1 _<the IP of the other node>_node node1node node2auto_failback on
The ha.cf file can become very complicated, but for some situations, it is as simple asthis. There are a few very important lines here. First, the ucast line is telling Heartbeatthe IP address of the other node and the interface on which to ping that node. This filediffers on each node (as the IP listed in each case will be the IP of the “other” one). Ifthis IP is incorrect, the interface is incorrect, or there is a firewall preventing this ping,Heartbeat will not work correctly (both nodes will believe themselves to be the masteras they cannot communicate, this is often called split-brain). Equally importantly, thenode lines identifying the members of the cluster must contain hostnames that actuallymatch the return of “hostname” on each node.
128 | Chapter 12: Failover Configuration
www.it-ebooks.info

The auto_failback line is actually quite important, too. If you set thisto on, resources will be failed back to their “home” node whenever thatnode comes back from a failure. If it is set to off, you will have to failthem back manually. Having this option off is generally safer, as youcan decide when you are ready to fail back to the “home” node andyou avoid the possibility of resources “ping-ponging” back and forthbetween nodes.
Finally, here’s an example haresources configuration:
node1 192.168.1.3/32/eth1 httpd mysqld _<resource4> <resource5>_
This file is very simple: you just list the resources that Heartbeat will be managing andwhich node each resource “belongs” to by default. A “resource” is either a Heartbeat-specific resource, such as IPaddr or Filesystem (file system mounts), or just an init script.So, you can manage system-level resources such as IPs and mounts, as well as servicessuch as apache, mysql, and memcache (via their init scripts).
So what IPs might you put in haresources for failover? You should never put the mainIP address for a server in this file and have it managed for failover. This would renderthe server unreachable upon failover. Instead, you should always assign an extra IP(often called the virtual IP or VIP) to be managed by Heartbeat. This IP will then be theone used by whatever service you want to failover. For example, if you were trying tofailover HTTP traffic between two servers, you’d request an extra IP from your provider,set up Heartbeat with it managed between the two servers, and then use that IP in yourDNS records. When it was failed over, traffic would then move transparently.
UsageOnce configured, using Heartbeat is quite easy. You start it via the init script (/etc/init.d/heartbeat in many cases) and can watch its progress in the system log. Once it’s fullystarted, you can failover resources by either fully shutting down Heartbeat on one ofthe nodes or using hb_takeover or hb_standby, two small tools that either set resourcesinto standby mode (i.e., fail them over to the other server) or take over resources fromthe other server. These utilities have three main options:all
Failover all resources.
foreign
Failover just those resources not “owned” by the current node (this goes back to theharesources file).
local
Failover only those resources “owned” by the current node.
Heartbeat | 129
www.it-ebooks.info

These small utilities are also how you integrate Heartbeat with an external monitoringsystem—you have it call them when a failure is detected.
130 | Chapter 12: Failover Configuration
www.it-ebooks.info
CHAPTER 13
MySQL
One could easily write an entire book on MySQL configuration, monitoring, and queryoptimization. Actually, many people have, and getting one of these books would be anexcellent idea. We will cover some facets of configuration and optimization here (thosethat directly relate to Drupal). This is a very large subject, and one any Drupal developershould be well versed in. Any content management system is in essence a very advanceddatabase frontend, and not knowing the underlying technology of your site and/orbusiness is asking for trouble.
Drupal and MySQL EnginesMySQL includes support for pluggable storage backends, putting data storage and re‐trieval entirely in their hands. There is even a CSV storage engine that literally storestables as comma-separated values (CSV) files. While pluggable engines is an interestingfeature and makes it possible for MySQL to be surprisingly flexible, in practice, InnoDBand MyISAM are the only engines you are likely to use.
MyISAM is an older-style engine with very limited data durability, simplistic caching,and very few advanced features of any kind. It excels in low-memory situations and onsome very poorly optimized queries. These days it is considered dangerous to actuallyuse MyISAM for production data, due to it not being crash safe and it lacking row-levellocking. However, it is important to keep in mind that MyISAM is used for temporarytables written to disk. So, while it shouldn’t be used for actually storing data, it is stillgoing to be used during query execution.
InnoDB is the flagship MySQL storage engine. It has been around for a long time, buthas recently seen a lot of advancement. It is very stable, and is now scaling across mul‐ticore CPUs considerably better than it has in the past. Some versions of InnoDB evensupport tuning parameters to make it use the full IO capacity of solid-state drives. As
131
www.it-ebooks.info

of Drupal 7, InnoDB is the default for new installations. If there is one thing to takeaway from this chapter, it is this: use InnoDB.
There are other engines that could be worth looking at that specialize in integratingother technologies or in data archiving. If you have a very specialized task, some of thesecan be useful; however, they are beyond the scope of this book and most Drupal de‐ployments.
Versions of MySQLIt has been an exciting few years for MySQL. While you could argue that developmenthad been stagnating, the purchase of MySQL AB and the immediate forks thereafterhave really accelerated development across the board. While many were concernedabout the MySQL ecosystem around the time of these forks, they have turned out to bevery positive for users. The one downside is that it’s now quite difficult to figure outwhich version of MySQL to use. To be clear, we will not be recommending one here.However, we will be covering the differences and pointing out that in most cases, what‐ever version “fits” best in your infrastructure (i.e., is easiest to install/update) is likelygoing to be fine for you.
Oracle MySQLOracle’s MySQL is what everyone thinks of as “MySQL.” There was definitely a periodwhere this fork was significantly lagging in scalability features, but that time is long past.If you have a recent version of Oracle’s MySQL and don’t need a specialized feature inanother distribution, you are likely to be fine with this version.
MariaDBMariaDB is a fork of MySQL by one of the project’s founder, Monty Widenus. Theoriginal goal of this project was to create a better version of MyISAM, but the projectquickly grew into a fork of the entire server as more developers joined the project.MariaDB has gotten a lot of traction recently, including being integrated into Fedoraand RHEL7 instead of Oracle’s MySQL. Some of the highlights that you may notice are:Aria storage engine
This is the result of the original goal of the project, creating a crash-safe version ofMyISAM. While it’s still not something you should use for your main database, itdefinitely is more generally usable and has some decent advantages for temporarytables (e.g., better buffering of data).
XtraDBXtraDB is a fork of InnoDB that includes some advanced instrumentation, hooksfor online binary backups, and many scalability changes. This version of InnoDB
132 | Chapter 13: MySQL
www.it-ebooks.info

is the default in MariaDB. You can optionally enable the mainline InnoDB, but mostpeople using MariaDB enjoy the “Xtra” features of XtraDB.
“Enterprise” featuresThere are some features, such as threading changes, that Oracle’s MySQL doesn’tinclude in the community (free) version. MariaDB ships with these in all versions.
If you look at the feature comparison charts available online, you can see many otherdifferences; however, concurrent development happens fast enough that many of theselists quickly become outdated or are somewhat debatable. We are fans of MariaDB ingeneral, but it’s fairly rare that you see a Drupal site that really needs any of these features.
Percona ServerPercona Server is a fork of MySQL that is developed by one of the leading MySQLperformance firms. In general, if you need one of the specific features in this version,you are going to be well aware of that fact. It is somewhat of a niche MySQL distributionfor those with extensive scalability requirements. However, many of the features devel‐oped by Percona in this MySQL distribution make it into other versions—XtraDB is anexample of this.
General ConfigurationThere are many books on MySQL configuration and many sources for template con‐figuration files. Due to this, we are not going to cover every configuration option, butinstead will focus on those that are most important for Drupal.
MySQL configuration can generally be split into global configuration, per-thread con‐figuration, and storage engine configuration. Let’s take a look at some of the importantsettings for each.
Global ConfigurationDrupal doesn’t require tuning of many nonstandard global options. Those you maywant to consider include:max_connections
This configuration option is pretty self-explanatory, but it’s often set far too high.This is because when max_connection errors are seen on the frontend, the problemis often assumed to be that max_connections is set too low. Usually, however, theproblem actually is that there are a massive number of slow queries running. Inmany cases, increasing max_connections only allows a server to thrash itself todeath more effectively. This limit should be seen as a safety maximum and shouldbe adjusted based on the amount of memory available. You can calculate memory
General Configuration | 133
www.it-ebooks.info

usage with a formula like the following to get something that is “close enough toaccurate”:
(global buffers) + ((per-thread buffers + tmp_table_size) * max_connections)
key_buffer
This is a very important buffer for MyISAM, which you should keep in mind is stillbeing used for temporary tables. Any sane default is likely fine (30–50 MB for adedicated server is not a bad starting point), but if you use a statistics script suchas mysqlreport and the buffer is constantly full, make sure you increase it.
query_cache_size
It is remarkably easy to talk about the MySQL query cache for a long, long time. Itis both a really effective cache that can increase performance dramatically and aterrible global lock that can destroy performance completely. For most Drupal sites,it is definitely worth enabling, but it’s best to not set this above 100 MB, and we tendto set it at 60 MB as a default.
Per-Thread ConfigurationPer-thread options are generally related to either temporary tables or the various buffersused in the execution of a single query. Many of the quality configuration templates,such as those from the IUS RHEL/CentOS repositories or Percona Tools for MySQLhave good defaults for these values. You can spend a lot of time tweaking and testingthe various buffers to very slightly increase performance for your specific query load.However, the benefit is often fairly negligible. In almost every case, the defaults are fine,and that time is better spent on query optimization. The only per-thread settings weoften recommend tweaking for a Drupal website are those affecting temporary tables:tmp_table_size/max_heap_table_size
These two variables control the maximum size of in-memory temporary tables.When a temp table exceeds this limit (or if a table contains TEXT/BLOB columns),it is copied to disk. In general you want to avoid this, while not increasing thesesettings to a size that is not sustainable for your server. Finding what is sustainableis the issue. In general, you could just take your maximum temporary table size andmultiply it by max_connections to ensure you have enough memory to supportevery connection with a temporary table. However, this isn’t a perfect method, asmany people do intentionally run with temporary table sizes that are “too large” fortheir server. These people tend to have historical knowledge of their database serv‐er’s usage to allow them to feel comfortable running “overcommitted” from a mem‐ory perspective.
134 | Chapter 13: MySQL
www.it-ebooks.info
These variables should be set to the same value, and both need to beset or the smallest value will be used.
Storage Engine ConfigurationUnlike most of the per-thread configuration, correctly configuring InnoDB is extremelyimportant. In particular, the InnoDB buffer size and transaction flush method are pos‐sibly the most important tunables for a Drupal installation. MyISAM has few importanttunables for a Drupal installation other than the generic key_buffer, so we will focuson InnoDB here:innodb_buffer_size
This configuration option defines the size of the global InnoDB buffer. It’s difficultto overstate how important this buffer is. The InnoDB buffer holds data cachedhere for reading, the insert buffer, as well as any hash indexes the engine builds foroptimization. Not only do you want a large enough buffer to hold your entire da‐taset, but you want it large enough to have free space for the insert buffer and hashindexes. The usual recommendation is to set this to two-thirds of your memoryspace, but we tend to start at around half and then monitor it from there. Drupalsites specifically tend to have some fairly high tmp_table requirements, and thatcan eat into your available memory.
innodb_flush_log_at_trx_commit
This option defines exactly how careful InnoDB is with your data. Possible settingsare:
0
Write out and flush the log to disk every second, no matter when a COMMIT is trig‐gered.
1
Write out and flush the log to disk at every COMMIT.
2
Write out the log at every COMMIT, but only flush every second.
InnoDB defaults to 1, which is fully durable and in theory will lead to no data loss evenon full power loss (this is very dependent on the backend IO device). This setting isexceptionally slow for Drupal, though, as it COMMITs quite a lot. Most people end upsetting this to either 0 or 2, as the risk is the possibility of losing up to one second ofdata. In most infrastructures, not only is that not a huge issue, but there are more likelyways to lose one second of data.
General Configuration | 135
www.it-ebooks.info

While losing one second of data isn’t that scary, what is sometimes anissue is the InnoDB transactional state getting out of sync with thebinary log. There are deployments where this is a significant prob‐lem, either because it’s difficult to resync the slave or because the slavesare very important to the correct operation of the site. In cases likethis, you will have to run InnoDB with more data protection and likelyshould ensure that you have a new enough version of MySQL withgroup commit (this combines COMMIT operations, reducing disk flush‐es).
innodb_log_file_size/innodb_log_filesThese settings can be important if you have a very frequently updated site. If youhave a lot of updates, it’s quite possible to fill up your log file space, which will forceInnoDB to process its log files immediately and can cause both IO spikes and queriesstacking up. The default log file size for InnoDB is actually quite low. Increasingthis to something like 256 MB is usually not a bad idea, but be aware it will increasethe time it takes InnoDB to recover from a crash (more logs to traverse).
The InnoDB log file size is one of the few settings that not only re‐quires a restart to load in, but also requires some work to move the oldlog files away. When you change the log file size, InnoDB will see theold logs and then throw an error because they are the wrong size. Itwill simply refuse to start. Because of this, you must fully shut downMySQL and move the ib_logfile files out of the way before startingMySQL with the new setting. It is extremely important that InnoDBshuts down fully and purges out the log files before you move themout of the way. Because of this, you must ensure that in
nodb_fast_shutdown is not set to 2. Having it set to 1 is fine, but 2 willnot perform a clean shutdown.
ReplicationMost every production deployment will need a replicated slave, at the very least forfailover during crashes and/or updates. Again, there are many books and tutorials onsetting up replication, and thus we are not going to cover this topic in detail. However,there are some Drupal-specific considerations:Replication type
There are three types of replication: statement, row, and mixed. Statement replica‐tion simply sends the SQL statements themselves to the slave, which then runs them.It is the oldest style of replication in MySQL. Row-level replication replicates theactual binary delta and applies it to the tables on the slave. Mixed replication is, notshockingly, a mix of these two modes. Where Drupal comes into this is for contrib
136 | Chapter 13: MySQL
www.it-ebooks.info

modules, which can have some poorly written SQL queries that don’t always complywith the requirements for statement-level replication. When a query like this is runon a recent version of MySQL that has statement-level logging enabled, a warningwill be put in the error log. You should watch for these warnings and consider row-level or mixed replication if it becomes a problem for you.
There are quite a few exceptions to the rules for which queries can beperfectly replicated with statement replication and which cannot. Ingeneral, the issues center around repeatability. For example, UPDATEstatements with a LIMIT clause tend to be the biggest offenders forstatement replication.
Slave lagMySQL replication is currently single threaded. This can be a problem, becauseDrupal has historically had a habit of running some longish DELETE queries tomaintain its various logging and metrics tables. Contrib modules are also guilty ofthis. Most of these issues have been fixed in core and many of the popular contribmodules, but if you ever use your MySQL slave for read queries, this is somethingyou need to actively monitor. Your slave server falling several minutes behind dur‐ing cron runs can lead to some very difficult-to-debug issues if you are not moni‐toring slave lag actively.
Read-only queriesPressflow 6, Drupal 7, and Drupal 8 have the ability to register a slave server andmark certain read-only queries to be sent to the slave. Pager queries (queries thatshow listings of information across several pages), for example, are often slave-safe.
There are modules that automate the splitting of queries between themaster and the slave, but they are not 100% accurate and we do notrecommend them. It is usually safer to manage this yourself via theslave options to Drupal Views or the _slave versions of Drupal’sdb_query routines.
Virtualized DeploymentsConfiguring MySQL for virtualized deployments usually involves making absolutelysure your dataset fits in RAM and then configuring InnoDB to be a bit less durable(using the flush_log_at_trx_commit configuration option described earlier). This isdue to most cloud systems having really below average IO throughput, which is some‐thing that is very important to most database systems and thus is an issue that must bemitigated.
Virtualized Deployments | 137
www.it-ebooks.info

Some other options for increasing IO throughput are:
• Configure a shared memory (SHM) mount/ramdisk and point the tmpdir config‐uration directive at it. This will write all temp tables to the memory mount andremove that IO from the disk backend.
This reduces the data durability of temp tables, and if your memorymount fills up, queries will start failing.
• Use striped volumes (RAID-0). This is mainly useful for Amazon EC2, and sometemplated server configuration packages, such as RightScale, even offer an auto‐mated way to stripe EBS volumes for use as MySQL volumes. These volume stripestend to increase performance somewhat, but are more useful in evening out per‐formance. EBS volumes tend to have very volatile IO throughput, and striping themtogether helps to alleviate this volatility.
138 | Chapter 13: MySQL
www.it-ebooks.info

CHAPTER 14
Tools for Managing and Monitoring MySQL
The last few years have been tremendously exciting when it comes to third-party toolsfor MySQL. We have gone from a few little tools here and there to professionally main‐tained packages of tools, with many of the utilities in these packages solving issues thathave been problematic for MySQL DBAs for a very long time. We will be covering a fewof our favorite packages in this chapter. We will not be covering any commercial (for-pay) utilities. There are many great ones, of course, but we will limit this chapter toeither open source or “free as in beer” utilities.
Percona ToolkitThe Percona Toolkit actually used to be called Maatkit, before its adventures in re‐branding. It was a must-have toolkit before the rename and has only gotten more sosince. It contains over 30 tools, varying from hugely complicated and impactful utilitiesto glorified output reformatters. Some of the most important tools include:pt-query-digest
There once was a tool called mysqlsla, which basically everyone used to read theMySQL slow query log and output reports showing the top slow queries in the log.This was very useful, but mysqlsla didn’t really progress much. pt-query-digest is areplacement that allows for running EXPLAINs automatically, monitoring processlists, and even generating ASCII graphs. Is it an overengineered tool for its purpose?Probably. Is it awesome enough that we don’t care about that? Absolutely.
pt-table-checksumWe recommend this tool for every replication cluster that uses statement-based ormixed binary logging (It is somewhat less needed for, and more importantly notsupported with, row-based replication). pt-table-checksum allows you to run a re‐plicated checksum across your cluster to ensure that the two (or more) servers areactually consistent. MySQL itself doesn’t have checksums or validation built into
139
www.it-ebooks.info
the replication engine, and this tool fills a critical gap. (Note that some MySQL forks,such as MariaDB, are now integrating checksums into the binary log.)
pt-online-schema-changeThis tool is very dangerous to use, but quite cool to think about using. This scriptautomates the somewhat common practice of ALTERing a large table by creating anew table with a new table definition and then filling that table from the old table,while triggers are inserted to update the new table in real time while the fill isexecuted. At the end of all of this, you switch the two tables. It’s a complicatedprocedure that is fully automated by pt-online-schema-change.
pt-index-usageThis tool can take a slow log (or general log), EXPLAIN the queries, and generatereports on index usage. It is a useful companion to pt-query-digest, more specificto index usage.
There are many more tools in this package, and we recommend taking a look at all ofthem. They generally make your life far easier when managing a DB server and exam‐ining query performance.
Openark KitThe openark kit gets less attention than Percona Toolkit, but it has some equally usefultools. While Percona Toolkit tends to be slightly more focused on performance opti‐mization and replication, openark is more focused on operational tools. These are a fewof the tools we have found most useful:oak-chunk-update
This tool takes a large UPDATE/DELETE statement and automatically splits it intochunks to prevent it from locking a large segment of an often-used table.
oak-kill-slow-queriesIn a perfect world, this script wouldn’t need to exist. However, perfection is sadlylacking in most database clusters. For those times when perfection is escaping you,we have this script. It connects to your DB and kills queries that take longer than aconfigurable time period. This is useful when you have a site with a known “bad”query that hasn’t been fixed yet and could possibly harm your database server’sperformance if left unchecked (for example, a query that only causes problem whenrun many times concurrently).
oak-purge-master-logsThis script can connect to your entire replication chain and then purge the masterlogs on a server (leaving a configurable number of logs). What is useful about thisis that it will check every slave server and won’t purge a log that a slave still needs.Thus, it is a safe way to purge master logs.
140 | Chapter 14: Tools for Managing and Monitoring MySQL
www.it-ebooks.info

oak-security-auditThis tool runs a quick audit of some standard security settings, accounts, and priv‐ileges.
oak-show-limitsThis script is really only useful for large installations, but it’s very useful for those—it shows the “space” you have left in AUTO_INCREMENT columns. This doesn’t soundcritical, right up until it’s incredibly critical.
mysqlreportmysqlreport has been the standard in “general MySQL statistics” for as long as we canremember. It should be run on every MySQL server at least once. This utility will printout current usage information for the query cache, key buffer, and InnoDB buffer pool,as well as detailed InnoDB statistics and much more. If you only install one of theseutilities, this should be the one. A guide for understanding its output is available here.We mentioned a few variables that are important to tune correctly for a Drupal/InnoDBMySQL instance in the previous chapter—this tool is how you would track those vari‐ables and validate your configuration. Let’s look at some example output, with com‐ments describing each section.
The first section of mysqlreport’s output describes the MyISAM key buffer cache: formost deployments, you are mainly interested in whether it’s 100% used or not. If it is100% used, it should likely be increased in size (note that even with an InnoDB server,the key buffer will be used for temporary and internal tables):
__ Key _________________________________________________________________Buffer used 14.00k of 30.00M %Used: 0.05 Current 5.50M %Usage: 18.33Write hit 0.00%Read hit 70.21%
The next section describes the breakdown by query type: in most cases, you will havefar more SELECTs than the volatile UPDATE/INSERT/DELETE/REPLACE options, but if that’sever not true, this will allow you to discover that and track it. If you suddenly see a hugespike in volatile statements, you may need to investigate why that is (a cache table beingrefreshed repeatedly, a spam network registering new users, etc.) and take action:
__ Questions ___________________________________________________________Total 1.81G 2.3k/s QC Hits 920.26M 1.2k/s %Total: 50.78 DMS 831.76M 1.0k/s 45.90 Com_ 39.21M 49.5/s 2.16 COM_QUIT 21.09M 26.6/s 1.16 -Unknown 91.11k 0.1/s 0.01Slow 2 s 68.31k 0.1/s 0.00 %DMS: 0.01 Log: ONDMS 831.76M 1.0k/s 45.90
mysqlreport | 141
www.it-ebooks.info

SELECT 809.20M 1.0k/s 44.65 97.29 INSERT 11.49M 14.5/s 0.63 1.38 UPDATE 9.07M 11.4/s 0.50 1.09 DELETE 1.24M 1.6/s 0.07 0.15 REPLACE 769.68k 1.0/s 0.04 0.09Com_ 39.21M 49.5/s 2.16 set_option 29.66M 37.4/s 1.64 show_tables 9.49M 12.0/s 0.52 begin 29.75k 0.0/s 0.00
The following section gives a breakdown of the types of sorts, scans, and joins you’reperforming. This section is usually a lot more useful when you have a huge amount ofquery control. Drupal deployments (especially multisite deployments), are not alwaysa great fit for making this section useful. However, you should always monitor this forlarge changes and trends:
__ SELECT and Sort _____________________________________________________Scan 15.80M 19.9/s %SELECT: 1.95Range 234.83M 296.3/s 29.02Full join 12.67k 0.0/s 0.00Range check 0 0/s 0.00Full rng join 201.66k 0.3/s 0.02Sort scan 121.17M 152.9/sSort range 26.33M 33.2/sSort mrg pass 3.26M 4.1/s
The Query Cache section describes the query cache fill percentage and its usage: Thereare two important aspects to this part of the report. First, it allows you to monitor thehit to insert ratio and the prune ratio. The hit to insert ratio in particular is very im‐portant, as you’re really looking for a case where this ratio is quite hit-heavy. This rep‐resents a stable query cache that is very effective. However, if this ratio is close to 1:1,the cache is not being very effective and may not be worth the extra locking. Secondly,this section allows you to monitor how full the query cache is and whether there areexcessive amounts of prunes. Assuming your cache is effective, it being full and beingpruned often could mean it needs to be bigger:
__ Query Cache _________________________________________________________Memory usage 26.57M of 50.00M %Used: 53.15Block Fragmnt 16.39%Hits 920.26M 1.2k/sInserts 807.94M 1.0k/sInsrt:Prune 1.24:1 196.1/sHit:Insert 1.14:1
The next section is pretty simple: it just describes table locks. If you have a lot of waitedtable locks, you may have a MyISAM table that you need to convert to InnoDB:
__ Table Locks _________________________________________________________Waited 0 0/s %Total: 0.00Immediate 1.21G 1.5k/s
142 | Chapter 14: Tools for Managing and Monitoring MySQL
www.it-ebooks.info
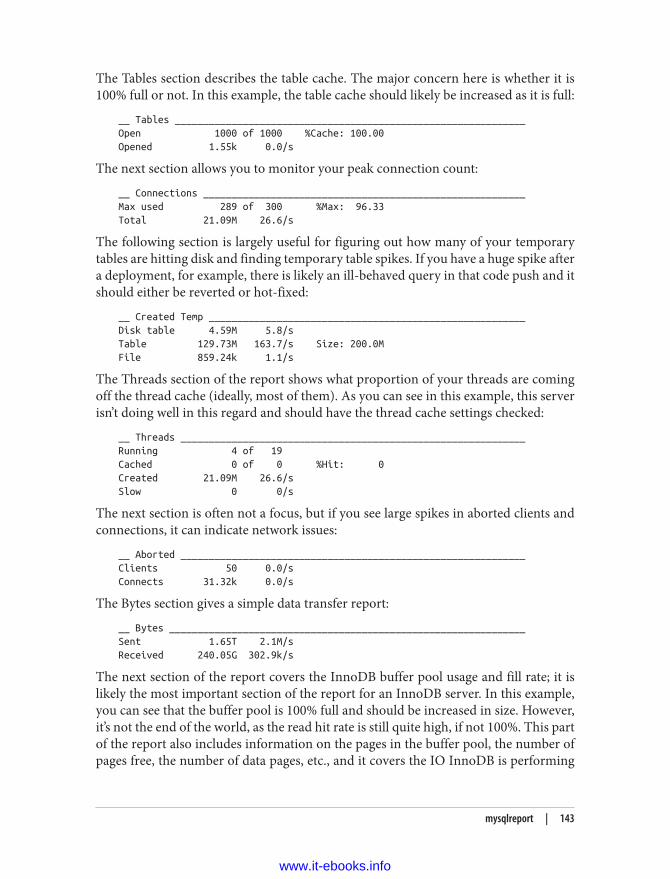
The Tables section describes the table cache. The major concern here is whether it is100% full or not. In this example, the table cache should likely be increased as it is full:
__ Tables ______________________________________________________________Open 1000 of 1000 %Cache: 100.00Opened 1.55k 0.0/s
The next section allows you to monitor your peak connection count:
__ Connections _________________________________________________________Max used 289 of 300 %Max: 96.33Total 21.09M 26.6/s
The following section is largely useful for figuring out how many of your temporarytables are hitting disk and finding temporary table spikes. If you have a huge spike aftera deployment, for example, there is likely an ill-behaved query in that code push and itshould either be reverted or hot-fixed:
__ Created Temp ________________________________________________________Disk table 4.59M 5.8/sTable 129.73M 163.7/s Size: 200.0MFile 859.24k 1.1/s
The Threads section of the report shows what proportion of your threads are comingoff the thread cache (ideally, most of them). As you can see in this example, this serverisn’t doing well in this regard and should have the thread cache settings checked:
__ Threads _____________________________________________________________Running 4 of 19Cached 0 of 0 %Hit: 0Created 21.09M 26.6/sSlow 0 0/s
The next section is often not a focus, but if you see large spikes in aborted clients andconnections, it can indicate network issues:
__ Aborted _____________________________________________________________Clients 50 0.0/sConnects 31.32k 0.0/s
The Bytes section gives a simple data transfer report:
__ Bytes _______________________________________________________________Sent 1.65T 2.1M/sReceived 240.05G 302.9k/s
The next section of the report covers the InnoDB buffer pool usage and fill rate; it islikely the most important section of the report for an InnoDB server. In this example,you can see that the buffer pool is 100% full and should be increased in size. However,it’s not the end of the world, as the read hit rate is still quite high, if not 100%. This partof the report also includes information on the pages in the buffer pool, the number ofpages free, the number of data pages, etc., and it covers the IO InnoDB is performing
mysqlreport | 143
www.it-ebooks.info
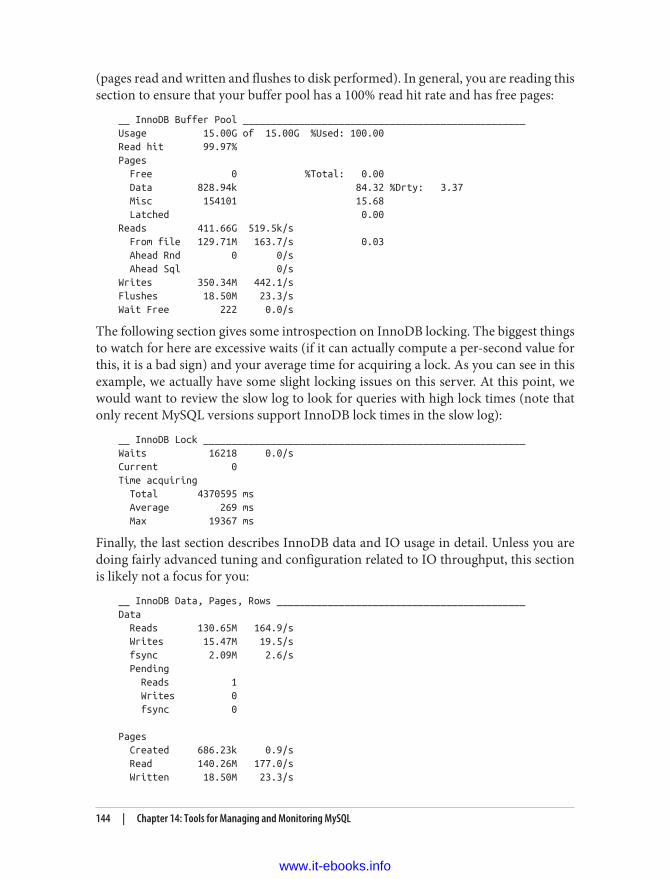
(pages read and written and flushes to disk performed). In general, you are reading thissection to ensure that your buffer pool has a 100% read hit rate and has free pages:
__ InnoDB Buffer Pool __________________________________________________Usage 15.00G of 15.00G %Used: 100.00Read hit 99.97%Pages Free 0 %Total: 0.00 Data 828.94k 84.32 %Drty: 3.37 Misc 154101 15.68 Latched 0.00Reads 411.66G 519.5k/s From file 129.71M 163.7/s 0.03 Ahead Rnd 0 0/s Ahead Sql 0/sWrites 350.34M 442.1/sFlushes 18.50M 23.3/sWait Free 222 0.0/s
The following section gives some introspection on InnoDB locking. The biggest thingsto watch for here are excessive waits (if it can actually compute a per-second value forthis, it is a bad sign) and your average time for acquiring a lock. As you can see in thisexample, we actually have some slight locking issues on this server. At this point, wewould want to review the slow log to look for queries with high lock times (note thatonly recent MySQL versions support InnoDB lock times in the slow log):
__ InnoDB Lock _________________________________________________________Waits 16218 0.0/sCurrent 0Time acquiring Total 4370595 ms Average 269 ms Max 19367 ms
Finally, the last section describes InnoDB data and IO usage in detail. Unless you aredoing fairly advanced tuning and configuration related to IO throughput, this sectionis likely not a focus for you:
__ InnoDB Data, Pages, Rows ____________________________________________Data Reads 130.65M 164.9/s Writes 15.47M 19.5/s fsync 2.09M 2.6/s Pending Reads 1 Writes 0 fsync 0
Pages Created 686.23k 0.9/s Read 140.26M 177.0/s Written 18.50M 23.3/s
144 | Chapter 14: Tools for Managing and Monitoring MySQL
www.it-ebooks.info

Rows Deleted 12.93M 16.3/s Inserted 14.48M 18.3/s Read 178.26G 224.9k/s Updated 8.96M 11.3/s
Percona Monitoring Plug-InsPercona Monitoring Plug-Ins is a set of extensions for Nagios/Icinga and Cacti thatmake them far more useful for MySQL administrators. They are a very useful additionto most Nagios or Cacti installations.
Percona Monitoring Plug-Ins | 145
www.it-ebooks.info

CHAPTER 15
MySQL Query Optimization
We noted in a previous chapter the importance of MySQL query optimization in relationto MySQL configuration tuning. While tuning is important, it often has nowhere nearthe impact of actually fixing a poorly performing query. Fixing queries is also a lot morefun. As in the other MySQL chapters, we need to note that this subject is massive andwe cannot possibly cover it fully here. It is highly recommended that you get a book onthis subject, as it is a very deep one and is well worth learning for any Drupal developer.As a web developer using a CMS, you are only slightly removed from the SQL layer. Notdeeply knowing how to use this layer and how to optimize it is very limiting. To get youstarted, this chapter will cover some very basic optimization, index usage, and joinoptimization techniques.
Index BasicsIndexes are very important for database performance. But even though they have thislevel of importance, they are not completely understood by many developers. This oftenleads to problems that could easily have been avoided. The biggest issue is a belief thatindexes are kind of magical and that the MySQL optimizer should be able to run a queryquickly if an index even touches the columns in question. Sadly, indexes are not magic.
It is best to think of an index as a tree, largely because they are trees in most DB systems(B+Trees, specifically; there is a link to an excellent article on B+Trees and how InnoDBuses them at the end of Chapter 21). Thus, if you have an example index test that covers(columnA, columnB), you literally have a tree of columnA values, with columnB valuesin the leaves. If you have a query that has a WHERE condition on these two columns,MySQL will go through this tree looking for the correct columnA value first, and thengo into the leaves of that object and find the correct columnB value.
Due to this tree organization, there are some limitations. For example, if you have aquery with a WHERE condition on columnB and not columnA, it can’t use the index on
147
www.it-ebooks.info

(columnA, columnB). Thinking about this, it makes a lot of sense. How would you get tothe columnB values in this index? You must have a way to traverse the columnA branchesto get to the columnB values. This leads to some interesting decisions. For example, ifyou have five queries that run against a table and three of them have WHERE conditionson columnB alone, that column should come first in the index so that it can be used.
Range queries are a special case. A range query is one that is going toreturn a range of values in an index. A good example is a datetimequery, such as SELECT * FROM table WHERE date > "SOMEDATE";.Sometimes you may want to put a particular column at the begin‐ning of an index (henceforth called the prefix of the index), but if thatcolumn’s condition is a range, you have to reconsider. MySQL can‐not use any column of an index after a range query. So, if your indexis (columnA, columnB) and your query is SELECT * FROM tableWHERE columnA > 5 AND columnB = 2; you will not be using the indexto satisfy the second condition (columnB = 2). In this situation, youmust have columnB in the prefix of the index for it to be used.
Base Tables and Join OrderNow that you have a basic understanding of how indexes work, you need an equallybasic understanding of joins. In keeping with our nature theme, we are going to visualizeindexes as trees and tables as pools of water—specifically, you can think of a table as alarge pool of water at the top of a hill, with smaller pools of water under it as you progressdown the hill. Each pool has a little waterfall that flows from it into the pool below. Thelargest pool at the top of the hill is the base table for the join. The goal is to limit the sizeof the waterfalls and ensure that the resulting pool doesn’t need water treatment (tem‐porary tables used to service a GROUP BY, ORDER BY, or DISTINCT).
Let’s consider an example. Our biggest pool is the Drupal node table. We then join againsta taxonomy table (pool) and filter on a taxonomy type. So, we have no real filter on thenode table, and our only real filter (the one that defines our dataset) is on the taxonomy table. How do we limit the water flowing from the node pool into the taxonomy pool?We don’t. This is going to be a big waterfall. The node table being the base table and allthe filtering/conditions being on subtables is a very common problem in Drupal. Theissue here is conceptually somewhat simple: to fulfill this query, we need to join everynode against every taxonomy term, whereas in reality, it would be far better to start withthe taxonomy table and only join the filtered rows that match our condition. You al‐ways want to have your major conditions (the ones that limit your returned data themost) in the base table. Drupal, in particular Views, makes this very difficult sometimes.
148 | Chapter 15: MySQL Query Optimization
www.it-ebooks.info

Let’s consider another example. Again, we have node as our base pool, and we are goingto join against taxonomy. This time our only filter is on node, so that’s good, but thenwe are going to GROUP BY a column in taxonomy. Unfortunately, we have a problem. Wecan’t execute this GROUP BY via an index when it’s not in the base pool, and thus theresulting pool after the join will need some water treatment (a temporary table sort).Again, this is a very common problem with Drupal Views queries. It all goes back toensuring that you actually have the right table as the base for your query.
The question now is, how do you determine the base table for a join? For Drupal, theanswer usually comes down to making sure your relationships in Drupal Views are setcorrectly. It is quite easy to have a Views query with all LEFT JOINs. A query like thisforces MySQL to treat the node table as the base table, which is almost always a problem.Other than this issue, you often have to just run EXPLAIN on the query in questionand figure out why the base table is what it is, then edit your View or Views handlers toswap the tables or set the conditions differently. We will go over some common examplesof issues with Drupal Views next.
Common IssuesWe are now going to cover some examples of common problems that arise with DrupalViews, indexing, and joins.
First, let’s discuss the debugging options available to you with Views. In the Views set‐tings, there are a few very important options for tracking Views and Views performance:“Show the SQL query” (live preview section)
This allows you to see the SQL query Views is building for execution. Obviously,this is quite important.
“Show performance statistics” (live preview section)This allows you to easily track build and execution time.
“Show other queries run during render during live preview” (live preview section).It is quite possible that other queries are being called during the processing of aView, besides the main view query. This is a common point of confusion and thisdebug setting will help immensely.
“Add Views signature to all SQL queries” (advanced tab)This is arguably the most important option on this page, as it allows you to actuallytell where a query is coming from. Back in “olden times” / “the good old days,” youcould just search for a query in an application to find it. These days, with the adventof Views and other dynamic query builders, this is basically impossible. Having theViews signature built into the query is hugely valuable.
Now that you have Views set up to assist you, or at least to not insist on making yourjob impossible, it’s time to look at some common issues.
Common Issues | 149
www.it-ebooks.info

The ORDER BY on an Unrelated TableThis truly is a classic for Drupal Views. Because so much of the data in Drupal is heavilynormalized (split into different tables), it’s quite common to have your dataset definedby tableA (i.e., all your WHERE conditions are on this table) and then ORDER BY your dataon a column in a totally different table. This is a problem, as the ORDER BY will have tobe serviced by a temp table or filesort. The tracker query that ships with Views is a greatexample of this:
SELECT node.type AS node_type, node.title AS node_title, node.nid AS nid,users_node.name AS users_node_name, users_node.uid AS users_node_uid,node_comment_statistics.comment_count AS node_comment_statistics_comment_count,node_comment_statistics.last_comment_timestamp ASnode_comment_statistics_last_comment_timestamp, history.timestamp AShistory_timestamp, node.created AS node_created, node.changed AS node_changed,'tracker:default' AS view_nameFROM{node} nodeLEFT JOIN {users} users_node ON node.uid = users_node.uidINNER JOIN {node_comment_statistics} node_comment_statistics ONnode.nid = node_comment_statistics.nidLEFT JOIN {history} history ON node.nid = history.nid AND history.uid = '1'WHERE (( (node.status = '1') ))ORDER BY node_comment_statistics_last_comment_timestamp DESCLIMIT 25 OFFSET 0
This query has a single filter on node.status, and then ORDER BYs on node_comment_statistics. However, this query is better than most because at least node_comment_statistics is a required relationship in this View, which means it’s an INNERJOIN and not a LEFT JOIN. This means that if the optimizer decides that node.statusas a filter is not very useful (i.e., all your nodes have the same status), it can “flip thejoin” and start with node_comment_statistics, making it possible to use an index forthe ORDER BY. (You can only use an index for this when the table containing the columnor columns in question is the base table.)
The Useless DISTINCT (“In Case of Accidents!”)Views allows you to just “throw in” a DISTINCT in the Query Settings of the View. Theease with which you can add a DISTINCT to a query to ensure it doesn’t start returningduplicates is a big problem, much more so than you might think. Many times perfor‐mance can be hugely improved by just removing these safety-net DISTINCTs. However,it takes a lot of work to differentiate between a useless DISTINCT and one that is actuallyneeded. It’s better to think about this from the beginning.
150 | Chapter 15: MySQL Query Optimization
www.it-ebooks.info

It is a good idea to always EXPLAIN a query after you add a DISTINCT. It’s good to know if you should be thinking about structuring aquery a different way or if the DISTINCT is fine when you are still inthe development stage. Restructuring a query is far more difficult todo in the testing stage.
Starfish Syndrome (All LEFT JOINS)When you create a query, Drupal Views has you define relationships between the data.When a relationship is not required, it’s translated into a LEFT JOIN in most cases.However, when it is required, it’s just an INNER JOIN. The problem with this is theamount of importance placed on a somewhat poorly worded checkbox. Quite often,this checkbox is left unchecked even when a relationship is required.
For example, if you have a user table and another table that holds email addresses forthose users, there will always be at least one row per user, and this is a required rela‐tionship. However, it’s tempting to not check that box, because it doesn’t really impactfunctionality and it seems more complicated. The impact of this decision will be togreatly limit MySQL’s optimizer, as it will only ever be able to use the user table as thebase table for the query.
We call this starfish syndrome, because if you diagram queries like this, you have thebase table in the center and all the joined tables around it (like the legs of a starfish).The optimizer has no choice in JOINs. This is almost always bad for Views queries inparticular, because often the default base table is node. Not only is this a huge table inmost installations, but it often doesn’t define the returned data very well (it doesn’tcontain columns that define custom data).
Going back to our waterfall metaphor, you could think of this as a bigpool in the middle with all the smaller pools flowing into it. Theamount of water never gets smaller; the middle pool just gets biggerand bigger.
Node AccessNode access is a problem. Having fine-grained permissions on a per-node basis is a niceidea. However, it is terrible from a query performance perspective. It adds a set of filtersthat are totally separate from anything defining the dataset for your query and that usetables that have nothing to do with your dataset. While it is possible if you work reallyhard to make this work quickly and have good queries, in general you can either havenode access or have good queries. It’s an OR, not an AND, question.
Common Issues | 151
www.it-ebooks.info

There is work underway on refactoring node_access to work in adifferent way with better performance on new versions of MySQL.Hopefully this work will resolve this long-standing issue.
152 | Chapter 15: MySQL Query Optimization
www.it-ebooks.info

CHAPTER 16
Alternative Storage and Cache Backends
Drupal uses MySQL as the default storage backend for all data on a site. This includeslow-level APIs such as caching and queues, as well as site content.
MySQL provides a great database backend for Drupal, but there are certain issues thatarise, especially as Drupal sites get larger. Drupal is very modular and flexible in termsof how data can be defined. Entity types such as nodes, users, and comments can beextended with configurable fields, and then the Views module allows those to be queriedand presented—all without leaving the user interface. This is a very powerful set offeatures, but it can make getting great performance out of a traditional relational data‐base quite difficult. The entity/field storage provided by core provides one or two tablesfor each core entity, then two tables for each individual field (one for the current or“live” revision and one for older revisions). Queries with a condition on one field thatsort on another then have to join across multiple tables, which is very hard to optimizewith a relational database.
Another common performance bottleneck that particularly affects higher-traffic Dru‐pal sites is that cache and session data are stored in MySQL tables by default. While thisis generally fine for smaller sites, as the number of cache and session objects grows,frequent actions such as cache invalidation put a high demand on the database layer.This can cause increased network traffic and ultimately increase the load on the databaseservers. There are multiple Drupal contributed projects that provide a way to pull cacheentries out of MySQL and store them in an alternative storage backend, such as Memc‐ached or Redis. Not only can these backends help to offload queries from MySQL, butthey can be easily scaled out horizontally as your site grows.
Drupal’s default MySQL-based search can also be replaced with alter‐native backend solutions. This is covered in Chapter 17.
153
www.it-ebooks.info

Cache, Lock, and Session StorageAs introduced in Chapter 3, Drupal’s cache API stores data in MySQL by default, but itcan be easily integrated with other technologies. Swapping out the cache backend canhelp improve both performance and scalability; however, we should look closely atexactly what changes when the cache storage is replaced. One incorrect assumption thatmany people make is that replacing the cache backend will automatically make eachindividual cache request faster. For cache gets, this is often not the case—a well-tunedMySQL server can perform as well as or better than Memcache in some cases, althoughMemcache should almost always outperform MySQL for cache sets.
The true benefit becomes clearer as traffic to the site increases. Key/value stores suchas Memcached and Redis are great at dealing with large amounts of data, and Memc‐ached in particular can be scaled horizontally simply by adding more servers. MySQL,on the other hand, is far more difficult to scale horizontally and is likely to also be beingused as your primary data source. Having your caching layer impacting the speed ofyour primary data store is not really acceptable. By swapping out cache backends, weachieve two things:
1. Offloading queries from MySQL, allowing the server to perform better for otherqueries
2. Placing data into a key/value store, which will maintain performance as the datasize increases to multiple gigabytes and allows for easy horizontal scaling
This is why even though replacing the cache backend may not improve speed for anindividual request, it can actually make a dramatic difference for large or heavily loadedsites.
So far we have concentrated on two alternatives: Redis and Memcached. There are othercache storage options, such as the APC user cache (this allows you to use the APC cachefor objects other than PHP opcode); however, Redis and Memcache are by far the mostwidely used options for large Drupal sites, as they perform well and are generally mucheasier to scale. APC in particular is unable to share its cache across multiple servers,which makes it unusable as a data cache for any site that uses more than one web server,and even on a single server the user cache suffers from fragmentation and does notimplement the least recently used (LRU) eviction. (APC is obviously still very usable asan opcode cache, even when you have multiple servers.)
Redis and Memcached both provide a similar service: an in-memory key/value store.They are both designed to provide O(1) performance for all GET and SET operations.What this means in practice is that GET and SET calls maintain a constant speed as yourcache size grows (this is a very good thing!). While both are strictly in-memory cachesfor all queries, Redis also adds the option for on-disk persistence using one of twooptions: using periodic flushes to disk or an append-only file to store all commands.
154 | Chapter 16: Alternative Storage and Cache Backends
www.it-ebooks.info

The benefit to persistence in this situation is that if your caching servers are restartedor go offline for any reason, the cache will be prewarmed when the servers come backonline—meaning a smaller dip in performance while the caches are rebuilt.
As far as the Drupal modules for Memcached and Redis are concerned, Memcache hasbeen around a lot longer and is more mature, with a wider user base. That said, the Redismodule is quickly gaining popularity now that Redis technology has matured. For newsites, either option works; we suggest testing out both and seeing which you are morecomfortable with. Both modules include their own lock implementations, and Rediscan also be leveraged for a queue implementation (using the Redis Queue module).While not specifically related to caching, this can be useful in situations where yourequire a job queue.
Memcache In DepthWith the Drupal Memcache module being a bit more mature and better tested, we’llfocus on it for a more in-depth exploration. First, it’s important to understand howthings differ between Memcache and the default MySQL-backed cache API:
1. All data that was being stored in the cache* tables in MySQL will instead be storedin Memcached. There is a way to override this for individual caches, covered in thenext section.
2. Clearing Drupal caches does not explicitly delete things out of Memcached. Instead,the time of the last cache clear is tracked and retrieved items are compared to thattimestamp (along with any item-specific expiry time) to see if they are still valid.
3. Since the maximum amount of memory the Memcached daemon can allocate isdefined at startup, it’s possible to fill up available memory, at which time Memcachedwill evict least-recently-used items—meaning you can lose your items out of thecache if it isn’t large enough. Don’t worry, we’ll explain how to monitor and avoidthis.
PHP Extensions for MemcacheIn order to use the Memcache module, you’ll need to add Memcache support to PHP.There are currently two PHP Memcache extensions available in PECL: Memcache andMemcached. The older and more stable of the two is Memcache (no d). Later, theMemcached extension was created as a rewrite and to leverage libmemcached, a light‐weight library shared by several client implementations. Both are considered stable, andeither will work with the Drupal Memcache module. In general, we recommend theMemcache extension, as it’s consistently proven to be more stable. Though the Memc‐ached extension enjoyed a surge of popularity, it’s been linked to a number of bugs thathave proven difficult to solve. All modern Memcache features are provided by both
Memcache In Depth | 155
www.it-ebooks.info

PECL extensions, though as of this writing, you will need to use a Beta 3.x version ofthe Memcache extension to access some newer features (this has been in Beta since 2008and is widely considered stable). The Memcache PECL extension has been more heavilytested by the Drupal module’s authors. That said, either one should work fine for mostsituations, and both are packaged on the majority of Linux distributions.
The PHP Memcache extensions use different hashing algorithms,which will lead to cache inconsistencies if you have multiple webservers using different Memcache extensions. Be sure that whicheverextension you choose is used by all of your servers.
Assigning Memcached Servers and BinsThe Memcache module supports splitting a single cache storage bin across multipleMemcached instances. The Memcached instances could be distributed across differentservers, or multiple instances on the same server (or some combination). There are alot of references online that suggest splitting up the various Drupal cache tables so thateach has its own Memcached instance. This was required at one point due to the lackof wildcard flushes in the Memcache module. However, now that wildcard flushes aresupported, there is generally no reason to split the caches into individual Memcachedinstances (sessions being a notable exception, as covered in the section “What to Storein Memcache” on page 158). The settings for this would look something like the followingconfiguration, but for the latest documentation on how to configure the Memcachemodule, please see the module’s README.txt file:
$conf['memcache_servers'] = array( '172.16.1.5:11211' => 'default', '172.16.1.6:11211' => 'default', '172.16.1.6:11212' => 'default');
If you are connecting to a Memcached instance on a local server, it’salso possible (and potentially better performing) to connect over aUnix socket. Simply use the syntax unix:///path/to/socket for the serv‐er definition in your $conf[memcache_servers] array.
It is useful and recommended to run multiple Memcached instances across servers forall cache bins. By splitting the cache across multiple servers, you ensure that if one ofthe servers goes offline, only that portion of your cache is lost. On the other hand, ifyou only have one Memcached instance, you will be left without any cache entries ifthat Memcached instance goes offline. In many cases, we find that creating a Memcachedinstance on each of the web servers is a good setup. Another alternative, if your webservers don’t have memory to spare, is to create a group of servers specifically for
156 | Chapter 16: Alternative Storage and Cache Backends
www.it-ebooks.info

Memcached. Whatever you decide, be sure that the Memcached port is not open toexternal traffic—this is covered below in the section “Configuring the Memcache Dae‐mon” on page 158.
When using multiple Memcached instances for a single cache bin, the PHP Memc‐ache(d) extension uses a hashing algorithm to create a key hash for each item, and thenuses that hash to decide which Memcached instance to store/fetch the item on. If youare using multiple Memcached instances, it is important to use the consistent hashingalgorithm, since it will minimize cache item reassignments if your Memcached instancesever change—for example, when adding or removing a server. The two PHP extensionshave different settings for this value, and different packages or Linux distributions mayoverride the default, so you should always verify that this is set correctly.
To enable consistent hashing in the PHP Memcache extension, use:
memcache.hash_strategy consistent
To enable consistent hashing in the PHP Memcached extension, use:
memcached.sess_consistent_hash 1
The default behavior of the PHP Memcache(d) extensions is to only store values in asingle Memcached instance. Adding additional Memcached servers and grouping theminto a single bin in your Drupal settings does not get you high availability for your cachedata. Both of the extensions provide a configuration option that enables them to writeitems to multiple servers at the same time. However, this can lead to invalid cache itemsbeing served should a server go offline for a time and then come back. Generally, it’sbetter to have a few cache misses if a server goes down instead of worrying about highavailability for your cache data and then having to deal with potential cache corruption.
Memcache Locking and Stampede ProtectionThe Drupal Memcache module provides stampede protection, which helps minimizethe overhead of rebuilding cache items during a cache rebuild. For example, if the cachedversion of a popular article on your website was invalidated by a visitor posting a com‐ment, and then several other visitors requested that page at the same time, each Drupalprocess accessing the article would typically go through the following steps (unawarethat other processors were doing the same thing):
1. Check for the item in Memcache.2. See that the item is invalid/expired.3. Regenerate the item (this step can involve many SQL queries, PHP processing, etc.).4. Push the data into a cache item in Memcache.
This can be particularly problematic if step 3 is a large operation that could put heavyload onto your database. Enabling stampede protection, ensures that the module will
Memcache In Depth | 157
www.it-ebooks.info

create a lock for the cache item so that only one process will attempt to update it inMemcache. Other requests that come along while the lock is in place will serve stalecontent out of Memcache (or simply wait for a valid cache entry if the existing item ismissing or invalid as opposed to expired) to prevent overloading of the database whilethe cache is being rebuilt.
As stampede protection relies on Drupal’s locking layer, it’s critical that you also movelocks out of MySQL and into Memcache. If you enable stampede protection withoutalso moving locks into Memcache, you can experience severe performance degradation.Enabling stampede protection and the Memcache lock implementation is done with thefollowing settings in settings.php:
$conf['memcache_stampede_protection'] = TRUE;$conf['lock_inc'] = 'sites/all/modules/memcache/memcache-lock.inc';
What to Store in MemcacheWhen you enable the Drupal Memcache module, by default, all cache tables will bestored in Memcache. In Drupal 8, form state information has been moved into a key/value store, but in previous versions, it was stored in a cache table (though not strictlya cache). For Drupal 7 sites using Memcache, it is important to keep the cache_formtable in MySQL to ensure form data isn’t lost if Memcached goes offline. If the form IDsare lost, then any form submissions will fail, and since Memcached is not persistent,there is the potential that this could happen. So, be sure to follow the instructions andalways keep the cache_form table in MySQL. This override is done for Drupal 7 withthe following setting in settings.php:
$conf['cache_class_cache_form'] = 'DrupalDatabaseCache';
The Memcache module also gives the option to store Drupal sessions in Memcachedinstead of MySQL. As of this writing, though the 6.x implementation is consideredstable, the 7.x version has known bugs (tracked in https://drupal.org/node/656838).Some people see session storage in Memcache as a great feature, while others see it as adisaster waiting to happen. The nice part about moving sessions out of MySQL is itmeans a lot less read and write activity on the database. The downside is the potentialto lose the session information out of Memcache in the event of a Memcached servergoing offline or because of an eviction should the Memcache bin fill up. We recommenddoing two things to reduce the risk of sessions being evicted from Memcache: create anew bin dedicated to sessions with ample space so other caches can’t cause sessionevictions, and spread the sessions bin across multiple servers so a failing Memcachedserver only invalidates a portion of live sessions.
Configuring the Memcache DaemonAs mentioned earlier in this chapter, it’s very important to allocate enough space inMemcached that you aren’t constantly running out of memory for cache storage and
158 | Chapter 16: Alternative Storage and Cache Backends
www.it-ebooks.info

forcing Memcache to evict valid cache items in order to store new items. Most Linuxdistributions ship Memcached packages with a default bin size of 32–64 MB. Generally,this is way too small for Drupal sites, as many sites can end up with multiple gigabytesof cached content. When first setting up Memcached, you can guess your size require‐ments by looking at the size of your cache tables in MySQL—while this won’t be an exactrepresentation of the size required to store your cache items in Memcache, it can provideat least a ballpark figure to get you started. From there, you can watch the Memcacheusage using the built-in stats command or the statistics section provided by theMemcache_admin module, or track it with something like Munin or Cacti. If you startto see space near full or a large number of evictions, then you should increase the mem‐ory allocation for Memcached.
It’s possible that you’ll start to see evictions happen before the Memcached instance isusing 100% of its allocated memory. This is because Memcached allocates space in var‐ious slabs, where each slab is used to store items of a certain size range—for example,one slab will store items that need 1,000–2,000 bytes, another slab will store items thatneed 2,001–4,000 bytes, etc. So, if you have a lot of items with a similar size, then it’spossible to fill up a slab while the overall Memcached instance still has free space inother slabs. While you can adjust the slab allocation size increments, it is generally nota good practice; except in very special cases, you’re generally better off to simply allocatemore memory to Memcached overall.
Beyond the memory allocation, you shouldn’t need to customize much in the Memc‐ached configuration. One important point, however, is to ensure that Memcached islocked down to prevent remote access. This can be done either with iptables, by hidingthe Memcached server(s) behind a network address translated network, by using the -l flag to Memcached to specify which port to listen on, or using some combination ofthose options.
How to Break Your Site with MemcacheAlthough the Memcache module is in very wide use, its usage seems to be a source ofconfusion for many. There are a number of common problems we’ve come across relatedto Drupal Memcache configuration that we’ll share here, in the hope that it will helpothers to implement Memcache correctly.
Inconsistent CachingIn infrastructures with multiple web nodes, it’s important that the Drupal Memcacheserver and bin configuration is the same across all servers. The three most popular waysto break this rule are to:
How to Break Your Site with Memcache | 159
www.it-ebooks.info

• Configure one web server to list more or different Memcache bins than otherservers. This will cause the hashing algorithm on each web server to assign differentservers for the same cache item, leading to an inconsistent cache.
• Configure each web server to only connect to Memcached on localhost. A commonvariation of the previous example, this causes each web server to have its own sep‐arate cache, meaning you may see changes in content based on which web serverthe load balancer directs you to. Also, depending how your cache clears are done,you may only ever be clearing out the cache from one of the Memcached instances.
• Forget to enable consistent hashing in the PHP Memcache extension configuration.This causes the PHP extension to use the standard hashing strategy, which inva‐lidates your entire cache on all servers any time a server is brought online or offlinefor any reason. You should be sure to always set this explicitly in your PHP con‐figuration, because different packages on different Linux distributions will havedifferent defaults for this setting.
Constant EvictionsAs described previously, it’s important to allocate enough memory to Memcached sothat it can fit all of your active cache items. Failing to do this, or failure to watch theusage as your site grows, can cause it to run out of space and be forced to evict cacheitems before they expire. Avoid this by closely monitoring memory usage and evictions.You should keep in mind that some evictions in the statistics are not bad. BecauseMemcache uses an LRU algorithm and the Drupal Memcache module, by design, doesn’tactually flush out data, some evictions are to be expected. What you don’t want to haveis a constant level of evictions, as that likely means you don’t have enough memory tofit your full data set.
Vanishing SessionsIf you are storing Drupal sessions in Memcache, it’s important to ensure two things:
• Your Memcached servers and your network connections between them and yourweb nodes are stable. If you lose even one of your Memcached servers, even for asmall duration of time, you will lose session data for some number of active users.
• Sessions are being stored in a bin where they will not be evicted. Generally thismeans creating a separate bin exclusively to hold sessions, and ensuring that it hasmore than enough space for your active traffic.
Sessions are an area where Redis has an advantage over memcache: items are persistedto disk, and it’s possible to have an instance with LRU disabled specifically for sessionstorage, ensuring that sessions won’t be evicted until they’ve expired.
160 | Chapter 16: Alternative Storage and Cache Backends
www.it-ebooks.info

Entity/Field StorageDrupal 7 introduced the field API to Drupal core, providing functionality previouslyprovided by the Content Construction Kit, or CCK. It’s this API that allows for entitytypes such as nodes, users, and comments to be extended with configurable fields. Sincefields may be added to or removed from entities at any time, each field is stored in itsown set of database tables. One table stores the values for the current revision, andanother stores the values for any historical revisions of the entity. Both are written towhen entities are saved, but only one is queried at any one time.
Loading of field values happens via a single query, and the values are cached via Drupal’scache API, so in itself is not a significant performance issue, and the Entity Cachecontributed module allows for caching of the entire entity object, including data frombase tables and hook implementations. However, in certain cases, saving entities canrequire dozens or hundreds of writes to the various field tables. Where performanceissues usually arise first are with queries generating lists of entities: a condition on onefield and a sort on the other requires a JOIN, making it impossible for MySQL to effec‐tively use indexes for those queries.
The vast majority of sites are able to deal with these issues by caching the results oflisting queries (either using Drupal’s cache API directly, or by enabling caching in theViews module) and using pregeneration or custom denormalization in SQL for partic‐ularly bad queries.
However, with large data sets and a highly dynamic site with lots of pages, cache hitrates may be too low, or queries may be unacceptably slow on a cache miss.
To allow sites to optimize for these cases, the field API also has the concept of pluggablestorage. This allows the field_sql_storage module to be replaced entirely. Drupal 7does not, however, allow the entity base tables to be replaced, so data is still written tothose and core queries them directly. In practice, it was found that field storage imple‐mentations needed to store the entity base table information as well, requiring dupli‐cation between the hardcoded entity storage and the field storage.
As a result, Drupal 8 has the same default MySQL implementation, but storage is con‐trolled at the entity level rather than for individual fields, allowing the base tables to bereplaced as well as the field storage.
While entity/field storage is pluggable, changing the storage layer is unfortunately notas transparent (especially in Drupal 7) as it is with the cache or sessions. Many con‐tributed modules query entity tables directly, and poorly written custom modules maydirectly query field tables. If considering using pluggable storage, there are several bestpractices to keep in mind in order to ensure the smoothest possible transition. If youhave an existing site and are considering changing the entity storage, enforcing thesebest practices at the application level early on is a prerequisite to making the switch, and
Entity/Field Storage | 161
www.it-ebooks.info
you should also be prepared to audit contributed modules as well as your own customcode.
EntityFieldQuery/EntityQueryWhen querying entities, using EntityQuery as opposed to db_select() or db_query()on the tables directly ensures that the query will work regardless of the storage used.
When using Views, the EntityFieldQuery Views Backend module replaces Views’s SQLquery builder with an EntityFieldQuery builder, providing the same interoperabilityfor exported views.
CRUDContributed and custom modules often attempt to avoid loading or saving full entities,opting instead to query individual values or to update via db_update(), especially whenmultiple entities are being loaded or updated. Bypassing the API like this can lead toinconsistent results due to caches not being invalidated correctly, alter hooks not firingon load, etc. It also makes it impossible to use those modules with an alternative storagebackend, since the database table being queried directly may not even exist. And whenloading, querying the table bypasses both static and persistent caches, so it’s often sloweranyway. Always use the proper CRUD (create, read, update, and delete) functionswhenever dealing with entities.
MongoDBWhile there are theoretically many potential options for entity storage, currently theonly viable option is MongoDB. MongoDB is an open source document database thathas so far proved extremely promising in solving many of the performance issues thataffect Drupal’s entity storage. Integration is provided via Prod: change text to the Mon‐goDB module. MongoDB allows considerable improvements in both the performanceand the scalability of sites with very large data sets, but it’s still a relatively new technologyboth in terms of general adoption and Drupal specifically. You should carefully considerwhether your project requires MongoDB entity/field storage before making the change,since it imposes development constraints (albeit good ones) as well as introducing anadditional system to administer—one that holds all of your site’s most important data!You’ll need to set up replication and backups for MongoDB in addition to MySQL. Alsoensure you’re comfortable maintaining MongoDB long-term. Entity data cannot beregenerated in the same way as a cache entry if it gets lost, and migration from MySQLto MongoDB and back again is a manual process at the time of writing, so while it ispossible, changing entity storage on a live site is a very complex process.
The main feature of MongoDB as a document database is that each entity is stored as asingle record. MongoDB stores documents in BSON format (a variant of JSON), so the
162 | Chapter 16: Alternative Storage and Cache Backends
www.it-ebooks.info
resulting entity storage is very similar to what you’d see running json_encode(entity_load(1));. It should look quite familiar to any Drupal developer who’s ever lookedat an entity structure with var_export() or via a web service. Queries against MongoDBare written in JSON syntax; while this is useful on the command line, at the Drupal level,you should only ever use EntityFieldQuery to avoid being locked into MongoDB atthe application layer (much as using db_query() and db_select() enforces MySQLstorage).
As opposed to potentially dozens of individual database tables, a single record is createdwith both the properties and configurable fields of the entity all in the same place. Sinceconfigurable fields can have multiple values, this is impossible to achieve in SQL in termsof a single database table with a column for each field. This allows complex entity queries,which might JOIN across 20 or more tables with the default MySQL field storage, to beexecuted against a single collection.
MongoDB is schemaless, in that it’s not necessary to define the structure of a collectionup front before documents can be saved. Therefore, adding new fields or field valuesdoes not require any Data Definition Language (DDL) operations on the storage. How‐ever, being schemaless doesn’t mean no schema as such; it just means it’s entirely up tothe application to enforce it.
Indexes can be applied to collections in a similar way to how MySQL indexes are appliedto tables. There is currently no automated way for the MongoDB module to createindexes for EntityFieldQuery, so sites planning to use the MongoDB module in pro‐duction should expect to audit queries and add their own indexes.
One of the main limitations of MongoDB is the inability to join between collections.The MongoDB module stores entities in their own collections, meaning that it’s notpossible to query specific groups of nodes as easily as it would be with MySQL—forexample, nodes created by users who live in Australia. There are workarounds for this—for example, adding an “author country” field to nodes and copying over the valuefrom the user would allow that query to be run—but as with denormalization in MySQL,this requires maintaining both sets of data should the user record be updated.
Entity/Field Storage | 163
www.it-ebooks.info

CHAPTER 17
Solr Search
Drupal’s default search backend uses MySQL to implement some fairly advanced searchcapabilities. While this is fine for small sites and kind of impressive in its own right, itcan prove quite a performance bottleneck for larger sites that contain many nodes andwhere the database may already be under moderate to heavy load. Luckily, Drupal’s coresearch system can be enhanced or completely replaced by contrib modules. Not onlydoes this provide a way to offload search queries from MySQL, but it can also bringadditional features that aren’t part of the traditional Drupal search. For example, search‐ing with Solr provides faceted search functionality—a way to filter search results basedon categories or groupings—and spellcheck, two widely used search features.
There are a number of popular open source search technologies, such as Elasticsearch,Solr, Sphinx, and Xapian. While all of these have Drupal modules, Solr is by far the mostactively developed and widely used module, so we will focus exclusively on integratingSolr throughout this chapter. That is not to say that other search technologies aren’t asgood as Solr; they simply haven’t been as well integrated into Drupal as Solr.
Performance and Scalability ConsiderationsOn smaller Drupal sites, the search queries done by the default search module may notbe particularly “heavy” SQL queries, but they do contribute to the overall load on thedatabase server. On sites with a large enough data set, the queries can be downrightperformance killers. For this reason, Drupal’s built-in search should not be used onanything but the smallest of sites; it does not scale well enough for large sites. Search isone place where we can not only offload a task from the database server, but improveperformance and scalability at the same time.
As discussed in Chapter 7 and the chapters on MySQL, MySQL is not something thatcan easily be scaled horizontally simply by adding more servers. On the other hand,pretty much every search-specific application has been designed to be able to scale
165
www.it-ebooks.info

horizontally. While most sites won’t have enough search traffic to necessitate a largesearch cluster, there certainly are sites that benefit from increased performance andeasily scalable search.
Integrating Solr with DrupalThere are at least two modules that tie into Solr for search: apachesolr and search_api.They provide a similar set of features, either directly or by tying into other modules.Some of the most commonly used Solr features are:Spellcheck
Solr can provide search results for words spelled similarly to those in the initialquery.
More like thisThis feature allows you to find similar content to a particular result; this can beuseful for displaying a block on a page to link to other similar pieces of content.
Faceted searchThis provides users with a way to filter search results—for example, limiting resultsto content updated within a certain time frame, or only by a particular author.
The main difference between the two modules is that search_api relies on the Drupalentity API, actually doing a full entity load for each result returned, whereas the apa‐chesolr module retrieves more data from the index when doing a search, meaning thatit can provide at least a title and teaser text without having to pull anything in from thedatabase. There are some other small differences, but in general, the options are prettysimilar. For our examples in this chapter, we’ll be using the apachesolr module, but themajority of the Solr setup remains exactly the same for either module.
Solr ConfigurationSolr has a number of configuration files, many of which define settings that both theserver and the client need to be aware of. For that reason, both the apachesolr andsearch_api modules include a set of configuration files that need to be used on the Solrserver. The configuration files included in the module may vary over time, but the mostimportant files included there are:solrconfig.xml
This file includes Solr-specific configuration settings. You may need to tweak someof these values, but the provided config works well for the general case.
166 | Chapter 17: Solr Search
www.it-ebooks.info

schema.xmlThis file defines the schema used when storing documents. Since this defines whichfields will be used for searching and storing, it’s important that whatever is used onyour server matches what the module expects.
protwords.txtThis file is a sort of “blacklist” for words and stops them from being “stemmed.” InSolr parlance, this means that any word listed here won’t be considered part of alarger word. For example, by default “test” would normally be stemmed into otherwords such as “tester,” “testing,” and “tested,” but if it were listed here, that behaviorwould stop. The apachesolr module includes some HTML entities here in order tokeep those from being stemmed.
Indexing ContentSolr contains its own search index that is totally separate from your site’s main contentstored in MySQL. This means that an indexing job is required in order to load contentout of the database and push it into the Solr search index. The apachesolr module tracksinformation on which content needs to be indexed in its own SQL table, and by defaultit will index a small number (currently the default is 50) of those items each time thatthe site cron job runs. There are also admin options and drush commands used to runthe indexing job outside of the main cron run, to mark content for reindexing, and evento fully delete the Solr index.
Be aware that if you have a large amount of content on your site, it can take a long time(from a few up to even dozens of hours) to index it all the first time. Once content isindexed initially, only new and updated content will be indexed, so it happens muchfaster. The bottleneck here is generally not Solr, but the fact that the apachesolr moduleneeds to do a full node_load() on content in order to pull out the information neededfor the index.
Most sites can support indexing of many more than the default 50 items at a time, andyou can usually improve the indexing time by increasing $conf[apachesolr_cron_lim‐it] to something higher. Depending on the database and network infrastructurespecifics, we’ve found the sweet spot for this setting to be somewhere from 100 to 1,000items. Try a few different values in that range and see which performs best in yourenvironment.
Solr indexing can be very resource intensive for a web node. Verifythat your PHP memory limit and maximum execution time are highenough to avoid errors when indexing.
Indexing Content | 167
www.it-ebooks.info
Infrastructure ConsiderationsSolr, as of version 1.4, has built-in replication that makes setting up multiple slave serversvery easy. Because of that, there’s really no excuse not to run at least two Solr servers ina master/slave setup. Since most sites don’t need full high availability for Solr writes,usually they are fine with failing over to read-only on the slave as needed. Full HA withwrite failover is a bit harder to configure, though Solr 4.x attempts to address some ofthose shortcomings (leveraging Zookeeper).
Currently, Solr versions 3.x and 4.x are supported by the Apache Lucene project (andeither will work with Drupal). A lot of sites are currently using 3.x versions because theydon’t need the new features from 4.x, and the 4.x releases are young enough that somebugs are still being worked out.
When you download Solr, it includes a “built-in” Jetty server (a Java servlet engine witha built-in web server). This works fine for testing, but it’s not designed to be used in aproduction environment. The most popular options for a production-ready servlet en‐gine are either using the full Jetty distribution, or using Tomcat. Either of those optionswill work fine with Solr, so it’s really just a matter of preference which you choose.
Solr ReplicationWe recommend starting with at least two Solr servers set up as master/slave. This willallow you to support at least read-only failover in the case that the master goes offline.The reason for having two servers is more about providing a failover than it is abouthaving the option to load balance search queries — however, there’s no reason you can’tbenefit from each. There are various choices for a failover mechanism; often we use IPfailover controlled with Heartbeat, and if you set up Varnish on the Solr servers to directtraffic, it can easily be configured to filter out “write” queries to only go to the masterserver:
sub vcl_recv { if (req.url ~ "^/solr/[^/]+/(select|admin/ping)") { set req.backend = solr_server_pool; } else { set req.backend = solr_master; if (req.request == "POST") { return(pipe); } return (pass); }
// rest of vcl_recv...
In this example, we send Solr select queries and requests for admin/ping to a Varnishdirector containing a pool of all Solr servers. All other traffic is forced to go to the Solr
168 | Chapter 17: Solr Search
www.it-ebooks.info
master server only. In the case of POST requests (index updates), we use a pipe in orderto avoid timeouts should the update queries take a long time.
Enabling the built-in replication in Solr is fairly straightforward. If you set a few variablesin the file solrconfig.properties located within a Solr core’s conf/ directory, they can thenbe referenced in solrconfig.xml within each Solr core configuration. Handling the con‐figuration with variables and conditionals makes it possible for both master and slaveto share the same solrconfig.xml file.
The following replication snippet from solrcore.properties shows the settings for themaster server:
solr.replication.master=truesolr.replication.slave=falsesolr.replication.pollInterval=00:00:60solr.replication.masterUrl=http://solr-master-hostname:8112/solr
For the slave, simply swap the true/false values for the master and slave settings. Thereplication interval can be adjusted if you need to ensure that the slave receives updatesfaster than once per minute.
With those settings in place, the default solrconfig.xml that ships with the apachesolrmodule will handle replication for you, using the solr.replication.master andsolr.replication.slave variables to conditionally enable master or slave behavior oneach of the servers.
Drupal Module InstallationDownload and install the apachesolr module. There are some additional modules listedthere that may be desired for extra features. There’s no need to enable the module justyet, since we need to get Solr set up first.
Inside the module, you’ll find a directory, solr-conf/ that contains Solr configurationfiles for different versions of Solr: 1.4, 3.x, and 4.x. Any new installation should use 3.xor 4.x as 1.4 is already quite dated. Depending on which Solr version you decide to use,copy the configuration files from the corresponding directory here to your Solr server.They should be placed in /<path_to_solr>/<corename>/conf/.
Once you’ve copied those in place, you’ll need to (re)start your Solr service (e.g., Jettyor Tomcat) in order to recognize the configuration changes. Once that is running, youshould be able to enable the apachesolr module and update its settings to point to yourSolr URL. It will report if it’s able to successfully connect to the Solr server, and fromthat point, you can start indexing your content in Solr.
With the Solr server successfully up and running, the remaining module setup andconfiguration is fairly easy. Instead of covering it here, where it may quickly go out of
Drupal Module Installation | 169
www.it-ebooks.info

date, we recommend reading through the apachesolr module’s project page and docu‐mentation, as well as the README.txt file that ships with the module.
170 | Chapter 17: Solr Search
www.it-ebooks.info

CHAPTER 18
PHP and httpd Configuration
Web server (httpd) and PHP configurations are often overlooked or trivialized. ManyDrupal deployments make only small changes to the httpd or PHP configuration (raiseyour hand if your biggest change to php.ini has been to increase PHP’s memory limit),and otherwise blindly accept most default configuration values. This is sometimes withgood reason: using a default httpd.conf file will work fine in some cases, and generallysites can perform pretty well with little to no tweaking of the httpd configuration. Onthe flip side, it is very possible for a default httpd configuration to grind your server toa halt should you experience a large traffic spike. Not only that, but there are configu‐ration options that can help improve performance, sometimes drastically.
This chapter will focus mainly on changes that can be made to improve performancein PHP and Apache’s httpd daemon. We give Apache 2.2 more attention than other webservers because it is the most widely used web server; however, the chapter also containsa section on alternative web servers and PHP configurations (e.g., CGI versus runningas an Apache module).
APC: PHP Opcode CacheTo understand what an opcode cache is and why it’s important, you first need to un‐derstand how PHP works server-side. When a PHP script is run on your web server,the PHP source file is read and then compiled into byte code before being executed. Ifyou add an opcode cache, the intermediary executable code gets compiled on the firstaccess of a script but then is stored in the cache and used for subsequent requests of thesame script. This saves a lot of overhead, which is especially noticeable on a busy server.
Although there are a number of PHP opcode caches available, we’ll focus on APC, as itis the most widely used. However, with the release of PHP 5.5, the core PHP distributionnow includes Zend Optimizer+, which after being open sourced has become the defaultopcode cache in PHP moving forward. PHP is now referring to Zend Optimizer+ as
www.it-ebooks.info

“OPcache.” APC currently ships as a PECL extension, meaning it can be installed viathe PECL install tool, though most Linux distributions and add-on software repositorieshave prebuilt packages available. OPcache is built into PHP versions 5.5.0+ and is avail‐able as a PECL extension for versions 5.2, 5.3, and 5.4. An alternative to APC is mostwelcome, and we imagine most sites will soon migrate from APC to OPcache. In themeantime, however, the vast majority of sites are running on APC, so we will focus onAPC throughout this chapter.
Once installed, the APC extension needs to be enabled either in php.ini or in its ownapc.ini file. For servers hosting a single Drupal site, most of the default settings for APCwill work fine; however, it is very important to set an appropriate memory size. For mostsites, using a single shared memory segment with a size of 128 MB is a good startingpoint. Once set, restart Apache to pick up the change, then load your website and re‐peatedly load a few different pages. Then visit apc.php (a monitoring script included inmost APC packages that can be moved to your webroot, but should not be left thereafter use) in your browser to see the current statistics. What you want to see is little tono fragmentation of the cache, and there should be some amount (at least 16–32 MB)of free space available. At this point, you should also see hit rates at or close to 100%. Ifyour cache is totally full or showing high fragmentation, or if the full count is more than0, you should increase the amount of memory allocated to APC. Continue increasingthe memory allocation until the cache is left with free space; once the site has run for afew days without filling up the cache, you’re in good shape. It’s important to check onthis periodically to be sure that the cache isn’t filling up or becoming fragmented.
Once your APC memory allocation has been set properly, there are many other con‐figuration settings that allow some fine-tuning of how APC runs. As mentioned previ‐ously, these typically don’t need to change for most sites (especially if you are onlyrunning one Drupal web root on a server). The full list of APC runtime settings isavailable at http://www.php.net/manual/en/apc.configuration.php. A few of the mostcommonly customized are:apc._num_files_hint
This setting tells APC how many files you expect to be cached. It uses this infor‐mation when allocating cache storage space. The default is 1000, which is a prettygood rough estimate for a single Drupal site. However, if you are running multiplesites or a site with a lot of modules, increasing this could help reduce fragmentation.
apc.stat
This setting controls whether or not APC will “stat” (check) a file to be sure it hasn’tbeen updated since the cache entry was created. The default is 1, meaning that APCwill perform this check. If set to 0, APC will not recheck files once they have beenpulled into the cache. This means that if you change a file, you need to reload Apachein order for APC to read in that change. Obviously this is not ideal for developmentenvironments, but it can lead to performance improvements in infrastructures with
172 | Chapter 18: PHP and httpd Configuration
172
www.it-ebooks.info

high I/O latency. This setting needs to be approached carefully, as there are quite afew other stats in the process of serving a request and they must all be disabled foryou to see much improvement.
So far, our description of APC has been entirely as an opcode cache.However, APC also supports “user” caches, meaning that you coulduse APC to store Drupal cache data. We discussed that possibility inChapter 16.
Again, it’s important to monitor APC status to ensure the cache does not fill or becometoo fragmented (usually fragmentation is caused by the cache being at or close to full).There are, for example, Munin scripts that scrape the APC stats from a local PHP script(a great candidate to live in an adminscripts directory!) and graph them over time. Ifyou notice the usage approaching full on the APC cache, it’s likely that you’ll want toincrease the cache size.
php.ini SettingsThere are a few settings in php.ini that are important to consider when bringing up asite. The most important of these settings is memory_limit, which controls how muchmemory a single PHP process is allowed to consume. It is important to gauge this settingcorrectly because if a process consumes more than this amount of memory, it will errorout at the point where it attempts to allocate more memory, and the entire page loadwill fail. For many Drupal sites, the maximum memory usage is somewhere around the128 MB range. While it’s not uncommon for this to be set at 512 MB or 768 MB onlarger websites, if you are using that much RAM in PHP, you may have a problem inyour code that needs attention. The downside to setting this to a very large value is thata memory leak or “runaway” process can end up consuming quite a bit of system mem‐ory, potentially causing the server to run out of memory.
Watch the memory use of your PHP processes (or httpd processes if you’re runningPHP as a module) to see how much they are using on average by running top and sortingby memory usage (type O to see sort options, then n to sort by resident memory). How‐ever, that just tells you what the current processes are doing and doesn’t tell you whatthe maximum usage may be. For a more precise view of PHP memory usage, considerenabling XHProf, described in Chapter 6, and use it to profile the different page typeson your site. With this setting, it’s best to err on the large side because setting it too lowwill cause some user-visible errors with the site should you ever hit the limit.
The display_errors setting controls whether or not PHP errors will be shown on theoutput of the page where an error occurs. This is clearly something you want to disable
php.ini Settings | 173
www.it-ebooks.info

on your production servers, but it can be very useful to enable on your developmentservers.
While you shouldn’t display errors to users on a production site, you likely want to keeptrack of errors if they do happen. For this reason there is a log_errors setting thatcontrols whether or not errors are logged. If you are running PHP as an Apache module,setting this to On will log PHP errors to Apache’s error log.
Both display_errors and log_errors are selective about what types of errors theyshow. Both of them are affected by the error_reporting setting, which lets you definewhich types of errors to show/log and which to ignore. Settings here are applied bit‐wise, meaning you can combine different message types with “and,” “or,” and “not” inorder to achieve the type of error reporting you desire. Generally on production servers,you would only care about actual errors and not about warnings, notices, or languagedeprecation messages. On development servers, it’s more useful to track everything sothat you can see things like PHP notices when variables are used before being set, etc.php.ini files ship with a large section of comments explaining the various message typesalong with suggested settings for production versus development.
It’s also important to set the time zone in php.ini (or in your .htaccess file). As of PHP5.3, a warning message will be sent when the date.timezone setting is unset—andimportantly, it defaults to unset. Valid time zone values are listed here.
PHP Apache Module Versus CGIPHP is most commonly run as an Apache module called mod_php. This is the easiestway to run PHP, as it can be installed as a package that includes a very minimal Apacheconfiguration to enable the module for PHP scripts. There are two main issues to un‐derstand when running mod_php:
1. The PHP module will be loaded into each httpd process, increasing resource usageand making the processes heavier. This means that every access to httpd, even fora static (non-PHP) file, will have the overhead of the PHP module residing in thehttpd process.
2. PHP scripts will all be run as the same user, generally apache or www-data, that thehttpd processes are run by. This is generally fine when you only host a single siteon a server, but it’s not secure for multisite environments, where it is best to keepthe sites separated as much as possible. One way to work around this issue is to runmultiple instances of Apache, each with a different user. This is easily accomplishedwith the default configuration in Debian-based distributions, though it is not aseasy with Red Hat-based-distributions.
It is possible to run PHP as an “external CGI,” which just boils down to having someway for httpd to call an external PHP process when it needs to execute PHP code. In
174 | Chapter 18: PHP and httpd Configuration
www.it-ebooks.info

order for this to work in production environments, you need to run a CGI managersuch as mod_fastcgi to manage the PHP processes. This requires a bit of extra config‐uration over the built-in module, but you gain flexibility. For alternative web serverssuch as Nginx, you must run PHP as a CGI—more on this at the end of this chapter.
PHP now includes the FastCGI Process Manager, or FPM, also referred to as PHP-FPM. Prior to PHP-FPM, it was difficult to ensure PHP CGI processes shared an opcodecache, which was not great for performance. The addition of PHP-FPM allows its PHPprocesses to share a central APC cache, making it a stronger option for those who arelooking for an alternative to running mod_php.
Many sites choose to skip the extra configuration needed to run PHP as a CGI binary,and instead stick with the default mod_php. mod_php can scale well and has the perfor‐mance advantage of being in the same process space as Apache. However, it does addadditional memory overhead in the httpd processes, and it’s not quite as tune-able ashaving PHP completely separated as a CGI. For example, in a PHP-FPM setup, you canlimit the amount of memory and/or threads each FPM pool has available to it. If youneed this extra configurability, are hosting multiple sites that need to run as differentusers, or cannot offload static file serving (such as by using Varnish or a CDN), FastCGIand PHP-FPM are options worth considering. For our purposes, we will continue toassume the use of mod_php since it is the most popular method to run PHP.
Apache MPM SettingsApache is one of the most configurable and flexible HTTP servers in existence. It is infact so configurable that you can even change its process model via your choice ofmultiprocessing module (MPM). The two major core MPMs are Prefork and Worker:
• Apache Prefork can be considered the “classic” multiprocessing module. It worksby having a single parent httpd process managing a pool of child processes. Eachrequest that comes into the server is “assigned” to a child process, which then takesover communication with the client and fulfillment of the request. If more processesare needed, the parent process will create them and will clean up old processes.
• Apache Worker is a newer multiprocessing module that relies on threads insteadof processes. It works in much the same way as the Prefork module, except thatinstead of maintaining processes, it maintains threads. The advantage to this is thatits lighter weight. The disadvantage is that you must ensure your code is entirelythread-safe.
In most cases, the choice between these two modules is made for you. If you are usingmod_php, you should use the Prefork module. There are many non-thread-safe PHPmodules, and some are required by many Drupal installations. On the other hand, ifyou are running PHP as a CGI, you have the option of using Apache Worker and making
Apache MPM Settings | 175
www.it-ebooks.info

Apache a bit more lightweight. The remainder of this chapter will assume the use of theApache Prefork module using mod_php.
Prefork Thread SettingsThe Prefork module has a number of settings that control its behavior. Generally, thedefaults for the settings controlling the number of spare servers to start and leave idlework fine for most sites. However, it’s important to focus on the settings that controlthe number of processes and how often they are cycled, as these are the settings thathave the potential to bring your server crashing down if not configured correctly. Theyare:StartServers
This setting defines how many processes will be started when the httpd servicestarts. For Prefork, this defaults to 5. For most sites this is fine, since httpd willspawn new processes as needed. In cases where you know your server will alwaysbe serving more than five clients at once, you might want to increase this so thatthere isn’t a wait involved when spinning up additional processes.
MinSpareServers and MaxSpareServersThese settings control how many idle (not actively serving requests) httpd processeswill be kept around. They default to 5 and 10, respectively, meaning that if there areless than five idle httpd processes, new processes will be spawned (at a maximumrate of one per second) until there are five idle. Contrarily, if there are more than10 idle httpd processes, the additional processes will get killed off by the parenthttpd process. Again, for most sites these defaults work fine, although on some sitesit may be worthwhile to increase these settings somewhat so that you can betterdeal with traffic spikes. Setting these values very high means that you will have alot of processes on the system using up RAM even when traffic is rather low.
MaxClientsDefines the maximum number of httpd processes that can be running. It can “makeor break” your site, in that if it is set too low, the server will queue incoming HTTPconnections (eventually dropping them once a threshold is hit), and if it’s set toohigh, the server may swap itself to death during periods of high traffic. The defaultvalue for MaxClients for Prefork is 256. For static websites or very minimal PHPscripts, 256 processes may be fine, but for most Drupal sites, this is way too high.The reason that this value is too high is because when using mod_php memory isallocated inside of each httpd process, and for larger Drupal sites, it’s not unusualto see httpd processes using somewhere from 64–150 MB (or more!) each. If yourhttpd processes are each averaging 150 MB of RAM, then at 256 processes, that’snearly 38 GB of RAM. Some of us are lucky to have servers that large, but it’s notcommon, or inexpensive. Also, that doesn’t take into account memory usage by
176 | Chapter 18: PHP and httpd Configuration
www.it-ebooks.info

other processes on the system. The trick to setting MaxClients appropriately is tofirst figure out how large your httpd processes are. You can get a general numberfor this by running top and looking at the RES (resident memory) column. Onceyou know how large your httpd processes are, you can use the following formulato see how many httpd processes you can support:
((System RAM) – (RAM used by other processes)) / (httpd process size) = MaxClients
“RAM used by other processes” would take into account any other major services run‐ning on the web server, plus some amount for basic OS-level processes. Generally weuse 512 MB as a rough estimate for OS resource needs, and then add any additionalservice requirements to that. This 512 MB estimate is intended to cover resources usedby the kernel as well as periodic processes that may be run on the server. Long-runningservices should be analyzed separately.
As an example, suppose your web server is running Varnish, httpd, and no other majorservices. The server has 8 GB of RAM. Varnish is allocated 2 GB of memory. Your averagehttpd process is around 85 MB. To provide some safety in our estimate, we’ll round thatup to 100 MB. In this case, we would calculate MaxClients as follows:
((8 GB System RAM) – (512 MB OS resources + 2 GB Varnish)) / (100 MB httpd process)= 5632 MB / 100 MB= 56.32
You should always round down at the end for safety, so you would end up with 56 asyour MaxClients setting.ServerLimit
This setting defines the maximum value that you can set MaxClients to during thelife of the parent httpd process. In most cases, if you have calculated MaxClients asshown above, you can set this to the same number. If you want to give yourself somewiggle room in order to potentially increase MaxClients without having to fullyrestart Apache, you could set this to be the maximum that you would increaseMaxClients to. In either case, MaxClients must be less than or equal to ServerLimit.
MaxRequestsPerChildThis setting controls how many requests a child httpd process will serve before itis killed. The Apache default is 10000, although many distributions ship with othervalues in httpd.conf. Both 4000 and 0 (disabled) are used by common distributions.When this is set to 0, httpd child processes are never killed (except as part ofMaxSpareServers, as described above). As with most Apache settings, there is atrade-off involved when setting this. Setting this value on the high side can causeyour httpd processes to consume more RAM over time due to memory leaks in
Prefork Thread Settings | 177
www.it-ebooks.info

PHP or other scripts, or due to a process that loads different code bases over itslifetime. On the other hand, setting this value too low will lead to a lot of overheadon the server caused by killing and respawning httpd processes. Generally, we wouldconsider somewhere in the 1000–4000 range to be a safe value for this setting, basedon the traffic your site experiences. 2000 is a good middle-of-the-road value that ishigh enough that you won’t see process thrashing in most cases, but low enoughthat httpd processes won’t stick around forever eating up a lot of memory.
KeepAliveKeepAlive allows a client to reuse the same connection with the server multiple timesinstead of having to open up a new connection for each request. For example, if youhad a web page with a number of images and CSS files all served locally, the client woulddownload the web page and then reuse the same connection to download the imagesand CSS. This saves time and resources on both ends of the connection. However, thereis a downside to using KeepAlive, which is that the server needs to keep connectionsopen for a certain amount of time (defined by KeepAliveTimeout). This can lead to alot of open connections sitting around waiting and not actually serving any content.For this same reason, KeepAlive can make it easier for someone to launch a denial ofservice (DoS) attack against your site—once there are enough connections open waitingfor clients, no other requests to the site can be served.
To be clear, KeepAlive is very beneficial for client-side performance. However, it canbring down sites if misconfigured, or if enabled at all during large traffic spikes. This isone of the benefits of having a caching reverse proxy, such as Varnish, as it is far morecapable of handling KeepAlive connections to clients without adversely impactingApache stability.
If you choose to use KeepAlive, be sure to also look at the KeepAliveTimeout setting,which defines how long a process will wait for an idle client to send another request.The default KeepAliveTimeout is five seconds, which in most cases is rather high. Ide‐ally, set this as low as possible without having it force new connections on existing clients.One or two seconds can work generally, but it’s worth a bit of trial and error to figureout the correct setting for your site and the majority of your visitors. Also, we highlyrecommend providing KeepAlive to clients through a proxy and not directly withApache.
Cache HeadersThere are a number of headers that are used to inform client browsers and intermediatecaches whether or not to cache content, and if so, for how long. Configuring theseheaders properly can make a difference in user-visible performance on your site. Theheaders you will want to keep an eye on when setting up a production site are ETags,
178 | Chapter 18: PHP and httpd Configuration
www.it-ebooks.info
Expires, Cache-Control, Last-Modified, and Vary. These headers work together todetermine just how aggressively a client can cache a page or static file. We will discusseach of these headers individually:Last-Modified
This header is used exactly as you might expect, to check whether a page has beenmodified since it was last fetched. By default, Drupal adds this header to pages witha timestamp generated during the Drupal bootstrap process when serving a page.
ETag
The ETag, or entity tag, is meant to uniquely identify a single version of a page.When the ETag matches on two versions of a document, they are assumed to be thesame. This tag can be as simple as an MD5 hash of the document or as complicatedas hashes of various aspects of the request. What it should not be is the defaultApache ETag, which includes server-specific information. If you use Apache’s de‐fault ETag, if you have four web nodes the ETags generated on each node will bedifferent, and reverse proxy caching will be significantly worse.
Expires
This header indicates when the page will expire from any cache it is in. In Pressflowand Drupal 7 or later, you can set this date by configuring the page cache maximumage. This is a legacy header, and if Cache-Control (which we will discuss next)exists, this header is ignored by newer browsers and proxies.
Cache-Control
This header controls caching options and is set by Pressflow and Drupal 7 laterwhen they are configured to use an external page cache. The name is not as creativeas one might have hoped. The header contains keywords and settings that impactcaching, for example:
max-age=N
This informs downstream proxies of the maximum number of seconds this pagecan stay in its cache.
no-cache
This completely disables caching.
private
This allows for browser caching, but not intermediate proxy caching.
LoggingApache allows you to set multiple log outputs for different types of information, thoughthe majority of sites are configured only with a general access log and an error log. Mostoften, in the case of multiple sites on a single server, logs are defined per-virtual host sothat it’s easy to track information for each individual site.
Logging | 179
www.it-ebooks.info

The format of the log files can be defined using the ErrorLogFormat and LogFormatdirectives. Generally, the default ErrorLogFormat is fine for most sites, and for the accesslog, most sites use one of the log formats that comes predefined in default Apacheconfiguration files—either “common” or “combined.” The combined log format addsheader information for Referer and User-Agent. If you decide to use your own customlog format, you can define the format and give it a name using the LogFormat directive,and then refer to that name in a CustomLog directive:
LogFormat "%h \"%r\"" hostandrequestCustomLog logs/request.log hostandrequest
This example defines a hostandrequest log format that includes only the remote hostand the requested URL, and then uses that format to log to the file logs/request.log.
Log destinations are defined relative to the ServerRoot unless the pathbegins with a slash. ServerRoot defaults to /etc/httpd on Red Hat-based distributions or /etc/apache2 on Debian-based distributions.Red Hat includes a symlink from /etc/httpd/logs to /var/log/httpd inorder to ensure logs end up in the standard location on the system.
While the built-in Apache logging works great for many sites, it’s not quite as flexibleas some sites require. For these situations, Apache supports using external loggingtools. Cronolog is one example of an external logging application used in conjunctionwith Apache. It has some nice features, such as dynamic log file naming using date fields,making it possible to output to a log file with the current date in its filename. When thedate changes, Cronolog will automatically start writing to a new file, meaning you get“built-in” log rotation as well as having log files nicely organized by date. Because newlog files are written to every day, there’s no need to reload httpd to perform log rotation.You most likely will want to add your own scripts to compress these log files, and even‐tually to remove/archive them. The following is an example Apache configuration touse Cronolog:
ErrorLog "|/usr/sbin/cronolog /var/log/httpd/error/%Y%m%d-error.log"CustomLog "|/usr/sbin/cronolog /var/log/httpd/access/%Y%m%d-access.log" common
You can add the following script to cron.daily on the server to compress old log files:
#!/bin/bashexport PATH="/usr/bin:/bin"
if [ -d /var/log/httpd ]; then find /var/log/httpd -name "*.log" -mtime +1 -exec gzip -9 "{}" ";"fi
and this one to eventually remove them:
180 | Chapter 18: PHP and httpd Configuration
www.it-ebooks.info

#!/bin/bashexport PATH="/usr/bin:/bin"
if [ -d /var/log/httpd ]; then find /var/log/httpd -name "*.log.gz" -mtime +60 -exec rm "{}" ";"fi
Server SignatureThere are a couple of places where Apache may output information about its version,and potentially version information for modules such as PHP. One of these is the “serversignature” line that optionally shows up at the bottom of Apache-generated pages (e.g.,503 errors or directory listing pages); the other is the Server HTTP response headerthat gets sent by the server. Some people may consider this a security risk in that it makesit easy for potential attackers to know what software versions you are running and targetyou with specific attacks. Others would say that security through obscurity is not securityat all, and if someone is dedicated enough, hiding information like this is only going tomake it take a few minutes longer for them to figure out an attack. Whatever your viewis, you may want to hide this information either for security reasons or just because youdon’t like the way it looks to potential visitors.
The Server header and server signature lines are controlled by two different settings:ServerSignature
This is an on/off setting that controls whether or not to show the server signatureline on Apache-generated pages. Setting this to Off means that the server signaturewill not be shown on those pages.
ServerTokens
This is the setting that controls what information is shown in the server signatureline and placed in the Server HTTP response header. The default setting for ServerTokens is Full, which will show Apache version information as well as moduleand version information for running modules (e.g., PHP). While you can’t set thisto be empty without modifying the source code, you can limit the information sentto be only the “Product” string, “Apache,” by setting ServerTokens to Prod. Re‐member that changing this not only changes the server signature on documents,but also controls the text used in the Server HTTP header.
Administrative Directory or VirtualHostOften times, you’ll need to store various web-accessible scripts on a server used formonitoring or management. For example, it can be useful to have access to apc.php toreview APC settings and statistics, but you typically don’t want to leave that in yourpublicly accessible web root. There are a couple of easy solutions for how to securelystore those scripts: you can either use a locked-down directory or a separate virtualhost
Server Signature | 181
www.it-ebooks.info

to store the scripts. In either case, securing the scripts directory using a list of authorizedIPs and/or an htaccess username and password is critical.
Some sites go so far as to only allow access from localhost, meaningyou need to do something like proxy your traffic through SSH in orderto load the administrative scripts. If you do lock down a directory toonly localhost, ensure that you’re factoring any reverse proxies you maybe running into your thinking. These will make many connectionsappear to be coming from localhost.
Storing these types of scripts in their own separate directory has a couple of great ben‐efits. First, you don’t need to temporarily copy files into your production web root andremove them when you’re done. (How many times have you copied a phpinfo() scriptor similar into the web root and then forgotten to remove it?) Secondly, keeping themin their own virtualhost or directory means they are easily accessible by authorized users(or monitoring scripts) at a permanent URL that you can use across all of your webservers.
An example administrative scripts directory configuration looks like this:
Alias /adminscripts /var/www/adminscripts<Directory "/var/www/adminscripts"> Options -Indexes AllowOverride None # Control who can get stuff from this directory. Order Allow,Deny Allow from 127.0.0.1</Directory>
NginxApache’s web server, httpd, is the most popular web server in use today, and has beenfor many years. Recently, however, some other open source web servers have gainedsome traction. Nginx is one alternative to Apache’s httpd that has become very popular.
There are a number of reasons why you might consider using Nginx for your site insteadof Apache. Nginx is newer, and there is a lot of discussion around the Internet suggestingthat Nginx is generally faster and lighter, especially for serving static files. While sometests may back this up, it’s by no means conclusively faster for all requests. One thingthat may make Nginx faster than Apache for serving static files in our default setup(using mod_php) is that with mod_php Apache would have a full PHP process in memoryfor each httpd process. Nginx doesn’t have to worry about this, because it relies on anexternal PHP setup. This is one reason we recommend offloading static file serving ifyou are using Apache and mod_php.
182 | Chapter 18: PHP and httpd Configuration
www.it-ebooks.info
One of the main differences in Nginx is its event-based model for dealing with newconnections. Instead of dedicating a process or thread to each request, this processmodel only services a request when an event triggers (data read from disk, etc.), andthen moves on to another request. This model has become very popular recently, dueto how efficient it can be when executed well. Apache 2.4 now includes the event MPM,which works somewhat similarly to Nginx.
The most common Nginx setup for Drupal involves using PHP-FPM (see “PHP ApacheModule Versus CGI” on page 174), which provides a pool of PHP processes that Nginxconnects to over a Unix or TCP socket. This architecture provides a method to scaleand tune Nginx separately from the PHP processes, keeping the Nginx processes verylightweight and able to quickly serve static requests.
mod_php won’t work with Nginx. You must use PHP as a CGI whenrunning Nginx.
Why Not Use Nginx Everywhere?Nginx and PHP-FPM can provide a performance enhancement and a reduction of re‐sources as compared to the most common Apache configuration, so it may seem likethere is no reason to ever use Apache. This may be true in certain cases, but there areindeed reasons why many people still prefer Apache. One major reason is that whenyou start caching static items in a reverse proxy and/or CDN—more on this in the nextchapter—the web server is being hit much less often for those types of requests, and theperformance difference for static files is only noticeable when first loading an item intothe external cache. This leaves Apache and mod_php to be just an application server,which limits the advantages of Nginx as a static file server. Another major reason forpeople to use Apache is if they require htaccess files in their setup, as these are notsupported by Nginx. At the end of the day, the question of which httpd server to use isusually decided by team familiarity and other requirements.
Nginx | 183
www.it-ebooks.info

CHAPTER 19
Reverse Proxies and Content DeliveryNetworks
We’ve discussed a number of ways to speed up Drupal sites by improving code, opti‐mizing infrastructure, and speeding up database queries. These changes can make ahuge difference in website performance, but they can only go so far. Site performancecan be improved even further by caching content before requests even reach Apache(and Drupal, PHP, or MySQL). Reverse proxies provide a way to do just that—cachestatic items such as images, JavaScript, and CSS, and potentially even full pages—andserve those items in a fraction of the time it would take if the request had go into Apache,PHP, and MySQL. This chapter focuses on reverse proxies with built-in caches, alsoreferred to as web accelerators.
Content delivery networks (CDNs) take the idea of a reverse proxy a step further bymoving cached content physically closer to website visitors. In addition to offloadingnetwork traffic from your infrastructure, this also makes your site seem much faster tovisitors by reducing their network latency.
Using a Reverse Proxy with DrupalWhen implementing a reverse proxy cache in front of your web servers, there are manyoptions to consider. First up is which reverse proxy to use. Varnish has become verypopular in recent years and its configuration language is extremely powerful, allowingfor very specific caching configurations. Varnish has generally become accepted by theDrupal community as the reverse proxy of choice, so we’ll concentrate solely on Varnish
185
www.it-ebooks.info

here. The overall ideas apply to any reverse proxy, but the specific configuration exam‐ples will apply to Varnish only.
Other Popular Reverse Proxy CachesOf course, Varnish isn’t the only option out there. Other popular reverse proxy cachesinclude the following:Nginx
In addition to functioning as a web server in place of Apache, Nginx is also fre‐quently used as a standalone reverse proxy.
SquidSquid is one of the oldest reverse proxies still available today, though its use hasdeclined in favor of Varnish in recent years.
Apache Traffic ServerOriginally developed at Yahoo!, Traffic Server was donated to the Apache SoftwareFoundation and is now fully open source.
Secondly, you need to decide how much you want to cache and how integrated the proxywill be with your website. For example, caching static content items like images andJavaScript is relatively easy and can be done “out of the box” with minimal configuration,using pretty much any reverse proxy. If you want to take things a step further and startcaching full pages served by Drupal, that requires a bit more configuration. Going evenfurther, you can closely integrate Varnish and Drupal such that when an object is edited,Drupal can immediately purge pages containing that object out of Varnish’s cache toprevent stale content from being served. While the more advanced actions may take abit more configuration, it’s not terribly difficult once you get comfortable with the con‐figuration language—and there are a number of contributed Drupal modules that willhelp ease the process as well.
Let’s look at an example of using Varnish to cache. Figure 19-1 shows Varnish handlingincoming HTTP requests for the site. When Varnish has a valid item in its cache, it willserve that item from the cache immediately with no backend request to the web server.When Varnish does not have an item cached, or has an out-of-date item cached, it willmake a request to the web server for the item, store it in the local Varnish cache if it’scacheable, and then return it to the client.
186 | Chapter 19: Reverse Proxies and Content Delivery Networks
www.it-ebooks.info
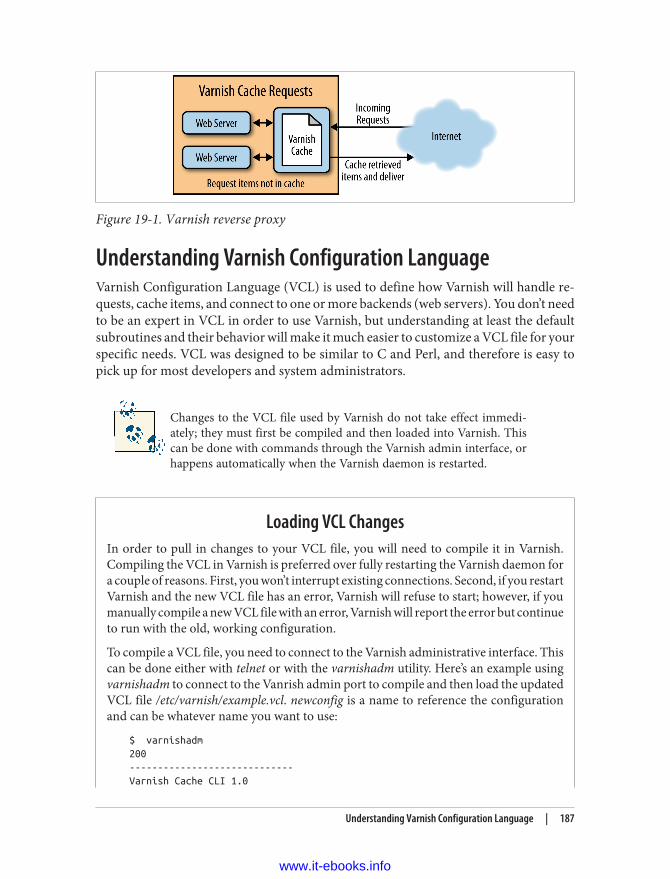
Figure 19-1. Varnish reverse proxy
Understanding Varnish Configuration LanguageVarnish Configuration Language (VCL) is used to define how Varnish will handle re‐quests, cache items, and connect to one or more backends (web servers). You don’t needto be an expert in VCL in order to use Varnish, but understanding at least the defaultsubroutines and their behavior will make it much easier to customize a VCL file for yourspecific needs. VCL was designed to be similar to C and Perl, and therefore is easy topick up for most developers and system administrators.
Changes to the VCL file used by Varnish do not take effect immedi‐ately; they must first be compiled and then loaded into Varnish. Thiscan be done with commands through the Varnish admin interface, orhappens automatically when the Varnish daemon is restarted.
Loading VCL ChangesIn order to pull in changes to your VCL file, you will need to compile it in Varnish.Compiling the VCL in Varnish is preferred over fully restarting the Varnish daemon fora couple of reasons. First, you won’t interrupt existing connections. Second, if you restartVarnish and the new VCL file has an error, Varnish will refuse to start; however, if youmanually compile a new VCL file with an error, Varnish will report the error but continueto run with the old, working configuration.
To compile a VCL file, you need to connect to the Varnish administrative interface. Thiscan be done either with telnet or with the varnishadm utility. Here’s an example usingvarnishadm to connect to the Vanrish admin port to compile and then load the updatedVCL file /etc/varnish/example.vcl. newconfig is a name to reference the configurationand can be whatever name you want to use:
$ varnishadm200-----------------------------Varnish Cache CLI 1.0
Understanding Varnish Configuration Language | 187
www.it-ebooks.info

-----------------------------Linux,3.9.10-100.fc17.x86_64,x86_64,-sfile,-smalloc,-hcritbit
Type 'help' for command list.Type 'quit' to close CLI session.
> vcl.load newconfig /etc/varnish/example.vcl200 13VCL compiled.> vcl.use newconfig200 0
Defining a BackendThe first step when setting up Varnish is to configure it with your backend information.The backend declaration supplies Varnish with information on how to connect to yourbackend web server(s). The declaration can be as simple as providing a hostname andport, but it also allows you to configure additional options such as connection timeouts,max connections, and probe checks, which are used to check whether the backend ishealthy or not. An example backend server declaration looks like this:
backend default { .host = "10.0.1.15"; .port = "80"; .connect_timeout = 20s; .first_byte_timeout = 20s; .between_bytes_timeout = 10s; .max_connections = 120; .probe = { .request = "GET healthcheck.php HTTP/1.1" "Host: www.example.com" "Connection: close" "Accept-Encoding: gzip" ; .interval = 5s; .timeout = 3s; .window = 5; .threshold = 3; }}
This example defines a backend named default, which will connect to port 80 on host10.0.1.15. Varnish will throw an error if any of the timeouts are hit while making arequest to the backend. The max_connections setting allows a way to limit the numberof connections that Varnish will make to the backend—this should not be more thanyour Apache MaxClients setting on the web server, discussed in the previous chapter.
188 | Chapter 19: Reverse Proxies and Content Delivery Networks
www.it-ebooks.info

When running a single server with both Apache and Varnish, you willneed to have Varnish listen on port 80 and move Apache to listen onan alternate port (via the Listen setting in httpd.conf). Also be sure toset the correct Apache port in your VCL backend settings.
The probe section is optional; it defines a periodic health check for the backend. Usinga probe gives you a proactive way to check the status of a backend—otherwise, the statuswill only be updated if it hits a timeout when making a backend request for a client.Obviously, that particular client request will be served a Varnish error. It’s best to definea probe, especially if you have multiple backends, so sick backends are automaticallyavoided with the use of a director. Once a probe detects that the backend has returnedto a healthy state, the backend will be made active again in the director.
Inside of the probe definition, you are able to specify a URL to request, along with anyother headers that should be used for the request. In addition, you define how often torun the check, what its timeout is, and window and threshold values. In order to declarea backend as healthy, Varnish will look the past X probe responses, where X is yourwindow value: at least threshold of them must be successful. In our example, Varnishwill look at the previous five probe requests, and if three or more of them were successful,the backend will be marked as healthy. If two or fewer probe requests were successful,the backend will be marked as sick.
Your probe should use a simple page as a check. You don’t want to usea page that will put a large load on your web server or take a long timeto respond, though it’s best to choose a page that verifies the full stackis working. For example, use a simple Drupal page instead of using astatic HTML page, which might succeed even if there were problemswith Drupal, PHP, and/or the database.
Directors: Dealing with Multiple Backend ServersIf you have more than one web server, you can define each in its own backend decla‐ration, but then you’ll need a way to group them together and tell Varnish how to directtraffic between them; that’s where directors come in. In Varnish, a director is a logicalgrouping of backend servers. There are a number of different director types that usedifferent algorithms to decide which backend to use for a given request. To declare a
Understanding Varnish Configuration Language | 189
www.it-ebooks.info

director, you need to give it a name, tell it which director type to use, and then definewhich backend servers to include.
Varnish Director TypesThe types of director available in Varnish include:Random
Picks a backend at random, though weights can be used to adjust the chance ofusing a particular backend.
ClientUses the client’s identity to choose a backend.
HashChooses a backend based on the request URL hash. This is useful if you have oneVarnish instance load balancing in front of multiple Varnish servers and want tosplit the cache among them; it prevents cache duplication between the servers.
Round-robinCycles through a list of backends, directing one request to each, then moving on tothe next.
DNSAllows you to specify a list of IPs or a netblock to use for backend servers. Thisbackend makes it easy to define a large number of backend servers with minimalconfiguration in the VCL.
FallbackProvided with a list of backends, this director will start at the top of the list and usethe first one that is considered healthy.
The following example shows how to define a round-robin director, which will simplyloop over all the backends listed, directing a single request to one backend and thenmoving to the next backend for the next request. Assume we’ve already defined twobackends, web1 and web2:
director main round-robin { { .backend = web1; } { .backend = web2; }}
This defines a director named main, which will direct traffic evenly between both of thebackends. Another commonly used director is the random director, which will ran‐
190 | Chapter 19: Reverse Proxies and Content Delivery Networks
www.it-ebooks.info

domly select a backend from a list, though you can also weight the backend servers inorder to send more or less traffic to them. This can be useful if your web servers are notuniform and one has more processing power than another. An example definition lookslike this:
director loadbalance random { { .backend = web1; .weight = 3; } { .backend = web2; .weight = 1; } { .backend = web3; .weight = 1; }}
This example declares a director named loadbalance that randomly selects a backendserver from those listed, but will give the web1 backend a weight such that it will beselected roughly three times as often as either of the other two backend servers.
Once you define a director, Varnish needs to be told when to use that director. This isconfigured within the vcl_recv subroutine, described in more depth in the next section.At its simplest, all you need to do is set the req.backend variable to the backend ordirector you want to use. The setting used is the same whether you are setting it to asingle backend or to a director:
sub vcl_recv { set req.backend = loadbalance;}
This example sets the default backend to the loadbalance director we defined in theprevious example.
Built-in VCL SubroutinesThere are a number of subroutines used by Varnish to handle requests. You can overrideor “prepend” any of these subroutines with your own definitions. Most of the time, onlyone or two of these subroutines needs to be modified in order to work well with yoursite. However, some sites need a bit more customization and end up overriding mostor all of the built-in subroutines. It’s important to know that if you don’t define one ofthe built-in subroutines in your VCL file, that subroutine will still exist in its defaultconfiguration. Here is a quick overview of some of the predefined subroutines used inthe VCL file that are commonly modified with site-specific configurations:
Understanding Varnish Configuration Language | 191
www.it-ebooks.info

vcl_recv
This subroutine is called to deal with an incoming request. It contains the logic totell Varnish if and how to serve the request—for example, whether it should returna cached item or bypass the cache and fetch an object from a backend server inorder to fulfill the request. vcl_recv is also where you declare which backend (ordirector) to use for a given request.
vcl_fetch
This subroutine is called after an item has been fetched from a backend. Generally,things to check for here include if a cookie is being set, or some other response thatindicates the item should not be cached.
vcl_error
This subroutine is called when an error is hit either within Varnish or with thebackend response. Here you have the option of calling a restart on the request totry again, in the hopes of not getting an error the second time. This subroutine isalso used to customize the Varnish error output and to deal with custom error codesthat may have been set elsewhere in the VCL.
vcl_hash
This subroutine creates a hash for the cached item. The cache is used internally byVarnish for future lookups and by default includes the URL and either the HTTPhost or IP address. If you are doing some custom caching (e.g., splitting the cache)based on a cookie or a certain header in the request, then you would likely do soby including that item in your hash calculation. This is useful, for example, if youwant to cache mobile requests separately from regular “desktop” requests based ona device type cookie or header.
For Varnish 3.0, the VCL reference located here gives an overview ofall VCL subroutines and shows the default configuration for each. Thedefault VCL example here provides a flowchart showing how a re‐quest flows through the various VCL subroutines.
Customizing SubroutinesWhen you add code for any of the built-in subroutines in your VCL configuration, bydefault you will only prepend the default for that subroutine. If your custom code ter‐minates with an action (e.g., some sort of return statement), then the default won’t berun for that subroutine. Sometimes there are reasons you want to bypass the defaultroutines, though generally it is best to only prepend them by not including a returnstatement at the end of your code.
192 | Chapter 19: Reverse Proxies and Content Delivery Networks
www.it-ebooks.info

As an example, let’s write a few custom vcl_recv subroutines with one difference: onewill return at the end of the subroutine (bypassing the default vcl_recv stub), and onewill not return by default, meaning the default stub will get executed. For starters, hereis the default vcl_recv stub:
/* * Copyright (c) 2006 Verdens Gang AS * Copyright (c) 2006-2011 Varnish Software AS * All rights reserved. * * Author: Poul-Henning Kamp <[email protected]> * * Redistribution and use in source and binary forms, with or without * modification, are permitted provided that the following conditions * are met: * 1. Redistributions of source code must retain the above copyright * notice, this list of conditions and the following disclaimer. * 2. Redistributions in binary form must reproduce the above copyright * notice, this list of conditions and the following disclaimer in the * documentation and/or other materials provided with the distribution. * * THIS SOFTWARE IS PROVIDED BY THE AUTHOR AND CONTRIBUTORS ``AS IS'' AND * ANY EXPRESS OR IMPLIED WARRANTIES, INCLUDING, BUT NOT LIMITED TO, THE * IMPLIED WARRANTIES OF MERCHANTABILITY AND FITNESS FOR A PARTICULAR * PURPOSE ARE DISCLAIMED. IN NO EVENT SHALL AUTHOR OR CONTRIBUTORS BE * LIABLE FOR ANY DIRECT, INDIRECT, INCIDENTAL, SPECIAL, EXEMPLARY, OR * CONSEQUENTIAL DAMAGES (INCLUDING, BUT NOT LIMITED TO, PROCUREMENT OF * SUBSTITUTE GOODS OR SERVICES; LOSS OF USE, DATA, OR PROFITS; OR * BUSINESS INTERRUPTION) HOWEVER CAUSED AND ON ANY THEORY OF LIABILITY, * WHETHER IN CONTRACT, STRICT LIABILITY, OR TORT (INCLUDING NEGLIGENCE * OR OTHERWISE) ARISING IN ANY WAY OUT OF THE USE OF THIS SOFTWARE, * EVEN IF ADVISED OF THE POSSIBILITY OF SUCH DAMAGE. */
sub vcl_recv { if (req.restarts == 0) { if (req.http.x-forwarded-for) { set req.http.X-Forwarded-For = req.http.X-Forwarded-For + ", " + client.ip; } else { set req.http.X-Forwarded-For = client.ip; } } if (req.request != "GET" && req.request != "HEAD" && req.request != "PUT" && req.request != "POST" && req.request != "TRACE" && req.request != "OPTIONS" && req.request != "DELETE") { /* Non-RFC2616 or CONNECT which is weird. */ return (pipe);
Understanding Varnish Configuration Language | 193
www.it-ebooks.info

} if (req.request != "GET" && req.request != "HEAD") { /* We only deal with GET and HEAD by default */ return (pass); } if (req.http.Authorization || req.http.Cookie) { /* Not cacheable by default */ return (pass); } return (lookup);}
Let’s walk through what the default code does. First, it appends to the X-Forwarded-For header if that is set. Next, it checks for nonstandard request types; if it encounterssomething unexpected, it will return pipe, meaning that the request will be piped di‐rectly to the backend instead of going through the normal request flow in Varnish. Afterthat, if the request type is anything except GET or HEAD, Varnish will pass it throughwithout caching (you wouldn’t want to cache a POST request, for example). In the finalcheck, Varnish checks if there is an Authorization header or if a cookie is set. If eitherof those are in place, the request is returned with pass, meaning it won’t be cached.Finally, after going through all that, the subroutine returns lookup, meaning it willforward the request to the backend and attempt to cache the result.
For the sake of this example, let’s assume that you want to add one additional check tovcl_recv. Specifically, there is a URL, /update.php, which you want to tell Varnish neverto cache. Seems reasonable enough. Let’s see how that would be handled in vcl_recv:
sub vcl_recv { if (req.url ~ "^/update.php$") { return(pass); }}
Once you’ve loaded that code into Varnish, your custom vcl_recv will be run for in‐coming requests. In this case, if a request comes in for /update.php Varnish will returnpass, meaning that it will bypass its cache for the request. Requests for any other URLon the site will fall through your subroutine and, because you did not include a return at the end of the subroutine, the default stub shown earlier will be executed as well.Compare that to the following:
sub vcl_recv { if (req.url ~ "^/update.php$") { return(pass); } return(lookup);}
The code in this version includes return(lookup) in the subroutine. In this case, re‐quests for URLs other than /update.php will be cached in Varnish and delivered to
194 | Chapter 19: Reverse Proxies and Content Delivery Networks
www.it-ebooks.info
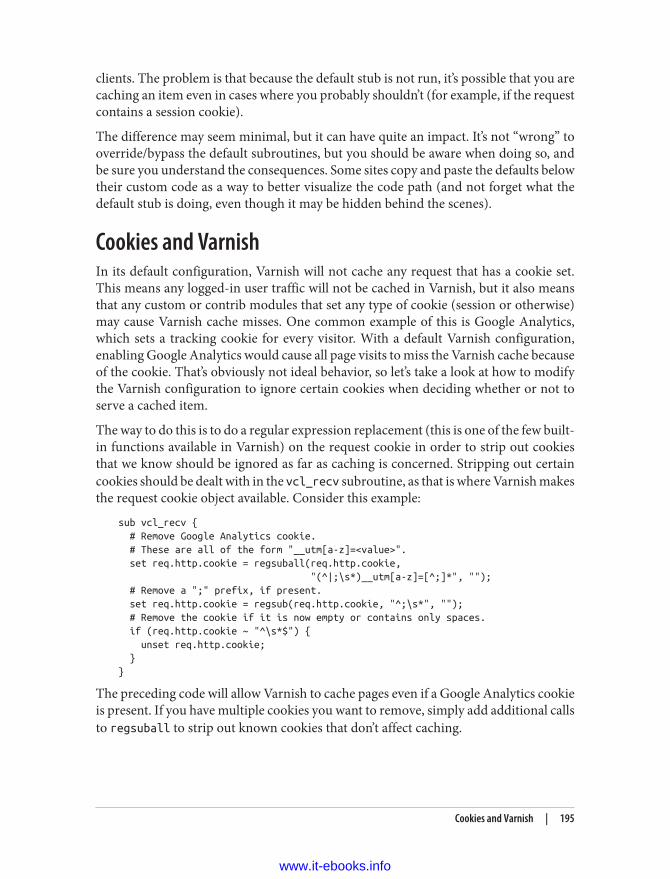
clients. The problem is that because the default stub is not run, it’s possible that you arecaching an item even in cases where you probably shouldn’t (for example, if the requestcontains a session cookie).
The difference may seem minimal, but it can have quite an impact. It’s not “wrong” tooverride/bypass the default subroutines, but you should be aware when doing so, andbe sure you understand the consequences. Some sites copy and paste the defaults belowtheir custom code as a way to better visualize the code path (and not forget what thedefault stub is doing, even though it may be hidden behind the scenes).
Cookies and VarnishIn its default configuration, Varnish will not cache any request that has a cookie set.This means any logged-in user traffic will not be cached in Varnish, but it also meansthat any custom or contrib modules that set any type of cookie (session or otherwise)may cause Varnish cache misses. One common example of this is Google Analytics,which sets a tracking cookie for every visitor. With a default Varnish configuration,enabling Google Analytics would cause all page visits to miss the Varnish cache becauseof the cookie. That’s obviously not ideal behavior, so let’s take a look at how to modifythe Varnish configuration to ignore certain cookies when deciding whether or not toserve a cached item.
The way to do this is to do a regular expression replacement (this is one of the few built-in functions available in Varnish) on the request cookie in order to strip out cookiesthat we know should be ignored as far as caching is concerned. Stripping out certaincookies should be dealt with in the vcl_recv subroutine, as that is where Varnish makesthe request cookie object available. Consider this example:
sub vcl_recv { # Remove Google Analytics cookie. # These are all of the form "__utm[a-z]=<value>". set req.http.cookie = regsuball(req.http.cookie, "(^|;\s*)__utm[a-z]=[^;]*", ""); # Remove a ";" prefix, if present. set req.http.cookie = regsub(req.http.cookie, "^;\s*", ""); # Remove the cookie if it is now empty or contains only spaces. if (req.http.cookie ~ "^\s*$") { unset req.http.cookie; }}
The preceding code will allow Varnish to cache pages even if a Google Analytics cookieis present. If you have multiple cookies you want to remove, simply add additional callsto regsuball to strip out known cookies that don’t affect caching.
Cookies and Varnish | 195
www.it-ebooks.info

Caching for Authenticated UsersWe mentioned in the previous section that by default, requests from logged-in userswill not be cached by Varnish. For many cases, that’s actually the preferred behavior.For example, you wouldn’t want to cache per-user or per-role page customizations andthen serve those cached items to an anonymous user. However, there are some files thatremain static for all requests, such as image, JavaScript, and CSS files. There is no reasonnot to cache those in Varnish and serve them for any request, regardless of whether ornot the user is logged in.
There are a couple of different approaches to solve this particular issue. One option isto create a list of file extensions that should always be cached. The second option makesthe assumption that any files served out of the sites/ subdirectory can be cached re‐gardless of whether the user is logged in. Either way, the implementation is very similar:add a check in vcl_recv, and if the check is met, unset any cookies that might be presentand return a lookup. return(lookup) will return an item from the cache or, if it’s notpresent, fetch it from the backend and store it in the cache for future requets. Here’s aVCL example for serving cached items for common “static” file extensions:
sub vcl_recv { if (req.url ~ "\.(js|css|jpg|jpeg|png|gif|gz|tgz|bz2|tbz|mp3|ogg|swf)$") { unset req.http.Cookie; return (lookup); }}
Edge-Side IncludesThere are many cases where it would be possible (and ideal!) to cache a page in Varnishfor authenticated users, but where there is some small amount of personalized contentin that page that can’t be shared between users. Edge-side includes (ESI) provides a wayto work around this problem by referencing the personalized data in a separate ESI tag.The full page without the personalized content can then be cached in Varnish, and thatcontent can be pulled in separately and integrated with the cached content.
Imagine the simple case of a logged-in user block that displays the user’s name. This issomething you wouldn’t want to cache and serve to other users, for obvious reasons.However, if the rest of the page contents are not user-specific, then Varnish could cachethe entire page and dynamically pull in an ESI block containing the user-specific blockcontent.
ESI is a very powerful tool that can greatly increase your cache hit rate by allowing muchmore of the site to be cached for authenticated users. However, misused or misconfig‐ured, ESI could have the opposite effect and greatly reduce your site’s client-side per‐formance, so be sure to thoroughly test any deployment. We could easily span an entire
196 | Chapter 19: Reverse Proxies and Content Delivery Networks
www.it-ebooks.info

chapter (or book!) discussing ESI, but because of space constraints, we won’t go into itin more depth here.
The Drupal ESI module provides example documentation for how tointegrate Drupal ESI into Varnish.
Serving Expired ContentSometimes it makes sense to serve cache content that has already expired. This isn’tquite as bad as it sounds; cached content is not like expired milk, and certainly smellsbetter. Actually, there are a couple of good reasons that you might want to serve expiredcontent:
• The backend server is down or unreachable.• Varnish has sent a request to the backend for an object, but that request is slow to
process on the backend. Meanwhile, Varnish could serve an old version of that sameobject to any incoming requests for the same object.
Both of these situations are handled by setting a grace period for requests to live inVarnish after they have expired. This can be set using the req.grace variable invcl_recv. You’ll also need to set beresp.grace in vcl_fetch. req.grace controls thegrace period for an object. beresp.grace affects the maximum grace time allowed foran object, controlling when the object will be purged from the cache. Consider thefollowing VCL snippet:
sub vcl_recv { if (req.backend.healthy) { set req.grace = 20s; } else { set req.grace = 30m; }}
sub vcl_fetch { set beresp.grace = 30m;}
In vcl_recv, we check if the backend is healthy (health is based on backend probes orrecent failed backend requests). If the backend is healthy, a grace period of 20 secondsis used for requests — this applies to cases where a cache item has expired and a newrequest has been sent to the backend for the updated object. In this case, any subsequentrequests for the item will be served the expired content while the backend request iswaiting to complete. On the other hand, if the backend is considered sick, the grace time
Serving Expired Content | 197
www.it-ebooks.info
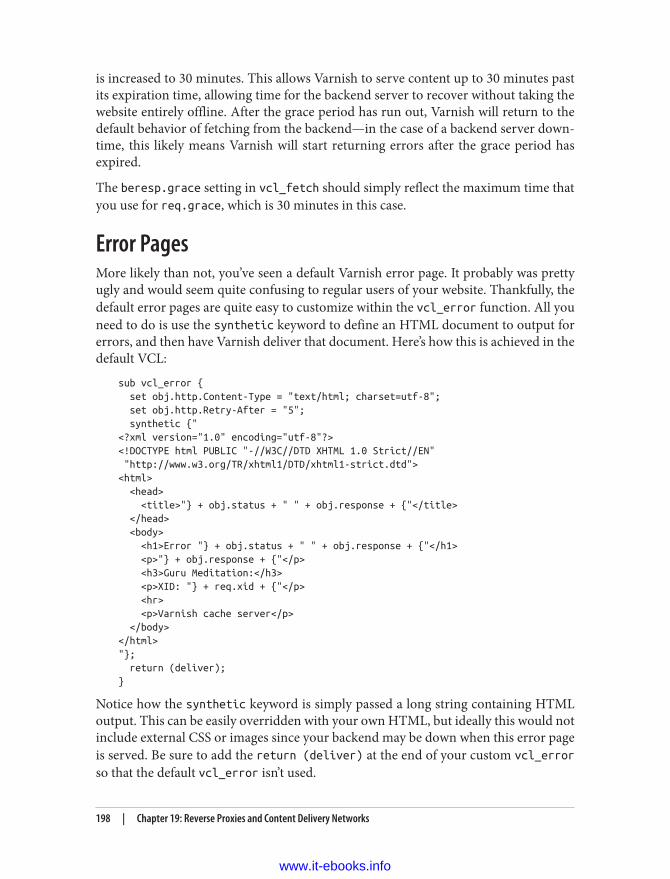
is increased to 30 minutes. This allows Varnish to serve content up to 30 minutes pastits expiration time, allowing time for the backend server to recover without taking thewebsite entirely offline. After the grace period has run out, Varnish will return to thedefault behavior of fetching from the backend—in the case of a backend server down‐time, this likely means Varnish will start returning errors after the grace period hasexpired.
The beresp.grace setting in vcl_fetch should simply reflect the maximum time thatyou use for req.grace, which is 30 minutes in this case.
Error PagesMore likely than not, you’ve seen a default Varnish error page. It probably was prettyugly and would seem quite confusing to regular users of your website. Thankfully, thedefault error pages are quite easy to customize within the vcl_error function. All youneed to do is use the synthetic keyword to define an HTML document to output forerrors, and then have Varnish deliver that document. Here’s how this is achieved in thedefault VCL:
sub vcl_error { set obj.http.Content-Type = "text/html; charset=utf-8"; set obj.http.Retry-After = "5"; synthetic {"<?xml version="1.0" encoding="utf-8"?><!DOCTYPE html PUBLIC "-//W3C//DTD XHTML 1.0 Strict//EN" "http://www.w3.org/TR/xhtml1/DTD/xhtml1-strict.dtd"><html> <head> <title>"} + obj.status + " " + obj.response + {"</title> </head> <body> <h1>Error "} + obj.status + " " + obj.response + {"</h1> <p>"} + obj.response + {"</p> <h3>Guru Meditation:</h3> <p>XID: "} + req.xid + {"</p> <hr> <p>Varnish cache server</p> </body></html>"}; return (deliver);}
Notice how the synthetic keyword is simply passed a long string containing HTMLoutput. This can be easily overridden with your own HTML, but ideally this would notinclude external CSS or images since your backend may be down when this error pageis served. Be sure to add the return (deliver) at the end of your custom vcl_errorso that the default vcl_error isn’t used.
198 | Chapter 19: Reverse Proxies and Content Delivery Networks
www.it-ebooks.info

Memory AllocationVarnish provides two stable methods for memory allocation: file-backed, or completelyin-memory. With file-backed memory allocation, Varnish depends on the OS memorycaching/paging system to keep recently used items in RAM; with in-memory allocation(“malloc”), Varnish claims a dedicated chunk of RAM and stores all cache items there.There are trade-offs to either option. Using a file-based backend means you can gen‐erally have a much larger cache, but certain cache items may be slower than others ifthey end up getting paged out to disk by the operating system. In the case of malloc,cached items are guaranteed to be in RAM, but if you are caching a lot of items, youmay need more space than you have available RAM.
You will nearly always get better performance when using malloc. For that reason, werecommend using malloc except in the cases where you need to cache more than youhave space for in RAM (and are unable to add more RAM). That said, Varnish is actuallyvery smart about how it caches to disk: it relies on the operating system’s file cache, andfrequently used cache items end up in the FS cache under optimal circumstances.
In order to figure out how much RAM is required for your website, it’s easiest to simplyallocate something like 512 MB or 1 GB, and then let Varnish run for a while. Monitorthe memory usage using top and varnishstat, specifically looking at the SMA bytes allocated output of varnishstat. If you see that the cache has filled up or are seeing manynuked objects, then you should increase the memory allocation.
Varnish will use a bit more memory (or file system space) than allo‐cated, due to internal overhead. When setting the amount of memo‐ry to use, you are only limiting the size of the cache; the overhead sizeis not configurable.
Logging and Monitoring VarnishOnce you have Varnish in place, there are a number of tools you can use to log requestsand monitor hit rates, usage, and other information:varnishncsa
Many administrators like to have a simple request log (much like Apache’s accesslog) for tracking all requests handled by Varnish. Varnish ships with the varnish‐ncsa daemon, which provides just that. Simply start the varnishncsa service(command-line options include a file to output to), and it will start logging.
varnishstatRun without any options, varnishstat will provide a continuously updated snapshotof statistics. This will give you an idea of your current cache hit rate, cache usage,
Memory Allocation | 199
www.it-ebooks.info

and other request and backend statistics. If you run varnishstat with the -1 flag, itwill output all statistics once and exit; this is useful for capturing the output to afile.
varnishhistThis will provide you with a visual representation of how long requests take to beserved. Items graphed toward the left side are served faster than those on the rightside. This can help give you an idea of your cache hit rate and help you spot anyoutliers that take an unusual amount of time.
varnishlogvarnishlog reads out of Varnish’s shared memory and outputs information abouteach request handled. You have the option of filtering out certain requests basedon things like the request URL, which is almost always how this utility is usedbecause otherwise it just gives way too much information.
All of these tools are very useful for tracking how well Varnish is working to cache yoursite’s content, and especially useful when you are making changes to your VCL file andwant to see the effects. Using varnishstat to watch cache hits and misses and then track‐ing down misses using varnishlog or watching the request/response headers in yourbrowser can be very useful when troubleshooting VCL issues.
Sample VCL for DrupalTo wrap up our discussion of Varnish, let’s take a look at a sample VCL file that can beused on a Drupal site with just a few configuration changes—you will need to adjustthe backend declaration to point to your web server, and add additional backend defi‐nitions and a director if you have more than one backend server.
There are a few things included in this VCL file that weren’t covered in this chapter:
1. In vcl_deliver, we add response headers to track whether or not the item returnedwas cached. In the case of a cache hit, we also add a header with the number ofcache hits for that particular item. This is very useful for tracking your hits andmisses, especially when first setting up Varnish in a new environment.
2. There is a list of file extensions in vcl_recv that we always want to cache, so weunset any cookies for these requests. This same list is duplicated in vcl_fetch sothat if the backend attempts to set a new cookie with the response, that Set-Cookie will be caught and dropped by Varnish ensuring that the item will be cached.The important thing to note here is that if you edit the list in vcl_recv, you shouldupdate the list in vcl_fetch to match.
3. vcl_fetch includes a check for a few different error codes (404, 301, 500), whichcorrespond to page not found, moved permanently, and internal server error. By
200 | Chapter 19: Reverse Proxies and Content Delivery Networks
www.it-ebooks.info

default, the backend will return these with a TTL of 0 so they won’t be cached byVarnish. But because these requests can actually cause a full Drupal bootstrap anddatabase queries, it’s actually beneficial to cache the responses for some amount oftime. In this example, we set the TTL to 10 minutes so that Varnish will maintainthe responses in the cache.
Our sample Drupal VCL file looks like this:
# Sample VCL based on VCL created by Four Kitchens, available at# https://fourkitchens.atlassian.net/wiki/display# /TECH/Configure+Varnish+3+for+Drupal+7/* * Copyright (c) 2013 Four Kitchens * All rights reserved. * * Redistribution and use in source and binary forms, with or without * modification, are permitted provided that the following conditions * are met: * 1. Redistributions of source code must retain the above copyright * notice, this list of conditions and the following disclaimer. * 2. Redistributions in binary form must reproduce the above copyright * notice, this list of conditions and the following disclaimer in the * documentation and/or other materials provided with the distribution. * * THIS SOFTWARE IS PROVIDED BY THE AUTHOR AND CONTRIBUTORS ``AS IS'' AND * ANY EXPRESS OR IMPLIED WARRANTIES, INCLUDING, BUT NOT LIMITED TO, THE * IMPLIED WARRANTIES OF MERCHANTABILITY AND FITNESS FOR A PARTICULAR * PURPOSE ARE DISCLAIMED. IN NO EVENT SHALL AUTHOR OR CONTRIBUTORS BE * LIABLE FOR ANY DIRECT, INDIRECT, INCIDENTAL, SPECIAL, EXEMPLARY, OR * CONSEQUENTIAL DAMAGES (INCLUDING, BUT NOT LIMITED TO, PROCUREMENT OF * SUBSTITUTE GOODS OR SERVICES; LOSS OF USE, DATA, OR PROFITS; OR * BUSINESS INTERRUPTION) HOWEVER CAUSED AND ON ANY THEORY OF LIABILITY, * WHETHER IN CONTRACT, STRICT LIABILITY, OR TORT (INCLUDING NEGLIGENCE * OR OTHERWISE) ARISING IN ANY WAY OUT OF THE USE OF THIS SOFTWARE, * EVEN IF ADVISED OF THE POSSIBILITY OF SUCH DAMAGE. */
# Default backend definition. Set this to point to your content server.backend default { .host = "127.0.0.1"; .port = "81";}
sub vcl_recv { # Use anonymous, cached pages if all backends are down. if (!req.backend.healthy) { unset req.http.Cookie; }
# Allow the backend to serve up stale content if it is responding slowly. set req.grace = 6h;
Sample VCL for Drupal | 201
www.it-ebooks.info

# Do not cache these paths. if (req.url ~ "^/status\.php$" || req.url ~ "^/update\.php$" || req.url ~ "^/admin$" || req.url ~ "^/admin/.*$" || req.url ~ "^/flag/.*$" || req.url ~ "^.*/ajax/.*$" || req.url ~ "^.*/ahah/.*$") { return (pass); }
# Always cache the following file types for all users. This list of extensions # appears twice, once here and again in vcl_fetch, so make sure you edit both # and keep them equal. if (req.url ~ "(?i)\.(pdf|txt|doc|xls|ppt|csv|png|gif|jpeg|jpg|ico|swf|css|js)(\?.*)?$") { unset req.http.Cookie; }
# Remove all cookies that Drupal doesn't need to know about. We explicitly # list the ones that Drupal does need, the SESS and NO_CACHE cookies. If after # running this code we find that either of these two cookies remains, we # will pass as the page shouldn't be cached. if (req.http.Cookie) { # Append a semicolon to the front of the cookie string. set req.http.Cookie = ";" + req.http.Cookie;
# Remove all spaces that appear after semicolons. set req.http.Cookie = regsuball(req.http.Cookie, "; +", ";");
# Match the cookies we want to keep, adding back the space we removed # previously. "\1" is first matching group in the regular expression match. set req.http.Cookie = regsuball(req.http.Cookie, ";(SESS[a-z0-9]+|SSESS[a-z0-9]+|NO_CACHE)=", "; \1=");
# Remove all other cookies, identifying them by the fact that they have # no space after the preceding semicolon. set req.http.Cookie = regsuball(req.http.Cookie, ";[^ ][^;]*", "");
# Remove all spaces and semicolons from the beginning and end of the # cookie string. set req.http.Cookie = regsuball(req.http.Cookie, "^[; ]+|[; ]+$", "");
if (req.http.Cookie == "") { # If there are no remaining cookies, remove the cookie header # so that Varnish will cache the request. unset req.http.Cookie; } else { # If there are any cookies left (a session or NO_CACHE cookie), do not # cache the page. Pass it on to the backend directly.
202 | Chapter 19: Reverse Proxies and Content Delivery Networks
www.it-ebooks.info
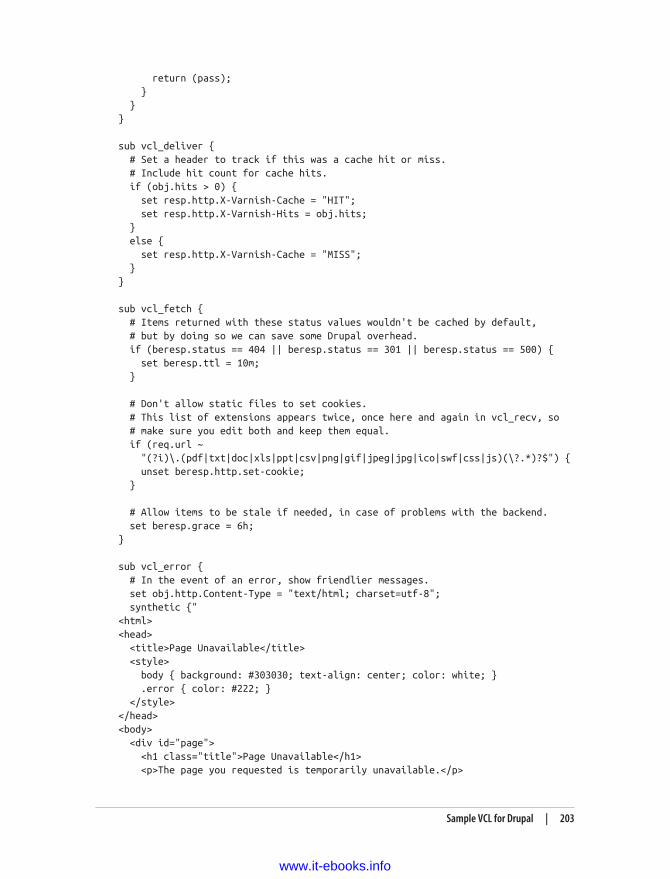
return (pass); } }}
sub vcl_deliver { # Set a header to track if this was a cache hit or miss. # Include hit count for cache hits. if (obj.hits > 0) { set resp.http.X-Varnish-Cache = "HIT"; set resp.http.X-Varnish-Hits = obj.hits; } else { set resp.http.X-Varnish-Cache = "MISS"; }}
sub vcl_fetch { # Items returned with these status values wouldn't be cached by default, # but by doing so we can save some Drupal overhead. if (beresp.status == 404 || beresp.status == 301 || beresp.status == 500) { set beresp.ttl = 10m; }
# Don't allow static files to set cookies. # This list of extensions appears twice, once here and again in vcl_recv, so # make sure you edit both and keep them equal. if (req.url ~ "(?i)\.(pdf|txt|doc|xls|ppt|csv|png|gif|jpeg|jpg|ico|swf|css|js)(\?.*)?$") { unset beresp.http.set-cookie; }
# Allow items to be stale if needed, in case of problems with the backend. set beresp.grace = 6h;}
sub vcl_error { # In the event of an error, show friendlier messages. set obj.http.Content-Type = "text/html; charset=utf-8"; synthetic {"<html><head> <title>Page Unavailable</title> <style> body { background: #303030; text-align: center; color: white; } .error { color: #222; } </style></head><body> <div id="page"> <h1 class="title">Page Unavailable</h1> <p>The page you requested is temporarily unavailable.</p>
Sample VCL for Drupal | 203
www.it-ebooks.info

<p>Please try again later.</p> <div class="error">(Error "} + obj.status + " " + obj.response + {")</div> </div></body></html>"}; return (deliver);}
Content Delivery NetworksCDNs can be used either in place of or in addition to a reverse proxy. As we mentionedin the introduction to this chapter, a CDN can dramatically increase the speed of yourwebsite, not only by caching your content, but also by dispersing that content geo‐graphically and making it available on a fast network link in order to optimize perfor‐mance for visitors from all over the world.
In the most simple configuration, a CDN can be set up to serve all static content fromyour site. However, CDNs are capable of doing much more: for example, they can handleall traffic to your website (imagine pointing your website’s domain to a CDN serverinstead of it pointing to your web server) and even potentially handle SSL requests,which is something that Varnish can’t do.
Serving Static Content Through a CDNThe easiest (and cheapest!) way to integrate a CDN with your site is to use the CDN asa static cache store. Generally this means storing images, JavaScript, and CSS on theCDN, but serving all page requests from your own servers. When a request comes infor a page on your site, the request is handled by your web server, but all static contentis referenced with a URL that points to the CDN server so clients will fetch all of thatcontent from the CDN server(s) directly. When missing or expired content is requestedon the CDN, it makes requests directly to the backend server(s) to update its cache. TheCDN Drupal module makes this configuration very easy by automatically rewritingURLs for you.
In the case of a CDN set up to pull content, rewriting the URLs is all that is neededbecause the CDN will automatically request items from your web server if it doesn’thave them in its cache. Another type of CDN is a push CDN, where you must manuallyupload content to the CDN servers before it will be served. The Drupal CDN modulealso handles such CDNs (with additional configuration), though pull-based CDNs aremuch more common.
204 | Chapter 19: Reverse Proxies and Content Delivery Networks
www.it-ebooks.info

When to Use a CDNCDNs can provide an amazing performance boost to your site with very little config‐uration overhead. Cached items are served faster to visitors, and load is reduced on yourservers as more requests are dealt with by the CDN. In general, if you can afford thecost of a CDN, then there is no reason not to use one. While the cost for larger sites andthose needing special features can grow quite large, there are many affordable CDNproviders for small- to medium-sized sites.
Choosing Between a CDN and a Reverse ProxyThere is actually no reason that this needs to be an either/or decision. If you have areverse proxy in place, you will still see benefits from adding a CDN. The caches canlayer well, and any special request handling that needs to happen can easily be configuredwith some custom headers passed on by the CDN and handled in the reverse proxy (orvice versa).
Content Delivery Networks | 205
www.it-ebooks.info

CHAPTER 20
Load Testing
We mentioned in Chapter 1 that performance improvements are not a one-time task,but are something that should be revisited in iterations throughout the lifetime of awebsite. Load testing is an important aspect of any project: it provides insight into howyour site and infrastructure will react under load. While critical to the launch processof any project, load testing is also useful to integrate into your standard testing proce‐dure. It can help you locate bottlenecks and generic performance regressions introducedin the evolution of a site after launch (due to code and infrastructure changes).
There are many different methodologies and applications for performing load tests, butgenerally this testing involves accessing various pages on the site with enough traffic tostart causing degradation. From there, work can be done to isolate bottlenecks in orderto improve performance. If you perform periodic load tests, you are much more likelyto catch something while it’s still a minor performance issue, not after it becomes a majorproblem.
Different Types of Load TestsThere are a number of different load testing configurations (sometimes referred to astest plans) that can be used individually or in conjunction to provide insight into siteperformance. Generally, we end up running three different types of tests:Baseline tests
These tests are run with a relatively low amount of traffic in order to obtain somebaseline information about site performance. These are useful for tracking generaluser-facing performance (time to first byte, time for a full page load) and for com‐paring against a higher-traffic load test result, as well as for tracking regressions inthe standard case.
207
www.it-ebooks.info

High traffic testsTests with relatively higher traffic are run in order to see when site performancebegins to degrade as traffic increases. These tests can give you an idea of how manyrequests a site can handle before performance deteriorates to an unacceptable de‐gree. At the same time, these types of tests are very good for uncovering bottlenecksin a site; many times issues with underlying services or service integration requirea higher load in order to trigger. Generally speaking, this type of load test is the onethat is run most frequently.
Targeted testsMost tests are designed to cover all different request types and page types for a site.Targeted tests take a different approach; they are designed to test one or severalspecific features or user paths. For example, if you are working to improve theperformance of a certain page type on your site, you could run a load test that onlyfocuses on that particular area.
Depending on the load testing tool in use, these tests could all be based on the same testplan by tweaking the amount of traffic generated and/or by enabling or disabling certainparts of the test plan in order to focus testing on only a subset of the site.
Creating a Valid TestOne of the most difficult aspects of load testing is creating a test that represents real sitetraffic. If the test diverges greatly from real traffic patterns, the performance results andbottlenecks found during the test may not help you improve real-world performancein a meaningful way. By starting with a test that as closely as possible matches real-worldtraffic (or expected traffic, if you are looking at a new/growing site), you’ll more reliablyuncover performance issues on your site. Fine-tuning a load test can happen over timein order to keep it in line with shifting traffic patterns and new features added to a site.Things to take into consideration when creating and reviewing a load test plan include:User browsing patterns
What pages are visited most often? How long do users spend on different pagetypes? What are the most common entry points into the site?
Logged-in trafficWhat percentage of traffic is logged in versus anonymous users? Do logged-in usersvisit different pages than anonymous users?
Amount of contentWhen creating a new site, do you have enough content on the site to perform a validtest? If not, then consider creating content programmatically before running a test.The Devel module is great for this purpose (among other things).
208 | Chapter 20: Load Testing
www.it-ebooks.info
When to TestThere are many ways to approach load testing for a given website and infrastructure.How frequently tests are run is entirely up to you. Some sites may run a load test man‐ually once per month, while others may run tests multiple times per day. Whatever youdecide, it’s important to run a baseline test occasionally to understand what “normal”performance looks like. Only once you have baseline numbers for user-facing andserver-side performance during a load test can you define what is “good” or “bad” in aparticular test result.
Continuous Integration (CI)Testing can be tied into your development process using a tool such as Jenkins (describedin more depth in Chapter 9). Tests could be set up to run each time a new release ispushed to the staging environment, or if you have sufficient resources, tests could evenbe run each time new code is pushed to the site’s code repository.
Periodic TestingFor those who don’t want to deal with the overhead of testing for each new code push,an alternative approach is to test on some predetermined schedule. This could be daily,weekly, or even monthly. The more frequently tests are run, the easier it will be to directlylink a change in performance to a specific change on the site. If you go too long betweentests, it can become much harder to pinpoint the cause of a performance problem.
Manual Targeted TestingIn addition to the previously described approaches, it can be useful to run manual testsoccasionally, especially if you are trying to test a specific aspect of the site with a targetedtest plan. For example, if you are planning a media event that will drive a lot of newusers to your site, it might be beneficial to run targeted tests against the main site entrypoints and features that may receive higher than normal traffic, such as user registration.
Interpreting Test ResultsOne problem that many people encounter with load testing is that they are bombardedwith too much data in the results, and it’s not always clear what information is important.In most situations, you will at least want to examine:Time to first byte
Also referred to as latency in some load testing applications. This is quite importantas it usually represents the actual Drupal execution time (or caching time), whereasother data points are less focused.
When to Test | 209
www.it-ebooks.info

Full page load timeAlso referred to as response time in some applications. The difference between timeto first byte and this is mainly due to the size of the page, the network path, andother issues.
Requests per secondThe number of page requests per second is an important statistic to look at whenplanning for traffic loads and infrastructure scaling.
Error responsesThese are another very important data point, and also the most likely to be ignored.A failing site will often load test very well; however, those results are obviously notproviding very useful information and misrepresent the actual site performance.Paying attention to the error responses can give you an idea of where problems maybe occurring. For example, Apache may have timeouts waiting on backend requestssuch as connecting to MySQL when the DB server is overloaded, and in those casesmay return a 503 error.
Depending on what the goals are for your load test, you may also be looking at additionalinformation such as bytes transferred or throughput for a particular page.
No matter what data you choose to track, it becomes even more valuable if you are ableto track it over time. By comparing multiple test results, you’ll get a much better ideaof your site’s performance as well as gaining the ability to see trends in the performancedata. It can be very useful to observe things like page load time to see how it varies overtime, or how it might increase or decrease in response to a specific code or infrastructurechange.
Another important consideration is to understand how requests from load testing soft‐ware differ from requests made by a user using a standard web browser. For example,JMeter, which we cover later in this chapter, does not execute JavaScript, and by defaultit will not download linked assets on a page (more on this in “Example Load Test UsingJMeter” on page 212). In general, those differences are acceptable as long as they areunderstood. However, it can be worthwhile to perform some sort of additional testingwith a tool that more accurately represents a browser. These tools are not always capableof high-traffic load tests, but they can at least be used to establish a baseline.
Server Monitoring During Load TestsWhen you run a load test, you’ll be presented with a list of results that focus entirely onclient-side performance, since that is all that the load testing application can see. It’simportant to monitor servers and services during load test runs in order to get the mostfrom your tests and to be able to track down infrastructure bottlenecks. Of course, thissort of monitoring could be left to the automated systems you set up while readingChapter 8, but it can also be useful to manually watch the servers during test runs to see
210 | Chapter 20: Load Testing
www.it-ebooks.info
how things are affected and adjust what you are monitoring. Different sites will sufferfrom completely different infrastructure bottlenecks, so it’s best to keep an eye on asmuch data as possible, but for starters we recommend:Web servers
Watch overall system load, memory usage, swap usage, network traffic, and disk I/O. Also keep track of things like the Apache process count to see if you are ap‐proaching (or hitting!) the MaxClients setting. As always, don’t forget to watch logsfor Apache to see if any errors are being reported.
Reverse proxies and other caches, such as memcachedWatch load, network traffic, and caching statistics. Is your cache hit rate higher orlower than normal? Try to understand why that might be (e.g., a test plan that onlyhits a very small subset of the site’s pages would likely cause higher cache hit rates).Watch memory usage and evictions to be sure that the cache isn’t becoming overlyfull and forced to delete items before they’ve expired.
Database serversWatch the server load and connection count, and watch the MySQL error log forany unusual errors. Ensure that the MySQL slow query log is enabled, and watch itfor potential query improvements that can be made (see e.g. pt-query-digest in thePercona Toolkit). You can also watch MySQL statistics directly or with tools suchas mysqlreport to monitor things like InnoDB buffer usage, lock wait times, andquery cache usage. Watch the MySQL process list to see if there are certain queriesrunning frequently or causing waits for other queries.
Where to TestThere are a number of options to determine which environment to run load tests against:development, staging, production, or potentially some environment dedicated to loadtesting. In an ideal world, tests should always be run against the production environmentto obtain the most valid data possible. However, site users (not to mention investors)tend to dislike the website becoming unusably slow due to a load test. While some peoplemay be able to run tests against production, even if it means scheduling the test for 3a.m. or some other low-traffic time, others won’t have that option. Our advice is to takeinto account what the goals and requirements are for your load testing and, based onthat, run the tests against an appropriate environment.
One other consideration when planning which environment to run aload test against is whether or not the test will be creating and/ordeleting data on the site. In general, testing things like user com‐ments against a production site can be very difficult to do in a way thatdoesn’t interfere with your users.
Where to Test | 211
www.it-ebooks.info
As we mentioned in Chapter 7, the more closely your staging environment mimicsproduction, the more useful it will be. In the case of load testing, staging can be a veryfitting place to run load tests. While your staging servers may not be as numerous andhigh-powered as those in the production environment, you can still easily track downmany performance issues and infrastructure bottlenecks by running tests against thestaging environment if it is similar to your production environment.
Another option is to run tests against a development environment. This is especiallyvalid for tests integrated with CI. While the performance numbers here will, expectedly,differ from in production, it’s still a great way to test for performance changes whencode changes occur.
When running tests against an environment that is not your produc‐tion environment, be aware that any user-facing performance num‐bers should be taken with a grain of salt. That is, performance willlikely be slower than in your production environment, but the num‐bers can still be useful when comparing test results over time.
In cases where test or staging environments are under heavy use, it may not be possibleto run load tests against those environments. For those situations, usually the only al‐ternative is to have a dedicated “load testing” environment used specifically for loadtests—or potentially also for other automated tests, such as acceptance testing). As al‐ways, the more closely this environment can mimic production, the more valid yourtest results will be. For those infrastructures that run mostly in the cloud, this environ‐ment might be spun up on demand when tests need to be run, but otherwise left offline.
Some sites might insist on running load tests against production in order to have “real”numbers. While this can make sense in certain situations, it’s rare that a dedicated stagingenvironment won’t be sufficient to get the data required. Generally, our recommenda‐tion would be to only run low-traffic tests against production in order to obtain user-facing performance information. If you are trying to put the site under a heavy load inorder to catch performance bottlenecks, then doing so in a staging environment shouldyield useful results.
Example Load Test Using JMeterWhile there are many load testing applications and services available, JMeter is one opensource option that we have used extensively. JMeter tests are fairly flexible, and the abilityto run tests either from a GUI or directly from command line makes it convenient forrunning tests remotely. As an example, we’ll configure a simple load test plan withJMeter that logs into a Drupal site, visits a few pages, and then logs out. Once this iscomplete, you can configure how many concurrent threads you would like to run and
212 | Chapter 20: Load Testing
www.it-ebooks.info

for what duration, and you should have a good understanding of how it might be adaptedto run against your own site.
JMeter has some downsides: it doesn’t execute JavaScript, nor does itrender the HTML for pages it retrieves. You can still get useful per‐formance information from JMeter tests, but be aware of those limi‐tations and plan for another way to test JavaScript and rendering timesif needed. There are multiple options for this type of testing, includ‐ing Selenium and PhantomJS.
First, we need to understand the structure of the site we’ll be testing. Our example is astandard Drupal 7 site with some “static” node pages, a forum section, and a front pagethat dynamically displays custom content to logged-in users, or a list of featured articlesfor anonymous users. For our load test, we’ll want to test each of these different pagetypes—plus, it’s always important to focus attention on the front page, both for anony‐mous and logged-in users. You don’t want people leaving your site because the frontpage took too long to load!
Global Test SettingsWhen you first launch JMeter, you will be presented with an empty test plan. We’ll startby naming the test plan something original, like Drupal, by editing the Name field. Next,we’ll start adding some global settings that we’ll refer to in other parts of our test. Settingsare stored in objects that JMeter refers to as Config Elements, and in this case, we’regoing to add one of the type User Defined Variables. To add this to the test, right-clickon the test plan icon in the left toolbar and select Add→Config Element→User DefinedVariables. The new element should appear as a child under the test plan.
Select the new object, and change the name to something useful like Global Settings.Next, we’re going to add the variables listed in Table 20-1.
Table 20-1. JMeter global settingsName Value
site.hostname d7.example.com
site.port 80
testlength 300
drupal.user testuser
drupal.pass verysecurepassword
Of course, you’ll want to set the hostname to your site’s real hostname, and set the useraccount and password to some existing (nonadmin) account. We will use that accountfor the test threads to log into the site. The testlength variable will be used to control
Example Load Test Using JMeter | 213
www.it-ebooks.info

how long the test runs (in seconds). Once complete, the settings should look somethinglike Figure 20-1.
We are using only a single account in this test in order to keep theexample as simple as possible. You should consider using many (doz‐ens, or hundreds, depending on your site’s user base) user accounts tomore accurately reflect real-world traffic.
Figure 20-1. JMeter global settings
Next, we’ll create an HTTP Request Defaults Config Element in order to store defaultvalues for all of the HTTP requests we’ll make later in the test. This saves us having toenter things like the server hostname in every single request, since if it’s not specified,it will fall back to these default values. Right-click on the test plan and go to Add→ConfigElement→HTTP Request Defaults. In the HTTP Request Defaults configuration, setServer Name or IP to our global variable, ${site.hostname}, set Port Number to the vari‐able ${site.port}, and then set Implementation to HttpClient4, Protocol to http, and
214 | Chapter 20: Load Testing
www.it-ebooks.info

Content encoding to utf-8. Once complete, your settings should look like those inFigure 20-2.
Figure 20-2. HTTP Request Defaults
As mentioned previously, JMeter will not download linked assets bydefault. This includes CSS, images, applets, and iframes. This differsgreatly from what happens when an actual user accesses your site, sincethe user’s browser will download all of those assets. The setting forcontrolling this behavior in JMeter is Retrieve All Embedded Resour‐ces from HTML Files, located in the Optional Tasks section of HTTPRequest Defaults or any individual HTTP Request. Many sites leavethis setting disabled since most slowdowns and infrastructure bottle‐necks are caused by serving the page itself, not the linked assets. Thisis especially true when you have incorporated a reverse proxy or a CDNto cache static assets. That said, if you choose to leave this optiondisabled for standard test runs, we advise running periodic tests withit enabled to ensure that asset delivery is happening as fast as expected.
Example Load Test Using JMeter | 215
www.it-ebooks.info
Thread GroupsJMeter has the concept of thread groups, which is a way to group together a set of threadsthat will perform certain requests (anything defined as a child of the thread group)against the site. This can be useful for splitting up the test into different sections—e.g.,tests for things like authenticated users versus anonymous users. Because thread groupseach have configurable settings for timing and number of threads, it’s also possible touse them to put different traffic loads on different parts of the site. In our case, we’regoing to define a single thread group for authenticated traffic, though it will also includean anonymous visit to the site’s front page. For a more complete test plan, it would beuseful to also add at least one more thread group to handle anonymous traffic, but weleave that as an exercise for the reader.
JMeter threads are not the same as real users on your site. While asingle thread may seem like it closely represents a user, remember thatJMeter is not rendering pages or reading content once it’s displayed —it’s just loading pages as fast as possible and then going on to load thenext page in the test plan. This can give you an idea of how manyrequests per second your site can handle, but it does not directlytranslate into the number of users your site can handle.
To add a thread group, right-click on the test plan icon in the lefthand toolbar and goto Add→Threads (Users)→Thread Group. The new thread group should appear belowyour global settings in the left toolbar, as shown in Figure 20-3. Name it AuthenticatedUsers so that you know what type of testing it will be handling. Now we’ll want toconfigure the number of threads—let’s go with 10 for now, as that’s a relatively smallamount of traffic but should still give us a good baseline on performance. The Ramp-Up Period is how long JMeter takes to create all of the threads. Let’s set that to 20 seconds,meaning JMeter will create a new thread every two seconds until it hits the 10 totalthreads we’ve configured.
There are a couple of options for how to control the test duration. First, you could seta loop count on the thread group. This controls how many times each thread loops overthe test plan within the thread group. In our case, we’ll set this to ‘Forever', and insteadwe’ll set a limit on the time duration of the test. To do this, click the ‘Forever’ checkboxnext to ‘Loop Count', and then click the ‘Scheduler’ checkbox to enable the scheduler.It will fill in ‘Start Time’ and ‘End Time’ with the current date and time; that can beignored. In the ‘Duration’ setting, add the value ${testlength} which will use the tes‐tlength variable that we defined in our global settings. Once complete, the test plan orderand thread group settings should look like Figure 20-3.
216 | Chapter 20: Load Testing
www.it-ebooks.info
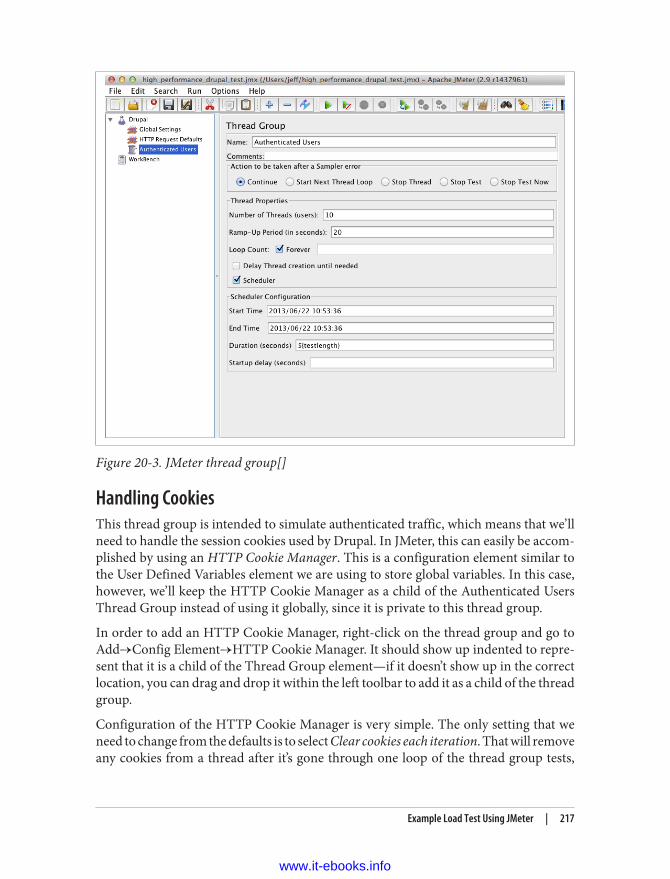
Figure 20-3. JMeter thread group[]
Handling CookiesThis thread group is intended to simulate authenticated traffic, which means that we’llneed to handle the session cookies used by Drupal. In JMeter, this can easily be accom‐plished by using an HTTP Cookie Manager. This is a configuration element similar tothe User Defined Variables element we are using to store global variables. In this case,however, we’ll keep the HTTP Cookie Manager as a child of the Authenticated UsersThread Group instead of using it globally, since it is private to this thread group.
In order to add an HTTP Cookie Manager, right-click on the thread group and go toAdd→Config Element→HTTP Cookie Manager. It should show up indented to repre‐sent that it is a child of the Thread Group element—if it doesn’t show up in the correctlocation, you can drag and drop it within the left toolbar to add it as a child of the threadgroup.
Configuration of the HTTP Cookie Manager is very simple. The only setting that weneed to change from the defaults is to select Clear cookies each iteration. That will removeany cookies from a thread after it’s gone through one loop of the thread group tests,
Example Load Test Using JMeter | 217
www.it-ebooks.info

meaning that each thread starts fresh (similar to a new user) each time it loops throughthe thread group.
Login ControllerAlthough it’s not too complicated, performing the Drupal login is probably the mostdifficult part of this particular load test plan. The login itself is quite simple: we just needto POST the username and password to the /user/login form page. What makes this moredifficult is that the form also contains a hidden form_build_id input containing a ran‐dom hash, which we’ll need to POST with the form in order for Drupal to accept thesubmission. To accomplish this, we’ll need to first load the form (located at /user), andthen use a Regular Expression Extractor to pull the form_build_id string out of the pagesource. This same technique will work for any Drupal form. Do you feel like a spammeryet?
Let’s start by adding a Simple Controller under the thread group. We’ll use this to grouptogether all of the login logic to keep it self-contained. It doesn’t matter to JMeter if wedo this or not, but it makes the test plan more readable, and it also makes it easy toduplicate the form handling logic should we ever need it elsewhere on the site. Right-click on the thread group and go to Add→Logic Controller→Simple Controller; itshould appear underneath the HTTP Cookie Manager, also as a child of the threadgroup. The Simple Controller has no options aside from its name; we’ll name this oneLogin.
Now we can add the request elements needed in order to fetch and submit the loginform. The process consists of requesting the /user page, pulling out the form_build_idstring from the response data, and then submitting the form with a POST request to /user/login. We’ll start by creating an HTTP Request element to request the /user page.Right-click on the new Login controller we just created and go to Add→Sam‐pler→HTTP Request. Change the name to User Form. Since we have a global HTTPRequest Defaults object set up, there’s no need to fill in most of the request fields. Theonly thing we need to set is the Path, which needs to be set to /user.
In order to get the form_build_id, we’ll need to create a Regular Expression Extractor asa child of the User Form request. Right-click on the User Form request and go toAdd→Post Processors→Regular Expression Extractor. It should show up as a child ofthe User Form request, but drag it there if not. Name the extractor Drupal form buildid. We’ll keep the defaults for the other settings, and then we just need to create a regularexpression to extract the form_build_id string. The string appears in the page sourcelike this:
<input type="hidden" name="form_build_id" value="form-P6bhzmdBofDC_AZ-yjHn6ZB-R35b5ljF1hmTEwXbDF0" />
218 | Chapter 20: Load Testing
www.it-ebooks.info

Everything after form- in the value string is a random hash specific to that particularform, but we’ll want to grab the whole string including the “form-” at the beginning. Todo this, we can use the following regular expression:
name="form_build_id" value="(.*?)"
For the Reference Name, enter form_build_id — this is the variable name we’ll be ableto use later to refer to this value. Next, for Regular Expression, enter the regular ex‐pression just shown. For Template, enter $1$ — this tells JMeter to assign whatever isin the first reference (in between the parentheses in the regular expression) to the vari‐able we’re creating. Finally, for Match Number, enter 1 — this tells JMeter to apply thisregular expression to the first match it comes across. Note that if you have multipleforms showing up on the login form (such as a search box in the header), you may needto adjust this.
Now we’ll create a second request for submitting the form. Right-click on the LoginController and go to Add→Sampler→HTTP Request. If needed, drag it so that it appearsunderneath the User Form request, but still as a child to the Login Controller. Namethis request Submit User Form, change the Method setting to POST since we’re submit‐ting a form, and then set the Path to /user/login. Next, we’ll need to add a list of param‐eters to send with the request. These can be added by clicking the Add button belowthe parameters list. Add the parameters shown in Table 20-2.
Table 20-2. User login parametersName Value Encode Include Equals
name ${drupal.user} No Yes
pass ${drupal.pass} No Yes
form_build_id ${form_build_id} No Yes
form_id user_login No Yes
op Log in Yes Yes
For name and pass, we are referring to the variables we set in the global settings earlier.form_build_id uses the results from our regular expression extractor to submit theappropriate form_build_id. form_id is another hidden field that we need to submit, andop is the name of the submit button for the form. The top portion of the Submit UserForm request should look like Figure 20-4—nothing needs to be changed below theparameters list.
Example Load Test Using JMeter | 219
www.it-ebooks.info

Figure 20-4. Submit user form
Browse ControllerNow that we have the ability to log into the site, we’ll create a list of a few pages that wewant to test. Start by creating another Simple Controller as a child of the AuthenticatedUsers thread group, and name it Browse — this will be used as a container for our au‐thenticated user page browsing requests. Be sure that this controller is below the LoginController, but as a direct child of Authenticated Users, not as a child of the LoginController. Next, we’ll create individual HTTP Request elements for each page that wewant to test.
Another approach to this is to create a CSV file listing URLs to visit.This can be easier to maintain for a large number of paths. We won’tdescribe this approach in detail, but it can be done by using a CSVData Set Config element to read the CSV file into a list of variables.
For each page we’re going to test, we’ll create an HTTP Sampler by right-clicking on theBrowse controller and going to Add→Sampler→HTTP Request. Since we’re using theHTTP request defaults, the only settings that need to be changed for each request arethe name and path. In the case of our example site, we’ll want to test the front page, theforum index, a forum post, and a couple of article pages. We’ll do this by adding requestelements for the name/path combinations listed in Table 20-3.
220 | Chapter 20: Load Testing
www.it-ebooks.info

Table 20-3. Page requestsName Path
Front Page /
Article 1 /somearticle
Article 2 /anotherarticle
Forum Index /forum-index
Forum Post 1 /forum/post-1
These are actual paths on our test site, but you’ll obviously want to adjust these to fityour site, being sure to cover all the various page types you have in place.
We’re now testing a full set of pages as an authenticated user. However, it would also beuseful to test at least the front page as a nonauthenticated (anonymous) user, since manypeople will visit the front page directly before logging in. To simulate this, create aduplicate of the Front Page request element, rename it Front Page (Anon), and drag itjust above the Login Controller. This way, each thread will request the front page beforelogging in and proceeding to visit the other pages. Once we’ve done this, our test planlooks like Figure 20-5.
Figure 20-5. Test plan
Output ConfigurationNow that our test plan is complete with a set of page requests, the only piece missing isto save the request results. This is done by creating a Simple Data Writer element withinthe test plan. The data writer could be created at the global level in order to save allrequests from a test, or it could be placed within a thread group in order to save resultsonly from that set of requests. This is useful if you have multiple thread groups (e.g.,
Example Load Test Using JMeter | 221
www.it-ebooks.info

Authenticated Users and Anonymous Users) and want to write out to different data filesfor each of them. You can have data writers at as many levels of the test as you like. Inour case, we’ll add one global data writer to catch all requests. To do this, right-click onthe test plan and go to Add→Listener→Simple Data Writer. Name it Full Test Output,and enter a filename for it to save to, such as /path/to/jmeter-test/full-output.jtl.
Data writers have many options regarding which data to save in the file. Note that if youare saving the full responses, the file can get large rather quickly if you’re doing a largenumber of requests. In general, settings such as those shown in Figure 20-6 will besufficient; however, if you are debugging issues with requests or responses, it can beuseful to save the request and/or response headers and the full response data. We’lldescribe how to view the output data momentarily, in the section “Reading Test Results.”
Figure 20-6. Data writer configuration
Running a TestTests can be run either by opening the test in the JMeter GUI and clicking on the Playbutton in the toolbar, or from the command line. If you’re running the test from a remoteserver, simply run the following:
$ /path/to/jmeter/bin/jmeter -n -t /path/to/test/loadtest.jmx
In this command, -n tells JMeter to run in non-GUI mode, and -t tells it the path tothe test plan file you want to execute.
Reading Test ResultsNow for the fun part, reading the test results to see how our site performed! There area number of reports available for reading results, though for an overall picture, the bestchoice is to use the Summary Report. Add one of these to JMeter by right-clicking onWorkbench and then going to Add→Listener→Summary Report. Once that is created,
222 | Chapter 20: Load Testing
www.it-ebooks.info
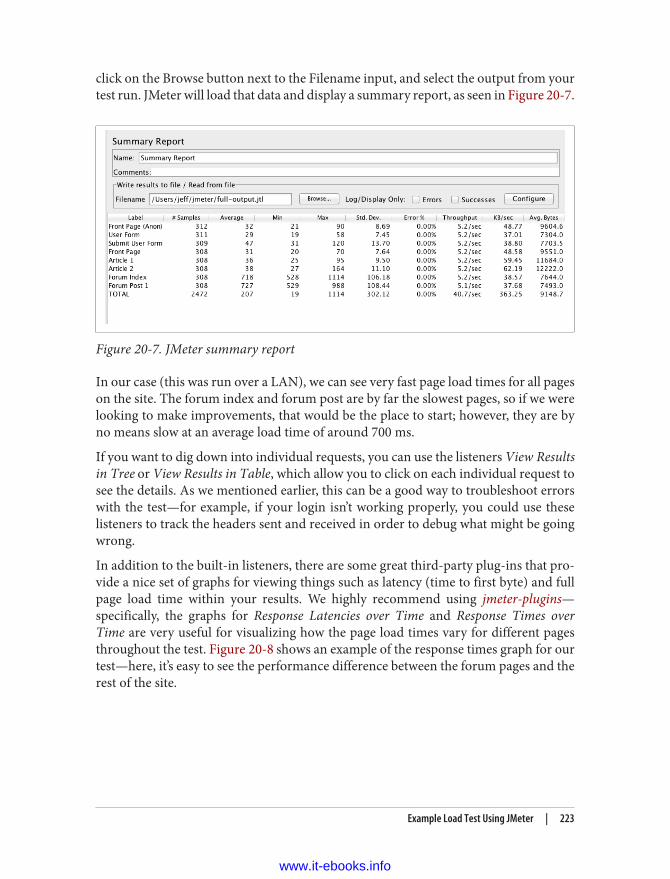
click on the Browse button next to the Filename input, and select the output from yourtest run. JMeter will load that data and display a summary report, as seen in Figure 20-7.
Figure 20-7. JMeter summary report
In our case (this was run over a LAN), we can see very fast page load times for all pageson the site. The forum index and forum post are by far the slowest pages, so if we werelooking to make improvements, that would be the place to start; however, they are byno means slow at an average load time of around 700 ms.
If you want to dig down into individual requests, you can use the listeners View Resultsin Tree or View Results in Table, which allow you to click on each individual request tosee the details. As we mentioned earlier, this can be a good way to troubleshoot errorswith the test—for example, if your login isn’t working properly, you could use theselisteners to track the headers sent and received in order to debug what might be goingwrong.
In addition to the built-in listeners, there are some great third-party plug-ins that pro‐vide a nice set of graphs for viewing things such as latency (time to first byte) and fullpage load time within your results. We highly recommend using jmeter-plugins—specifically, the graphs for Response Latencies over Time and Response Times overTime are very useful for visualizing how the page load times vary for different pagesthroughout the test. Figure 20-8 shows an example of the response times graph for ourtest—here, it’s easy to see the performance difference between the forum pages and therest of the site.
Example Load Test Using JMeter | 223
www.it-ebooks.info
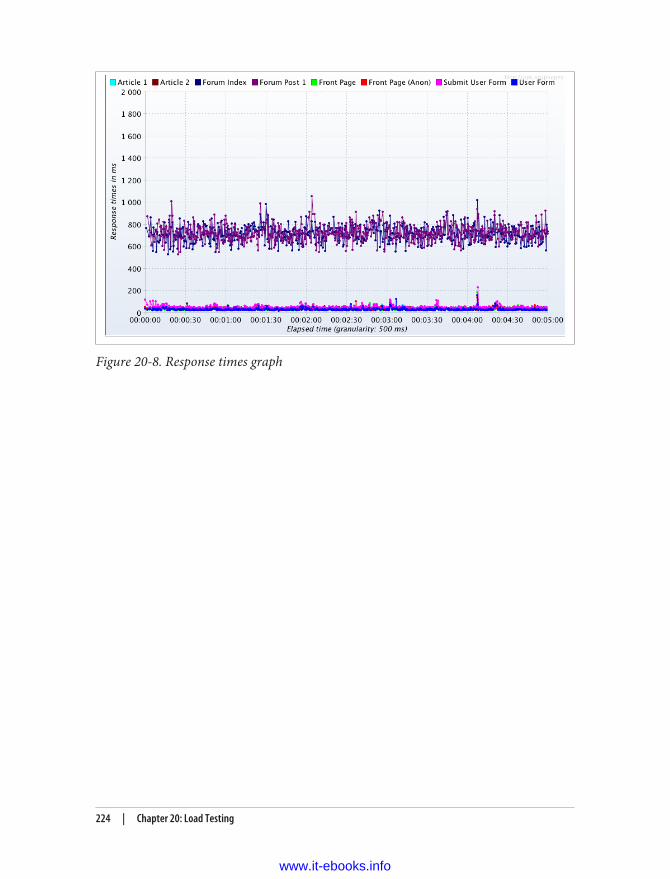
Figure 20-8. Response times graph
224 | Chapter 20: Load Testing
www.it-ebooks.info

CHAPTER 21
Where to Next?
We hope that this book has given you an actionable approach to improving the perfor‐mance of your Drupal website. Website performance is a very broad topic, and whilewe hope we have given enough information about common performance issues, it’s justnot possible to cover everything in detail. Here, we present a number of resources foradditional reading on many of the topics we’ve covered in the book, as well as generalresources for Drupal performance and scalability.
Official Book WebsiteThis book has an official website that links to code snippets and configuration filesdiscussed in the book.
High Performance Drupal GroupThere is a Drupal Group focused on high-performance Drupal issues. This is a goodplace to see what other people are doing and to ask performance- and scalability-relatedquestions.
Drupal WatchdogDrupal Watchdog is the only print magazine specific to Drupal. The magazine includesarticles from many well-known Drupal contributors focusing on many different topics,including Drupal performance. Articles are made freely available online sometime aftereach issue is released in print.
225
www.it-ebooks.info

Revision Control with GitThe Pro Git book is available here. The Git Flow extensions that are built around thebranching model mentioned in Chapter 9 are available at here. A general comparisonof Git and Subversion can be found here.
VarnishThe Varnish Reference Manual is the authoritative source for configuring Varnish andwriting VCL. There are a number of Varnish Modules and Extensions (VMODs) locatedat https://www.varnish-cache.org/vmods that can help you easily extend the function‐ality of your VCL files.
Configuration ManagementOne advantage of using modularized configuration management systems is that it iseasy to share and reuse code. The Chef community is perhaps one of the best at this,with its vast collection of cookbooks. Puppet also has a growing list of communitymodules.
VagrantThere are a number of prebuilt Vagrant virtual machine “boxes” available online. Va‐grantbox.es provides links to many of them, including “official” boxes provided byPuppetLabs, Opscode (Chef), and Ubuntu.
JenkinsJenkins has a number of plug-ins that make it even more useful. Some of the ones weuse most frequently include:
• The GitHub plug-in, which lets you tie into GitHub repos and kick off jobs basedon activity there
• The Build Keeper plug-in, which allows you to configure rules to keep or discardbuilds
• The Performance plug-in, which ties into JMeter or JUnit test runs in order todisplay test data and can trigger a build error condition based on errors during thetest run
226 | Chapter 21: Where to Next?
www.it-ebooks.info

MySQL PerformanceThe MySQL Performance Blog is an excellent source for tips, tools, and some veryinteresting benchmarks and test cases.
InnoDB Index StructuresTo extend on the index structure overview that was given in Chapter 15, check outJeremy Cole’s blog post “B+Tree index structures in InnoDB”.
MySQL Performance | 227
www.it-ebooks.info
We’d like to hear your suggestions for improving our indexes. Send email to [email protected].
Index
AA link, 65Acquia Cloud, 122adding caching, 34adding files to a page, 11administrative directories, 181advantages of queues, 43aggregation logic, 25AJAX
callbacks, 50requests, 66
Amazon EC2, 138analyzing site performance, 6anonymous users, 23Ansible, Vagrant and, 106Apache, 82, 82, 171–183
administrative directories, 181attaching strace to, 74cache headers, 178custom configuration files, storing, 103KeepAlive, 178logging, 179MPM settings, 175Nginx vs., 182PHP module for, 174Prefork module, 176server signatures, 181Varnish, running with, 189virtual hosts on development server, 106
VirtualHost and, 181Apache Software Foundation, 186Apache Traffic Server, 186apachesolr module (Solr), 166, 167APC, 171–173APC user cache, 154apc.stat runtime setting (APC), 172apc._num_files_hint runtime setting (APC), 172application performance, 59–77
Devel module, 60–65strace, 74–77Xdebug, 65XHProf, 66–74
Aria storage engine, 132Assetic library, 14authenticated traffic, 22authkeys configuration file (Heartbeat), 127automation required for cloud infrastructure,
122
Bbackend networks, 88backups, as hosting consideration, 92base tables (MySQL), 148base64 encoding, 13baseline load tests, 207benefit of change, 2BitBucket, 102
229
www.it-ebooks.info

bottlenecks, 10identifying, 10
branching model, of revision control systems,102
bricks (GlusterFS), 114browse controller (JMeter), 220BSD, Heartbeat and, 127BSON format, 162Build Keeper plug-in (Jenkins), 226bytes, time to, 3, 57
Ccache
bins, 37chains, 37Drupal API, 26fetching items from, 5granularity, 51headers, 178resource requirements for, 84stampedes, 44storage backends for, 154storing items in, 5tags, 38
Cache Actions, 25cache chain backend, 37Cache-Control cache header, 179cacheable headers, 15CacheArray, 39cachegrind files, 65caches, 82CacheTags, 25caching, 34–43
adding, 34Drupal and, 21–25expired content, serving, 197for authenticated rulers, 196inconsistent, 159persistent, 37–43render, 40–43static, 34–37wrappers and, 36
Cacti, 95, 98, 145plug-ins for, 99
CFEngine, 103check_command option (Icinga), 98Chef, 103, 226
Vagrant and, 106Chrome Developer Tools, 10, 13, 58
cloud deployments, 121–124advantages of, 121infrastructure overhead of, 122issues, 123prepackaged, 122
cloud washing, 121clouds, managed, 122clusters, file syncing across, 113–120
GlusterFS, 114NFS server clusters, 116–120rsync and, 113single NFS server, 115storage area networks (SANs), 120
code revision control, utility servers and, 90Cole, Jeremy, 227collecting information, 1
approaches for, 2comma-separated values storage engines for
MySQL, 131compression, 15Config Elements (JMeter), 213configuration API, 49configuration management systems, 103
scripts, in revision control systems, 102utility servers and, 90Vagrant and, 106with Puppet/Git, 103–106workflow and, 107–110
Content Construction Kit (CCK) API, 161content delivery networks, 82
Nginx and, 183push vs. pull, 204
content delivery networks (CDNs), 204–205frontend performance and, 16goals of, 16Google, 16reverse proxies vs., 205serving static content through, 204
content download, 57Contextual modules, 52continuous integration (CI), 209
utility servers and, 90cookies
handling with thread groups, 217VCL and, 195
costs, 3as hosting consideration, 92of infrastructure, 80
230 | Index
www.it-ebooks.info

CPU, 69performance issues and, 29scalability issues and, 29usage, monitoring, 97
Cron, 27Cronolog, 180CRUD, 162CSS
aggregation, 9caching, 196Drupal and, 25
CSS Embedded Images, 13CSV storage engines for MySQL, 131custom JavaScript, 10customizing content, 23
query log display, 61
DData Definition Language (DDL), 163database logging, 26, 99
monitoring, 211databases, 82
queries, time for, 5resource requirements for, 83
dblog module, 26, 52DDoS attacks, 55Debian, log destinations on, 180debugging, 53
in Views, 149deleteMultiple() API, 38deployment workflow, 107–110
DevOps, 107–110with Git, 108with Jenkins CI, 110
Devel module, 60–65memory usage and, 60page timing, 60query log, 61–65
develop branch (Git), 109development environments, 87
cost cutting for, 87providing, 88virtual hosts on, 106
development settings, 53DevOps, 101–111
configuration management systems, 103deployment workflow, 107–110Git and, 103–106Jenkins CI and, 110
Puppet and, 103–106revision control systems, 102virtual machines, development on, 106
directors (VCL), 189–191types of, 190
disk usage, monitoring, 97display redirection pages, 61display time, frontend, 3display_errors setting (php.ini), 173DISTINCT (MySQL), 150DNS lookup, 56DNS vs. IP failover, 126document complete events, 56DOM selection, 10, 50DRBD, setting up, 117–118Driessen, Vincent, 108Drupal, 21–28
cache API for, 26Cron and, 27CSS and, 25ESI module, 197JavaScript aggregation and, 25logging and, 26MySQL and, 131optimizing, 29–45page caching with, 21–25read-only queries and, 137reverse proxies with, 185Solr, integrating with, 166swappable storage for, 26Views and, 27
Drupal API website, 37Drupal Watchdog (website), 225drush, 27, 35, 44
EE link, 65edge-side includes (ESIs), 196Edit modules, 52Elasticsearch, 82, 165emergency fixes, 53entity cache, 161entity storage
CRUD, 162EntityFieldQuery, 162EntityQuery, 162MongoDB, 162
EntityFieldQuery, 162MongoDB and, 163
Index | 231
www.it-ebooks.info
EntityQuery, 162EntityQuery() API, 32error responses, tracking, 210ETag cache header, 179event handling, 10evictions, 160
least recently used (LRU), 154Expire, 25Expires cache header, 179external requests, 5, 49external scripts, 17
FFacebook, 5, 49, 66failover configuration, 125–130
for cloud deployments, 123Heartbeat, 127IP vs. DNS, 126service-level issues and, 126
failover infrastructure, 91failover, as hosting consideration, 92false optimizations, 30FastCGI Process Manager (FPM), 175field API, 161field storage
CRUD, 162EntityFieldQuery, 162EntityQuery, 162MongoDB, 162
field_sql_storage module, 161File Systems in User Space (FUSE), 114file-backed memory allocation, 199files, adding to pages, 11Firebug, 10, 13, 58Firefox, 58first-time visitors, 5frontend performance, 5, 9–19, 25
audits of, 10–12cacheable headers, 15CDNs and, 16compression, 15display times, 3external scripts and, 17HTTP requests, limiting, 9–12image requests and, 12jQuery and, 16minification, 13PageSpeed (Google), 55real user monitoring, 58
SPOFs and, 17–19third party libraries and, 16verifying changes in, 55–59waterfall charts, 56YSlow, 55
frontend proxies, 82full page loads, 3function calls, 69
Ggeographic distribution, as hosting considera‐
tion, 92getMultiple() API, 38Git, 103–106
repository, setting up, 104Subversion vs., 226workflow with, example, 108
Git Flow extensions, 226Git Hub plug-in (Jenkins), 226GitHub, 102GlusterFS, 114
configuring, 115goals, 2
realistic, 4setting, 4
Google, 9CDN, 16
Google Analytics, 59, 195grace period for expired content, 197gzip compression, 15
HHA NFS clusters, 116–120
configuration for, 117DRBD, setting up, 117–118Heartbeat, 119NFS, setting up, 119testing, 119
ha.cf configuration file (Heartbeat), 128HAProxy, 82haresources configuration file (Heartbeat), 128hb_standby tool (Heartbeat), 129hb_takeover tool (Heartbeat), 129Heartbeat, 119
configuration, 127–129failover configuration with, 127installation, 127tools/options for, 129
232 | Index
www.it-ebooks.info

Heartbeat+CRM, 127Heartbeat+Pacemaker, 127high availability infrastructure, 81, 91High Performance Drupal Group, 225high traffic load tests, 208historic data, graphing, 98horizontal scaling, 79–81hosted environments, network layout control
on, 88hosting considerations, 91hotfixes, with Git, 109HTTP requests
limiting, 9–12minimizing, 9reducing with JavaScript, 12
HTTP Sampler (JMeter), 220
IIcinga, 95, 96–98, 145
check_command option, 98icon fonts, 13identifying bottlenecks, 10image requests
frontend performance and, 12vis CSS, 13
imagessprites, 13
images,caching, 196improving page load time, 3improving website performance, 1
potential improvements, 2in-memory allocation, 199indexes, 147
as trees, 147improving build time for, 167
infrastructure, 79–93bottlenecks in, 210development environments, 87failover, 91for Solr, 168high availability, 91horizontal scaling, 79–81hosting considerations, 91internal network layout, 88large-scale, 85overhead for cloud deployments, 122resource requirements and, 83service categorization, 82staging environments, 87
two-layer configuration, 84–85utility servers, 90vertical scaling, 79–81
initial connection, 57inline option, 12InnoDB storage engine, 131
index structures, 227log file size, 136
innodb_buffer_size configuration option (In‐noDB), 135
innodb_flush_log_at_trx_commit configurationoption (InnoDB), 135
innodb_log_files configuration option (In‐noDB), 136
innodb_log_file_size configuration option (In‐noDB), 136
internal vs. remote monitoring, 99IP addresses, 117
failover vs. DNS, 126virtual, 129
IPVS, 82IUS RHEL/CentOS repository (website), 134
JJavaScript
aggregation, 9, 25caching, 196custom, 10JMeter and, 210native functions, 10nodes in, 52reducing HTTP requests, 12
Jenkins CI, 27, 110plug-ins for, 226
Jetty servers, 168Jiffy, 59JMeter, 212–223
browse controller, 220cookie handling, 217downloading linked assets with, 215global settings for, 213JavaScript and, 210login controller, 218–219output configuration, 221test results, reading, 222tests, running, 222thread groups, 216
jmeter-plugins third party listener, 223join order (MySQL), 148
Index | 233
www.it-ebooks.info

jQuery, 10, 14, 16frontend performance and, 16update, 16
KKCacheGrind, 65KeepAlive (Apache), 178KeepAliveTimeout (Apache), 178key-based invalidation, 39key/value store API, 49key_buffer global option (MySQL), 134
LLast-Modified cache header, 179latency, testing, 209least recently used (LRU) evictions, 154Linux
Heartbeat and, 127Memcache in, 159
load balancers, 82load test plans, 208load testing, 207–223
browse controller, 220continuous integration (CI), 209creating, 208environments for, 211global settings for, 213interpreting results of, 209login controller, 218–219manual targeted, 209output configuration, 221periodic testing, 209running, 222server monitoring during, 210test results, reading, 222thread groups in JMeter, 216types of, 207with JMeter, 212–223
lock storage backends, 154logging, 179
Drupal and, 26for Varnish, 199
login controller, 218–219logs
destination files for, 180file format for, 180
log_errors setting (php.ini), 174long TTLs, 39
Lucene project (Apache), 168
Mmaintain coherency, 39malloc, Varnish memory allocation and, 199managed clouds, 122manual targeted testing, 209MariaDB, 132master branch (Git), 109max-age=N cache header, 179MaxClinets setting (Prefork), 176MaxRequestsPerChild setting (Prefork), 177MaxSpareServers setting (Prefork), 176max_connections global option (MySQL), 133max_heap_table_size variable (MySQL), 134measuring site performance, 2, 6Meenan, Patrick, 18Memcache(d), 82, 155–159
caching, inconsistent, 159consistent hashing and, 157daemon, configuring, 158evictions, 160monitoring, 211PHP extensions for, 155resource requirements for, 84servers and bins for, 156usage, 158vanishing sessions, 160
memory allocation, 199memory use, 69memory_limit setting (php.ini), 173Microsoft SQL Server, 82minification, 13
during the build process, 14on the fly, 14pre-, for modules/themes, 14
minimizing HTTP requests, 9MinSpareServers setting (Prefork), 176mixed replication, 136modules, 21mod_php module (Apache), 174
Nginx and, 183Mon, 127MongoDB, 82, 162Monit, 127monitoring
synchronization process, 118utility servers and, 90Varnish, 199
234 | Index
www.it-ebooks.info

Monty Widenus, 132multiple entity loading, 32multiprocessing module (MPM), 175Munin, 95, 98
plug-ins for, 99MyISAM storage engine, 131MySQL, 82, 131–138, 139–145
configurations, global, 133configuring, 133–136default data relationships in, 151DISTINCT, 150Drupal and, 131larger sites and, 153MariaDB, 132monitoring, 97, 99mysqlreport, 141–145openark kit, 140optimizing, 147–152Oracle MySQL, 132per-thread configuration, 134Percona Server, 133Percona Toolkit, 139queries, 147–152replication, 136starfish syndrome, 151storage engine configuration, 135virtualized deployment, 137
MySQL Performance Blog, 227MySQL queries
base tables, 148indexes, 147join order, 148node access and, 151ORDER BY, 150troubleshooting, 149unrelated tables, 150
MySQL query cache, 48, 51mysqlreport, 141–145
guide to, 141mysqlsla tool (Percona), 139mytop, 61
NNagios, 95, 145Name Service Cache Daemon (NSCD), 126Netflix, 59network connection count, monitoring, 97network layouts, 88network traffic direction, 126
networks, backend, 88NFS servers, 115
clustering, 116–120Nginx, 82, 182, 186no-cache cache header, 179nodes in JavaScript, 52number of queries, 64
Ooak-chunk-update tool (Openark), 140oak-kill-slow-queries tool (Openark), 140oak-purge-master-logs tool (Openark), 140oak-security-audit tool (Openark), 141oak-show-limits tool (Openark), 141OPcache, 171opcode cache, 171–173openark kit, 140OpenNMS, 96optimizing Drupal, 29–45, 47–53
cache granularity, 51cache stampedes, 44caching, 34–43context and, 29debugging, 53development settings and, 53EntityQuery() API, 32external requests and, 49false, 30listing entities and, 32–34multiple entity loading and, 32PHP errors and, 52queues and, 43race conditions, 44sessions, 50variable_set() and, 47–49workers, 43
Oracle, 82Oracle MySQL, 132ORDER BY (MySQL), 150
Ppage assets, 25page caching, 21–25, 60
internal, 23reverse proxy, 24usage, 22
page load time, 3decreasing maximum, 4
Index | 235
www.it-ebooks.info

full page load, 3improving, 3improving for first-time visitors, 5reducing average, 4
page requests per second, testing, 210PageSpeed (Google), 9, 55
summary reports from, 56Pantheon, 122parsing requests, 21PDO, 69peak memory use, 69Percona Server, 133Percona Toolkit, 139
monitoring plug-ins for, 145Percona Tools (website), 134performance issues, 29
as site grows, 85cache backends and, 154with cloud deployments, 123
performance of revision control systems, 102Performance plug-in (Jenkins), 226performance projects, 1–8
baselines, establishing, 3collecting information for, 1Drupal for, 5goals, setting for, 4improvements, prioritizing, 6improving, 1–3
periodic jobs, utility servers and, 90periodic testing, 209persistent caching, 37–43
cache bins, 37cache chains, 37cache tags, 38CacheArray, 39deleteMultiple() API, 38getMultiple() API, 38render caching, 40–43setMultiple() API, 38
PhantomJS, 56PHP, 171–183
Apache module vs. CGI, 174cache headers, 178custom configuration files, storing, 103errors, and optimizing Drupal code, 52execution time, 5for anonymous users, 23gzip support, 15Memcache, extensions for, 155
memory usage, 173opcode cache, 171–173php.ini settings, 173preprocessors, 14strace, 74–77Xdebug and, 65
Picture module, 12ping checks against servers, 97Poormanscron module, 27PostgreSQL, 82Prefork module (Apache), 175, 176Pressflow 6, 137private cache header, 179Pro Git, 226probe section (VCL file), 189protwords.txt configuration file (Solr), 167proxy caches, 82pt-index-usage tool (Percona), 140pt-online-schema-change tool (Percona), 140pt-query-digest tool (Percona), 139pt-table-checksum tool (Percona), 139Puppet, 103–106
master server, setting up, 105Vagrant and, 106
Qquery log display, customizing, 61query results, 27Query Settings (Views), 150query_cache_size global option (MySQL), 134queue daemons, 44queues
advantages of, 43
Rrace conditions, 44RAM usage, monitoring, 97range queries, 148read-only queries (MySQL), 137real users
monitoring, 58, 59thread groups vs., 216
realistic goals, 4recording site performance, 2Red Hat
log destinations on, 180NFS and, 119
236 | Index
www.it-ebooks.info

Redis, 82, 153–155Memcache session storage vs., 160
reducing page load time, 4redundancy, 91Regular Expression Extractor (JMeter), 218remote vs. internal monitoring, 99render caching, 40–43rendered output, 27replication
MySQL, 136Solr, 168
request serve time, 5requirements, 2resource usage, 80response time, testing, 210responsive images, 12reverse proxies, 185–204
caching for authenticated rulers, 196content delivery network vs., 205edge-side includes, 196error pages, 198expired content, serving, 197logging for, 199memory allocation, 199monitoring, 199, 211Nginx and, 183resource requirements for, 84Varnish Configuration Language (VCL),
187–204with Drupal, 185
reviews, 2revision control systems, 102
features of, 102local or external, 102system changes and, 102with Puppet/Git, 103–106
RightScale, 123, 138row replication, 136RRDTool, 98rsync, 113
SSaaS solutions, 59SASS, 13scalability, 29
cache backends and, 154Scalable Vector Graphics (SVG), 13scaling out, 79scaling up, 79
schema.xml configuration file (Solr), 167script tags, 18search backends, 82search_api module (Solr), 166security
as hosting consideration, 92monitoring scripts and, 181
Sensu, 96Server header, 181server signatures, 181ServerLimit setting (Prefork), 177servers
multiple, Solr and, 168virtual vs. physical, as hosting consideration,
92ServerSignature setting (Apache), 181ServerTokens setting (Apache), 181service categorization, 82service monitoring, 95–100
commercial software for, 96graphing data from, 98importance of, 95internal vs. remote, 99selecting services for, 96tuning, 97with Icinga, 96–98
services, 21session storage backends, 154
Memcache(d) as, 158sessions, 50
vanishing, 160setMultiple() API, 38setting TTLs, 39setting variables, 48settings API, 49shared memory (SHM) mount, 138short TTLs, 39Simple Data Writer (JMeter), 221simpletest adaption, 35single points of failure (SPOFs), 17–19site performance
analyzing, 6measuring, 2, 6recording, 2
slave lag (MySQL), 137Slow Query Highlighting, 61social widgets, 19Solr, 82, 165–170
configuring, 166
Index | 237
www.it-ebooks.info

features of, 166indexing content, 167infrastructure for, 168installation, 169performance and, 165replication, 168scalability and, 165
solrconfig.xml configuration file, 166Sort Query Log, 61Souder, Steve, 59Speedy module, 14, 26Sphinx, 82, 165SPOF-O-Matic plug-in, 18SQLite, 82Squid, 186ssh
checks against servers, 97Jenkins and, 110
SSL negotiation, 57SSL requests, handling with CDNs, 204staging environments, 87starfish syndrome, 151start render events, 56StartServers setting (Prefork), 176statd hostname (NFS), 117state API, 49statement replication, 136static caching, 34–37stats command (Memcache), 159storage area networks (SANs), 120storage backends, 153–163
cache, 154caching, inconsistent, 159entity, 161–163evictions, 160field, 161–163lock, 154Memcache, 155–159MongoDB, 162session, 154
storing, 47strace, 74–77
Apache and, 74striped volumes (RAID-0), 138Subversion vs. Git, 226Summary Report (JMeter), 222summary reports, 56support, as hosting consideration, 92swap usage, monitoring, 97
swappable storage, 26synchronization process, 118syslog module, 26, 52system data, monitoring, 99system log, 129
Ttargeted load tests, 208third party libraries
frontend performance and, 16thread groups (JMeter), 216
cookies, handling with, 217real users vs., 216
time problems, 63time to bytes, 3, 57tmp_table_size variable (MySQL), 134Tomcat servers, 168traffic patterns, 22
anonymous users, 23authenticated, 22content, 22customized content, 23frequent updates, 23
translators (GlusterFS), 114Twitter, 5, 49two-layer configuration, 84–85
Uupdates, 23uptime, as hosting consideration, 92utility servers, 90
Jenkins and, 110
VVagrant, 106
distributing VMs with, 107pre-built virtual machines, 226virtual machines and, 106
variable_set(), 47–49storing with, 47
Varnish, 24, 82, 185Apache, running with, 189error pages, 198separating to dedicated servers, 86
Varnish Configuration Language (VCL), 187–204backends, defining, 188
238 | Index
www.it-ebooks.info
caching for authenticated rulers, 196changes to files, loading, 187cookies and, 195directors, 189–191edge-side includes, 196logging for, 199memory allocation, 199monitoring, 199subroutines, built-in, 191subroutines, customizing, 192–195
Varnish Reference Manual (website), 226varnishcsa daemon (Varnish), 199varnishhist logging tool (Varnish), 200varnishlog logging tool (Varnish), 200varnishstat logging tool (Varnish), 199VCL file, sample, 200–204vcl_error subroutine (VCL), 192, 198vcl_fetch subroutine (VCL), 192vcl_hash subroutine (VCL), 192vcl_recv subroutine (VCL), 192verifying changes, 55–77
in frontend performance, 55–59to application performance, 59–77
vertical scaling, 79–81Views
data relationships in, 149default data relationships in, 151Drupal and, 27EntityFieldQuery builder, 162
Views Cache Bully, 28virtual IP, 129virtual machines
deployment workflow, 107–110development on, 106disappearing/failing, with cloud deploy‐
ments, 123distributing with Vagrant, 107pre-built, 226Vagrant, setting up with, 106
VirtualHost, 181virtualized deployment of MySQL, 137
Wwall time, 69
waterfall charts, 56Web Episodes, 59web server data, monitoring, 99, 211web services, 82
resource requirements for, 83WebKit implementation, 56webpagetest, 58website
goals, 2performance, improving, 1requirements, 2
widgets, social, 19Worker module (Apache), 175workflows, deployment, 107–110wrappers, adding caching to, 36
XXapian, 165Xdebug, 60, 66
PHP and, 65XHProf vs., 66
XHProf, 60, 66–74extension, 67Xdebug vs., 66
XtraDB storage engine, 132
YYahoo!, 9, 186YouTube, 26YSlow, 9, 55
summary reports from, 56
ZZabbix, 95, 96Zend Optimizer+, 171ZenOSS, 96Zookeeper, 168
Index | 239
www.it-ebooks.info

About the AuthorsJeff Sheltren has been involved with open source since 2001. He started using Linuxprofessionally at the University of California at Santa Barbara, where he was a seniorsystems administrator and programmer for the computer science department. His pre‐vious position at the Oregon State University Open Source Lab (OSU OSL) was as theoperations manager, providing technical and organizational leadership to the OSU OSLwhile working closely with the many open source projects hosted there, including Dru‐pal.org, the Linux Foundation, and the Apache Software Foundation. Currently, Jeffworks as a performance engineer at Tag1 Consulting.
Jeff has extensive infrastructure experience, gained over the years. As the operationsmanager at OSU OSL—the largest open source hosting infrastructure of its kind—heled the infrastructure and development teams; he is deeply involved in the CentOS Linuxbuild and release process as a member of the QA team, and he works as a volunteer forthe Drupal.org Infrastructure Team. Jeff currently maintains a number of packages forthe Fedora Project and Fedora’s Extra Packages for Enterprise Linux (EPEL), and heserves as the lead systems engineer for multiple Tag1 clients. He lives in Vancouver,Washington.
Narayan Newton is a co-owner of Tag1 Consulting who joined the team in 2008. Hewas introduced to Drupal during his tenure at the Oregon State University Open SourceLab, where he was the co-lead system administrator—and served as the database ad‐ministrator of over 180 MySQL databases; he has also held the positions of freenodeserver administrator and Drupal.org server administrator. Narayan is a permanentmember of the Drupal Association as their systems coordinator, and is the lead systemsadministrator for the Drupal.org Infrastructure Team. He is also a co-maintainer of thePressflow high-performance Drupal distribution.
Outside of Drupal, Narayan has been deeply involved in the FreeBSD, Gentoo, andSlackware communities. More recently, he acted as infrastructure lead for the Examin‐er.com 2.0 relaunch, infrastructure lead for the Drupal.org redesign launch, and infra‐structure lead/performance lead for Drupal.org Git migration. Narayan is currentlychief technology officer at Tag1 Consulting and resides in Portland, Oregon.
Nathaniel Catchpole has been using Drupal since version 4.5 and has been a regularcontributor to Drupal core since 2006; along with extensive code profiling, he has con‐tributed over 400 patches to the Drupal 7 release. Nathaniel also maintains the coreentity, cache, and taxonomy subsystems, as well as the Memcache and Entity Cachecontributed projects. In September 2011, Nathaniel became branch baintainer and re‐lease manager for the Drupal 8 release cycle.
Nathaniel has been with Tag1 Consulting since September 2010. Prior to that, he workedon the Examiner.com Drupal migration and launch and as a consultant for CivicActions,with clients such as Sony BMG and Amnesty International.
www.it-ebooks.info

ColophonThe animal on the cover of High Performance Drupal is the Red-shouldered Hawk(Buteo lineatus). The Red-shouldered Hawk can be found in North America, specificallyin eastern North America, the coast of California, and northern Mexico. They live inwooded areas and stay within a confined range within those areas.
Adult male Red-shouldered Hawks are 15 to 23 inches in length and tend to weigh 550grams. Females, on the other hand, are a bit longer than males by just a few inches, andweigh 700 grams. The wingspan of the adult Red-shouldered Hawk ranges from 35 to50 inches. They have brown heads, red chests, red bars along their bellies, and whitebars along their tails. Like many hawks, they have great vision and will swoop down ontheir prey. They eat rodents, squirrels, rabbits, amphibians, small birds, and large insects.
The Red-shouldered Hawk is a monogamous bird. A breeding pair will typically builda stick nest and will use the same nest every year. The female Red-shouldered Hawktypically gives birth to three to four eggs and after being born the young are dependenton their parents for up to 19 weeks.
The cover image is from Johnson’s Natural History. The cover fonts are URW Typewriterand Guardian Sans. The text font is Adobe Minion Pro; the heading font is AdobeMyriad Condensed; and the code font is Dalton Maag’s Ubuntu Mono.
www.it-ebooks.info