Development of Self-consolidating High Performance ...
359
Development of Self-consolidating High Performance Concrete Incorporating Rice Husk Ash by Md. Safiuddin A thesis presented to the University of Waterloo in fulfillment of the thesis requirement for the degree of Doctor of Philosophy in Civil Engineering Waterloo, Ontario, Canada, 2008 ©Md. Safiuddin 2008
-
Upload
khangminh22 -
Category
Documents
-
view
0 -
download
0
Transcript of Development of Self-consolidating High Performance ...
Development of Self-consolidating High
Performance Concrete Incorporating
Rice Husk Ash
by
Md. Safiuddin
A thesis
presented to the University of Waterloo
in fulfillment of the
thesis requirement for the degree of
Doctor of Philosophy
in
Civil Engineering
Waterloo, Ontario, Canada, 2008
©Md. Safiuddin 2008

Author’s Declaration
I hereby declare that I am the sole author of this thesis. This is a true copy of the thesis,
including any required final revisions, as accepted by my examiners.
I understand that the University of Waterloo may make my thesis electronically
available to the public.
ii
Abstract
The work presented in this thesis deals with the development of self-consolidating high
performance concrete (SCHPC) incorporating rice husk ash (RHA) as a supplementary
cementing material. Various SCHPCs were produced using the water-binder (W/B) ratios of
0.30, 0.35, 0.40 and 0.50, and RHA content in the range of 0 to 30% of cement by weight. In
addition, a number of pastes and mortars formulated from the concretes were prepared and
tested for the filling ability. The paste and mortar filling abilities were tested with respect to
flow time and flow spread, respectively, at various dosages of high-range water reducer
(HRWR). Also, the mortars were tested for the air content at various dosages of air-
entraining admixture (AEA). It was observed that the flow time of the pastes increased with
lower W/B ratio and higher RHA content, whereas the flow spread of the mortars decreased
with higher W/B ratio and greater RHA content. Both paste and mortar filling abilities
increased with higher HRWR dosages. In addition, the air content of the mortars decreased
with lower W/B ratio and higher RHA content for given AEA dosages.
The fresh SCHPCs were tested for filling ability, passing ability, air-void stability,
segregation resistance, unit weight and air content. The filling ability was determined with
respect to slump and slump flow, inverted slump cone flow time and spread, and orimet flow
time and spread. The passing ability was measured with regard to slump and slump flow with
J-ring, inverted slump cone flow spread with J-ring, and orimet flow spread with J-ring. The
air-void stability in several fresh SCHPC mixtures was investigated with respect to re-mixing
of concrete and subsequent measurement of air content at different test stages.
The test results obtained for the fresh properties showed that the inverted slump cone
and orimet flow times increased with lower W/B ratio and greater RHA content. In addition,
the slump flow, inverted slump cone flow spread, and orimet flow spread with and without J-
ring increased considerably with lower W/B ratio and greater RHA content. However, the
increases in slump with and without J-ring at lower W/B ratio and higher RHA content were
not significant. The unit weight of concrete slightly decreased with higher W/B ratio and
greater RHA content, and with higher air content. Achieving the target air content required
greater AEA dosages for lower W/B ratio and higher RHA content. However, the presence of
RHA had no adverse effect on the air-void stability of concrete.
iii

The segregation resistance of various SCHPCs was investigated by visual inspection
of concrete in mixer pan, and during and after different flow tests. Slight bleeding and a thick
layer of paste were noticed in mixer pan for several concretes. The dynamic segregation in
the form of discontinuity or blockage of flow did not occur during the orimet and inverted
slump cone flow tests for any concrete. No aggregate pile appeared in the slump flow, and
orimet and inverted slump cone flow spreads of any concrete. But minor to severe mortar
halos were noticed in the periphery of the flow spread of several concretes, particularly in the
presence of high RHA content. The results of visual inspection suggest that both lower W/B
ratio and greater RHA content improved the dynamic segregation resistance of concrete. In
contrast, the higher RHA content resulted in a lower static segregation resistance, which was
overcome in the presence of viscosity-enhancing admixture (VEA).
The static segregation resistance of several SCHPCs was quantitatively determined by
sieve and column apparatus. The segregation index given by the sieve increased with lower
W/B ratio and higher RHA content, thus indicating a reduced static segregation resistance. In
contrast, the segregation factor given by the column apparatus decreased with lower W/B
ratio suggesting an increased static segregation resistance. However, the segregation factor
increased with higher RHA content, and thus revealed a reduction in static segregation
resistance. In the presence of VEA, both segregation index and segregation factor decreased
significantly, indicating an improvement in the static segregation resistance of concrete.
The hardened SCHPCs were tested for compressive strength, ultrasonic pulse
velocity, water absorption, total porosity and electrical resistivity. Test results revealed that
the compressive strength, ultrasonic pulse velocity and true electrical resistivity increased,
whereas the water absorption and total porosity decreased with lower W/B ratio and higher
RHA content. The entrained air-voids decreased the compressive strength, ultrasonic pulse
velocity, water absorption and total porosity, but slightly increased the electrical resistivity of
concrete. In general, the hardened properties indicated good durability of the concretes.
The empirical models for the filling ability (slump flow) and compressive strength of
SCHPC were derived and verified with test data from this study and other data taken from
the literature. The slump flow and compressive strength computed from the models were
coherent with the measured values. Both filling ability and strength models were useful to
develop a mixture design method for SCHPC with and without RHA.
iv
Acknowledgements
The author expresses sincere gratitude to his supervisors Dr. Jeffrey S. West, Assistant
Professor and Dr. Khaled A. Soudki, Professor, Department of Civil and Environmental
Engineering for their precious guidance, advice, and encouragement throughout the research
program.
The author is thankful to Mr. Cameron Monroe, Manager of Technical Services at the
BASF Construction Chemicals Canada Ltd. for supplying chemical admixtures, and for his
valuable technical support. The author is grateful to Lafarge North America Inc. for the
supply of cement. The author is also grateful to Michael Rich, Renewable Energy Generation
Inc. for his help in collecting rice husk ash required for the research program.
Sincere gratitude and indebtedness are conveyed to Dr. Giovanni Cascante, Associate
Professor, Department of Civil and Environmental Engineering, Faculty of Engineering for
his excellent cooperation in testing ultrasonic pulse velocity of the concretes. Deep thanks are
due to all technical staff in the Faculty of Engineering Machine Shop, Civil and
Environmental Engineering Laboratories, University of Waterloo, particularly John Boldt,
Ken Bowman, Terry Ridgway, Richard Morrison, and Doug Hirst for their valuable input
and assistance during the research program. Special thanks also go to all of my colleagues,
particularly Han Tae Choi and Khanh Tran, and to all Undergraduate Research Assistants for
their great help in experimental investigation.
Sincere and great appreciation goes to Natural Sciences and Engineering Research
Council of Canada; Ontario Ministry of Training, Colleges and Universities; JNE Consulting
Limited; and University of Waterloo for the financial support.
v
Dedication
This thesis is dedicated to the martyrs of Language Movement (Bhasa Andolon) who died in
February 21 (declared as the International Mother Language Day by UNESCO), 1952 to
establish Bengali as a state language of former Pakistan, and to all freedom fighters who
sacrificed their lives for the independence of Bangladesh in 1971.
vi
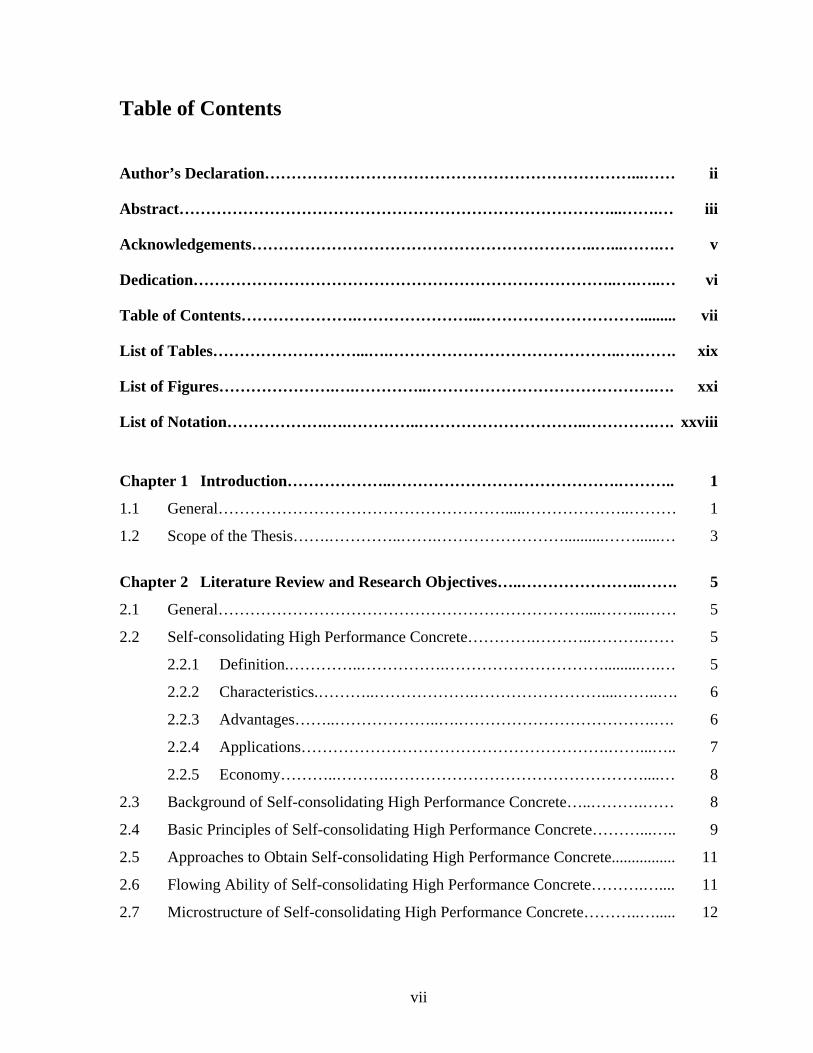
Table of Contents
Author’s Declaration……………………………………………………………...…… ii
Abstract………………………………………………………………………...…….… iii
Acknowledgements………………………………………………………..…...…….… v
Dedication……………………………………………………………………..….…..… vi
Table of Contents………………….…………………...…………………………......... vii
List of Tables………………………...….……………………………………..….……. xix
List of Figures………………….….…………..…………………………………….…. xxi
List of Notation……………….….…………..…………………………..………….…. xxviii
Chapter 1 Introduction………………..…………………………………….……….. 1
1.1 General……………………………………………….....………………..……… 1
1.2 Scope of the Thesis…….…………..…….……………………..........……......… 3
Chapter 2 Literature Review and Research Objectives…..…………………..……. 5
2.1 General……………………………………………………………....……...…… 5
2.2 Self-consolidating High Performance Concrete………….………..……….…… 5
2.2.1 Definition.…………..…………….………………………….........….… 5
2.2.2 Characteristics.………..……………….……………………....……..…. 6
2.2.3 Advantages……..………………..….……………………………….…. 6
2.2.4 Applications………………………………………………….……...….. 7
2.2.5 Economy………..……….…………………………………………....… 8
2.3 Background of Self-consolidating High Performance Concrete…..……….…… 8
2.4 Basic Principles of Self-consolidating High Performance Concrete………...….. 9
2.5 Approaches to Obtain Self-consolidating High Performance Concrete................ 11
2.6 Flowing Ability of Self-consolidating High Performance Concrete……….….... 11
2.7 Microstructure of Self-consolidating High Performance Concrete………..…..... 12
vii
2.8 Performance Criteria for Self-consolidating High Performance Concrete……… 14
2.9 Material Aspects for Self-consolidating High Performance Concrete.................. 16
2.9.1 Coarse aggregate…...….……...…………………………………..…..… 16
2.9.1.1 Physical properties……………….………………..……………….. 16
2.9.1.2 Gradation…….…………...………………...….……….…………… 17
2.9.2 Fine aggregate…..…………………………………………..……..……. 18
2.9.2.1 Physical properties……………………...……………………..…… 18
2.9.2.2 Gradation………………………………….……………..…….…..... 19
2.9.3 Portland cement……………...………………………….……….……... 19
2.9.3.1 Physical properties……………………………………………..…… 20
2.9.3.2 Chemical composition.…………...….……………..………..…….. 20
2.9.4 Supplementary cementing materials…………………………...……...... 21
2.9.4.1 Physical requirements…………….………..………………….…… 22
2.9.4.2 Chemical requirements…………….………..….……………..…… 22
2.9.5 Rice husk ash………………………...……….……….…………….….. 22
2.9.5.1 Physical properties…………………….………..………………….. 22
2.9.5.2 Chemical composition….…...………...……………………………. 23
2.9.5.3 Role in concretes………..………….……………...…………..……. 24
2.9.5.4 Use in self-consolidating high performance concrete………..... 26
2.9.6 Water………….…………………...…………………………….…….... 26
2.9.6.1 Physical quality…..…………………………......……………..…… 26
2.9.6.2 Chemical quality………..……………………… .…….….....…… 27
2.9.7 High-range water reducer…..……...………………..……………....….. 27
2.9.7.1 Physical properties…………………………...…………………….. 28
2.9.7.2 Chemical structure…….……..…………..……………………..….. 28
2.9.7.3 Mechanisms of water reduction……………..………………....…. 28
2.9.8 Air-entraining admixture………………………………..………....…… 30
2.9.8.1 Physical properties……………………………………..……..……. 31
2.9.8.2 Chemical properties…..……………………………………….……. 31
2.9.8.3 Mechanism of air entrainment………………….…..………..……. 31
2.9.9 Viscosity-enhancing admixture……..……………………...…….…..… 32
viii
2.9.9.1 Physical properties…………….……………………………..…..… 33
2.9.9.2 Chemical properties………………………………………..……..… 33
2.9.9.3 Mechanisms of viscosity enhancement………….......……....…… 34
2.10 Mixture Design for Self-consolidating High Performance Concrete.................... 34
2.10.1 Justification for a different method of mixture design….…………..….. 34
2.10.2 Current methods of mixture design...…..…..…………...…………...…. 35
2.11 Mixing of Self-consolidating High Performance Concrete……………..…….… 37
2.12 Stability of Self-consolidating High Performance Concrete….......................….. 37
2.12.1 Static stability…………...…..…………………...………………...….... 38
2.12.2 Dynamic stability…...…………...……………………………..........….. 41
2.12.3 Air-void stability………...…………...……………………..…….…….. 43
2.12.4 Role of rice husk ash…...…………...………………..…………...…….. 44
2.13 Key Fresh Properties of Self-consolidating High Performance Concrete………. 44
2.13.1 Filling ability…..…………...…………………………….…………….. 44
2.13.2 Passing ability………...………………………………………..……….. 45
2.13.3 Segregation resistance.……………………………..………….……….. 45
2.13.4 Unit weight………………..……………………………………….….... 46
2.13.5 Air content.………………...………………………………………..….. 46
2.13.6 Role of rice husk ash………...………..……………………………..….. 46
2.14 Curing of Self-consolidating High Performance Concrete…………………….... 47
2.15 Testing of Self-consolidating High Performance Concrete……………..……..... 48
2.16 Key Hardened Properties of Self-consolidating High Performance Concrete...... 49
2.16.1 Compressive strength………………………………………………..….. 49
2.16.2 Porosity……………………..…………………………………….…….. 50
2.16.3 Ultrasonic pulse velocity…..….…………………………………….….. 50
2.16.4 Absorption……………...…..……………………………….………….. 51
2.16.5 Permeability……………………………………………………..…...…. 51
2.16.6 Electrical resistivity………..…………………..………………….……. 52
2.16.7 Role of rice husk ash…….………...…………..…………………..……. 53
2.17 Modeling of Self-consolidating High Performance Concrete…………….…..… 53
2.17.1 Models for filling ability…………...…………………...………..……... 53
ix
2.17.2 Models for compressive strength….……….......…………...……..……. 56
2.17.3 Other models…...………………….......……………………………..…. 58
2.18 Research Needs……………………………………………………….…….….... 59
2.19 Research Objectives……………………………………………………..…….… 60
Chapter 3 Research Program and Procedures………..……………………………. 61
3.1 General………………………………………………….…………..………….... 61
3.2 Experimental Investigation……………………………...………………..……... 61
3.3 Modeling and Mixture Design…………………….………………………....….. 64
Chapter 4 Characteristics of Constituent Materials and Aggregate Blends…….... 65
4.1 General………………………………………………………..……………...….. 65
4.2 Selection and Testing of Constituent Materials…......…………………..………. 65
4.2.1 Concrete stone…………….………....…………………………………. 65
4.2.2 Concrete sand….…………………………………….…….……………. 66
4.2.3 Normal portland cement……………………………..…………....……. 66
4.2.4 Amorphous rice husk ash…....………....………………………….……. 66
4.2.5 Tap water…………………………………….………………...…….…. 67
4.2.6 Polycarboxylate-based high-range water reducer.…..……………….…. 67
4.2.7 Synthetic air-entraining admixture.…………….…………….……...…. 67
4.2.8 Modified polysaccharide-based viscosity-enhancing admixture……….. 67
4.3 Characteristics of Concrete Stone…………………………………….………..... 68
4.3.1 Physical properties…………….…………………………..……………. 68
4.3.2 Gradation…………………….………………………….….………...… 69
4.4 Characteristics of Concrete Sand……………………………...…………...……. 70
4.4.1 Physical properties………………………………………………….…... 71
4.4.2 Gradation……………………………………………………………...... 72
4.5 Characteristics of Normal Portland Cement…………………...……….…….…. 73
4.5.1 Physical properties……………………………………………………… 73
4.5.2 Particle size distribution………………………………………...……… 74
4.5.3 Chemical composition………………………………………………….. 74
x
4.6 Characteristics of Amorphous Rice Husk Ash………………………………..… 75
4.6.1 Physical properties……………………………………………………… 76
4.6.2 Particle size distribution………...…...………………………………..... 77
4.6.3 Chemical composition………………………………………………….. 78
4.7 Quality of Tap Water…….……………………………………………………… 78
4.8 Characteristics of Glenium 3400 NV……………………………..…………….. 80
4.9 Characteristics of Micro Air……………………………………………….……. 81
4.10 Characteristics of Rheomac VMA 362…………………………………..……… 81
4.11 Preparation and Testing of Aggregate Blends……………………………..……. 82
4.11.1 Preparation of aggregate blends…………………………………...……. 83
4.11.2 Test for bulk density and optimum sand-aggregate ratio…….………… 83
4.12 Properties of Aggregate Blends……………………………………….………… 84
4.12.1 Bulk density…………………………………………………..………… 84
4.12.2 Optimum sand-aggregate ratio……………………………………….… 85
4.13 Use of Properties of Constituent Materials and Aggregate Blends………..……. 85
4.14 Conclusions…………………………………………………………………..….. 86
Chapter 5 Filling Ability of Binder Pastes…………..………………………..…….. 87
5.1 General………………………………………………………………...………… 87
5.2 Research Significance………………………………….………………..….…… 87
5.3 Preparation and Testing of Binder Pastes……………………………………..… 87
5.3.1 Preparation of binder pastes………………………………..…………… 88
5.3.2 Flow cone test…………………………………………………..………. 90
5.4 Filling Ability of Binder Pastes……………….………….……………….…… 91
5.4.1 Effect of high-range water reducer…...……………….…………….….. 91
5.4.2 Saturation dosages of high-range water reducer.………….……..……... 92
5.4.3 Water reduction capacity of high-range water reducer.....……...…….… 96
5.4.4 Water demand of rice husk ash....................................…………..……... 97
5.4.5 Effect of rice husk ash and water-binder ratio………....……………...... 100
5.5 Suitable Content of Rice Husk Ash…….....…………………....………..…….... 103
5.6 Use of Filling Ability Results of Binder Pastes………...………..………..…….. 103
xi
5.7 Conclusions…………………………………….………………….………..…… 104
Chapter 6 Filling Ability and Air Content of Mortars………………….…..……... 105
6.1 General……………………………………………………………….………..… 105
6.2 Research Significance…………………………………………………………… 105
6.3 Preparation and Testing of Mortars……………………………………………... 105
6.3.1 Preparation of mortars……………………………………………….…. 106
6.3.2 Flow mould test……………………………………………………….... 109
6.3.3 Chace indicator test……………………………………………………... 110
6.4 Filling Ability of Mortars……………......…….………………………..…….… 111
6.4.1 Effect of high-range water reducer….…………...…...……………….... 115
6.4.2 Verification of saturation dosages of high-range water reducer……..…. 116
6.4.3 Effect of water-binder ratio….…………………………..……….…….. 117
6.4.4 Effect of rice husk ash………….....…………………………..…….….. 117
6.5 Air Content of Mortars………………..…….…….………………….……….… 118
6.5.1 Effect of air-entraining admixture…………………………….………... 122
6.5.2 Effect of water-binder ratio…………………………….…………...….. 122
6.5.3 Effect of rice husk ash………………………………………..……….... 122
6.6 Suitable Content of Rice Husk Ash……………………………………….…….. 124
6.7 Estimated Dosages of Air-entraining Admixture for Concretes……..………...... 124
6.8 Use of Filling Ability and Air Content Results of Mortars……….…….....……. 125
6.9 Conclusions……...…………………………………………………………...….. 127
Chapter 7 Mixture Proportions of Concretes…………………………….……...…. 128
7.1 General………………………………………………………………………..…. 128
7.2 Design of Concrete Mixtures………………………………………………..…... 128
7.2.1 Design variables and constraints…………………………………….…. 128
7.2.2 Design approach…………………………………………………….….. 129
7.2.3 Various types of concrete mixture………………………………..…….. 130
7.3 Mixture Proportions…………………………………………………………..…. 130
7.3.1 Primary mixture proportions……………………………………..……... 131
xii
7.3.2 Dosages of chemical admixtures………………………….……….…… 132
7.3.3 Adjusted mixture proportions…………………………………..………. 134
7.4 Concluding Remarks………………………………….………………………… 135
Chapter 8 Properties of Freshly Mixed Self-consolidating High Performance
Concretes………………………………………...……………………....... 136
8.1 General……………..………………………………………………...……..…… 136
8.2 Research Significance…………………………….…………………………...… 136
8.3 Preparation of Fresh Concretes…………………………………..……………… 137
8.3.1 Batching procedure…………………………………………………..…. 137
8.3.2 Mixing method……………………………………………………..…… 137
8.4 Testing of Fresh Concretes…………………………………………….………... 138
8.4.1 Slump and slump flow test………………………………………….….. 138
8.4.2 Slump cone – J-ring flow test…………………………..………………. 140
8.4.3 Orimet flow test…………………………………………………….…... 140
8.4.4 Orimet – J-ring flow test………………………………………..………. 141
8.4.5 Inverted slump cone flow test………………………………………..…. 142
8.4.6 Inverted slump cone – J-ring flow test……………………………….… 143
8.4.7 Test for unit weight…………………………………………..…………. 143
8.4.8 Test for air content……………………………………………..……….. 145
8.4.9 Test for air-void stability……………………………………………..… 145
8.5 Filling Ability of Concretes…………...……...………..………..……….…........ 146
8.5.1 Slump and slump flow….………..…………………………..………..... 148
8.5.2 Orimet flow time and spread……………………………………..…….. 148
8.5.3 Inverted slump cone flow time and spread…………….....……….……. 149
8.5.4 Effect of water-binder ratio and rice husk ash on flow time….........…... 149
8.5.5 Effect of water-binder ratio and rice husk ash on slump and flow
spreads.......……………………………………………………………... 150
8.5.6 Effect of high-range water reducer on filling ability.…….…....…..…… 151
8.5.7 Effect of air-entraining admixture on filling ability………....….....…… 154
8.6 Correlations for Different Filling ability Properties……..…..………...….…….. 154
xiii
8.6.1 Flow times of pastes and concretes……………………………….……. 154
8.6.2 Flow spread of mortars and slump flow of concretes……………..……. 154
8.6.3 Orimet and inverted slump cone flow times………………………..…... 156
8.6.4 Inverted slump cone flow spread and slump flow…………………….... 156
8.6.5 Orimet flow spread and slump flow…………………………….……… 158
8.6.6 Orimet and inverted slump cone flow spreads…………………….…… 158
8.7 Performance Criteria for Inverted Slump Cone Flow…………….…………...… 159
8.8 Advantages of Inverted Slump Cone Apparatus…………….………............….. 160
8.9 Model for Filling Ability of Concretes……....……….……...………..……..….. 160
8.9.1 Validity of the model………………………………….…………….….. 164
8.9.2 Application of the model………………………………………….……. 164
8.10 Passing Ability of Concretes………...……….….……..……………..……..….. 165
8.10.1 Slump and slump flow with J-ring…..….……..…..……………..……... 165
8.10.2 Orimet – J-ring flow………...………...…….……..……………...……. 166
8.10.3 Inverted slump cone – J-ring flow………….….....….……………..…... 167
8.10.4 Effect of water-binder ratio and rice husk ash on passing ability……..... 169
8.10.5 Effect of high-range water reducer on passing ability….………….....… 169
8.10.6 Effect of air-entraining admixture on passing ability…………….…..… 169
8.11 Correlations for Different Passing Ability Properties……..…………………..... 169
8.11.1 Slump flow with J-ring and orimet – J-ring flow……………….……… 169
8.11.2 Inverted slump cone – J-ring flow and slump flow with J-ring……….... 170
8.11.3 Inverted slump cone – J-ring flow and orimet – J-ring flow….………... 170
8.12 Correlations between Filling Ability and Passing Ability Properties……..…...... 171
8.13 Performance Criterion for Inverted Slump Cone – J-ring Flow…………..…….. 176
8.14 Unit Weight of Concretes………………………………………………….……. 176
8.14.1 Effect of water-binder ratio…………………………………….………. 177
8.14.2 Effect of rice husk ash……………………………………………….…. 178
8.14.3 Effect of air content………………………………………………….…. 178
8.15 Air Content of Concretes…….....…...………….…….....………………...…….. 178
8.15.1 Effect of water-binder ratio and rice husk ash…….....…….……....…… 178
xiv

8.15.2 Correlation of estimated and actual dosages of air-entraining
admixture…….…….........................................................................…… 178
8.16 Air-void Stability of Concretes…….......……………..……..…...…...….……… 179
8.16.1 Effect of re-mixing…..……………………...…………...…….…..…… 181
8.16.2 Effect of filling ability…………...………....………..…………...…..… 182
8.16.3 Effect of high-range water reducer….…...……………...……………… 182
8.16.4 Effect of rice husk ash……………………………..…………........…… 183
8.17 Optimum Content of Rice Husk Ash………………………………………..…... 183
8.18 Conclusions……………………………………………….…………………..…. 184
Chapter 9 Properties of Hardened Self-consolidating High Performance
Concretes……….......................................................................................... 186
9.1 General……………………………………….……………………..…………… 186
9.2 Research Significance………………………………………………………..….. 186
9.3 Preparation of Test Specimens……………………………………………….…. 187
9.4 Test Procedures for Hardened Concretes………………………………….……. 188
9.4.1 Compression test…………………………………………………..……. 188
9.4.2 Test for ultrasonic pulse velocity……………………………………..… 189
9.4.3 Test for electrical resistivity………………………………………….… 191
9.4.4 Test for water absorption and total porosity………………….………… 191
9.5 Test Results for Hardened Properties……...……………………..…........……... 193
9.5.1 Compressive strength……....……………...…..…….……………....….. 193
9.5.1.1 Effect of water-binder ratio………………………………..………. 196
9.5.1.2 Effect of rice husk ash…………………………………….....……... 199
9.5.1.3 Effect of air content……………………………………...……..…... 199
9.5.2 Ultrasonic pulse velocity……...…………...….…….….…………...….. 199
9.5.2.1 Effect of water-binder ratio…………………………………..……. 201
9.5.2.2 Effect of rice husk ash…………………………………...……..…... 203
9.5.2.3 Effect of air content…………………………………….........……... 203
9.5.3 Water absorption………..……...……………….…….………........…… 203
9.5.3.1 Effect of water-binder ratio…………………………………..……. 206
xv
9.5.3.2 Effect of rice husk ash…………………………………...……..…... 206
9.5.3.3 Effect of air content…………………………………….........……... 207
9.5.4 Total porosity………………………...………………….…............…… 208
9.5.4.1 Effect of water-binder ratio……………………………………..…. 210
9.5.4.2 Effect of rice husk ash…………………………………...……..…... 210
9.5.4.3 Effect of air content……………………………………….....……... 211
9.5.5 Electrical resistivity…………...………………..………….…………… 212
9.5.5.1 Effect of water-binder ratio…………………………………..……. 214
9.5.5.2 Effect of rice husk ash…………………………………….....……... 214
9.5.4.3 Effect of air content……………………………………...………..... 215
9.6 Concrete Durability……….………………………………………….…........…. 216
9.7 Correlations among Various Hardened Properties……………..…………...…... 216
9.7.1 Compressive strength and ultrasonic pulse velocity………………..…... 216
9.7.2 Compressive strength and total porosity…………………………..……. 217
9.7.3 Ultrasonic pulse velocity and total porosity…………………….……… 218
9.7.4 Electrical resistivity and total porosity……………………………….… 218
9.8 Model for Compressive Strength…….……………...…………………………... 220
9.8.1 Validity of the model…………………………………………….……... 224
9.8.2 Application of the model………………………………………….……. 225
9.9 Optimum Content of Rice Husk Ash…….….……………………………..……. 227
9.10 Conclusions…………………………………………………………………..….. 228
Chapter 10 Segregation Resistance of Self-consolidating High Performance
Concretes…………………………………………...………………….… 229
10.1 General………………………………….……..……….……………...……..….. 229
10.2 Research Significance……………..………….……..……….………………….. 229
10.3 Preparation of Fresh Concretes……………………………………………..…… 229
10.4 Development of Segregation Column Apparatus……………………………..… 230
10.4.1 Different types of segregation column……………………………….… 230
10.4.2 Filling techniques………………………………………………..……… 232
10.4.3 Test procedures………………………………………………………..... 232
xvi
10.4.4 Performance of segregation columns……………………………..…….. 236
10.4.5 Selection of segregation column……………………………………..…. 238
10.4.6 Determination of performance criteria for column segregation………... 238
10.4.7 Advantages of segregation column apparatus…………………….……. 249
10.5 Testing of Fresh Concretes for Segregation Resistance……………….………... 249
10.6 Test Results for Segregation Resistance of Concretes………..……….……..…. 250
10.6.1 Static segregation resistance…………………………………….……… 250
10.6.2 Dynamic segregation resistance………………………………….…….. 260
10.6.3 Effect of water-binder ratio………….......………………………….….. 262
10.6.4 Effect of rice husk ash……...….…….......………………...………….... 263
10.6.5 Effect of viscosity-enhancing admixture………...………………….….. 266
10.7 Comparison of Sieve and Column Segregation Tests………….……………..… 268
10.8 Suitable Content of Rice Husk Ash……………..………..…………..……….… 268
10.9 Conclusions…………………………………….…………………………….…. 269
Chapter 11 Mixture Design of Self-consolidating High Performance Concrete.… 271
11.1 General………………………………….……….…..……….………………….. 271
11.2 Research Significance……………………….……..……….………..……....….. 271
11.3 Performance Requirements…..……………….……..……….………..……..….. 271
11.3.1 Filling ability………………………………………………………….... 272
11.3.2 Passing ability…………………………………………………..………. 272
11.3.3 Segregation resistance……………………………………………….…. 273
11.3.4 Rheological properties………………………………………….………. 274
11.3.5 Compressive strength………………………………………………..….. 275
11.3.6 Durability……………………………………………………………..… 276
11.3.7 Air content…………………………………………………………..….. 277
11.4 Principles of Mixture Design……...………….……..……….………..……….... 277
11.5 Materials Selection………………………………………………………….…... 278
11.6 Requirements for Mixture Composition………………………………..……….. 281
11.7 Mixture Design Procedure…...……………….……..……….………..……..….. 285
11.8 Example of Mixture Design………………………………..………………..…... 295
xvii
11.9 Limitation of the Design Method…………...…………………………….…….. 299
11.10 Concluding Remarks.……………………………………………………….…... 300
Chapter 12 Summary, Contributions and Recommendations……..…….……..…. 301
12.1 General………………………………….……….…..……….………………….. 301
12.2 Summary…………………………………….……..……….………..………….. 301
12.3 Contributions……...…………………….……….…..……….………..…….….. 306
12.4 Recommendations………………………..….……..……….………..………….. 308
References……………………………………………………………………….……… 310
xviii
List of Tables
Table 2.1: Applications of self-consolidating high performance concrete…………….. 7
Table 2.2: Performance criteria for self-consolidating high performance concrete...…. 15
Table 2.3: Typical chemical composition of portland cement…………………………. 21
Table 2.4: Typical chemical composition of rice husk ash……….……………………. 23
Table 4.1: Physical properties of concrete stone……………………………...……….. 68
Table 4.2: Physical properties of concrete sand….…………………………………….. 71
Table 4.3: Physical properties of normal portland cement……….…………...……….. 73
Table 4.4: Chemical composition of normal portland cement………...……………….. 76
Table 4.5: Physical properties of rice husk ash……………….….…………………….. 77
Table 4.6: Chemical composition of rice husk ash……………….….……………..….. 79
Table 4.7: Quality of normal tap water………………………………………………… 79
Table 4.8: Physical analysis of Glenium 3400 NV…………………………………….. 80
Table 4.9: Physical analysis of Micro Air…………..…………………………...…….. 81
Table 4.10: Physical analysis of Rheomac VMA 362……...………………………….. 82
Table 4.11: Details of the aggregate blends used for testing bulk density and optimum
sand-aggregate ratio…………………………………………………...…... 83
Table 5.1: Details of the binder pastes prepared with various dosages of HRWR
(series 1)…………………...………………………………………….…….. 89
Table 5.2: Details of the binder pastes prepared with different increased water
contents (series 2)…………………………….…………………………….. 90
Table 6.1: Primary mixture proportions of the mortars tested for filling ability and air
content (series 1 and series 2)………………………………………………. 107
Table 6.2: Adjusted mixture proportions of the mortars tested for filling ability by
flow mould (series 1)………………………………………………………. 108
Table 6.3: Adjusted mixture proportions of the mortars tested for air content by Chace
indicator (series 2)…………………….……………………………………. 109
Table 6.4: Various mixture parameters of the mortars tested for filling ability and air
content……………………………….…...…………………………………. 114
xix
Table 6.5: Results of visual inspection of the flow spread of mortars during flow
mould test…………...…………….…...……………………………………. 116
Table 6.6: Estimated AEA dosages for various concrete mixtures……………...…….. 126
Table 7.1: Variables and constraints for different types of concrete mixture………..… 129
Table 7.2: Designation and description of the concrete mixtures……………………… 131
Table 7.3: Details of the primary concrete mixture proportions……………………….. 132
Table 7.4: Various mass dosages of HRWR, AEA and VEA………………...……….. 133
Table 7.5: Details of the adjusted concrete mixture proportions………………………. 134
Table 8.1: Test program for different types of fresh SCHPC…..…………………...…. 138
Table 8.2: Variations of volume fractions of aggregates, binder, RHA and paste, and
surface area of the binder for different SCHPCs……………………...……. 151
Table 8.3: Unit weight and air content of various fresh concretes………...…………... 177
Table 8.4: Variation of slump at different test stages for various SCHPCs………...…. 182
Table 8.5: Variation of slump flow at different test stages for various SCHPCs……… 183
Table 9.1: Details of the test specimens………………………………………………... 188
Table 9.2: Test program for different types of hardened concrete…………………….. 189
Table 9.3: Compressive strength of various concretes (W/B = 0.30, 0.40, and 0.50)…. 194
Table 9.4: Compressive strength of various concretes (W/B = 0.35)………………….. 195
Table 10.1: Different types of segregation column and methods of filling……………. 230
Table 10.2: Sieve and column segregation test results for different columns……...….. 237
Table 10.3: Test program to determine the performance criteria for the segregation
column apparatus……………………………………………………….…. 239
Table 10.4: Segregation test results for performance criteria (series 1)……...………... 242
Table 10.5: Segregation test results for performance criteria (series 2 and series 3)….. 244
Table 10.6: Test program for segregation resistance of different SCHPCs……………. 250
Table 10.7: Results of visual inspection for various SCHPCs…………………………. 251
Table 10.8: Different mixture parameters, critical mortar yield stress, slump flow,
flow time, and air content of various SCHPCs……………...………….…. 255
xx
List of Figures
Figure 2.1: Basic principles of SCHPC……….………………………………………… 10
Figure 2.2: Schematic representation of aggregate-interfacial transition zone-bulk paste
matrix microstructure…………………………………………………..…… 13
Figure 2.3: Development of rich microstructure in self-consolidating high performance
concrete………………………………………………………………...…… 14
Figure 2.4: Microfilling effect of RHA…………………………………….…………… 24
Figure 2.5: Pozzolanic effect of RHA…………………………………………………... 25
Figure 2.6: Chemical structure of polycarboxylate HRWR…………………………….. 29
Figure 2.7: Cement-water agglomeration in absence of HRWR……………………..…. 29
Figure 2.8: Dispersion of cement particles in presence of HRWR…………………..….. 29
Figure 2.9: Schematic of aggregate suspended in paste matrix……………………..…... 39
Figure 2.10: Forces acting on aggregate during horizontal flow…………………..……. 42
Figure 2.11: Forces acting on aggregate during perpendicular flow…………….……… 42
Figure 3.1: Overall research program……………………………………………..…….. 62
Figure 4.1: Gradation of concrete stone………………………………………….……... 70
Figure 4.2: Gradation of concrete sand…………………………………………..……… 72
Figure 4.3: Particle size distribution of normal portland cement and rice husk ash…..… 75
Figure 4.4: Bulk densities of different aggregate blends……………………………..…. 84
Figure 5.1: Mixer for preparing binder pastes and testing of paste filling ability………. 91
Figure 5.2: Flow time of pastes with increased HRWR dosages (W/B = 0.30)…….…... 92
Figure 5.3: Flow time of pastes with increased HRWR dosages (W/B = 0.35)…….…... 93
Figure 5.4: Flow time of pastes with increased HRWR dosages (W/B = 0.40 and 0.50). 93
Figure 5.5: Flow time of pastes with increased water content (initial W/B = 0.30)…..… 94
Figure 5.6: Flow time of pastes with increased water content (initial W/B = 0.35)…..… 94
Figure 5.7: Flow time of pastes with increased water content (initial W/B = 0.40 and
0.50)…………………………………………………………………………. 95
Figure 5.8: Effect of W/B ratio on the saturation dosages of high-range water reducer... 95
Figure 5.9: Effect of RHA on the saturation dosages of high-range water reducer…….. 96
xxi
Figure 5.10: Water reduction capacity for various saturation dosages of HRWR…….... 99
Figure 5.11: Effect of W/B ratio and RHA content on the water reduction capacity of
HRWR……………………………………………………..…………….… 99
Figure 5.12: Water demand of RHA for saturation flow of binder pastes……..……….. 100
Figure 5.13: Effect of RHA and W/B ratio on the saturation flow time of binder
pastes……………………………………………………………….……… 101
Figure 5.14: Effect of RHA and W/B ratio on the binder volume fraction of pastes….... 102
Figure 5.15: Effect of RHA and W/B ratio on the surface area of binder……………..... 102
Figure 6.1: Test setup and testing of mortar filling ability with respect to flow spread… 110
Figure 6.2: Test setup and testing of mortars for air content……………………..……... 110
Figure 6.3: Flow spread of various mortars (W/B = 0.30, concrete air content = 6%)…. 111
Figure 6.4: Flow spread of various mortars (W/B = 0.35, concrete air content = 6%)…. 112
Figure 6.5: Flow spread of various mortars (W/B = 0.40, concrete air content = 6%)…. 112
Figure 6.6: Flow spread of various mortars (W/B = 0.35, concrete air content = 4% and
8%)…………………………………………………………....…………….. 113
Figure 6.7: Flow spread of various mortars (W/B = 0.50, concrete air content = 2% and
6%)………………………………………………………………………….. 113
Figure 6.8: Effect of water-binder ratio on the flow spread of mortars…………..……... 118
Figure 6.9: Effect of rice husk ash on the flow spread of mortars………………..……... 119
Figure 6.10: Air content of various mortars (W/B = 0.30, concrete air content = 6%)..... 120
Figure 6.11: Air content of various mortars (W/B = 0.35, concrete air content = 6%)..... 120
Figure 6.12: Air content of various mortars (W/B = 0.35, concrete air content = 4%
and 8%)…………………………………………..………………………... 121
Figure 6.13: Air content of various mortars (W/B = 0.40 and 0.50, concrete air content
= 6%)………………………………………………………………..……... 121
Figure 6.14: Effect of W/B ratio on the air content of mortars…………………….…… 123
Figure 6.15: Effect of RHA content on the air content of mortars…………………….... 123
Figure 8.1: Pan mixer, slump and slump flow with and without J-ring, and orimet flow
spread……………………………………………………………………..…. 139
Figure 8.2: Details of the J-ring………………………………………...……………..… 141
Figure 8.3: Details of the orimet apparatus………………………..……………………. 142
xxii
Figure 8.4: Orimet – J-ring flow , inverted slump cone flow with and without J-ring,
unit weight, and air content tests for various concretes…......………….…… 144
Figure 8.5: Details of the inverted slump cone apparatus……….……………………… 145
Figure 8.6: Details of air-void stability test…………………..…………………………. 147
Figure 8.7: Effect of W/B ratio and RHA content on the orimet and inverted slump
cone flow times of concrete………………….………………………...…… 150
Figure 8.8: Effect of W/B ratio and RHA content on the slump flow of concretes…….. 152
Figure 8.9: Effect of W/B ratio and RHA content on the orimet flow spread of
concretes……………………………………………………..…………….... 152
Figure 8.10: Effect of W/B ratio and RHA content on the inverted slump cone flow
spread of concretes…...………………………….……………………….... 153
Figure 8.11: Effect of W/B ratio and RHA content on the slump of concretes……..…... 153
Figure 8.12: Correlation between flow times of pastes and concretes…………….……. 155
Figure 8.13: Correlation between mortar flow spread and concrete slump flow…….…. 156
Figure 8.14: Correlation between orimet and inverted slump cone flow times………..... 157
Figure 8.15: Correlation between inverted slump cone flow spread and slump flow…... 157
Figure 8.16: Correlation between orimet flow spread and slump flow…………….…… 158
Figure 8.17: Correlation between orimet and inverted slump cone flow spreads…….… 159
Figure 8.18: Relationship between (ρ/Sf 2) and (1-Vp) for various concrete mixtures…... 163
Figure 8.19: Comparison between computed and measured slump flows of various
SCHPCs……………………………………………………………..……... 165
Figure 8.20: Effect of W/B ratio and RHA content on the slump with J-ring for various
concretes…………………………………………………..……………..… 166
Figure 8.21: Effect of W/B ratio and RHA content on the slump flow with J-ring for
various concretes……………………………………..………...………..… 167
Figure 8.22: Effect of W/B ratio and RHA content on the orimet – J-ring flow of
various concretes……..……………………………………..…………..… 168
Figure 8.23: Effect of W/B ratio and RHA content on the inverted slump cone – J-ring
flow of various concretes…….……………………………...…………..… 168
Figure 8.24: Correlation between orimet – J-ring flow and slump flow with J-ring for
various concretes………..…..………………………..……………….....… 170
xxiii
Figure 8.25: Correlation between inverted slump cone – J-ring flow and slump flow
with J-ring for various concretes……….…………………....…………..… 171
Figure 8.26: Correlation between inverted slump cone – J-ring flow and orimet – J-ring
flow for various concretes……….………………….……………….…..… 172
Figure 8.27: Correlation between slump with and without J-ring for various
concretes………………………………………………………………….... 172
Figure 8.28: Correlation between slump flow with and without J-ring for various
concretes………………………………………………………………….... 173
Figure 8.29: Correlation between inverted slump cone flow spread with and without J-
ring for various concretes…..………………………………………..…….. 173
Figure 8.30: Correlation between orimet flow spread with and without J-ring for
various concretes…..…………………….…………………………..…….. 174
Figure 8.31: Correlation between inverted slump cone – J-ring flow and slump flow for
various concretes…….……………….………………………………...….. 174
Figure 8.32: Correlation between orimet – J-ring flow and slump flow for various
concretes…….……………….…………………………………………….. 175
Figure 8.33: Correlation between inverted slump cone – J-ring flow and orimet flow
spread for various concretes…….……………….……………..………….. 175
Figure 8.34: Correlation between orimet – J-ring flow and inverted slump cone flow
spread for various concretes…….……………….………………..……….. 176
Figure 8.35: Correlation between estimated and actual AEA dosages for various
concretes………………………………………………………..………….. 179
Figure 8.36: Variation of air content in self-consolidating high performance concretes
with 4% design air content…………………………………………..…….. 180
Figure 8.37: Variation of air content in self-consolidating high performance concretes
with 8% design air content………………………..……………………….. 181
Figure 9.1: Cylinder specimens used for determining the hardened properties of
concretes…………………………………………………………….…….… 187
Figure 9.2: Different tests for determining the hardened properties of concretes…….… 190
Figure 9.3: Schematic of test setup for determining water absorption and total
porosity…………………………………………………………….……...… 193
xxiv

Figure 9.4: Compressive strength development of various concretes (W/B = 0.30)…..... 196
Figure 9.5: Compressive strength development of various concretes (W/B = 0.35)…..... 197
Figure 9.6: Compressive strength development of various concretes (W/B = 0.40 and
0.50)…………………………………………………………………………. 197
Figure 9.7: Effect of W/B ratio on the compressive strength of concretes without
RHA……………………………………………………………………….... 198
Figure 9.8: Effect of W/B ratio on the 28 days compressive strength of concretes with
RHA…………………………………………………………………….…... 198
Figure 9.9: Ultrasonic pulse velocity of various concretes (W/B = 0.30)………….…… 200
Figure 9.10: Ultrasonic pulse velocity of various concretes (W/B = 0.35)……..…….… 200
Figure 9.11: Ultrasonic pulse velocity of various concretes (W/B = 0.40 and 0.50)….... 201
Figure 9.12: Effect of W/B ratio on the ultrasonic pulse velocity of concretes……….... 202
Figure 9.13: Effect of W/B ratio and RHA content on the 28 days ultrasonic pulse
velocity of concretes……………………………………………….…….... 202
Figure 9.14: Water absorption of various concretes (W/B = 0.30)……………………... 204
Figure 9.15: Water absorption of various concretes (W/B = 0.35)………………….….. 205
Figure 9.16: Water absorption of various concretes (W/B = 0.40 and 0.50)………...….. 205
Figure 9.17: Effect of W/B ratio on the water absorption of concretes……………..…... 206
Figure 9.18: Effect of W/B ratio and RHA content on the 28 days water absorption of
concretes……………………..………………………………………...…... 207
Figure 9.19: Total porosity of various concretes (W/B = 0.30)………………..………... 208
Figure 9.20: Total porosity of various concretes (W/B = 0.35)……………………..…... 209
Figure 9.21: Total porosity of various concretes (W/B = 0.40 and 0.50)…….……..…... 209
Figure 9.22: Effect of W/B ratio on the total porosity of concretes…………..…….…... 210
Figure 9.23: Effect of W/B ratio and RHA content on the 28 days total porosity of
concretes………………………..……………………………………..…... 211
Figure 9.24: True electrical resistivity of various concretes (W/B = 0.30)……........…... 212
Figure 9.25: True electrical resistivity of various concretes (W/B = 0.35)……........…... 213
Figure 9.26: True electrical resistivity of various concretes (W/B = 0.40 and 0.50)….... 213
Figure 9.27: Effect of W/B ratio on the true electrical resistivity of concretes……….… 214
xxv
Figure 9.28: Effect of W/B ratio and RHA content on the 28 days true electrical
resistivity of concretes……...……..…………………….………………..... 215
Figure 9.29: Correlation between compressive strength and ultrasonic pulse velocity… 217
Figure 9.30: Correlation between compressive strength and total porosity…….………. 218
Figure 9.31: Correlation between ultrasonic pulse velocity and total porosity…….…… 219
Figure 9.32: Correlation between true electrical resistivity and total porosity………..… 220
Figure 9.33: Relationship between 1/f(t,28) and 1/t…………………………….…….… 222
Figure 9.34: Contribution of RHA towards 28 days compressive strength of
concretes………………………………………..………………………….. 223
Figure 9.35: Relationship between strength contribution factor and W/B ratio……..….. 224
Figure 9.36: Predicted and measured compressive strength of concretes (W/B = 0.30)... 226
Figure 9.37: Predicted and measured compressive strength of concretes (W/B = 0.40)... 226
Figure 9.38: Comparison between predicted and measured compressive strength of
concretes……………………………………………………………...……. 227
Figure 10.1: Various types of PVC column and filling technique used in the
development of segregation column apparatus……………….…………… 231
Figure 10.2: Several operational stages involved in the development of segregation
column apparatus………………………………….…………..…………… 234
Figure 10.3: Apparatus and several operational stages of the sieve segregation test….... 235
Figure 10.4: Details of the segregation column apparatus…………………………….... 239
Figure 10.5: Different types of test specimen used to determine the performance
criteria for column segregation of concrete……..………………………… 241
Figure 10.6: Variation of segregation factor with segregation index of concrete…….… 242
Figure 10.7: Correlation between degree of variation and statistical coefficient of
variation in compressive strength….…………...………………………..… 247
Figure 10.8: Variation of compressive strength with segregation factor of concrete…… 247
Figure 10.9: Correlation between variations of compressive strength and true electrical
resistivity…………………………...…………...………….……………… 248
Figure 10.10: Variation of true electrical resistivity with segregation factor of
concrete…………………………...…………...………………….……… 248
Figure 10.11: Variation of segregation index for different concretes…………….…….. 252
xxvi
Figure 10.12: Variation of segregation factor for different concretes……………….….. 252
Figure 10.13a: Appearances of the slump flow and orimet flow spreads for
C50R0A2……………………………………………………….........….. 255
Figure 10.13b: Appearances of the inverted slump cone flow spread for C50R0A6 and
orimet flow spread for C35R15A6……...…………………...............….. 256
Figure 10.13c: Appearances of the inverted slump cone flow spread for C35R15A6
and slump flow spread for C35R25A6……...……………….……...….. 257
Figure 10.14: Effect of slump flow on the segregation index of SCHPC……….……… 259
Figure 10.15: Effect of W/B ratio on the segregation index of SCHPC…………….….. 264
Figure 10.16: Effect of W/B ratio on the segregation factor of SCHPC………………... 265
Figure 11.1: Flowchart for mixture design procedure…………………………………... 286
Figure 11.2: Chart for determining paste volume based on slump flow…………….….. 287
Figure 11.3: Chart for determining W/B ratio based on average compressive strength… 288
xxvii
List of Notation
Notation Meaning
a Ratio of top radius to the bottom radius of slump cone
AEA Air-entraining admixture
A(t) Kinetics function related to the compressive strength of reference
concrete
Aa Cross-sectional area of aggregate
Ac Entrained air content of mortar
Aca Absorption of coarse aggregate
Afa Absorption of fine aggregate
Ame Equivalent air content of mortar
Ap Entrapped air content of concrete
At Total design air content of concrete
B Binder content of concrete or mortar
B/A Binder-aggregate ratio
BDmad Maximum bulk density of air-dry aggregate blend
C Cement
CA Coarse aggregate
CA/FA Coarse aggregate to fine aggregate mass ratio
CA/TS Coarse aggregate to total solid volume ratio
CSH Calcium silicate hydrate
CBB Surface-dry mass of the coarse aggregate in bottom section of column
apparatus
CD Drag coefficient
Cfto Orimet flow time of concrete
Cftisc Inverted slump cone flow time of concrete
Ci Surface-dry mass of the aggregate in ‘i’th section of column apparatus
CT Surface-dry mass of the coarse aggregates in top section of column
apparatus
xxviii

D Diameter of concrete cylinder specimen, maximum size of aggregate
Dca Actual AEA dosage
Dce Estimated AEA dosage for the specified air content of concrete
Dh Dosage of high-range water reducer
Dm Mortar density
Dme AEA dosage for the equivalent air content of mortar
FA Fine aggregate
f /acr Equivalent average compressive strength of air-entrained SCHPC
Fb Buoyant force
fc(t) Compressive strength at any time
f /c Specified design compressive strength of concrete
f /cr Specified design compressive strength of concrete
f /nacr Average compressive strength of non-air-entrained SCHPC
f(t, ts) Strength-time function
fcm Mean compressive strength at 28 days
fcs Specified compressive strength of concrete
fc28 28-day compressive strength of concrete
Fd Downward force
Fdr Vertical drag force
Ff Frictional force
Fg Gravitational force
Fr Restoring force
g Gravitational acceleration
H Height of concrete cylinder specimen, height of fresh concrete in
slump cone
HRWR High-range water reducer
HPC High performance concrete
ISCF Inverted slump cone flow
K A coefficient that depends on the type of aggregate
Kc A factor related to cement strength, strength contribution factor of rice
husk ash
xxix

Mb Buoyant mass of the saturated specimen in water
Mc Mass of the mortar contained in concrete sample
Mca Moisture content of coarse aggregate
Md Oven-dry mass of the specimen in air
Mfa Moisture content of fine aggregate
Mp Mass of the mortar passing No. 4 sieve
Ms Saturated surface-dry mass of the specimen in air
n Experimental constant for slump flow model, number of column
sections
Rc28 28-day compressive strength of cement
OF Orimet flow
Pft Paste flow time
Prha Percent amount of rice husk ash in total binder
Pt Total porosity
P Average of tP and bP
bP Average concrete property obtained from two bottom sections of
column specimens
tP Average concrete property obtained from two top sections of column
specimens
RHA Rice husk ash
ra Radius of aggregate
Rb Bottom radius of concrete sample before deformation
Rd Relative density of AEA
S Slump
S/A Sand-aggregate ratio
(S/A)opt Optimum sand-aggregate ratio
SCC Self-consolidating concrete
SCM Supplementary cementing material
SCHPC Self-consolidating high performance concrete
SD Saturation dosage
xxx
SF Mass of silica fume, segregation factor of concrete
SI Segregation index of concrete
Sf Slump flow of concrete
Sh Solid content of high-range water reducer
Sv Volume fraction of solids, volume fraction of coarse and fine
aggregates
t Concrete age
T Time period for the measurement of slump and slump flow
Ti Inverted slump cone flow time
To Orimet flow time
Ts Slump time
V Volume of concrete sample in slump cone
Vm Mortar volume
VEA Viscosity-enhancing admixture
Va Volume of aggregate
Vc Air-free absolute volume of concrete
Vca Absolute volume of coarse aggregate
Vfa Absolute volume of fine aggregate
Vcaad Voids in air-dry basis compacted aggregate blend
Vcp Statistical coefficient of variation in concrete property
Vdp Degree of variation in concrete property
Vep Excess paste
Vm Air-free absolute volume of the mortar component of concrete
Vmp Minimum paste volume
Vp Paste volume of concrete
Vta Absolute volume of total aggregates
vt Terminal velocity
W Water
Wa Water absorption
W/B Water-binder ratio
W/C Water-cement ratio
xxxi
Wb Binder weight
Wc Weight of cement
Wca Amount of saturated surface-dry coarse aggregate
Wcaad Adjusted air-dry weight of coarse aggregate
WD Water demand of RHA
Wfa Amount of saturated surface-dry fine aggregate
Wfaad Adjusted air-dry weight of fine aggregate
WIO Increase in water content required for the binder paste without RHA
WIRHA Increase in water content needed for the binder paste with RHA
WHRWR Water content required for the saturation flow time in the presence of
HRWR
WO Water content needed for the saturation flow time without any HRWR
WR Water reduction capacity of HRWR
Wrha Weight of RHA
Wta Amount of total aggregate
Ww Weight of water
Wwad Adjusted weight of mixing water
y A coefficient that accounts for the entrapped air volume
α 2gV/π, experimental constant for strength model
αs Shape factor
β Experimental constant for slump flow and strength model
φmc Volume fraction of the mortar component in concrete
η Viscosity of matrix
μ Plastic viscosity of concrete
νe Equilibrium velocity
ρ Unit weight or density of fresh concrete
ρa Density of aggregate
ρm Density of matrix
ρr Relative density of concrete
ρrc Relative density of cement
xxxii
ρrca Saturated surface-dry basis relative density of coarse aggregate
ρrcaad Air-dry basis relative density of coarse aggregate
ρrfaad Air-dry basis relative density of fine aggregate
ρrfa Saturated surface-dry basis relative density of fine aggregate
ρrrha Relative density of RHA
ρw Density of water
σ Standard deviation
τbm Maximum bottom shear stress
τcmy Critical mortar yield stress needed to avoid segregation
τy Yield stress
xxxiii
Chapter 1
Introduction
1.1 General
Advancements in concrete technology have resulted in the development of a new type of
concrete, which is known as self-consolidating high performance concrete (SCHPC). The
merits of SCHPC are based on the concept of self-consolidating and high performance
concretes. Self-consolidating concrete (SCC) is a flowing concrete that spreads through
congested reinforcement, fills every corner of the formwork, and is consolidated under its
self-weight (Khayat 1999). SCC requires excellent filling ability, good passing ability, and
adequate segregation resistance. But it does not include high strength and good durability as
essential performance criteria. Conversely, high performance concrete (HPC) has been
defined as a concrete that is properly designed, mixed, placed, consolidated, and cured to
provide high strength and low transport properties or good durability (Russell 1999). HPC
exhibits good segregation resistance. But HPC does not provide excellent filling ability and
passing ability, and therefore needs external means such as rodding or vibration for proper
consolidation. Hence, a concrete that fulfills the performance criteria of both SCC and HPC
can be referred to as SCHPC. An SCHPC is that concrete, which offers excellent
performance with respect to filling ability, passing ability, segregation resistance, strength,
transport properties and durability.
SCHPC is produced by exploiting the benefits of high-range water reducer (HRWR)
and supplementary cementing material (SCM). The use of HRWR is essential to produce
SCHPC. A HRWR contributes to achieve excellent filling ability and passing ability. In
addition, SCMs are incorporated in SCHPC mostly to enhance the strength and durability of
concrete. It may also contribute to attain good segregation resistance. In Canada and other
countries, several well-known SCMs such as silica fume, ground granulated blast-furnace
slag, and fly ash have been used to produce SCHPC (Bouzoubaâ and Lachemi 2001, Khayat
2000, Okamura and Ozawa 1994, Persson 2001). In comparison, the use of rice husk ash
(RHA) in SCHPC is very limited. RHA is obtained by controlled burning of rice husks,
1

which are agricultural wastes generated in the rice-milling industry. It has been found that
RHA provides dramatic improvements in hardened properties and durability of concrete
(Mehta and Folliard 1995, Maeda et al. 2001). Similar effects might be observed when RHA
is used in SCHPC. SCMs are also essential for high strength and high durability of SCHPC.
Moreover, the expense of some SCMs such as silica fume and high reactivity metakaolin
increases the overall material cost of SCHPC. Therefore, the use of less-expensive RHA is
more desirable to decrease the overall production cost of SCHPC. The usage of RHA also
minimizes the environmental burden resolving vast waste disposal problems caused by rice
milling industries. The recent yearly production of rice in the world is about 560 million
metric tons (Vegas 2004). Rice husk constitutes approximately one fifth of the dried rice
(Mehta 1992). Therefore, about 120 million metric tons of rice husks are available annually
for disposal. This is causing a huge environmental load for rice-producing countries, which
can be reduced if RHA is used in concrete production. Thus, the incorporation of RHA in
SCHPC will be a novel solution to the environmental problem caused by rice husks. Also,
the use of RHA lowers the demand for cement in construction industry, and thus reduces the
cost of cement production and lessens the environmental pollution caused by cement
factories. Hence, RHA not only improves concrete properties and durability, but also
provides substantial economic and environmental benefits. Yet, no comprehensive research
has been conducted to explore the potential of RHA by investigating its effect on fresh and
hardened properties and durability of SCHPC.
The present study has attempted to develop SCHPCs utilizing RHA as a SCM. The
key properties of SCHPCs and their binder paste and mortar components have been
determined in this study. In particular, the effects of RHA on various properties of different
binder pastes, mortars and SCHPCs have been examined. A simplified mixture proportioning
process for SCHPC has been developed. New and modified test approaches have been
applied to determine several properties of binder pastes, mortars and SCHPCs. The test
apparatus have been developed to measure the filling ability, passing ability, and segregation
resistance of SCHPCs. In addition, empirical models have been developed for the filling
ability and compressive strength of SCHPC. The outcome of this study will extend the scope
of SCHPC, and thus generate new opportunities for the construction industry. Although there
2
is not a large source of RHA in Canada, the findings of the present study will be useful for
the rice-producing countries.
1.2 Scope of the Thesis
The contents of the thesis are given in ten chapters.
Chapter 1 introduces SCHPC with a short overview of the present research and
briefly presents the scope of the thesis.
Chapter 2 presents a background of SCHPC, highlights the major issues of SCHPC,
describes various constituent materials of SCHPC including their key aspects, identifies
several research needs, and gives the research objectives.
Chapter 3 gives an overview of the research program and procedures for experimental
investigation and development of test apparatus, modeling, and mixture design.
Chapter 4 discusses the selection and testing of constituent materials, describes the
preparation and testing of aggregate blends, presents the characteristics of constituent
materials and aggregate blends, and emphasizes their usefulness.
Chapter 5 presents the formulation, preparation and testing of various binder pastes,
gives the test results for the filling ability of the pastes, discusses the significance of these
results, highlights the effects of HRWR, RHA and water-binder (W/B) ratio on the filling
ability of the pastes, reports the saturation dosage and water reduction capacity of HRWR,
and depicts the water demand and suitability of RHA.
Chapter 6 presents the formulation, preparation and testing of various mortars,
provides the test results for the filling ability and air content of the mortars, discusses the
importance of these results, highlights the effects of HRWR, AEA, RHA and W/B ratio on
the filling ability and air content of the mortars, focuses on the acceptability of saturation
dosages of HRWR obtained from flow cone test of binder pastes, and depicts the suitability
of RHA.
Chapter 7 presents the design and proportioning process of various concrete mixtures,
and reports the primary and adjusted mixture proportions including the dosages of chemical
admixtures.
Chapter 8 describes the development of flowing ability test apparatus, depicts the
preparation and testing of various fresh concretes, presents the test results for the key fresh
3
properties of various SCHPCs including air-void stability, and discusses the significance of
these results. In addition, this chapter discusses the effects of HRWR, AEA, RHA, W/B ratio
and air content on the fresh properties of SCHPC, highlights the air-void stability in fresh
SCHPC including the effects of re-mixing and filling ability, demonstrates inverted slump
cone apparatus with test procedure and performance criteria for filling ability and passing
ability, and develops correlations among several properties of fresh SCHPCs. This chapter
also provides the correlations between flow properties of SCHPC and its paste and mortar
components, gives the relationship between estimated and actual AEA dosages of various
SCHPCs, establishes a model for filling ability and discusses it validity and application, and
reports the optimum RHA content.
Chapter 9 presents the preparation of hardened test specimens, describes the test setup
and testing of various hardened concretes, discusses the test results for hardened properties of
various SCHPCs, highlights the importance of these results, discusses the effects of RHA,
W/B ratio and air content, shows the relationships between different hardened properties,
establishes a model for compressive strength and discusses its validity and application, and
gives the optimum content of RHA.
Chapter 10 describes the development of a simplified column apparatus including the
test procedure and performance criteria. This chapter also depicts the testing of several
SCHPCs for segregation resistance, describes the segregation test results, compares the
performance of sieve and column tests, discusses the effects of RHA, W/B ratio and VEA,
and gives the optimum RHA content to produce segregation-resistant SCHPC.
Chapter 11 presents a mixture design procedure for SCHPC, highlights the principles
and performance requirements of mixture design, and depicts materials selection and
requirements for mixture composition. In addition, this chapter gives a design example and
discusses the limitation of the mixture design procedure.
Chapter 12 provides a summary of the research findings, presents the contributions,
and gives several recommendations for future study.
4
Chapter 2
Literature Review and Research Objectives
2.1 General
Self-consolidating high performance concrete (SCHPC) is relatively a new building material
in the construction industry. This chapter presents a background and review of SCHPC. It
primarily gives the definition and briefly describes the characteristics, advantages,
applications, and economy of SCHPC. Then it provides a short background of SCHPC;
depicts the basic principles, production approaches, flowing ability and microstructure of
SCHPC; focuses on the performance criteria and material aspects of SCHPC; justifies the
need for a different approach and presents the current methods for designing SCHPC; and
discusses the mixing and stability of SCHPC. Also, this chapter highlights major fresh and
hardened properties, and states the curing and testing issues of SCHPC. Finally, this chapter
emphasizes certain modeling approaches, presents the research needs for SCHPC, and sets
the research objectives.
2.2 Self-consolidating High Performance Concrete
The development of SCHPC has implied significant changes in the conceptual approach and
construction methods for concrete structures, and opened new opportunities for design. The
definition, characteristics, advantages, applications and economy of SCHPC are briefly
discussed below.
2.2.1 Definition
Self-consolidating concrete (SCC) is a special type of concrete that spreads through the
congested reinforcement, reaches every corner of the formwork, and is consolidated under its
own weight. It provides excellent filling ability and passing ability, and exhibits good
segregation resistance (Khayat 1999). When the performance criteria of high strength and
durability for high performance concrete (HPC) are included in SCC with a low water-binder
(W/B) ratio, it can be referred to as SCHPC. A SCHPC is that special concrete, which would
5
give the optimized performance with respect to flow characteristics, strength, transport
properties and durability consistent with the requirements of service life under a given set of
materials, loads and exposure conditions.
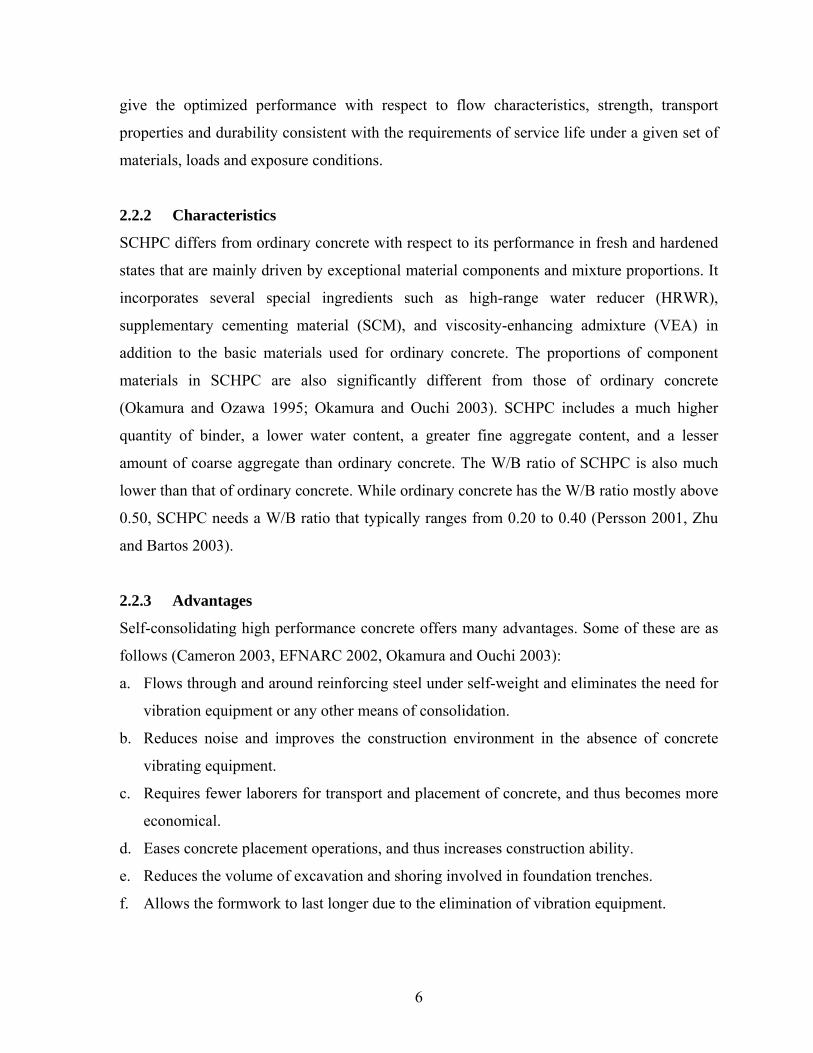
2.2.2 Characteristics
SCHPC differs from ordinary concrete with respect to its performance in fresh and hardened
states that are mainly driven by exceptional material components and mixture proportions. It
incorporates several special ingredients such as high-range water reducer (HRWR),
supplementary cementing material (SCM), and viscosity-enhancing admixture (VEA) in
addition to the basic materials used for ordinary concrete. The proportions of component
materials in SCHPC are also significantly different from those of ordinary concrete
(Okamura and Ozawa 1995; Okamura and Ouchi 2003). SCHPC includes a much higher
quantity of binder, a lower water content, a greater fine aggregate content, and a lesser
amount of coarse aggregate than ordinary concrete. The W/B ratio of SCHPC is also much
lower than that of ordinary concrete. While ordinary concrete has the W/B ratio mostly above
0.50, SCHPC needs a W/B ratio that typically ranges from 0.20 to 0.40 (Persson 2001, Zhu
and Bartos 2003).
2.2.3 Advantages
Self-consolidating high performance concrete offers many advantages. Some of these are as
follows (Cameron 2003, EFNARC 2002, Okamura and Ouchi 2003):
a. Flows through and around reinforcing steel under self-weight and eliminates the need for
vibration equipment or any other means of consolidation.
b. Reduces noise and improves the construction environment in the absence of concrete
vibrating equipment.
c. Requires fewer laborers for transport and placement of concrete, and thus becomes more
economical.
d. Eases concrete placement operations, and thus increases construction ability.
e. Reduces the volume of excavation and shoring involved in foundation trenches.
f. Allows the formwork to last longer due to the elimination of vibration equipment.
6
g. Favors the placement of a large amount of reinforcement in small sections such as those
most often seen in high-rise buildings.
h. Saves a large quantity of concrete due to the reduced section of structural components.
i. Provides good finishing without any surface pores and improves the aesthetical
appearance of concrete.
j. Results in greater strength due to enhanced compactness and reduced porosity.
k. Confers high early strength, allows a quicker reuse of formwork, and thus enhances the
production rate.
l. Imparts improved water-tightness, and thus offers reduced transport properties and
enhanced durability.
m. Simplifies the construction of the structures of complicated design due to the easement in
casting and molding of the complex architectural forms.
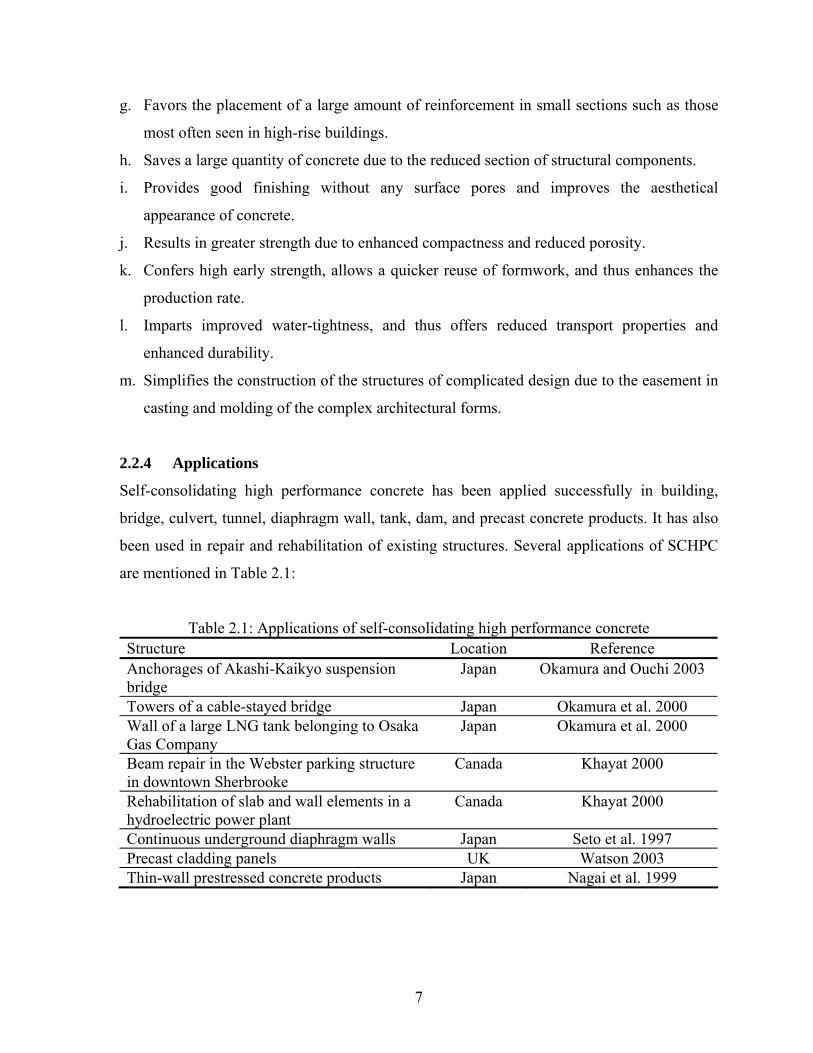
2.2.4 Applications
Self-consolidating high performance concrete has been applied successfully in building,
bridge, culvert, tunnel, diaphragm wall, tank, dam, and precast concrete products. It has also
been used in repair and rehabilitation of existing structures. Several applications of SCHPC
are mentioned in Table 2.1:
Table 2.1: Applications of self-consolidating high performance concrete Structure Location Reference Anchorages of Akashi-Kaikyo suspension bridge
Japan Okamura and Ouchi 2003
Towers of a cable-stayed bridge Japan Okamura et al. 2000 Wall of a large LNG tank belonging to Osaka Gas Company
Japan Okamura et al. 2000
Beam repair in the Webster parking structure in downtown Sherbrooke
Canada Khayat 2000
Rehabilitation of slab and wall elements in a hydroelectric power plant
Canada Khayat 2000
Continuous underground diaphragm walls Japan Seto et al. 1997 Precast cladding panels UK Watson 2003 Thin-wall prestressed concrete products Japan Nagai et al. 1999
7
2.2.5 Economy
The overall material cost of SCHPC is higher than that of ordinary concrete. The cost
involved in quality control is also high in case of SCHPC due to instability problems.
However, the increased cost for materials and quality control can be compensated through
concrete quantity savings and productivity improvement. SCHPC is generally stronger than
ordinary concrete. Therefore, the structural components will be made of thinner sections, and
thus savings can be attained due to a less amount of concrete. The productivity improvement
also reduces the cost involved in formwork. Moreover, SCHPC offers better mechanical and
durability performance and greater service life than ordinary concrete, and hence can be
acceptable over the increased initial cost. If the cost analysis is conducted based on the
lifecycle costing, the cost-effectiveness of SCHPC in construction industry will be apparent.
The use of SCHPC in high-rise building, bridge, offshore platform and other special
structures will be economical over the increased cost of materials and more rigorous quality
control. In fact, the overall cost will be low due to drastic reduction in the geometry of the
structural components, reduced number of laborers, decrease in reinforcement percentage,
ease of conveyance and placement, and reduction in formwork and shoring. Indirect benefits
can also be gained through the durability improvement leading to maintenance savings. The
maintenance and repair costs are expected to be low in SCHPC. Thus, a lot of savings will be
achieved particularly for the large projects if SCHPC is used (Ouchi et al. 2003).
2.3 Background of Self-consolidating High Performance Concrete
The construction of concrete structures needs thorough placement and good consolidation of
fresh concrete to obtain good hardened properties and durability. However, the proper
placement and consolidation were not always achievable with ordinary concretes, even
though placed by skilled laborers. The lack of skilled laborers was also a great concern in
construction industry. Then, the concept of SCHPC first came out in Japan to build durable
concrete structures and to offset the growing shortage of skilled labors.
Okamura and Ozawa (1995) advocated the development of SCHPC in 1986 and
developed the first prototype in 1988. However, the development of SCHPC did not occur
rapidly. The literature shows that self-leveling and segregation-free concretes were produced
using HRWR more than one decade before the development of SCHPC (Collepardi 1976).
8

These concretes were very similar to SCHPC in fluidity, cohesiveness, and low tendency to
segregation. The stability of these concretes was maintained successfully despite the absence
of VEA. However, the precursors of SCHPC were largely dependent of high paste volume.
Therefore, the overall cost was very high and the application remained limited. Thereafter,
the invention of more effective HRWR and VEA made the advent of modern SCHPC
(Collepardi 1994, Khayat and Guizani 1997). The technology of SCHPC has been tailored
and optimized in Japan during last decade. The Japanese concrete industry commercialized
SCHPC under the trade names of “Non-vibrated Concrete,” “Super-quality Concrete,” and
“Biocrete” (Bartos 2000). At the same time, SCHPC has become familiar in North America,
Europe, and other parts of the world (Shah et al. 2002, Wallevik and Nielsson 2003).
2.4 Basic Principles of Self-consolidating High Performance Concrete
SCHPC can be produced by achieving self-consolidation capacity (self-compactability)
through optimum flowing ability (filling ability and passing ability) and optimum segregation
resistance, as illustrated in Figure 2.1. The optimum flowing ability can be obtained by using
HRWR, limited coarse aggregate content, and an increased amount of cementing materials at
low W/B ratio (Dehn et al. 2000, Okamura and Ouchi 2003). Conversely, the optimum
segregation resistance can be attained either by limited coarse aggregate content and
increased cementing materials at low W/B ratio, or by using a VEA (Okamura and Ozawa
1994, Okamura and Ozawa 1995). In addition, the aggregate size influences both flowing
ability and segregation resistance of SCHPC (Bui et al. 2002, Saak et al. 2001). A reduced
aggregate size is preferable to obtain optimum flowing ability (particularly passing ability)
and optimum segregation resistance. The flowing ability and segregation resistance of
SCHPC are also interrelated. Both poor and high segregation resistances may decrease the
flowing ability, whereas a high flowing ability may cause segregation in SCHPC.
The main parameters that influence the flowing ability and segregation resistance of
SCHPC are the volume concentrations of cementing materials and coarse aggregates. The
limited coarse aggregate content and the increased amount of cementing materials at low
W/B ratio result in higher relative distance between aggregate particles. Thus, the frequency
of contact and collision between coarse aggregates decreases during the deformation of
plastic concrete (Okamura et al. 2000). This greatly reduces the internal stress and thus
9

increases the flowing ability of concrete. However, the increased flowing ability tends to
produce very high fluidity with low viscosity, which reduces the segregation resistance of
SCHPC. Therefore, the flowing ability and segregation resistance of fresh SCHPC mixture
must be balanced in such a way so that the self-consolidation capacity is achieved without
any segregation. An adequately viscous paste is required to inhibit the segregation of coarse
aggregates. The optimum segregation resistance with a sufficiently high viscosity hinders the
separation of coarse aggregates from the paste, while maintaining a good flowing ability in
concrete (Okamura and Ozawa 1994). It also prevents coarse aggregates from approaching
each other and thereby eliminates the localized increase in internal stress. The optimum
flowing ability and segregation resistance can be ensured by the proper use of coarse
aggregates, cementing materials with a low W/B ratio, HRWR and VEA.
Self-consolidation
capacity
Optimum segregationresistance
Viscosity-enhancing admixture
High-range water reducer
Optimum flowing ability
Limited coarse aggregate content and reduced aggregate size
Increased cementing materials and low
W/B ratio
Figure 2.1: Basic principles of SCHPC (adapted from Okamura and Ozawa 1995)
10
2.5 Approaches to Obtain Self-consolidating High Performance Concrete
Three approaches have been identified to produce SCHPC:
a. Powder-type SCHPC using limited coarse aggregate content and increased amount of
binder (Okamura and Ouchi 2003): This is achieved by using greater amount of fine
aggregate and cementing material along with HRWR at low W/B ratio.
b. VEA-type SCHPC using VEA (Okamura and Ozawa 1995): A VEA is used with HRWR
without increasing the content of binder or cementing material to produce SCHPC.
c. Combination-type SCHPC using both VEA and increased amount of binder (Shindoh and
Matsuoka 2003): A VEA and an increased amount of cementing material are used with
HRWR at low W/B ratio.
2.6 Flowing Ability of Self-consolidating High Performance Concrete
The flowing ability is a property of fresh SCHPC that allows it to flow into and fill the spaces
within the formwork, or pass through tight openings between reinforcing bars under self-
weight, and without any vibration or any other means of consolidation (EFNARC 2002). The
flowing ability of SCHPC is controlled by its rheological parameters such as yield stress and
plastic viscosity, which can be determined using a rheometer (Geiker et al. 2002) or by
testing the slump, slump flow and slump time of concrete (Chidiac et al. 2000). Nevertheless,
SCHPC exhibits exceptional flowing ability due to its low yield stress and moderate plastic
viscosity (Nehdi et al. 2003a, Khayat 1999). In general, HRWR improves the flowing ability
of SCHPC by reducing the yield stress and plastic viscosity. However, excessive dosage of
HRWR results in very high fluidity that may cause an instability or segregation problem. The
incorporation of a suitable SCM is an option to improve the segregation resistance, and thus
to maintain stability as well as good flowing ability in fresh SCHPC. Most common SCMs
such as silica fume, ground granulated blast-furnace slag, fly ash and limestone filler have
been used to produce SCHPC with a good flowing ability (Lachemi et al. 2003, Okamura and
Ozawa 1994). Similarly, rice husk ash (RHA) can be used in SCHPC. RHA may provide
good benefits through increased plastic viscosity, which is required to prevent segregation in
SCHPC. However, RHA possesses an extremely high specific surface area in comparison to
other SCMs (Zhang and Malhotra 1996). Hence, RHA may cause a flowing ability problem
in SCHPC that can be overcome using an efficient HRWR, such as polycarboxylate
11
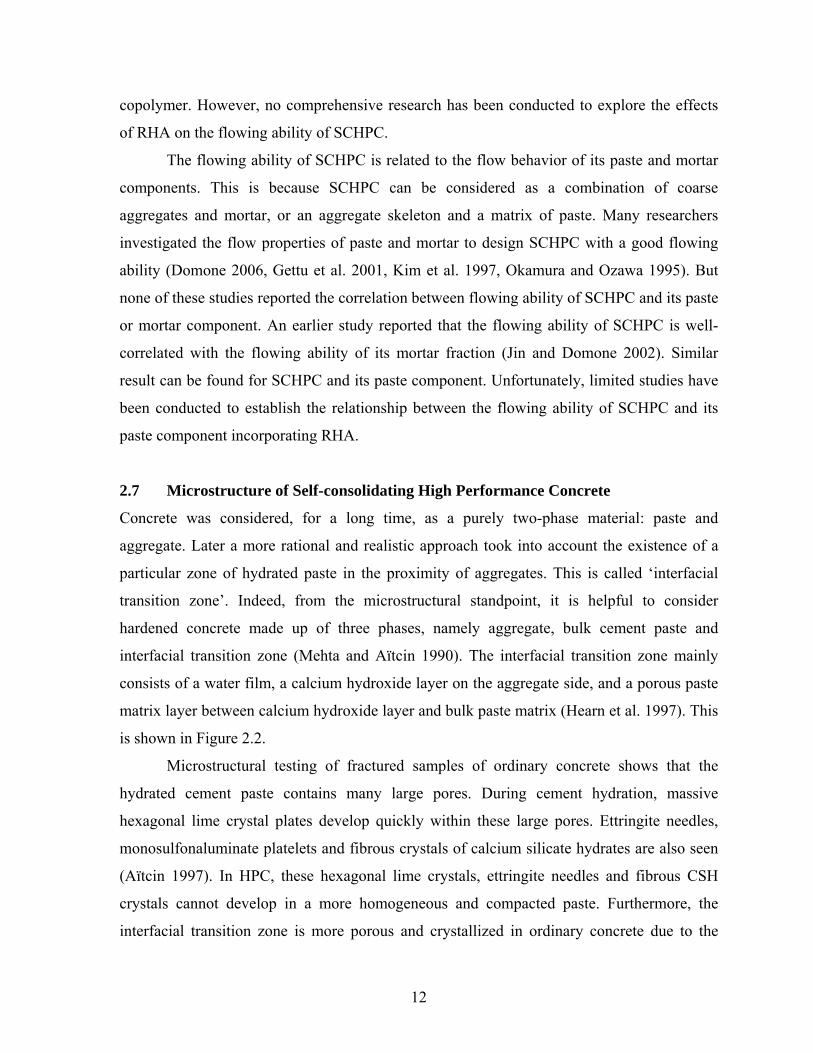
copolymer. However, no comprehensive research has been conducted to explore the effects
of RHA on the flowing ability of SCHPC.
The flowing ability of SCHPC is related to the flow behavior of its paste and mortar
components. This is because SCHPC can be considered as a combination of coarse
aggregates and mortar, or an aggregate skeleton and a matrix of paste. Many researchers
investigated the flow properties of paste and mortar to design SCHPC with a good flowing
ability (Domone 2006, Gettu et al. 2001, Kim et al. 1997, Okamura and Ozawa 1995). But
none of these studies reported the correlation between flowing ability of SCHPC and its paste
or mortar component. An earlier study reported that the flowing ability of SCHPC is well-
correlated with the flowing ability of its mortar fraction (Jin and Domone 2002). Similar
result can be found for SCHPC and its paste component. Unfortunately, limited studies have
been conducted to establish the relationship between the flowing ability of SCHPC and its
paste component incorporating RHA.
2.7 Microstructure of Self-consolidating High Performance Concrete
Concrete was considered, for a long time, as a purely two-phase material: paste and
aggregate. Later a more rational and realistic approach took into account the existence of a
particular zone of hydrated paste in the proximity of aggregates. This is called ‘interfacial
transition zone’. Indeed, from the microstructural standpoint, it is helpful to consider
hardened concrete made up of three phases, namely aggregate, bulk cement paste and
interfacial transition zone (Mehta and Aïtcin 1990). The interfacial transition zone mainly
consists of a water film, a calcium hydroxide layer on the aggregate side, and a porous paste
matrix layer between calcium hydroxide layer and bulk paste matrix (Hearn et al. 1997). This
is shown in Figure 2.2.
Microstructural testing of fractured samples of ordinary concrete shows that the
hydrated cement paste contains many large pores. During cement hydration, massive
hexagonal lime crystal plates develop quickly within these large pores. Ettringite needles,
monosulfonaluminate platelets and fibrous crystals of calcium silicate hydrates are also seen
(Aïtcin 1997). In HPC, these hexagonal lime crystals, ettringite needles and fibrous CSH
crystals cannot develop in a more homogeneous and compacted paste. Furthermore, the
interfacial transition zone is more porous and crystallized in ordinary concrete due to the
12
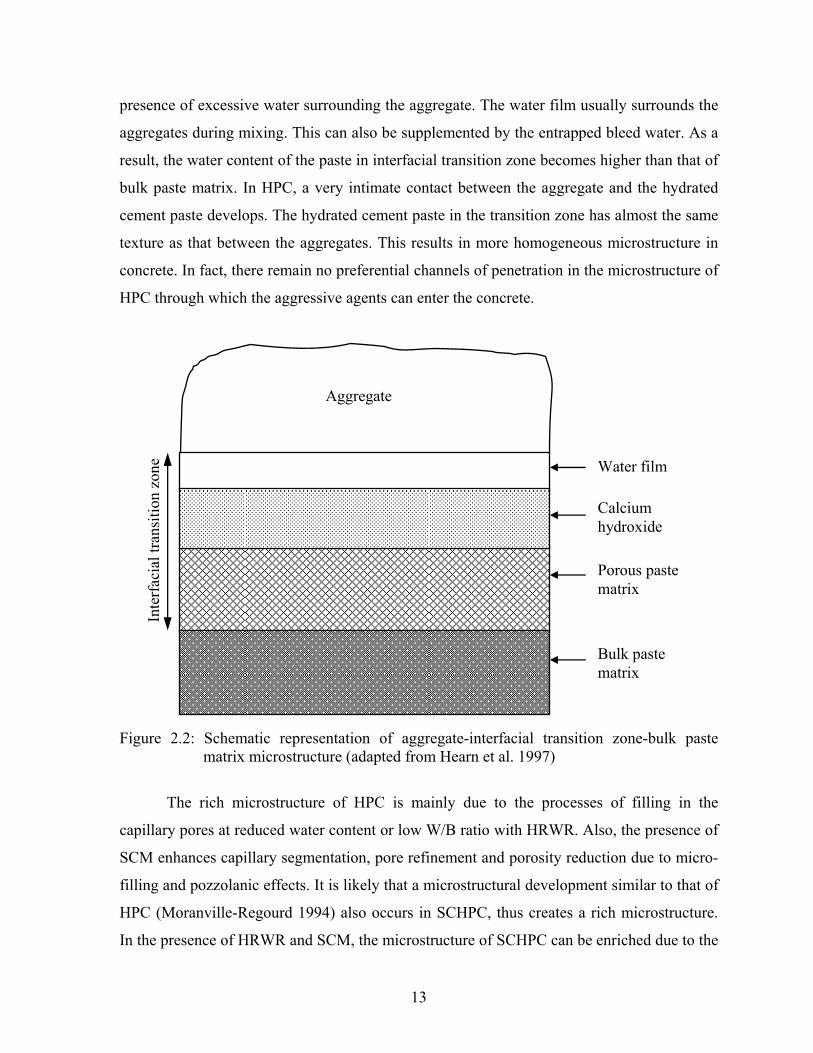
presence of excessive water surrounding the aggregate. The water film usually surrounds the
aggregates during mixing. This can also be supplemented by the entrapped bleed water. As a
result, the water content of the paste in interfacial transition zone becomes higher than that of
bulk paste matrix. In HPC, a very intimate contact between the aggregate and the hydrated
cement paste develops. The hydrated cement paste in the transition zone has almost the same
texture as that between the aggregates. This results in more homogeneous microstructure in
concrete. In fact, there remain no preferential channels of penetration in the microstructure of
HPC through which the aggressive agents can enter the concrete.
Aggregate
Bulk paste matrix
Porous paste matrix
Calcium hydroxide
Water film
Inte
rfac
ial t
rans
ition
zon
e
Figure 2.2: Schematic representation of aggregate-interfacial transition zone-bulk paste
matrix microstructure (adapted from Hearn et al. 1997)
The rich microstructure of HPC is mainly due to the processes of filling in the
capillary pores at reduced water content or low W/B ratio with HRWR. Also, the presence of
SCM enhances capillary segmentation, pore refinement and porosity reduction due to micro-
filling and pozzolanic effects. It is likely that a microstructural development similar to that of
HPC (Moranville-Regourd 1994) also occurs in SCHPC, thus creates a rich microstructure.
In the presence of HRWR and SCM, the microstructure of SCHPC can be enriched due to the
13
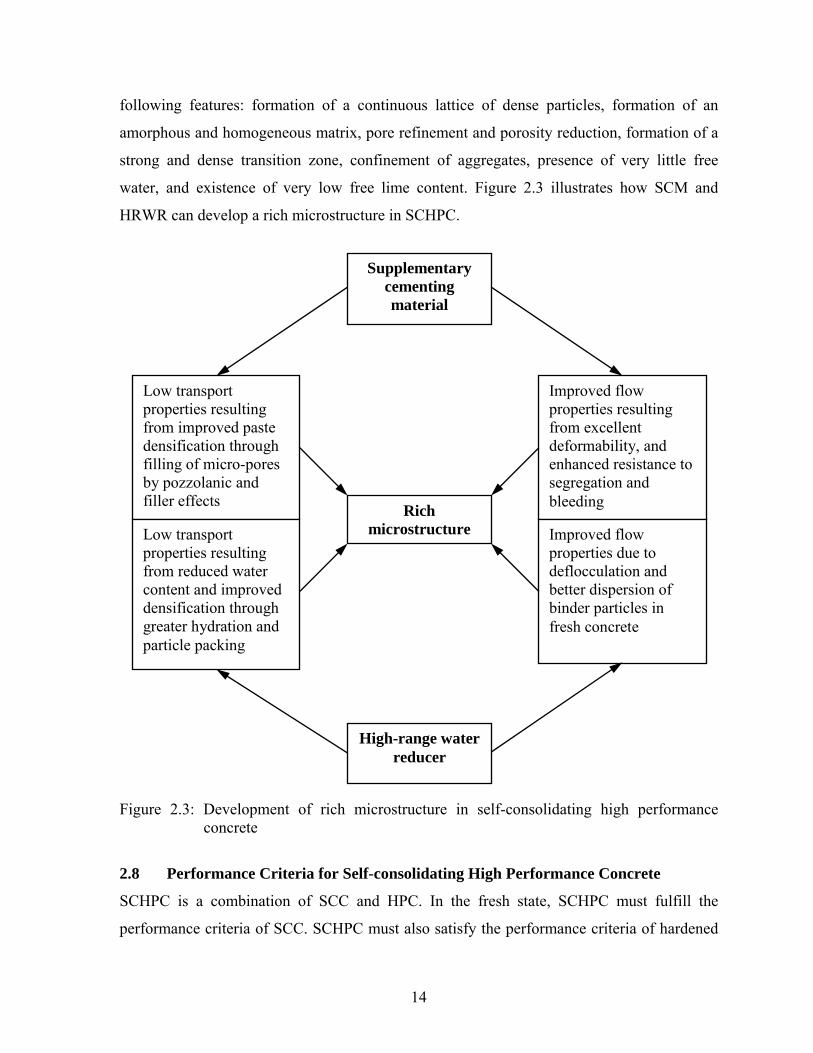
following features: formation of a continuous lattice of dense particles, formation of an
amorphous and homogeneous matrix, pore refinement and porosity reduction, formation of a
strong and dense transition zone, confinement of aggregates, presence of very little free
water, and existence of very low free lime content. Figure 2.3 illustrates how SCM and
HRWR can develop a rich microstructure in SCHPC.
Supplementary cementing material
Rich microstructure
High-range water reducer
Low transport properties resulting from improved paste densification through filling of micro-pores by pozzolanic and filler effects
Improved flow properties resulting from excellent deformability, and enhanced resistance to segregation and bleeding
Low transport properties resulting from reduced water content and improved densification through greater hydration and particle packing
Improved flow properties due to deflocculation and better dispersion of binder particles in fresh concrete
Figure 2.3: Development of rich microstructure in self-consolidating high performance concrete
2.8 Performance Criteria for Self-consolidating High Performance Concrete
SCHPC is a combination of SCC and HPC. In the fresh state, SCHPC must fulfill the
performance criteria of SCC. SCHPC must also satisfy the performance criteria of hardened
14
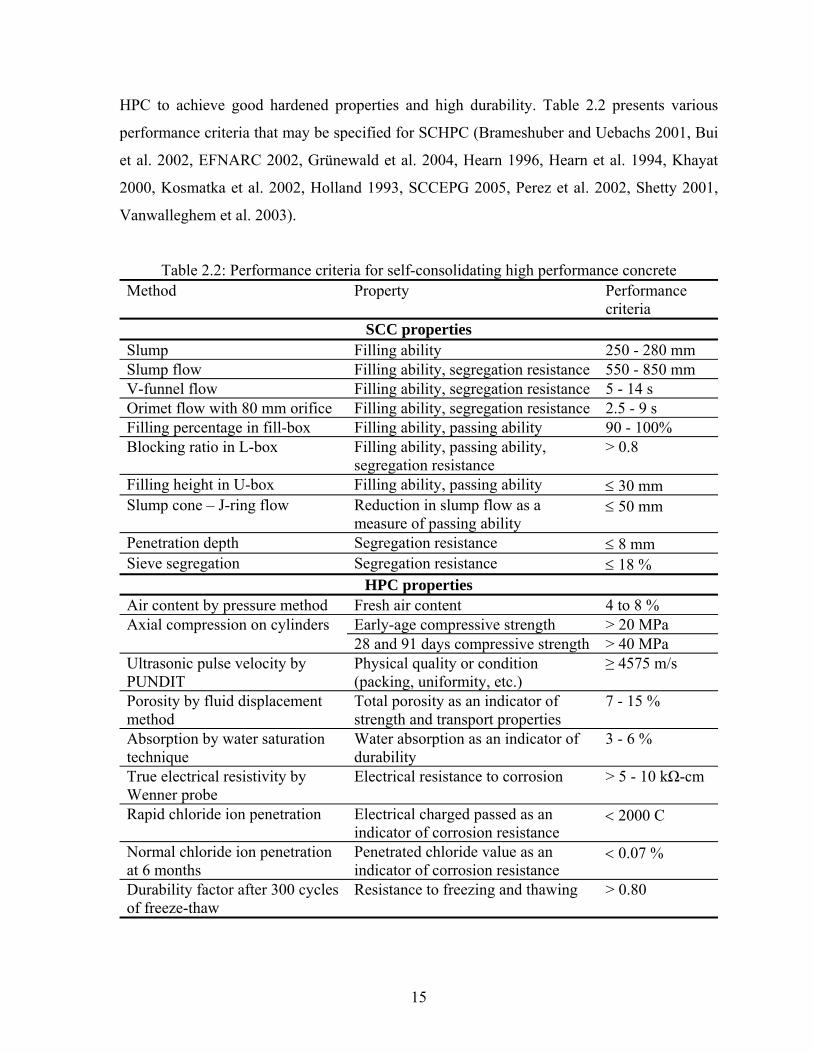
HPC to achieve good hardened properties and high durability. Table 2.2 presents various
performance criteria that may be specified for SCHPC (Brameshuber and Uebachs 2001, Bui
et al. 2002, EFNARC 2002, Grünewald et al. 2004, Hearn 1996, Hearn et al. 1994, Khayat
2000, Kosmatka et al. 2002, Holland 1993, SCCEPG 2005, Perez et al. 2002, Shetty 2001,
Vanwalleghem et al. 2003).
Table 2.2: Performance criteria for self-consolidating high performance concrete Method Property Performance
criteria SCC properties
Slump Filling ability 250 - 280 mm Slump flow Filling ability, segregation resistance 550 - 850 mm V-funnel flow Filling ability, segregation resistance 5 - 14 s Orimet flow with 80 mm orifice Filling ability, segregation resistance 2.5 - 9 s Filling percentage in fill-box Filling ability, passing ability 90 - 100% Blocking ratio in L-box Filling ability, passing ability,
segregation resistance > 0.8
Filling height in U-box Filling ability, passing ability ≤ 30 mm Slump cone – J-ring flow Reduction in slump flow as a
measure of passing ability ≤ 50 mm
Penetration depth Segregation resistance ≤ 8 mm Sieve segregation Segregation resistance ≤ 18 %
HPC properties Air content by pressure method Fresh air content 4 to 8 %
Early-age compressive strength > 20 MPa Axial compression on cylinders 28 and 91 days compressive strength > 40 MPa
Ultrasonic pulse velocity by PUNDIT
Physical quality or condition (packing, uniformity, etc.)
≥ 4575 m/s
Porosity by fluid displacement method
Total porosity as an indicator of strength and transport properties
7 - 15 %
Absorption by water saturation technique
Water absorption as an indicator of durability
3 - 6 %
True electrical resistivity by Wenner probe
Electrical resistance to corrosion > 5 - 10 kΩ-cm
Rapid chloride ion penetration Electrical charged passed as an indicator of corrosion resistance
< 2000 C
Normal chloride ion penetration at 6 months
Penetrated chloride value as an indicator of corrosion resistance
< 0.07 %
Durability factor after 300 cycles of freeze-thaw
Resistance to freezing and thawing > 0.80
15
2.9 Material Aspects for Self-consolidating High Performance Concrete
Self-consolidating high performance concrete consists of cement, aggregates, water, and
chemical admixture and/or SCM. Most common chemical admixtures used for SCHPC are
HRWR, VEA and AEA. Aggregates, cement, water, and HRWR are the principal materials
where as SCM, VEA, AEA, and other chemicals can be used as the optional materials.
The production of SCHPC involves more stringent control on the selection of
constituent materials than ordinary concrete to meet the requirements for fresh and hardened
properties and durability. The reason is that the performance of SCHPC largely depends on
the characteristics of its ingredients. The suitable properties of the constituent materials are
the defining factors to achieve the expected benefits from SCHPC. Indeed, the constituent
materials play important roles when they are combined in concrete. Therefore, suitable
constituent materials should be selected and specifications must be given more enforcement
to produce SCHPC. The following sections briefly illustrate the component materials of
SCHPC emphasizing their properties.
2.9.1 Coarse aggregate
The aggregates retained on the 4.75-mm (No.4) sieve are defined as coarse aggregates
(ASTM C125, 2004). They are granular materials, such as gravel or crushed stone, and are
usually used with fine aggregate and cementing material or binder to produce concrete. As in
any concrete, coarse aggregates are also a key component of SCHPC. Coarse aggregates
significantly influence the performance of SCHPC by affecting the flowing ability,
segregation resistance, and strength of concrete (Noguchi et al. 1999, Okamura and Ozawa
1995, Xie et al. 2002).
2.9.1.1 Physical properties
The physical characteristics such as the size, shape, surface texture, and porosity of coarse
aggregates affect the properties and durability of concrete. The nominal maximum size for
SCHPC can be 20 or 25 mm (Uomoto and Ozawa 1999). However, the smaller size is
preferable to produce higher strength (ACI 211.4R-93, 2004; Kwan 2000) and to reduce
segregation in fresh SCHPC (Bonen and Shah 2005). The shape and texture of coarse
aggregates influence the packing of combined aggregates in SCHPC (Gettu et al. 2001). The
16
shape of the coarse aggregates also considerably affects the properties of SCHPC. Round
aggregates are better than angular aggregates for flowing ability of SCHPC, since they
induce less yield stress and plastic viscosity in concrete mixture due to less inter-particle
friction (Geiker et al. 2002, Mindess et al. 2003). Conversely, rough and angular aggregates
are conducive to high strength and strong interfacial bond due to rough surface texture and
interlocking characteristic (Taylor et al. 1996). But the surface texture, aspect ratio, and
angularity of angular aggregates are not conducive to the flowing ability of SCHPC because
of greater water demand (Xie et al. 2002) and increased yield stress and plastic viscosity
(Geiker et al. 2002). However, the required flowing ability can be maintained in the presence
of HRWR.
The porosity and reactivity of coarse aggregate are also of great concerns for the
durability of SCHPC. Porous aggregates produce less strength and less resistance to freezing
and thawing. Some aggregates may cause alkali-aggregate reactions. Therefore, the selection
of coarse aggregates should be conducted carefully. In general, good quality coarse
aggregates should be used to enhance strength, aggregate-matrix bond, flow properties, and
durability of SCHPC. The ASTM and CSA have specified some physical requirements for
coarse aggregates (ASTM C33, 2004; CSA A23.1, 2004; CSA A23.2, 2004). These
requirements are also applicable for the coarse aggregates to be used in SCHPC.
2.9.1.2 Gradation
The gradation of coarse aggregates affects the flow properties and segregation resistance of
SCHPC. The well-graded coarse aggregates contribute to produce the optimum mixture with
least particle interference (Shilstone, Sr. 1990), and thus enhance the flowing ability and
reduce the tendency of segregation in fresh concrete (Neville 1996). They also improve the
hardened properties and durability of concrete due to dense particle packing (Tasi et al.
2006). In addition, the gradation influences the volume content of the coarse aggregates to be
used in SCHPC. The volume content of coarse aggregates can be increased when they are
well-graded (Okamura and Ozawa 1995). It indicates that a lesser amount of mortar is
required for well-graded coarse aggregates to achieve the target filling ability and passing
ability in SCHPC.
17
The ASTM and CSA (ASTM C33, 2004; CSA A23.1, 2004) have the gradation
requirement for the coarse aggregates to be used in concrete. This gradation requirement is
also applicable for the coarse aggregates to be used in SCHPC. The reports based on the
laboratory and field experience revealed that the coarse aggregates meeting ASTM C 33
(2004) grading specification can contribute to improve the placement, finishing and
durability performance of concrete (Shilstone, Sr. 1990; Shilstone, Sr. and Shilstone, Jr.
1993).
2.9.2 Fine aggregate
Fine aggregates are the second ingredient of aggregate phase in SCHPC. Sand is the most
commonly used fine aggregate for concrete. Fine aggregates pass the 4.75 mm (No. 4) sieve
but are retained on the 75 μm (No. 200) sieve (ASTM C125, 2004). They occupy a greater
volume in SCHPC, as compared to ordinary concrete (Bonen and Shah 2005). Similar to
coarse aggregates, fine aggregates also influence the performance of SCHPC. They increase
the flowing ability and segregation resistance when used at a suitable amount (Okamura and
Ozawa 1995, Su et al. 2002). In addition, they modify the strength of concrete when used in
varying proportion with cement and coarse aggregates (Xie et al. 2002).
2.9.2.1 Physical properties
The physical properties of fine aggregate influence the performance of concrete in fresh and
hardened states. For instance, the particle shape, surface texture, surface area, and void
content affect the mixing water requirement and compressive strength of concrete (ACI
211.4R-93, 2004). Also, the physical characteristics of fine aggregate considerably influence
the mortar flow and thus it may affect the flowing ability of SCHPC (Hu and Wang 2005,
Okamura and Ozawa 1995). The published guidelines show that fine aggregates may produce
more significant effect than coarse aggregates on the fresh properties of SCHPC (SCCEPG
2005). Therefore, the physical properties of fine aggregate should be conducive to the
performance of SCHPC.
The fine aggregates selected for SCHPC should be sharp, angular, chemically inert,
sound, low absorbent, and free from deleterious substances to attain high strength and good
durability. However, the sharp and angular fine aggregates are not beneficial to the flowing
18
ability of SCHPC, since they increase the viscosity of mortar phase (Westerholm 2006). This
adverse effect can be minimized using increased HRWR dosage and reduced fine aggregate
content. Nevertheless, the ASTM and CSA have specified the physical requirements for fine
aggregates (ASTM C33, 2004; CSA A23.1, 2004; CSA A23.2, 2004). These requirements
are also appropriate to select the fine aggregates for SCHPC.
2.9.2.2 Gradation
Gradation of fine aggregates represents the size distribution of particles in the range of 4.75
mm to 150 μm. The gradation of fine aggregates has an effect on the viscosity of mortar, and
thereby on the flowing ability of fresh concrete (Murata and Kikukawa 1992). The poor sand
grading affects the water and cement contents of concrete, and causes most mixing problems
(Shilstone, Sr. and Shilstone, Jr. 2002). In general, the fine aggregates selected for SCHPC
should be well-graded to reduce the paste content (SCCEPG 2005). The well-graded fine
aggregates increase the flow of mortar (Hu and Wang 2005), and hence may improve the
flowing ability of SCHPC. Furthermore, the well-graded fine aggregates contribute to
improve the packing density, and thus the hardened properties and durability of concrete
(Tasi et al. 2006).
The ASTM and CSA (ASTM C33, 2004; CSA A23.1, 2004) have specified the
requirement of fine aggregate grading, which is valid for SCHPC. The laboratory and field
experience showed that the gradation of fine aggregates meeting ASTM C 33 (2004) grading
specification does not adversely affect the quality of concrete (Shilstone, Sr. and Shilstone,
Jr. 1993). The gradation of fine aggregates is usually determined by sieve analysis. It
introduces a parameter known as ‘fineness modulus’ for arriving at satisfactory gradation.
The ‘fineness modulus’ is a ready index of the coarseness or fineness of fine aggregates. The
larger the index, the coarser are the fine aggregates. A fineness modulus in the range of 2.5 to
3.2 is generally recommended for high-strength high performance concrete (ACI 211.4R-93,
2004; Nawy 1996), and can also be used for SCHPC.
2.9.3 Portland cement
Portland cement is most widely used to produce various types of concrete. It is a hydraulic
cement, which is produced by pulverizing clinker consisting of calcium silicates, and usually
19
containing calcium sulfate as an interground addition (ASTM C150, 2004). Portland cement
is also a key component of SCHPC. It is used alone or in combination with SCM to produce
SCHPC. Portland cement improves the flowing ability of SCHPC when used with water to
lubricate the aggregates (Okamura and Ozawa 1995). Portland cement can also affect the
segregation resistance of SCHPC by affecting the density of cement paste matrix of concrete
(Bonen and Shah 2005). After reacting with water, portland cement also reduces the porosity
and results in a packed concrete mass leading to low transport properties and good durability
(Neville 1996).
2.9.3.1 Physical properties
The physical properties of cement significantly influence the performance of concrete. This
is also true for SCHPC. The cement used for SCHPC should have sound flow and setting
properties. It should enhance the fluidity of concrete and should be free from false setting due
to premature stiffening within a few minutes of mixing with water. Also, it should be
compatible with the chemical admixtures such as HRWR, AEA and VEA.
Lump-free fresh cement should be used in SCHPC. The cement should possess
carefully controlled fineness, and should produce low or moderate heat of hydration to
control the volume changes in concrete (Struble and Hawkins 1994). The ASTM and CSA
(ASTM C 150, 2004; CSA A23.1, 2004) have specified the physical property requirements
for various portland cements, which are also useful to choose the proper cement for SCHPC.
2.9.3.2 Chemical composition
The chemical analysis of portland cement has revealed that it mostly consists of various
oxide compounds. The major oxide compounds are lime, silica, alumina, and iron. In
addition, two minor oxides namely sodium and potassium oxides are of some importance,
particularly with regard to alkali-aggregate reactions in concrete. In addition, magnesia and
sulfuric anhydrite can be present, although they are not beneficial constituents of cement.
The typical chemical composition of portland cement is shown in Table 2.3. The ASTM and
CSA (ASTM C 150, 2004; CAN/CSA A3001, 2003) have specified the chemical
requirements for different types of portland cement. These requirements are also beneficial to
select the appropriate cement for SCHPC.
20
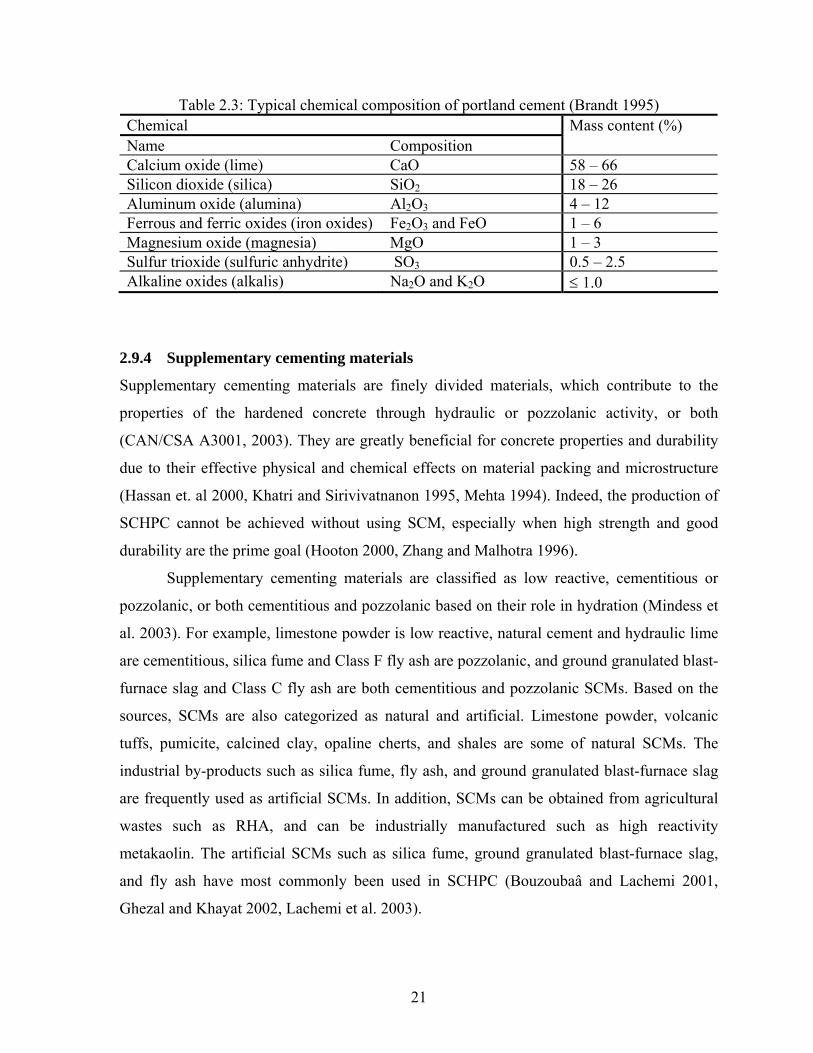
Table 2.3: Typical chemical composition of portland cement (Brandt 1995) Chemical Name Composition
Mass content (%)
Calcium oxide (lime) CaO 58 – 66 Silicon dioxide (silica) SiO2 18 – 26 Aluminum oxide (alumina) Al2O3 4 – 12 Ferrous and ferric oxides (iron oxides) Fe2O3 and FeO 1 – 6 Magnesium oxide (magnesia) MgO 1 – 3 Sulfur trioxide (sulfuric anhydrite) SO3 0.5 – 2.5 Alkaline oxides (alkalis) Na2O and K2O ≤ 1.0
2.9.4 Supplementary cementing materials
Supplementary cementing materials are finely divided materials, which contribute to the
properties of the hardened concrete through hydraulic or pozzolanic activity, or both
(CAN/CSA A3001, 2003). They are greatly beneficial for concrete properties and durability
due to their effective physical and chemical effects on material packing and microstructure
(Hassan et. al 2000, Khatri and Sirivivatnanon 1995, Mehta 1994). Indeed, the production of
SCHPC cannot be achieved without using SCM, especially when high strength and good
durability are the prime goal (Hooton 2000, Zhang and Malhotra 1996).
Supplementary cementing materials are classified as low reactive, cementitious or
pozzolanic, or both cementitious and pozzolanic based on their role in hydration (Mindess et
al. 2003). For example, limestone powder is low reactive, natural cement and hydraulic lime
are cementitious, silica fume and Class F fly ash are pozzolanic, and ground granulated blast-
furnace slag and Class C fly ash are both cementitious and pozzolanic SCMs. Based on the
sources, SCMs are also categorized as natural and artificial. Limestone powder, volcanic
tuffs, pumicite, calcined clay, opaline cherts, and shales are some of natural SCMs. The
industrial by-products such as silica fume, fly ash, and ground granulated blast-furnace slag
are frequently used as artificial SCMs. In addition, SCMs can be obtained from agricultural
wastes such as RHA, and can be industrially manufactured such as high reactivity
metakaolin. The artificial SCMs such as silica fume, ground granulated blast-furnace slag,
and fly ash have most commonly been used in SCHPC (Bouzoubaâ and Lachemi 2001,
Ghezal and Khayat 2002, Lachemi et al. 2003).
21
2.9.4.1 Physical requirements
The ASTM and CSA (ASTM C 618, 2004; ASTM C 989, 2004; ASTM C 1240, 2004;
CAN/CSA A3001, 2003) have specified the physical requirements for natural, and most
artificial SCMs such as silica fume, fly ash and ground granulated blast-furnace slag. These
requirements mainly provide the limits for fineness, expansion or contraction, pozzolanic
activity, uniformity, and reactivity. However, currently there are no ASTM or CSA physical
requirements for RHA. Some of the physical requirements for silica fume given in ASTM C
1240 (2004) can be valid for RHA.
2.9.4.2 Chemical requirements
The ASTM and CSA (ASTM C 618, 2004; ASTM C 989, 2004; ASTM C 1240, 2004;
CAN/CSA A3001, 2003) have specified the chemical requirements for silica fume, fly ash,
ground granulated blast-furnace slag, and natural SCMs. These requirements mostly provide
the limits for several chemical components and igneous loss. At present, there are no ASTM
or CSA chemical requirements for RHA. However, the chemical requirements given for
silica fume might be applicable to RHA due to their comparable chemical composition.
2.9.5 Rice husk ash
Rice husk ash is produced by incinerating the husks of rice paddy. Rice husk is a by-product
of rice milling industry. Controlled incineration of rice husks between 5000C and 8000C
produces non-crystalline amorphous RHA (Mehta and Monteiro 1993, Malhotra 1993). RHA
is whitish or gray in color. The particles of RHA occur in cellular structure with a very high
surface fineness. They have 90% to 95% amorphous silica (Mehta 1992). Due to high silica
content, RHA possesses excellent pozzolanic activity.
2.9.5.1 Physical properties
The physical properties of RHA largely depend on burning conditions. Particularly, the
period and temperature of burning affect the microstructure and characteristics of RHA
(Nagataki 1994). The partial burning of rice husks produces black RHA whereas the
complete burning results in either white or grey RHA (Ismail and Waliuddin 1996). In
addition, the uncontrolled burning at high temperature produces crystalline RHA, which
22
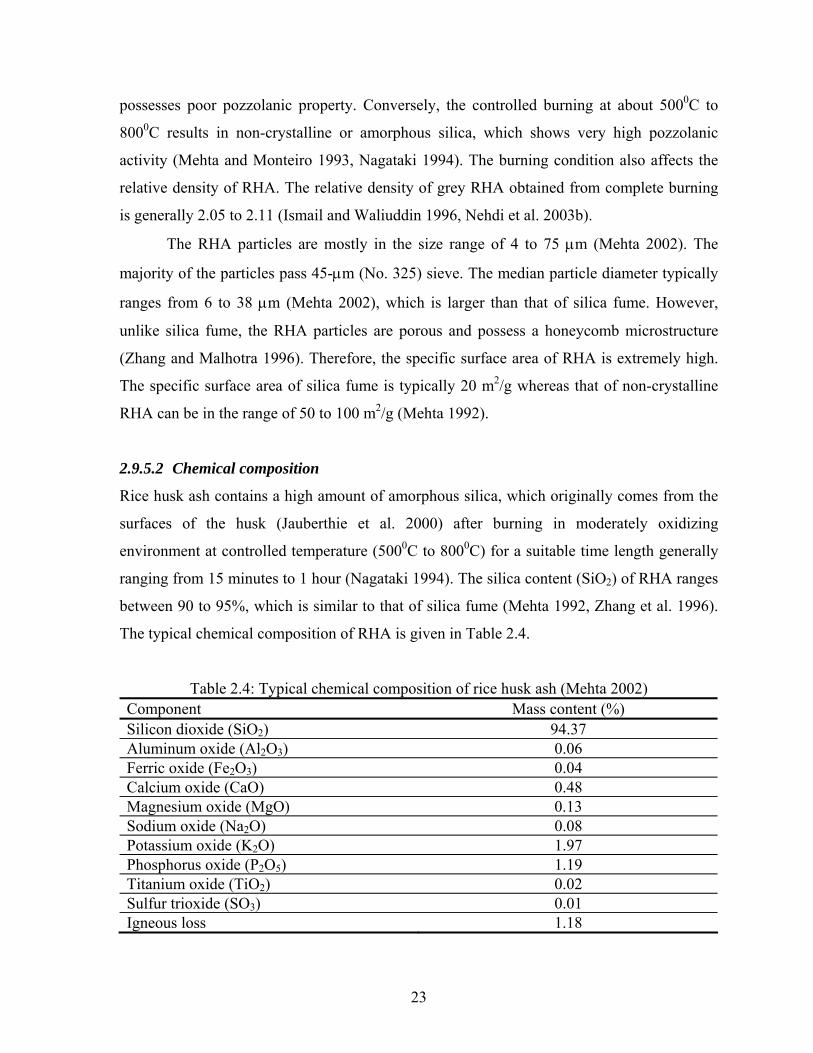
possesses poor pozzolanic property. Conversely, the controlled burning at about 5000C to
8000C results in non-crystalline or amorphous silica, which shows very high pozzolanic
activity (Mehta and Monteiro 1993, Nagataki 1994). The burning condition also affects the
relative density of RHA. The relative density of grey RHA obtained from complete burning
is generally 2.05 to 2.11 (Ismail and Waliuddin 1996, Nehdi et al. 2003b).
The RHA particles are mostly in the size range of 4 to 75 μm (Mehta 2002). The
majority of the particles pass 45-μm (No. 325) sieve. The median particle diameter typically
ranges from 6 to 38 μm (Mehta 2002), which is larger than that of silica fume. However,
unlike silica fume, the RHA particles are porous and possess a honeycomb microstructure
(Zhang and Malhotra 1996). Therefore, the specific surface area of RHA is extremely high.
The specific surface area of silica fume is typically 20 m2/g whereas that of non-crystalline
RHA can be in the range of 50 to 100 m2/g (Mehta 1992).
2.9.5.2 Chemical composition
Rice husk ash contains a high amount of amorphous silica, which originally comes from the
surfaces of the husk (Jauberthie et al. 2000) after burning in moderately oxidizing
environment at controlled temperature (5000C to 8000C) for a suitable time length generally
ranging from 15 minutes to 1 hour (Nagataki 1994). The silica content (SiO2) of RHA ranges
between 90 to 95%, which is similar to that of silica fume (Mehta 1992, Zhang et al. 1996).
The typical chemical composition of RHA is given in Table 2.4.
Table 2.4: Typical chemical composition of rice husk ash (Mehta 2002) Component Mass content (%) Silicon dioxide (SiO2) 94.37 Aluminum oxide (Al2O3) 0.06 Ferric oxide (Fe2O3) 0.04 Calcium oxide (CaO) 0.48 Magnesium oxide (MgO) 0.13 Sodium oxide (Na2O) 0.08 Potassium oxide (K2O) 1.97 Phosphorus oxide (P2O5) 1.19 Titanium oxide (TiO2) 0.02 Sulfur trioxide (SO3) 0.01 Igneous loss 1.18
23

2.9.5.3 Role in concretes
The role of RHA in SCHPC is the same as that in any other concretes. In concrete, the RHA
mainly serves as a microfiller, pozzolan, and viscosity modifier. The RHA particles can fill
the voids between the larger cement grains because of their smaller size, as shown in Figure
2.4. However, the microfilling ability of RHA is not as effective as silica fume. This is
because the RHA particles are much larger than the silica fume particles. The typical median
particle size of RHA is about 7 μm, while that of the cement and silica fume is 13 μm and 0.1
μm, respectively (Mehta 1994, Zhang and Malhotra 1996). Although RHA is not very fine in
particle size, it behaves as a very reactive pozzolanic material because of its extreme surface
fineness and high silica content (Mehta 1992, Mehta 1994). In the presence of water, the
RHA actively reacts with Ca(OH)2 liberated during cement hydration (pozzolanic reaction)
and produces additional calcium silicate hydrate (CSH), as shown in Equation 2.1 and
Equation 2.2.
Water + HRWR
Cement grain
Cement grain RHA particle
Physical packing in presence of cement alone
Physical packing in presence of cement and RHA
Water + HRWR
Figure 2.4: Microfilling effect of RHA
24
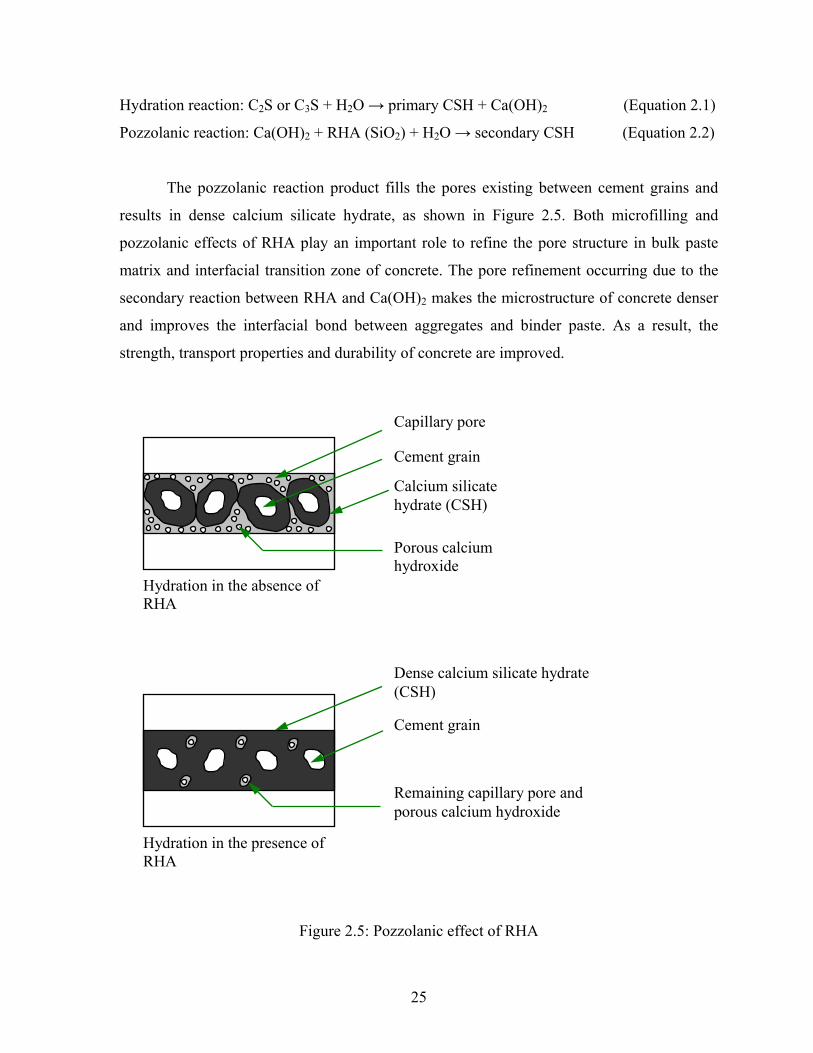
Hydration reaction: C2S or C3S + H2O → primary CSH + Ca(OH)2 (Equation 2.1)
Pozzolanic reaction: Ca(OH)2 + RHA (SiO2) + H2O → secondary CSH (Equation 2.2)
The pozzolanic reaction product fills the pores existing between cement grains and
results in dense calcium silicate hydrate, as shown in Figure 2.5. Both microfilling and
pozzolanic effects of RHA play an important role to refine the pore structure in bulk paste
matrix and interfacial transition zone of concrete. The pore refinement occurring due to the
secondary reaction between RHA and Ca(OH)2 makes the microstructure of concrete denser
and improves the interfacial bond between aggregates and binder paste. As a result, the
strength, transport properties and durability of concrete are improved.
Capillary pore
Cement grain
Calcium silicate hydrate (CSH)
Cement grain
Dense calcium silicate hydrate (CSH)
Porous calcium hydroxide
Remaining capillary pore and porous calcium hydroxide
Hydration in the absence of RHA
Hydration in the presence of RHA
Figure 2.5: Pozzolanic effect of RHA
25
Similar to silica fume, the RHA can also act as a viscosity modifier (Rixom and
Mailvaganam 1999). Due to extreme surface fineness, it increases the water-retaining
capacity, and thus enhances the viscosity of concrete mixture.
2.9.5.4 Use in self-consolidating high performance concretes
The use of RHA in concrete was accelerated after Mehta’s findings in 1973 (Mehta 1992).
During the last two decades, RHA has been used to produce high strength and high
performance concretes in many countries including Canada (Mahmud et al. 2004, Mehta
1992, Zhang and Malhotra 1996). In USA and Canada, RHA has been competently used to
protect concrete structures from chloride attack (Mehta 1992, Zhang et al. 1996). Also, it has
been used recently in Canada, as a part of composite cement to produce normal-strength SCC
(Nehdi et al. 2004). However, the use of RHA to produce SCHPC has not been reported.
2.9.6 Water
Water is the readily available most important component of SCHPC. The hydration of
cement can take place only in the presence of water. Adequate water is required for the
hydration of cement, leading to the formation of paste to bind the aggregates. In addition,
water is required in conjunction with HRWR to achieve the self-consolidation capacity of
SCHPC (Okamura and Ozawa 1995). It contributes to attain good flowing ability of SCHPC
by lubricating the fine and coarse aggregates.
2.9.6.1 Physical quality
Water intended for use in concrete should be clean, fresh and free of deleterious substances.
Water containing harmful substances such as silts, suspended particles, organic matter, oil, or
sugar can unfavorably affect the strength and setting properties of cement and disrupt the
affinity between aggregate and cement paste (Nawy 1996). Therefore, the suitability of water
should be examined before use. As a rule, any water with a silt content below 2000 mg/L is
suitable for use in concrete (Shetty 2001). In general, the potable or drinkable water is safe
for use in concrete. However, the criterion of potability is not absolute. Water not fit for
drinking may also be used satisfactorily in making concrete.
26
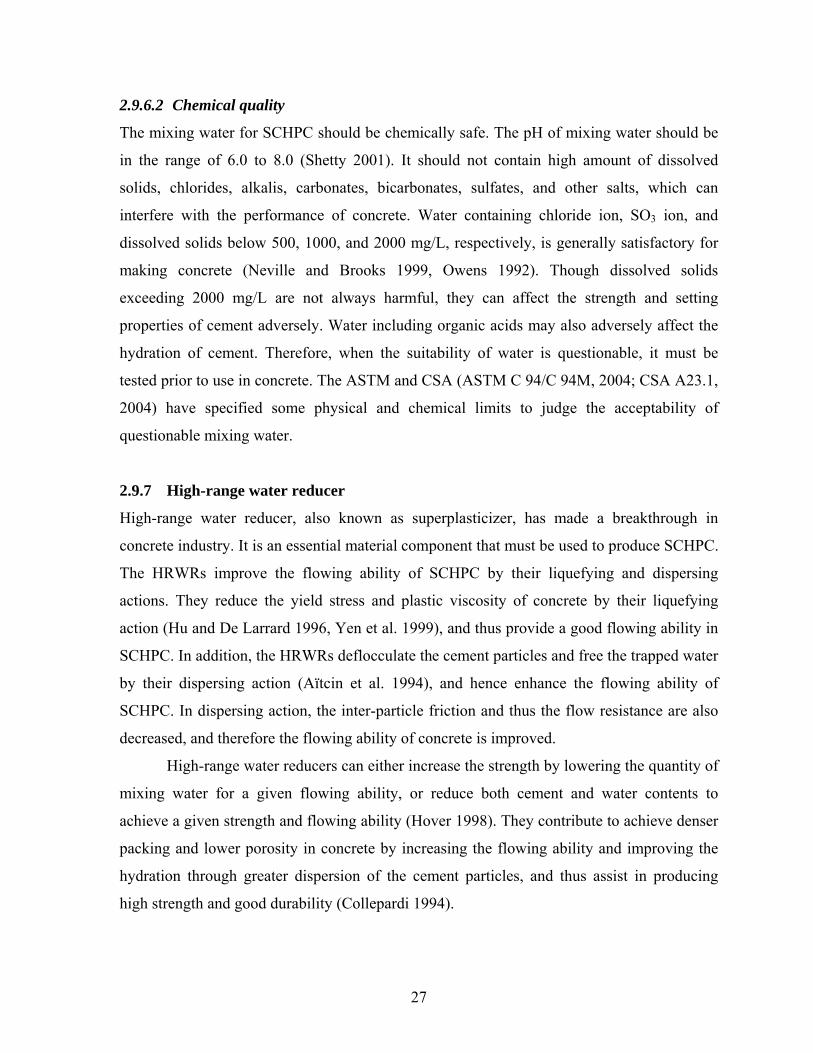
2.9.6.2 Chemical quality
The mixing water for SCHPC should be chemically safe. The pH of mixing water should be
in the range of 6.0 to 8.0 (Shetty 2001). It should not contain high amount of dissolved
solids, chlorides, alkalis, carbonates, bicarbonates, sulfates, and other salts, which can
interfere with the performance of concrete. Water containing chloride ion, SO3 ion, and
dissolved solids below 500, 1000, and 2000 mg/L, respectively, is generally satisfactory for
making concrete (Neville and Brooks 1999, Owens 1992). Though dissolved solids
exceeding 2000 mg/L are not always harmful, they can affect the strength and setting
properties of cement adversely. Water including organic acids may also adversely affect the
hydration of cement. Therefore, when the suitability of water is questionable, it must be
tested prior to use in concrete. The ASTM and CSA (ASTM C 94/C 94M, 2004; CSA A23.1,
2004) have specified some physical and chemical limits to judge the acceptability of
questionable mixing water.
2.9.7 High-range water reducer
High-range water reducer, also known as superplasticizer, has made a breakthrough in
concrete industry. It is an essential material component that must be used to produce SCHPC.
The HRWRs improve the flowing ability of SCHPC by their liquefying and dispersing
actions. They reduce the yield stress and plastic viscosity of concrete by their liquefying
action (Hu and De Larrard 1996, Yen et al. 1999), and thus provide a good flowing ability in
SCHPC. In addition, the HRWRs deflocculate the cement particles and free the trapped water
by their dispersing action (Aïtcin et al. 1994), and hence enhance the flowing ability of
SCHPC. In dispersing action, the inter-particle friction and thus the flow resistance are also
decreased, and therefore the flowing ability of concrete is improved.
High-range water reducers can either increase the strength by lowering the quantity of
mixing water for a given flowing ability, or reduce both cement and water contents to
achieve a given strength and flowing ability (Hover 1998). They contribute to achieve denser
packing and lower porosity in concrete by increasing the flowing ability and improving the
hydration through greater dispersion of the cement particles, and thus assist in producing
high strength and good durability (Collepardi 1994).
27

There are mainly four categories of HRWR (Neville 1996, Mindess et al. 2003). They
are sulfonated melamine-formaldehyde condensates, sulfonated naphthalene-formaldehyde
condensates, modified lignosulfonates, and carboxylated acrylic ester copolymers or
polycarboxylates.
2.9.7.1 Physical properties
High-range water reducers are generally formulated to produce high plasticity, normal-
setting characteristics, and accelerated strengths in concrete. HRWRs are usually available in
clear to dark brown liquid form but also obtainable in solid state as a brownish powder. They
usually possess a viscosity in the range of 60 to 80 centipoises, and a solid content varying
from 22 to 42% by weight (Aïtcin 1998). Also, the relative density of HRWR is near to that
of water and hence it can be easily dispersed with water.
A particular type of HRWR can be used as a singular admixture or as a component in
an admixture system, but it must fulfill some physical requirements and should be compatible
with cementing materials for good performance in concrete. The ASTM has specified some
physical requirements for HRWR (ASTM C 494/C 494M, 2004).
2.9.7.2 Chemical structure
Polycarboxylate HRWRs are generally used to produce SCHPC. They are produced from the
relevant monomers by a free radical mechanism. The molecular structure of polycarboxylate
HRWRs consists of a main chain and a graft chain. The main chain contains carboxylate
groups (COO-) while the graft chain comprises ethylene oxide (EO). The chemical structure
of polycarboxylate HRWRs is shown in Figure 2.6.
2.9.7.3 Mechanisms of water reduction
High-range water reducers prevent the formation of cement-water agglomeration in concrete
mixture and disperse the cement particles in aqueous phase, as can be seen from Figures 2.7
and 2.8. Thus, the water demand of concrete mixture is significantly reduced. HRWRs can
exert the water-reducing action by two mechanisms, known as electrical and steric
repulsions.
28
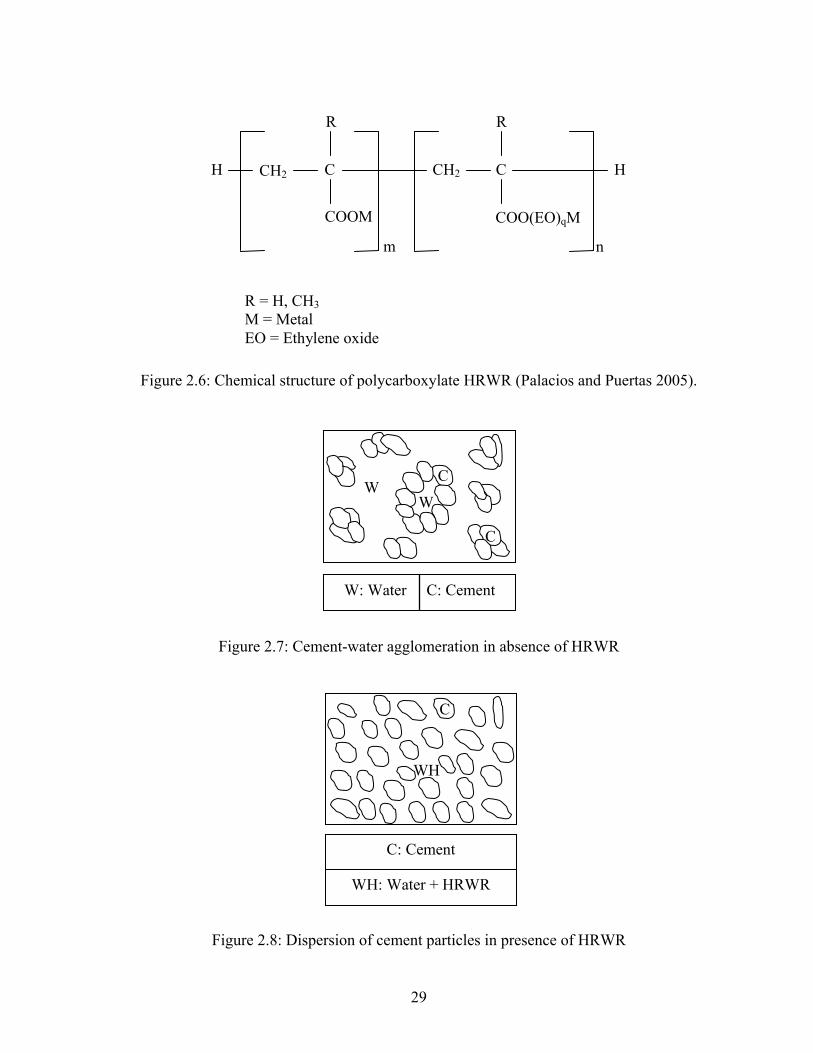
COO(EO)qM
n
C H
R = H, CH3 M = Metal EO = Ethylene oxide
CH2
R
COOM
CH2 C
m
R
H
Figure 2.6: Chemical structure of polycarboxylate HRWR (Palacios and Puertas 2005).
W
C
W
C
W: Water C: Cement
Figure 2.7: Cement-water agglomeration in absence of HRWR
Figure 2.8: Dispersion of cement particles in presence of HRWR
WH
C
C: Cement
WH: Water + HRWR
29
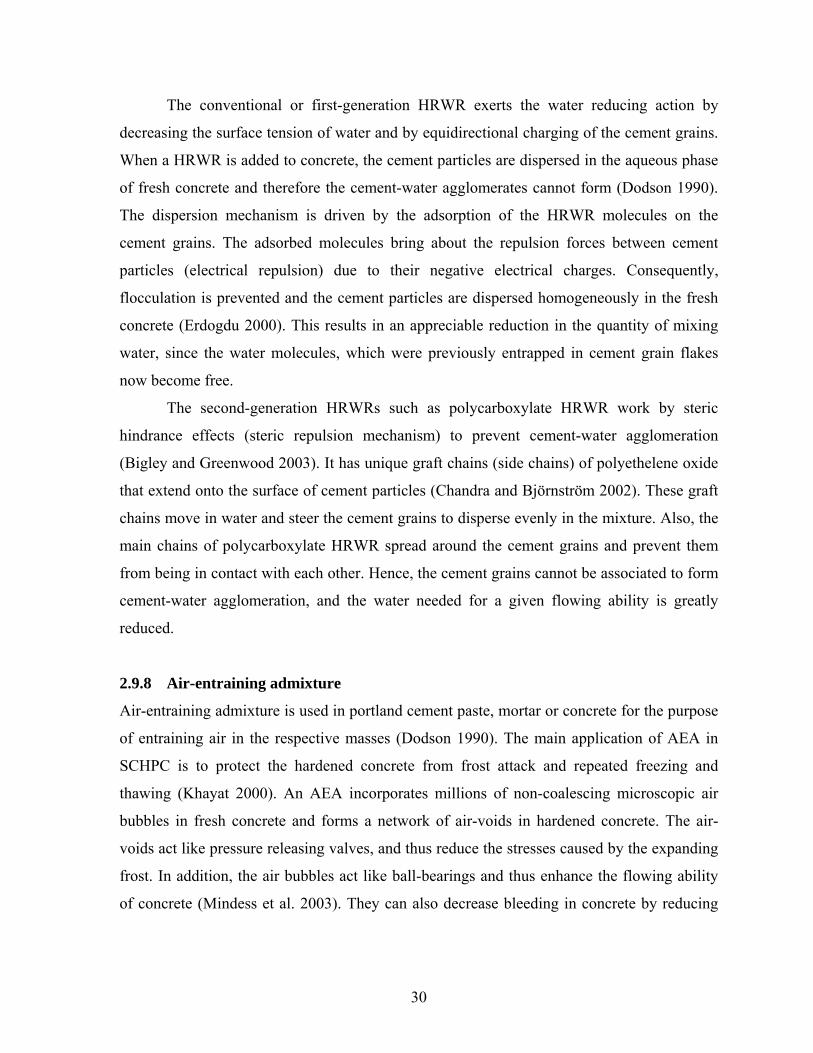
The conventional or first-generation HRWR exerts the water reducing action by
decreasing the surface tension of water and by equidirectional charging of the cement grains.
When a HRWR is added to concrete, the cement particles are dispersed in the aqueous phase
of fresh concrete and therefore the cement-water agglomerates cannot form (Dodson 1990).
The dispersion mechanism is driven by the adsorption of the HRWR molecules on the
cement grains. The adsorbed molecules bring about the repulsion forces between cement
particles (electrical repulsion) due to their negative electrical charges. Consequently,
flocculation is prevented and the cement particles are dispersed homogeneously in the fresh
concrete (Erdogdu 2000). This results in an appreciable reduction in the quantity of mixing
water, since the water molecules, which were previously entrapped in cement grain flakes
now become free.
The second-generation HRWRs such as polycarboxylate HRWR work by steric
hindrance effects (steric repulsion mechanism) to prevent cement-water agglomeration
(Bigley and Greenwood 2003). It has unique graft chains (side chains) of polyethelene oxide
that extend onto the surface of cement particles (Chandra and Björnström 2002). These graft
chains move in water and steer the cement grains to disperse evenly in the mixture. Also, the
main chains of polycarboxylate HRWR spread around the cement grains and prevent them
from being in contact with each other. Hence, the cement grains cannot be associated to form
cement-water agglomeration, and the water needed for a given flowing ability is greatly
reduced.
2.9.8 Air-entraining admixture
Air-entraining admixture is used in portland cement paste, mortar or concrete for the purpose
of entraining air in the respective masses (Dodson 1990). The main application of AEA in
SCHPC is to protect the hardened concrete from frost attack and repeated freezing and
thawing (Khayat 2000). An AEA incorporates millions of non-coalescing microscopic air
bubbles in fresh concrete and forms a network of air-voids in hardened concrete. The air-
voids act like pressure releasing valves, and thus reduce the stresses caused by the expanding
frost. In addition, the air bubbles act like ball-bearings and thus enhance the flowing ability
of concrete (Mindess et al. 2003). They can also decrease bleeding in concrete by reducing
30
the differential movement of water (Shetty 2001). However, they may reduce the segregation
resistance of SCHPC by affecting the plastic viscosity of concrete (Khayat 2000).
2.9.8.1 Physical properties
Air-entraining admixture is generally formulated in liquid form. The relative density of AEA
is closer to that of water. It is also soluble in water. Hence, the dispersion of AEA in concrete
is enhanced when used with the mixing water. Also, most AEAs are not totally evaporable.
They contain some solids. The solid content depends on the type of AEA. It usually varies in
the range of 5% to 20% by weight (Rixom and Mailvaganam 1999).
The AEA intended for use in concrete must be compatible with other admixtures such
as HRWR and VEA. The ASTM has specified several physical requirements for AEA to
ensure its good performance in concretes (ASTM C 260, 2004).
2.9.8.2 Chemical properties
The chemical properties of AEAs depend on the raw materials from which they are made up.
The AEA are usually formulated from neutralized wood resins, fatty-acid salts, alkyl-aryl
sulfonates, alkyl sulfates and phenol ethoxylates (Rixom and Mailvaganam 1999). They can
be anionic, cationic and non-ionic. However, most of the modern AEAs are anionic in
character. They impart much better stability to the entrained air-voids.
The commercially available AEAs generally contain no chloride and possess a higher
pH, thus do not promote corrosion of reinforcing steel in concrete. Also, they usually do not
have any volatile organic compounds. However, currently there is no standard specification
for the chemical requirements of AEA.
2.9.8.3 Mechanism of air entrainment
The mechanism of air entrainment can be explained by the thermodynamics of air bubble
coalescence in aqueous phase of fresh concrete. The stability of air bubbles in fresh non-air
entrained concrete largely depends on air pressure within the bubble and the solubility of air
in surrounding aqueous phase (Dodson 1990). The extent of pressure inside the air bubbles is
defined by the surface tension of cement solution and the diameter of the bubbles. The
pressure within the air bubbles and their diameter are inversely related. The pressure inside
31
the bubbles is higher when the diameter is smaller. Again, the higher the pressure, the greater
is the solubility of the air bubbles in the surrounding aqueous phase. Consequently, the
process of air dissolution occurs in the proximity of the smaller bubbles. Hence, the smaller
air bubbles tend to become even smaller and eventually disappear. The dissolution of air
from the smaller bubbles causes an equivalent amount of air to enter the larger bubbles
undergoing less pressure. As a result, the larger bubbles become larger at the expense of the
smaller ones and get out of the concrete mixture.
The normal thermodynamics of air bubble coalescence is impeded in the presence of
AEA. When an AEA is added to the concrete, it forms a coating at the interface of air bubble
and aqueous phase. The stability of air-voids largely depends on the solubility of this coating.
If the coating is insoluble and sufficiently elastic, it resists internal and external pressures in
its environment, and inhibits the transmission of air from air bubble to aqueous phase
(Dodson 1990). Most AEAs are predominantly anionic surfactants, which form an insoluble
coating across air-void/aqueous phase interface (Rixom and Mailvaganam 1999). Thus, the
air bubbles do not deteriorate with time. This means the air entrainment becomes stable in
concrete mixture.
2.9.9 Viscosity-enhancing admixture
Viscosity-enhancing admixture is relatively a new addition to the family of admixtures for
cement paste, mortar and concrete. The common application of VEA is to produce non-
dispersible underwater concrete and SCHPC. VEA improves the viscosity and cohesion of
fresh concrete, and thus reduces the bleeding, surface settlement and aggregate sedimentation
resulting in a more stable and uniform fresh concrete (Khayat and Guizani 1997). In addition,
VEA makes the fresh concrete more robust and less sensitive to the small variations in the
conditions and proportions of other constituent materials (SCCEPG 2005).
Rixom and Mailvaganam (1999) have categorized the VEAs into five classes based
on their physical actions in concrete. The classification is as follows:
Class A: Water-soluble synthetic and natural organic polymers, which increase the
viscosity of concrete by increasing the viscosity of mixing water.
Class B: Organic water-soluble flocculants, which increase the viscosity of concrete
by enhancing interparticle attraction between cement particles.
32
Class C: Emulsions of various organic materials, which improve the viscosity of
concrete by increasing interparticle attraction and supplying additional superfine particles in
the cement paste.
Class D: Water-swellable inorganic materials of high surface area that improve the
viscosity of concrete by increasing the water-retaining capacity of the concrete.
Class E: Inorganic materials of high surface area that improve the viscosity of
concrete by increasing the content of fine particles in concrete, and thereby resulting in
greater thixotropy.
Most widely used VEAs for concrete are of Class A (Khayat 1998, Rixom and
Mailvaganam 1999). The VEAs under this class can be further subdivided into natural, semi-
synthetic and synthetic polymers.
2.9.9.1 Physical properties
The most common VEAs are water soluble. They are available in liquid form. They are
generally lighter than other chemical admixtures such as HRWR and AEA with a relative
density very close to that of water. They also contain a very small amount of solids, as
compared to HRWR and AEA. Currently, there is no ASTM or CSA standard specification
providing any physical requirements for VEA. Nevertheless, the VEAs should be compatible
with other chemical admixtures, particularly HRWR, to produce cohesive yet highly
flowable concrete mixtures (Mailvaganam 1994).
2.9.9.2 Chemical properties
The chemical properties of VEA vary depending on the type of admixture. The water-soluble
synthetic and natural organic polymers (Class A VEA) are mostly used in concrete. The
primary structure of Class A VEAs is built with a carbon backbone with side chains. The
backbone is composed of six-carbon chains. Such chemical structure results in a high
molecular weight and contributes to increase the viscosity of solution when used in concrete
(Rixom and Mailvaganam 1999).
Most commercially available VEAs can be categorized under Class A. The Class A
VEAs are more tolerant of salts and cations. They are also stable to the changes in pH and
temperature. In addition, they contained no chloride and volatile organic compounds. Thus,
33
they are expected to cause no adverse effects on the properties and durability of concrete.
However, presently there is no standard specification for the chemical requirements of VEA.
2.9.9.3 Mechanisms of viscosity enhancement
The mechanism of viscosity enhancement depends on the type of VEA. The VEAs under
Class A work through the mechanisms of adsorption, association and intertwining (Khayat
1998). In adsorption, the long-chain polymer molecules adsorb and fix a part of the mixing
water (Okamura and Ozawa 1995), and thus expand by adhering to the periphery of water
molecules. As a result, the free movement of water molecules is obstructed, and the viscosity
of the mixing water and that of the concrete mixture are increased. In association, the
molecules of adjacent polymer chains develop attractive forces that further obstruct water
movement and form a gel, resulting in an increase in the viscosity of concrete. In addition,
the polymer chains can intertwine and entangle, resulting in an increase in the viscosity of the
concrete mixture. However, such intertwining and entanglement depends on the
concentration of VEA and deformation or shear rate of concrete.
2.10 Mixture Design for Self-consolidating High Performance Concrete
The mixture design of SCHPC is different from that of ordinary concrete. In general,
compressive strength is the primary criterion for designing ordinary concrete. Conversely,
the flowing ability and durability must be given equal importance with the compressive
strength in designing SCHPC. Thus, a different design approach is needed for SCHPC.
2.10.1 Justification for a different method of mixture design
The process of mixture design for ordinary concrete is not applicable to SCHPC for the
following reasons:
a. Established relationships between average and specified compressive strengths of
ordinary concrete could be unacceptable for SCHPC possessing high strength.
b. Traditional curves for the relationship between W/B ratio and compressive strength could
be misleading for SCHPC that needs a lower W/B ratio.
c. None of the traditional curves for W/B ratio and strength relationship accounts for the
effect of SCM, HRWR, and VEA, which are usually used to produce SCHPC.
34
d. The coarse aggregate content of ordinary concrete is relatively high and unsuitable for
SCHPC.
e. The fine aggregate content obtained from traditional method is generally much lower
than that recommended for SCHPC.
f. The approximate water content of concrete mixture does not include the effects of SCM
and HRWR, which are usually incorporated in SCHPC.
g. Slump alone is no longer a performance criterion for the flowing ability of SCHPC.
The aggregate content, the incorporation of SCM, and the presence of various
chemical admixtures may have a significant influence on the flow characteristics, strength,
transport properties and durability of SCHPC. Therefore, a different design approach should
be followed, instead of traditional method, to design the mixture composition of SCHPC.
2.10.2 Current methods of mixture design
The mixture design method proposed by Okamura and Ozawa (1995) has mostly been used
in Japan. The Japanese Ready-mixed Concrete Association (JRMCA) has simplified this
method to standardize the mixture proportioning process of SCHPC in Japan (Su et al. 2001).
Okamura and Ozawa’s method has also been using in many countries of Europe with some
modifications (EFNARC 2002, SCCEPG 2005). In this method, the coarse and fine
aggregate contents are fixed and the self-consolidation capacity is achieved just by modifying
the W/B ratio and HRWR dosage. The disadvantage of this method is that the W/B ratio
cannot be fixed based on the strength requirement since it has to be decided through
achieving the self-consolidation capacity. Therefore, the W/B ratio fixed on the basis of self-
consolidation capacity may not provide the expected strength. In addition, it may take many
trial mixtures to fix the proper W/B ratio and HRWR dosage, as these two must be balanced
to provide optimum flowing ability and segregation resistance unless a VEA is used.
In North America, there is no ACI or CSA standard mixture design method for
SCHPC. The ACI is currently working to develop a mixture design procedure for SCC (ACI
Committee 211H, 2006). Recently, the International Centre for Aggregates Research (ICAR)
in the University of Texas at Austin has developed a mixture design for SCC (Koehler and
Fowler 2006). This method emphasizes to satisfy the criteria of filling ability, passing ability
and segregation resistance, but does not give equal importance on strength and durability. For
35

example, it allows a W/B ≥ 0.45, which is not suitable to achieve high strength and good
durability. Therefore, this method may not be valid for SCHPC. Saak et al. (2001) have also
introduced a design methodology for SCC, assuming that the rheology and density of paste
matrix dictate the flowing ability and segregation resistance of concrete. This methodology
highlights how the segregation can be controlled in SCC, but it does not clearly explain how
the aggregate characteristics and content influence the filling ability and passing ability of
concrete. In addition, it does not give any clear guidelines for obtaining high strength and
improved transport properties or durability. Nevertheless, the concrete industry is exploiting
Shilstone’s method to produce SCHPC (Monroe 2004). This mixture design method is based
on aggregate particle distribution and several parameters for workability, coarseness and
mortar fraction (Shilstone, Sr. 1990). The self-consolidation capacity can be obtained by
adjusting the workability and coarseness parameters, and by fixing the water content and
HRWR dosage based on trial mixtures. The mortar factor is useful to judge the water content
and the quantity of cement. In addition, the aggregate particle distribution facilitates to
provide the optimum graded mixture. Above all, this method concentrates on the gradation of
aggregates and aggregate blend but does not discuss the effect of coarse aggregate content,
and the role of cementing materials and chemical admixtures.
In China, Kwan (2000) developed a mixture design method for SCHPC incorporating
silica fume. This method shows the process of getting SCHPC with a mean 28-day cube
strength greater than 80 MPa and a slump above 200 mm. It uses a W/B ratio and strength
relationship, which is different from that of ordinary concrete. But it fixes the dosage of
HRWR at 3% by weight of binder, which may not be practical for any other SCHPC.
Another mixture design method for SCHPC has been developed in China (Xie et al. 2002). It
is specific to SCHPC incorporating ultra-pulverized fly ash. This method employs the
fineness of ultra-pulverized fly ash and the optimum HRWR dosage to assess the flowing
ability SCHPC. It includes a very high content of cementing material, which is not cost-
effective. This method also uses relatively a high coarse aggregate content, which is not
favorable for good passing ability.
In Taiwan, a mixture design method has been developed based on the concept of
aggregate packing factor (Su et al. 2001). This method can predetermine the amount of SCM
and the dosage of HRWR although they may need to be adjusted by trial mixtures. In this
36
method, the fine aggregate content is high, which enhances the filling ability and passing
ability but reduces the compressive strength. Also, this method assumes that the relationship
between compressive strength and W/B ratio is similar to that of ordinary concrete.
Several statistical mixture design methods such as factorial design approach (Ghezal
and Khayat 2002), and three-factor central composite design method (Ozyildirim and Lane
2003) have been used in North America to produce SCHPC mainly for laboratory-based
work. These approaches provide an optimum mixture composition from various mixture
combinations. Nevertheless, they are not always practical due to the variability of constituent
materials and the involvement of a greater number of variables in mixture design.
2.11 Mixing of Self-consolidating High Performance Concrete
Mixing is a mechanical operation to obtain a uniform mixture of concrete. A sound mixing is
necessary for SCHPC to disperse the constituent materials uniformly. Conventional mixers
can be used in producing SCHPC. However, the horizontal twin shaft type mixer is more
suitable to increase the mixing efficiency (Chang and Peng 2001). Also, the mixing time for
SCHPC is greater than that of ordinary concrete due to its higher plastic viscosity at low W/B
ratio (Chopin et al. 2004).
The mixing sequence of SCHPC can be different from that of ordinary concrete due
to the presence of chemical admixtures such as HRWR and VEA. In general, the aggregates
are mixed first with a portion of mixing water followed by the addition of cementing
materials. HRWR should be added once the aggregates and the cementing materials are
wetted out. This will increase the effectiveness of HRWR (Chang and Peng 2001) and avoid
the loss of HRWR through absorption by aggregates (Price 1994). When an AEA is selected
for use, it is generally added at the initial stage of mixing, as it needs greater mixing time to
achieve optimal performance (Kosmatka et al. 2002). In addition, when the VEA needs to be
used in SCHPC to improve the stability of concrete mixture, it can be added either at the
earlier or later stage of mixing (MBT 2002).
2.12 Stability of Self-consolidating High Performance Concrete
The stability of SCHPC refers to its ability to resist phase separation such as bleeding and
segregation of the paste from the aggregates or the settlement of coarse aggregates during
37
and after placement. Generally, two forms of stability are a concern for the fresh SCHPC;
static and dynamic stabilities. Both static and dynamic stabilities must be ensured in SCHPC
to obtain uniform distribution of the constituent materials, particularly coarse aggregates,
throughout the concrete component (Bui et al. 2002, Daczko 2002). Air-void stability is
another issue that needs to be maintained in SCHPC exposed to freezing and thawing
environment. All forms of the stability of SCHPC are affected by various factors such as
constituent materials, mixture proportions and placement techniques.
2.12.1 Static stability
The stability of concrete after placement is known as the static stability. It refers to the
resistance of the cast-in-place fresh concrete to segregation until the onset of hardening. The
lack of static stability induces surface defects, affects the interfacial transition zone leading to
impaired impermeability and mechanical properties, and weakens the bond to embedded
reinforcement (Assaad et al. 2004).
SCHPC exhibits good static stability when the coarse aggregates remain suspended in
the mixture. This criterion is controlled by the rheological properties of concrete. The yield
stress and plastic viscosity play the key role. The difference between the relative densities of
aggregate and matrix is also a critical factor. The yield stress opposes the sedimentation of
coarse aggregates. The yield stress in SCHPC is relatively very low and therefore coarse
aggregates tend to settle under static condition. For an aggregate of given size, the
sedimentation of aggregate also depends on the viscosity and density of the matrix.
In cast-in-place fresh SCHPC, the aggregates are subjected to buoyancy, gravity and
restoring or frictional force (Saak et al. 2001), as shown in Figure 2.9. The gravity or
gravitational force is given as
aag VgF ρ= (Equation 2.3)
where:
g is the gravitational acceleration, ρa is the density of the aggregate, and Va is the volume of
aggregate. The buoyancy or buoyant force is given as
38
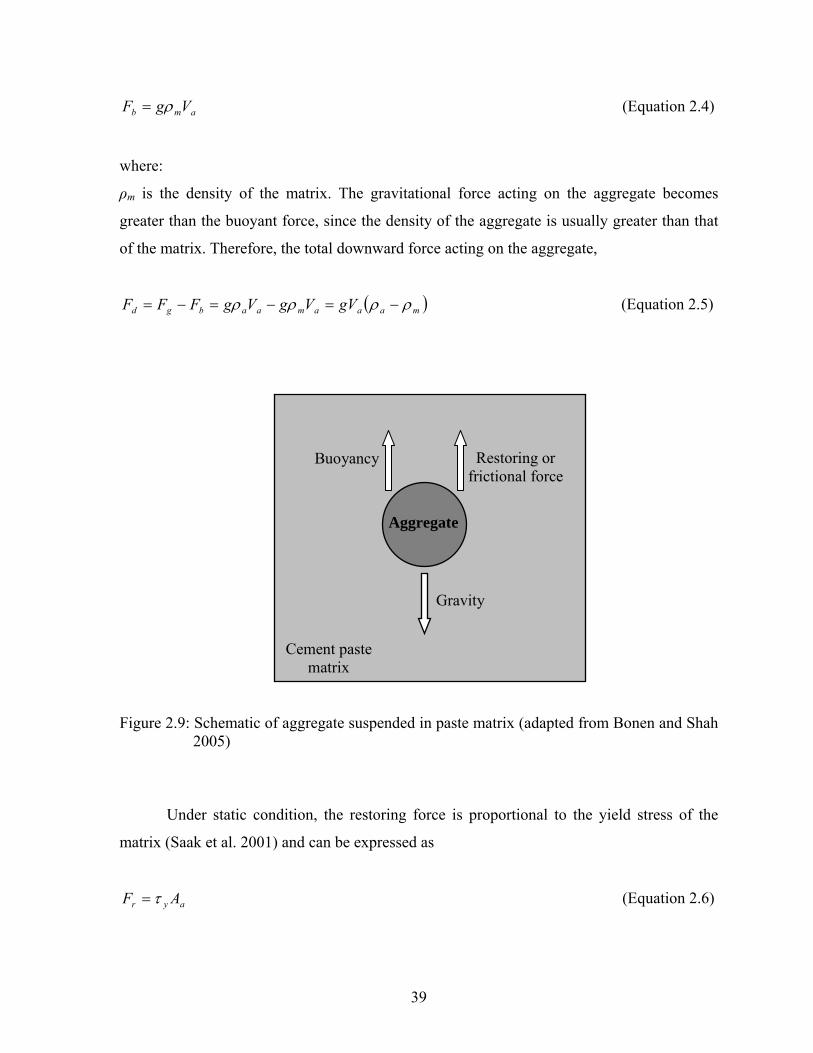
amb VgF ρ= (Equation 2.4)
where:
ρm is the density of the matrix. The gravitational force acting on the aggregate becomes
greater than the buoyant force, since the density of the aggregate is usually greater than that
of the matrix. Therefore, the total downward force acting on the aggregate,
( )maaamaabgd gVVgVgFFF ρρρρ −=−=−= (Equation 2.5)
Cement paste matrix
Buoyancy Restoring or frictional force
Gravity
Aggregate
Figure 2.9: Schematic of aggregate suspended in paste matrix (adapted from Bonen and Shah 2005)
Under static condition, the restoring force is proportional to the yield stress of the
matrix (Saak et al. 2001) and can be expressed as
ayr AF τ= (Equation 2.6)
39
where:
τy is the yield stress of the matrix and Aa is the cross-sectional area of the aggregate immersed
in the matrix. In order to keep the aggregate stationary,
( maaaydr gVAeiFF )ρρτ −≥≥ .,., (Equation 2.7)
For spherical aggregates, Aa = πra2 and Va = 4πra
3/3, where ra = radius of aggregate.
Therefore,
( ) ( ) ama
yamay greirg
34.,.,
34
≥−
−≥ρρ
τρρτ (Equation 2.8)
When Fr < Fd, aggregate settlement or sedimentation will occur. The aggregate will
settle down through the matrix and the velocity of the aggregate will increase until the
equilibrium of all forces is achieved (Bonen and Shah 2005). In this case, the restoring force,
Fr is replaced by a frictional force Ff given by
eaf vrF πη6= (Equation 2.9)
where:
η is the viscosity of the matrix, and ve is the equilibrium velocity of the aggregate. Under
equilibrium condition, the net forces acting on the aggregate are zero, and therefore the
frictional force,
( ) ( )maaeamaabgf gVvreigVFFF ρρπηρρ −=−=−= 6.,., (Equation 2.10)
By substituting Va,
( )η
ρρ9
2 2maa
egr
v−
= (Equation 2.11)
40

It is evident from Equation 2.8 that both yield stress and matrix density are crucial to
control static stability. Also, Equation 2.11 indicates that the extent of static segregation
depends on the aggregate size used in concrete, and the viscosity and density of the matrix.
2.12.2 Dynamic stability
The stability of fresh concrete during transport and placement is referred to as dynamic
stability. It describes the resistance to dynamic segregation that generally occurs in the
presence of obstruction and exhibits blockage of concrete. The lack of dynamic stability
causes the differential accumulation of coarse aggregate and separation of the matrix. Such
phenomena result in the heterogeneity due to the variations across the concrete, and degrade
the properties of the concrete (Bonen and Shah 2005). SCHPC possesses good dynamic
stability if the coarse aggregates move uniformly with the matrix as a cohesive fluid during
flow. This criterion is achieved through improved viscosity of the matrix (Saak et al. 2001).
Dynamic segregation may occur in SCHPC during placement along horizontal and
perpendicular directions. In horizontal flow, the aggregate is subjected to several forces such
as lateral mixture drag, gravity, buoyancy, vertical drag, and viscous force or plastic
viscosity, as presented in Figure 2.10. In contrast, the aggregate is subjected to gravity,
buoyancy and vertical drag force during perpendicular flow, as shown in Figure 2.11. In
horizontal flow, the lateral mixture drag and vertical drag help to keep the aggregates
suspended in concrete mixture (Bonen and Shah 2005). Both lateral mixture drag and vertical
drag depend on the velocity of the concrete mixture during placement. In this case, the plastic
viscosity of the matrix also resists the separation of coarse aggregates, acting oppositely to
the direction of lateral mixture drag. In perpendicular flow, the vertical drag resists the falling
of the aggregate (Saak et al. 2001). The vertical drag force can be given by
2
21
tmaDdr vACF ρ= (Equation 2.12)
where:
CD is the drag coefficient and vt is the constant terminal velocity of the aggregate. Aa and ρm
are explained in Section 2.12.1.
41
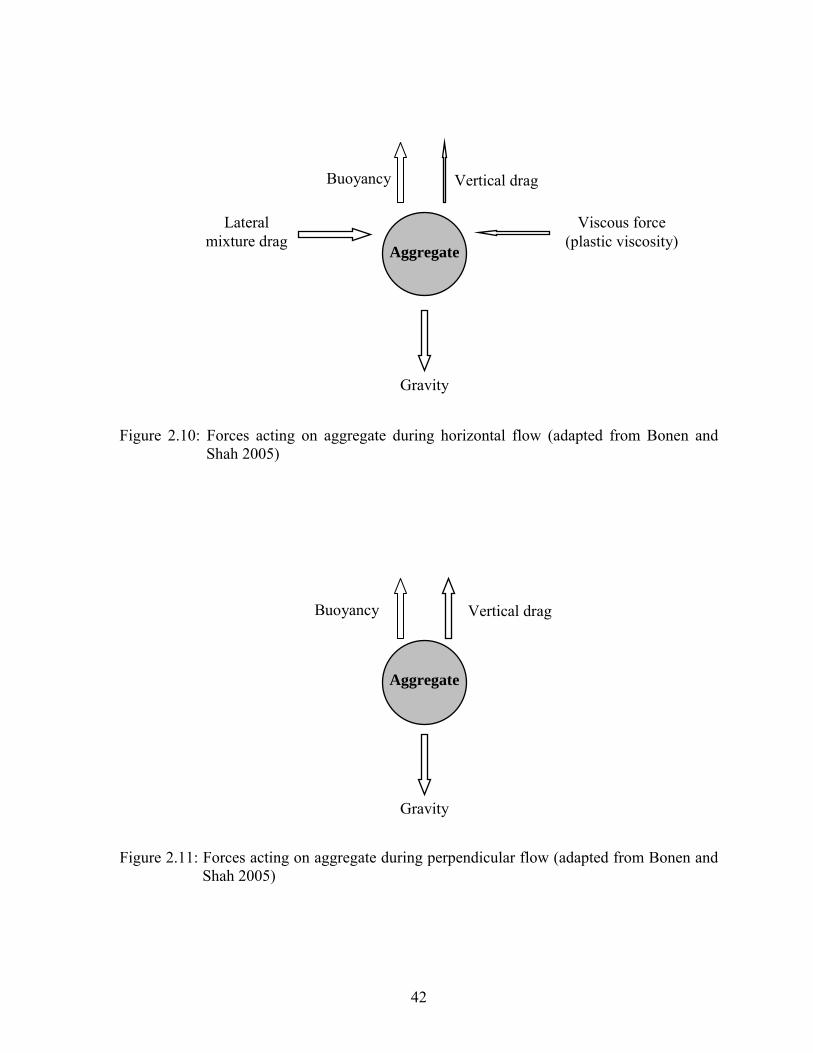
Figure 2.10: Forces acting on aggregate during horizontal flow (adapted from Bonen and Shah 2005)
Lateral mixture drag
Buoyancy Vertical drag
Viscous force (plastic viscosity)
Gravity
Aggregate
Buoyancy Vertical drag
Gravity
Aggregate
Figure 2.11: Forces acting on aggregate during perpendicular flow (adapted from Bonen and Shah 2005)
42
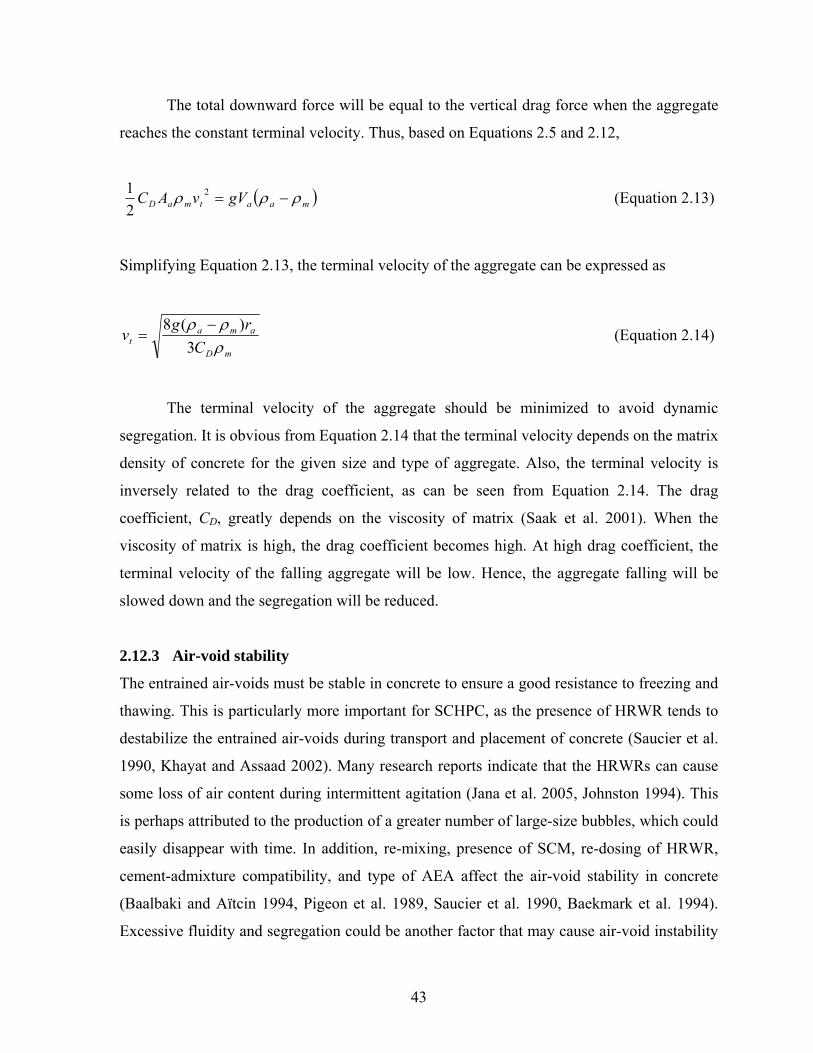
The total downward force will be equal to the vertical drag force when the aggregate
reaches the constant terminal velocity. Thus, based on Equations 2.5 and 2.12,
( maatmaD gVvAC ρρρ −=2
21 ) (Equation 2.13)
Simplifying Equation 2.13, the terminal velocity of the aggregate can be expressed as
mD
amat C
rgv
ρρρ
3)(8 −
= (Equation 2.14)
The terminal velocity of the aggregate should be minimized to avoid dynamic
segregation. It is obvious from Equation 2.14 that the terminal velocity depends on the matrix
density of concrete for the given size and type of aggregate. Also, the terminal velocity is
inversely related to the drag coefficient, as can be seen from Equation 2.14. The drag
coefficient, CD, greatly depends on the viscosity of matrix (Saak et al. 2001). When the
viscosity of matrix is high, the drag coefficient becomes high. At high drag coefficient, the
terminal velocity of the falling aggregate will be low. Hence, the aggregate falling will be
slowed down and the segregation will be reduced.
2.12.3 Air-void stability
The entrained air-voids must be stable in concrete to ensure a good resistance to freezing and
thawing. This is particularly more important for SCHPC, as the presence of HRWR tends to
destabilize the entrained air-voids during transport and placement of concrete (Saucier et al.
1990, Khayat and Assaad 2002). Many research reports indicate that the HRWRs can cause
some loss of air content during intermittent agitation (Jana et al. 2005, Johnston 1994). This
is perhaps attributed to the production of a greater number of large-size bubbles, which could
easily disappear with time. In addition, re-mixing, presence of SCM, re-dosing of HRWR,
cement-admixture compatibility, and type of AEA affect the air-void stability in concrete
(Baalbaki and Aïtcin 1994, Pigeon et al. 1989, Saucier et al. 1990, Baekmark et al. 1994).
Excessive fluidity and segregation could be another factor that may cause air-void instability
43
problem in SCHPC. The air-void stability can be ensured in SCHPC by a proper mixture
composition including a suitable combination of chemical admixtures. An increase in the
amount of cementing material at a low W/B ratio or the use of VEA can maintain the
appropriate air-void system during transport, placement and setting of SCHPC (Khayat 2000,
Khayat and Assaad 2002).
2.12.4 Role of rice husk ash
The stability of SCHPC is mainly controlled by its mixture variables. The properties and
proportions of cementing materials have significant effect on both static and dynamic
stability (Saak et al. 2001) as well as on air-void stability of SCHPC (Khayat and Assaad
2002). If SCHPC suffers from instability problem, it can be eliminated by increasing the
amount of SCM (Nagataki and Fujiwara 1995). However, it depends on some physical
properties such as particle shape and size, specific surface area, and relative density of SCM.
These properties influence the yield stress, viscosity and density of the cement paste matrix
that affect the stability of SCHPC (Saak et al. 2001, Bonen and Shah 2005). Since the yield
stress, plastic viscosity and density of the paste matrix are changed in the presence of RHA,
both static and dynamic stability of SCHPC including RHA can be influenced. Also, the
change in the viscosity of paste influences the formation of stable air-voids. Consequently,
the air-void stability of SCHPC can also be affected in the presence of RHA. Nevertheless,
limited studies investigated the effect of RHA on the stability of SCHPC.
2.13 Key Fresh Properties of Self-consolidating High Performance Concrete
The key fresh properties of SCHPC are the filling ability, passing ability and segregation
resistance. These three properties must be satisfied regardless of the sophistication of the
mixture design and other considerations such as cost. Among other fresh properties, plastic
shrinkage, unit weight and air content are noteworthy.
2.13.1 Filling ability
Filling ability is defined as the ability of fresh SCHPC to flow into and fill the spaces within
the formwork under self-weight at unconfined condition (Bartos 2000, EFNARC 2002). It is
associated with the formability, self-leveling capacity, and finishing ability of SCHPC. The
44
filling ability is an essential property of SCHPC to achieve self-consolidation capacity. This
property is crucial for concrete placement with proper casting technique (ACI 237R-07,
2007). The filling ability primarily depends on the aggregate content, W/B ratio, binder
content and HRWR dosage of concrete (Okamura and Ozawa 1995). A good filling ability
can be achieved by limiting the coarse aggregate content and increasing the amount of
cementing materials, while adding a proper dosage of HRWR.
2.13.2 Passing ability
Passing ability is defined as the ability of fresh SCHPC to flow through tight openings or
spaces confined by steel reinforcing bars (Bartos 2000, EFNARC 2002). Where structures
are heavily reinforced, a good passing ability of SCHPC enables it to be placed and
consolidated through dense reinforcing bars without any aggregate blockage (ACI 237R-07,
2007). The factors affecting the filling ability also influence the passing ability of concrete.
In addition, the passing ability depends on the number and spacing of the reinforcing bars. A
good passing ability can be achieved by increasing the filling ability of fresh concrete and by
limiting the segregation of coarse aggregates.
2.13.3 Segregation resistance
The segregation resistance of SCHPC refers to its ability to remain uniform during and after
placement without any loss of stability due to bleeding, mortar separation and coarse
aggregate settlement (EFNARC 2002). In particular, the distribution of aggregates becomes
non-uniform if SCHPC does not possess sufficient segregation resistance. This might affect
the properties and durability of concrete. A recent study has reported that the water
absorption and chloride penetration of SCHPC can be affected under poor segregation
resistance (Daczko 2002). A good segregation resistance can be attained in SCHPC by a
proper mixture composition. An increased amount of cementing materials, a small nominal
maximum size of aggregate, a limited content of well-graded coarse aggregates, and a low
W/B ratio should be used to achieve good segregation resistance (Bonen and Shah 2005). In
addition, the segregation resistance of SCHPC can be improved by using VEA (Okamura and
Ozawa 1994).
45
2.13.4 Unit weight
The unit weight of SCHPC refers to its mass per unit volume of fresh concrete. It depends on
the mixture composition of concrete. The unit weight of concrete becomes slightly lower
when a SCM such as RHA, fly ash and silica fume is incorporated (Zain et al. 1999). This is
because most SCMs are lighter than cement. However, it also depends on the degree of
materials packing in concrete.
2.13.5 Air content
Adequate air content must be maintained in SCHPC in order to protect it from freezing and
thawing damage (Brameshuber and Uebachs 2003, Hayakawa et al. 1994). The network of
entrained air bubbles offsets the hydraulic pressure posed by freezing water, and thus
improves the performance of concrete in freezing and thawing environment (Hayakawa et al.
1994). However, obtaining the correct air content in SCHPC is not very straightforward.
There are many factors such as mixture proportions, aggregate grading, cement composition,
type of HRWR, type and composition of SCM, mixing or placing method, and temperature
etc., that affect air-entrainment, and therefore achieving the target air content becomes much
more difficult (ACI 201.2R-01, 2004; Du and Folliard 2005, Pigeon 1994).
2.13.6 Role of rice husk ash
The presence of RHA results in a high water demand due to high specific surface area
(Mahmud et al. 2004, Zhang and Malhotra 1996). Thus, the filling ability and passing ability
can be affected if the increased water demand is not reduced with the adequate dosage of
HRWR. Moreover, the incorporation of RHA reduces the unit weight of concrete (Ismail and
Waliuddin 1996). The air content of concrete is also affected in the presence of RHA. The
concrete requires more AEA for a given air content when RHA is used with cement (Zhang
and Malhotra 1996). It was also reported that RHA reduces bleeding and segregation in non-
self-consolidating concrete (Mehta 1992, Zhang and Malhotra 1996) due to enhanced
viscosity. However, a decrease in bleeding increases the susceptibility of plastic shrinkage
cracking. In addition, the incorporation of RHA lowers the density of paste matrix and thus
may adversely affect the segregation resistance of SCHPC, particularly in static condition.
46
However, very few studies have been conducted to investigate the effects of RHA on the
fresh properties of SCHPC.
2.14 Curing of Self-consolidating High Performance Concrete
Curing is ideally a process that keeps the concrete element completely saturated or as much
saturated as possible until the water-filled spaces are substantially reduced by hydration
products (Gowripalan et al. 1992, Mather 1987). Concrete properties and durability are
significantly influenced by curing since it greatly affects the hydration of cement. The
hydration of cement virtually ceases when the relative humidity within the capillaries drops
below 80% (Neville 1996). The lack of moisture in cement paste can also result in
autogenous shrinkage due to self-desiccation. This is particularly a concern for the concretes
with higher binder content and lower W/B ratio (Neville 1996). Moreover, the drying of
concrete surfaces results in shrinkage cracks that may aggravate the durability problems.
Therefore, an efficient curing method is inevitable to prevent the concrete from drying and
self-desiccation, and to maintain the relative humidity above 80%.
A proper curing of SCHPC is crucial to produce greater hydration products, and to
reduce the porosity and drying shrinkage cracking of concrete, and thus to achieve higher
strength and greater resistance to physical or chemical attacks in aggressive environments. If
SCHPC is not well cured, particularly at the early age, it will not gain the properties and
durability at the desired level due to a lower degree of hydration, and would suffer from
irreparable loss. Therefore, a suitable curing method such as water ponding, spraying of
water, covering with wet burlap and plastic sheet, storing in a moist room, wrapping with
polyfilm, or storing in an oven with controlled temperature is essential to produce strong and
durable SCHPC. Water ponding, spraying of water, storing in a moist room and covering
with wet burlap are different forms of water curing, which is most effective to improve the
hardened properties of concrete (Aïtcin et al. 1994). In addition, wrapped curing, such as
wrapping with polyfilm, provides concrete properties closer to those given by water curing
(Zain et al. 2000). Hence, water curing should be the first choice to cure SCHPC. In case of
water shortage, wrapped curing can be adopted to cure SCHPC. The curing period should be
at least 7 days to improve the properties and durability of concrete (ACI 308R-01, 2001).
47
This is more crucial for SCHPC to reduce its autogenous and drying shrinkages caused by
high binder content and low W/B ratio.
2.15 Testing of Self-consolidating High Performance Concrete
Testing of SCHPC includes the testing of both fresh and hardened concretes. The testing of
fresh concretes usually includes the tests for rheological parameters (yield stress and plastic
viscosity), flowing ability (filling ability and passing ability), segregation resistance, air
content, unit weight, etc. The testing of hardened concretes includes both destructive and
non-destructive tests. Among various destructive tests, the compression test is of great
importance. The other important destructive tests are flexural (bending), and direct and
indirect (splitting) tension tests. The non-destructive testing includes tests for ultrasonic pulse
velocity, modulus of elasticity, porosity, absorption, permeability, electrical resistivity, etc.
Most of the test methods available for determining the fresh properties of ordinary
concrete are not suitable for SCHPC due to different workability characteristics. However,
very few standard test methods were established for fresh SCHPC. The most common slump
test has been used widely with some modifications to examine the filling ability of SCHPC
(Shindoh and Matsuoka 2003). Recently, the ASTM has standardized the slump flow test for
determining the filling ability of SCC (ASTM C 1611/C 1611M, 2007), which is also
applicable for SCHPC. In addition, the V-funnel and Orimet have been using to determine
the filling ability of SCHPC (Bartos 2000, EFNARC 2002). Similar to filling ability, there
were few standard test methods to measure the passing ability of SCHPC. Lately, the ASTM
has standardized the J-ring to measure the passing ability of SCC (ASTM C 1621/C 1621M,
2007). This test method is also applicable to SCHPC. Moreover, the U-box, L-box and Fill-
box have been used for determining the passing ability of SCHPC (EFNARC 2002, Okamura
and Ouchi 2003). The segregation resistance is mostly being measured by standard No. 4
sieve (EFNARC 2002, Nagataki and Fujiwara 1995) and column apparatus (Assaad et al.
2004, Sonebi 2004a). The ASTM has also standardized a column apparatus for testing the
segregation resistance of SCC (ASTM C 1610/C 1610M, 2006), which is also valid for
freshly mixed SCHPC. For other fresh properties of SCHPC such as unit weight and air
content, the existing test methods for ordinary concrete can be used with some modifications,
particularly for the procedures of filling and consolidation.
48
In case of hardened SCHPC, the test methods used for ordinary concrete can be
employed to determine the concrete properties. However, the testing ages should be extended
to 56 or 91 days for most hardened properties. This is because SCHPC most often contains
SCMs; some of these hydrate at a slower rate than portland cement (Lessard and Aïtcin
1994). In addition, a higher specified loading rate can be applied to SCHPC as compared to
ordinary concrete, while conducting the destructive strength test. This is because the strength
of SCHPC is much higher than that of ordinary concrete. Also, the capping conditions for the
compression test of SCHPC may not be the same as for ordinary concrete. Nevertheless,
these changes do not enforce to employ completely new test methods for hardened SCHPC.
2.16 Key Hardened Properties of Self-consolidating High Performance Concrete
Compressive strength, porosity, ultrasonic pulse velocity, absorption, permeability, and
electrical resistivity are some of the key hardened properties of SCHPC. They are briefly
discussed below.
2.16.1 Compressive strength
Compressive strength is the most important mechanical property of concrete. In general, for a
given set of cement and aggregates, and under the same mixing, curing and testing
conditions, the compressive strength of a concrete primarily depends on W/B ratio,
binder/aggregate (B/A) ratio, mixture composition, and degree of consolidation. However, it
is the W/B ratio that chiefly controls the development of compressive strength in concrete.
The limits of W/B ratio to achieve a targeted compressive strength in high-strength HPC are
as follows (Lessard et al. 1995):
50 MPa – 75 MPa, for 0.30 ≤ W/B ≤ 0.40
75 MPa – 100 MPa, for 0.25 ≤ W/B ≤ 0.35
100 MPa – 125 MPa, for 0.20 ≤ W/B ≤ 0.30
125 MPa and above, for W/B ≤ 0.20
Ordinary concrete generally produces a compressive strength in the range of 20 to 40
MPa. The compressive strength of SCHPC is much higher than that of ordinary concrete. For
a compressive strength varying from 50 to 125 MPa, the aforementioned range of W/B ratios
is also valid for SCHPC (Persson 2001). Another observation is that the kinetics of strength
49
increase is notably faster in SCHPC (Persson 2001) as compared to ordinary concrete due to
increased gel/space ratio at lower W/B ratio.
2.16.2 Porosity
Porosity refers to a fraction of the total concrete volume that is occupied by the pores in bulk
cement paste, interfacial transition zone and aggregates. It is one of the major factors that
control the strength of concrete (Neville 1996). Porosity also affects the electrical resistivity,
and thus the corrosion resistance of concrete (Claisse et al. 2001). The porosity of concrete
can be characterized into two forms – total and capillary or suction porosity (Nokken and
Hooton 2002). The total porosity is mainly comprised of capillary and air porosity. In
contrast, the network of open pores mainly constitutes the capillary porosity of concrete. The
capillary porosity has considerable effects on the transport properties and hence on the
durability of concrete (Hearn et al. 1994).
The total and capillary porosity are expected to be low in SCHPC (7 to 15%) as
compared to ordinary concrete due to compacted pore structure. The pore system in SCHPC
is more refined than that in ordinary concrete (Attiogbe et al. 2002). This is mainly because
of a low W/B ratio. The higher degree of packing due to good consolidation, the greater
degree of hydration due to deflocculation and dispersion of cement particles in the presence
of HRWR, and the pozzolanic and micro-filling effects of SCM also contribute to form a
refined pore structure in SCHPC.
2.16.3 Ultrasonic pulse velocity
The ultrasonic pulse velocity is defined as the traversed distance of the pulse or sonic wave
per unit transit time. This is obtained from the path length (length of the interposed concrete
specimen) and transit time. The ultrasonic pulse velocity of concrete is mainly influenced by
the mixture composition of concrete, moisture and maturity of concrete, curing conditions,
and temperature. Generally, a high ultrasonic pulse velocity through concrete indicates that
the concrete is of good quality. An ultrasonic pulse velocity above 4575 m/sec states the
‘excellent’ quality of concrete whereas an ultrasonic pulse velocity below 2135 m/sec reveals
the ‘very poor’ condition of concrete (Leslie and Cheeseman 1949, Shetty 2001).
50

Ultrasonic pulse velocity can be used to evaluate the physical quality of SCHPC. It is
also useful to detect the cracks and flaws, and to study the freeze-thaw durability of SCHPC.
The ultrasonic pulse velocity of SCHPC is expected to be much higher than that of ordinary
concrete. This is due to the refined pore structure and dense microstructure of SCHPC.
However, no considerable studies have been conducted on the non-destructive evaluation of
SCHPC using ultrasonic pulse velocity method.
2.16.4 Absorption
Absorption is a process by which a liquid gets into and tends to fill the open pores in a
porous solid body such as a component of concrete (ASTM C 125, 2004). The absorption is
generally more significant in surface layer than the core of concrete due to strong capillary
action. The rate at which a dry concrete surface absorbs a liquid can be taken as a predictor of
the durability of concrete. Water is the most common liquid with which the concrete comes
in contact. Hence, water absorption is widely used to indicate the absorptivity of concrete. It
can be determined based on the increase in mass of a concrete specimen due to the
penetration of water into its open pores.
Water absorption is directly related to concrete’s resistance to water penetration,
which plays an important role in various deterioration mechanisms and carries many
deleterious agents from the surroundings. Like other engineering properties, the water
absorption of concrete is directly influenced by the porosity (Hearn et al. 1994). The porosity
controls the microstructure and thus the absorption of concrete, depending on the relative
quantities of the pores of various types and sizes (Hearn et al. 1997). When the porosity
decreases, the water absorption is also reduced. It was reported that SCHPC provides a water
absorption in the range of 3 to 6% (Schutter et al. 2003, Vanwalleghem et al. 2003).
2.16.5 Permeability
Permeability of concrete is defined as the movement of liquid and/or gas through a mass of
concrete under a constant pressure gradient. It is an intrinsic property of concrete that chiefly
depends upon the geometric arrangement and characteristics of the constituent materials. The
permeability of concrete is mainly controlled by the compactness and porosity of the
hydrated paste present in bulk paste matrix and interfacial transition zone. In the hydrated
51
paste, the capillary and gel pores can be distinguished. The gel pores are very small.
Although they constitute a network of open pores, the permeability of this network is very
low. Conversely, the capillary pores are relatively large spaces existing between the cement
grains. It is the capillary porosity that greatly affects the permeability of concrete (Perraton et
al. 1994).
The permeability of SCHPC is typically lower than that of ordinary concrete. The
previous research showed that SCHPC results in very low water and gas permeability (Zhu
and Bartos 2003, Schutter et al. 2003). This is mostly attributed to the superior flow
properties, dense microstructure and refined pore structure that develop in the presence of
SCM and HRWR at low W/B ratio. Good flow properties result in excellent packing
condition due to improved consolidation, and thus contribute to reduce the permeability of
concrete.
2.16.6 Electrical resistivity
The corrosion-resisting performance of concrete is influenced by its electrical resistivity,
which refers to the resistance that the electrical charges experience while passing through the
concrete. The electrical resistivity must be sufficiently high to inhibit the corrosion process in
concrete. The increased electrical resistivity of concrete hinders the movement of electrons
from the anodic to the cathode regions, and thereby retards the propagation of corrosion
process. It has been reported that the corrosion rate becomes very low when the true
electrical resistivity (apparent resistivity/cell correction factor) of concrete is greater than 10
kΩ-cm (Hearn 1996). HPC has been known to provide higher electrical resistivity (Hansen et
al. 1993, Tasi et al. 2006).
Limited studies have been carried out to investigate the electrical resistivity of
SCHPC. Hwang and Hung (2002) determined the electrical resistivity of SCHPC as a
measure of the durability at different W/B ratios. They found that SCHPC provides an
electrical resistivity much higher than 10 kΩ-cm at later ages (≥ 28 days). This is mainly
attributed to the reduced porosity of SCHPC. The reduction in porosity lessens the amount of
electrolyte and impedes the movement of electrical charges, and thus increases the electrical
resistivity of concrete.
52
2.16.7 Role of rice husk ash
The published literature shows that the hardened properties of concrete are improved in the
presence of RHA. For example, RHA provided significant improvements in compressive and
tensile strengths, ultrasonic pulse velocity, and transport properties of high strength and high
performance concretes (Ismail and Waliuddin 1996, Zhang and Malhotra 1996, Mahmud et
al. 2004). Similar performance of RHA is expected in case of SCHPC. However, limited
studies have been conducted to investigate the effect of RHA on the hardened properties of
SCHPC.
2.17 Modeling of Self-consolidating High Performance Concrete
The modeling of fresh and hardened concrete properties is useful for mixture design and
performance prediction. In published literature, there are several models available for fresh
and hardened concretes. Most of these models are related to the filling ability and
compressive strength of concrete, and can be applicable for SCHPC.
2.17.1 Models for filling ability
The slump and slump flow are two fresh properties that express the filling ability of concrete.
Hu et al. (1996) proposed a semi-empirical model relating the slump to the yield stress of
fresh concrete as follows:
)300(270
Sy −=ρτ (Equation 2.15)
where:
S is the slump (mm), τy is the yield stress (Pa), and ρ is the unit weight or density of fresh
concrete (kg/m3).
For the above model, the correlation between yield stress and slump is poor when the
plastic viscosity of concrete exceeds 300 Pa.s. Ferraris and de Larrard (1998) improved the
accuracy of Hu’s model by changing the value of the slope term and adding a constant term
53
as shown in Equation 2.16. They implied that the modified version of Hu’s model is valid for
very fluid concrete such as SCHPC.
212)300(347
+−= Syρτ (Equation 2.16)
Ferraris and de Larrard (1998) also provided a relationship among the plastic
viscosity, slump and slump time of concrete as follows:
( 1751000
08.1−= STsρμ ) (Equation 2.17)
where:
μ is the plastic viscosity (Pa.s) and Ts is slump time (s), S is the slump (mm), and ρ is the
density of fresh concrete (kg/m3). This relationship is given for a slump value in the range of
200 to 260 mm. Therefore, it is also valid for SCHPC.
Murata (1984) produced a relationship to calculate the maximum bottom shear stress,
and developed a model for the slump flow and yield stress as follows:
⎟⎟⎠
⎞⎜⎜⎝
⎛= 22
1
bbm R
gVπρτ (Equation 2.18)
by
bmf RS
ττ22
= (Equation 2.19)
where:
τbm is the maximum bottom shear stress (Pa), Sf is the slump flow of concrete (m), τy is the
yield stress of concrete (Pa), Rb is the bottom radius of concrete sample before deformation
(m), ρ is the density of fresh concrete (kg/m3), g is gravitational acceleration (9.806 m/s2),
and V is the volume of concrete sample (m3). The frictional resistance between concrete
54
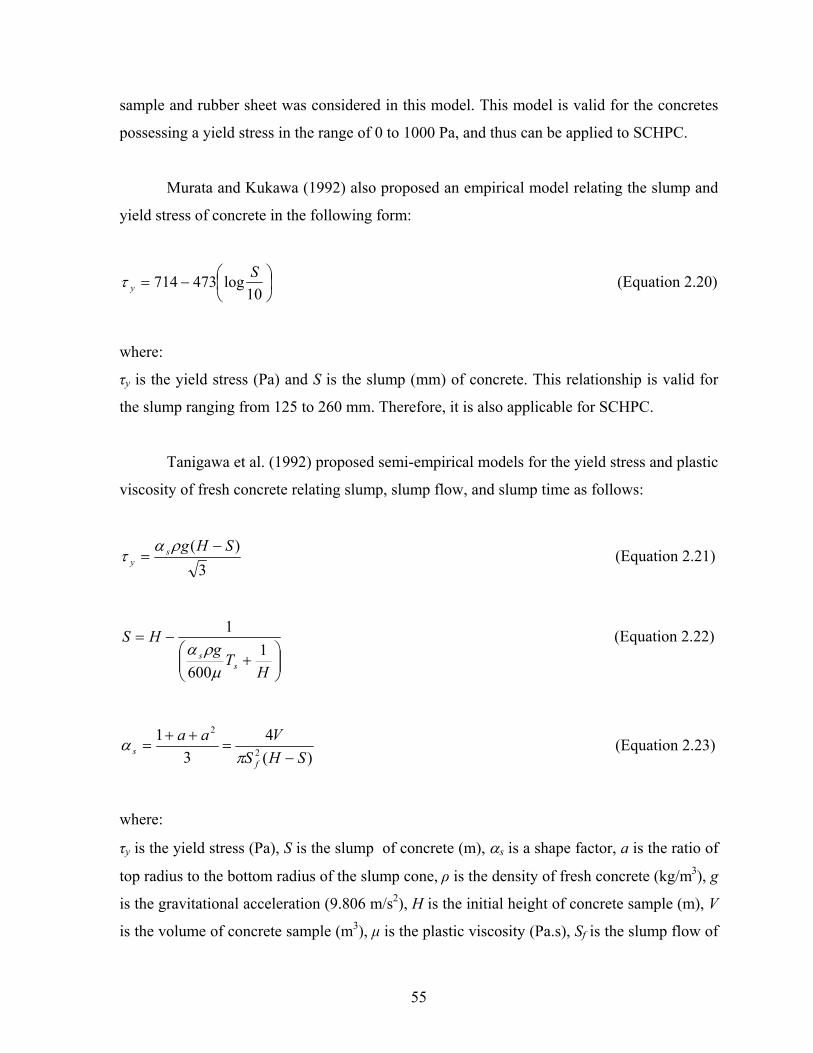
sample and rubber sheet was considered in this model. This model is valid for the concretes
possessing a yield stress in the range of 0 to 1000 Pa, and thus can be applied to SCHPC.
Murata and Kukawa (1992) also proposed an empirical model relating the slump and
yield stress of concrete in the following form:
⎟⎠⎞
⎜⎝⎛−=
10log473714 S
yτ (Equation 2.20)
where:
τy is the yield stress (Pa) and S is the slump (mm) of concrete. This relationship is valid for
the slump ranging from 125 to 260 mm. Therefore, it is also applicable for SCHPC.
Tanigawa et al. (1992) proposed semi-empirical models for the yield stress and plastic
viscosity of fresh concrete relating slump, slump flow, and slump time as follows:
3)( SHgs
y−
=ρα
τ (Equation 2.21)
⎟⎟⎠
⎞⎜⎜⎝
⎛+
−=
HT
gHS
ss 1
600
1
μρα
(Equation 2.22)
)(4
31
2
2
SHSVaa
fs −
=++
=π
α (Equation 2.23)
where:
τy is the yield stress (Pa), S is the slump of concrete (m), αs is a shape factor, a is the ratio of
top radius to the bottom radius of the slump cone, ρ is the density of fresh concrete (kg/m3), g
is the gravitational acceleration (9.806 m/s2), H is the initial height of concrete sample (m), V
is the volume of concrete sample (m3), μ is the plastic viscosity (Pa.s), Sf is the slump flow of
55

concrete (m), and Ts is the slump time (s). The models are generally valid for any fresh
concrete including SCHPC. However, the accuracy of these models depends on the variation
of shape factor.
Chidiac et al. (2000) revised Equations 2.21 and 2.22 to avoid the effect of shape
factor (αs) and provided the relationships for the yield stress and plastic viscosity of concrete
as follows:
234
fy S
gVπρτ = (Equation 2.24)
2150 f
s
SSgVHTπ
ρμ = (Equation 2.25)
where:
τy is the yield stress (Pa); μ is the plastic viscosity (Pa.s), Sf is the slump flow of concrete (m),
H is the initial height of concrete sample (m), S is the slump of concrete (m), Ts is the slump
time (s), ρ is the density of fresh concrete (kg/m3), g is the gravitational acceleration (9.806
m/s2), and V is the volume of concrete sample (m3). These equations can be used to estimate
the yield stress and plastic viscosity of SCHPC.
2.17.2 Models for compressive strength
Duval and Kadri (1998) proposed a model for the compressive strength of silica fume HPC
in the following form:
]6.0)/(1.236.1)([)1(
)( 2228 −−+
+= CSFtA
WyCKRtf cc (Equation 2.26)
where:
fc(t) is the compressive strength at any time t; K is a coefficient that depends on the type of
aggregates and is computed from the 28-day compressive strength of reference concrete
56
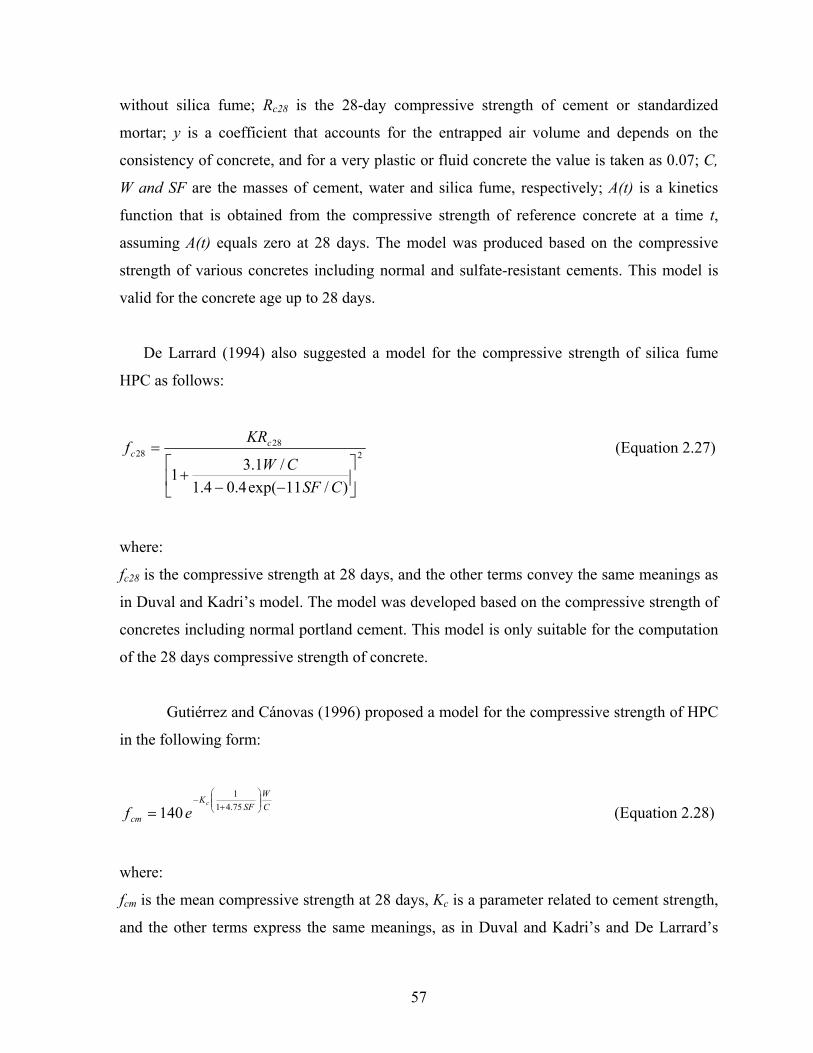
without silica fume; Rc28 is the 28-day compressive strength of cement or standardized
mortar; y is a coefficient that accounts for the entrapped air volume and depends on the
consistency of concrete, and for a very plastic or fluid concrete the value is taken as 0.07; C,
W and SF are the masses of cement, water and silica fume, respectively; A(t) is a kinetics
function that is obtained from the compressive strength of reference concrete at a time t,
assuming A(t) equals zero at 28 days. The model was produced based on the compressive
strength of various concretes including normal and sulfate-resistant cements. This model is
valid for the concrete age up to 28 days.
De Larrard (1994) also suggested a model for the compressive strength of silica fume
HPC as follows:
228
28
)/11exp(4.04.1/1.31 ⎥
⎦
⎤⎢⎣
⎡−−
+
=
CSFCW
KRf c
c (Equation 2.27)
where:
fc28 is the compressive strength at 28 days, and the other terms convey the same meanings as
in Duval and Kadri’s model. The model was developed based on the compressive strength of
concretes including normal portland cement. This model is only suitable for the computation
of the 28 days compressive strength of concrete.
Gutiérrez and Cánovas (1996) proposed a model for the compressive strength of HPC
in the following form:
CW
SFK
cm
c
ef⎟⎟⎠
⎞⎜⎜⎝
⎛+
−
= 75.411
140 (Equation 2.28)
where:
fcm is the mean compressive strength at 28 days, Kc is a parameter related to cement strength,
and the other terms express the same meanings, as in Duval and Kadri’s and De Larrard’s
57
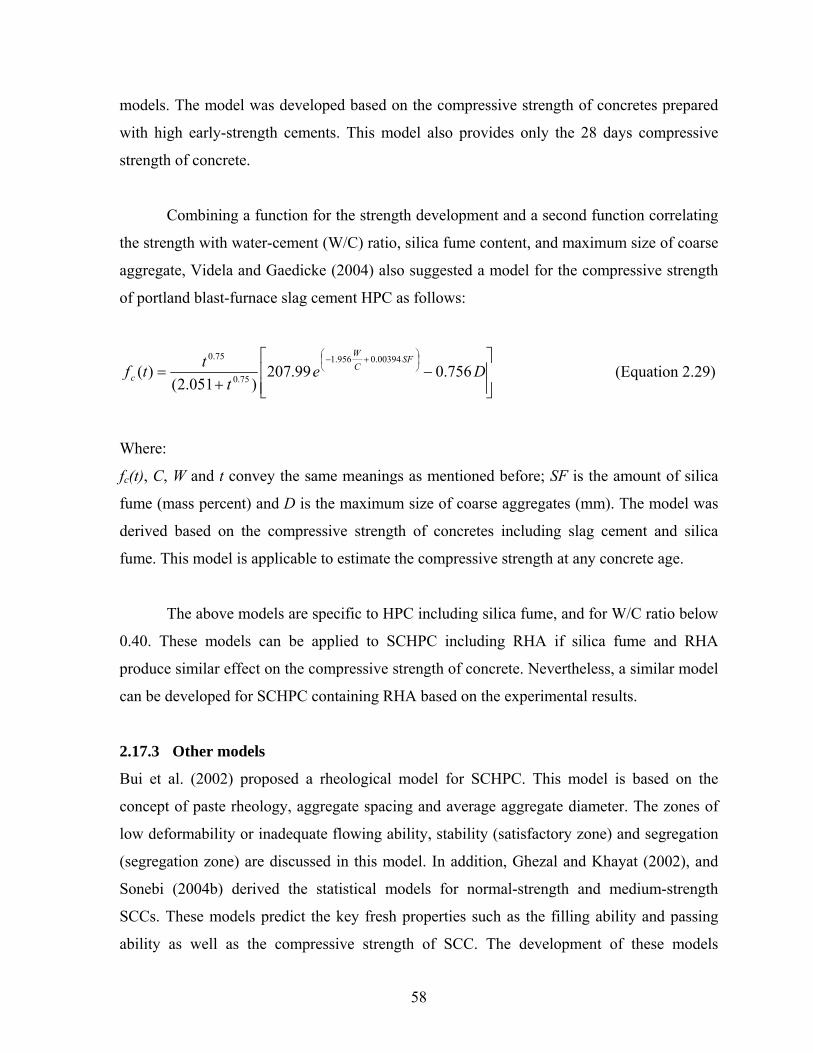
models. The model was developed based on the compressive strength of concretes prepared
with high early-strength cements. This model also provides only the 28 days compressive
strength of concrete.
Combining a function for the strength development and a second function correlating
the strength with water-cement (W/C) ratio, silica fume content, and maximum size of coarse
aggregate, Videla and Gaedicke (2004) also suggested a model for the compressive strength
of portland blast-furnace slag cement HPC as follows:
⎥⎥⎦
⎤
⎢⎢⎣
⎡−
+=
⎟⎠⎞
⎜⎝⎛ +−
Det
ttfSF
CW
c 756.099.207)051.2(
)(00394.0956.1
75.0
75.0
(Equation 2.29)
Where:
fc(t), C, W and t convey the same meanings as mentioned before; SF is the amount of silica
fume (mass percent) and D is the maximum size of coarse aggregates (mm). The model was
derived based on the compressive strength of concretes including slag cement and silica
fume. This model is applicable to estimate the compressive strength at any concrete age.
The above models are specific to HPC including silica fume, and for W/C ratio below
0.40. These models can be applied to SCHPC including RHA if silica fume and RHA
produce similar effect on the compressive strength of concrete. Nevertheless, a similar model
can be developed for SCHPC containing RHA based on the experimental results.
2.17.3 Other models
Bui et al. (2002) proposed a rheological model for SCHPC. This model is based on the
concept of paste rheology, aggregate spacing and average aggregate diameter. The zones of
low deformability or inadequate flowing ability, stability (satisfactory zone) and segregation
(segregation zone) are discussed in this model. In addition, Ghezal and Khayat (2002), and
Sonebi (2004b) derived the statistical models for normal-strength and medium-strength
SCCs. These models predict the key fresh properties such as the filling ability and passing
ability as well as the compressive strength of SCC. The development of these models
58
involved the testing of a number of concrete mixtures. Also, the mixture parameters such as
cement content, SCM and HRWR, etc. are generally selected on trial basis. They are
material-specific and therefore may not be directly applicable to other sets of materials.
However, the derived models would be helpful to simulate different sets of materials in
future SCC and SCHPC concrete mixtures, leading to time and cost savings from a reduced
number of trail batches.
2.18 Research Needs
Self-consolidating high performance concrete has rapidly gained broad acceptance in North
America. It could be used successfully in many structural as well as non-structural
applications. However, comprehensive research is necessary to fill the existing knowledge
gaps and to link different issues for the prospect of SCHPC in different sectors of
construction. Based on the literature review, the following research needs have been
identified in the field of SCHPC:
a. Potential for the use of waste materials such as RHA to improve concrete properties and
durability.
b. Development of a simplified mixture design method.
c. Investigation of the relationship between the filling ability of concrete and the filling
ability of its paste or mortar component.
d. Investigation of the air-void stability in fresh and hardened concretes.
e. Investigation of the effect of RHA on the fresh and hardened properties, and durability of
concrete.
f. Investigation of the effect of RHA on the static and dynamic stabilities or segregation
resistances of concrete.
g. Development of simple test apparatus to examine the filling ability, passing ability and
segregation resistance of concrete.
h. Assessment of the physical quality of concrete by different non-destructive test methods.
i. Modeling of major fresh and hardened properties of concrete with respect to key mixture
design parameters.
59
2.19 Research Objectives
The main objective of the study was to develop SCHPCs incorporating RHA, and to
investigate their performance at fresh and hardened states. The sub-objectives of the study
were as follows:
a. Investigation of the filling ability of various SCHPCs, and their paste and mortar
components.
b. Development of a simple design approach for the mixture proportioning of SCHPC.
c. Development of simplified and single-operator test apparatus for assessing the filling
ability, passing ability, and segregation resistance of SCHPC.
d. Evaluation of the air-void stability in various fresh SCHPCs with and without RHA.
e. Investigation of the effect of RHA on various properties of fresh and hardened SCHPCs.
f. Examination of the effect of RHA on the static and dynamic segregation resistances of
various SCHPCs.
a. Development of empirical models for the filling ability (slump flow) and compressive
strength of SCHPC.
60
Chapter 3
Research Program and Procedures
3.1 General
The research program was comprised of experimental investigation and modeling. The aim
of the experimental investigation was to examine the suitability of component materials and
to observe the performance of different binder pastes and mortars, and various fresh and
hardened self-consolidating high performance concretes (SCHPCs). The pastes, mortars and
concretes used contained rice husk ash (RHA) as a supplementary cementing material
(SCM). This chapter discusses the research procedure and provides a flowchart for the
overall research program.
3.2 Experimental Investigation
The experimental investigation for various SCHPCs was comprised of selection and testing
of materials, testing of aggregate blends, testing of binder pastes, testing of mortars, design of
concrete mixtures, preparation and testing of fresh concretes, and preparation and testing of
hardened concretes. In addition, the development of several test apparatus for measuring the
key fresh properties of SCHPC was included. The overall experimental investigation is
shown in the flowchart given in Figure 3.1.
The following systematic procedure was followed to carry out the research on
SCHPCs incorporating RHA:
Step 1: The constituent materials for SCHPCs were selected, collected, and tested for
the key properties.
Step 2: Various aggregate blends were prepared by mixing concrete stone and
concrete sand at different proportions. The aggregate blends were tested to determine the
optimum sand-aggregate (S/A) ratio leading to maximum bulk density.
Step 3: The primary mixture proportions of SCHPCs were determined based on the
results obtained from the testing of materials and aggregate blends, and by selecting the
water-binder (W/B) ratio and estimating the mixing water requirement of concrete.
61
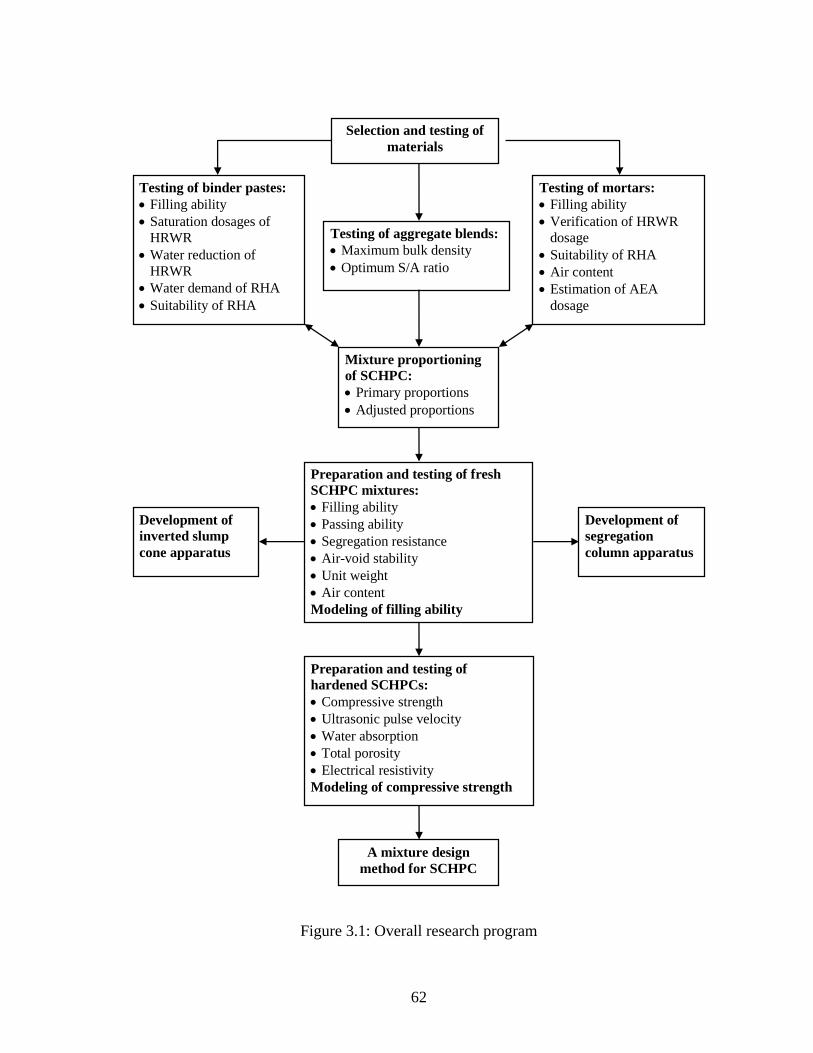
Preparation and testing of fresh SCHPC mixtures: • Filling ability • Passing ability • Segregation resistance • Air-void stability • Unit weight • Air content Modeling of filling ability
Mixture proportioning of SCHPC: • Primary proportions • Adjusted proportions
Testing of aggregate blends: • Maximum bulk density • Optimum S/A ratio
Selection and testing of materials
Development of segregation column apparatus
Testing of mortars: • Filling ability • Verification of HRWR
dosage • Suitability of RHA • Air content • Estimation of AEA
dosage
Testing of binder pastes: • Filling ability • Saturation dosages of
HRWR • Water reduction of
HRWR • Water demand of RHA • Suitability of RHA
Development of inverted slump cone apparatus
Preparation and testing of hardened SCHPCs: • Compressive strength • Ultrasonic pulse velocity • Water absorption • Total porosity • Electrical resistivity Modeling of compressive strength
A mixture design method for SCHPC
Figure 3.1: Overall research program
62
Step 4: Various binder pastes were formulated from the primary mixture proportions
of the concretes. The binder pastes were tested using a standard grout flow cone to determine
their filling ability with respect to flow time, to obtain the saturation dosages of high-range
water reducer (HRWR), to find the water reduction caused by HRWR, to observe the
suitability of RHA for use in SCHPC, and to assess the water demand of RHA.
Step 5: Various mortars were formulated based on the primary mixture proportions of
the concretes. The mortars were tested using a standard flow mould to determine their filling
ability with respect to flow spread, to verify the saturation dosages of HRWR obtained from
flow cone test, and to observe the suitability of RHA for use in SCHPC. In addition, the
mortars were tested using a Chace air indicator to obtain the air content, and thus to estimate
the AEA dosages for the concretes.
Step 6: The mixture proportions of different SCHPCs were adjusted after fixing the
dosages of HRWR, AEA and viscosity-enhancing admixture (VEA), and correcting the
proportions of aggregates and water.
Step 7: The component materials were batched based on the adjusted mixture
proportions, and mixed in a revolving type pan mixer to prepare the fresh SCHPC mixtures.
Step 8: New, modified and existing test apparatus were used to investigate the fresh
properties of different SCHPCs. An inverted slump cone apparatus including the test
procedure and performance criteria was developed for use without and with a J-ring to
determine the filling ability and passing ability of SCHPC, respectively. In addition, a
simplified column apparatus including the test method and performance criteria was
developed to measure the static segregation resistance of SCHPC.
Step 9: The fresh SCHPC mixtures were tested for filling ability, passing ability, unit
weight, and air content. In addition, several SCHPC mixtures were tested for air-void
stability. The filling ability was determined with respect to slump and slump flow, orimet
flow time and spread, and inverted slump cone flow time and spread. The passing ability was
measured with regard to slump and slump flow, orimet flow spread, and inverted slump cone
flow spread in the presence of a J-ring. The air-void stability was investigated with respect to
the air content of concrete after re-mixing at different test stages.
Step 10: The segregation resistance of fresh SCHPCs was visually inspected by
observing the quality of concrete resting in mixer pan and during slump flow, orimet flow
63

and inverted slump cone flow tests. In addition, the segregation resistance of several
concretes was quantitatively determined by sieve and column segregation tests.
Step 11: The test specimens were cast after examining the fresh properties of the
concretes. The specimens were cured and modified when necessary for determining the key
hardened properties of SCHPC mixtures.
Step 12: Existing and modified test methods were used to investigate the hardened
properties of different SCHPCs. The laboratory tests were carried out to determine the
compressive strength, ultrasonic pulse velocity, water absorption, total porosity, and
electrical resistivity of the concretes.
3.3 Modeling and Mixture Design
The models of two key properties such as filling ability and compressive strength and a
mixture design method for SCHPC were developed. The filling ability model was developed
based on the results of slump flow. The validity of the model was further examined based on
the related data available in the literature. The strength model was developed based on the
results of compression test for various SCHPC concrete mixtures. The validity of the strength
model was also checked using a set of related data gathered from the literature. Finally, a
mixture design method for SCHPC was produced based on the test results and developed
models.
64
Chapter 4
Characteristics of Constituent Materials and Aggregate Blends
4.1 General
This chapter deals with the selection and testing of constituent materials for the concretes
used in the present study. The physical characteristics of the constituent materials of
concretes, the results of sieve analyses for concrete stone and sand (coarse and fine
aggregates), and the chemical and particle size analyses of cement and rice husk ash (RHA)
are presented and discussed in this chapter. The preparation and testing of the aggregate
blends and their test results are also shown and discussed in this chapter. In addition, this
chapter discusses the usefulness of the properties of constituent materials and aggregate
blends.
4.2 Selection and Testing of Constituent Materials
Concrete stone, concrete sand, normal portland cement, amorphous RHA, normal tap water,
polycarboxylate-based high-range water reducer (HRWR), synthetic air-entraining admixture
(AEA), and modified polysaccharide-based viscosity-enhancing admixture (VEA) were
selected to produce various self-consolidating high performance concretes (SCHPCs). The
component materials were tested to examine their suitability and to obtain several physical
properties required for the mixture proportioning process of concrete. The following sections
describe the constituent materials along with the experiments conducted.
4.2.1 Concrete stone
Locally available concrete stone in the form of a blend of crushed and round aggregates was
used as the coarse aggregate (CA). The weight percentage of round aggregate was 50% of the
total aggregates. The concrete stone was tested for mass passing 75-μm sieve, oven-dry basis
bulk density, void content, saturated surface-dry relative density, absorption, total evaporable
moisture content, mass loss due to unconfined freeze-thaw, and accelerated mortar bar
65
expansion. In addition, the sieve analysis was performed for the concrete stone according to
ASTM C 136 (2004).
4.2.2 Concrete sand
Locally available concrete sand in the form of natural pit sand by source was used as the fine
aggregate (FA). The sand was found as deposits in soil, and obtained by forming pits into the
soil. The concrete sand was tested for mass passing 75-μm sieve, oven-dry basis bulk density,
void content, saturated surface-dry basis relative density, absorption, total evaporable
moisture content, and accelerated mortar bar expansion. Moreover, the sieve analysis was
performed for the concrete sand in accordance with ASTM C 136 (2004).
4.2.3 Normal portland cement
Lafarge normal portland cement (C) was used as the main cementing material. It complied
with the requirements of ASTM Type I (CSA Type 10 or Type GU) cement (ASTM C 150,
2004; CAN/CSA A3001, 2003). The cement was tested for sieve fineness by 75-μm, 150-μm
and 325-μm sieves, relative density, Blaine specific surface area, setting time, compressive
strength, autoclave expansion and air content. It was also tested for the particle size
distribution and chemical composition. A Malvern Mastersizer was used for the particle size
analysis by laser diffraction method (ISO 13320-1, 1999). The chemical analysis was
determined based on ASTM C 114 (2004) to obtain the oxide and compound compositions,
free lime, insoluble residue and loss on ignition.
4.2.4 Amorphous rice husk ash
Amorphous (non-crystalline) RHA was used as a supplementary cementing material (SCM).
It was available in very fine powder form with a grey color. RHA was tested for relative
density, Blaine specific surface area, accelerated pozzolanic activity, particle size
distribution, and chemical composition. The accelerated pozzolanic activity was determined
according to the procedure used for silica fume, as given in ASTM C 1240 (2004). The
hydrometer method, as mentioned in ASTM D 422 (2004) was applied for the particle size
analysis of RHA. The borate fusion whole rock analysis by XRF spectrometry was used to
determine the oxide composition and loss on ignition of RHA (Taggart, Jr. and Siems 2002).
66
In addition, the RHA was tested for the sulfur, carbon and chloride contents. The LECO C/S
Analyzer was used to determine the total sulfur (Brown and Curry 2002a) and carbon (Brown
and Curry 2002b) contents of RHA by combustion. The chloride content was obtained by the
pressed powder XRF analysis (Bruker 2004).
4.2.5 Tap water
The normal tap water was used as the mixing water for preparing the concretes. The quality
of water was verified with respect to pH, total solids, chlorides, sulfates, and alkalis, which
were obtained from the tap water analysis conducted by the Regional Municipality of
Waterloo (2003). The tap water was also tested for the density at the ambient temperature
(24±20C).
4.2.6 Polycarboxylate-based high-range water reducer
A polycarboxylate-based HRWR, commercially known as Glenium 3400 NV, was used to
produce the required flowing ability of concrete. It was available in dark brown liquid form.
The HRWR was tested to verify whether it complies with the ASTM physical requirements
with respect to water content, setting time, compressive strength, flexural strength, length
change and relative durability factor (ASTM C494/C 494M, 2004). It was also tested for
relative density and solid content.
4.2.7 Synthetic air-entraining admixture
A synthetic AEA, commercially known as Micro Air, was used to produce the required air
content in concretes. It was available as brown aqueous solution. The AEA chosen was tested
to verify whether it conforms to the ASTM physical requirements with respect to bleeding,
setting time, compressive strength, flexural strength, length change, and relative durability
factor (ASTM C 260, 2004). It was also tested for relative density and solid content.
4.2.8 Modified polysaccharide-based viscosity-enhancing admixture
A water-soluble modified polysaccharide-based VEA, commercially known as Rheomac
VMA 362, was used to improve the segregation resistance of several concretes. It was a
67

Class A VEA according to the classification given by Rixom and Mailvaganam (1999). The
VEA was available as light brown liquid.
The ASTM or CSA currently has no standard specification for VEA. Nevertheless,
the “harmlessness” tests were conducted on the VEA selected with regard to setting time,
compressive strength, flexural strength, length change and relative durability factor in order
to identify any adverse effect of Rheomac VMA 362. The VEA was also tested for relative
density and solid content.
4.3 Characteristics of Concrete Stone
The concrete stone was characterized by a number of physical properties and gradation
obtained from sieve analysis before using in concrete.
4.3.1 Physical properties
The test results for the physical properties of concrete stone are given in Table 4.1. These
properties indicated that the concrete stone was suitable for use as coarse aggregate in
producing concretes. The mass finer than 75-μm sieve, mass loss due to unconfined freeze-
thaw, and mortar bar expansion were within the maximum permissible limits set by the
ASTM or CSA (ASTM C 33, 2004; CSA A23.1, 2004; CSA A23.2, 2004).
Table 4.1: Physical properties of concrete stone Property Value Maximum permissible limit Mass passing 75-μm sieve* 0.8% 1% (ASTM C33) Oven-dry basis bulk density 1670 kg/m3 --- Void content 37% --- Saturated surface-dry basis relative density 2.71 --- Absorption 1.5% --- Total evaporable moisture content 0.1% --- Mass loss due to unconfined freeze-thaw* 3.0% 6% (CSA A23.1) Accelerated mortar bar expansion* 0.08% 0.15% (CSA A23.2)
* Test results obtained from Peto MacCallum Ltd., Toronto, Ontario, Canada.
The saturated surface-dry basis relative density of concrete stone was 2.71. Most
natural aggregates possess relative densities between 2.4 to 2.9 (Kosmatka et al. 2002). The
absorption of concrete stone was 1.5%. The absorption of coarse aggregates usually varies
68
from 0.5 to 4.5% (Neville 1996). Thus, the absorption of concrete stone was in the lower
range, which is good for concretes. A higher absorption value is indicative of greater pores in
aggregates that might affect the strength and durability of concretes.
The oven-dry basis bulk density of concrete stone determined under compacted
condition was 1670 kg/m3. The bulk density of concrete aggregates generally varies from
1200 to 1750 kg/m3 (Kosmatka et al. 2002). It includes the pores and voids existing in
aggregates. The void content of concrete stone computed based on the oven-dry basis bulk
density was 37%. Thus, the void content obtained represents the percentage of voids between
compacted aggregates. The void content of coarse aggregates usually ranges from 30 to 45%
(Kosmatka et al. 2002).
The concrete stone used was air-dried. There was no free or surface moisture on the
surface of aggregates. Therefore, the concrete stone contained a negligible amount of total
evaporable moisture (0.1%). The moisture content of coarse aggregates is generally not
considered in the primary mixture proportions of concrete. But the moisture content increases
the quantity of mixing water that produces a higher W/B ratio and thus produces an impact
on the properties of concrete. Hence, the moisture content of the aggregates should be given
due allowance to adjust the mixture proportions of concrete.
4.3.2 Gradation
The gradation of concrete stone obtained from the sieve analysis is presented in Figure 4.1.
The coefficient of gradation for the gradation curve of concrete stone was 1.12. It indicates
that the concrete stone used was well-graded. A well-graded material usually provides a
coefficient of gradation in the range of 1 to 3 (Das 1999). Moreover, the grading of the
different sizes of concrete stone was between the upper and lower limits specified in ASTM
C 33 (2004). The predominant portion of the concrete stone was between the coarser sieve
sizes of 19 and 9.5 mm. Therefore, the fineness modulus of concrete stone was also higher.
The fineness modulus obtained was 6.78. The fineness modulus of coarse aggregate can vary
from 6.30 to 6.90 for the acceptable grading range specified by the ASTM (ASTM C 33,
2004).
The gradation of concrete stone or coarse aggregates affects the workability or
flowing ability (filling ability and passing ability) of concrete. This is because it affects the
69
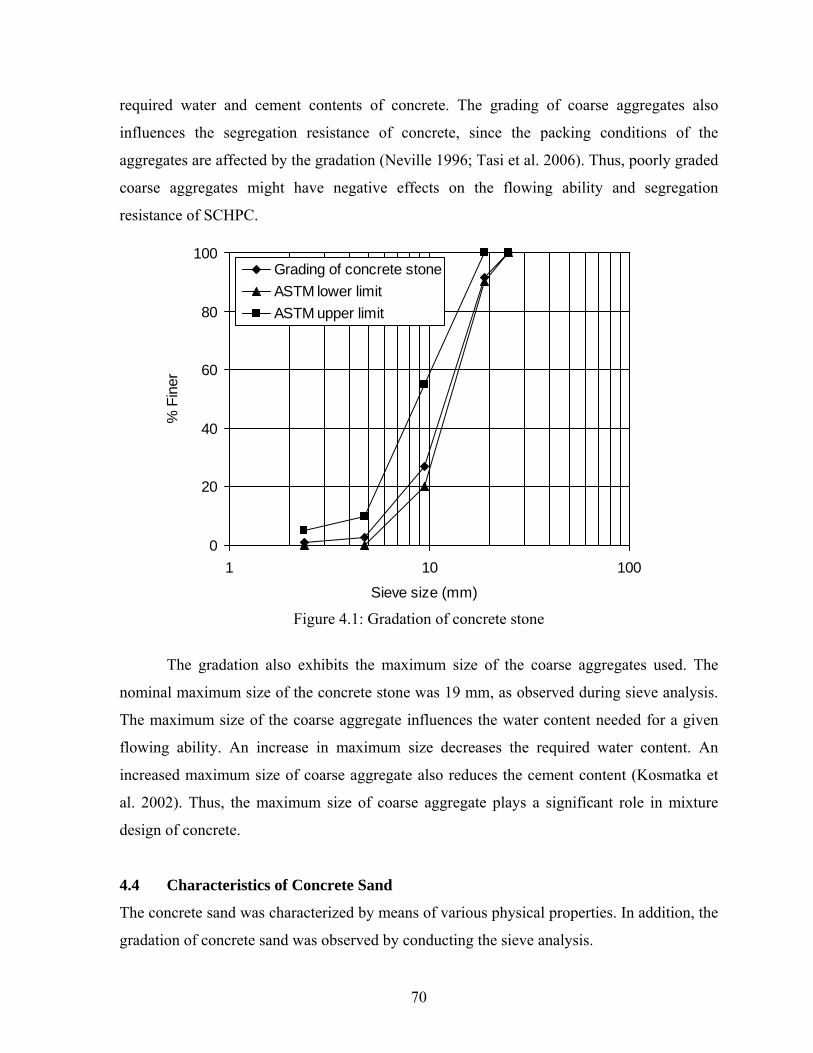
required water and cement contents of concrete. The grading of coarse aggregates also
influences the segregation resistance of concrete, since the packing conditions of the
aggregates are affected by the gradation (Neville 1996; Tasi et al. 2006). Thus, poorly graded
coarse aggregates might have negative effects on the flowing ability and segregation
resistance of SCHPC.
0
20
40
60
80
100
1 10 100
Sieve size (mm)
% F
iner
Grading of concrete stoneASTM lower limitASTM upper limit
Figure 4.1: Gradation of concrete stone
The gradation also exhibits the maximum size of the coarse aggregates used. The
nominal maximum size of the concrete stone was 19 mm, as observed during sieve analysis.
The maximum size of the coarse aggregate influences the water content needed for a given
flowing ability. An increase in maximum size decreases the required water content. An
increased maximum size of coarse aggregate also reduces the cement content (Kosmatka et
al. 2002). Thus, the maximum size of coarse aggregate plays a significant role in mixture
design of concrete.
4.4 Characteristics of Concrete Sand
The concrete sand was characterized by means of various physical properties. In addition, the
gradation of concrete sand was observed by conducting the sieve analysis.
70
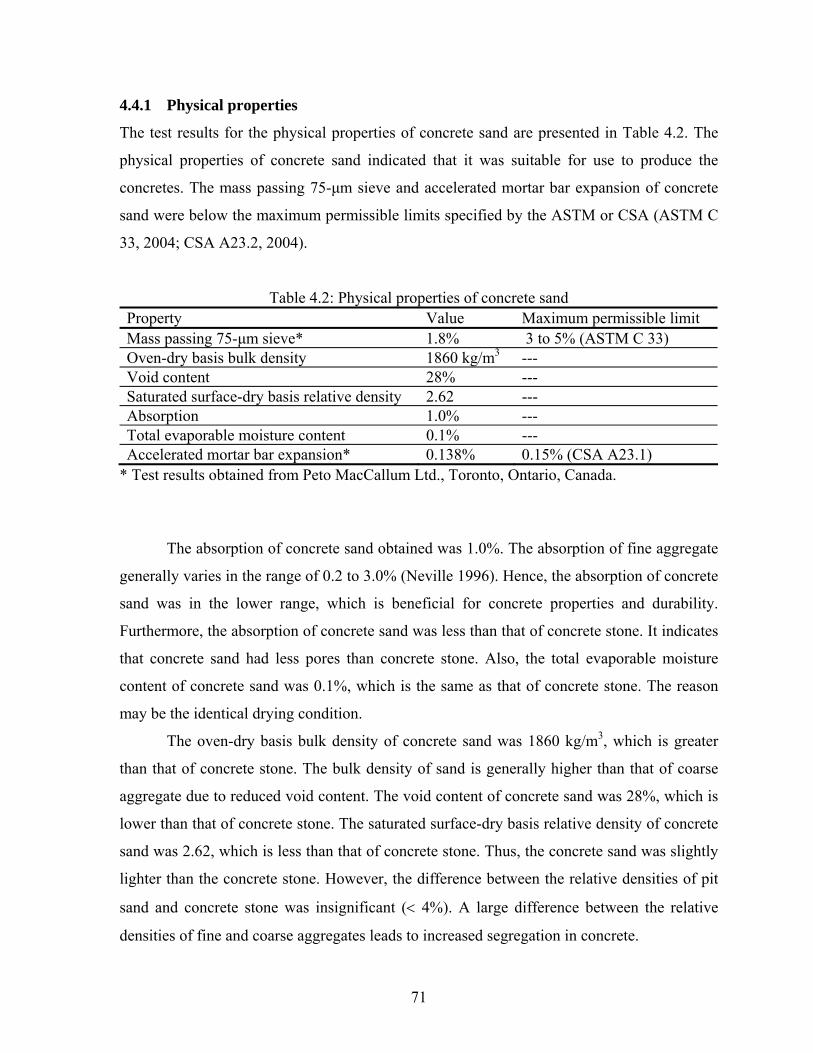
4.4.1 Physical properties
The test results for the physical properties of concrete sand are presented in Table 4.2. The
physical properties of concrete sand indicated that it was suitable for use to produce the
concretes. The mass passing 75-μm sieve and accelerated mortar bar expansion of concrete
sand were below the maximum permissible limits specified by the ASTM or CSA (ASTM C
33, 2004; CSA A23.2, 2004).
Table 4.2: Physical properties of concrete sand Property Value Maximum permissible limit Mass passing 75-μm sieve* 1.8% 3 to 5% (ASTM C 33) Oven-dry basis bulk density 1860 kg/m3 --- Void content 28% --- Saturated surface-dry basis relative density 2.62 --- Absorption 1.0% --- Total evaporable moisture content 0.1% --- Accelerated mortar bar expansion* 0.138% 0.15% (CSA A23.1)
* Test results obtained from Peto MacCallum Ltd., Toronto, Ontario, Canada.
The absorption of concrete sand obtained was 1.0%. The absorption of fine aggregate
generally varies in the range of 0.2 to 3.0% (Neville 1996). Hence, the absorption of concrete
sand was in the lower range, which is beneficial for concrete properties and durability.
Furthermore, the absorption of concrete sand was less than that of concrete stone. It indicates
that concrete sand had less pores than concrete stone. Also, the total evaporable moisture
content of concrete sand was 0.1%, which is the same as that of concrete stone. The reason
may be the identical drying condition.
The oven-dry basis bulk density of concrete sand was 1860 kg/m3, which is greater
than that of concrete stone. The bulk density of sand is generally higher than that of coarse
aggregate due to reduced void content. The void content of concrete sand was 28%, which is
lower than that of concrete stone. The saturated surface-dry basis relative density of concrete
sand was 2.62, which is less than that of concrete stone. Thus, the concrete sand was slightly
lighter than the concrete stone. However, the difference between the relative densities of pit
sand and concrete stone was insignificant (< 4%). A large difference between the relative
densities of fine and coarse aggregates leads to increased segregation in concrete.
71
4.4.2 Gradation
The gradation of concrete sand obtained from the sieve analysis is shown in Figure 4.2. The
coefficient of gradation was 1.03, which is greater than 1. Thus, the concrete sand was
considered well-graded. Furthermore, the grading of different sizes of concrete sand was
within the limits specified by the ASTM (ASTM C 33, 2004).
0
20
40
60
80
100
120
0.1 1 10
Sieve size (mm)
% F
iner
Grading of concrete sandASTM lower limitASTM upper limit
Figure 4.2: Gradation of concrete sand
The nominal maximum size and fineness modulus of concrete sand were obtained
from the sieve analysis. The nominal maximum size and fineness modulus of concrete sand
were 4.75 and 2.74, respectively. The fineness modulus indicated that the concrete sand was
appropriate for producing concrete mixtures. The fineness modulus of sand for use in
concrete generally varies in the range of 2.4 to 3.2 (ACI 211.4R-93, 2004; Nawy 1996,
Kosmatka et al. 2002).
The gradation of sand influences the total surface area of the aggregates that
determines the water demand as well as affects the compressive strength of concrete mixture
(Neville 1996). Thus, it influences the mixture design of concrete. Moreover, the sand
72
gradation affects the flow properties of mortar (Hu and Wang 2005), and influences the
physical packing of constituent materials in concrete (Tasi et al. 2006). Consequently, the
sand gradation may affect the properties of SCHPC.
4.5 Characteristics of Normal Portland Cement
The normal portland cement was characterized by determining various physical properties,
chemical composition and particle size distribution.
4.5.1 Physical properties
The test results for the physical properties of cement used are shown in Table 4.3. The sieve
fineness by 45-μm sieve, Blaine specific surface area and compressive strength were above
the minimum permissible limits where as the time of setting, autoclave expansion and air
content were below the maximum permissible limits set by the ASTM and CSA (ASTM
C150, 2004; CSA A23.1, 2004). In addition, the relative density of cement was 3.16. The
density of portland cement usually varies from 3.10 to 3.25 (Kosmatka et al. 2002). Thus, the
normal portland cement was physically suitable to produce the concretes for this study.
Table 4.3: Physical properties of normal portland cement Property Value Permissible limit Relative density 3.16 ---
Blaine specific surface area: 412 m2/kg ≥ 280 (ASTM C 150) % passing 45-μm wet sieve*: 91.5 ≥ 72% (CSA A23.1) % passing 75-μm dry sieve: 99.1 ---
Fineness
% passing 150-μm dry sieve: 99.9 --- Time of setting (Vicat)*
Initial: 132 min 45 – 375 min (ASTM C 150)
3 days: 26.9 MPa ≥ 14.5 MPa (CSA A23.1) 7 days: 32.2 MPa ≥ 20 MPa (CSA A23.1)
Compressive strength*
28 days: 38.8 MPa ≥ 26.5 MPa (CSA A23.1) Autoclave expansion*
0.11% ≤ 0.80% (ASTM C 150)
Air content* 7.2% ≤ 12% (ASTM C 150) *Test results obtained from Lafarge North America, Woodstock, Ontario, Canada.
The Blaine specific surface area and both the dry and wet sieve finenesses assist to
check the ground condition of cement. However, the Blaine specific surface area is widely
73
used to represent the surface fineness of cement. This is better than sieve fineness because it
provides an idea of uniformity of the fineness. Also, the specific surface area acts as a
measure for the frequency of the particles of average size.
The setting time is an indicator of the unsoundness of cement due to storage. The
compressive strength of cement is used to indicate its contribution to the strength of concrete.
The autoclave expansion indicates the soundness of cement. The air content indicates the
suitability of cement for use in air-entrained concretes. The relative density of cement does
not reflect the quality of cement, but it is used for the design and control of concrete
mixtures.
4.5.2 Particle size distribution
The particle size distribution of normal portland cement is shown in Figure 4.3. The cement
particles were well-graded. The coefficient of gradation was 1.084, which is greater than 1,
hence indicating a good grading of the cement.
Most of the cement particles were in the smaller range. Approximately 90% of the
cement particles were smaller than 45 μm, as can be seen from Figure 4.3. The median size
of the cement was 15 μm. The particle size distribution is also related to the fineness of
cement. The greater the amount of smaller cement particles, the higher is the cement
fineness. A greater amount of smaller particle sizes increases the rate of cement hydration,
and thus accelerates the strength development in concrete.
4.5.3 Chemical composition
The chemical composition of cement is shown in Table 4.4. The cement used fulfilled the
chemical requirements specified by the ASTM and CSA (ASTM C 150, 2004; CAN/CSA
A3001, 2003). It was mainly composed of the oxides of several metallic elements. The
cement had magnesium oxide and sulfur trioxide below the maximum permissible limits. But
the equivalent alkali content was higher than the maximum specified limit. The excessive
amounts of magnesium oxide and sulfur trioxide make the cement unsound. In addition, the
cement may cause alkali-aggregate reaction, efflorescence and staining in concrete if the
alkali content is excessive. However, the limit for alkali content is given for the cement
intended to be used with potentially reactive aggregates (ASTM C 150, 2004). Since, the
74
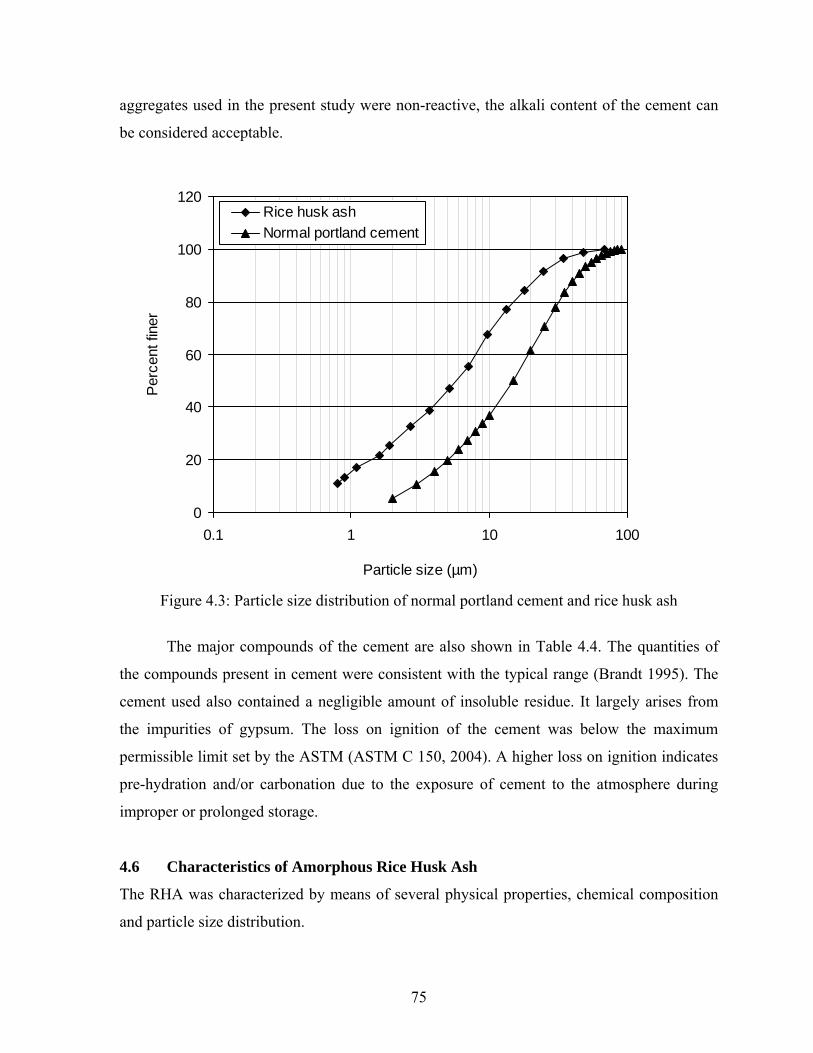
aggregates used in the present study were non-reactive, the alkali content of the cement can
be considered acceptable.
0
20
40
60
80
100
120
0.1 1 10 100
Particle size (µm)
Per
cent
fine
r
Rice husk ashNormal portland cement
Figure 4.3: Particle size distribution of normal portland cement and rice husk ash
The major compounds of the cement are also shown in Table 4.4. The quantities of
the compounds present in cement were consistent with the typical range (Brandt 1995). The
cement used also contained a negligible amount of insoluble residue. It largely arises from
the impurities of gypsum. The loss on ignition of the cement was below the maximum
permissible limit set by the ASTM (ASTM C 150, 2004). A higher loss on ignition indicates
pre-hydration and/or carbonation due to the exposure of cement to the atmosphere during
improper or prolonged storage.
4.6 Characteristics of Amorphous Rice Husk Ash
The RHA was characterized by means of several physical properties, chemical composition
and particle size distribution.
75
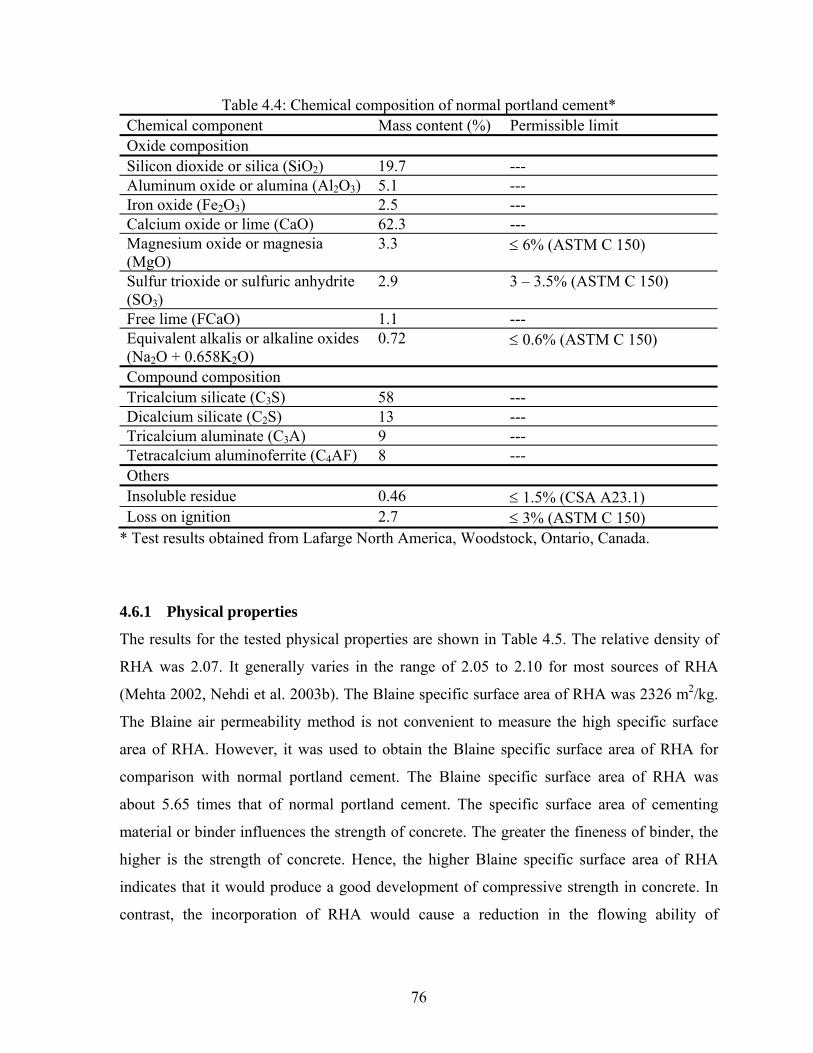
Table 4.4: Chemical composition of normal portland cement* Chemical component Mass content (%) Permissible limit Oxide composition Silicon dioxide or silica (SiO2) 19.7 --- Aluminum oxide or alumina (Al2O3) 5.1 --- Iron oxide (Fe2O3) 2.5 --- Calcium oxide or lime (CaO) 62.3 --- Magnesium oxide or magnesia (MgO)
3.3 ≤ 6% (ASTM C 150)
Sulfur trioxide or sulfuric anhydrite (SO3)
2.9 3 – 3.5% (ASTM C 150)
Free lime (FCaO) 1.1 --- Equivalent alkalis or alkaline oxides (Na2O + 0.658K2O)
0.72 ≤ 0.6% (ASTM C 150)
Compound composition Tricalcium silicate (C3S) 58 --- Dicalcium silicate (C2S) 13 --- Tricalcium aluminate (C3A) 9 --- Tetracalcium aluminoferrite (C4AF) 8 --- Others Insoluble residue 0.46 ≤ 1.5% (CSA A23.1) Loss on ignition 2.7 ≤ 3% (ASTM C 150)
* Test results obtained from Lafarge North America, Woodstock, Ontario, Canada.
4.6.1 Physical properties
The results for the tested physical properties are shown in Table 4.5. The relative density of
RHA was 2.07. It generally varies in the range of 2.05 to 2.10 for most sources of RHA
(Mehta 2002, Nehdi et al. 2003b). The Blaine specific surface area of RHA was 2326 m2/kg.
The Blaine air permeability method is not convenient to measure the high specific surface
area of RHA. However, it was used to obtain the Blaine specific surface area of RHA for
comparison with normal portland cement. The Blaine specific surface area of RHA was
about 5.65 times that of normal portland cement. The specific surface area of cementing
material or binder influences the strength of concrete. The greater the fineness of binder, the
higher is the strength of concrete. Hence, the higher Blaine specific surface area of RHA
indicates that it would produce a good development of compressive strength in concrete. In
contrast, the incorporation of RHA would cause a reduction in the flowing ability of
76
concrete. This is because the increase in specific surface area results in a greater water
demand and reduces the amount of free water available in concrete mixture.
Table 4.5: Physical properties of rice husk ash Property Value Relative density 2.07 Blaine specific surface area 2326 m2/kg Accelerated pozzolanic activity 122.4%
The accelerated pozzolanic activity index was 122.4%, which is much higher than
85%, the minimum requirement for silica fume (ASTM C 1240, 2004). The pozzolanic
activity of RHA is generally greater than that of other supplementary cementing materials
such as silica fume (Nehdi et al. 2003b). This is due to extremely high specific surface area
of RHA. The specific surface area of RHA is much higher than that of fly ash and ground
granulated blast-furnace slag, and even silica fume. The specific surface area of RHA by
nitrogen adsorption can be about 1.5 times that of silica fume (Zhang and Malhotra 1996).
Nevertheless, the high accelerated pozzolanic activity index of RHA indicates that it would
accelerate the strength development at the early ages of concrete.
4.6.2 Particle size distribution
The particle size distribution of RHA is shown in Figure 4.3. It was obtained using a soil
hydrometer based on the principle of Stokes’ law for particle size determination. This method
is widely used for obtaining an estimate of the distribution of soil particle sizes ranging from
1 to 75 μm. The range of soil particle sizes for the hydrometer analysis to be valid is
approximately 0.2 to 200 μm, which also covers the size range of RHA. In addition, the dry
sample is mixed with distilled water and a small amount of dispersing agent to form the
suspension for use in hydrometer analysis. A similar sample preparation is also applicable for
RHA since it does not react with water.
The RHA particles were well-graded with a coefficient of gradation approximately 1.
About 85% of the RHA particles were smaller than 20 μm. The median particle size of RHA
was 6 μm. A median diameter of RHA in the range of 6 to 15 μm is preferred with respect to
workability and cohesiveness (Mehta 2002). The median particle size of RHA was 2.5 times
finer than that of cement. The lower particle size of RHA contributes to reduce the bleeding
77
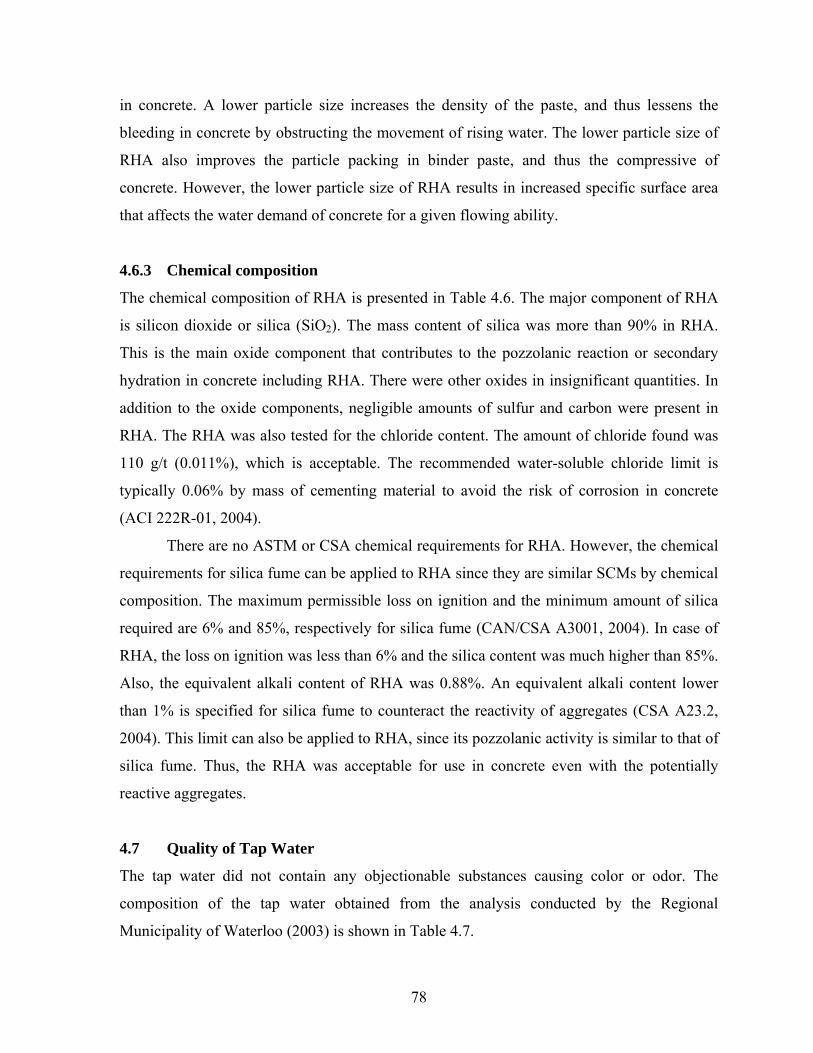
in concrete. A lower particle size increases the density of the paste, and thus lessens the
bleeding in concrete by obstructing the movement of rising water. The lower particle size of
RHA also improves the particle packing in binder paste, and thus the compressive of
concrete. However, the lower particle size of RHA results in increased specific surface area
that affects the water demand of concrete for a given flowing ability.
4.6.3 Chemical composition
The chemical composition of RHA is presented in Table 4.6. The major component of RHA
is silicon dioxide or silica (SiO2). The mass content of silica was more than 90% in RHA.
This is the main oxide component that contributes to the pozzolanic reaction or secondary
hydration in concrete including RHA. There were other oxides in insignificant quantities. In
addition to the oxide components, negligible amounts of sulfur and carbon were present in
RHA. The RHA was also tested for the chloride content. The amount of chloride found was
110 g/t (0.011%), which is acceptable. The recommended water-soluble chloride limit is
typically 0.06% by mass of cementing material to avoid the risk of corrosion in concrete
(ACI 222R-01, 2004).
There are no ASTM or CSA chemical requirements for RHA. However, the chemical
requirements for silica fume can be applied to RHA since they are similar SCMs by chemical
composition. The maximum permissible loss on ignition and the minimum amount of silica
required are 6% and 85%, respectively for silica fume (CAN/CSA A3001, 2004). In case of
RHA, the loss on ignition was less than 6% and the silica content was much higher than 85%.
Also, the equivalent alkali content of RHA was 0.88%. An equivalent alkali content lower
than 1% is specified for silica fume to counteract the reactivity of aggregates (CSA A23.2,
2004). This limit can also be applied to RHA, since its pozzolanic activity is similar to that of
silica fume. Thus, the RHA was acceptable for use in concrete even with the potentially
reactive aggregates.
4.7 Quality of Tap Water
The tap water did not contain any objectionable substances causing color or odor. The
composition of the tap water obtained from the analysis conducted by the Regional
Municipality of Waterloo (2003) is shown in Table 4.7.
78
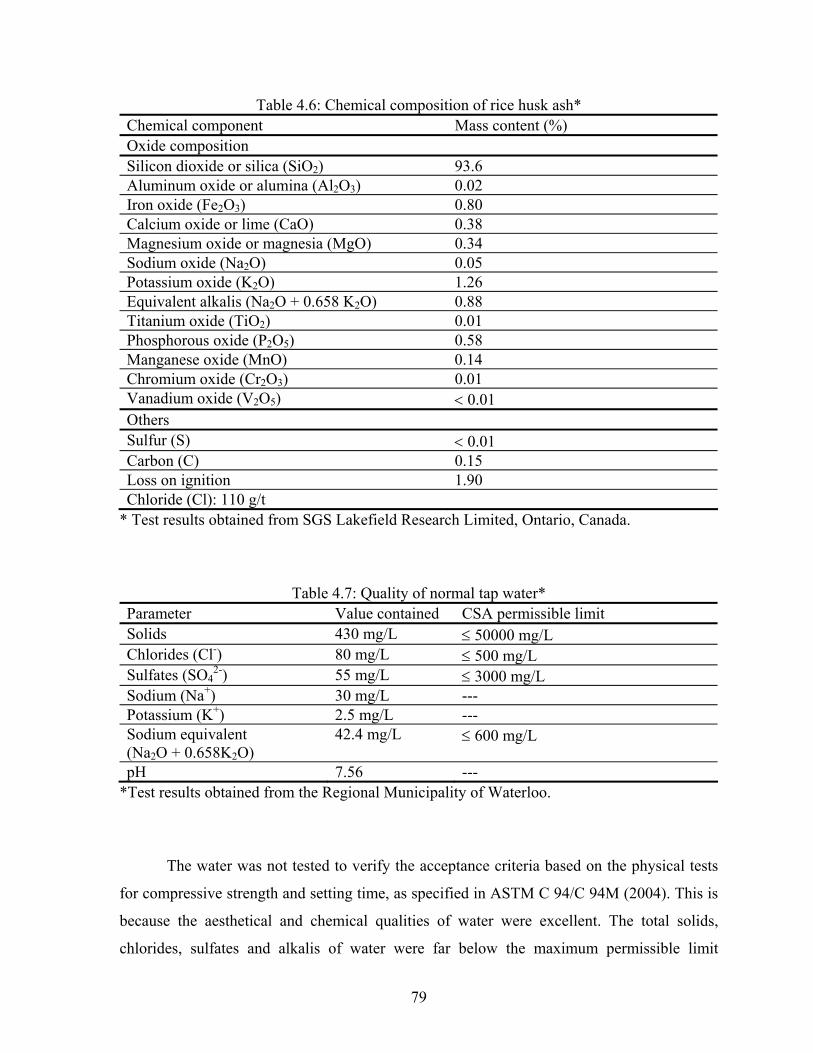
Table 4.6: Chemical composition of rice husk ash* Chemical component Mass content (%) Oxide composition Silicon dioxide or silica (SiO2) 93.6 Aluminum oxide or alumina (Al2O3) 0.02 Iron oxide (Fe2O3) 0.80 Calcium oxide or lime (CaO) 0.38 Magnesium oxide or magnesia (MgO) 0.34 Sodium oxide (Na2O) 0.05 Potassium oxide (K2O) 1.26 Equivalent alkalis (Na2O + 0.658 K2O) 0.88 Titanium oxide (TiO2) 0.01 Phosphorous oxide (P2O5) 0.58 Manganese oxide (MnO) 0.14 Chromium oxide (Cr2O3) 0.01 Vanadium oxide (V2O5) < 0.01 Others Sulfur (S) < 0.01 Carbon (C) 0.15 Loss on ignition 1.90 Chloride (Cl): 110 g/t
* Test results obtained from SGS Lakefield Research Limited, Ontario, Canada.
Table 4.7: Quality of normal tap water* Parameter Value contained CSA permissible limit Solids 430 mg/L ≤ 50000 mg/L Chlorides (Cl-) 80 mg/L ≤ 500 mg/L Sulfates (SO4
2-) 55 mg/L ≤ 3000 mg/L Sodium (Na+) 30 mg/L --- Potassium (K+) 2.5 mg/L --- Sodium equivalent (Na2O + 0.658K2O)
42.4 mg/L ≤ 600 mg/L
pH 7.56 --- *Test results obtained from the Regional Municipality of Waterloo.
The water was not tested to verify the acceptance criteria based on the physical tests
for compressive strength and setting time, as specified in ASTM C 94/C 94M (2004). This is
because the aesthetical and chemical qualities of water were excellent. The total solids,
chlorides, sulfates and alkalis of water were far below the maximum permissible limit
79
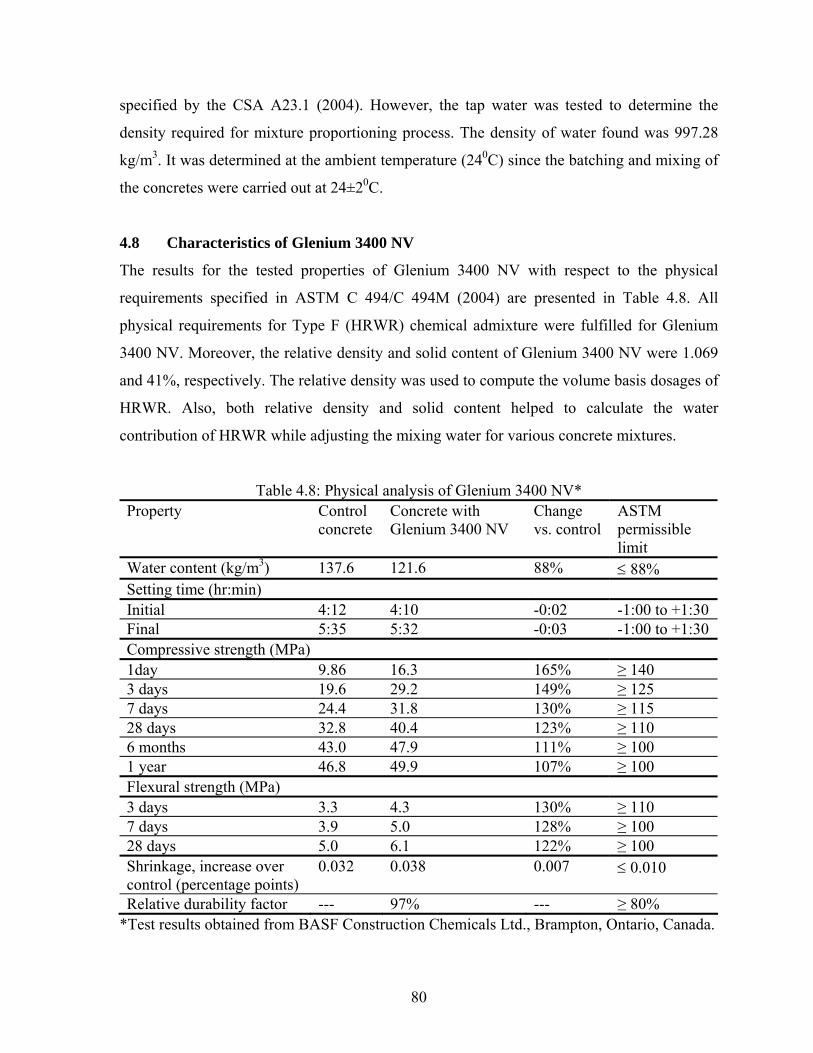
specified by the CSA A23.1 (2004). However, the tap water was tested to determine the
density required for mixture proportioning process. The density of water found was 997.28
kg/m3. It was determined at the ambient temperature (240C) since the batching and mixing of
the concretes were carried out at 24±20C.
4.8 Characteristics of Glenium 3400 NV
The results for the tested properties of Glenium 3400 NV with respect to the physical
requirements specified in ASTM C 494/C 494M (2004) are presented in Table 4.8. All
physical requirements for Type F (HRWR) chemical admixture were fulfilled for Glenium
3400 NV. Moreover, the relative density and solid content of Glenium 3400 NV were 1.069
and 41%, respectively. The relative density was used to compute the volume basis dosages of
HRWR. Also, both relative density and solid content helped to calculate the water
contribution of HRWR while adjusting the mixing water for various concrete mixtures.
Table 4.8: Physical analysis of Glenium 3400 NV* Property Control
concrete Concrete with Glenium 3400 NV
Change vs. control
ASTM permissible limit
Water content (kg/m3) 137.6 121.6 88% ≤ 88% Setting time (hr:min) Initial 4:12 4:10 -0:02 -1:00 to +1:30 Final 5:35 5:32 -0:03 -1:00 to +1:30 Compressive strength (MPa) 1day 9.86 16.3 165% ≥ 140 3 days 19.6 29.2 149% ≥ 125 7 days 24.4 31.8 130% ≥ 115 28 days 32.8 40.4 123% ≥ 110 6 months 43.0 47.9 111% ≥ 100 1 year 46.8 49.9 107% ≥ 100 Flexural strength (MPa) 3 days 3.3 4.3 130% ≥ 110 7 days 3.9 5.0 128% ≥ 100 28 days 5.0 6.1 122% ≥ 100 Shrinkage, increase over control (percentage points)
0.032 0.038 0.007 ≤ 0.010
Relative durability factor --- 97% --- ≥ 80% *Test results obtained from BASF Construction Chemicals Ltd., Brampton, Ontario, Canada.
80
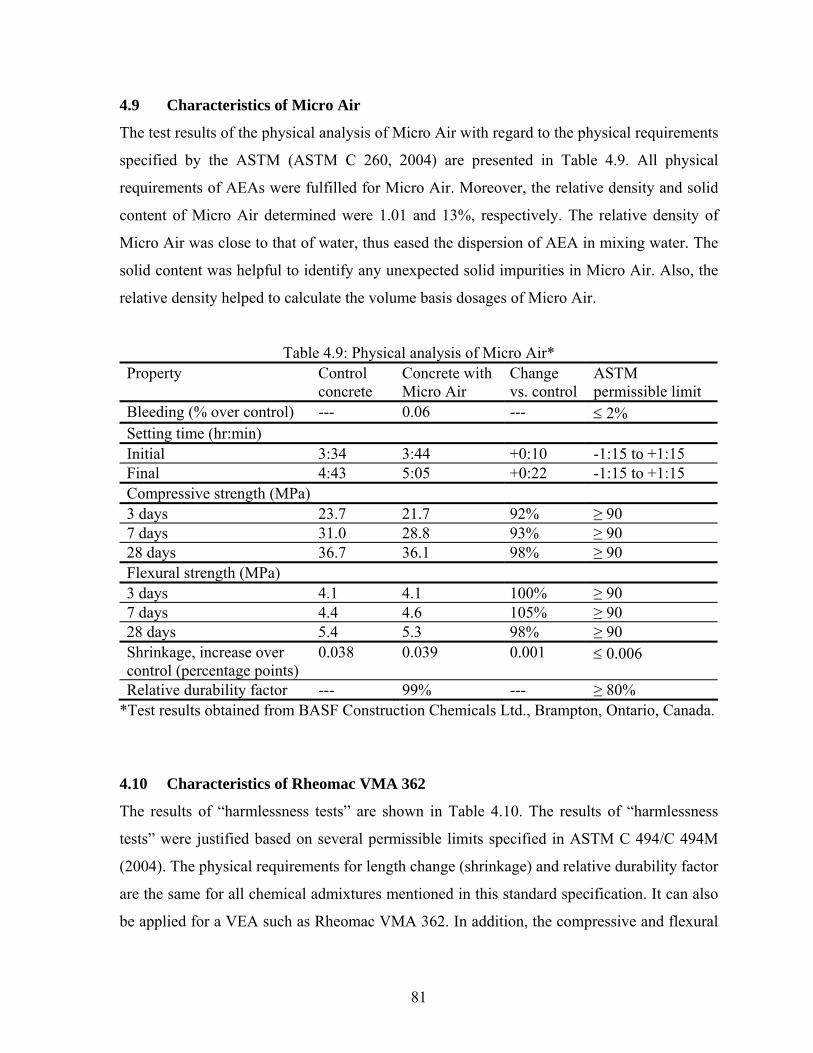
4.9 Characteristics of Micro Air
The test results of the physical analysis of Micro Air with regard to the physical requirements
specified by the ASTM (ASTM C 260, 2004) are presented in Table 4.9. All physical
requirements of AEAs were fulfilled for Micro Air. Moreover, the relative density and solid
content of Micro Air determined were 1.01 and 13%, respectively. The relative density of
Micro Air was close to that of water, thus eased the dispersion of AEA in mixing water. The
solid content was helpful to identify any unexpected solid impurities in Micro Air. Also, the
relative density helped to calculate the volume basis dosages of Micro Air.
Table 4.9: Physical analysis of Micro Air* Property Control
concrete Concrete with Micro Air
Change vs. control
ASTM permissible limit
Bleeding (% over control) --- 0.06 --- ≤ 2% Setting time (hr:min) Initial 3:34 3:44 +0:10 -1:15 to +1:15 Final 4:43 5:05 +0:22 -1:15 to +1:15 Compressive strength (MPa) 3 days 23.7 21.7 92% ≥ 90 7 days 31.0 28.8 93% ≥ 90 28 days 36.7 36.1 98% ≥ 90 Flexural strength (MPa) 3 days 4.1 4.1 100% ≥ 90 7 days 4.4 4.6 105% ≥ 90 28 days 5.4 5.3 98% ≥ 90 Shrinkage, increase over control (percentage points)
0.038 0.039 0.001 ≤ 0.006
Relative durability factor --- 99% --- ≥ 80% *Test results obtained from BASF Construction Chemicals Ltd., Brampton, Ontario, Canada.
4.10 Characteristics of Rheomac VMA 362
The results of “harmlessness tests” are shown in Table 4.10. The results of “harmlessness
tests” were justified based on several permissible limits specified in ASTM C 494/C 494M
(2004). The physical requirements for length change (shrinkage) and relative durability factor
are the same for all chemical admixtures mentioned in this standard specification. It can also
be applied for a VEA such as Rheomac VMA 362. In addition, the compressive and flexural
81
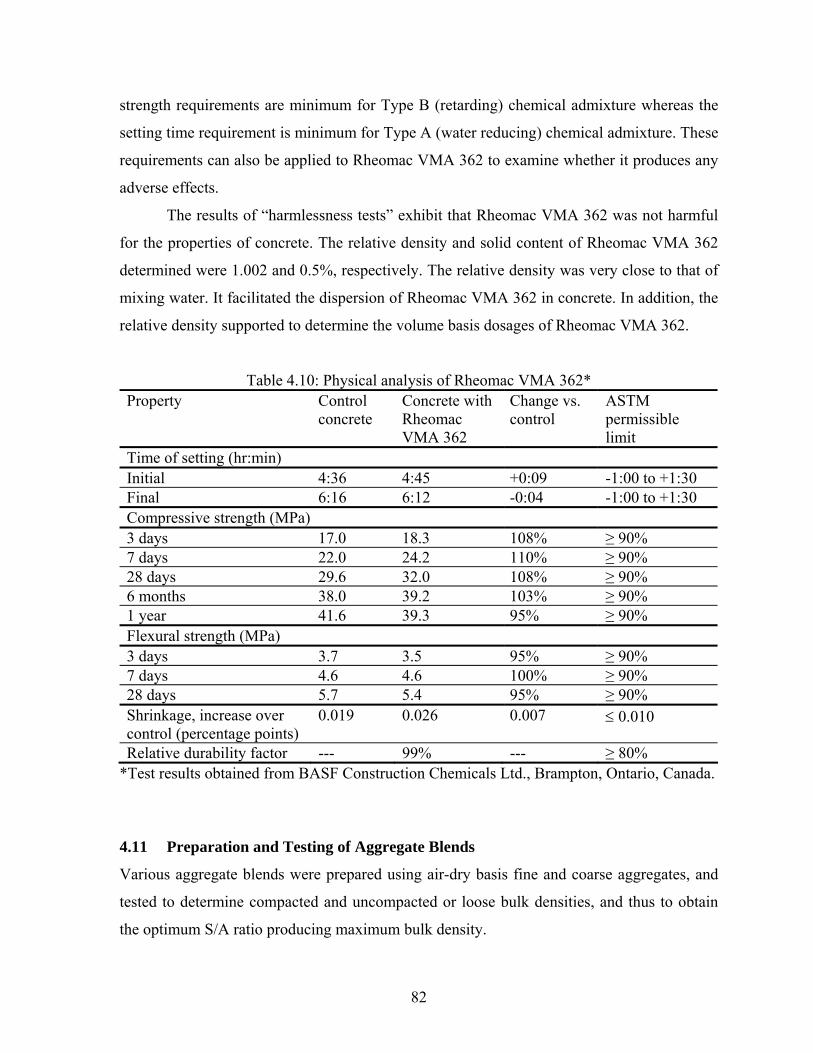
strength requirements are minimum for Type B (retarding) chemical admixture whereas the
setting time requirement is minimum for Type A (water reducing) chemical admixture. These
requirements can also be applied to Rheomac VMA 362 to examine whether it produces any
adverse effects.
The results of “harmlessness tests” exhibit that Rheomac VMA 362 was not harmful
for the properties of concrete. The relative density and solid content of Rheomac VMA 362
determined were 1.002 and 0.5%, respectively. The relative density was very close to that of
mixing water. It facilitated the dispersion of Rheomac VMA 362 in concrete. In addition, the
relative density supported to determine the volume basis dosages of Rheomac VMA 362.
Table 4.10: Physical analysis of Rheomac VMA 362* Property Control
concrete Concrete with Rheomac VMA 362
Change vs. control
ASTM permissible limit
Time of setting (hr:min) Initial 4:36 4:45 +0:09 -1:00 to +1:30 Final 6:16 6:12 -0:04 -1:00 to +1:30 Compressive strength (MPa) 3 days 17.0 18.3 108% ≥ 90% 7 days 22.0 24.2 110% ≥ 90% 28 days 29.6 32.0 108% ≥ 90% 6 months 38.0 39.2 103% ≥ 90% 1 year 41.6 39.3 95% ≥ 90% Flexural strength (MPa) 3 days 3.7 3.5 95% ≥ 90% 7 days 4.6 4.6 100% ≥ 90% 28 days 5.7 5.4 95% ≥ 90% Shrinkage, increase over control (percentage points)
0.019 0.026 0.007 ≤ 0.010
Relative durability factor --- 99% --- ≥ 80% *Test results obtained from BASF Construction Chemicals Ltd., Brampton, Ontario, Canada.
4.11 Preparation and Testing of Aggregate Blends
Various aggregate blends were prepared using air-dry basis fine and coarse aggregates, and
tested to determine compacted and uncompacted or loose bulk densities, and thus to obtain
the optimum S/A ratio producing maximum bulk density.
82
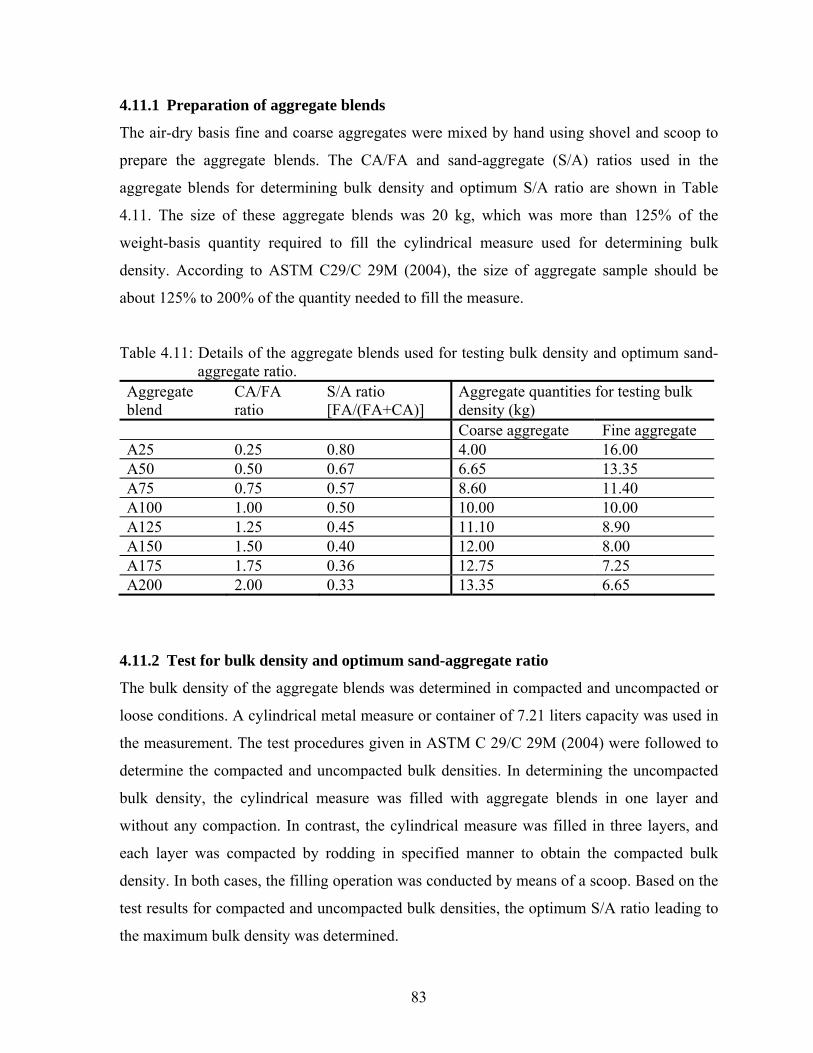
4.11.1 Preparation of aggregate blends
The air-dry basis fine and coarse aggregates were mixed by hand using shovel and scoop to
prepare the aggregate blends. The CA/FA and sand-aggregate (S/A) ratios used in the
aggregate blends for determining bulk density and optimum S/A ratio are shown in Table
4.11. The size of these aggregate blends was 20 kg, which was more than 125% of the
weight-basis quantity required to fill the cylindrical measure used for determining bulk
density. According to ASTM C29/C 29M (2004), the size of aggregate sample should be
about 125% to 200% of the quantity needed to fill the measure.
Table 4.11: Details of the aggregate blends used for testing bulk density and optimum sand-aggregate ratio.
Aggregate blend
CA/FA ratio
S/A ratio [FA/(FA+CA)]
Aggregate quantities for testing bulk density (kg)
Coarse aggregate Fine aggregate A25 0.25 0.80 4.00 16.00 A50 0.50 0.67 6.65 13.35 A75 0.75 0.57 8.60 11.40 A100 1.00 0.50 10.00 10.00 A125 1.25 0.45 11.10 8.90 A150 1.50 0.40 12.00 8.00 A175 1.75 0.36 12.75 7.25 A200 2.00 0.33 13.35 6.65
4.11.2 Test for bulk density and optimum sand-aggregate ratio
The bulk density of the aggregate blends was determined in compacted and uncompacted or
loose conditions. A cylindrical metal measure or container of 7.21 liters capacity was used in
the measurement. The test procedures given in ASTM C 29/C 29M (2004) were followed to
determine the compacted and uncompacted bulk densities. In determining the uncompacted
bulk density, the cylindrical measure was filled with aggregate blends in one layer and
without any compaction. In contrast, the cylindrical measure was filled in three layers, and
each layer was compacted by rodding in specified manner to obtain the compacted bulk
density. In both cases, the filling operation was conducted by means of a scoop. Based on the
test results for compacted and uncompacted bulk densities, the optimum S/A ratio leading to
the maximum bulk density was determined.
83
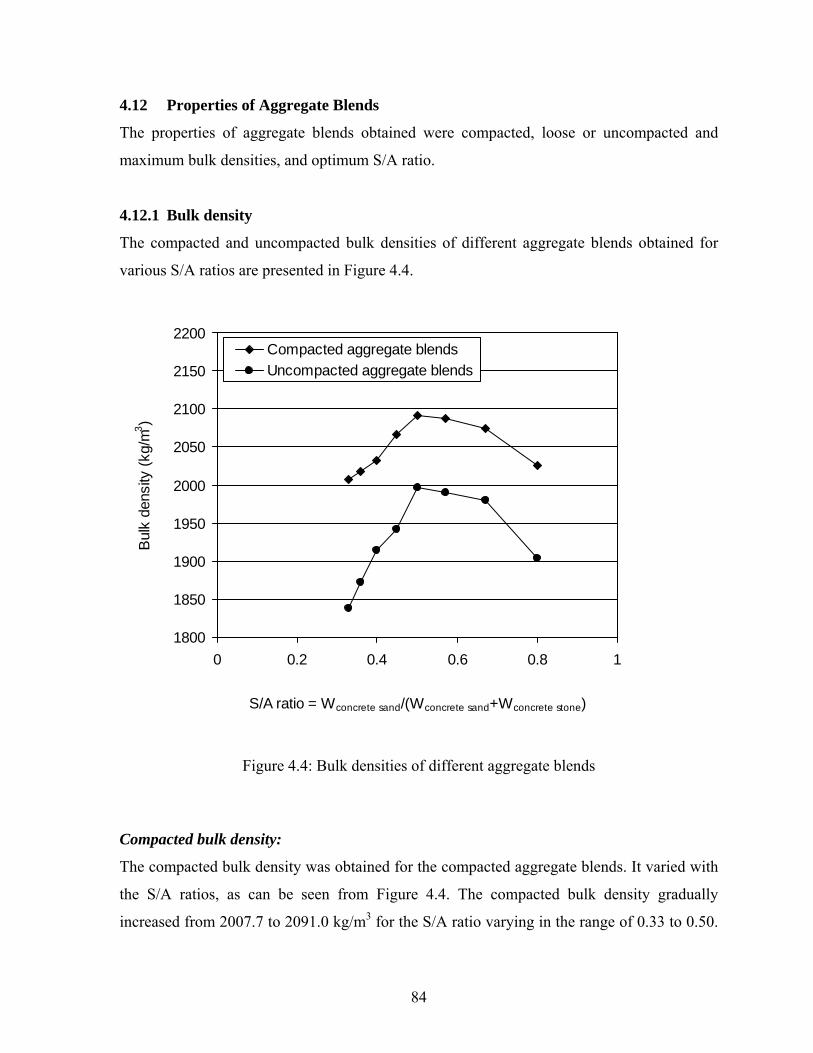
4.12 Properties of Aggregate Blends
The properties of aggregate blends obtained were compacted, loose or uncompacted and
maximum bulk densities, and optimum S/A ratio.
4.12.1 Bulk density
The compacted and uncompacted bulk densities of different aggregate blends obtained for
various S/A ratios are presented in Figure 4.4.
1800
1850
1900
1950
2000
2050
2100
2150
2200
0 0.2 0.4 0.6 0.8 1
S/A ratio = Wconcrete sand/(Wconcrete sand+Wconcrete stone)
Bul
k de
nsity
(kg/
m3 )
Compacted aggregate blendsUncompacted aggregate blends
Figure 4.4: Bulk densities of different aggregate blends
Compacted bulk density:
The compacted bulk density was obtained for the compacted aggregate blends. It varied with
the S/A ratios, as can be seen from Figure 4.4. The compacted bulk density gradually
increased from 2007.7 to 2091.0 kg/m3 for the S/A ratio varying in the range of 0.33 to 0.50.
84
Then it decreased with the increase in S/A ratio. This suggests that the extent of voids
between aggregates also varied with different S/A ratios.
Uncompacted bulk density:
The uncompacted bulk density was obtained for the loose aggregate blends. Similar to
compacted bulk density, it also varied with the S/A ratios, as can be seen from Figure 4.4.
The uncompacted bulk density gradually increased from 1837.8 to 1997.3 kg/m3 for the S/A
ratio varying in the range of 0.33 to 0.50. Also, the curve of uncompacted bulk density
obtained was below that of compacted bulk density. This is because the uncompacted bulk
density was lower than the compacted bulk density for all S/A ratios. The lower
uncompacted bulk density indicates the presence of greater void content in aggregate blends.
Maximum bulk density:
The bulk density of the aggregate blends reached a maximum value for a particular S/A ratio.
It was called the maximum bulk density. The compacted and uncompacted maximum bulk
densities obtained were 2091.0 and 1997.3 kg/m3, respectively. The maximum bulk density is
accompanied with a minimum void content in aggregate blend that contributes to produce
low porosity and good compressive strength in concretes.
4.12.2 Optimum sand-aggregate ratio
The S/A ratio, which resulted in the maximum bulk density in aggregate blends was defined
as the optimum S/A ratio. For both compacted and uncompacted aggregate blends, the
optimum S/A ratio found was 0.50, as can be seen from Figure 4.4.
4.13 Use of Properties of Constituent Materials and Aggregate Blends
The properties of the constituent materials were used to judge their suitability for producing
paste, mortar and concrete mixtures. In addition, a number of physical properties of the
materials were used in determining the primary and adjusted mixture proportions of the
concretes. The sieve analyses of fine and coarse aggregates were useful to identify any
deviation from the gradation requirement. The chemical compositions of the cementing
materials were used to check the required proportions of the component compounds, and to
85
examine whether any impurities are present beyond the permissible limits. The particle size
analyses of the cementing materials were useful to understand their packing characteristics in
the paste composition of the concretes.
The bulk density results of aggregate blends were used to determine the optimum S/A
ratio. The optimum S/A ratio was beneficial to obtain the mixture proportions of various
SCHPCs. The optimum S/A ratio leading to maximum bulk density was used in the concretes
to produce low water absorption and porosity, high electrical resistivity and ultrasonic pulse
velocity, and good compressive strength. In addition, the optimum S/A ratio lessened the
amount of cementing material required for concretes, and thus made the concrete production
more economic.
4.14 Conclusions
a. The constituent materials were suitable for producing the concrete mixtures, as they met
the specified physical and chemical requirements.
b. The gradations of fine and coarse aggregates were in the specified range suitable for
producing concrete mixtures.
c. The chemical compositions of the cementing materials exhibited that the chemical
components were in specified proportions and no impurities were present above the
maximum permissible limits.
d. The particle size analyses of the cementing materials revealed that both cement and RHA
were well-graded suggesting good particle packing in the paste composition of concretes.
e. The maximum compacted and uncompacted bulk densities with minimum void content
were obtained at the optimum S/A ratio of 0.50.
f. The optimum S/A ratio was used in the mixture proportioning of concretes to improve the
hardened properties and durability of concrete.
86

Chapter 5
Filling Ability of Binder Pastes
5.1 General
The preparation and testing of various binder pastes, and the test results for the filling ability
of the binder pastes with respect to flow time are presented and discussed in this chapter. The
effects of high-range water reducer (HRWR), rice husk ash (RHA), and water-binder (W/B)
ratio on the filling ability of the binder pastes are discussed. The saturation dosages and water
reduction capacity of HRWR, and the water demand and suitability of RHA are highlighted.
Finally, this chapter emphasizes how the paste filling ability results can be used in the
concrete mixture design process.
5.2 Research Significance
The filling ability of binder pastes is useful to facilitate the mixture proportioning process of
self-consolidating high performance concrete (SCHPC). The optimum combination of the
cement, supplementary cementing material (SCM) and HRWR for an SCHPC mixture can be
selected based on the filling ability of its binder component. The optimization of cement-
admixture system reduces the volume of laboratory work involved in determining the
mixture proportions of SCHPC. In addition, it is possible to predict the filling ability of
SCHPC based on the filling ability of its paste component. Consequently, the whole mixture
proportioning process becomes simplified, and the loss of materials is minimized. Moreover,
the effectiveness and suitability of SCM and the efficiency of HRWR to be used in concretes
can be examined based on the filling ability of the binder pastes.
5.3 Preparation and Testing of Binder Pastes
Different types of binder paste were prepared and tested to determine the filling ability with
respect to flow time. The increased flow time correlates with a reduced filling ability of the
pastes. The water reduction capacity and saturation dosage (SD) of HRWR and the water
87
demand of RHA were also determined based on the filling ability results of various binder
pastes.
The binder pastes were designated based on the W/B ratio and RHA content used in
corresponding parent concretes (Table 5.1). For example, the ‘P30R0S1’ and ‘P30R0S2’
designations were chosen for the binder pastes prepared with a W/B ratio of 0.30 and 0%
RHA content, as used in corresponding parent concrete ‘C30R0A6’. In addition, the ‘S1’ and
‘S2’ components were used in the designations to categorize the binder pastes under series 1
and series 2, respectively.
5.3.1 Preparation of binder pastes
A series of binder pastes (P30R0S1 to P50R0S1), as shown in Table 5.1, was prepared to
investigate the filling ability at various HRWR dosages, and thus to determine the saturation
dosages of HRWR. The lower limits of HRWR dosage were selected to produce a continuous
flow whereas the upper limits were chosen to obtain a flow beyond the saturation flow of
pastes. The amount of the mixing water (W) for these pastes was 1.571 kg. The amounts of
cement (C) and RHA were varied based on their proportions in the corresponding parent
concretes. Another series of binder pastes (P30R0S2 to P50R0S2), as shown in Table 5.2,
was prepared to test the filling ability for various water contents, and thus to determine the
water reduction caused by HRWR and the water demand of RHA. The amounts of cement
and RHA were same as in the first series. However, no HRWR was used to vary the filling
ability of the pastes. Instead, the mixing water was increased incrementally to increase the
filling ability of the pastes. The limits of water increment were chosen to produce a
continuous flow of the pastes with successively lower flow time in the absence of HRWR.
The binder pastes were prepared using an epicyclic revolving type small mechanical
mixer conforming to ASTM C 305 (2004). The mixer is shown in Figure 5.1. The nominal
capacity of the mixing bowl was 4.73 liters. The cementing or binding material (cement
alone or with RHA) was placed in the mixing bowl and dry mixed for 30 seconds with a
stainless steel spoon. This step was omitted when RHA was not present in the binder system.
The mixer was then started and the binding material was mixed with water for 30 seconds.
Then the mixer was stopped, and the paste was quickly scraped from side and bottom of the
mixing bowl over a period of 30 seconds. The mixer was restarted and run for 60 seconds.
88
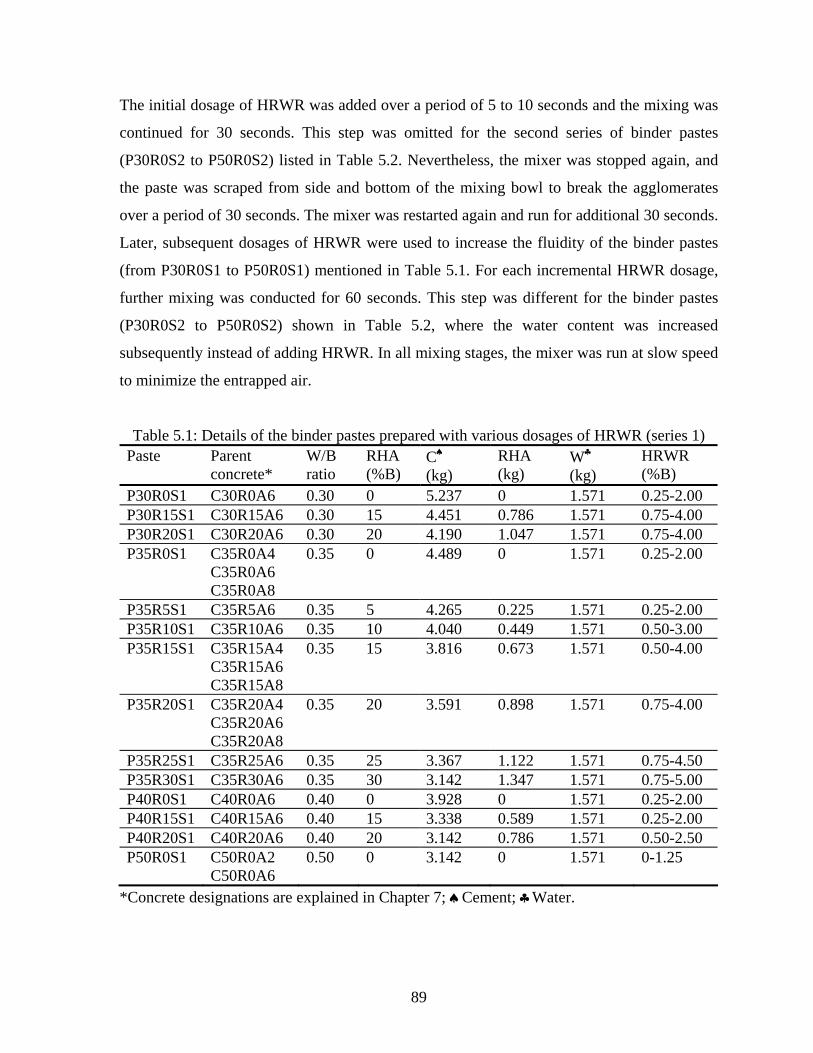
The initial dosage of HRWR was added over a period of 5 to 10 seconds and the mixing was
continued for 30 seconds. This step was omitted for the second series of binder pastes
(P30R0S2 to P50R0S2) listed in Table 5.2. Nevertheless, the mixer was stopped again, and
the paste was scraped from side and bottom of the mixing bowl to break the agglomerates
over a period of 30 seconds. The mixer was restarted again and run for additional 30 seconds.
Later, subsequent dosages of HRWR were used to increase the fluidity of the binder pastes
(from P30R0S1 to P50R0S1) mentioned in Table 5.1. For each incremental HRWR dosage,
further mixing was conducted for 60 seconds. This step was different for the binder pastes
(P30R0S2 to P50R0S2) shown in Table 5.2, where the water content was increased
subsequently instead of adding HRWR. In all mixing stages, the mixer was run at slow speed
to minimize the entrapped air.
Table 5.1: Details of the binder pastes prepared with various dosages of HRWR (series 1) Paste
Parent concrete*
W/B ratio
RHA (%B)
C♠
(kg) RHA (kg)
W♣
(kg) HRWR (%B)
P30R0S1 C30R0A6 0.30 0 5.237 0 1.571 0.25-2.00 P30R15S1 C30R15A6 0.30 15 4.451 0.786 1.571 0.75-4.00 P30R20S1 C30R20A6 0.30 20 4.190 1.047 1.571 0.75-4.00 P35R0S1 C35R0A4
C35R0A6 C35R0A8
0.35 0 4.489 0 1.571 0.25-2.00
P35R5S1 C35R5A6 0.35 5 4.265 0.225 1.571 0.25-2.00 P35R10S1 C35R10A6 0.35 10 4.040 0.449 1.571 0.50-3.00 P35R15S1 C35R15A4
C35R15A6 C35R15A8
0.35 15 3.816 0.673 1.571 0.50-4.00
P35R20S1 C35R20A4 C35R20A6 C35R20A8
0.35 20 3.591 0.898 1.571 0.75-4.00
P35R25S1 C35R25A6 0.35 25 3.367 1.122 1.571 0.75-4.50 P35R30S1 C35R30A6 0.35 30 3.142 1.347 1.571 0.75-5.00 P40R0S1 C40R0A6 0.40 0 3.928 0 1.571 0.25-2.00 P40R15S1 C40R15A6 0.40 15 3.338 0.589 1.571 0.25-2.00 P40R20S1 C40R20A6 0.40 20 3.142 0.786 1.571 0.50-2.50 P50R0S1 C50R0A2
C50R0A6 0.50 0 3.142 0 1.571 0-1.25
*Concrete designations are explained in Chapter 7; ♠Cement; ♣Water.
89
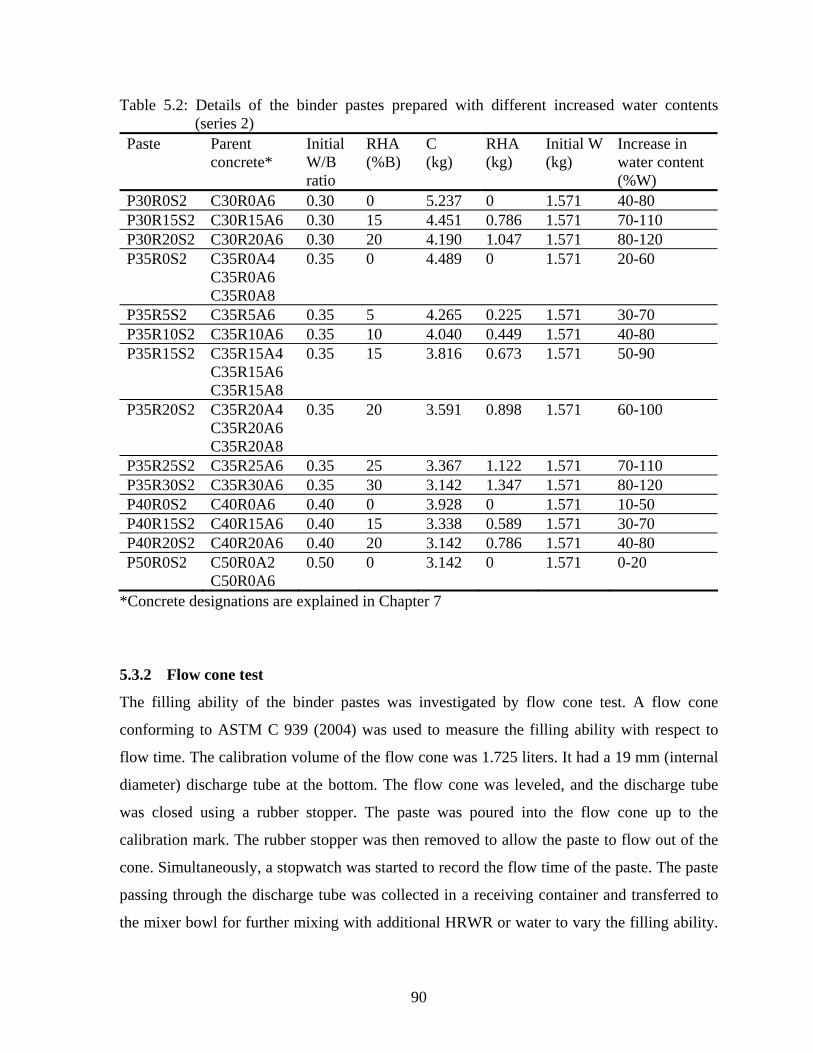
Table 5.2: Details of the binder pastes prepared with different increased water contents (series 2)
Paste
Parent concrete*
Initial W/B ratio
RHA (%B)
C (kg)
RHA (kg)
Initial W (kg)
Increase in water content (%W)
P30R0S2 C30R0A6 0.30 0 5.237 0 1.571 40-80 P30R15S2 C30R15A6 0.30 15 4.451 0.786 1.571 70-110 P30R20S2 C30R20A6 0.30 20 4.190 1.047 1.571 80-120 P35R0S2 C35R0A4
C35R0A6 C35R0A8
0.35 0 4.489 0 1.571 20-60
P35R5S2 C35R5A6 0.35 5 4.265 0.225 1.571 30-70 P35R10S2 C35R10A6 0.35 10 4.040 0.449 1.571 40-80 P35R15S2 C35R15A4
C35R15A6 C35R15A8
0.35 15 3.816 0.673 1.571 50-90
P35R20S2 C35R20A4 C35R20A6 C35R20A8
0.35 20 3.591 0.898 1.571 60-100
P35R25S2 C35R25A6 0.35 25 3.367 1.122 1.571 70-110 P35R30S2 C35R30A6 0.35 30 3.142 1.347 1.571 80-120 P40R0S2 C40R0A6 0.40 0 3.928 0 1.571 10-50 P40R15S2 C40R15A6 0.40 15 3.338 0.589 1.571 30-70 P40R20S2 C40R20A6 0.40 20 3.142 0.786 1.571 40-80 P50R0S2 C50R0A2
C50R0A6 0.50 0 3.142 0 1.571 0-20
*Concrete designations are explained in Chapter 7
5.3.2 Flow cone test
The filling ability of the binder pastes was investigated by flow cone test. A flow cone
conforming to ASTM C 939 (2004) was used to measure the filling ability with respect to
flow time. The calibration volume of the flow cone was 1.725 liters. It had a 19 mm (internal
diameter) discharge tube at the bottom. The flow cone was leveled, and the discharge tube
was closed using a rubber stopper. The paste was poured into the flow cone up to the
calibration mark. The rubber stopper was then removed to allow the paste to flow out of the
cone. Simultaneously, a stopwatch was started to record the flow time of the paste. The paste
passing through the discharge tube was collected in a receiving container and transferred to
the mixer bowl for further mixing with additional HRWR or water to vary the filling ability.
90
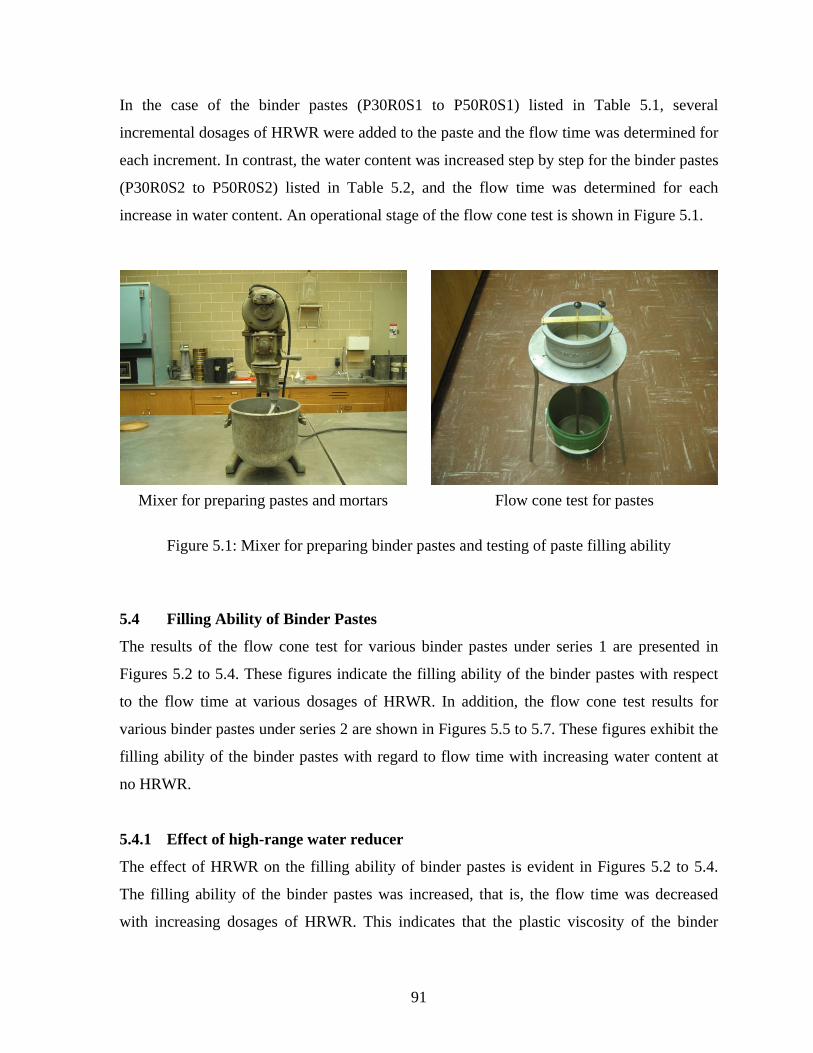
In the case of the binder pastes (P30R0S1 to P50R0S1) listed in Table 5.1, several
incremental dosages of HRWR were added to the paste and the flow time was determined for
each increment. In contrast, the water content was increased step by step for the binder pastes
(P30R0S2 to P50R0S2) listed in Table 5.2, and the flow time was determined for each
increase in water content. An operational stage of the flow cone test is shown in Figure 5.1.
Mixer for preparing pastes and mortars Flow cone test for pastes
Figure 5.1: Mixer for preparing binder pastes and testing of paste filling ability
5.4 Filling Ability of Binder Pastes
The results of the flow cone test for various binder pastes under series 1 are presented in
Figures 5.2 to 5.4. These figures indicate the filling ability of the binder pastes with respect
to the flow time at various dosages of HRWR. In addition, the flow cone test results for
various binder pastes under series 2 are shown in Figures 5.5 to 5.7. These figures exhibit the
filling ability of the binder pastes with regard to flow time with increasing water content at
no HRWR.
5.4.1 Effect of high-range water reducer
The effect of HRWR on the filling ability of binder pastes is evident in Figures 5.2 to 5.4.
The filling ability of the binder pastes was increased, that is, the flow time was decreased
with increasing dosages of HRWR. This indicates that the plastic viscosity of the binder
91
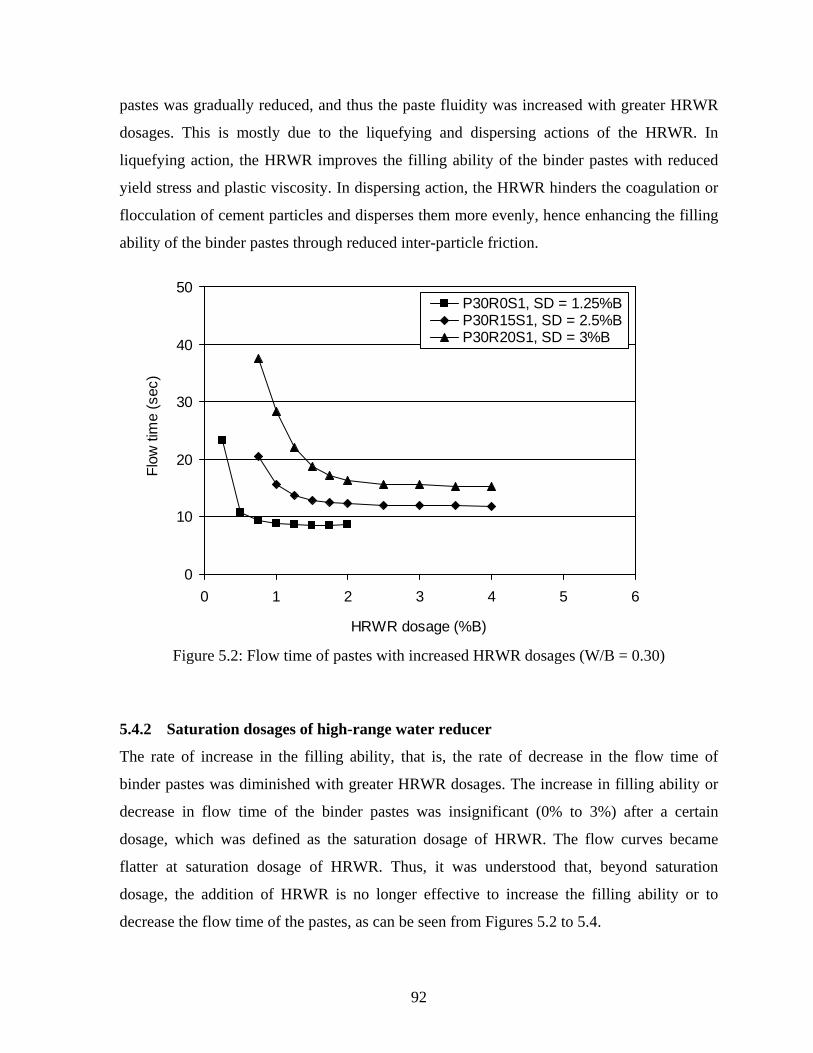
pastes was gradually reduced, and thus the paste fluidity was increased with greater HRWR
dosages. This is mostly due to the liquefying and dispersing actions of the HRWR. In
liquefying action, the HRWR improves the filling ability of the binder pastes with reduced
yield stress and plastic viscosity. In dispersing action, the HRWR hinders the coagulation or
flocculation of cement particles and disperses them more evenly, hence enhancing the filling
ability of the binder pastes through reduced inter-particle friction.
0
10
20
30
40
50
0 1 2 3 4 5 6
HRWR dosage (%B)
Flow
tim
e (s
ec)
P30R0S1, SD = 1.25%BP30R15S1, SD = 2.5%BP30R20S1, SD = 3%B
Figure 5.2: Flow time of pastes with increased HRWR dosages (W/B = 0.30)
5.4.2 Saturation dosages of high-range water reducer
The rate of increase in the filling ability, that is, the rate of decrease in the flow time of
binder pastes was diminished with greater HRWR dosages. The increase in filling ability or
decrease in flow time of the binder pastes was insignificant (0% to 3%) after a certain
dosage, which was defined as the saturation dosage of HRWR. The flow curves became
flatter at saturation dosage of HRWR. Thus, it was understood that, beyond saturation
dosage, the addition of HRWR is no longer effective to increase the filling ability or to
decrease the flow time of the pastes, as can be seen from Figures 5.2 to 5.4.
92
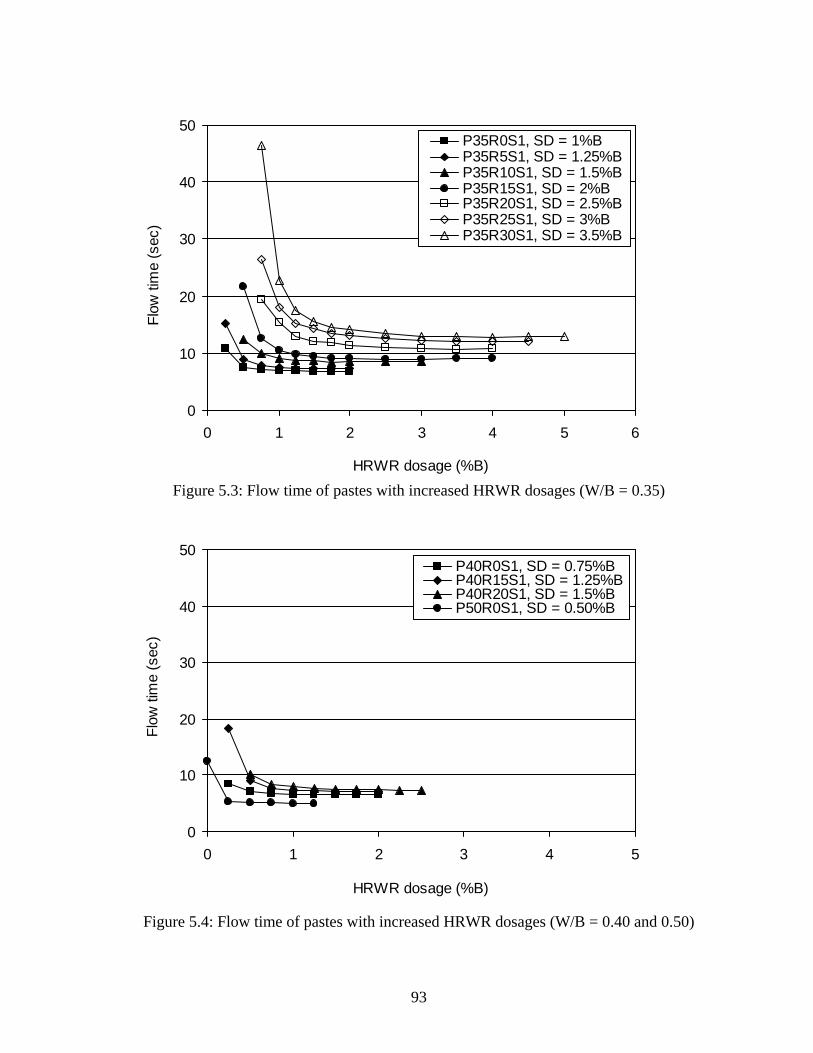
0
10
20
30
40
50
0 1 2 3 4 5
HRWR dosage (%B)
Flow
tim
e (s
ec)
6
P35R0S1, SD = 1%BP35R5S1, SD = 1.25%BP35R10S1, SD = 1.5%BP35R15S1, SD = 2%BP35R20S1, SD = 2.5%BP35R25S1, SD = 3%BP35R30S1, SD = 3.5%B
Figure 5.3: Flow time of pastes with increased HRWR dosages (W/B = 0.35)
0
10
20
30
40
50
0 1 2 3 4 5
HRWR dosage (%B)
Flow
tim
e (s
ec)
P40R0S1, SD = 0.75%BP40R15S1, SD = 1.25%BP40R20S1, SD = 1.5%BP50R0S1, SD = 0.50%B
Figure 5.4: Flow time of pastes with increased HRWR dosages (W/B = 0.40 and 0.50)
93

0
5
10
15
20
25
0 20 40 60 80 100 120 140
Increase in water content (%)
Flow
tim
e (s
ec)
P30R0S2 P30R15S2P30R20S2
Figure 5.5: Flow time of pastes with increased water content (initial W/B = 0.30)
0
5
10
15
20
25
0 20 40 60 80 100 120 140
Increase in water content (%)
Flow
tim
e (s
ec)
P35R0S2 P35R5S2P35R10S2 P35R15S2P35R20S2 P35R25S2P35R30S2
Figure 5.6: Flow time of pastes with increased water content (initial W/B = 0.35)
94
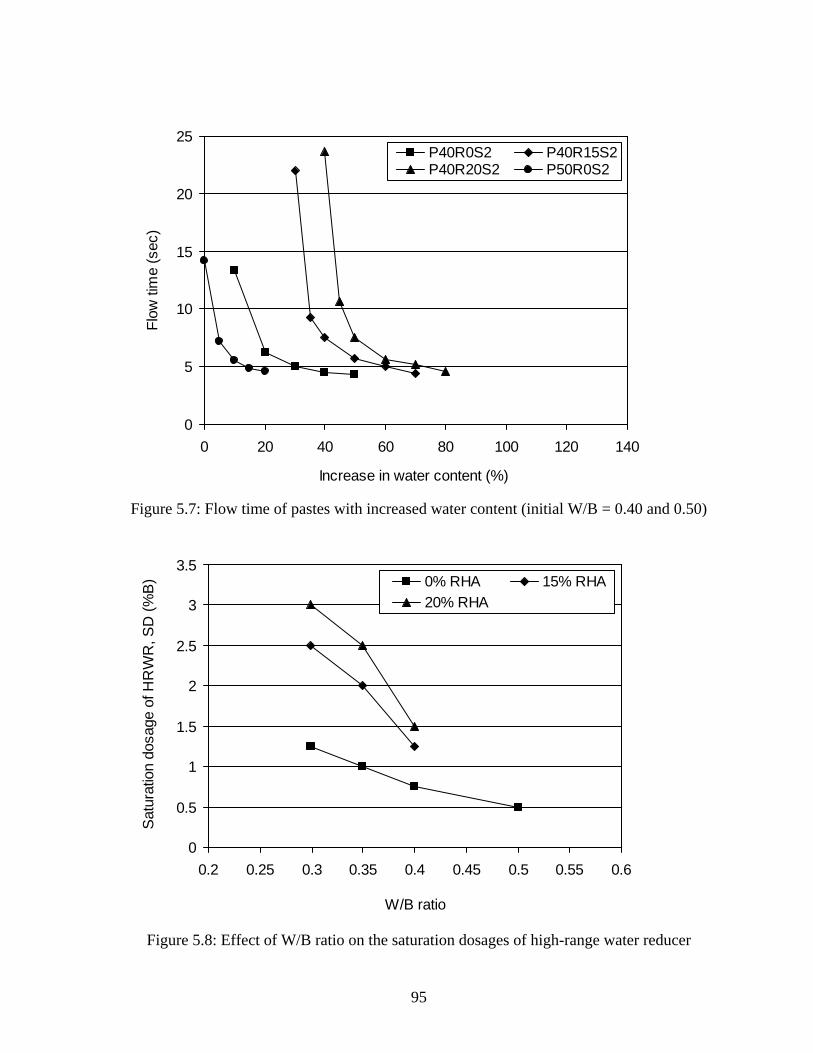
0
5
10
15
20
25
0 20 40 60 80 100 120 140
Increase in water content (%)
Flow
tim
e (s
ec)
P40R0S2 P40R15S2P40R20S2 P50R0S2
Figure 5.7: Flow time of pastes with increased water content (initial W/B = 0.40 and 0.50)
0
0.5
1
1.5
2
2.5
3
3.5
0.2 0.25 0.3 0.35 0.4 0.45 0.5 0.55 0.6
W/B ratio
Sat
urat
ion
dosa
ge o
f HR
WR
, SD
(%B
) 0% RHA 15% RHA20% RHA
Figure 5.8: Effect of W/B ratio on the saturation dosages of high-range water reducer
95
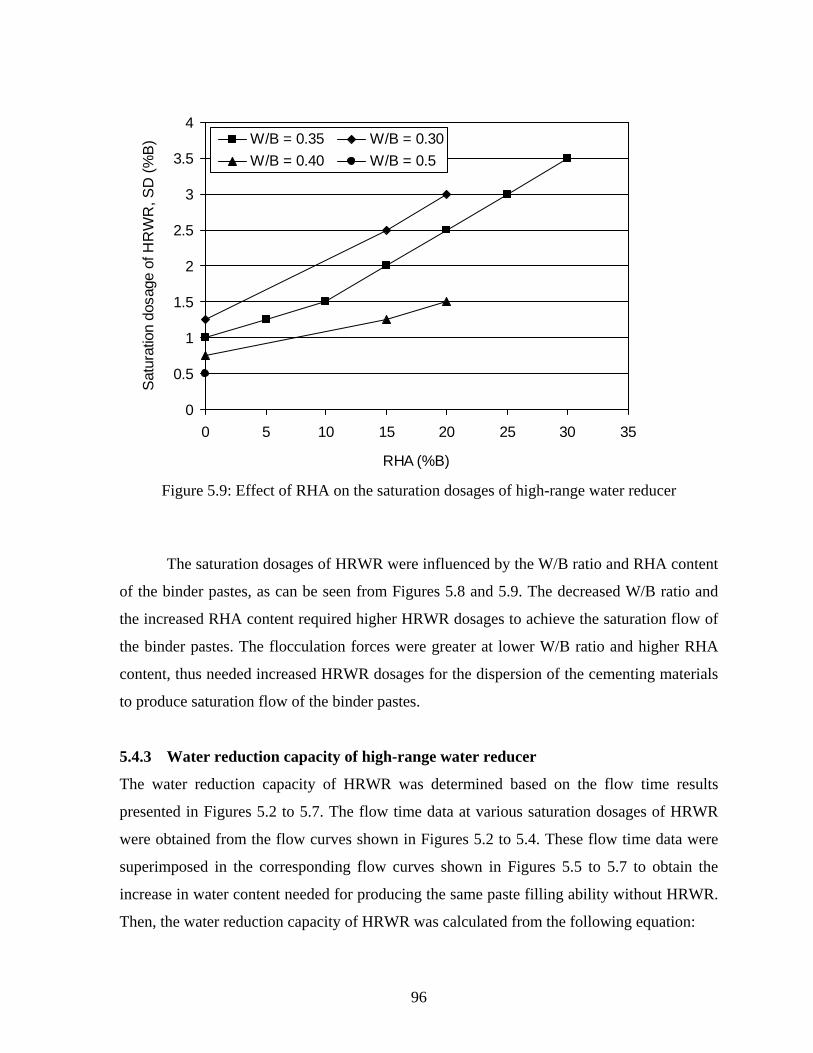
0
0.5
1
1.5
2
2.5
3
3.5
4
0 5 10 15 20 25 30 35
RHA (%B)
Sat
urat
ion
dosa
ge o
f HR
WR
, SD
(%B
) W/B = 0.35 W/B = 0.30W/B = 0.40 W/B = 0.5
Figure 5.9: Effect of RHA on the saturation dosages of high-range water reducer
The saturation dosages of HRWR were influenced by the W/B ratio and RHA content
of the binder pastes, as can be seen from Figures 5.8 and 5.9. The decreased W/B ratio and
the increased RHA content required higher HRWR dosages to achieve the saturation flow of
the binder pastes. The flocculation forces were greater at lower W/B ratio and higher RHA
content, thus needed increased HRWR dosages for the dispersion of the cementing materials
to produce saturation flow of the binder pastes.
5.4.3 Water reduction capacity of high-range water reducer
The water reduction capacity of HRWR was determined based on the flow time results
presented in Figures 5.2 to 5.7. The flow time data at various saturation dosages of HRWR
were obtained from the flow curves shown in Figures 5.2 to 5.4. These flow time data were
superimposed in the corresponding flow curves shown in Figures 5.5 to 5.7 to obtain the
increase in water content needed for producing the same paste filling ability without HRWR.
Then, the water reduction capacity of HRWR was calculated from the following equation:
96
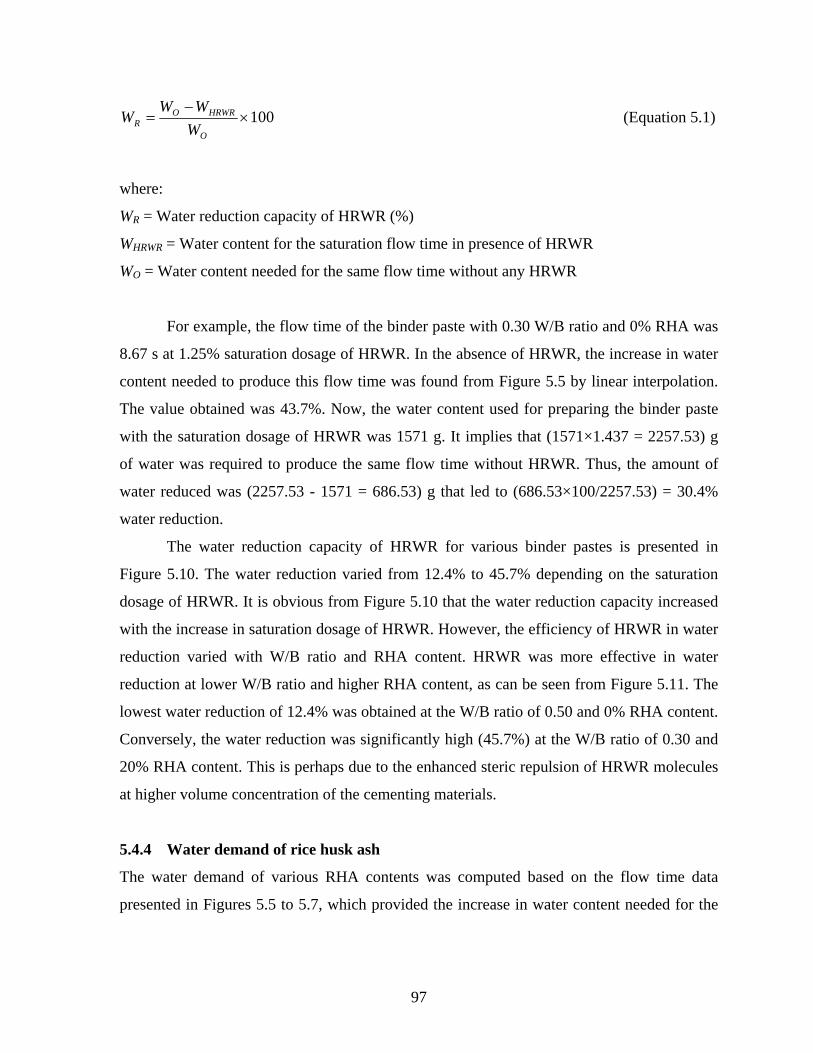
100×−
=O
HRWROR W
WWW (Equation 5.1)
where:
WR = Water reduction capacity of HRWR (%)
WHRWR = Water content for the saturation flow time in presence of HRWR
WO = Water content needed for the same flow time without any HRWR
For example, the flow time of the binder paste with 0.30 W/B ratio and 0% RHA was
8.67 s at 1.25% saturation dosage of HRWR. In the absence of HRWR, the increase in water
content needed to produce this flow time was found from Figure 5.5 by linear interpolation.
The value obtained was 43.7%. Now, the water content used for preparing the binder paste
with the saturation dosage of HRWR was 1571 g. It implies that (1571×1.437 = 2257.53) g
of water was required to produce the same flow time without HRWR. Thus, the amount of
water reduced was (2257.53 - 1571 = 686.53) g that led to (686.53×100/2257.53) = 30.4%
water reduction.
The water reduction capacity of HRWR for various binder pastes is presented in
Figure 5.10. The water reduction varied from 12.4% to 45.7% depending on the saturation
dosage of HRWR. It is obvious from Figure 5.10 that the water reduction capacity increased
with the increase in saturation dosage of HRWR. However, the efficiency of HRWR in water
reduction varied with W/B ratio and RHA content. HRWR was more effective in water
reduction at lower W/B ratio and higher RHA content, as can be seen from Figure 5.11. The
lowest water reduction of 12.4% was obtained at the W/B ratio of 0.50 and 0% RHA content.
Conversely, the water reduction was significantly high (45.7%) at the W/B ratio of 0.30 and
20% RHA content. This is perhaps due to the enhanced steric repulsion of HRWR molecules
at higher volume concentration of the cementing materials.
5.4.4 Water demand of rice husk ash
The water demand of various RHA contents was computed based on the flow time data
presented in Figures 5.5 to 5.7, which provided the increase in water content needed for the
97
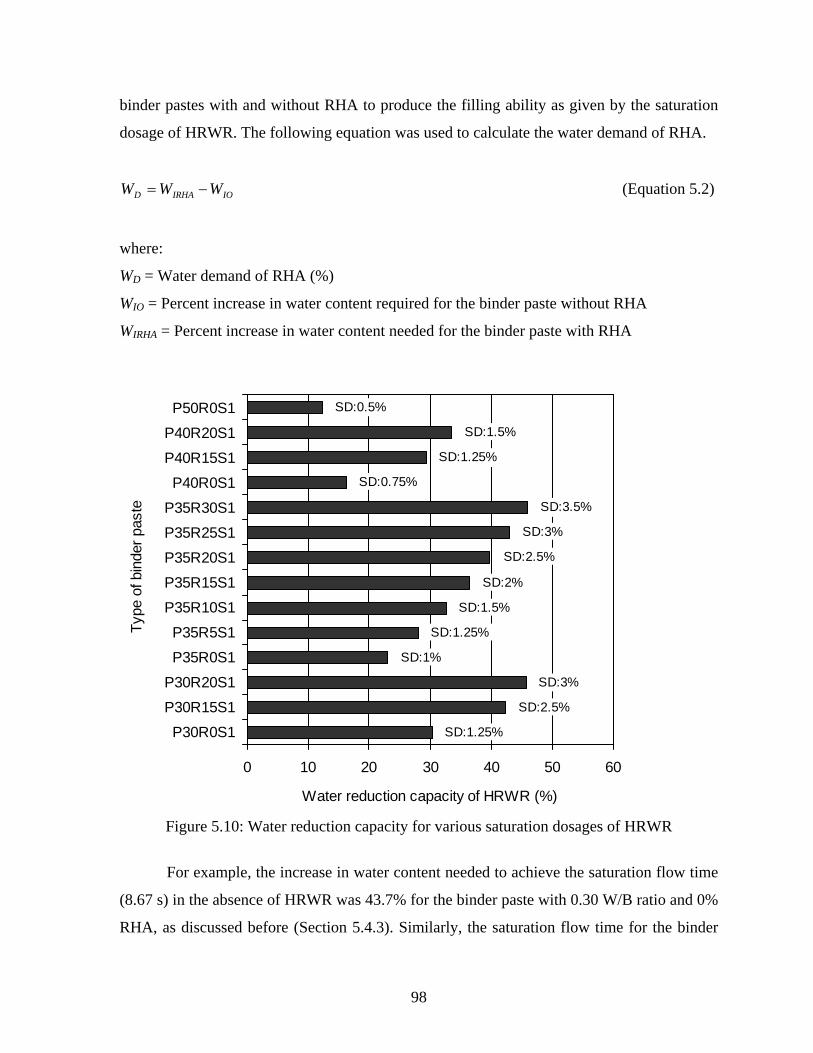
binder pastes with and without RHA to produce the filling ability as given by the saturation
dosage of HRWR. The following equation was used to calculate the water demand of RHA.
IOIRHAD WWW −= (Equation 5.2)
where:
WD = Water demand of RHA (%)
WIO = Percent increase in water content required for the binder paste without RHA
WIRHA = Percent increase in water content needed for the binder paste with RHA
0 10 20 30 40 50 6
P30R0S1
P30R15S1
P30R20S1
P35R0S1
P35R5S1
P35R10S1
P35R15S1
P35R20S1
P35R25S1
P35R30S1
P40R0S1
P40R15S1
P40R20S1
P50R0S1
Type
of b
inde
r pas
te
Water reduction capacity of HRWR (%)
0
SD:1.25%
SD:0.75%
SD:3.5%
SD:3%
SD:2.5%
SD:2%
SD:1.5%
SD:1.25%
SD:1%
SD:3%
SD:2.5%
SD:1.25%
SD:0.5%
SD:1.5%
Figure 5.10: Water reduction capacity for various saturation dosages of HRWR
For example, the increase in water content needed to achieve the saturation flow time
(8.67 s) in the absence of HRWR was 43.7% for the binder paste with 0.30 W/B ratio and 0%
RHA, as discussed before (Section 5.4.3). Similarly, the saturation flow time for the binder
98
paste with 0.30 W/B ratio and 15% RHA in the presence of HRWR was obtained from
Figure 5.2 as 11.95 s. The increase in water content required to attain this flow time in the
absence of HRWR was found from Figure 5.5 as 73.7%. Hence, the water demand of 15%
RHA was (73.6% – 43.7%) = 30%.
The water demand of various RHA contents to achieve the saturation flow is shown in
Figure 5.12. It is evident from Figure 5.12 that the water demand increased with the increase
in RHA content. Also, the water demand became greater at lower W/B ratio since the
quantity of RHA was increased. Nevertheless, the water demand of RHA varied in the range
of 0% to 55.1% depending on its content used in the binder pastes. The highest water demand
(55.1%) was observed for 30% RHA content, which was incorporated in a SCHPC mixture
with the W/B ratio of 0.35. The increased water demand of RHA is mainly attributed to its
particle characteristics. The smaller particle size and porous honey-comb microstructure of
RHA resulted in very high specific surface area that demanded a greater amount of water for
saturation flow.
0
10
20
30
40
50
60
0.2 0.25 0.3 0.35 0.4 0.45 0.5 0.55 0.6
W/B ratio
Wat
er re
duct
ion
capa
city
(%)
0% RHA 15% RHA20% RHA
Figure 5.11: Effect of W/B ratio and RHA content on the water reduction capacity of HRWR
99

0
10
20
30
40
50
60
70
0 5 10 15 20 25 30 35
RHA (%B)
Wat
er d
eman
d of
RH
A (%
)W/B = 0.35 W/B = 0.30W/B = 0.40
Figure 5.12: Water demand of RHA for saturation flow of binder pastes
5.4.5 Effect of rice husk ash and water-binder ratio
The flow curves presented in Figures 5.2 to 5.4 showed a shift towards the upward right-hand
direction as the W/B ratio is reduced and the RHA content is increased. These trends indicate
that the plastic viscosity of the binder pastes was increased with reduced W/B ratio and
increased RHA content.
The effects of RHA and W/B ratio on the filling ability of the binder pastes were
examined based on the saturation dosages of HRWR. The flow time values of the pastes at
saturation dosages of HRWR were determined from Figures 5.2 to 5.4, and plotted in Figure
5.13. The filling ability of the binder pastes was reduced and therefore the flow time value
became higher with increasing RHA content and lower W/B ratio, as evident in Figure 5.13.
This is mostly due to the increased volume fraction and wettable surface area of the binder.
The volume fraction of the binder was increased with lower W/B ratio and higher RHA
content, which is evident from Figure 5.14. The increase in volume fraction of the binder
100
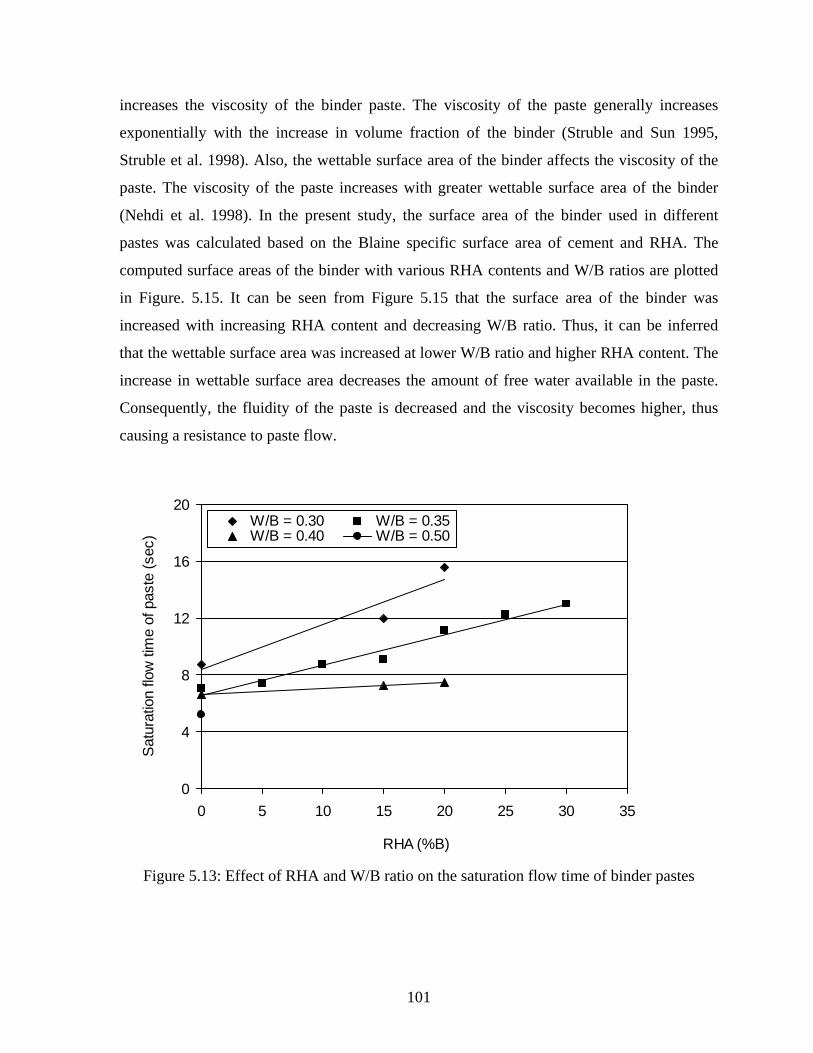
increases the viscosity of the binder paste. The viscosity of the paste generally increases
exponentially with the increase in volume fraction of the binder (Struble and Sun 1995,
Struble et al. 1998). Also, the wettable surface area of the binder affects the viscosity of the
paste. The viscosity of the paste increases with greater wettable surface area of the binder
(Nehdi et al. 1998). In the present study, the surface area of the binder used in different
pastes was calculated based on the Blaine specific surface area of cement and RHA. The
computed surface areas of the binder with various RHA contents and W/B ratios are plotted
in Figure. 5.15. It can be seen from Figure 5.15 that the surface area of the binder was
increased with increasing RHA content and decreasing W/B ratio. Thus, it can be inferred
that the wettable surface area was increased at lower W/B ratio and higher RHA content. The
increase in wettable surface area decreases the amount of free water available in the paste.
Consequently, the fluidity of the paste is decreased and the viscosity becomes higher, thus
causing a resistance to paste flow.
0
4
8
12
16
20
0 5 10 15 20 25 30 35
RHA (%B)
Sat
urat
ion
flow
tim
e of
pas
te (s
ec)
W/B = 0.30 W/B = 0.35W/B = 0.40 W/B = 0.50
Figure 5.13: Effect of RHA and W/B ratio on the saturation flow time of binder pastes
101

0.3
0.35
0.4
0.45
0.5
0.55
0.6
0 5 10 15 20 25 30 35
RHA (%B)
Vol
ume
fract
ion
of b
inde
rW/B = 0.30 W/B = 0.35W/B = 0.40 W/B = 0.50
Figure 5.14: Effect of RHA and W/B ratio on the binder volume fraction of pastes
0
1
2
3
4
5
0 5 10 15 20 25 30 35
RHA (%B)
Sur
face
are
a of
bin
der (
×103 m
2 )
W/B = 0.30 W/B = 0.35W/B = 0.40 W/B = 0.50
Figure 5.15: Effect of RHA and W/B ratio on the surface area of binder
102
The morphology (shape and surface texture) of the RHA particles was also not
conducive to the filling ability of the binder pastes. The RHA particles are angular and
cellular with honey-comb microstructure (Zhang and Malhotra 1996), and thus could exhibit
interlocking characteristics. Therefore, the inter-particle friction becomes higher in the
presence of RHA. Also, the angular and porous RHA particles require more water than
rounded non-porous particles, resulting in less free water availability in the paste. Hence, the
binder paste with higher RHA content exhibited a lower filling ability with greater flow time.
5.5 Suitable Content of Rice Husk Ash
The test results showed that the presence of RHA affects the filling ability of the binder
pastes. The filling ability of the binder pastes was reduced with greater RHA content due to
increased water demand. It was observed that the water demand of RHA became very high
when its content exceeded 20%. In particular, the water demand of 25% and 30% RHA in
P35R25S1 and P35R30S1 binder pastes, respectively, were higher than the water reduction
capacity of the respective saturation dosage of HRWR. This can be seen from Figures 5.10
and 5.12. It indicates that the water demand of RHA was not fulfilled in P35R25S1 and
P35R30S1 binder pastes, even with the saturation dosages of HRWR. Hence, the filling
ability of these binder pastes can be affected. Furthermore, the saturation dosages of HRWR
became much higher when the RHA content was greater than 20%, as can be seen from
Figure 5.9. A HRWR dosage more than 3% is usually considered very high for SCHPC
(Kwan 1999). Very high dosages of HRWR may cause cement setting problem leading to
delayed hydration. In addition, mixing and handling difficulties were experienced for the
binder pastes with 20% RHA at 0.30 W/B ratio, and 25 to 30% RHA at 0.35 W/B ratio.
Based on these standpoints, a RHA content above 15% can be considered unsuitable for the
pastes and their corresponding parent concretes.
5.6 Use of Filling Ability Results of Binder Pastes
The filling ability results of the binder pastes exhibited the effects of HRWR, RHA content
and W/B ratio. The saturation dosages and water reduction capacity of HRWR, and the water
demand of RHA content were helpful to fix the HRWR dosages for various SCHPC
mixtures. These results were also useful to judge the suitability of RHA for use in concretes.
103
Moreover, the flow time results of the binder pastes indicated the filling ability of the
corresponding parent concretes. They were used for establishing the correlation of paste
filling ability with the filling ability of concretes.
5.7 Conclusions
a. The filling ability of the pastes was increased, and thus the flow time was decreased with
greater dosages of HRWR. This is attributed to the efficient liquefying and dispersing
actions of the HRWR.
b. The flow time of the pastes was increased with lower W/B ratio and higher RHA content.
This is due to the increased plastic viscosity caused by a greater volume fraction and
surface area of the binder.
c. The lower W/B ratio and higher RHA content increased the flocculation forces, and thus
required higher dosages of HRWR to achieve the saturation flow of the binder pastes.
d. The water reduction capacity of HRWR was increased at lower W/B ratio and higher
RHA content. This is mostly credited to the enhanced steric repulsion of HRWR at higher
volume concentration of the binder.
e. The water demand for saturation flow was increased with higher RHA content. This is
attributed to the extremely high specific surface area arising from the smaller particle size
and porous honey-comb microstructure of RHA.
f. A RHA content greater than 15% of binder by weight can be considered unsuitable due to
excessive water demand, and mixing and handling difficulties.
g. The optimum HRWR dosage and the suitable RHA content for concretes can be
determined based on the filling ability of binder pastes, and thus the paste filling ability
facilitates the mixture proportioning process of SCHPC.
104
Chapter 6
Filling Ability and Air Content of Mortars
6.1 General
The preparation and testing of mortars for the filling ability and air content, and their test
results are presented and discussed in this chapter. The effects of high-range water reducer
(HRWR), air-entraining admixture (AEA), water-binder (W/B) ratio, and rice husk ash
(RHA) on the filling ability and air content of the mortars are highlighted. The acceptability
of saturation dosages of HRWR and the suitability of RHA are discussed. The estimated
AEA dosages for concretes are also given. Finally, this chapter focuses how the mortar filling
ability and air content results are useful for the concrete mixtures.
6.2 Research Significance
The filling ability of mortars as that of binder pastes is useful to support the mixture
proportioning process of self-consolidating high performance concrete (SCHPC). The
suitable contents of cement and supplementary cementing material (SCM) and the required
dosage of HRWR for an SCHPC mixture can be determined based on the filling ability of its
mortar component. In addition, it is possible to estimate the AEA dosages for SCHPC
mixtures based on the air content of the mortar components. These processes minimize the
volume of laboratory work involved in finding the mixture proportions of SCHPC because
the number of trial mixtures, and thus the loss of materials are greatly reduced. A wide range
of variables can also be assessed using mortars in a short period. Moreover, the effectiveness
of HRWR, SCM, and AEA can be observed based on the filling ability and air content of
mortars.
6.3 Preparation and Testing of Mortars
Different types of mortars were prepared and tested to examine the filling ability with respect
to flow spread, to verify the saturation dosages (SDs) of HRWR obtained from flow cone test
of binder pastes, and to determine the air content for various dosages of AEA. The
105
designations of the mortars are given in Table 6.1 based on the W/B ratio and RHA content
used in the corresponding parent concrete. For instance, the ‘M30R0S1’ and ‘M30R0S2’
designations were selected for the mortars prepared with a W/B ratio of 0.30 and 0% RHA
content, as used in corresponding parent concrete ‘C30R0A6’. The ‘S1’ and ‘S2’ components
were used in the designations to categorize the mortars under series 1 (without AEA) and
series 2 (with AEA), respectively. The supplementary letter ‘a’ or ‘b’ was added right after
‘S1’ and ‘S2’ in case of several mortars formulated from the concretes with 4 and 8% design
air content, respectively. Moreover, the letter ‘c’ was used after ‘S1’ for a mortar formulated
from the concrete C50R0A2 (W/B: 0.50; RHA: 0%) containing 2% entrapped air content.
6.3.1 Preparation of mortars
A series of mortars (M30R0S1 to M50R0S1c), as given in Table 6.1, was prepared without
AEA (no air entrainment) to investigate the filling ability at various HRWR dosages, and
thus examining the effect of RHA and verifying the saturation dosages of HRWR. A second
series of mortars (M30R0S2 to M50R0S2), as listed in Table 6.1, was prepared with AEA for
testing air content. The primary mixture proportions of the mortars tested for filling ability
and air content are shown in Table 6.1. These proportions were calculated based on the
primary mixture proportions of the corresponding parent concretes.
The volume of the mortars prepared was 3 liters in both series. The dosages of
HRWR for the mortars under series 1 were varied in the vicinity of saturation dosages
obtained from the flow cone test of binder pastes. No AEA was used in the series 1 mortars.
The dosages of HRWR used for the mortars under series 2 were fixed at the saturation
dosages. The AEA was added to these mortars to produce the entrained air-voids. For each
mortar, the dosages of AEA were varied with additional mixing. The limits of AEA dosages
were chosen to produce the mortar air content in the range of 3.7% to 19.4%, which is
equivalent to the concrete air content ranging from 2.5% to 12.9%.
Before batching, the water correction was determined considering the absorption of
fine aggregate (natural pit sand) and the water contribution of HRWR. Accordingly, the
proportions of fine aggregate and water were adjusted. These adjustments were required
since air-dry pit sand and liquid HRWR were used in preparing the mortars. The adjusted
106
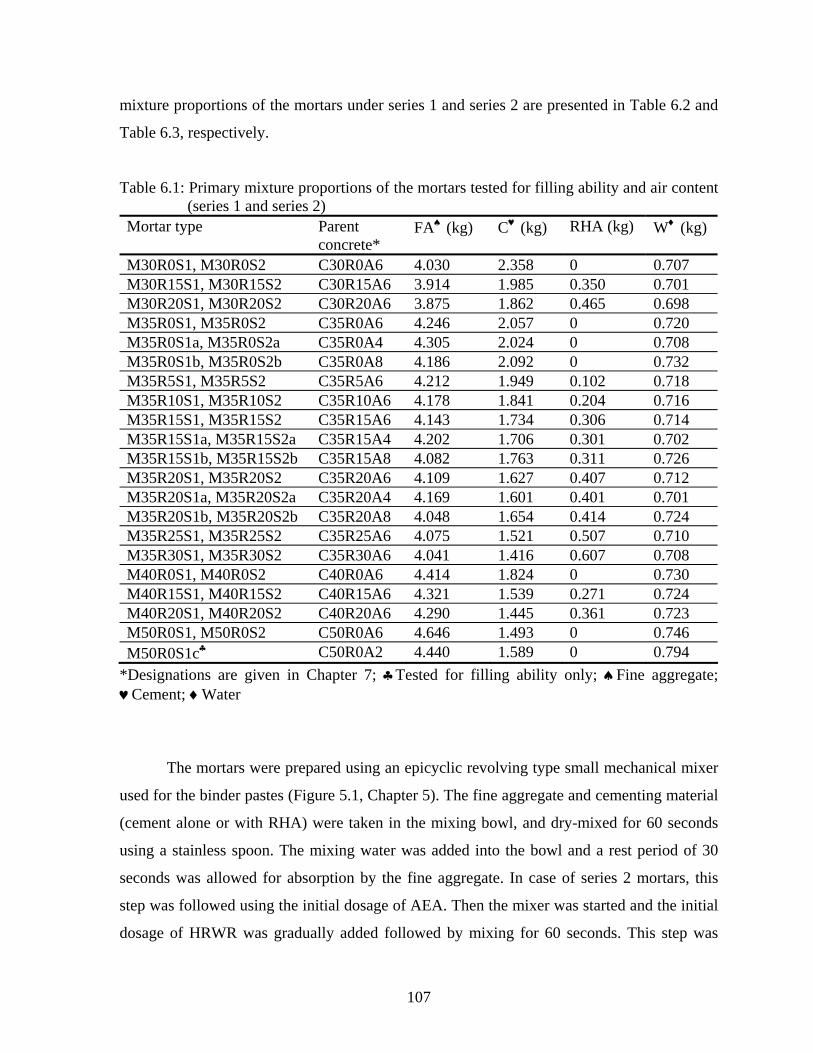
mixture proportions of the mortars under series 1 and series 2 are presented in Table 6.2 and
Table 6.3, respectively.
Table 6.1: Primary mixture proportions of the mortars tested for filling ability and air content (series 1 and series 2)
Mortar type Parent concrete*
FA♠ (kg) C♥ (kg) RHA (kg) W♦ (kg)
M30R0S1, M30R0S2 C30R0A6 4.030 2.358 0 0.707 M30R15S1, M30R15S2 C30R15A6 3.914 1.985 0.350 0.701 M30R20S1, M30R20S2 C30R20A6 3.875 1.862 0.465 0.698 M35R0S1, M35R0S2 C35R0A6 4.246 2.057 0 0.720 M35R0S1a, M35R0S2a C35R0A4 4.305 2.024 0 0.708 M35R0S1b, M35R0S2b C35R0A8 4.186 2.092 0 0.732 M35R5S1, M35R5S2 C35R5A6 4.212 1.949 0.102 0.718 M35R10S1, M35R10S2 C35R10A6 4.178 1.841 0.204 0.716 M35R15S1, M35R15S2 C35R15A6 4.143 1.734 0.306 0.714 M35R15S1a, M35R15S2a C35R15A4 4.202 1.706 0.301 0.702 M35R15S1b, M35R15S2b C35R15A8 4.082 1.763 0.311 0.726 M35R20S1, M35R20S2 C35R20A6 4.109 1.627 0.407 0.712 M35R20S1a, M35R20S2a C35R20A4 4.169 1.601 0.401 0.701 M35R20S1b, M35R20S2b C35R20A8 4.048 1.654 0.414 0.724 M35R25S1, M35R25S2 C35R25A6 4.075 1.521 0.507 0.710 M35R30S1, M35R30S2 C35R30A6 4.041 1.416 0.607 0.708 M40R0S1, M40R0S2 C40R0A6 4.414 1.824 0 0.730 M40R15S1, M40R15S2 C40R15A6 4.321 1.539 0.271 0.724 M40R20S1, M40R20S2 C40R20A6 4.290 1.445 0.361 0.723 M50R0S1, M50R0S2 C50R0A6 4.646 1.493 0 0.746 M50R0S1c♣ C50R0A2 4.440 1.589 0 0.794
*Designations are given in Chapter 7; ♣Tested for filling ability only; ♠Fine aggregate; ♥Cement; ♦Water
The mortars were prepared using an epicyclic revolving type small mechanical mixer
used for the binder pastes (Figure 5.1, Chapter 5). The fine aggregate and cementing material
(cement alone or with RHA) were taken in the mixing bowl, and dry-mixed for 60 seconds
using a stainless spoon. The mixing water was added into the bowl and a rest period of 30
seconds was allowed for absorption by the fine aggregate. In case of series 2 mortars, this
step was followed using the initial dosage of AEA. Then the mixer was started and the initial
dosage of HRWR was gradually added followed by mixing for 60 seconds. This step was
107
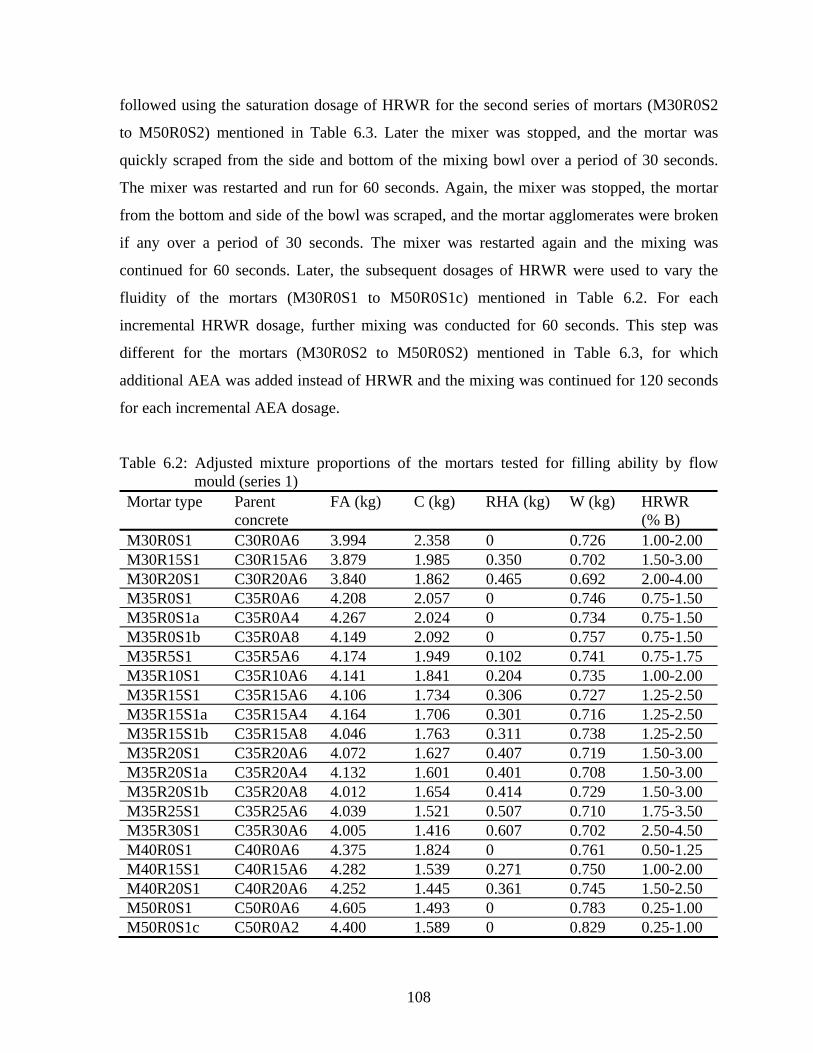
followed using the saturation dosage of HRWR for the second series of mortars (M30R0S2
to M50R0S2) mentioned in Table 6.3. Later the mixer was stopped, and the mortar was
quickly scraped from the side and bottom of the mixing bowl over a period of 30 seconds.
The mixer was restarted and run for 60 seconds. Again, the mixer was stopped, the mortar
from the bottom and side of the bowl was scraped, and the mortar agglomerates were broken
if any over a period of 30 seconds. The mixer was restarted again and the mixing was
continued for 60 seconds. Later, the subsequent dosages of HRWR were used to vary the
fluidity of the mortars (M30R0S1 to M50R0S1c) mentioned in Table 6.2. For each
incremental HRWR dosage, further mixing was conducted for 60 seconds. This step was
different for the mortars (M30R0S2 to M50R0S2) mentioned in Table 6.3, for which
additional AEA was added instead of HRWR and the mixing was continued for 120 seconds
for each incremental AEA dosage.
Table 6.2: Adjusted mixture proportions of the mortars tested for filling ability by flow mould (series 1)
Mortar type
Parent concrete
FA (kg) C (kg) RHA (kg) W (kg) HRWR (% B)
M30R0S1 C30R0A6 3.994 2.358 0 0.726 1.00-2.00 M30R15S1 C30R15A6 3.879 1.985 0.350 0.702 1.50-3.00 M30R20S1 C30R20A6 3.840 1.862 0.465 0.692 2.00-4.00 M35R0S1 C35R0A6 4.208 2.057 0 0.746 0.75-1.50 M35R0S1a C35R0A4 4.267 2.024 0 0.734 0.75-1.50 M35R0S1b C35R0A8 4.149 2.092 0 0.757 0.75-1.50 M35R5S1 C35R5A6 4.174 1.949 0.102 0.741 0.75-1.75 M35R10S1 C35R10A6 4.141 1.841 0.204 0.735 1.00-2.00 M35R15S1 C35R15A6 4.106 1.734 0.306 0.727 1.25-2.50 M35R15S1a C35R15A4 4.164 1.706 0.301 0.716 1.25-2.50 M35R15S1b C35R15A8 4.046 1.763 0.311 0.738 1.25-2.50 M35R20S1 C35R20A6 4.072 1.627 0.407 0.719 1.50-3.00 M35R20S1a C35R20A4 4.132 1.601 0.401 0.708 1.50-3.00 M35R20S1b C35R20A8 4.012 1.654 0.414 0.729 1.50-3.00 M35R25S1 C35R25A6 4.039 1.521 0.507 0.710 1.75-3.50 M35R30S1 C35R30A6 4.005 1.416 0.607 0.702 2.50-4.50 M40R0S1 C40R0A6 4.375 1.824 0 0.761 0.50-1.25 M40R15S1 C40R15A6 4.282 1.539 0.271 0.750 1.00-2.00 M40R20S1 C40R20A6 4.252 1.445 0.361 0.745 1.50-2.50 M50R0S1 C50R0A6 4.605 1.493 0 0.783 0.25-1.00 M50R0S1c C50R0A2 4.400 1.589 0 0.829 0.25-1.00
108
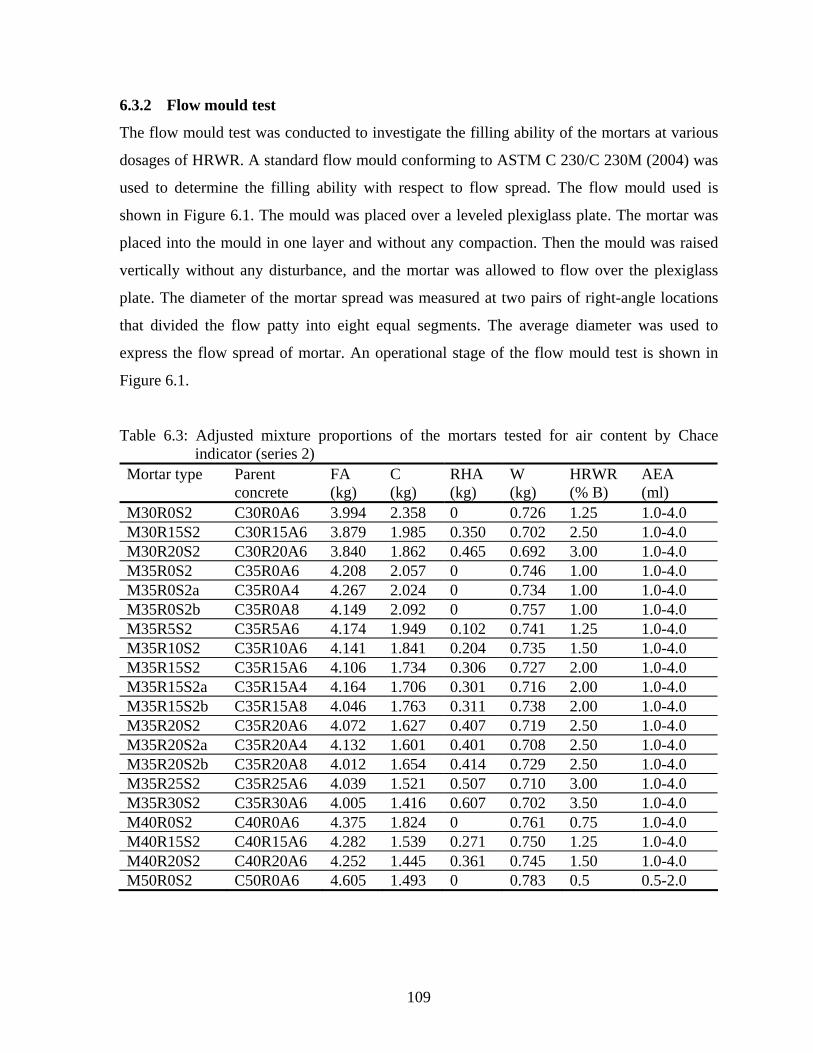
6.3.2 Flow mould test
The flow mould test was conducted to investigate the filling ability of the mortars at various
dosages of HRWR. A standard flow mould conforming to ASTM C 230/C 230M (2004) was
used to determine the filling ability with respect to flow spread. The flow mould used is
shown in Figure 6.1. The mould was placed over a leveled plexiglass plate. The mortar was
placed into the mould in one layer and without any compaction. Then the mould was raised
vertically without any disturbance, and the mortar was allowed to flow over the plexiglass
plate. The diameter of the mortar spread was measured at two pairs of right-angle locations
that divided the flow patty into eight equal segments. The average diameter was used to
express the flow spread of mortar. An operational stage of the flow mould test is shown in
Figure 6.1.
Table 6.3: Adjusted mixture proportions of the mortars tested for air content by Chace indicator (series 2)
Mortar type
Parent concrete
FA (kg)
C (kg)
RHA (kg)
W (kg)
HRWR (% B)
AEA (ml)
M30R0S2 C30R0A6 3.994 2.358 0 0.726 1.25 1.0-4.0 M30R15S2 C30R15A6 3.879 1.985 0.350 0.702 2.50 1.0-4.0 M30R20S2 C30R20A6 3.840 1.862 0.465 0.692 3.00 1.0-4.0 M35R0S2 C35R0A6 4.208 2.057 0 0.746 1.00 1.0-4.0 M35R0S2a C35R0A4 4.267 2.024 0 0.734 1.00 1.0-4.0 M35R0S2b C35R0A8 4.149 2.092 0 0.757 1.00 1.0-4.0 M35R5S2 C35R5A6 4.174 1.949 0.102 0.741 1.25 1.0-4.0 M35R10S2 C35R10A6 4.141 1.841 0.204 0.735 1.50 1.0-4.0 M35R15S2 C35R15A6 4.106 1.734 0.306 0.727 2.00 1.0-4.0 M35R15S2a C35R15A4 4.164 1.706 0.301 0.716 2.00 1.0-4.0 M35R15S2b C35R15A8 4.046 1.763 0.311 0.738 2.00 1.0-4.0 M35R20S2 C35R20A6 4.072 1.627 0.407 0.719 2.50 1.0-4.0 M35R20S2a C35R20A4 4.132 1.601 0.401 0.708 2.50 1.0-4.0 M35R20S2b C35R20A8 4.012 1.654 0.414 0.729 2.50 1.0-4.0 M35R25S2 C35R25A6 4.039 1.521 0.507 0.710 3.00 1.0-4.0 M35R30S2 C35R30A6 4.005 1.416 0.607 0.702 3.50 1.0-4.0 M40R0S2 C40R0A6 4.375 1.824 0 0.761 0.75 1.0-4.0 M40R15S2 C40R15A6 4.282 1.539 0.271 0.750 1.25 1.0-4.0 M40R20S2 C40R20A6 4.252 1.445 0.361 0.745 1.50 1.0-4.0 M50R0S2 C50R0A6 4.605 1.493 0 0.783 0.5 0.5-2.0
109
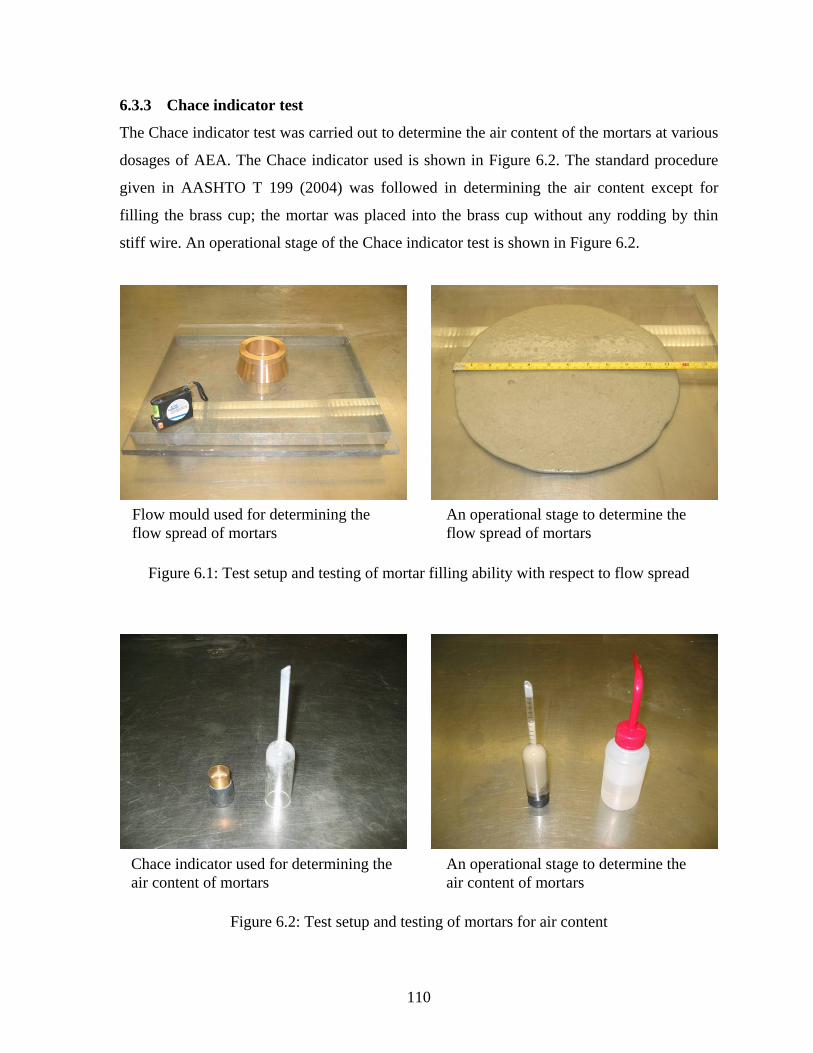
6.3.3 Chace indicator test
The Chace indicator test was carried out to determine the air content of the mortars at various
dosages of AEA. The Chace indicator used is shown in Figure 6.2. The standard procedure
given in AASHTO T 199 (2004) was followed in determining the air content except for
filling the brass cup; the mortar was placed into the brass cup without any rodding by thin
stiff wire. An operational stage of the Chace indicator test is shown in Figure 6.2.
Flow mould used for determining the flow spread of mortars
An operational stage to determine the flow spread of mortars
Figure 6.1: Test setup and testing of mortar filling ability with respect to flow spread
Chace indicator used for determining the air content of mortars
An operational stage to determine the air content of mortars
Figure 6.2: Test setup and testing of mortars for air content
110
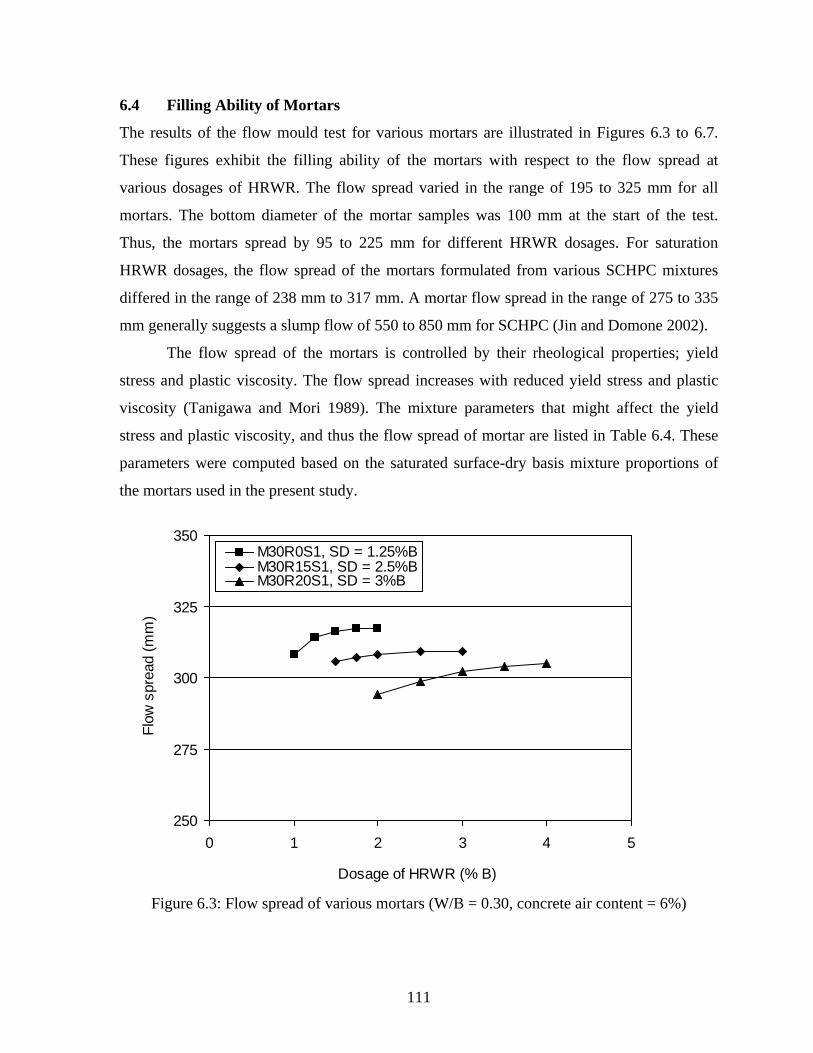
6.4 Filling Ability of Mortars
The results of the flow mould test for various mortars are illustrated in Figures 6.3 to 6.7.
These figures exhibit the filling ability of the mortars with respect to the flow spread at
various dosages of HRWR. The flow spread varied in the range of 195 to 325 mm for all
mortars. The bottom diameter of the mortar samples was 100 mm at the start of the test.
Thus, the mortars spread by 95 to 225 mm for different HRWR dosages. For saturation
HRWR dosages, the flow spread of the mortars formulated from various SCHPC mixtures
differed in the range of 238 mm to 317 mm. A mortar flow spread in the range of 275 to 335
mm generally suggests a slump flow of 550 to 850 mm for SCHPC (Jin and Domone 2002).
The flow spread of the mortars is controlled by their rheological properties; yield
stress and plastic viscosity. The flow spread increases with reduced yield stress and plastic
viscosity (Tanigawa and Mori 1989). The mixture parameters that might affect the yield
stress and plastic viscosity, and thus the flow spread of mortar are listed in Table 6.4. These
parameters were computed based on the saturated surface-dry basis mixture proportions of
the mortars used in the present study.
250
275
300
325
350
0 1 2 3 4
Dosage of HRWR (% B)
Flow
spr
ead
(mm
)
5
M30R0S1, SD = 1.25%BM30R15S1, SD = 2.5%BM30R20S1, SD = 3%B
Figure 6.3: Flow spread of various mortars (W/B = 0.30, concrete air content = 6%)
111
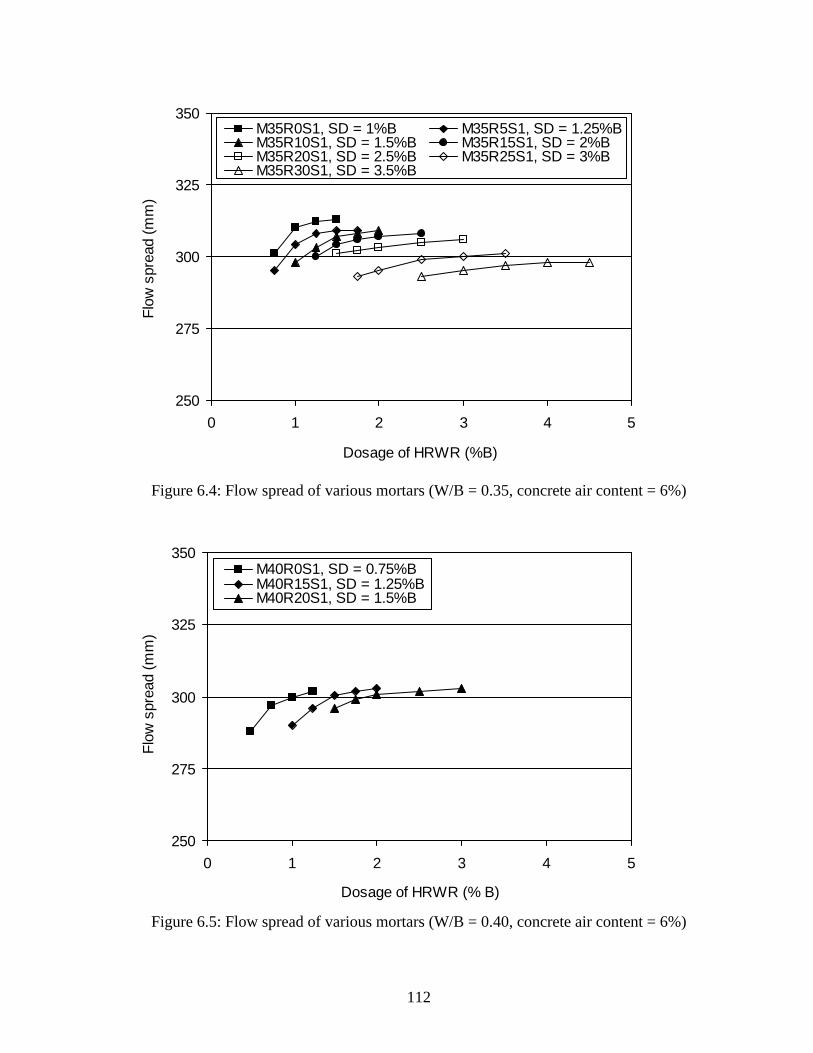
250
275
300
325
350
0 1 2 3 4 5
Dosage of HRWR (%B)
Flow
spr
ead
(mm
)M35R0S1, SD = 1%B M35R5S1, SD = 1.25%BM35R10S1, SD = 1.5%B M35R15S1, SD = 2%BM35R20S1, SD = 2.5%B M35R25S1, SD = 3%BM35R30S1, SD = 3.5%B
Figure 6.4: Flow spread of various mortars (W/B = 0.35, concrete air content = 6%)
250
275
300
325
350
0 1 2 3 4
Dosage of HRWR (% B)
Flow
spr
ead
(mm
)
5
M40R0S1, SD = 0.75%BM40R15S1, SD = 1.25%BM40R20S1, SD = 1.5%B
Figure 6.5: Flow spread of various mortars (W/B = 0.40, concrete air content = 6%)
112
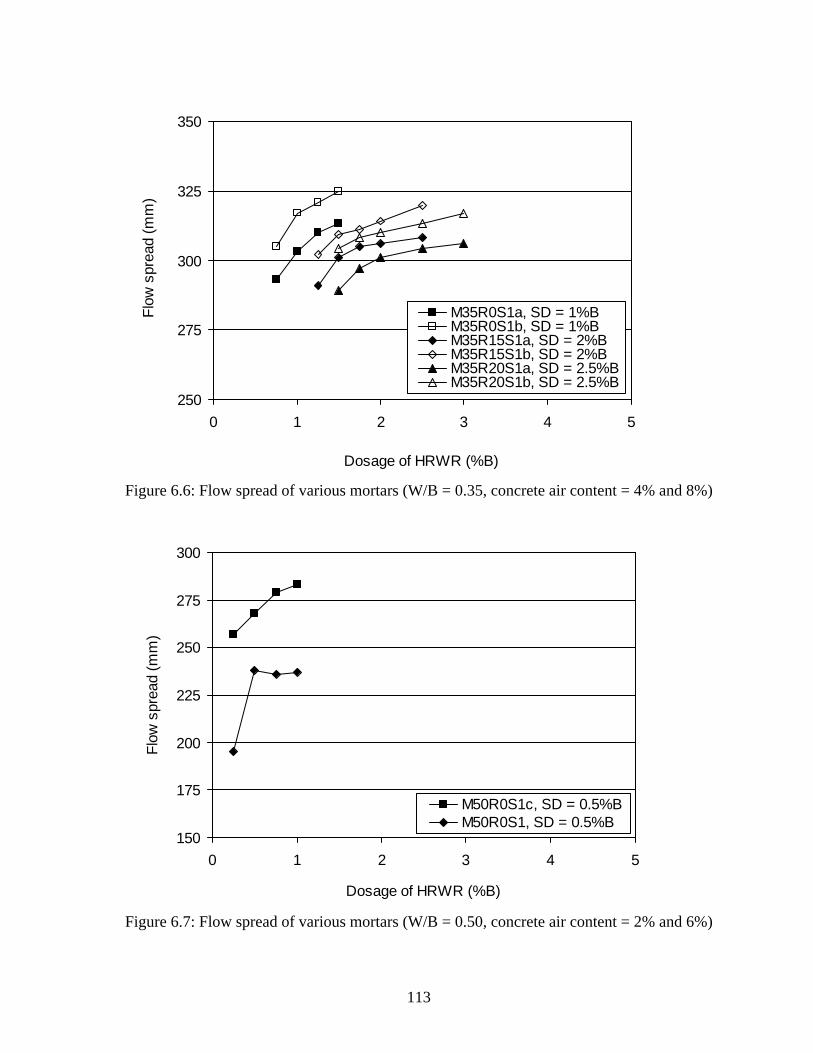
250
275
300
325
350
0 1 2 3 4 5
Dosage of HRWR (%B)
Flow
spr
ead
(mm
)
M35R0S1a, SD = 1%BM35R0S1b, SD = 1%BM35R15S1a, SD = 2%BM35R15S1b, SD = 2%BM35R20S1a, SD = 2.5%BM35R20S1b, SD = 2.5%B
Figure 6.6: Flow spread of various mortars (W/B = 0.35, concrete air content = 4% and 8%)
150
175
200
225
250
275
300
0 1 2 3 4 5
Dosage of HRWR (%B)
Flow
spr
ead
(mm
)
M50R0S1c, SD = 0.5%BM50R0S1, SD = 0.5%B
Figure 6.7: Flow spread of various mortars (W/B = 0.50, concrete air content = 2% and 6%)
113
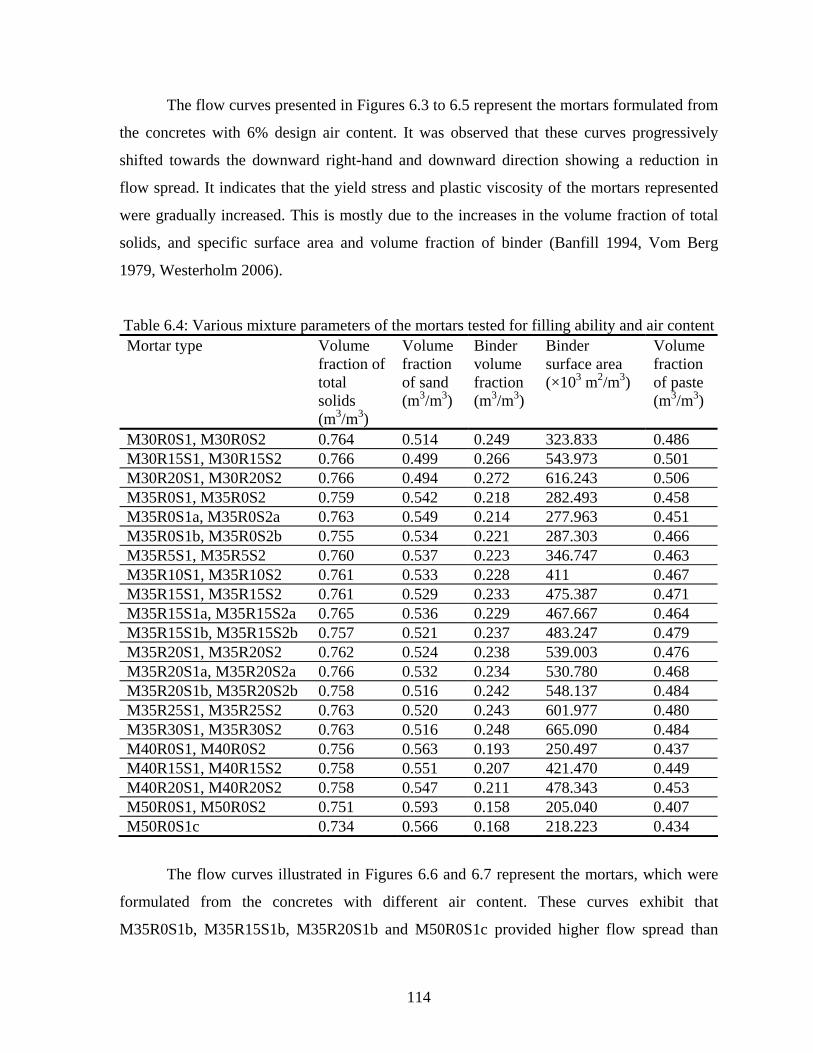
The flow curves presented in Figures 6.3 to 6.5 represent the mortars formulated from
the concretes with 6% design air content. It was observed that these curves progressively
shifted towards the downward right-hand and downward direction showing a reduction in
flow spread. It indicates that the yield stress and plastic viscosity of the mortars represented
were gradually increased. This is mostly due to the increases in the volume fraction of total
solids, and specific surface area and volume fraction of binder (Banfill 1994, Vom Berg
1979, Westerholm 2006).
Table 6.4: Various mixture parameters of the mortars tested for filling ability and air content Mortar type
Volume fraction of total solids (m3/m3)
Volume fraction of sand (m3/m3)
Binder volume fraction (m3/m3)
Binder surface area (×103 m2/m3)
Volume fraction of paste (m3/m3)
M30R0S1, M30R0S2 0.764 0.514 0.249 323.833 0.486 M30R15S1, M30R15S2 0.766 0.499 0.266 543.973 0.501 M30R20S1, M30R20S2 0.766 0.494 0.272 616.243 0.506 M35R0S1, M35R0S2 0.759 0.542 0.218 282.493 0.458 M35R0S1a, M35R0S2a 0.763 0.549 0.214 277.963 0.451 M35R0S1b, M35R0S2b 0.755 0.534 0.221 287.303 0.466 M35R5S1, M35R5S2 0.760 0.537 0.223 346.747 0.463 M35R10S1, M35R10S2 0.761 0.533 0.228 411 0.467 M35R15S1, M35R15S2 0.761 0.529 0.233 475.387 0.471 M35R15S1a, M35R15S2a 0.765 0.536 0.229 467.667 0.464 M35R15S1b, M35R15S2b 0.757 0.521 0.237 483.247 0.479 M35R20S1, M35R20S2 0.762 0.524 0.238 539.003 0.476 M35R20S1a, M35R20S2a 0.766 0.532 0.234 530.780 0.468 M35R20S1b, M35R20S2b 0.758 0.516 0.242 548.137 0.484 M35R25S1, M35R25S2 0.763 0.520 0.243 601.977 0.480 M35R30S1, M35R30S2 0.763 0.516 0.248 665.090 0.484 M40R0S1, M40R0S2 0.756 0.563 0.193 250.497 0.437 M40R15S1, M40R15S2 0.758 0.551 0.207 421.470 0.449 M40R20S1, M40R20S2 0.758 0.547 0.211 478.343 0.453 M50R0S1, M50R0S2 0.751 0.593 0.158 205.040 0.407 M50R0S1c 0.734 0.566 0.168 218.223 0.434
The flow curves illustrated in Figures 6.6 and 6.7 represent the mortars, which were
formulated from the concretes with different air content. These curves exhibit that
M35R0S1b, M35R15S1b, M35R20S1b and M50R0S1c provided higher flow spread than
114
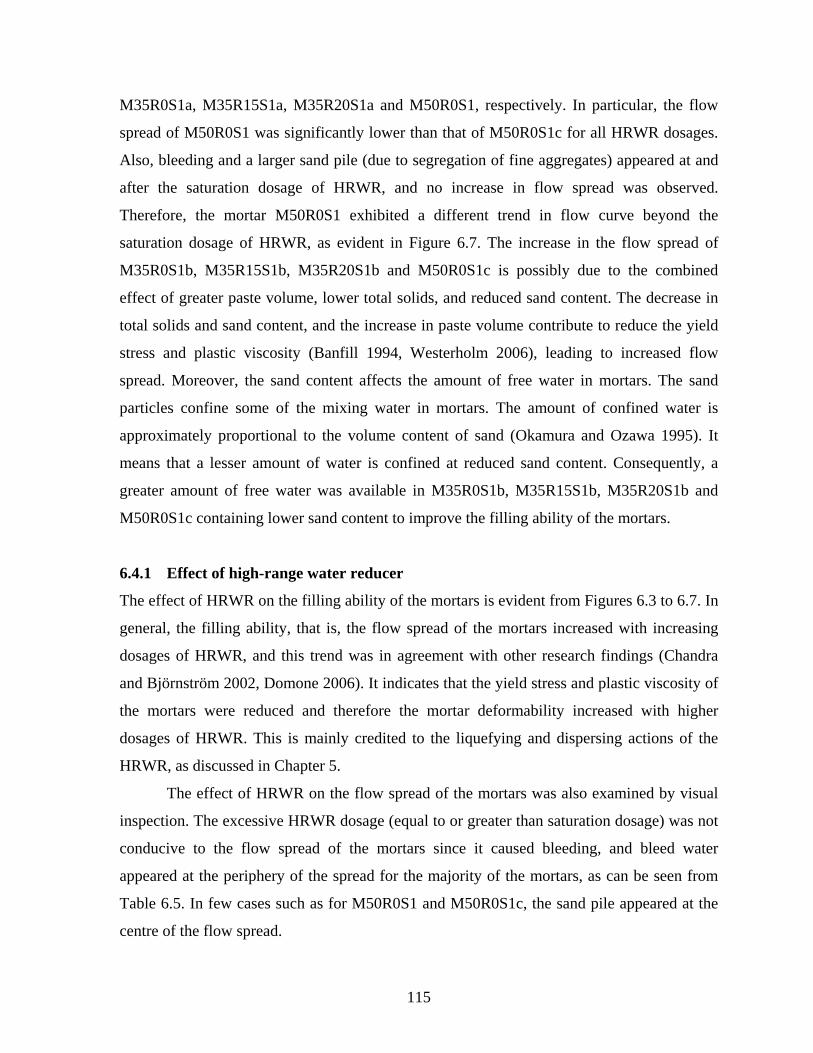
M35R0S1a, M35R15S1a, M35R20S1a and M50R0S1, respectively. In particular, the flow
spread of M50R0S1 was significantly lower than that of M50R0S1c for all HRWR dosages.
Also, bleeding and a larger sand pile (due to segregation of fine aggregates) appeared at and
after the saturation dosage of HRWR, and no increase in flow spread was observed.
Therefore, the mortar M50R0S1 exhibited a different trend in flow curve beyond the
saturation dosage of HRWR, as evident in Figure 6.7. The increase in the flow spread of
M35R0S1b, M35R15S1b, M35R20S1b and M50R0S1c is possibly due to the combined
effect of greater paste volume, lower total solids, and reduced sand content. The decrease in
total solids and sand content, and the increase in paste volume contribute to reduce the yield
stress and plastic viscosity (Banfill 1994, Westerholm 2006), leading to increased flow
spread. Moreover, the sand content affects the amount of free water in mortars. The sand
particles confine some of the mixing water in mortars. The amount of confined water is
approximately proportional to the volume content of sand (Okamura and Ozawa 1995). It
means that a lesser amount of water is confined at reduced sand content. Consequently, a
greater amount of free water was available in M35R0S1b, M35R15S1b, M35R20S1b and
M50R0S1c containing lower sand content to improve the filling ability of the mortars.
6.4.1 Effect of high-range water reducer
The effect of HRWR on the filling ability of the mortars is evident from Figures 6.3 to 6.7. In
general, the filling ability, that is, the flow spread of the mortars increased with increasing
dosages of HRWR, and this trend was in agreement with other research findings (Chandra
and Björnström 2002, Domone 2006). It indicates that the yield stress and plastic viscosity of
the mortars were reduced and therefore the mortar deformability increased with higher
dosages of HRWR. This is mainly credited to the liquefying and dispersing actions of the
HRWR, as discussed in Chapter 5.
The effect of HRWR on the flow spread of the mortars was also examined by visual
inspection. The excessive HRWR dosage (equal to or greater than saturation dosage) was not
conducive to the flow spread of the mortars since it caused bleeding, and bleed water
appeared at the periphery of the spread for the majority of the mortars, as can be seen from
Table 6.5. In few cases such as for M50R0S1 and M50R0S1c, the sand pile appeared at the
centre of the flow spread.
115
Table 6.5: Results of visual inspection of the flow spread of mortars during flow mould test Mortar type
Parent concrete
Saturation dosage of HRWR (%B)*
Dosage of HRWR used (%B)
Observation on flow spread of mortar
M30R0S1 C30R0A6 1.25 1.00-2.00 Bleeding at and after 1.5% HRWR
M30R15S1 C30R15A6 2.5 1.50-3.00 No bleeding M30R20S1 C30R20A6 3 2.00-4.00 No bleeding M35R0S1 C35R0A6 1 0.75-1.50 Bleeding at and after
1.25% HRWR M35R0S1a C35R0A4 1 0.75-1.50 Bleeding at and after
1.25% HRWR M35R0S1b C35R0A8 1 0.75-1.50 Bleeding at and after 1%
HRWR M35R5S1 C35R5A6 1.25 0.75-1.75 Bleeding at and after
1.50% HRWR M35R10S1 C35R10A6 1.5 1.00-2.00 Bleeding at 2% HRWR M35R15S1 C35R15A6 2 1.25-2.50 Bleeding at 2.5% HRWR M35R15S1a C35R15A4 2 1.25-2.50 Bleeding at 2.5% HRWR M35R15S1b C35R15A8 2 1.25-2.50 Bleeding at 2.5% HRWR M35R20S1 C35R20A6 2.5 1.50-3.00 No bleeding M35R20S1a C35R20A4 2.5 1.50-3.00 No bleeding M35R20S1b C35R20A8 2.5 1.50-3.00 No bleeding M35R25S1 C35R25A6 3 1.75-3.50 No bleeding M35R30S1 C35R30A6 3.5 2.50-4.50 No bleeding M40R0S1 C40R0A6 0.75 0.50-1.25 Bleeding at and after
0.75% HRWR M40R15S1 C40R15A6 1.25 1.00-2.00 Bleeding at and after
1.75% HRWR M40R20S1 C40R20A6 1.5 1.50-3.00 Bleeding at and after
2.5% HRWR M50R0S1 C50R0A6 0.5 0.25-1.00 Bleeding and bigger sand
pile at and after 0.5% HRWR
M50R0S1c C50R0A2 0.5 0.25-1.00 Bleeding and smaller sand pile at and after 0.5% HRWR
*Obtained from flow cone test of binder pastes mentioned in Chapter 5
6.4.2 Verification of saturation dosages of high-range water reducer
The saturation dosages obtained from the flow cone test of the binder pastes were verified
based on the flow spread of the mortars. In general, the increase in flow spread was
116
insignificant (0% to 5.6%) beyond the saturation dosages of HRWR. Furthermore, the
bleeding occurred in most cases when the HRWR dosages exceeded the saturation dosage.
This observation justifies the acceptability of the saturation dosages of HRWR obtained from
the flow cone test of the binder pastes. However, a slight bleeding was even observed for the
saturation dosages of HRWR in few cases such as for the mortars designated as M35R0S1b,
M40R0S1, M50R0S1 and M50R0S1c. In addition, a sand pile appeared in the flow spread of
M50R0S1 and M50R0S1c due to the segregation of fine aggregates. The overall observations
suggest that the use of HRWR at or above saturation dosage should be avoided to prevent
bleeding and segregation, and thus to improve the uniformity of mortars.
6.4.3 Effect of water-binder ratio
The effect of W/B ratio on the filling ability of the mortars was examined based on the flow
spreads obtained at the saturation dosages of HRWR. The saturation flow spread of the
mortars corresponding to the parent concretes with 6% design air content were noted from
Figures 6.3 to 6.5 and 6.7, and plotted in Figure 6.8. It can be seen from Figure 6.8 that the
saturation flow spread was greater for lower W/B ratio. This is due to larger paste volume
and reduced sand content. At lower W/B ratio, the paste volume was increased
simultaneously with the reduced sand content, as can be seen from Table 6.4. The increased
paste volume and the reduced sand content decrease the yield stress and plastic viscosity of
the mortars (Banfill 1994, Westerholm 2006), leading to greater flow spread. Also, the
dispersion of the sand particles was enhanced with reduced sand content and increased paste
volume. The increased paste volume pushed the sand particle away from each other with
greater coating thickness of paste (Noguchi and Tomosawa 1999, Yen et al. 1999). Thus, the
friction among sand particles became lower with higher inter-particle distance, and a greater
kinetic energy was available to spread the mortar.
6.4.4 Effect of rice husk ash
The presence of RHA removed the bleeding from the mortars at saturation and higher
dosages of HRWR, as can be seen from Table 6.5. But the flow spread of the mortars was
decreased in the presence of RHA, which is obvious from Figure 6.9. Hence, the greater
HRWR dosages were required at higher RHA contents to obtain the saturation flow spread.
117
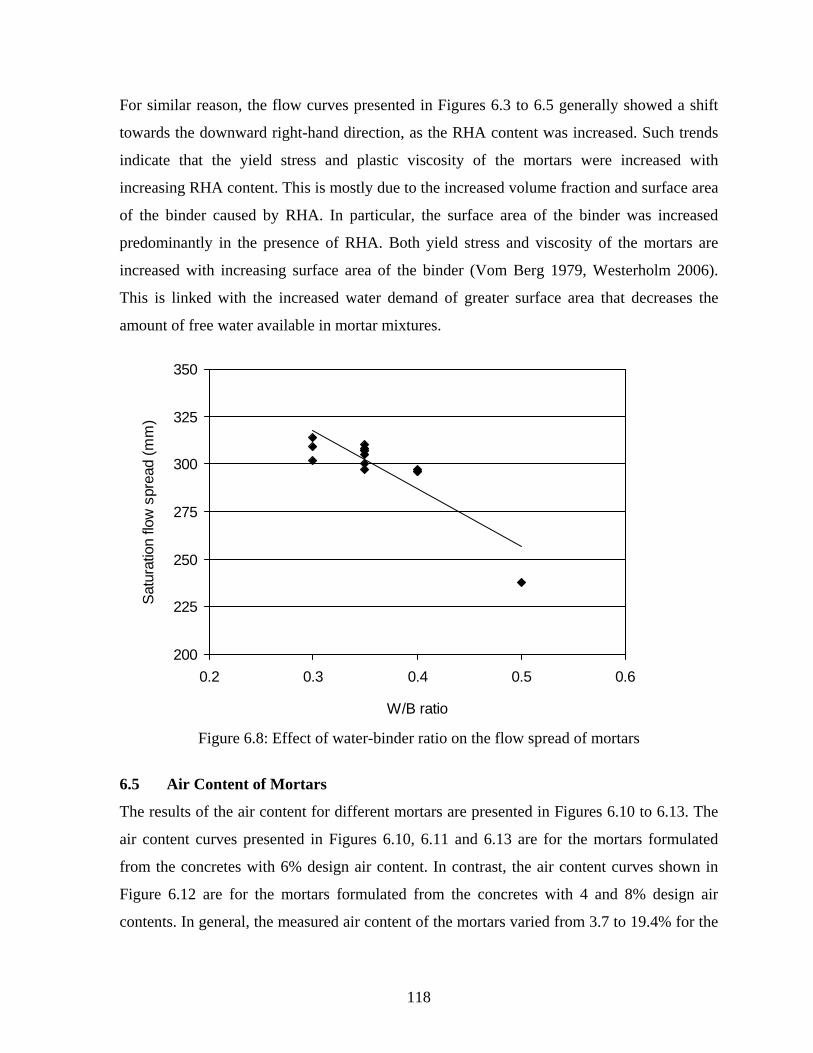
For similar reason, the flow curves presented in Figures 6.3 to 6.5 generally showed a shift
towards the downward right-hand direction, as the RHA content was increased. Such trends
indicate that the yield stress and plastic viscosity of the mortars were increased with
increasing RHA content. This is mostly due to the increased volume fraction and surface area
of the binder caused by RHA. In particular, the surface area of the binder was increased
predominantly in the presence of RHA. Both yield stress and viscosity of the mortars are
increased with increasing surface area of the binder (Vom Berg 1979, Westerholm 2006).
This is linked with the increased water demand of greater surface area that decreases the
amount of free water available in mortar mixtures.
200
225
250
275
300
325
350
0.2 0.3 0.4 0.5 0.6
W/B ratio
Sat
urat
ion
flow
spr
ead
(mm
)
Figure 6.8: Effect of water-binder ratio on the flow spread of mortars
6.5 Air Content of Mortars
The results of the air content for different mortars are presented in Figures 6.10 to 6.13. The
air content curves presented in Figures 6.10, 6.11 and 6.13 are for the mortars formulated
from the concretes with 6% design air content. In contrast, the air content curves shown in
Figure 6.12 are for the mortars formulated from the concretes with 4 and 8% design air
contents. In general, the measured air content of the mortars varied from 3.7 to 19.4% for the
118
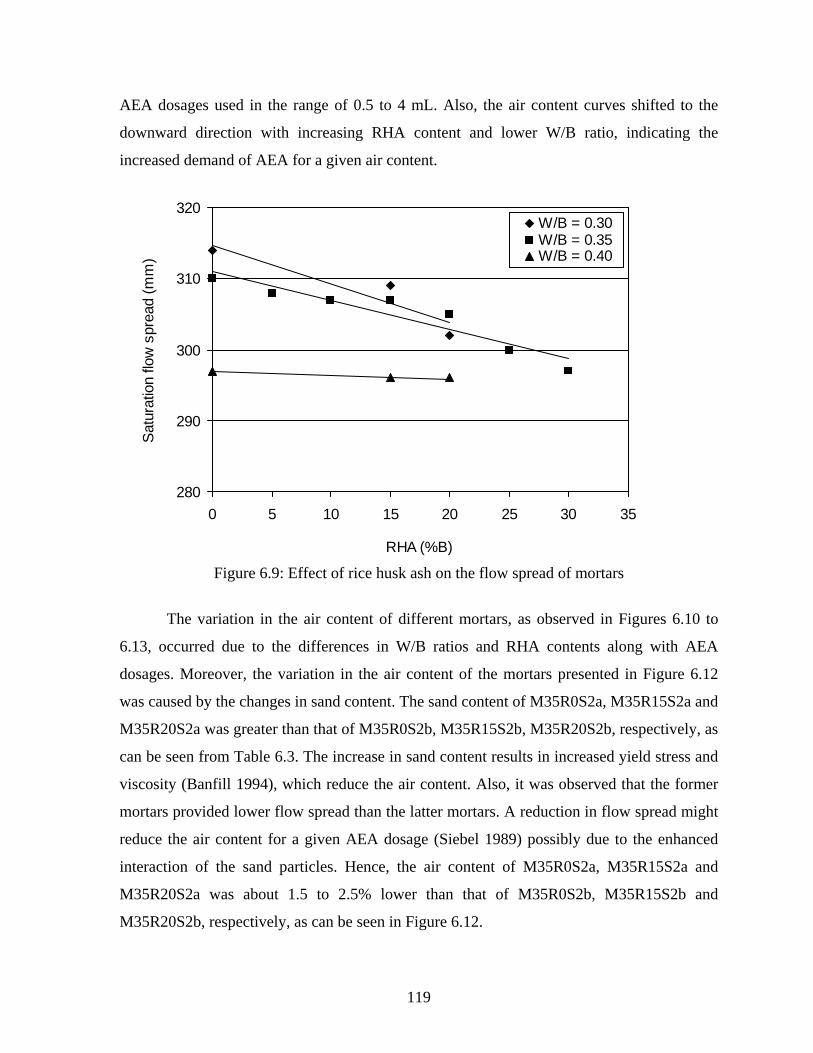
AEA dosages used in the range of 0.5 to 4 mL. Also, the air content curves shifted to the
downward direction with increasing RHA content and lower W/B ratio, indicating the
increased demand of AEA for a given air content.
280
290
300
310
320
0 5 10 15 20 25 30 35
RHA (%B)
Sat
urat
ion
flow
spr
ead
(mm
)
W/B = 0.30W/B = 0.35W/B = 0.40
Figure 6.9: Effect of rice husk ash on the flow spread of mortars
The variation in the air content of different mortars, as observed in Figures 6.10 to
6.13, occurred due to the differences in W/B ratios and RHA contents along with AEA
dosages. Moreover, the variation in the air content of the mortars presented in Figure 6.12
was caused by the changes in sand content. The sand content of M35R0S2a, M35R15S2a and
M35R20S2a was greater than that of M35R0S2b, M35R15S2b, M35R20S2b, respectively, as
can be seen from Table 6.3. The increase in sand content results in increased yield stress and
viscosity (Banfill 1994), which reduce the air content. Also, it was observed that the former
mortars provided lower flow spread than the latter mortars. A reduction in flow spread might
reduce the air content for a given AEA dosage (Siebel 1989) possibly due to the enhanced
interaction of the sand particles. Hence, the air content of M35R0S2a, M35R15S2a and
M35R20S2a was about 1.5 to 2.5% lower than that of M35R0S2b, M35R15S2b and
M35R20S2b, respectively, as can be seen in Figure 6.12.
119
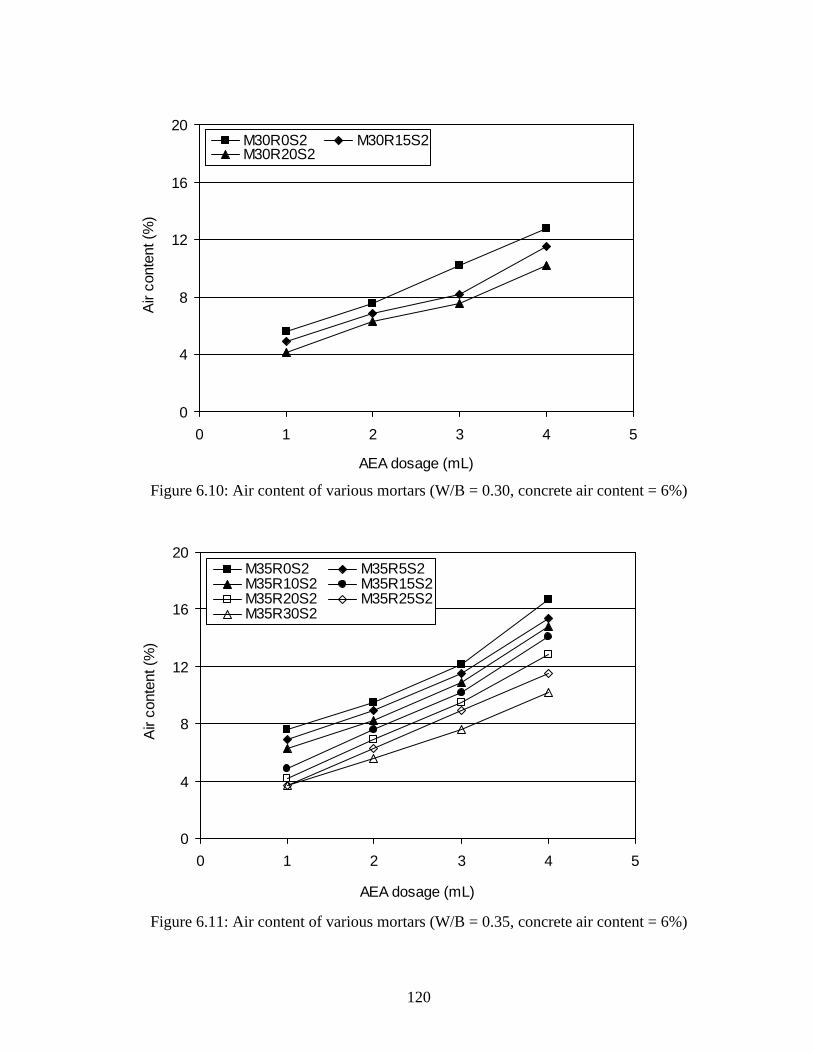
0
4
8
12
16
20
0 1 2 3 4 5
AEA dosage (mL)
Air
cont
ent (
%)
M30R0S2 M30R15S2M30R20S2
Figure 6.10: Air content of various mortars (W/B = 0.30, concrete air content = 6%)
0
4
8
12
16
20
0 1 2 3 4 5
AEA dosage (mL)
Air
cont
ent (
%)
M35R0S2 M35R5S2M35R10S2 M35R15S2M35R20S2 M35R25S2M35R30S2
Figure 6.11: Air content of various mortars (W/B = 0.35, concrete air content = 6%)
120
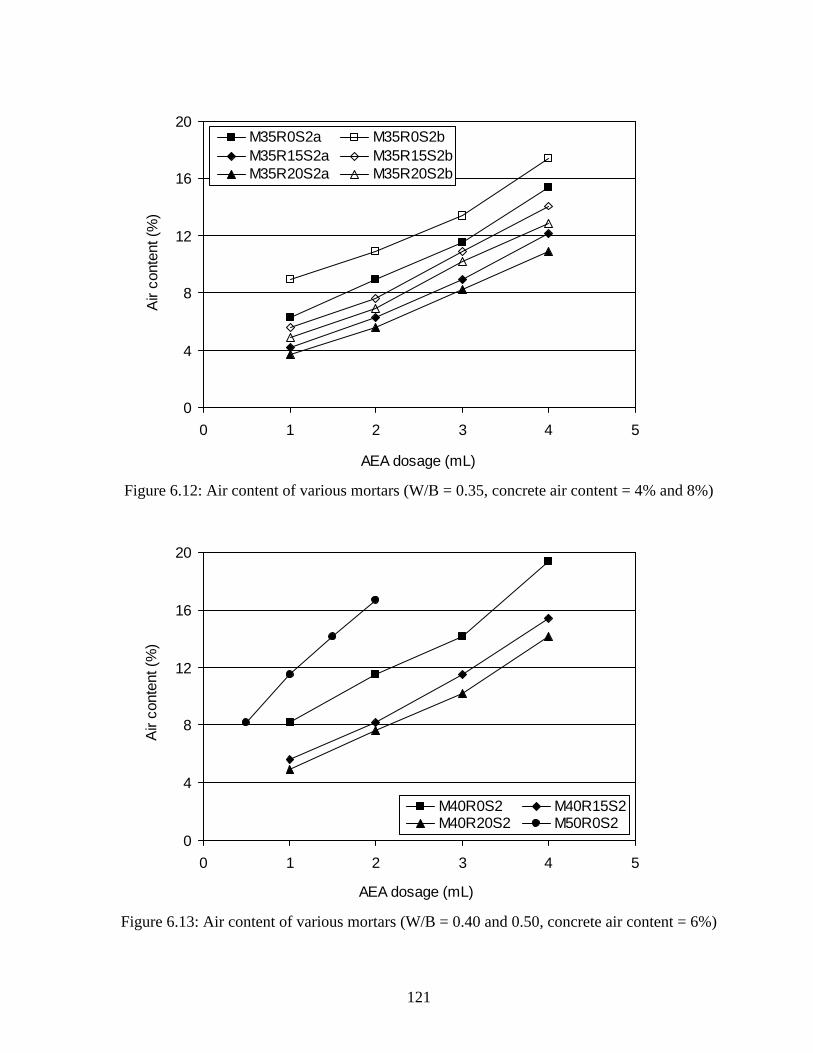
0
4
8
12
16
20
0 1 2 3 4
AEA dosage (mL)
Air
cont
ent (
%)
5
M35R0S2a M35R0S2bM35R15S2a M35R15S2bM35R20S2a M35R20S2b
Figure 6.12: Air content of various mortars (W/B = 0.35, concrete air content = 4% and 8%)
0
4
8
12
16
20
0 1 2 3 4 5
AEA dosage (mL)
Air
cont
ent (
%)
M40R0S2 M40R15S2M40R20S2 M50R0S2
Figure 6.13: Air content of various mortars (W/B = 0.40 and 0.50, concrete air content = 6%)
121
6.5.1 Effect of air-entraining admixture
The air content of the mortars increased with increasing AEA dosages, as can be seen from
Figures 6.10 to 6.13. The rate of increase was generally greater for the AEA dosages at 3 mL
and above indicating the formation of more air-voids. It is reflected with the slope of the
curves that became steeper in most cases at higher AEA dosages between 3 and 4 mL. This is
perhaps due to the reduced loss of AEA through absorption in sand particles and binding
materials that occurs at the early stage of mixing. Furthermore, additional air-voids can also
be produced from the previous dosages with increased mixing time (Kosmatka et al. 2002),
leading to a greater total air content.
6.5.2 Effect of water-binder ratio
The air content of the mortars was decreased linearly with lower W/B ratio for all AEA
dosages, which is obvious from Figure 6.14. This is caused by the increased cement content
at lower W/B ratio (ACI 212.3R-04, 2004; Whiting and Nagi 1998). An increase in the
amount of cementing material results in a higher surface area that enhances the yield stress
and plastic viscosity of paste, and thus causes some loss of air-voids leading to a reduction in
air content.
6.5.3 Effect of rice husk ash
The air content of the mortars decreased with the increased RHA content for all AEA
dosages. In general, the mortar air content was reduced linearly with increasing RHA
content, as can be seen from Figure 6.15. Also, the reduction in air content due to RHA
followed a similar trendline for all AEA dosages. The reduction in air content is mostly due
to the increased surface area of the binder in the presence of RHA. The increased surface area
of the binder intensifies the viscosity of the paste that tends to collapse some of the air-voids
with increased internal pressure (Khayat and Assaad 2002). In addition, the increased RHA
content required higher dosages of HRWR. The HRWR molecules impede the attachment of
entrained air-voids onto the binding materials by reducing the attachment sites (Khayat and
Assaad 2002). Thus, the air content of the mortars can be reduced with increased RHA
content.
122
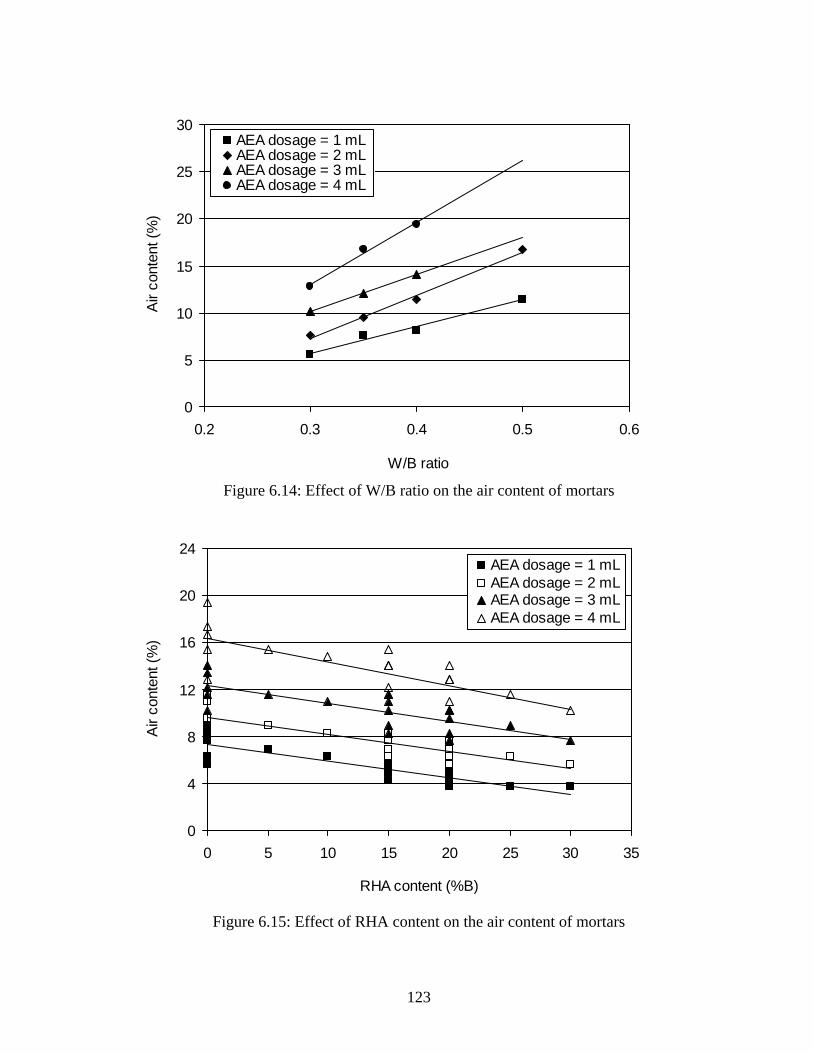
0
5
10
15
20
25
30
0.2 0.3 0.4 0.5 0.6
W/B ratio
Air
cont
ent (
%)
AEA dosage = 1 mLAEA dosage = 2 mLAEA dosage = 3 mLAEA dosage = 4 mL
Figure 6.14: Effect of W/B ratio on the air content of mortars
0
4
8
12
16
20
24
0 5 10 15 20 25 30 35
RHA content (%B)
Air
cont
ent (
%)
AEA dosage = 1 mLAEA dosage = 2 mLAEA dosage = 3 mLAEA dosage = 4 mL
Figure 6.15: Effect of RHA content on the air content of mortars
123
6.6 Suitable Content of Rice Husk Ash
The reduction in the filling ability of the mortars was significant for a RHA content greater
than 20% although it practically eliminated the bleeding. However, it depended on the W/B
ratio of the mortars. The water demand for 20% RHA was higher at lower water W/B ratio.
For this reason, 20% RHA caused a significant reduction in the flow spread of mortars at
0.30 and 0.35 W/B ratios. In comparison, the minimum reduction in flow spread was
observed at 0.40 W/B ratio, as can be seen from Figures 6.5 and 6.9. Also, it can be inferred
based on Figures 6.4 and 6.9 that the yield stress and plastic viscosity became very high at 25
and 30% RHA, resulting in a significant reduction in the flow spread of mortar. Therefore,
relatively high HRWR dosages were required to achieve the saturation flow spread for these
two cases. The overall flow spread results suggest that a RHA content greater than 20% is
not effective for the filling ability of mortar. In addition, the demand for the AEA dosages for
a given air content was comparatively high for 20% and greater RHA contents. Also,
handling and mixing difficulties were experienced for the mortars with a RHA content higher
than 15%, particularly at lower W/B ratios. Therefore, a RHA content greater than 15% may
not be suitable to achieve the target filling ability of mortars and their corresponding parent
concretes.
6.7 Estimated Dosages of Air-entraining Admixture for Concretes
The dosages of AEA required to produce a given air content in concretes were estimated
based on the air content results of the mortars. For this, the concrete air content was
converted into the equivalent mortar air content. Since the entrapped air content of the
concrete is not produced from the AEA dosage, it was deducted from the specified concrete
air content. The entrapped air content of concretes generally varies in the range of 1 to 3%
(Kosmatka et al. 2002). Therefore, an average amount of entrapped air (2%) was subtracted
from the specified concrete air content before converting it into equivalent mortar air content.
Also, the entrapped air content of the mortars was not included while computing the
equivalent mortar air content since the entrapped air is minimized when the mortars are
produced at the slow speed of the mixer (Kim and Robertson 1997). The following equation
was used to determine the equivalent mortar air content of the concretes (ASTM C231,
2004):
124
)(100100
mccm
ccme VVAV
VAA
−+= (Equation 6.1)
where:
Ame = Equivalent air content of the mortar (%)
Ac = Entrained air content of the concrete (%)
Vc = Air-free absolute volume of the concrete (m3)
Vm = Air-free absolute volume of the mortar component of concrete (m3)
The AEA dosages needed for the equivalent mortar air contents were calculated using
the air content curves presented in Figures 6.10 to 6.13. These AEA dosages are applicable
for the pure mortars, which were prepared separately instead of taking them from the
concrete mixtures during testing of the air content by Chace indicator. Hence, they were
corrected by multiplying with the actual air-free volume fraction of the mortar present in
concrete. Equation 6.2 was applied to estimate the AEA dosages for the concretes. The
estimated AEA dosages are shown in Table 6.6.
1001000
××= mcdme
ce BRD
D φ (Equation 6.2)
where:
B = Binder content of mortar (kg)
Dce = Estimated AEA dosage for the specified air content of concrete (%B)
Dme = AEA dosage for the equivalent air content of mortar (mL)
Rd = Relative density of AEA
φmc = Volume fraction of the mortar component in concrete (m3/m3)
6.8 Use of Filling Ability and Air Content Results of Mortars
The filling ability results primarily revealed the effects of HRWR, RHA content, and W/B
ratio or binder content on the flow spread of mortars. In addition, the flow spread of several
mortars showed the effect of sand content. These results were useful to verify the saturation
125
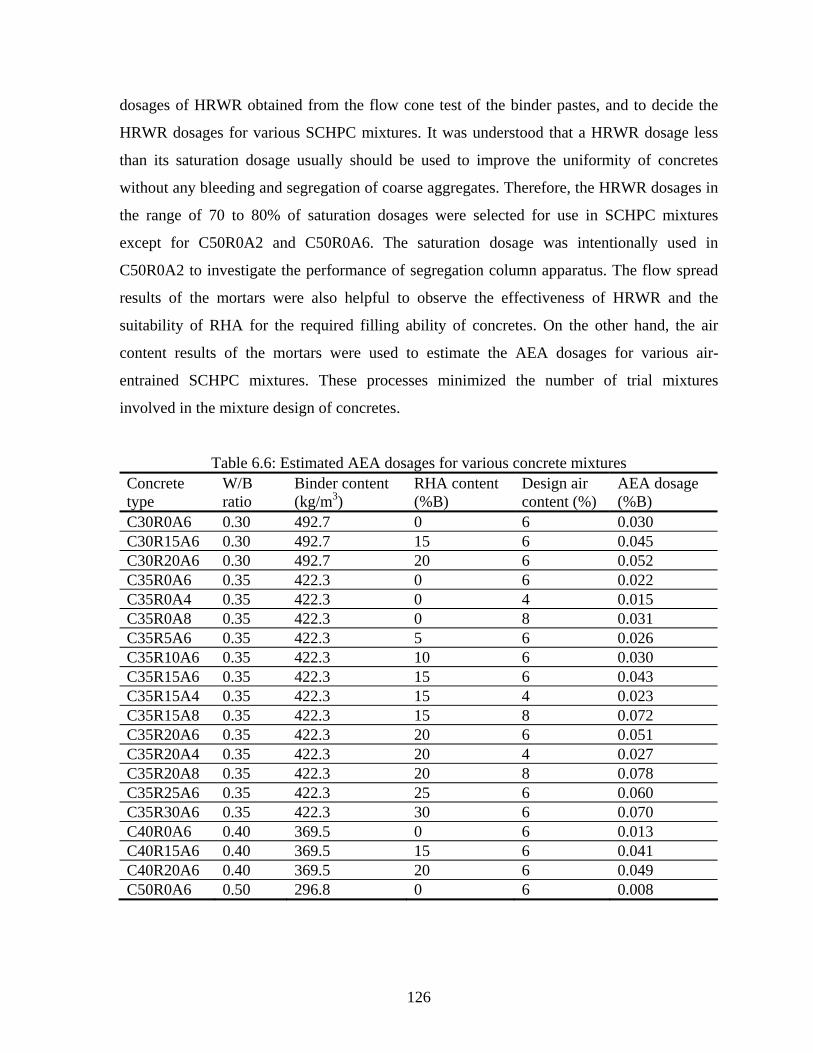
dosages of HRWR obtained from the flow cone test of the binder pastes, and to decide the
HRWR dosages for various SCHPC mixtures. It was understood that a HRWR dosage less
than its saturation dosage usually should be used to improve the uniformity of concretes
without any bleeding and segregation of coarse aggregates. Therefore, the HRWR dosages in
the range of 70 to 80% of saturation dosages were selected for use in SCHPC mixtures
except for C50R0A2 and C50R0A6. The saturation dosage was intentionally used in
C50R0A2 to investigate the performance of segregation column apparatus. The flow spread
results of the mortars were also helpful to observe the effectiveness of HRWR and the
suitability of RHA for the required filling ability of concretes. On the other hand, the air
content results of the mortars were used to estimate the AEA dosages for various air-
entrained SCHPC mixtures. These processes minimized the number of trial mixtures
involved in the mixture design of concretes.
Table 6.6: Estimated AEA dosages for various concrete mixtures Concrete type
W/B ratio
Binder content (kg/m3)
RHA content (%B)
Design air content (%)
AEA dosage (%B)
C30R0A6 0.30 492.7 0 6 0.030 C30R15A6 0.30 492.7 15 6 0.045 C30R20A6 0.30 492.7 20 6 0.052 C35R0A6 0.35 422.3 0 6 0.022 C35R0A4 0.35 422.3 0 4 0.015 C35R0A8 0.35 422.3 0 8 0.031 C35R5A6 0.35 422.3 5 6 0.026 C35R10A6 0.35 422.3 10 6 0.030 C35R15A6 0.35 422.3 15 6 0.043 C35R15A4 0.35 422.3 15 4 0.023 C35R15A8 0.35 422.3 15 8 0.072 C35R20A6 0.35 422.3 20 6 0.051 C35R20A4 0.35 422.3 20 4 0.027 C35R20A8 0.35 422.3 20 8 0.078 C35R25A6 0.35 422.3 25 6 0.060 C35R30A6 0.35 422.3 30 6 0.070 C40R0A6 0.40 369.5 0 6 0.013 C40R15A6 0.40 369.5 15 6 0.041 C40R20A6 0.40 369.5 20 6 0.049 C50R0A6 0.50 296.8 0 6 0.008
126
6.9 Conclusions
a. The filling ability of the mortars with respect to flow spread was increased with greater
dosages of HRWR, which improved the deformability of mortar by its liquefying and
dispersing actions.
b. The increase in mortar flow spread was not significant beyond the saturation dosages of
HRWR obtained from the flow cone test of binder pastes. In most cases the bleeding and
in few cases the sand pile appeared when the HRWR dosage used was equal to and
higher than saturation dosage.
c. Excessive dosages of HRWR caused bleeding, which was minimized or eliminated in the
presence of RHA that reduced the amount of free water available in mortar mixture due
to increased water demand.
d. The filling ability, that is, the flow spread of the mortars was increased with lower W/B
ratio due to larger paste volume and reduced sand content.
e. The filling ability of the mortars with regard to flow spread was decreased with higher
RHA content due to the increased volume fraction and surface area of the binder.
f. A RHA content greater than 20% reduced the flow spread of mortar significantly,
suggesting it might be unsuitable to achieve the required filling ability of concrete. Also,
the demand for the AEA dosages for a given air content was relatively high for 20% and
greater RHA contents.
g. The filling ability and air content of the mortars were influenced by their mixture
composition, particularly, the sand and cement contents affected the flow spread and air
content of the mortars by affecting their yield stress and plastic viscosity.
h. The air content of the mortars increased with the increase in AEA dosage due to the
formation of greater air-voids, and decreased with lower W/B ratio and higher RHA
content due to the increases in binder content, binder surface area and HRWR dosage.
i. The filling ability and air content of the mortars facilitate the mixture proportioning
process of concretes to set the necessary HRWR dosages, to estimate the required AEA
dosages, and to select a suitable RHA content.
127
Chapter 7
Mixture Proportions of Concretes
7.1 General
The design of self-consolidating high performance concrete (SCHPC) mixtures including the
variables and constraints are presented and discussed in this chapter. In addition, this chapter
presents the design approach, describes different types of SCHPC, and gives their primary
and adjusted mixture proportions and the dosages of various chemical admixtures such as
high-range water reducer (HRWR), air-entraining admixture (AEA) and viscosity-enhancing
admixture (VEA).
7.2 Design of Concrete Mixtures
Different types of SCHPC mixtures were designed with various water-binder (W/B) ratios
and rice husk ash (RHA) contents. All SCHPC mixtures designed were air-entrained except
for one. The non-air-entrained concrete was mainly designed for using in the development of
segregation column apparatus.
7.2.1 Design variables and constraints
The variables and constraints for different concrete mixtures are shown in Table 7.1. The
major design variables for the concrete mixtures were W/B ratio or binder (cement plus
RHA) content, RHA content and air content. The other variables were the dosages of HRWR
and AEA, and the mixing time of concrete. The dosages of HRWR were varied for different
concrete mixtures to achieve a slump flow in the range of 600 to 800 mm. The HRWR
dosages were mainly dependent of the W/B ratio or binder content and RHA content used.
The dosages of AEA also varied for different concrete mixtures, depending on the required
air content and the W/B ratio and RHA content used.
The major constraints for the concrete mixtures were the slump and slump flow. A
minimum slump of 250 mm and a minimum slump flow of 600 mm were considered to
produce the SCHPC mixtures. The optimum sand-aggregate (S/A) ratio was also used in all
128
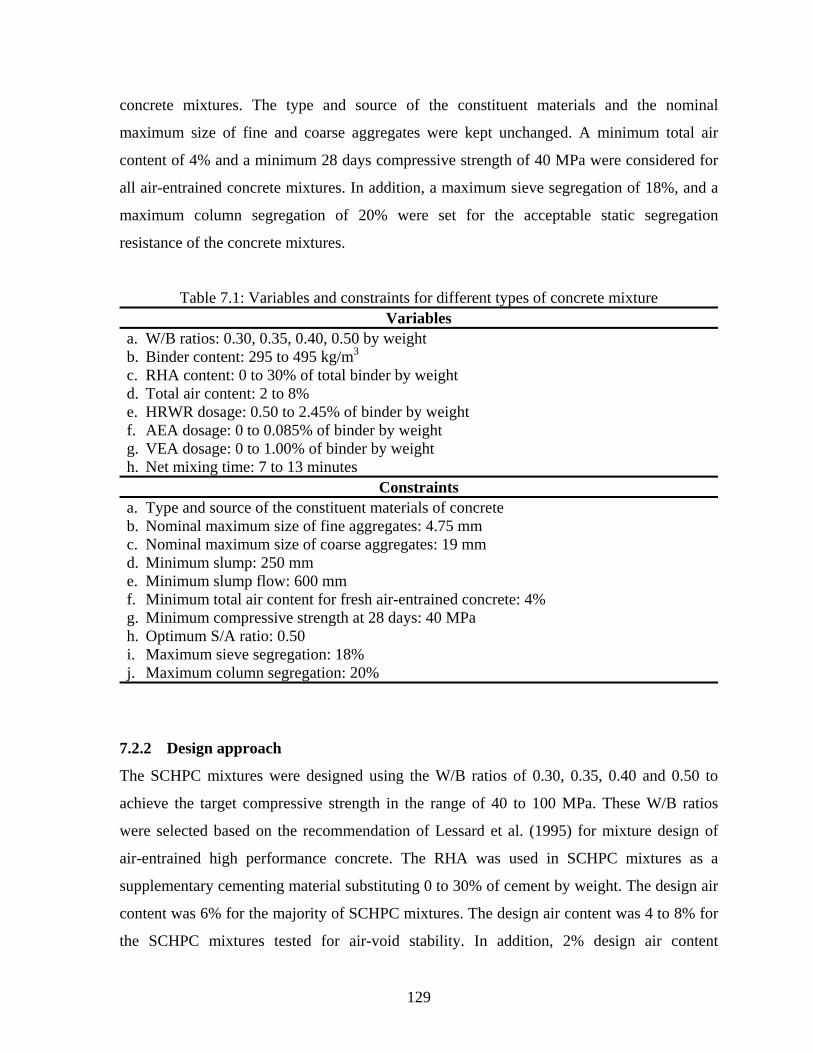
concrete mixtures. The type and source of the constituent materials and the nominal
maximum size of fine and coarse aggregates were kept unchanged. A minimum total air
content of 4% and a minimum 28 days compressive strength of 40 MPa were considered for
all air-entrained concrete mixtures. In addition, a maximum sieve segregation of 18%, and a
maximum column segregation of 20% were set for the acceptable static segregation
resistance of the concrete mixtures.
Table 7.1: Variables and constraints for different types of concrete mixture Variables
a. W/B ratios: 0.30, 0.35, 0.40, 0.50 by weight b. Binder content: 295 to 495 kg/m3 c. RHA content: 0 to 30% of total binder by weight d. Total air content: 2 to 8% e. HRWR dosage: 0.50 to 2.45% of binder by weight f. AEA dosage: 0 to 0.085% of binder by weight g. VEA dosage: 0 to 1.00% of binder by weight h. Net mixing time: 7 to 13 minutes
Constraints a. Type and source of the constituent materials of concrete b. Nominal maximum size of fine aggregates: 4.75 mm c. Nominal maximum size of coarse aggregates: 19 mm d. Minimum slump: 250 mm e. Minimum slump flow: 600 mm f. Minimum total air content for fresh air-entrained concrete: 4% g. Minimum compressive strength at 28 days: 40 MPa h. Optimum S/A ratio: 0.50 i. Maximum sieve segregation: 18% j. Maximum column segregation: 20%
7.2.2 Design approach
The SCHPC mixtures were designed using the W/B ratios of 0.30, 0.35, 0.40 and 0.50 to
achieve the target compressive strength in the range of 40 to 100 MPa. These W/B ratios
were selected based on the recommendation of Lessard et al. (1995) for mixture design of
air-entrained high performance concrete. The RHA was used in SCHPC mixtures as a
supplementary cementing material substituting 0 to 30% of cement by weight. The design air
content was 6% for the majority of SCHPC mixtures. The design air content was 4 to 8% for
the SCHPC mixtures tested for air-void stability. In addition, 2% design air content
129
(entrapped air content) was considered for the non-air-entrained SCHPC mixture with 0.50
W/B ratio and 0% RHA content.
The quantity of the mixing water for SCHPC mixtures with 0.30 to 0.40 W/B ratios
was estimated and adjusted based on the ACI guideline for mixture design of high strength
concrete given in ACI 211.4R-93 (2004). In this case, a minimum slump of 75 to 100 mm
specified without any HRWR was considered for the first estimate of mixing water
requirement. The mixing water for the SCHPC mixtures with 0.50 W/B ratio was estimated
according to the CAC guideline (Kosmatka et al. 2002). In this case a minimum slump of 25
to 50 mm was considered for the first estimate of mixing water prior to the addition of any
HRWR. In addition, the optimum S/A ratio of 0.50, as obtained from the testing of various
aggregate blends, was used to design the SCHPC mixtures. The HRWR was used in all
concretes to obtain the required filling ability and passing ability. The AEA was incorporated
to obtain the concrete air content in the range of 4% to 8%. Moreover, the VEA was used in a
limited number of concrete mixtures to improve their stability with increased segregation
resistance.
7.2.3 Various types of concrete mixture
In total, twenty one different types of SCHPC mixtures were designed. The designation and
description of the concrete mixtures are presented in Table 7.2. The concrete mixtures were
designated based on the W/B ratio, RHA content, and design air content used. For example,
the ‘C30R0A6’ designation was used for a concrete prepared with a W/B ratio of 0.30, 0%
RHA content, and 6% design air content.
7.3 Mixture Proportions
The mixture proportions of various SCHPCs were determined based on the absolute volume
method. At first, the primary mixture proportions were determined considering the design air
content and the absolute volumes of fine and coarse aggregates, binder (cement pus RHA),
and water. Then, the dosages of chemical admixtures (HRWR, AEA and VEA) were
decided, the water correction was done, and finally the adjusted mixture proportions were
determined for concrete batching.
130
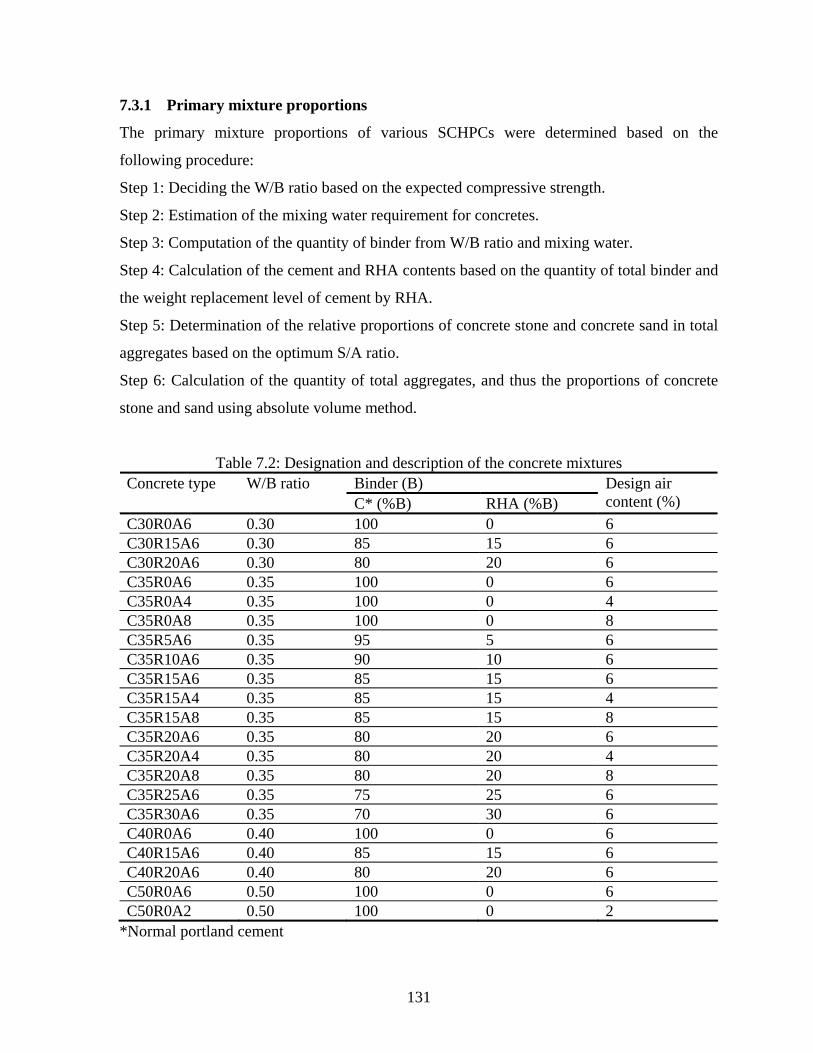
7.3.1 Primary mixture proportions
The primary mixture proportions of various SCHPCs were determined based on the
following procedure:
Step 1: Deciding the W/B ratio based on the expected compressive strength.
Step 2: Estimation of the mixing water requirement for concretes.
Step 3: Computation of the quantity of binder from W/B ratio and mixing water.
Step 4: Calculation of the cement and RHA contents based on the quantity of total binder and
the weight replacement level of cement by RHA.
Step 5: Determination of the relative proportions of concrete stone and concrete sand in total
aggregates based on the optimum S/A ratio.
Step 6: Calculation of the quantity of total aggregates, and thus the proportions of concrete
stone and sand using absolute volume method.
Table 7.2: Designation and description of the concrete mixtures Binder (B) Concrete type W/B ratio C* (%B) RHA (%B)
Design air content (%)
C30R0A6 0.30 100 0 6 C30R15A6 0.30 85 15 6 C30R20A6 0.30 80 20 6 C35R0A6 0.35 100 0 6 C35R0A4 0.35 100 0 4 C35R0A8 0.35 100 0 8 C35R5A6 0.35 95 5 6 C35R10A6 0.35 90 10 6 C35R15A6 0.35 85 15 6 C35R15A4 0.35 85 15 4 C35R15A8 0.35 85 15 8 C35R20A6 0.35 80 20 6 C35R20A4 0.35 80 20 4 C35R20A8 0.35 80 20 8 C35R25A6 0.35 75 25 6 C35R30A6 0.35 70 30 6 C40R0A6 0.40 100 0 6 C40R15A6 0.40 85 15 6 C40R20A6 0.40 80 20 6 C50R0A6 0.50 100 0 6 C50R0A2 0.50 100 0 2
*Normal portland cement
131

The absolute volumes of the HRWR, AEA and VEA were not taken into account to
calculate the primary mixture proportions. This is because these chemical admixtures were
used as additives to the primary concrete mixtures. The primary mixture proportions of the
concretes are shown in Table 7.3.
Table 7.3: Details of the primary concrete mixture proportions Concrete type CA*
(kg/m3) FA♣
(kg/m3) C (kg/m3)
RHA (kg/m3)
W♠
(kg/m3) C30R0A6 846.3 842.2 492.7 0 147.8 C30R15A6 829.9 825.8 418.8 73.9 147.8 C30R20A6 824.4 820.3 394.2 98.5 147.8 C35R0A6 876.1 871.8 422.3 0 147.8 C35R0A4 902.7 898.3 422.3 0 147.8 C35R0A8 849.4 845.2 422.3 0 147.8 C35R5A6 871.4 867.1 401.2 21.1 147.8 C35R10A6 866.7 862.4 380.1 42.2 147.8 C35R15A6 862.0 857.8 359.0 63.3 147.8 C35R15A4 888.6 884.2 359.0 63.3 147.8 C35R15A8 835.3 831.2 359.0 63.3 147.8 C35R20A6 857.3 853.1 337.8 84.5 147.8 C35R20A4 883.9 879.5 337.8 84.5 147.8 C35R20A8 830.6 826.5 337.8 84.5 147.8 C35R25A6 852.6 848.4 316.7 105.6 147.8 C35R30A6 847.9 843.7 295.6 126.7 147.8 C40R0A6 898.4 894.0 369.5 0 147.8 C40R15A6 886.0 881.7 314.1 55.4 147.8 C40R20A6 881.9 877.6 295.6 73.9 147.8 C50R0A6 928.3 923.7 296.8 0 148.4 C50R0A2 940.1 935.5 334.8 0 167.4
*Coarse aggregate; ♣Fine aggregate; ♠Normal tap water
7.3.2 Dosages of chemical admixtures
The dosages of chemical admixtures such as HRWR, AEA and VEA were selected to
produce the required flowing ability (filling ability and passing ability), air content, and
segregation resistance, respectively. The HRWR dosages for the concretes were set based on
the saturation dosages (SDs) of HRWR. The saturation dosages of HRWR were obtained
from the filling ability test results of the pastes, as discussed in Chapter 5. The AEA dosages
132
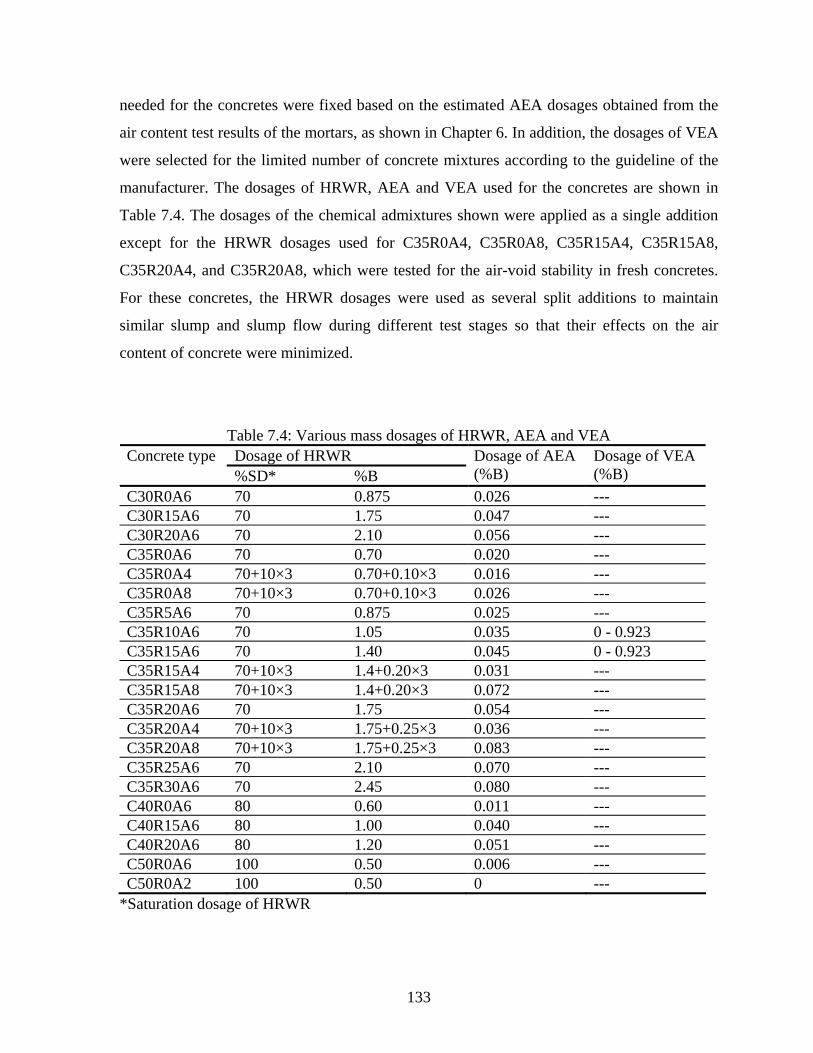
needed for the concretes were fixed based on the estimated AEA dosages obtained from the
air content test results of the mortars, as shown in Chapter 6. In addition, the dosages of VEA
were selected for the limited number of concrete mixtures according to the guideline of the
manufacturer. The dosages of HRWR, AEA and VEA used for the concretes are shown in
Table 7.4. The dosages of the chemical admixtures shown were applied as a single addition
except for the HRWR dosages used for C35R0A4, C35R0A8, C35R15A4, C35R15A8,
C35R20A4, and C35R20A8, which were tested for the air-void stability in fresh concretes.
For these concretes, the HRWR dosages were used as several split additions to maintain
similar slump and slump flow during different test stages so that their effects on the air
content of concrete were minimized.
Table 7.4: Various mass dosages of HRWR, AEA and VEA Dosage of HRWR Concrete type %SD* %B
Dosage of AEA (%B)
Dosage of VEA (%B)
C30R0A6 70 0.875 0.026 --- C30R15A6 70 1.75 0.047 --- C30R20A6 70 2.10 0.056 --- C35R0A6 70 0.70 0.020 --- C35R0A4 70+10×3 0.70+0.10×3 0.016 --- C35R0A8 70+10×3 0.70+0.10×3 0.026 --- C35R5A6 70 0.875 0.025 --- C35R10A6 70 1.05 0.035 0 - 0.923 C35R15A6 70 1.40 0.045 0 - 0.923 C35R15A4 70+10×3 1.4+0.20×3 0.031 --- C35R15A8 70+10×3 1.4+0.20×3 0.072 --- C35R20A6 70 1.75 0.054 --- C35R20A4 70+10×3 1.75+0.25×3 0.036 --- C35R20A8 70+10×3 1.75+0.25×3 0.083 --- C35R25A6 70 2.10 0.070 --- C35R30A6 70 2.45 0.080 --- C40R0A6 80 0.60 0.011 --- C40R15A6 80 1.00 0.040 --- C40R20A6 80 1.20 0.051 --- C50R0A6 100 0.50 0.006 --- C50R0A2 100 0.50 0 ---
*Saturation dosage of HRWR
133
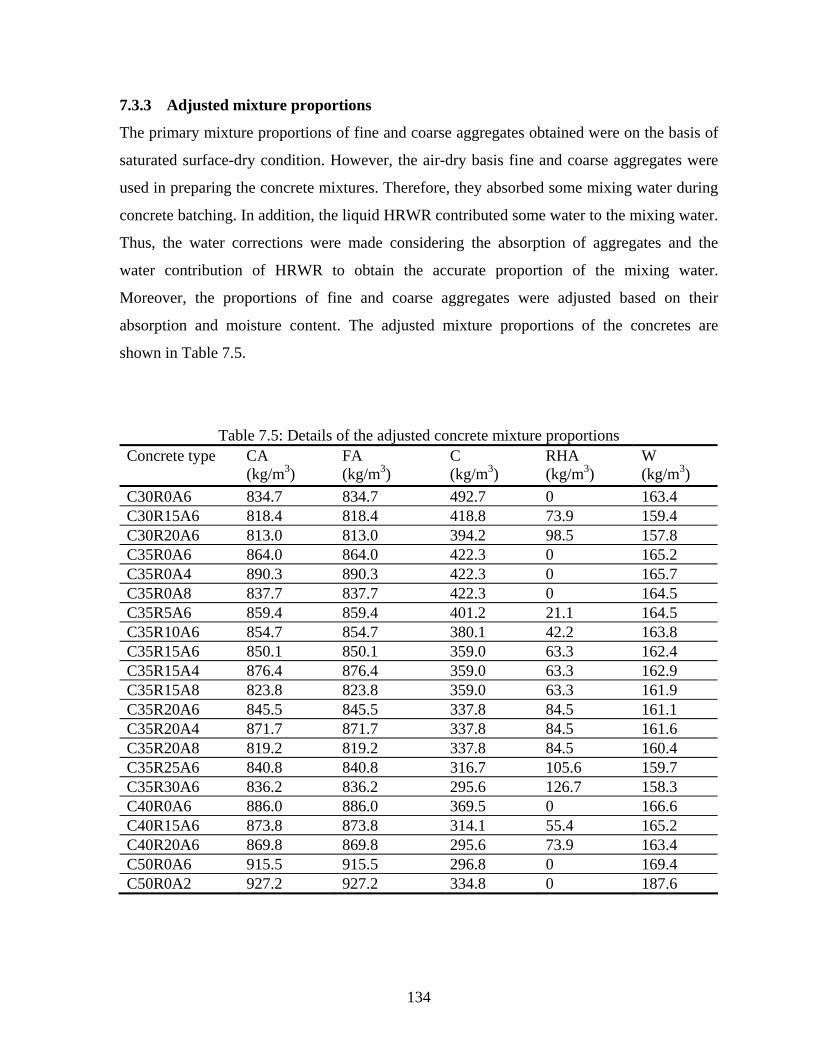
7.3.3 Adjusted mixture proportions
The primary mixture proportions of fine and coarse aggregates obtained were on the basis of
saturated surface-dry condition. However, the air-dry basis fine and coarse aggregates were
used in preparing the concrete mixtures. Therefore, they absorbed some mixing water during
concrete batching. In addition, the liquid HRWR contributed some water to the mixing water.
Thus, the water corrections were made considering the absorption of aggregates and the
water contribution of HRWR to obtain the accurate proportion of the mixing water.
Moreover, the proportions of fine and coarse aggregates were adjusted based on their
absorption and moisture content. The adjusted mixture proportions of the concretes are
shown in Table 7.5.
Table 7.5: Details of the adjusted concrete mixture proportions Concrete type CA
(kg/m3) FA (kg/m3)
C (kg/m3)
RHA (kg/m3)
W (kg/m3)
C30R0A6 834.7 834.7 492.7 0 163.4 C30R15A6 818.4 818.4 418.8 73.9 159.4 C30R20A6 813.0 813.0 394.2 98.5 157.8 C35R0A6 864.0 864.0 422.3 0 165.2 C35R0A4 890.3 890.3 422.3 0 165.7 C35R0A8 837.7 837.7 422.3 0 164.5 C35R5A6 859.4 859.4 401.2 21.1 164.5 C35R10A6 854.7 854.7 380.1 42.2 163.8 C35R15A6 850.1 850.1 359.0 63.3 162.4 C35R15A4 876.4 876.4 359.0 63.3 162.9 C35R15A8 823.8 823.8 359.0 63.3 161.9 C35R20A6 845.5 845.5 337.8 84.5 161.1 C35R20A4 871.7 871.7 337.8 84.5 161.6 C35R20A8 819.2 819.2 337.8 84.5 160.4 C35R25A6 840.8 840.8 316.7 105.6 159.7 C35R30A6 836.2 836.2 295.6 126.7 158.3 C40R0A6 886.0 886.0 369.5 0 166.6 C40R15A6 873.8 873.8 314.1 55.4 165.2 C40R20A6 869.8 869.8 295.6 73.9 163.4 C50R0A6 915.5 915.5 296.8 0 169.4 C50R0A2 927.2 927.2 334.8 0 187.6
134

7.4 Concluding Remarks
The concrete mixtures were designed using the W/B ratios varying from 0.30 to 0.50, RHA
content ranging from 0 to 30% of binder by weight, and an optimum S/A ratio of 0.50. The
primary mixture proportions were computed based on the absolute volumes of the constituent
materials. The dosages of HRWR were fixed based on the saturation dosages obtained from
the flow cone test of binder pastes. The dosages of AEA were estimated using the air content
results of the mortar components of corresponding parent concretes. The VEA dosages were
fixed based on the manufacture’s guideline.
135
Chapter 8
Properties of Freshly Mixed Self-consolidating High Performance
Concretes
8.1 General
This chapter describes the preparation and testing of various freshly mixed self-consolidating
high performance concretes (SCHPCs). The test results for various fresh properties of
different SCHPCs, and for the air void-stability in several freshly mixed SCHPCs are also
presented and discussed. A simplified single-operator inverted slump cone apparatus
including the performance criteria for filling ability and passing ability has been introduced.
The effects of water-binder (W/B) ratio, rice husk ash (RHA), high-range water reducer
(HRWR), and air content are highlighted. The effects of re-mixing and filling ability on the
air-void stability are also discussed. In addition, a number of correlations for the flow times
of paste and concrete, flow spread of mortar and slump flow of concrete, various filling
ability and passing ability properties, and estimated and actual dosages of AEA are shown.
This chapter also provides an empirical model for the filling ability with regard to slump
flow, and discusses its validity and application. Finally, this chapter gives the optimum RHA
content of SCHPC.
8.2 Research Significance
The filling ability and passing ability are two essential properties of SCHPC. They must be
carefully maintained in concretes to achieve self-consolidation capacity (self-compactability).
The air-void stability in SCHPC is also essential to provide sufficient freeze-thaw resistance.
The performance of various SCHPCs incorporating RHA was investigated with respect to
different fresh properties, particularly filling ability and passing ability. In addition to several
known techniques, a simplified single-operator inverted slump cone apparatus was proposed
to assess the filling ability and passing ability. The correlations for different filling ability
and passing ability properties are highlighted. Also, the air-void stability in fresh SCHPC is
136
discussed. The test results give the effect of RHA on various fresh properties and air-void
stability, and suggest an optimum RHA content for SCHPC. Based on the slump flow results,
a filling ability model was developed to facilitate the mixture design of SCHPC. The research
findings will be of special interest to the construction industry regarding the use of SCHPC in
different structural and non-structural applications.
8.3 Preparation of Fresh Concretes
The fresh SCHPC mixtures were prepared using a revolving pan type mixer conforming to
ASTM C 192/C 192M (2004). The nominal capacity of the pan was 50 liters. The pan mixer
used is shown in Figure 8.1.
8.3.1 Batching procedure
The batch volume of the concrete mixtures was calculated before batching. The batch
quantity of the fresh concrete taken was at least 15% more than the required to compensate
the loss during mixing and testing. The amounts of the primary constituent materials for each
concrete batch were determined based on the adjusted mixture proportions shown in Table
7.5 (Chapter 7). The aggregates, cement and RHA were taken on weight basis. But the
quantities of the mixing water and all chemical admixtures such as HRWR, air-entraining
admixture (AEA) and viscosity-enhancing admixture (VEA) required for a concrete batch
were measured on volume basis. The volume dosages of the chemical admixtures were
determined based on the mass dosages shown in Table 7.4 (Chapter 7).
8.3.2 Mixing method
The coarse and fine aggregates were charged first into the mixer and mixed with one-quarter
of the mixing water for 60 seconds. Then the dosage of AEA dispensed in the second-quarter
of the mixing water was added and the mixing was continued for 60 seconds. This step was
followed in absence of AEA in non-air-entrained SCHPC mixture. The mixer was stopped
thereafter and the cementing material (cement alone or with RHA) was charged into the
mixer. Immediately, the mixer was restarted and the mixing was continued for 120 seconds
with the addition of third-quarter of the mixing water. After that, the mixer was stopped, and
the concrete materials in the pan were covered with a piece of wet burlap and allowed to rest
137
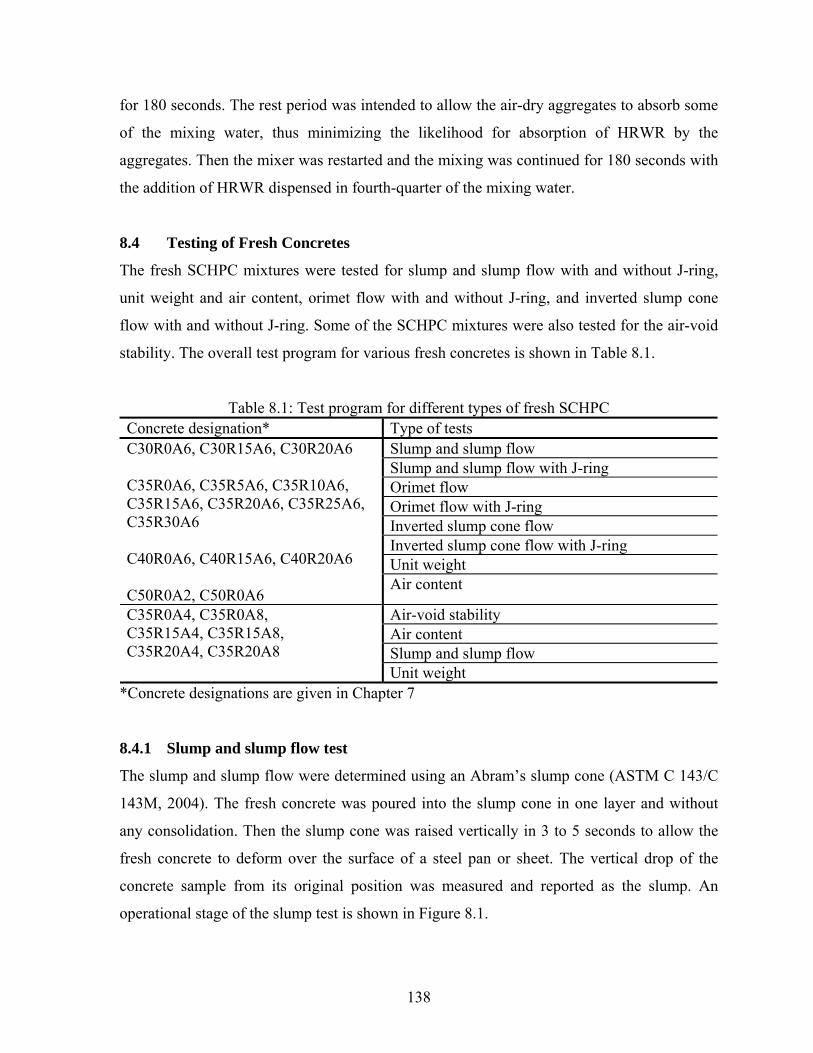
for 180 seconds. The rest period was intended to allow the air-dry aggregates to absorb some
of the mixing water, thus minimizing the likelihood for absorption of HRWR by the
aggregates. Then the mixer was restarted and the mixing was continued for 180 seconds with
the addition of HRWR dispensed in fourth-quarter of the mixing water.
8.4 Testing of Fresh Concretes
The fresh SCHPC mixtures were tested for slump and slump flow with and without J-ring,
unit weight and air content, orimet flow with and without J-ring, and inverted slump cone
flow with and without J-ring. Some of the SCHPC mixtures were also tested for the air-void
stability. The overall test program for various fresh concretes is shown in Table 8.1.
Table 8.1: Test program for different types of fresh SCHPC Concrete designation* Type of tests
Slump and slump flow Slump and slump flow with J-ring Orimet flow Orimet flow with J-ring Inverted slump cone flow Inverted slump cone flow with J-ring Unit weight
C30R0A6, C30R15A6, C30R20A6 C35R0A6, C35R5A6, C35R10A6, C35R15A6, C35R20A6, C35R25A6, C35R30A6 C40R0A6, C40R15A6, C40R20A6 C50R0A2, C50R0A6
Air content
Air-void stability Air content Slump and slump flow
C35R0A4, C35R0A8, C35R15A4, C35R15A8, C35R20A4, C35R20A8
Unit weight *Concrete designations are given in Chapter 7
8.4.1 Slump and slump flow test
The slump and slump flow were determined using an Abram’s slump cone (ASTM C 143/C
143M, 2004). The fresh concrete was poured into the slump cone in one layer and without
any consolidation. Then the slump cone was raised vertically in 3 to 5 seconds to allow the
fresh concrete to deform over the surface of a steel pan or sheet. The vertical drop of the
concrete sample from its original position was measured and reported as the slump. An
operational stage of the slump test is shown in Figure 8.1.
138
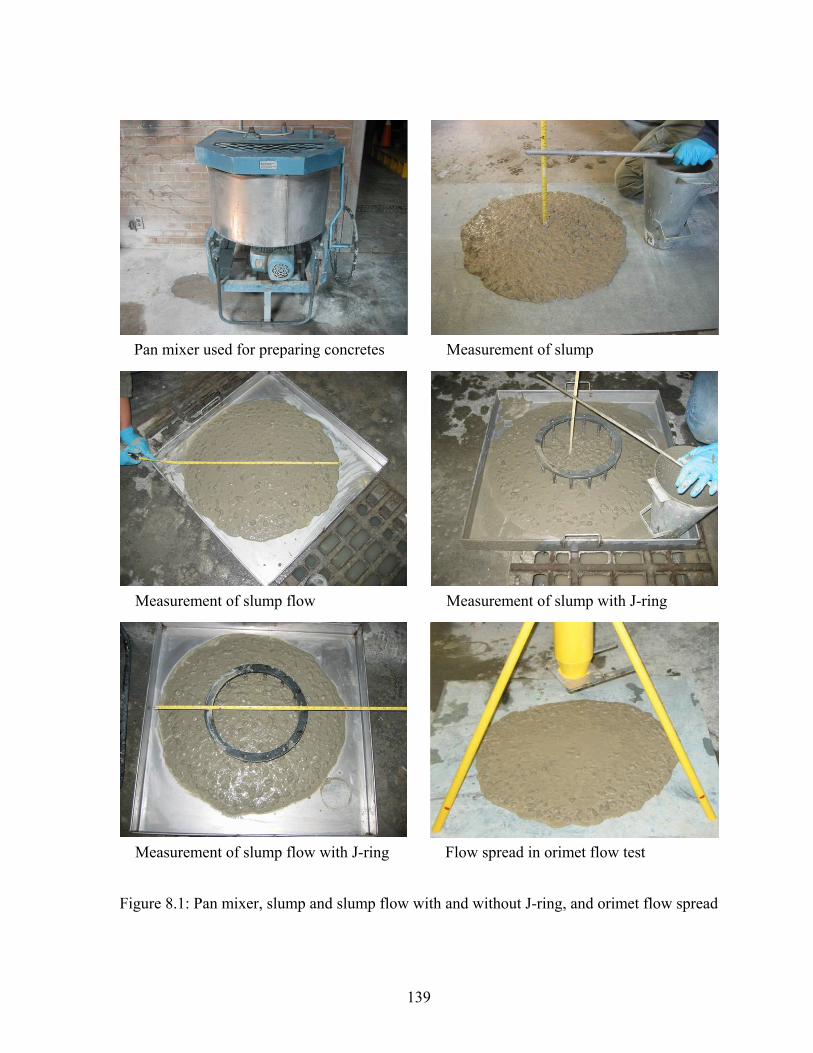
Pan mixer used for preparing concretes Measurement of slump
Measurement of slump flow Measurement of slump with J-ring
Measurement of slump flow with J-ring Flow spread in orimet flow test
Figure 8.1: Pan mixer, slump and slump flow with and without J-ring, and orimet flow spread
139

The slump flow was measured from the same test conducted for determining the
slump. The diameter of the concrete spread was measured at four positions that divided the
flow patty into eight equal segments. The average diameter was used to express the slump
flow of the concrete. An operational stage of the slump flow test is also shown in Figure 8.1.
8.4.2 Slump cone – J-ring flow test
The slump cone – J-ring flow test was conducted to determine the slump and slump flow
with J-ring. The J-ring was built using 10-mm deformed reinforcing bars. The spacing of the
bars was 57 mm (3 times the maximum size of concrete stone), which is greater than the
minimum recommended bar spacing. The minimum recommended bar spacing for J-ring is
2.5 times higher than the maximum size of coarse aggregate (Brameshuber and Uebachs
2001). The details of the J-ring are shown in Figure 8.2. The slump cone was placed at the
centre of the J-ring and filled with concrete in one layer without any consolidation. Then the
slump cone was raised vertically and the concrete was allowed to deform. The vertical drop
of the concrete sample was measured in presence of J-ring and reported as the slump with J-
ring. An operational stage of the slump measurement in the presence of J-ring is shown in
Figure 8.1. In addition, the diameter of the concrete spread through the J-ring was measured
in a similar way as mentioned in case of slump flow. The average diameter was recorded as
the slump flow with J-ring. An operational stage for the slump flow measurement in the
presence of J-ring is shown in Figure 8.1.
8.4.3 Orimet flow test
The orimet flow was determined using an orimet, as shown in Figure 8.3. This apparatus is
used in Europe to examine the filling ability of SCHPC (EFNARC 2002). It has a 120 mm
diameter × 600 mm long vertical pipe section, which is welded with a 60 mm high conical
orifice at the bottom end. The outlet diameter of the orifice can be varied. The orimet used in
this study had an orifice with the outlet diameter of 80 mm. The level of the orifice outlet
was fixed at a height of 430 mm from the floor. During testing, the fresh concrete was placed
into the pipe section of the orimet without any consolidation, while keeping the trap door
closed. Then the door was opened and the concrete was allowed to flow through the orifice.
Simultaneously, a stopwatch was used to record the flow time. In addition, the diameter of
140
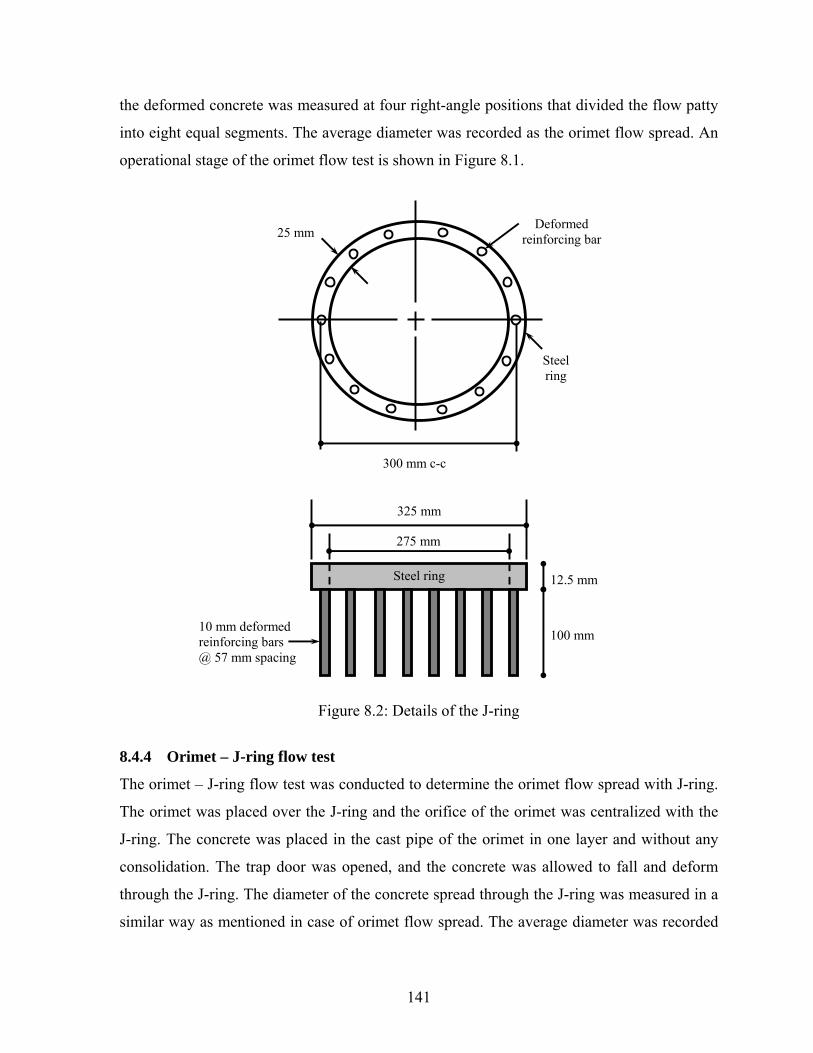
the deformed concrete was measured at four right-angle positions that divided the flow patty
into eight equal segments. The average diameter was recorded as the orimet flow spread. An
operational stage of the orimet flow test is shown in Figure 8.1.
Figure 8.2: Details of the J-ring
8.4.4 Orimet – J-ring flow test
The orimet – J-ring flow test was conducted to determine the orimet flow spread with J-ring.
The orimet was placed over the J-ring and the orifice of the orimet was centralized with the
J-ring. The concrete was placed in the cast pipe of the orimet in one layer and without any
consolidation. The trap door was opened, and the concrete was allowed to fall and deform
through the J-ring. The diameter of the concrete spread through the J-ring was measured in a
similar way as mentioned in case of orimet flow spread. The average diameter was recorded
Deformed reinforcing bar
300 mm c-c
25 mm
Steel ring
325 mm
100 mm
12.5 mm
10 mm deformed reinforcing bars @ 57 mm spacing
275 mm
Steel ring
141
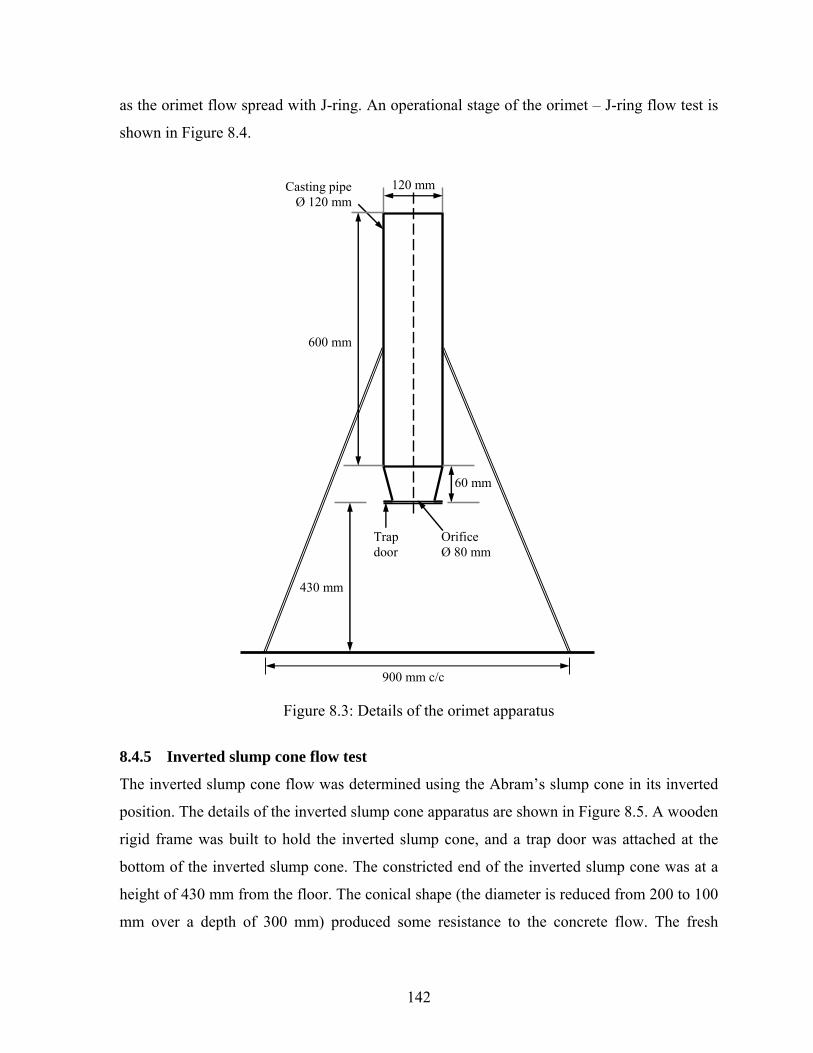
as the orimet flow spread with J-ring. An operational stage of the orimet – J-ring flow test is
shown in Figure 8.4.
120 mmCasting pipeØ 120 mm
60 mm
600 mm
430 mm
Orifice Ø 80 mm
Trap door
900 mm c/c
Figure 8.3: Details of the orimet apparatus
8.4.5 Inverted slump cone flow test
The inverted slump cone flow was determined using the Abram’s slump cone in its inverted
position. The details of the inverted slump cone apparatus are shown in Figure 8.5. A wooden
rigid frame was built to hold the inverted slump cone, and a trap door was attached at the
bottom of the inverted slump cone. The constricted end of the inverted slump cone was at a
height of 430 mm from the floor. The conical shape (the diameter is reduced from 200 to 100
mm over a depth of 300 mm) produced some resistance to the concrete flow. The fresh
142
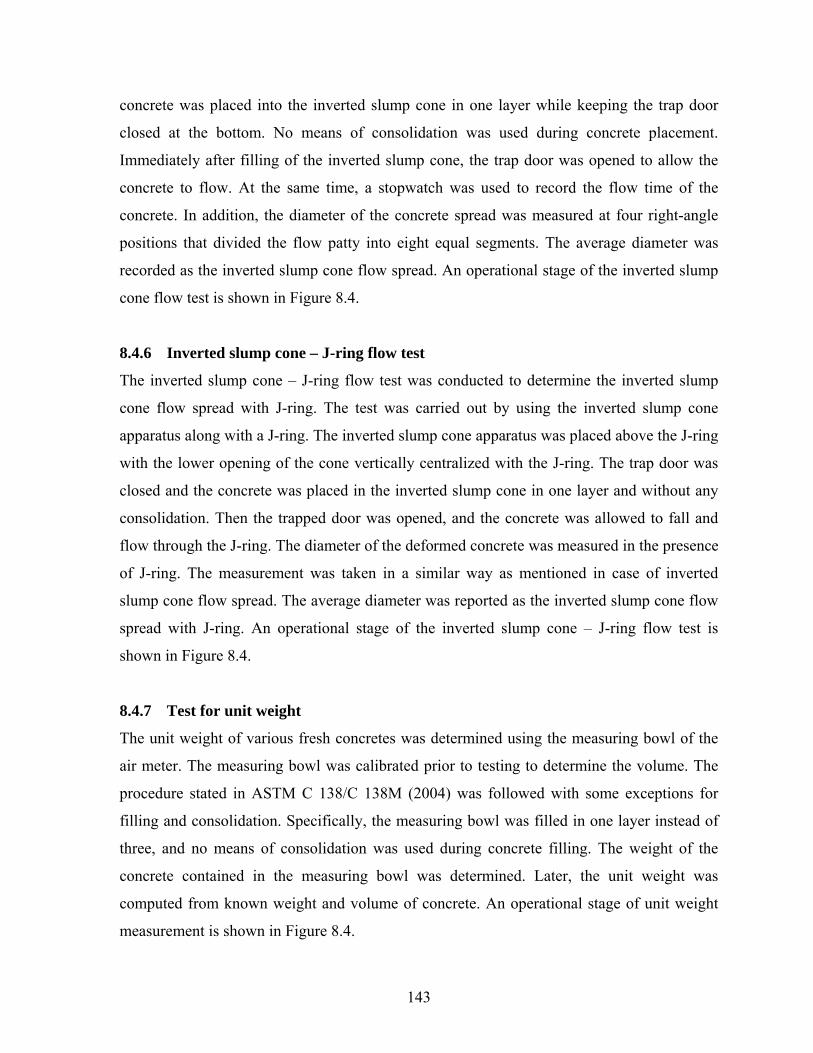
concrete was placed into the inverted slump cone in one layer while keeping the trap door
closed at the bottom. No means of consolidation was used during concrete placement.
Immediately after filling of the inverted slump cone, the trap door was opened to allow the
concrete to flow. At the same time, a stopwatch was used to record the flow time of the
concrete. In addition, the diameter of the concrete spread was measured at four right-angle
positions that divided the flow patty into eight equal segments. The average diameter was
recorded as the inverted slump cone flow spread. An operational stage of the inverted slump
cone flow test is shown in Figure 8.4.
8.4.6 Inverted slump cone – J-ring flow test
The inverted slump cone – J-ring flow test was conducted to determine the inverted slump
cone flow spread with J-ring. The test was carried out by using the inverted slump cone
apparatus along with a J-ring. The inverted slump cone apparatus was placed above the J-ring
with the lower opening of the cone vertically centralized with the J-ring. The trap door was
closed and the concrete was placed in the inverted slump cone in one layer and without any
consolidation. Then the trapped door was opened, and the concrete was allowed to fall and
flow through the J-ring. The diameter of the deformed concrete was measured in the presence
of J-ring. The measurement was taken in a similar way as mentioned in case of inverted
slump cone flow spread. The average diameter was reported as the inverted slump cone flow
spread with J-ring. An operational stage of the inverted slump cone – J-ring flow test is
shown in Figure 8.4.
8.4.7 Test for unit weight
The unit weight of various fresh concretes was determined using the measuring bowl of the
air meter. The measuring bowl was calibrated prior to testing to determine the volume. The
procedure stated in ASTM C 138/C 138M (2004) was followed with some exceptions for
filling and consolidation. Specifically, the measuring bowl was filled in one layer instead of
three, and no means of consolidation was used during concrete filling. The weight of the
concrete contained in the measuring bowl was determined. Later, the unit weight was
computed from known weight and volume of concrete. An operational stage of unit weight
measurement is shown in Figure 8.4.
143

Orimet – J-ring flow Inverted slump cone flow
Inverted slump cone – J-ring flow A measurement for unit weight
Type B air meter Measurement of air content
Figure 8.4: Orimet – J-ring flow, inverted slump cone flow with and without J-ring, unit weight, and air content tests for various concretes
144
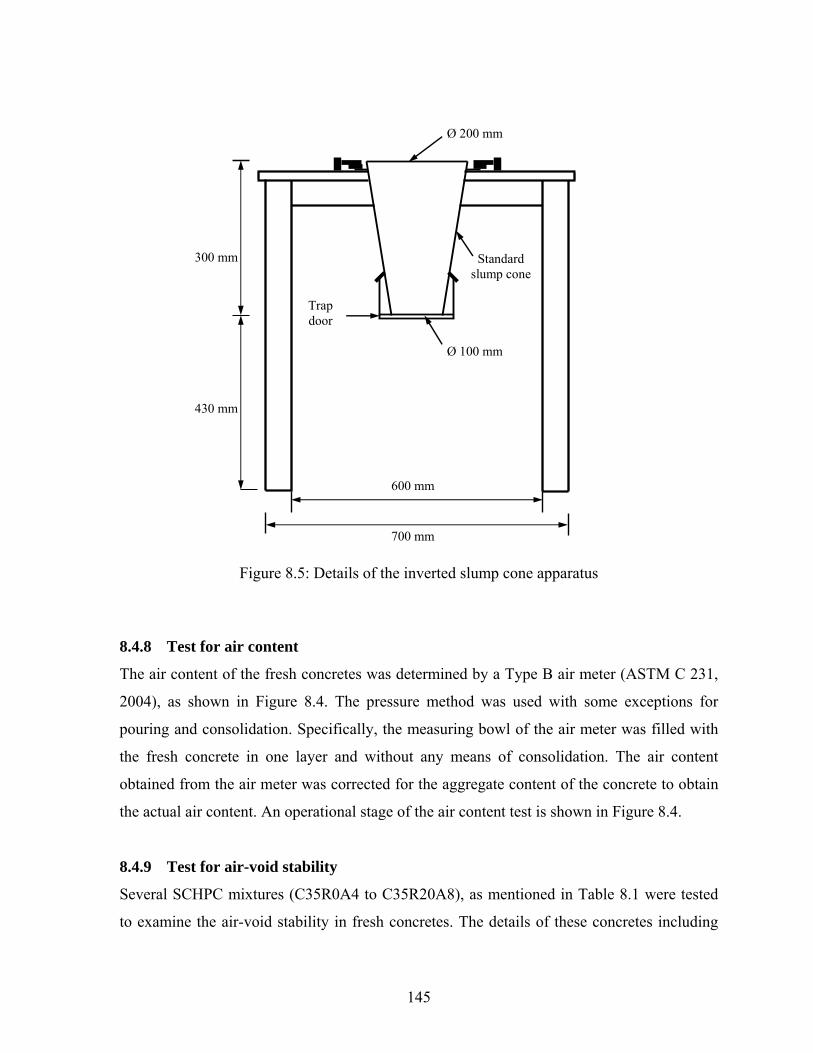
600 mm
300 mm
430 mm
Ø 100 mm
Ø 200 mm
Standard slump cone
Trap door
700 mm
Figure 8.5: Details of the inverted slump cone apparatus
8.4.8 Test for air content
The air content of the fresh concretes was determined by a Type B air meter (ASTM C 231,
2004), as shown in Figure 8.4. The pressure method was used with some exceptions for
pouring and consolidation. Specifically, the measuring bowl of the air meter was filled with
the fresh concrete in one layer and without any means of consolidation. The air content
obtained from the air meter was corrected for the aggregate content of the concrete to obtain
the actual air content. An operational stage of the air content test is shown in Figure 8.4.
8.4.9 Test for air-void stability
Several SCHPC mixtures (C35R0A4 to C35R20A8), as mentioned in Table 8.1 were tested
to examine the air-void stability in fresh concretes. The details of these concretes including
145
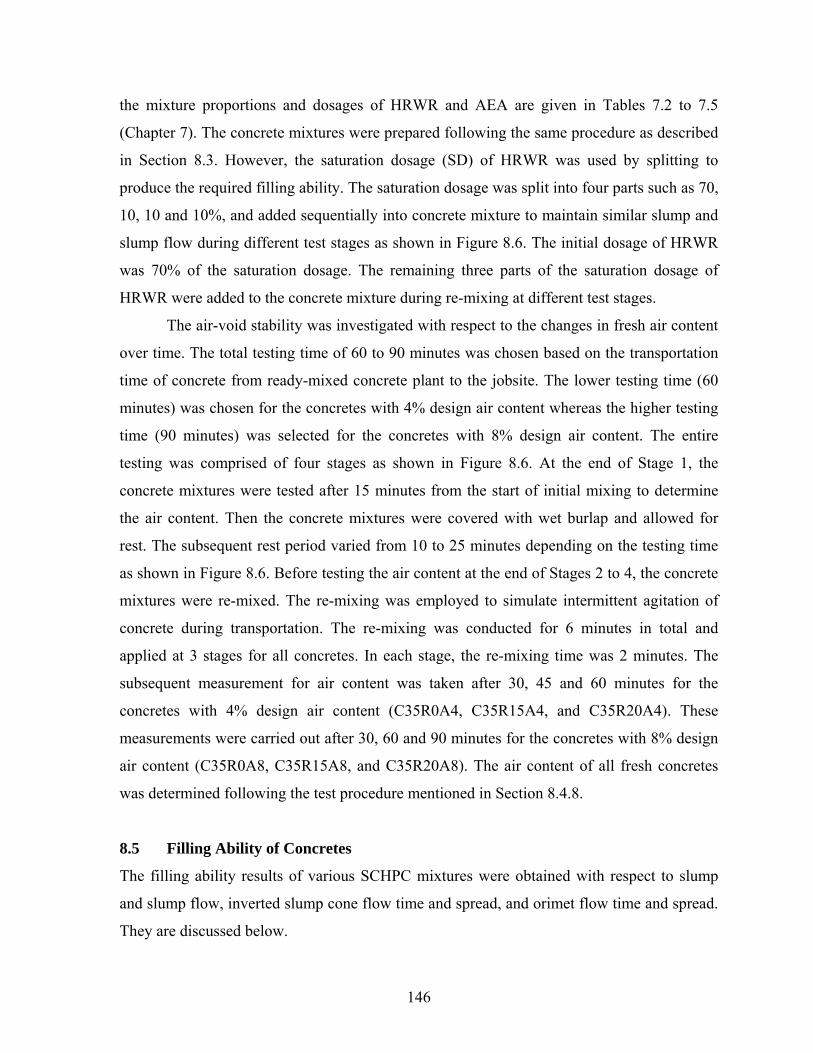
the mixture proportions and dosages of HRWR and AEA are given in Tables 7.2 to 7.5
(Chapter 7). The concrete mixtures were prepared following the same procedure as described
in Section 8.3. However, the saturation dosage (SD) of HRWR was used by splitting to
produce the required filling ability. The saturation dosage was split into four parts such as 70,
10, 10 and 10%, and added sequentially into concrete mixture to maintain similar slump and
slump flow during different test stages as shown in Figure 8.6. The initial dosage of HRWR
was 70% of the saturation dosage. The remaining three parts of the saturation dosage of
HRWR were added to the concrete mixture during re-mixing at different test stages.
The air-void stability was investigated with respect to the changes in fresh air content
over time. The total testing time of 60 to 90 minutes was chosen based on the transportation
time of concrete from ready-mixed concrete plant to the jobsite. The lower testing time (60
minutes) was chosen for the concretes with 4% design air content whereas the higher testing
time (90 minutes) was selected for the concretes with 8% design air content. The entire
testing was comprised of four stages as shown in Figure 8.6. At the end of Stage 1, the
concrete mixtures were tested after 15 minutes from the start of initial mixing to determine
the air content. Then the concrete mixtures were covered with wet burlap and allowed for
rest. The subsequent rest period varied from 10 to 25 minutes depending on the testing time
as shown in Figure 8.6. Before testing the air content at the end of Stages 2 to 4, the concrete
mixtures were re-mixed. The re-mixing was employed to simulate intermittent agitation of
concrete during transportation. The re-mixing was conducted for 6 minutes in total and
applied at 3 stages for all concretes. In each stage, the re-mixing time was 2 minutes. The
subsequent measurement for air content was taken after 30, 45 and 60 minutes for the
concretes with 4% design air content (C35R0A4, C35R15A4, and C35R20A4). These
measurements were carried out after 30, 60 and 90 minutes for the concretes with 8% design
air content (C35R0A8, C35R15A8, and C35R20A8). The air content of all fresh concretes
was determined following the test procedure mentioned in Section 8.4.8.
8.5 Filling Ability of Concretes
The filling ability results of various SCHPC mixtures were obtained with respect to slump
and slump flow, inverted slump cone flow time and spread, and orimet flow time and spread.
They are discussed below.
146
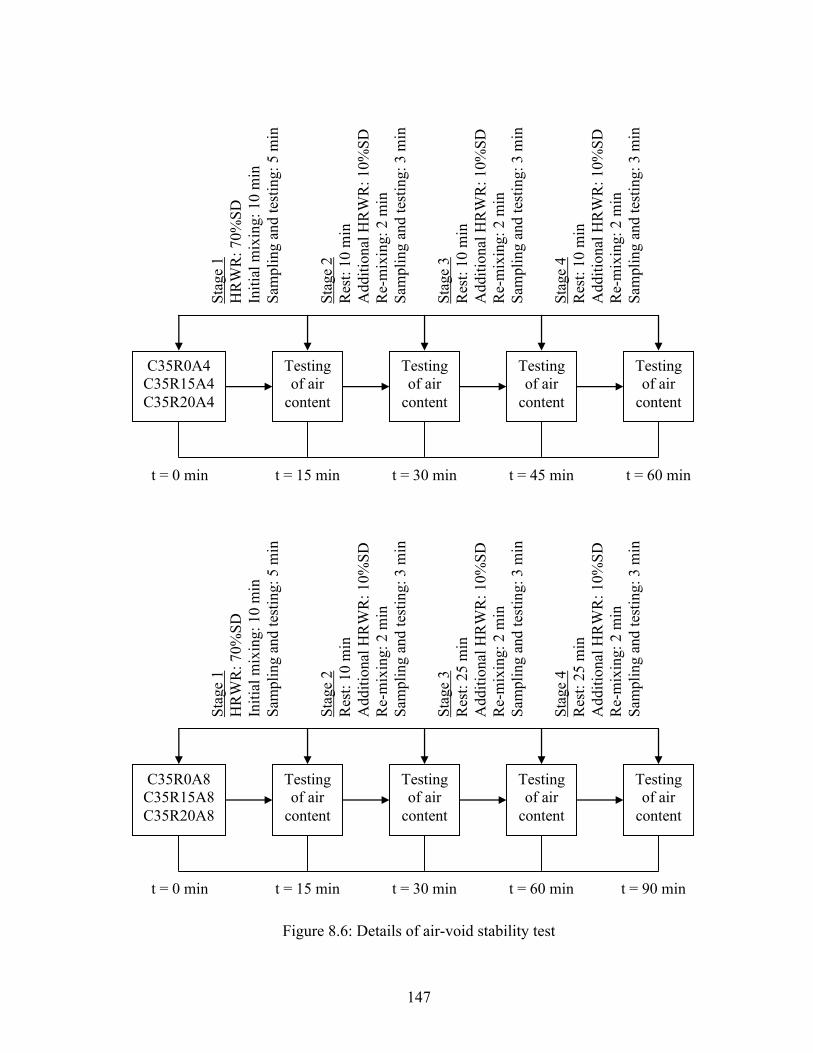
C35R0A4 C35R15A4 C35R20A4
Testing of air
content
Stag
e 1
HR
WR
: 70%
SD
Initi
al m
ixin
g: 1
0 m
in
Sam
plin
g an
d te
stin
g: 5
min
Testing of air
content
Testing of air
content
Testing of air
content
Stag
e 2
Res
t: 10
min
A
dditi
onal
HR
WR
: 10%
SD
Re-
mix
ing:
2 m
in
Sam
plin
g an
d te
stin
g: 3
min
t = 0 min t = 15 min t = 30 min t = 45 min t = 60 min
Stag
e 3
Res
t: 10
min
A
dditi
onal
HR
WR
: 10%
SD
Re-
mix
ing:
2 m
in
Sam
plin
g an
d te
stin
g: 3
min
Stag
e 4
Res
t: 10
min
A
dditi
onal
HR
WR
: 10%
SD
Re-
mix
ing:
2 m
in
Sam
plin
g an
d te
stin
g: 3
min
C35R0A8 C35R15A8 C35R20A8
Testing of air
content
Stag
e 1
HR
WR
: 70%
SD
Initi
al m
ixin
g: 1
0 m
in
Sam
plin
g an
d te
stin
g: 5
min
Testing of air
content
Testing of air
content
Testing of air
content
Stag
e 2
Res
t: 10
min
A
dditi
onal
HR
WR
: 10%
SD
Re-
mix
ing:
2 m
in
Sam
plin
g an
d te
stin
g: 3
min
t = 0 min t = 15 min t = 30 min t = 60 min t = 90 min
Stag
e 3
Res
t: 25
min
A
dditi
onal
HR
WR
: 10%
SD
Re-
mix
ing:
2 m
in
Sam
plin
g an
d te
stin
g: 3
min
Stag
e 4
Res
t: 25
min
A
dditi
onal
HR
WR
: 10%
SD
Re-
mix
ing:
2 m
in
Sam
plin
g an
d te
stin
g: 3
min
Figure 8.6: Details of air-void stability test
147
8.5.1 Slump and slump flow
The slump varied in the range of 260 to 280 mm, which is consistent with the slump values
reported in the literature (Ferraris et al. 2000). However, the measured slump values did not
exhibit any significant relative differences among the filling ability of the concretes, since the
variation of the slump was marginal. The slump mainly depends on the yield stress of the
concrete. When the yield stress is low, the slump becomes very high (Tanigawa and Mori
1989). The yield stress is greatly reduced in SCHPC due to the higher dosages of HRWR.
The yield stress of SCHPC is less than 60 Pa (Bonen and Shah 2005), and typically ranges
between 20 and 50 Pa (Cyr and Mouret 2003). For this low range of yield stress, the variation
in the slump of SCHPC mixtures becomes insignificant, suggesting that slump is not a
suitable criterion to assess the filling ability of SCHPC.
The slump flow of the concretes varied in the range of 600 to 770 mm, which
indicates an excellent filling ability of SCHPC. Usually, the slump flow of SCHPC varies
from 550 to 850 mm (EFNARC 2002, Khayat 2000, SCCEPG 2005). Unlike slump, the
slump flow results exhibited the relative differences in the filling ability of the concretes with
some variation in the flow spread. Hence, the slump flow is recommended instead of slump
to assess the filling ability of SCHPC.
8.5.2 Orimet flow time and spread
The orimet flow time of different SCHPC mixtures varied in the range of 1.8 to 11.5 sec. The
maximum acceptable limit for orimet flow time is 9 sec (Grünewald et al. 2004). The orimet
flow time of several concretes with higher RHA content (greater than 15 to 20%) at lower
W/B ratios was slightly above this maximum limit. Furthermore, the orimet flow spread
varied from 615 to 800 mm for different concretes. The variation in the orimet flow spread
followed a similar trend as observed for the slump flow of different concretes. It was also
observed that the orimet flow spreads were greater than the slump flow values by 15 to 40
mm. Thus, it was understood that more kinetic energy was involved in the orimet flow spread
of concrete. This is mainly due to a greater amount of concrete used in orimet test. In
addition, the concrete dropped from a height of 430 mm, which is higher than the sample
height (300 mm) used in slump flow test.
148

8.5.3 Inverted slump cone flow time and spread
The inverted slump cone flow time of different SCHPC mixtures varied in the range of 1.1 to
6.2 sec and the inverted slump cone flow spread ranged from 550 to 725 mm for different
concretes. The variation in the inverted slump cone flow time followed a similar trend as
observed for the orimet flow time of the concretes. In addition, the variation in the inverted
slump cone flow spread followed a similar trend as observed for the slump flow and orimet
flow spread of the concretes. It was also observed that the inverted slump cone flow spreads
were lower than the slump flow values by 15 to 50 mm. It indicates that less kinetic energy
was available in the inverted slump cone flow spread although the concrete quantity was the
same and the falling height was greater than the sample height as used in the slump flow test.
This suggests that some loss of energy occurred due to the resistance caused by the
constricted end of the inverted slump cone and owing to the impact of concrete on the pan.
8.5.4 Effect of water-binder ratio and rice husk ash on flow time
The orimet and inverted slump cone flow times were influenced by the W/B ratio and RHA
content of the concretes, as can be seen from Figure 8.7. The flow times increased with lower
W/B ratio and greater RHA content, thus indicating an increase in the plastic viscosity of the
concretes. The reasons are the same as discussed for the filling ability of the binder pastes
(Chapter 5). The volume fraction and surface area of binder were increased with lower W/B
ratio and higher RHA content, as can be seen from Table 8.2. The increased volume fraction
and surface area of the binder increase the viscosity of concretes, and hence increase the flow
time of concretes (Kim et al. 1997). However, the aggregate content of concretes was
reduced and the paste volume was increased simultaneously with the lower W/B ratio and
greater RHA content. The reduced aggregate content and the increased paste volume
decrease the plastic viscosity of the concretes (Struble et al. 1998, EFNARC 2002). Based on
the data given in Table 8.2, it was understood that the proportional reduction in aggregate
content and increase in paste volume were not as significant as the proportional increases in
volume fraction and surface area of binder. Therefore, the net effect was to increase the
plastic viscosity of concrete as indicated from the flow time results of the orimet and inverted
slump cone flow tests. Nevertheless, the viscosity remained low enough to sustain
uninterrupted concrete flow during the orimet and inverted slump cone flow tests.
149
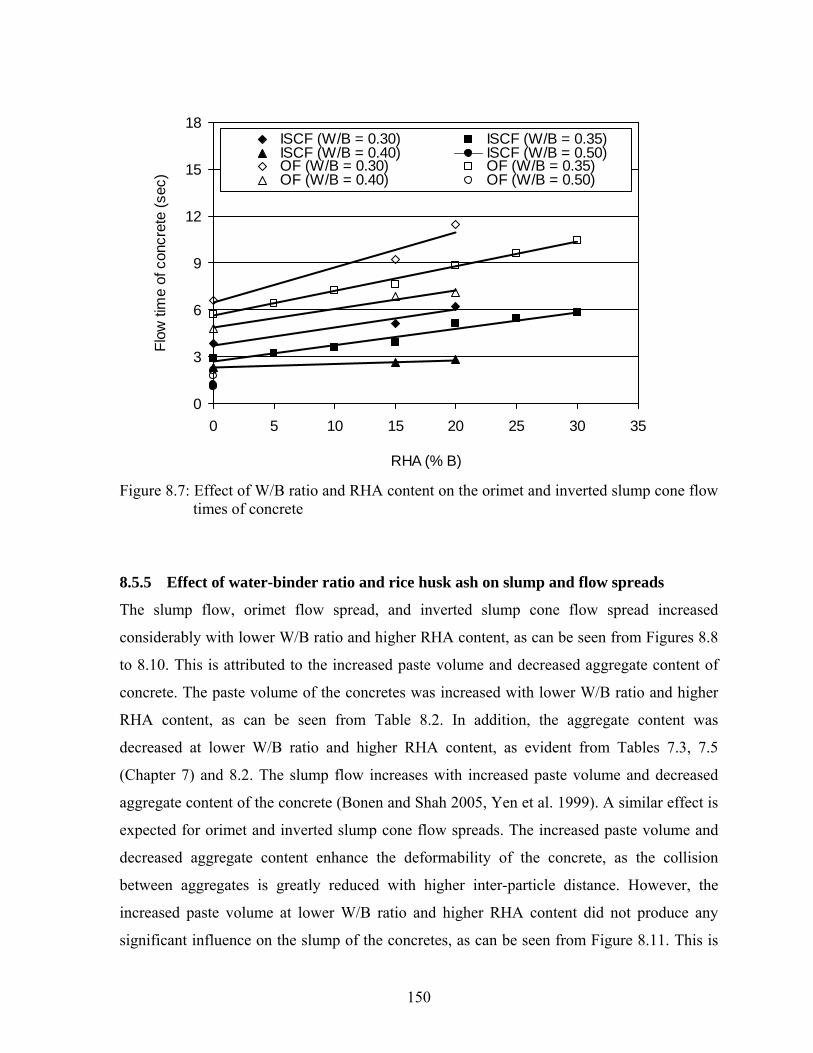
0
3
6
9
12
15
18
0 5 10 15 20 25 30 35
RHA (% B)
Flow
tim
e of
con
cret
e (s
ec)
ISCF (W/B = 0.30) ISCF (W/B = 0.35)ISCF (W/B = 0.40) ISCF (W/B = 0.50)OF (W/B = 0.30) OF (W/B = 0.35)OF (W/B = 0.40) OF (W/B = 0.50)
Figure 8.7: Effect of W/B ratio and RHA content on the orimet and inverted slump cone flow times of concrete
8.5.5 Effect of water-binder ratio and rice husk ash on slump and flow spreads
The slump flow, orimet flow spread, and inverted slump cone flow spread increased
considerably with lower W/B ratio and higher RHA content, as can be seen from Figures 8.8
to 8.10. This is attributed to the increased paste volume and decreased aggregate content of
concrete. The paste volume of the concretes was increased with lower W/B ratio and higher
RHA content, as can be seen from Table 8.2. In addition, the aggregate content was
decreased at lower W/B ratio and higher RHA content, as evident from Tables 7.3, 7.5
(Chapter 7) and 8.2. The slump flow increases with increased paste volume and decreased
aggregate content of the concrete (Bonen and Shah 2005, Yen et al. 1999). A similar effect is
expected for orimet and inverted slump cone flow spreads. The increased paste volume and
decreased aggregate content enhance the deformability of the concrete, as the collision
between aggregates is greatly reduced with higher inter-particle distance. However, the
increased paste volume at lower W/B ratio and higher RHA content did not produce any
significant influence on the slump of the concretes, as can be seen from Figure 8.11. This is
150
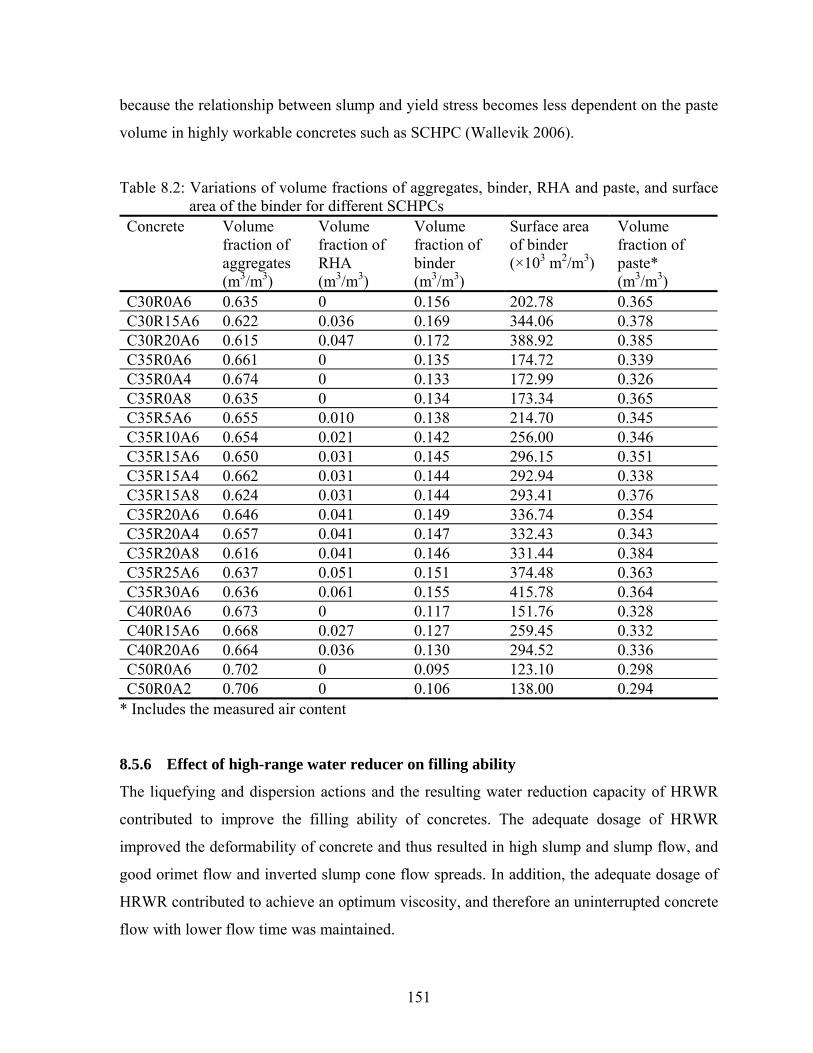
because the relationship between slump and yield stress becomes less dependent on the paste
volume in highly workable concretes such as SCHPC (Wallevik 2006).
Table 8.2: Variations of volume fractions of aggregates, binder, RHA and paste, and surface area of the binder for different SCHPCs
Concrete
Volume fraction of aggregates (m3/m3)
Volume fraction of RHA (m3/m3)
Volume fraction of binder (m3/m3)
Surface area of binder (×103 m2/m3)
Volume fraction of paste* (m3/m3)
C30R0A6 0.635 0 0.156 202.78 0.365 C30R15A6 0.622 0.036 0.169 344.06 0.378 C30R20A6 0.615 0.047 0.172 388.92 0.385 C35R0A6 0.661 0 0.135 174.72 0.339 C35R0A4 0.674 0 0.133 172.99 0.326 C35R0A8 0.635 0 0.134 173.34 0.365 C35R5A6 0.655 0.010 0.138 214.70 0.345 C35R10A6 0.654 0.021 0.142 256.00 0.346 C35R15A6 0.650 0.031 0.145 296.15 0.351 C35R15A4 0.662 0.031 0.144 292.94 0.338 C35R15A8 0.624 0.031 0.144 293.41 0.376 C35R20A6 0.646 0.041 0.149 336.74 0.354 C35R20A4 0.657 0.041 0.147 332.43 0.343 C35R20A8 0.616 0.041 0.146 331.44 0.384 C35R25A6 0.637 0.051 0.151 374.48 0.363 C35R30A6 0.636 0.061 0.155 415.78 0.364 C40R0A6 0.673 0 0.117 151.76 0.328 C40R15A6 0.668 0.027 0.127 259.45 0.332 C40R20A6 0.664 0.036 0.130 294.52 0.336 C50R0A6 0.702 0 0.095 123.10 0.298 C50R0A2 0.706 0 0.106 138.00 0.294
* Includes the measured air content
8.5.6 Effect of high-range water reducer on filling ability
The liquefying and dispersion actions and the resulting water reduction capacity of HRWR
contributed to improve the filling ability of concretes. The adequate dosage of HRWR
improved the deformability of concrete and thus resulted in high slump and slump flow, and
good orimet flow and inverted slump cone flow spreads. In addition, the adequate dosage of
HRWR contributed to achieve an optimum viscosity, and therefore an uninterrupted concrete
flow with lower flow time was maintained.
151
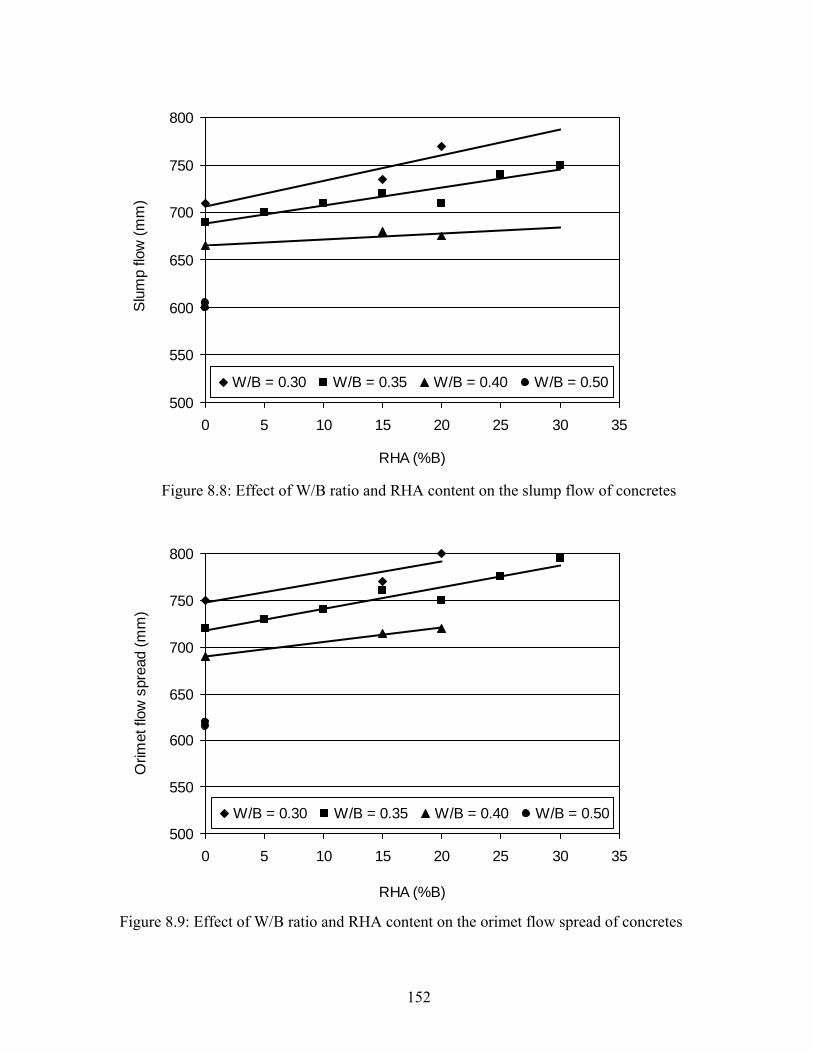
500
550
600
650
700
750
800
0 5 10 15 20 25 30 35
RHA (%B)
Slu
mp
flow
(mm
)
W/B = 0.30 W/B = 0.35 W/B = 0.40 W/B = 0.50
Figure 8.8: Effect of W/B ratio and RHA content on the slump flow of concretes
500
550
600
650
700
750
800
0 5 10 15 20 25 30 35
RHA (%B)
Orim
et fl
ow s
prea
d (m
m)
W/B = 0.30 W/B = 0.35 W/B = 0.40 W/B = 0.50
Figure 8.9: Effect of W/B ratio and RHA content on the orimet flow spread of concretes
152
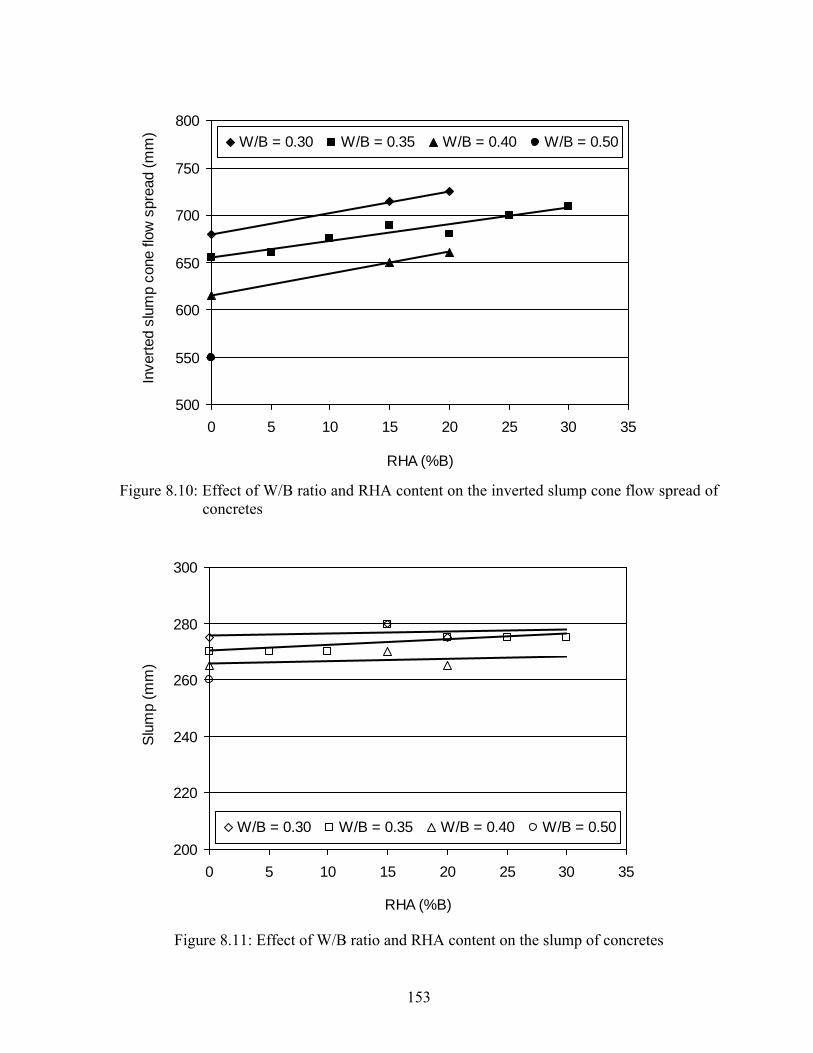
500
550
600
650
700
750
800
0 5 10 15 20 25 30 35
RHA (%B)
Inve
rted
slum
p co
ne fl
ow s
prea
d (m
m) W/B = 0.30 W/B = 0.35 W/B = 0.40 W/B = 0.50
Figure 8.10: Effect of W/B ratio and RHA content on the inverted slump cone flow spread of concretes
200
220
240
260
280
300
0 5 10 15 20 25 30 35
RHA (%B)
Slu
mp
(mm
)
W/B = 0.30 W/B = 0.35 W/B = 0.40 W/B = 0.50
Figure 8.11: Effect of W/B ratio and RHA content on the slump of concretes
153
8.5.7 Effect of air-entraining admixture on filling ability
The AEA induced microscopic air-bubbles which acted like ball-bearing to increase the
filling ability of concretes. Therefore, the use of AEA decreased the water demand of
concrete for a given filling ability. This is obvious from the mixture proportions of C50R0A2
and C50R0A2 given in Tables 7.3 and 7.5 (Chapter 7). Despite the lower water and binder
contents, the filling ability properties of C50R0A6 were similar to those of C50R0A2 due to
the presence of AEA.
8.6 Correlations for Different Filling Ability Properties
The correlations for the flow times of pastes and concretes, and the flow spread of mortars
and slump flow of concretes were determined. The correlations for the orimet and inverted
slump cone flow times, slump flow and orimet flow spread, slump flow and inverted slump
cone flow spread, and orimet and inverted slump cone flow spread of the concretes were also
determined.
8.6.1 Flow times of pastes and concretes
The inverted slump cone and orimet flow times of the concretes were plotted versus the paste
flow time. The flow time of the concretes was strongly correlated with the flow time of the
pastes, as can be seen from Figure 8.12. In both cases, the relationship was linear. The
coefficient of determination (R2) reveals that at least 88 to 96% of the flow time data were
accounted for in the linear relationship. The correlation coefficient (R) for concrete orimet
flow time and paste flow time was 0.939, while the correlation coefficient for concrete
inverted slump cone flow time and paste flow time was 0.979. The excellent correlations
were obtained since the changes in viscosity due to various W/B ratios and RHA contents
followed similar trends in pastes and concretes. Also, the flow times of concrete and paste
are highly dependent of the paste viscosity (Kim et al. 1997, Schwartzentruber et al. 2006).
8.6.2 Flow spread of mortars and slump flow of concretes
The slump flow of concretes was plotted versus the flow spread of mortars to determine the
correlation. A good correlation with a linear relationship between the slump flow of concrete
and the flow spread of mortar was obtained in the absence of RHA, as can be seen from
154
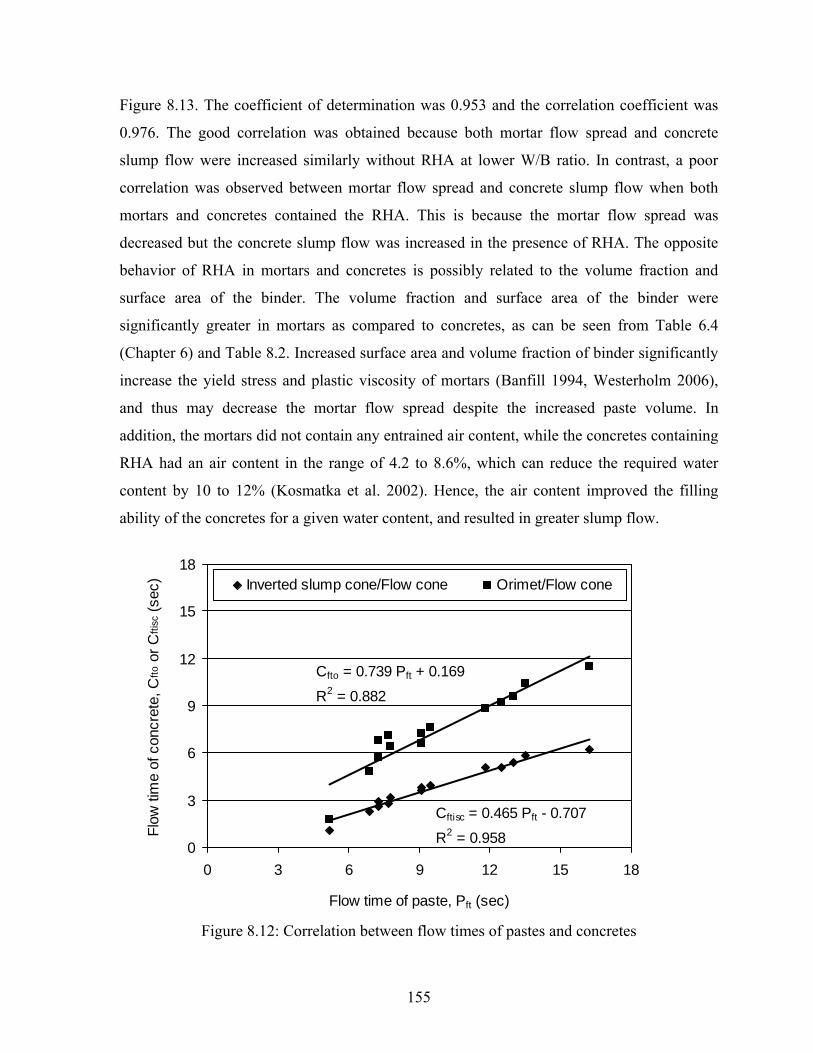
Figure 8.13. The coefficient of determination was 0.953 and the correlation coefficient was
0.976. The good correlation was obtained because both mortar flow spread and concrete
slump flow were increased similarly without RHA at lower W/B ratio. In contrast, a poor
correlation was observed between mortar flow spread and concrete slump flow when both
mortars and concretes contained the RHA. This is because the mortar flow spread was
decreased but the concrete slump flow was increased in the presence of RHA. The opposite
behavior of RHA in mortars and concretes is possibly related to the volume fraction and
surface area of the binder. The volume fraction and surface area of the binder were
significantly greater in mortars as compared to concretes, as can be seen from Table 6.4
(Chapter 6) and Table 8.2. Increased surface area and volume fraction of binder significantly
increase the yield stress and plastic viscosity of mortars (Banfill 1994, Westerholm 2006),
and thus may decrease the mortar flow spread despite the increased paste volume. In
addition, the mortars did not contain any entrained air content, while the concretes containing
RHA had an air content in the range of 4.2 to 8.6%, which can reduce the required water
content by 10 to 12% (Kosmatka et al. 2002). Hence, the air content improved the filling
ability of the concretes for a given water content, and resulted in greater slump flow.
Cftisc = 0.465 Pft - 0.707
R2 = 0.958
Cfto = 0.739 Pft + 0.169
R2 = 0.882
0
3
6
9
12
15
18
0 3 6 9 12 15 18
Flow time of paste, Pft (sec)
Flow
tim
e of
con
cret
e, C
fto o
r Cfti
sc (s
ec) Inverted slump cone/Flow cone Orimet/Flow cone
Figure 8.12: Correlation between flow times of pastes and concretes
155
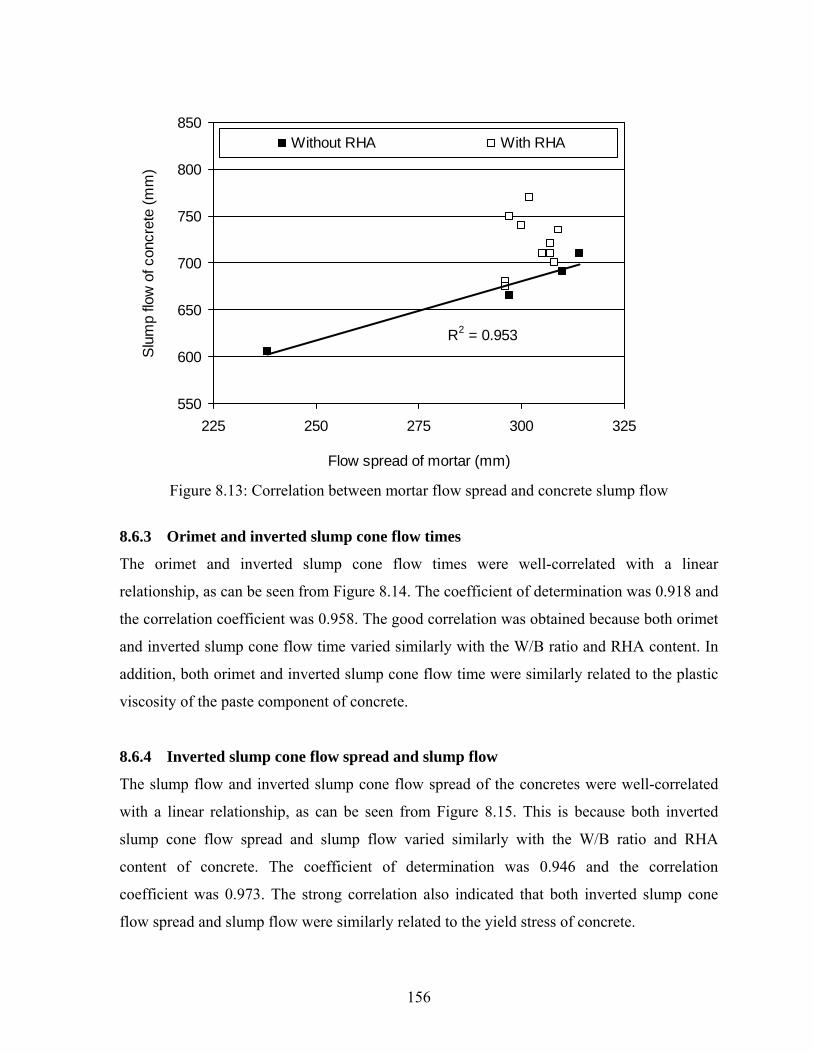
R2 = 0.953
550
600
650
700
750
800
850
225 250 275 300 325
Flow spread of mortar (mm)
Slu
mp
flow
of c
oncr
ete
(mm
)Without RHA With RHA
Figure 8.13: Correlation between mortar flow spread and concrete slump flow
8.6.3 Orimet and inverted slump cone flow times
The orimet and inverted slump cone flow times were well-correlated with a linear
relationship, as can be seen from Figure 8.14. The coefficient of determination was 0.918 and
the correlation coefficient was 0.958. The good correlation was obtained because both orimet
and inverted slump cone flow time varied similarly with the W/B ratio and RHA content. In
addition, both orimet and inverted slump cone flow time were similarly related to the plastic
viscosity of the paste component of concrete.
8.6.4 Inverted slump cone flow spread and slump flow
The slump flow and inverted slump cone flow spread of the concretes were well-correlated
with a linear relationship, as can be seen from Figure 8.15. This is because both inverted
slump cone flow spread and slump flow varied similarly with the W/B ratio and RHA
content of concrete. The coefficient of determination was 0.946 and the correlation
coefficient was 0.973. The strong correlation also indicated that both inverted slump cone
flow spread and slump flow were similarly related to the yield stress of concrete.
156
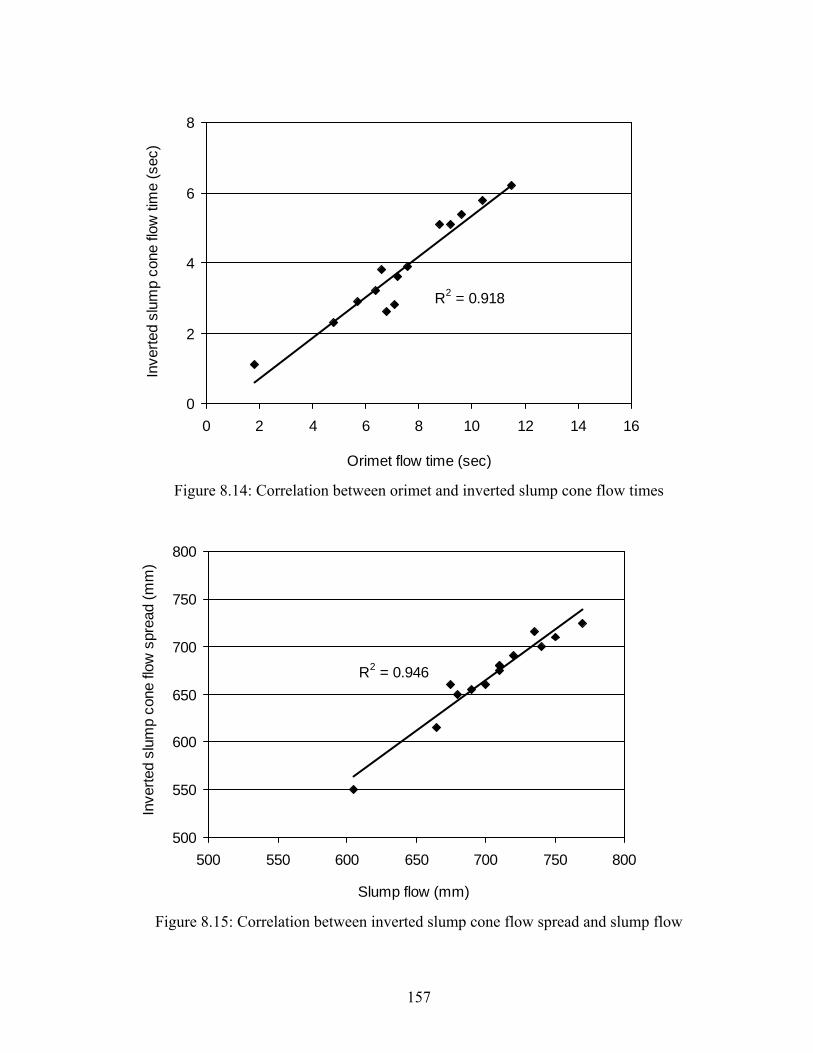
R2 = 0.918
0
2
4
6
8
0 2 4 6 8 10 12 14 16
Orimet flow time (sec)
Inve
rted
slum
p co
ne fl
ow ti
me
(sec
)
Figure 8.14: Correlation between orimet and inverted slump cone flow times
R2 = 0.946
500
550
600
650
700
750
800
500 550 600 650 700 750 800
Slump flow (mm)
Inve
rted
slum
p co
ne fl
ow s
prea
d (m
m)
Figure 8.15: Correlation between inverted slump cone flow spread and slump flow
157
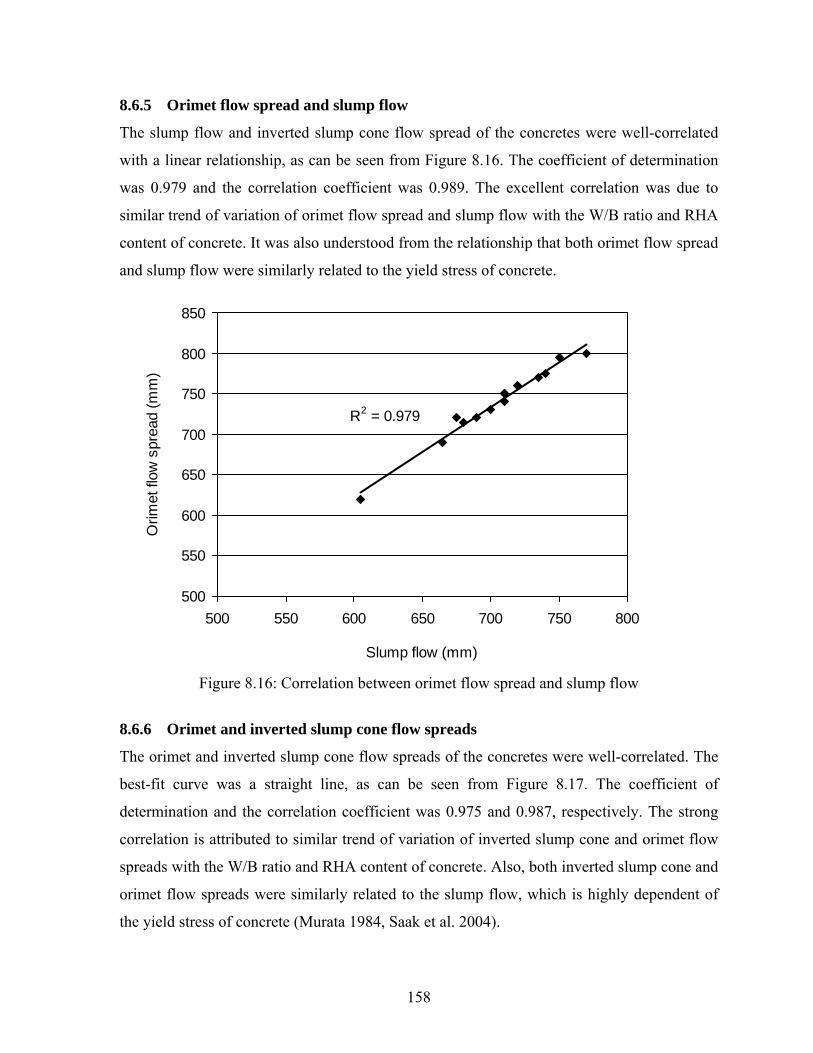
8.6.5 Orimet flow spread and slump flow
The slump flow and inverted slump cone flow spread of the concretes were well-correlated
with a linear relationship, as can be seen from Figure 8.16. The coefficient of determination
was 0.979 and the correlation coefficient was 0.989. The excellent correlation was due to
similar trend of variation of orimet flow spread and slump flow with the W/B ratio and RHA
content of concrete. It was also understood from the relationship that both orimet flow spread
and slump flow were similarly related to the yield stress of concrete.
R2 = 0.979
500
550
600
650
700
750
800
850
500 550 600 650 700 750 800
Slump flow (mm)
Orim
et fl
ow s
prea
d (m
m)
Figure 8.16: Correlation between orimet flow spread and slump flow
8.6.6 Orimet and inverted slump cone flow spreads
The orimet and inverted slump cone flow spreads of the concretes were well-correlated. The
best-fit curve was a straight line, as can be seen from Figure 8.17. The coefficient of
determination and the correlation coefficient was 0.975 and 0.987, respectively. The strong
correlation is attributed to similar trend of variation of inverted slump cone and orimet flow
spreads with the W/B ratio and RHA content of concrete. Also, both inverted slump cone and
orimet flow spreads were similarly related to the slump flow, which is highly dependent of
the yield stress of concrete (Murata 1984, Saak et al. 2004).
158
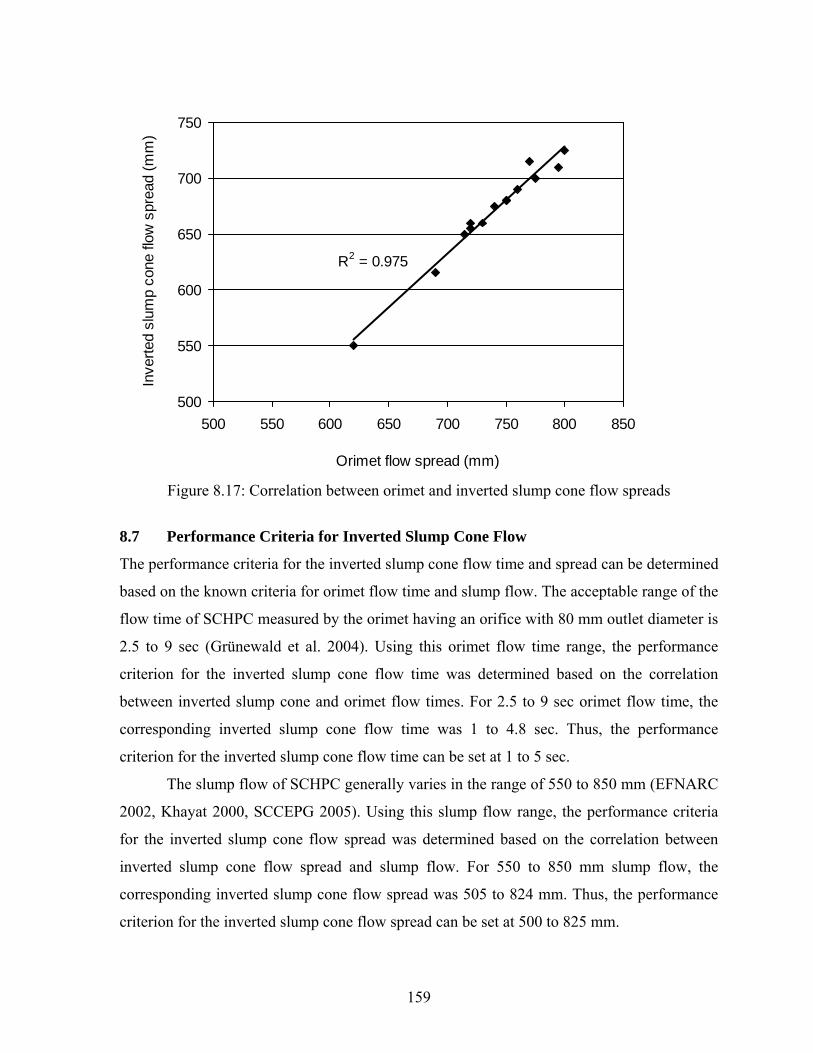
R2 = 0.975
500
550
600
650
700
750
500 550 600 650 700 750 800 850
Orimet flow spread (mm)
Inve
rted
slum
p co
ne fl
ow s
prea
d (m
m)
Figure 8.17: Correlation between orimet and inverted slump cone flow spreads
8.7 Performance Criteria for Inverted Slump Cone Flow
The performance criteria for the inverted slump cone flow time and spread can be determined
based on the known criteria for orimet flow time and slump flow. The acceptable range of the
flow time of SCHPC measured by the orimet having an orifice with 80 mm outlet diameter is
2.5 to 9 sec (Grünewald et al. 2004). Using this orimet flow time range, the performance
criterion for the inverted slump cone flow time was determined based on the correlation
between inverted slump cone and orimet flow times. For 2.5 to 9 sec orimet flow time, the
corresponding inverted slump cone flow time was 1 to 4.8 sec. Thus, the performance
criterion for the inverted slump cone flow time can be set at 1 to 5 sec.
The slump flow of SCHPC generally varies in the range of 550 to 850 mm (EFNARC
2002, Khayat 2000, SCCEPG 2005). Using this slump flow range, the performance criteria
for the inverted slump cone flow spread was determined based on the correlation between
inverted slump cone flow spread and slump flow. For 550 to 850 mm slump flow, the
corresponding inverted slump cone flow spread was 505 to 824 mm. Thus, the performance
criterion for the inverted slump cone flow spread can be set at 500 to 825 mm.
159

8.8 Advantages of Inverted Slump Cone Apparatus
The inverted slump cone apparatus will be useful to measure the filling ability of SCHPC. In
addition, it can be used with the J-ring to measure both filling ability and passing ability of
concrete simultaneously. It might also qualitatively indicate the segregation resistance of
concrete whether it is used alone or with J-ring. Thus a single test apparatus will provide
information on three key properties of SCHPC. The inadequacy of filling ability, passing
ability and segregation resistance will be detected during concrete flow.
The inverted slump cone apparatus would provide several benefits over some of the
existing methods. For example, the standard slump and slump flow test does not provide any
information on the viscosity unless the slumping or slump flow time is measured. The
inverted slump cone apparatus can be used to obtain information on both yield stress and
plastic viscosity from the same test. The flow time relates the viscosity where as the flow
spread indicates the yield stress of concrete. Moreover, it has the advantage of being a
dynamic test and thus reflects the concrete placement in practice. In comparison with other
apparatus such as slump cone and orimet, the inverted slump cone ideally does not require
two operators. It can be easily handled by a single operator. In addition, it requires about
27% less concrete than the orimet and thus saves both concrete quantity and operation time.
The whole test takes about 2 to 3 minutes to conduct. Because of simplicity, it can be used
comfortably and quickly in laboratory and field.
The construction of inverted slump cone apparatus is not difficult as compared to
other apparatus such as U-box. The construction cost is also minimal since it uses Abram’s
slump cone, which is not expensive. The cone used in inverted slump cone apparatus can be
separated easily. Therefore, the same cone can also be used to conduct the slump and slump
flow test.
8.9 Model for Filling Ability of Concretes
An empirical model has been developed for the filling ability of SCHPC based on the slump
flow and paste volume of the concretes. In a slump flow test, the deformation of the fresh
concrete is mainly caused by gravity. The deformation continues until the equilibrium is
established and the fresh concrete achieves it final slump flow spread. In equilibrium, the
160
applied shear stress is equal to the yield stress. Based on the force balance approach given by
Murata (1984), the yield stress (τy) of the concrete can be calculated as follows:
( ) 222/2 ffy SS
gV ραπρτ == (Equation 8.1)
where:
ρ is the density or unit weight of concrete (kg/m3), g is the gravitational acceleration (9.806
m/s2), V is the volume of fresh concrete that equals the volume of slump cone (0.0055 m3), Sf
is the slump flow (diameter of spread) of concrete (m), and α is a constant that substitutes
(2gV/π).
Equation 8.1 is based on the assumption that the concrete behaves as an
incompressible material and no flow exists between the layers of concrete. It is obvious from
Equation 8.1 that the second power of the slump flow is inversely proportional to the yield
stress of concrete. The yield stress is a major rheological parameter of concrete. Tomas
(1961) performed a comprehensive experimental investigation on the non-Newtonian
laminar-flow properties of flocculated suspension and reported a relationship for the yield
stress. Based on a wide range of data fitted satisfactorily with the Bingham plastic model, he
concluded that the yield stress is directly proportional to the cube of the volume fraction of
solids (Sv) for any given suspension. That is,
3vy S∝τ (Equation 8.2)
The SCHPC mixture can be considered as a flocculated suspension (coarse and fine
aggregates suspended in a matrix of binder paste). In addition, it is well-known that the
SCHPC mixture behaves like a Bingham (non-Newtonian) fluid. Hence, the following
relationship can be assumed for SCHPC:
nvy S∝τ (Equation 8.3)
161
where:
n is an empirical constant and Sv is the volume fraction of coarse and fine aggregates
(concrete stone and sand). Assuming the air-voids and HRWR dosage as a part of the binder
paste, for 1 m3 of concrete, Sv can be expressed in the following form with respect to the
paste volume of concrete (Vp).
pv VS −= 1 (Equation 8.4)
Now from Equations 8.1, 8.3 and 8.4, the following relationship can be obtained for
the slump flow and paste volume of concrete.
np
f
VS
)1(2 −= βρ (Equation 8.5)
where:
β is an empirical constant. Both β and n were determined based on the experimental results
obtained from the slump flow test of various concretes. In order to determine β and n,
Equation 8.5 was reformed as follows:
ββρ ln)1(ln)1(lnln 2 +−=−= pn
pf
VnVS
(Equation 8.6)
The paste volume was computed based on the proportions of cement and water, the
dosages of HRWR and the air content or volume of air-voids in concrete. The logarithmic
data of ρ/Sf2 were plotted versus the logarithmic (1-Vp) data for various concretes. The best-
fit plot was a straight line, as can be seen from Figure 8.18.
The value of n was determined as the slope of the straight line whereas the value of β
was found based on the intercept of the y = ln(ρ/Sf2) axis. The values of β and n obtained
were 15873, and 2.84, respectively. Thus, Equation 8.5 can be expressed in the following
form:
162
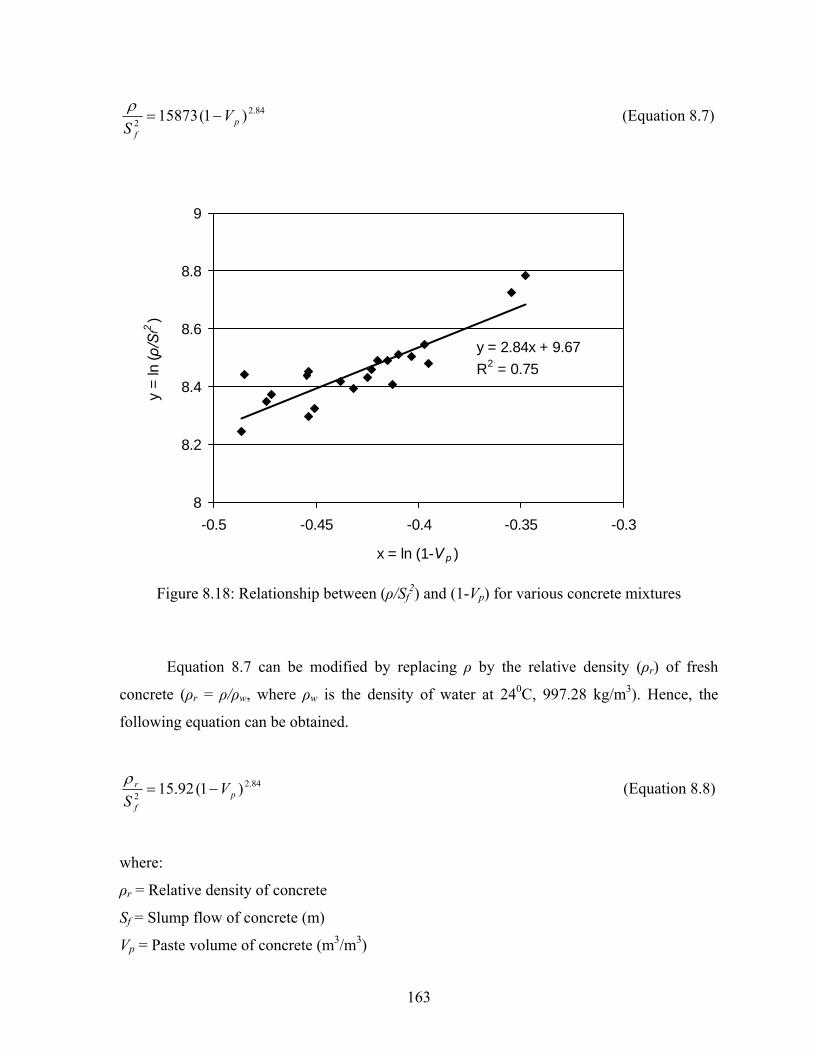
84.22 )1(15873 pf
VS
−=ρ (Equation 8.7)
y = 2.84x + 9.67R2 = 0.75
8
8.2
8.4
8.6
8.8
9
-0.5 -0.45 -0.4 -0.35 -0.3
x = ln (1-Vp )
y =
ln (ρ/Sf2
)
Figure 8.18: Relationship between (ρ/Sf2) and (1-Vp) for various concrete mixtures
Equation 8.7 can be modified by replacing ρ by the relative density (ρr) of fresh
concrete (ρr = ρ/ρw, where ρw is the density of water at 240C, 997.28 kg/m3). Hence, the
following equation can be obtained.
84.22 )1(92.15 pf
r VS
−=ρ (Equation 8.8)
where:
ρr = Relative density of concrete
Sf = Slump flow of concrete (m)
Vp = Paste volume of concrete (m3/m3)
163
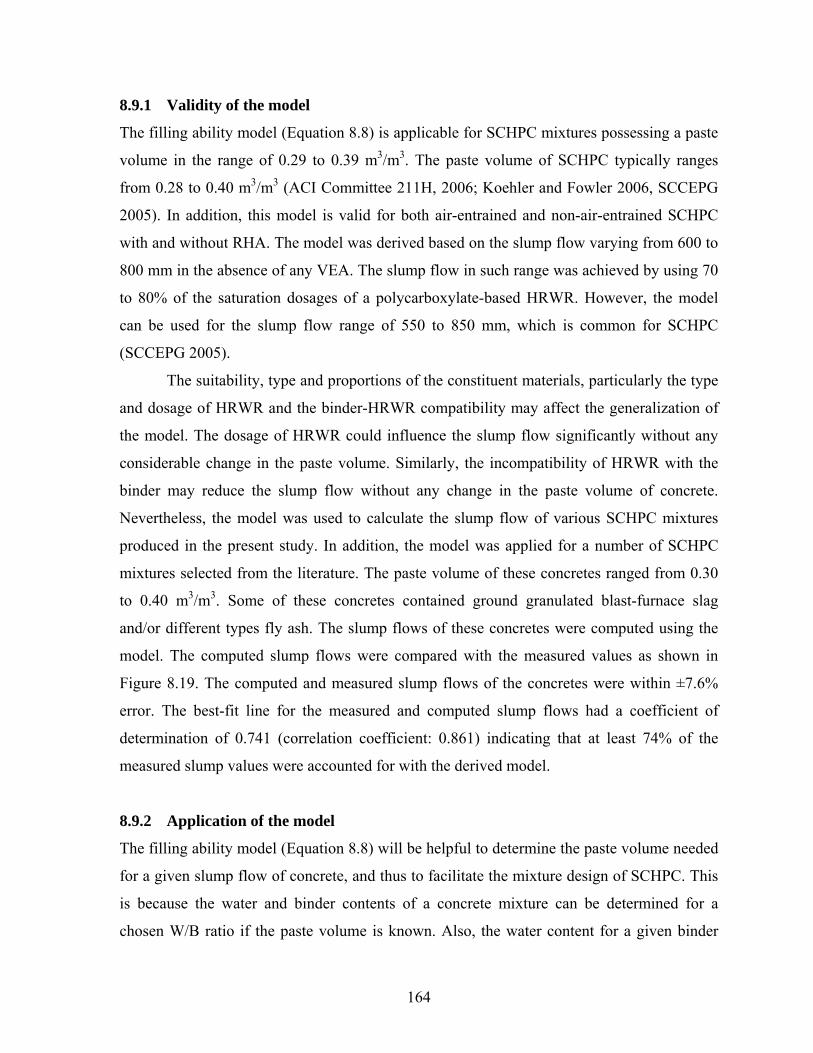
8.9.1 Validity of the model
The filling ability model (Equation 8.8) is applicable for SCHPC mixtures possessing a paste
volume in the range of 0.29 to 0.39 m3/m3. The paste volume of SCHPC typically ranges
from 0.28 to 0.40 m3/m3 (ACI Committee 211H, 2006; Koehler and Fowler 2006, SCCEPG
2005). In addition, this model is valid for both air-entrained and non-air-entrained SCHPC
with and without RHA. The model was derived based on the slump flow varying from 600 to
800 mm in the absence of any VEA. The slump flow in such range was achieved by using 70
to 80% of the saturation dosages of a polycarboxylate-based HRWR. However, the model
can be used for the slump flow range of 550 to 850 mm, which is common for SCHPC
(SCCEPG 2005).
The suitability, type and proportions of the constituent materials, particularly the type
and dosage of HRWR and the binder-HRWR compatibility may affect the generalization of
the model. The dosage of HRWR could influence the slump flow significantly without any
considerable change in the paste volume. Similarly, the incompatibility of HRWR with the
binder may reduce the slump flow without any change in the paste volume of concrete.
Nevertheless, the model was used to calculate the slump flow of various SCHPC mixtures
produced in the present study. In addition, the model was applied for a number of SCHPC
mixtures selected from the literature. The paste volume of these concretes ranged from 0.30
to 0.40 m3/m3. Some of these concretes contained ground granulated blast-furnace slag
and/or different types fly ash. The slump flows of these concretes were computed using the
model. The computed slump flows were compared with the measured values as shown in
Figure 8.19. The computed and measured slump flows of the concretes were within ±7.6%
error. The best-fit line for the measured and computed slump flows had a coefficient of
determination of 0.741 (correlation coefficient: 0.861) indicating that at least 74% of the
measured slump values were accounted for with the derived model.
8.9.2 Application of the model
The filling ability model (Equation 8.8) will be helpful to determine the paste volume needed
for a given slump flow of concrete, and thus to facilitate the mixture design of SCHPC. This
is because the water and binder contents of a concrete mixture can be determined for a
chosen W/B ratio if the paste volume is known. Also, the water content for a given binder
164
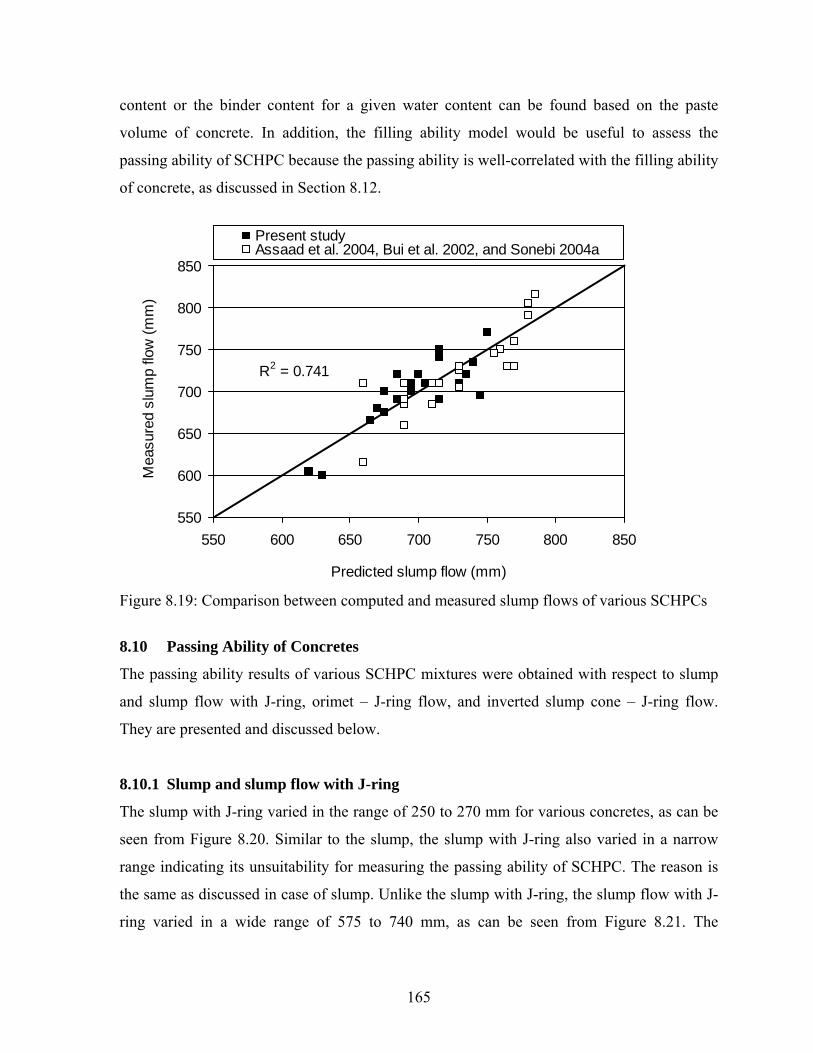
content or the binder content for a given water content can be found based on the paste
volume of concrete. In addition, the filling ability model would be useful to assess the
passing ability of SCHPC because the passing ability is well-correlated with the filling ability
of concrete, as discussed in Section 8.12.
550
600
650
700
750
800
850
550 600 650 700 750 800 850
Predicted slump flow (mm)
Mea
sure
d sl
ump
flow
(mm
)
Present studyAssaad et al. 2004, Bui et al. 2002, and Sonebi 2004a
R2 = 0.741
Figure 8.19: Comparison between computed and measured slump flows of various SCHPCs
8.10 Passing Ability of Concretes
The passing ability results of various SCHPC mixtures were obtained with respect to slump
and slump flow with J-ring, orimet – J-ring flow, and inverted slump cone – J-ring flow.
They are presented and discussed below.
8.10.1 Slump and slump flow with J-ring
The slump with J-ring varied in the range of 250 to 270 mm for various concretes, as can be
seen from Figure 8.20. Similar to the slump, the slump with J-ring also varied in a narrow
range indicating its unsuitability for measuring the passing ability of SCHPC. The reason is
the same as discussed in case of slump. Unlike the slump with J-ring, the slump flow with J-
ring varied in a wide range of 575 to 740 mm, as can be seen from Figure 8.21. The
165
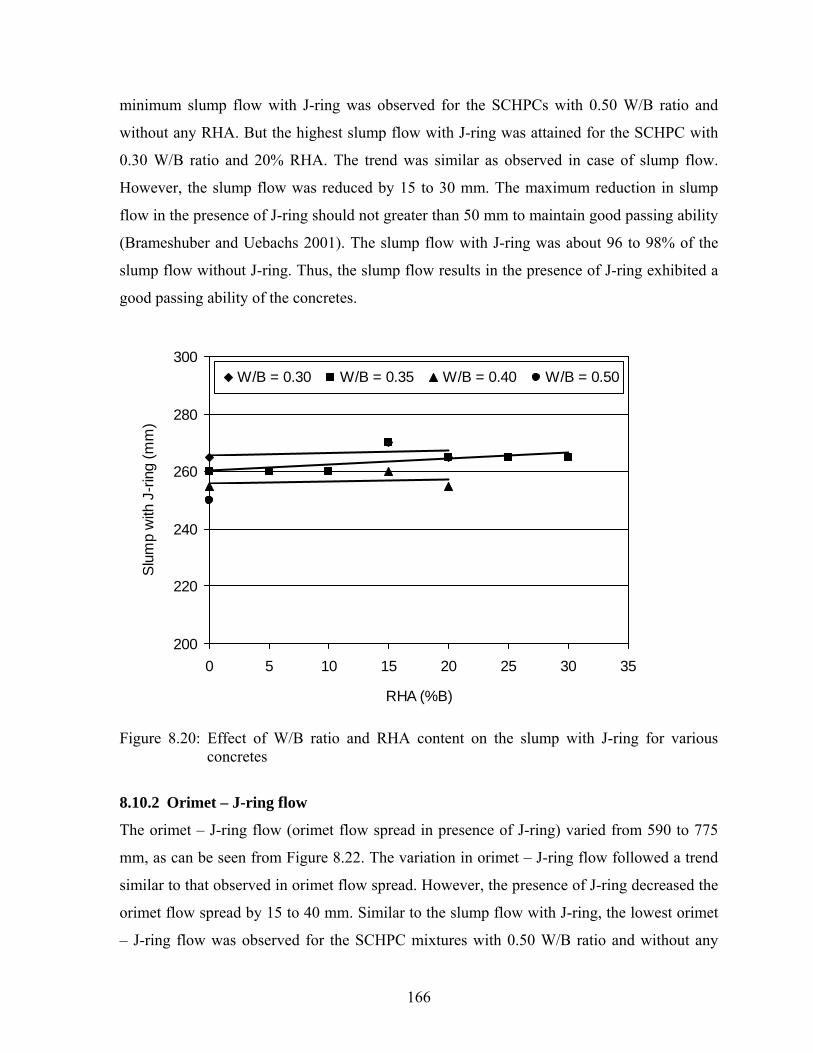
minimum slump flow with J-ring was observed for the SCHPCs with 0.50 W/B ratio and
without any RHA. But the highest slump flow with J-ring was attained for the SCHPC with
0.30 W/B ratio and 20% RHA. The trend was similar as observed in case of slump flow.
However, the slump flow was reduced by 15 to 30 mm. The maximum reduction in slump
flow in the presence of J-ring should not greater than 50 mm to maintain good passing ability
(Brameshuber and Uebachs 2001). The slump flow with J-ring was about 96 to 98% of the
slump flow without J-ring. Thus, the slump flow results in the presence of J-ring exhibited a
good passing ability of the concretes.
200
220
240
260
280
300
0 5 10 15 20 25 30 35
RHA (%B)
Slu
mp
with
J-r
ing
(mm
)
W/B = 0.30 W/B = 0.35 W/B = 0.40 W/B = 0.50
Figure 8.20: Effect of W/B ratio and RHA content on the slump with J-ring for various concretes
8.10.2 Orimet – J-ring flow
The orimet – J-ring flow (orimet flow spread in presence of J-ring) varied from 590 to 775
mm, as can be seen from Figure 8.22. The variation in orimet – J-ring flow followed a trend
similar to that observed in orimet flow spread. However, the presence of J-ring decreased the
orimet flow spread by 15 to 40 mm. Similar to the slump flow with J-ring, the lowest orimet
– J-ring flow was observed for the SCHPC mixtures with 0.50 W/B ratio and without any
166
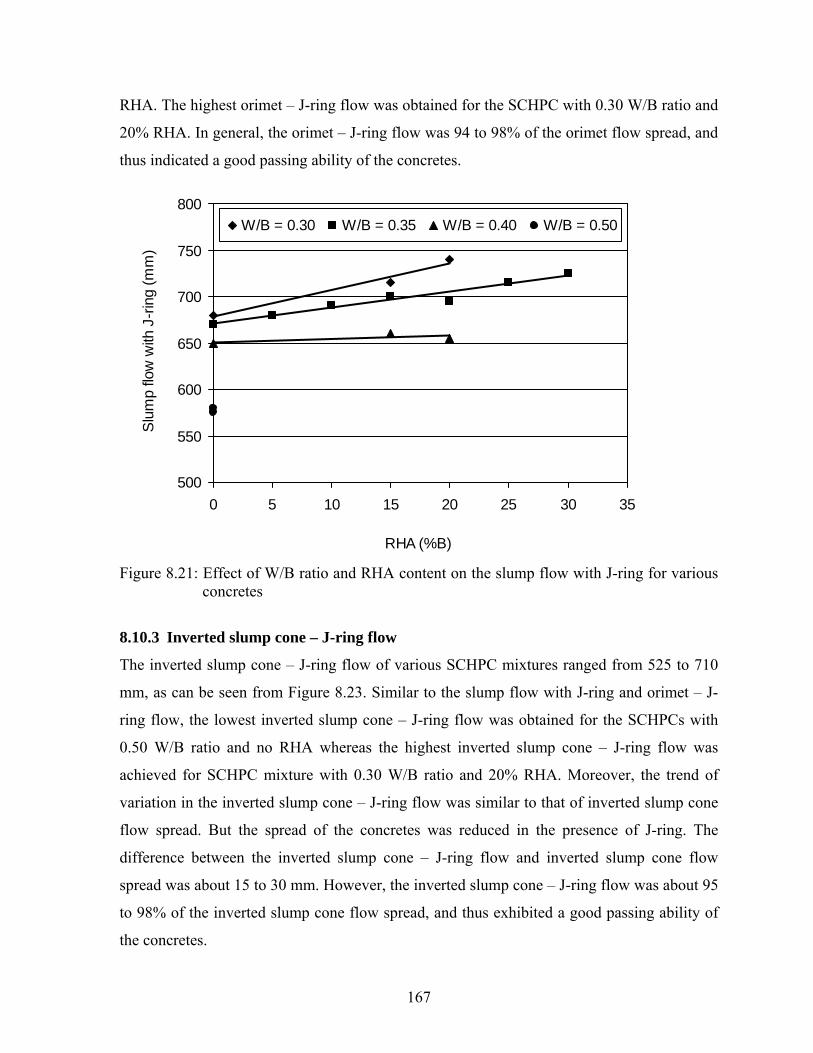
RHA. The highest orimet – J-ring flow was obtained for the SCHPC with 0.30 W/B ratio and
20% RHA. In general, the orimet – J-ring flow was 94 to 98% of the orimet flow spread, and
thus indicated a good passing ability of the concretes.
500
550
600
650
700
750
800
0 5 10 15 20 25 30 35
RHA (%B)
Slu
mp
flow
with
J-r
ing
(mm
)
W/B = 0.30 W/B = 0.35 W/B = 0.40 W/B = 0.50
Figure 8.21: Effect of W/B ratio and RHA content on the slump flow with J-ring for various concretes
8.10.3 Inverted slump cone – J-ring flow
The inverted slump cone – J-ring flow of various SCHPC mixtures ranged from 525 to 710
mm, as can be seen from Figure 8.23. Similar to the slump flow with J-ring and orimet – J-
ring flow, the lowest inverted slump cone – J-ring flow was obtained for the SCHPCs with
0.50 W/B ratio and no RHA whereas the highest inverted slump cone – J-ring flow was
achieved for SCHPC mixture with 0.30 W/B ratio and 20% RHA. Moreover, the trend of
variation in the inverted slump cone – J-ring flow was similar to that of inverted slump cone
flow spread. But the spread of the concretes was reduced in the presence of J-ring. The
difference between the inverted slump cone – J-ring flow and inverted slump cone flow
spread was about 15 to 30 mm. However, the inverted slump cone – J-ring flow was about 95
to 98% of the inverted slump cone flow spread, and thus exhibited a good passing ability of
the concretes.
167
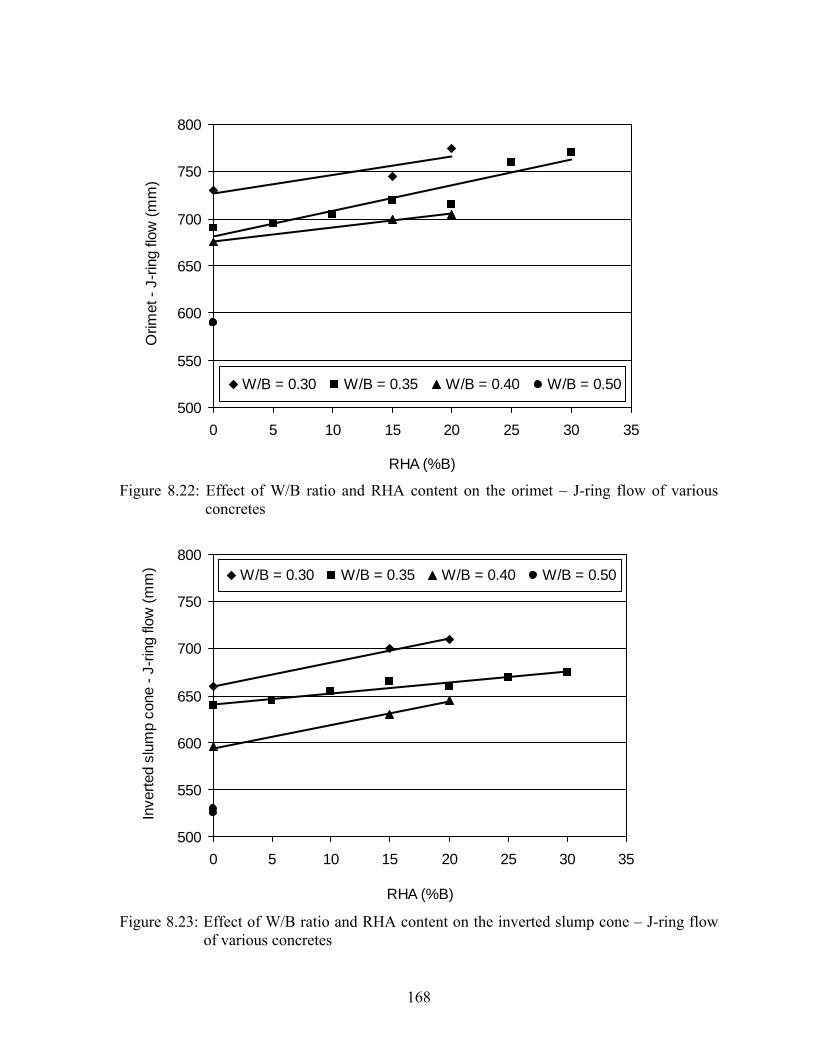
500
550
600
650
700
750
800
0 5 10 15 20 25 30 35
RHA (%B)
Orim
et -
J-rin
g flo
w (m
m)
W/B = 0.30 W/B = 0.35 W/B = 0.40 W/B = 0.50
Figure 8.22: Effect of W/B ratio and RHA content on the orimet – J-ring flow of various concretes
500
550
600
650
700
750
800
0 5 10 15 20 25 30 35
RHA (%B)
Inve
rted
slum
p co
ne -
J-rin
g flo
w (m
m) W/B = 0.30 W/B = 0.35 W/B = 0.40 W/B = 0.50
Figure 8.23: Effect of W/B ratio and RHA content on the inverted slump cone – J-ring flow of various concretes
168
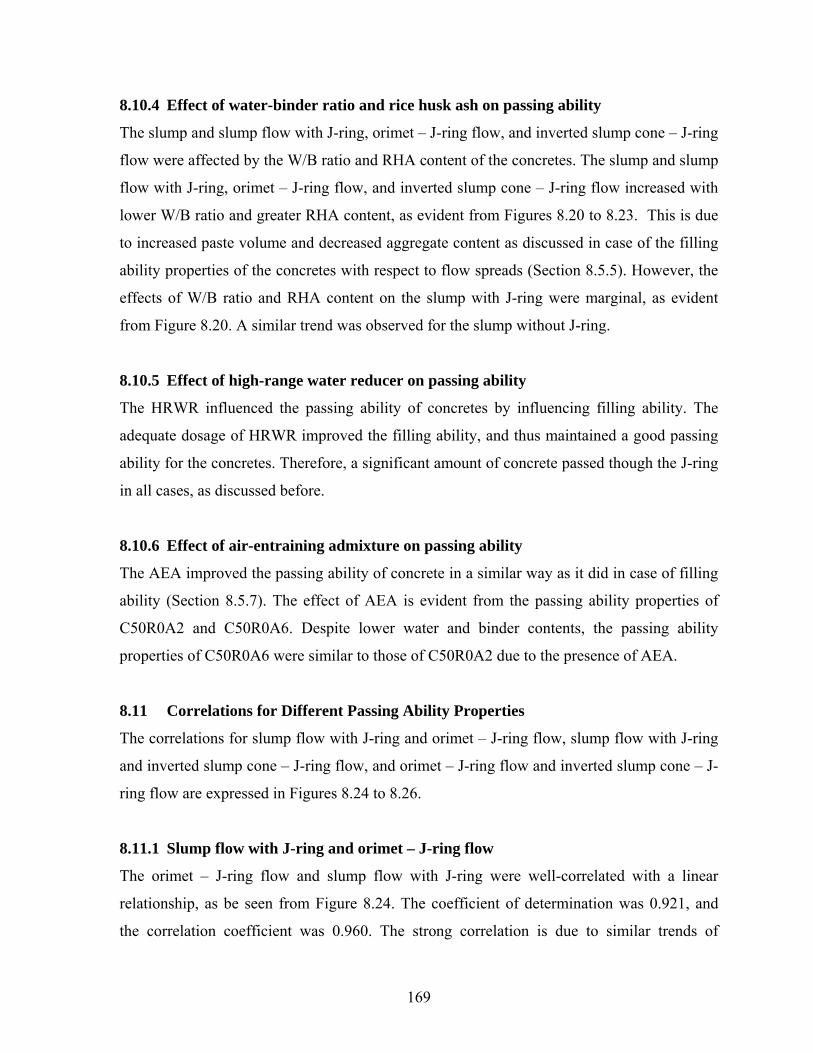
8.10.4 Effect of water-binder ratio and rice husk ash on passing ability
The slump and slump flow with J-ring, orimet – J-ring flow, and inverted slump cone – J-ring
flow were affected by the W/B ratio and RHA content of the concretes. The slump and slump
flow with J-ring, orimet – J-ring flow, and inverted slump cone – J-ring flow increased with
lower W/B ratio and greater RHA content, as evident from Figures 8.20 to 8.23. This is due
to increased paste volume and decreased aggregate content as discussed in case of the filling
ability properties of the concretes with respect to flow spreads (Section 8.5.5). However, the
effects of W/B ratio and RHA content on the slump with J-ring were marginal, as evident
from Figure 8.20. A similar trend was observed for the slump without J-ring.
8.10.5 Effect of high-range water reducer on passing ability
The HRWR influenced the passing ability of concretes by influencing filling ability. The
adequate dosage of HRWR improved the filling ability, and thus maintained a good passing
ability for the concretes. Therefore, a significant amount of concrete passed though the J-ring
in all cases, as discussed before.
8.10.6 Effect of air-entraining admixture on passing ability
The AEA improved the passing ability of concrete in a similar way as it did in case of filling
ability (Section 8.5.7). The effect of AEA is evident from the passing ability properties of
C50R0A2 and C50R0A6. Despite lower water and binder contents, the passing ability
properties of C50R0A6 were similar to those of C50R0A2 due to the presence of AEA.
8.11 Correlations for Different Passing Ability Properties
The correlations for slump flow with J-ring and orimet – J-ring flow, slump flow with J-ring
and inverted slump cone – J-ring flow, and orimet – J-ring flow and inverted slump cone – J-
ring flow are expressed in Figures 8.24 to 8.26.
8.11.1 Slump flow with J-ring and orimet – J-ring flow
The orimet – J-ring flow and slump flow with J-ring were well-correlated with a linear
relationship, as be seen from Figure 8.24. The coefficient of determination was 0.921, and
the correlation coefficient was 0.960. The strong correlation is due to similar trends of
169
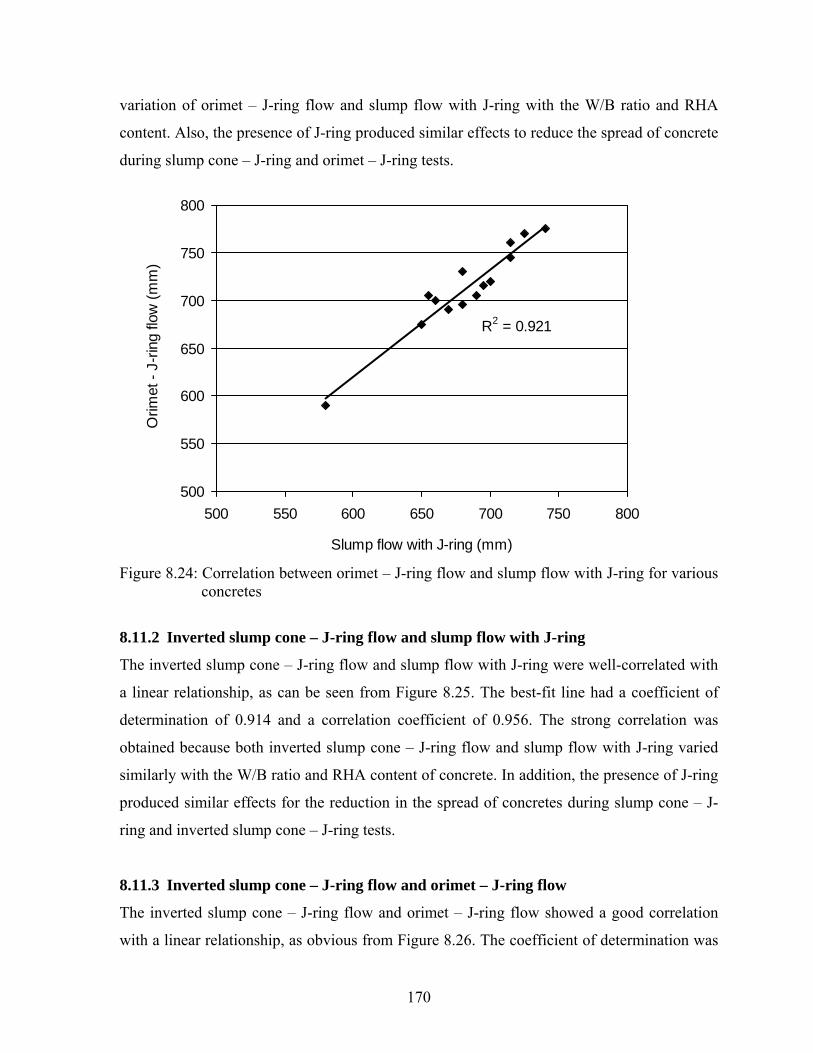
variation of orimet – J-ring flow and slump flow with J-ring with the W/B ratio and RHA
content. Also, the presence of J-ring produced similar effects to reduce the spread of concrete
during slump cone – J-ring and orimet – J-ring tests.
R2 = 0.921
500
550
600
650
700
750
800
500 550 600 650 700 750 800
Slump flow with J-ring (mm)
Orim
et -
J-rin
g flo
w (m
m)
Figure 8.24: Correlation between orimet – J-ring flow and slump flow with J-ring for various concretes
8.11.2 Inverted slump cone – J-ring flow and slump flow with J-ring
The inverted slump cone – J-ring flow and slump flow with J-ring were well-correlated with
a linear relationship, as can be seen from Figure 8.25. The best-fit line had a coefficient of
determination of 0.914 and a correlation coefficient of 0.956. The strong correlation was
obtained because both inverted slump cone – J-ring flow and slump flow with J-ring varied
similarly with the W/B ratio and RHA content of concrete. In addition, the presence of J-ring
produced similar effects for the reduction in the spread of concretes during slump cone – J-
ring and inverted slump cone – J-ring tests.
8.11.3 Inverted slump cone – J-ring flow and orimet – J-ring flow
The inverted slump cone – J-ring flow and orimet – J-ring flow showed a good correlation
with a linear relationship, as obvious from Figure 8.26. The coefficient of determination was
170

0.892 and the correlation coefficient was 0.944. The strong correlation obtained is attributed
to similar variations of inverted slump cone – J-ring flow and orimet – J-ring flow with the
W/B ratio and RHA content of concrete. Also, both inverted slump cone – J-ring flow and
orimet – J-ring flow are similarly related to the yield stress and plastic viscosity that
influence the spread of concrete.
R2 = 0.914
500
550
600
650
700
750
500 550 600 650 700 750 800
Slump flow with J-ring (mm)
Inve
rted
slum
p co
ne -
J-rin
g flo
w (m
m)
Figure 8.25: Correlation between inverted slump cone – J-ring flow and slump flow with J-ring for various concretes
8.12 Correlations between Filling Ability and Passing Ability Properties
The correlations between filling ability properties (slump and slump flow, orimet flow
spread, and inverted slump cone flow spread) and passing ability properties (slump and
slump flow with J-ring, orimet – J-ring flow, and inverted slump cone – J-ring flow) were
established. The filling ability properties exhibited strong linear correlations with the passing
ability properties, as can be seen from Figures 8.27 to 8.34. The coefficient of determination
ranged from 0.904 to 1, and the correlation coefficient varied in the range of 0.951 to 1.
Strong correlations were obtained because the filling ability and passing ability properties
varied similarly with various W/B ratios and RHA contents of the concretes.
171
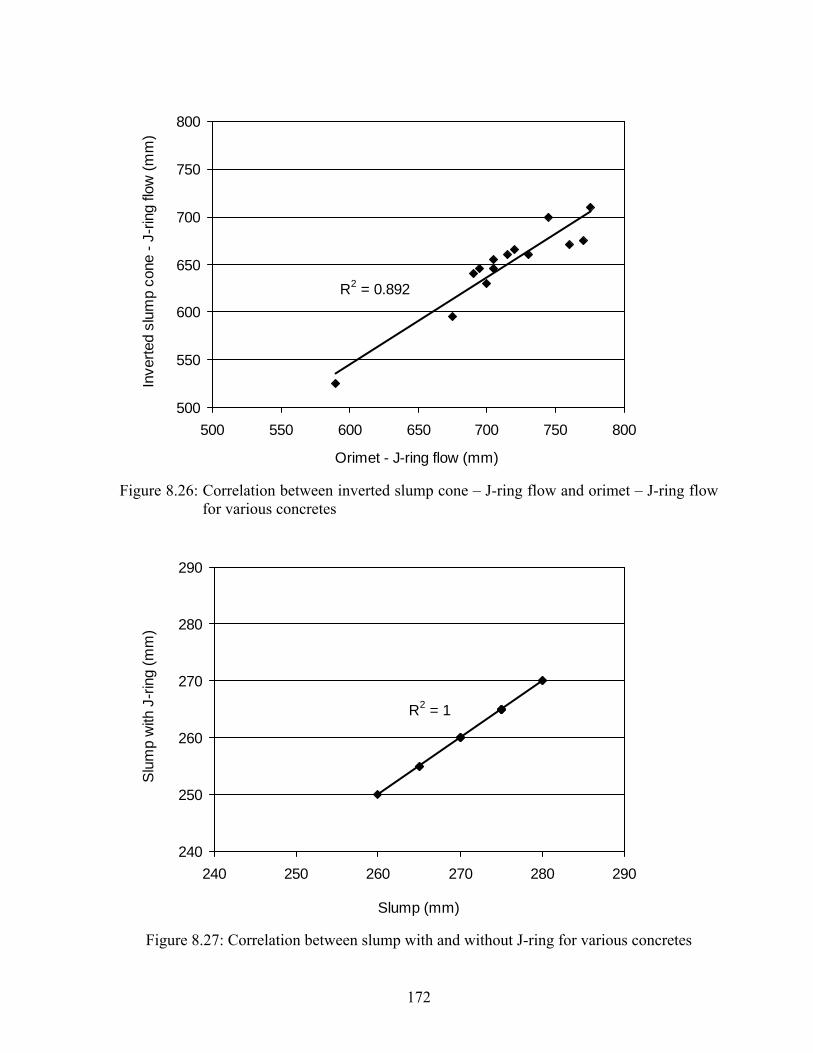
R2 = 0.892
500
550
600
650
700
750
800
500 550 600 650 700 750 800
Orimet - J-ring flow (mm)
Inve
rted
slum
p co
ne -
J-rin
g flo
w (m
m)
Figure 8.26: Correlation between inverted slump cone – J-ring flow and orimet – J-ring flow for various concretes
R2 = 1
240
250
260
270
280
290
240 250 260 270 280 290
Slump (mm)
Slu
mp
with
J-r
ing
(mm
)
Figure 8.27: Correlation between slump with and without J-ring for various concretes
172
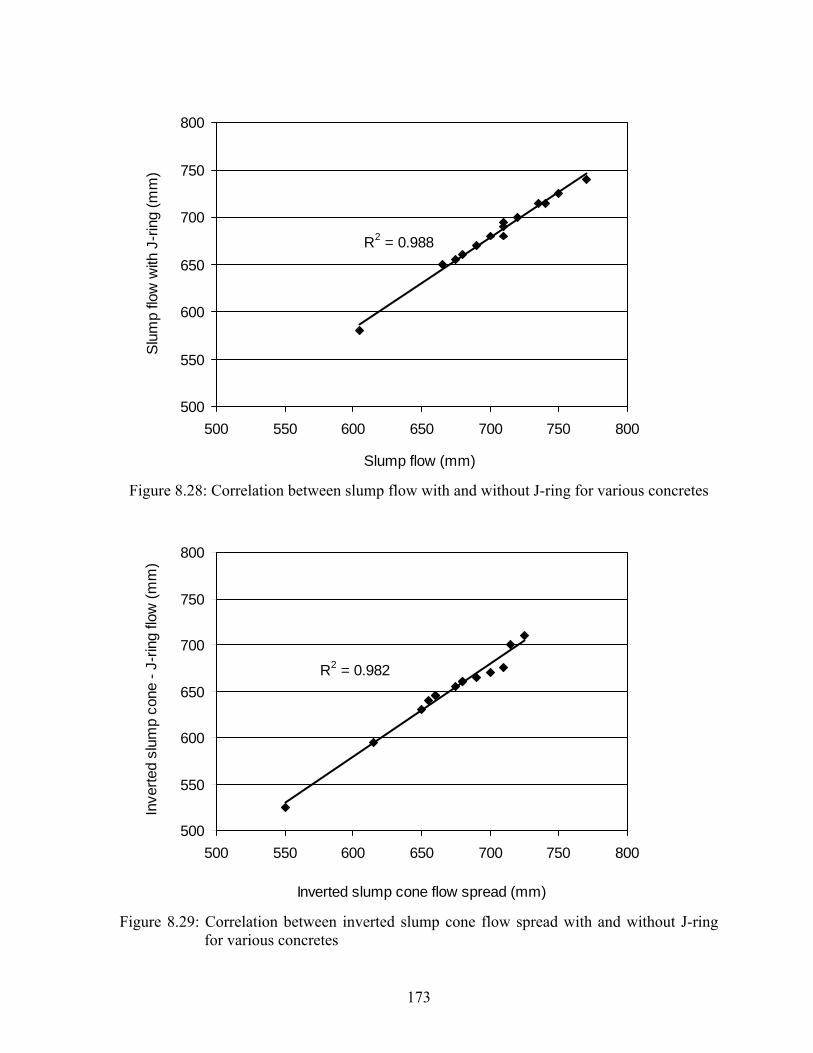
R2 = 0.988
500
550
600
650
700
750
800
500 550 600 650 700 750 800
Slump flow (mm)
Slu
mp
flow
with
J-r
ing
(mm
)
Figure 8.28: Correlation between slump flow with and without J-ring for various concretes
R2 = 0.982
500
550
600
650
700
750
800
500 550 600 650 700 750 800
Inverted slump cone flow spread (mm)
Inve
rted
slum
p co
ne -
J-rin
g flo
w (m
m)
Figure 8.29: Correlation between inverted slump cone flow spread with and without J-ring for various concretes
173
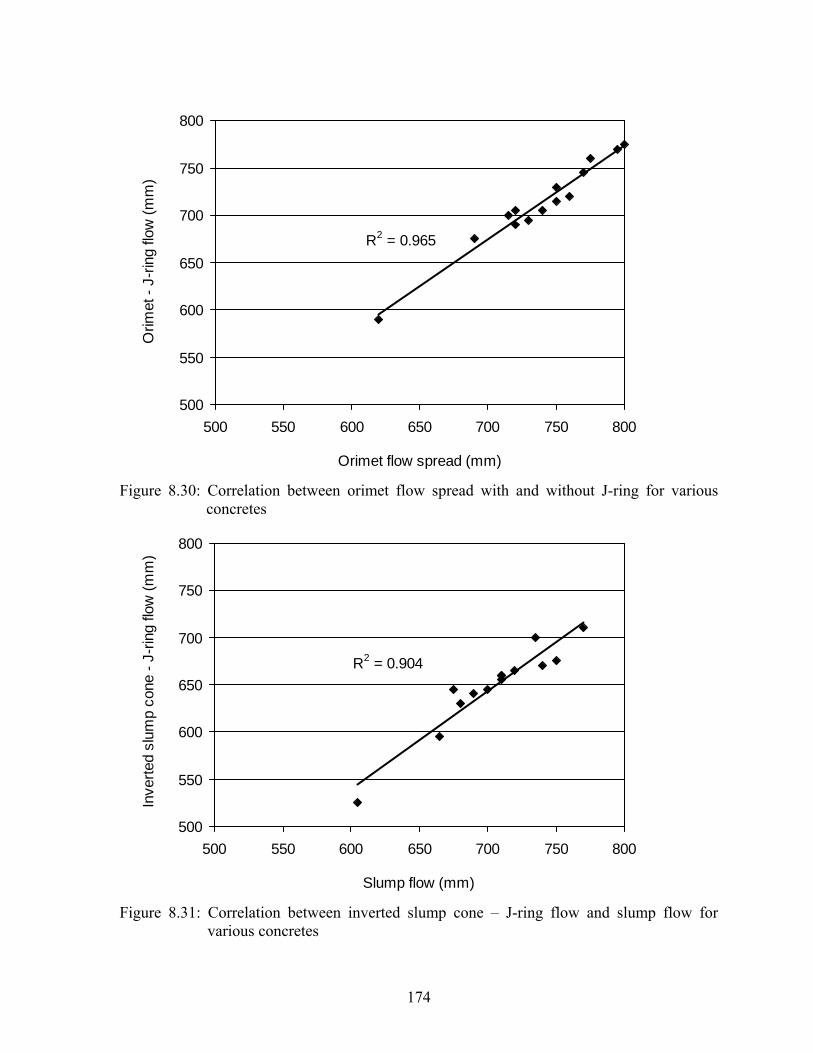
R2 = 0.965
500
550
600
650
700
750
800
500 550 600 650 700 750 800
Orimet flow spread (mm)
Orim
et -
J-rin
g flo
w (m
m)
Figure 8.30: Correlation between orimet flow spread with and without J-ring for various concretes
R2 = 0.904
500
550
600
650
700
750
800
500 550 600 650 700 750 800
Slump flow (mm)
Inve
rted
slum
p co
ne -
J-rin
g flo
w (m
m)
Figure 8.31: Correlation between inverted slump cone – J-ring flow and slump flow for various concretes
174
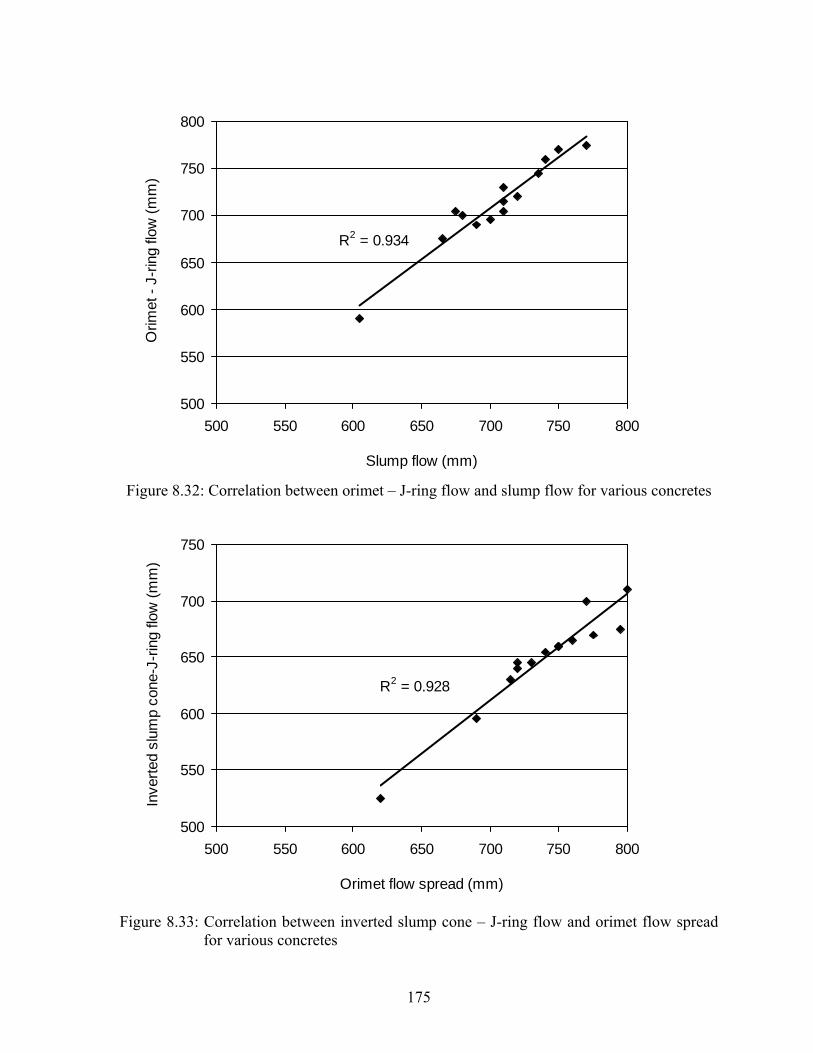
R2 = 0.934
500
550
600
650
700
750
800
500 550 600 650 700 750 800
Slump flow (mm)
Orim
et -
J-rin
g flo
w (m
m)
Figure 8.32: Correlation between orimet – J-ring flow and slump flow for various concretes
R2 = 0.928
500
550
600
650
700
750
500 550 600 650 700 750 800
Orimet flow spread (mm)
Inve
rted
slum
p co
ne-J
-rin
g flo
w (m
m)
Figure 8.33: Correlation between inverted slump cone – J-ring flow and orimet flow spread for various concretes
175
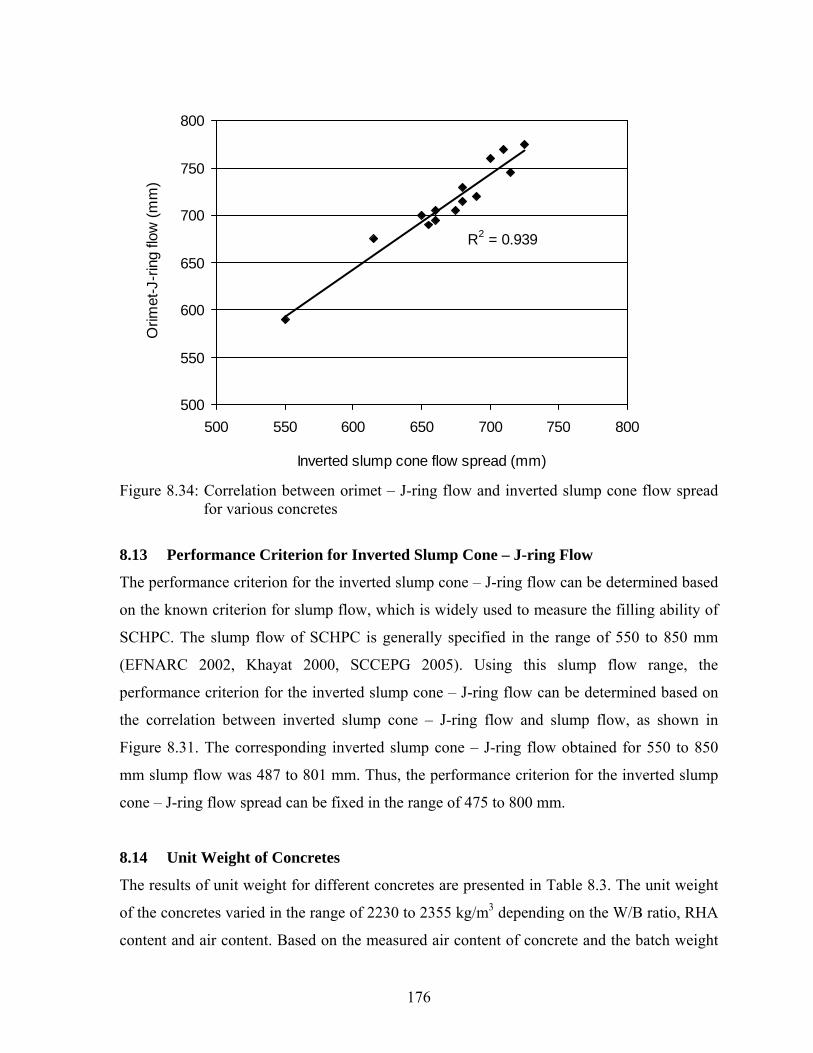
R2 = 0.939
500
550
600
650
700
750
800
500 550 600 650 700 750 800
Inverted slump cone flow spread (mm)
Orim
et-J
-rin
g flo
w (m
m)
Figure 8.34: Correlation between orimet – J-ring flow and inverted slump cone flow spread for various concretes
8.13 Performance Criterion for Inverted Slump Cone – J-ring Flow
The performance criterion for the inverted slump cone – J-ring flow can be determined based
on the known criterion for slump flow, which is widely used to measure the filling ability of
SCHPC. The slump flow of SCHPC is generally specified in the range of 550 to 850 mm
(EFNARC 2002, Khayat 2000, SCCEPG 2005). Using this slump flow range, the
performance criterion for the inverted slump cone – J-ring flow can be determined based on
the correlation between inverted slump cone – J-ring flow and slump flow, as shown in
Figure 8.31. The corresponding inverted slump cone – J-ring flow obtained for 550 to 850
mm slump flow was 487 to 801 mm. Thus, the performance criterion for the inverted slump
cone – J-ring flow spread can be fixed in the range of 475 to 800 mm.
8.14 Unit Weight of Concretes
The results of unit weight for different concretes are presented in Table 8.3. The unit weight
of the concretes varied in the range of 2230 to 2355 kg/m3 depending on the W/B ratio, RHA
content and air content. Based on the measured air content of concrete and the batch weight
176
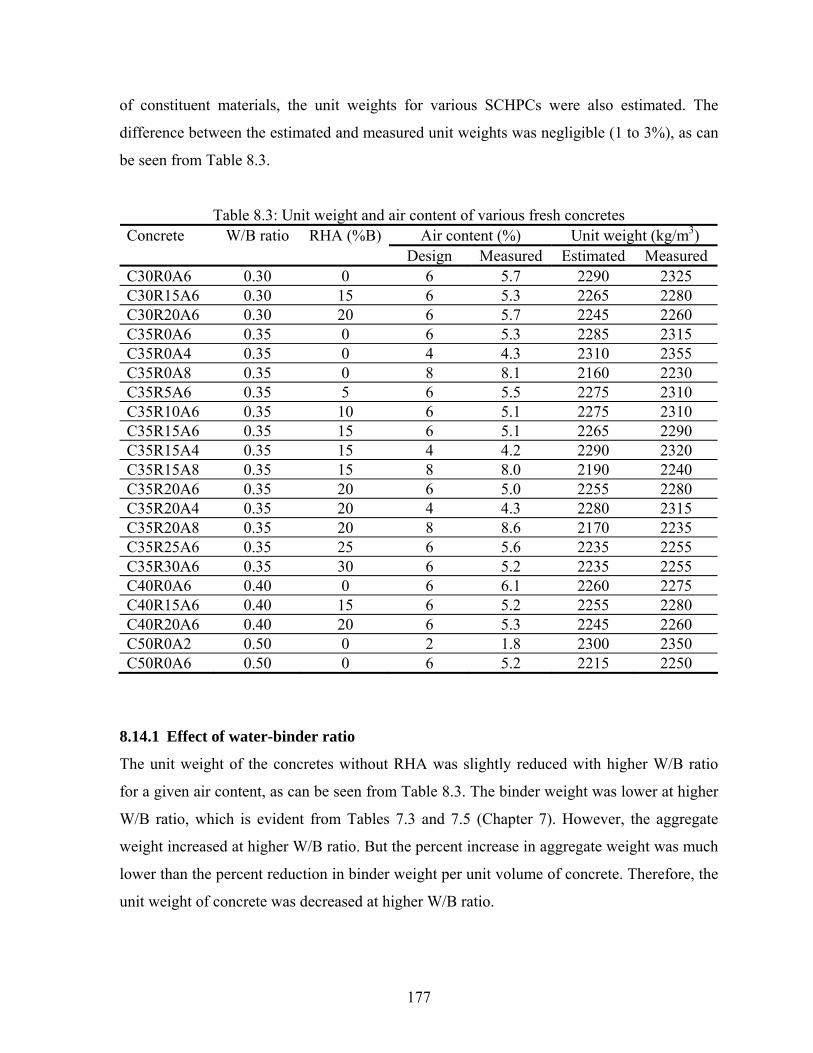
of constituent materials, the unit weights for various SCHPCs were also estimated. The
difference between the estimated and measured unit weights was negligible (1 to 3%), as can
be seen from Table 8.3.
Table 8.3: Unit weight and air content of various fresh concretes Air content (%) Unit weight (kg/m3) Concrete W/B ratio RHA (%B)
Design Measured Estimated Measured C30R0A6 0.30 0 6 5.7 2290 2325 C30R15A6 0.30 15 6 5.3 2265 2280 C30R20A6 0.30 20 6 5.7 2245 2260 C35R0A6 0.35 0 6 5.3 2285 2315 C35R0A4 0.35 0 4 4.3 2310 2355 C35R0A8 0.35 0 8 8.1 2160 2230 C35R5A6 0.35 5 6 5.5 2275 2310 C35R10A6 0.35 10 6 5.1 2275 2310 C35R15A6 0.35 15 6 5.1 2265 2290 C35R15A4 0.35 15 4 4.2 2290 2320 C35R15A8 0.35 15 8 8.0 2190 2240 C35R20A6 0.35 20 6 5.0 2255 2280 C35R20A4 0.35 20 4 4.3 2280 2315 C35R20A8 0.35 20 8 8.6 2170 2235 C35R25A6 0.35 25 6 5.6 2235 2255 C35R30A6 0.35 30 6 5.2 2235 2255 C40R0A6 0.40 0 6 6.1 2260 2275 C40R15A6 0.40 15 6 5.2 2255 2280 C40R20A6 0.40 20 6 5.3 2245 2260 C50R0A2 0.50 0 2 1.8 2300 2350 C50R0A6 0.50 0 6 5.2 2215 2250
8.14.1 Effect of water-binder ratio
The unit weight of the concretes without RHA was slightly reduced with higher W/B ratio
for a given air content, as can be seen from Table 8.3. The binder weight was lower at higher
W/B ratio, which is evident from Tables 7.3 and 7.5 (Chapter 7). However, the aggregate
weight increased at higher W/B ratio. But the percent increase in aggregate weight was much
lower than the percent reduction in binder weight per unit volume of concrete. Therefore, the
unit weight of concrete was decreased at higher W/B ratio.
177

8.14.2 Effect of rice husk ash
The unit weight of most concretes decreased slightly with higher RHA content, as evident
from Table 8.3. This is because RHA was lighter than cement. Also, the fine and coarse
aggregate contents decreased as the paste volume increased in the presence of RHA.
However, the decrease in the unit weight of concrete caused by RHA was marginal (1.7 to
2.8%). This is perhaps attributed to the improved physical packing of the fresh concretes due
to the finer particle size of RHA as compared to cement.
8.14.3 Effect of air content
The unit weight of the concretes varied with the air content. The higher unit weight was
obtained at lower air content, as can be seen from Table 8.3. This is due to the increased
aggregate contents. At lower air content, the amounts of both fine and coarse aggregates were
increased for a given W/B ratio (fixed contents of binder and water), as can be seen from
Tables 7.3 and 7.4 (Chapter 7).
8.15 Air Content of Concretes
The results of air content for various SCHPC mixtures are shown in Table 8.3. The measured
air contents were within ±1.0% of the design air content, which is acceptable. The maximum
acceptable tolerance for air content measurement can be in the range of ±1.5% (ACI 201.2R-
01, 2004).
8.15.1 Effect of water-binder ratio and rice husk ash
The air content was prone to decrease with lower W/B ratio and higher RHA content due to
the same reasons as discussed in Sections 6.5.2 and 6.5.3 (Chapter 6). Therefore, the demand
for AEA was increased progressively with lower W/B ratio and higher RHA content for a
given design air content, as illustrated in Table 7.4 (Chapter 7).
8.15.2 Correlation of estimated and actual dosages of air-entraining admixture
The correlation between actual and estimated AEA dosages of concretes was established.
The estimated AEA dosages for various concretes were obtained based on the air content of
their mortar components (Chapter 6). The actual and estimated AEA dosages were well-
178
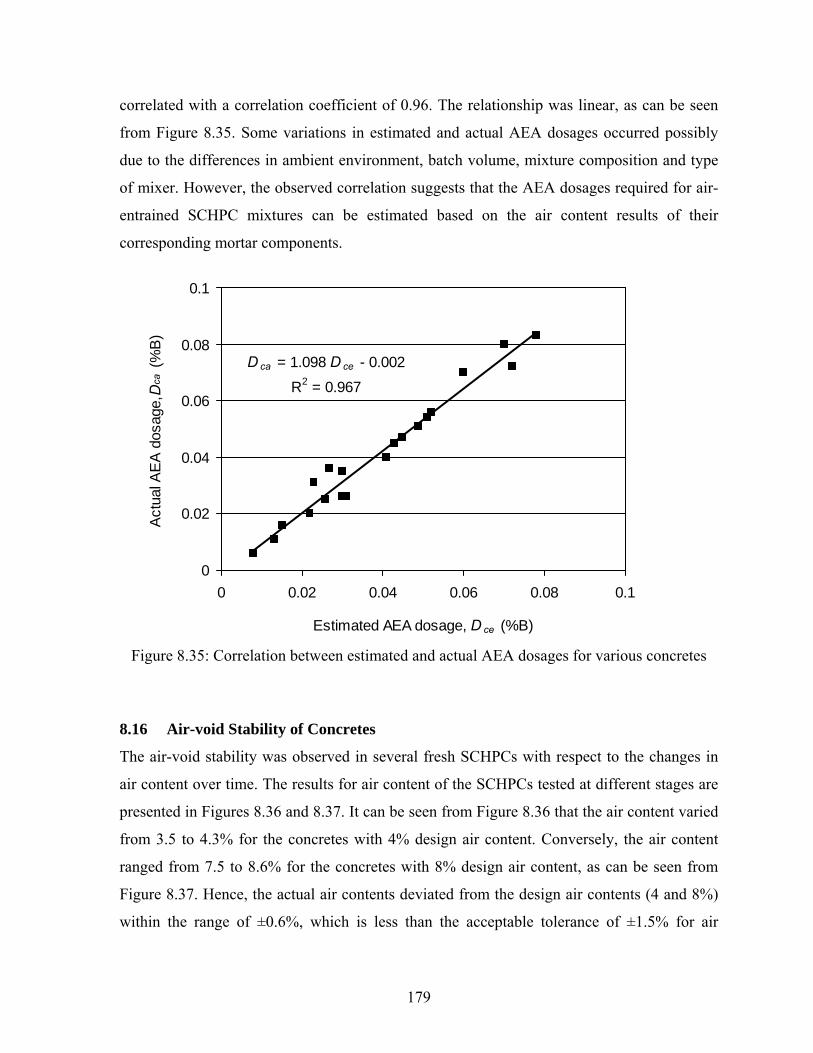
correlated with a correlation coefficient of 0.96. The relationship was linear, as can be seen
from Figure 8.35. Some variations in estimated and actual AEA dosages occurred possibly
due to the differences in ambient environment, batch volume, mixture composition and type
of mixer. However, the observed correlation suggests that the AEA dosages required for air-
entrained SCHPC mixtures can be estimated based on the air content results of their
corresponding mortar components.
Dca = 1.098 Dce - 0.002
R2 = 0.967
0
0.02
0.04
0.06
0.08
0.1
0 0.02 0.04 0.06 0.08 0.1
Estimated AEA dosage, Dce (%B)
Act
ual A
EA d
osag
e, Dca
(%B
)
Figure 8.35: Correlation between estimated and actual AEA dosages for various concretes
8.16 Air-void Stability of Concretes
The air-void stability was observed in several fresh SCHPCs with respect to the changes in
air content over time. The results for air content of the SCHPCs tested at different stages are
presented in Figures 8.36 and 8.37. It can be seen from Figure 8.36 that the air content varied
from 3.5 to 4.3% for the concretes with 4% design air content. Conversely, the air content
ranged from 7.5 to 8.6% for the concretes with 8% design air content, as can be seen from
Figure 8.37. Hence, the actual air contents deviated from the design air contents (4 and 8%)
within the range of ±0.6%, which is less than the acceptable tolerance of ±1.5% for air
179

content measurement (ACI 201.2R-01, 2004). In a few cases, the air content observed during
the second stage of testing at 30 minutes from concrete batching was slightly higher than the
initial air content. This is possibly due to enhanced dispersion of the entrained air under more
mixing action. The overall test results indicate that the air-void stability in all fresh SCHPC
mixtures was good. The maximum loss of air content over the period of 60 and 90 minutes
was less than 1.0% for all concretes. This is below the air loss of 1 to 2% that generally
occurs due to the transportation of concrete (Kosmatka et al. 2002).
0
1
2
3
4
5
6
15 30 45 60
Testing time (min.)
Air
cont
ent (
%)
0% RHA 15% RHA 20% RHA
Figure 8.36: Variation of air content in self-consolidating high performance concretes with 4% design air content
The air-void stability observed in various fresh SCHPC mixtures is attributed to the
relatively high binder content, low W/B ratio and high S/A ratio. These properties are not
only conducive to the filling ability of the concretes, but also enhance the air-void stability
(Khayat and Assaad 2002). In the present study, the concretes tested for air-void stability
were prepared using a relatively low coarse aggregate content with a higher amount of
binder. In addition, the saturation dosages of HRWR dispersed the binding materials and
180
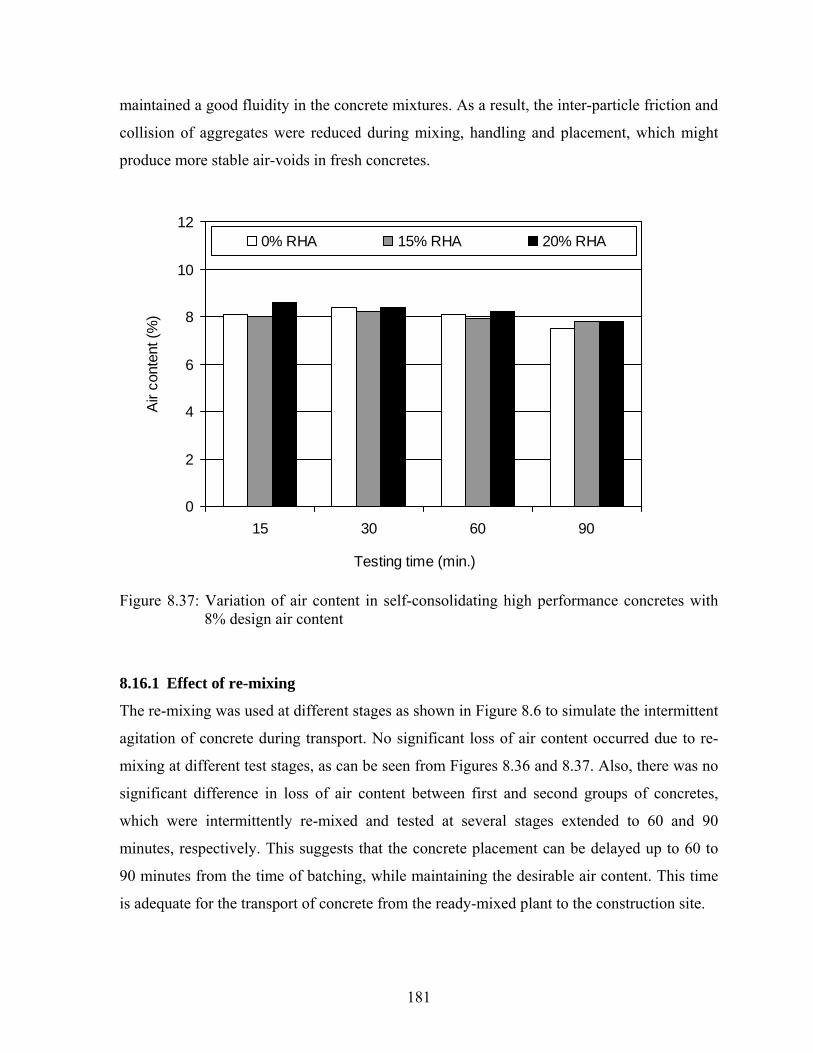
maintained a good fluidity in the concrete mixtures. As a result, the inter-particle friction and
collision of aggregates were reduced during mixing, handling and placement, which might
produce more stable air-voids in fresh concretes.
0
2
4
6
8
10
12
15 30 60 90
Testing time (min.)
Air
cont
ent (
%)
0% RHA 15% RHA 20% RHA
Figure 8.37: Variation of air content in self-consolidating high performance concretes with 8% design air content
8.16.1 Effect of re-mixing
The re-mixing was used at different stages as shown in Figure 8.6 to simulate the intermittent
agitation of concrete during transport. No significant loss of air content occurred due to re-
mixing at different test stages, as can be seen from Figures 8.36 and 8.37. Also, there was no
significant difference in loss of air content between first and second groups of concretes,
which were intermittently re-mixed and tested at several stages extended to 60 and 90
minutes, respectively. This suggests that the concrete placement can be delayed up to 60 to
90 minutes from the time of batching, while maintaining the desirable air content. This time
is adequate for the transport of concrete from the ready-mixed plant to the construction site.
181
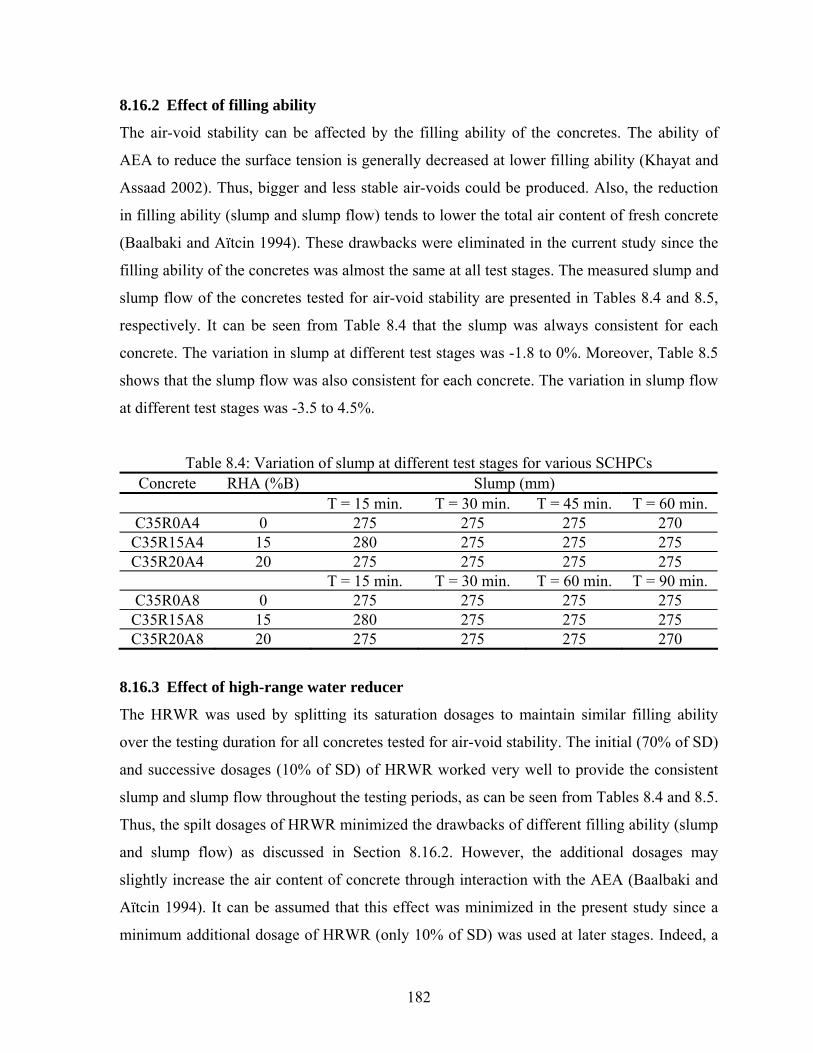
8.16.2 Effect of filling ability
The air-void stability can be affected by the filling ability of the concretes. The ability of
AEA to reduce the surface tension is generally decreased at lower filling ability (Khayat and
Assaad 2002). Thus, bigger and less stable air-voids could be produced. Also, the reduction
in filling ability (slump and slump flow) tends to lower the total air content of fresh concrete
(Baalbaki and Aïtcin 1994). These drawbacks were eliminated in the current study since the
filling ability of the concretes was almost the same at all test stages. The measured slump and
slump flow of the concretes tested for air-void stability are presented in Tables 8.4 and 8.5,
respectively. It can be seen from Table 8.4 that the slump was always consistent for each
concrete. The variation in slump at different test stages was -1.8 to 0%. Moreover, Table 8.5
shows that the slump flow was also consistent for each concrete. The variation in slump flow
at different test stages was -3.5 to 4.5%.
Table 8.4: Variation of slump at different test stages for various SCHPCs Concrete RHA (%B) Slump (mm)
T = 15 min. T = 30 min. T = 45 min. T = 60 min. C35R0A4 0 275 275 275 270 C35R15A4 15 280 275 275 275 C35R20A4 20 275 275 275 275
T = 15 min. T = 30 min. T = 60 min. T = 90 min. C35R0A8 0 275 275 275 275 C35R15A8 15 280 275 275 275 C35R20A8 20 275 275 275 270
8.16.3 Effect of high-range water reducer
The HRWR was used by splitting its saturation dosages to maintain similar filling ability
over the testing duration for all concretes tested for air-void stability. The initial (70% of SD)
and successive dosages (10% of SD) of HRWR worked very well to provide the consistent
slump and slump flow throughout the testing periods, as can be seen from Tables 8.4 and 8.5.
Thus, the spilt dosages of HRWR minimized the drawbacks of different filling ability (slump
and slump flow) as discussed in Section 8.16.2. However, the additional dosages may
slightly increase the air content of concrete through interaction with the AEA (Baalbaki and
Aïtcin 1994). It can be assumed that this effect was minimized in the present study since a
minimum additional dosage of HRWR (only 10% of SD) was used at later stages. Indeed, a
182
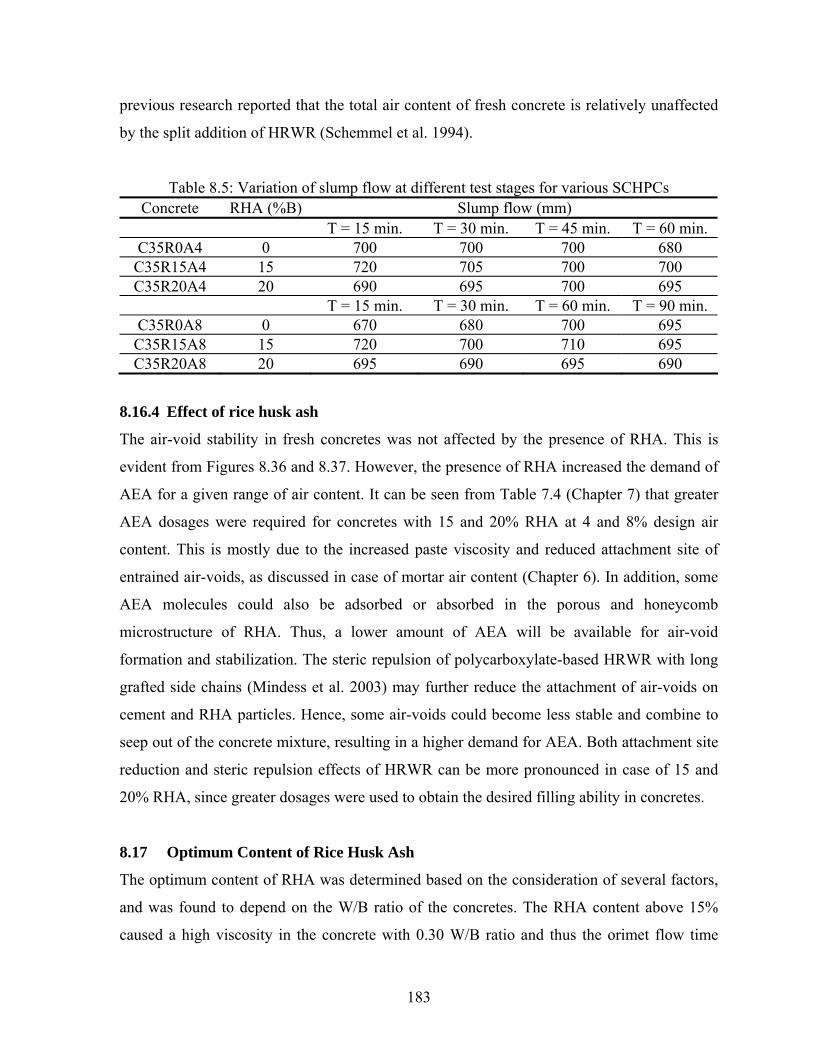
previous research reported that the total air content of fresh concrete is relatively unaffected
by the split addition of HRWR (Schemmel et al. 1994).
Table 8.5: Variation of slump flow at different test stages for various SCHPCs Concrete RHA (%B) Slump flow (mm)
T = 15 min. T = 30 min. T = 45 min. T = 60 min. C35R0A4 0 700 700 700 680 C35R15A4 15 720 705 700 700 C35R20A4 20 690 695 700 695
T = 15 min. T = 30 min. T = 60 min. T = 90 min. C35R0A8 0 670 680 700 695 C35R15A8 15 720 700 710 695 C35R20A8 20 695 690 695 690
8.16.4 Effect of rice husk ash
The air-void stability in fresh concretes was not affected by the presence of RHA. This is
evident from Figures 8.36 and 8.37. However, the presence of RHA increased the demand of
AEA for a given range of air content. It can be seen from Table 7.4 (Chapter 7) that greater
AEA dosages were required for concretes with 15 and 20% RHA at 4 and 8% design air
content. This is mostly due to the increased paste viscosity and reduced attachment site of
entrained air-voids, as discussed in case of mortar air content (Chapter 6). In addition, some
AEA molecules could also be adsorbed or absorbed in the porous and honeycomb
microstructure of RHA. Thus, a lower amount of AEA will be available for air-void
formation and stabilization. The steric repulsion of polycarboxylate-based HRWR with long
grafted side chains (Mindess et al. 2003) may further reduce the attachment of air-voids on
cement and RHA particles. Hence, some air-voids could become less stable and combine to
seep out of the concrete mixture, resulting in a higher demand for AEA. Both attachment site
reduction and steric repulsion effects of HRWR can be more pronounced in case of 15 and
20% RHA, since greater dosages were used to obtain the desired filling ability in concretes.
8.17 Optimum Content of Rice Husk Ash
The optimum content of RHA was determined based on the consideration of several factors,
and was found to depend on the W/B ratio of the concretes. The RHA content above 15%
caused a high viscosity in the concrete with 0.30 W/B ratio and thus the orimet flow time
183
exceeded the maximum acceptable criterion for filling ability. In contrast, the orimet flow
time was within the acceptable range when 20% RHA was used in concretes with 0.35 and
0.40 W/B ratios. However, the viscosity became higher for 25 and 30% RHA contents used
in concretes with 0.35 W/B ratio and therefore the orimet flow time also exceeded the
maximum acceptable criterion in these two cases. In addition, the RHA content greater than
15% required high dosages of HRWR to achieve the required filling ability and passing
ability, particularly at lower W/B ratios. In case of 20 to 30% RHA, the HRWR dosages
required were much higher than the maximum dosage recommended by the manufacturer. A
high dosage of HRWR may cause concrete setting problem and thus could delay the
hydration process. Handling and mixing difficulties were also experienced for the concretes
including a RHA content greater than 15%. Nevertheless, obtaining the required filling
ability, passing ability and air content was not problematic in the presence of 15% RHA.
Moreover, no adverse effect on the air-void stability in fresh concrete was observed for 15%
RHA. The overall test results suggest that 15% RHA can be selected as the optimum content
for use in SCHPC.
8.18 Conclusions
a. The slump flow, inverted slump cone flow spread, and orimet flow spread with and
without J-ring increased at lower W/B ratio and higher RHA content due to the increased
paste volume of concrete.
b. The dosages of HRWR required to achieve adequate filling ability and passing ability
increased with lower W/B ratio and higher RHA content mostly due to the increased
content and surface area of the binder.
c. The filling ability and passing ability criteria were fulfilled for all SCHPCs except few
concretes with a lower W/B ratio and a RHA content greater than 15 and 20% that
exhibited high viscosity mostly due to the excessive surface area of rice husk ash.
d. The orimet and inverted slump cone flow times increased with lower W/B ratio and
higher RHA content, and thus indicated the increased viscosity of concrete. This is
greatly attributed to the increased volume fraction and surface area of the binder used in
concrete.
184
e. The filling ability model is applicable to various air-entrained and non-air-entrained
SCHPC mixtures containing a paste volume in the range of 0.29 to 0.40 m3/m3, and
providing a slump flow between 550 and 850 mm.
f. The filling ability model provided the slump flows close to the measured slump flow
values. The computed and measured slump flows were within ±7.6% error.
g. Strong correlations were observed for the flow times of all pastes and concretes. The
mortar flow spread was also well correlated with the slump flow of concrete in the
absence of RHA. Strong correlations were also seen for various filling ability and
passing ability properties of concrete.
h. The inverted slump cone apparatus can be used in laboratory and field comfortably by a
single operator with and without J-ring to assess the filling ability and passing ability of
SCHPC based on the performance criteria derived.
i. The air-void stability in various SCHPC mixtures was not affected by the presence of
RHA and re-mixing, as the maximum loss of air content over the period of 60 to 90
minutes remained less than 1%.
j. The unit weight of concrete slightly increased at lower W/B ratio due to greater binder
content. The unit weight of concrete also increased with lower air content due to
increased aggregate quantity and reduced void content. Conversely, the unit weight
marginally decreased with higher RHA content due to the increased paste volume.
k. The measured air contents were within ±1.0% of the design air contents. The dosages of
AEA for achieving a given air content increased with lower W/B ratio and greater RHA
content mostly due to higher plastic viscosity of the concretes.
l. The estimated and actual AEA dosages for different SCHPC mixtures were well-
correlated. Hence, the AEA dosage needed for a concrete air content can be fixed based
on the AEA dosage used for the equivalent mortar air content.
m. The optimum RHA content was 15% based on the results of filling ability and passing
ability properties at lower W/B ratios of 0.30 and 0.35. It was dependent of the W/B ratio
used in concrete. An increased optimum content can be obtained at higher W/B ratios.
185
Chapter 9
Properties of Hardened Self-consolidating High Performance
Concretes
9.1 General
The preparation of hardened test specimens, the test procedures, and the test results for
various hardened properties of self-consolidating high performance concretes (SCHPCs) are
presented in this chapter. The effects of water-binder (W/B) ratio, rice husk ash (RHA) and
air content are discussed, and the correlations among different hardened properties are
shown. This chapter also presents a model for the compressive strength of concretes, and
discusses it validity and application.
9.2 Research Significance
The cost-effective SCHPCs with good hardened properties and durability are desirable in
construction industry. The SCHPCs have been produced using several supplementary
cementing materials (SCMs) such as silica fume, ground granulated blast-furnace slag, and
fly ash. However, silica fume is an expensive SCM. Presently, slag and fly ash are also sold
in North America as a commercial commodity. In developing countries, the use of SCM such
as silica fume may be cost-prohibitive. Therefore, it is important to use an alternative less
expensive SCM such as RHA to produce cost-effective SCHPC. Like silica fume, RHA
offers similar benefits with regard to hardened properties and durability of concrete. This
study incorporated RHA in various SCHPCs as an SCM. The performance of RHA was
investigated with respect to several hardened properties. Both destructive and non-destructive
tests were performed to obtain key hardened properties of different SCHPCs and an
empirical model for compressive strength was developed. Some of the properties tested were
indicative of concrete durability. The test results obtained for the hardened properties of the
concretes can be beneficial to the construction industry regarding the use of RHA in SCHPC.
Also, the strength model will be useful for the mixture design of SCHPC.
186
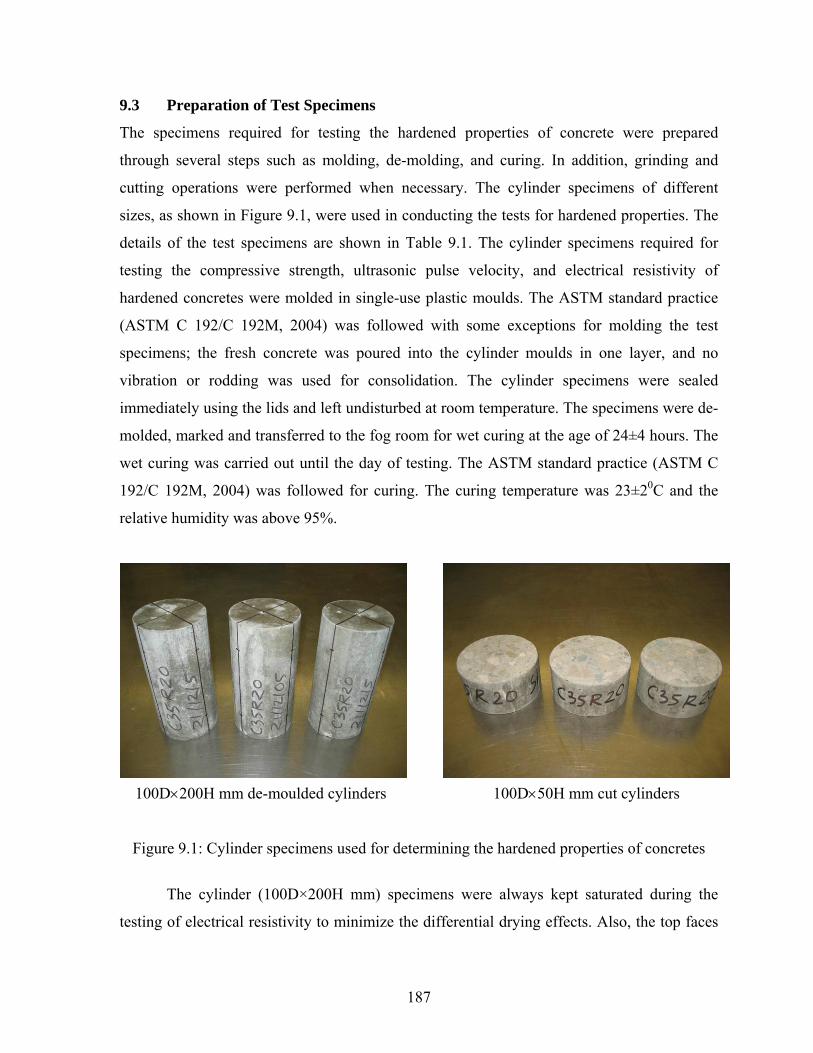
9.3 Preparation of Test Specimens
The specimens required for testing the hardened properties of concrete were prepared
through several steps such as molding, de-molding, and curing. In addition, grinding and
cutting operations were performed when necessary. The cylinder specimens of different
sizes, as shown in Figure 9.1, were used in conducting the tests for hardened properties. The
details of the test specimens are shown in Table 9.1. The cylinder specimens required for
testing the compressive strength, ultrasonic pulse velocity, and electrical resistivity of
hardened concretes were molded in single-use plastic moulds. The ASTM standard practice
(ASTM C 192/C 192M, 2004) was followed with some exceptions for molding the test
specimens; the fresh concrete was poured into the cylinder moulds in one layer, and no
vibration or rodding was used for consolidation. The cylinder specimens were sealed
immediately using the lids and left undisturbed at room temperature. The specimens were de-
molded, marked and transferred to the fog room for wet curing at the age of 24±4 hours. The
wet curing was carried out until the day of testing. The ASTM standard practice (ASTM C
192/C 192M, 2004) was followed for curing. The curing temperature was 23±20C and the
relative humidity was above 95%.
100D×200H mm de-moulded cylinders 100D×50H mm cut cylinders
Figure 9.1: Cylinder specimens used for determining the hardened properties of concretes
The cylinder (100D×200H mm) specimens were always kept saturated during the
testing of electrical resistivity to minimize the differential drying effects. Also, the top faces
187
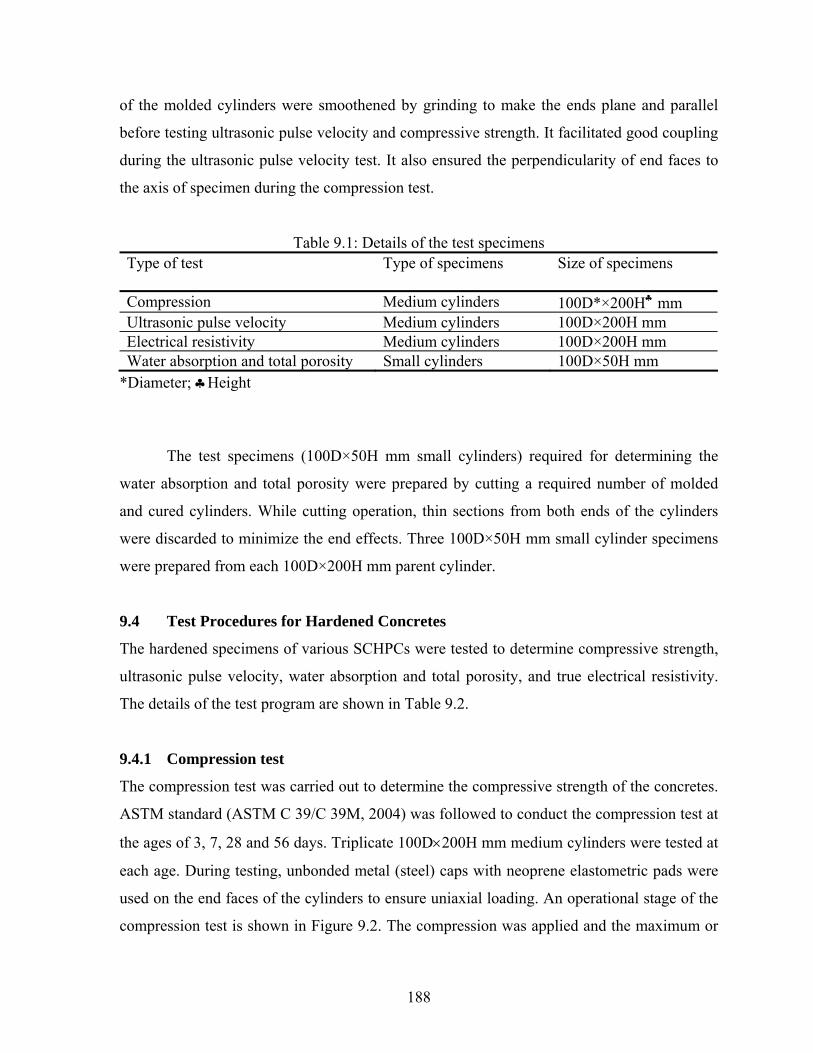
of the molded cylinders were smoothened by grinding to make the ends plane and parallel
before testing ultrasonic pulse velocity and compressive strength. It facilitated good coupling
during the ultrasonic pulse velocity test. It also ensured the perpendicularity of end faces to
the axis of specimen during the compression test.
Table 9.1: Details of the test specimens Type of test Type of specimens Size of specimens
Compression Medium cylinders 100D*×200H♣ mm Ultrasonic pulse velocity Medium cylinders 100D×200H mm Electrical resistivity Medium cylinders 100D×200H mm Water absorption and total porosity Small cylinders 100D×50H mm
*Diameter; ♣Height
The test specimens (100D×50H mm small cylinders) required for determining the
water absorption and total porosity were prepared by cutting a required number of molded
and cured cylinders. While cutting operation, thin sections from both ends of the cylinders
were discarded to minimize the end effects. Three 100D×50H mm small cylinder specimens
were prepared from each 100D×200H mm parent cylinder.
9.4 Test Procedures for Hardened Concretes
The hardened specimens of various SCHPCs were tested to determine compressive strength,
ultrasonic pulse velocity, water absorption and total porosity, and true electrical resistivity.
The details of the test program are shown in Table 9.2.
9.4.1 Compression test
The compression test was carried out to determine the compressive strength of the concretes.
ASTM standard (ASTM C 39/C 39M, 2004) was followed to conduct the compression test at
the ages of 3, 7, 28 and 56 days. Triplicate 100D×200H mm medium cylinders were tested at
each age. During testing, unbonded metal (steel) caps with neoprene elastometric pads were
used on the end faces of the cylinders to ensure uniaxial loading. An operational stage of the
compression test is shown in Figure 9.2. The compression was applied and the maximum or
188
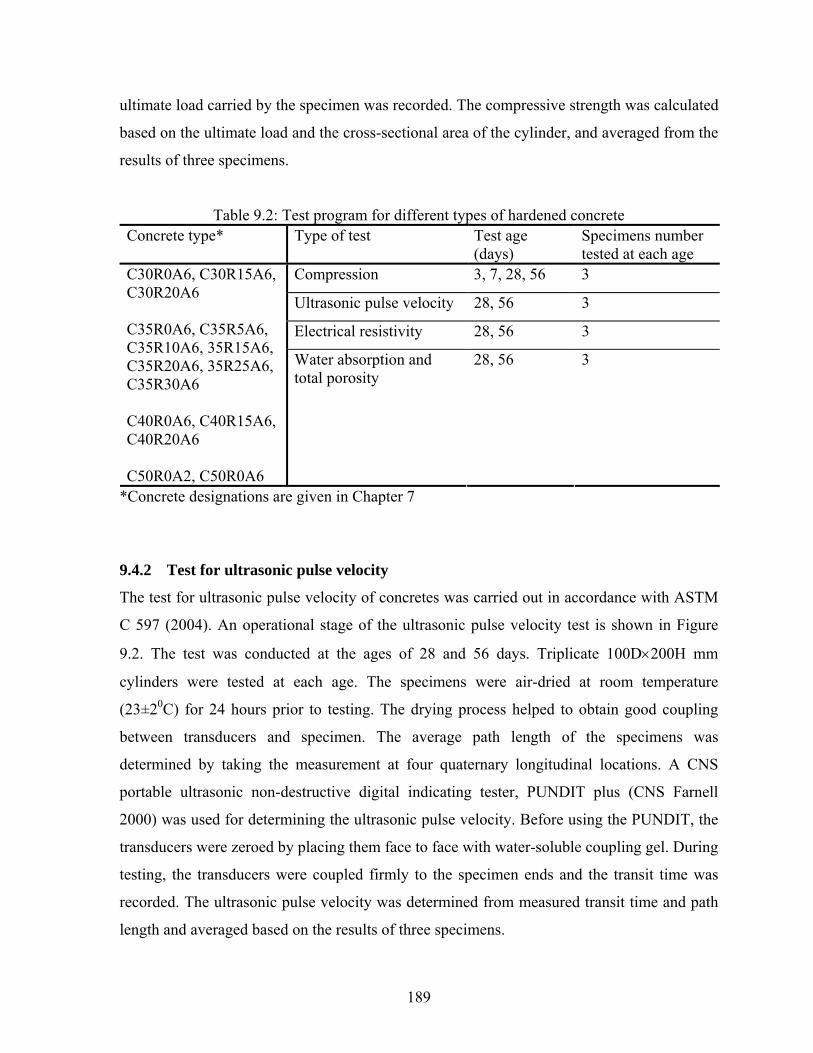
ultimate load carried by the specimen was recorded. The compressive strength was calculated
based on the ultimate load and the cross-sectional area of the cylinder, and averaged from the
results of three specimens.
Table 9.2: Test program for different types of hardened concrete Concrete type* Type of test Test age
(days) Specimens number tested at each age
Compression 3, 7, 28, 56 3
Ultrasonic pulse velocity 28, 56 3
Electrical resistivity 28, 56 3
C30R0A6, C30R15A6, C30R20A6 C35R0A6, C35R5A6, C35R10A6, 35R15A6, C35R20A6, 35R25A6, C35R30A6 C40R0A6, C40R15A6, C40R20A6 C50R0A2, C50R0A6
Water absorption and total porosity
28, 56 3
*Concrete designations are given in Chapter 7
9.4.2 Test for ultrasonic pulse velocity
The test for ultrasonic pulse velocity of concretes was carried out in accordance with ASTM
C 597 (2004). An operational stage of the ultrasonic pulse velocity test is shown in Figure
9.2. The test was conducted at the ages of 28 and 56 days. Triplicate 100D×200H mm
cylinders were tested at each age. The specimens were air-dried at room temperature
(23±20C) for 24 hours prior to testing. The drying process helped to obtain good coupling
between transducers and specimen. The average path length of the specimens was
determined by taking the measurement at four quaternary longitudinal locations. A CNS
portable ultrasonic non-destructive digital indicating tester, PUNDIT plus (CNS Farnell
2000) was used for determining the ultrasonic pulse velocity. Before using the PUNDIT, the
transducers were zeroed by placing them face to face with water-soluble coupling gel. During
testing, the transducers were coupled firmly to the specimen ends and the transit time was
recorded. The ultrasonic pulse velocity was determined from measured transit time and path
length and averaged based on the results of three specimens.
189
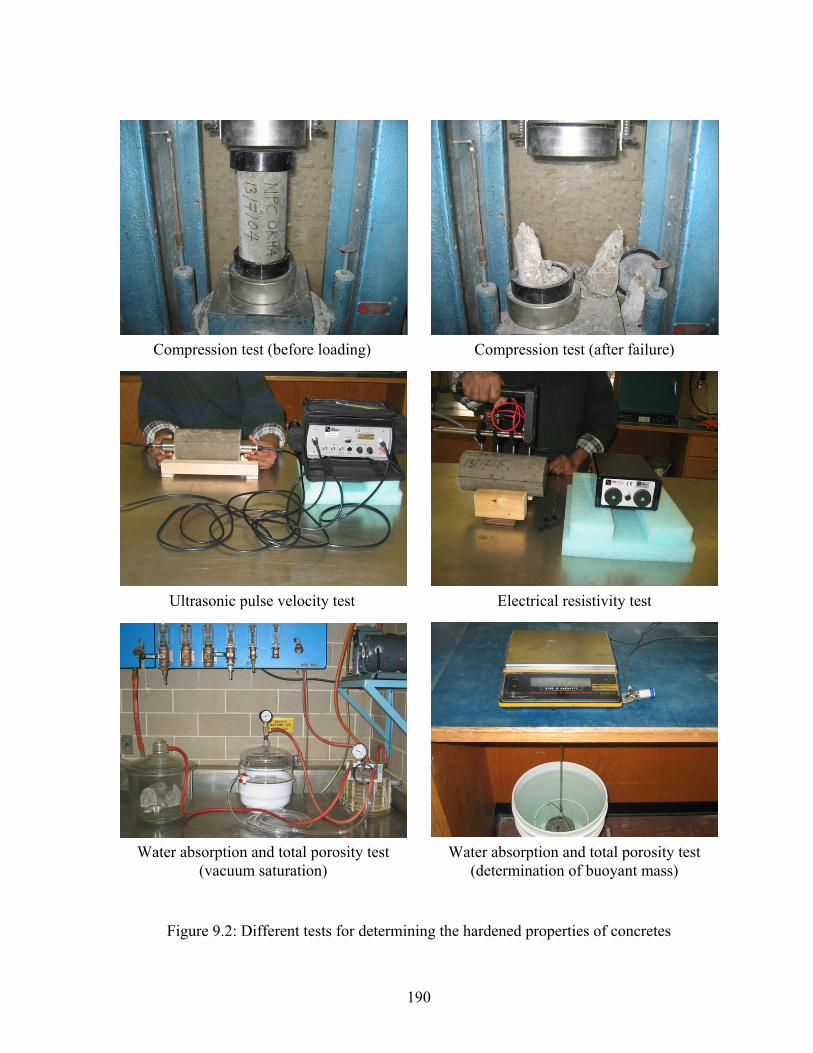
Compression test (before loading) Compression test (after failure)
Ultrasonic pulse velocity test Electrical resistivity test
Water absorption and total porosity test (vacuum saturation)
Water absorption and total porosity test (determination of buoyant mass)
Figure 9.2: Different tests for determining the hardened properties of concretes
190
9.4.3 Test for electrical resistivity
The electrical resistivity test for concretes was carried out by the four-point Wenner array
probe technique. The Florida test method FM 5-578 was followed for determining the
resistivity of various concretes (Florida Department of Transportation 2004). A CNS RM
MKII concrete resistivity meter (CNS Farnell 2004) was used to measure the surface
resistivity at the ages of 28 and 56 days. The probe array spacing used was 40 mm. An
operational stage of the electrical resistivity test is shown in Figure 9.2. Triplicate
100D×200H mm saturated cylinders were used at each test age. The resistivity measurements
were taken at four quaternary longitudinal locations of the specimen, and repeated once for
each location to obtain 8 readings per specimen. Hence, 24 resistivity readings were obtained
in total for three specimens. These readings were averaged to get the electrical resistivity of
the concrete. The resistivity obtained was the apparent electrical resistivity of concrete.
Therefore, a correction factor was applied to obtain the true electrical resistivity. The
correction factor was determined based on the procedure described by Morris et al. (1996).
The true electrical resistivity of the concretes was determined by dividing the apparent
resistivity with the correction factor.
9.4.4 Test for water absorption and total porosity
A test method based on the vacuum saturation technique was employed to determine the
water absorption and total porosity of the concretes from saturated, suspended and oven-dry
masses of the specimens. A schematic of the vacuum saturation technique is shown in Figure
9.3. The 100D×50H mm cylinder specimens were vacuum saturated at the ages of 28 and 56
days. Triplicate specimens were used at each testing age. The specimens were placed in a
vacuum pycnometer with both end faces being exposed. There was a movable air-tight collar
attached to the lid of this pycnometer. The collar was used to connect or disconnect the
vacuum and water lines with the pycnometer holding test specimens. Cool tap water was
poured in another vacuum pycnometer. Both pycnometers were covered by the lid and sealed
using vacuum grease. The pycnometers were then connected to a vacuum pump through a
water trap by means of a vacuum line connector. A pressure gage was attached to the vacuum
line connector. Another pressure gage was attached to the vacuum pycnometer holding water
to ensure the required vacuum pressure. The vacuum pump was started and run for 3 hours at
191
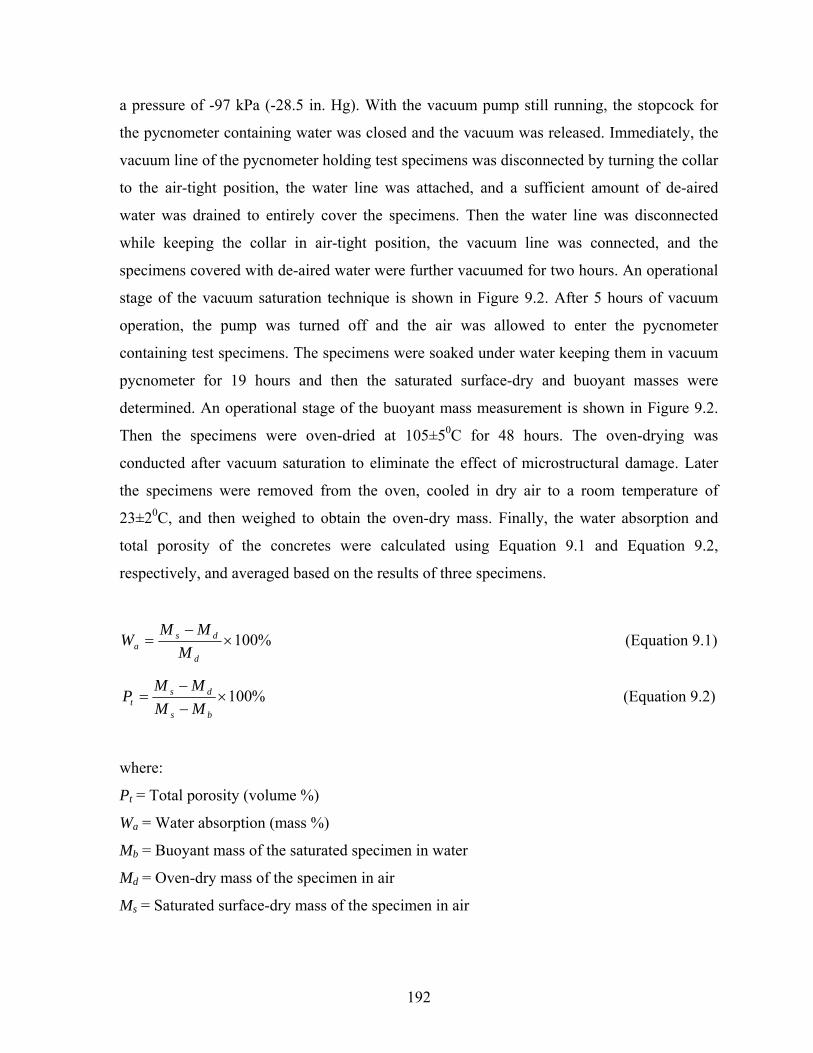
a pressure of -97 kPa (-28.5 in. Hg). With the vacuum pump still running, the stopcock for
the pycnometer containing water was closed and the vacuum was released. Immediately, the
vacuum line of the pycnometer holding test specimens was disconnected by turning the collar
to the air-tight position, the water line was attached, and a sufficient amount of de-aired
water was drained to entirely cover the specimens. Then the water line was disconnected
while keeping the collar in air-tight position, the vacuum line was connected, and the
specimens covered with de-aired water were further vacuumed for two hours. An operational
stage of the vacuum saturation technique is shown in Figure 9.2. After 5 hours of vacuum
operation, the pump was turned off and the air was allowed to enter the pycnometer
containing test specimens. The specimens were soaked under water keeping them in vacuum
pycnometer for 19 hours and then the saturated surface-dry and buoyant masses were
determined. An operational stage of the buoyant mass measurement is shown in Figure 9.2.
Then the specimens were oven-dried at 105±50C for 48 hours. The oven-drying was
conducted after vacuum saturation to eliminate the effect of microstructural damage. Later
the specimens were removed from the oven, cooled in dry air to a room temperature of
23±20C, and then weighed to obtain the oven-dry mass. Finally, the water absorption and
total porosity of the concretes were calculated using Equation 9.1 and Equation 9.2,
respectively, and averaged based on the results of three specimens.
%100×−
=d
dsa M
MMW (Equation 9.1)
%100×−−
=bs
dst MM
MMP (Equation 9.2)
where:
Pt = Total porosity (volume %)
Wa = Water absorption (mass %)
Mb = Buoyant mass of the saturated specimen in water
Md = Oven-dry mass of the specimen in air
Ms = Saturated surface-dry mass of the specimen in air
192
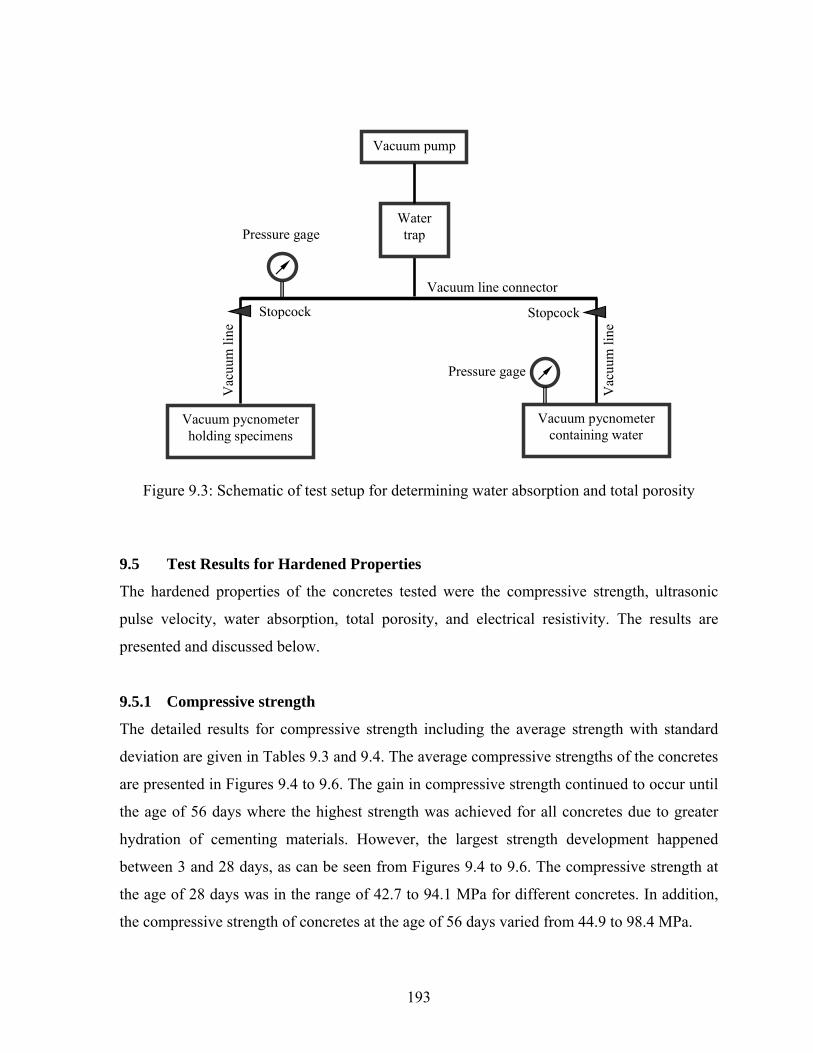
Vacuum pycnometer holding specimens
Vacuum pump
Pressure gage
Vacuum line connector
Stopcock Stopcock
Vac
uum
line
Vac
uum
line
Water trap
Vacuum pycnometer containing water
Pressure gage
Figure 9.3: Schematic of test setup for determining water absorption and total porosity
9.5 Test Results for Hardened Properties
The hardened properties of the concretes tested were the compressive strength, ultrasonic
pulse velocity, water absorption, total porosity, and electrical resistivity. The results are
presented and discussed below.
9.5.1 Compressive strength
The detailed results for compressive strength including the average strength with standard
deviation are given in Tables 9.3 and 9.4. The average compressive strengths of the concretes
are presented in Figures 9.4 to 9.6. The gain in compressive strength continued to occur until
the age of 56 days where the highest strength was achieved for all concretes due to greater
hydration of cementing materials. However, the largest strength development happened
between 3 and 28 days, as can be seen from Figures 9.4 to 9.6. The compressive strength at
the age of 28 days was in the range of 42.7 to 94.1 MPa for different concretes. In addition,
the compressive strength of concretes at the age of 56 days varied from 44.9 to 98.4 MPa.
193
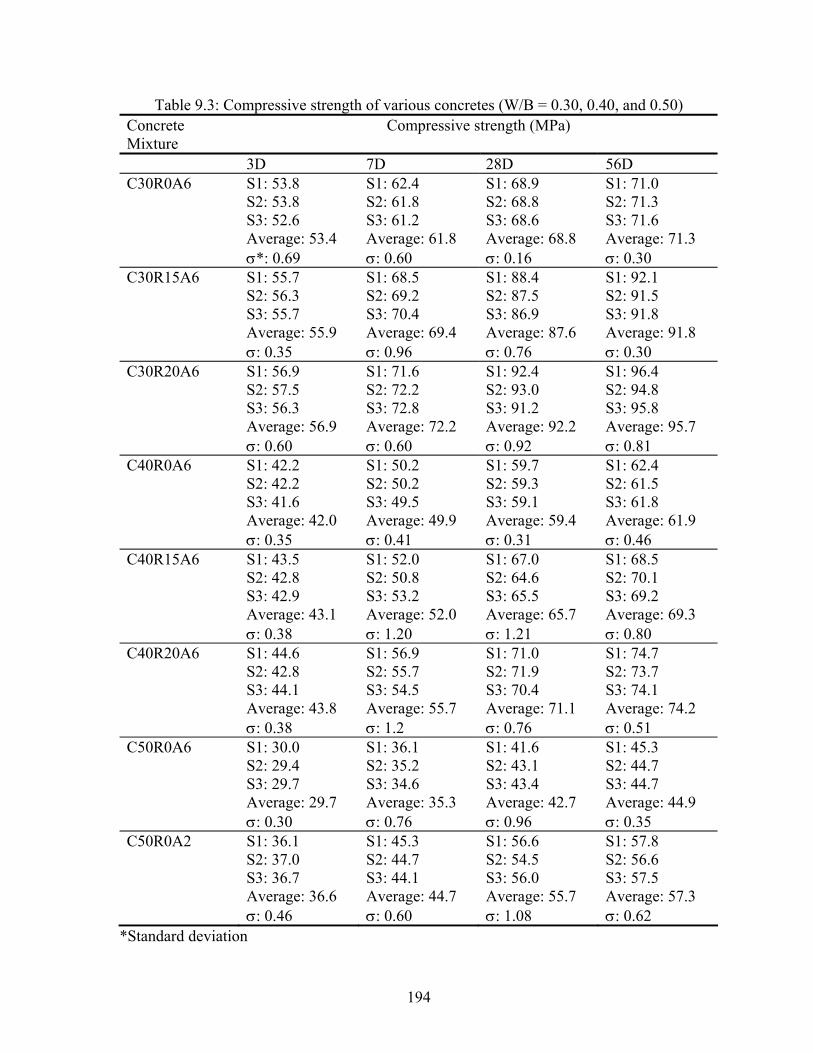
Table 9.3: Compressive strength of various concretes (W/B = 0.30, 0.40, and 0.50) Concrete Mixture
Compressive strength (MPa)
3D 7D 28D 56D C30R0A6 S1: 53.8
S2: 53.8 S3: 52.6 Average: 53.4 σ*: 0.69
S1: 62.4 S2: 61.8 S3: 61.2 Average: 61.8 σ: 0.60
S1: 68.9 S2: 68.8 S3: 68.6 Average: 68.8 σ: 0.16
S1: 71.0 S2: 71.3 S3: 71.6 Average: 71.3 σ: 0.30
C30R15A6 S1: 55.7 S2: 56.3 S3: 55.7 Average: 55.9 σ: 0.35
S1: 68.5 S2: 69.2 S3: 70.4 Average: 69.4 σ: 0.96
S1: 88.4 S2: 87.5 S3: 86.9 Average: 87.6 σ: 0.76
S1: 92.1 S2: 91.5 S3: 91.8 Average: 91.8 σ: 0.30
C30R20A6 S1: 56.9 S2: 57.5 S3: 56.3 Average: 56.9 σ: 0.60
S1: 71.6 S2: 72.2 S3: 72.8 Average: 72.2 σ: 0.60
S1: 92.4 S2: 93.0 S3: 91.2 Average: 92.2 σ: 0.92
S1: 96.4 S2: 94.8 S3: 95.8 Average: 95.7 σ: 0.81
C40R0A6 S1: 42.2 S2: 42.2 S3: 41.6 Average: 42.0 σ: 0.35
S1: 50.2 S2: 50.2 S3: 49.5 Average: 49.9 σ: 0.41
S1: 59.7 S2: 59.3 S3: 59.1 Average: 59.4 σ: 0.31
S1: 62.4 S2: 61.5 S3: 61.8 Average: 61.9 σ: 0.46
C40R15A6 S1: 43.5 S2: 42.8 S3: 42.9 Average: 43.1 σ: 0.38
S1: 52.0 S2: 50.8 S3: 53.2 Average: 52.0 σ: 1.20
S1: 67.0 S2: 64.6 S3: 65.5 Average: 65.7 σ: 1.21
S1: 68.5 S2: 70.1 S3: 69.2 Average: 69.3 σ: 0.80
C40R20A6 S1: 44.6 S2: 42.8 S3: 44.1 Average: 43.8 σ: 0.38
S1: 56.9 S2: 55.7 S3: 54.5 Average: 55.7 σ: 1.2
S1: 71.0 S2: 71.9 S3: 70.4 Average: 71.1 σ: 0.76
S1: 74.7 S2: 73.7 S3: 74.1 Average: 74.2 σ: 0.51
C50R0A6 S1: 30.0 S2: 29.4 S3: 29.7 Average: 29.7 σ: 0.30
S1: 36.1 S2: 35.2 S3: 34.6 Average: 35.3 σ: 0.76
S1: 41.6 S2: 43.1 S3: 43.4 Average: 42.7 σ: 0.96
S1: 45.3 S2: 44.7 S3: 44.7 Average: 44.9 σ: 0.35
C50R0A2 S1: 36.1 S2: 37.0 S3: 36.7 Average: 36.6 σ: 0.46
S1: 45.3 S2: 44.7 S3: 44.1 Average: 44.7 σ: 0.60
S1: 56.6 S2: 54.5 S3: 56.0 Average: 55.7 σ: 1.08
S1: 57.8 S2: 56.6 S3: 57.5 Average: 57.3 σ: 0.62
*Standard deviation
194
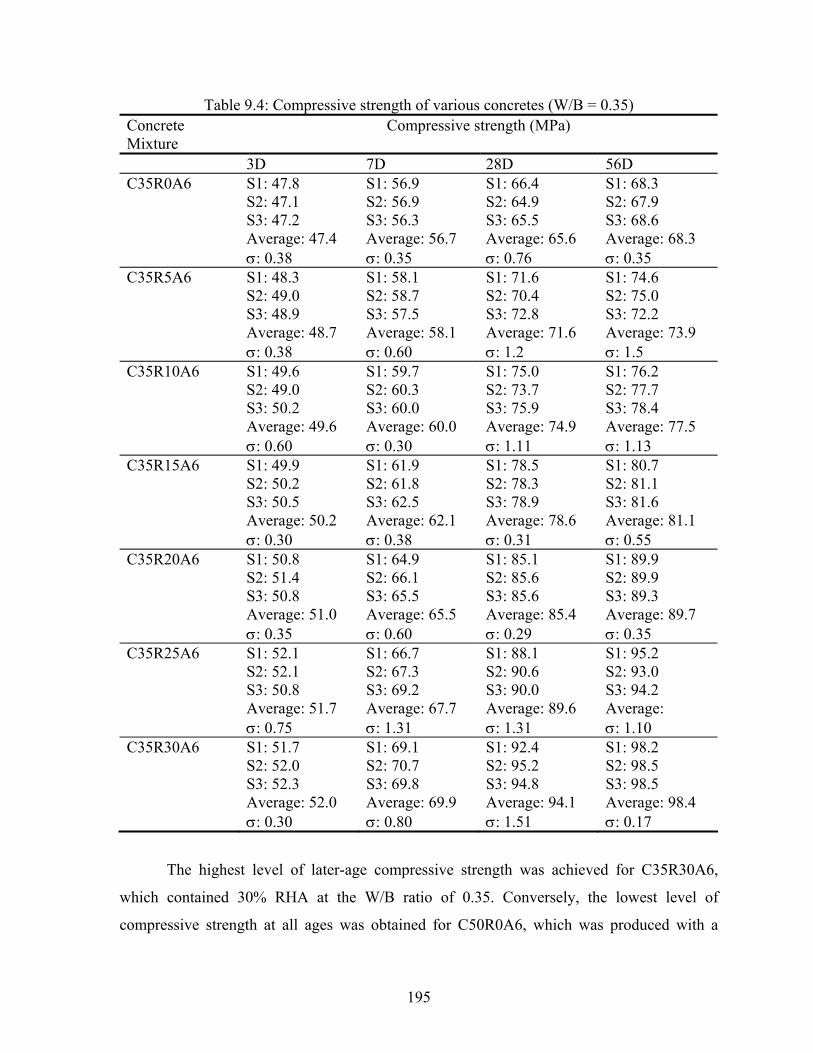
Table 9.4: Compressive strength of various concretes (W/B = 0.35) Concrete Mixture
Compressive strength (MPa)
3D 7D 28D 56D C35R0A6 S1: 47.8
S2: 47.1 S3: 47.2 Average: 47.4 σ: 0.38
S1: 56.9 S2: 56.9 S3: 56.3 Average: 56.7 σ: 0.35
S1: 66.4 S2: 64.9 S3: 65.5 Average: 65.6 σ: 0.76
S1: 68.3 S2: 67.9 S3: 68.6 Average: 68.3 σ: 0.35
C35R5A6 S1: 48.3 S2: 49.0 S3: 48.9 Average: 48.7 σ: 0.38
S1: 58.1 S2: 58.7 S3: 57.5 Average: 58.1 σ: 0.60
S1: 71.6 S2: 70.4 S3: 72.8 Average: 71.6 σ: 1.2
S1: 74.6 S2: 75.0 S3: 72.2 Average: 73.9 σ: 1.5
C35R10A6 S1: 49.6 S2: 49.0 S3: 50.2 Average: 49.6 σ: 0.60
S1: 59.7 S2: 60.3 S3: 60.0 Average: 60.0 σ: 0.30
S1: 75.0 S2: 73.7 S3: 75.9 Average: 74.9 σ: 1.11
S1: 76.2 S2: 77.7 S3: 78.4 Average: 77.5 σ: 1.13
C35R15A6 S1: 49.9 S2: 50.2 S3: 50.5 Average: 50.2 σ: 0.30
S1: 61.9 S2: 61.8 S3: 62.5 Average: 62.1 σ: 0.38
S1: 78.5 S2: 78.3 S3: 78.9 Average: 78.6 σ: 0.31
S1: 80.7 S2: 81.1 S3: 81.6 Average: 81.1 σ: 0.55
C35R20A6 S1: 50.8 S2: 51.4 S3: 50.8 Average: 51.0 σ: 0.35
S1: 64.9 S2: 66.1 S3: 65.5 Average: 65.5 σ: 0.60
S1: 85.1 S2: 85.6 S3: 85.6 Average: 85.4 σ: 0.29
S1: 89.9 S2: 89.9 S3: 89.3 Average: 89.7 σ: 0.35
C35R25A6 S1: 52.1 S2: 52.1 S3: 50.8 Average: 51.7 σ: 0.75
S1: 66.7 S2: 67.3 S3: 69.2 Average: 67.7 σ: 1.31
S1: 88.1 S2: 90.6 S3: 90.0 Average: 89.6 σ: 1.31
S1: 95.2 S2: 93.0 S3: 94.2 Average: σ: 1.10
C35R30A6 S1: 51.7 S2: 52.0 S3: 52.3 Average: 52.0 σ: 0.30
S1: 69.1 S2: 70.7 S3: 69.8 Average: 69.9 σ: 0.80
S1: 92.4 S2: 95.2 S3: 94.8 Average: 94.1 σ: 1.51
S1: 98.2 S2: 98.5 S3: 98.5 Average: 98.4 σ: 0.17
The highest level of later-age compressive strength was achieved for C35R30A6,
which contained 30% RHA at the W/B ratio of 0.35. Conversely, the lowest level of
compressive strength at all ages was obtained for C50R0A6, which was produced with a
195
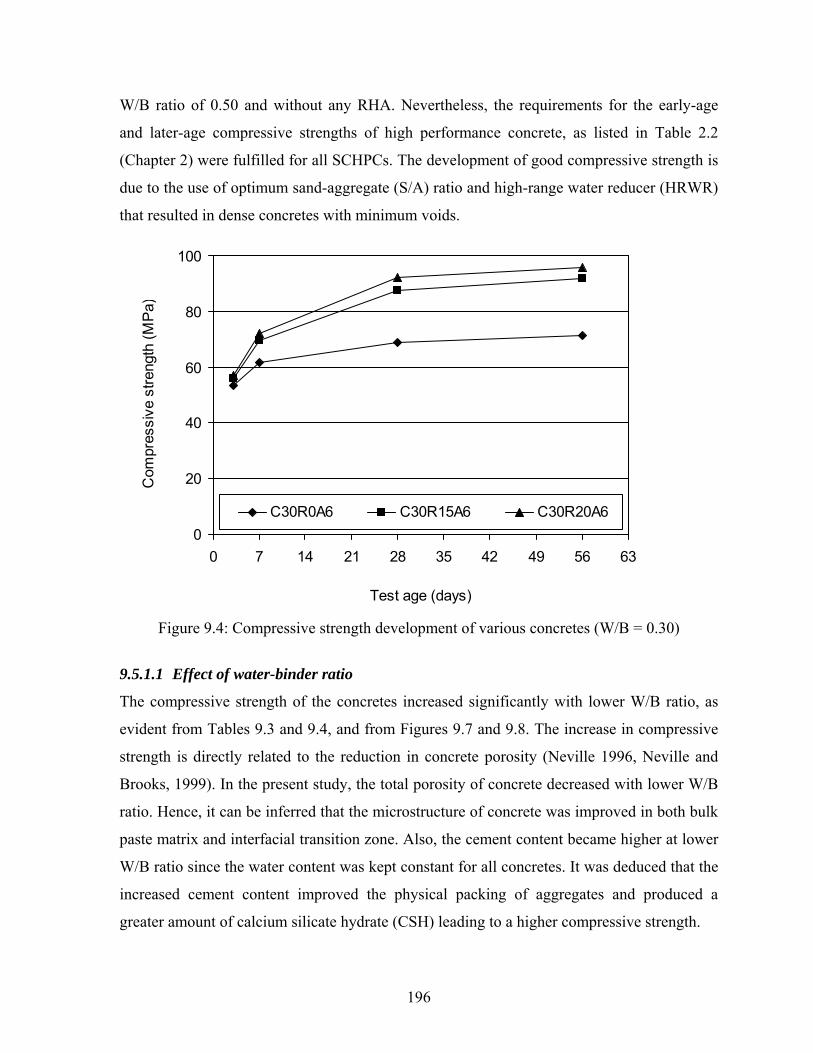
W/B ratio of 0.50 and without any RHA. Nevertheless, the requirements for the early-age
and later-age compressive strengths of high performance concrete, as listed in Table 2.2
(Chapter 2) were fulfilled for all SCHPCs. The development of good compressive strength is
due to the use of optimum sand-aggregate (S/A) ratio and high-range water reducer (HRWR)
that resulted in dense concretes with minimum voids.
0
20
40
60
80
100
0 7 14 21 28 35 42 49 56 63
Test age (days)
Com
pres
sive
stre
ngth
(MP
a)
C30R0A6 C30R15A6 C30R20A6
Figure 9.4: Compressive strength development of various concretes (W/B = 0.30)
9.5.1.1 Effect of water-binder ratio
The compressive strength of the concretes increased significantly with lower W/B ratio, as
evident from Tables 9.3 and 9.4, and from Figures 9.7 and 9.8. The increase in compressive
strength is directly related to the reduction in concrete porosity (Neville 1996, Neville and
Brooks, 1999). In the present study, the total porosity of concrete decreased with lower W/B
ratio. Hence, it can be inferred that the microstructure of concrete was improved in both bulk
paste matrix and interfacial transition zone. Also, the cement content became higher at lower
W/B ratio since the water content was kept constant for all concretes. It was deduced that the
increased cement content improved the physical packing of aggregates and produced a
greater amount of calcium silicate hydrate (CSH) leading to a higher compressive strength.
196
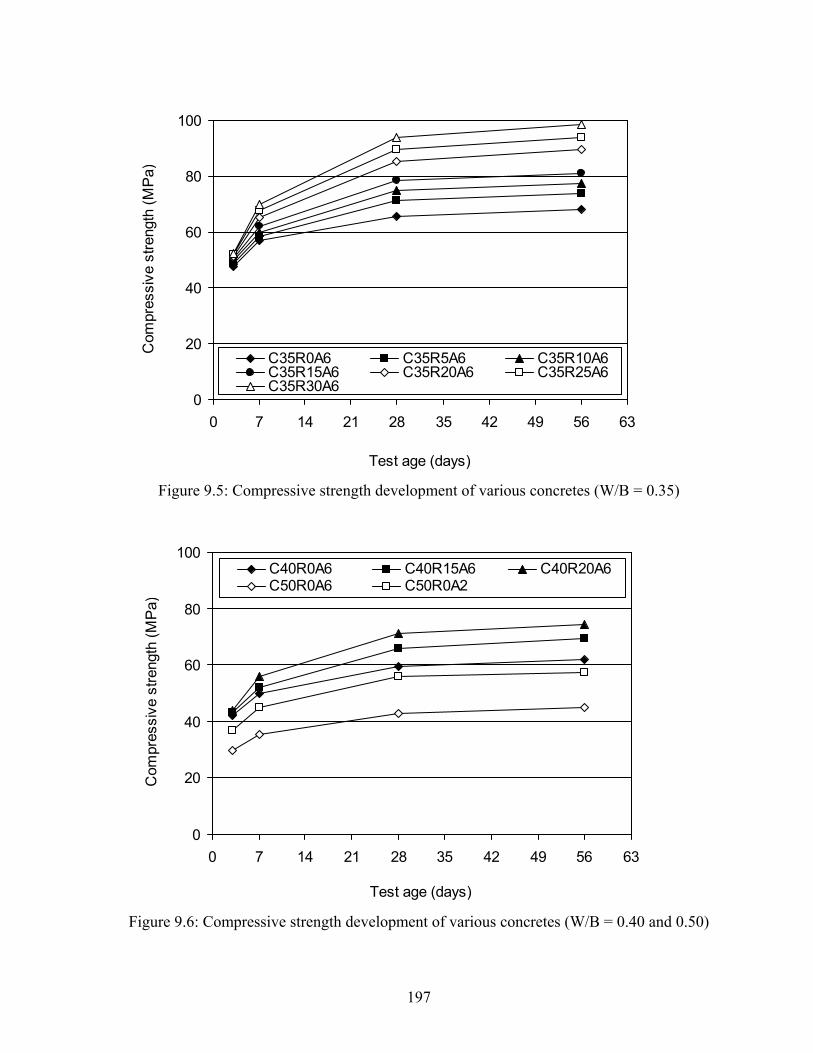
0
20
40
60
80
100
0 7 14 21 28 35 42 49 56 63
Test age (days)
Com
pres
sive
stre
ngth
(MP
a)
C35R0A6 C35R5A6 C35R10A6C35R15A6 C35R20A6 C35R25A6C35R30A6
Figure 9.5: Compressive strength development of various concretes (W/B = 0.35)
0
20
40
60
80
100
0 7 14 21 28 35 42 49 56 63
Test age (days)
Com
pres
sive
stre
ngth
(MP
a)
C40R0A6 C40R15A6 C40R20A6C50R0A6 C50R0A2
Figure 9.6: Compressive strength development of various concretes (W/B = 0.40 and 0.50)
197
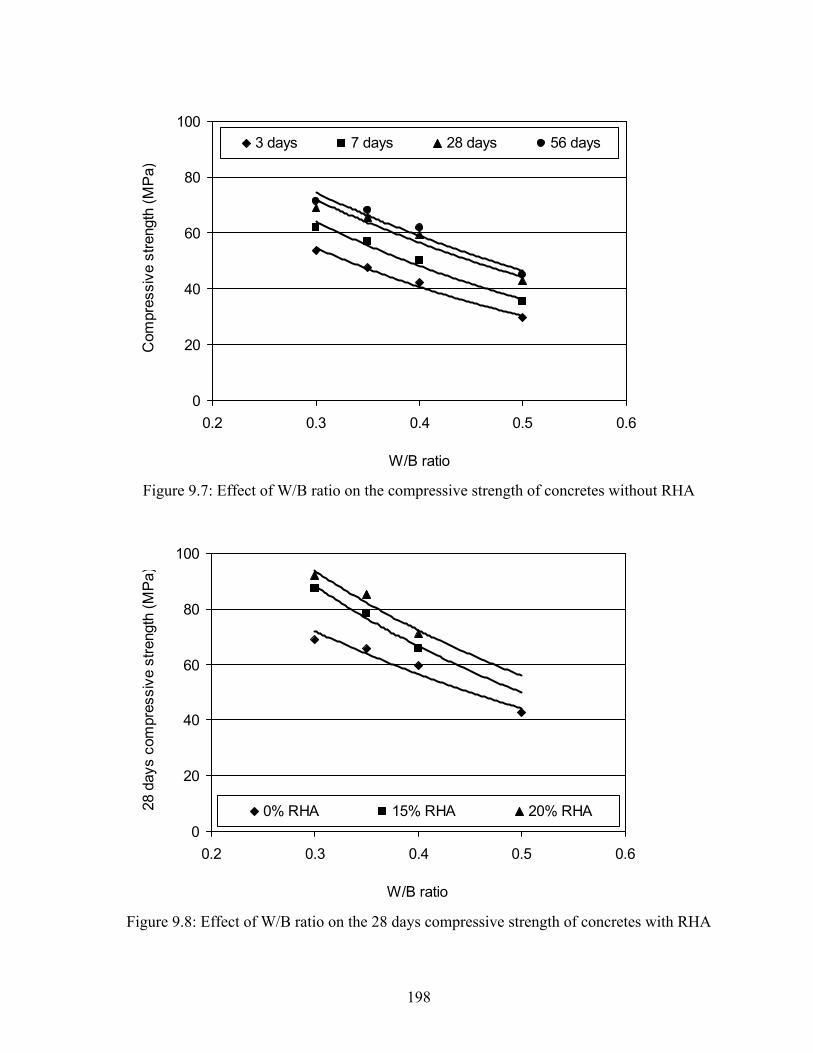
0
20
40
60
80
100
0.2 0.3 0.4 0.5 0.6
W/B ratio
Com
pres
sive
stre
ngth
(MP
a)3 days 7 days 28 days 56 days
Figure 9.7: Effect of W/B ratio on the compressive strength of concretes without RHA
0
20
40
60
80
100
0.2 0.3 0.4 0.5 0.6
W/B ratio
28 d
ays
com
pres
sive
stre
ngth
(MP
a)
0% RHA 15% RHA 20% RHA
Figure 9.8: Effect of W/B ratio on the 28 days compressive strength of concretes with RHA
198
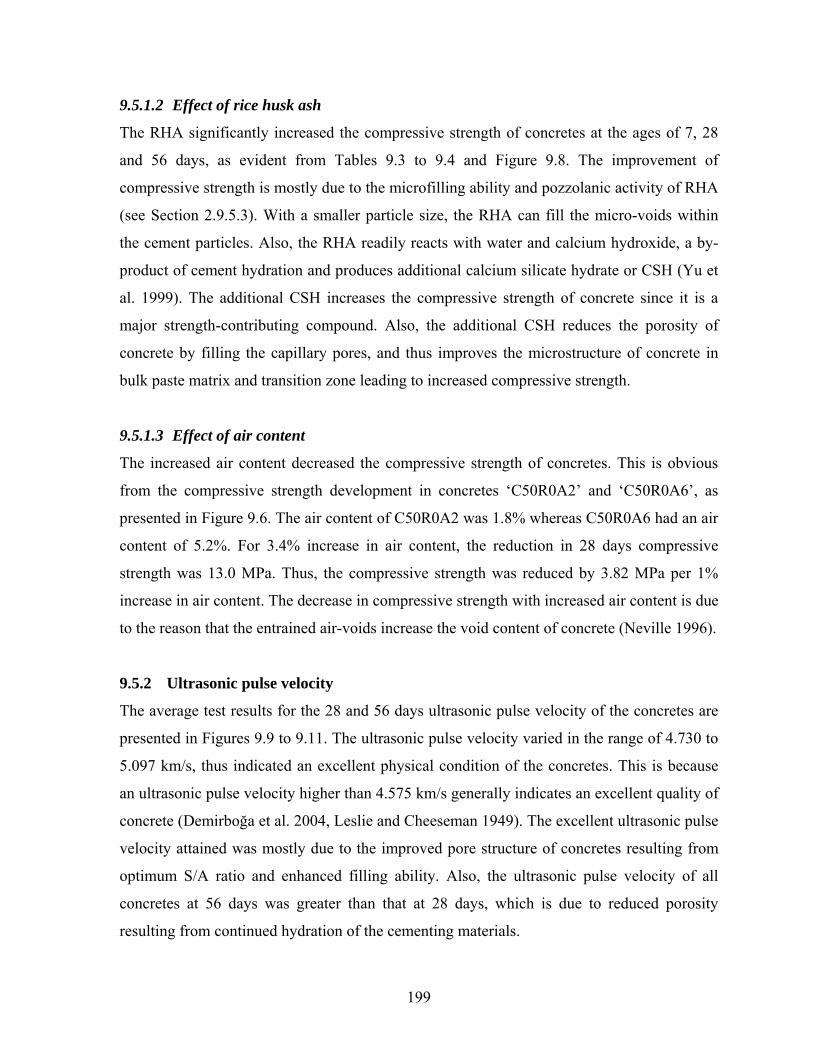
9.5.1.2 Effect of rice husk ash
The RHA significantly increased the compressive strength of concretes at the ages of 7, 28
and 56 days, as evident from Tables 9.3 to 9.4 and Figure 9.8. The improvement of
compressive strength is mostly due to the microfilling ability and pozzolanic activity of RHA
(see Section 2.9.5.3). With a smaller particle size, the RHA can fill the micro-voids within
the cement particles. Also, the RHA readily reacts with water and calcium hydroxide, a by-
product of cement hydration and produces additional calcium silicate hydrate or CSH (Yu et
al. 1999). The additional CSH increases the compressive strength of concrete since it is a
major strength-contributing compound. Also, the additional CSH reduces the porosity of
concrete by filling the capillary pores, and thus improves the microstructure of concrete in
bulk paste matrix and transition zone leading to increased compressive strength.
9.5.1.3 Effect of air content
The increased air content decreased the compressive strength of concretes. This is obvious
from the compressive strength development in concretes ‘C50R0A2’ and ‘C50R0A6’, as
presented in Figure 9.6. The air content of C50R0A2 was 1.8% whereas C50R0A6 had an air
content of 5.2%. For 3.4% increase in air content, the reduction in 28 days compressive
strength was 13.0 MPa. Thus, the compressive strength was reduced by 3.82 MPa per 1%
increase in air content. The decrease in compressive strength with increased air content is due
to the reason that the entrained air-voids increase the void content of concrete (Neville 1996).
9.5.2 Ultrasonic pulse velocity
The average test results for the 28 and 56 days ultrasonic pulse velocity of the concretes are
presented in Figures 9.9 to 9.11. The ultrasonic pulse velocity varied in the range of 4.730 to
5.097 km/s, thus indicated an excellent physical condition of the concretes. This is because
an ultrasonic pulse velocity higher than 4.575 km/s generally indicates an excellent quality of
concrete (Demirboğa et al. 2004, Leslie and Cheeseman 1949). The excellent ultrasonic pulse
velocity attained was mostly due to the improved pore structure of concretes resulting from
optimum S/A ratio and enhanced filling ability. Also, the ultrasonic pulse velocity of all
concretes at 56 days was greater than that at 28 days, which is due to reduced porosity
resulting from continued hydration of the cementing materials.
199
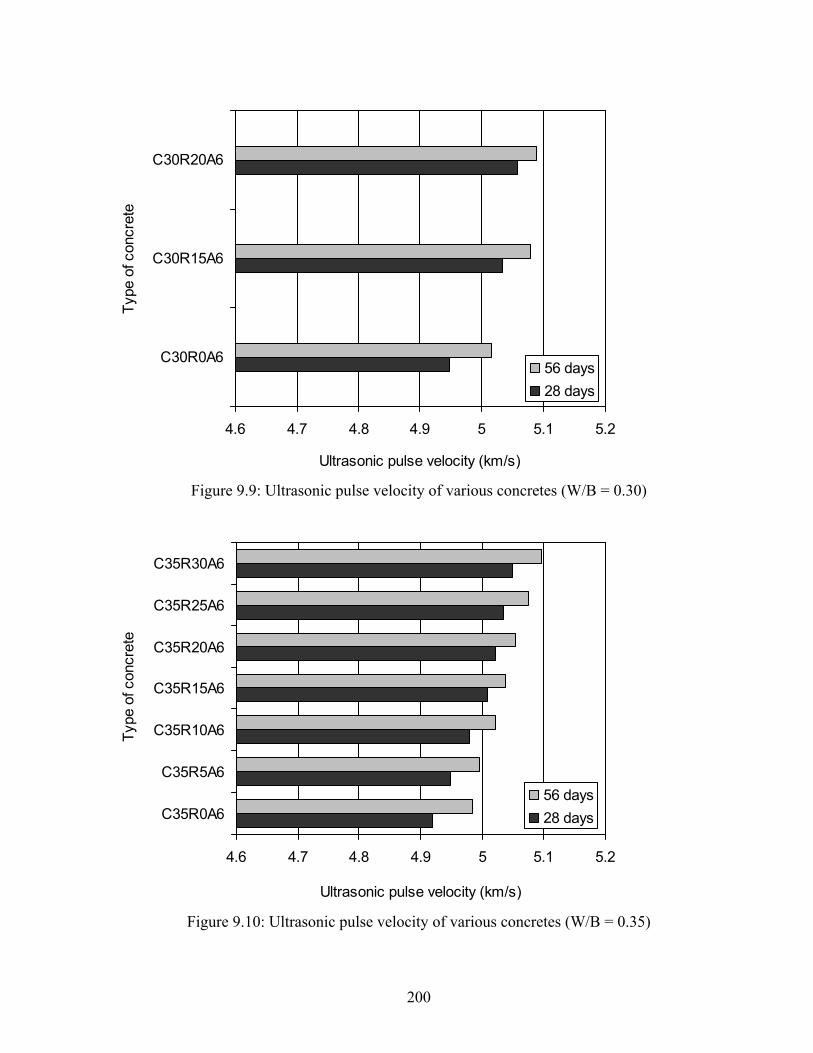
4.6 4.7 4.8 4.9 5 5.1 5.2
C30R0A6
C30R15A6
C30R20A6
Type
of c
oncr
ete
Ultrasonic pulse velocity (km/s)
56 days28 days
Figure 9.9: Ultrasonic pulse velocity of various concretes (W/B = 0.30)
4.6 4.7 4.8 4.9 5 5.1 5.2
C35R0A6
C35R5A6
C35R10A6
C35R15A6
C35R20A6
C35R25A6
C35R30A6
Type
of c
oncr
ete
Ultrasonic pulse velocity (km/s)
56 days28 days
Figure 9.10: Ultrasonic pulse velocity of various concretes (W/B = 0.35)
200
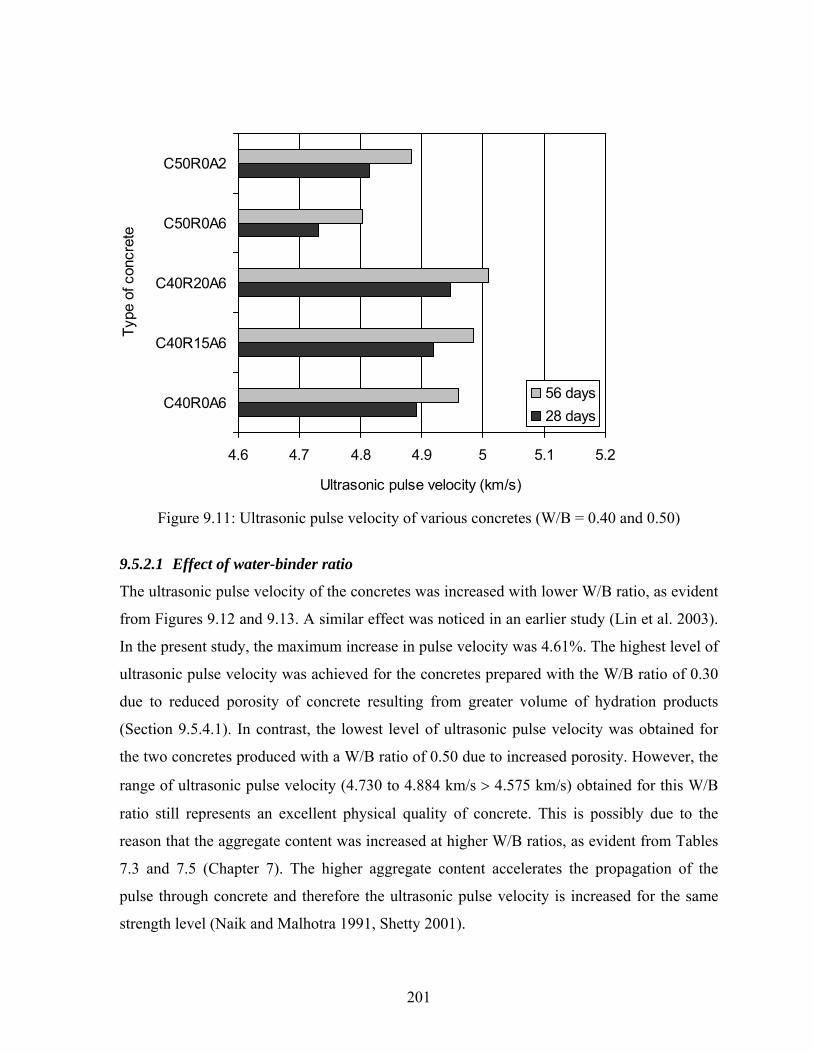
4.6 4.7 4.8 4.9 5 5.1 5.2
C40R0A6
C40R15A6
C40R20A6
C50R0A6
C50R0A2
Type
of c
oncr
ete
Ultrasonic pulse velocity (km/s)
56 days28 days
Figure 9.11: Ultrasonic pulse velocity of various concretes (W/B = 0.40 and 0.50)
9.5.2.1 Effect of water-binder ratio
The ultrasonic pulse velocity of the concretes was increased with lower W/B ratio, as evident
from Figures 9.12 and 9.13. A similar effect was noticed in an earlier study (Lin et al. 2003).
In the present study, the maximum increase in pulse velocity was 4.61%. The highest level of
ultrasonic pulse velocity was achieved for the concretes prepared with the W/B ratio of 0.30
due to reduced porosity of concrete resulting from greater volume of hydration products
(Section 9.5.4.1). In contrast, the lowest level of ultrasonic pulse velocity was obtained for
the two concretes produced with a W/B ratio of 0.50 due to increased porosity. However, the
range of ultrasonic pulse velocity (4.730 to 4.884 km/s > 4.575 km/s) obtained for this W/B
ratio still represents an excellent physical quality of concrete. This is possibly due to the
reason that the aggregate content was increased at higher W/B ratios, as evident from Tables
7.3 and 7.5 (Chapter 7). The higher aggregate content accelerates the propagation of the
pulse through concrete and therefore the ultrasonic pulse velocity is increased for the same
strength level (Naik and Malhotra 1991, Shetty 2001).
201
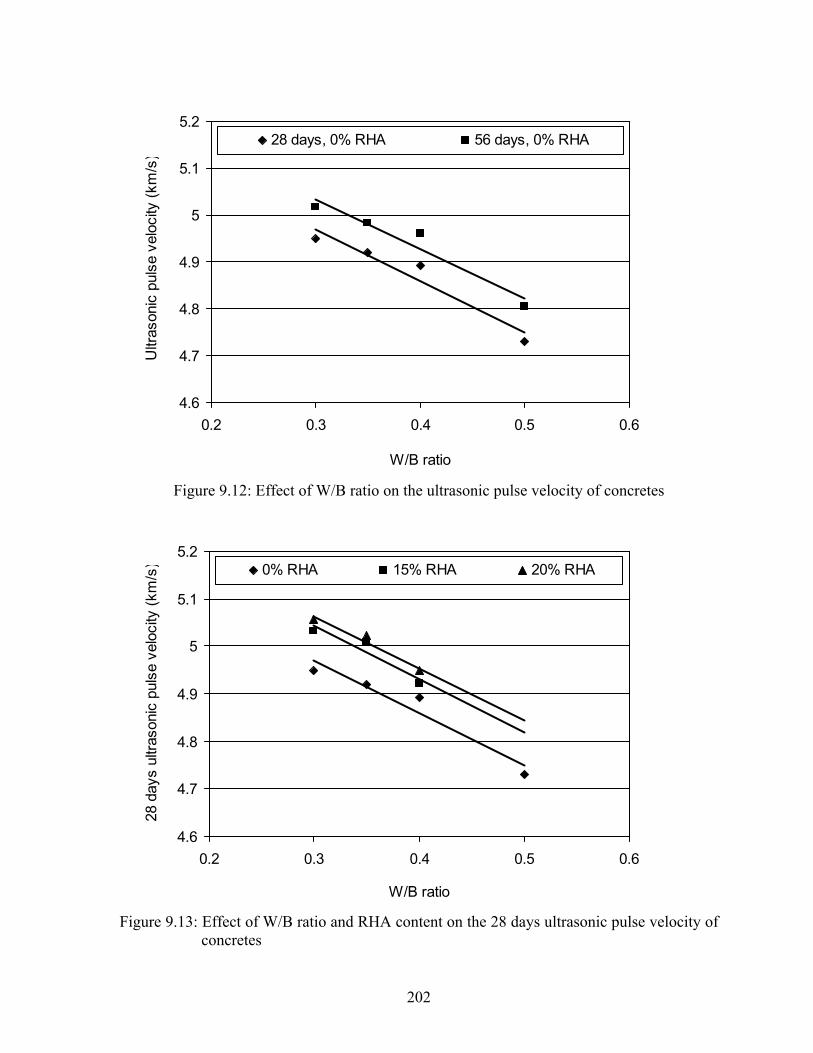
4.6
4.7
4.8
4.9
5
5.1
5.2
0.2 0.3 0.4 0.5 0.6
W/B ratio
Ultr
ason
ic p
ulse
vel
ocity
(km
/s)
28 days, 0% RHA 56 days, 0% RHA
Figure 9.12: Effect of W/B ratio on the ultrasonic pulse velocity of concretes
4.6
4.7
4.8
4.9
5
5.1
5.2
0.2 0.3 0.4 0.5 0.6
W/B ratio
28 d
ays
ultra
soni
c pu
lse
velo
city
(km
/s) 0% RHA 15% RHA 20% RHA
Figure 9.13: Effect of W/B ratio and RHA content on the 28 days ultrasonic pulse velocity of concretes
202
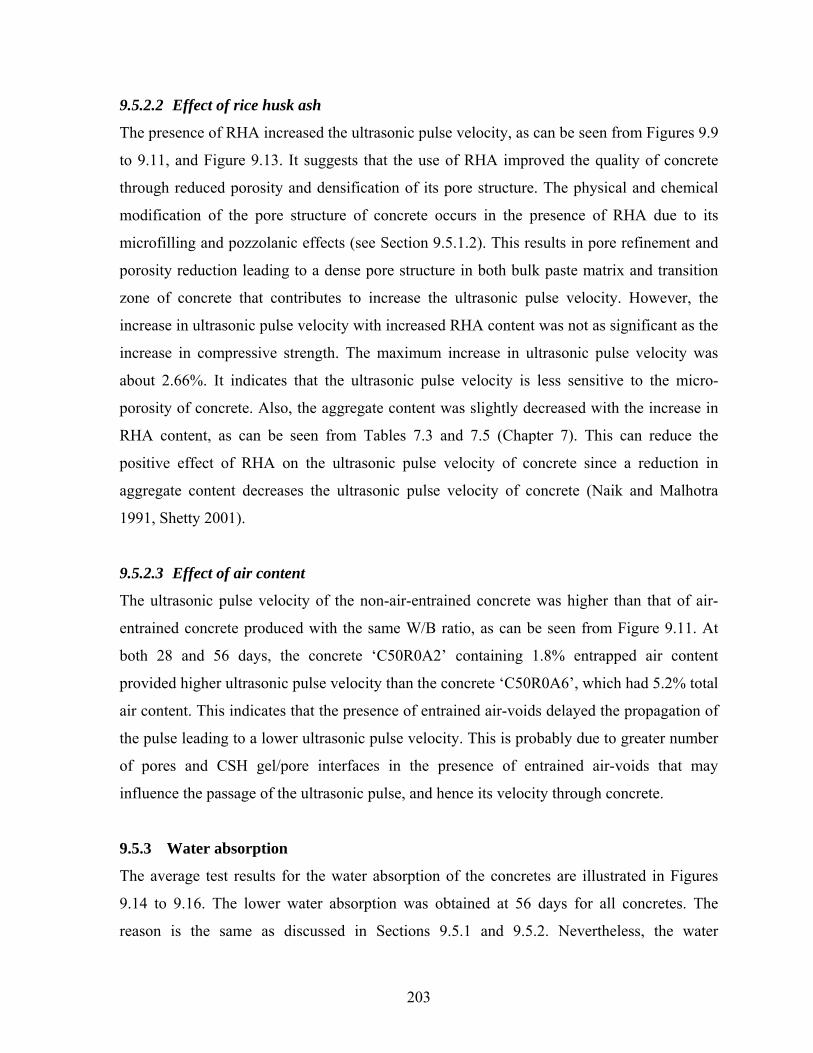
9.5.2.2 Effect of rice husk ash
The presence of RHA increased the ultrasonic pulse velocity, as can be seen from Figures 9.9
to 9.11, and Figure 9.13. It suggests that the use of RHA improved the quality of concrete
through reduced porosity and densification of its pore structure. The physical and chemical
modification of the pore structure of concrete occurs in the presence of RHA due to its
microfilling and pozzolanic effects (see Section 9.5.1.2). This results in pore refinement and
porosity reduction leading to a dense pore structure in both bulk paste matrix and transition
zone of concrete that contributes to increase the ultrasonic pulse velocity. However, the
increase in ultrasonic pulse velocity with increased RHA content was not as significant as the
increase in compressive strength. The maximum increase in ultrasonic pulse velocity was
about 2.66%. It indicates that the ultrasonic pulse velocity is less sensitive to the micro-
porosity of concrete. Also, the aggregate content was slightly decreased with the increase in
RHA content, as can be seen from Tables 7.3 and 7.5 (Chapter 7). This can reduce the
positive effect of RHA on the ultrasonic pulse velocity of concrete since a reduction in
aggregate content decreases the ultrasonic pulse velocity of concrete (Naik and Malhotra
1991, Shetty 2001).
9.5.2.3 Effect of air content
The ultrasonic pulse velocity of the non-air-entrained concrete was higher than that of air-
entrained concrete produced with the same W/B ratio, as can be seen from Figure 9.11. At
both 28 and 56 days, the concrete ‘C50R0A2’ containing 1.8% entrapped air content
provided higher ultrasonic pulse velocity than the concrete ‘C50R0A6’, which had 5.2% total
air content. This indicates that the presence of entrained air-voids delayed the propagation of
the pulse leading to a lower ultrasonic pulse velocity. This is probably due to greater number
of pores and CSH gel/pore interfaces in the presence of entrained air-voids that may
influence the passage of the ultrasonic pulse, and hence its velocity through concrete.
9.5.3 Water absorption
The average test results for the water absorption of the concretes are illustrated in Figures
9.14 to 9.16. The lower water absorption was obtained at 56 days for all concretes. The
reason is the same as discussed in Sections 9.5.1 and 9.5.2. Nevertheless, the water
203
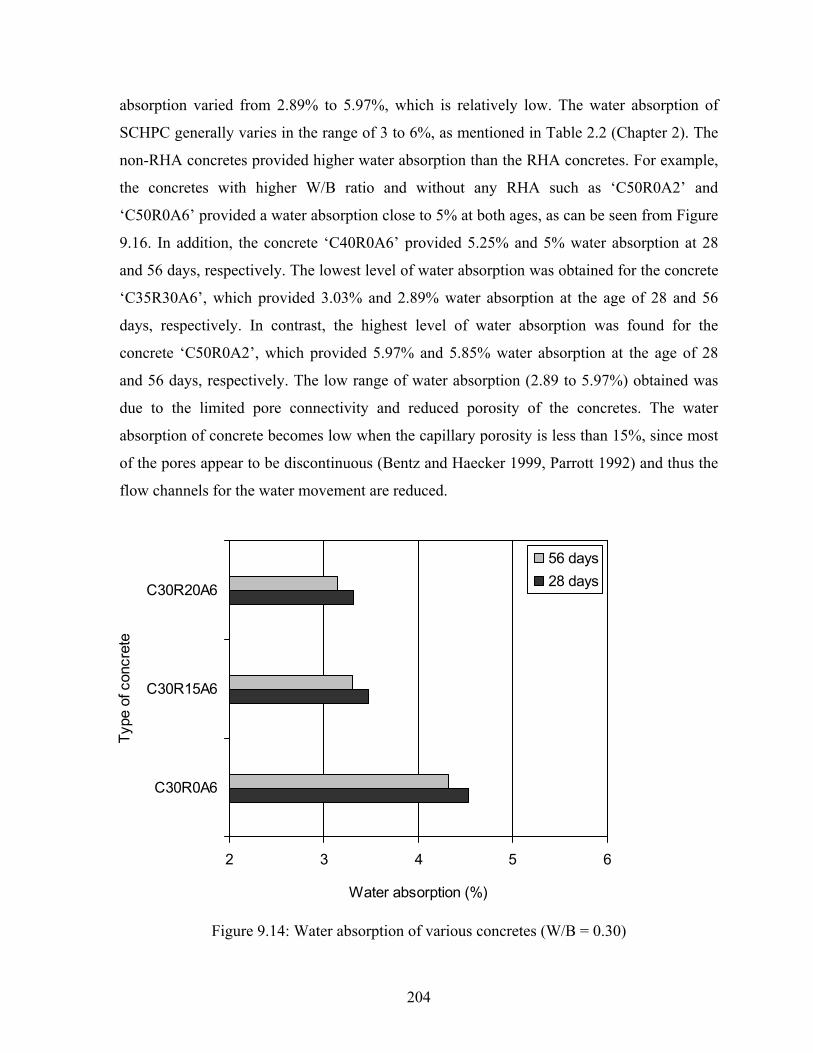
absorption varied from 2.89% to 5.97%, which is relatively low. The water absorption of
SCHPC generally varies in the range of 3 to 6%, as mentioned in Table 2.2 (Chapter 2). The
non-RHA concretes provided higher water absorption than the RHA concretes. For example,
the concretes with higher W/B ratio and without any RHA such as ‘C50R0A2’ and
‘C50R0A6’ provided a water absorption close to 5% at both ages, as can be seen from Figure
9.16. In addition, the concrete ‘C40R0A6’ provided 5.25% and 5% water absorption at 28
and 56 days, respectively. The lowest level of water absorption was obtained for the concrete
‘C35R30A6’, which provided 3.03% and 2.89% water absorption at the age of 28 and 56
days, respectively. In contrast, the highest level of water absorption was found for the
concrete ‘C50R0A2’, which provided 5.97% and 5.85% water absorption at the age of 28
and 56 days, respectively. The low range of water absorption (2.89 to 5.97%) obtained was
due to the limited pore connectivity and reduced porosity of the concretes. The water
absorption of concrete becomes low when the capillary porosity is less than 15%, since most
of the pores appear to be discontinuous (Bentz and Haecker 1999, Parrott 1992) and thus the
flow channels for the water movement are reduced.
2 3 4 5
C30R0A6
C30R15A6
C30R20A6
Type
of c
oncr
ete
Water absorption (%)
6
56 days28 days
Figure 9.14: Water absorption of various concretes (W/B = 0.30)
204
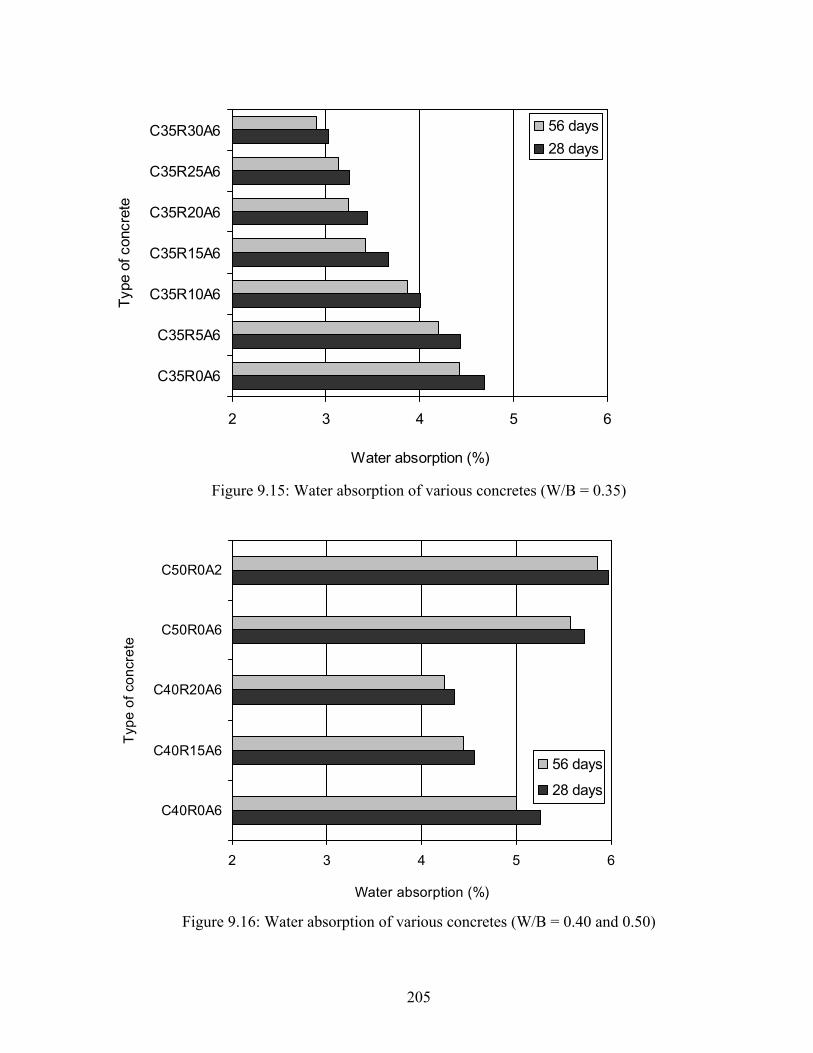
2 3 4 5 6
C35R0A6
C35R5A6
C35R10A6
C35R15A6
C35R20A6
C35R25A6
C35R30A6Ty
pe o
f con
cret
e
Water absorption (%)
56 days28 days
Figure 9.15: Water absorption of various concretes (W/B = 0.35)
2 3 4 5
C40R0A6
C40R15A6
C40R20A6
C50R0A6
C50R0A2
Type
of c
oncr
ete
Water absorption (%)
6
56 days
28 days
Figure 9.16: Water absorption of various concretes (W/B = 0.40 and 0.50)
205
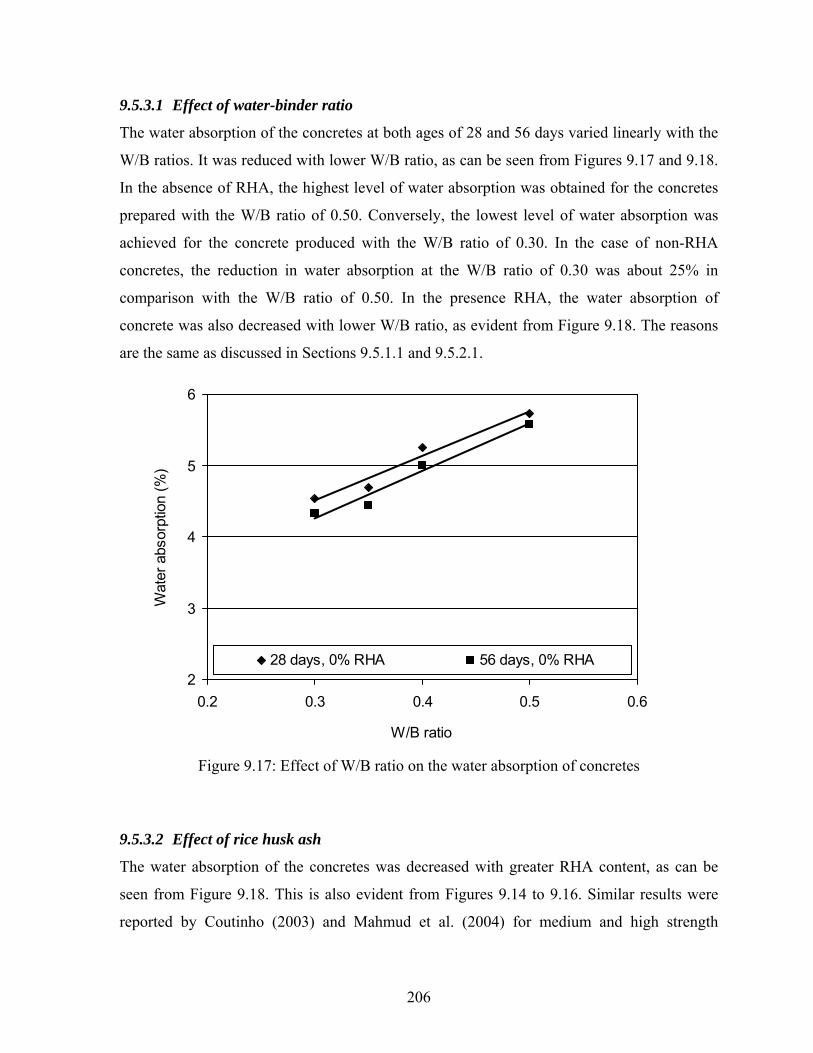
9.5.3.1 Effect of water-binder ratio
The water absorption of the concretes at both ages of 28 and 56 days varied linearly with the
W/B ratios. It was reduced with lower W/B ratio, as can be seen from Figures 9.17 and 9.18.
In the absence of RHA, the highest level of water absorption was obtained for the concretes
prepared with the W/B ratio of 0.50. Conversely, the lowest level of water absorption was
achieved for the concrete produced with the W/B ratio of 0.30. In the case of non-RHA
concretes, the reduction in water absorption at the W/B ratio of 0.30 was about 25% in
comparison with the W/B ratio of 0.50. In the presence RHA, the water absorption of
concrete was also decreased with lower W/B ratio, as evident from Figure 9.18. The reasons
are the same as discussed in Sections 9.5.1.1 and 9.5.2.1.
2
3
4
5
6
0.2 0.3 0.4 0.5 0.6
W/B ratio
Wat
er a
bsor
ptio
n (%
)
28 days, 0% RHA 56 days, 0% RHA
Figure 9.17: Effect of W/B ratio on the water absorption of concretes
9.5.3.2 Effect of rice husk ash
The water absorption of the concretes was decreased with greater RHA content, as can be
seen from Figure 9.18. This is also evident from Figures 9.14 to 9.16. Similar results were
reported by Coutinho (2003) and Mahmud et al. (2004) for medium and high strength
206
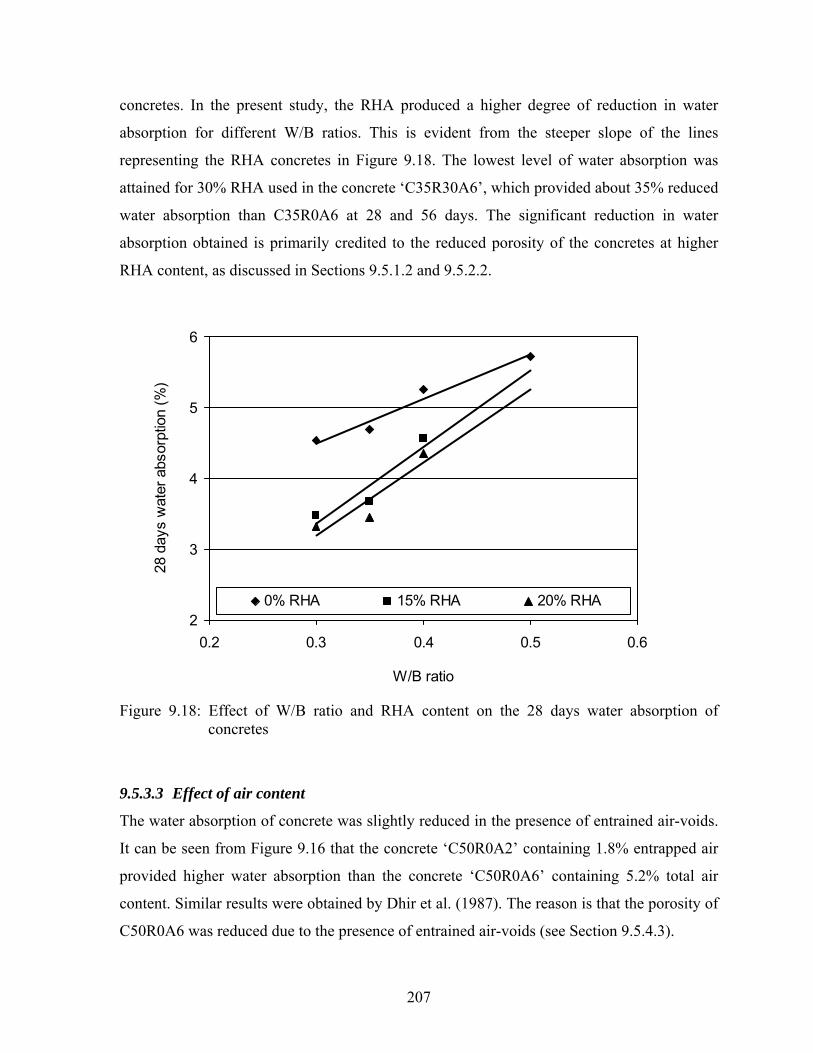
concretes. In the present study, the RHA produced a higher degree of reduction in water
absorption for different W/B ratios. This is evident from the steeper slope of the lines
representing the RHA concretes in Figure 9.18. The lowest level of water absorption was
attained for 30% RHA used in the concrete ‘C35R30A6’, which provided about 35% reduced
water absorption than C35R0A6 at 28 and 56 days. The significant reduction in water
absorption obtained is primarily credited to the reduced porosity of the concretes at higher
RHA content, as discussed in Sections 9.5.1.2 and 9.5.2.2.
2
3
4
5
6
0.2 0.3 0.4 0.5 0.6
W/B ratio
28 d
ays
wat
er a
bsor
ptio
n (%
)
0% RHA 15% RHA 20% RHA
Figure 9.18: Effect of W/B ratio and RHA content on the 28 days water absorption of concretes
9.5.3.3 Effect of air content
The water absorption of concrete was slightly reduced in the presence of entrained air-voids.
It can be seen from Figure 9.16 that the concrete ‘C50R0A2’ containing 1.8% entrapped air
provided higher water absorption than the concrete ‘C50R0A6’ containing 5.2% total air
content. Similar results were obtained by Dhir et al. (1987). The reason is that the porosity of
C50R0A6 was reduced due to the presence of entrained air-voids (see Section 9.5.4.3).
207

9.5.4 Total porosity
The average test results for the total porosity of concretes are illustrated in Figures 9.19 to
9.21. The total porosity ranged from 6.77 to 13.71%. The lowest level of porosity was
obtained for the concrete ‘C35R30A6’, with the total porosity of 7.07% and 6.77%,
respectively, at 28 and 56 days. In contrast, the highest level of porosity was attained for the
concrete ‘C50R0A2’, which provided a total porosity of 13.71% and 13.38% at 28 and 56
days, respectively. The overall test results of total porosity suggest that the quality of the
concretes was good. The total porosity of high-quality concrete is about 7% whereas that of
average-quality concrete is 15% (Hearn et al. 1994). The lowest level of total porosity was
obtained for all concretes at the age of 56 days for the same reasons as discussed before. In
addition, the pore structure of the concretes was improved due to the use of HRWR. The
HRWR induces high consistency in concrete, and thus improves the packing in the range of
the fines. Also, the HRWR enhances the hydration process by dispersing the cement grains
(Collepardi and Massidda 1976). Thus, both total porosity and pore diameter are reduced in
concretes.
Figure 9.19: Total porosity of various concretes (W/B = 0.30)
5 7.5 10 12.5 15
C30R0A6
C30R15A6
C30R20A6
Type
of c
oncr
ete
Total porosity (%)
56 days28 days
208
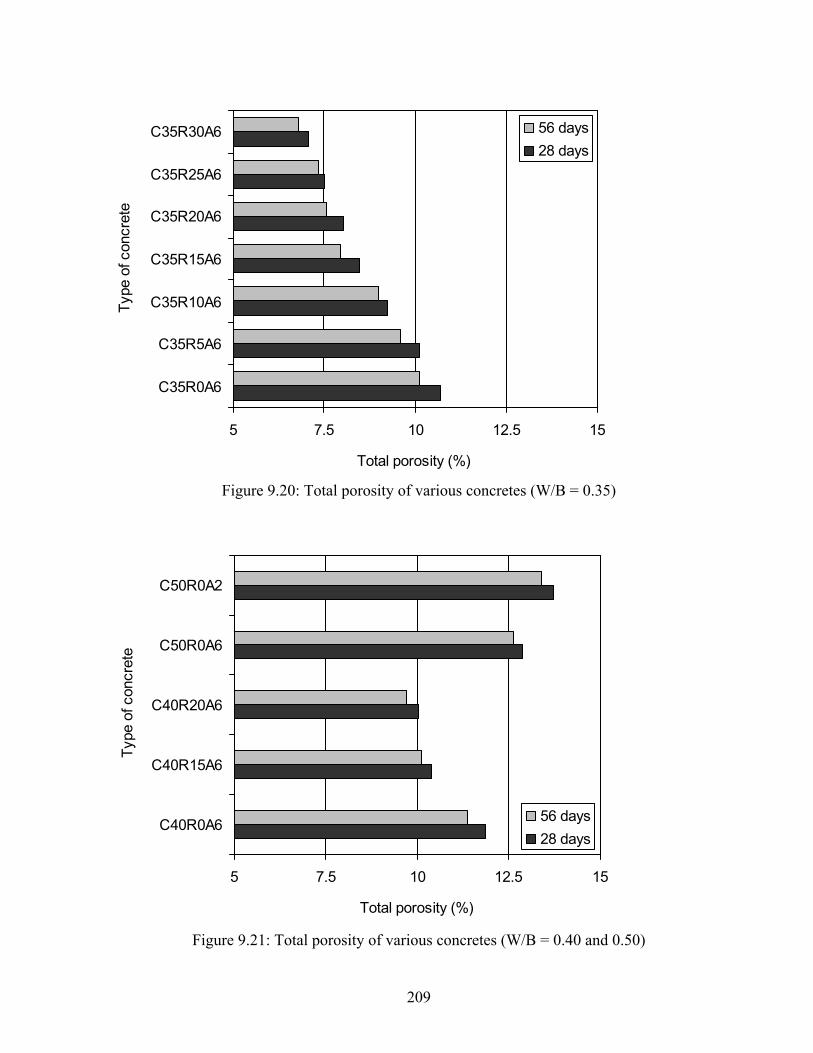
5 7.5 10 12.5 15
C35R0A6
C35R5A6
C35R10A6
C35R15A6
C35R20A6
C35R25A6
C35R30A6Ty
pe o
f con
cret
e
Total porosity (%)
56 days28 days
Figure 9.20: Total porosity of various concretes (W/B = 0.35)
5 7.5 10 12.5 15
C40R0A6
C40R15A6
C40R20A6
C50R0A6
C50R0A2
Type
of c
oncr
ete
Total porosity (%)
56 days28 days
Figure 9.21: Total porosity of various concretes (W/B = 0.40 and 0.50)
209
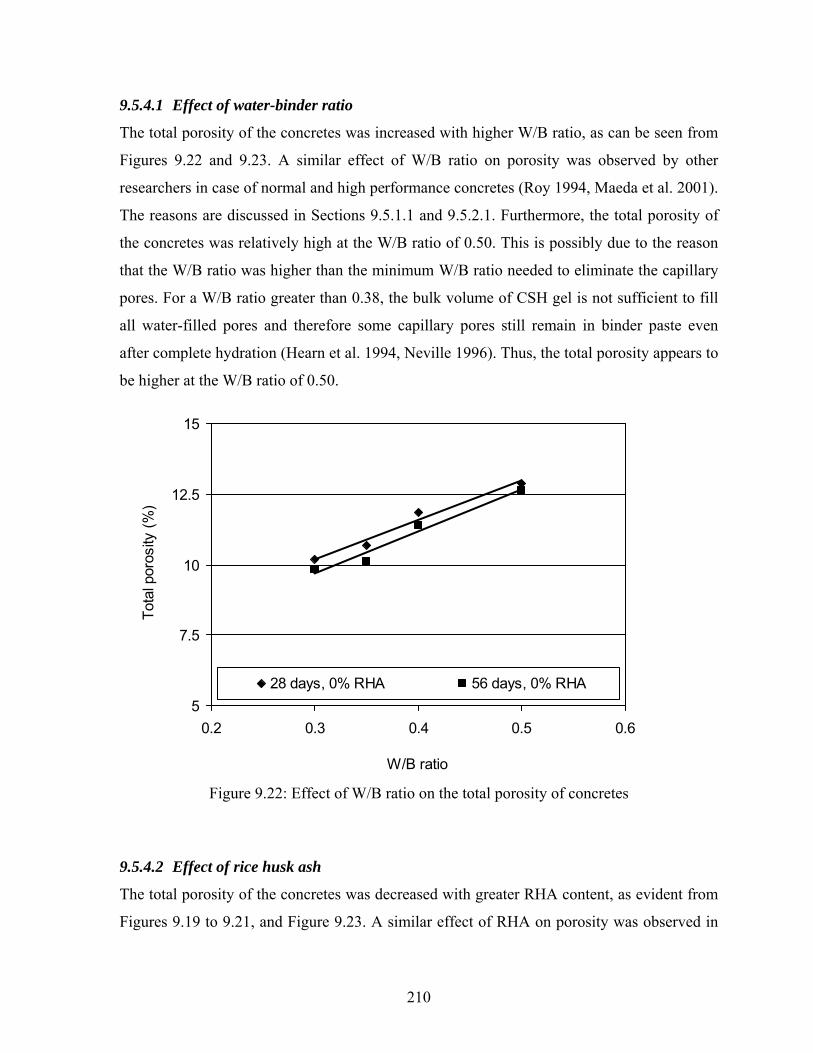
9.5.4.1 Effect of water-binder ratio
The total porosity of the concretes was increased with higher W/B ratio, as can be seen from
Figures 9.22 and 9.23. A similar effect of W/B ratio on porosity was observed by other
researchers in case of normal and high performance concretes (Roy 1994, Maeda et al. 2001).
The reasons are discussed in Sections 9.5.1.1 and 9.5.2.1. Furthermore, the total porosity of
the concretes was relatively high at the W/B ratio of 0.50. This is possibly due to the reason
that the W/B ratio was higher than the minimum W/B ratio needed to eliminate the capillary
pores. For a W/B ratio greater than 0.38, the bulk volume of CSH gel is not sufficient to fill
all water-filled pores and therefore some capillary pores still remain in binder paste even
after complete hydration (Hearn et al. 1994, Neville 1996). Thus, the total porosity appears to
be higher at the W/B ratio of 0.50.
5
7.5
10
12.5
15
0.2 0.3 0.4 0.5 0.6
W/B ratio
Tota
l por
osity
(%)
28 days, 0% RHA 56 days, 0% RHA
Figure 9.22: Effect of W/B ratio on the total porosity of concretes
9.5.4.2 Effect of rice husk ash
The total porosity of the concretes was decreased with greater RHA content, as evident from
Figures 9.19 to 9.21, and Figure 9.23. A similar effect of RHA on porosity was observed in
210
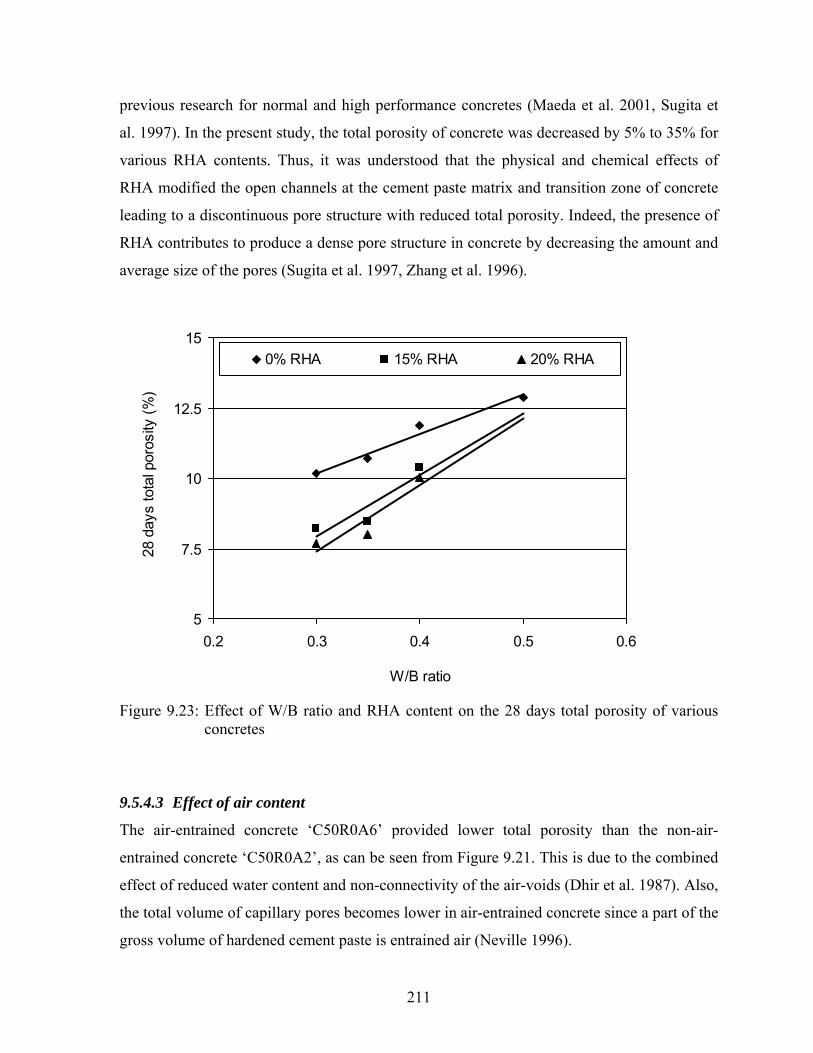
previous research for normal and high performance concretes (Maeda et al. 2001, Sugita et
al. 1997). In the present study, the total porosity of concrete was decreased by 5% to 35% for
various RHA contents. Thus, it was understood that the physical and chemical effects of
RHA modified the open channels at the cement paste matrix and transition zone of concrete
leading to a discontinuous pore structure with reduced total porosity. Indeed, the presence of
RHA contributes to produce a dense pore structure in concrete by decreasing the amount and
average size of the pores (Sugita et al. 1997, Zhang et al. 1996).
5
7.5
10
12.5
15
0.2 0.3 0.4 0.5 0.6
W/B ratio
28 d
ays
tota
l por
osity
(%)
0% RHA 15% RHA 20% RHA
Figure 9.23: Effect of W/B ratio and RHA content on the 28 days total porosity of various concretes
9.5.4.3 Effect of air content
The air-entrained concrete ‘C50R0A6’ provided lower total porosity than the non-air-
entrained concrete ‘C50R0A2’, as can be seen from Figure 9.21. This is due to the combined
effect of reduced water content and non-connectivity of the air-voids (Dhir et al. 1987). Also,
the total volume of capillary pores becomes lower in air-entrained concrete since a part of the
gross volume of hardened cement paste is entrained air (Neville 1996).
211
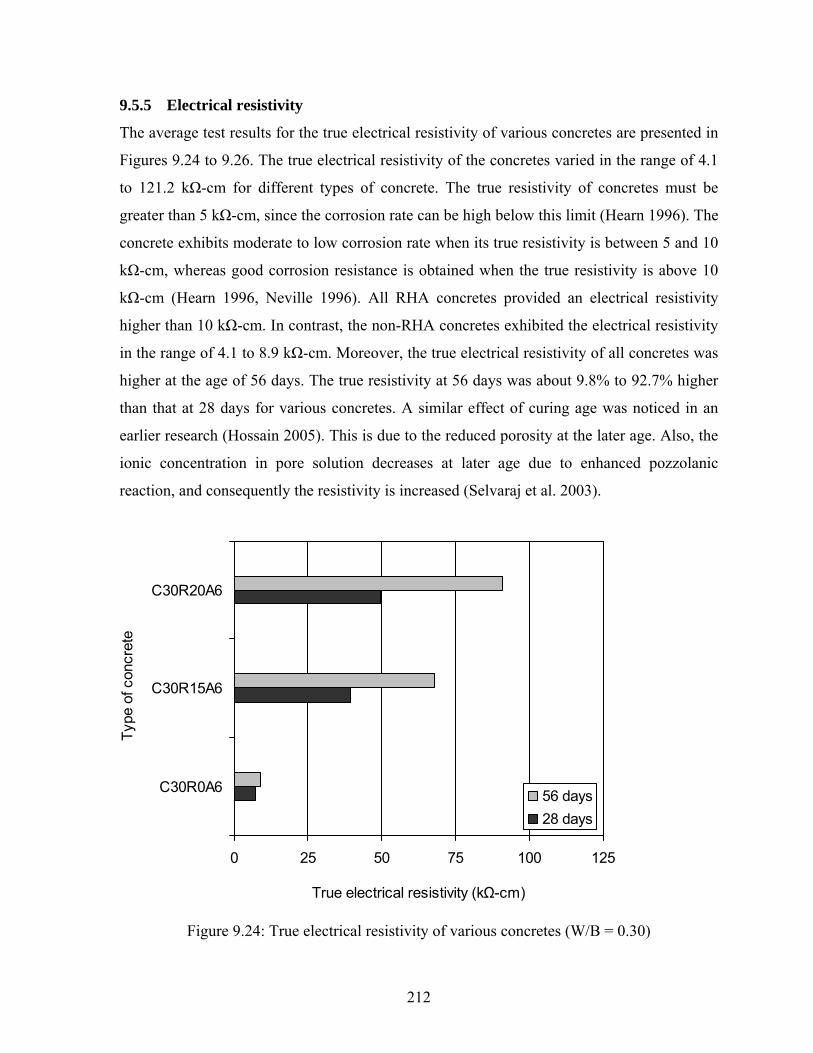
9.5.5 Electrical resistivity
The average test results for the true electrical resistivity of various concretes are presented in
Figures 9.24 to 9.26. The true electrical resistivity of the concretes varied in the range of 4.1
to 121.2 kΩ-cm for different types of concrete. The true resistivity of concretes must be
greater than 5 kΩ-cm, since the corrosion rate can be high below this limit (Hearn 1996). The
concrete exhibits moderate to low corrosion rate when its true resistivity is between 5 and 10
kΩ-cm, whereas good corrosion resistance is obtained when the true resistivity is above 10
kΩ-cm (Hearn 1996, Neville 1996). All RHA concretes provided an electrical resistivity
higher than 10 kΩ-cm. In contrast, the non-RHA concretes exhibited the electrical resistivity
in the range of 4.1 to 8.9 kΩ-cm. Moreover, the true electrical resistivity of all concretes was
higher at the age of 56 days. The true resistivity at 56 days was about 9.8% to 92.7% higher
than that at 28 days for various concretes. A similar effect of curing age was noticed in an
earlier research (Hossain 2005). This is due to the reduced porosity at the later age. Also, the
ionic concentration in pore solution decreases at later age due to enhanced pozzolanic
reaction, and consequently the resistivity is increased (Selvaraj et al. 2003).
0 25 50 75 100 125
C30R0A6
C30R15A6
C30R20A6
Type
of c
oncr
ete
True electrical resistivity (kΩ-cm)
56 days28 days
Figure 9.24: True electrical resistivity of various concretes (W/B = 0.30)
212
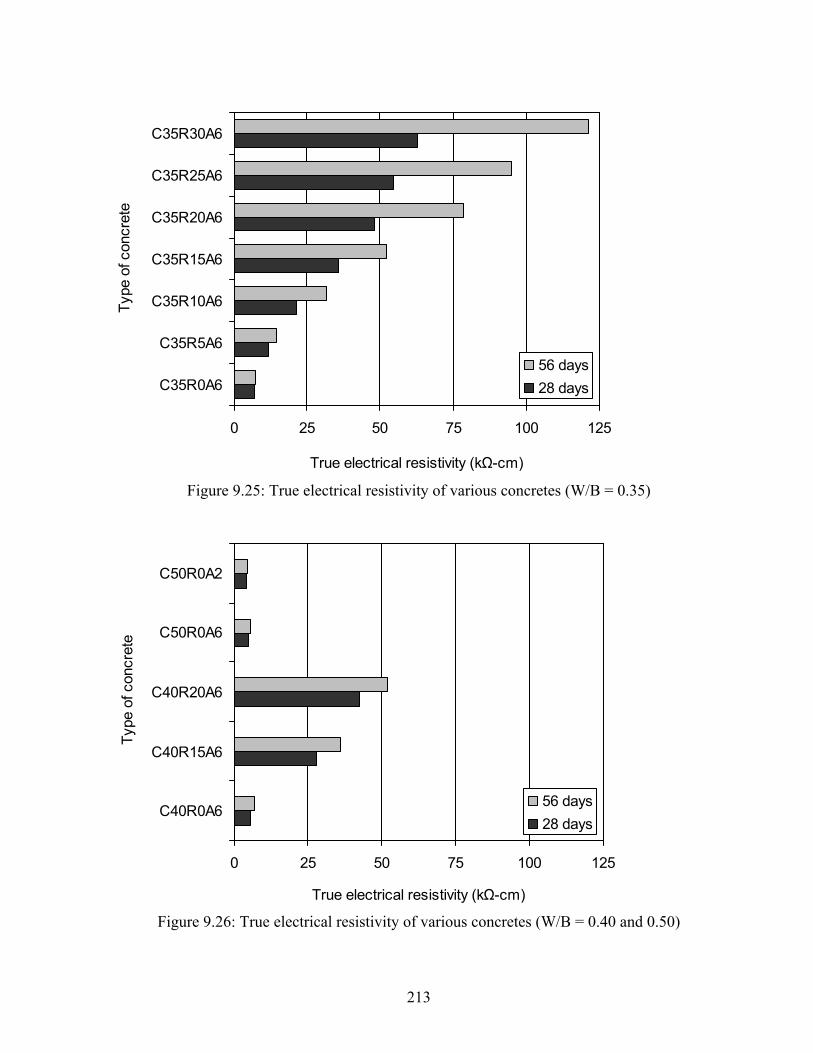
0 25 50 75 100 125
C35R0A6
C35R5A6
C35R10A6
C35R15A6
C35R20A6
C35R25A6
C35R30A6Ty
pe o
f con
cret
e
True electrical resistivity (kΩ-cm)
56 days28 days
Figure 9.25: True electrical resistivity of various concretes (W/B = 0.35)
0 25 50 75 100 125
C40R0A6
C40R15A6
C40R20A6
C50R0A6
C50R0A2
Type
of c
oncr
ete
True electrical resistivity (kΩ-cm)
56 days28 days
Figure 9.26: True electrical resistivity of various concretes (W/B = 0.40 and 0.50)
213
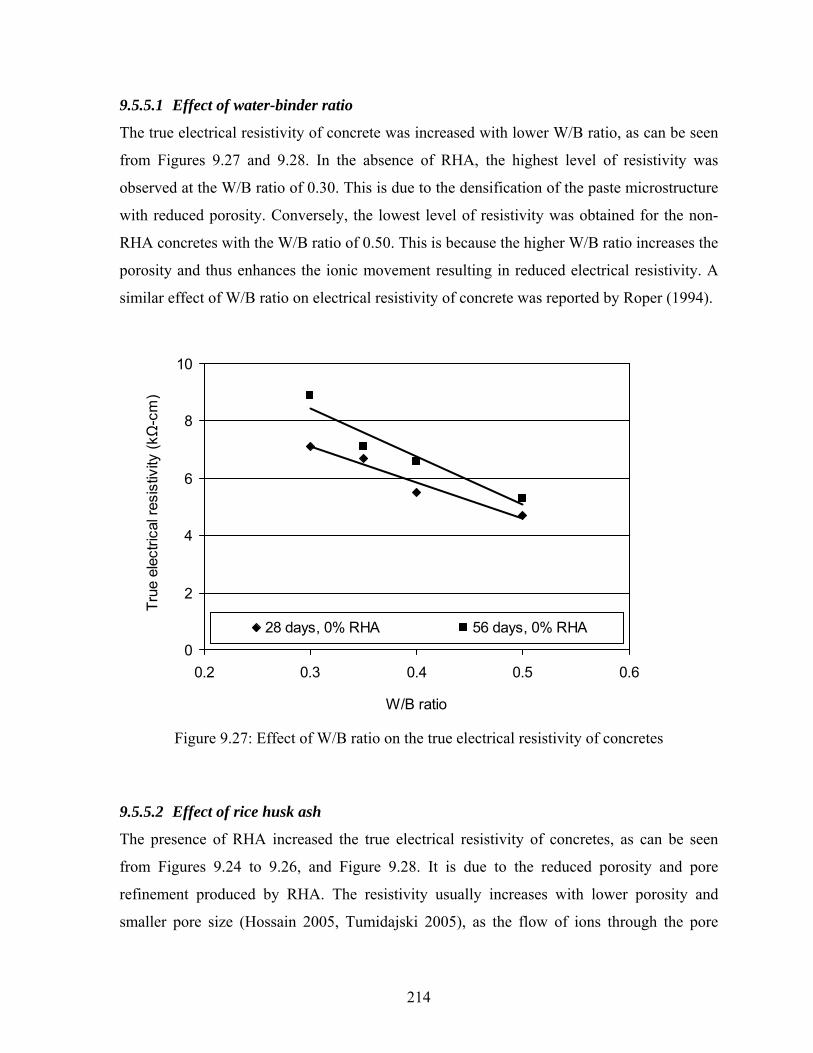
9.5.5.1 Effect of water-binder ratio
The true electrical resistivity of concrete was increased with lower W/B ratio, as can be seen
from Figures 9.27 and 9.28. In the absence of RHA, the highest level of resistivity was
observed at the W/B ratio of 0.30. This is due to the densification of the paste microstructure
with reduced porosity. Conversely, the lowest level of resistivity was obtained for the non-
RHA concretes with the W/B ratio of 0.50. This is because the higher W/B ratio increases the
porosity and thus enhances the ionic movement resulting in reduced electrical resistivity. A
similar effect of W/B ratio on electrical resistivity of concrete was reported by Roper (1994).
0
2
4
6
8
10
0.2 0.3 0.4 0.5 0.6
W/B ratio
True
ele
ctric
al re
sist
ivity
(kΩ
-cm
)
28 days, 0% RHA 56 days, 0% RHA
Figure 9.27: Effect of W/B ratio on the true electrical resistivity of concretes
9.5.5.2 Effect of rice husk ash
The presence of RHA increased the true electrical resistivity of concretes, as can be seen
from Figures 9.24 to 9.26, and Figure 9.28. It is due to the reduced porosity and pore
refinement produced by RHA. The resistivity usually increases with lower porosity and
smaller pore size (Hossain 2005, Tumidajski 2005), as the flow of ions through the pore
214
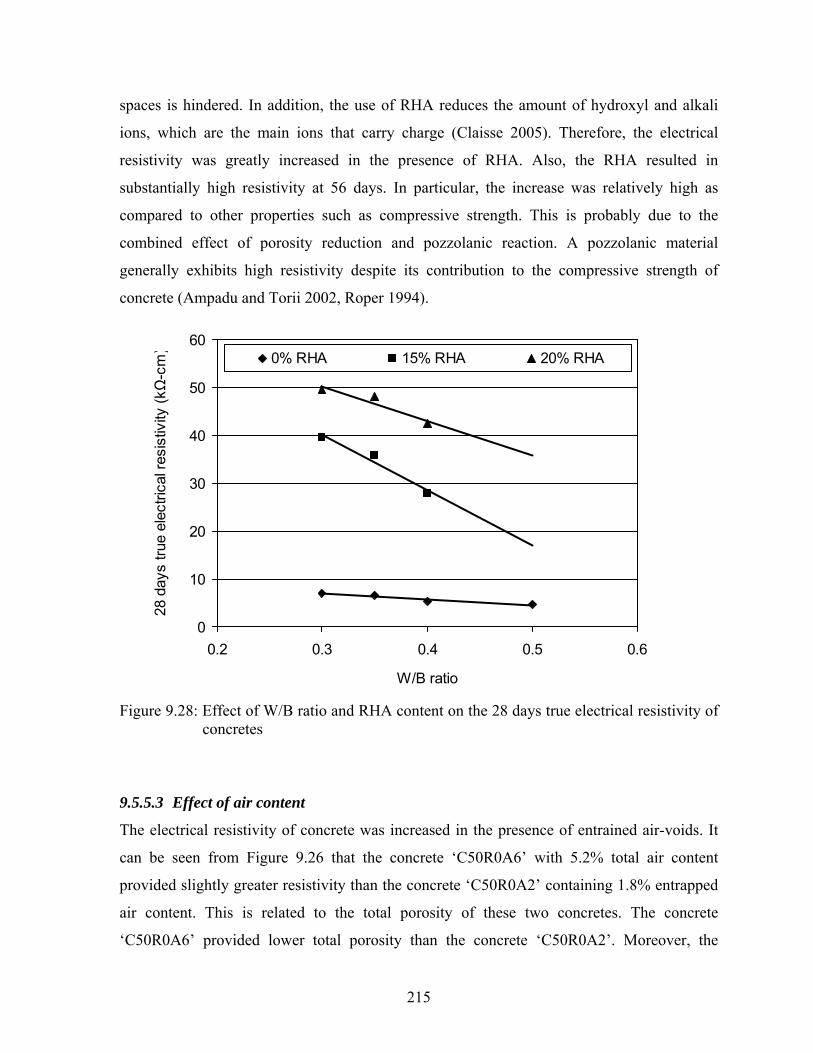
spaces is hindered. In addition, the use of RHA reduces the amount of hydroxyl and alkali
ions, which are the main ions that carry charge (Claisse 2005). Therefore, the electrical
resistivity was greatly increased in the presence of RHA. Also, the RHA resulted in
substantially high resistivity at 56 days. In particular, the increase was relatively high as
compared to other properties such as compressive strength. This is probably due to the
combined effect of porosity reduction and pozzolanic reaction. A pozzolanic material
generally exhibits high resistivity despite its contribution to the compressive strength of
concrete (Ampadu and Torii 2002, Roper 1994).
0
10
20
30
40
50
60
0.2 0.3 0.4 0.5 0.6
W/B ratio
28 d
ays
true
elec
trica
l res
istiv
ity (kΩ
-cm
) 0% RHA 15% RHA 20% RHA
Figure 9.28: Effect of W/B ratio and RHA content on the 28 days true electrical resistivity of concretes
9.5.5.3 Effect of air content
The electrical resistivity of concrete was increased in the presence of entrained air-voids. It
can be seen from Figure 9.26 that the concrete ‘C50R0A6’ with 5.2% total air content
provided slightly greater resistivity than the concrete ‘C50R0A2’ containing 1.8% entrapped
air content. This is related to the total porosity of these two concretes. The concrete
‘C50R0A6’ provided lower total porosity than the concrete ‘C50R0A2’. Moreover, the
215

capillary porosity is decreased in the presence of entrained air-voids as discussed before.
Consequently, the ionic movement was reduced and the resistivity became higher.
9.6 Concrete Durability
The durability of the concretes was not tested directly in the present study. However, the
hardened properties determined indicated a good durability for the majority of concretes. The
ultrasonic pulse velocity and compressive strength results exhibited the excellent physical
condition or quality of concretes with a reduced porosity, and thus pointed to good durability.
In addition, the low range of water absorption and total porosity, and the high level of
electrical resistivity obtained for most concretes suggested that they would show good
durability. This is because the reduction in porosity enhances the freeze-thaw durability
(Litvan 1973, Claisse 2005), decreases the water and gas permeability (Coppola et al. 2004),
and increases the resistance to acid attack, carbonation and chloride penetration (Sugita et al.
1997). A lower range of water absorption indicates the reduced penetration of chlorides and
other deleterious agents into concretes (McCarter et al. 1992). Also, the concretes with a true
electrical resistivity higher than 10 kΩ-cm exhibit low chloride ion permeability (Chini et al.
2003, Kessler et al. 2005) and reduced corrosion rate (ACI 222R-01, 2004).
9.7 Correlations among Various Hardened Properties
The correlations for the compressive strength and ultrasonic pulse velocity, compressive
strength and total porosity, ultrasonic pulse velocity and total porosity, and true electrical
resistivity and total porosity were determined. They are presented and discussed below.
9.7.1 Compressive strength and ultrasonic pulse velocity
An exponential relationship was observed between the compressive strength and ultrasonic
pulse velocity of all concretes, as can be seen from Figure 9.29. This relationship was found
for the compressive strength ranging from 42.7 to 98.4 MPa and for the ultrasonic pulse
velocity varying from 4.730 to 5.097 km/s. The coefficient of determination (R2) for the best-
fit curve was 0.929, and the correlation coefficient (R) was 0.964, which indicates an
excellent relationship. This correlation was obtained for both later ages (28 and 56 days) of
concretes. Thus, it was understood that the relationship between compressive strength and
216
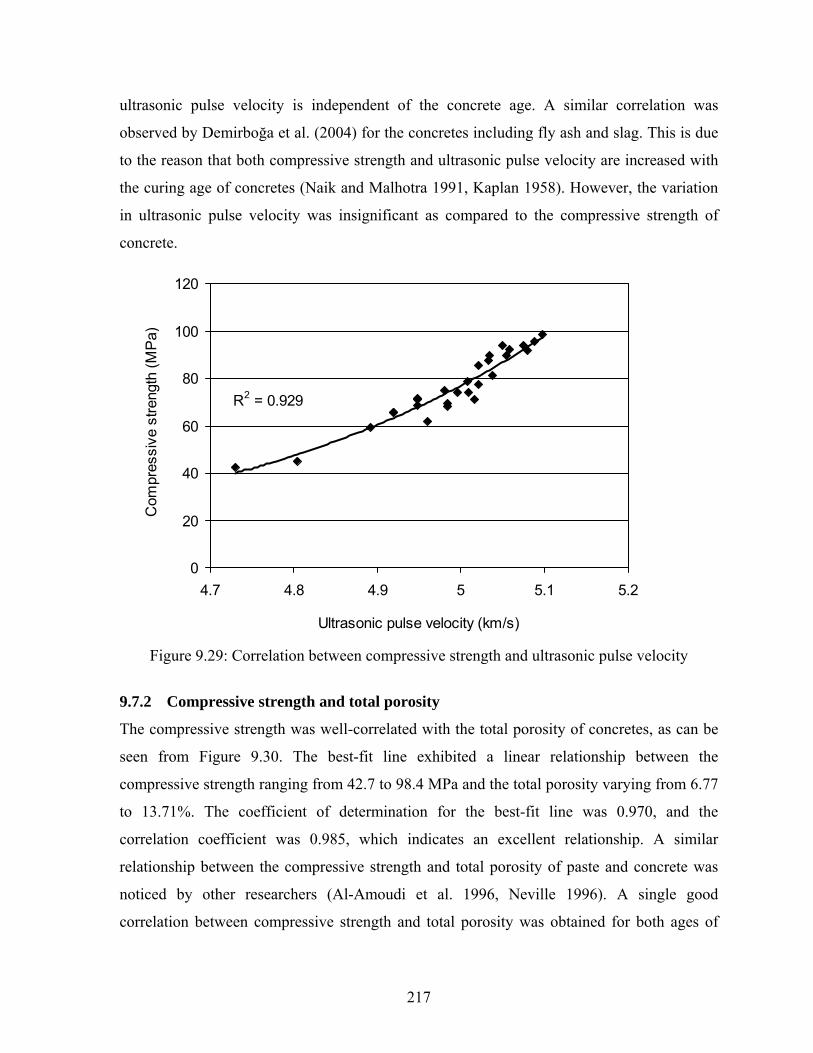
ultrasonic pulse velocity is independent of the concrete age. A similar correlation was
observed by Demirboğa et al. (2004) for the concretes including fly ash and slag. This is due
to the reason that both compressive strength and ultrasonic pulse velocity are increased with
the curing age of concretes (Naik and Malhotra 1991, Kaplan 1958). However, the variation
in ultrasonic pulse velocity was insignificant as compared to the compressive strength of
concrete.
R2 = 0.929
0
20
40
60
80
100
120
4.7 4.8 4.9 5 5.1 5.2
Ultrasonic pulse velocity (km/s)
Com
pres
sive
stre
ngth
(MP
a)
Figure 9.29: Correlation between compressive strength and ultrasonic pulse velocity
9.7.2 Compressive strength and total porosity
The compressive strength was well-correlated with the total porosity of concretes, as can be
seen from Figure 9.30. The best-fit line exhibited a linear relationship between the
compressive strength ranging from 42.7 to 98.4 MPa and the total porosity varying from 6.77
to 13.71%. The coefficient of determination for the best-fit line was 0.970, and the
correlation coefficient was 0.985, which indicates an excellent relationship. A similar
relationship between the compressive strength and total porosity of paste and concrete was
noticed by other researchers (Al-Amoudi et al. 1996, Neville 1996). A single good
correlation between compressive strength and total porosity was obtained for both ages of
217
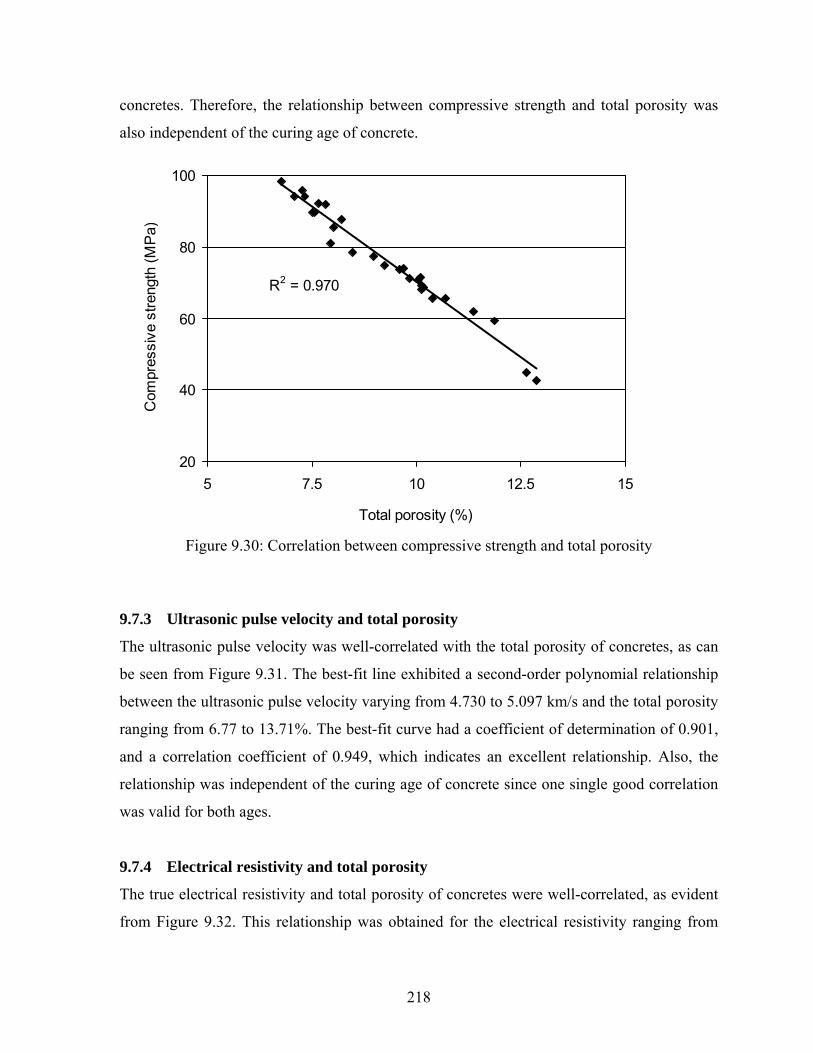
concretes. Therefore, the relationship between compressive strength and total porosity was
also independent of the curing age of concrete.
R2 = 0.970
20
40
60
80
100
5 7.5 10 12.5 15
Total porosity (%)
Com
pres
sive
stre
ngth
(MP
a)
Figure 9.30: Correlation between compressive strength and total porosity
9.7.3 Ultrasonic pulse velocity and total porosity
The ultrasonic pulse velocity was well-correlated with the total porosity of concretes, as can
be seen from Figure 9.31. The best-fit line exhibited a second-order polynomial relationship
between the ultrasonic pulse velocity varying from 4.730 to 5.097 km/s and the total porosity
ranging from 6.77 to 13.71%. The best-fit curve had a coefficient of determination of 0.901,
and a correlation coefficient of 0.949, which indicates an excellent relationship. Also, the
relationship was independent of the curing age of concrete since one single good correlation
was valid for both ages.
9.7.4 Electrical resistivity and total porosity
The true electrical resistivity and total porosity of concretes were well-correlated, as evident
from Figure 9.32. This relationship was obtained for the electrical resistivity ranging from
218
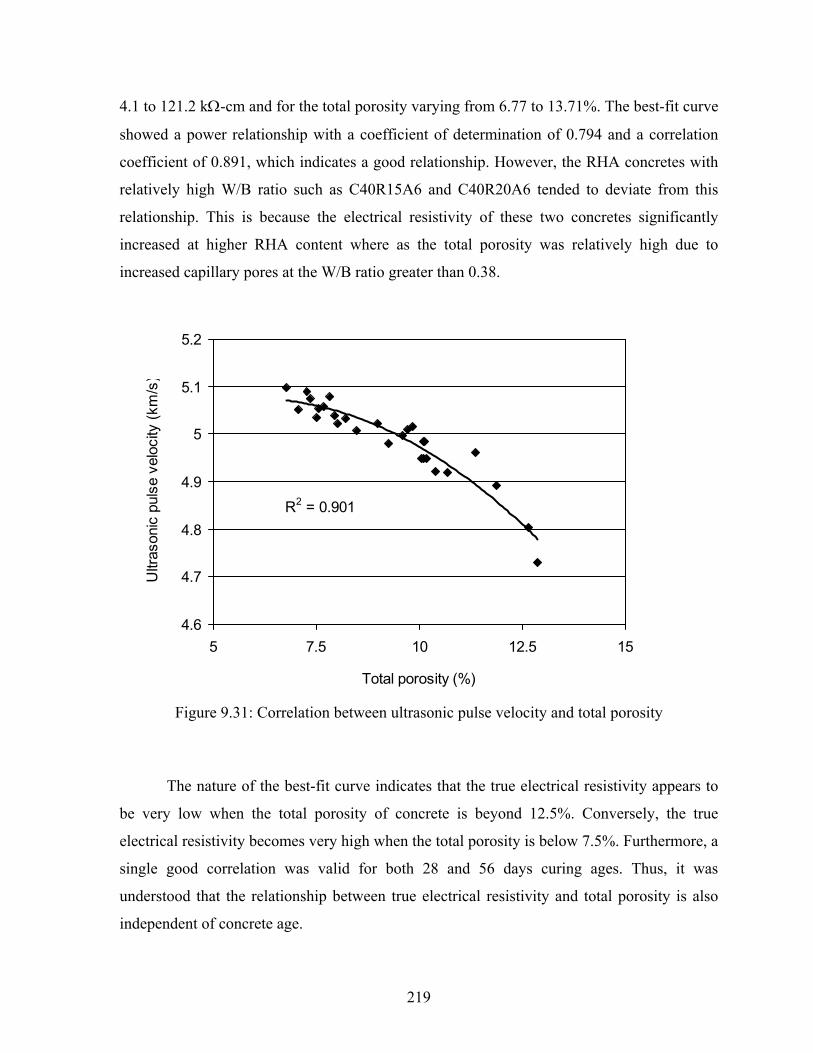
4.1 to 121.2 kΩ-cm and for the total porosity varying from 6.77 to 13.71%. The best-fit curve
showed a power relationship with a coefficient of determination of 0.794 and a correlation
coefficient of 0.891, which indicates a good relationship. However, the RHA concretes with
relatively high W/B ratio such as C40R15A6 and C40R20A6 tended to deviate from this
relationship. This is because the electrical resistivity of these two concretes significantly
increased at higher RHA content where as the total porosity was relatively high due to
increased capillary pores at the W/B ratio greater than 0.38.
R2 = 0.901
4.6
4.7
4.8
4.9
5
5.1
5.2
5 7.5 10 12.5 15
Total porosity (%)
Ultr
ason
ic p
ulse
vel
ocity
(km
/s)
Figure 9.31: Correlation between ultrasonic pulse velocity and total porosity
The nature of the best-fit curve indicates that the true electrical resistivity appears to
be very low when the total porosity of concrete is beyond 12.5%. Conversely, the true
electrical resistivity becomes very high when the total porosity is below 7.5%. Furthermore, a
single good correlation was valid for both 28 and 56 days curing ages. Thus, it was
understood that the relationship between true electrical resistivity and total porosity is also
independent of concrete age.
219
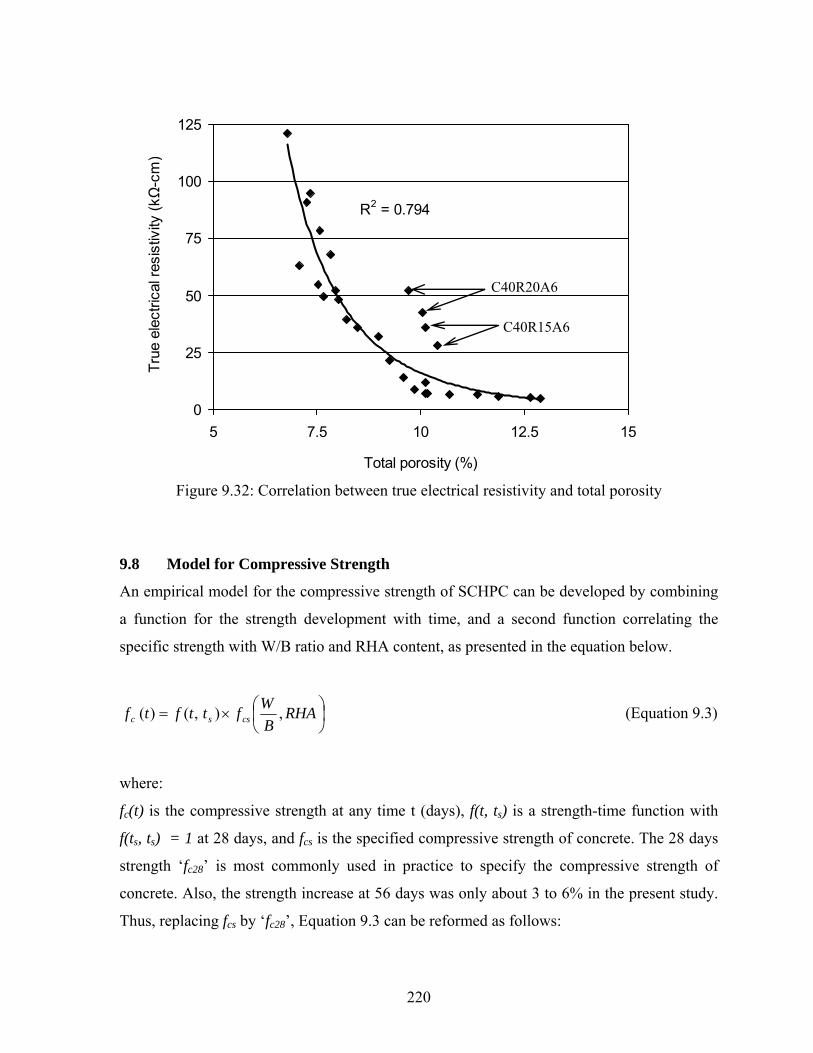
R2 = 0.794
0
25
50
75
100
125
5 7.5 10 12.5 15
Total porosity (%)
True
ele
ctric
al re
sist
ivity
(kΩ
-cm
)
C40R15A6
C40R20A6
Figure 9.32: Correlation between true electrical resistivity and total porosity
9.8 Model for Compressive Strength
An empirical model for the compressive strength of SCHPC can be developed by combining
a function for the strength development with time, and a second function correlating the
specific strength with W/B ratio and RHA content, as presented in the equation below.
⎟⎠⎞
⎜⎝⎛×= RHA
BWfttftf cssc ,),()( (Equation 9.3)
where:
fc(t) is the compressive strength at any time t (days), f(t, ts) is a strength-time function with
f(ts, ts) = 1 at 28 days, and fcs is the specified compressive strength of concrete. The 28 days
strength ‘fc28’ is most commonly used in practice to specify the compressive strength of
concrete. Also, the strength increase at 56 days was only about 3 to 6% in the present study.
Thus, replacing fcs by ‘fc28’, Equation 9.3 can be reformed as follows:
220
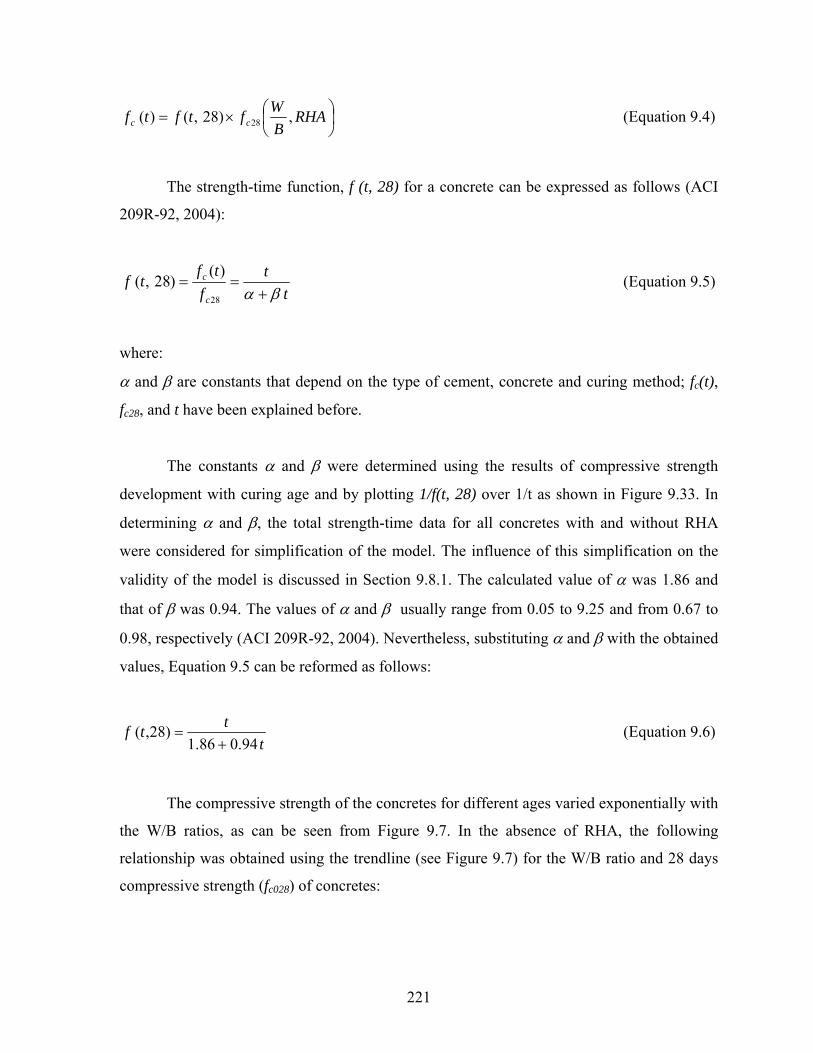
⎟⎠⎞
⎜⎝⎛×= RHA
BWftftf cc ,)28,()( 28 (Equation 9.4)
The strength-time function, f (t, 28) for a concrete can be expressed as follows (ACI
209R-92, 2004):
tt
ftf
tfc
c
βα +==
28
)()28,( (Equation 9.5)
where:
α and β are constants that depend on the type of cement, concrete and curing method; fc(t),
fc28, and t have been explained before.
The constants α and β were determined using the results of compressive strength
development with curing age and by plotting 1/f(t, 28) over 1/t as shown in Figure 9.33. In
determining α and β, the total strength-time data for all concretes with and without RHA
were considered for simplification of the model. The influence of this simplification on the
validity of the model is discussed in Section 9.8.1. The calculated value of α was 1.86 and
that of β was 0.94. The values of α and β usually range from 0.05 to 9.25 and from 0.67 to
0.98, respectively (ACI 209R-92, 2004). Nevertheless, substituting α and β with the obtained
values, Equation 9.5 can be reformed as follows:
tttf
94.086.1)28,(
+= (Equation 9.6)
The compressive strength of the concretes for different ages varied exponentially with
the W/B ratios, as can be seen from Figure 9.7. In the absence of RHA, the following
relationship was obtained using the trendline (see Figure 9.7) for the W/B ratio and 28 days
compressive strength (fc028) of concretes:
221
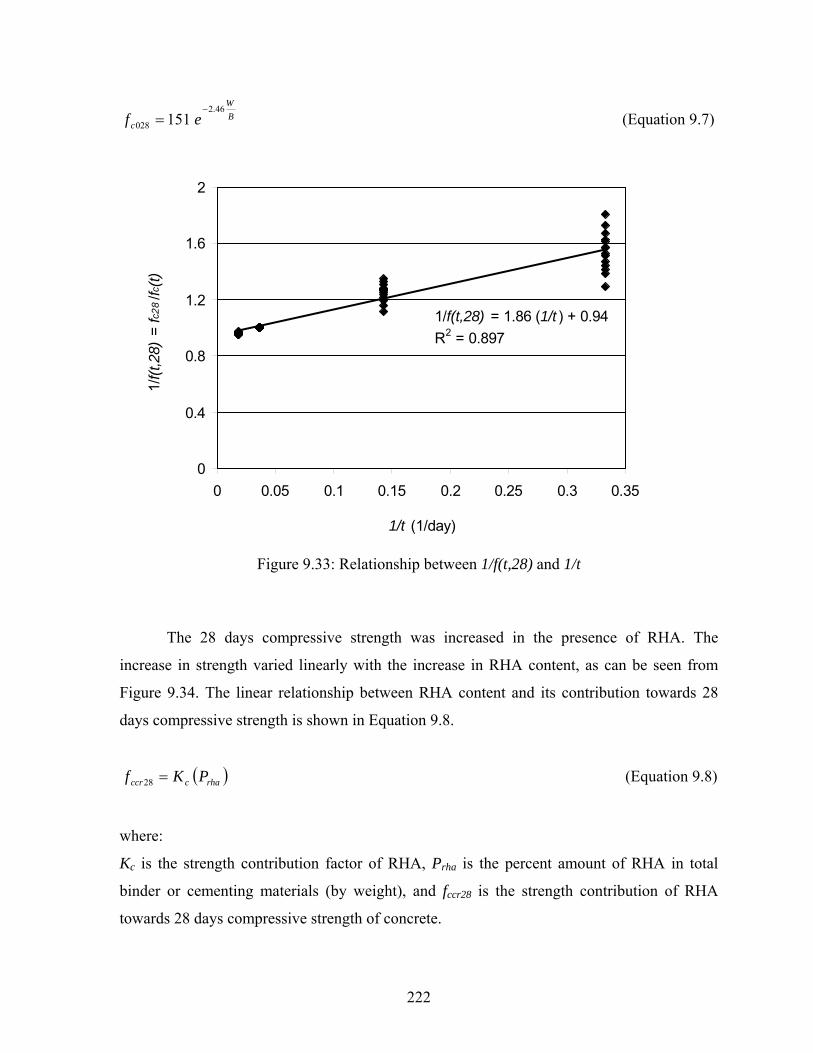
BW
c ef46.2
028 151−
= (Equation 9.7)
1/f(t,28) = 1.86 (1/t ) + 0.94R2 = 0.897
0
0.4
0.8
1.2
1.6
2
0 0.05 0.1 0.15 0.2 0.25 0.3 0.35
1/t (1/day)
1/f(t
,28)
= fc
28/fc
(t)
Figure 9.33: Relationship between 1/f(t,28) and 1/t
The 28 days compressive strength was increased in the presence of RHA. The
increase in strength varied linearly with the increase in RHA content, as can be seen from
Figure 9.34. The linear relationship between RHA content and its contribution towards 28
days compressive strength is shown in Equation 9.8.
( rhacccr PKf =28 ) (Equation 9.8)
where:
Kc is the strength contribution factor of RHA, Prha is the percent amount of RHA in total
binder or cementing materials (by weight), and fccr28 is the strength contribution of RHA
towards 28 days compressive strength of concrete.
222
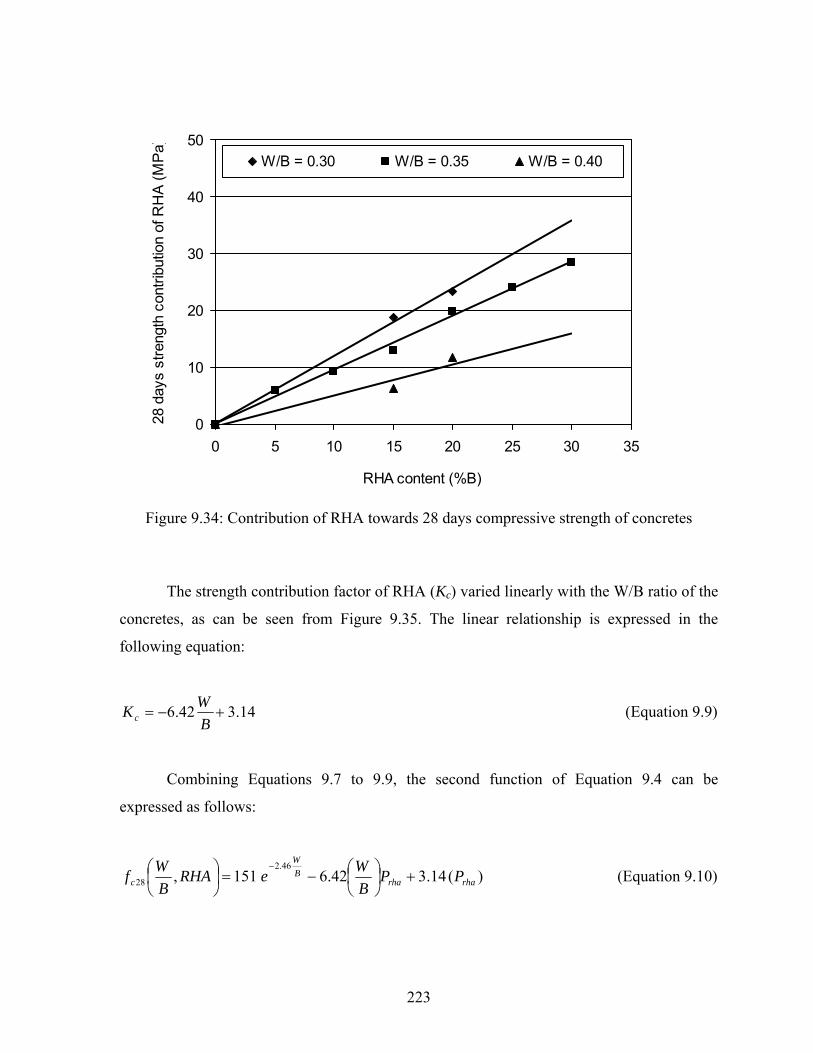
0
10
20
30
40
50
0 5 10 15 20 25 30 35
RHA content (%B)
28 d
ays
stre
ngth
con
tribu
tion
of R
HA
(MP
a)W/B = 0.30 W/B = 0.35 W/B = 0.40
Figure 9.34: Contribution of RHA towards 28 days compressive strength of concretes
The strength contribution factor of RHA (Kc) varied linearly with the W/B ratio of the
concretes, as can be seen from Figure 9.35. The linear relationship is expressed in the
following equation:
14.342.6 +−=BWKc (Equation 9.9)
Combining Equations 9.7 to 9.9, the second function of Equation 9.4 can be
expressed as follows:
)(14.342.6151,46.2
28 rharhaBW
c PPBWeRHA
BWf +⎟
⎠⎞
⎜⎝⎛−=⎟
⎠⎞
⎜⎝⎛ −
(Equation 9.10)
223
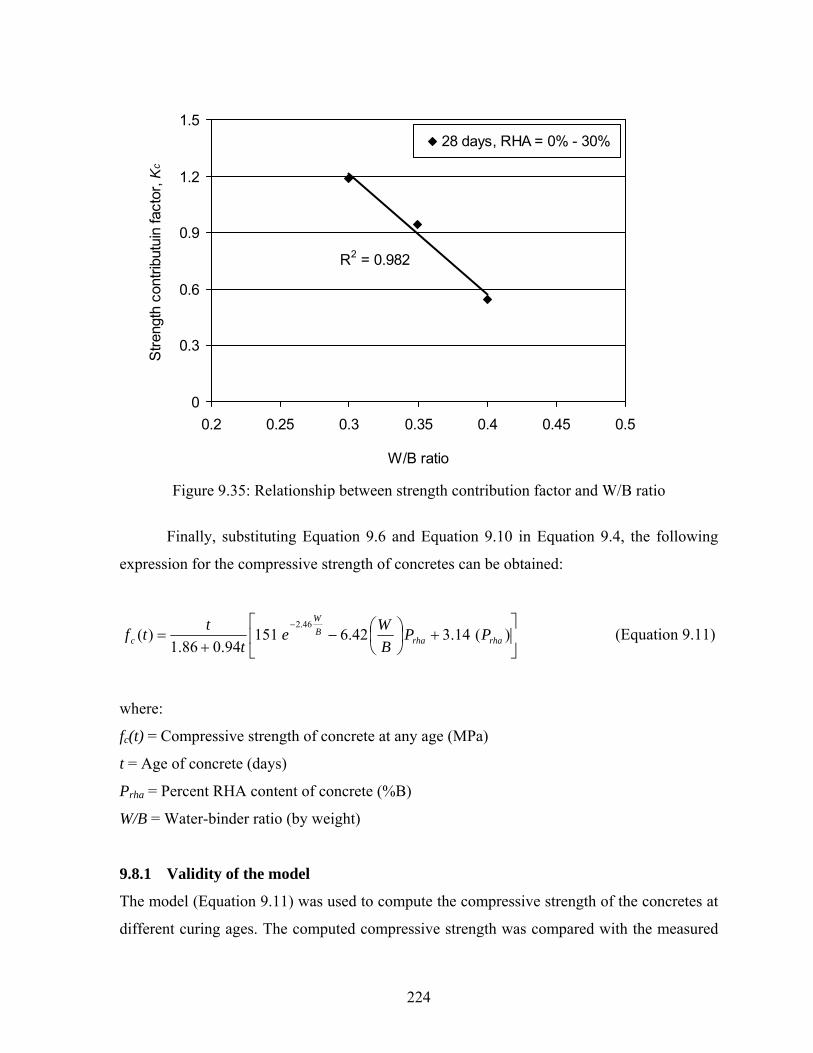
R2 = 0.982
0
0.3
0.6
0.9
1.2
1.5
0.2 0.25 0.3 0.35 0.4 0.45 0.5
W/B ratio
Stre
ngth
con
tribu
tuin
fact
or, K
c28 days, RHA = 0% - 30%
Figure 9.35: Relationship between strength contribution factor and W/B ratio
Finally, substituting Equation 9.6 and Equation 9.10 in Equation 9.4, the following
expression for the compressive strength of concretes can be obtained:
⎥⎦
⎤⎢⎣
⎡+⎟
⎠⎞
⎜⎝⎛−
+=
−)(14.342.6151
94.086.1)(
46.2
rharhaBW
c PPBWe
tttf (Equation 9.11)
where:
fc(t) = Compressive strength of concrete at any age (MPa)
t = Age of concrete (days)
Prha = Percent RHA content of concrete (%B)
W/B = Water-binder ratio (by weight)
9.8.1 Validity of the model
The model (Equation 9.11) was used to compute the compressive strength of the concretes at
different curing ages. The computed compressive strength was compared with the measured
224
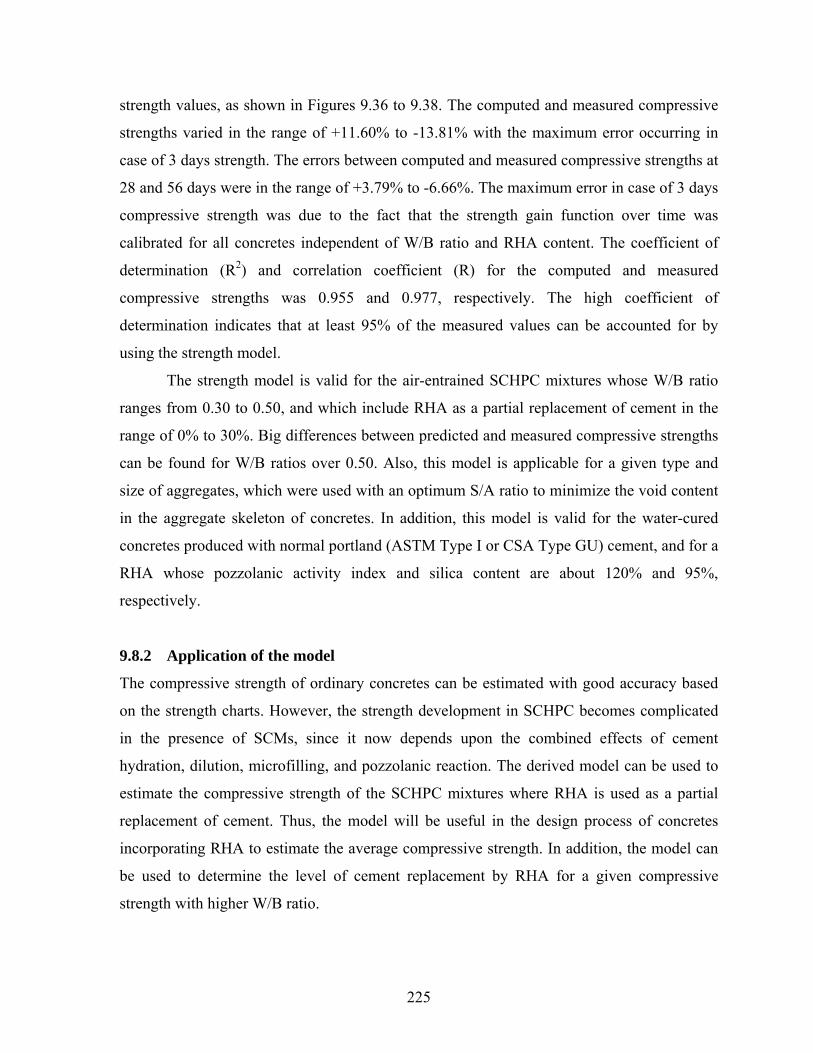
strength values, as shown in Figures 9.36 to 9.38. The computed and measured compressive
strengths varied in the range of +11.60% to -13.81% with the maximum error occurring in
case of 3 days strength. The errors between computed and measured compressive strengths at
28 and 56 days were in the range of +3.79% to -6.66%. The maximum error in case of 3 days
compressive strength was due to the fact that the strength gain function over time was
calibrated for all concretes independent of W/B ratio and RHA content. The coefficient of
determination (R2) and correlation coefficient (R) for the computed and measured
compressive strengths was 0.955 and 0.977, respectively. The high coefficient of
determination indicates that at least 95% of the measured values can be accounted for by
using the strength model.
The strength model is valid for the air-entrained SCHPC mixtures whose W/B ratio
ranges from 0.30 to 0.50, and which include RHA as a partial replacement of cement in the
range of 0% to 30%. Big differences between predicted and measured compressive strengths
can be found for W/B ratios over 0.50. Also, this model is applicable for a given type and
size of aggregates, which were used with an optimum S/A ratio to minimize the void content
in the aggregate skeleton of concretes. In addition, this model is valid for the water-cured
concretes produced with normal portland (ASTM Type I or CSA Type GU) cement, and for a
RHA whose pozzolanic activity index and silica content are about 120% and 95%,
respectively.
9.8.2 Application of the model
The compressive strength of ordinary concretes can be estimated with good accuracy based
on the strength charts. However, the strength development in SCHPC becomes complicated
in the presence of SCMs, since it now depends upon the combined effects of cement
hydration, dilution, microfilling, and pozzolanic reaction. The derived model can be used to
estimate the compressive strength of the SCHPC mixtures where RHA is used as a partial
replacement of cement. Thus, the model will be useful in the design process of concretes
incorporating RHA to estimate the average compressive strength. In addition, the model can
be used to determine the level of cement replacement by RHA for a given compressive
strength with higher W/B ratio.
225
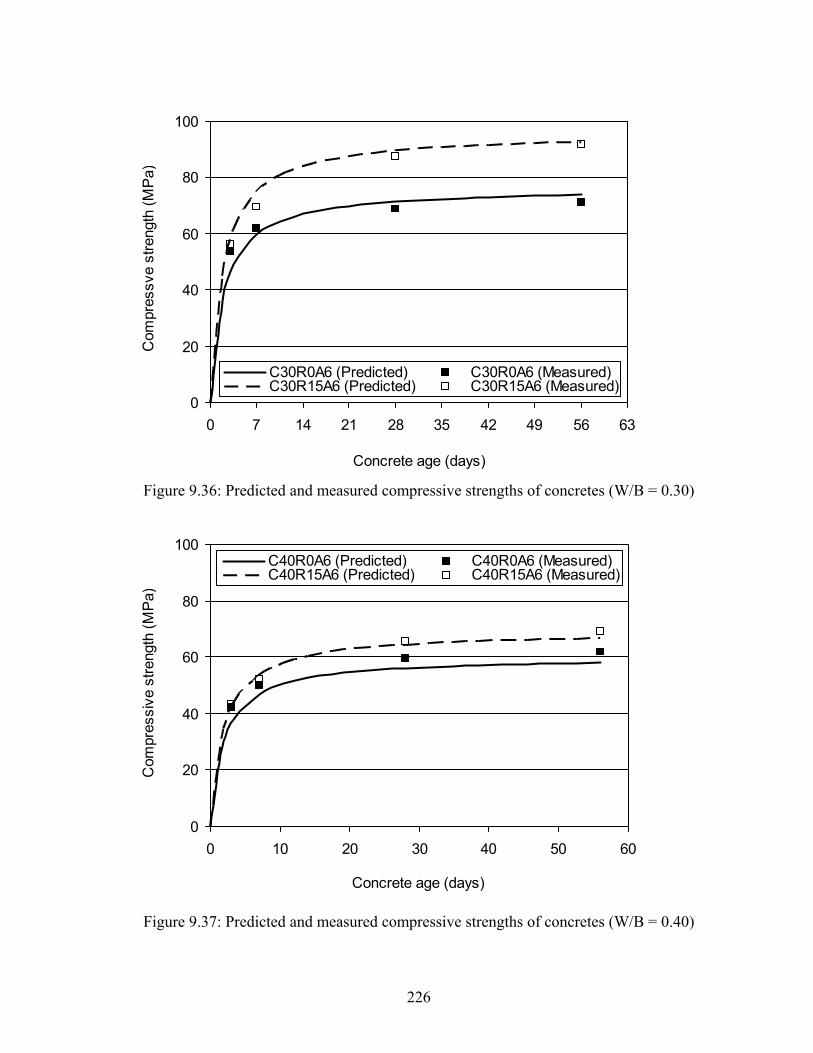
0
20
40
60
80
100
0 7 14 21 28 35 42 49 56 63
Concrete age (days)
Com
pres
sve
stre
ngth
(MP
a)
C30R0A6 (Predicted) C30R0A6 (Measured)C30R15A6 (Predicted) C30R15A6 (Measured)
Figure 9.36: Predicted and measured compressive strengths of concretes (W/B = 0.30)
0
20
40
60
80
100
0 10 20 30 40 50 6
Concrete age (days)
Com
pres
sive
stre
ngth
(MP
a
0
)
C40R0A6 (Predicted) C40R0A6 (Measured)C40R15A6 (Predicted) C40R15A6 (Measured)
Figure 9.37: Predicted and measured compressive strengths of concretes (W/B = 0.40)
226
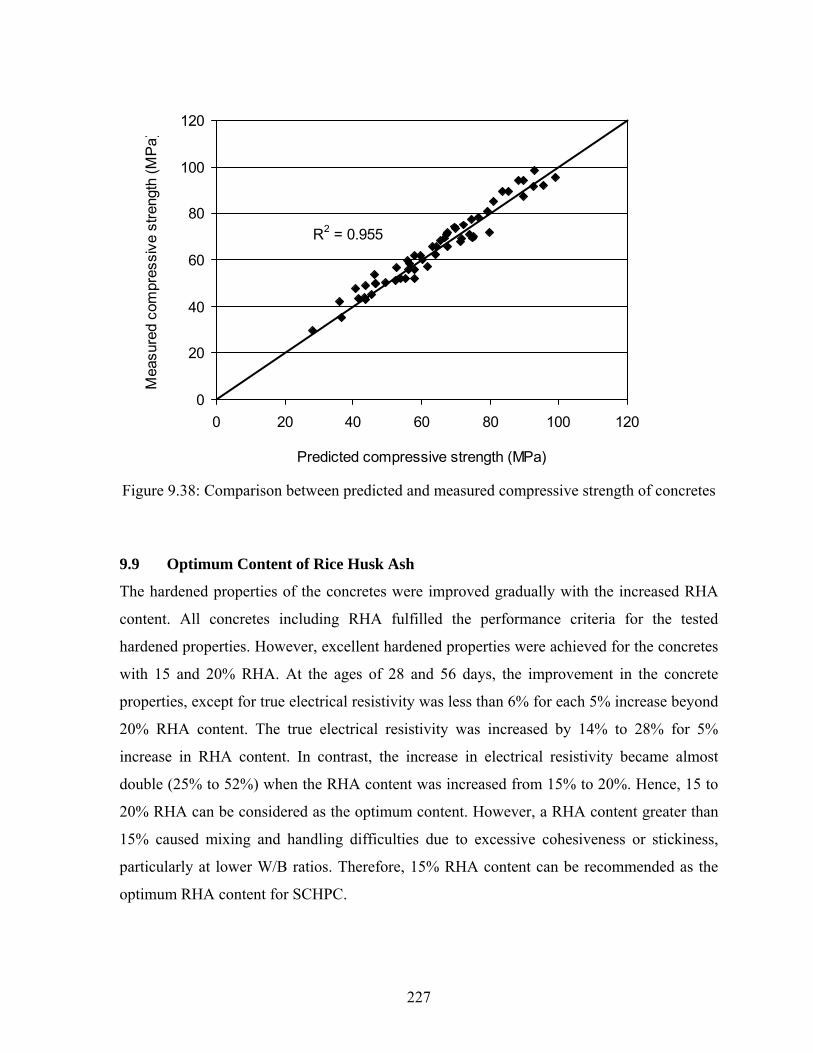
0
20
40
60
80
100
120
0 20 40 60 80 100 120
Predicted compressive strength (MPa)
Mea
sure
d co
mpr
essi
ve s
treng
th (M
Pa)
R2 = 0.955
Figure 9.38: Comparison between predicted and measured compressive strength of concretes
9.9 Optimum Content of Rice Husk Ash
The hardened properties of the concretes were improved gradually with the increased RHA
content. All concretes including RHA fulfilled the performance criteria for the tested
hardened properties. However, excellent hardened properties were achieved for the concretes
with 15 and 20% RHA. At the ages of 28 and 56 days, the improvement in the concrete
properties, except for true electrical resistivity was less than 6% for each 5% increase beyond
20% RHA content. The true electrical resistivity was increased by 14% to 28% for 5%
increase in RHA content. In contrast, the increase in electrical resistivity became almost
double (25% to 52%) when the RHA content was increased from 15% to 20%. Hence, 15 to
20% RHA can be considered as the optimum content. However, a RHA content greater than
15% caused mixing and handling difficulties due to excessive cohesiveness or stickiness,
particularly at lower W/B ratios. Therefore, 15% RHA content can be recommended as the
optimum RHA content for SCHPC.
227
9.10 Conclusions
a. The hardened properties of the SCHPCs were improved at later ages such as 28 and 56
days due to greater hydration of cement and enhanced pozzolanic activity of RHA.
b. The hardened properties of the SCHPCs were improved with lower W/B ratio due to
improved paste densification resulting from greater hydration products in the presence of
higher binder content.
c. The hardened properties of the SCHPCs were improved with higher RHA content due to
the microfilling and pozzolanic effects of rice husk ash.
d. The total porosity of the SCHPCs was decreased with lower W/B ratio and higher RHA
content, and thus it increased the compressive strength, ultrasonic pulse velocity and
electrical resistivity, and decreased the water absorption of concrete.
e. The hardened properties of the SCHPCs were progressively improved with the increase
in RHA content. However, the performance criteria for all targeted hardened properties
were fulfilled at 15%, which was also suitable for the fresh properties of SCHPC except
for static segregation resistance.
f. The increased air content decreased the compressive strength of SCHPC since the air-
voids increased the void content of concrete. Also, the increase in air content decreased
the ultrasonic pulse velocity of SCHPC, as the increased amount of air-voids delayed the
propagation of ultrasonic pulse.
g. The higher air content decreased the total porosity of SCHPC to some extent probably
due to the reduced capillary porosity in the presence of entrained air-voids, and thus
provided lower water absorption and higher electrical resistivity in concrete.
h. The test results for the compressive strength, total porosity, ultrasonic pulse velocity,
water absorption and true electrical resistivity of the SCHPCs including RHA indicated
good durability.
i. Good correlations were observed among the hardened properties of SCHPC and these
correlations were independent of the curing age of concrete.
j. The compressive strength computed based on the derived model varied in the range of
+11.6% to -13.81% as compared to the measured strength of the SCHPCs. At least 95%
of the measured compressive strengths were accounted for with the derived model.
228
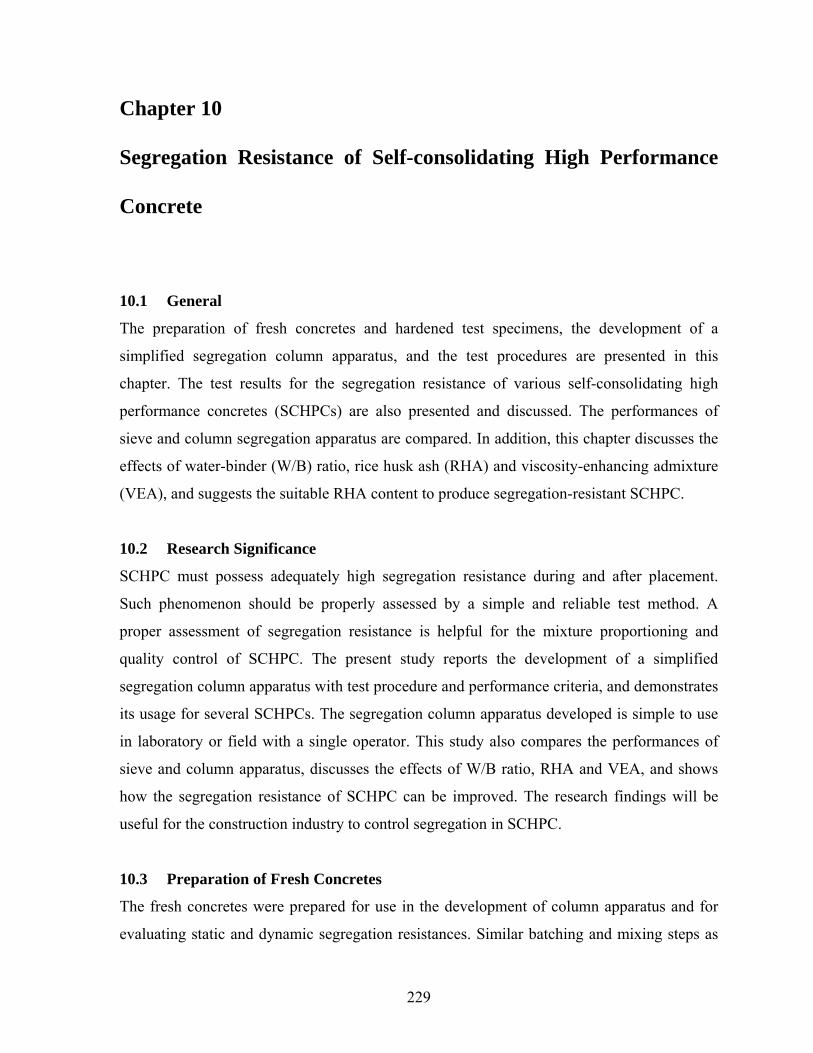
Chapter 10
Segregation Resistance of Self-consolidating High Performance
Concrete
10.1 General
The preparation of fresh concretes and hardened test specimens, the development of a
simplified segregation column apparatus, and the test procedures are presented in this
chapter. The test results for the segregation resistance of various self-consolidating high
performance concretes (SCHPCs) are also presented and discussed. The performances of
sieve and column segregation apparatus are compared. In addition, this chapter discusses the
effects of water-binder (W/B) ratio, rice husk ash (RHA) and viscosity-enhancing admixture
(VEA), and suggests the suitable RHA content to produce segregation-resistant SCHPC.
10.2 Research Significance
SCHPC must possess adequately high segregation resistance during and after placement.
Such phenomenon should be properly assessed by a simple and reliable test method. A
proper assessment of segregation resistance is helpful for the mixture proportioning and
quality control of SCHPC. The present study reports the development of a simplified
segregation column apparatus with test procedure and performance criteria, and demonstrates
its usage for several SCHPCs. The segregation column apparatus developed is simple to use
in laboratory or field with a single operator. This study also compares the performances of
sieve and column apparatus, discusses the effects of W/B ratio, RHA and VEA, and shows
how the segregation resistance of SCHPC can be improved. The research findings will be
useful for the construction industry to control segregation in SCHPC.
10.3 Preparation of Fresh Concretes
The fresh concretes were prepared for use in the development of column apparatus and for
evaluating static and dynamic segregation resistances. Similar batching and mixing steps as
229

described in Chapter 8 were followed except for the addition of VEA. The VEA was added
with the initial mixing water for a limited number of concrete mixtures. The mixture
proportions of the concretes are given in Chapter 7.
10.4 Development of Segregation Column Apparatus
The segregation column apparatus for measuring the static segregation resistance of concrete
was developed through trial and error by testing several batches of the non-air-entrained
SCHPC (C50R0A2) prepared with a W/B ratio of 0.50. The experimental investigation was
carried out to establish the column size, test procedure and performance criteria.
10.4.1 Different types of segregation column
The column size (height and diameter) and the number of column sections were varied, as
shown in Table 10.1. The circular shape was selected for all columns to minimize the corner
effects. The maximum column height of 600 mm was chosen to minimize the susceptibility
of dynamic segregation, since the separation of coarse aggregates may occur when the
concrete is discharged from a height greater than 600 mm (ACI 304R-00, 2004). The
diameter of the columns was also varied because the lateral dimension may be related to
concrete blocking and aggregate settlement. The material for all columns was poly-vinyl
chloride (PVC). Different types of segregation column are shown in Figure 10.1.
Table 10.1: Different types of segregation column and methods of filling Column designation
Column size Number of sections
Method of filling Comments
C13 100D∗×450H♣ 3 Scooping H/D: 4.5 C23 150D×450H 3 Scooping H/D: 3.0 C33 100D×600H 3 Scooping H/D: 6.0 C44 100D×600H 4 Scooping H/D: 6.0 C53 150D×600H 3 Scooping H/D: 4.0 C64 150D×600H 4 Scooping H/D: 4.0 C64/ISC 150D×600H 4 Scooping
through inverted slump cone (ISC)
C64/O 150D×600H 4 Scooping through orimet (O)
Column dimensions and number of sections are known after testing the segregation columns C13 to C64.
∗Column diameter (mm); ♣Column height (mm)
230
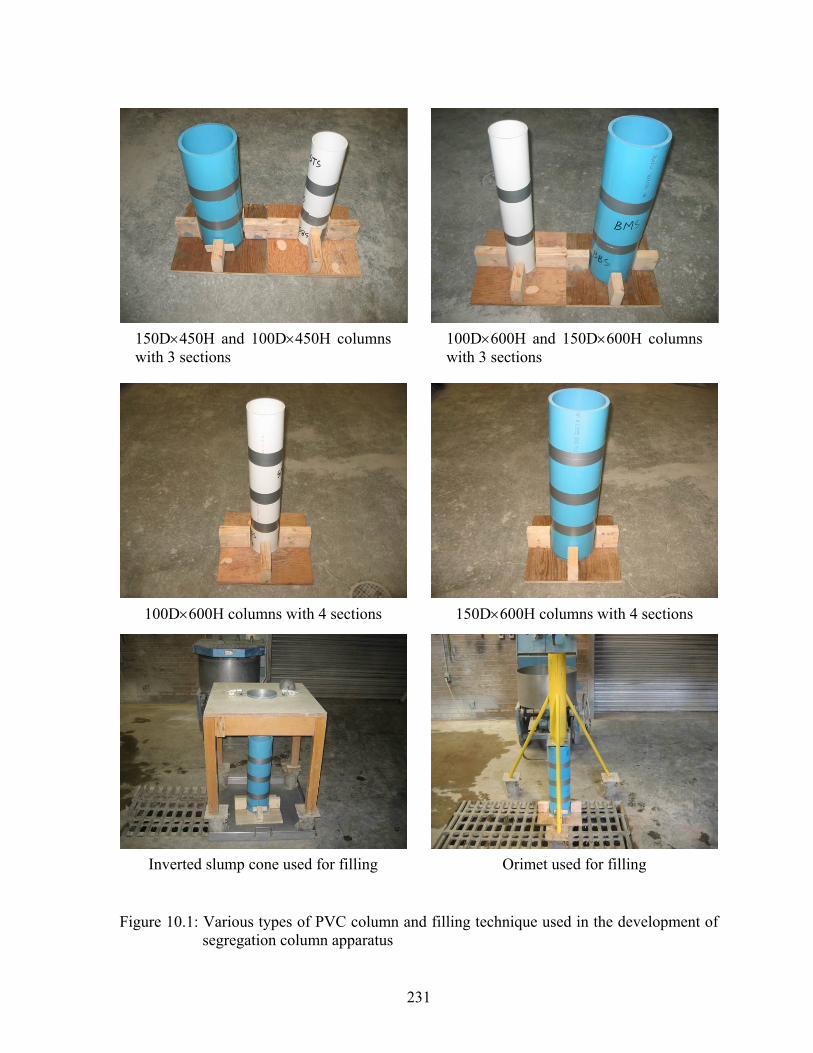
150D×450H and 100D×450H columns with 3 sections
100D×600H and 150D×600H columns with 3 sections
100D×600H columns with 4 sections 150D×600H columns with 4 sections
Inverted slump cone used for filling Orimet used for filling
Figure 10.1: Various types of PVC column and filling technique used in the development of
segregation column apparatus
231
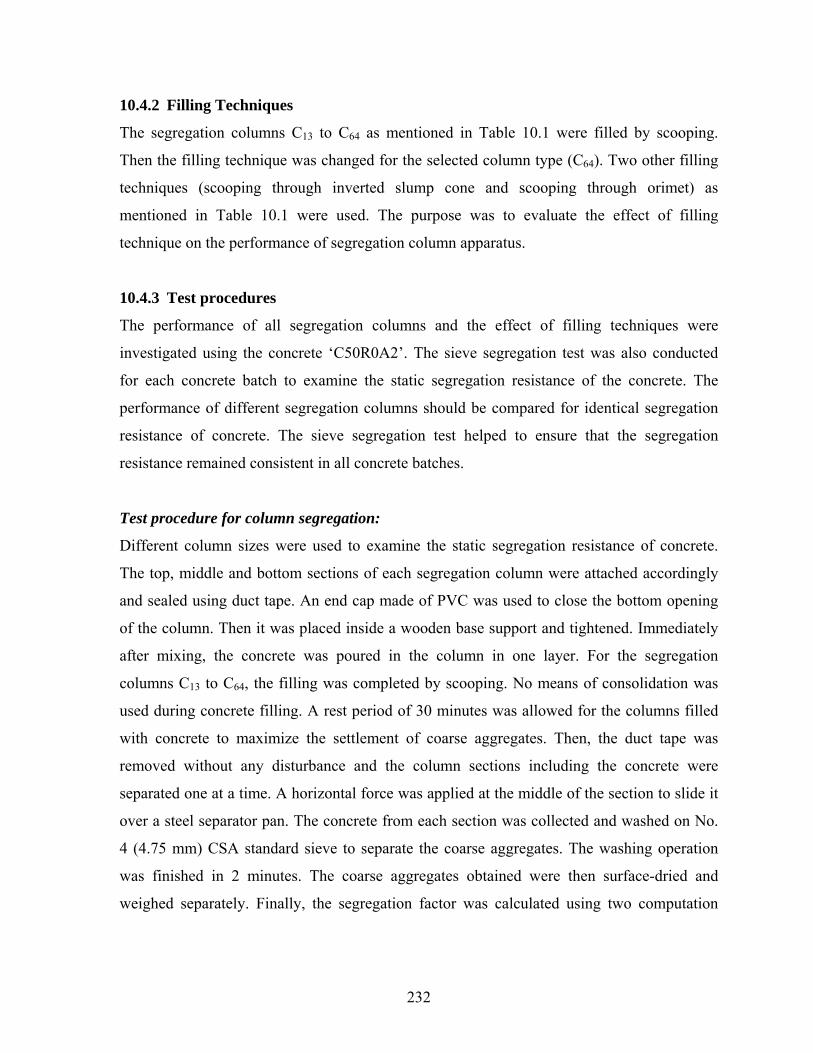
10.4.2 Filling Techniques
The segregation columns C13 to C64 as mentioned in Table 10.1 were filled by scooping.
Then the filling technique was changed for the selected column type (C64). Two other filling
techniques (scooping through inverted slump cone and scooping through orimet) as
mentioned in Table 10.1 were used. The purpose was to evaluate the effect of filling
technique on the performance of segregation column apparatus.
10.4.3 Test procedures
The performance of all segregation columns and the effect of filling techniques were
investigated using the concrete ‘C50R0A2’. The sieve segregation test was also conducted
for each concrete batch to examine the static segregation resistance of the concrete. The
performance of different segregation columns should be compared for identical segregation
resistance of concrete. The sieve segregation test helped to ensure that the segregation
resistance remained consistent in all concrete batches.
Test procedure for column segregation:
Different column sizes were used to examine the static segregation resistance of concrete.
The top, middle and bottom sections of each segregation column were attached accordingly
and sealed using duct tape. An end cap made of PVC was used to close the bottom opening
of the column. Then it was placed inside a wooden base support and tightened. Immediately
after mixing, the concrete was poured in the column in one layer. For the segregation
columns C13 to C64, the filling was completed by scooping. No means of consolidation was
used during concrete filling. A rest period of 30 minutes was allowed for the columns filled
with concrete to maximize the settlement of coarse aggregates. Then, the duct tape was
removed without any disturbance and the column sections including the concrete were
separated one at a time. A horizontal force was applied at the middle of the section to slide it
over a steel separator pan. The concrete from each section was collected and washed on No.
4 (4.75 mm) CSA standard sieve to separate the coarse aggregates. The washing operation
was finished in 2 minutes. The coarse aggregates obtained were then surface-dried and
weighed separately. Finally, the segregation factor was calculated using two computation
232
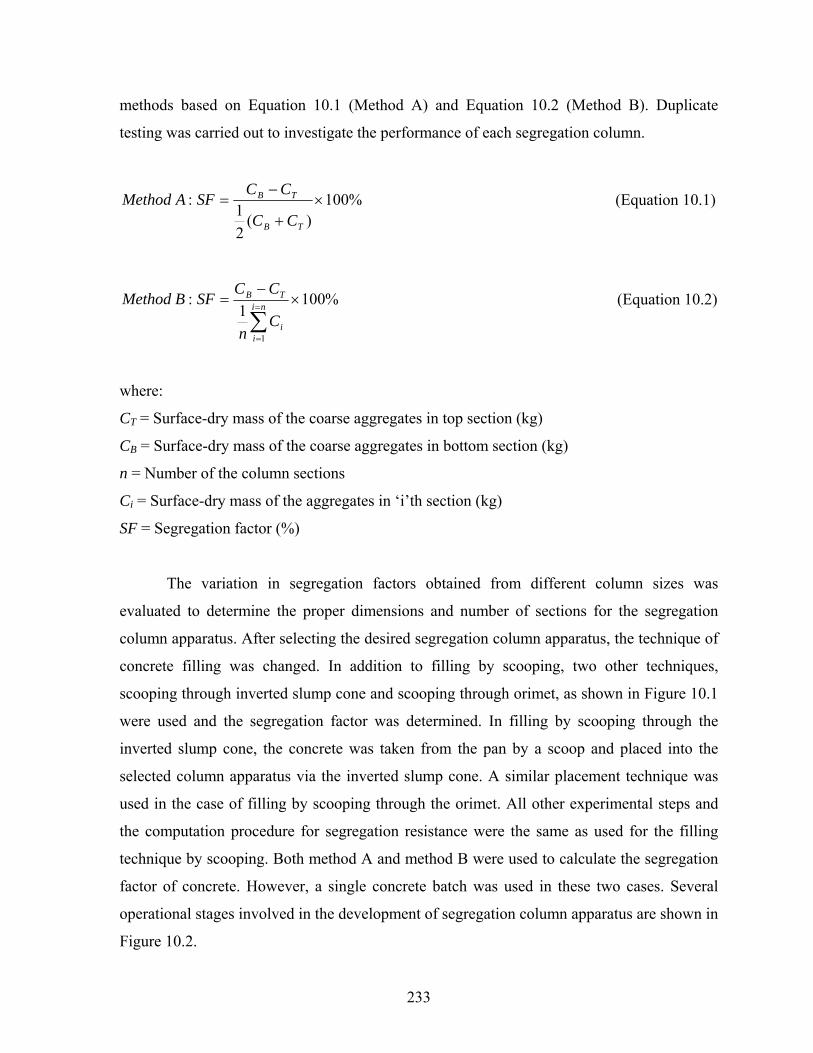
methods based on Equation 10.1 (Method A) and Equation 10.2 (Method B). Duplicate
testing was carried out to investigate the performance of each segregation column.
%100)(
21
: ×+
−=
TB
TB
CC
CCSFAMethod (Equation 10.1)
%1001
:
1
×−
=
∑=
=
ni
ii
TB
Cn
CCSFBMethod (Equation 10.2)
where:
CT = Surface-dry mass of the coarse aggregates in top section (kg)
CB = Surface-dry mass of the coarse aggregates in bottom section (kg) B
n = Number of the column sections
Ci = Surface-dry mass of the aggregates in ‘i’th section (kg)
SF = Segregation factor (%)
The variation in segregation factors obtained from different column sizes was
evaluated to determine the proper dimensions and number of sections for the segregation
column apparatus. After selecting the desired segregation column apparatus, the technique of
concrete filling was changed. In addition to filling by scooping, two other techniques,
scooping through inverted slump cone and scooping through orimet, as shown in Figure 10.1
were used and the segregation factor was determined. In filling by scooping through the
inverted slump cone, the concrete was taken from the pan by a scoop and placed into the
selected column apparatus via the inverted slump cone. A similar placement technique was
used in the case of filling by scooping through the orimet. All other experimental steps and
the computation procedure for segregation resistance were the same as used for the filling
technique by scooping. Both method A and method B were used to calculate the segregation
factor of concrete. However, a single concrete batch was used in these two cases. Several
operational stages involved in the development of segregation column apparatus are shown in
Figure 10.2.
233
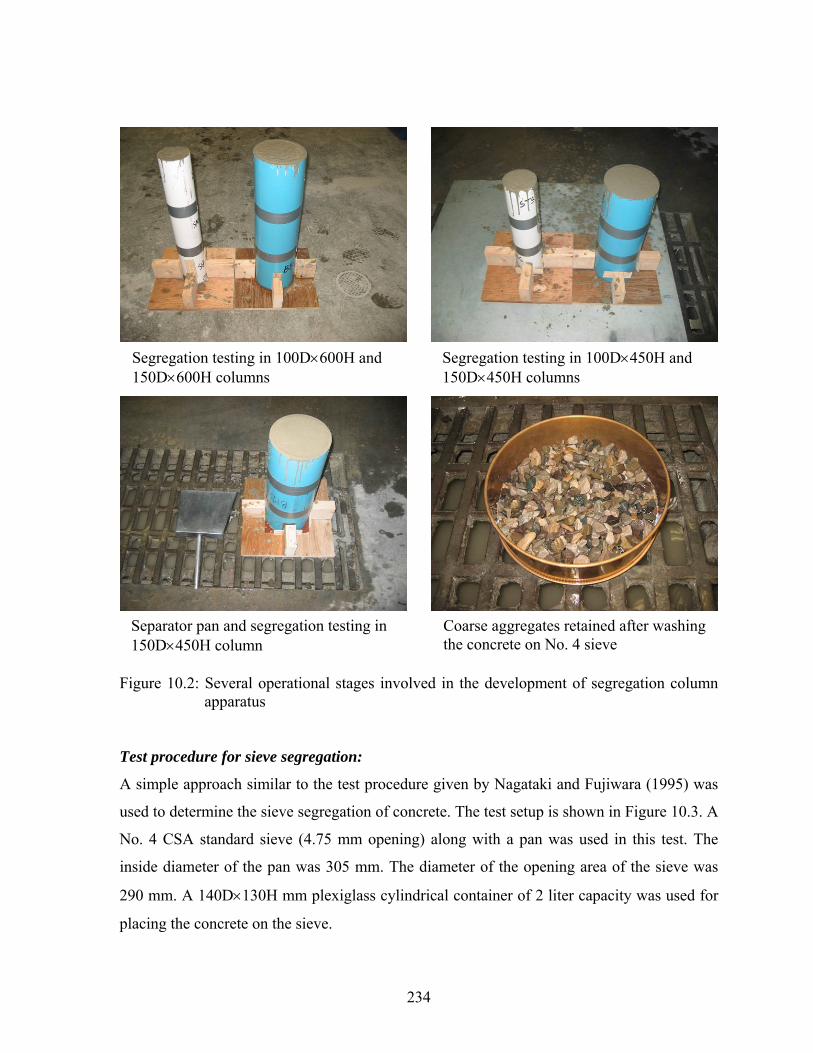
Segregation testing in 100D×600H and 150D×600H columns
Segregation testing in 100D×450H and 150D×450H columns
Separator pan and segregation testing in 150D×450H column
Coarse aggregates retained after washing the concrete on No. 4 sieve
Figure 10.2: Several operational stages involved in the development of segregation column apparatus
Test procedure for sieve segregation:
A simple approach similar to the test procedure given by Nagataki and Fujiwara (1995) was
used to determine the sieve segregation of concrete. The test setup is shown in Figure 10.3. A
No. 4 CSA standard sieve (4.75 mm opening) along with a pan was used in this test. The
inside diameter of the pan was 305 mm. The diameter of the opening area of the sieve was
290 mm. A 140D×130H mm plexiglass cylindrical container of 2 liter capacity was used for
placing the concrete on the sieve.
234

Apparatus for sieve segregation test Initial stage of sieve segregation test
Mortar passed through sieve Coarse aggregates retained on sieve
Figure 10.3: Apparatus and several operational stages of the sieve segregation test
The sieve and pan were weighed. Then the sieve was placed over the pan. The
concrete was poured into the cylindrical container in one layer and without any
consolidation. Immediately, the concrete was gently emptied onto the sieve without any
disturbance and left for 5 minutes rest. A fraction of the mortar passed through the sieve
during this time. After the rest period, the sieve and pan assembly including the concrete was
weighed. The mass of the concrete sample was determined by subtracting the masses of the
sieve and pan. Then the sieve was removed with the leftover concrete. The pan along with
the mortar fraction passed was weighed, and the mass of the mortar was determined by
subtracting the mass of the pan. Later, the leftover concrete on No. 4 sieve was washed to
235
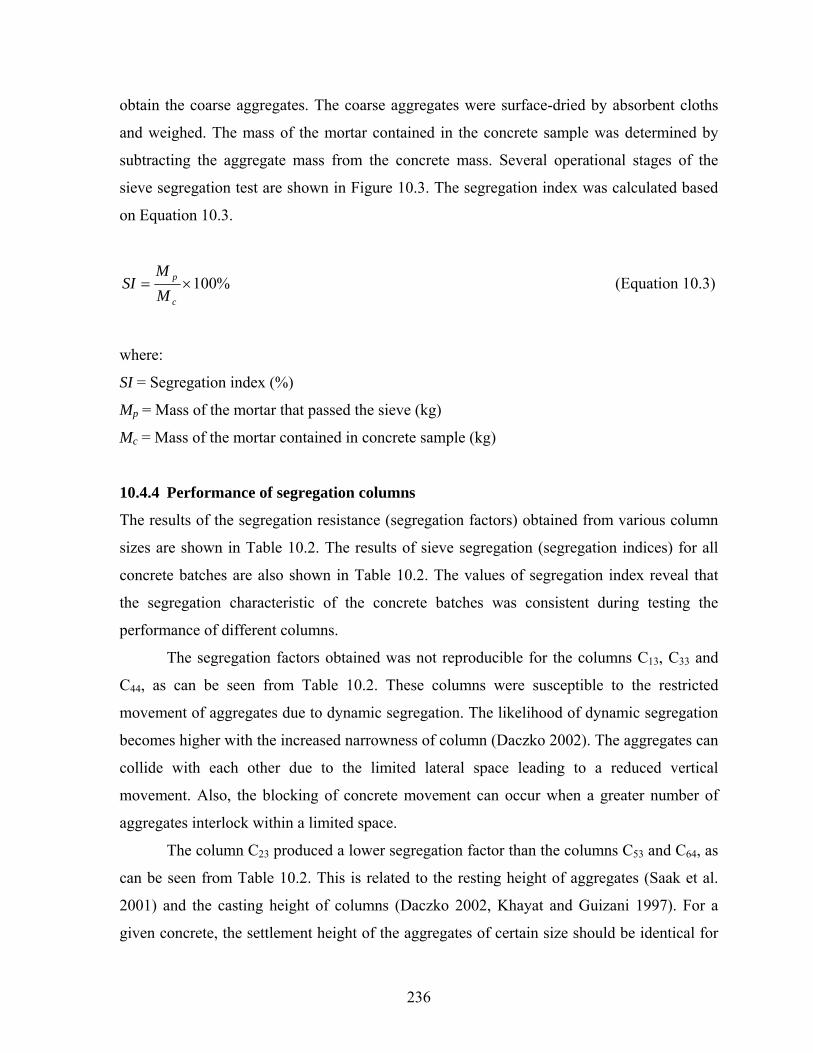
obtain the coarse aggregates. The coarse aggregates were surface-dried by absorbent cloths
and weighed. The mass of the mortar contained in the concrete sample was determined by
subtracting the aggregate mass from the concrete mass. Several operational stages of the
sieve segregation test are shown in Figure 10.3. The segregation index was calculated based
on Equation 10.3.
%100×=c
p
MM
SI (Equation 10.3)
where:
SI = Segregation index (%)
Mp = Mass of the mortar that passed the sieve (kg)
Mc = Mass of the mortar contained in concrete sample (kg)
10.4.4 Performance of segregation columns
The results of the segregation resistance (segregation factors) obtained from various column
sizes are shown in Table 10.2. The results of sieve segregation (segregation indices) for all
concrete batches are also shown in Table 10.2. The values of segregation index reveal that
the segregation characteristic of the concrete batches was consistent during testing the
performance of different columns.
The segregation factors obtained was not reproducible for the columns C13, C33 and
C44, as can be seen from Table 10.2. These columns were susceptible to the restricted
movement of aggregates due to dynamic segregation. The likelihood of dynamic segregation
becomes higher with the increased narrowness of column (Daczko 2002). The aggregates can
collide with each other due to the limited lateral space leading to a reduced vertical
movement. Also, the blocking of concrete movement can occur when a greater number of
aggregates interlock within a limited space.
The column C23 produced a lower segregation factor than the columns C53 and C64, as
can be seen from Table 10.2. This is related to the resting height of aggregates (Saak et al.
2001) and the casting height of columns (Daczko 2002, Khayat and Guizani 1997). For a
given concrete, the settlement height of the aggregates of certain size should be identical for
236
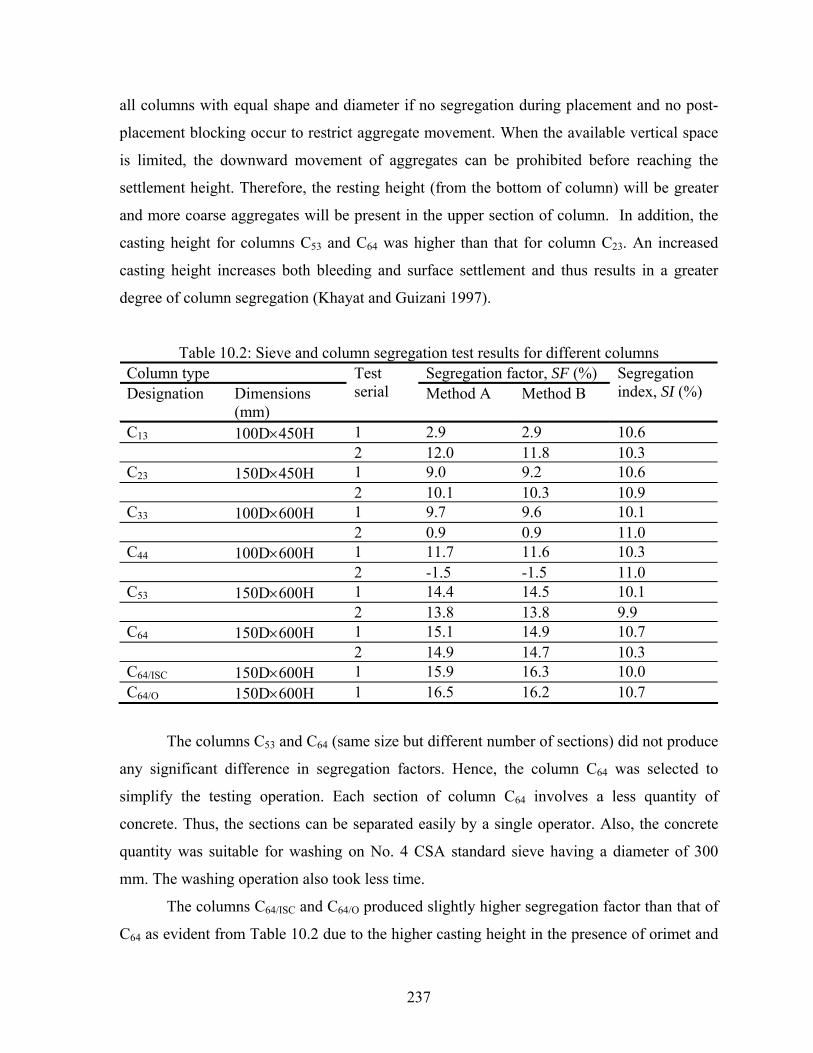
all columns with equal shape and diameter if no segregation during placement and no post-
placement blocking occur to restrict aggregate movement. When the available vertical space
is limited, the downward movement of aggregates can be prohibited before reaching the
settlement height. Therefore, the resting height (from the bottom of column) will be greater
and more coarse aggregates will be present in the upper section of column. In addition, the
casting height for columns C53 and C64 was higher than that for column C23. An increased
casting height increases both bleeding and surface settlement and thus results in a greater
degree of column segregation (Khayat and Guizani 1997).
Table 10.2: Sieve and column segregation test results for different columns Column type Segregation factor, SF (%) Designation Dimensions
(mm)
Test serial Method A Method B
Segregation index, SI (%)
C13 100D×450H 1 2.9 2.9 10.6 2 12.0 11.8 10.3 C23 150D×450H 1 9.0 9.2 10.6 2 10.1 10.3 10.9 C33 100D×600H 1 9.7 9.6 10.1 2 0.9 0.9 11.0 C44 100D×600H 1 11.7 11.6 10.3 2 -1.5 -1.5 11.0 C53 150D×600H 1 14.4 14.5 10.1 2 13.8 13.8 9.9 C64 150D×600H 1 15.1 14.9 10.7 2 14.9 14.7 10.3 C64/ISC 150D×600H 1 15.9 16.3 10.0 C64/O 150D×600H 1 16.5 16.2 10.7
The columns C53 and C64 (same size but different number of sections) did not produce
any significant difference in segregation factors. Hence, the column C64 was selected to
simplify the testing operation. Each section of column C64 involves a less quantity of
concrete. Thus, the sections can be separated easily by a single operator. Also, the concrete
quantity was suitable for washing on No. 4 CSA standard sieve having a diameter of 300
mm. The washing operation also took less time.
The columns C64/ISC and C64/O produced slightly higher segregation factor than that of
C64 as evident from Table 10.2 due to the higher casting height in the presence of orimet and
237
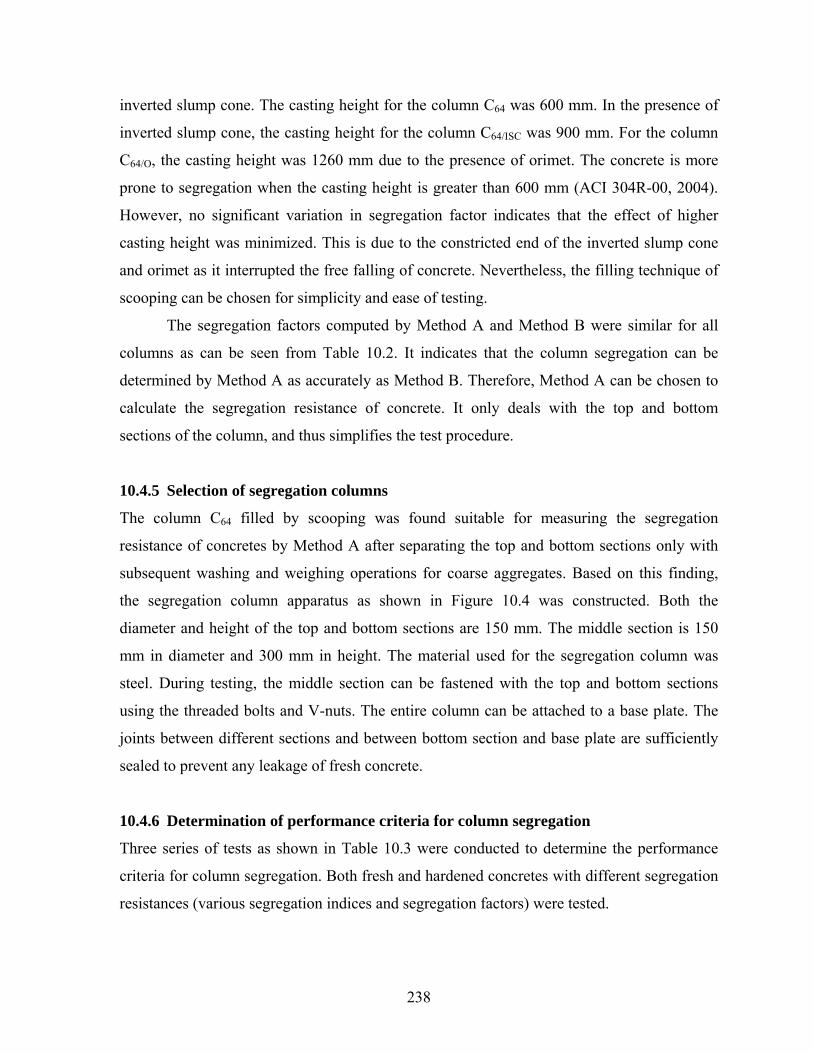
inverted slump cone. The casting height for the column C64 was 600 mm. In the presence of
inverted slump cone, the casting height for the column C64/ISC was 900 mm. For the column
C64/O, the casting height was 1260 mm due to the presence of orimet. The concrete is more
prone to segregation when the casting height is greater than 600 mm (ACI 304R-00, 2004).
However, no significant variation in segregation factor indicates that the effect of higher
casting height was minimized. This is due to the constricted end of the inverted slump cone
and orimet as it interrupted the free falling of concrete. Nevertheless, the filling technique of
scooping can be chosen for simplicity and ease of testing.
The segregation factors computed by Method A and Method B were similar for all
columns as can be seen from Table 10.2. It indicates that the column segregation can be
determined by Method A as accurately as Method B. Therefore, Method A can be chosen to
calculate the segregation resistance of concrete. It only deals with the top and bottom
sections of the column, and thus simplifies the test procedure.
10.4.5 Selection of segregation columns
The column C64 filled by scooping was found suitable for measuring the segregation
resistance of concretes by Method A after separating the top and bottom sections only with
subsequent washing and weighing operations for coarse aggregates. Based on this finding,
the segregation column apparatus as shown in Figure 10.4 was constructed. Both the
diameter and height of the top and bottom sections are 150 mm. The middle section is 150
mm in diameter and 300 mm in height. The material used for the segregation column was
steel. During testing, the middle section can be fastened with the top and bottom sections
using the threaded bolts and V-nuts. The entire column can be attached to a base plate. The
joints between different sections and between bottom section and base plate are sufficiently
sealed to prevent any leakage of fresh concrete.
10.4.6 Determination of performance criteria for column segregation
Three series of tests as shown in Table 10.3 were conducted to determine the performance
criteria for column segregation. Both fresh and hardened concretes with different segregation
resistances (various segregation indices and segregation factors) were tested.
238
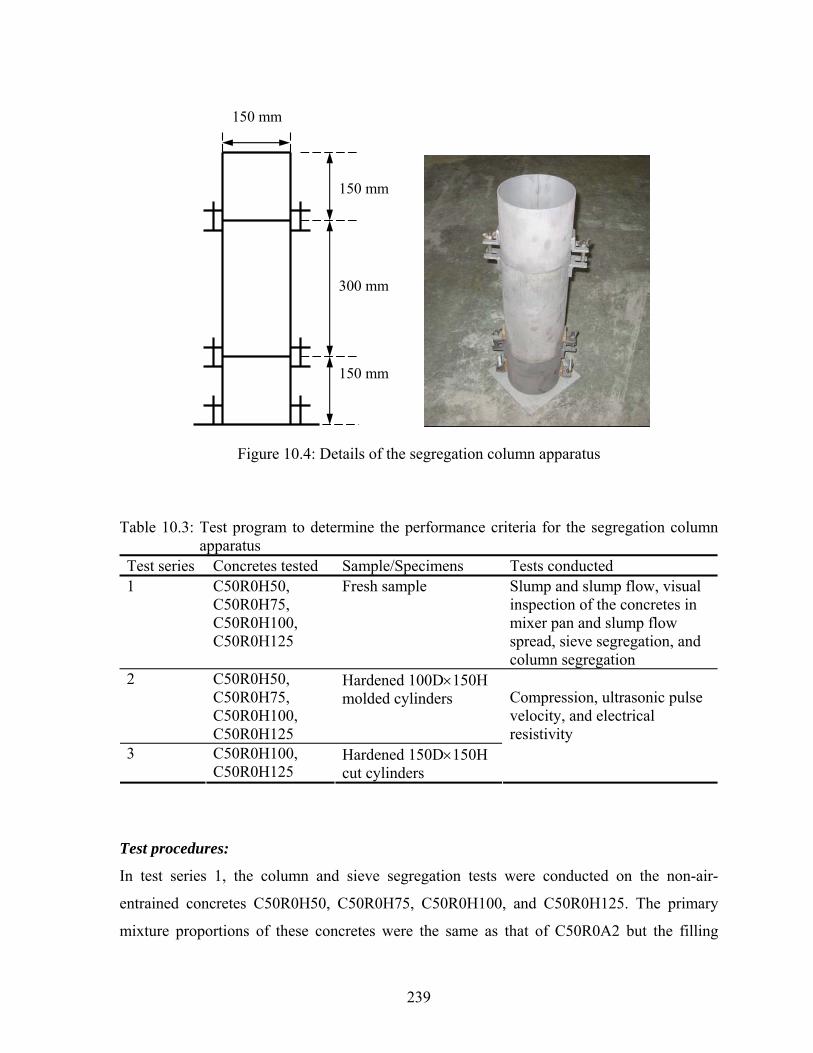
150 mm
150 mm
150 mm
300 mm
Figure 10.4: Details of the segregation column apparatus
Table 10.3: Test program to determine the performance criteria for the segregation column apparatus
Test series Concretes tested Sample/Specimens Tests conducted 1 C50R0H50,
C50R0H75, C50R0H100, C50R0H125
Fresh sample Slump and slump flow, visual inspection of the concretes in mixer pan and slump flow spread, sieve segregation, and column segregation
2 C50R0H50, C50R0H75, C50R0H100, C50R0H125
Hardened 100D×150H molded cylinders
3 C50R0H100, C50R0H125
Hardened 150D×150H cut cylinders
Compression, ultrasonic pulse velocity, and electrical resistivity
Test procedures:
In test series 1, the column and sieve segregation tests were conducted on the non-air-
entrained concretes C50R0H50, C50R0H75, C50R0H100, and C50R0H125. The primary
mixture proportions of these concretes were the same as that of C50R0A2 but the filling
239
ability (slump and slump flow) was varied using various HRWR dosages (50, 75, 100 and
125% of the saturation dosage). The slump and slump flow were determined to observe the
filling ability of concrete. The segregation index was determined by sieve segregation test. In
addition, the column apparatus shown in Figure 10.4 was used to determine the segregation
factor. The procedures for the sieve and column segregation tests were the same as described
in Section 10.4.3.
In case of test series 2, the concretes C50R0H50, C50R0H75, C50R0H100, and
C50R0H125 were cast in the column apparatus shown in Figure 10.4 in one layer and
without any consolidation. After a rest period of 30 minutes, the portions of concrete were
separately collected from the top and bottom sections of the column apparatus and re-mixed
by hand using a scoop. Duplicate 100D×150H mm cylinders were cast from each portion of
concrete. Hence, four 100D×150H mm cylinders as shown in Figure 10.5 were obtained for
each concrete: two from top section and the other two from bottom section. The cylinders
molded by using the concrete collected from the top and bottom sections were designated as
MT100D×150H and MB100D×150H, respectively. For these specimens, the concrete was
poured in two layers and each layer was rodded and tapped in specified manner. The rodding
and taping were used since the self-consolidation capacity of concrete was significantly
reduced during the rest period of 30 minutes. Immediately after casting, the top faces of the
cylinders were covered by the lids and left undisturbed at room temperature. The specimens
were de-molded at the age of 24±2 hours and transferred to the fog room for curing. The
curing was conducted according to the ASTM standard practice (ASTM C 192/C 192M,
2004) until the day of testing for true electrical resistivity, ultrasonic pulse velocity and
compressive strength at the age of 28 days. The tests were conducted in similar manners as
discussed in Chapter 9 except for the probe spacing used in resistivity measurement. A probe
spacing of 30 mm was used to determine the true electrical resistivity, since the length of
concrete cylinders was 150 mm instead of 200 mm.
In test series 3, the concretes C50R0H100 and C50R0H125 were cast in the column
apparatus shown in Figure 10.4 in one layer and without any consolidation. Immediately
after casting, the top of the column apparatus was covered by a plastic lid and left
undisturbed at room temperature. The column specimens were taken out of the apparatus at
the age of 24±2 hours and transferred to the fog room for curing in accordance with ASTM C
240
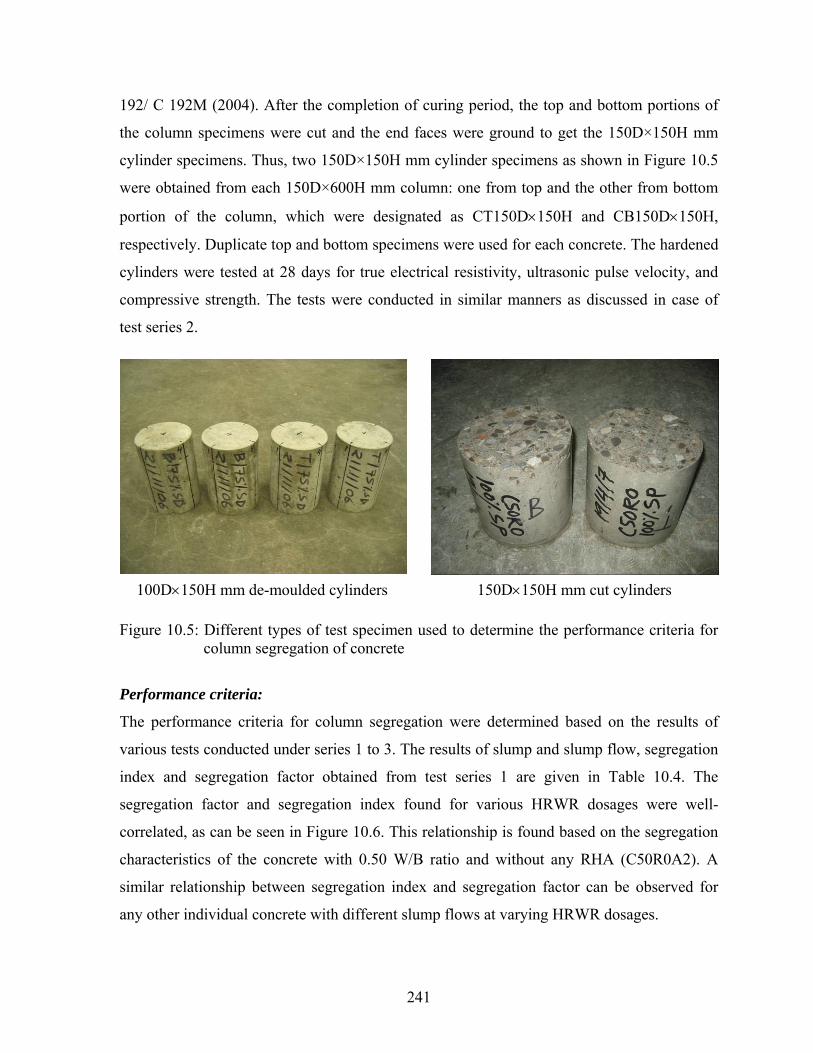
192/ C 192M (2004). After the completion of curing period, the top and bottom portions of
the column specimens were cut and the end faces were ground to get the 150D×150H mm
cylinder specimens. Thus, two 150D×150H mm cylinder specimens as shown in Figure 10.5
were obtained from each 150D×600H mm column: one from top and the other from bottom
portion of the column, which were designated as CT150D×150H and CB150D×150H,
respectively. Duplicate top and bottom specimens were used for each concrete. The hardened
cylinders were tested at 28 days for true electrical resistivity, ultrasonic pulse velocity, and
compressive strength. The tests were conducted in similar manners as discussed in case of
test series 2.
100D×150H mm de-moulded cylinders 150D×150H mm cut cylinders
Figure 10.5: Different types of test specimen used to determine the performance criteria for column segregation of concrete
Performance criteria:
The performance criteria for column segregation were determined based on the results of
various tests conducted under series 1 to 3. The results of slump and slump flow, segregation
index and segregation factor obtained from test series 1 are given in Table 10.4. The
segregation factor and segregation index found for various HRWR dosages were well-
correlated, as can be seen in Figure 10.6. This relationship is found based on the segregation
characteristics of the concrete with 0.50 W/B ratio and without any RHA (C50R0A2). A
similar relationship between segregation index and segregation factor can be observed for
any other individual concrete with different slump flows at varying HRWR dosages.
241
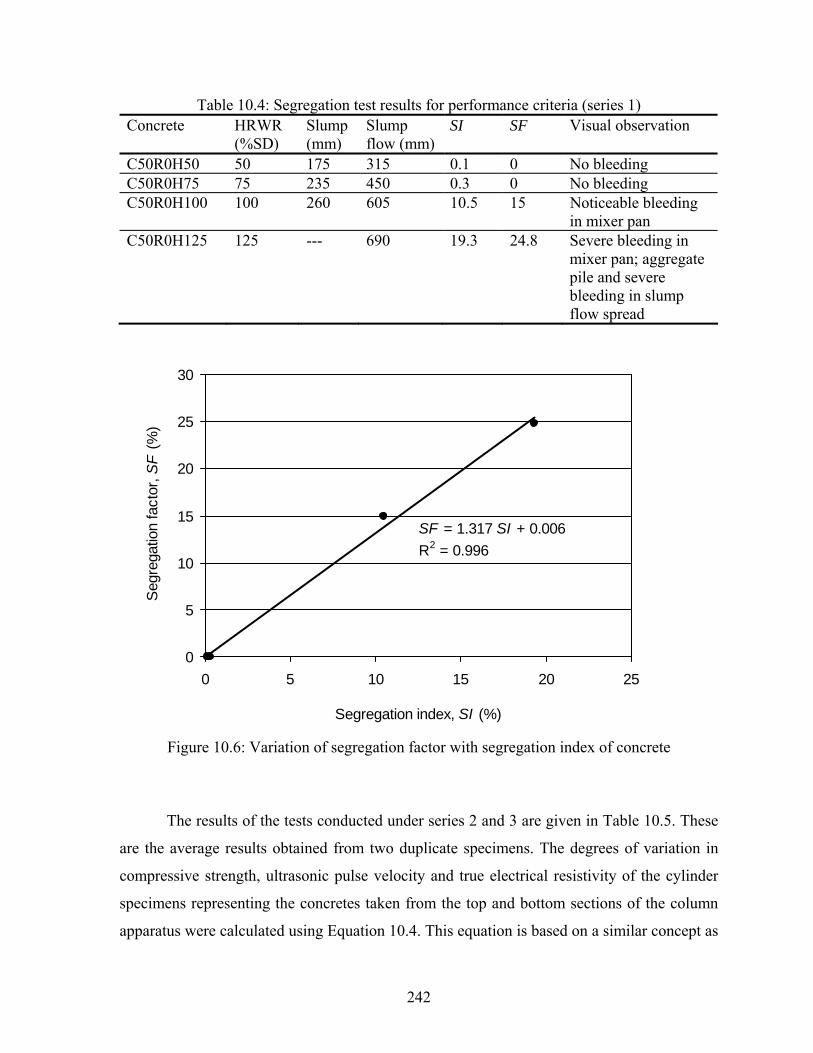
Table 10.4: Segregation test results for performance criteria (series 1) Concrete HRWR
(%SD) Slump (mm)
Slump flow (mm)
SI SF Visual observation
C50R0H50 50 175 315 0.1 0 No bleeding C50R0H75 75 235 450 0.3 0 No bleeding C50R0H100 100 260 605 10.5 15 Noticeable bleeding
in mixer pan C50R0H125 125 --- 690 19.3 24.8 Severe bleeding in
mixer pan; aggregate pile and severe bleeding in slump flow spread
SF = 1.317 SI + 0.006R2 = 0.996
0
5
10
15
20
25
30
0 5 10 15 20 25
Segregation index, SI (%)
Seg
rega
tion
fact
or, S
F (%
)
Figure 10.6: Variation of segregation factor with segregation index of concrete
The results of the tests conducted under series 2 and 3 are given in Table 10.5. These
are the average results obtained from two duplicate specimens. The degrees of variation in
compressive strength, ultrasonic pulse velocity and true electrical resistivity of the cylinder
specimens representing the concretes taken from the top and bottom sections of the column
apparatus were calculated using Equation 10.4. This equation is based on a similar concept as
242
used to calculate the segregation factor of concrete (Section 10.4.3). Also, the statistical
coefficients of variation for the aforementioned concrete properties were calculated using
Equation 10.5. This equation is derived based on the relationship between standard deviation
and coefficient of variation.
%100×−
=P
PPV tb
dp (Equation 10.4)
( ) ( )%100
22
×−+−
=P
PPPPV tb
cp (Equation 10.5)
where:
Vdp = Degree of variation in concrete property (strength, pulse velocity, resistivity, etc.)
Vcp = Statistical coefficient of variation in concrete property
bP = Average concrete property obtained from two bottom specimens
tP = Average concrete property obtained from two top specimens
( )tb PPP +=21
The degree of variation and the statistical coefficient of variation for the compressive
strength, ultrasonic pulse velocity and true electrical resistivity between top and bottom
specimens of the concretes having different segregation indices and segregation factors are
shown in Table 10.5. These variations are due to the changes in the internal composition of
concrete caused by segregation.
The variation in compressive strength between top and bottom specimens for each
concrete was insignificant under series 2, as can be seen from Table 10.5. This is because the
distribution of coarse aggregates in concrete specimens was uniform due to re-mixing of the
fresh concrete, thus reducing the heterogeneity in the concrete and contributing to produce
good interfacial bond between aggregate and mortar. In contrast, the distribution of coarse
aggregates was non-uniform in the specimens under series 3, thus increasing the
243
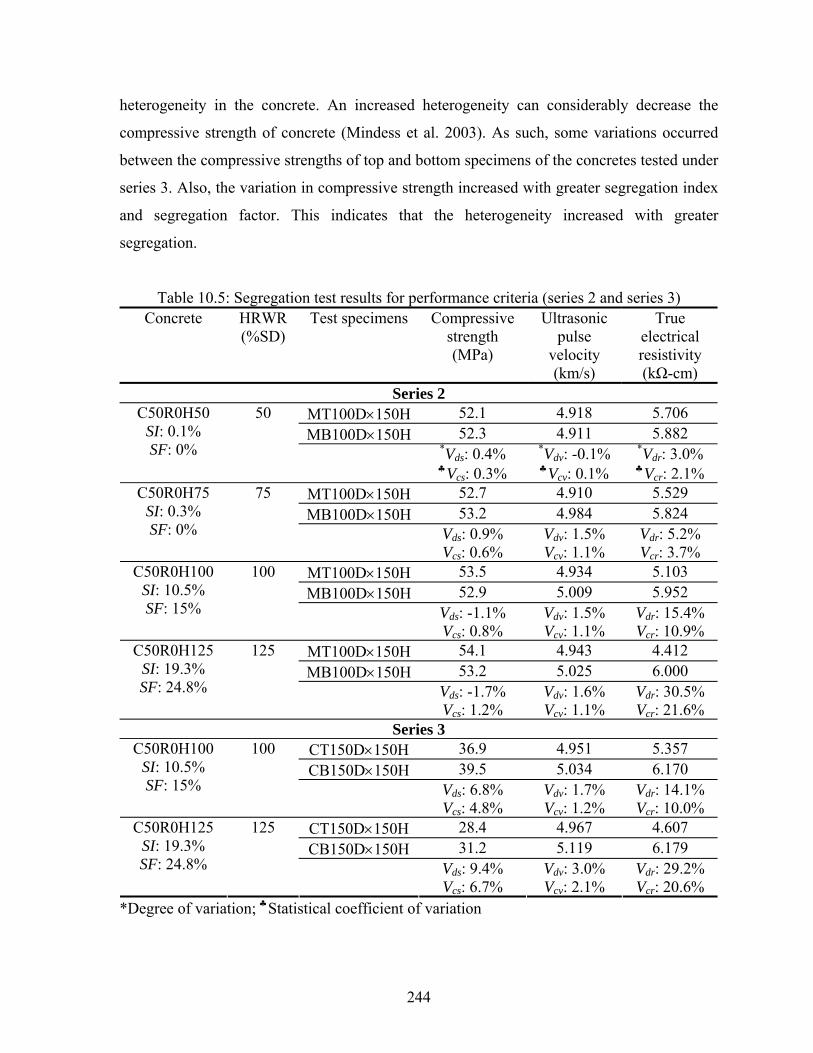
heterogeneity in the concrete. An increased heterogeneity can considerably decrease the
compressive strength of concrete (Mindess et al. 2003). As such, some variations occurred
between the compressive strengths of top and bottom specimens of the concretes tested under
series 3. Also, the variation in compressive strength increased with greater segregation index
and segregation factor. This indicates that the heterogeneity increased with greater
segregation.
Table 10.5: Segregation test results for performance criteria (series 2 and series 3) Concrete HRWR
(%SD) Test specimens Compressive
strength (MPa)
Ultrasonic pulse
velocity (km/s)
True electrical resistivity (kΩ-cm)
Series 2 MT100D×150H 52.1 4.918 5.706 MB100D×150H 52.3 4.911 5.882
C50R0H50 SI: 0.1% SF: 0%
50
*Vds: 0.4% ♣Vcs: 0.3%
*Vdv: -0.1% ♣Vcv: 0.1%
*Vdr: 3.0% ♣Vcr: 2.1%
MT100D×150H 52.7 4.910 5.529 MB100D×150H 53.2 4.984 5.824
C50R0H75 SI: 0.3% SF: 0%
75
Vds: 0.9% Vcs: 0.6%
Vdv: 1.5% Vcv: 1.1%
Vdr: 5.2% Vcr: 3.7%
MT100D×150H 53.5 4.934 5.103 MB100D×150H 52.9 5.009 5.952
C50R0H100 SI: 10.5% SF: 15%
100
Vds: -1.1% Vcs: 0.8%
Vdv: 1.5% Vcv: 1.1%
Vdr: 15.4% Vcr: 10.9%
MT100D×150H 54.1 4.943 4.412 MB100D×150H 53.2 5.025 6.000
C50R0H125 SI: 19.3% SF: 24.8%
125
Vds: -1.7% Vcs: 1.2%
Vdv: 1.6% Vcv: 1.1%
Vdr: 30.5% Vcr: 21.6%
Series 3 CT150D×150H 36.9 4.951 5.357 CB150D×150H 39.5 5.034 6.170
C50R0H100 SI: 10.5% SF: 15%
100
Vds: 6.8% Vcs: 4.8%
Vdv: 1.7% Vcv: 1.2%
Vdr: 14.1% Vcr: 10.0%
CT150D×150H 28.4 4.967 4.607 CB150D×150H 31.2 5.119 6.179
C50R0H125 SI: 19.3% SF: 24.8%
125
Vds: 9.4% Vcs: 6.7%
Vdv: 3.0% Vcv: 2.1%
Vdr: 29.2% Vcr: 20.6%
*Degree of variation; ♣Statistical coefficient of variation
244
The variation in ultrasonic pulse velocity was not significant in both series 2 and 3, as
can be seen from Table 10.5. The bottom specimens had more aggregates than the top
specimens. The ultrasonic pulse velocity is increased with greater aggregate content since the
aggregates generally have a higher elastic modulus than mortar and concrete (Lin et al.
2003). However, the mass density of concrete increased in the bottom specimens due to a
greater amount of coarse aggregate and reduced mortar content. This is because the mass
density of coarse aggregate is greater than the mass densities of mortar and concrete. An
increased mass density decreases the ultrasonic pulse velocity of concrete, since they are
inversely related (Neville 1996). For this reason, the effect of higher aggregate content was
minimized leading to no significant variation in ultrasonic pulse velocity. In contrast, a
considerable variation in true electrical resistivity was observed in series 2 and 3, indicating
its good potential for segregation measurement. The top specimens provided significantly
lower electrical resistivity than the bottom specimens. This is because more paste or mortar
(less coarse aggregate) was present in the top specimens due to segregation, thus producing a
greater concentration of pore solution and ions. In particular, the water content was higher
since significant bleeding occurred as the coarse aggregates settled down.
The overall statistical coefficient of variation for the in-place compressive strength of
concrete in the case of laboratory trial batches is normally not more than 6.7% (Bartlett and
MacGregor 1999; ACI 214.4R-03, 2004). This variation consists of within-test and within-
member variations. The within-test variation arises due to the improper handling, storing,
curing and testing procedures, whereas the within-member variation in compressive strength
can occur due to the variations in W/B ratio, air content, and proportions of ingredients such
as aggregate, cement, water and admixtures, as caused by segregation. The within-test
coefficient of variation is generally 3% (Bartlett and MacGregor 1996). However, the
acceptable within-test coefficient of variation (percent one-sigma limit) for 150D×300H mm
molded cylinders and 100D×200H mm cored cylinders is ≤ 2.37% (ASTM C39 2004), and ≤
3.2% (ASTM C 42/C 42M 2004), respectively. In the present study, the maximum within-
test coefficient of variation was 2.43% for the cylinder specimens tested under series 2 and 3.
Nonetheless, using 3% as the maximum within-test variability, the acceptable limit for the
statistical coefficient of variation for the in-place compressive strength due to segregation
was determined based on the following equation:
245
22cstcsocss VVV −= (Equation 10.6)
where:
Vcso = Typical overall coefficient of variation for in-place compressive strength (6.7%)
Vcss = Acceptable limit for the coefficient of variation for in-place compressive strength
Vcst = Maximum within-test coefficient of variation for compressive strength (3%)
The degree of variation (Vds) and the statistical coefficient of variation (Vcs) in the
compressive strength were strongly correlated, as can be seen from Figure 10.7. This
relationship was used to determine the acceptable degree of variation in compressive strength
based on the statistical coefficient of variation for the in-place compressive strength due to
segregation as obtained from Equation 10.6. The acceptable coefficient of variation for the
in-place compressive strength due to segregation was found as %6)3()7.6( 22 =− . This
provided an acceptable degree of variation in compressive strength of 8.4% from Figure 10.7.
It was used to set the criteria for column segregation. The observed degree of variation in
compressive strength was plotted versus the segregation factor, as shown in Figure 10.8. The
segregation factor corresponding to 8.4% degree of variation in compressive strength was
found to be 21% from Figure 10.8.
The degrees of variations in the compressive strength and true electrical resistivity of
the concretes tested under series 2 and 3 were also well-correlated, as can be seen from
Figure 10.9. Using this relationship, the acceptable variation in true electrical resistivity was
determined based on the acceptable variation in compressive strength of 8.4%. The
acceptable variation in true electrical resistivity was found as 23.2% from Figure 10.9. It can
also be used to fix the criteria for column segregation. The degree of variation in true
electrical resistivity was plotted versus the segregation factor of concrete in Figure 10.10.
The segregation factor corresponding to 23.2% variation in true electrical resistivity was
found as 20.2% from Figure 10.10. Thus the following criteria are proposed to qualify the
segregation resistance of SCHPC mixture:
a. SCHPC mixture has a good static segregation resistance if the segregation factor ≤ 20%.
b. SCHPC mixture has a poor static segregation resistance if the segregation factor > 20%.
246
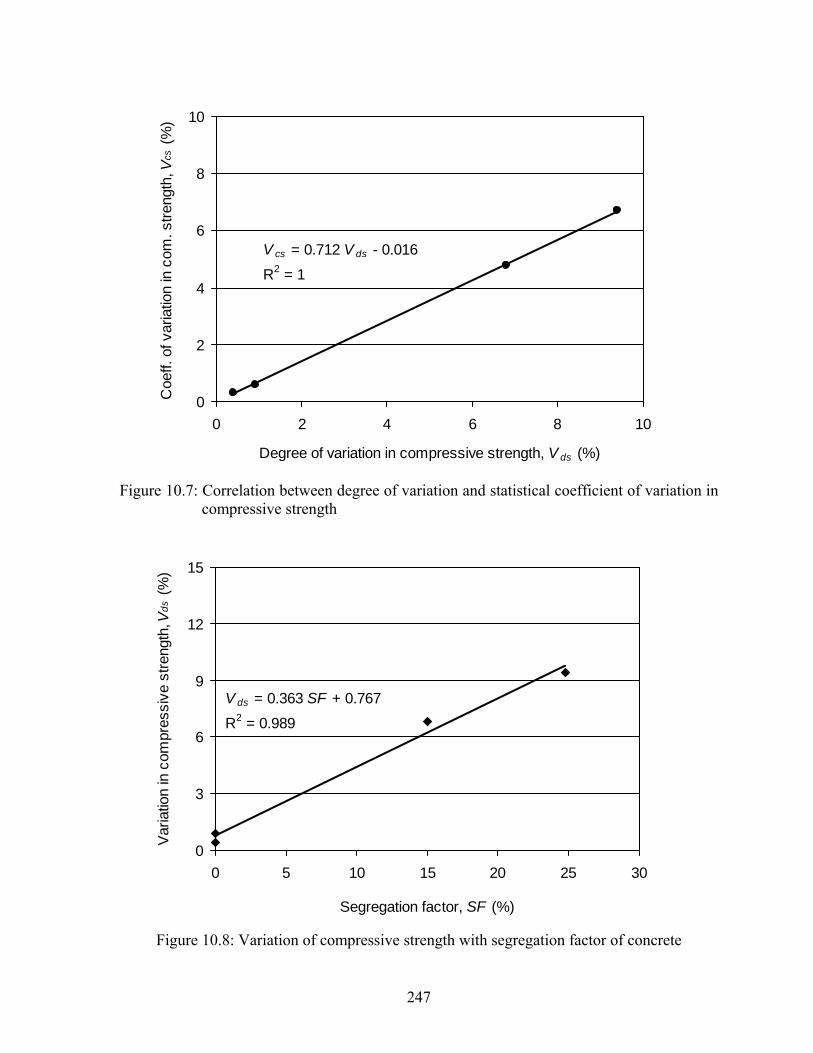
V cs = 0.712 V ds - 0.016
R2 = 1
0
2
4
6
8
10
0 2 4 6 8
Degree of variation in compressive strength, V ds (%)
Coe
ff. o
f var
iatio
n in
com
. stre
ngth
, Vcs
(%)
10
Figure 10.7: Correlation between degree of variation and statistical coefficient of variation in compressive strength
V ds = 0.363 SF + 0.767
R2 = 0.989
0
3
6
9
12
15
0 5 10 15 20 25 30
Segregation factor, SF (%)
Var
iatio
n in
com
pres
sive
stre
ngth
, Vds
(%)
Figure 10.8: Variation of compressive strength with segregation factor of concrete
247
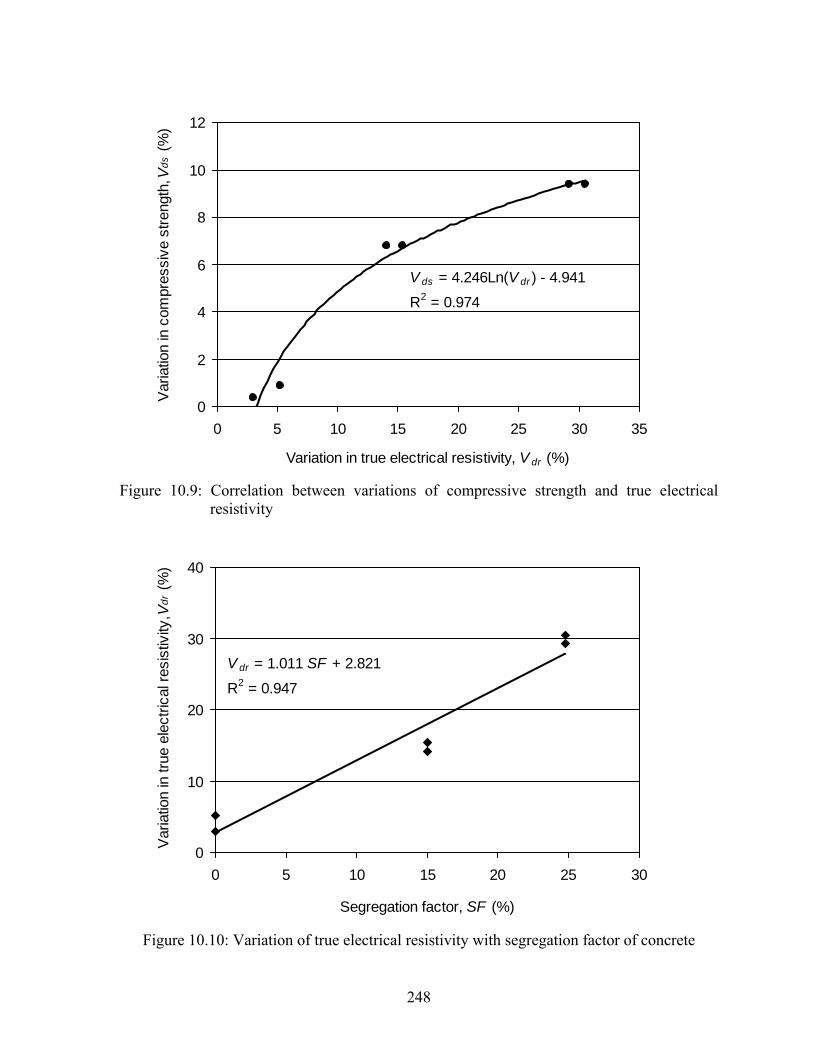
V ds = 4.246Ln(V dr ) - 4.941
R2 = 0.974
0
2
4
6
8
10
12
0 5 10 15 20 25 30 35
Variation in true electrical resistivity, V dr (%)
Var
iatio
n in
com
pres
sive
stre
ngth
, Vds
(%)
Figure 10.9: Correlation between variations of compressive strength and true electrical resistivity
V dr = 1.011 SF + 2.821
R2 = 0.947
0
10
20
30
40
0 5 10 15 20 25 30
Segregation factor, SF (%)
Var
iatio
n in
true
ele
ctric
al re
sist
ivity
, Vdr
(%)
Figure 10.10: Variation of true electrical resistivity with segregation factor of concrete
248
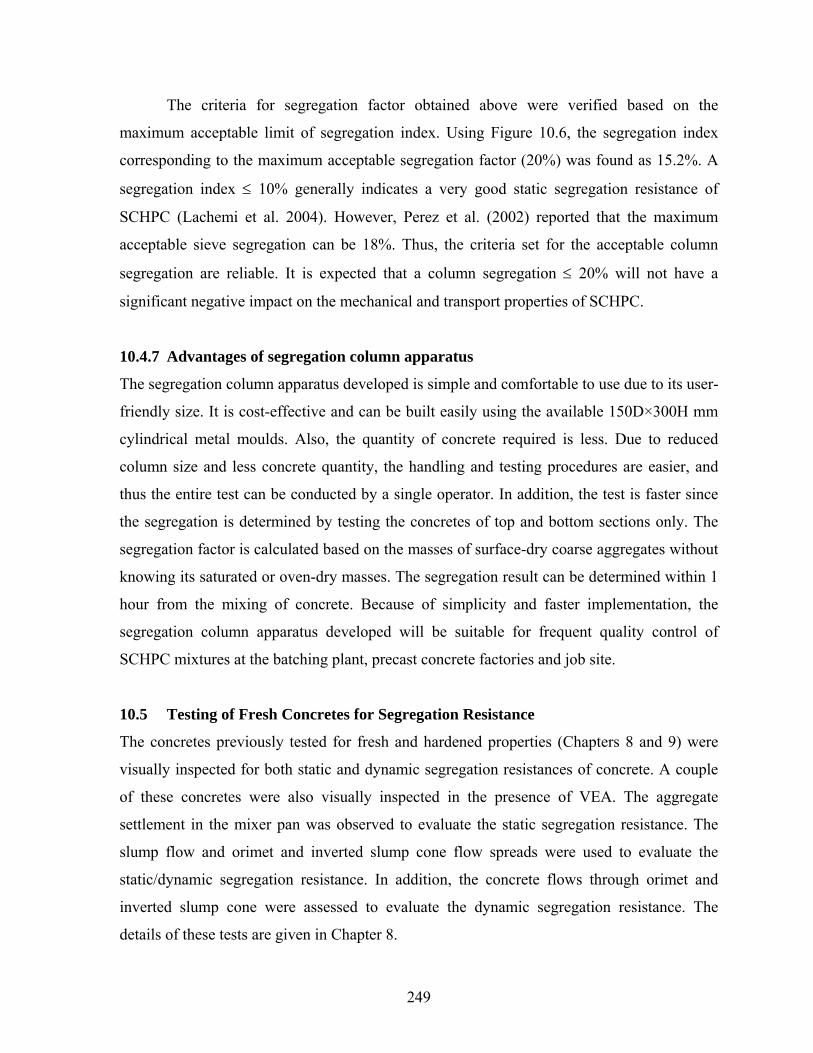
The criteria for segregation factor obtained above were verified based on the
maximum acceptable limit of segregation index. Using Figure 10.6, the segregation index
corresponding to the maximum acceptable segregation factor (20%) was found as 15.2%. A
segregation index ≤ 10% generally indicates a very good static segregation resistance of
SCHPC (Lachemi et al. 2004). However, Perez et al. (2002) reported that the maximum
acceptable sieve segregation can be 18%. Thus, the criteria set for the acceptable column
segregation are reliable. It is expected that a column segregation ≤ 20% will not have a
significant negative impact on the mechanical and transport properties of SCHPC.
10.4.7 Advantages of segregation column apparatus
The segregation column apparatus developed is simple and comfortable to use due to its user-
friendly size. It is cost-effective and can be built easily using the available 150D×300H mm
cylindrical metal moulds. Also, the quantity of concrete required is less. Due to reduced
column size and less concrete quantity, the handling and testing procedures are easier, and
thus the entire test can be conducted by a single operator. In addition, the test is faster since
the segregation is determined by testing the concretes of top and bottom sections only. The
segregation factor is calculated based on the masses of surface-dry coarse aggregates without
knowing its saturated or oven-dry masses. The segregation result can be determined within 1
hour from the mixing of concrete. Because of simplicity and faster implementation, the
segregation column apparatus developed will be suitable for frequent quality control of
SCHPC mixtures at the batching plant, precast concrete factories and job site.
10.5 Testing of Fresh Concretes for Segregation Resistance
The concretes previously tested for fresh and hardened properties (Chapters 8 and 9) were
visually inspected for both static and dynamic segregation resistances of concrete. A couple
of these concretes were also visually inspected in the presence of VEA. The aggregate
settlement in the mixer pan was observed to evaluate the static segregation resistance. The
slump flow and orimet and inverted slump cone flow spreads were used to evaluate the
static/dynamic segregation resistance. In addition, the concrete flows through orimet and
inverted slump cone were assessed to evaluate the dynamic segregation resistance. The
details of these tests are given in Chapter 8.
249
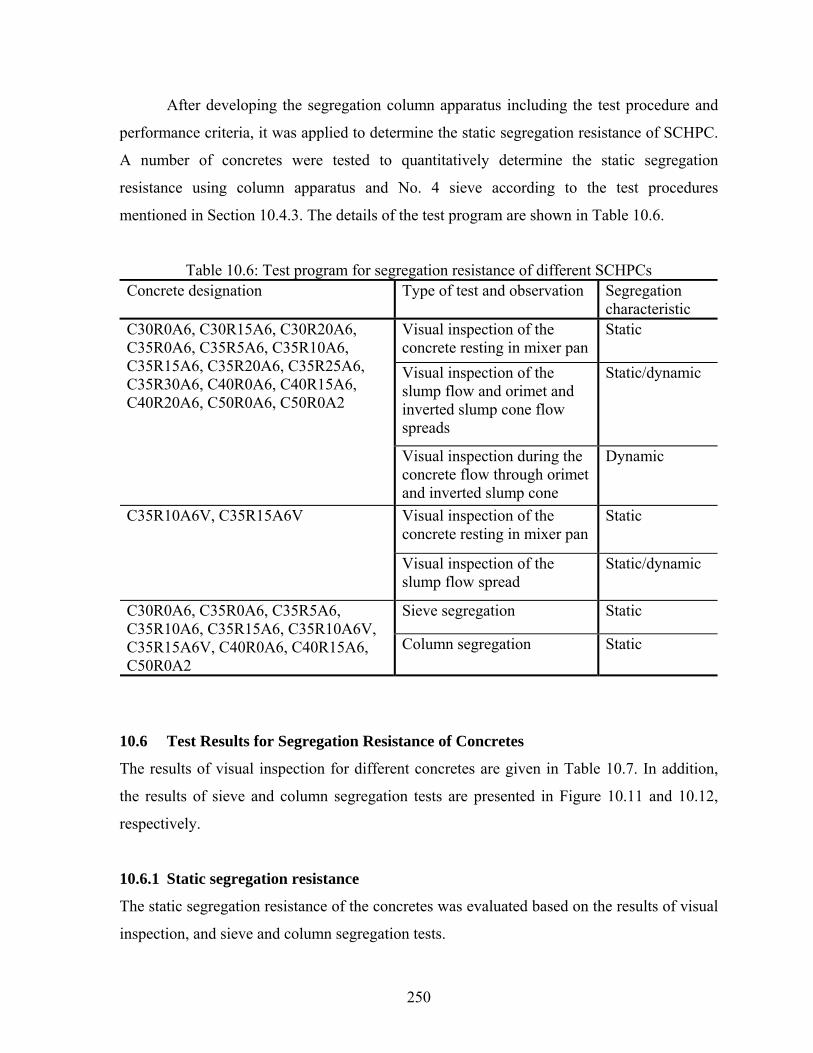
After developing the segregation column apparatus including the test procedure and
performance criteria, it was applied to determine the static segregation resistance of SCHPC.
A number of concretes were tested to quantitatively determine the static segregation
resistance using column apparatus and No. 4 sieve according to the test procedures
mentioned in Section 10.4.3. The details of the test program are shown in Table 10.6.
Table 10.6: Test program for segregation resistance of different SCHPCs Concrete designation Type of test and observation Segregation
characteristic Visual inspection of the concrete resting in mixer pan
Static
Visual inspection of the slump flow and orimet and inverted slump cone flow spreads
Static/dynamic
C30R0A6, C30R15A6, C30R20A6, C35R0A6, C35R5A6, C35R10A6, C35R15A6, C35R20A6, C35R25A6, C35R30A6, C40R0A6, C40R15A6, C40R20A6, C50R0A6, C50R0A2
Visual inspection during the concrete flow through orimet and inverted slump cone
Dynamic
Visual inspection of the concrete resting in mixer pan
Static C35R10A6V, C35R15A6V
Visual inspection of the slump flow spread
Static/dynamic
Sieve segregation Static C30R0A6, C35R0A6, C35R5A6, C35R10A6, C35R15A6, C35R10A6V, C35R15A6V, C40R0A6, C40R15A6, C50R0A2
Column segregation Static
10.6 Test Results for Segregation Resistance of Concretes
The results of visual inspection for different concretes are given in Table 10.7. In addition,
the results of sieve and column segregation tests are presented in Figure 10.11 and 10.12,
respectively.
10.6.1 Static segregation resistance
The static segregation resistance of the concretes was evaluated based on the results of visual
inspection, and sieve and column segregation tests.
250
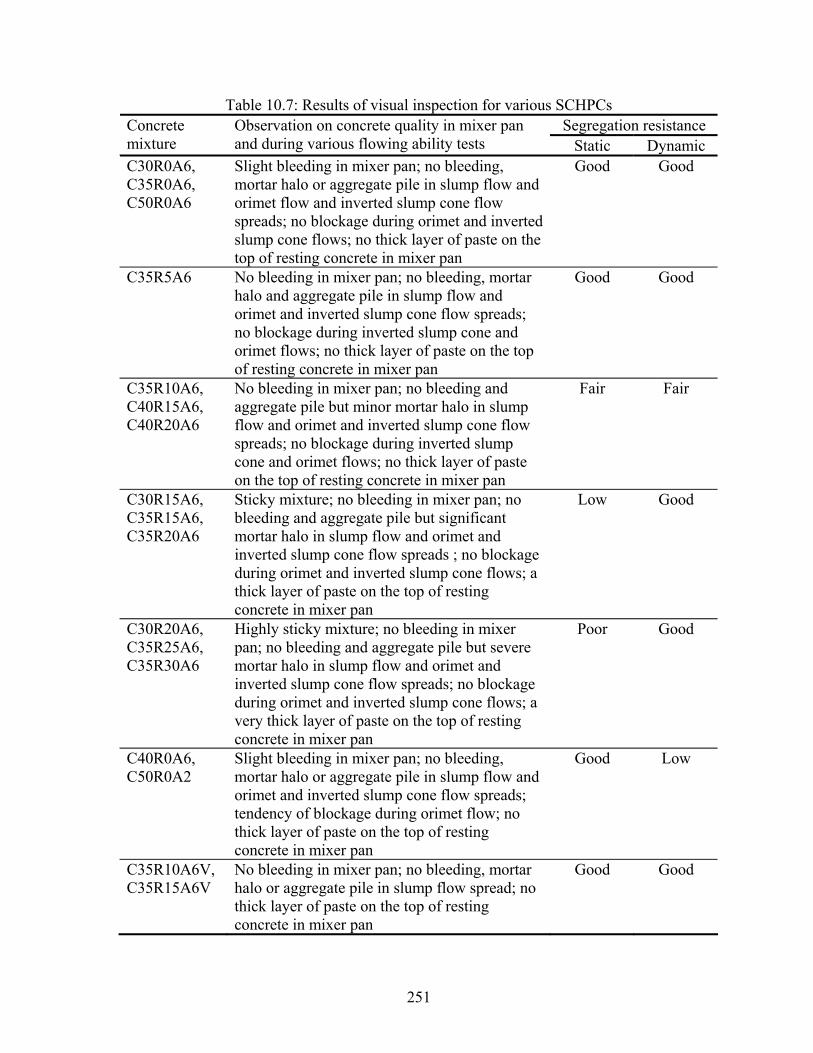
Table 10.7: Results of visual inspection for various SCHPCs Segregation resistance Concrete
mixture Observation on concrete quality in mixer pan and during various flowing ability tests Static Dynamic
C30R0A6, C35R0A6, C50R0A6
Slight bleeding in mixer pan; no bleeding, mortar halo or aggregate pile in slump flow and orimet flow and inverted slump cone flow spreads; no blockage during orimet and inverted slump cone flows; no thick layer of paste on the top of resting concrete in mixer pan
Good
Good
C35R5A6 No bleeding in mixer pan; no bleeding, mortar halo and aggregate pile in slump flow and orimet and inverted slump cone flow spreads; no blockage during inverted slump cone and orimet flows; no thick layer of paste on the top of resting concrete in mixer pan
Good
Good
C35R10A6, C40R15A6, C40R20A6
No bleeding in mixer pan; no bleeding and aggregate pile but minor mortar halo in slump flow and orimet and inverted slump cone flow spreads; no blockage during inverted slump cone and orimet flows; no thick layer of paste on the top of resting concrete in mixer pan
Fair Fair
C30R15A6, C35R15A6, C35R20A6
Sticky mixture; no bleeding in mixer pan; no bleeding and aggregate pile but significant mortar halo in slump flow and orimet and inverted slump cone flow spreads ; no blockage during orimet and inverted slump cone flows; a thick layer of paste on the top of resting concrete in mixer pan
Low Good
C30R20A6, C35R25A6, C35R30A6
Highly sticky mixture; no bleeding in mixer pan; no bleeding and aggregate pile but severe mortar halo in slump flow and orimet and inverted slump cone flow spreads; no blockage during orimet and inverted slump cone flows; a very thick layer of paste on the top of resting concrete in mixer pan
Poor Good
C40R0A6, C50R0A2
Slight bleeding in mixer pan; no bleeding, mortar halo or aggregate pile in slump flow and orimet and inverted slump cone flow spreads; tendency of blockage during orimet flow; no thick layer of paste on the top of resting concrete in mixer pan
Good Low
C35R10A6V, C35R15A6V
No bleeding in mixer pan; no bleeding, mortar halo or aggregate pile in slump flow spread; no thick layer of paste on the top of resting concrete in mixer pan
Good Good
251
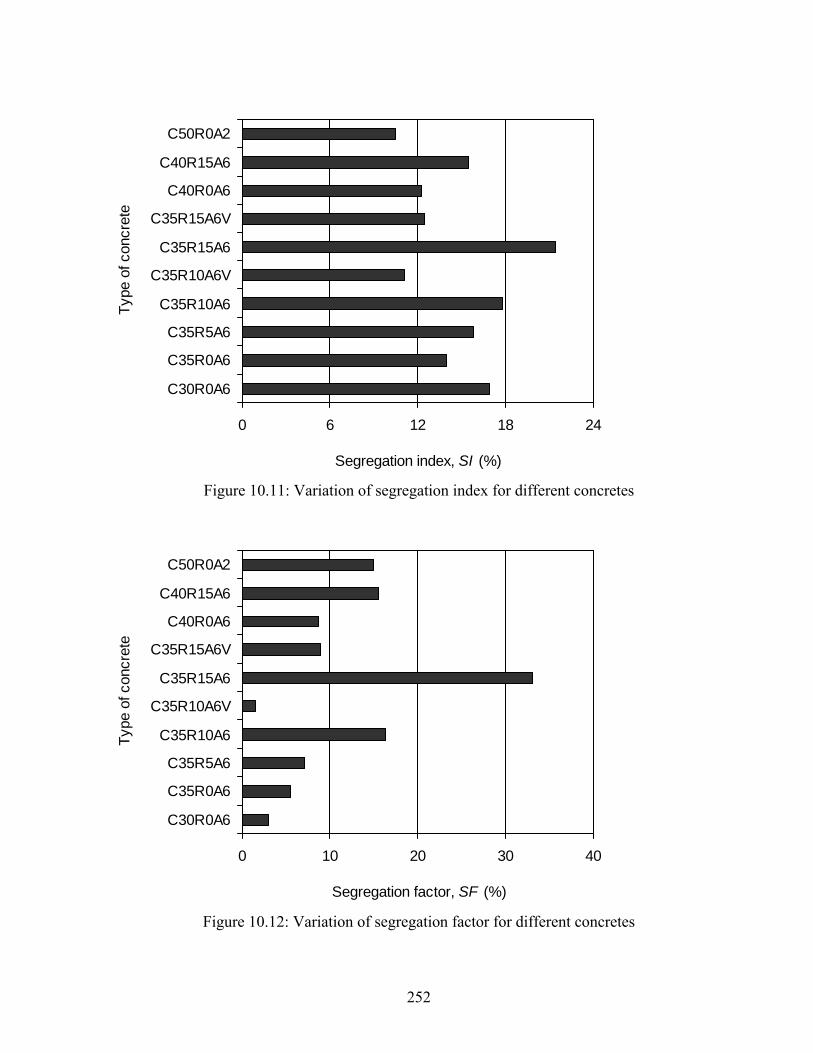
0 6 12 18 24
C30R0A6
C35R0A6
C35R5A6
C35R10A6
C35R10A6V
C35R15A6
C35R15A6V
C40R0A6
C40R15A6
C50R0A2Ty
pe o
f con
cret
e
Segregation index, SI (%)
Figure 10.11: Variation of segregation index for different concretes
0 10 20 30 4
C30R0A6
C35R0A6
C35R5A6
C35R10A6
C35R10A6V
C35R15A6
C35R15A6V
C40R0A6
C40R15A6
C50R0A2
Type
of c
oncr
ete
Segregation factor, SF (%)
0
Figure 10.12: Variation of segregation factor for different concretes
252
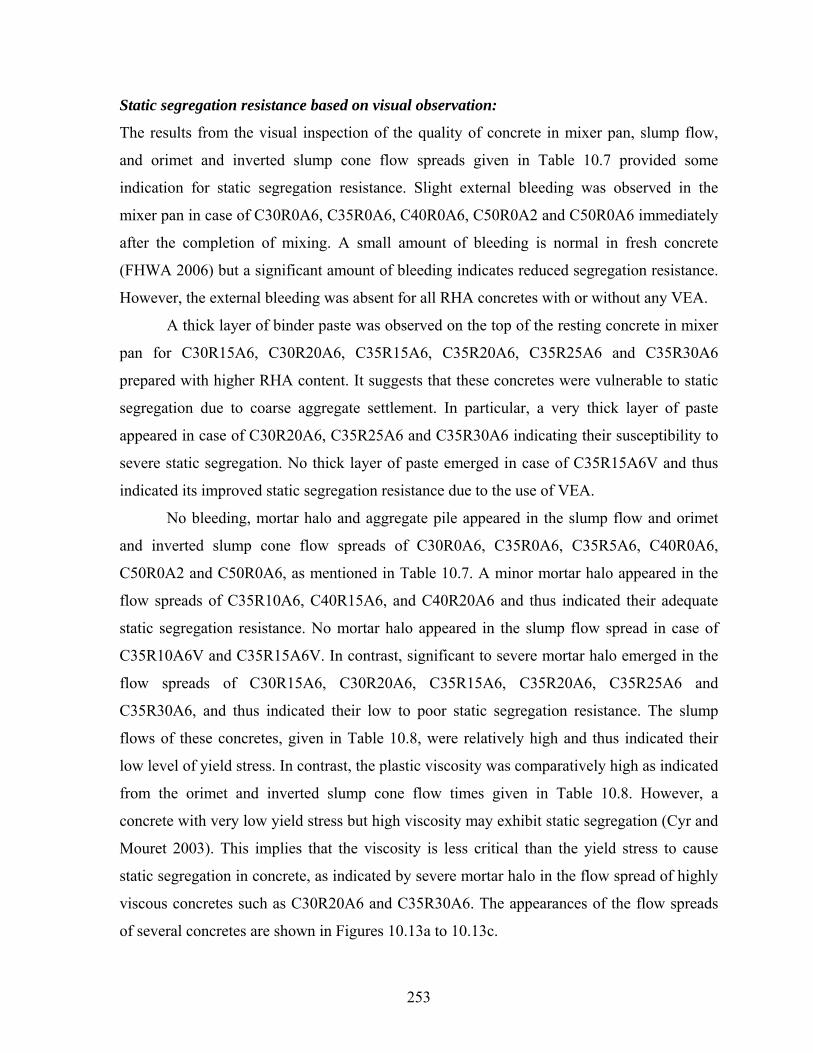
Static segregation resistance based on visual observation:
The results from the visual inspection of the quality of concrete in mixer pan, slump flow,
and orimet and inverted slump cone flow spreads given in Table 10.7 provided some
indication for static segregation resistance. Slight external bleeding was observed in the
mixer pan in case of C30R0A6, C35R0A6, C40R0A6, C50R0A2 and C50R0A6 immediately
after the completion of mixing. A small amount of bleeding is normal in fresh concrete
(FHWA 2006) but a significant amount of bleeding indicates reduced segregation resistance.
However, the external bleeding was absent for all RHA concretes with or without any VEA.
A thick layer of binder paste was observed on the top of the resting concrete in mixer
pan for C30R15A6, C30R20A6, C35R15A6, C35R20A6, C35R25A6 and C35R30A6
prepared with higher RHA content. It suggests that these concretes were vulnerable to static
segregation due to coarse aggregate settlement. In particular, a very thick layer of paste
appeared in case of C30R20A6, C35R25A6 and C35R30A6 indicating their susceptibility to
severe static segregation. No thick layer of paste emerged in case of C35R15A6V and thus
indicated its improved static segregation resistance due to the use of VEA.
No bleeding, mortar halo and aggregate pile appeared in the slump flow and orimet
and inverted slump cone flow spreads of C30R0A6, C35R0A6, C35R5A6, C40R0A6,
C50R0A2 and C50R0A6, as mentioned in Table 10.7. A minor mortar halo appeared in the
flow spreads of C35R10A6, C40R15A6, and C40R20A6 and thus indicated their adequate
static segregation resistance. No mortar halo appeared in the slump flow spread in case of
C35R10A6V and C35R15A6V. In contrast, significant to severe mortar halo emerged in the
flow spreads of C30R15A6, C30R20A6, C35R15A6, C35R20A6, C35R25A6 and
C35R30A6, and thus indicated their low to poor static segregation resistance. The slump
flows of these concretes, given in Table 10.8, were relatively high and thus indicated their
low level of yield stress. In contrast, the plastic viscosity was comparatively high as indicated
from the orimet and inverted slump cone flow times given in Table 10.8. However, a
concrete with very low yield stress but high viscosity may exhibit static segregation (Cyr and
Mouret 2003). This implies that the viscosity is less critical than the yield stress to cause
static segregation in concrete, as indicated by severe mortar halo in the flow spread of highly
viscous concretes such as C30R20A6 and C35R30A6. The appearances of the flow spreads
of several concretes are shown in Figures 10.13a to 10.13c.
253
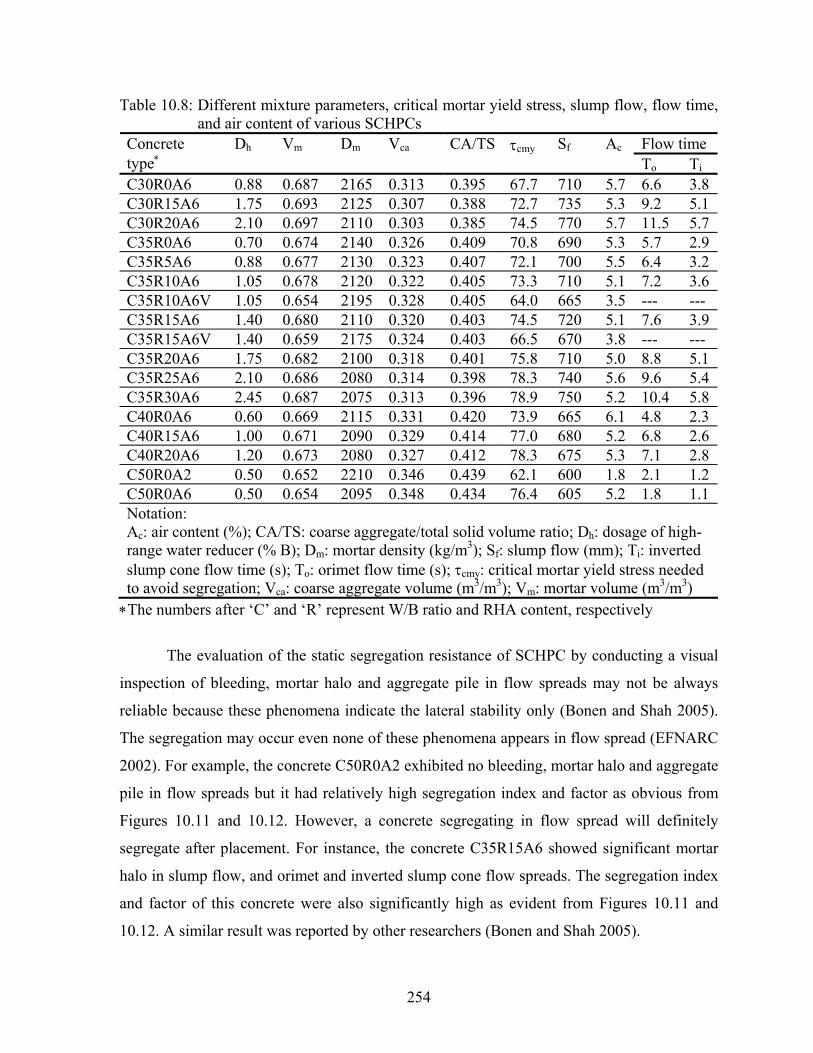
Table 10.8: Different mixture parameters, critical mortar yield stress, slump flow, flow time, and air content of various SCHPCs
Flow time Concrete type∗
Dh Vm Dm Vca CA/TS τcmy Sf Ac To Ti
C30R0A6 0.88 0.687 2165 0.313 0.395 67.7 710 5.7 6.6 3.8 C30R15A6 1.75 0.693 2125 0.307 0.388 72.7 735 5.3 9.2 5.1 C30R20A6 2.10 0.697 2110 0.303 0.385 74.5 770 5.7 11.5 5.7 C35R0A6 0.70 0.674 2140 0.326 0.409 70.8 690 5.3 5.7 2.9 C35R5A6 0.88 0.677 2130 0.323 0.407 72.1 700 5.5 6.4 3.2 C35R10A6 1.05 0.678 2120 0.322 0.405 73.3 710 5.1 7.2 3.6 C35R10A6V 1.05 0.654 2195 0.328 0.405 64.0 665 3.5 --- --- C35R15A6 1.40 0.680 2110 0.320 0.403 74.5 720 5.1 7.6 3.9 C35R15A6V 1.40 0.659 2175 0.324 0.403 66.5 670 3.8 --- --- C35R20A6 1.75 0.682 2100 0.318 0.401 75.8 710 5.0 8.8 5.1 C35R25A6 2.10 0.686 2080 0.314 0.398 78.3 740 5.6 9.6 5.4 C35R30A6 2.45 0.687 2075 0.313 0.396 78.9 750 5.2 10.4 5.8 C40R0A6 0.60 0.669 2115 0.331 0.420 73.9 665 6.1 4.8 2.3 C40R15A6 1.00 0.671 2090 0.329 0.414 77.0 680 5.2 6.8 2.6 C40R20A6 1.20 0.673 2080 0.327 0.412 78.3 675 5.3 7.1 2.8 C50R0A2 0.50 0.652 2210 0.346 0.439 62.1 600 1.8 2.1 1.2 C50R0A6 0.50 0.654 2095 0.348 0.434 76.4 605 5.2 1.8 1.1 Notation: Ac: air content (%); CA/TS: coarse aggregate/total solid volume ratio; Dh: dosage of high-range water reducer (% B); Dm: mortar density (kg/m3); Sf: slump flow (mm); Ti: inverted slump cone flow time (s); To: orimet flow time (s); τcmy: critical mortar yield stress needed to avoid segregation; Vca: coarse aggregate volume (m3/m3); Vm: mortar volume (m3/m3) ∗The numbers after ‘C’ and ‘R’ represent W/B ratio and RHA content, respectively
The evaluation of the static segregation resistance of SCHPC by conducting a visual
inspection of bleeding, mortar halo and aggregate pile in flow spreads may not be always
reliable because these phenomena indicate the lateral stability only (Bonen and Shah 2005).
The segregation may occur even none of these phenomena appears in flow spread (EFNARC
2002). For example, the concrete C50R0A2 exhibited no bleeding, mortar halo and aggregate
pile in flow spreads but it had relatively high segregation index and factor as obvious from
Figures 10.11 and 10.12. However, a concrete segregating in flow spread will definitely
segregate after placement. For instance, the concrete C35R15A6 showed significant mortar
halo in slump flow, and orimet and inverted slump cone flow spreads. The segregation index
and factor of this concrete were also significantly high as evident from Figures 10.11 and
10.12. A similar result was reported by other researchers (Bonen and Shah 2005).
254

No signs of segregation in slump flow spread (C50R0A2)
No signs of segregation in orimet flow spread (C50R0A2)
Figure 10.13a: Appearances of the slump flow and orimet flow spreads for C50R0A2
255

No signs of segregation in inverted slump cone flow spread (C50R0A6)
Significant mortar halo in orimet flow spread (C35R15A6)
Figure 10.13b: Appearances of the inverted slump cone flow spread for C50R0A6 and orimet flow spread for C35R15A6
256
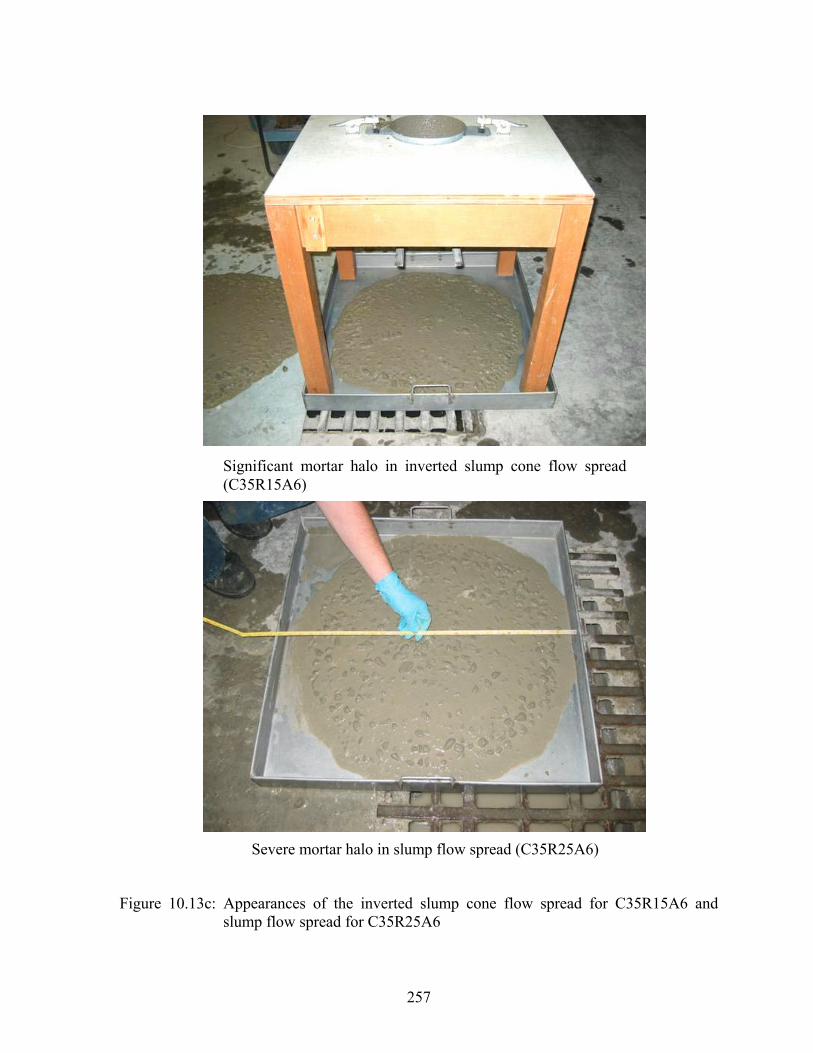
Significant mortar halo in inverted slump cone flow spread (C35R15A6)
Severe mortar halo in slump flow spread (C35R25A6)
Figure 10.13c: Appearances of the inverted slump cone flow spread for C35R15A6 and slump flow spread for C35R25A6
257
The evaluation of the static segregation resistance based on the visual inspection of
the concrete resting in a mixer pan can also be misleading. This is because the absence of
significant bleeding or thick layer of paste on the top of resting concrete does not always
imply that the SCHPC possesses a good static segregation resistance. For example, no
significant bleeding and thick layer of paste were observed for C50R0A2. Yet it provided
significant segregation index and factor showing relatively a low static segregation
resistance. Also, there was no external bleeding for C35R15A6 but it provided significantly
high segregation index and factor indicating very low static segregation resistance. However,
a concrete showing significant bleeding and/or a thick layer of paste in mixer pan will
definitely segregate after placement.
Segregation index:
The segregation index obtained from the sieve segregation test provided a quantitative
measurement for the static segregation resistance of concrete. The segregation indices of
various concretes are presented in Figure 10.11. The segregation index varied from 10.5% to
21.4% for different concretes. The concrete with 0.50 W/B ratio and 0% RHA (C50R0A2)
produced the lowest segregation index (10.5%). In contrast, the concrete with 0.35 W/B ratio
and 15% RHA (C35R15A6) provided the highest segregation index of 21.4%. If a
segregation index of 18% is considered as the maximum acceptable limit for adequate
segregation resistance, then the concrete C35R15A6 cannot be considered as resistant to
segregation.
The segregation index was largely influenced by the horizontal spread or slump flow
of concrete as can be seen from Figure 10.14. Similar results were reported in previous
research (Rols et al. 1997, Lachemi et al. 2003). The increased slump flow implied that the
spread of concrete on the sieve was greater due to lower yield stress. In general, a lower yield
stress decreases the segregation resistance of concrete. The higher HRWR dosage and greater
mortar volume given in Table 10.7 also indicate that the yield stress was reduced to provide a
higher slump flow of concrete. Therefore, more mortar passed the sieve leading to increased
segregation index. The segregation indices obtained also imply that the sieve test is inclined
to provide the segregation resistance of concrete in horizontal direction. It may not represent
258
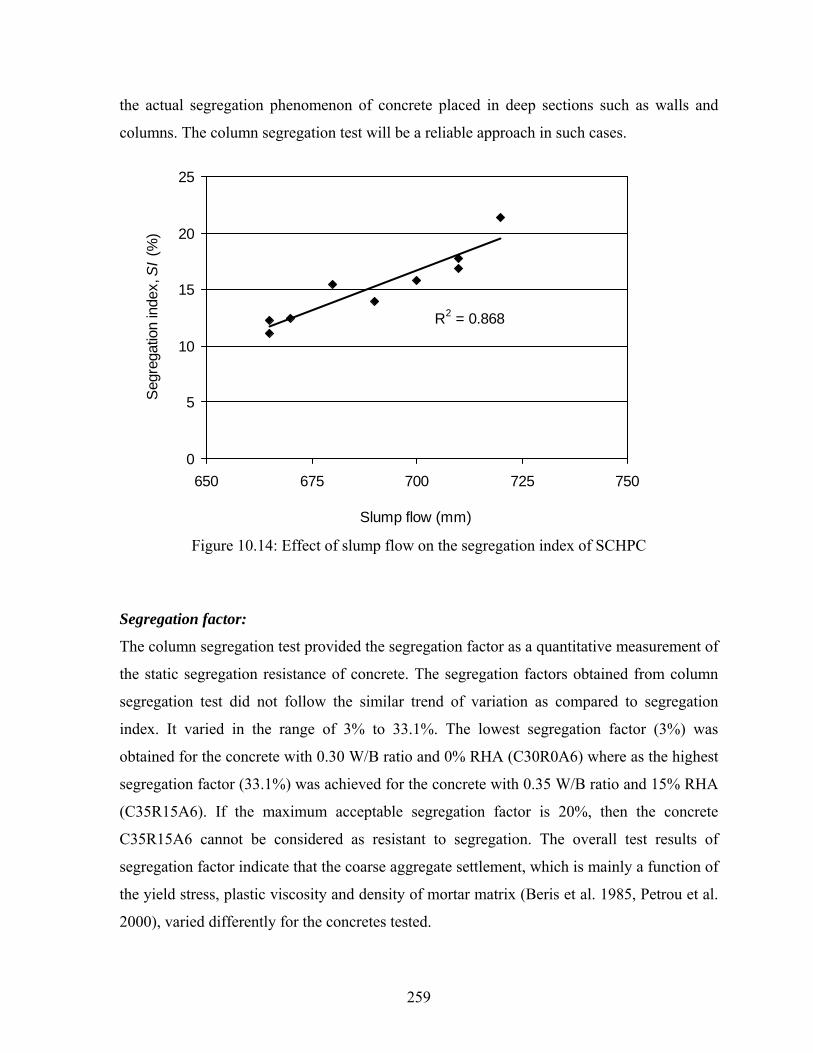
the actual segregation phenomenon of concrete placed in deep sections such as walls and
columns. The column segregation test will be a reliable approach in such cases.
R2 = 0.868
0
5
10
15
20
25
650 675 700 725 750
Slump flow (mm)
Seg
rega
tion
inde
x, S
I (%
)
Figure 10.14: Effect of slump flow on the segregation index of SCHPC
Segregation factor:
The column segregation test provided the segregation factor as a quantitative measurement of
the static segregation resistance of concrete. The segregation factors obtained from column
segregation test did not follow the similar trend of variation as compared to segregation
index. It varied in the range of 3% to 33.1%. The lowest segregation factor (3%) was
obtained for the concrete with 0.30 W/B ratio and 0% RHA (C30R0A6) where as the highest
segregation factor (33.1%) was achieved for the concrete with 0.35 W/B ratio and 15% RHA
(C35R15A6). If the maximum acceptable segregation factor is 20%, then the concrete
C35R15A6 cannot be considered as resistant to segregation. The overall test results of
segregation factor indicate that the coarse aggregate settlement, which is mainly a function of
the yield stress, plastic viscosity and density of mortar matrix (Beris et al. 1985, Petrou et al.
2000), varied differently for the concretes tested.
259
The yield stress and plastic viscosity of the concretes were not determined directly in
the present study. However, the slump flow and flow time are strongly correlated with the
yield stress and plastic viscosity of concrete, respectively (Níelsson and Wallevik 2003). In
addition, the paste or mortar volume affects the yield stress (Wallevik 2006) and viscosity of
concrete (Bonen et al. 2007). The slump flow, orimet and inverted slump cone flow times,
mortar volume and density, HRWR dosage and RHA content of the concretes tested for
column segregation are shown in Table 10.8. The increase in slump flow indicated that the
yield stress decreased, and the increase in flow time implied that the plastic viscosity
increased although it was not too high to stop the concrete flow. In addition, the increase in
matrix (mortar) density suggests that the settlement of coarse aggregate was reduced because
it increases the buoyant force acting on aggregates. Indeed, the combined effect of yield
stress, plastic viscosity and mortar density determined the extent of segregation factor. The
settlement of coarse aggregate occurs when the mortar yield stress is less than the critical
value. The critical yield stress of mortar depends on its density. A decrease in matrix density
increases the critical yield stress required to avoid segregation (Saak et al. 2001). On the
other hand, the plastic viscosity controls the degree of segregation in concrete. A decrease in
plastic viscosity increases the settlement rate of coarse aggregate, and thus lessens the
segregation resistance of concrete (Bonen and Shah 2005).
10.6.2 Dynamic segregation resistance
The results of visual inspection of the quality of concrete during slump flow, and inverted
slump cone flow and orimet flow spreads qualitatively showed the dynamic segregation
resistance of concrete. The orimet and inverted slump cone flows also indicated the dynamic
segregation resistance of concrete.
Dynamic segregation resistance based on flow spreads:
There was no formation of aggregate pile during slump flow, orimet flow and inverted slump
cone flow spreads of the concretes as mentioned in Table 10.7. This is mostly due to low
coarse aggregate content and increased mortar volume of concrete as can be seen from Table
10.8. The volume of coarse aggregate was in the range of 30.3% to 34.8%, which is less than
the maximum recommended content (35%) for SCHPC (Uomoto and Ozawa 1999).
260
Consequently, the mortar volume of concrete became higher (> 65%) for this low range of
coarse aggregate content. The inter-particle contact between coarse aggregates was decreased
at lower aggregate content and increased mortar volume. Therefore, more kinetic energy was
available to disperse the coarse aggregates. However, the absence of any signs of dynamic
segregation in flow spreads does not mean that the concrete is dynamically stable. This is
because the flow spreads can indicate the dynamic segregation of concrete in the lateral
direction only.
The flow spread was faster for the concretes with higher W/B ratio and without any
RHA. In contrast, the flow spread became slower for the concretes with lower W/B ratio and
higher RHA content. In particular, the concrete became sticky in the presence of RHA. The
stickiness was increased with increasing RHA content, and the deformation of concrete in
flow spread became gradually slower. This observation suggests that the viscosity of
concrete was increased with lower W/B ratio and higher RHA content. Indeed, the viscosity
played the key role for the dynamic segregation resistance of concrete during horizontal flow
by resisting the separation of coarse aggregates.
Dynamic segregation resistance based on vertical concrete flow and flow times:
The vertical flow of concrete was uniform during orimet and inverted slump cone flow tests
for the majority of concretes. No tendency of blockage was observed during the orimet and
inverted slump cone flows except for C40R0A6 and C50R0A2. This suggests that most of
the concretes possessed sufficient dynamic segregation resistance. It is primarily due to the
decreased aggregate content and increased plastic viscosity of concrete. The interaction
between coarse aggregates leading to blocking of concrete flow is reduced at a lower coarse
aggregate content. In addition, a high plastic viscosity results in a high drag force, which
decreases the terminal velocity of coarse aggregates, and thus reduces the dynamic
segregation in concrete (Saak et al. 2001). The terminal velocity and therefore the dynamic
segregation resistance is also a function of matrix density (Saak et al. 2001). However, the
concrete flow observed suggests that the effect of plastic viscosity is more predominant than
that of matrix density for dynamic segregation resistance.
The orimet and inverted slump cone flow time results for the concretes tested are
given in Table 10.8. The concrete flow time became higher with lower W/B ratio and greater
261
RHA content. The flow time is directly related to the viscosity of concrete (Níelsson and
Wallevik 2003). This suggests that that the viscosity was increased for the concretes with
lower W/B ratio and higher RHA. Therefore, the unblocked flow time results can provide an
indication of dynamic segregation resistance of concrete. Safawi et al. (2003) reported that
the degree of segregation is inversely related to the flow time of concrete. The degree of
segregation becomes higher when the flow time is lower.
The tendency of blocking was observed for C40R0A6 and C50R0A2 in the first batch
but no blocking occurred in repeated batches of both types. The unblocked orimet and
inverted slump cone flow times of these two concretes indicate that their viscosity was
relatively low. Also, the volume aggregate contents of these two concretes were 33.1% and
34.6% as can be seen from Table 10.8. Thus, the aggregate contents were comparatively
high, although below the maximum recommended amount. Due to low viscosity and
increased aggregate content, C40R0A6 and C50R0A2 were susceptible to dynamic
segregation. Therefore, any variation in coarse aggregate content during placement may
trigger the dynamic segregation to occur.
The SCHPC mixture must possess a sufficiently high plastic viscosity to avoid
segregation under dynamic condition (Saak et al. 2001). The plastic viscosity helps to keep
the coarse aggregates in suspension and thus reduces the dynamic segregation of concrete.
However, the plastic viscosity is not a critical factor for the static segregation resistance. The
critical matrix (mortar) yield stress and the matrix density play the key roles in static
segregation of concrete. Therefore, a dynamically segregation-resistant SCHPC mixture may
experience static segregation.
10.6.3 Effect of water-binder ratio
The visual inspection was not effective to exhibit the effect of W/B ratio on the static or
dynamic segregation resistance of concretes. This is because the concretes C30R0A6 (W/B:
0.30), C35R0A6 (W/B: 0.35) and C50R0A6 (W/B: 0.50) were equally good on the basis of
visual observation, and no signs of segregation were noticed. However, the orimet and
inverted slump cone flow time results showed that an increase in W/B ratio decreased the
flow time. This suggests that a higher W/B ratio decreases the plastic viscosity, and thus
increases the susceptibility of concrete to dynamic segregation. Therefore, the concretes
262
C40R0A6 (W/B: 0.40) and C50R0A2 (W/B: 0.50) showed a tendency of blockage in orimet
and inverted slump cone flow tests, as discussed in Section 10.6.2.
The segregation index was increased with lower W/B ratio as can be seen from Figure
10.15. A similar effect was observed by Bouzoubaâ and Lachemi (2001). This is mainly
credited to the increased mortar volume at higher content of cementing material. The slump
flow values given in Table 10.8 suggest that the yield stress was reduced due to greater
mortar volume and higher HRWR dosage. Therefore, the concrete spread was greater and
more mortar passed the sieve resulting in higher segregation index. Although the plastic
viscosity of concrete was increased at lower W/B ratio as evident from the higher orimet and
inverted slump cone flow time results given in Table 10.8, it did not reduce the segregation
index. This is because the viscosity was not sufficiently high enough to significantly reduce
the spread of concrete over the sieve. Also, the density of mortar matrix was increased with
lower W/B ratio as can be seen from Table 10.8. However, it seems that the effect of
increased matrix density on aggregate settlement was absent in sieve segregation test due to
the limited sample height and restricted vertical movement of coarse aggregates in concrete.
Thus, it was understood that the segregation index was dominated by the flow spread of
concrete at reduced yield stress.
The segregation factor was decreased with lower W/B ratio as can be seen from
Figure 10.16, which is in contrast with the result of segregation index. A similar effect was
noticed by Assaad et al. (2004). This is mainly due to the increased density of mortar matrix
at lower W/B ratio. The buoyant force acting on the aggregates was increased when the
density of mortar became higher. Also, the lower W/B ratio resulted in higher plastic
viscosity, which increased the frictional force acting against the gravity. Consequently, the
net downward force was decreased and the settlement of aggregates was reduced. In addition,
the coarse aggregate/total solid (CA/TS) volume ratio was decreased at lower W/B ratio as
shown in Table 10.8. The segregation resistance of concrete is considerably increased at
lower CA/TS volume ratio (Ye et al. 2005).
10.6.4 Effect of rice husk ash
The RHA influenced both static and dynamic segregation resistances of SCHPC. The visual
inspection of the flow spreads and resting concrete revealed that the presence of RHA
263
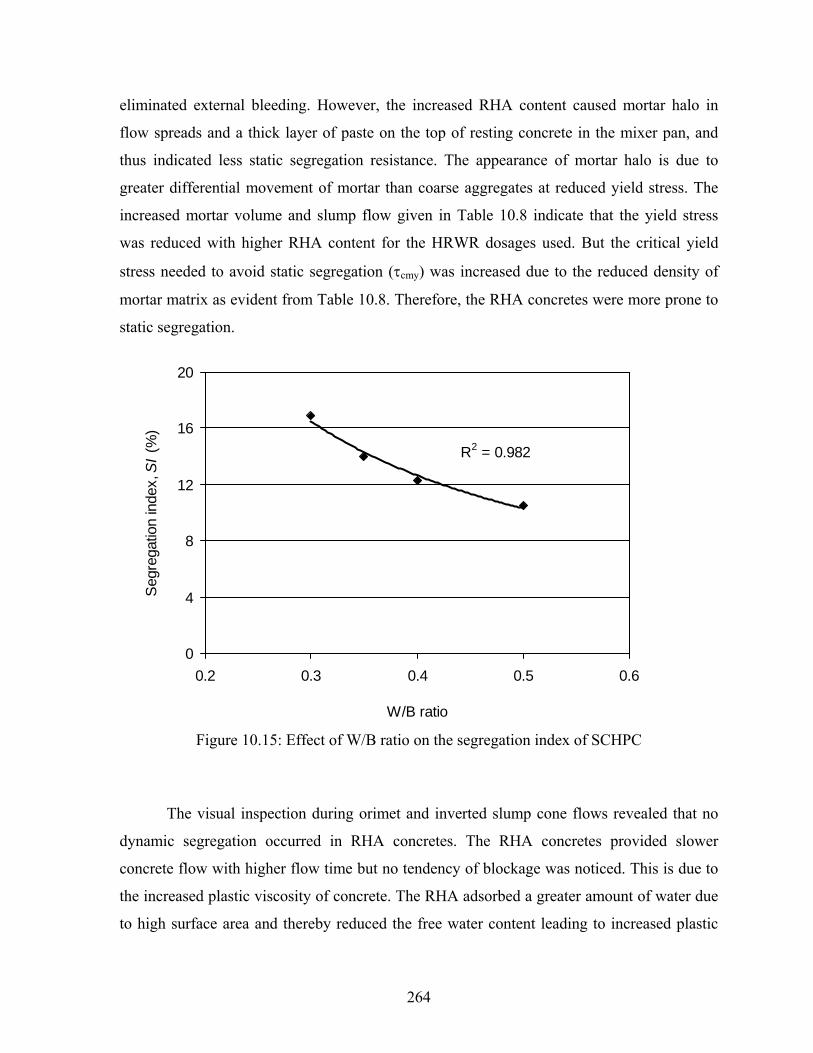
eliminated external bleeding. However, the increased RHA content caused mortar halo in
flow spreads and a thick layer of paste on the top of resting concrete in the mixer pan, and
thus indicated less static segregation resistance. The appearance of mortar halo is due to
greater differential movement of mortar than coarse aggregates at reduced yield stress. The
increased mortar volume and slump flow given in Table 10.8 indicate that the yield stress
was reduced with higher RHA content for the HRWR dosages used. But the critical yield
stress needed to avoid static segregation (τcmy) was increased due to the reduced density of
mortar matrix as evident from Table 10.8. Therefore, the RHA concretes were more prone to
static segregation.
R2 = 0.982
0
4
8
12
16
20
0.2 0.3 0.4 0.5 0.6
W/B ratio
Seg
rega
tion
inde
x, S
I (%
)
Figure 10.15: Effect of W/B ratio on the segregation index of SCHPC
The visual inspection during orimet and inverted slump cone flows revealed that no
dynamic segregation occurred in RHA concretes. The RHA concretes provided slower
concrete flow with higher flow time but no tendency of blockage was noticed. This is due to
the increased plastic viscosity of concrete. The RHA adsorbed a greater amount of water due
to high surface area and thereby reduced the free water content leading to increased plastic
264

viscosity, as evident from the orimet and inverted slump cone flow time results. The
increased plastic viscosity increases the vertical drag force, which decreases the terminal
velocity of falling aggregates and thus improves the dynamic segregation resistance of
concrete. Although the density of the mortar matrix was reduced, it was not more
predominant than the increased vertical drag force to cause dynamic segregation. Thus, it
was understood that the increased viscosity played the key role to prevent the separation of
coarse aggregates. In addition, the mortar volume was increased and the coarse aggregate
content was slightly decreased in the presence of RHA. The increased mortar volume and
decreased aggregate content reduced the inter-particle contact between aggregates and
thereby eliminated the tendency of dynamic segregation.
R2 = 0.998
0
4
8
12
16
20
0.2 0.3 0.4 0.5 0.6
W/B ratio
Seg
rega
tion
fact
or, S
F (%
)
Figure 10.16: Effect of W/B ratio on the segregation factor of SCHPC
The results of sieve and column segregation tests revealed that the concretes with
higher RHA content provided lower static segregation resistance. The segregation index was
increased with higher RHA content as evident from Figure 10.11. This is because the
increase in RHA content increased the mortar volume as can be seen from Table 10.8. The
265
higher slump flow also indicates that the yield stress was decreased for the HRWR dosages
used. Therefore, the concrete spread was higher and that produced greater segregation index
for SCHPC.
The RHA significantly affected the segregation factor of concrete, as can be seen
from Figure 10.12. It is mostly due to the decreased yield stress and matrix density of
concrete. The slump flow was increased with higher RHA content for the HRWR dosages
used, suggesting that a low level of yield stress was attained for the RHA concretes. In
addition, the volume of mortar matrix increased in the presence of RHA as can be seen from
Table 10.8. The increased mortar volume decreases the yield stress of concrete due to
enhanced lubrication and greater inter-particle distance between aggregates (Wallevik 2006).
Moreover, the increased mortar volume at higher RHA content decreased the density of
mortar matrix as evident from Table 10.8. Both yield stress and matrix density affect the
static segregation resistance of concrete, as discussed in Section 2.12.1 (Chapter 2). The net
downward force acting on the aggregates increases when the matrix density is decreased and
the upward restoring or frictional force decreases when the yield stress is decreased. As a
result, the settlement of aggregates occurred with a greater equilibrium velocity. Although
the increased plastic viscosity induced by the RHA slowed down the settlement rate of falling
aggregates, it was not sufficient to significantly reduce the degree of aggregate settlement.
This is because the effect of reduced matrix density on the settlement of coarse aggregates
can be as high as or even greater than that of plastic viscosity (Bonen and Shah 2005, Saak et
al. 2001). A decrease in the matrix density from 2330 to 2190 kg/m3 (6%) can cause more
than a five fold increase in the content of segregated coarse aggregates at the bottom of the
column apparatus. In addition, the effect of plastic viscosity becomes less effective when the
matrix density is decreased (Bonen and Shah 2005). Indeed, the reduced matrix density and
the decreased yield stress together played the key role to cause significant static segregation
in SCHPC mixtures containing higher RHA content.
10.6.5 Effect of viscosity-enhancing admixture
The visual observation revealed that the use of VEA improved the segregation resistance of
concrete since no signs of segregation appeared in the mixer pan and slump flow spread.
266
However, this process was unable to quantify the extent of improvement in segregation
resistance of the concretes with VEA.
The static segregation resistance of concrete was significantly improved in the
presence of VEA. The segregation index of C35R10A6 and C35R15A6 was 17.8% and
21.4%, respectively. When the VEA was used, these two concretes (re-designated as
C35R10A6V and C35R15A6V) provided the segregation index of 11.1% and 12.5%,
respectively, as can be seen from Figure 10.11. Thus, a significant reduction in segregation
index (37 to 42%) was made by the VEA. This is because the spread of the concretes was
reduced in the presence of VEA, as evident from the lower slump flow results given in Table
10.8. The viscosity and yield stress of concrete are significantly increased due to the high
degree of association and entanglement of VEA polymer chains (Assaad et al. 2004). As a
result, the ease of flow was reduced leading to a decrease in concrete spread.
The improvement of segregation resistance by the VEA was more significant from the
results of column segregation test. The segregation factor of C35R10A6 and C35R15A6 was
16.4% and 33.1%, respectively. In the presence of VEA, the segregation factor of these two
concretes (re-designated as C35R10A6V and C35R15A6V) was reduced to 1.5% and 9.0%,
respectively, as can be seen from Figure 10.12. A similar effect of VEA on the segregation
resistance of concrete was reported by Khayat and Guizani (1997). In the present study, the
reduction in segregation factor was about 73 to 91%. The percent reduction in segregation
factor was about twice the percent reduction in segregation index for the concretes tested.
The significant reduction in segregation factor is due to the reason that the VEA greatly
increases the viscosity and yield stress of mortar matrix (Nagataki and Fujiwara 1995,
Khayat 1999). In addition, the use of VEA decreased the air content of concrete for given
AEA dosage. In the presence of VEA, the concretes C35R10A6V and C35R15A6V had
3.5% and 3.8% air content, respectively, although the design air content was 6%. The yield
stress and plastic viscosity of concrete can be increased with the reduction in air content
(Chidiac et al. 2003, Khayat 2000). Also, the volume of mortar matrix was reduced due to the
reduced air content and thus its density increased, as can be seen from Table 10.8. These
effects were conducive to increase the static segregation resistance of concrete.
The use of VEA improved the segregation resistance of concrete but it caused some
reductions in slump flow and air content as mentioned before. The maximum reduction in
267
slump flow was about 7%. The slump flow of the VEA concretes (C35R10A6V and
C35R15A6V) as shown in Table 10.8 still represents a good filling ability of concrete. In
addition, the reduction in air content was about 1.3 to 1.6% as compared to the air content
obtained in the absence of VEA. The design total air content of 6±1.5% can be achieved by
using a slightly increased AEA dosage. This will not have a significant negative effect on
achieving adequate static segregation resistance, since the increases in the viscosity and yield
stress caused by VEA normally dominate to improve the segregation resistance of concrete.
10.7 Comparison of Sieve and Column Segregation Tests
The factors affecting the static segregation in concrete do not produce similar effects during
sieve and column tests. The segregation index given by the sieve test is mainly affected by
the yield stress of concrete. But the segregation factor obtained from the column test is
affected by the yield stress, plastic viscosity and matrix density of concrete. Therefore, the
results of sieve and column tests can be significantly different for a given concrete. A
concrete passing the sieve test may or may not pass the column test. This is because the result
of the column test also considerably depends on the plastic viscosity and matrix density of
concrete. For this reason, the segregation result obtained from the sieve test sometimes can
be misleading for the application of SCHPC in vertical members. In such cases, the column
test should be carried out to determine the static segregation resistance of concrete. The result
obtained from the column apparatus will be more representative for the concrete used in
vertical members. In contrast, the sieve test is more appropriate to measure the static
segregation resistance of SCHPC to be used in horizontal flat members such as slabs and
pavements.
10.8 Suitable Content of Rice Husk Ash
The RHA did not adversely affect the dynamic segregation resistance of concrete due to
increased plastic viscosity. In contrast, the RHA decreased the static segregation resistance of
concrete as it reduced the density of mortar matrix. The maximum RHA content for the
adequate segregation resistance (SI ≤ 18%, SF ≤ 20%) depended on the W/B ratio of
concrete. For example, the concrete C40R15A6 (W/B: 0.40) with 15% RHA provided
adequate static segregation resistance whereas the concrete C35R15A6 (W/B: 0.35) with
268
15% RHA provided significantly low static segregation resistance. In addition, the adequate
static segregation resistance was obtained for the concretes C35R5A6 and C35R10A6, which
were prepared with 5% and 10% RHA, respectively. Based on the results of the present
study, 10% RHA content can be considered as the maximum suitable content for segregation-
resistant SCHPC without VEA. This amount can be increased if the RHA is used in SCHPC
mixture in the presence of a VEA.
10.9 Conclusions
a. The segregation column with 150D×600H mm dimensions and 4 sections was more
efficient than any other column to measure the static segregation resistance of concrete.
The greater lateral dimension minimized the blocking of aggregate movement and the
greater vertical dimension captured the effects of casting and aggregate settlement
heights. Also, the column size was user-friendly, and required less quantity of concrete to
conduct the test by a single operator.
b. The segregation factor calculated from the top and bottom sections was identical to that
calculated from all four sections of the column apparatus. Thus, the consideration of just
top and bottom sections simplified the test procedure for column segregation without
compromising the accuracy of segregation measurement.
c. The segregation factor was well-correlated with the segregation index and variations in
compressive strength and true electrical resistivity of the concrete used for the
development of column apparatus.
d. The dynamic segregation was good for most of the concretes due to reduced coarse
aggregate content. In addition, the lower W/B ratio and the higher RHA content were
conducive to improve the dynamic segregation resistance because the plastic viscosity of
concrete was increased.
e. The concretes with 0.40 and 0.50 W/B ratios and without any RHA exhibited less
dynamic segregation resistance due to relatively high aggregate content and low
viscosity. In contrast, the RHA concretes produced less static segregation resistance due
to the decreases in yield stress and matrix density.
f. A concrete showing signs of segregation in flow spreads will definitely segregate after
placement but the lack of segregation in flow spreads does not necessarily mean that the
269
concrete will not segregate after placement. Similarly, the absence of bleeding and/or a
thick layer of paste on the top of concrete resting in mixer pan do not imply that the post-
placement segregation will not occur. Hence, the visual inspection is often misleading
and not reliable.
g. The segregation index obtained from the sieve test increased with lower W/B ratio and
higher RHA content due to greater concrete spread at higher mortar volume and HRWR
dosage. The increase in segregation index was consistent with the increased slump flow
of concrete.
h. The sieve segregation test did not effectively capture the effects of plastic viscosity and
matrix density on the segregation resistance of concrete due to limited sample height and
restricted coarse aggregate settlement. The column segregation test overcame these
deficiencies and thus proved its potential for use as a reliable method to measure the
static segregation resistance of SCHPC.
i. The segregation column test should be conducted to measure the static segregation
resistance of SCHPC to be cast in vertical members, because the column apparatus can
effectively deal with the major factors affecting the segregation in such cases.
j. The concrete with higher flow time and greater matrix density provided lower
segregation factor in the absence of RHA despite having an increased slump flow. This
indicated that the effect of reduced yield stress was minimized due to higher plastic
viscosity and increased matrix density.
k. The segregation factor decreased with lower W/B ratio due to the increases in the
viscosity and matrix density of concrete. A W/B ratio in the range of 0.30 to 0.35 was
suitable to improve the segregation resistance of SCHPC.
l. The static segregation resistance was reduced in the presence of RHA because it
decreased the matrix density of concrete. However, a RHA content in the range of 0% to
10% can be used without any VEA to produce SCHPC with adequate segregation
resistance. The RHA content can be increased if used with a VEA.
m. The VEA was very effective to produce segregation-resistant SCHPC incorporating RHA
because it increases the yield stress and viscosity of concrete. Thus, the proper
combination of HRWR and VEA can be an efficient way of achieving the segregation-
free SCHPC.
270
Chapter 11
Mixture Design of Self-consolidating High Performance Concrete
11.1 General
This chapter describes a mixture design procedure for self-consolidating high performance
concrete (SCHPC) and discusses its limitations. The performance requirements, principles of
mixture design, materials selection, and requirements for mixture composition are
highlighted. In addition, this chapter gives an example of mixture design for a SCHPC.
11.2 Research Significance
The optimization of SCHPC often requires carrying out many trial batches to achieve the
desired fresh and hardened properties and durability of concrete. The mixture design method
presented herein can be beneficial to obtain an optimum mixture composition of SCHPC
with a minimum number of trial batches. The mixture design given is mainly for air-
entrained SCHPC including rice husk ash (RHA) as a supplementary cementing material
(SCM) at low water-binder (W/B) ratio. However, it is also valid for the SCHPC without any
RHA, and can be applied for the non-air-entrained SCHPC. The optimum sand-aggregate
(S/A) ratio is used in the design and therefore it requires relatively low binder paste, that is,
low binder (cement plus RHA) content. This approach could help the concrete industry to
produce SCHPC cost-effectively while satisfying the performance requirements.
11.3 Performance Requirements
The key properties such as filling ability, passing ability, segregation resistance, compressive
strength, and durability must be achieved to produce SCHPC. The rheological properties
such as yield stress and plastic viscosity should be suitable to obtain the filling ability,
passing ability and segregation resistance in desired levels. The porosity and transport
properties should be decreased, whereas the electrical resistivity should be increased to
improve the durability of SCHPC. In addition, the appropriate air content must be present in
SCHPC to obtain good freeze-thaw durability.
271
11.3.1 Filling ability
The SCHPC must possess good filling ability to achieve self-consolidation capacity. The
filling ability is mainly governed by the W/B ratio, amount of cementing materials, and
dosage of high-range water reducer (HRWR). The increased amount of cementing material,
low W/B ratio and adequate HRWR dosage should be used to obtain an optimum filling
ability. While adjusting the W/B ratio and amount of cementing materials, the coarse
aggregate content should also be kept below the recommended maximum level (≤ 35% of
concrete volume) to maintain a good filling ability.
The slump is not a suitable criterion for SCHPC because of its high flowing ability.
Hence, the slump flow is widely used as a performance criterion of filling ability. The range
of slump flow is selected based on the type of intended application. Three levels of filling
ability can be selected for SCHPC on the basis of slump flow (SCCEPG 2005):
Level 1 filling ability – a slump flow of 550 to 650 mm: It is appropriate for
unreinforced or slightly reinforced concrete structures, and for sections with low element
shape intricacy, low element length, and high wall thickness.
Level 2 filling ability – a slump flow of 660 to 750 mm: It is most appropriate for
moderately reinforced concrete structures; for sections with medium shape intricacy, length
and wall thickness, and where concrete flows a medium horizontal distance.
Level 3 filling ability – a slump flow of 760 to 850 mm: It is suitable for elements
with highly congested reinforcement, narrow width and complex shape, and typically used
for vertical applications with a small maximum size of coarse aggregates and for lateral
applications where concrete must flow long horizontal distances.
11.3.2 Passing ability
The SCHPC must possess adequately high passing ability to allow the concrete flow between
reinforcing bars. This is mainly governed by the coarse aggregate size and content of
concrete. The coarse aggregate content should be below the maximum recommended amount
(≤ 35% of concrete volume) to obtain the desired passing ability. The low maximum size of
coarse aggregate should also be used to improve the passing ability of SCHPC.
The mortar volume should be sufficiently large to increase the inter-particle spacing
between coarse aggregates. The viscosity of the mortar component should also be high to
272
resist the separation of coarse aggregates. However, it should not be excessively high so that
the coarse aggregate cannot pass through the gap between reinforcing bars.
The difference between slump flow and slump cone – J-ring flow can be used as a
performance criterion for the passing ability of SCHPC. Two levels of passing ability can be
used for SCHPC depending on the type of intended application (ASTM C 1621/C 1621M,
2007; SCCEPG 2005):
Level 1 passing ability - a difference between slump flow and slump cone – J-ring
flow of 25 to 50 mm with a minimal noticeable blocking: It is suitable for normal
applications with unreinforced or slightly reinforced sections.
Level 2 passing ability – a difference between slump flow and slump cone – J-ring
flow of 0 to 25 mm without any visible blocking: It is appropriate for concrete sections with
highly congested reinforcement, narrow width, and complex shape.
11.3.3 Segregation resistance
The risk of segregation is usually very high in SCHPC due to high fluidity. The segregation
resistance of SCHPC can be improved by decreasing the W/B ratio with increased cementing
material or by adding a viscosity-enhancing admixture (VEA). The role of coarse aggregate
is also vital to improve the segregation resistance of SCHPC. The segregation resistance is
improved when a reduced content and a lower maximum size of coarse aggregate are used.
Both dynamic and static segregations can occur in SCHPC. The requirements for
adequate dynamic segregation resistance are more stringent for sections with congested
reinforcement or for applications where the concrete is dropped from a greater vertical height
and flows a longer horizontal distance (Koehler and Fowler 2006). To achieve a good
dynamic segregation resistance, the SCHPC must possess an adequately high plastic
viscosity, whereas it must possess a yield stress above the critical value to attain good static
segregation resistance. In both cases of segregation, the difference between the densities of
coarse aggregate and matrix (paste or mortar) should be as low as possible. The susceptibility
to static segregation can be severe if the matrix density of SCHPC is decreased.
The segregation factor obtained from the column apparatus can be used as a criterion
for the static segregation resistance of concrete. Two levels of segregation resistance can be
proposed for SCHPC as follows:
273
Level 1 segregation resistance – a segregation factor ranging from 10 to 20%: It is
applicable for both horizontal and vertical applications with lower flow distance and lightly
reinforced or unreinforced section.
Level 2 segregation resistance – a segregation factor less than 10%: It is preferred for
vertical applications with greater flow distance and highly congested reinforcement.
11.3.4 Rheological properties
The rheological properties such as yield stress and plastic viscosity play the vital roles to
influence the flowing ability (filling ability and passing ability) and segregation resistance of
concrete.
Yield stress:
The yield stress must be low to increase the flowing ability of concrete. In general, the yield
stress of SCHPC varies in the range of 0 to 60 Pa (Bonen and Shah 2005). The yield stress
requirement depends on the plastic viscosity of concrete. When the plastic viscosity is below
40 Pa.s, the SCHPC should have a yield stress greater than zero. Conversely, the yield stress
can be about zero when the plastic viscosity is higher than 70 Pa.s (Wallevik 2003).
However, a zero yield stress is detrimental for static segregation resistance. Therefore, an
SCHPC mixture should have a yield stress greater than zero. Generally, a yield stress above
10 Pa is considered significant but negligible if it drops below 10 Pa (Wallevik 2003).
The yield stress can be assessed by the slump flow since they are strongly correlated.
The slump flow of SCHPC must be higher than 550 mm to achieve a yield stress value below
60 Pa (Níelsson and Wallevik 2003). The flow spread of the mortar component of SCHPC
can also be used to represent the slump flow and thus the yield stress of concrete. It was
found in the present study that the flow spread of mortar must be higher than 250 mm to
obtain a slump flow of concrete greater than 550 mm, which suggests a concrete yield stress
below 60 Pa.
Plastic viscosity:
The plastic viscosity of SCHPC should be moderate to maintain good flowing ability and
adequately high segregation resistance. A low viscosity is detrimental for both static and
274
dynamic segregation resistances. Also, a high viscosity reduces the flowing ability of
concrete. Generally, the plastic viscosity of SCHPC mixture should be in the range of 20 to
100 Pa.s (Wallevik 2003).
The plastic viscosity can be assessed based on the flow time of concrete because they
are generally well-correlated. The orimet and inverted slump cone flow times can provide an
indication of the plastic viscosity of concrete. The orimet flow time should be in the range of
2.5 to 9 sec (Grünewald et al. 2004). The corresponding inverted slump cone flow time
ranges from 1 to 5 sec, as observed in the present study. The inverted slump cone flow time >
5 sec and the orimet flow time > 9 sec indicate relatively a high viscosity, which should be
avoided. Based on the orimet and inverted slump cone flow times of concrete, two levels of
viscosity can be defined as follows:
Level 1 viscosity – an inverted slump cone flow time ≤ 2.5 s or an orimet flow time ≤
5 s: It is expected to provide good flowing ability and self-consolidation capacity with a
plastic viscosity ≤ 60 Pa.s (Níelsson and Wallevik 2003). However, the concrete may be
susceptible to bleeding and segregation.
Level 2 viscosity – an inverted slump cone flow time > 2.5 s or an orimet flow time >
5 s: It is expected to provide good flowing ability and self-consolidation capacity with a
plastic viscosity > 60 Pa.s (Níelsson and Wallevik 2003). This level of viscosity improves the
segregation resistance of concrete. However, the inverted slump cone and orimet flow times
should not be greater than 5 and 9 s, respectively, to avoid excessively high viscosity.
The flow time of binder paste obtained from the grout flow cone test can also be used
to represent the viscosity of corresponding concrete. The flow time of paste is well-correlated
with the orimet and inverted slump cone flow times of concrete as observed in the present
study. Therefore, the viscosity criteria for the orimet and inverted slump cone flow times can
be used to determine the viscosity criterion for the paste flow time. It was obtained in the
present study that the flow time of paste should be ≤ 7 sec for level 1 viscosity and > 7 sec
for level 2 viscosity. However, it should be ≤ 13 sec to avoid excessively high viscosity.
11.3.5 Compressive strength
The compressive strength of high performance concrete at 28 days must be greater than 40
MPa (Kosmatka et al. 2002), which is also valid for SCHPC. It can be achieved by using low
275
maximum size of coarse aggregate and reduced W/B ratio, and by incorporating a suitable
SCM. Most of the SCMs produce higher strength at later age. For this reason, the 28 days
criterion for compressive strength has been modified to 56 days or 91 days in many
specifications (ACI 211.4R-93, 2004). However, the 28 days criterion can be used for the
RHA concrete. This is because the additional strength gain due to RHA was ≤ 5% at 56 days
as compared to the compressive strength at 28 days. The RHA is a highly reactive SCM
because of its extremely high specific surface area. Hence, it readily reacts with the Ca(OH)2
liberated from cement hydration to produce additional CSH gel (secondary hydration
product), and thus increases the strength from the early age of concrete (Mehta 1992).
The average compressive strength must exceed the specified strength by a sufficient
amount so that the probability of getting low strength is small. The average compressive
strength of SCHPC can be determined from the specified strength using Equation 11.1 when
the proportions are selected based on the laboratory trial batches (ACI 211.4R-93, 2004).
90.06.9/
/ += c
crf
f (Equation 11.1)
where:
f /cr = Average compressive strength of concrete (MPa)
f /c = Specified design compressive strength of concrete (MPa)
11.3.6 Durability
The SCHPC must possess high durability for long service life. The durability is correlated
with the porosity, transport properties and electrical resistivity of concrete. A good durability
can be achieved by decreasing the porosity and transport properties such as water absorption
and water permeability of concrete. In addition, the durability of SCHPC can be enhanced by
increasing its electrical resistivity. The total porosity and water absorption should be less than
15% (Hearn et al. 1994, Nokken and Hooton 2002) and 6% (Vanwalleghem et al. 2003),
respectively, and the true electrical resistivity must be greater than 5 kΩ-cm (Hearn 1996) to
improve the durability of concrete. The ultrasonic pulse velocity and compressive strength
can also be used as a predictor of durability because both of these properties are directly
276
related to concrete quality. An ultrasonic pulse velocity higher than 4575 m/s (Shetty 2001)
and a compressive strength greater than 40 MPa (Kosmatka 2002) suggest a low porosity,
which contributes to improve the durability of concrete. A low W/B ratio, an optimum S/A
ratio, and the presence of a pozzolanic SCM are the key factors to reduce the total porosity
and transport properties, and to increase the electrical resistivity, ultrasonic pulse velocity
and compressive strength of concrete, thus contributing to enhance concrete durability.
11.3.7 Air content
The air content of SCHPC requiring high freeze-thaw resistance should normally be at least
4.5% (Uomoto and Ozawa 1999). The CSA recommends an air content in the range of 4 to
9% for the aggregate sizes most commonly used in SCHPC (CSA A23.1, 2004). However, an
air content of 6% generally corresponds to a spacing factor lower than 230 μm, which is
required for good freeze-thaw durability (Lessard et al. 1995). Therefore, an air content of
6±1.5% can be chosen for air-entrained SCHPC.
11.4 Principles of Mixture Design
The optimum S/A ratio improves the physical packing in aggregate skeleton of concrete, and
thus reduces the void content. Consequently, less paste is required to obtain a good flowing
ability in concrete.
The paste volume must be greater than the void content of aggregate blend to coat and
lubricate the aggregates by a layer of excess paste. The excess paste reduces the friction
between aggregates and thus enhances the flowing ability of concrete.
The low coarse aggregate content increases the mortar volume as well as the inter-
particle distance between aggregates. It reduces the interlocking and bridging of aggregates
during concrete flow and thus increases the flowing ability and segregation resistance of
concrete.
The increased cementing material at low W/B ratio and adequate HRWR dosage can
provide optimum flowing ability and segregation resistance, and thus helps to maintain self-
consolidation capacity of concrete.
The optimum flowing ability and segregation resistance can be achieved by adjusting
the fluidity and viscosity of concrete through a proper combination of cement and SCM,
277
limiting the W/B ratio and adding a suitable dosage of HRWR, and optionally adding an
adequate dosage of VEA.
The high compressive strength and ultrasonic pulse velocity, low porosity and
transport properties, and high electrical resistivity suggesting a good durability are achieved
by the compacted aggregates with maximum density and minimum void content at optimum
S/A ratio, and by binding them with a paste of low W/B ratio.
11.5 Materials Selection
The constituent materials should satisfy the quality requirements to attain the desired fresh
and hardened properties and durability of SCHPC. They should not contain any harmful
ingredients in significant quantities that may be detrimental to the properties and durability of
concrete.
Coarse aggregate:
The coarse aggregates conforming to ASTM C 33 (2004) can be used to produce SCHPC.
The type, shape and size, surface texture, porosity, absorption, gradation, fines content, and
reactivity of coarse aggregates should be taken into account to maintain the quality of
concrete. Usually, the normal-weight coarse aggregates are used in SCHPC. Round or
crushed coarse aggregates or a blend of both can be used. Whatever the type of coarse
aggregate chosen, it should be well-graded (1 ≤ gradation coefficient ≤ 3) to enhance the
flowing ability, segregation resistance and particle packing of concrete. In addition, the low
maximum size (≤ 25 mm) should be selected to improve flowing ability, segregation
resistance, and strength. The production of SCHPC with good flowing ability and adequately
high segregation resistance becomes difficult for the coarse aggregates larger than 25 mm
(ASTM C 1611/C 1611M, 2007). The larger size also reduces the strength of concrete. The
recommended maximum aggregate size for SCHPC is 9.5-19 mm (EFNARC 2002; ACI
Committee 211H, 2006).
Fine aggregate:
The fine aggregates conforming to ASTM C 33 (2004) can be selected for use in SCHPC.
The particle shape, surface texture, surface area, void content, absorption, gradation, and
278
soundness should be considered while selecting the fine aggregate. The crushed and rounded
fine aggregates or their blend can be used in SCHPC. The rounded fine aggregate is
conducive to the flowing ability whereas the crushed fine aggregate is beneficial to increase
the strength of concrete. Nevertheless, the fine aggregate selected for SCHPC should be well-
graded to improve the flowing ability and strength of concrete. Fine aggregate with a
fineness modulus in the range of 2.5 to 3.2 is preferable to obtain high strength (ACI 211.4R-
93, 2004). Well-graded fine aggregate also reduces the void content in aggregate blend and
thus improves the physical packing of concrete (Tasi et al. 2006).
Cement:
The cements conforming to ASTM C150 (2004) or ASTM C 1157 (2004) can be used for the
production of SCHPC. The proper choice of cement type is dictated by the specific
requirements of the desired application.
Rice husk ash:
The non-crystalline amorphous RHA can be used in SCHPC as a pozzolanic SCM. It
enhances the grain size distribution and particle packing to improve the cohesiveness of
concrete. The RHA increases the viscosity, which is conducive to improve the segregation
resistance of concrete. However, it reduces the matrix density, which can decrease the
segregation resistance of concrete, particularly at static condition. Also, the RHA increases
the paste volume, which enhances the flowing ability of concrete.
In hardened concrete, the RHA can increase the compressive strength by up to 40% or
more as observed from the present study. Hence, the use of RHA allows to increase the
strength of concrete without further reduction in W/B ratio, or to adopt a higher W/B ratio for
the same strength. In addition, the RHA provides significant improvement in concrete
properties that govern durability.
The physical and chemical properties of RHA should be suitable to produce SCHPC.
The median particle size of RHA must be significantly lower than that of cement for good
microfilling ability. The pozzolanic activity index of RHA must be > 85% for good strength
gain through pozzolanic reaction. In addition, the specific surface area (surface fineness)
must be > 15 m2/g to achieve a good pozzolanic activity. A higher surface fineness also
279
decreases bleeding, and increases the cohesiveness of concrete. The silica content of RHA
must be ≥ 85% to possess a good pozzolanic activity. Moreover, the igneous loss of RHA
should be ≤ 6% to ensure that excessive carbonation did not occur due to the exposure to the
atmosphere during prolonged storage.
Mixing water:
The water conforming to ASTM C 94/C 94 M (2004) or CSA A23.1 (2004) can be used to
produce SCHPC. In general, the normal tap water is suitable to prepare any concrete. In case
of the recycled water recovered from the processes of concrete industry, it must be examined
for the acceptance criteria before use in SCHPC to avoid any adverse effect on the quality of
concrete.
High-range water reducer:
The use of HRWR is essential for SCHPC to achieve the required flowing ability. The
HRWR conforming to ASTM C494/C 494M (2004) or ASTM C 1017/C 1017M (2004) can
be used. There are many commercially available HRWRs that can be selected. However, the
polycarboxylate-based HRWR is mostly used to produce SCHPC due to its better ability to
retain the fluidity of concrete mixture.
Air-entraining admixture:
The AEA conforming to ASTM C 494/C 494M (2004) or ASTM C 260 (2004) can be used
to produce the air-entrained SCHPC. The addition of AEA can be accomplished in the same
way as in non-self-consolidating concretes.
Viscosity-enhancing admixture:
The use of VEA in SCHPC is not always necessary. However, it can be used to improve the
homogeneity and stability of concrete with increased segregation resistance, and to reduce
the sensitivity of the mixture due to variations in the proportions and conditions of other
constituent materials. In particular, the VEA can be advantageous for the SCHPC containing
gap-graded, angular, flat and elongated coarse aggregates and a lower content of cementing
material (ACI Committee 211H, 2006).
280
11.6 Requirements for Mixture Composition
The fine and coarse aggregate contents, S/A ratio, binder content, W/B ratio, water content,
paste or mortar volume, and the dosages of chemical admixtures such as HRWR, AEA and
VEA play the key roles to form a proper mixture composition of SCHPC.
Coarse aggregate content:
The coarse aggregate content influences the flowing ability, segregation resistance and
strength of SCHPC (Nagataki and Fujiwara 1995, Okamura and Ozawa 1995). The coarse
aggregate content of SCHPC should be in the range of 28 to 35% of concrete volume
(EFNARC 2002, Uomoto and Ozawa 1999). Also, it is suggested that the coarse aggregate
content should be about 50% of the dry packed unit weight of aggregate blend (Su et al.
2001). The content of coarse aggregate depends on its maximum size and particle shape as
well as on the type of application (ACI Committee 211H, 2006). A higher content can be
used if a rounded coarse aggregate of lower maximum size (< 25 mm) is chosen, and when
the passing ability is not a concern.
Fine aggregate content:
The fine aggregate content influences the flowing ability of SCHPC (Okamura and Ozawa
1995). Also, the fine aggregate content affects cohesion, and thus the segregation resistance
of concrete (Shilstone, Sr. and Shilstone, Jr. 1993). The fine aggregate content should be in
the range of 48 to 55% of total aggregates by weight (SCCEPG 2005) or 40 to 50% of mortar
volume (EFNARC 2002, Okamura and Ozawa 1995) to produce good flowing ability in
SCHPC.
Optimum S/A ratio:
The optimum S/A ratio should be used to decrease the porosity and transport properties, and
thus to improve the strength and durability of concrete. However, it should also be conducive
to the flowing ability and segregation resistance of SCHPC. The optimum S/A ratio (by
weight) usually varies in the range of 0.40 to 0.55 depending on the type and size of fine and
coarse aggregates (Domone and Soutsos 1994, Koehler and Fowler 2006, Schrader 1976).
281
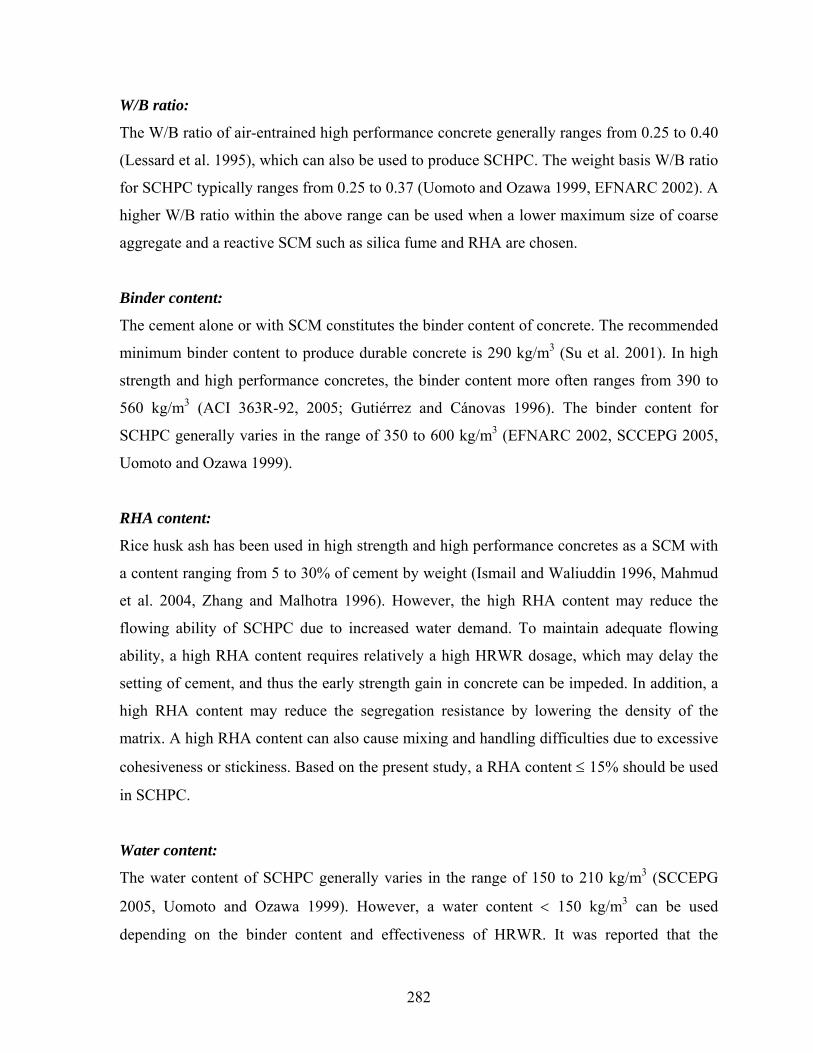
W/B ratio:
The W/B ratio of air-entrained high performance concrete generally ranges from 0.25 to 0.40
(Lessard et al. 1995), which can also be used to produce SCHPC. The weight basis W/B ratio
for SCHPC typically ranges from 0.25 to 0.37 (Uomoto and Ozawa 1999, EFNARC 2002). A
higher W/B ratio within the above range can be used when a lower maximum size of coarse
aggregate and a reactive SCM such as silica fume and RHA are chosen.
Binder content:
The cement alone or with SCM constitutes the binder content of concrete. The recommended
minimum binder content to produce durable concrete is 290 kg/m3 (Su et al. 2001). In high
strength and high performance concretes, the binder content more often ranges from 390 to
560 kg/m3 (ACI 363R-92, 2005; Gutiérrez and Cánovas 1996). The binder content for
SCHPC generally varies in the range of 350 to 600 kg/m3 (EFNARC 2002, SCCEPG 2005,
Uomoto and Ozawa 1999).
RHA content:
Rice husk ash has been used in high strength and high performance concretes as a SCM with
a content ranging from 5 to 30% of cement by weight (Ismail and Waliuddin 1996, Mahmud
et al. 2004, Zhang and Malhotra 1996). However, the high RHA content may reduce the
flowing ability of SCHPC due to increased water demand. To maintain adequate flowing
ability, a high RHA content requires relatively a high HRWR dosage, which may delay the
setting of cement, and thus the early strength gain in concrete can be impeded. In addition, a
high RHA content may reduce the segregation resistance by lowering the density of the
matrix. A high RHA content can also cause mixing and handling difficulties due to excessive
cohesiveness or stickiness. Based on the present study, a RHA content ≤ 15% should be used
in SCHPC.
Water content:
The water content of SCHPC generally varies in the range of 150 to 210 kg/m3 (SCCEPG
2005, Uomoto and Ozawa 1999). However, a water content < 150 kg/m3 can be used
depending on the binder content and effectiveness of HRWR. It was reported that the
282
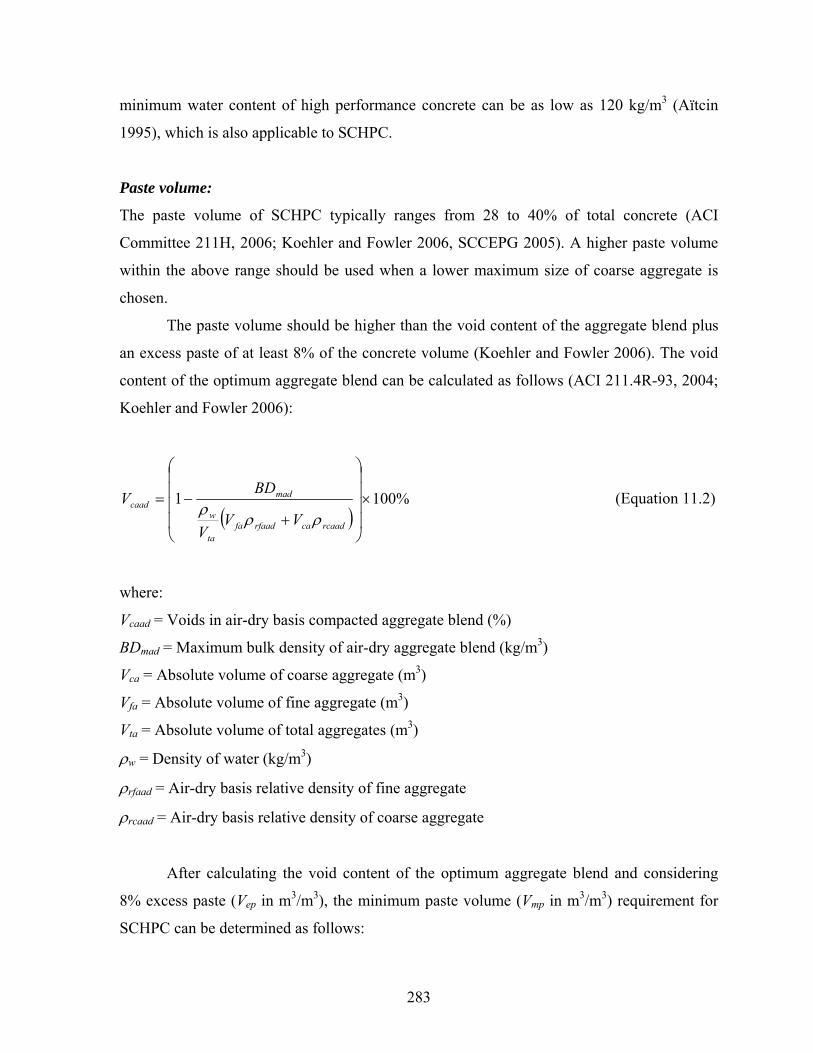
minimum water content of high performance concrete can be as low as 120 kg/m3 (Aïtcin
1995), which is also applicable to SCHPC.
Paste volume:
The paste volume of SCHPC typically ranges from 28 to 40% of total concrete (ACI
Committee 211H, 2006; Koehler and Fowler 2006, SCCEPG 2005). A higher paste volume
within the above range should be used when a lower maximum size of coarse aggregate is
chosen.
The paste volume should be higher than the void content of the aggregate blend plus
an excess paste of at least 8% of the concrete volume (Koehler and Fowler 2006). The void
content of the optimum aggregate blend can be calculated as follows (ACI 211.4R-93, 2004;
Koehler and Fowler 2006):
( )%1001 ×
⎟⎟⎟⎟
⎠
⎞
⎜⎜⎜⎜
⎝
⎛
+−=
rcaadcarfaadfata
w
madcaad
VVV
BDV
ρρρ
(Equation 11.2)
where:
Vcaad = Voids in air-dry basis compacted aggregate blend (%)
BDmad = Maximum bulk density of air-dry aggregate blend (kg/m3)
Vca = Absolute volume of coarse aggregate (m3)
Vfa = Absolute volume of fine aggregate (m3)
Vta = Absolute volume of total aggregates (m3)
ρw = Density of water (kg/m3)
ρrfaad = Air-dry basis relative density of fine aggregate
ρrcaad = Air-dry basis relative density of coarse aggregate
After calculating the void content of the optimum aggregate blend and considering
8% excess paste (Vep in m3/m3), the minimum paste volume (Vmp in m3/m3) requirement for
SCHPC can be determined as follows:
283

( ) ⎥⎦
⎤⎢⎣
⎡⎟⎠⎞
⎜⎝⎛ −
−−=100
10011 caad
epmpV
VV (Equation 11.3)
The paste volume of SCHPC must be ≥ Vmp to maintain good flowing ability and
adequate segregation resistance.
Mortar volume:
The mortar content of SCHPC is relatively high due to reduced coarse aggregate content. The
mortar volume of SCHPC should be in the range of 65 to 72% of concrete volume since the
recommended coarse aggregate volume content varies from 28 to 35% (ACI Committee
211H, 2006; Uomoto and Ozawa 1999).
HRWR dosage:
The HRWR dosage greatly depends upon the surface characteristics of cement and SCM
such as particle size and specific surface area. The dosage is also affected by the type of
HRWR and its compatibility with cement. A very high dosage of HRWR might cause
segregation and bleeding in concrete. Therefore, the HRWR dosage should be kept as low as
possible. The maximum HRWR dosage for SCHPC can be in the range of 3 to 5% of binder
by weight depending on the type of admixture (Kwan 2000).
AEA dosage:
A higher dosage of AEA is generally required for SCHPC to maintain a specified total air
content due to the presence of SCM, HRWR and VEA (Khayat 2000, Siebel 1989).
However, very high dosage of AEA is not beneficial for the strength and freeze-thaw
durability of concrete. In general, the AEA dosage should not exceed 1 to 2% of binder by
weight (Nawy 1996).
VEA dosage:
The VEA is recommended to be used in SCHPC when the fresh mixture is too fluid and
exhibits an instability (segregation) problem. The dosage of VEA may vary in the range of
0.15 to 0.95% of binder by weight (MBT, 2002).
284
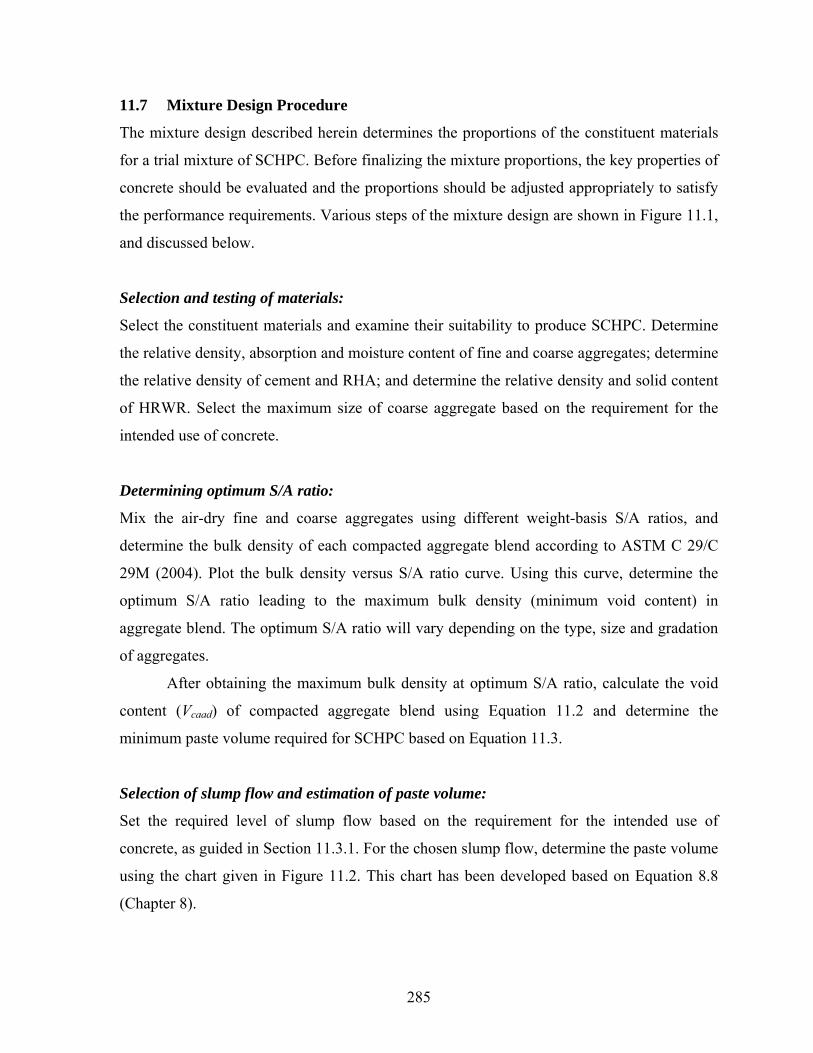
11.7 Mixture Design Procedure
The mixture design described herein determines the proportions of the constituent materials
for a trial mixture of SCHPC. Before finalizing the mixture proportions, the key properties of
concrete should be evaluated and the proportions should be adjusted appropriately to satisfy
the performance requirements. Various steps of the mixture design are shown in Figure 11.1,
and discussed below.
Selection and testing of materials:
Select the constituent materials and examine their suitability to produce SCHPC. Determine
the relative density, absorption and moisture content of fine and coarse aggregates; determine
the relative density of cement and RHA; and determine the relative density and solid content
of HRWR. Select the maximum size of coarse aggregate based on the requirement for the
intended use of concrete.
Determining optimum S/A ratio:
Mix the air-dry fine and coarse aggregates using different weight-basis S/A ratios, and
determine the bulk density of each compacted aggregate blend according to ASTM C 29/C
29M (2004). Plot the bulk density versus S/A ratio curve. Using this curve, determine the
optimum S/A ratio leading to the maximum bulk density (minimum void content) in
aggregate blend. The optimum S/A ratio will vary depending on the type, size and gradation
of aggregates.
After obtaining the maximum bulk density at optimum S/A ratio, calculate the void
content (Vcaad) of compacted aggregate blend using Equation 11.2 and determine the
minimum paste volume required for SCHPC based on Equation 11.3.
Selection of slump flow and estimation of paste volume:
Set the required level of slump flow based on the requirement for the intended use of
concrete, as guided in Section 11.3.1. For the chosen slump flow, determine the paste volume
using the chart given in Figure 11.2. This chart has been developed based on Equation 8.8
(Chapter 8).
285
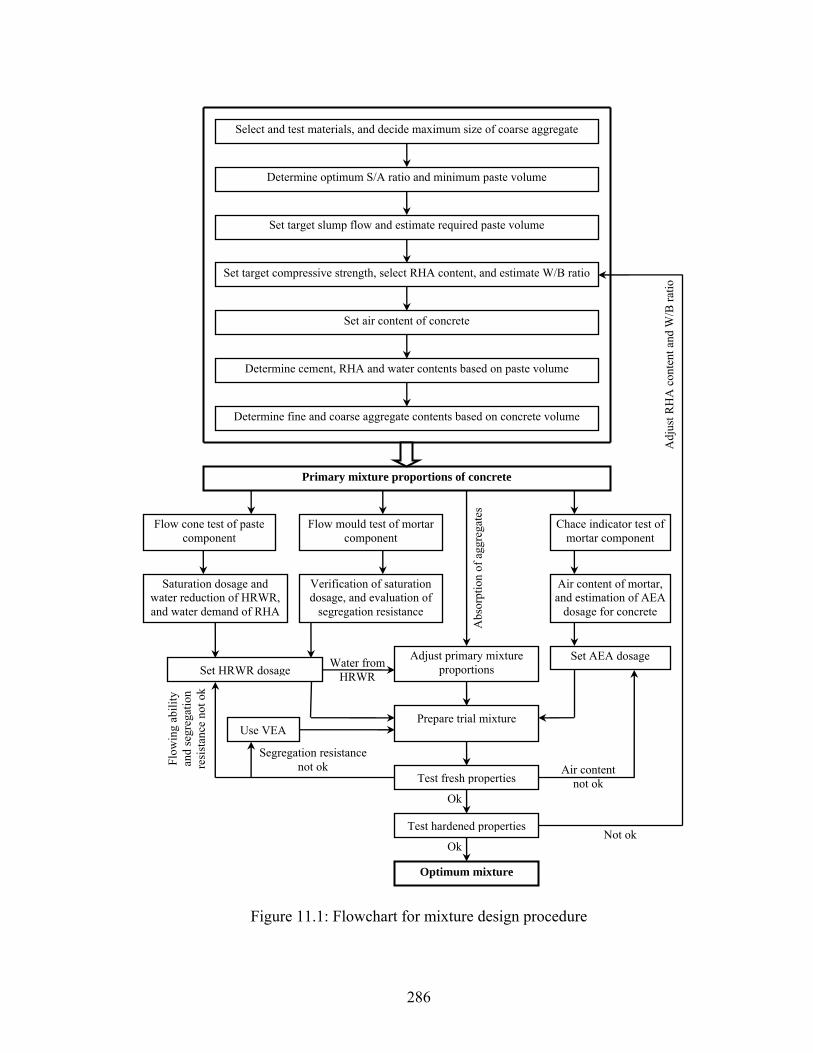
Set target slump flow and estimate required paste volume
Select and test materials, and decide maximum size of coarse aggregate
Set target compressive strength, select RHA content, and estimate W/B ratio
Determine optimum S/A ratio and minimum paste volume
Prepare trial mixture
Flow cone test of paste component
Flow mould test of mortar component
Determine fine and coarse aggregate contents based on concrete volume
Primary mixture proportions of concrete
Saturation dosage and water reduction of HRWR, and water demand of RHA
Verification of saturation dosage, and evaluation of
segregation resistance
Determine cement, RHA and water contents based on paste volume
Set HRWR dosage
Test fresh properties
Test hardened properties
Use VEA
Optimum mixture
Set air content of concrete
Air content of mortar, and estimation of AEA
dosage for concrete
Chace indicator test of mortar component
Set AEA dosage Adjust primary mixture proportions Water from
HRWR
Abs
orpt
ion
of a
ggre
gate
s
Segregation resistance not ok Flow
ing
abili
ty
and
segr
egat
ion
resi
stan
ce n
ot o
k
Ok
Ok
Not ok
Air content not ok
Adj
ust R
HA
con
tent
and
W/B
ratio
Figure 11.1: Flowchart for mixture design procedure
286
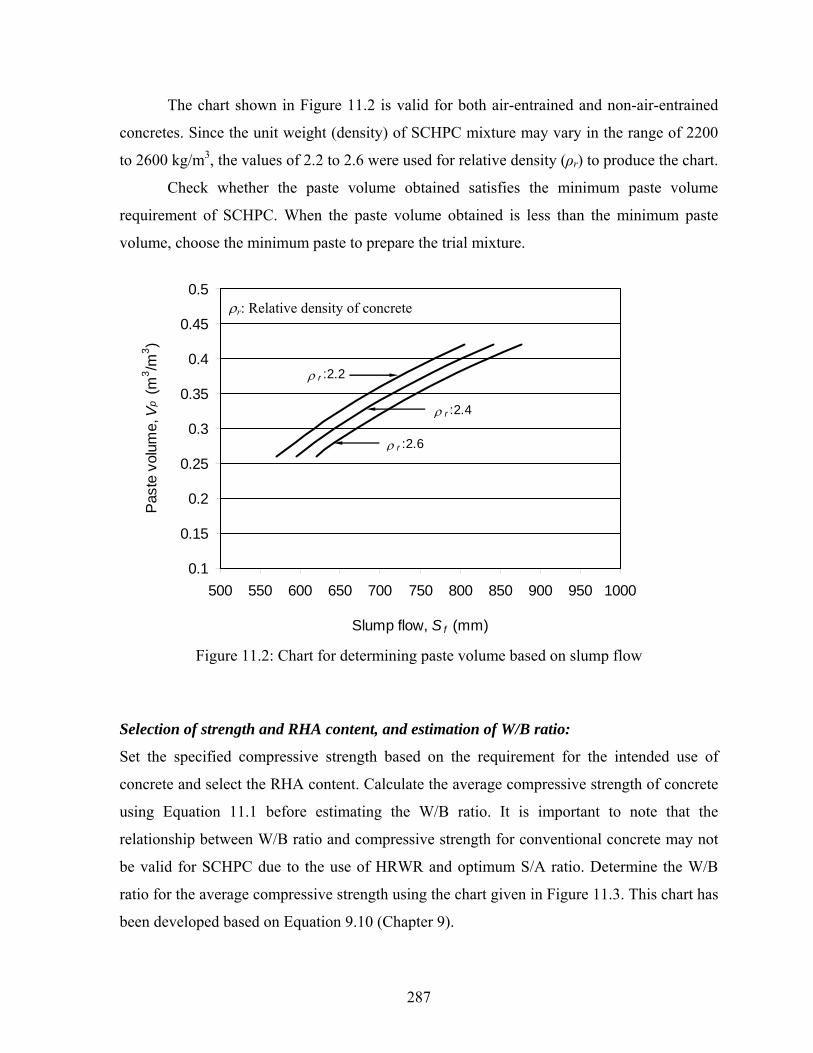
The chart shown in Figure 11.2 is valid for both air-entrained and non-air-entrained
concretes. Since the unit weight (density) of SCHPC mixture may vary in the range of 2200
to 2600 kg/m3, the values of 2.2 to 2.6 were used for relative density (ρr) to produce the chart.
Check whether the paste volume obtained satisfies the minimum paste volume
requirement of SCHPC. When the paste volume obtained is less than the minimum paste
volume, choose the minimum paste to prepare the trial mixture.
0.1
0.15
0.2
0.25
0.3
0.35
0.4
0.45
0.5
500 550 600 650 700 750 800 850 900 950 1000
Slump flow, S f (mm)
Pas
te v
olum
e, V
p (m
3 /m3 )
ρ r :2.2
ρ r :2.4
ρ r :2.6
ρr: Relative density of concrete
Figure 11.2: Chart for determining paste volume based on slump flow
Selection of strength and RHA content, and estimation of W/B ratio:
Set the specified compressive strength based on the requirement for the intended use of
concrete and select the RHA content. Calculate the average compressive strength of concrete
using Equation 11.1 before estimating the W/B ratio. It is important to note that the
relationship between W/B ratio and compressive strength for conventional concrete may not
be valid for SCHPC due to the use of HRWR and optimum S/A ratio. Determine the W/B
ratio for the average compressive strength using the chart given in Figure 11.3. This chart has
been developed based on Equation 9.10 (Chapter 9).
287
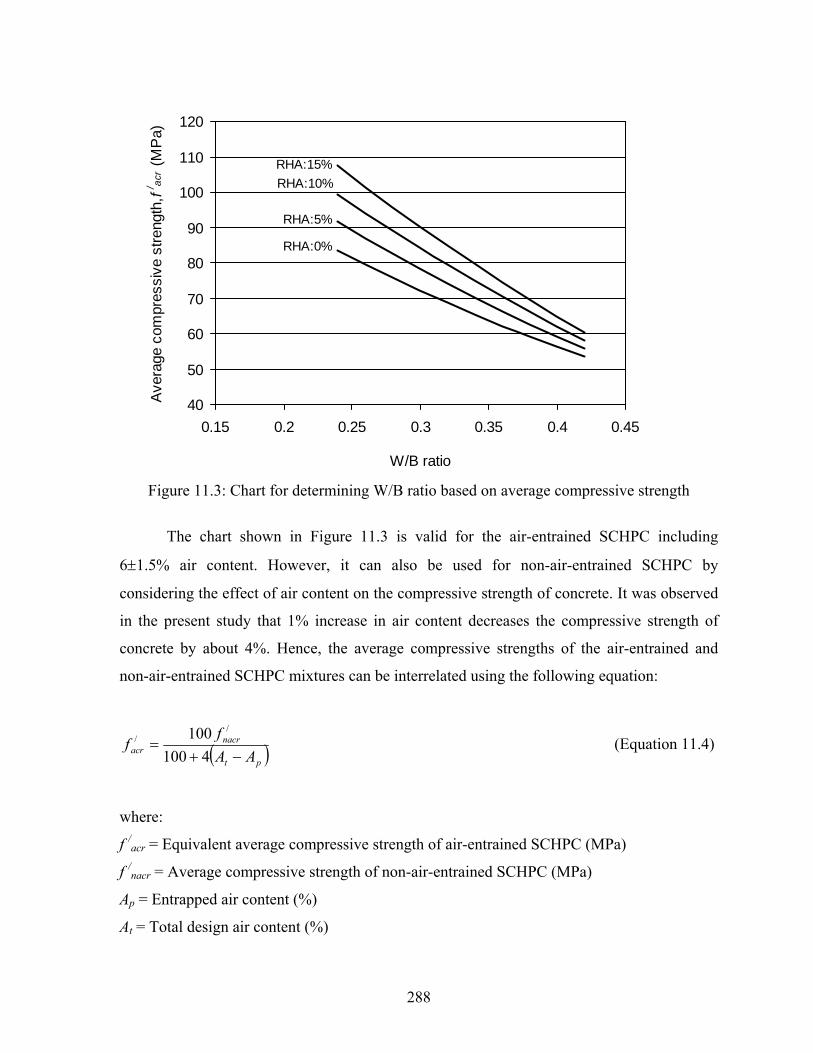
40
50
60
70
80
90
100
110
120
0.15 0.2 0.25 0.3 0.35 0.4 0.45
W/B ratio
Ave
rage
com
pres
sive
stre
ngth
, f / ac
r (M
Pa)
RHA:15%RHA:10%
RHA:5%
RHA:0%
Figure 11.3: Chart for determining W/B ratio based on average compressive strength
The chart shown in Figure 11.3 is valid for the air-entrained SCHPC including
6±1.5% air content. However, it can also be used for non-air-entrained SCHPC by
considering the effect of air content on the compressive strength of concrete. It was observed
in the present study that 1% increase in air content decreases the compressive strength of
concrete by about 4%. Hence, the average compressive strengths of the air-entrained and
non-air-entrained SCHPC mixtures can be interrelated using the following equation:
( )pt
nacracr AA
ff
−+=
4100100 /
/ (Equation 11.4)
where:
f /acr = Equivalent average compressive strength of air-entrained SCHPC (MPa)
f /nacr = Average compressive strength of non-air-entrained SCHPC (MPa)
Ap = Entrapped air content (%)
At = Total design air content (%)
288
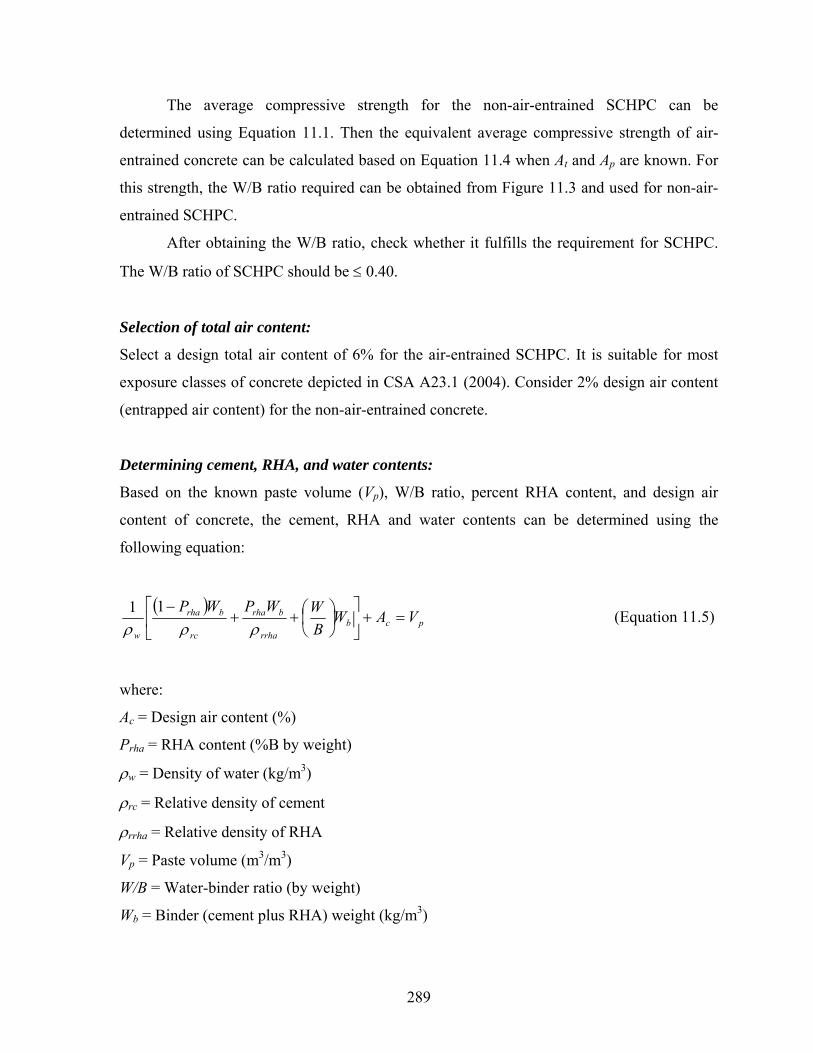
The average compressive strength for the non-air-entrained SCHPC can be
determined using Equation 11.1. Then the equivalent average compressive strength of air-
entrained concrete can be calculated based on Equation 11.4 when At and Ap are known. For
this strength, the W/B ratio required can be obtained from Figure 11.3 and used for non-air-
entrained SCHPC.
After obtaining the W/B ratio, check whether it fulfills the requirement for SCHPC.
The W/B ratio of SCHPC should be ≤ 0.40.
Selection of total air content:
Select a design total air content of 6% for the air-entrained SCHPC. It is suitable for most
exposure classes of concrete depicted in CSA A23.1 (2004). Consider 2% design air content
(entrapped air content) for the non-air-entrained concrete.
Determining cement, RHA, and water contents:
Based on the known paste volume (Vp), W/B ratio, percent RHA content, and design air
content of concrete, the cement, RHA and water contents can be determined using the
following equation:
( )pcb
rrha
brha
rc
brha
w
VAWBWWPWP
=+⎥⎦
⎤⎢⎣
⎡⎟⎠⎞
⎜⎝⎛++
−ρρρ
11 (Equation 11.5)
where:
Ac = Design air content (%)
Prha = RHA content (%B by weight)
ρw = Density of water (kg/m3)
ρrc = Relative density of cement
ρrrha = Relative density of RHA
Vp = Paste volume (m3/m3)
W/B = Water-binder ratio (by weight)
Wb = Binder (cement plus RHA) weight (kg/m3)
289
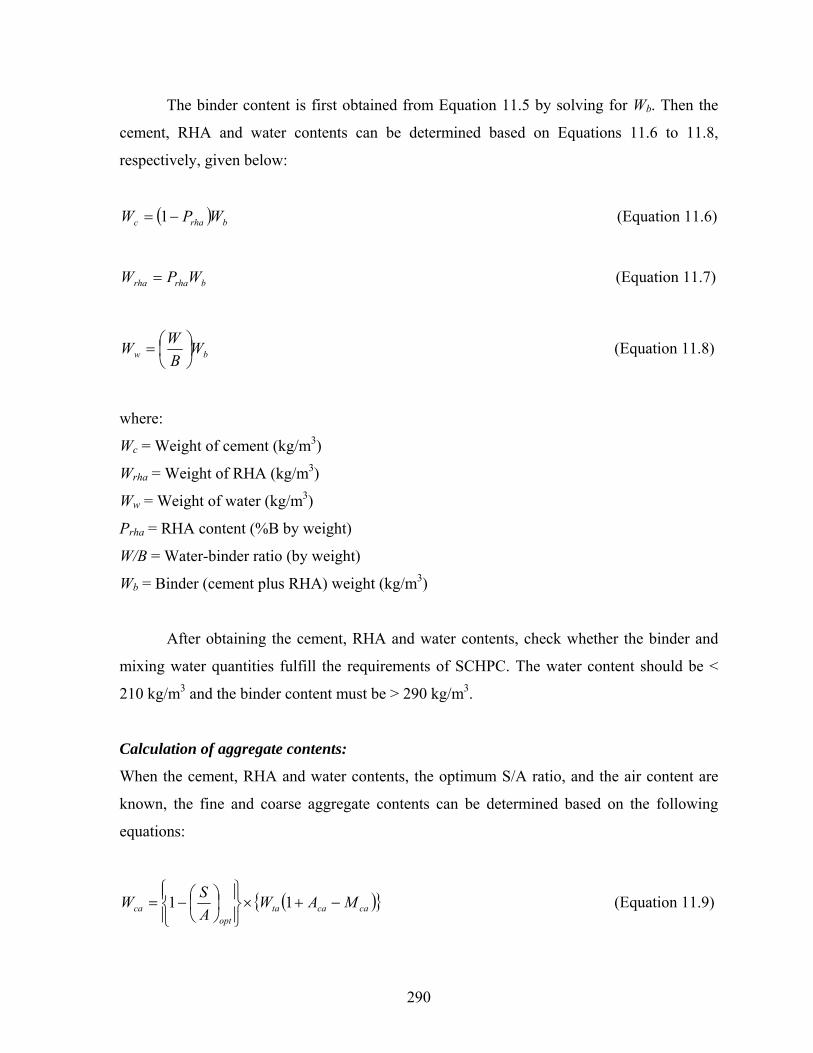
The binder content is first obtained from Equation 11.5 by solving for Wb. Then the
cement, RHA and water contents can be determined based on Equations 11.6 to 11.8,
respectively, given below:
( ) brhac WPW −= 1 (Equation 11.6)
brharha WPW = (Equation 11.7)
bw WBWW ⎟
⎠⎞
⎜⎝⎛= (Equation 11.8)
where:
Wc = Weight of cement (kg/m3)
Wrha = Weight of RHA (kg/m3)
Ww = Weight of water (kg/m3)
Prha = RHA content (%B by weight)
W/B = Water-binder ratio (by weight)
Wb = Binder (cement plus RHA) weight (kg/m3)
After obtaining the cement, RHA and water contents, check whether the binder and
mixing water quantities fulfill the requirements of SCHPC. The water content should be <
210 kg/m3 and the binder content must be > 290 kg/m3.
Calculation of aggregate contents:
When the cement, RHA and water contents, the optimum S/A ratio, and the air content are
known, the fine and coarse aggregate contents can be determined based on the following
equations:
( cacataopt
ca MAWASW −+×
⎪⎭
⎪⎬⎫
⎪⎩
⎪⎨⎧
⎟⎠⎞
⎜⎝⎛−= 11 ) (Equation 11.9)
290
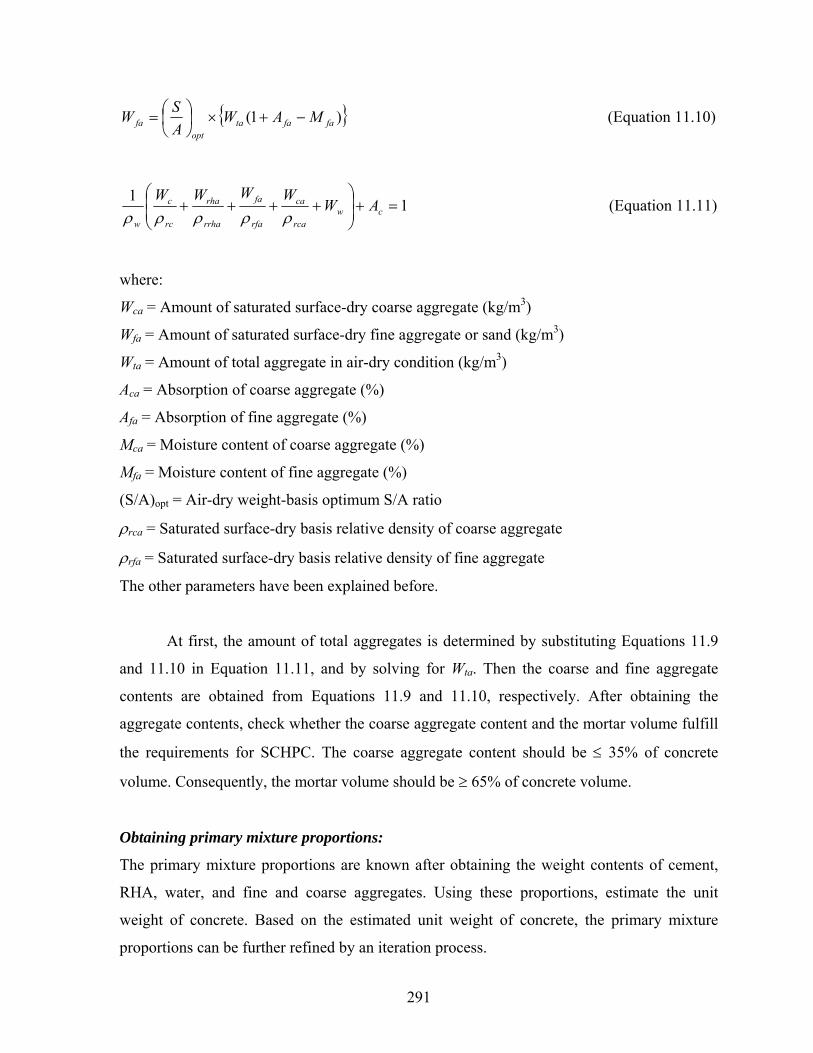
)1( fafataopt
fa MAWASW −+×⎟⎠⎞
⎜⎝⎛= (Equation 11.10)
11=+⎟
⎟⎠
⎞⎜⎜⎝
⎛++++ cw
rca
ca
rfa
fa
rrha
rha
rc
c
w
AWWWWWρρρρρ
(Equation 11.11)
where:
Wca = Amount of saturated surface-dry coarse aggregate (kg/m3)
Wfa = Amount of saturated surface-dry fine aggregate or sand (kg/m3)
Wta = Amount of total aggregate in air-dry condition (kg/m3)
Aca = Absorption of coarse aggregate (%)
Afa = Absorption of fine aggregate (%)
Mca = Moisture content of coarse aggregate (%)
Mfa = Moisture content of fine aggregate (%)
(S/A)opt = Air-dry weight-basis optimum S/A ratio
ρrca = Saturated surface-dry basis relative density of coarse aggregate
ρrfa = Saturated surface-dry basis relative density of fine aggregate
The other parameters have been explained before.
At first, the amount of total aggregates is determined by substituting Equations 11.9
and 11.10 in Equation 11.11, and by solving for Wta. Then the coarse and fine aggregate
contents are obtained from Equations 11.9 and 11.10, respectively. After obtaining the
aggregate contents, check whether the coarse aggregate content and the mortar volume fulfill
the requirements for SCHPC. The coarse aggregate content should be ≤ 35% of concrete
volume. Consequently, the mortar volume should be ≥ 65% of concrete volume.
Obtaining primary mixture proportions:
The primary mixture proportions are known after obtaining the weight contents of cement,
RHA, water, and fine and coarse aggregates. Using these proportions, estimate the unit
weight of concrete. Based on the estimated unit weight of concrete, the primary mixture
proportions can be further refined by an iteration process.
291
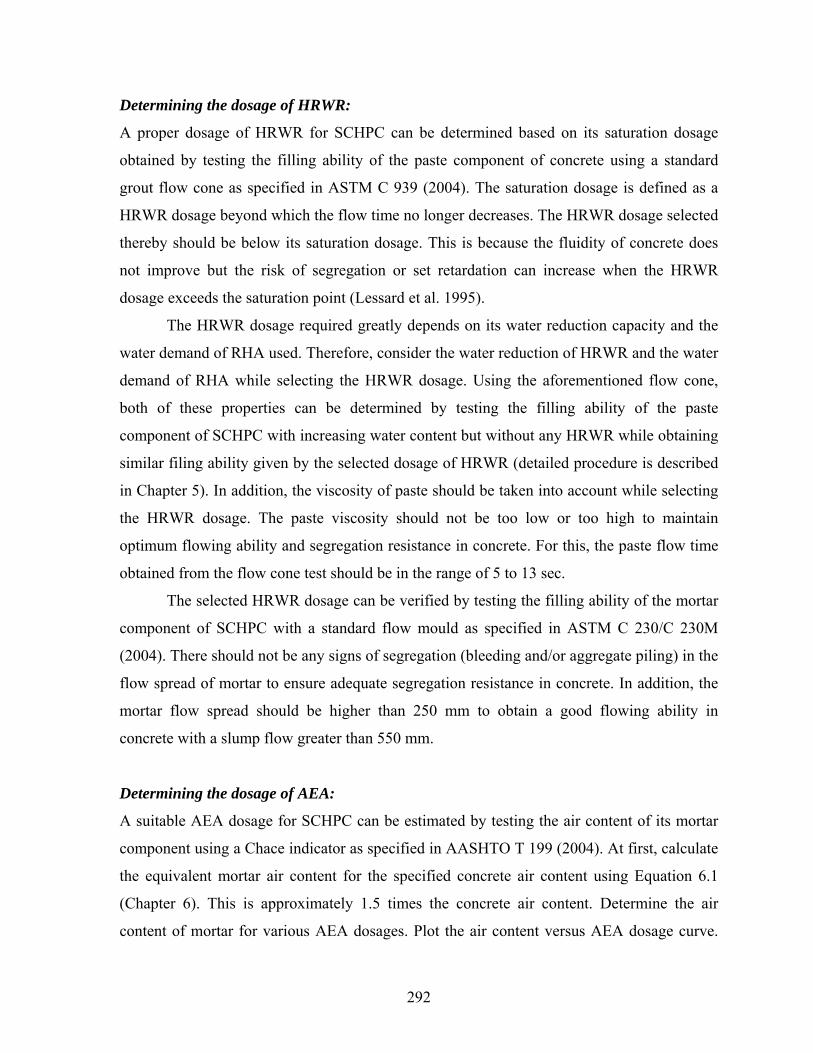
Determining the dosage of HRWR:
A proper dosage of HRWR for SCHPC can be determined based on its saturation dosage
obtained by testing the filling ability of the paste component of concrete using a standard
grout flow cone as specified in ASTM C 939 (2004). The saturation dosage is defined as a
HRWR dosage beyond which the flow time no longer decreases. The HRWR dosage selected
thereby should be below its saturation dosage. This is because the fluidity of concrete does
not improve but the risk of segregation or set retardation can increase when the HRWR
dosage exceeds the saturation point (Lessard et al. 1995).
The HRWR dosage required greatly depends on its water reduction capacity and the
water demand of RHA used. Therefore, consider the water reduction of HRWR and the water
demand of RHA while selecting the HRWR dosage. Using the aforementioned flow cone,
both of these properties can be determined by testing the filling ability of the paste
component of SCHPC with increasing water content but without any HRWR while obtaining
similar filing ability given by the selected dosage of HRWR (detailed procedure is described
in Chapter 5). In addition, the viscosity of paste should be taken into account while selecting
the HRWR dosage. The paste viscosity should not be too low or too high to maintain
optimum flowing ability and segregation resistance in concrete. For this, the paste flow time
obtained from the flow cone test should be in the range of 5 to 13 sec.
The selected HRWR dosage can be verified by testing the filling ability of the mortar
component of SCHPC with a standard flow mould as specified in ASTM C 230/C 230M
(2004). There should not be any signs of segregation (bleeding and/or aggregate piling) in the
flow spread of mortar to ensure adequate segregation resistance in concrete. In addition, the
mortar flow spread should be higher than 250 mm to obtain a good flowing ability in
concrete with a slump flow greater than 550 mm.
Determining the dosage of AEA:
A suitable AEA dosage for SCHPC can be estimated by testing the air content of its mortar
component using a Chace indicator as specified in AASHTO T 199 (2004). At first, calculate
the equivalent mortar air content for the specified concrete air content using Equation 6.1
(Chapter 6). This is approximately 1.5 times the concrete air content. Determine the air
content of mortar for various AEA dosages. Plot the air content versus AEA dosage curve.
292

Using this curve, determine the AEA dosage for the equivalent air content of mortar. Now
estimate the AEA dosage for the concrete using Equation 6.2 (Chapter 6). The AEA dosage
obtained thereby is applicable for the concrete without any VEA. It needs to be adjusted
when a VEA is used in concrete.
Determining the dosage of VEA:
Use a VEA when the stability (segregation resistance) of concrete mixture needs to be
improved without changing the primary proportions of concrete. Determine the VEA dosage
based on the manufacture’s recommended dosage.
Adjusting primary mixture proportions:
The primary proportions of fine and coarse aggregates are obtained in saturated surface-dry
condition. If the air-dry fine and coarse aggregates are selected, the aggregate proportions
should be corrected considering their absorption and moisture content. Adjust the primary
proportions of fine and coarse aggregate using the following equations:
caca
cacaad MA
WW
−+=
1 (Equation 11.12)
fafa
fafaad MA
WW
−+=
1 (Equation 11.13)
where:
Wcaad = Adjusted air-dry weight of coarse aggregate (kg/m3)
Wfaad = Adjusted air-dry weight of fine aggregate (kg/m3)
Aca = Absorption of coarse aggregate (%)
Afa = Absorption of fine aggregate (%)
Mca = Moisture content of coarse aggregate (%)
Mfa = Moisture content of fine aggregate (%)
Wca = Amount of saturated surface-dry coarse aggregate (kg/m3)
Wfa = Amount of saturated surface-dry fine aggregate or sand (kg/m3)
293
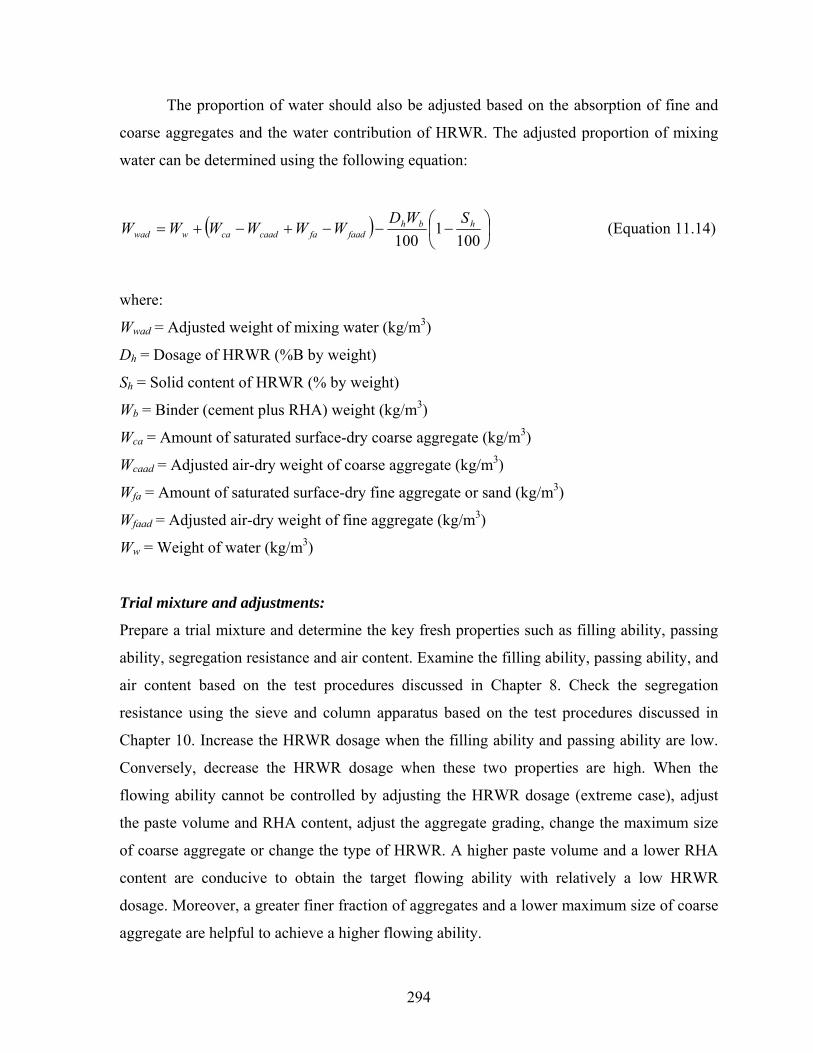
The proportion of water should also be adjusted based on the absorption of fine and
coarse aggregates and the water contribution of HRWR. The adjusted proportion of mixing
water can be determined using the following equation:
( ) ⎟⎠⎞
⎜⎝⎛ −−−+−+=
1001
100hbh
faadfacaadcawwadSWD
WWWWWW (Equation 11.14)
where:
Wwad = Adjusted weight of mixing water (kg/m3)
Dh = Dosage of HRWR (%B by weight)
Sh = Solid content of HRWR (% by weight)
Wb = Binder (cement plus RHA) weight (kg/m3)
Wca = Amount of saturated surface-dry coarse aggregate (kg/m3)
Wcaad = Adjusted air-dry weight of coarse aggregate (kg/m3)
Wfa = Amount of saturated surface-dry fine aggregate or sand (kg/m3)
Wfaad = Adjusted air-dry weight of fine aggregate (kg/m3)
Ww = Weight of water (kg/m3)
Trial mixture and adjustments:
Prepare a trial mixture and determine the key fresh properties such as filling ability, passing
ability, segregation resistance and air content. Examine the filling ability, passing ability, and
air content based on the test procedures discussed in Chapter 8. Check the segregation
resistance using the sieve and column apparatus based on the test procedures discussed in
Chapter 10. Increase the HRWR dosage when the filling ability and passing ability are low.
Conversely, decrease the HRWR dosage when these two properties are high. When the
flowing ability cannot be controlled by adjusting the HRWR dosage (extreme case), adjust
the paste volume and RHA content, adjust the aggregate grading, change the maximum size
of coarse aggregate or change the type of HRWR. A higher paste volume and a lower RHA
content are conducive to obtain the target flowing ability with relatively a low HRWR
dosage. Moreover, a greater finer fraction of aggregates and a lower maximum size of coarse
aggregate are helpful to achieve a higher flowing ability.
294
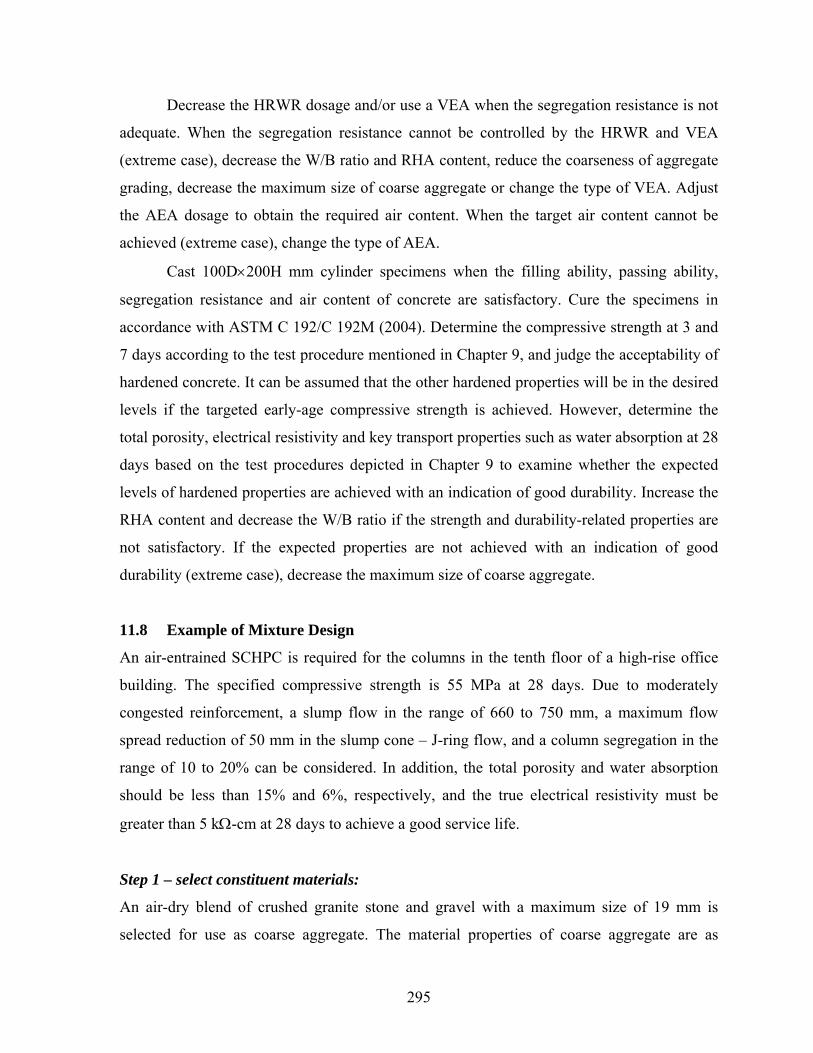
Decrease the HRWR dosage and/or use a VEA when the segregation resistance is not
adequate. When the segregation resistance cannot be controlled by the HRWR and VEA
(extreme case), decrease the W/B ratio and RHA content, reduce the coarseness of aggregate
grading, decrease the maximum size of coarse aggregate or change the type of VEA. Adjust
the AEA dosage to obtain the required air content. When the target air content cannot be
achieved (extreme case), change the type of AEA.
Cast 100D×200H mm cylinder specimens when the filling ability, passing ability,
segregation resistance and air content of concrete are satisfactory. Cure the specimens in
accordance with ASTM C 192/C 192M (2004). Determine the compressive strength at 3 and
7 days according to the test procedure mentioned in Chapter 9, and judge the acceptability of
hardened concrete. It can be assumed that the other hardened properties will be in the desired
levels if the targeted early-age compressive strength is achieved. However, determine the
total porosity, electrical resistivity and key transport properties such as water absorption at 28
days based on the test procedures depicted in Chapter 9 to examine whether the expected
levels of hardened properties are achieved with an indication of good durability. Increase the
RHA content and decrease the W/B ratio if the strength and durability-related properties are
not satisfactory. If the expected properties are not achieved with an indication of good
durability (extreme case), decrease the maximum size of coarse aggregate.
11.8 Example of Mixture Design
An air-entrained SCHPC is required for the columns in the tenth floor of a high-rise office
building. The specified compressive strength is 55 MPa at 28 days. Due to moderately
congested reinforcement, a slump flow in the range of 660 to 750 mm, a maximum flow
spread reduction of 50 mm in the slump cone – J-ring flow, and a column segregation in the
range of 10 to 20% can be considered. In addition, the total porosity and water absorption
should be less than 15% and 6%, respectively, and the true electrical resistivity must be
greater than 5 kΩ-cm at 28 days to achieve a good service life.
Step 1 – select constituent materials:
An air-dry blend of crushed granite stone and gravel with a maximum size of 19 mm is
selected for use as coarse aggregate. The material properties of coarse aggregate are as
295
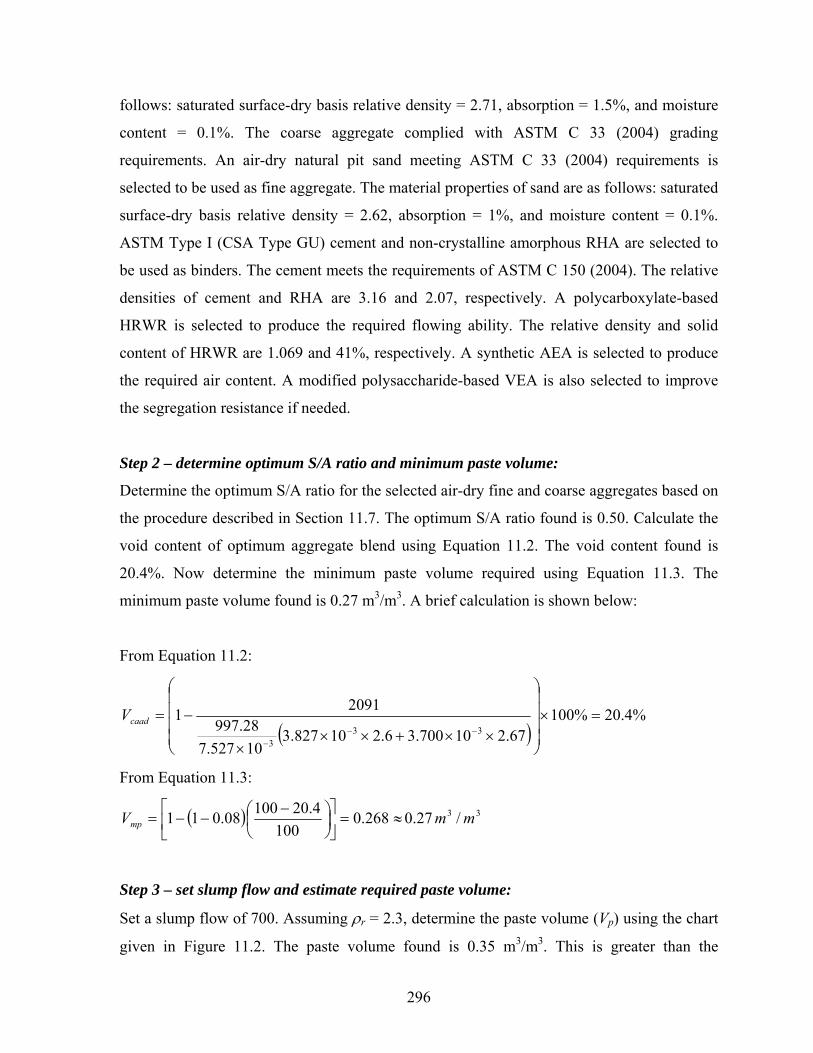
follows: saturated surface-dry basis relative density = 2.71, absorption = 1.5%, and moisture
content = 0.1%. The coarse aggregate complied with ASTM C 33 (2004) grading
requirements. An air-dry natural pit sand meeting ASTM C 33 (2004) requirements is
selected to be used as fine aggregate. The material properties of sand are as follows: saturated
surface-dry basis relative density = 2.62, absorption = 1%, and moisture content = 0.1%.
ASTM Type I (CSA Type GU) cement and non-crystalline amorphous RHA are selected to
be used as binders. The cement meets the requirements of ASTM C 150 (2004). The relative
densities of cement and RHA are 3.16 and 2.07, respectively. A polycarboxylate-based
HRWR is selected to produce the required flowing ability. The relative density and solid
content of HRWR are 1.069 and 41%, respectively. A synthetic AEA is selected to produce
the required air content. A modified polysaccharide-based VEA is also selected to improve
the segregation resistance if needed.
Step 2 – determine optimum S/A ratio and minimum paste volume:
Determine the optimum S/A ratio for the selected air-dry fine and coarse aggregates based on
the procedure described in Section 11.7. The optimum S/A ratio found is 0.50. Calculate the
void content of optimum aggregate blend using Equation 11.2. The void content found is
20.4%. Now determine the minimum paste volume required using Equation 11.3. The
minimum paste volume found is 0.27 m3/m3. A brief calculation is shown below:
From Equation 11.2:
( )%4.20%100
67.210700.36.210827.310527.728.997
2091133
3
=×⎟⎟⎟⎟
⎠
⎞
⎜⎜⎜⎜
⎝
⎛
××+×××
−=−−
−
caadV
From Equation 11.3:
( ) 33 /27.0268.0100
4.2010008.011 mmVmp ≈=⎥⎦
⎤⎢⎣
⎡⎟⎠⎞
⎜⎝⎛ −
−−=
Step 3 – set slump flow and estimate required paste volume:
Set a slump flow of 700. Assuming ρr = 2.3, determine the paste volume (Vp) using the chart
given in Figure 11.2. The paste volume found is 0.35 m3/m3. This is greater than the
296
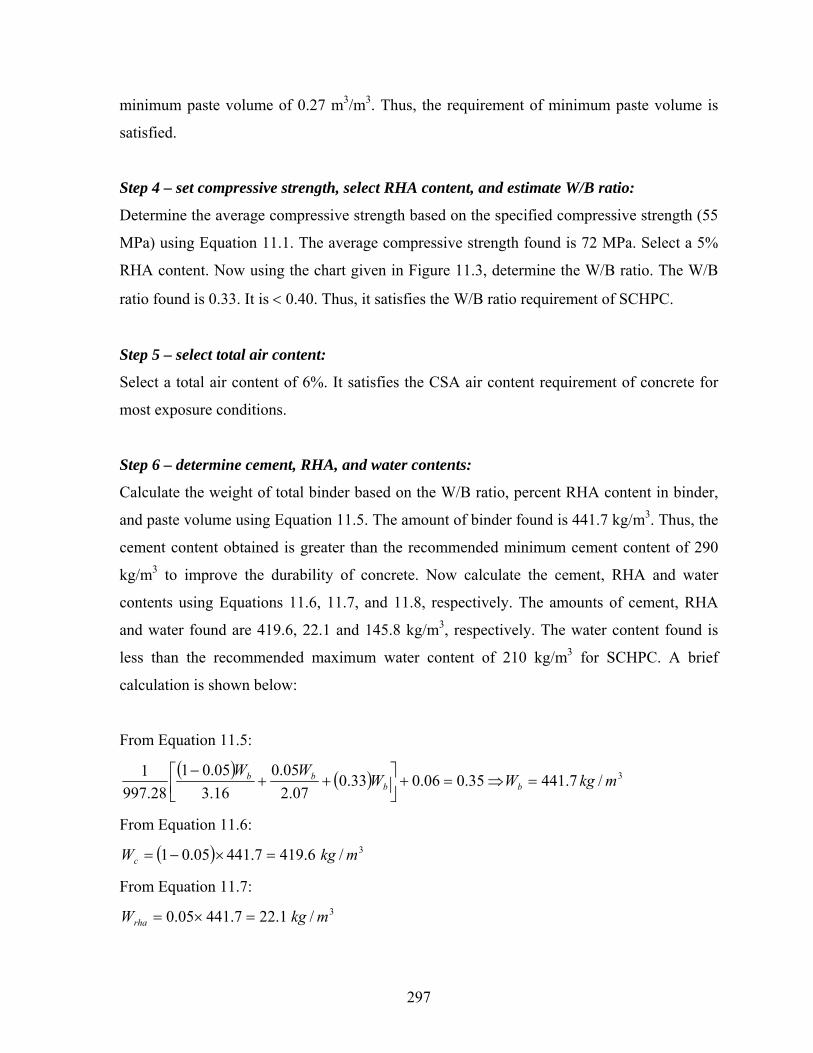
minimum paste volume of 0.27 m3/m3. Thus, the requirement of minimum paste volume is
satisfied.
Step 4 – set compressive strength, select RHA content, and estimate W/B ratio:
Determine the average compressive strength based on the specified compressive strength (55
MPa) using Equation 11.1. The average compressive strength found is 72 MPa. Select a 5%
RHA content. Now using the chart given in Figure 11.3, determine the W/B ratio. The W/B
ratio found is 0.33. It is < 0.40. Thus, it satisfies the W/B ratio requirement of SCHPC.
Step 5 – select total air content:
Select a total air content of 6%. It satisfies the CSA air content requirement of concrete for
most exposure conditions.
Step 6 – determine cement, RHA, and water contents:
Calculate the weight of total binder based on the W/B ratio, percent RHA content in binder,
and paste volume using Equation 11.5. The amount of binder found is 441.7 kg/m3. Thus, the
cement content obtained is greater than the recommended minimum cement content of 290
kg/m3 to improve the durability of concrete. Now calculate the cement, RHA and water
contents using Equations 11.6, 11.7, and 11.8, respectively. The amounts of cement, RHA
and water found are 419.6, 22.1 and 145.8 kg/m3, respectively. The water content found is
less than the recommended maximum water content of 210 kg/m3 for SCHPC. A brief
calculation is shown below:
From Equation 11.5:
( ) ( ) 3/7.44135.006.033.007.2
05.016.305.01
28.9971 mkgWW
WWbb
bb =⇒=+⎥⎦⎤
⎢⎣⎡ ++
−
From Equation 11.6:
( ) 3/6.4197.44105.01 mkgWc =×−=
From Equation 11.7: 3/1.227.44105.0 mkgWrha =×=
297
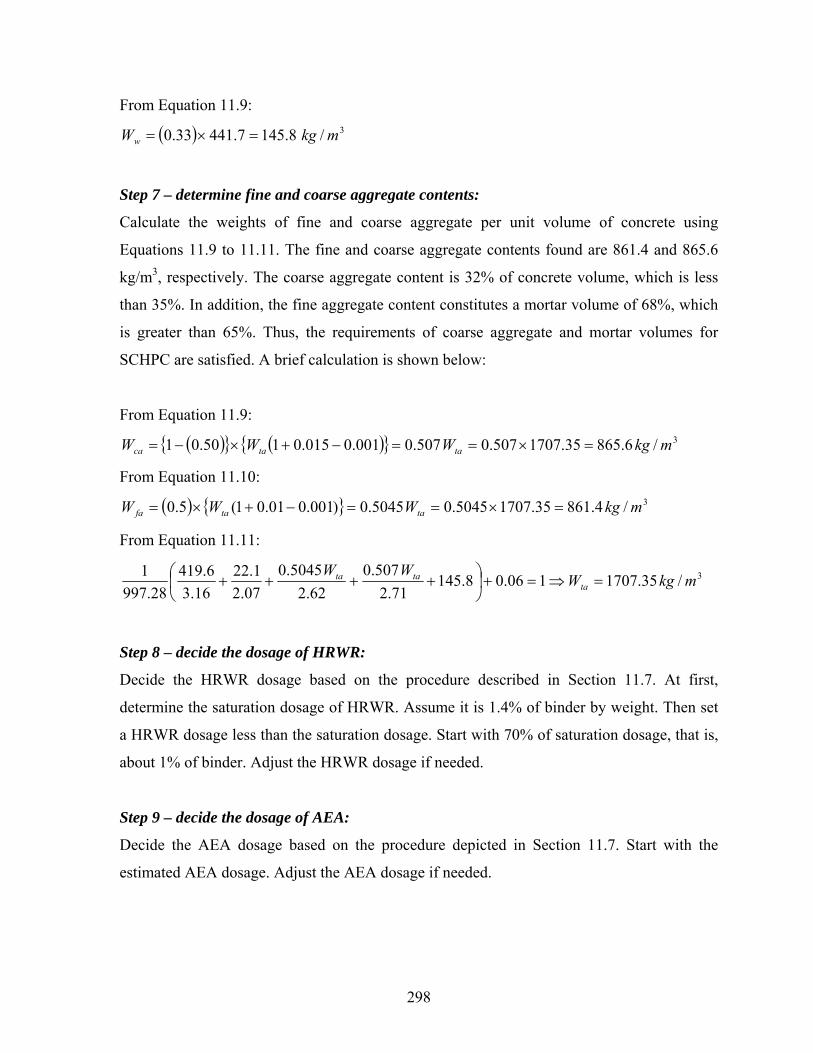
From Equation 11.9:
( ) 3/8.1457.44133.0 mkgWw =×=
Step 7 – determine fine and coarse aggregate contents:
Calculate the weights of fine and coarse aggregate per unit volume of concrete using
Equations 11.9 to 11.11. The fine and coarse aggregate contents found are 861.4 and 865.6
kg/m3, respectively. The coarse aggregate content is 32% of concrete volume, which is less
than 35%. In addition, the fine aggregate content constitutes a mortar volume of 68%, which
is greater than 65%. Thus, the requirements of coarse aggregate and mortar volumes for
SCHPC are satisfied. A brief calculation is shown below:
From Equation 11.9:
( ) ( ) 3/6.86535.1707507.0507.0001.0015.0150.01 mkgWWW tataca =×==−+×−=
From Equation 11.10:
( ) 3/4.86135.17075045.05045.0)001.001.01(5.0 mkgWWW tatafa =×==−+×=
From Equation 11.11:
3/35.1707106.08.14571.2
507.062.2
5045.007.2
1.2216.3
6.41928.997
1 mkgWWW
tatata =⇒=+⎟
⎠⎞
⎜⎝⎛ ++++
Step 8 – decide the dosage of HRWR:
Decide the HRWR dosage based on the procedure described in Section 11.7. At first,
determine the saturation dosage of HRWR. Assume it is 1.4% of binder by weight. Then set
a HRWR dosage less than the saturation dosage. Start with 70% of saturation dosage, that is,
about 1% of binder. Adjust the HRWR dosage if needed.
Step 9 – decide the dosage of AEA:
Decide the AEA dosage based on the procedure depicted in Section 11.7. Start with the
estimated AEA dosage. Adjust the AEA dosage if needed.
298

Step 10 – decide the dosage of VEA:
Decide the VEA dosage based on the manufacturer’s recommended dosage if necessary after
testing the filling ability, passing ability and segregation resistance of concrete.
Step 11 – adjust primary mixture proportions:
Adjust the proportions of fine and coarse aggregates using Equations 11.12 and 11.13. The
adjusted fine aggregate content found is 853.7 kg/m3. The adjusted coarse aggregate content
found is also 853.7 kg/m3. Now adjust the proportion of mixing water using Equation 11.14.
The adjusted water content found is 162.8 kg/m3.
From Equation 11.12:
3/7.853001.0015.01
6.865 mkgWcaad =−+
=
From Equation 11.13:
3/7.853001.001.01
4.861 mkgW faad =−+
=
From Equation 11.4:
( ) 3/8.162100411
1007.4410.17.8534.8617.8536.8658.145 mkgWwad =⎟
⎠⎞
⎜⎝⎛ −
×−−+−+=
Step 12 – prepare trial mixture and decide optimum mixture proportions:
Prepare the trial mixture based on the adjusted primary mixtures, and conduct the tests on the
key fresh and hardened concretes as discussed in Section 11.7 to judge the acceptability of
the mixture. Decide the final mixture proportions after obtaining the properties and durability
in expected levels.
11.9 Limitation of the Design Method
The mixture design given is applicable for normal-weight, air-entrained and non-air-
entrained SCHPC with and without RHA. It cannot be applied to the SCHPC incorporating
other SCMs, because the design chart for the strength-W/B ratio relationship will be
different. However, a similar design procedure can be developed for the SCHPC mixture
including other SCMs such as silica fume, fly ash and ground granulated blast-furnace slag.
299
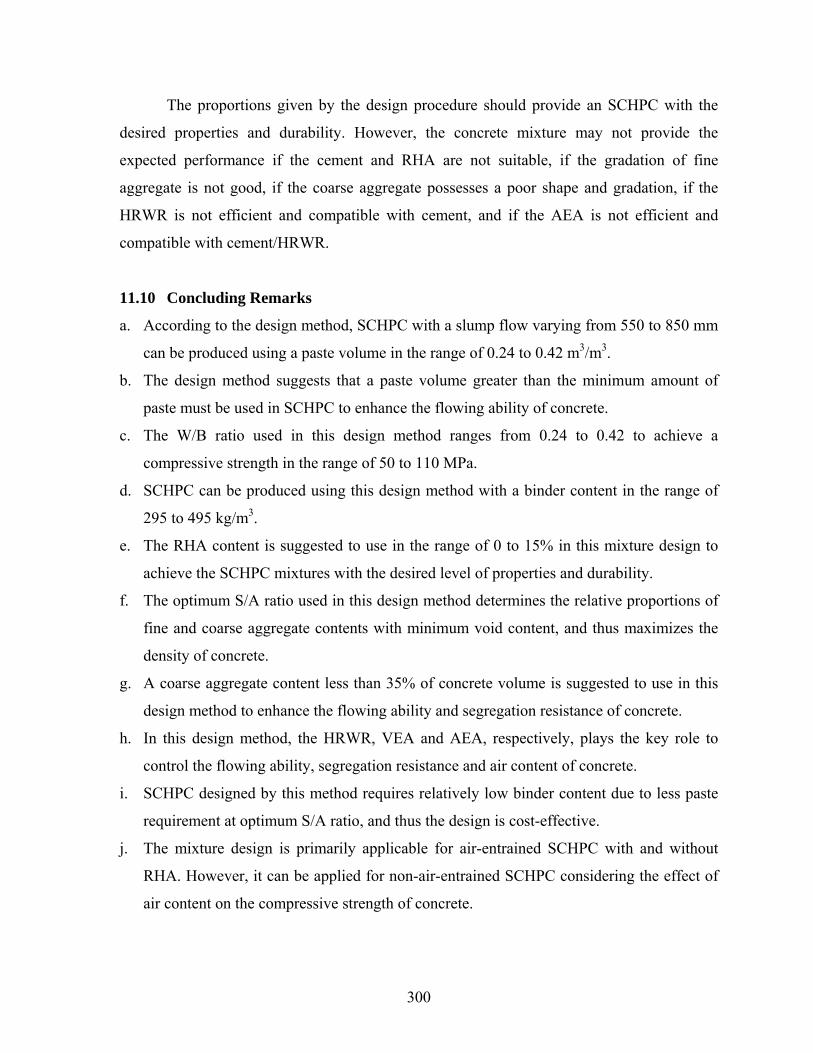
The proportions given by the design procedure should provide an SCHPC with the
desired properties and durability. However, the concrete mixture may not provide the
expected performance if the cement and RHA are not suitable, if the gradation of fine
aggregate is not good, if the coarse aggregate possesses a poor shape and gradation, if the
HRWR is not efficient and compatible with cement, and if the AEA is not efficient and
compatible with cement/HRWR.
11.10 Concluding Remarks
a. According to the design method, SCHPC with a slump flow varying from 550 to 850 mm
can be produced using a paste volume in the range of 0.24 to 0.42 m3/m3.
b. The design method suggests that a paste volume greater than the minimum amount of
paste must be used in SCHPC to enhance the flowing ability of concrete.
c. The W/B ratio used in this design method ranges from 0.24 to 0.42 to achieve a
compressive strength in the range of 50 to 110 MPa.
d. SCHPC can be produced using this design method with a binder content in the range of
295 to 495 kg/m3.
e. The RHA content is suggested to use in the range of 0 to 15% in this mixture design to
achieve the SCHPC mixtures with the desired level of properties and durability.
f. The optimum S/A ratio used in this design method determines the relative proportions of
fine and coarse aggregate contents with minimum void content, and thus maximizes the
density of concrete.
g. A coarse aggregate content less than 35% of concrete volume is suggested to use in this
design method to enhance the flowing ability and segregation resistance of concrete.
h. In this design method, the HRWR, VEA and AEA, respectively, plays the key role to
control the flowing ability, segregation resistance and air content of concrete.
i. SCHPC designed by this method requires relatively low binder content due to less paste
requirement at optimum S/A ratio, and thus the design is cost-effective.
j. The mixture design is primarily applicable for air-entrained SCHPC with and without
RHA. However, it can be applied for non-air-entrained SCHPC considering the effect of
air content on the compressive strength of concrete.
300
Chapter 12
Summary, Contributions and Recommendations
12.1 General
This chapter provides a summary of the research findings, lists the contributions of the
present study, and gives several recommendations for future research.
12.2 Summary
Various self-consolidating high performance concrete (SCHPC) incorporating rice husk ash
(RHA) as a supplementary cementing material were produced in the present study. For this,
the constituent materials, and the paste and mortar components of the concretes were
primarily investigated for key properties. Later, the key fresh properties including
segregation resistance and air-void stability, and the major hardened properties of the
concretes were determined. The effects of re-mixing, water-binder (W/B) ratio, RHA content,
air content, high-range water reducer (HRWR), air-entraining admixture (AEA), and
viscosity-enhancing admixture (VEA) were examined. In addition, simple apparatus were
developed to measure the filling ability, passing ability and segregation resistance of
concrete. Empirical models for the filling ability (slump flow) and compressive strength of
SCHPC were also developed. Finally, a design procedure was proposed for the mixture
proportion of SCHPC. The main research findings are given below.
Properties of Materials and Aggregate Blends:
a. The properties of constituent materials were suitable to produce SCHPC except for the
alkali contents of cement and RHA, which are acceptable for non-reactive aggregates.
b. The maximum bulk density with minimum void content was obtained for the aggregate
blend at the weight-basis sand-aggregate (S/A) ratio of 0.50, which is defined as the
optimum S/A ratio.
c. The optimum S/A ratio was used in the mixture proportioning of various SCHPCs to
improve the hardened properties and durability of concrete through reduced porosity.
301
Filling Ability of Pastes, Mortars and Concretes:
a. The flow time of SCHPC mixture and its paste component increased with lower W/B
ratio and higher RHA content indicating an increased plastic viscosity due to greater
volume fraction and surface area of the binder.
b. The higher HRWR dosages decreased the flow time of the pastes and increased the flow
spread of the mortars, and thus improved their filling abilities. This is due to the efficient
liquefying and dispersing actions of the HRWR resulting in greater fluidity.
c. The mortar filling ability with respect to flow spread increased with lower W/B ratio due
to higher paste volume and reduced sand content resulting in lower inter-particle friction.
In contrast, the mortar filling ability decreased with higher RHA content due to greater
volume fraction and surface area of the binder that increase the viscosity of mortar.
d. The filling ability of mortar with regard to flow spread was influenced by the mixture
composition; particularly, the sand content affected the flow spread by affecting the yield
stress and plastic viscosity.
e. The filling ability results of the pastes and mortars suggest that a HRWR dosage greater
than its saturation dosage can be unsuitable to achieve the required filling ability in
concrete due to bleeding and segregation. Thus, the optimum HRWR dosage for
concrete can be determined based on the filling ability of paste and mortar so as to
facilitate the mixture proportioning of SCHPC.
f. The filling abilities of SCHPC and its paste component were strongly correlated. The
orimet and inverted slump cone flow time exhibited very good relationships with the
paste flow time with a correlation coefficient of 0.939 and 0.979, respectively. This is
because the changes in plastic viscosity due to various W/B ratios and RHA contents
followed similar trends in cases of pastes and concretes.
g. The filling abilities of SCHPC and its mortar component were well-correlated with a
correlation coefficient of 0.953 in the absence of RHA, since both mortar flow spread
and concrete slump flow increased similarly without RHA at lower W/B ratio. In
contrast, a poor correlation was observed between the filling abilities of SCHPC and its
mortar component in the presence of RHA. This is because the mortar flow spread
decreased where as the concrete slump flow increased with higher RHA content.
302
Air Content of Mortars:
a. The air content of mortar for a given AEA dosage decreased by about 1.5 to 2.5% with
the increases in sand and cement contents due to increased yield stress and plastic
viscosity, which cause a loss of air-voids.
b. The air content of mortar decreased with lower W/B ratio and higher RHA content due
to the increases in binder content, binder surface area and HRWR dosage. The air
content of mortar helped to estimate the AEA dosage for the desired air content of
concrete, and thus facilitated the mixture proportioning process of SCHPC.
Filling Ability and Passing Ability of Concretes:
a. The filling ability and passing ability criteria were fulfilled for all SCHPCs except for
few concretes with a lower W/B ratio and a higher RHA content due to the high
viscosity caused by excessive surface area of rice husk ash.
b. The filling ability and passing ability of SCHPC with regard to slump flow, and inverted
slump cone and orimet flow spreads with and without J-ring, respectively, increased with
lower W/B ratio and higher RHA content due to the increased paste volume of concrete
resulting in lower inter-particle friction.
c. The filling ability properties of SCHPC were well correlated with its passing ability
properties with a correlation coefficient varying from 0.944 to 1. This is because both
filling ability and passing ability properties were influenced similarly by the W/B ratio
and RHA content of concrete.
d. The inverted slump cone flow time and spread were well-correlated with the orimet flow
time and spread with a correlation coefficient of 0.958 and 0.987, respectively. In
addition, the inverted slump cone and orimet flow spreads were strongly correlated in the
presence of the J-ring with a correlation coefficient of 0.944. The strong correlations
were observed for these properties of SCHPC because they varied similarly with the
W/B ratio and RHA content of concrete.
e. The inverted slump cone apparatus with and without a J-ring can be used easily in
laboratory and field by a single operator to assess the passing ability and filling ability of
concrete based on the performance criteria derived.
303
Segregation Resistance of Concretes:
a. The visual inspection revealed that the dynamic segregation resistance was good for
most of the SCHPC mixtures due to lower W/B ratio, higher RHA content and reduced
coarse aggregate content.
b. The static and dynamic segregation resistances of SCHPC mixtures were influenced
differently in the presence of RHA. The RHA increased the dynamic segregation
resistance of SCHPC by reducing the bleeding and increasing the viscosity of concrete.
However, it decreased the static segregation resistance of SCHPC by decreasing the
matrix density of concrete.
c. The sieve segregation test provided the static segregation resistance of SCHPC with
respect to segregation index, which increased with lower W/B ratio and higher RHA
content due to greater concrete spread. However, this test was not effective to capture the
effects of viscosity and matrix density on the static segregation resistance of SCHPC.
d. The column segregation test overcame the deficiencies of the sieve segregation test in
capturing the effects of plastic viscosity and matrix density, and thus showed its potential
for use as a reliable method to measure the static segregation resistance of SCHPC.
e. The segregation factor obtained from the column apparatus was well-correlated with the
variation in true electrical resistivity of SCHPC. This is because both varied similarly
with the heterogeneity or the variation in internal composition of concrete between top
and bottom sections of column apparatus due to coarse aggregate segregation.
f. The column segregation test should be conducted to determine the static segregation
resistance of SCHPC to be cast in vertical members, since it can effectively deal with the
major factors affecting the segregation in such cases.
g. The segregation factor given by the column apparatus decreased with lower W/B ratio,
which increased the viscosity and matrix density of SCHPC. In contrast, the segregation
factor increased with higher RHA content, which decreased the matrix density of
SCHPC due to increased binder volume.
h. The segregation resistance of SCHPC increased greatly in the presence of VEA, which
increases the yield stress and plastic viscosity of concrete. Therefore, the segregation
factor of the RHA concretes including VEA was reduced significantly.
304

Air Content, Air-void Stability and Unit Weight of Concretes:
a. The measured air content of SCHPC was within ±1.0% of the design air content. The
demand for the AEA dosage for a given air content increased with lower W/B ratio and
higher RHA content due to the increased plastic viscosity of concrete.
b. The estimated and actual AEA dosages for various SCHPCs were well-correlated with a
correlation coefficient of 0.983. Hence, the AEA dosage required to achieve a target
concrete air content can be determined based on the AEA dosage used for the equivalent
mortar air content.
c. The air-void stability in various fresh SCHPC mixtures was excellent. The presence of
RHA did not affect the air-void stability at different test stages after re-mixing and the
maximum loss of air content over the period of 60 to 90 minutes was less than 1%.
d. The unit weight of SCHPC mixture increased with lower W/B ratio due to greater binder
content, but decreased with higher RHA content due to increased paste volume. In
addition, a reduction in air content increased the aggregate contents and decreased the
total void content, and thus increased the unit weight of SCHPC.
Hardened Properties of Concretes:
a. The hardened properties of SCHPC were improved with lower W/B ratio due to higher
binder content, which produced greater hydration products and thus resulted in enhanced
paste densification.
b. The higher air content decreased the compressive strength and ultrasonic pulse velocity
by due to the increased void content of concrete. The reduction in compressive strength
was about 3.8 MPa per 1% increase in air content. In addition, the increased air content
decreased the total porosity due to reduced capillary porosity, and thus provided higher
electrical resistivity and lower water absorption.
c. The hardened properties of SCHPC were improved in the presence of RHA due to its
microfilling and pozzolanic effects.
d. Strong correlations were observed for the hardened properties of SCHPC. The test
results for the hardened properties of various SCHPCs also indicated that the concrete
durability was improved with lower W/B ratio and higher RHA content.
305
Optimum RHA content:
a. The filling ability results of the pastes and mortars suggest that a RHA content greater
than 15% can be unsuitable for SCHPC due to excessive water demand. In addition,
mixing and handling difficulties were experienced for a RHA content higher than 15%.
b. The SCHPC mixtures fulfilled the performance criteria for all fresh properties at a RHA
content ≤ 15%, except the static segregation resistance, which was not acceptable for
15% RHA in the absence of VEA. However, all RHA concretes provided the desired
hardened properties. The tested properties of the fresh and hardened concretes suggest
15% RHA as the optimum content for SCHPC.
Modeling of Concrete:
a. The filling ability model produced the slump flows close to the measured slump flow
values for both air-entrained and non-air-entrained SCHPC mixtures. The computed and
measured slump flows were within ±7.6% error.
b. The strength model of SCHPC provided the compressive strengths close to the measured
strength values. At least 95% of the measured strength values were accounted for with
the derived model of compressive strength.
Mixture Design of Concrete:
a. The proposed mixture design can be used to produce both air-entrained and non-air-
entrained SCHPCs with and without RHA providing a slump flow ranging from 550 to
850 mm, and a compressive strength in the range of 50 to 110 MPa.
b. The competency of the proposed mixture design method depends on the HRWR, VEA
and AEA, which play key roles to control the flowing ability, segregation resistance and
air content of concrete, respectively.
12.3 Contributions
The present study has contributed to the present state of knowledge on SCHPC. The main
contributions are:
a. Development of SCHPC utilizing RHA as a supplementary cementing material that is
obtained by burning rice husks generated in rice milling industry.
306
b. Optimization of aggregate blends to obtain maximum bulk density with minimum void
content, and thus to reduce the cement content for producing cost-effective SCHPC,
while achieving the properties and durability of concrete in desired levels.
c. Evaluation of the filling ability of binder pastes with respect to flow time using a grout
flow cone, thus determining the saturation or optimum dosage and water reduction
capacity of HRWR, and the water demand of RHA. These steps are useful to select the
HRWR dosage and RHA content, and thereby to facilitate the mixture proportioning
process of SCHPC.
d. Evaluation of the filling ability of mortars with respect to flow spread using a flow
mould, thus verifying the saturation dosage of HRWR obtained from the flow cone test
of binder pastes, examining the effectiveness or suitability of the selected HRWR dosage
and RHA content, and indicating the segregation resistance of concrete. These steps are
helpful for the mixture proportioning process of SCHPC.
e. Assessment of the air content for the mortar component of SCHPC mixture at various
AEA dosages using a Chace indicator, and thus estimating the AEA dosage required to
achieve the desired air content of concrete. This step is also helpful for the mixture
proportioning process of SCHPC.
f. Demonstration of the air-void stability in fresh SCHPC mixture with respect to re-
mixing at different plastic stages of concrete.
g. Development of a single-operator inverted slump cone apparatus for measuring the
filling ability and passing ability, and for indicating the static/dynamic segregation
resistance of SCHPC.
h. Development of a simplified and single-operator segregation column apparatus for
measuring the static segregation resistance of SCHPC.
i. Assessment of the degree of segregation in hardened SCHPC using electrical resistivity.
j. Non-destructive assessment for the water absorption, total porosity, electrical resistivity
and ultrasonic pulse velocity of SCHPC.
k. Modification of the test procedure for measuring the water absorption and total porosity
of SCHPC by vacuum saturation technique.
l. Setting the performance criteria for the inverted slump cone and segregation column
apparatus.
307
m. Development of empirical models for the filling ability and compressive strength of
concrete to facilitate the mixture proportioning process of SCHPC with and without
RHA.
n. Proposing a mixture design procedure for the air-entrained and non-air-entrained
SCHPC with and without RHA.
12.4 Recommendations
There are several aspects that were not investigated in the present study. The following
recommendations are given for future research:
a. The effects of RHA on the fresh and hardened properties of SCHPC should be
investigated for different types and sizes of coarse aggregate.
b. An experimental investigation should be carried out to examine the efficiency of RHA in
refining the microstructure of SCHPC due to microfilling and pozzolanic effects.
c. The effects of various curing conditions on the hardened properties of SCHPC, including
drying and autogenous shrinkages, should be examined.
d. The durability performance of SCHPC such as resistances to corrosion, alkali-aggregate
reaction, sulfate attack, and freezing and thawing, and the effects of RHA should be
investigated.
e. The effects of HRWR on the hardened properties including the electrical resistivity of
SCHPC should be investigated with and without various RHA contents.
f. The effects of VEA on the properties and durability of SCHPC with and without various
RHA contents should be examined and compared.
g. The performance of inverted slump cone apparatus should be compared with other test
devices, particularly V-funnel, which is also widely used to assess the filling ability of
SCHPC.
h. The combined effects of RHA and other supplementary cementing materials on the fresh
and hardened properties and durability of SCHPC should be investigated.
i. The SCHPC mixtures including RHA should be tested for the rheological parameters
such as yield stress and plastic viscosity in addition to the empirical tests for filling
ability with respect to flow time and flow spread.
308
j. The air-void stability in hardened SCHPC with and without RHA should be investigated
to ensure the freeze-thaw durability of concrete.
k. The effects of RHA collected from various sources should be investigated with respect to
different fresh and hardened properties and durability of SCHPC.
l. A testing device and a test method should be developed to quantitatively measure the
dynamic segregation resistance of SCHPC.
m. The effectiveness of the four-point Wenner array probe resistivity meter in identifying
the segregation in hardened concrete should be investigated for different SCHPCs
including RHA or other supplementary cementing materials.
n. The mixture design procedure developed should be employed to determine the mixture
proportions of SCHPC with and without RHA, thus validating its applicability.
309

References
AASHTO T 199, “Air content of freshly mixed concrete by the Chace indicator”, Standard
Specifications for Transportation Materials and Methods of Sampling and Testing, Part II, American Association of State Highway and Transportation Officials, Washington, D.C., USA, 2004.
ACI 201.2R-01, “Guide to durable concrete”, ACI Manual of Concrete Practice, Part 1, American Concrete Institute, Farmington Hills, Michigan, USA, 2004, 38pp.
ACI 209R-92, “Prediction of creep, shrinkage, and temperature effects in concrete structures”, ACI Manual of Concrete Practice, Part 1, American Concrete Institute, Farmington Hills, Michigan, USA, 2004, 47pp.
ACI 211.4R-93, “Guide for selecting proportions for high-strength concrete with portland cement and fly ash”, ACI Manual of Concrete Practice, Part 1, American Concrete Institute, Farmington Hills, Michigan, USA, 2004, 13pp.
ACI Committee 211H, “Guide for selecting proportions of self-consolidating concrete (SCC)”, American Concrete Institute, Farmington Hills, Michigan, USA, 2006.
ACI 212.3R-04, “Chemical admixtures for concretes”, ACI Manual of Concrete Practice, Part 1, American Concrete Institute, Farmington Hills, Michigan, USA, 2004, 31pp.
ACI 214.4R-03, “Guide for obtaining cores and interpreting compressive strength results”, ACI Manual of Concrete Practice, Part 1, American Concrete Institute, Farmington Hills, Michigan, USA, 2004, 16pp.
ACI 222R-01, “Protection of metals in concrete against corrosion”, ACI Manual of Concrete Practice, Part 1, American Concrete Institute, Farmington Hills, Michigan, USA, 2004, 41pp.
ACI 237R-07, “Self-consolidating concrete”, ACI Manual of Concrete Practice, Part 1, American Concrete Institute, Farmington Hills, Michigan, USA, 2007, 30pp.
ACI 304R-00, “Guide for measuring, mixing, transporting, and placing concrete”, ACI Manual of Concrete Practice, Part 2, American Concrete Institute, Farmington Hills, Michigan, USA, 2004. 41pp.
ACI 308R-01, “Guide to curing concrete”, ACI Manual of Concrete Practice, Part 2, American Concrete Institute, Farmington Hills, Michigan, USA, 2001. 31pp.
ACI 363R-92, “State-of-the art report on high-strength concrete”, ACI Manual of Concrete Practice, Part 5, American Concrete Institute, Farmington Hills, Michigan, USA, 2005. 55pp.
Aïtcin, P.-C., “The use of superplasticizers in high performance concrete”, High Performance Concrete: From Material to Structure, Y. Malier, ed., E & FN Spon, London, UK, 1994, pp.14-33.
Aïtcin, P.-C., “Developments in the application of high-performance concretes”, Construction and Building Materials, Vol.9, No.1, 1995, pp.13-17.
Aïtcin, P.-C., “High strength concrete: current trends and applications”, Proceedings of the Fifth International Conference on Concrete Engineering and Technology, University Malaya, Kuala Lumpur, Malaysia, 1997, pp.37-46.
Aïtcin, P.-C., High Performance Concrete, 1st Edition, E & FN Spon, London, UK, 1998. 624pp.
310

Al-Amoudi, O.S.B., Maslehuddin, M., and Asi, I.M., “Performance and correlation of the properties of fly ash cement concrete”, Cement, Concrete, and Aggregates, Vol.18, No.2, 1996, pp.71-77.
Ampadu, K.O., and Torii, K., “Chloride ingress and steel corrosion in cement mortars incorporating low-quality fly ashes”, Cement and Concrete Research, Vol.32, No.6, 2002, pp.893-901.
Assaad, J., Khayat, K.H., and Daczko, J., “Evaluation of static stability of self-consolidating concrete”, ACI Materials Journal, Vol.101, No.3, 2004, pp.207-215.
ASTM C 29/C 29M, “Standard test method for bulk density (“unit weight”) and voids in aggregate”, Annual Book of ASTM Standards, Vol.04.02, American Society for Testing and Materials, Philadelphia, USA, 2004.
ASTM C 33, “Standard specification for concrete aggregates”, Annual Book of ASTM Standards, Vol.04.02, American Society for Testing and Materials, Philadelphia, USA, 2004.
ASTM C 39/C 39M, “Standard test method for compressive strength of cylindrical concrete specimens”, Annual Book of ASTM Standards, Vol.04.02, American Society for Testing and Materials, Philadelphia, USA, 2004.
ASTM C 42/C 42M, “Standard test method for obtaining and testing drilled cores and sawed beams of concrete”, Annual Book of ASTM Standards, Vol.04.02, American Society for Testing and Materials, Philadelphia, USA, 2004.
ASTM C 94/C 94M, “Standard specification for ready-mixed concrete”, Annual Book of ASTM Standards, Vol.04.02, American Society for Testing and Materials, Philadelphia, USA, 2004.
ASTM C 114, “Test methods for chemical analysis of hydraulic cement”, Annual Book of ASTM Standards, Vol.04.01, American Society for Testing and Materials, Philadelphia, USA, 2004.
ASTM C 125, “Standard terminology relating to concrete and concrete aggregates”, Annual Book of ASTM Standards, Vol.04.02, American Society for Testing and Materials, Philadelphia, USA, 2002.
ASTM C 136, “Standard test method for sieve analysis of fine and coarse aggregates”, Annual Book of ASTM Standards, Vol.04.02, American Society for Testing and Materials, Philadelphia, USA, 2004.
ASTM C 138/C 138M, “Standard test method for density (unit weight), yield, and air content (gravimetric) of concrete”, Annual Book of ASTM Standards, Vol.04.02, American Society for Testing and Materials, Philadelphia, USA, 2004.
ASTM C 143/C 143M, “Standard test method for slump of hydraulic-cement concrete”, Annual Book of ASTM Standards, Vol.04.02, American Society for Testing and Materials, Philadelphia, USA, 2004.
ASTM C 150, “Standard specification for portland cement”, Annual Book of ASTM Standards, Vol.04.01, American Society for Testing and Materials, Philadelphia, USA, 2004.
ASTM C 192/C 192M, “Standard practice for making and curing concrete test specimens in the laboratory”, Annual Book of ASTM Standards, Vol.04.02, American Society for Testing and Materials, Philadelphia, USA, 2004.
311
ASTM C 230/C 230M, “Standard specification for flow table for use in tests of hydraulic cement”, Annual Book of ASTM Standards, Vol.04.01, American Society for Testing and Materials, Philadelphia, USA, 2004.
ASTM C 231, “Standard test method for air content of freshly mixed concrete by pressure method”, Annual Book of ASTM Standards, Vol.04.02, American Society for Testing and Materials, Philadelphia, USA, 2004.
ASTM C 260, “Standard specification for air-entraining admixtures for concrete”, Annual Book of ASTM Standards, Vol.04.02, American Society for Testing and Materials, Philadelphia, USA, 2004.
ASTM C 305, “Standard practice for mechanical mixing of hydraulic cement pastes and mortars of plastic consistency”, Annual Book of ASTM Standards, Vol.04.01, American Society for Testing and Materials, Philadelphia, USA, 2004.
ASTM C 494/ C494M, “Standard specification for chemical admixtures for concrete”, Annual Book of ASTM Standards, Vol.04.02, American Society for Testing and Materials, Philadelphia, USA, 2004.
ASTM C 597, “Standard test method for pulse velocity through concrete”, Annual Book of ASTM Standards, Vol.04.02, American Society for Testing and Materials, Philadelphia, USA, 2004.
ASTM C 618, “Standard specification for coal fly ash and raw or calcined natural pozzolan for use as a mineral admixture in concrete”, Annual Book of ASTM Standards, Vol.04.02, American Society for Testing and Materials, Philadelphia, USA, 2004.
ASTM C 939, “Standard test method for flow of grout for preplaced-aggregate concrete (flow cone method)”, Annual Book of ASTM Standards, Vol.04.02, American Society for Testing and Materials, Philadelphia, USA, 2004.
ASTM C 989, “Standard specification for ground granulated blast-furnace slag for use in concrete and mortars”, Annual Book of ASTM Standards, Vol.04.02, American Society for Testing and Materials, Philadelphia, USA, 2004.
ASTM C 1017/C 1017M, “Standard specification for chemical admixtures for use in producing flowing concrete”, Annual Book of ASTM Standards, Vol.04.02, American Society for Testing and Materials, Philadelphia, USA, 2004.
ASTM C 1157, “Standard performance specification for hydraulic cement”, Annual Book of ASTM Standards, Vol.04.01, American Society for Testing and Materials, Philadelphia, USA, 2004.
ASTM C 1240, “Standard specification for use of silica fume as mineral admixture in hydraulic cement concrete, mortar and grout”, Annual Book of ASTM Standards, Vol.04.02, American Society for Testing and Materials, Philadelphia, USA, 2004.
ASTM C 1610/C 1610M, “Standard test method for static segregation of self-consolidating concrete using column technique”, Annual Book of ASTM Standards, Vol.04.02, American Society for Testing and Materials, Philadelphia, USA, 2006.
ASTM C 1611/C 1611M, “Standard test method for slump flow of self-consolidating concrete”, Annual Book of ASTM Standards, Vol.04.02, American Society for Testing and Materials, Philadelphia, USA, 2007.
ASTM C 1621/C 1621M, “Standard test method for passing ability of self-consolidating concrete by J-ring”, Annual Book of ASTM Standards, Vol.04.02, American Society for Testing and Materials, Philadelphia, USA, 2007.
312
ASTM D 422, “Standard test method for particle-size analysis of soils”, Annual Book of ASTM Standards, Vol.04.08, American Society for Testing and Materials, Philadelphia, USA, 2004.
Attiogbe, E.K., See, H.T., and Daczko, J.A., “Engineering properties of self-consolidating concrete”, Proceedings of the First North American Conference on the Design and Use of Self-Consolidating Concrete, S.P. Shah, J.A. Daczko, and J.N. Lingscheit, eds., Hanley-Wood, LLC, Illinois, USA, 2002, pp.331-336.
Baalbaki, M., and Aïtcin, P.-C., “Cement/superplasticizer/air-entraining agent compatibility”, Proceedings of the Fourth CANMET/ACI International Conference on Superplasticizers and Other Chemical Admixtures in Concrete, ACI SP-148, V.M. Malhotra, ed., American Concrete Institute, Farmington Hills, Michigan, USA, 1994, pp.47-62.
Baekmark, K., Hansen, H., and Reichert, J., “Stabilized air void system in superplasticized concrete”, Concrete Technology – Past, Present, and Future: Proceedings of V. Mohan Malhotra Symposium, ACI SP-144, P.K. Mehta, ed., American Concrete Institute, Farmington Hills, Michigan, USA, 1994, pp.177-190.
Banfill, P.F.G., “Rheological methods for assessing the flow properties of mortar and related materials”, Construction and Building Materials, Vol.8, No.1, 1994, pp.43-50.
Bartlett, F.M., and MacGregor, J.G., “Statistical analysis of the compressive strength of concrete in structures”, ACI Materials Journal, Vol.93, No.2, 1996, pp.158-168.
Bartlett, F.M., and MacGregor, J.G., “Variation of in-place concrete strength in structures”, ACI Materials Journal, Vol.96, No.2, 1999, pp.261-271.
Bartos, P.J.M., “Measurement of key properties of fresh self-compacting concrete”, Paper presented in the CEN/STAR PNR Workshop on Measurement, Testing and Standardization: Future Needs in the Field of Construction Materials, Paris, France, 5-6 June 2000, 6pp.
Bentz, D.P., and Haecker, C.J., “An argument for using coarse cements in high-performance concretes”, Cement and Concrete Research, Vol.29, No.4, 1999, pp.615-618.
Beris, A.N., Tsamopoulos, J.A., Armstrong, R.C., and Brown, R.A., “Creeping motion of a sphere through a Bingham plastic”, Journal of Fluid Mechanics, Vol.158, 1985, pp.219-244.
Bigley, C., and Greenwood, P., “Using silica to control bleed and segregation in self-consolidating concrete”, Concrete, Vol.37, No.2, 2003, pp.43-45.
Bonen, D., and Shah, S.P., “Fresh and hardened properties of self-consolidating concrete”, Progress in Structural Engineering and Materials, Vol.7, No.1, 2005, pp.14-26.
Bonen, D., Deshpande, Y., Olek, J., Struble, L., Lange, D., and Khayat, K., “Robustness of SCC”, Self-Consolidating Concrete, D. Lange, ed., The Centre for Advanced Cement-based Materials, Northwestern University, Illinois, USA, 2007, pp.4-22.
Bouzoubaâ, N., and Lachemi, M., “Self-compacting concrete incorporating high volumes of Class F fly ash: preliminary results”, Cement and Concrete Research, Vol.31, No.3, 2001, pp.413-420.
Brameshuber, W., and Uebachs, S., “Practical experience with the application of self-compacting concrete in Germany”, Proceedings of the Second International Symposium on Self-compacting Concrete, K. Ozawa and M. Ouchi, eds., COMS Engineering Corporation, Tokyo, Japan, 2001, pp.687-695.
Brandt, A.M., Cement-based Composites: Materials, Mechanical Properties, and Performance, E & FN Spon, London, UK, 1995.
313
Brown, Z.A., and Curry, K.J., “Total sulphur by combustion”, Analytical Methods for Chemical Analysis of Geological and Other Materials, J.E. Taggart, Jr., ed., U.S. Geological Survey, Denver, Colorado, USA, 2002a, pp.Q1-4.
Brown, Z.A., and Curry, K.J., “Total carbon by combustion”, Analytical Methods for Chemical Analysis of Geological and Other Materials, J.E. Taggart, Jr., ed., U.S. Geological Survey, Denver, Colorado, USA, 2002b, pp.R1-4.
Bruker, “XRF analysis of chlorine in pressed powder cement samples”, Bruker Analytical X-ray Systems, Bruker AXS, Inc., Madison, Wisconsin, USA, 2004.
Bui, V.K., Montgomery, D., Hinczak, I., and Turner, K., “Rapid testing method for segregation resistance of self-compacting concrete”, Cement and Concrete Research, Vol.32, No.9, 2002, pp.1489-1496.
Cameron, I., “Self-compacting concrete: a versatile material”, Concrete, Vol.37, No.2, 2003, pp.16-18.
CAN/CSA A3001, “Cementitious materials for use in concrete”, Cementitious Materials Compendium, Canadian Standards Association, Etobicoke, Ontario, Canada, 2003.
Chandra, S., and Björnström, J., “Influence of cement and superplasticizers type and dosage on the fluidity of cement mortars – Part I”, Cement and Concrete Research, Vol.32, No.10, 2002, pp.1605-1611.
Chang, P.-K., and Peng, Y.-N., “Influence of mixing techniques on properties of high performance concrete”, Cement and Concrete Research, Vol.31, No. 1, 2001, pp.87-95.
Chidiac, S.E., Maadani, O., Razaqpur, A.G., and Mailvaganam, N.P., “Controlling the quality of fresh concrete – a new approach”, Magazine of Concrete Research, Vol.52, No.5, 2000, pp.353-363.
Chidiac, S.E., Maadani, O., Razaqpur, A.G., and Mailvaganam, N.P., “Correlation of rheological properties to durability and strength of hardened concrete”, Journal of Materials in Civil Engineering, Vol.15, No.4, 2003, pp.391-399.
Chini, A.R., Muszynski, L.C., and Hicks, J., Determination of Acceptance Permeability Characteristics for Performance-related Specifications for Portland Cement Concrete, Final report submitted to Florida Department of Transportation, BC 354-41, M.E. Rinker, Sr. School of Building Construction, University of Florida, Florida, USA, 2003, 165pp.
Chopin, D., Larrard, F., D., and Cazacliu, B., “Why do HPC and SCC require a longer mixing time?”, Cement and Concrete Research, Vol.34, No.12, 2004, pp.2237-2243.
Claisse, P., “Transport properties of concrete”, Concrete International, Vol.27, No.1, 2005, pp.43-48.
Claisse, P.A., Cabrera, J.G., and Hunt, D.N., “Measurement of porosity as a predictor of the durability performance of concrete with and without condensed silica fume”, Advances in Cement Research, Vol.13, No.4, 2001, pp.165-174.
CNS Farnell, Operating Manual for PUNDIT plus, Fulton Group Limited, England, UK, 2000, 31pp.
CNS Farnell, Operating Instructions for RM MK II Concrete Resistivity Meter, England, UK, 2004, 22pp.
Collepardi, M., “Assessment of the rheoplasticity of concretes”, Cement and Concrete Research, 1976, Vol.6, No.3, pp.401-408.
314
Collepardi, M., “Advances in chemical admixtures for concrete”, Proceedings of an Engineering Foundation Conference on Advances in Cement and Concrete, M.W. Grutzeck, and S.L. Sarkar, eds., American Society of Civil Engineers, New York, USA, 1994, pp.257-291.
Collepardi, M., and Massidda, L., “The influence of water-reducing admixtures on the cement paste and concrete properties”, Proceedings of a Conference on Hydraulic Cement Pastes: Their Structure and Properties, Cement and Concrete Association, Slough, UK, 1976, pp.256-267.
Coppola, L., Cerulli, T., and Salvioni, D., “Sustainable development and durability of self-compacting concrete”, Proceedings of the Eighth CANMET/ACI International Conference on Fly Ash, Silica Fume, Slag and Natural Pozzolans in Concrete, ACI SP-221, V.M. Malhotra, ed., American Concrete Institute, Farmington Hills, Michigan, USA, 2004, pp.29-50.
Coutinho, J.S., “The combined benefits of CPF and RHA in improving the durability of concrete structures”, Cement and Concrete Composites, Vol.25, No.1, 2003, pp.51-59.
CSA A23.1, Concrete Materials and Methods of Concrete Construction, Canadian Standards Association, Etobicoke, Ontario, Canada, 2004.
CSA A23.2, Methods of Test and Standard Practices for Concrete, Canadian Standards Association, Etobicoke, Ontario, Canada, 2004.
Cyr, M., and Mouret, M., “Rheological characterization of superplasticized cement pastes containing mineral admixtures: consequences on self-compacting concrete design”, Proceedings of the Seventh CANMET/ACI International Conference on Superplasticizers and other Chemical Admixtures in Concrete, ACI SP-217, V.M. Malhotra, ed., American Concrete Institute, Michigan, USA, 2003, pp.241-255.
Daczko, J.A., “Stability of self-consolidating concrete, assumed or ensured?”, Proceedings of the First North American Conference on the Design and Use of Self-consolidating Concrete, S.P. Shah, J.A. Daczko, and J.A. Lingscheit, eds., Hanley-Wood, LLC, Illinois, USA, 2002, pp.223-228.
Das, B.M., Principles of Foundation Engineering, Fourth Edition, PWS Publishing, Brooks/Cole Publishing Company, California, USA, 1999. 862pp.
Dehn, F., Holschemacher, K., and Weiβe, D., “Self-compacting concrete (SCC) time development of the materials properties and the bond behaviour”, The Leipzig Annual Civil Engineering Report, University of Leipzig, Leipzig, Federal Republic of Germany, 2000, pp.115-124.
De Larrard, F., “A mix performance method for high-performance concrete”, High Performance Concrete, Y. Malier, ed., E & FN Spon, London, UK, 1994, pp.48-62.
Demirboğa, R., Türkmen, İ., and Karakoc, M.B., “Relationship between ultrasonic velocity and compressive strength for high-volume mineral-admixtured concrete”, Cement and Concrete Research, Vol.34, No.12, 2004, pp.2329-2336.
Dhir, R.K., Hewlett, P.C., and Chan, Y.N., “Near-surface characteristics of concrete: assessment and development of in-situ test methods”, Magazine of Concrete Research, Vol.39, No.141, 1987, pp.183-195.
Dodson, V.H., Concrete Admixtures, First Edition, Van Nostrand Reinhold, Inc., New York, USA, 1990, 211pp.
Domone, P., “Mortar tests for self-consolidating concrete”, Concrete International, Vol.28, No.4, 2006, pp.39-45.
315
Domone, P., and Soutsos, M., “An approach to the proportioning of high-strength concrete mixes”, Concrete International, Vol.16, No.10, 1994, pp.26-31.
Du, L., and Folliard, K.J., “Mechanisms of air entrainment in concrete”, Cement and Concrete Research, Vol.35, No.8, 2005, pp.1463-1471.
Duval, R., and Kadri, E.H., “Influence of silica fume on the workability and the compressive strength of high-performance concretes”, Cement and Concrete Research, Vol.28, No.4, 1998, pp.533-547.
EFNARC, Specifications and Guidelines for Self-Consolidating Concrete, European Federation of Suppliers of Specialist Construction Chemicals (EFNARC), Surrey, UK, 2002, 32pp.
Erdogdu, S., “Compatibility of superplasticizers with cements different in composition”, Cement and Concrete Research, Vol.30, No.5, 2000, pp.767-773.
Ferraris, C.F., and De Larrard, F., “Modified slump test to measure rheological parameters of fresh concrete”, Cement, Concrete, and Aggregates, Vol.20, No.2, 1998, pp.241-247.
Ferraris, C.F., Brower, L., Ozyildirim, C., and Daczko, J., “Workability of self-compacting concrete”, Proceedings of the PCI/FHWA/FIB International Symposium on High Performance Concrete, L.S. Johal, ed., Precast/Prestressed Concrete Institute, Chicago, USA, 2000, pp.398-407.
FHWA, “Critical properties of concrete”, Integrated Materials and Construction Practices for Concrete Pavement: A State-of-the Practice Manual, Publication No. HF-07-004, U.S. Department of Transportation and Federal Highway Administration, Washington, USA, 2006, pp.105-170.
Florida Department of Transportation, “Florida method of test for concrete resistivity as an electrical indicator of its permeability”, FM 5-578, The Florida Department of Transportation, Florida, USA, 2004.
Geiker, M.R., Brandl, M., Thrane, L.N., and Nielsen, L.F., “On the effect of coarse aggregate fraction and shape on the rheological properties of self-compacting concrete”, Cement, Concrete, and Aggregates, Vol.24, No.1, 2002, pp.3-6.
Gettu, R., Gomes, P.C.C., Agullo, L., and Josa, A., “High-strength self-compacting concrete with fly ash: development and utilization”, Proceedings of Fifth CANMET/ACI International Conference on Recent Advances in Concrete Technology, ACI SP-200, V.M. Malhotra, ed., American Concrete Institute, Farmington Hills, Michigan, USA, 2001, pp.507-522.
Ghezal, A., and Khayat, K.H., “Optimizing self-consolidating concrete with limestone filler by using statistical factorial design methods”, ACI Materials Journal, Vol.99, No.3, 2002, pp.264-272.
Gowripalan, N., Cabrera, J.G., Cusens, A.R., and Wainwright, P.J., “Effect of curing on durability”, Durable Concrete, ACI Compilation 24, American Concrete Institute, Farmington Hills, Michigan, USA, 1992, pp.47-54.
Grünewald, S., Walraven, J.C., Emborg, M., Cärlsward, J., and Hedin, C., “Test methods for filling ability of SCC”, Summary Report of Workpackage 3.1, Delft University of Technology and Betongindustri, Netherlands, 2004, 6pp.
Gutiérrez, P.A., and Cánovas, M.F., “High-performance concrete: requirements for constituent materials and mix proportioning”, ACI Materials Journal, Vol.93, No.3, 1996, pp.233-241.
316
Hansen, M.R., Leming, M.L., Zia, P., and Ahmad, S., “Chloride permeability and AC impedance of high performance concrete”, Proceedings of the Symposium on High Performance Concrete in Severe Environments, ACI SP-140, P. Zia, ed., American Concrete Institute, Farmington Hills, Michigan, USA, 1993, pp.121-145.
Hassan, K.E., Cabrera, J.G., and Maliehe, R.S., “The effect of mineral admixtures on the properties of high-performance concrete”, Cement and Concrete Composites, Vol.22, No.4, 2000, pp.267-271.
Hayakawa, M., Matsuoka, Y., and Shindoh, T., “Development and application of super-workable concrete”, Special Concretes: Workability and Mixing, Proceedings of the International RILEM Workshop, P.J.M. Bartos, ed., E & FN Spon, London, UK, 1994, pp.183-190.
Hearn, N., Hooton, R.D., and Mills, R.H., “Pore structure and permeability”, Significance of Tests and Properties of Concrete and Concrete-Making Materials, ASTM STP 169C, American Society for Testing and Materials, Philadelphia, USA, 1994, pp. 240-262.
Hearn, N., “On the corrosion of steel reinforcement in concrete”, Proceedings of the 1st Structural Specialty Conference, Canadian Society for Civil Engineering, Montréal, Quebec, Canada, 1996, pp.763-774.
Hearn, N., Skalny, J., and Bajza, A., “Microstructures and bond in cementitious solids”, Building Research Journals, Vol.45, No.1, 1997, pp.103-118.
Hossain, K.M.A., “Correlations between porosity, chloride diffusivity and electrical resistivity in volcanic pumice-based blended cement pastes”, Advances in Cement Research, Vol.17, No.1, 2005, pp.29-37.
Holland, T.C., “High performance concrete”, Concrete Products, June 1993, pp.19-21. Hooton, R.D., “Canadian use of ground granulated blast-furnace slag as a supplementary
cementing material for enhanced performance of concrete”, Canadian Journal of Civil Engineering, Vol.27, No.4, 2000, pp.754-760.
Hover, K.C., “Concrete mixture proportioning with water-reducing admixtures to enhance durability: a quantitative model”, Cement and Concrete Composites, Vol.20, No.2-3, 1998, pp.113-119.
Hu, C., and De Larrard, F., “The rheology of fresh high-performance concrete”, Cement and Concrete Research, Vol.26, No.2, 1996, pp.283-294.
Hu, C., De Larrard, F., Sedran, T., Boulay, C., Bosc, F., and Deflorenne, F., “Validation of BTRHEOM, the new rheometer for soft to fluid concrete”, Materials and Structures, Vol.29, No.10, 1996, pp.620-631.
Hu, J., and Wang, K., “Effects of aggregate on flow properties of mortar”, Proceeding of the Mid-Continent Transportation Research Symposium, Ames, Iowa, Iowa State University, 2005, 8pp.
Hwang, C.L., and Hung, M.F., “Durability consideration of self-consolidating concrete”, Proceedings of the First North American Conference on the Design and Use of Self-Consolidating Concrete, S.P. Shah, J.A. Daczko, and J.N. Lingscheit, eds., Hanley-Wood, LLC, Illinois, USA, 2002, pp.343-348.
Ismail, M.S., and Waliuddin, A.M., “Effect of rice husk ash on high strength concrete”, Construction and Building Materials, Vol.10, No.7, 1996, pp.521-526.
ISO 13320-1, Particle Size Analysis – Laser Diffraction Methods, Part 1: General Principles, International Organization for Standardization, Geneva, Switzerland, 1999.
317
Jauberthie, R., Rendell, F., Tamba, S., and Cisse, I., “Origin of the pozzolanic effect of rice husks”, Construction and Building Materials, Vol.14, No.8, 2000, pp.419-423.
Jana, D., Erlin, B., and Pistilli, M.F., “A closer look at entrained air in concrete”, Concrete International, Vol.27, No.7, 2005, pp.31-34.
Jin, J., and Domone, P.L., “Relationships between the fresh properties of SCC and its mortar component”, Proceedings of the First North American Conference on the Design and Use of Self-consolidating Concrete, S.P. Shah, J.A. Daczko, and J.N. Lingscheit, eds., Hanley-Wood, LLC, Illinois, USA, 2002, pp.37-42.
Johnston, C.D., “Deicer salt scaling resistance and chloride permeability”, Concrete International, Vol.16, No.8, 1994, pp.48-55.
Kaplan, M.F., “Compressive strength and ultrasonic pulse velocity relationships for concrete in columns”, Proceedings of American Concrete Institute, Vol.54, 1958, pp.675-688.
Kessler, R.J., Powers, R.G., and Paredes, M.A., “Resistivity measurements of water saturated concrete as an indicator of permeability”, Corrosion, Paper 05261, 2005, 10pp.
Khatri, R.P., and Sirivivatnanon, “Effect of different supplementary cementitious materials on mechanical properties of high performance concrete”, Cement and Concrete Research, Vol.25, No.1, 1995, pp.209-220.
Khayat, K.H., “Viscosity-enhancing admixtures for cement-based materials – an overview”, Cement and Concrete Composites, Vol.20, No.2-3, 1998, pp.171-188.
Khayat, K.H., “Workability, testing, and performance of self-consolidating concrete”, ACI Materials Journal, Vol.96, No.3, 1999, pp.346-353.
Khayat, K.H., “Optimization and performance of air-entrained, self-consolidating concrete”, ACI Materials Journal, Vol.97, No.5, 2000, pp.526-535.
Khayat, K.H., and Assaad, J., “Air void stability in self-consolidating concrete”, ACI Materials Journal, Vol.99, No.4, 2002, pp.408-416.
Khayat, K.H., and Guizani, Z., “Use of viscosity-modifying admixtures to enhance stability of fluid concretes”, ACI Materials Journal, Vol.94, No.4, 1997, pp.332-340.
Kim, H., Park, Y.-D., Noh, J., Song, Y., Han, C., and Kang, S., “Rheological properties of self-compacting high-performance concrete”, Proceedings of the Third CANMET/ACI International Conference, ACI SP-172, V.M. Malhotra, ed., American Concrete Institute, Michigan, USA, 1997, pp.653-668.
Kim, J.-H., and Robertson, R.E., “Prevention of air void formation in polymer-modified cement mortar by pre-wetting”, Cement and Concrete Research, Vol.27, No.2, 1997, pp.171-176.
Koehler, E.P., and Fowler, D.W., ICAR Mixture Proportioning Procedure for Self-consolidating Concrete, Research Report 108-1, International Center for Aggregates Research, University of Texas at Austin, Texas, USA, 2006, 21pp.
Kosmatka, S.H., Kerkhoff, B., Panareśe, W.C., MacLeod, N.F, and McGrath, R.J., Design and Control of Concrete Mixtures, Seventh Edition, Cement Association of Canada, Ottawa, Ontario, Canada, 2002. 356pp.
Kwan, A.K.H., “Use of condensed silica fume for making high strength, self-consolidating concrete”, Canadian Journal of Civil Engineering, Vol.27, No.4, 2000, pp.620-627.
Lachemi, M., Hossain, K.M.A., Lambros, V., and Bouzoubaâ, N., “Development of cost-effective self-consolidating concrete incorporating fly ash, slag cement, or viscosity-modifying admixtures”, ACI Materials Journal, Vol.100, No.5, 2003, pp.419-425.
318
Lachemi, M., Hossain, K.M.A., Lambros, V., Nkinamubanzi, P.-C., and Bouzoubaâ, N., “Self-consolidating concrete incorporating new viscosity modifying admixtures”, Cement and Concrete Research, Vol.34, No.6, 2004, pp.917-926.
Leslie, J.R., and Cheesman, W.J., “An ultrasonic method of studying deterioration and cracking in concrete structures”, Journal of the American Concrete Institute, Vol.21, No.1, 1949, pp.17-36.
Lessard, M., and Aïtcin, P.-C., “Testing high performance concrete”, High Performance Concrete: From Material to Structure, Y. Malier, ed., E & FN Spon, London, UK, 1994, pp.196-213.
Lessard, M., Baalbaki, M., and Aïtcin, P.-C., “Mix design for air-entrained high performance concrete”, Proceedings of the International Conference on Concrete under Severe Conditions: Environment and Loading, Vol.2, K. Sakai, N. Banthia, and O.E. Gjørv, eds., E & FN Spon, London, UK, 1995, pp.1025-1034.
Lin, Y., Lai, C.-P., and Yen, T., “Prediction of ultrasonic pulse velocity (UPV) in concrete”, ACI Materials Journal, Vol.100, No.1, 2003, pp.21-28.
Litvan, G.G., “Pore structure and frost susceptibility of building materials”, Proceedings of the RILEM/IUPAC International Symposium on Pore Structure and Properties of Materials, Prague, Czech Republic, September 18-21, 1973, 14pp.
Maeda, N., Wada, I., Kawakami, M., Ueda, T., and Pushpalal, G.K.D., “Chloride diffusivity of concrete incorporating rice husk ash”, Proceedings of the Fifth CANMET/ACI International Conferences on Recent Advances in Concrete Technology, ACI SP-200, V.M. Malhotra, ed., American Concrete Institute, Farmington Hills, Michigan, USA, 2001, pp.291-308.
Mahmud, H.B., Majuar, E., Zain, M.F.M., and Hamid, N.B.A.A., “Mechanical properties and durability of high strength concrete containing rice husk ash”, Proceedings of the Eighth CANMET/ACI International Conference on Fly Ash, Silica Fume, Slag and Natural Pozzolans in Concrete, ACI SP-221, V.M. Malhotra, ed., American Concrete Institute, Farmington Hills, Michigan, USA, 2004, pp.751-765.
Mailvaganam, N.P., Concrete Admixtures Handbook, Noyes Publication, New Jersey, USA, 1994, pp.1000-1006.
Malhotra, V.M., “Fly ash, slag, silica fume, and rice-husk ash in concrete: a review”, Concrete International, Vol.15, No.4, 1993, pp.23-28.
Mather, B., “Curing of concrete”, Proceedings of Lewis H. Tuthill International Symposium on Concrete and Concrete Construction, ACI SP-104, G.T. Halvorsen, ed., American Concrete Institute, Farmington Hills, Michigan, USA, 1987, pp.145-159.
MBT, “Rheomac VMA 362”, Information Sheet, Master Builders, Inc., Brampton, Ontario, Canada, 2002.
McCarter, W.J., Ezirim, H., and Emerson, M., “Absorption of water and chloride into concrete”, Magazine of Concrete Research, Vol.44, No.158, 1992, pp.31-37.
Mehta, P.K., “Rice husk ash – a unique supplementary cementing material”, Proceedings of the CANMET/ACI International Symposium on Advances in Concrete Technology, V.M. Malhotra, ed., Athens, Greece, 1992, pp.407-430.
Mehta, P.K., “Mineral Admixtures for Concrete – an Overview of Recent Developments”, Advances in Cement and Concrete: Proceedings of an Engineering Foundation Conference, M.W. Grutzeck, and S.L. Sarkar, eds., American Society of Civil Engineers, New York, USA, 1994, pp. 243-256.
319
Mehta, P.K., Method for Producing a Blended Cementitious Composition, United States Patent, No. US 6451104 B2, 2002, 13pp.
Mehta, P.K., and Aïtcin, P.-C., “Microstructural basis for selection of materials and mix proportions for high strength concrete”, Second International Symposium on High Strength Concrete, ACI SP-121, W.T. Hester, ed., American Concrete Institute, Farmington Hills, Michigan, USA, 1990, pp.265-282.
Mehta, P.K., and Folliard, K.J., “Rice husk ash – a unique supplementary cementing material: durability aspects”, Proceedings of the Second CANMET/ACI International Symposium on Advances in Concrete Technology, ACI SP-154, V.M. Malhotra, ed., American Concrete Institute, Farmington Hills, Michigan, USA, 1995, pp.531-541.
Mehta, P.K., and Monteiro, P.J.M., Concrete: Microstructure, Properties, and Materials; Second Edition, McGraw-Hill Companies, Inc., New York, USA, 1993. 548pp.
Mindess, S., Young, J.F., and Darwin, D., Concrete, Second Edition, Prentice Hall, New Jersey, USA, 2003, 644pp.
Monroe, C.F., Personal Communication. Manager of Technical Services, Degussa Master Builders Ltd, Brampton, Ontario, Canada, 2004.
Moranville-Regourd, M., “Microstructure of high performance concrete’, High Performance Concrete, Y. Malier, ed., E & FN Spon, London, UK, 1994, pp.3-13.
Morris, W., Moreno, E.I., and Sagüés, A.A., “Practical evaluation of resistivity of concrete in test cylinders using a Wenner array probe”, Cement and Concrete Research, Vol.26, No.12, 1996, pp.1779-1787.
Murata, J., “Flow and deformation of fresh concrete”, Materials and Structures, Vol.17, No.98, 1984, pp.117-129.
Murata, J., and Kikukawa, H., “Viscosity equation of fresh concrete”, ACI Materials Journal, Vol.89, No.3, 1992, pp.230-237.
Nagai, T, Kojima, T., and Miura, T., “Application of high-strength/superworkable concrete to thin-wall prestressed concrete products”, Magazine of Concrete research, Vol.51, No.3, 1999, pp.153-162.
Nagataki, S., “Mineral admixtures in concrete: state of the art and trends”, Proceedings of V. Mohan Malhotra Symposium on Concrete Technology: Past, Present, and Future, SP-144, P.K. Mehta, ed., American Concrete Institute, Farmington Hills, Michigan, USA, 1994, pp.447-482.
Nagataki, S., and Fujiwara, H., “Self-compacting property of highly flowable concrete”, Proceedings of the Second CANMET/ACI International Symposium on Advances in Concrete Technology, SP-154, V.M. Malhotra, ed., American Concrete Institute, Farmington Hills, Michigan, USA, 1995, pp.301-314.
Naik, T.R., and Malhotra, V.M., “The ultrasonic pulse velocity method”, CRC Handbook on Nondestructive Testing of Concrete, V.M. Malhotra, and N.J. Carino, eds., CRC Press, Florida, USA, 1991.
Nawy, E.G., Fundamentals of High Strength High Performance Concrete, Longman Group Limited, London, UK, 1996. 340pp.
Nehdi, M., El-Chabib, H., and El-Naggar, H., “Cost-effective SCC for deep foundations”, Concrete International, Vol.25, No.3, 2003a, pp.95-103.
Nehdi, M., Duquette, J., and El-Damatty, A., “Performance of rice husk ash produced using a new technology as a mineral admixture in concrete”, Cement and Concrete Research, Vol.33, No.8, 2003b, pp.1203-1210.
320
Nehdi, M., Mindess, S., and Aïtcin, P.-C., “Rheology of high-performance concrete: effect of ultrafine particles”, Cement and Concrete Research, Vol.28, No.5, 1998, pp.687-697.
Nehdi, M., Pardhan, M., Koshowski, S., “Durability of self-consolidating concrete incorporating high-volume replacement composite cements”, Cement and Concrete Research, Vol.34, No.11, 2004, 2103-2112.
Neville, A.M. Properties of Concrete, Fourth and Final Edition, John Wiley & Sons, Inc., New York, USA, 1996, 844pp.
Neville, A.M., and Brooks, J.J., Concrete Technology, Addison-Wesley Longman, Inc., Essex, England, UK, 1999, 438pp.
Níelsson, I., and Wallevik, Ó.H., “Rheological evaluation of some empirical test methods-preliminary results”, Proceedings of the Third International Symposium on Self-compacting Concrete, O. Wallevik, and I. Nielsson, eds., RILEM Publications, Bagneux, France, 2003, pp.59-68.
Noguchi, T., Oh, S.G., and Tomosawa, F., “Rheological approach to passing ability between reinforcing bars of self-compacting concrete”, Proceedings of the First International RILEM Symposium on Self-compacting Concrete, Â. Skarendahl, and Ö. Petersson, ed., RILEM Publications, Bagneux, France, 1999, 12pp.
Nokken, M.R., and Hooton, R.D., “Dependence of rate of absorption on degree of saturation of concrete”, Cement, Concrete, and Aggregates, Vol.24, No.1, 2002, pp.20-24.
Okamura, H., and Ouchi, M., “Self-compacting concrete”, Journal of Advanced Concrete Technology, Vol.1, No.1, 2003, pp.5-15.
Okamura, H., and Ozawa, K., “Self-compactable high-performance concrete in Japan”, Proceedings of the International Workshop on High-Performance Concrete”, ACI SP-159, P. Zia, ed., American Concrete Institute, Farmington Hills, Michigan, USA, 1994, pp.31-44.
Okamura, H., and Ozawa, K., “Mix design for self-compacting concrete”, Concrete Library of JSCE, No.25, 1995, pp.107-120.
Okamura, H., Ozawa, K., and Ouchi, M., “Self-compacting concrete”, Structural Concrete, Vol.1, No.1, 2000, pp.3-17.
Ouchi, M., Nakamura, S., Osterberg, T., Hallberg, S.-E., and Lwin, M., “Applications of self-compacting concrete in Japan, Europe and the United States”, Proceedings of the 3rd PCI/FHWA International Symposium on High Performance Concrete, US Department of Transportation and Federal Highway Transportation (FHWA), Orlando, Florida, USA, 2003, 20pp.
Owens, P.L., “Water and Its Role in Concrete – Part 1 and Part 2”, Durable Concrete, ACI Compilation 24, American Concrete Institute, Farmington Hills, Michigan, USA, 1992, pp.18-38.
Ozyildirim, C., and Lane, D.S., “Evaluation of self-consolidating concrete”, Final Report, VTRC 03-R13, Virginia Transportation Research Council, Virginia, USA, 2003, 15pp.
Palacios, M., and Puertas, F., “Effect of superplasticizer and shrinkage-reducing admixtures on alkali-activated slag pastes and mortars”, Cement and Concrete Research, Vol.35, No.7, 2005, pp.1358-1367.
Parrott, L.J., “Variations of water absorption rate and porosity with depth from an exposed concrete surface: effects of exposure conditions and cement type”, Cement and Concrete Research, Vol.22, No.6, 1992, pp.1077-1088.
321
Perez, N., Romero, H., Hermida, G., and Cuellar, G., “Self-compacting concrete, on the search and finding of an optimized design”, S.P. Shah, J.A. Daczko, and J.N. Lingscheit, eds., Proceedings of the First North American Conference on the Design and Use of Self-consolidating Concrete, Hanley-Wood, LLC, Illinois, USA, 2002, pp.101-107.
Perraton, D., Aïtcin, P.-C., and Carles-Gbergues, A., “Permeability, as seen by the researcher”, High Performance Concrete: From Material to Structure, Y. Malier, ed., E & FN Spon, London, UK, 1994, pp.186-195.
Persson, B., “A comparison between mechanical properties of self-compacting concrete and the corresponding properties of normal concrete”, Cement and Concrete Research, Vol.31, No.2, 2001, pp.193-198.
Petrou, M.F., Harries, K.A., Gadala-Maria, F., and Kolli, V.G., “A unique experimental method for monitoring aggregate settlement in concrete”, Cement and Concrete Research, Vol.30, No.5, 2000, pp.809-816.
Pigeon, M., Plante, P., and Plante, M., “Air-void stability, part I: influence of silica fume and other parameters”, ACI Materials Journal, Vol.86, No.5, 1989, pp.482-490.
Pigeon, M., “Frost resistance, a critical look”, Concrete Technology – Past, Present, and Future: Proceedings of V. Mohan Malhotra Symposium, ACI SP-144, P.K. Mehta, ed., American Concrete Institute, Farmington Hills, Michigan, USA, 1994, pp.141-158.
Price, B., “BP invests heavily in lightweight concrete for North Sea”, Concrete, Vol.28, No.10, 1994, pp.9-13.
Regional Municipality of Waterloo, Tap Water Quality, Data collected through personal communication with P. Clarke, Water Quality Specialist, Region of Waterloo, Ontario, Canada, 2003.
Rixom, R., and Mailvaganam, N., Chemical Admixtures for Concrete, Third Edition, E & FN Spon, London, UK, 1999, 437pp.
Rols, S., Ambroise, J., and Pera, J., “Development of an admixture for self-levelling concrete”, Proceedings of the Fifth CANMET/ACI International Conferences on Superplasticizers and Other Chemical Admixtures, ACI SP 173, V.M. Malhotra, ed., American Concrete Institute, Farmington Hills, Michigan, USA, 1997, pp.493-510.
Roper, H., “Mineral admixtures in cements for general use and special purposes”, Proceedings of the Engineering Foundation Conference on Advances in Cement and Concrete, M.W. Grutzeck, and S.L. Sarkar, eds., American Society of Civil Engineers, New York, USA, 1994, pp.236-242.
Roy, D.M., “High-performance concrete: superior microstructure for long-term durability”, Proceedings of the International Workshop on High-Performance Concrete, ACI SP-159, P. Zia, ed., American Concrete Institute, Farmington Hills, Michigan, USA, 1994, pp.393-408.
Russell, H.G., “ACI defines high-performance concrete”, Concrete International, Vol.21, No.2, 1999, pp.56-57.
Saak, A.W., Jennings, H.M., and Shah, S.P., “New methodology for designing self-compacting concrete”, ACI Materials Journal, Vol.98, No.6, 2001, pp.363-371.
Saak, A.W., Jennings, H.M., and Shah, S.P., “A generalized approach for the determination of yield stress by slump and slump flow”, Cement and Concrete Research, Vol.34, No.3, 2004, pp.363-371.
322
Safawi, M.I., Iwaki, I., and Miura, T., “The segregation tendency in the vibration of high fluidity concrete”, Cement and Concrete Research, Vol.34, No.2, 2004, pp.219-226.
Saucier, F., Pigeon, M., and Plante, M., “Air-void stability, part III: field tests of superplasticized concretes”, ACI Materials Journal, Vol.87, No.1, 1990, pp.3-11.
SCCEPG, The European Guidelines for Self-compacting Concrete: Specification, Production and Use, Self-compacting Concrete European Project Group, The European Federation of Concrete Admixtures Associations, West Midlands, UK, 2005, 63pp.
Schemmel, J.J., Arora, V., and Williams, J., “Split addition of a HRWR and its effect on high-performance concrete”, Proceedings of the Fourth CANMET/ACI International Conference on Superplasticizers and Other Chemical Admixtures in Concrete, ACI SP-148, V.M. Malhotra, ed., American Concrete Institute, Farmington Hills, Michigan, USA, 1994, pp.301-316.
Schrader, E.K., and Munch, A.V., “Deck slab repaired by fibrous concrete overlay”, Journal of the Construction Division: Proceedings of the American Society of Civil Engineers, Vol.102, No.C01, 1976, pp.179-196.
Schutter, G.D., Audenaert, K., Boel, V., Vandewalle, L., Dupont, D., Heirman, G., Vantomme, J., and D’hemricourt, J., “Transport properties in self-compacting concrete and relation with durability: overview of a Belgian research project”, Self-Compacting Concrete: Proceedings of the Third International RILEM Symposium, RILEM Proceedings 33, O. Wallevik, and I. Nielsson, eds., RILEM Publications, Bagneux, France, 2003, pp.799-807.
Schwartzentruber, L.D., Roy, R.L., and Cordin J., “Rheological behaviour of fresh cement pastes formulated from a self-compacting concrete (SCC)”, Cement and Concrete Research, Vol.36, No.7, 2006, pp.1203-1213.
Selvaraj, R., Muralidharan, S., and Srinivasan, S., “The influence of silica fume on the factors affecting the corrosion of reinforcement in concrete – a review”, Structural Concrete, Vol.4, No.1, 2003, pp.19-23.
Seto, K., Yanai, S., Ohno, T., and Yasunaga, M., “Application of high strength and self-compacting concrete for continuous diaphragm walls”, Proceedings of the First International Conference on High Strength Concrete, A. Azizinamini, D. Darwin, and C. French, eds., American Society of Civil Engineers, Virginia, 1997, pp.622-635.
Shah, S.P., Daczko, J.A., and Lingscheit, J.N., eds., Proceedings of the First North American Conference on the Design and Use of Self-Consolidating Concrete, Hanley-Wood, LLC, Illinois, USA, 2002, 426pp.
Shetty, M.S., Concrete Technology: Theory and Practice, S. Chand and Company Ltd., New Delhi, India, 2001, 637pp.
Shilstone, Sr., J.M., “Concrete mixture optimization”, Concrete International, Vol.12, No.6, 1990, pp.33-39.
Shilstone, Sr., J.M., and Shilstone, Jr., J.M., “High performance concrete mixtures for durability”, Proceedings of the Symposium on High Performance Concrete in Severe Environments, ACI SP-140, P. Zia, ed., American Concrete Institute, Farmington Hills, Michigan, USA, 1993, pp.281-306.
Shilstone, Sr., J.M., and Shilstone, Jr., J.M., “Performance-based concrete mixtures and specifications for today”, Concrete International, Vol.24, No.2, 2002, pp.80-83.
323
Shindoh, T., and Matsuoka, Y., “Development of combination-type self-compacting concrete and evaluation test methods", Journal of Advanced Concrete Technology, Vol.1, No.1, 2003, pp.26-36.
Siebel, E., “Air-void characteristics and freezing and thawing resistance of superplasticized air-entrained concrete with high workability”, Proceeding of the Third International Conference on Superplasticizers and Other Chemical Admixtures in Concrete, ACI SP-119, V.M. Malhotra, ed., American Concrete Institute, Farmington Hills, Michigan, USA, 1989, pp.297-319.
Sonebi, M., “Medium strength self-compacting concrete containing fly ash: modelling using factorial experimental plans”, Cement and Concrete Research, Vol.34, No.7, 2004a, pp.1199-1208.
Sonebi, M., “Applications of statistical models in proportioning medium-strength self-consolidating concrete”, ACI Materials Journal, Vol.101, No.5, 2004b, pp.339-346
Struble, L., Szecsy, R., Lei, W.-G., and Sun, G.K., “Rheology of cement paste and concrete”, Cement, Concrete and Aggregates, Vol.20, No.2, 1998, pp.269-277.
Struble, L., and Hawkins, P., “Hydraulic cements – physical properties”, Tests and Properties of Concrete, ASTM STP 169C, American Society for Testing and Materials, Philadelphia, 1994, pp.449-461.
Struble, L., and Sun, G.-K., “Viscosity of portland cement paste as a function of concentration”, Advanced Cement Based Materials, Vol.2, No.2, 1995, pp.62-69.
Su, N., Hsu, K.-C., and Chai, H.-W., “A simple mix design method for self-compacting concrete”, Cement and Concrete Research, Vol.31, No.12, 2001, pp.1799-1807.
Su, J.K., Cho, S.W., Yang, C.C., and Huang, R., “Effect of sand ratio on the elastic modulus of self-compacting concrete”, Journal of Marine Science, Vol.10, No.1, 2002, pp.8-13.
Sugita, S., Yu, Q., Shoya, M., Tsukinaga, Y., and Isojima, Y., “The resistance of rice husk ash concrete to carbonation, acid attack and chloride ion penetration”, Proceedings of the Third CANMET/ACI International Conference on High Performance Concrete: Design and Materials and Recent Advances in Concrete Technology, ACI SP-172, V.M. Malhotra, ed., American Concrete Institute, Farmington Hills, Michigan, USA, 1997, pp.29-43.
Taggart, Jr., J.E., and Siems, D.F., “Major element analysis by wavelength dispersive X-ray fluorescence spectrometry”, Analytical Methods for Chemical Analysis of Geological and Other Materials, J.E. Taggart, Jr., ed., U.S. Geological Survey, Denver, Colorado, USA, 2002, pp.T1-9.
Tanigawa, Y., and Mori, H., “Analytical study on deformation of fresh concrete”, Journal of Engineering Mechanics, Vol.115, No.3, 1989, pp.493-508.
Tanigawa, Y., Mori, H., Kurokawa, Y., and Komura, R., “Rheological study on slumping behaviour of fresh Concrete”, Transactions of the Japan Concrete Institute, Vol.14, 1992, pp.1-8.
Tasi, C.T., Li, S., and Hwang, C.L., “The effect of aggregate gradation on engineering properties of high performance concrete”, Journal of ASTM International, Vol.3, No.3, 2006, pp.1-12.
Taylor, M.R., Lydon, F.D., and Barr, B.I.G., “Mix proportions for high strength concrete”, Construction and Building Materials, Vol.10, No.6, 1996, pp.445-450.
324
Tomas, D.G., “Transport characteristics of suspensions: III. Laminar flow properties of flocculated suspensions”, Journal of American Institute for Chemical Engineers, Vol.7, No.3, 1961, pp.431-437.
Tumidajski, P.J., “Relationship between resistivity, diffusivity and microstructural descriptors for mortars with silica fume”, Cement and Concrete Research, Vol.35, No.7, 2005, pp.1262-1268.
Uomoto, T., and Ozawa, K., “Recommendation for self-compacting concrete”, JSCE Concrete Engineering Series 31, Japan Society of Civil Engineers, Tokyo, Japan, 1999, 77pp.
Vanwalleghem, H., Blontrock, H., and Taerwe, L., “Spalling tests on self-compacting concrete”, Proceedings of the Third International Symposium on Self-compacting Concrete, O. Wallevik, and I. Nielsson, eds., RILEM Publications, Bagneux, France, 2003, pp.855-862.
Vegas, P. “Rice production and marketing”, Sage V Foods, LLC, Los Angeles, California, USA, 2004.
Videla, C., and Gaedicke, C., “Modeling portland blast-furnace slag cement high-performance concrete”, ACI Materials Journal, Vol.101, No.5, 2004, pp.365-375.
Vom Berg, W., “Influence of specific surface and concentration of solids upon the flow behaviour of cement pastes”, Magazine of Concrete Research, Vol.31, No.109, 1979, pp.211-216.
Wallevik, J.E., “Relationship between the Bingham parameters and slump”, Cement and Concrete Research, Vol.36, No.7, 2006, pp.1214-1221.
Wallevik, Ó.H., “Rheology – a scientific approach to develop self-compacting concrete”, Proceedings of the Third International Symposium on Self-compacting Concrete, O. Wallevik, and I. Nielsson, eds., RILEM Publications, Bagneux, France, 2003, pp.23-31.
Wallevik, O., and Nielsson, I., eds., Self-Compacting Concrete: Proceedings of the Third International RILEM Symposium, RILEM Proceedings 33, RILEM Publications, Bagneux, France, 2003, 1028pp.
Watson, N., “Self-compacting concrete: the future of precast cladding”, Concrete, Vol.37, No.2, 2003, pp.40-41.
Westerholm, M., Rheology of the Mortar Phase of Concrete with Crushed Aggregate, Licentiate Thesis, Division of Mineral Processing, Department of Chemical Engineering and Geosciences, Luleå University of Technology, Sweden, 2006, 94pp.
Whiting, D.A., and Nagi, M.A., Manual on Control of Air Content in Concrete, Portland Cement Association, Skokie, Illinois, USA, 1998, 48pp.
Xie, Y., Liu, B., Yin, J., and Zhou, S., “Optimum mix parameters of high-strength self-compacting concrete with ultrapulverized fly ash”, Cement and Concrete Research, Vol.32, No.3, 2002, pp.477-48.
Ye, Y., Bonen, D., and Shah, S.P., “Fresh properties and segregation resistance of self-compacting concrete”, Proceedings of the Second North American Conference and the Fourth International RILEM Symposium on Self-consolidating Concrete, Centre for Advanced Cement-based Materials, Northwestern University, Illinois, USA, 2005, pp.621-627.
Yen, T., Tang, C.-W., Chang, C.-S., and Chen, K.-H., “Flow behaviour of high strength high-performance concrete”, Cement and Concrete Composites, Vol.21, No.5-6, 1999, pp.413-424.
325
Yu, Q., Sawayama, K., Sugita, S., Shoya, M., and Isojima, Y., “The reaction between rice husk ash and Ca(OH)2 solution and the nature of its product”, Cement and Concrete Research, Vol.29, No.1, 1999, pp.37-43.
Zain, M.F.M., Safiuddin, M., and Yusof, K.M., “A study on the physical properties of freshly mixed high performance concrete”, Cement and Concrete Research, Vol.29, No.9, 1999, pp.1427-1432.
Zain, M.F.M., Safiuddin, M., and Yusof, K.M., “Influence of different curing conditions on the strength and durability of high performance concrete”, Proceedings of the Fourth ACI International Conference on Repair, Rehabilitation and Maintenance of Concrete Structures, and Innovations in Design and Construction, ACI SP-193, V.M. Malhotra, ed., American Concrete Institute, Farmington Hills, Michigan, USA, 2000, pp.275-292.
Zhang, M.-H., and Malhotra, V.M., “High-performance concrete incorporating rice husk ash as a supplementary cementing material”, ACI Materials Journal, Vol.93, No.6, 1996, pp.629-636.
Zhang, M.H., Lastra, R., and Malhotra, V.M., “Rice-husk ash paste and concrete: some aspects of hydration and the microstructure of the interfacial zone between the aggregate and paste”, Cement and Concrete Research, Vol.26, No.6, 1996, pp.963-977.
Zhu, W., and Bartos, P.J.M., “Permeation properties of self-compacting concrete”, Cement and Concrete Research, Vol.33, No.6, 2003, pp.921-926.
326