High level of molecular and phenotypic biodiversity in Jatropha curcas from Central America compared...
19
RESEARCH ARTICLE Open Access High level of molecular and phenotypic biodiversity in Jatropha curcas from Central America compared to Africa, Asia and South America Luis Rodolfo Montes Osorio 1,3,4 , Andres Fransisco Torres Salvador 1 , Raymond Elmar Etienne Jongschaap 2 , Cesar Augusto Azurdia Perez 3 , Julio Ernesto Berduo Sandoval 3 , Luisa Miguel Trindade 1 , Richard Gerardus Franciscus Visser 1 and Eibertus Nicolaas van Loo 1* Abstract Background: The main bottleneck to elevate jatropha (Jatropha curcas L.) from a wild species to a profitable biodiesel crop is the low genetic and phenotypic variation found in different regions of the world, hampering efficient plant breeding for productivity traits. In this study, 182 accessions from Asia (91), Africa (35), South America (9) and Central America (47) were evaluated at genetic and phenotypic level to find genetic variation and important traits for oilseed production. Results: Genetic variation was assessed with SSR (Simple Sequence Repeat), TRAP (Target Region Amplification Polymorphism) and AFLP (Amplified fragment length polymorphism) techniques. Phenotypic variation included seed morphological characteristics, seed oil content and fatty acid composition and early growth traits. Jaccard’s similarity and cluster analysis by UPGM (Unweighted Paired Group Method) with arithmetic mean and PCA (Principle Component Analysis) indicated higher variability in Central American accessions compared to Asian, African and South American accessions. Polymorphism Information Content (PIC) values ranged from 0 to 0.65. In the set of Central American accessions. PIC values were higher than in other regions. Accessions from the Central American population contain alleles that were not found in the accessions from other populations. Analysis of Molecular Variance (AMOVA; P < 0.0001) indicated high genetic variation within regions (81.7%) and low variation across regions (18.3%). A high level of genetic variation was found on early growth traits and on components of the relative growth rate (specific leaf area, leaf weight, leaf weight ratio and net assimilation rate) as indicated by significant differences between accessions and by the high heritability values (50–88%). The fatty acid composition of jatropha oil significantly differed (P < 0.05) between regions. Conclusions: The pool of Central American accessions showed very large genetic variation as assessed by DNA-marker variation compared to accessions from other regions. Central American accessions also showed the highest phenotypic variation and should be considered as the most important source for plant breeding. Some variation in early growth traits was found within a group of accessions from Asia and Africa, while these accessions did not differ in a single DNA-marker, possibly indicating epigenetic variation. Keywords: Jatropha curcas, Genetic diversity, Phenotypic variation, AFLP, SSR, TRAP, Fatty acid composition, Heritability, RGR, SLA, NAR * Correspondence: [email protected] 1 Plant Breeding, Wageningen University and Research Centre, PO Box 386, 6700 AJ Wageningen, The Netherlands Full list of author information is available at the end of the article © 2014 Montes Osorio et al.; licensee BioMed Central Ltd. This is an Open Access article distributed under the terms of the Creative Commons Attribution License (http://creativecommons.org/licenses/by/2.0), which permits unrestricted use, distribution, and reproduction in any medium, provided the original work is properly credited. Montes Osorio et al. BMC Plant Biology 2014, 14:77 http://www.biomedcentral.com/1471-2229/14/77
Transcript of High level of molecular and phenotypic biodiversity in Jatropha curcas from Central America compared...

Montes Osorio et al. BMC Plant Biology 2014, 14:77http://www.biomedcentral.com/1471-2229/14/77
RESEARCH ARTICLE Open Access
High level of molecular and phenotypicbiodiversity in Jatropha curcas from CentralAmerica compared to Africa, Asia and SouthAmericaLuis Rodolfo Montes Osorio1,3,4, Andres Fransisco Torres Salvador1, Raymond Elmar Etienne Jongschaap2,Cesar Augusto Azurdia Perez3, Julio Ernesto Berduo Sandoval3, Luisa Miguel Trindade1,Richard Gerardus Franciscus Visser1 and Eibertus Nicolaas van Loo1*
Abstract
Background: The main bottleneck to elevate jatropha (Jatropha curcas L.) from a wild species to a profitablebiodiesel crop is the low genetic and phenotypic variation found in different regions of the world, hamperingefficient plant breeding for productivity traits. In this study, 182 accessions from Asia (91), Africa (35), South America(9) and Central America (47) were evaluated at genetic and phenotypic level to find genetic variation andimportant traits for oilseed production.
Results: Genetic variation was assessed with SSR (Simple Sequence Repeat), TRAP (Target Region AmplificationPolymorphism) and AFLP (Amplified fragment length polymorphism) techniques. Phenotypic variation includedseed morphological characteristics, seed oil content and fatty acid composition and early growth traits. Jaccard’ssimilarity and cluster analysis by UPGM (Unweighted Paired Group Method) with arithmetic mean and PCA(Principle Component Analysis) indicated higher variability in Central American accessions compared to Asian,African and South American accessions. Polymorphism Information Content (PIC) values ranged from 0 to 0.65. Inthe set of Central American accessions. PIC values were higher than in other regions. Accessions from the CentralAmerican population contain alleles that were not found in the accessions from other populations. Analysis ofMolecular Variance (AMOVA; P < 0.0001) indicated high genetic variation within regions (81.7%) and low variationacross regions (18.3%). A high level of genetic variation was found on early growth traits and on components ofthe relative growth rate (specific leaf area, leaf weight, leaf weight ratio and net assimilation rate) as indicated bysignificant differences between accessions and by the high heritability values (50–88%). The fatty acid compositionof jatropha oil significantly differed (P < 0.05) between regions.
Conclusions: The pool of Central American accessions showed very large genetic variation as assessed by DNA-markervariation compared to accessions from other regions. Central American accessions also showed the highest phenotypicvariation and should be considered as the most important source for plant breeding. Some variation in early growthtraits was found within a group of accessions from Asia and Africa, while these accessions did not differ in a singleDNA-marker, possibly indicating epigenetic variation.
Keywords: Jatropha curcas, Genetic diversity, Phenotypic variation, AFLP, SSR, TRAP, Fatty acid composition, Heritability,RGR, SLA, NAR
* Correspondence: [email protected] Breeding, Wageningen University and Research Centre, PO Box 386,6700 AJ Wageningen, The NetherlandsFull list of author information is available at the end of the article
© 2014 Montes Osorio et al.; licensee BioMedCreative Commons Attribution License (http:/distribution, and reproduction in any medium
Central Ltd. This is an Open Access article distributed under the terms of the/creativecommons.org/licenses/by/2.0), which permits unrestricted use,, provided the original work is properly credited.

Montes Osorio et al. BMC Plant Biology 2014, 14:77 Page 2 of 19http://www.biomedcentral.com/1471-2229/14/77
BackgroundVegetable oils are currently used as food, feedstock forthe chemical industry and as liquid biofuels (includingbiodiesel). The demand for vegetable oils for bio-fuelproduction has increased enormously in recent yearsdue to increased costs and instable and finite suppliesof fossil fuels, and the desire to reduce greenhouse gas(GHG) emissions. In addition to traditional oilseedcrops, a number of new species are now being exploredfor the purpose of bio-fuel production. Jatropha (Jatrophacurcas L.) is one of these new species and has receivedmuch attention as a source of renewable oil for the pro-duction of sustainable and affordable biofuels. Despite therecent interest in jatropha, it essentially still is a wild spe-cies that has not benefitted yet from programmes of cropimprovement. The agronomy of the species, now treatedas an agricultural crop, is still poorly understood. Thissudden boom in jatropha has therefore led to an unbal-anced development, with a fast implementation of largeplantations and processing units, while essential questionsaround jatropha crop growth, crop management and pro-duction have not been addressed adequately. Wild jatro-pha accessions were used to setup plantations, often notwell adapted to local environments and local productionsystems. Maladaptation of jatropha accessions to the newuse has often led to inadequate seed and oil yields per hec-tare. The challenge is to develop well adapted, robust, highyielding jatropha varieties for a range of climates andagrosystems, since only high seed and oil per hectarewill guarantee a good profitability and a high GHGemission reduction [1]. Wide genetic variation is re-quired in breeding for major agronomically importanttraits like seed and oil yield, seed and oil composition,flowering behaviour, tree morphology, disease resistanceand the absence of anti-nutritional factors that currentlyblock the use of jatropha seed meal in animal feeding.Plant breeding programs need such genetic variation tobe able to combine positive traits from different parentsto provide the required profitable and sustainable jatro-pha varieties of the future.Jatropha is a perennial tree or shrub that produces
fruits containing seeds rich in oil [2]. It grows in semi-arid tropical and subtropical climates, does not toleratefrost, and flowers only under specific temperature, radi-ation and phenological conditions [3]. The oil and deri-vatives of the oil are very suitable as a bio-fuel [2,4]. Mostsimply, the oil can be used without modification in theform of pure plant or vegetable oil to fuel stationary dieselengines. If the oil is esterified with methanol, the resultingmethyl esters of jatropha oil form bio-diesel, which canreplace or be mixed with fossil oil based diesel.Not much is known about genetic diversity in Jatropha
curcas and this hampers breeding of jatropha towardsvarieties with higher value as energy crop and with
better adaptation to different forms of abiotic and bioticstresses. Before its use as a bio-energy crop, jatrophawas used for medicinal products, and as a live fencearound arable land. Because the plant is toxic, animalsdo not eat the plant. Therefore, a dense jatropha hedgekeeps animals out of arable land and protects arablecrops against animal grazing. The plant was also used toobtain plant oil for the production of soap [5]. For thesetraditional purposes naturally occurring ecotypes wereused. Only recently, the use of jatropha as a bio-energycrop has started on the basis of such existing ecotypeswithout any plant breeding for bio-energy productionrelated traits. With respect to bio-energy production,jatropha still has to be considered an undomesticatedwild species [6].Genetic diversity in Jatropha curcas was found to be
very low in Asian, African and South American (Brazilian)germplasm [7-10]. Tang et al. [9] used a set of six ampli-fied fragment length polymorphism (AFLP) primercombinations that yielded 362 AFLP-markers to analysegenetic variation in Asian J. curcas accessions and foundlow genetic variation in material from China. Also inSouth America, the reported genetic variation is limited[10]. South and Central America have been reported ascentres of biodiversity and possible centres of origin forJ. curcas, since it is believed that jatropha was native inAmerica only. The Portuguese collected jatropha inAmerica and took the plant to Cape Verde, South-Africa,Madagascar, India and finally to Indonesia. It is conceiv-able that only a very low number of genotypes of jatrophawas collected and transferred to Africa and Asia and thatthis is the cause of the low level of genetic variation inAfrica and Asia. If this is true, it is expected that geneticvariation in South and Central America is much higherthan in Asia and Africa. However, only few studies havereported the extent of genetic variation of jatrophagermplasm from all these continents simultaneously[11,12]. Recent studies on genetic diversity have foundhigh genetic variation in material from Chiapas Mexico,which shares a border with Guatemala, indicating highgenetic variation in this region [11,13]. Genetic diversityin this species has mainly been analysed at the molecularmarker level. It is much more interesting to relate relevanttraits for bio-energy production to the molecular variation,but detailed analyses on this are lacking so far.In this study, we analysed the genetic variation in the
collection of the Jatropha curcas Evaluation Programme(JEP, [14]) in order to identify new genetic variation tobe used in breeding programs of jatropha. The JEP col-lection contains 182 accessions from Asia (91), Africa(35), South-America (9) and Central America (47). Theanalysis of genetic variation included analysis of molecu-lar marker variation, variation in seed traits (oil contentand fatty acid composition), and early growth traits.

Table 2 PIC values for the SSR markers between thegeographical regions of Central and South America, Asiaand Africa
No SSR Africa Asia Central America South America
1 Jc01 A 0.09 0.02 0.39 0.15
2 Jc01 B 0.10 0.00 0.19 0.15
3 Jc01 C 0.12 0.02 0.33 0.15
4 Jc03 A 0.00 0.00 0.46 0.00
5 Jc05 A 0.00 0.00 0.42 0.00
6 Jc07 B 0.00 0.08 0.65 0.00
7 Jc08 A 0.00 0.00 0.26 0.00
8 Jc09 A 0.05 0.00 0.63 0.15
9 Jc10 A 0.00 0.00 0.06 0.00
10 Jc10 B 0.00 0.00 0.35 0.00
11 Jc13 A 0.09 0.00 0.56 0.15
12 Jc14 B 0.00 0.08 0.65 0.00
13 Jc17 A 0.37 0.38 0.37 0.37
14 Jc28 A 0.00 0.00 0.54 0.00
Montes Osorio et al. BMC Plant Biology 2014, 14:77 Page 3 of 19http://www.biomedcentral.com/1471-2229/14/77
ResultsMolecular variationUsing a set of SSRs [15,16] in the JEP collection, poly-morphisms for 14 SSRs were found. Using TRAP-PCRwith 13 (single) SSR-primers from non-polymorphic SSRs,6 additional polymorphisms were identified. AFLP analysisof the JEP collection yielded 86 polymorphic bands with 2primer combinations. The polymorphic SSRs, TRAP-primersand AFLP yielded 190 polymorphic DNA-markers amongthe accessions in the JEP collection (Table 1).
Allele frequencies and PIC values in SSR makersUsing the published SSR-primers we found the samefragment lengths as reported in literature. The percent-age of SSRs with polymorphisms was 32% in the set ofaccessions from Africa, 58% for the set from Asia, 79%for the set from South America and 89% for the set ofaccessions from Central America. The mean number ofalleles per polymorphic SSR was for 4.1 for Africa, 2.2for Asia, 2.0 for South America and 3.8 for CentralAmerica. The PIC (Polymorphism Information Content)values from the different SSR markers were higher inthe set of Central American accessions (Table 2).
Genetic structure of JEP collection related to region oforiginThe markers scores of 190 DNA markers were used todetermine the genetic distances between 182 accessionsin the JEP collection using Jaccard’s coefficient andUPGMA clustering analysis. The average Jaccard’s simi-larity coefficient was 0.15 (of all pairwise combinations),indicating high genetic diversity in the JEP collection.Using the genetic distance, a neighbour joining tree wasconstructed that groups genetically similar accessionsand separates genetically dissimilar accessions (Figure 1).A group of 70 accessions, mainly from Asia and Africa,did not show molecular polymorphisms for any of the190 DNA markers for which the other accessions werepolymorphic, which indicates that these accessions aregenetically identical for these DNA markers. The other
Table 1 Summary statistics for SSR, TRAP and AFLPmarkers
Characteristic SSR TRAP AFLP
Number of markers tested for amplification 29 13 20
Number of markers yielding polymorphic patterns 14 6 2
Total number of polymorphisms amplified 73 31 86
Average number of polymorphic bands per marker 5 5
Highest number of polymorphic bands per marker 12 10
Lowest number of polymorphic bands per marker 2 2
Total number of null alleles 2
Total number of exclusive alleles 22
accessions from Asia, Africa and South America showedmore polymorphisms, but are nonetheless highly gene-tically similar to the group of 70 accessions that weregenetically identical. In contrast, a high level of poly-morphism with these DNA markers was found for theaccessions from Central America (Figure 1).Fst-values indicated that the groups of South American
and Asian accessions hardly differ genetically, but amoderate level of genetic difference was found betweenthe groups of Asian and African accessions (Table 3).This is not surprising in view of the large number ofAsian, African and South American accessions withoutany polymorphisms for the DNA markers analysed.Fst-values between Central American accessions andother regions (Asia, Africa and South America) showedlarge to moderate genetic differentiation. AMOVA re-sults were significant (P < 0.0001) and indicated a highpercentage of genetic variation within geographical regions(81.7%) and a much lower extent of genetic variationacross regions (18.3%).PCA on the basis of the DNA-marker data shows
a clear separation between accessions from CentralAmerica and the ones from Africa, Asia and SouthAmerica (Figure 2). The PCA shows four differentclusters. The accessions from Central America are sepa-rated into three highly differentiated clusters (A, B and C).Most of the accessions from Africa, Asia and SouthAmerica occur in one single cluster (D). Cluster Amainly contains accessions from the South and SouthEast regions of Guatemala. Cluster B has a mixture ofaccessions from the northern and southern regions ofGuatemala. Cluster C has mixture of accessions from

Figure 1 UPGMA cluster analysis of 133 J. curcas accessions of the JEP germplasm collection using the Jaccard’s similarity index.Colours indicate the origin of the accessions. Groups A and B were indicated by structure 2.3 (k = 2).
Montes Osorio et al. BMC Plant Biology 2014, 14:77 Page 4 of 19http://www.biomedcentral.com/1471-2229/14/77

Table 3 Genetic distance between groups
Regions A Region B Fst-value Significant
Asia Central America 0.312 ***
South America Central America 0.119 **
Africa Central America 0.103 **
Asia Africa 0.092 *
Africa South America 0.046 (ngd)
Asia South America 0.023 (ngd)***Fst > 0.15 indicates large genetic differentiation.**Fst between 0.10 and 0.15 indicates moderate genetic differentiation.*Fst between 0.05 and 0.10 little genetic differentiation.(ngd) Fst < 0.05 indicates negligible genetic differentiation.Fixation index (Fst) between the geographical regions of Central and SouthAmerica, Asia and Africa.
Montes Osorio et al. BMC Plant Biology 2014, 14:77 Page 5 of 19http://www.biomedcentral.com/1471-2229/14/77
Central America with one South American and oneAfrican accession, and cluster D contains the majorityof accessions from Africa, Asia, South America, and onlyvery few from Central America.The analysis of the population by STRUCTURE 2.3.2
[17] indicated two main populations (k = 2) can be dis-tinguished, which are visualized in the cluster analysisin Figure 1. One group exclusively contains accessionsfrom Central America and the other group contains ac-cessions from Central America, Asia, Africa and SouthAmerica.
Figure 2 PCA scatter plot for J. curcas accessions of the JEP germplas(Central America, Africa and South America accessions), Cluster D (Central
Seed and seedling traitsSeed weight, seed hull and seed oil contentThe average seed weight of the accessions in the JEPcollection ranged from 0.4 to 0.9 g per seed. Seed hullpercentage ranged between 32%. and 52%. The averageoil content in the seed (w/w) of the accessions variedbetween 19 and 40% of the whole seed (seed kernel andseed hull). The average seed oil content of all accessionswas 28% with no significant differences between theregions.
Seed oil fatty acid compositionFatty acid composition of the seed oil showed large vari-ation in the JEP collection. The content of palmitic acid(C16:0) showed significant differences between regions(P < 0.001); accessions from South America showed thehighest percentages (15.4%), followed by accessionsfrom Africa (15.0%), Asia (14.8%) and Central America(13.6%) (Table 4). The content of stearic acid (C18:0)did not show significant differences between regions(P > 0.05). Palmitoleic acid (C16:1) contents were verylow, but the small differences between regions were sta-tistically significant (P < 0.05). Accessions from Asia,Africa and South America showed similar values be-tween 42.0-46.1% of oleic acid content (C18:1), whereasaccessions from Central America showed significantly
m collection. Cluster A and B (Central Amercia accessions), Cluster CAmerica, Asia, Africa and South America accessions).

Table 4 Fatty acid composition between jatrophaaccessions from different regions
A. Fatty acid composition of seed oil (% of total fatty acids)
Fatty acids Asia Africa South America Central America
C16:0* 14.8a 15.0a 15.4a 13.6b
C16:1* 0.7a 0.7a 0.7a 0.6b
C18:0(ns) 8.2 8.0 8.6 8.4
C18:1* 46.1a 42.0a 42.9a 34.5b
C18:2* 30.5a 34.6a 33.1a 43.1b
C18:3(ns) 0.2 0.2 0.2 0.2
* = variation between accessions is statistically significant (p < 0.05).(ns) = no significant differences (p > 0.05). Differences between regionssignificant when denoted with different letters.
B. Coefficient of genetic variation (CVg, standard deviation of setof accessions divided by the mean, as%) of fatty acid contents
Fatty acids Asia Africa South America Central America
C16:0* 4.4 6.7 10.4 4.3
C16:1* 11.1 8.2 14.5 5.6
C18:0(ns) 6.3 18.3 12.6 4.6
C18:1* 9.4 9.4 8.4 17.4
C18:2* 14.0 13.0 9.9 12.9
C18:3(ns) 6.4 4.0 8.4 0
C. Range of fatty acid contents (% of total fatty acids)
Fatty acids Asia Africa South America Central America
C16:0* 12.4-17.5 13.1-16.9 10.5-17.1 11.3-16.6
C16:1* 0.5-1.1 0.6-0.9 0.4-1 0.4-0.9
C18:0(ns) 5.5-11.3 6.1-13.4 5.7-10.3 6.1-10.4
C18:1* 31.0-53.8 34.2-52.1 35.9-49.5 24.1-50.7
C18:2* 22.0-43.3 24-43.3 29.3-40.1 25.2-52
C18:3(ns) 0.1-0.2 0.1-0.3 0.1-0.2 0.1-0.2
* = variation between accessions is statistically significant (p < 0.05).(ns) = no significant differences (p > 0.05). Differences betweenmeans of regions are significant when denoted with different letters(Table 4A).
A. Fatty acid percentage. B. Coefficient of variation of the fatty acid betweenregions. C. Fatty acids range (Maximum and Minimum values) in different regions.
Montes Osorio et al. BMC Plant Biology 2014, 14:77 Page 6 of 19http://www.biomedcentral.com/1471-2229/14/77
lower C18:1 content (only 34.5%). The linoleic acidcontent (C18:2) of accessions from Central Americawas significantly higher (43.1% on average) than thatof accessions from Asia, Africa and South America(30.5%, 34.6% and 33.1% respectively). α-Linolenic acid(C18:3) levels were very low (0.2%) for all regions(Table 4). The ranges of fatty acid contents of C18:1and C18:2 were high in all regions (for the whole col-lection ranging from 24.1 to 53.8% for C18:1 and 22.0to 52% for C18:2, Table 4C), but these ranges werehighest for Central America. This is also reflected inthe higher coefficients of genetic variation (CVg%) inCentral America than in the other regions for C18:1and C18:2. The sum of C18:1 and C18:2 was ratherconstant at about 78%.
Seedling growth and morphologySignificant and large genetic variation was found be-tween accessions in the JEP collection for almost allof the observed early growth and morphology traits(Table 5). A fast early growth is very beneficial as it isone of the factors positively influencing the yield ofseed and oil in the first year of establishment. A posi-tive correlation (r > 0.83) was found between all bio-mass variables (root, stem, leaf, petiole and total plantdry weight) and plant height, first leaf length andwidth and total leaf area and absolute growth rate.The broad sense heritability (h2) of most traits washigh (50–90%), except for cotyledon number and peti-ole weight (Table 5). Table 6 shows the variability forphenotypic traits between the regions in the JEP col-lection. Central American accessions, on average, hadthe highest total growth rates (indicated by the higherdry weights 59 DAG). Also, for most traits, the coeffi-cient of genetic variation was highest in the set ofCentral American accessions. Especially for total leafarea and for root and petiole dry weight, but not fortotal above ground dry weight for which the coeffi-cient of genetic variation was not highest in CentralAmerica.
Relative growth rate (RGR) and its componentsRGR ranged from 0.040-0.060 d−1 between accessions(F-test significant at p < 0.01). RGR averages per countryranged from 0.045-0.057 d−1 (Figure 3). No significantdifferences in the average RGR between the 4 regions(Asia, Africa, South America and Central America) wereobserved (P > 0.05) (Table 7). Significant differences werefound for specific leaf area (SLA) and ranged from 220to 416 cm2 g−1 (P < 0.001). Leaf weight ratio (LWR) alsoshowed significant differences (P < 0.001) and ranged from34% to 55% among all individual accessions (Table 7).Variation between accessions for net assimilation rate(NAR; g m−2 d−1) correlated highly with variation in RGR(r = 0.83) and in RUE (r = 0.95).
Relating phenotypic variation in early growth traits tomolecular variationPopulation analysis based on phenotypic variation in earlygrowth traits showed significant variation between acces-sions from the different regions. A dendrogram basedon Euclidean distances showed four different groups(Figure 4). The largest group B contains the majority ofaccessions from Asia and Africa, all accessions from SouthAmerica and few accessions from Central America. GroupA and D are composed by few accessions from Asia, Africaand Central America and group C only contains accessionsfrom Central America.A Mantel-test between the molecular marker and the
phenotypic early growth trait similarity matrices showed

Table 5 Phenotypic variation in J. curcas among accessions
Trait Mean Min. Max. SDg CVg% h2 (%)
Average seed weight (g seed−1) 0.66 0.44 0.89 0.089 13 n.d.
Cotyledon number (#) 2.02 2 3 0.009 0.4 1.4
Days to cotyledon emergence (d) 18.2 14.5 28.0 2.1 12 88.3
Days to germination (d) 14.8 11.0 22.0 1.7 12 74.8
Plant height (cm) 21.3 7.5 33.4 3.5 17 85.7
Leaf number (#) 12.0 7.0 17 0.8 7 48.0
Phyllochron in days per leaf (d) 5.1 2.7 8.3 0.44 9 64.3
First-leaf length (cm) 12.6 7.2 20.3 1.6 13 81.9
First-leaf width (cm) 11.9 7.2 19.8 1.9 16 83.4
Leaf area average (cm2 leaf−1) 173 112 327 35 20 87.8
Root dry weight (g plant−1) 1.3 0.4 2.5 0.29 23 70.0
Petiole dry weight (g plant−1 ) ns 1.9 0.8 3.0 0.20 10 39.2
Stem dry weight (g plant−1) 6.6 2.2 12.5 1.39 21 71.2
Leaf dry weight (g plant−1) 6.4 3.2 10.4 0.87 14 59.2
Total plant dry weight (g plant−1) 16.1 7.5 27.6 2.7 17 66.4
Total leaf area (cm2 plant−1) 2044 1044 3158 303 15 75.5
Absolute growth rate (g d−1) 0.27 0.13 0.47 0.046 17 67.5
Relative Growth Rate, RGR (d−1) 0.053 0.040 0.060 0.002 4 47.4
Leaf Weight Ratio, LWR (%) 40.1 34 55 2.0 5 62.8
Specific Leaf Area, SLA (cm2 g−1) 324 220 416 22 7 64.7
Net Assimilation Rate, NAR (g m2 d−1) 4.2 2.4 5.9 0.4 9 48.4
Radiation use efficiency (g MJint−1) 5.0 2.4 8.0 0.67 13 57.3
Shoot/root ratio (−) 12.5 8.0 24.4 1.8 14 73.7
Leaves/stem ratio (−) 1.3 1.0 2.4 0.14 11 69.6
Petiole/leaf weight ratio (−) 0.30 0.16 0.38 0.031 10 78.8
No significant difference between accessions for petiole dry weights (ns).RGR, RUE and NAR differences statistically significant at p < 0.05.Difference for all other traits statistically significant at p < 0.01.Note: RGR = LWR*SLA*NAR (when SLA in m2 g−1 and NAR in g m2 d−1 and LWR expressed as a fraction).Means over all accessions, minimum, maximum values of accession means, genetic standard deviation (SDg) and genetic coefficient of variation (CVg% = 100*SDg/mean), broad sense heritability (h2, for family means based on three plants per family).
Montes Osorio et al. BMC Plant Biology 2014, 14:77 Page 7 of 19http://www.biomedcentral.com/1471-2229/14/77
a low but significant (P < 0.05) correlation between thegenetic and phenotypic similarity matrices indicatingthat the genetic structure of the JEP collection (based onmolecular markers) is reflected also in the phenotypicvariation (r = 0.27).
DiscussionThis is the first published comprehensive study of Jatro-pha curcas biodiversity among a world wide collectionof accessions that assesses both molecular genetic vari-ation nd variation in phenotypic traits. Large phenotypicvariation between jatropha accessions in the world-wideJEP collection was observed in plant characteristics likeearly growth traits, flowering type, tree architecture andleaf shape and size. Most phenotypic variation was found
among accessions from Central America (Figure 5). Itwas at first unknown whether this variation was onlydue to environmental variation or due to genetic factors.The DNA marker analysis showed that the large pheno-
typic variation in the JEP collection is accompanied by alarge genetic variation at the genome level. In previousstudies in which some of the SSRs used here were devel-oped, no SSR polymorphisms could be found in the(Asian) jatropha accessions [15,16]. In our study we find ahigh degrees of polymorphism for the same SSRs in thetotal JEP collection. PIC values (indicating the level ofallelic variation per SSR) were higher in the set of ac-cessions from Central America than in sets from otherregions. The low PIC values for Asia found here, wherethe PIC-values were even 0 for some markers, confirm thelow level of genetic variation in accessions from Asia

Figure 3 Variation in relative growth rate (RGR, d-1) between J. curcas accessions from different countries. Horizontal dash: Asian origin;no fill: African origin; tilted dash: South American origin; grey: Central American origin.
Table 6 Phenotypic and genotypic variability among accessions across geographical regions
Asia Africa South America Central America
Trait Mean CVg Mean CVg Mean CVg Mean CVg
Germination time (d) 14.9 10.7 14.0 12.9 14.2 9.5 13.8 12.0
Cotyledon emergence date (d) 18.4 10.9 17.5 11.4 17.9 7.4 17.1 10.7
First-leaf length (cm) 12.0 7.8 12.2 5.8 13.1 7.1 14.6 14.3
First-leaf width (cm) 11.0 7.6 11.8 6.0 12.1 7.4 14.6 15.0
Plant height (cm) 20.1 12.1 20 15.6 22.1 8.5 24.9 14.1
Leaf number (# plant−1) 12.1 7.7 11.9 7.4 12.8 10.0 11.8 6.2
Root dry weight (g plant−1) 1.2 18.4 1.1 19.9 1.4 24.8 1.6 16.0
Petiole dry weight (g plant−1) 1.9 9.7 1.9 8.3 2.2 14.3 2.0 16.8
Stem dry weight (g plant−1) 6.1 14.6 6.0 19.6 7.3 16.4 8.0 14.5
Leaf dry weight (g plant−1) 6.0 4.1 5.8 10.6 6.8 11.0 7.5 9.3
Total dry weight (g plant−1) 15.1 11.0 14.5 14.6 17.4 14.8 19.1 11.7
Total leaf area (cm2 plant−1) 1874 6.9 1933 5.6 2139 0.0 2525 10.9
CVg is the coefficient of genetic variation (SDg/mean). Plant height and plant weights were determined 59 days after germination.
Montes Osorio et al. BMC Plant Biology 2014, 14:77 Page 8 of 19http://www.biomedcentral.com/1471-2229/14/77

Table 7 Genetic variation between accession of J. curcas from different countries and regions
Country Region Seed weight (g) RGR (d−1) SLA (cm2 g−1) LWR (%) NAR (g m−2 d−1)
Thailand Asia 0.57 0.049 275 46.0 3.9
Laos Asia 0.59 0.051 344 44.3 3.5
Philippines Asia 0.78 0.052 281 39.3 4.9
India Asia 0.63 0.052 321 40.1 4.2
Nepal Asia 0.64 0.054 315 36.1 4.8
Mali Africa 0.59 0.046a 345 45.4 3.0
Ethiopia Africa 0.63 0.051 354 40.6 3.7
Rwanda Africa 0.48 0.052 366 44.7 3.2
Central African Republic Africa 0.64 0.053 350 39.6 3.8
Madagascar Africa 0.76 0.053 291 36.8 5.0
Cameroon Africa 0.60 0.054 349 38.6 4.2
Burkina Faso Africa 0.57 0.054 289 43.6 4.4
Cape Verde Africa 0.71 0.056 297 42.1 4.5
Namibia Africa 0.53 0.057b 320 39.1 4.6
Mozambique Africa 0.64 0.057b 285 37.1 5.4
Peru S-America 0.74 0.052 313 38.9 4.4
Venezuela S-America 0.70 0.053 339 40.9 3.8
El Salvador C-America 0.74 0.045a 381 43.5 3.3
Belize C-America 0.74 0.049 331 41.3 3.6
Mexico C-America 0.75 0.053 331 42.9 3.7
Guatemala C-America 0.76 0.054 343 39.9 4.4
Nicaragua C-America 0.79 0.055 340 39.3 4.1
Panama C-America 0.57 0.055 326 44.5 3.9
LSD Countries (p = 0.05) 0.10* 0.007ns 60* 5.9* 1.3*
LSD Regions (p = 0.05) 0.02* 0.001ns 16* 1.6ns 0.4ns
* = statistically significant at p < 0.05.ns = non-significant, p > 0.05; RGR differences between the top two countries (b) and bottom two countries (a) are significant in pairwise comparisons, althoughthe overall analysis of variance shows no significant differences between countries.RGR is the relative growth rate. SLA is the specific leaf area. LWR is the leaf weight ratio as percentage of total plant weight and NAR is the calculated netassimilation rate. For each region, the countries are sorted according to increasing RGR.
Montes Osorio et al. BMC Plant Biology 2014, 14:77 Page 9 of 19http://www.biomedcentral.com/1471-2229/14/77
previously found by others (Table 2). This was consistentwith the fact that 70 accessions from Asia and Africa didnot show any polymorphism for the markers evaluated.Cluster analysis by UPGMA (Figure 1) and PCA (Figure 2)
demonstrated that accessions from Asia, Africa and SouthAmerica were genetically highly similar, and cluster to-gether in both analyses. Still, AMOVA and Fst-valuesindicated that variation is present within accessionsfrom all four regions, but is highest in the set of CentralAmerican accessions. Central American accessions didnot show a clear geographical distribution in the differ-ent cluster analyses (Figure 1), which indicates that theCentral American accessions do not form isolated popula-tions, but can be regarded as a large inter-mating popula-tion in which a high level of genetic variation has beenmaintained. PCA analysis, however, showed four groups:one cluster of mainly Asian, Africa and South-Americanaccessions and three clusters of Guatemalan accessions.
These three Guatemalan clusters show three distinctgenetic groups; one with partial geographical separation,but two groups contain accessions from geographicalregions in Guatemala that are widely apart. This showsthat different genetically distinct types of jatropha occur,but that the genetic distinction does not follow a strictgeographical separation in Guatemala. The absence ofa clear geographical separation between distinct typesmight be due to migration of farmers within Guatemala.Farmers, using jatropha as a hedge for cattle, took alongjatropha cuttings and seeds when migrating to newareas [18].Not only do accessions differ in their genetic consti-
tution, but also show wide variation in phenotypictraits like seed hull, oil concentration and fatty acidcomposition. Interestingly, in the group of accessionsfrom Asia and Africa that did not show differences atthe genetic level - as inferred from the total absence of

Figure 4 UPGMA dendrogram of morphology traits of J. curcas accessions of the JEP germplasm collection. Group A (Asia and Africaaccession), Group B (Asia, Africa and South America accession), Group C (Central America accessions) and Group D (Asia and Africa accessions).
Montes Osorio et al. BMC Plant Biology 2014, 14:77 Page 10 of 19http://www.biomedcentral.com/1471-2229/14/77
polymorphisms in DNA-markers - still variation inearly growth traits and morphological traits was found.Apparent genetic differences between accessions thatdo not differ in DNA-marker profile have been re-ported in other studies from Asia for in traits like seedweight and seed oil content [19-21], The seeds of thedifferent accessions were produced in the country oforigin of the accessions and therefore environmentaldifferences within and between the countries of originmay also have caused the differences [22]. Fatty acidcomposition also varied between accessions, especiallywith respect to the ratio of C18:1 to C18:2. The con-tent of saturated fatty acid (SFA) and unsaturated fattyacid (UFA) in the seed oil did not differ much betweenthe regions (ranging from 22.0% to 24.0% for SFA andfrom 77.5% to 78.4% for UFA). This high content ofUFA was also observed in other studies, for example inaccessions from Mexico with UFA percentages between74–83% [23]. The relatively low SFA is an advantage ofjatropha oil compared to palm oil as it gives a lowercloud point when making biodiesel from the oil. A toohigh UFA content can increase the oxidative instabilityof biodiesel and for that reason it is important to breedvarieties with a higher C18:1 content as this has theadvantage of giving a lower cloud point – enabling useof the biodiesel in colder areas of the world – and ahigher oxidative stability compared to oil with highlyunsaturated fatty acids [24,25]. The concentration ofSFA and UFA (and the ratio of C18:1 to C18:2) are not
only controlled by genetic factors, but also by environ-mental conditions such (e.g. temperature) and post-har-vest process conditions affect the fatty acid composition.In jatropha, altitude can affect fatty composition througheffects of temperature [23]. In soybean, genetic differ-ences in the effect of temperature on fatty acid profileshave been reported [26], indicating that it may be im-portant in jatropha to test genotypes in environmentswith different temperatures in order to select genotypeswith a stable, desired fatty acid composition acrossenvironments.Early growth evaluation under greenhouse condition
showed phenotypic variation and high heritability valuesfor almost all the seedling traits (50–90%). This indicatesa high level of genetic variation in the variation of thesetraits. Surprisingly, the large group of Asian and Africanaccessions with no or only few polymorphisms in DNA-markers, also showed a considerable variation in earlygrowth traits. This phenomenon of highly variable growthtraits is also observed in many jatropha field experimentsand commercial plantations, even when seed from a singlegenetic source was used. A possible explanation forsuch phenotypic variation among accessions that do notshow differences in DNA-markers might lie in epigeneticvariation, for example through differences in DNA-methylation that do not lead to differences in the nucleo-tide sequence of the DNA, but can lead to differences inexpression of the methylated genes. Such epigenetic vari-ation has been reported in jatropha [27,28].

AA B C
D E F
G H I
J K L
M N OFigure 5 (See legend on next page.)
Montes Osorio et al. BMC Plant Biology 2014, 14:77 Page 11 of 19http://www.biomedcentral.com/1471-2229/14/77

(See figure on previous page.)Figure 5 Phenotypic variation in the JEP collection. Variation in the number of fruit (A and B). Male flower plant (C). Female flower plant -type1- (D). Female flower plant -type 2- (E). Bracteole inflorescence (F). Different leave shapes (G, H, I, J and K). Leaves size variation (L). Different canopytypes observed in jatropha (M, N and O).
Montes Osorio et al. BMC Plant Biology 2014, 14:77 Page 12 of 19http://www.biomedcentral.com/1471-2229/14/77
Although variation for early growth traits in the gene-tically uniform Asian accessions was found, the variationfor the early growth traits was much higher in the groupof Central American accessions (Table 6). The group ofCentral American accessions not only had the highestlevel of genetic variation for the traits compared to othergroups, but also showed significantly higher early growthrates, resulting in higher total leaf areas, dry weights,and plant heights. These traits that lead to larger andstronger plants are important for surviving the firststages in the field after transplanting, especially underdry conditions (low precipitation <1,000 mm/year), andfor taking advantage of short precipitation periods.Specific Leaf Area values (SLA) ranged from 220 to
416 cm2 g−1 and Leaf Weight Ratio (LWR) from 34 to55% among all individual accessions. These ranges aresmaller if average values per country are calculated(Table 7). The range among accessions of the calculatedNet Assimilation Rate (NAR) was large: 2.4-5.9 g m2 d−1
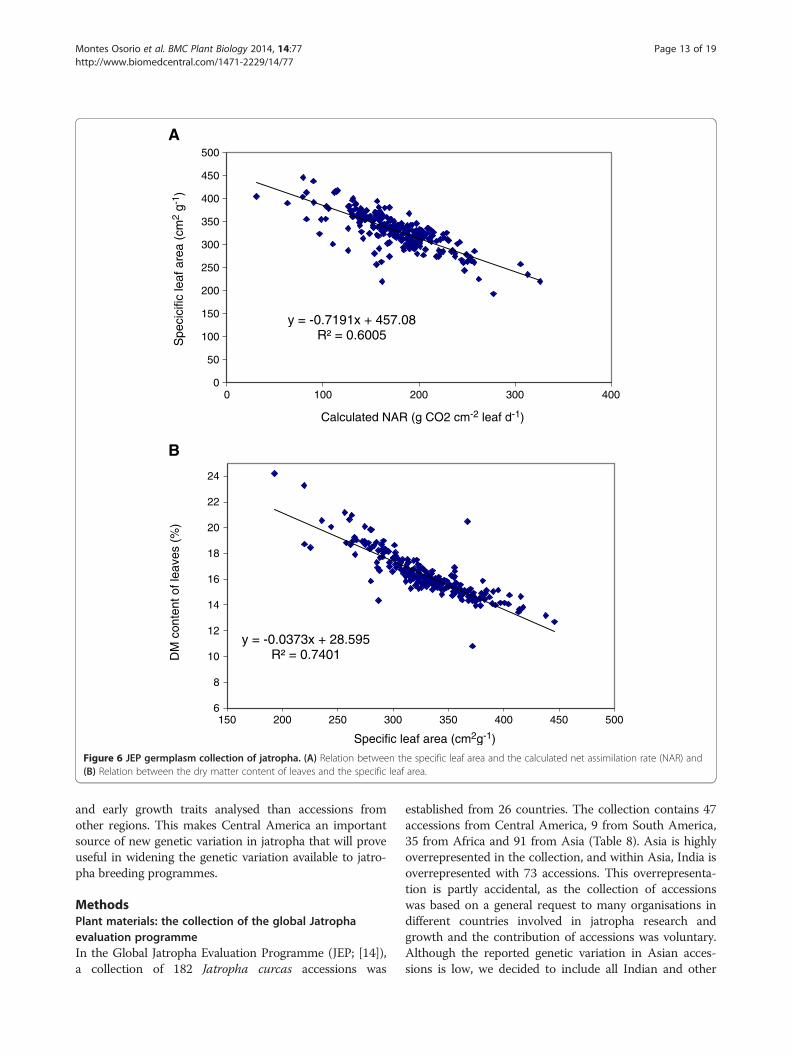
(Table 5). NAR was highly positively correlated with theRelative Growth Rate (RGR). SLA and LWR were nega-tively correlated to RGR and NAR. Differences in SLAexplained 19% and differences in LWR explained 40% ofthe variation in RGR. A highly negative correlation be-tween SLA and NAR was found (r = −0.82). A negativecorrelation between NAR and SLA has also been re-ported in other plant species [29,30]. A high SLA im-plies a thinner leaf and a lower density of nitrogen andchlorophyll per area of leaf. Therefore, the photosyn-thetic capacity per leaf area for plants with low SLA isusually lower than for plants with a higher SLA. Thecalculated NAR reflects such differences in photosyntheticcapacity to assimilate CO2. A high NAR is beneficial, as ahigher photosynthesis rate is the basis for a higher growthrate at the same light interception fraction. A high SLAcan also be beneficial in situations with lower light levels,for instance in intercropping systems where different spe-cies are combined and competition for light may bepresent. A plant with a high SLA (thin leaves) may expandits leaf area at a higher rate than a plant with a lower SLA,as it needs less dry matter to produce the same amount ofleaf area, leading to a higher light interception capacity.This study shows that in J. curcas genetic variation occursin both SLA and NAR, but also shows the trade-off be-tween the two, as expressed in RGR (See Eq. 2).SLA proved to be highly negatively correlated with dry
matter content of leaves (Figure 6). This relation is not fullyunexpected. The amount of leaf area per amount of leaf dry
matter reflects two aspects of leaf morphology: the thick-ness of the leaf and the density of the leaf. The density ofthe leaf is the amount of dry matter per volume of leaf. Atthe same density, leaf thickness and SLA will show a strictlypositive and linear relation. At the same thickness, densityand SLA will be positively related. One cause of variationin density is variation in the water content of the leaf.Clearly the density of dry matter increases when the drymatter content of the leaf increases. Apparently, such vari-ation in density is present in the studied set of accessionsunder greenhouse conditions, and this variation in densitycaused associated changes in SLA. A high level of geneticvariation was found for RGR and its components SLA,LWR and NAR in the JEP collection. In order to interpretthe impact of an increase in RGR by plant breeding better,it will help to realise that an increase of only 10% in RGRcan result in a difference of 20% in absolute dry matter ac-cumulation in 60 days. Such improvements in early growthwould be large enough to justify selection for early growthin breeding programs of Jatropha curcas.Our results clearly indicate that outside Central America
(including Mexico) there is no significant genetic variation inJatropha curcas. This is supported by similar results fromChiapas Mexico (sharing a border with Guatemala), wherehigh genetic variation was found in Jatropha curcas [23].In other studies with accessions from Asia, Africa andSouth America, low to moderate variation was found[8,10,15,16,31]. These results also support the hypothesis thatjatropha was probably distributed by Portuguese seafarersfrom Central America, through the Caribbean via The CapeVerde Islands to other countries in Africa and to Asia [5].
ConclusionsIn this study we found a high level of genetic variation inJatropha curcas both in terms of DNA-marker polymor-phisms and in phenotypic traits. The analysis of geneticvariation in the JEP collection showed that variation injatropha is concentrated in Central American accessions.The results obtained from the JEP collection also showedthat accessions from Asia and Africa without genetic vari-ation for the markers evaluated in this study still showphenotypic variation. Possibly, the phenotypic variation isassociated with genomic areas not covered by the DNA-markers used in this study, but it is very likely that epigen-etic variation exists in the genetically uniform Asian andAfrican accessions that causes part of the phenotypic vari-ation. Central American accessions always showed a muchhigher genetic and phenotypic variation for the seed traits
A
B
y = -0.7191x + 457.08R² = 0.6005
0
50
100
150
200
250
300
350
400
450
500
0 100 200 300 400
Spe
cici
fic le
af a
rea
(cm
2 g-
1 )
Calculated NAR (g CO2 cm-2 leaf d-1)
y = -0.0373x + 28.595R² = 0.7401
6
8
10
12
14
16
18
20
22
24
150 200 250 300 350 400 450 500
DM
con
tent
of l
eave
s (%
)
Specific leaf area (cm2g-1)
Figure 6 JEP germplasm collection of jatropha. (A) Relation between the specific leaf area and the calculated net assimilation rate (NAR) and(B) Relation between the dry matter content of leaves and the specific leaf area.
Montes Osorio et al. BMC Plant Biology 2014, 14:77 Page 13 of 19http://www.biomedcentral.com/1471-2229/14/77
and early growth traits analysed than accessions fromother regions. This makes Central America an importantsource of new genetic variation in jatropha that will proveuseful in widening the genetic variation available to jatro-pha breeding programmes.
MethodsPlant materials: the collection of the global Jatrophaevaluation programmeIn the Global Jatropha Evaluation Programme (JEP; [14]),a collection of 182 Jatropha curcas accessions was
established from 26 countries. The collection contains 47accessions from Central America, 9 from South America,35 from Africa and 91 from Asia (Table 8). Asia is highlyoverrepresented in the collection, and within Asia, India isoverrepresented with 73 accessions. This overrepresenta-tion is partly accidental, as the collection of accessionswas based on a general request to many organisations indifferent countries involved in jatropha research andgrowth and the contribution of accessions was voluntary.Although the reported genetic variation in Asian acces-sions is low, we decided to include all Indian and other

Montes Osorio et al. BMC Plant Biology 2014, 14:77 Page 14 of 19http://www.biomedcentral.com/1471-2229/14/77
Asian accessions in this study to increase the probabilityof finding genetic variation.
Analysis of molecular genetic variationDNA isolationSeed samples from all 182 accessions of the JEP germ-plasm collection were germinated and grown in order toobtain fresh plant material for DNA isolation, under thefollowing greenhouse conditions:Tmin. 20°C; Tmax 25°C;relative humidity between 50–80%; photosyntheticallyactive radiation (PAR) 3 MJ m−2 d−1 ( about 35 W m−2).For all germinated accessions, a young leaf sample ofapproximately 2 cm2 was ground in 800 μL of preheated(65°C) extraction buffer [32]. The 182 samples of homoge-nized ground samples were incubated at 65°C for 1.5 h,and stirred every 15 min. Samples were then treated with10 μL RNAse [20 mg/mL, Invitrogen (Carlsbad, California)]and incubated at 37°C for 30 min. Subsequently, 1 mL
Table 8 Regions and countries of origin of jatrophaaccessions collected for the Global Jatropha EvaluationProgramme (JEP)
Country Number of accessions Region
India 73 Asia
Indonesia 1 Asia
Laos 7 Asia
Nepal 4 Asia
Philippines 5 Asia
Thailand 1 Asia
Burkina Faso 3 Africa
Cabo Verde 1 Africa
Cameroon 3 Africa
Central African Republic 2 Africa
Ethiopia 9 Africa
Gambia 1 Africa
Madagascar 1 Africa
Mali 3 Africa
Mozambique 3 Africa
Namibia 5 Africa
Rwanda 4 Africa
Peru 7 South America
Venezuela 2 South America
Belize 2 Central America
El Salvador 1 Central America
Guatemala 39 Central America
Honduras 1 Central America
Mexico 1 Central America
Nicaragua 2 Central America
Panama 1 Central America
of chloroform-isoamyl solution was added to eachsample and centrifuged for 5 min at 14,000 rpm inorder to separate an aqueous and solid phase. Theaqueous phase was then transferred into a new tube, andtotal genomic DNA was recovered from this supernatantby using the “Mini-Spin Columns” and DNA purificationprotocol of the DNeasy Plant Mini-Kit (QIAGEN, Valencia,California). DNA concentrations were measured usingthe Nanodrop ND-1000 Spectrophotometer (ISOGENLife-science, Maarssen, Netherlands), and all sampleswere finally diluted to a concentration of 20 ng/mL ofDNA.
Simple sequence repeat markersTwenty-nine jatropha-specific simple sequence repeat(SSR) markers [15,16] were tested for amplification qua-lity and polymorphic content on six different accessionsof the JEP collection. Only polymorphic SSR from thisevaluation were used in the complete JEP collection. SSRmarkers were amplified in a 10 μL polymerase chain re-action (PCR) reaction containing 30 ng of DNA tem-plate, 50 mM KCl, 20 mM Tris–HCl (pH 8.4), 1.5 mMMgCl2, 0.20 nM Primer Mix (Forward and Reverse),0.20 mM dNTPs, and 1.5 U SuperTaq® Polymerase. For allSSR primer pair combinations, the reverse primer was la-belled with near-infrared fluorescence (IRDye 700). Thelabelled products were separated by electrophoresis on 6%(g/mL) denaturing polyacrylamide gels using a Li-CORIR2 DNA Analyzer (Li-COR, Lincoln, New England). SSRmarkers that were not polymorphic were used in thetarget region amplification polymorphism marker sys-tem (TRAP). Bands scoring was performed visually byevaluating only the strongest bands as alleles, sincelighter or blurry bands could be stutter bands, a by-product of DNA Taq polymerase slippage. All bandswere scored as presence/absence dominant markers,and a binary raw-data matrix was generated for all gelbanding patterns, in which a positive allele (presenceof a band) was encoded as 1 and a negative allele as 0(absence of a band), The molecular size of the bandswas determined to enable comparison to the molecularsizes of the SSR fragments reported previously.
TRAP markersThe non-polymorphic SSR primers were used in the tar-get region amplification polymorphism (TRAP) system[33]. These SSR were combined in a PCR reaction with an“arbitrary primer” which has a random sequence with ei-ther an adenine-thymine or guanine-cytosine (AT- or GC)rich core. This gives it an affinity to gene intron and exonsequences [33]. The main goal of the technique is to ge-nerate a large number of markers and polymorphismsaround target loci that are monomorphic [33]. In thisstudy, the TRAP technique was used to produce a large

Montes Osorio et al. BMC Plant Biology 2014, 14:77 Page 15 of 19http://www.biomedcentral.com/1471-2229/14/77
number of polymorphic markers around SSR loci yieldingstable monomorphic patterns. Unlabelled forward primersfor all selected SSR sequences were used as fixed primers.The arbitrary reverse primers were obtained from thework of Faris et al. [34]. Since Li-COR DNA sequencerscan simultaneously detect two fluorescent signals (at 700and 800 nm), TRAP-based PCR reactions were run usingtwo arbitrary primers with different fluorescent labels. ThePCR reactions were carried out in a 10-μl volume contain-ing 60 ng genomic, 50 mM KCl, 20 mM Tris–HCl(pH 8.4), 2.5 mM MgCl2, 0.1 mg/mL BSA (New EnglandBiolabs, Ipswich, Massachusetts), 0.50 nM Fixed Primer,0.20 nM Arbitrary Primer 1 (IRD-700), 0.20 nM ArbitraryPrimer 2 (IRD-800), 0.20 mM dNTPs, and 1.0 U Goldstar®Taq Polymerase (Eurogentec, Seraing, Belgium). The PCRwas performed by an initialcycle of denaturing the ge-nomic DNA at 95°C for 2 min, followed by a cycle of 95°Cfor 45 s, 35°C for 45 s, and 72°C for 1 min, 30 cycles of95°C for 45 s, 50°C for 45 s, and 72°C for 1 min, and a finalextension period at 72°C for 7 min. All amplifications wereperformed on a Veriti 96 Well Thermo Cycler (AppliedBiosystems) and amplified products were electrophoresedon 6% polyacrylamide gels using a Li-COR IR2 DNAsequencer (Li-COR). Band patterns were scored as pres-ence/absence dominant markers with aid of the Quan-tar Pro band analyser software (Keygene, Wageningen,Netherlands), and independent replicates were performedfor several TRAP-marker combinations in order to verifyand validate band-scoring results.
AFLP makersAFLP was carried out as described by Vos et al. [35].Genomic DNA (250 ng) was restricted with enzymesEcoR1 and Msel at 37°C for 2 hours and the digested ali-quot was ligated to EcoRi and MseI specific adapters at20°C for 2 h (AFLP® Core Reagent Kit, USA). The ligatedDNA was preamplified using EcoRI and MseI with oneselective nucleotide at the 3′ end primer each. The pre-amplified product was diluted 1:20 with sterile tris- eth-ylenediaminetetraacetic (TE) buffer. The diluted productwas amplified with selective primers for the EcoRI andMseI adapters withthree selective nucleotides at the3′ end. PCR was performed using 65°C for the firstcycle and subsequently for 11 cycles; the annealingtemperature was successively reduced by 0.7°C. Thiswas followed by 23 cycles at an annealing temperatureof 56°C. All amplifications were performed on a PTC-200 96 Well Thermo Cycler (MJ Research-Bio-Rad).Before loading the PCR products into the electrophor-esis gel an equal amount of formamide dye was added.PCR products with formamide dye were subjected toelectrophoretic separation on 6% denaturing polyacryl-amide gel in 1X tris-boric acid- ethylenediaminetetraacetic(TBE) buffer in a sequencing gel system (Bio-Rad
Sequi-Gen GT Sequencing Cell). The gels were stainedwith silver nitrate using a silver staining kit (Sigma, USA).Evaluation of each primer combination of EcoRI and MseIwas done two times with three samples (two from CentralAmerica and one from Asia) to select the polymorphicand reproducible primer combinations for the completeanalysis. Only clear bands between 700 and 50 bp werescored with a scale to describe the intensity of the bandfrom 1, 2 and 3 (weak, medium and strong), and only thebands with score of 3 were used for the analysis.
Data analysis molecular markersGenerated SSR, TRAP and AFLP fingerprints were indi-vidually scored and statistically analysed as dominantmarkers. (present = 1 and absent =0). Bands of similarsize and intensity were assumed to be homologous.Jaccard’s similarity coefficient [36] was used to esti-mate the genetic similarity (GS). Cluster analysis usingUnweighted Pair Group Method with Arithmetic Mean(UPGMA) clustering was carried out with the com-bined binary data from SSR, TRAP and AFLP in Gene-Maths XT (Ver. 1.6.1) (Applied Maths BVBA 2005).An analysis of molecular variance (AMOVA) was per-formed - with 10,000 permutations using the softwareArlequin© version 3.11 - to determinate the degree ofdifferentiation within and between populations. Thegenetic distance between the groups of accessions fromdifferent regions was expressed in terms of the FixationIndex (Fst). Fst is a measure of the allelic variationwithin and between groups of accessions. If for twogroups Fst equals 0, these groups have the same allelefrequencies for all markers, and this indicates that thetwo groups are freely interbreeding, and effectivelyform one genetic group. If Fst equals 1, the two groupsare genetically fully separated. Genetic structure of thepopulations was analysed using the software STRUC-TURE© version 2.3.2. This software was run with30,000 iterations, 50,000 iterations after burn-in and10 repetitions of each number of genetic populations(K1-K9) [11]. To determinate correlation between pheno-typic and molecular data, a Mantel test was done using thesimilarity matrix from phenotypic and molecular marker inGENSTAT 11.0th [37,38]. ANOVA analysis was done to de-termine significant differences between markers and traitsin GENSTAT 11.0th [37]. PIC values, heterozygosity andallele number were also calculated from the SSRs’ markersusing the microsatellite tools kit for MS Excel [39].
Analysis of seed and seedling traitsSeed hull percentageFour seeds of each accession were randomly selectedfrom each accession for analysis of total seed weight andweights of seed hull and kernel. The seeds were dried at70°C for 24 h to obtain a stable dry matter content of

Montes Osorio et al. BMC Plant Biology 2014, 14:77 Page 16 of 19http://www.biomedcentral.com/1471-2229/14/77
more than 96%. Each individual seed was mildly crushedto facilitate the separation of seed hull and kernel. Seedhull and kernel were weighed per individual seed.
Oil contentThe determination of oil content was carried out on in-dividual kernels. For this, we first crushed the kernel,which weighed between 0.3 and 1.0 g, to a fine powder.The whole powder sample was used to extract the seedoil using three consecutive cycles of hexane extraction.In the first cycle of hexane extraction, the sample wasadded to a 15 ml tube to which 7.5 ml of hexane wasadded. The tube was thoroughly shaken using a vortexduring 10 s to homogenize the mixture of hexane andpowder sample. The tubes with this mixture were placedon a shaking plate that stirred the tubes at 250 rpm for30 min to allow an efficient extraction of the oil into thehexane. After shaking, the tubes were centrifuged at4000 rpm for 10 min, and the supernatant containinghexane and extracted seed oil was carefully transferredto glass tubes of 10 ml. The hexane was evaporatedfrom the hexane-oil mixture to obtain pure seed oil ex-tracts using a Rapid Vap® Vacuum Evaporation System(Labconco, Kansas City, Missouri); a run time of 1 h at30°C was used. During evaporation, the pressure was re-duced from 250 mbar for the first 30 min to 70 mbarfor the final 10 min of a run, which was sufficient toevaporate all hexane.The pellet that remained in the 15 ml tubes was sus-
pended again in 7.5 ml hexane for the second round ofhexane extraction. After the second hexane extraction,the hexane-pellet mixture was again centrifuged and thesupernatant was added to the glass tube with extractedseed oil used in the first cycle, and the hexane was evap-orated again. This procedure was repeated for the thirdand last round of hexane extraction. After this, theamount of oil extracted was determined as the differenceof the weight of the glass tube with oil and the emptyglass tube. In 10 test runs, also a fourth round of hexaneextraction was carried out, but the increase in theamount of oil extracted from round 3 to round 4 wasless than 2% of the total amount of oil extracted after 4rounds of hexane extraction. The whole procedure wascarried out at room temperature (20°C).
Fatty acid compositionThe fatty acid composition of the extracted oil was de-termined according to a standard fatty acid methyl-ester analysis (AOCS Ce 1 h-05), after saponificationand methylation of the oil with a mixture of KOH andmethanol. Fatty acids were identified on the basis ofthe retention time of standards. The fatty acids C16:0,C16:1, C18:0, C18:1n-9, C18:2n-6 and C18:3n-3 werequantified using an Agilent GLC. The fatty acid
composition was expressed in terms of the relativepeak areas of these fatty acids.
Seedling growth and morphologyWe assessed the variation between the accessions in theJEP collection for early growth and morphological traitsin the seedling stage on the basis of a greenhouse experi-ment in Wageningen, The Netherlands. For this analysis,we selected 3 healthy seeds of each of the 182 acces-sions. Empty or damaged seeds or seeds showing signsof infection by fungi were discarded. Seeds were sown in1.4 L pots on December 23, 2008 in a greenhouse nurserywith a constant temperature of 20 ° at night and 25°C dur-ing the day, with a 12 hours light period. Light was pro-vided by SON-T lamps in addition to the natural lightentering in the greenhouse, reaching levels around3 MJ m−2 d−1 (PAR, between 400 and 700 nm), equiva-lent to about 35 W m−2. Germination took place ap-proximately 14 days after sowing, but was variablebetween accessions. To allow proper comparison ofthe accessions, the timing of all plant measurementswere expressed in days after germination (DAG) in-stead of days after sowing. After germination, individ-ual plants were transferred to individual pots of 1.4 Land to a larger greenhouse, also with 12 hours of artifi-cial light and a constant temperature of 20°C (night)and 25°C (day), where the plants were put according toa randomized block design with 3 blocks with one rep-licate plant per accession per block. Some accessionsonly occurred in two blocks, if one of the three repli-cate seeds had not germinated. Plants received a slowrelease NPK-fertilizer at the start of the experiment toavoid growth limitations due to nutrient shortage andplant were watered once every three days to preventgrowth limitations due to water shortage.The time until germination, until appearance of the co-
tyledons and the number of cotyledons were determinedwithin 2 to 4 weeks after planting. Other non-destructivemeasurements of morphological traits were obtained at 30and 60 days after germination (Table 9). Sixty days aftergermination, plants were fully harvested and fresh and dryweight (after drying 24 h in a stove at 105°C) of root, stem,petiole and leaves was measured, and total leaf area perplant was determined (Table 10). From total leaf area andleaf weight, the specific leaf area (SLA, cm2 g−1) was calcu-lated. Further, dry matter distribution was determinedby calculating the percentage of leaves (LWR), petioles(PWR), stems (SWR) and root (RWR) in the total biomass(Table 10). The phyllochron, i.e. the time between the ap-pearances of successive leaves on the stem was derivedfrom the observed number of leaves on successive pointsin time. The radiation use efficiency was derived from themeasured photosynthetically active radiation (PAR) andthe light interception estimated from the plant leaf area at

Table 9 Non-destructive plant variables measured in seedlings under greenhouse conditions
Trait Abbreviation Date of measurement Description
Days to germination (d) D_G 2-4 weeks after sowing From day of sowing, number of days until appearanceof shoot from soil.
Days to cotyledon emergence (d) D_CE 2-4 weeks after sowing From day of sowing, number of days until bothcotyledons were fully open.
Number of cotyledons (#) N_Cot 2-4 weeks after sowing Number of cotyledons per plant.
Plant height (cm.) P_H 30 DAG Plant height from the plant base at the soil to its apex.
Stem diameter (cm.) S_D 30 DAG Stem diameter at the base of the trunk.
First leaf length (cm.) FL_l 30 DAG For the first emerged leaf, length was measured from thepoint at which the petiole joins the leaf, to the tip of the leaf.
First leaf width (cm.) FL_W 30 DAG For the first emerged leaf, width was measured betweenthe two furthest horizontal (and parallel) points across the leaf.
Total number of leaves (#) Nr_L 60 DAG Overall number of mature leaves, excluding cotyledons andemerging leaves around the plant’s apex.
Sowing date was December 20, 2008. DAG = days after germination.
Montes Osorio et al. BMC Plant Biology 2014, 14:77 Page 17 of 19http://www.biomedcentral.com/1471-2229/14/77
final harvest. Table 11 lists these growth and morphologyplant variables. In addition, for each accession, the averageand variance of seed weight was determined on a sampleof twenty seeds.In the period just after the establishment of seedlings,
plant growth is approximately exponential, which meansthat the plant will grow with a constant relative growthrate (RGR). The absolute daily growth rate is equal toproduct of the relative growth rate and the plant weight.RGR is calculated from growth data as (Eq. 1):
RGR ¼ ln W2=W1ð Þ= t2−t1ð Þ ð1ÞIn which, RGR is the relative growth rate (d−1), W1
and W2 are the plant total dry weights (g plant−1) attime t1 and t2 (in days after germination).RGR can be analysed as the product of three compo-
nents as (Eq. 2):
RGR ¼ SLA LWR NAR ð2ÞIn which, SLA is the Specific Leaf Area, which is the
leaf area divided by the leaf dry weight, LWR is the Leaf
Table 10 Plant variables measured in seedlings under greenhplants on day 60 after germination
Trait Abbreviation Description
Total leaf area (cm2) TLA Surface area for eemerging leavesArea Meter (Li-COsurface area of al
Petiole fresh and dry weight (g plant−1) P_FW/P_DW Petioles were cut48 hours.
Leaf fresh and dry weight (g plant−1) L_FW/L_DW Leaves, excludingdrying at 105°C f
Stem fresh and dry weight (g plant−1) S_FW/S_DW The stem cut off
Root fresh and dry weight (g plant−1) R_FW/R_DW Roots were cut of
Weight Ratio, which is the dry weight of leaves dividedby the total plant dry weight (expressed as percentage)and NAR is the Net Assimilation Rate, which in thegrowth analysis is calculated from the measured RGR,SLA and LWR [40].
Data analysis of seed and seedling traitsAs some accessions were only present in two blocks,residual maximum likelihood (REML) procedure wasused to test significance of difference between accessions,with blocks and rows within block as random term. Itproved that the row within block variance was negligible,and therefore only results using the REML procedurewith blocks as random term and accessions as fixedterm are presented. Statistical significance was based ona probability of 5% of falsely rejecting the hypothesisthat no differences were present using the Waldstatistic.From the REML analysis, estimates of genetic variance
(the variance among accessions) and the residual variancewere obtained, and used to calculate the broad sense
ouse conditions determined at destructive harvest of
very mature leaf of the plant, including cotyledons but excludingaround the plant’s apex, was measured using a Li-COR Model 3100R). Total leaf area was calculated as the cumulative sum of thel leaves.
off from the plant and weighed fresh and after drying at 105°C for
petioles) were cut off from the plant and weighed fresh and afteror 48 hours.
from the plant and weighed fresh and after drying at 105°C for 48 hours.
f from the plant and weighed fresh and after drying at 105°C for 48 hours.

Table 11 J. curcas derived growth variables in seedlings under greenhouse conditions on day 60 after germination
Trait Description / Calculation
Total fresh weight (g plant−1) T_FW Σ (P_FW, L_FW, S_FW, R_FW)
Total dry weight (g plant−1) T_DW Σ (P_DW, L_DW, S_DW, R_DW)
Shoot/root ratio (−) S/R Σ (P_DW, L_DW, S_DW)/R_DW
Leaves/stem ratio (−) L/S Σ (P_DW, L_DW)/S_DW
Petiole/leaf sheath ratio (−) P/L_Sth P_DW/L_DW
Leaf area average (cm2 plant−1) L_AA TLA/Σ (Nr_L, N_Cot)
Specific leaf weight (g cm−2) SLW L_DW ∙10−3/TLA ∙10−8
Specific leaf area (cm2 g−1) SLA TLA ∙10−4/L_DW
Phyllochron in days (d) Phy_D (Number of Days from Emergence Date till Harvest Date)/Nr_L
Phyllochron in temperature (°C) Phy_T (Cumulative temperature between Cotyledon Emergence Date and Harvest Date)/Nr_L
Absolute growth rate (g d−1) AGR T_DW/(Number of Days from Emergence Date till Harvest Date)
Temperature sum per DW (°C g−1) TS_DW (Cumulative temperature between Emergence Date and Harvest Date)/T_DW
Radiation use efficiency (MJint g−1) RUE2 PAR Intercepted/T_DW
Montes Osorio et al. BMC Plant Biology 2014, 14:77 Page 18 of 19http://www.biomedcentral.com/1471-2229/14/77
heritability h2 (or repeatability) of the measured traits forentry means as (Eq. 3):
h2 ¼ σ2g= σ2g þ
σ2e3
� �� �ð3Þ
Where σ2g is the variance across all accessions and σ2eis the residual variance of the experiment. The co-efficient of genetic variation was calculated as σ2g/mean.Differences in means of different geographical ori-
gins of the accessions were tested using a REML ana-lysis with region as fixed term instead of accessions.To test whether the (genetic) variance among acces-sions from different regions were significantly diffe-rent, pairwise F-tests on the ratio of variance of oneregion and that of another region were performed.We carried out a principal component analysis (PCA)
analysis using the correlations between seedling growthand morphological traits to assess whether the total setof traits would show a structuring into groups of severalaccessions with high similarity (using GENSTAT 11th). Analternative presentation in the form of a dendrogramshowing possible structuring into group of high similaritywas based on Euclidean distances calculated from stan-dardized values for the traits measured.
Competing interestsFinancial competing interestsIn the past five years have you received reimbursements, fees, funding, orsalary from an organization that may in any way gain or lose financially fromthe publication of this manuscript, either now or in the future? Is such anorganization financing this manuscript (including the article-processingcharge)? NO.Do you hold any stocks or shares in an organization that may in any waygain or lose financially from the publication of this manuscript, either now orin the future? If so, please specify? NO.Do you hold or are you currently applying for any patents relating to thecontent of the manuscript? Have you received reimbursements, fees,
funding, or salary from an organization that holds or has applied for patentsrelating to the content of the manuscript? If so, please specify. NO.Do you have any other financial competing interests? If so, please specify. NO.Non-financial competing interestsAre there any non-financial competing interests (political, personal, religious,ideological, academic, intellectual, commercial or any other) to declare inrelation to this manuscript? If so, please specify. NO.
Authors’ contributionsLRM, AT, REEJ, ENvL, CA, LMT, RGFV: Marker selection and designedexperiments. LRM, AT, JB: developed molecular markers. LRM, AT, REEJ, ENvL:phenotypic evaluation. LRM, AT, ENvL: biodiversity analysis (molecular markerand phenotypic data). LRM, REEJ, LMT, RGFV, ENvL prepared the manuscript.All authors: reviewed and approved manuscript.
AcknowledgementsWe thank Stichting Het Groene Woudt, The Netherlands, AGROCYTGuatemala and the European Union Framework 7 Program KnowledgeBased Bio-Economy (grant under contract 245236; JATROPT) for funding partsof this project. We would like to express our gratitude to all the institutions andpersons that contributed to the global JEP collection of jatropha accessions.The comments from Dr. Xabier Barandiaran to this manuscript are highlyappreciated.
Author details1Plant Breeding, Wageningen University and Research Centre, PO Box 386,6700 AJ Wageningen, The Netherlands. 2Agrosystems Research, PlantResearch International, Wageningen University and Research Centre, PO Box616, 6708 AP Wageningen, The Netherlands. 3Facultad de Agronomía,FAUSAC, Universidad de San Carlos de Guatemala, Guatemala City,Guatemala. 4Biocombustibles de Guatemala S.A., Guatemala City, Guatemala.
Received: 27 May 2013 Accepted: 12 March 2014Published: 25 March 2014
References1. Achten WMJ, Verchot L, Franken YJ, Mathijs E, Singh VP, Aerts R, Muys B:
Jatropha bio-diesel production and use. Biomass Bioenergy 2008,32(12):1063–1084.
2. Sahoo PK, Das LM, Babu MKG, Arora P, Singh VP, Kumar NR, Varyani TS:Comparative evaluation of performance and emission characteristics ofjatropha, karanja and polanga based biodiesel as fuel in a tractorengine. Fuel 2009, 88(9):1698–1707.
3. Maes WH, Trabucco A, Achten WMJ, Muys B: Climatic growing conditionsof Jatropha curcas L. Biomass Bioenergy 2009, 33(10):1481–1485.

Montes Osorio et al. BMC Plant Biology 2014, 14:77 Page 19 of 19http://www.biomedcentral.com/1471-2229/14/77
4. Lu H, Liu Y, Zhou H, Yang Y, Chen M, Liang B: Production of biodieselfrom Jatropha curcas L. oil. Comput Chem Eng 2009, 33(5):1091–1096.
5. Heller J: Physic nut: Jatropha curcas L. Ipgri: Rome; 1996.6. Jongschaap REE, Corré WJ, Bindraban PS, Brandenburg WA: Claims and facts
on Jatropha curcas L.: global Jatropha curcas evaluation. Breeding andpropagation programme. Plant Research International: Wageningen; 2007.
7. Varshney RK, Tatikonda L, Wani SP, Kannan S, Beerelli N, Sreedevi TK,Hoisington DA, Devi P: AFLP-based molecular characterization of an elitegermplasm collection of Jatropha curcas L., a biofuel plant. Plant Sci2009, 176(4):505–513.
8. Chen XY, Shen JL, Jia XN, Ni HQ, Sun PG, Niu SH: AFLP analysis of geneticdiversity of Jatropha curcas grown in Hainan, China. Tress Struct Funct2010, 24(3):455–462.
9. Tang L, Zhang ZY, Guo XL, Liu BY, Chen F: Genetic diversity and geneticrelationship of Jatropha curcas between China and Southeast Asianrevealed by amplified fragment length polymorphisms. Afr J Biotechnol2011, 10(15):2825–2832.
10. Grattapaglia D, Rosado TB, Laviola BG, Faria DA, Pappas MR, Bhering LL,Quirino B: Molecular Markers Reveal Limited Genetic Diversity in a LargeGermplasm Collection of the Biofuel Crop Jatropha curcas L. in Brazil.Crop Sci 2010, 50(6):2372–2382.
11. Ovando-Medina AS-Ge I, Adriano-Anaya L, Espinosa-Garcia F, Núñez-Farf[anJ, Salvador-Figueroa M: Genetic Diversity of Population of Jatropha curcasin the State of Chiapas, Mexico. Diversity 2011, 3(4):641–659.
12. Basha SD, Francis G, Makkar HPS, Becker K, Sujatha M: A comparative studyof biochemical traits and molecular markers for assessment of geneticrelationships between Jatropha curcas L. germplasm from differentcountries. Plant Sci 2009, 176(6):812–823.
13. Víctor Pecina-Quintero JLA-L, Alfredo Zamarripa C, Noe Montes G, CarlosAlberto Núñes C, Jose Luis Solis B, María Rocío A-R, Homar REne Gill L,Daniela Judith Méjia B: Molecular characterisation of Jatropha curcas L.genetic resources from Chiapas, México through AFLP markers. BiomassBioenerg 2011, 35:1897–1905.
14. Jongschaap REE, Montes Osorio LR, de Ruijter FJ, van Loo EN: Highlightsof the Jatropha curcas evaluation program (JEP): crop managementand the fate of press-cake and other by-products with its effects onenvironmental sustainability. In ICJC2010 International Congress onJatropha curcas: November, 1–2, 2010. Groningen, The Netherlands:University of Groningen; 2010:36.
15. Ge XJ, Sun QB, Li LF, Li Y, Wu GJ: SSR and AFLP markers reveal lowgenetic diversity in the biofuel plant Jatropha curcas in China. Crop Sci2008, 48(5):1865–1871.
16. Reddy MP, Pamidimarri DVNS, Singh S, Mastan SG, Patel J: Molecularcharacterization and identification of markers for toxic and non-toxicvarieties of Jatropha curcas L. using RAPD, AFLP and SSR markers. MolBiol Rep 2009, 36(6):1357–1364.
17. Pritchard JK, Stephens M, Donnelly P: Inference of population structureusing multilocus genotype data. Genetics 2000, 155(2):945–959.
18. Azurdia RP C, Barrillas E, Montes L: Caracterización Molecular de las Variedadesde Jatropha curcas L. en Guatemala con Fines de Mejoramiento. In AGROCYT012–2005. Guatemala, Guatemala: AGROCYT; 2008:46.
19. Rao GR, Korwar GR, Shanker AK, Ramakrishna YS: Genetic associations,variability and diversity in seed characters, growth, reproductivephenology and yield in Jatropha curcas (L.) accessions. Tress Struct Funct2008, 22(5):697–709.
20. Kaushik N, Kumar K, Kumar S, Kaushik N, Roy S: Genetic variability anddivergence studies in seed traits and oil content of Jatropha (Jatrophacurcas L.) accessions. Biomass Bioenerg 2007, 31(7):497–502.
21. Ginwal HS, Phartyal SS, Rawat PS, Srivastava RL: Seed source variation inmorphology, germination and seedling growth of Jatropha curcas Linn.in central India. Silvae Genet 2005, 54(2):76–80.
22. Pant KS, Khosla V, Kumar D, Gairola S: Seed oil content variation inJatropha curcas Linn. in different altitudinal ranges and site conditions inH.P. India. Lyonia 2006, 11(2):31–34.
23. Ovando-Medina I, Espinosa-Garcia F, Nunez-Farfan J, Salvador-Figueroa M:Genetic variation in Mexican Jatropha curcas L. Estimated with Seed OilFatty Acids. J Oleo Sci 2011, 60(6):301–311.
24. Gandhi B, Chelladurai S, Kumaran D: Process optimization for biodieselsynthesis from jatropha curcas oil. Distrib Generation Altern Energy J 2011,26(4):6–16.
25. Okullo AA, Temu AK, Ogwok P, Ntalikwa JW: Physico-chemical propertiesof biodiesel from jatropha and castor oils. Int J Renew Energ Res 2012,2(1):47–52.
26. Rebetzke GJ, Pantalone VR, Burton JW, Carver BF, Wilson RF: Phenotypicvariation for saturated fatty acid content in soybean. Euphytica 1996,91(3):289–295.
27. Chengxin Yi SZ, Xiaokun L, Ha TN B, Yan H: Does epigeneticpolymorphism contribute to phenotypic variances in Jatropha curcas L.?BMC Plant Biol 2010, 10:259. doi:10.1186/1471-2229-1110-1259.
28. Siam P, Diego B, Sujatha M, Harinder PS M, Manish R, Reddy AR, Enrico P,Angharad MR G, Keith Syers J, O’Donnell AG, Ajay K: Narrow genetic andapparent phenetic diversity in Jatropha curcas: initial success withgenerating low phorbol ester interspecific hybrids. 2009. Available fromNature Precedings http://precedings.nature.com/documents/2782/version/1.
29. Shipley B: Trade-offs between net assimilation rate and specific leaf areain determining relative growth rate: relationship with daily irradiance.Funct Ecol 2002, 16(5):682–689.
30. Villar R, Maranon T, Quero JL, Panadero P, Arenas F, Lambers H: Variation inrelative growth rate of 20 Aegilops species (Poaceae) in the field: theimportance of net assimilation rate or specific leaf area depends on thetime scale. Plant Soil 2005, 272(1–2):11–27.
31. Machua J, Muturi G, Omondi SF, Gicheru J: Genetic diversity of Jatrophacurcas L. populations in Kenya using RAPD molecular markers:Implication to plantation establishment. Afr J Biotechnol 2011, 10(16):3069.
32. Fulton TM, Chunwongse J, Tanksley SD: Microprep protocol for extractionof DNA from tomato and other herbaceous plants. Plant Mol Biol Rep1995, 13(3):207–209.
33. Hu JG, Mou BQ, Vick BA: Genetic diversity of 38 spinach (Spinaciaoleracea L.) germplasm accessions and 10 commercial hybrids assessedby TRAP markers. Genet Resour Crop Ev 2007, 54(8):1667–1674.
34. Faris JD, Liu ZH, Anderson JA, Hu J, Friesen TL, Rasmussen JB: A wheatintervarietal genetic linkage map based on microsatellite and targetregion amplified polymorphism markers and its utility for detectingquantitative trait loci. Theor Appl Genet 2005, 111(4):782–794.
35. Vos P, Hogers R, Bleeker M, Reijans M, Vandelee T, Hornes M, Frijters A,Pot J, Peleman J, Kuiper M, Zabeau M: Aflp - a new technique forDNA-fingerprinting. Nucleic Acids Res 1995, 23(21):4407–4414.
36. Jaccard P: Gesetze der Pflanzenvertheilung in der alpinen region: auf Grundstatistich-floristischer Untersuchungen. Flora; 1902:349–377.
37. International V: GenStat for windows 14th edition. Oxford: VSN International;2011.
38. Mantel N: The detection of disease clustering and a generalizedregression approach. Cancer Res 1967, 27(2):209–220.
39. Park SDE: Trypanotolerance in West African cattle and the population geneticeffects of selection. Dublin, Irland: University of Dublin; 2001.
40. Shipley B: Net assimilation rate, specific leaf area and leaf mass ratio:which is most closely correlated with relative growth rate? A meta-analysis.Funct Ecol 2006, 20(4):565–574.
doi:10.1186/1471-2229-14-77Cite this article as: Montes Osorio et al.: High level of molecular andphenotypic biodiversity in Jatropha curcas from Central Americacompared to Africa, Asia and South America. BMC Plant Biology2014 14:77.
Submit your next manuscript to BioMed Centraland take full advantage of:
• Convenient online submission
• Thorough peer review
• No space constraints or color figure charges
• Immediate publication on acceptance
• Inclusion in PubMed, CAS, Scopus and Google Scholar
• Research which is freely available for redistribution
Submit your manuscript at www.biomedcentral.com/submit