Hidden and Latent Factors' Influence on Digital Technology ...
22
mathematics Article Hidden and Latent Factors’ Influence on Digital Technology Sustainability Development Egils Ginters * and Jagadeesh Chakkaravarthy Revathy Citation: Ginters, E.; Revathy, J.C. Hidden and Latent Factors’ Influence on Digital Technology Sustainability Development. Mathematics 2021, 9, 2801. https://doi.org/10.3390/ math9212801 Academic Editor: Aleksandr Rakhmangulov Received: 8 October 2021 Accepted: 3 November 2021 Published: 4 November 2021 Publisher’s Note: MDPI stays neutral with regard to jurisdictional claims in published maps and institutional affil- iations. Copyright: © 2021 by the authors. Licensee MDPI, Basel, Switzerland. This article is an open access article distributed under the terms and conditions of the Creative Commons Attribution (CC BY) license (https:// creativecommons.org/licenses/by/ 4.0/). Department of Modelling and Simulation, Riga Technical University, LV-1658 Riga, Latvia; [email protected] * Correspondence: [email protected] Abstract: The modern world can be described as a sociotechnical system, the existence and devel- opment of which are determined by the successful interaction of technology and society. When introducing a technology, it is important to assess its potential sustainability. There are currently more than a hundred different sustainability assessment methods that allow for the sustainability of a technology to be predicted on the basis of a quantitative assessment of basic impact indicators. However, as the complexity of technology increases, there are hidden and latent factors inherent in technology that sooner or later affect the sustainability of technology and pose significant risks. Identifying these factors is particularly important for digital technologies, as they are the backbone of any other current technology. The aim of this article is to identify and explain the impact of a set of hidden and latent factors on the sustainability of digital technologies by using a system dynamics simulation and the possibilities offered by Bayesian networks. The results of this study are useful for technology sustainability researchers, technology authors, and investors. Keywords: digital technology; sustainability; system dynamics simulation; Bayesian networks 1. Introduction The modern world is the result of the interaction of objective reality and public con- sciousness that exists and develops over time. Objective reality is matter, but consciousness is a social institution whose existence requires some form of matter. To meet any needs of individuals in society, tools and knowledge are needed to properly use them. The set of tools and methods used to achieve a specific goal is now commonly referred to as technology. As the role of technology in society increases, it becomes dependent on various technologies. Without these technologies, the existence of modern society is no longer possible. Society is a sociotechnical system, where technology is one of the forms of expression of the system. Each technology is characterized by a physical form of existence (tool) and a logical structure or, in this case, a methodology that distinguishes each particular technology from any other technology. The logical structure of a technology includes a social component, as technology aims to meet the needs of its user, and that is why technology is created. Thus, one of the indicators of technology evaluation is its direct or indirect usefulness to society or social groups. If the technology is not useful, it is not accepted, adopted, or used. There are no completely universal tools. If the tool works for everyone, then it really does not work for anyone. The larger the part of society that is covered by technology, the greater its overall impact on society’s existence over time. That is why studies are carried out on the impact of technology on different age groups, and on their relevance to social and historical traditions. Knowledge and experience gathered earlier create new insights that can be imple- mented in fundamentally new technologies; by improving old technologies, new ones are created that meet the public demand for a certain period of time. Mathematics 2021, 9, 2801. https://doi.org/10.3390/math9212801 https://www.mdpi.com/journal/mathematics
-
Upload
khangminh22 -
Category
Documents
-
view
1 -
download
0
Transcript of Hidden and Latent Factors' Influence on Digital Technology ...

mathematics
Article
Hidden and Latent Factors’ Influence on Digital TechnologySustainability Development
Egils Ginters * and Jagadeesh Chakkaravarthy Revathy
�����������������
Citation: Ginters, E.; Revathy, J.C.
Hidden and Latent Factors’ Influence
on Digital Technology Sustainability
Development. Mathematics 2021, 9,
2801. https://doi.org/10.3390/
math9212801
Academic Editor:
Aleksandr Rakhmangulov
Received: 8 October 2021
Accepted: 3 November 2021
Published: 4 November 2021
Publisher’s Note: MDPI stays neutral
with regard to jurisdictional claims in
published maps and institutional affil-
iations.
Copyright: © 2021 by the authors.
Licensee MDPI, Basel, Switzerland.
This article is an open access article
distributed under the terms and
conditions of the Creative Commons
Attribution (CC BY) license (https://
creativecommons.org/licenses/by/
4.0/).
Department of Modelling and Simulation, Riga Technical University, LV-1658 Riga, Latvia;[email protected]* Correspondence: [email protected]
Abstract: The modern world can be described as a sociotechnical system, the existence and devel-opment of which are determined by the successful interaction of technology and society. Whenintroducing a technology, it is important to assess its potential sustainability. There are currentlymore than a hundred different sustainability assessment methods that allow for the sustainabilityof a technology to be predicted on the basis of a quantitative assessment of basic impact indicators.However, as the complexity of technology increases, there are hidden and latent factors inherentin technology that sooner or later affect the sustainability of technology and pose significant risks.Identifying these factors is particularly important for digital technologies, as they are the backboneof any other current technology. The aim of this article is to identify and explain the impact of a set ofhidden and latent factors on the sustainability of digital technologies by using a system dynamicssimulation and the possibilities offered by Bayesian networks. The results of this study are useful fortechnology sustainability researchers, technology authors, and investors.
Keywords: digital technology; sustainability; system dynamics simulation; Bayesian networks
1. Introduction
The modern world is the result of the interaction of objective reality and public con-sciousness that exists and develops over time. Objective reality is matter, but consciousnessis a social institution whose existence requires some form of matter.
To meet any needs of individuals in society, tools and knowledge are needed toproperly use them. The set of tools and methods used to achieve a specific goal is nowcommonly referred to as technology. As the role of technology in society increases, itbecomes dependent on various technologies. Without these technologies, the existence ofmodern society is no longer possible. Society is a sociotechnical system, where technologyis one of the forms of expression of the system. Each technology is characterized by aphysical form of existence (tool) and a logical structure or, in this case, a methodology thatdistinguishes each particular technology from any other technology. The logical structureof a technology includes a social component, as technology aims to meet the needs of itsuser, and that is why technology is created.
Thus, one of the indicators of technology evaluation is its direct or indirect usefulnessto society or social groups. If the technology is not useful, it is not accepted, adopted, orused. There are no completely universal tools. If the tool works for everyone, then it reallydoes not work for anyone. The larger the part of society that is covered by technology, thegreater its overall impact on society’s existence over time. That is why studies are carriedout on the impact of technology on different age groups, and on their relevance to socialand historical traditions.
Knowledge and experience gathered earlier create new insights that can be imple-mented in fundamentally new technologies; by improving old technologies, new ones arecreated that meet the public demand for a certain period of time.
Mathematics 2021, 9, 2801. https://doi.org/10.3390/math9212801 https://www.mdpi.com/journal/mathematics

Mathematics 2021, 9, 2801 2 of 22
In most cases, technology is the result of paid work. A person wants to receiveremuneration for work, the amount of which must be greater than the invested resources.Technology needs to be both introduced and maintained over its lifetime, which requiressignificant resources. Thus, the sustainability of a technology depends on the profit itgenerates for the authors of the technology and other stakeholders.
The consequences of the use of technology, which improves the life of society andgives profit to inventors and investors, must not worsen or endanger the basis of society’sexistence, i.e., the environment.
Taken together, these three technology assessment indicators, namely, society, business,and the environment, form the triple bottom line (TBL) sustainability model, which iscurrently used to assess existing and new technologies. Currently, there are more than ahundred different sustainability assessment methods [1–3], which in most cases are basedon the technology life cycle assessment model and are used to assess the sustainability ofvarious large projects. The target audience for these laborious methods is project managersand regional policy planners [2].
One could be surprised at the large number of these methods. The reason is probablyutilitarian. If it is necessary to assess the sustainability of a “right” project, a method ofsustainability assessment is also generated, which justifies the successful sustainabilityof this “right” project. Often, only one component of sustainability, i.e., environmentalimpact, is assessed in the TBL model. There is still a lack of interactive methods for theself-assessment and forecasting of technology sustainability, in which technology authors,engineers, and investors are very interested.
Evidence is not required by the axiom that we live in a digital society where bothour social and working lives are determined by digital technologies. Digital technologiesare a specific type of technology, and some of their attributes are not specific to othertechnologies.
There is not much research on the nature of digital technologies [4–9], but individualdigital technologies or their applications have been analyzed. A researcher needs interdis-ciplinary knowledge and decades of work experience with digital technologies to delveinto their essence.
The question of how to assess the sustainability of digital technologies is relevant. Inmost cases, researchers limit themselves to evaluating the acceptance component. This is, ofcourse, a necessary condition. If technology is not accepted by society, then no sustainabilityis imaginable. There are several methods [2], such as the theory of planned behavior, thetheory of reasoned action, the technology acceptance model (TAM), social cognitive theory,the diffusion of innovation, the model of PC utilization, the motivational model, and theunified theory of acceptance and use of technology (UTAUT). The bottleneck of thesemethods is the laborious collection and processing of input data, which limits the use ofthese methods in self-assessment. It is a rather stagnant situation that has lasted for morethan the last ten years.
More than eight years ago, a group of authors [10] began developing an integral anduniversal method for assessing the sustainability of digital technologies. The integratedacceptance and sustainability assessment model (IASAM) was based on a four-streamacceptance, management, quality of technology, and domain factor system dynamicssimulation. The sustainability index curve was modulated according to the Skype referenceline [10]. The result was measured in skype units, which provided good interpretationpossibilities. The development of sustainability was depicted in the form of graphicaldiagrams, and the essence of calculated sustainability index ST j(t) and the future prospectsof the assessed technology were explained:
ST j(t) = ST j(t− dt) +(
Accept.T j + Manag.T j + QualityT j + DomainT j)∗ dt (1)
The IASAM methodology has been validated in a number of projects, but clarificationsare still needed to bring the methodology closer to the specificities of digital technologies.One of the refinements of the sustainability forecast is related to the respect of the effect

Mathematics 2021, 9, 2801 3 of 22
of the uncertainty attribute, which can have a significant effect ∆ST j(t) on the initiallypredicted sustainability:
ST j(t) = ST j(t− 1) ∗ ∆ST j(t) (2)
In order to create an adequate model for assessing the sustainability of modern digitaltechnologies, it is necessary to delve into the increasingly complex nature of technologies.The complexity of a technology creates an increasing impact of a set of hidden and latentfactors that sooner or later affect the initially predicted results of the use of the technology.The use of an initial sustainability forecast in assessing the sustainability of digital technol-ogy development poses increasing risks, so adjustments to sustainability assessment areneeded, including risk factors that characterize the nature of the technology and the latentmanifestations of unanticipated factors.
The aim of this article is to introduce the set of digital technology attributes thatdetermine the development of technology and its sustainability, and to identify latentand unanticipated factors that may cause significant changes in the results of the initialsustainability assessment.
This paper shows how different research methods complement each other, that is,system dynamics simulation and Bayesian networks.
The tangible result of this study is the Bayesian network of digital technology’s hiddenand unanticipated factors’ impact assessments, which makes it possible to improve thetechnology’s initial sustainability forecast.
Readers could be researchers of digital technology sustainability issues, technology au-thors, as well as investors, who so far lack the tools for quick evaluation of business projects.
This study consists of several parts. First, a specific set of digital attributes that affectsustainability parameters is considered. The uncertainty attribute, which has a criticalimpact on sustainability, is specified later, and the paradigm of sustainability assessment issimplified by omitting less important components. Further, a set of factors that determinethe effect of the uncertainty attribute is clarified, and a Bayesian model of the interactionand influence assessment of these hidden and unanticipated factors is developed.
2. System Dynamics Use in Digital Technology Sustainability Simulation
Completely new technologies are rare. Existing ones are usually enhanced by changesto their physical and logical structures. The basic features of both society and business aredigitization and digitalization. Digitization envisages changes that mainly replace elementsof the physical structure (tools), but digitalization also determines changes in the logicalbody, creating new and unprecedented models of business and society cooperation. Anytechnology has a digital component, i.e., a technology incorporates one or more existingdigital technologies.
The physical structure of digital technology is relatively easy to change, determinedby the ability of built-in or programmable algorithms and the provision of external resourcesupport and the modular structure of the technology. Digital technology can have cognitiveproperties that allow for them to make changes to the logical structure of the technology inreal time, changing not only the tasks but even the goals of the technology. Cyber–physicalsystems, where the possibilities of digital technology are supplemented in real time by aliving body becoming part of a control system, provide virtually unlimited possibilities forchange. The above makes digital technologies a unique building block in the developmentof other technologies, so identifying their specificities and potential impact is both criticaland a very complex and interdisciplinary task.
Digital technologies are characterized by a set of several attributes (AT), the mostimportant of which [11] are performance (APRF
T ), complexity (ACT), uncertainty (AU
T ),evolutionism (AE
T), pervasiveness (APRVT ), and reliability (AR
T). These interacting attributesaffect the sustainability of digital technology ST j , which is specified by the conceptual modelof sustainability evaluation [11], but the values of these attributes are determined by anumber of stochastic and difficult-to-measure factors (FT). The nature of digital technology

Mathematics 2021, 9, 2801 4 of 22
attributes and their interaction was explained [11], but a system dynamics (SD) approachis proposed for sustainability TBL model simulation (see Figure 1).
Figure 1. System dynamics model of digital technology sustainability development.
In the system dynamics TBL model:
ST j(t) = ST j(t− 1) ∗ ∆ST j(t) (3)
where
SBT j = f
(APRF
T , AUT , APRV
T
), SP
T j = f(
ACT , AU
T , AET , AR
T
), SE
T j = f(
AUT , AR
T
)(4)
and (APRFT , AC
T , AUT , AE
T , APRVT , AR
T) ∈ AT .However,
(APRFT ) = f
(FPRF
T
),(
FPRFT
)= {Technical, Financial} (5)
(ACT) = f (FC
T ), (FCT ) = {Non− linearity, Dynamic, Co− evolution,
Adaptivity, Unpredictability, Agility} (6)
(AUT ) = f
(AC
T , AET , AR
T , FUT),(
FUT)= {Hidden and Unanticipated e f f ects, Convergence, Magni f ication,
Socio− technicality, Illusion o f Precision, Predictability}(7)
(AET) = f
(FE
T),
(FET ) = {Openness, Teachability, Cognition, Sel f − diagnostics,
Adaptiveness, Reproducibility, Temporality, Dynamics, Readiness}(8)
(APRVT ) = f
(APRF
T , FPRVT
),(
FPRVT
)= {Ubiquity, Feasibility, Accessibility, Spatiality,
Surveilability, Compatibility (Situational, Cultural, Technical)}(9)
(ART) = f
(AC
T , APRVT , FR
T),(
FRT)= {Security, Disruptiveness, Agility, Observability, Trialability} (10)

Mathematics 2021, 9, 2801 5 of 22
The earliest conceptual model [11] was designed in the form of a concept map in theMindMeister [12] environment. To analyze the effect of attribute changes over time, theconceptual model was translated into an executive SD simulation model in the STELLA [13]environment (see Figure 1), which allows for the visual representation of interactivechanges, and provides convenient and transparent modeling options. The SD model isopen access [14], which facilitates its validation.
The SD model consists of six impact streams (AT) (performance, complexity, un-certainty, evolutionism, pervasiveness, and reliability). Flows are interconnected andinteracting. Each flow is affected by the corresponding set of essential attributes (FT).Each flow affects the associated stock. The resource set (AT) affects three sustainabilityeffect flows (ST j). All of the above flows have a cumulative effect on each of the associatedresources, i.e., the more significantly the resource changes, the greater the resource feedbackto the input flow is.
In the model, the weights of all influences were determined to be neutral; therefore, thebasic effect on the modeling results was caused by the structure of the model and the linksbetween the elements of the model. The statistical reliability of the results was assessed bychecking both the border values of the digital technology attributes and the random values.The Kolmogorov–Smirnov (K–S) nonparametric test with α = 0.05 (95% confidence) wasused to assess reliability. Both K–S test conditions were examined. First, the requiredcondition, i.e., the simulation results, corresponded to the normal probability distribution,and the sufficient condition, i.e., the calculated critical value of the K–S test, was lower thantheoretically allowable.
There are two main research questions. The first question is which of the pillars of theTBL model of digital technology sustainability are most affected, i.e., which of the com-ponents of business, society, and the environment are most affected by digital technologyattributes? Second, which of the attributes of digital technology most significantly impactthis critical pillar of TBL?
The system dynamics model mainly respects the structural impact of parameters andqualitative units of measurement are used—Low, High. The influence of the parameterin column charts is represented comparatively, that is, the height of the column of a lessimportant parameter will be lower.
The modeling results at the maximal attribute thresholds convincingly showed thatthe absolutely dominant pillar of the digital technology sustainability TBL model is society(SP
T j), but the impact on business (SBT j) and the environment (SE
T j) is relatively insignificantif we abstract it from the interaction of the pillars (see Figure 2).
Figure 2. Affected pillars of digital technology sustainability.
This only confirms the initial assumption that the existence of a society is not possiblewithout digital technologies. It is difficult to find anything that could exist today withoutthe participation of digital technologies. Today, even social communication in society isdependent on digital technologies.

Mathematics 2021, 9, 2801 6 of 22
The modeling results revealed that one of the riskiest attributes that can affect thesustainability of digital technology is uncertainty (AU
T ), while the impact of other attributesis at least twice less (see Figure 3).
Figure 3. Ranking of digital technology attribute influences.
As a result of the study, digital technologies are characterized by a set of specificattributes with a significant degree of uncertainty, which can cause very important butdifficult-to-predict changes in society. Therefore, it is useful to specifically focus on furtherinvestigating the effect of the uncertainty (AU
T ) attribute.In order to analyze uncertainty, it is useful to establish what digital technology is and
to identify a technological breakdown in basic groups. This makes it possible to classifydigital technologies and facilitate the assessment of the sustainability of new technologiesby using the characteristics of the classification. It also allows for focusing on the study ofuncertainties in specific technological groups.
3. Dijkstra Layer Use for Digital Technology Identification
Digital technology (DTT j) is a method (logical structure), and its implementation en-vironment (physical structure) provides data acquisition, reading, and storage, processingand conversion, and output and transmission in digital form.
Digital technologies are specific with a comprehensive presence and are critical tosociety’s existence. In addition, they may have a cognitive function, and their goals andtasks can quickly be changed. Impacts can be deterministic, stochastic, latent, and hiddenover time. This fuzzy essence is characterized by a set of digital technology attributes(AT j), where the share of each attribute in the technology assessment is different.
The level of abstraction is important to identify the basic groups of digital technologies.The level of abstraction can be defined as a feature of fuzzy classification that, with sufficientand reasonable reliability, allows for the identification of goal technology as a permanentbasic element for the design of other digital technologies.
How are these levels of abstraction determined? For example, the lowest level ofabstraction could be a microprocessor. However, at this degree of abstraction, any digitaltechnology is a derivative of that particular abstraction.
A higher level of abstraction could be a computer that is the result of microprocessorinteraction. However, even in this case, most other digital technologies are derivatives ofthis basic element. An even higher degree of abstraction could be a data processing systemthat is the result of joint collaboration between computers. This level of abstraction, on theother hand, is too high because it includes any other digital technology. A data processingsystem cannot be a basic technology because the methods and hardware are too diverse.

Mathematics 2021, 9, 2801 7 of 22
The condition should be that digital technology is considered to be a basic technologywhen used to construct other digital technologies. This is, of course, a theoretical anddifficult goal to achieve, but it can be attempted at the level of technology groups.
This abstraction was perfectly described by Dijkstra [15]: “In this connection it mightbe worthwhile to point out that the purpose of abstracting is not to be vague, but to createa new semantic level in which one can be absolutely precise”. Operational system THEsupporting multiprogram mode was based on the multilayer concept [16], where eachhigher layer is based on the previous lower layer, and it understands and uses the datagenerated by it.
In turn, each higher layer of abstraction can fully perform its functions only bysequentially translating them through the lower layers of abstraction. Otherwise, the layeris autonomous and not part of the integrated system structure. This means that the higherlayer abstractions must be translated into an instructional form that is understandable tothe lower layer. In this way, a clear and tightly connected system structure consisting of alayered hierarchy of virtual machines is provided [17]. This means that each higher layerhas a larger semantic capacity than that of its predecessor.
The analogy is understandable when looking at the basic principles of a high-levellanguage translator. The principles state that natural language constructs must first betransformed into lower-level semantic language constructs, going step by step to a micro-command set understood by the processor, or more precisely to two basic operations, theshift and add operations, because the work of the computer is only the execution of a set ofthese two operations.
Such a regular structure determines the goals, tasks, and restrictions of each layer ofabstraction, which reduces the number of possible errors. An analogous approach can beused to identify groups of basic digital technologies.
So, if we assume that a particular digital technology (DTT j) is used to create a new andderived technology (DTT j+1), then DTT j attributes are transferred to DTT j+1 and becomepermanent elements of the DTT j+1 attribute set.
On the basis of Dijkstra’s [15] abstraction layers, with respect to the trend of growth,and the compound annual growth rate (CAGR) [18–32], the following set of basic digitaltechnologies is offered:
• Mobile communication (DTTMB) (mobile smartphones, SMS, multimedia messages,video–audio streaming, and mobile data);
• Robotics (DTTRB) (automatic guided vehicles (AGV), chatbots or virtual assistants,industrial manipulators, automatic warehouses, unmanned vehicles (auto, drones));
• Augmented and virtual reality (AR/VR) (DTTVAR) (mix of technologies, holography);• Satellite navigation (DTTNAV ) (geolocation, digital mapping in logistics, military, con-
struction, land measurement);• Satellite and wireless communication (DTTSATCOM ) (wireless networking, satellite phones,
and Internet access);• Internet (DTT I−NET ) (communication environment, websites, e-commerce, social net-
works, Internet of Things (IoT), e-mails, data and software warehouses, clouds, remotecomputing resources);
• Digital finances (DTTFIN ) (SWIFT, payment cards, cryptocurrencies, digital money);• Identification and security (DTT ID ) (sensors, barcodes, QR codes, RFID, biometrics,
digital signature and certificates, blockchains);• Artificial intelligence (AI) (DTTAI ) (artificial neural networks (ANNs), genetic program-
ming, machine and deep learning, big data analytics, Bayesian networks).
The sustainability of digital technology is mainly determined by its impact on so-ciety, but this influence is dominated by the uncertainty (AU
T ) attribute. According toEquation (7), this is a very extensive and time-consuming study. As the aim of the study isto identify trends, it is assumed that:(
FUT
)∼ Hidden and Unanticipated e f f ects} (11)

Mathematics 2021, 9, 2801 8 of 22
Further, we provide some examples of the presence of these(
FUT)
factors in separategroups of basic technologies.
4. Mining of Hidden and Unanticipated Effects
The impact of the uncertainty attribute on the sustainability of digital technology iscritical. The authors in [10] identified the main groups of hidden and unanticipated factors(
FUT)
that determine uncertainty:(FU
T
)∼ 〈FU
TDI , FUTUE , FU
TAF , FUTSD , FU
TUU , FUTUC , FU
TDU , FUT I 〉, (12)
where FUTDI denotes determined and systematic impacts; FU
TUE denotes unexpected stochas-tic externalities; FU
TAF denotes the age dynamics factor; FUTSD denotes technology self-
development; FUTUU denotes unexpected use; FU
TUC denotes unanticipated consequences;FU
TDU denotes dual-use technologies; and FUT I denotes incentives.
Explanatory definitions of the hidden and unanticipated factors are provided below:
• Determined and systematic impacts (FUTDI ). Impacts are predictable, systematic, and
observable over the life cycle of the technology. Technology is adopted and usedfor exactly the purpose for which it was designed. The technology is introducedincreasingly widely in various industries and applications. It brings changes toindustry and society, and the applications market is growing.
• Unexpected stochastic externalities (FUTUE). Due to external conditions, the use of tech-
nology is suddenly increasing or decreasing. One such example is the unexpectedand unintended effects of the COVID-19 pandemic on public communication andcollaboration methods. If previously e-work was considered an exception, then dur-ing the crisis it has become commonplace. As remote access is not possible withoutthe participation of digital technologies, the turnover of digital service companiesis growing exponentially, for example, for the Zoom platform it increased 30 timesin 2020 [33].
• Age dynamics factor (FUTAF ) [34]. Dynamic changes in age groups in society lead to
significant changes in the use of technology. Society consists of a set of individuals,where each individual, like technology, has their own life cycle. According to thelife cycle phase, each age group has a time of knowledge accumulation, a phase ofmaterial wellbeing, and a period of aging-related problems, which both promote andlimit the full use of digital technologies. Migration and natural demographic changecan lead to rapid changes in age groups and affect the use of technology.
• Technological self-development (FUTSD ). This concerns the specific features and design of a
technology that form the basis for its further convenient and successful development,and even self-development. One of these qualities is the cognition provided by thepresence of artificial intelligence, and the modular structure of digital technology. Bychanging the interconnections of existing elements, a new structure with differentproperties can be obtained. The cognitive process leads to changes in the weight of thelinks in the structural model of the technology. New inherited technology is growingstep by step on the basis of existing digital technology.
• Unexpected use (FUTUU ). This is a situation where a technology is designed and imple-
mented to achieve a specific goal, but it is used to achieve another different goal asa result of demand. The use of the MP3 format [10] can serve as an example here.Thanks to the insatiable appetite of the former audio recording industry, MP3 tech-nology from the data compression medium in ISDN telephony networks became thebasis of the new mobile and portable audio recording industry.
• Unanticipated consequences (FUTUC ). There are additional positive or negative effects
of technology use that have been doubted from the outset. However, as technologyadvances, these impacts are confirmed, become critical, and significantly affect thefurther life cycle of digital technology.

Mathematics 2021, 9, 2801 9 of 22
• Dual-use technologies (FUTDU ). The use of technology has a dual effect, and it is an
additional benefit that promotes the use of technology. A digital technology is adoptedand used for one task, but can also be used for completely different purposes.
• Incentives (FUT I ). These are the characteristics of the technology that contribute to
the expansion of its market, offering new options. An adopted technology createsextra opportunities for the user, which forces them to use it more. This, in turn,initiates the development of new additions to the technology itself, which createsmore new opportunities for individuals. The use of technological improvements canboth make an individual’s daily life easier, affect their social prestige, and even lead todependence on the technology.
On the basis of the above considerations, the core groups of digital technologies werereviewed to identify which of the hidden and unanticipated factors impact the developmentof these technologies. This is a very extensive study, so the following are just a few
(FU
T)
examples to illustrate the nature of the influence of factors.
4.1. Determined and Systematic Impacts (FUTDI )
4.1.1. Augmented and Virtual Reality (AR/VR) (DTTVAR)
In the healthcare sector, AR/VR technologies are used with a clear positive impactfor training medical students, helping doctors and surgeons with decision making, andhelping people to cope with anxiety [35].
In the logistics sector, AR/VR-enhanced warehousing applications and smart glassesare used to enhance item finding procedures, pick information, display product detailsand packing information, increase productivity, and reduce human errors (DHL andothers) [36].
The retail and consumer market is growing, offering ways to engage, entertain, andinteract with consumers, from virtual stores (eBay) and fitting rooms for fashion stores(Zara, Sephora, Estée Lauder) to testing the furniture in users’ houses (Amazon, Houzz,IKEA) [35,37].
AR/VR includes remote collaboration and consulting through virtual environments,and allows for engineers and designers to design products in the environment in which theproduct is to be used, supporting prototyping. Products and services are tested using simu-lations and virtual twins (Audi, Volvo, Lexus, Ford, Siemens, Fraunhofer Institute) [38–43].Societal engagement in urban planning through AR/VR use is promoted [44]. In thetourism and leisure sector, AR/VR is used to introduce customers to the provided andexpected service (Thomas Cook [45], Lufthansa [46]).
4.1.2. Satellite and Wireless Communication (DTTSATCOM)
The global market of small satellites is expected to significantly expand, covering wire-less services in hardly accessible areas [47,48], because small satellites can be constructedand launched less expensively and more quickly than traditional ones can.
4.1.3. Artificial Intelligence (AI) (DTTAI )
According to Bernard Marr & Co. [49], artificial intelligence can dramatically improvethe efficiency of workplaces and can automate the work of humans. With better monitoringand diagnostic capabilities, artificial intelligence can dramatically influence healthcare.
In India, AI has helped farmers obtain 30% higher groundnut yields per hectare byproviding information on preparing land, applying fertilizers, and choosing sowing dates.
In Norway, AI helped to create a flexible and autonomous electric grid, integratingmore renewable energy. AI has helped researchers achieve 89% to 99% accuracy in iden-tifying tropical cyclones, weather fronts, and atmospheric rivers, the latter of which cancause heavy precipitation [50].

Mathematics 2021, 9, 2801 10 of 22
4.1.4. Robotics (DTTRB)
Physical robots are increasingly used in the manufacturing industry, while cognitiverobots, virtual assistants, and chatbots equipped with social intelligence software areintegrated into the corporate world [51]. The concept of a robot has evolved from aphysical device that performs mechanical actions to replace humans in heavy and routineoperations into a software engineering object or even a microworld element, such asnanobots used in medicine.
4.1.5. Satellite Navigation (DTTNAV )
The market size of GPS applications is anticipated to reach USD 146.4 billion by 2025according to a new study by Grand View Research Inc., exhibiting a CAGR of 18.4% duringthe forecast period [52].
4.2. Unexpected Stochastic Externalities (FUTUE)
Mobile Communication (DTTMB)
In uncertain times such as during COVID-19, millions of individuals stay lockedinside their homes, and opt for online streaming and entertainment services. For instance,in March 2020, Netflix registered an increase of more than 50% in the number of first-timeinstallations of the mobile Netflix application in Italy, and more than 30% in Spain [53].
4.3. Age Dynamics Factor (FUTAF )
4.3.1. Internet (DTTI−NET )
As more young people meet problems of privacy and safety on social platforms, theyrevise the importance of virtual world relationships. For example, 2019 findings fromEdison Research and Triton Digital showed that overall social media usage across severalplatforms among Americans 12 to 34 years old is either levelled off or waning. Researchfrom Global Web Index in 2019 suggests that the amount of time that millennial audiencesspend on many social platforms is flat, declining, or not rising as greatly as it once did. Thiscan be market damage to large social media companies such as Facebook and Instagram.To reach these younger audiences, marketers must rethink their approaches [54].
4.3.2. Digital Finances (DTTFIN )
According to MarketWatch’s report [55] on cryptocurrency trading’s age factor, peopleaged 30 years old and younger represent 64% of the trading app’s users, but 86% of ModeGlobal Holding PLC clients fall under the age of 41. This makes young people grosslyover-represented in bitcoin trading.
4.3.3. Robotics (DTTRB)
Data provided by Voicebot [56] show that younger Americans in the 18–29 age groupare about 75% more likely to own a smart virtual assistant than those over 60.
4.4. Technological Self-Development (FUTSD )
Robotics (DTTRB)
According to [57], robots can self-learn and improve their characteristics. Initially, thearticulated four-degree-of-freedom robotic arm moved randomly and collected approxi-mately one thousand trajectories. The robot then used deep learning to create a self-model.The first self-models were quite inaccurate, but in less than 35 h of training, the self-modelbecame consistent with the physical robot. The self-model enabled the robot to recalibrateits original position between each step along the trajectory.

Mathematics 2021, 9, 2801 11 of 22
4.5. Unexpected Use (FUTUU )
4.5.1. Augmented and Virtual Reality (AR/VR) (DTTVAR)
McDonald’s [58] uses the Pokémon Go AR application, which has been downloadedby tens of millions of users to catch virtual Pokémon. This marketing strategy leveragesthe popularity of Pokémon Go to increase the number of McDonald’s customers.
4.5.2. Identification and Security (DTTID)
Blockchain technology has high reliability on the security of cryptocurrencies [59],but governments started to implement blockchain technology to save and secure laborresources.
For example, Estonia, which is a pioneer of having applied blockchain-based servicesin e-Health, e-Security and e-Safety, and e-Governance (including e-Voting), estimated thatsuch services save 100 years of working time for its 1.3 million citizens [60].
4.5.3. Internet (DTTI−NET )
Although the online environment was intended to be a universal communicationenvironment, no one expected the development of IoT, which has caused a rapid increasein the number of hosts on the network, and the limited length of addresses began topose significant problems for the expansion of users. For example, wearable devices canbe used for broadcasting health knowledge [61], providing capabilities for tracking andcontact tracing [62], ensuring social distancing monitoring [61], and providing mentalhealthcare [63].
4.6. Unanticipated Consequences (FUTUC )
4.6.1. Augmented and Virtual Reality (AR/VR) (DTTVAR)
In the logistics sector, according to DHL [64] and KLM [65] workers and associates,sickness is revealed when using an AR/VR face simulator. According to the Netherlands’Trade Union Confederation, there is also a danger of employees experiencing more stressor work pressure with the increasing dictation of behavior by AR/VR technology [64]. Thedigitalization of crime scenes using AR/VR by the Dutch National Police Corps [66] canreduce the skills of creative thinking and perceiving the “bigger picture”.
4.6.2. Artificial Intelligence (AI) (DTTAI )
The field of AI is going through a period of great expectations, introducing a certainlevel of anxiety in research, business, and policy. This anxiety is further energized by an AIrace narrative that makes people believe that they might be missing out. Whether real ornot, a belief in this narrative may be detrimental, as some stakeholders feel obliged to cutcorners on safety precautions or ignore societal consequences just to be successful againstother competitors [67].
4.6.3. Internet (DTTI−NET )
As social media platforms rise with billions of monthly active users now spending53 min per day on these platforms on average, their impact on daily lives is significant [68].An unexpected impact of a social media platform is that it creates criticism of young peopleof each other, and this affects their mental health. The more social networks that a youngadult uses, the more likely they are to report depression and anxiety [69].
4.6.4. Digital Finances (DTTFIN )
Cryptocurrency mining has a measurable negative impact. Researchers estimate thatcryptomining can produce 3–15 million tons of global carbon emissions [70] from theproduction of the required electricity. There are also some ethical issues that are difficult tosolve. A person living in an EU country has the right to request that information be erased

Mathematics 2021, 9, 2801 12 of 22
about themselves from the information environment, but the question is how someone canbe erased if nothing can be removed from the blockchain [71].
4.6.5. Robotics (DTTRB)
The AI-based smart assistant of Amazon’s Alexa has changed interaction. Alexausers use hands-free voice as the input method to place orders, ask questions, and playentertainment. Alexa may sometimes not distinguish a customer’s order from everydayconversations with other people. This may result in unintended actions such as multipletoilet paper orders [72], unintentional cat food orders, and purchasing a doll house [73].
4.6.6. Satellite Navigation (DTTNAV )
Geolocation has a double-edged nature. The capabilities that empower social net-working provide the basis for serious misuse in the wrong hands. Such misuse includesthe unwarranted surveillance of individual or enterprise activities [74].
4.7. Dual-Use Technologies (FUTDU )
Mobile Communication (DTTMB)
The latest mobile statistics hint at a high reliance for online shopping on mobiledevices. More than half of Internet users use their mobile phones to purchase productsonline [75,76].
4.8. Incentives (FUT I )
Internet (DTTI−NET )
Social networks are a significant communication medium to most age groups. Socialmedia have evolved from electronic information exchange to virtual gathering places,to retail platforms, to a vital 21st century marketing tool. The introduction of Facebookallowed for users to take their communities wherever they want, but the use of apps suchas Twitter, Snapchat, Instagram, and TikTok dominates in the mobile app environment.Instagram, in particular, became the app of choice for social media users interested intravel, entertainment, fashion, and other visually orientated topics. Business marketerstook advantage of this new consumer mobility by serving their customers with simplermethods of interacting and new ways of buying goods and services. In 2021, a digitalreport [75] showed that more than 4.66 billion people now use the Internet, while socialmedia users have passed the 4.2 billion mark.
According to groups of factors that are typical for digital technologies, it is possible tofurther identify the affiliation of the analyzed digital technology to one of the basic groupsof already existing digital technologies.
We now focus on what the interactions and resulting effects are of hidden and an-ticipated factors that allow for adjustments to the initial forecast of digital technologysustainability.
5. Bayesian Network Use for Unanticipated Factors Influence Modeling
A Bayesian network (BN) is used to describe the interaction of hidden and unantic-ipated factors, and to calculate the probability of the impact of events. A BN describesa network of related events in which the probability of each child event depends on theparent events. BN is an orientated acyclic graph based on Bayes’ theorem [77] and theprobability chain law. The network demonstrates a conditional propagation of influences.By selecting any of the events as evident, the user can observe the probabilities of theimpact of other related events. The approach allows for an interactive examination ofdifferent scenarios. BNs in risk and impact assessment are widely used in practice invarious sectors of the economy.
There are two main tasks in BN preparation: the construction of the network topologyand the determination of the effects of events and conditional probabilities. Theoretically,

Mathematics 2021, 9, 2801 13 of 22
it is possible to generate a BN structure, but semantic search methods can be used todetermine impact and probabilities by analyzing information related to the use of digitaltechnologies in the online environment. In practice, this is an expert task with a high degreeof subjectivity, as the dependencies, influences, and probabilities of the factors are unclearand fuzzy.
To simplify the situation, the authors use the naive Bayesian network approach. It isassumed that, if two or more parent factors affect one child factor, then the child factorinputs are independent.
With respect to the findings of a system dynamics simulation, uncertainty AUT j is a
critical attribute of digital technology that influences the dominant society SPT j pillar of
sustainability, but the effects of other attributes are not significant (see Figure 4).
Figure 4. Conceptual Bayesian network of probabilistic influences.
This allows for transforming and simplifying the graph by discarding less influentiallinks (see Figure 5).
Figure 5. Transformed model of probabilistic influences on sustainability pillar society SPT j .
Mathematics 2021, 9, 2801 14 of 22
The total probability of the Bayesian network and the effect of uncertainty on thesustainability pillar can be calculated according to Equations (13) and (14):
P(SPT j , AU
T j , ART j , AC
T j , AET j , APRV
T j , APRFT j ) = P
(AE
T j
)∗ P
(APRF
T j
)∗ P
(AC
T j
)∗
P(
APRVT j |APRF
T j
)∗ P
(AR
T j |APRVT j , AC
T j
)∗ P
(SP
T j |AUT j
)∗ P
(AU
T j |ART j , AC
T j , AET j
) (13)
P(
SPT j |AU
T j
)= P(SP
T j , AUT j , AR
T j , ACT j , AE
T j , APRVT j , APRF
T j )/(P(
AET j
)∗ P
(APRF
T j
)∗P
(AC
T j
)∗ P
(APRV
T j |APRFT j
)∗ P
(AR
T j |APRVT j , AC
T j
)∗ P
(AU
T j |ART j , AC
T j , AET j
))
(14)
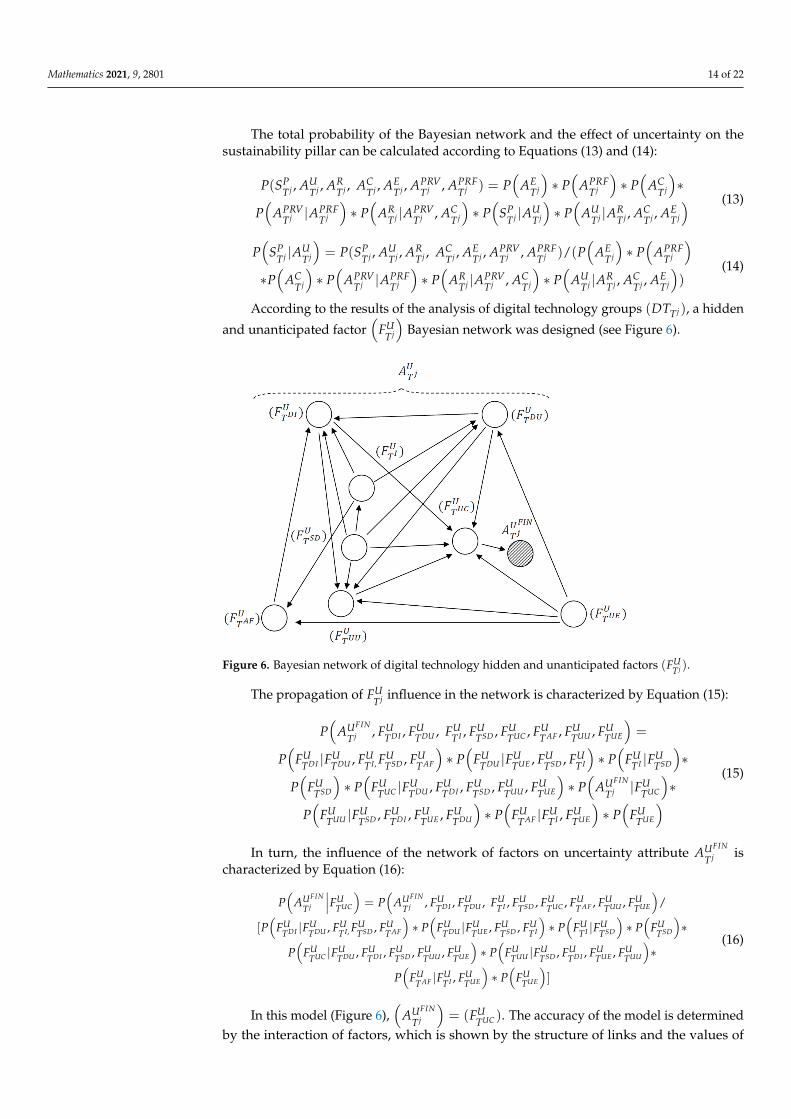
According to the results of the analysis of digital technology groups (DTT j), a hidden
and unanticipated factor(
FUT j
)Bayesian network was designed (see Figure 6).
Figure 6. Bayesian network of digital technology hidden and unanticipated factors (FUT j ).
The propagation of FUT j influence in the network is characterized by Equation (15):
P(
AUFIN
T j , FUTDI , FU
TDU , FUT I , FU
TSD , FUTUC , FU
TAF , FUTUU , FU
TUE
)=
P(
FUTDI |FU
TDU , FUT I, FU
TSD , FUTAF
)∗ P
(FU
TDU |FUTUE , FU
TSD , FUT I
)∗ P
(FU
T I |FUTSD
)∗
P(
FUTSD
)∗ P
(FU
TUC |FUTDU , FU
TDI , FUTSD , FU
TUU , FUTUE
)∗ P
(AUFIN
T j |FUTUC
)∗
P(
FUTUU |FU
TSD , FUTDI , FU
TUE , FUTDU
)∗ P
(FU
TAF |FUT I , FU
TUE
)∗ P
(FU
TUE
)(15)
In turn, the influence of the network of factors on uncertainty attribute AUFIN
T j ischaracterized by Equation (16):
P(
AUFIN
T j
∣∣∣FUTUC
)= P
(AUFIN
T j , FUTDI , FU
TDU , FUT I , FU
TSD , FUTUC , FU
TAF , FUTUU , FU
TUE
)/
[P(
FUTDI |FU
TDU , FUT I, FU
TSD , FUTAF
)∗ P
(FU
TDU |FUTUE , FU
TSD , FUT I
)∗ P
(FU
T I |FUTSD
)∗ P
(FU
TSD
)∗
P(
FUTUC |FU
TDU , FUTDI , FU
TSD , FUTUU , FU
TUE
)∗ P
(FU
TUU |FUTSD , FU
TDI , FUTUE , FU
TUU
)∗
P(
FUTAF |FU
T I , FUTUE
)∗ P
(FU
TUE
)]
(16)
In this model (Figure 6),(
AUFIN
T j
)= (FU
TUC ). The accuracy of the model is determinedby the interaction of factors, which is shown by the structure of links and the values of

Mathematics 2021, 9, 2801 15 of 22
factor influence. A 3-point Likert scale of high, medium, and low was used to characterizethe factor values. There are serious doubts as to whether the use of a longer rating scalecould improve the accuracy of the model. First, uncertainty factors have a high degree ofstochasticity, and second, the aim is to determine the trend.
Equation (15), after the quantification of event values, was implemented in theBayesFusion GeNIe [78] environment (see Figure 7).
Figure 7. Influence assessment networks of hidden and unanticipated factors.
Table 1 shows the influence of factors on related child factors. The impact values aredetermined by the structure of the model (see Figure 7), which is based on the unanticipatedfactor identification research of digital technologies, which is described above.
Table 1. Initial influence values (%) of hidden and unanticipated factor network.
(AUFIN
Tj ~ FUTUCj ) (FU
TDI ) (FUTDU ) (FU
TI ) (FUTSD ) (FU
TAF ) (FUTUU ) (FU
TUE )
High 8 8 8 84 8 8 84Medium 84 84 84 8 8 8 8
Low 8 8 8 8 84 84 8
The more outbound links there are, the higher the network node’s impact is. A factoreffect of 84% corresponds to a high level, and 8% to a low effect. Graduation is not detailed,so the sensitivity of the network can be considered to be low, and the network is robust. Thisis a deliberate design because, in conditions of uncertainty and stochasticity, too small ascale of intervals could only degrade the quality of the modeling. The purpose of modelingis to determine the trend, and not to calculate accurate impact values. The probability orinfluence interval is proportionally divided, determining the average quantitative valuesof each influence: high, medium, and low. It is possible to quantify each network nodeas follows. The modeler can tune the network at any time by changing the weight of theeffects.
Table 2 lists the values of the impact network events caused by the evidence ofuncertainty consequences events. Three forecasting network operation scenarios wereverified against the theoretical calculation results.

Mathematics 2021, 9, 2801 16 of 22
Table 2. Bayesian network event probabilities (%) of hidden and unanticipated factors (with influenceevidence).
(AUFIN
Tj ~FUTUCj ) (FU
TDI ) (FUTDU ) (FU
TI ) (FUTSD ) (FU
TAF ) (FUTUU ) (FU
TUE )
Scenario 1High 26 65 78 84 16 34 85
Medium 32 23 11 8 46 62 6Low 42 12 11 8 37 4 9
Scenario 2High 21 67 79 84 14 69 85
Medium 25 23 11 7 45 23 4Low 54 11 10 9 41 8 11
Scenario 3High 37 64 77 84 20 9 82
Medium 33 23 11 8 47 55 12Low 30 13 12 8 33 36 6
The model was implemented in the BayesFusion GeNIe environment and stored inthe depository [79] (see Figure 8).
Figure 8. Influence assessment network of hidden and unanticipated factors.
Only practice can help to validate the model, so validation can take place over a longerperiod of time. Of course, statistical reliability validation can be performed by obtainingthe normal distribution and fit of the data, for example, to the necessary and sufficientcondition of the Kolmogorov–Smirnov nonparametric test. However, this would not becorrect, as the impact of the factors is fuzzy and difficult to measure.
Further, by assessing the impact of digital technology uncertainty risk on the sustain-ability forecast, the evidence values of factors corresponding to each technology can bemarked, and what the adjustment of the goal technology sustainability forecast is can beconcluded according to the uncertainty impact factor—high, medium, or low.

Mathematics 2021, 9, 2801 17 of 22
6. Discussion
A critical and integral part of our society is digital technologies. It is important tounderstand and be able to roughly predict the sustainability of existing and new digitaltechnologies.
The interaction of digital technologies with society forms a sociotechnical system,the exact state of which is practically impossible to predict due to the very high impactof stochasticity, which is determined by hidden and unanticipated factors. In addition,the system is characterized by a cognition component that determines irregular and rapidchanges in the goal system model. The modeling should not be too enthusiastic aboutfinding out the quantitative and accurate values of the parameters. It is only self-deception.The best possible result is the identification of the development trend.
To identify the impact of hidden and unanticipated factors on the sustainabilityof digital technology, the authors proposed a hierarchical approach (see Figure 9), firstperforming conceptual modeling based on concept maps and Dijkstra layers of abstraction.The aim of the conceptual modeling was to find out the set of factors that characterizedigital technology, so that these technologies can be classified in the future.
Figure 9. Hierarchical approach to hidden and unanticipated factors’ influence identification.
However, the main tasks of executive modeling are to find which of the attributes hasthe greatest impact on the sustainability of digital technology, and which of the sustain-ability pillars is most affected. Detailed analysis of the critical attributes followed. Theresults of the simulation of system dynamics in the STELLA environment [14] showedthat the uncertainty (AU
T ) attribute plays a dominant role, which has a convincing effecton the society (SP
T j) pillar of digital technology sustainability. This does not mean thatthe other attributes of technology or the pillars of sustainability are not important. Lessimportant factors simply need to be discarded during modeling, so that the study does notsink into detail.
A system dynamics simulation was used instead of methods such as Petri nets andMarkov chains because of the flexibility, visibility, and transparency of the model imple-mentation and results, as users are representative of the interdisciplinary sciences and notmathematicians.
The system dynamics model can be easily maintained and modified by determiningand changing the weights of attribute effects. Behind the visual facade of system dynamicslies a computer-generated system of differential equations, because nothing better hasbeen devised yet to describe and analyze changes. The modeler does not need to bea mathematician in this case, but they must be able to explain to the computer exactlywhat changes in flows and resources they want to model. However, simulation is stillan art. At the same initial conditions, each modeler can create nuanced models. Unitsare the significance of an effect, quantitatively measured in absolute values to clearly andcomparatively show the effect of an attribute. The aim of the authors is not to find out theexact values of the parameters, but the trend.

Mathematics 2021, 9, 2801 18 of 22
Further detailed analysis of the uncertainty (AUT ) attribute was reduced to the most
significant influence, that is, to hidden and unanticipated factor(
FUT)
effects. These effectswere due to an interaction of at least eight factors. Extensive analysis of digital technologieswas performed to identify the nuances of the impact of these factors. It is not possible toclaim a statistically valid result, as this would be mathematical self-deception, but analysiscan give a notion of the relationship between uncertainty factors.
Why were Dijkstra and Bayes methods used to identify hidden and unanticipatedfactors and model the impact?
First, regarding the layers of abstraction used for Dijkstra, a specific analogy withprogramming languages can be mentioned. There are tens and even hundreds of program-ming languages, but a computer can “understand” only one of them, that is, the processorcommand system or microcommands, which are reduced to shifting and summing thebinary units in the processor registers. The computer does not understand anything else,so any higher-level programming language is reduced step by step during translation toa lower level of abstraction. Higher-level languages only exist to reduce programmingworkload and improve transparency.
Thus, hidden and unanticipated factors could be further modeled using system dy-namics and maintaining methodological integrity. However, the authors decided to useBayesian networks.
Although the system dynamics method would provide similar results, data analysiswould be much more complex. It would be difficult to visualize the effects and risks ofrelated factors step by step. There were two successive steps in constructing a Bayesian net-work in the BayesFusion GeNIe environment [79], namely, building the network structureand assessing the impact of the events. If the workload of the first step is commensuratewith the designing of the system dynamics model, then the second step is very unpleasantand even sophistic. As always, it is possible to rely on expert opinions, and make a convinc-ing and statistical assessment of the reliability of the data, and everything is formally right.However, if at least eight different events are interconnected, constructing conditionalprobability propagation tables is a very ambitious and challenging task.
However, the developed Bayesian model allows for interactively assessing the possiblecorrection of the sustainability forecast of each digital technology, which is affected by theuncertainty attribute. The author of the new technology or the project manager can adjustthe technology sustainability forecast, or understand the confidence limits of the forecaston the basis of this model. It is possible to perform technology self-assessment.
For example, if we assume that 5G technology evidence values FUTDI —high,
FUTUE —medium, FU
TAF —low, FUTSD —low, FU
TUU —medium, FUTDU —medium, and FU
T I —high,then the influence of potentially unanticipated consequences of 5G technology on societycould be high (46%) or nonexistent (46%), but public attitudes towards 5G technologies arenever unconcerned (8%).
7. Conclusions
As today is unthinkable without digital technologies, it is important to predict the sus-tainability of existing and new technologies. Technology creators, users, and investors needto understand whether it is worth investing in technology development and maintenance.
There are many methods of sustainability assessment that are labor-intensive and donot respect the specifics of digital technologies, such as cognition and self-developmentopportunities. Most methods are based on technology life cycle assessment, calculating theimpact on three pillars—business, society, and the environment. The environment pillarusually dominates. These methods are more useful for policy makers to evaluate largeindustrial and construction projects, but cannot be used by engineers for the assessment ofnew digital technologies.
Research on the nature of digital technologies is not yet sufficiently developed, butthe specific attributes of digital technologies determine their sustainability. Attributes

Mathematics 2021, 9, 2801 19 of 22
can be stochastic and their effects can be initially hidden, which poses serious risks inpreliminarily assessing the sustainability of digital technology.
The aim of this study was to find the influence of a set of uncertainty factors on thedevelopment of digital technology sustainability, which would allow for modifying theinitial assumptions and sustainability forecast.
The implementation of the research is reflected in the structure of the article. It wasnot possible to use the traditional waterfall method in the research, i.e., data collectionand statistical processing, analysis/model design/verification/validation/running, andsequential analysis of the obtained results. Unfortunately, there is limited research onthe nature and specifics of digital technologies, which determines the limited amount ofdata. As a result, modeling experiments had to be performed using a limited dataset,and served as a data source for the subsequent phases of the study: first, the analysis ofinformation sources, then conceptual modeling, then the design of a system dynamicsmodel, which formed a dataset for the construction of the Bayesian network structure, andthen a step back to implement repeated browsing of cognitive sources. This was necessaryto identify reference groups of digital technologies based on the impact of uncertainty riskfactors. In fact, agile research was carried out, which is not the best style and may givea slight impression of chaos in the implementation of the study. Perhaps, for the sake ofbetter transparency, it would have been more appropriate to divide the study into severalsuccessive stages and articles.
The results of modeling the interaction and impact dynamics of digital technologyattributes revealed that the influence of uncertainty factors on the sustainability of thetechnology is critical, but other attributes do not have significant impact.
There is a need to focus on the society pillar, but the influence of the business andenvironment pillars on the overall sustainability of the technology is negligible.
In order to be able to identify the uncertainties inherent in digital technologies, tech-nology stratification was performed using Dijkstra layers of abstraction. A set of hiddenand unanticipated factors was identified, and a BN model of factor interactions was de-veloped. The model depicts hidden and unanticipated influence probability propagationin the network, which allows for estimating the possible confidence interval of the initialsustainability forecast of digital technologies.
The approach developed by the authors of this article enables the designers, users,and investors of new technologies to interactively examine various scenarios of digitaltechnology sustainability development.
The bottleneck of the hidden and unanticipated factor influence model is the structureof the BN and the degree of event influence. For the time being, the model is robust, andthe effects are determined by the structure of the network, although it is simplicity thatallows for the method to remain useful. However, any expert can tailor the model to aspecific application.
The effects of hidden and unanticipated factors are fuzzy and stochastic, so theusefulness of using machine learning methods to identify factor values is questionable.Further, the use of semantic search to identify the effects of uncertainty that could be achallenging task will be explored.
Author Contributions: Data curation, J.C.R.; Investigation, E.G.; Methodology, E.G.; Resources, E.G.;Writing—original draft, E.G.; Writing—review & editing, E.G. All authors have read and agreed tothe published version of the manuscript.
Funding: This research was funded by LZP-2020/2-0397, Latent Impacts on Digital TechnologiesSustainability Development Assessment (LIASAM).
Institutional Review Board Statement: Not applicable.
Informed Consent Statement: Not applicable.
Conflicts of Interest: The authors declare no conflict of interest.

Mathematics 2021, 9, 2801 20 of 22
References1. Saurat, M.; Ritthoff, M.; Smith, L. SAMT. Deliverable D1.1 Overview of Existing Sustainability Assessment Methods and Tools,
and of Relevant Standards. Available online: https://www.spire2030.eu/SAMT (accessed on 17 July 2020).2. Ginters, E. New trends towards digital technology sustainability assessment. In Proceedings of the Fourth World Conference on
Smart Trends in Systems, Security and Sustainability (WorldS4), London, UK, 27–28 July 2020; pp. 184–189. [CrossRef]3. Ghosh, I. Zoom Is Now Worth More than the World′s 7 Biggest Airlines. Available online: https://www.visualcapitalist.com/
zoom-boom-biggest-airlines/ (accessed on 5 September 2020).4. Contractor, F.J.; Ra, W. How knowledge attributes influence alliance governance choices: A theory development note. J. Int.
Manag. 2002, 8, 11–27. [CrossRef]5. Committee on Forecasting Future Disruptive Technologies Division on Engineering and Physical Science. National Research
Council of the National Academies. Persistent Forecasting of Disruptive Technologies. 2010. Available online: https://www.nap.edu/read/12557/chapter/5#35 (accessed on 15 December 2020).
6. Characteristics of Complex Systems and How They Relate to Modern Software Development. 2019. Available online: https://jcfausto.com/6-characteristics-of-complex-systems-and-how-they-relate-to-modernsoftware-development/ (accessed on12 December 2020).
7. Technology Forecasting. 2020. Available online: https://en.wikipedia.org/wiki/Technology_forecasting (accessed on 5 December 2020).8. Exconde, J.; Gomez, R.; Magdaluyo, K.; Obang, K.; Que, P.; Sanchez, A.; Sevilla, S. The 10 Characteristics of Technology and Its
Impact on Communication. 2013. Available online: https://sci10sectionm.wordpress.com/2013/12/09/the-9-characteristicsof-technology/ (accessed on 20 November 2020).
9. Narendra, K.V. Characteristics of Technology, Transfer of Technology Process. Available online: https://www.youtube.com/watch?v=_hXMmifCUpI (accessed on 14 December 2020).
10. Ginters, E.; Dimitrovs, E. Latent impacts on digital technologies sustainability assessment and development. Adv. Intell. Syst.Comput. 2021, 1365, 3–13. [CrossRef]
11. Ginters, E.; Revathy, J.C. Attributes of digital technologies and related impacts on sustainability assessment. In Proceedings of theInternational Conference on Electrical, Communication, and Computer Engineering (ICECCE), Kuala Lumpur, Malaysia, 12–13June 2021; pp. 1–5. [CrossRef]
12. Beel, J.; Langer, S. An exploratory analysis of mind maps. In Proceedings of the 11th ACM Symposium on Document Engineering(DocEng′11), Mountain View, CA, USA, 19–22 September 2011; pp. 81–84.
13. Fisher, D. Modeling Dynamic Systems: Lessons for a First Course; ISEE Systems, Inc.: Lebanon, NH, USA, 2005; p. 300.14. Ginters, E. Attributes influence on digital technologies sustainability pillars. J. Affect. Disord. 2021, 125, 307–315. [CrossRef]15. Dijkstra, E.W. The humble programmer. ACM Turing Lecture 1972. Commun. ACM 1972, 15, 859–866. [CrossRef]16. Dijkstra, E.W. The structure of the “THE”-multiprogramming system. Commun. ACM 1968, 11, 342–346. [CrossRef]17. Dahl, O.-J.; Dijkstra, E.W.; Hoare, C.A.R. Structured Programming; Academic Press: London, UK; New York, NY, USA;
San Francisco, CA, USA, 1972.18. Market Data Forecast. Research Reports from Information Technology. 2021. Available online: https://www.marketdataforecast.
com/information-and-communication-technology (accessed on 12 July 2021).19. Market Data Forecast. Research Reports from Electronics and Semiconductor. 2021. Available online: https://www.
marketdataforecast.com/electronics-and-semiconductor (accessed on 12 July 2021).20. Market Data Forecast. Research Reports from Automation and Process Control. 2021. Available online: https://www.
marketdataforecast.com/automation-and-process-control (accessed on 12 July 2021).21. Market Data Forecast. Research Reports from Aerospace and Defense. 2021. Available online: https://www.marketdataforecast.
com/aerospace-defense (accessed on 12 July 2021).22. Market Data Forecast. Vehicle Tracking Systems Market. 2021. Available online: https://www.marketdataforecast.com/market-
reports/vehicle-tracking-systems-market (accessed on 12 July 2021).23. GlobeNewswire. Facts & Factors. 2021. Available online: https://www.globenewswire.com/news-release/2021/02/23/2180372
/0/en/Current-and-Upcoming-Trends-in-CryptoCurrency-Market-Cap-to-Hit-5-190-62-Million-by-2026-Soars-at-30-CAGR-Facts-Factors.html (accessed on 24 July 2021).
24. Research and Markets. Europe Digital Transformation Market to 2025—Regional Analysis and Forecasts by Components,Deployment Type and End-User. 2021. Available online: https://www.researchandmarkets.com/reports/4787360/europe-digital-transformation-market-to-2025 (accessed on 24 July 2021).
25. Research and Markets. Global Biometric Authentication and Identification Market: Focus on Modality (Face, Eye, Finger-print, Palm, and Vein), Motility, Application, and Technology Trends Analysis and Forecast: 2018–2023. 2019. Availableonline: https://www.researchandmarkets.com/reports/4761421/global-biometric-authentication-and?utm_source=BW&utm_medium=PressRelease&utm_code=mg4gg2&utm_campaign=1234279+-+Global+%2452Bn+Biometric+Authentication+%26+Identification+Market%2c+2023%3a+Focus+on+Modality%2c+Motility%2c+Application+and+Technology&utm_exec=joca220prd (accessed on 24 July 2021).
26. Fortune Business Insights. Cyber Security Market. 2021. Available online: https://www.fortunebusinessinsights.com/industry-reports/cyber-security-market-101165 (accessed on 30 July 2021).

Mathematics 2021, 9, 2801 21 of 22
27. Grand View Research. RFID Technology Market Worth $40.5 Billion by 2025 CAGR 14.7%. 2017. Available online: https://www.grandviewresearch.com/press-release/global-radio-frequency-identification-rfid-technology-market (accessed on 12 July 2021).
28. Gartner Research. Market Share: Analytics and Business Intelligence, Worldwide. 2019. Available online: https://www.gartner.com/en/documents/3985421/market-share-analytics-and-business-intelligence-worldwi (accessed on 19 July 2021).
29. ReportLinker. Predictive Analytics Market by Solution, Service, Deployment Mode, Organization Size, Vertical and Region—Global Forecast to 2025. 2020. Available online: https://www.reportlinker.com/p05073749/Predictive-Analytics-Market-by-Type-Deployment-Organization-Industry-Vertical-Global-Forecast-to.html?utm_source=GNW (accessed on 12 July 2021).
30. Mordor Intelligence. Edge Analytics Market—Growth, Trends, COVID-19 Impact, and Forecasts (2021–2026). 2020. Availableonline: https://www.mordorintelligence.com/industry-reports/edge-analytics-market (accessed on 19 July 2021).
31. Mordor Intelligence. Deep Learning Market—Growth, Trends, Forecasts (2020–2025). 2020. Available online: https://www.mordorintelligence.com/industry-reports/deep-learning (accessed on 12 July 2021).
32. Cision PR Newswire. News from Research and Markets. 2021. Available online: https://www.prnewswire.com/news/research-and-markets/ (accessed on 17 July 2021).
33. Popescu, C.R.G. Sustainability assessment: Does the OECD/G20 inclusive framework for BEPS (Base Erosion and Profit ShiftingProject) put an end to disputes over the recognition and measurement of intellectual capital? Sustainability 2020, 12, 10004.[CrossRef]
34. Ginters, E. Digital technologies acceptance/adoption modeling respecting age factor. Adv. Intell. Syst. Comput. 2020, 1160,621–630. [CrossRef]
35. Strauss, H.W.; Ohtsuki, K. Seeing is believing. J. Nucl. Med. 2019, 38, 1672–1674.36. Logistics. Available online: https://jasoren.com/logistics/ (accessed on 20 July 2021).37. Kyselova, V. Pancakes in a Virtual Kitchen and Online Fitting—How Retail Uses AR/VR. Available online: https://jasoren.com/
pancakes-in-a-virtual-kitchen-and-online-fitting-how-retail-uses-ar-vr/ (accessed on 20 July 2021).38. Kiryakova, G.; Angelova, N.; Yordanova, L. The potential of augmented reality to change the business. Trakia J. Sci. 2017, 15,
394–401. [CrossRef]39. Gaudiosi, J. How Ford Goes Further with Virtual Reality. 2015. Available online: http://fortune.com/2015/09/23/ford-virtual-
reality/ (accessed on 20 July 2021).40. Blissing, B.; Bruzelius, F.; Olvander, J. Augmented and mixed reality as a tool for evaluation of vehicle active safety systems. In
Proceedings of the Int. Conf. Road Safety and Simulation (RSS2013), Rome, Italy, 23–25 October 2013.41. VR/AR in Automotive Industry: Manufacture, Buy, and Drive Cars Smarter. Available online: https://wear-studio.com/blog/
heavy-industry/vr-ar-in-automotive-industry-manufacture-buy-and-drive-cars-smarter/ (accessed on 20 July 2021).42. Oh, K. Service prototyping for service testing in virtual reality. Int. J. Inf. Electron. Eng. 2013, 3, 304–308. [CrossRef]43. Hofmann, T.; König, C.; Bruder, R.; Bergner, J. How to reduce workload—Augmented reality to ease the work of air traffic
controllers. Work 2012, 41, 1168–1173. [CrossRef] [PubMed]44. Alissandrakis, A.; Reski, N. Using mobile augmented reality to facilitate public engagement. In Proceedings of the Extended
Papers of the International Symposium on Digital Humanities (DH 2016), Växjö, Sweden, 7–8 November 2016; pp. 99–109.Available online: http://ceur-ws.org/Vol-2021/paper5.pdf (accessed on 15 July 2021).
45. Thomas Cook Virtual Reality Holiday ‘Try before You Fly’. 2018. Available online: https://visualise.com/case-study/thomas-cook-virtual-holiday (accessed on 20 July 2021).
46. Jose, S. Replay FlyingLab. 2016. Available online: https://www.flyinglab.aero/en/fra-sjc/ (accessed on 20 July 2021).47. Research and Markets. Global Small Satellites Market—Analysis and Forecast: 2017 to 2021 Focus on Types, Subsystems and End
Users. 2017. Available online: https://www.researchandmarkets.com/research/fg57d6/global_2_5 (accessed on 20 July 2021).48. Future Market Insights. Small Satellite Market. 2017. Available online: https://www.futuremarketinsights.com/reports/small-
satellite-market (accessed on 20 July 2021).49. Marr, B. What is the Impact of Artificial Intelligence (AI) on Society? Available online: https://bernardmarr.com/what-is-the-
impact-of-artificial-intelligence-ai-on-society/ (accessed on 6 August 2021).50. Cho, R. Artificial Intelligence—A Game Changer for Climate Change and the Environment. 2018. Available online: https:
//news.climate.columbia.edu/2018/06/05/artificial-intelligence-climate-environment/ (accessed on 2 May 2021).51. Accenture. 3 Reasons to Consider Robots in Your Business. 2020. Available online: https://www.accenture.com/nl-en/blogs/
insights/3-reasons-to-consider-robots-in-your-business (accessed on 4 August 2021).52. GPS Market Size Worth $146.4 Billion by 2025 CAGR: 18.4%. 2018. Available online: https://www.grandviewresearch.com/
press-release/global-positioning-systems-gps-market-analysis (accessed on 5 August 2021).53. Video Streaming Market Size, Share & Trends Analysis Report by Streaming Type, by Solution, by Platform, by Service,
by Revenue Model, by Deployment Type, by User, by Region, and Segment Forecasts, 2021–2028. 2021. Available online:https://www.grandviewresearch.com/industry-analysis/video-streaming-market (accessed on 5 August 2021).
54. Wilson, S. The Era of Antisocial Social Media. 2020. Available online: https://hbr.org/2020/02/the-era-of-antisocial-social-media(accessed on 2 August 2021).
55. Denton, J. Overconfidence: Why It′s Mostly Men Under 30 Trading Bitcoin. 2021. Available online: https://www.marketwatch.com/story/overconfidence-why-its-mostly-men-under-30-trading-bitcoin-11612473601 (accessed on 8 August 2021).

Mathematics 2021, 9, 2801 22 of 22
56. Kinsella, B. Voice Assistant Demographic Data—Young Consumers More Likely to Own Smart Speakers While Over 60 Biastoward Alexa and Siri. 2019. Available online: https://voicebot.ai/2019/06/21/voice-assistant-demographic-data-young-consumers-more-likely-to-own-smart-speakers-while-over-60-bias-toward-alexa-and-siri/ (accessed on 4 August 2021).
57. Engineers Create a Robot That Can ‘Imagine′ Itself. 2019. Available online: https://www.sciencedaily.com/releases/2019/01/190130175621.htm (accessed on 4 August 2021).
58. Dacko, S.G. Enabling smart retail settings via mobile augmented reality shopping apps. Technol. Forecast. Soc. Chang. 2017, 124,243–256. [CrossRef]
59. Boucher, P.; Nascimento, S.; Kritikos, M. How blockchain technology could change our lives. Eur. Parliam. 2017, PE 581.948, 4–25.60. Makridakis, S.; Polemitis, A.; Giaglis, G.; Louca, S. Blockchain: The Next Breakthrough in the Rapid Progress of AI. 2018.
Available online: https://www.intechopen.com/chapters/60772 (accessed on 4 August 2021).61. Waheed, A.; Shafi, J. Successful role of smart technology to combat COVID-19. In Proceedings of the Fourth International
Conference on I-SMAC (IoT in Social, Mobile, Analytics and Cloud) (I-SMAC), Coimbatore, India, 7–9 October 2020; pp. 772–777.[CrossRef]
62. Lin, L.; Hou, Z. Combat COVID-19 with artificial intelligence and big data. J. Travel Med. 2020, 27, taaa080. [CrossRef] [PubMed]63. Ueafuea, K.; Boonnag, C.; Sudhawiyangkul, T.; Leelaarporn, P.; Gulistan, A.; Chen, W.; Mukhopadhyay, S.C.; Wilaiprasitporn, T.;
Piyayotai, S. Potential applications of mobile and wearable devices for psychological support during the COVID-19 pandemic: AReview. IEEE Sens. J. 2021, 21, 7162–7178. [CrossRef]
64. Heuts, P. DHL Experiments with Augmented Reality. 2017. Available online: https://www.etui.org/sites/default/files/ez_import/Hesamag_16_EN-22-26.pdf (accessed on 3 September 2021).
65. Goodwin, B. Virtual Reality Simulation Helps KLM Engineers Escape in an Emergency. Available online: https://www.computerweekly.com/news/450414139/Virtual-reality-simulation-helps-KLM-engineers-escape-in-an-emergency (accessed on20 July 2021).
66. Pool, R. Virtual and Augmented Reality Tech Joins the Fight against Crime. 2019. Available online: https://spie.org/news/spie-professional-magazine-archive/2019-january/ar/vr-tech-joins-the-fight-against-crime (accessed on 20 July 2021).
67. Han, A.; Pereira, L.M.; Lenaerts, T.; Santos, F.C. Mediating Artificial Intelligence Developments through Negative and PositiveIncentives. arXiv 2020, arXiv:2010.00403. Available online: https://arxiv.org/abs/2010.00403 (accessed on 3 September 2021).
68. Molla, R.; Wagner, K. People Spend Almost as Much Time on Instagram as They Do on Facebook. 2018. Available online: https://www.vox.com/2018/6/25/17501224/instagram-facebook-snapchat-time-spent-growth-data (accessed on 3 September 2021).
69. MacMillan, A. Millennials Who Use More Social Media Sites Have Higher Depression, Anxiety. 2016. Available online:https://www.health.com/condition/depression/multiple-social-media-sites-depression-anxiety (accessed on 2 August 2021).
70. Brian, K. Mining Bitcoin Can be More of an Energy Drain than Actual Mining. 2018. Available online: https://gizmodo.com/mining-bitcoin-can-be-more-of-an-energy-drain-than-actu-1830217426 (accessed on 3 August 2021).
71. Somers, M. The Risks and Unintended Consequences of Blockchain. 2019. Available online: https://mitsloan.mit.edu/ideas-made-to-matter/risks-and-unintended-consequences-blockchain (accessed on 16 May 2021).
72. Tryggestad, E. When the Roll Is Called up Yonder, Alexa Answers. 2019. Available online: https://christianchronicle.org/when-the-roll-is-called-up-yonder-alexa-answers/ (accessed on 4 August 2021).
73. Amazon Cleared after Alexa Ad ‘Triggers Cat Food Order’. 2018. Available online: https://news.sky.com/story/amazon-cleared-after-alexa-ad-triggers-cat-food-order-11249840 (accessed on 4 August 2021).
74. Estes, B. Geolocation—The Risk and Benefits of a Trending Technology. 2016. Available online: https://www.isaca.org/resources/isaca-journal/issues/2016/volume-5/geolocationthe-risk-and-benefits-of-a-trending-technology (accessed on 15 May 2021).
75. Kemp, S. Digital 2021: Global Overwiev Report. 2021. Available online: https://datareportal.com/reports/digital-2021-global-overview-report (accessed on 2 August 2021).
76. Lin, Y. 10 Mobile Usage Statistics Every Marketer Should Know in 2021. Available online: https://www.oberlo.com/blog/mobile-usage-statistics (accessed on 5 August 2021).
77. Stephenson, T.A. An Introduction to Bayesian Network Theory and Usage; IDIAP Research Report 00-03; IDIAP: Valais, Swizterland,2000; p. 31.
78. Simsekler, M.C.E.; Qazi, A. Adoption of a Data-Driven Bayesian Belief Network Investigating Organizational Factors ThatInfluence Patient Safety. Risk Anal. 2020. [CrossRef] [PubMed]
79. Ginters, E. Digital Technology Unanticipated Factors Influence on Sustainability Forecast. 2021. Available online: https://doi.org/10.5281/zenodo.5515604 (accessed on 18 September 2021).