Hewson Amar et al. 2007 changes in british woodland birds IBIS
15
Ibis (2007), 149 (Suppl. 2), 14–28 © 2007 The Authors Journal compilation © 2007 British Ornithologists’ Union Blackwell Publishing Ltd Recent changes in bird populations in British broadleaved woodland CHRIS M. HEWSON, 1 * ARJUN AMAR, 2 JEREMY A. LINDSELL, 2 RICHARD M. THEWLIS, 1 SIMON BUTLER, 2 KEN SMITH 2 & ROBERT J. FULLER 1 1 British Trust for Ornithology, The Nunnery, Thetford, Norfolk IP24 2PU, UK 2 The Royal Society for the Protection of Birds, The Lodge, Sandy, Beds. SG19 2DL, UK This paper presents estimated national and regional changes in numbers of breeding woodland birds in predominantly broadleaved woodland in Britain between the mid 1980s and 2003–04, derived from the Repeat Woodland Bird Survey (RWBS). A total of 405 sites across Britain for which historical data on bird populations were available were re-surveyed by BTO and RSPB fieldworkers during the RWBS. Changes were estimated separately for sites surveyed by the RSPB (n = 252) and BTO (n = 153) because of differences between the two groups in the field methods used in the original surveys. Changes between the 1960s and 1970s and 2003–04 were also estimated with the BTO data set only. The BTO and RSPB sites provide geographically complementary coverage of Britain and together provide much more widespread coverage than did the Common Bird Census (CBC), the former national monitoring scheme. Nationally, between the 1980s and 2003–04, six species declined significantly and three increased significantly based on the RSPB data, whereas eight declined and 13 increased according to the BTO data, with good correspondence between the changes recorded by the two data sets (only seven of 34 species showing trends differing in direction). Eight species showed large national declines (> 25%) according to both data sets: Garden Warbler Sylvia borin, Lesser Redpoll Carduelis cabaret, Lesser Spotted Woodpecker Dendrocopos minor, Spotted Flycatcher Muscicapa striata, Tree Pipit Anthus trivialis, Willow Tit Poecile montanus, Willow Warbler Phylloscopus trochilus and Wood Warbler P. sibilatrix. Eleven species showed large national increases (> 25%) in both data sets: Blackcap Sylvia atricapilla, Blue Tit Cyanistes caeruleus, Common Chiffchaff Phylloscopus collybita, Coal Tit Periparus ater, Great Spotted Woodpecker Dendrocopos major, Great Tit Parus major, Green Woodpecker Picus viridis, Goldcrest Regulus regulus, European Robin Erithacus rubecula, Eurasian Treecreeper Certhia familaris and Winter Wren Troglodytes troglodytes. Analysis of the longer-term changes using the BTO data set showed significant declines between the 1960s and 2003–04 in seven species and increases in 12 species. The large declines detected by the national monitoring schemes (CBC/BBS) for Lesser Spotted Woodpecker, Lesser Redpoll, Spotted Flycatcher, Tree Pipit, Willow Tit, Willow Warbler and Wood Warbler were all confirmed by the RWBS but the declines of the Common Bullfinch Pyrrhula pyrrhula, Marsh Tit Poecile palustris and Mistle Thrush Turdus viscivorus were not clearly supported. The declines detected by the RWBS for Garden Warbler, Pied Flycatcher Ficedula hypoleuca and Common Redstart Phoenicurus phoenicurus were not evident from the national monitoring schemes. Most of the increases detected by the monitoring schemes were confirmed by the RWBS. However, the large increases detected by the RWBS for Coal Tit, Goldcrest, Great Tit and Eurasian Treecreeper were unexpected. All long-distance migrants have declined whilst medium-distance migrants (Blackcap and Common Chiffchaff) have increased. Also, rare and specialist woodland species have fared less well than common and generalist species. *Corresponding author. Email: [email protected]
Transcript of Hewson Amar et al. 2007 changes in british woodland birds IBIS
Ibis
(2007),
149
(Suppl. 2), 14–28
© 2007 The Authors Journal compilation © 2007 British Ornithologists’ Union
Blackwell Publishing Ltd
Recent changes in bird populations in British broadleaved woodland
CHRIS M. HEWSON,
1
* ARJUN AMAR,
2
JEREMY A. LINDSELL,
2
RICHARD M. THEWLIS,
1
SIMON BUTLER,
2
KEN SMITH
2
& ROBERT J. FULLER
1
1
British Trust for Ornithology, The Nunnery, Thetford, Norfolk IP24 2PU, UK
2
The Royal Society for the Protection of Birds, The Lodge, Sandy, Beds. SG19 2DL, UK
This paper presents estimated national and regional changes in numbers of breedingwoodland birds in predominantly broadleaved woodland in Britain between the mid 1980sand 2003–04, derived from the Repeat Woodland Bird Survey (RWBS). A total of 405 sitesacross Britain for which historical data on bird populations were available were re-surveyedby BTO and RSPB fieldworkers during the RWBS. Changes were estimated separately forsites surveyed by the RSPB (
n
=
252) and BTO (
n
=
153) because of differences betweenthe two groups in the field methods used in the original surveys. Changes between the 1960sand 1970s and 2003–04 were also estimated with the BTO data set only. The BTO and RSPBsites provide geographically complementary coverage of Britain and together provide muchmore widespread coverage than did the Common Bird Census (CBC), the former nationalmonitoring scheme. Nationally, between the 1980s and 2003–04, six species declinedsignificantly and three increased significantly based on the RSPB data, whereas eight declinedand 13 increased according to the BTO data, with good correspondence between thechanges recorded by the two data sets (only seven of 34 species showing trends differing indirection). Eight species showed large national declines (
>
25%) according to both data sets:Garden Warbler
Sylvia borin
, Lesser Redpoll
Carduelis cabaret
, Lesser Spotted Woodpecker
Dendrocopos minor
, Spotted Flycatcher
Muscicapa striata
, Tree Pipit
Anthus trivialis
, WillowTit
Poecile montanus
, Willow Warbler
Phylloscopus trochilus
and Wood Warbler
P. sibilatrix
.Eleven species showed large national increases (
>
25%) in both data sets: Blackcap
Sylviaatricapilla
, Blue Tit
Cyanistes caeruleus
, Common Chiffchaff
Phylloscopus collybita
, Coal Tit
Periparus ater
, Great Spotted Woodpecker
Dendrocopos major
, Great Tit
Parus major
, GreenWoodpecker
Picus viridis
, Goldcrest
Regulus regulus
, European Robin
Erithacus rubecula
,Eurasian Treecreeper
Certhia familaris
and Winter Wren
Troglodytes troglodytes
. Analysis ofthe longer-term changes using the BTO data set showed significant declines between the1960s and 2003–04 in seven species and increases in 12 species. The large declines detectedby the national monitoring schemes (CBC/BBS) for Lesser Spotted Woodpecker, LesserRedpoll, Spotted Flycatcher, Tree Pipit, Willow Tit, Willow Warbler and Wood Warbler wereall confirmed by the RWBS but the declines of the Common Bullfinch
Pyrrhula pyrrhula
,Marsh Tit
Poecile palustris
and Mistle Thrush
Turdus viscivorus
were not clearly supported.The declines detected by the RWBS for Garden Warbler, Pied Flycatcher
Ficedula hypoleuca
and Common Redstart
Phoenicurus phoenicurus
were not evident from the national monitoringschemes. Most of the increases detected by the monitoring schemes were confirmed by theRWBS. However, the large increases detected by the RWBS for Coal Tit, Goldcrest, GreatTit and Eurasian Treecreeper were unexpected. All long-distance migrants have declinedwhilst medium-distance migrants (Blackcap and Common Chiffchaff ) have increased. Also,rare and specialist woodland species have fared less well than common and generalist species.
*Corresponding author. Email: [email protected]

© 2007 The AuthorsJournal compilation © 2007 British Ornithologists’ Union
Recent changes in British woodland bird populations
15
In recent years, there has been growing concernabout declines in woodland bird populations in theUK. The UK Government’s Wildbird PopulationsFramework Indicator for woodland birds fell by 20%between 1976 and 2001 (Defra 2005) and a numberof woodland breeding species have been added tothe red and amber lists of Birds of Conservation Con-cern (Gregory
et al
. 2002). These declines have beendetected through the BTO Common Birds Census(CBC) (which gives information from 1966 to 2000)and the BTO/JNCC/RSPB Breeding Bird Survey(BBS) (which gives information from 1994 to thepresent). The data from these two monitoring schemeshave been combined to give a continuous CBC/BBStrend (Freeman
et al
. 2007). The CBC was based ona non-randomly selected set of sites with a strongbias towards the south and east of Britain andthere was considerable turnover of sites contributing(Marchant
et al
. 1990), so it is unclear how representa-tive CBC population trends are of the whole country.These limitations of the CBC have largely beenaddressed in the BBS though this still suffers fromsmall sample sizes of sites containing rare and localizedspecies.
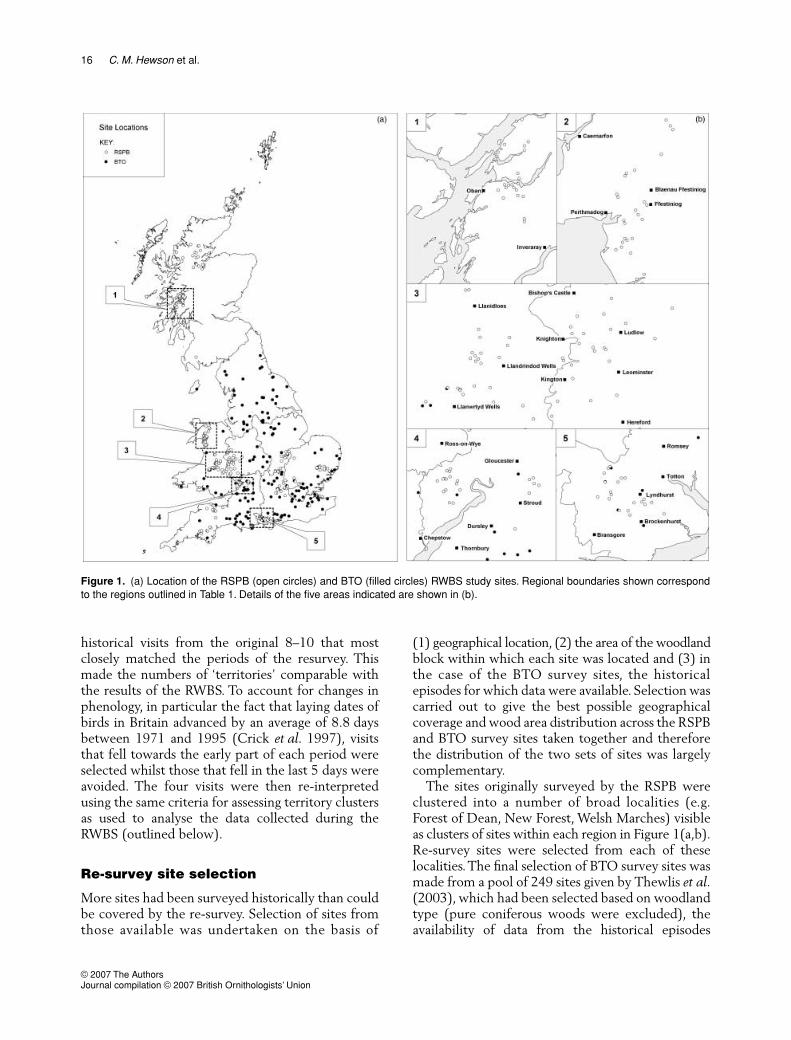
The Repeat Woodland Bird Survey (RWBS) wasdesigned to provide information on regional changesin woodland bird populations and assess the reliabilityof the combined CBC/BBS trends at the nationalscale. Surveys were conducted in broadleaved ormixed woodland sites (sites where at least 20% of treeswere broadleaved species) that had been originallysurveyed either as CBC plots or as part of an extensivesurvey of woodland bird populations undertakenby the RSPB in the mid-1980s. Identical surveymethods to the original surveys were used within eachsite, thus allowing population changes to be assessedthrough direct comparison of counts made at the samesites in the different time periods.
This paper reports population changes both nation-ally and regionally based on the 405 sites coveredby the RWBS. Two sets of sites are used: (1) 253sites surveyed by the RSPB in the 1980s and againin 2003–04 using point counts and (2) 152 sitessurveyed using territory mapping as part of the BTO’sCBC scheme during at least one of three historicaltime periods (1960s, 1970s and 1980s) and again in2003–04. The BTO data are thus not completelyindependent of the data used to calculate the initialCBC trends but by re-visiting the same sites for whichhistorical information is available, and by stratifyingsite selection across regions, the potential problemsof site turnover and regional bias in the original CBC
have been largely overcome. Although these BTOsurvey sites represent a non-random sample of poten-tial woodland sites within Britain, the sites coveredby the RSPB contrast in a number of characteristicsand provide a complementary data set. In particular,the RSPB sites are generally within larger blocks ofwoodland situated in less human-dominated land-scapes and provide better coverage of northern andwestern parts of Britain. The combined data set thusprovides wider and more representative geographicalcoverage of Britain than did the CBC (Fig. 1).
Population changes are estimated separately forRSPB and BTO data sets due to the different surveymethods and response variables employed. However,comparisons are made of the results obtained fromthe two data sets in order to assess the robustnessof conclusions reached. Thus, the different surveymethods employed on the RSPB and BTO surveysites allow assessment of the generality of populationchanges independent of survey method and sitetype. Comparisons are also made between the findingsof the present study and population changes deter-mined by the CBC/BBS to highlight differences inthe reported trends.
METHODS
Survey design
Information on bird numbers was available for threehistorical periods, which are referred to as surveyepisodes. These were: 1965–72, 1973–80 and 1981–88. Data for the first two episodes were availableonly for the BTO data set; data from the third episodewere available for both the RSPB and the BTO data sets.
All historical data from the RSPB point countswere collected from each site in a single year between1982 and 1988. These same sites were again surveyedmostly in just a single year of the RWBS (2003–04),with around 20% of sites in each region (
n
=
56 intotal) being surveyed in both years to provide infor-mation on interannual variation.
Historical data were available for most CBC sitesfor multiple years, so two years were chosen at randomfor inclusion in the study when more than one wasavailable from each of the survey episodes. Of the153 CBC sites, 127 were re-surveyed in both 2003and 2004; the remainder were surveyed in one yearonly. The re-survey consisted of just four visits forterritory mapping (rather than the 8–10 visits usedhistorically) and so the census maps for the selectedhistorical years were re-interpreted, using four
16
C. M. Hewson
et al.
© 2007 The Authors Journal compilation © 2007 British Ornithologists’ Union
historical visits from the original 8–10 that mostclosely matched the periods of the resurvey. Thismade the numbers of ‘territories’ comparable withthe results of the RWBS. To account for changes inphenology, in particular the fact that laying dates ofbirds in Britain advanced by an average of 8.8 daysbetween 1971 and 1995 (Crick
et al
. 1997), visitsthat fell towards the early part of each period wereselected whilst those that fell in the last 5 days wereavoided. The four visits were then re-interpretedusing the same criteria for assessing territory clustersas used to analyse the data collected during theRWBS (outlined below).
Re-survey site selection
More sites had been surveyed historically than couldbe covered by the re-survey. Selection of sites fromthose available was undertaken on the basis of
(1) geographical location, (2) the area of the woodlandblock within which each site was located and (3) inthe case of the BTO survey sites, the historicalepisodes for which data were available. Selection wascarried out to give the best possible geographicalcoverage and wood area distribution across the RSPBand BTO survey sites taken together and thereforethe distribution of the two sets of sites was largelycomplementary.
The sites originally surveyed by the RSPB wereclustered into a number of broad localities (e.g.Forest of Dean, New Forest, Welsh Marches) visibleas clusters of sites within each region in Figure 1(a,b).Re-survey sites were selected from each of theselocalities. The final selection of BTO survey sites wasmade from a pool of 249 sites given by Thewlis
et al
.(2003), which had been selected based on woodlandtype (pure coniferous woods were excluded), theavailability of data from the historical episodes
Figure 1. (a) Location of the RSPB (open circles) and BTO (filled circles) RWBS study sites. Regional boundaries shown correspondto the regions outlined in Table 1. Details of the five areas indicated are shown in (b).
© 2007 The AuthorsJournal compilation © 2007 British Ornithologists’ Union
Recent changes in British woodland bird populations
17
(maps for at least 1 and preferably 2 years in atleast one of the historical survey episodes had to beavailable at BTO HQ) and species compositionduring historical surveys (plots had to contain one of thefollowing species, to ensure adequate representationof species thought to have declined on the basis ofCBC trends: Willow Tit
Poecile montanus
, MarshTit
P. palustris
, Tree Pipit
Anthus trivialis
, SpottedFlycatcher
Muscicapa striata
, Lesser Spotted Wood-pecker
Dendrocopos minor
, Dunnock
Prunella modularis
,Willow Warbler
Phylloscopus trochilus
, Lesser Redpoll
Carduelis cabaret
, Hawfinch
Coccothraustes cocco-thraustes
and Common Bullfinch
Pyrrhula pyrrhula
).In practice, the species criterion was rarely decisiveas virtually all plots had historical records of at leastone of the key species.
All potential re-survey sites were categorized byregion (Table 1), and the area of the block of con-tiguous broadleaved woodland in which they wereembedded was calculated using the digitized GISlayer of the National Inventory of Trees and Wood-land (NIWT) (Forestry Commission 2003). Allwoodland types were considered except stands of pureconifer. Contiguous polygons of the same woodlandtype were considered as one unit for our purposesand polygons were considered contiguous if theywere closer than 10 m to each other. Sites were thenassigned to one of the following size classes ofwoodland blocks:
<
20 ha, 20–50 ha, 50–100 ha,100–500 ha and
>
500 ha. In the case of the BTOsites, a further classification was used for woods ofless than 10 ha that were embedded in a farmlandmatrix to allow us to include a sample of sites todetermine whether population trends in small farm
woods were different from those in other woods.The results of these analyses are reported in Amar
et al
. (2006).Within each region and size class, sites were ran-
domly selected from each RSPB locality and fromthe overall BTO pool. The BTO selection was thenchecked to ensure (1) that each historical surveyperiod was covered by an adequate sample of sitesand (2) that at least 20 small farm woods had beenincorporated in the total sample. Substitutions weremade with sites from the original pool until thesecriteria were satisfied. Following this initial selection,the combined RSPB and BTO selection was thenoverlaid onto a 100-km grid and substitutions of siteswere made from the remaining pool, where possible,to ensure as even coverage as possible at this spatialscale in the overall site selection.
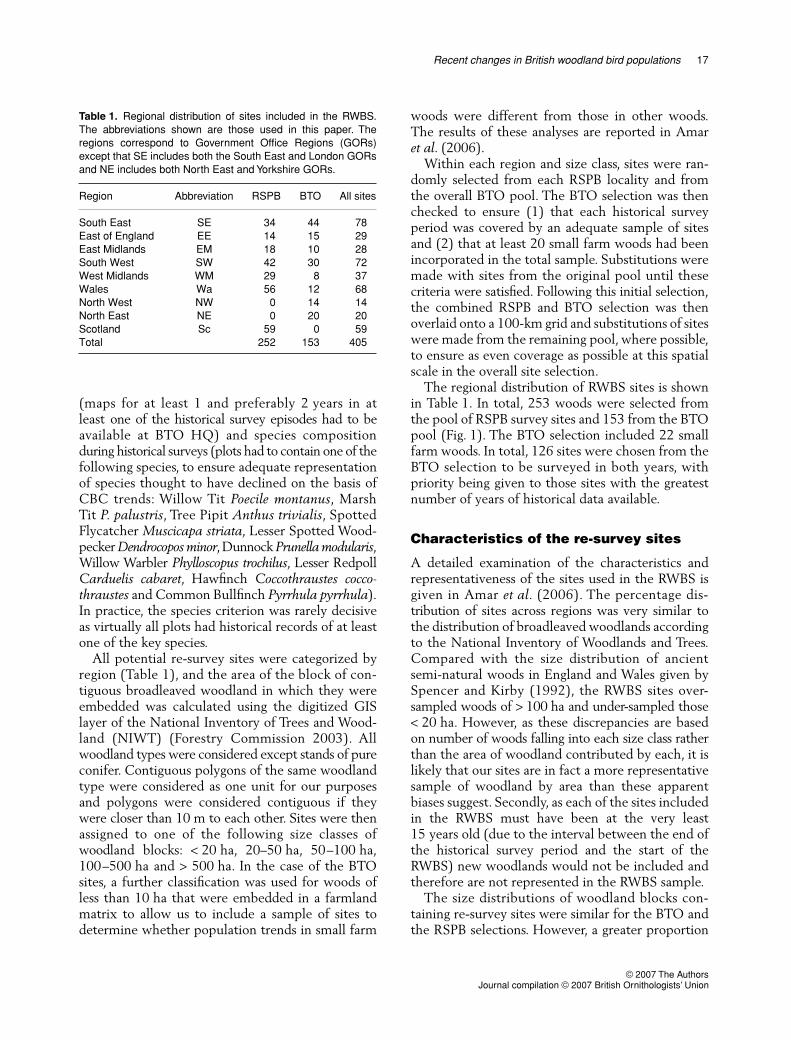
The regional distribution of RWBS sites is shownin Table 1. In total, 253 woods were selected fromthe pool of RSPB survey sites and 153 from the BTOpool (Fig. 1). The BTO selection included 22 smallfarm woods. In total, 126 sites were chosen from theBTO selection to be surveyed in both years, withpriority being given to those sites with the greatestnumber of years of historical data available.
Characteristics of the re-survey sites
A detailed examination of the characteristics andrepresentativeness of the sites used in the RWBS isgiven in Amar
et al
. (2006). The percentage dis-tribution of sites across regions was very similar tothe distribution of broadleaved woodlands accordingto the National Inventory of Woodlands and Trees.Compared with the size distribution of ancientsemi-natural woods in England and Wales given bySpencer and Kirby (1992), the RWBS sites over-sampled woods of
>
100 ha and under-sampled those
<
20 ha. However, as these discrepancies are basedon number of woods falling into each size class ratherthan the area of woodland contributed by each, it islikely that our sites are in fact a more representativesample of woodland by area than these apparentbiases suggest. Secondly, as each of the sites includedin the RWBS must have been at the very least15 years old (due to the interval between the end ofthe historical survey period and the start of theRWBS) new woodlands would not be included andtherefore are not represented in the RWBS sample.
The size distributions of woodland blocks con-taining re-survey sites were similar for the BTO andthe RSPB selections. However, a greater proportion
Table 1. Regional distribution of sites included in the RWBS.The abbreviations shown are those used in this paper. Theregions correspond to Government Office Regions (GORs)except that SE includes both the South East and London GORsand NE includes both North East and Yorkshire GORs.
Region Abbreviation RSPB BTO All sites
South East SE 34 44 78East of England EE 14 15 29East Midlands EM 18 10 28South West SW 42 30 72West Midlands WM 29 8 37Wales Wa 56 12 68North West NW 0 14 14North East NE 0 20 20Scotland Sc 59 0 59Total 252 153 405
18
C. M. Hewson
et al.
© 2007 The Authors Journal compilation © 2007 British Ornithologists’ Union
of BTO sites fell in woods of
<
20 ha and a greaterproportion of RSPB sites fell in woods of 100–500 ha. Woodland blocks containing BTO sites alsotended to be surrounded by more human-alteredlandscapes (e.g. arable/horticultural land, improvedgrassland, urban/suburban areas) than those con-taining RSPB sites. Differences in the geographicaldistributions of the two samples of sites (Table 1,Fig. 1) meant the RSPB survey sites provided bettercoverage than the BTO of the ranges of species asso-ciated with deciduous oak
Quercus
woodlands alongthe Atlantic seaboard of Britain (e.g. Pied Flycatcher
Ficedula hypoleuca
, Common Redstart
Phoenicurusphoenicurus
and Wood Warbler
Phylloscopus sibilatrix
).Therefore, the population changes for these speciesderived from the RSPB data set are likely to be morereliable.
Bird survey methods
To ensure data collected during the re-survey weredirectly comparable with the historical data availablefor each site, survey methods were made as similar aspossible to those used in the original surveys. Thetwo re-surveys therefore used two different censusmethods depending on the site – point counts in thecase of the RSPB sites and four-visit mapping censusesin the case of the BTO surveys.
For the RSPB surveys, a random number table wasused to select points based on their grid referencewithin the area sampled by the original surveys, withno point being closer than 50 m to the edge of thewood and no two points being closer than 100 m ofeach other. Points were marked on a map, located inthe field using a GPS and then marked with flaggingtape during a reconnaissance visit, to allow easyrelocation. In most cases, ten points were surveyedper site but there was some variation between sitesand survey episodes. Two visits were made to eachpoint, one in April or the first week of May andanother in the last 3 weeks of May or first half of June.The timing of the two visits roughly correspondedwith the historical survey but, where possible, wasup to 1 week earlier to account for changes inphenology (Crick
et al
. 1997, Crick & Sparks 1999)since the 1980s. All bird counts were carried out inthe morning, starting within 1 h of dawn and werecompleted by midday. Counts were not made inheavy rain or in strong or cold winds. The order inwhich the points were visited was reversed for thesecond visit. On arrival at the point, observerswaited 5 min then started counting all individuals
seen or heard for 5 min. Birds were recorded in twodistance categories although the distance bandsare not used in the analyses presented here. Countsin visit 1 and visit 2 are treated separately in theanalyses.
For the BTO surveys, observers carried out areconnaissance visit during which they familiarizedthemselves with the site using a map showing itsboundaries on which they marked prominentfeatures using a GPS. This facilitated orientationduring the bird surveys. The same territory mappingmethods were used as for the original CBC surveys(Marchant 1983) except that four visits were madeto each site rather than 8–10. The visits were spreadbetween late March/early April and early June; visit1 was made by 16 April, visit 2 by 8 May, visit 3 by29 May and visit 4 by 15 June in each year. Criteriamodified from those given by Marchant (1983) wereused for interpreting the census maps based on fourrather than 8–10 visits. Full details of the criteriaused can be found in Amar
et al
. (2006).Note that we use the word ‘territories’ in this
report to signify the clusters of registrations identi-fied during map interpretation. These clusters areinterpretations influenced by the criteria applied andthe application of these criteria by the map analyst,as well as by the degree of survey effort applied.They are therefore ‘pseudo-territories’ that give anindex of abundance for each species at each site ratherthan an absolute value of the number of territoriespresent. A sole analyst carried out virtually all of themap interpretation for the project (both historicaland re-survey maps) and applied consistent criteriathroughout, so our data are internally consistent,making comparisons within the data set robust.
Statistical analysis
All data were analysed using SAS version 8 (SASInstitute 1999). Generalized Linear Mixed Models(GLMMs) were used to estimate changes in thenumber of birds recorded per point (RSPB data) and‘territories’ per ha (BTO data) between surveyepisodes (i.e. 1980s vs. 2003–04 for RSPB data and1960s, 1970s and 1980s vs. 2003–04 for BTO data).The use of mixed models allowed us to control forpseudoreplication in the data and to control theuse of data from different combinations of sites andyears to calculate population changes between thesurvey episodes. This in turn allowed us to controlfor short-term fluctuations in populations whenexamining underlying population trends.
© 2007 The AuthorsJournal compilation © 2007 British Ornithologists’ Union
Recent changes in British woodland bird populations
19
Analyses incorporated data from the historicalsurvey episode in the 1980s and the contemporarysurvey (2003–04). These analyses were run separatelyfor RSPB and BTO data, with different modelstructures (random terms) to account for the differentsurvey structures (see later). Analyses incorporatingdata from all three historical survey episodes toassess changes between the 1960s, 1970s, 1980s and2003–04 were also run for the BTO data (but resultsfor change between the 1980s and 2003–04 derivedfrom this model are not presented).
For comparison, population changes were calculatedfor equivalent time intervals from the combinedCBC/BBS index for all habitats by taking the meanof index values for the middle 2 years of each histori-cal survey episode (1968/69, 1976/77 and 1984/85)and the mean of 2003/04.
Model formulation
The number of birds recorded at all points at a siteon a given visit during the RSPB surveys, or numberof ‘territories’ estimated from the BTO mappingcensus in a given year, were used as response variables.Only sites in which a species was recorded on atleast one occasion in any episode were included ineach analysis. In models of RSPB data, the log of thenumber of points surveyed was included as an offsetto control for variation between sites and visits inthe number of points at which counts were carriedout. The log of plot area was included as an offset inmodels of BTO data to provide estimates of numberof ‘territories’ per hectare from model outputs. Thus,model outputs gave parameter estimates in units ofbirds per point for RSPB data and ‘territories’ perhectare for BTO data.
For all models using count data we assumed aPoisson error structure with a log link function.Denominator degrees of freedom were estimatedusing Satterthwaite’s formula (Littell
et al
. 1996). Toexamine changes in regional and national populationswe specified the following variables as categoricalfixed effects in the models: survey episode (1960s,1970s, 1980s or 2003–04), region, and the interac-tion between survey episode and region (surveyepisode*region). Values for the numbers of birdsper point or ‘territories’ per hectare counted wereobtained through the back transformation of LeastSquare Means (LSMs) and were used to calculateproportional changes. The statistical significanceof the differences in numbers between episodes orregions was examined through type III analyses
using the difference in Least Square Mean tests(DLSMs).
Models of RSPB data also included visit (either earlyor late) as a permanent fixed effect. We includedfive random effects in the model: site, region, year,visit*year and site*survey episode. Site (a uniqueidentifier for each wood surveyed) was specified inthe model to allow comparison between episodesat the level of each specific wood to be incorporatedin the analysis. Region was specified because ofthe clustering of many of the sites (Fig. 1). Year wasspecified to account for surveys being conducted indifferent years, which may have influenced thenumbers counted. Visit*year was specified to accountfor the fact that visits within the same year weremore closely related than visits between years. Lastly,site*survey episode was specified to account for thefact that some sites had surveys carried out in both2003 and 2004.
For three species in the RSPB data set (Hawfinch,Lesser Spotted Woodpecker and Willow Tit) withsmall sample sizes (few records at few sites) wemodelled change in the probability of detection perpoint rather than in number of birds recorded perpoint. The response variable was number of points atwhich the species was detected divided by thenumber of points surveyed, and visit and episodewere fitted as fixed terms using a generalized linearmodel assuming a binomial distribution with a logitlink function.
RSPB sites fell within seven regions: SE, SW, EE,EM, WM, WA and Sc (codes are listed in Table 1).For each species we examined the number of siteswith records in each region. Where regions had fewrecords for a species, there was often insufficientdata to generate parameter estimates by region andmodels would not converge. Therefore, we excludedevery region with fewer than ten visit records for agiven species before running the models. We weretherefore unable to generate change estimates forthese regions. Additionally, models often did notconverge where the data from any specific region inany episode were all zero, for example where therehad been a complete disappearance of a species froma region. In these instances (for Lesser Redpoll andSpotted Flycatcher), we added a value of 0.01 to allof the counts prior to the analysis.
As BTO data consisted of only a single count ineach year surveyed, and did not have any strong clus-tering of sites, models were simpler than equivalentmodels for the RSPB data. Furthermore, becausealmost all sites had multiple survey years within each
20
C. M. Hewson
et al.
© 2007 The Authors Journal compilation © 2007 British Ornithologists’ Union
survey episode there was information on interannualvariation which could be incorporated in the analysis,resulting in more robust estimates of changes inpopulations between episodes (due to separation ofthe effects of site and year). Thus, only site and yearwere included as random effects, to account for non-independence of visits to the same site (thus allowingdirect comparison of data from a site in differentsurvey episodes) and to account for differences betweenthe years used to assess the population at each siteduring each survey episode.
BTO sites fell within the following eight regions:SE, SW, EE, EM, WM, WA, NW and NE. Modelswere run to estimate population changes for each ofthese regions and to control for the distribution ofsites between the regions when generating nationalpopulation changes. Where models failed to convergewith this full regional division, regions were com-bined. Only contiguous regions were combined andgroupings were chosen to maximize the number ofthe original regions that were left ungrouped. In afew instances, secondary models were run in whichthe data from some regions were deleted rather thancombined with others, in order to increase the numberof the original regions that remained ungroupedand for which population changes could therefore beproduced. However, all national population changespresented were produced from models includingall data, with regional groupings determined asoutlined above.
RESULTS
Changes between the 1980s and 2003–4
National percentage population changes betweenthe 1980s and 2003–04 derived from BTO andRSPB data are shown in Table 2. For the RSPB data,there were six declines and three increases thatwere significant at
P
<
0.05 whereas for the BTOdata, there were eight declines and 13 increases thatwere significant. The greater number of significantchanges in the BTO results is probably attributableto the differences in the structure of the two datasets (see Methods).
Figure 2 shows a comparison of the nationalpopulation changes from the analyses of the two datasets. These show close agreement, with only sevenof 34 species showing changes that differed in signbetween the two data sets. Only one of these changeswas significant at
P
<
0.05 (the increase of Chaffinch
Fringilla coelebs
according to the BTO data set;
additionally, the decline of Marsh Tit according tothe same data set was significant at
P
<
0.1). Eightspecies showed large declines (
>
25%) in both datasets, namely Garden Warbler
Sylvia borin
, LesserRedpoll, Lesser Spotted Woodpecker, SpottedFlycatcher, Tree Pipit, Willow Tit, Willow Warblerand Wood Warbler. Additionally, Hawfinch showed a
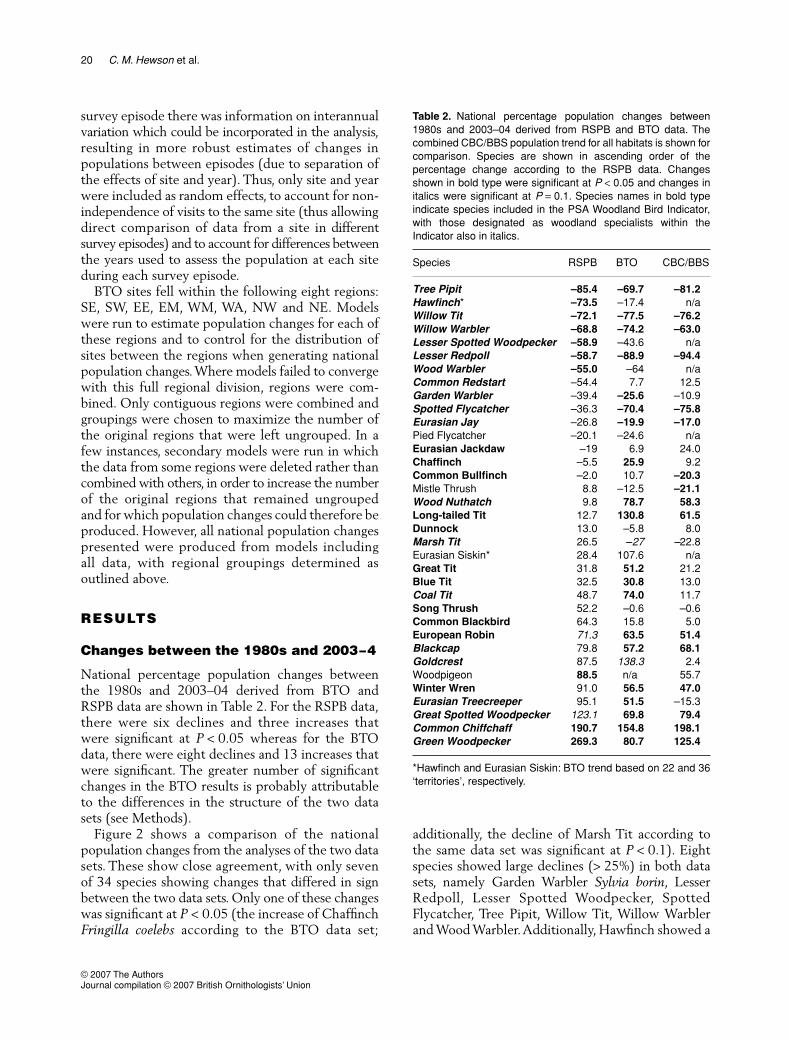
Table 2. National percentage population changes between1980s and 2003–04 derived from RSPB and BTO data. Thecombined CBC/BBS population trend for all habitats is shown forcomparison. Species are shown in ascending order of thepercentage change according to the RSPB data. Changesshown in bold type were significant at P < 0.05 and changes initalics were significant at P = 0.1. Species names in bold typeindicate species included in the PSA Woodland Bird Indicator,with those designated as woodland specialists within theIndicator also in italics.
Species RSPB BTO CBC/BBS
Tree Pipit –85.4 –69.7 –81.2Hawfinch* –73.5 –17.4 n/aWillow Tit –72.1 –77.5 –76.2Willow Warbler –68.8 –74.2 –63.0Lesser Spotted Woodpecker –58.9 –43.6 n/aLesser Redpoll –58.7 –88.9 –94.4Wood Warbler –55.0 –64 n/aCommon Redstart –54.4 7.7 12.5Garden Warbler –39.4 –25.6 –10.9Spotted Flycatcher –36.3 –70.4 –75.8Eurasian Jay –26.8 –19.9 –17.0Pied Flycatcher –20.1 –24.6 n/aEurasian Jackdaw –19 6.9 24.0Chaffinch –5.5 25.9 9.2Common Bullfinch –2.0 10.7 –20.3Mistle Thrush 8.8 –12.5 –21.1Wood Nuthatch 9.8 78.7 58.3Long-tailed Tit 12.7 130.8 61.5Dunnock 13.0 –5.8 8.0Marsh Tit 26.5 –27 –22.8Eurasian Siskin* 28.4 107.6 n/aGreat Tit 31.8 51.2 21.2Blue Tit 32.5 30.8 13.0Coal Tit 48.7 74.0 11.7Song Thrush 52.2 –0.6 –0.6Common Blackbird 64.3 15.8 5.0European Robin 71.3 63.5 51.4Blackcap 79.8 57.2 68.1Goldcrest 87.5 138.3 2.4Woodpigeon 88.5 n/a 55.7Winter Wren 91.0 56.5 47.0Eurasian Treecreeper 95.1 51.5 –15.3Great Spotted Woodpecker 123.1 69.8 79.4Common Chiffchaff 190.7 154.8 198.1Green Woodpecker 269.3 80.7 125.4
*Hawfinch and Eurasian Siskin: BTO trend based on 22 and 36‘territories’, respectively.
© 2007 The AuthorsJournal compilation © 2007 British Ornithologists’ Union
Recent changes in British woodland bird populations 21
large decline according to the RSPB results and amoderate decline according to the BTO results,although the latter was based on only a very smallsample of individuals and sites. Eleven species showedlarge increases (> 25%) in both data sets, namelyBlackcap Sylvia atricapilla, Blue Tit Cyanistes caeruleus,Common Chiffchaff Phylloscopus collybita, Coal TitPeriparus ater, Great Spotted Woodpecker Dendro-copos major, Great Tit Parus major, Green WoodpeckerPicus viridis, Goldcrest Regulus regulus, European RobinErithacus rubecula, Eurasian Treecreeper Certhiafamiliaris and Winter Wren Troglodytes troglodytes.Additionally, Eurasian Siskin Carduelis spinus in-creased by more than 25% according to both datasets, but neither increase was significant at P = 0.05and non-coniferous woods are marginal habitat forthis species across most of its British range. Themagnitude of these changes was in most cases similarin the two data sets, although Green Woodpeckerincreased more according to the RSPB results andGoldcrest increased more according to the BTOresults. Additionally, Chaffinch, Wood Nuthatch Sittaeuropaea and Long-tailed Tit Aegithalos caudatusshowed large increases in the BTO data but not in
the RSPB data, whilst Common Blackbird Turdusmerula and Song Thrush T. philomelos showed largeincreases in the RSPB data but not in the BTO data.
Comparison of the national change estimatesbetween the 1980s and 2003–04 from the RWBSwith equivalent estimates from the CBC/BBS for allhabitats (Table 2) shows that the level of agreementbetween these two surveys varies between species.For instance, the large declines detected by the CBC/BBS for Lesser Spotted Woodpecker, Lesser Redpoll,Spotted Flycatcher, Tree Pipit, Willow Tit, WillowWarbler and Wood Warbler were all confirmedby the RWBS results but the smaller decline of theCommon Bullfinch was not and the declines of MarshTit and Mistle Thrush were supported by the BTOresults but not by the RSPB results. Furthermore, thedecline detected by the RWBS for Garden Warblerwas greater than had been expected on the basis ofthe CBC/BBS trend, whilst the Common Redstartdecline detected by RSPB results had not beenexpected based on the trends from these schemes.The large increases detected by the monitoringschemes for Blackcap and Common Chiffchaff wereconfirmed by the RWBS. The large increases detectedby the RWBS for Coal Tit, Goldcrest and EurasianTreecreeper were unexpected on the basis of theCBC/BBS trend whilst the increase for Great Titwas greater than expected. In the cases of all theseincreases, however, there is much closer agreementbetween the RWBS results and the most recenttrends derived from the BBS alone.
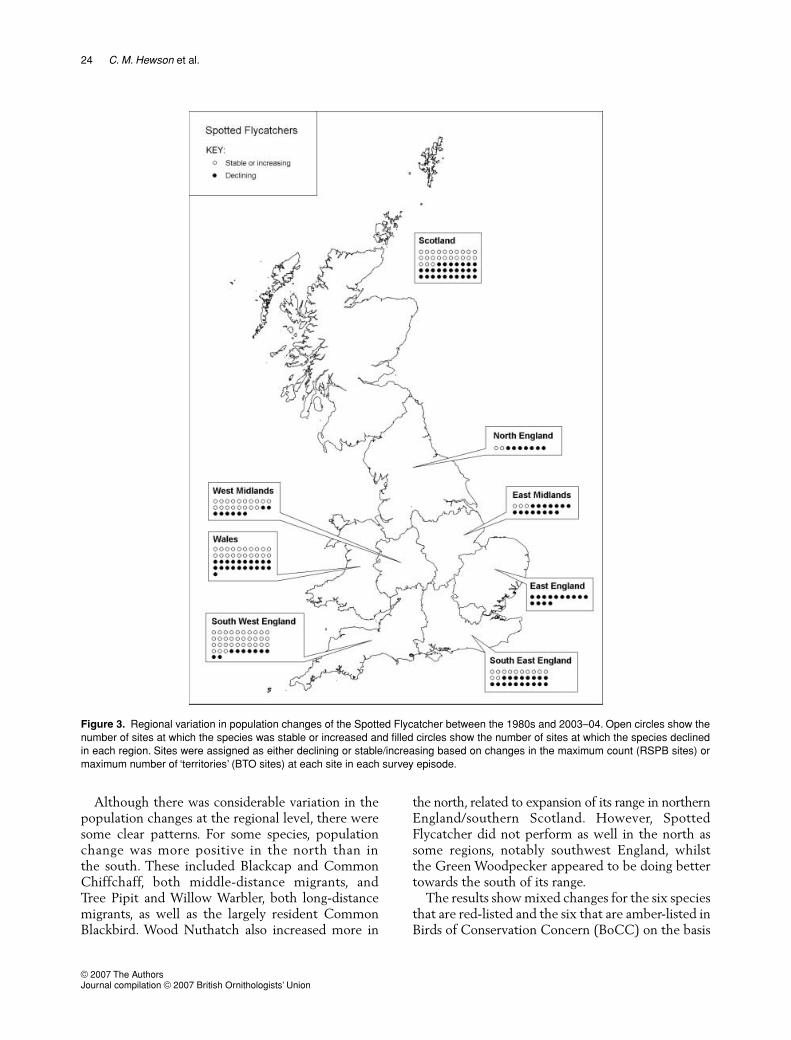
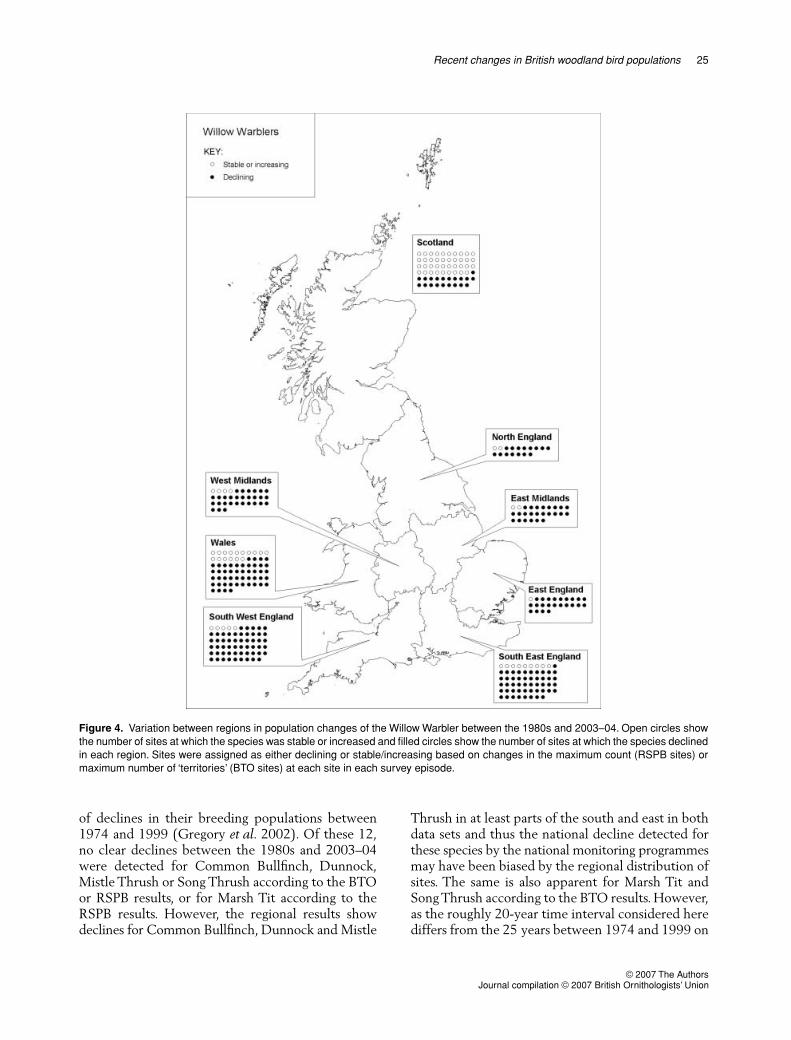
Tables 3 and 4 show the population changesbetween the 1980s and 2003–04 estimated by region.Although the number of sites contributing to theestimated change was small in some regions, there isbroad agreement in the pattern of changes detectedwithin each of the two data sets even at the regionallevel. For instance, the tables show that declines inspecies such as Lesser Redpoll, Tree Pipit, WillowWarbler and Wood Warbler occurred across all regionsfor which change estimates were available from bothdata sets. Also, the contrast between the change forSpotted Flycatcher in the SW compared with allother regions is supported by both BTO and RSPBresults (see also Fig. 3). Garden Warbler decreasedin most regions in both data sets, with the exceptionof an increase in Scotland evident in the RSPB data.Note that in addition to detecting an increase in GardenWarblers in Scotland, the RSPB results showed nodecline in Willow Warbler there, in contrast to theresults from both data sets for all other regions (seealso Fig. 4).
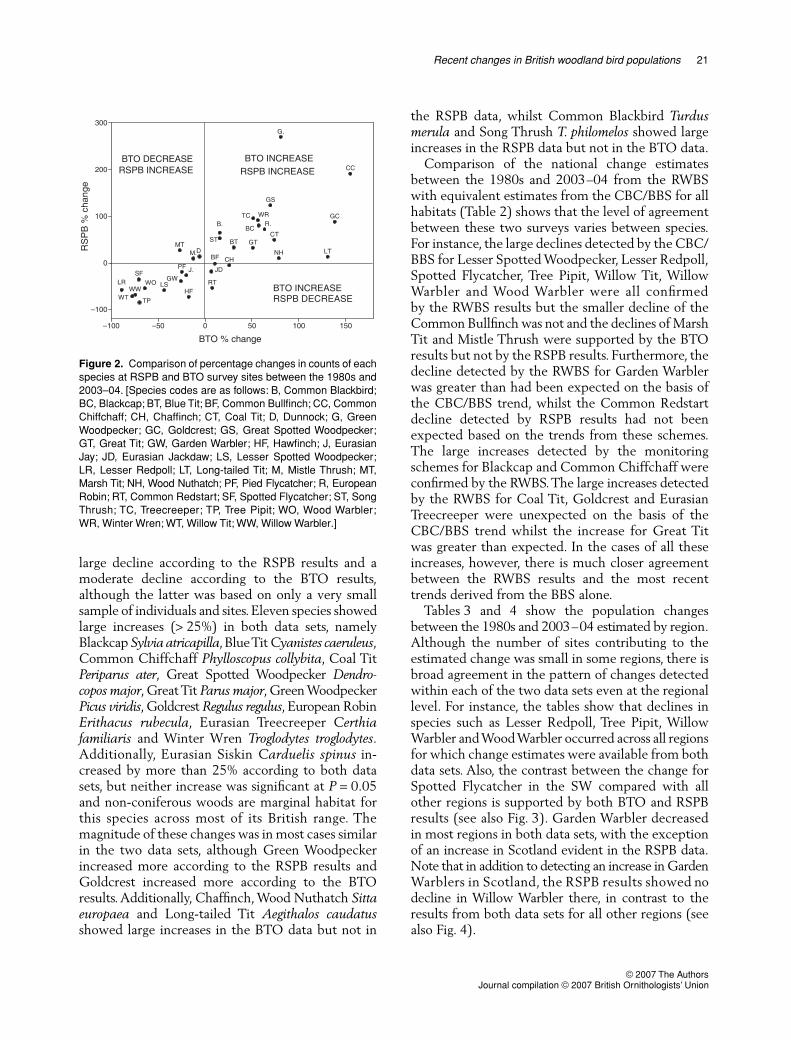
Figure 2. Comparison of percentage changes in counts of eachspecies at RSPB and BTO survey sites between the 1980s and2003–04. [Species codes are as follows: B, Common Blackbird;BC, Blackcap; BT, Blue Tit; BF, Common Bullfinch; CC, CommonChiffchaff; CH, Chaffinch; CT, Coal Tit; D, Dunnock; G, GreenWoodpecker; GC, Goldcrest; GS, Great Spotted Woodpecker;GT, Great Tit; GW, Garden Warbler; HF, Hawfinch; J, EurasianJay; JD, Eurasian Jackdaw; LS, Lesser Spotted Woodpecker;LR, Lesser Redpoll; LT, Long-tailed Tit; M, Mistle Thrush; MT,Marsh Tit; NH, Wood Nuthatch; PF, Pied Flycatcher; R, EuropeanRobin; RT, Common Redstart; SF, Spotted Flycatcher; ST, SongThrush; TC, Treecreeper; TP, Tree Pipit; WO, Wood Warbler;WR, Winter Wren; WT, Willow Tit; WW, Willow Warbler.]
22 C. M. Hewson et al.
© 2007 The Authors Journal compilation © 2007 British Ornithologists’ Union
There are some instances of contrasting findingsbetween the two sets of results, particularly forDunnock in the SE where the RSPB results showeda large significant increase and the BTO results showeda significant decrease. Other contrasting resultswere for Common Bullfinch in Wales, Dunnock inWM and Marsh Tit in EE and EM. Note that in allof these cases the RSPB results showed much morepositive changes than the BTO results, but only theRSPB increase of Dunnocks in WM and the BTO declineof Marsh Tits in EE were significant at P < 0.05. Notealso that the large increases in EE in the RSPB resultsfor Eurasian Jackdaw, Eurasian Jay and MistleThrush (as well as Marsh Tit) contrast strongly withall other regional results from both data sets.
Changes between the 1960s/1970s and 2003–04 from BTO data
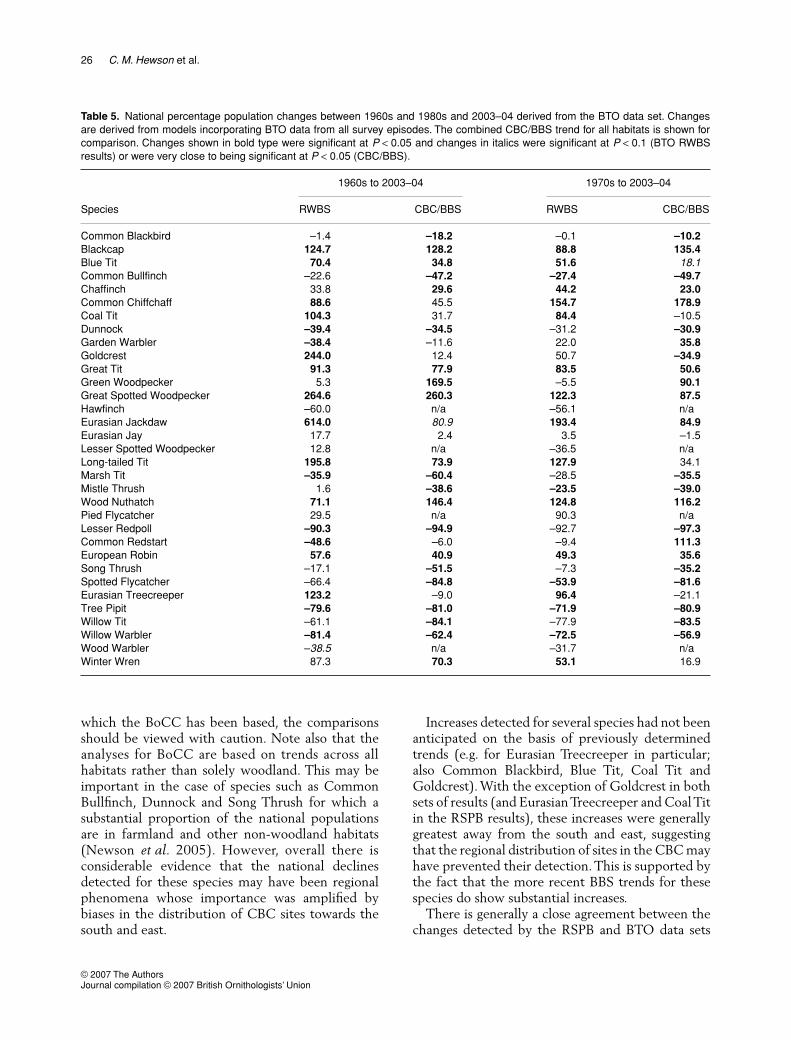
Table 5 shows longer-term national populationchanges estimated from the BTO data set betweenthe 1960s and 1970s and 2003–04 (together withequivalent changes derived from the CBC/BBScovering all habitats). Between the 1960s and2003–04, seven species decreased significantly and12 increased significantly at P < 0.05, and betweenthe 1970s and 2003–04, there were five significantdeclines and 13 increases. There are many species forwhich the changes from the RWBS closely correspondto those from the CBC/BBS, such as Blackcap, WoodNuthatch, Tree Pipit, Willow Tit and Willow Warbler.
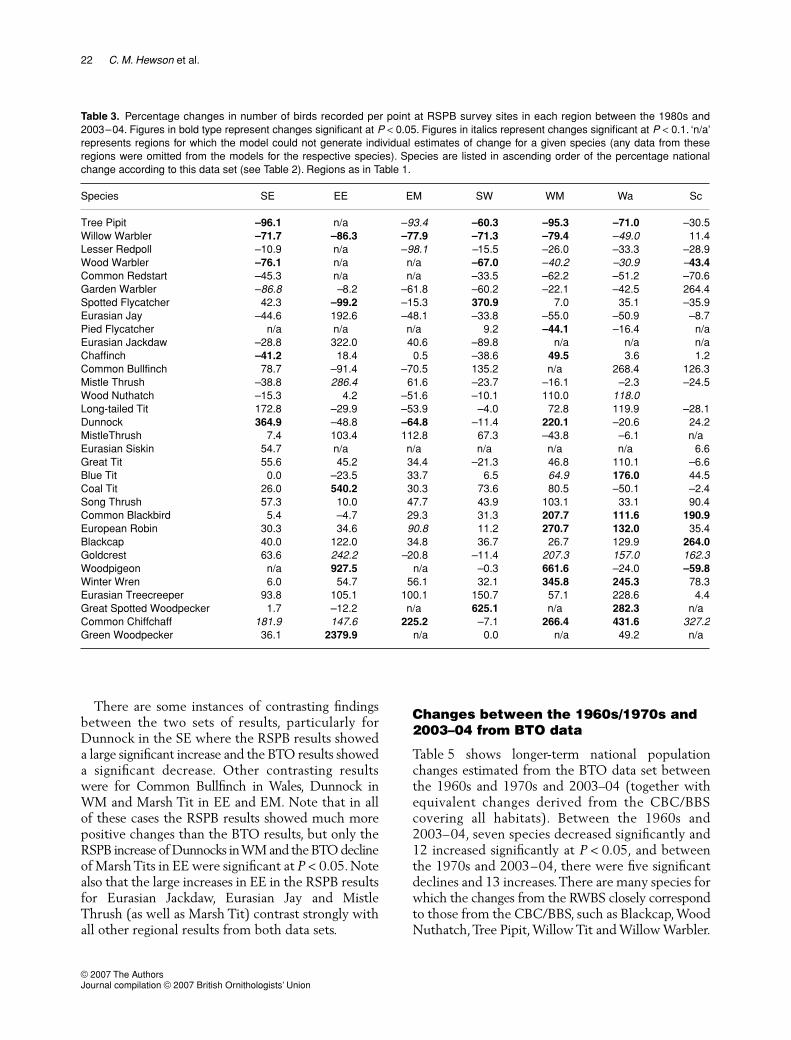
Table 3. Percentage changes in number of birds recorded per point at RSPB survey sites in each region between the 1980s and2003–04. Figures in bold type represent changes significant at P < 0.05. Figures in italics represent changes significant at P < 0.1. ‘n/a’represents regions for which the model could not generate individual estimates of change for a given species (any data from theseregions were omitted from the models for the respective species). Species are listed in ascending order of the percentage nationalchange according to this data set (see Table 2). Regions as in Table 1.
Species SE EE EM SW WM Wa Sc
Tree Pipit –96.1 n/a –93.4 –60.3 –95.3 –71.0 –30.5Willow Warbler –71.7 –86.3 –77.9 –71.3 –79.4 –49.0 11.4Lesser Redpoll –10.9 n/a –98.1 –15.5 –26.0 –33.3 –28.9Wood Warbler –76.1 n/a n/a –67.0 –40.2 –30.9 –43.4Common Redstart –45.3 n/a n/a –33.5 –62.2 –51.2 –70.6Garden Warbler –86.8 –8.2 –61.8 –60.2 –22.1 –42.5 264.4Spotted Flycatcher 42.3 –99.2 –15.3 370.9 7.0 35.1 –35.9Eurasian Jay –44.6 192.6 –48.1 –33.8 –55.0 –50.9 –8.7Pied Flycatcher n/a n/a n/a 9.2 –44.1 –16.4 n/aEurasian Jackdaw –28.8 322.0 40.6 –89.8 n/a n/a n/aChaffinch –41.2 18.4 0.5 –38.6 49.5 3.6 1.2Common Bullfinch 78.7 –91.4 –70.5 135.2 n/a 268.4 126.3Mistle Thrush –38.8 286.4 61.6 –23.7 –16.1 –2.3 –24.5Wood Nuthatch –15.3 4.2 –51.6 –10.1 110.0 118.0Long-tailed Tit 172.8 –29.9 –53.9 –4.0 72.8 119.9 –28.1Dunnock 364.9 –48.8 –64.8 –11.4 220.1 –20.6 24.2MistleThrush 7.4 103.4 112.8 67.3 –43.8 –6.1 n/aEurasian Siskin 54.7 n/a n/a n/a n/a n/a 6.6Great Tit 55.6 45.2 34.4 –21.3 46.8 110.1 –6.6Blue Tit 0.0 –23.5 33.7 6.5 64.9 176.0 44.5Coal Tit 26.0 540.2 30.3 73.6 80.5 –50.1 –2.4Song Thrush 57.3 10.0 47.7 43.9 103.1 33.1 90.4Common Blackbird 5.4 –4.7 29.3 31.3 207.7 111.6 190.9European Robin 30.3 34.6 90.8 11.2 270.7 132.0 35.4Blackcap 40.0 122.0 34.8 36.7 26.7 129.9 264.0Goldcrest 63.6 242.2 –20.8 –11.4 207.3 157.0 162.3Woodpigeon n/a 927.5 n/a –0.3 661.6 –24.0 –59.8Winter Wren 6.0 54.7 56.1 32.1 345.8 245.3 78.3Eurasian Treecreeper 93.8 105.1 100.1 150.7 57.1 228.6 4.4Great Spotted Woodpecker 1.7 –12.2 n/a 625.1 n/a 282.3 n/aCommon Chiffchaff 181.9 147.6 225.2 –7.1 266.4 431.6 327.2Green Woodpecker 36.1 2379.9 n/a 0.0 n/a 49.2 n/a
© 2007 The AuthorsJournal compilation © 2007 British Ornithologists’ Union
Recent changes in British woodland bird populations 23
However, there are some where the relationships areless consistent. Most notably, the RWBS changesestimated for Common Redstart do not accord withthose from monitoring schemes, but it should benoted that coverage of this species’ core range by theBTO RWBS sites was poor. Also, the increases shownfor Treecreeper are at odds with the small declinesshown by the CBC/BBS.
DISCUSSION
The RWBS confirmed the strong declines detectedby the CBC/BBS in several woodland bird species. TheUK Wildbird Populations Framework Indicator for
woodland birds divides the 33 species into woodlandspecialists and generalists. The trend line for thespecialists shows a marked decline compared withthat for the generalists (Defra 2005). Our data showa similar pattern, with, at the national scale, ten ofthe 19 woodland specialist species considered heredeclining as opposed to none of the 12 woodlandgeneralists. One of the most striking features hasbeen the decline of all seven long-distance migrants –Garden Warbler, Willow Warbler, Wood Warbler,Tree Pipit, Spotted Flycatcher, Pied Flycatcher andCommon Redstart. By contrast, the two middle-distance migrants (Blackcap and Common Chiffchaff)have increased strongly.
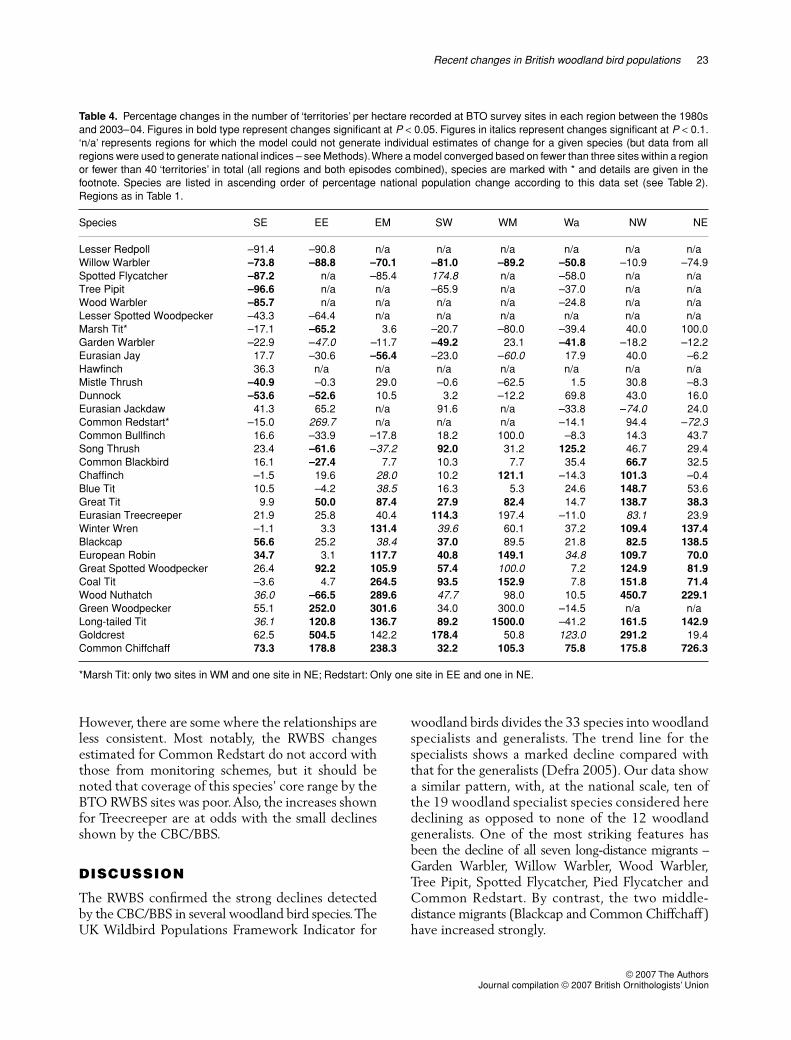
Table 4. Percentage changes in the number of ‘territories’ per hectare recorded at BTO survey sites in each region between the 1980sand 2003–04. Figures in bold type represent changes significant at P < 0.05. Figures in italics represent changes significant at P < 0.1.‘n/a’ represents regions for which the model could not generate individual estimates of change for a given species (but data from allregions were used to generate national indices – see Methods). Where a model converged based on fewer than three sites within a regionor fewer than 40 ‘territories’ in total (all regions and both episodes combined), species are marked with * and details are given in thefootnote. Species are listed in ascending order of percentage national population change according to this data set (see Table 2).Regions as in Table 1.
Species SE EE EM SW WM Wa NW NE
Lesser Redpoll –91.4 –90.8 n/a n/a n/a n/a n/a n/aWillow Warbler –73.8 –88.8 –70.1 –81.0 –89.2 –50.8 –10.9 –74.9Spotted Flycatcher –87.2 n/a –85.4 174.8 n/a –58.0 n/a n/aTree Pipit –96.6 n/a n/a –65.9 n/a –37.0 n/a n/aWood Warbler –85.7 n/a n/a n/a n/a –24.8 n/a n/aLesser Spotted Woodpecker –43.3 –64.4 n/a n/a n/a n/a n/a n/aMarsh Tit* –17.1 –65.2 3.6 –20.7 –80.0 –39.4 40.0 100.0Garden Warbler –22.9 –47.0 –11.7 –49.2 23.1 –41.8 –18.2 –12.2Eurasian Jay 17.7 –30.6 –56.4 –23.0 –60.0 17.9 40.0 –6.2Hawfinch 36.3 n/a n/a n/a n/a n/a n/a n/aMistle Thrush –40.9 –0.3 29.0 –0.6 –62.5 1.5 30.8 –8.3Dunnock –53.6 –52.6 10.5 3.2 –12.2 69.8 43.0 16.0Eurasian Jackdaw 41.3 65.2 n/a 91.6 n/a –33.8 –74.0 24.0Common Redstart* –15.0 269.7 n/a n/a n/a –14.1 94.4 –72.3Common Bullfinch 16.6 –33.9 –17.8 18.2 100.0 –8.3 14.3 43.7Song Thrush 23.4 –61.6 –37.2 92.0 31.2 125.2 46.7 29.4Common Blackbird 16.1 –27.4 7.7 10.3 7.7 35.4 66.7 32.5Chaffinch –1.5 19.6 28.0 10.2 121.1 –14.3 101.3 –0.4Blue Tit 10.5 –4.2 38.5 16.3 5.3 24.6 148.7 53.6Great Tit 9.9 50.0 87.4 27.9 82.4 14.7 138.7 38.3Eurasian Treecreeper 21.9 25.8 40.4 114.3 197.4 –11.0 83.1 23.9Winter Wren –1.1 3.3 131.4 39.6 60.1 37.2 109.4 137.4Blackcap 56.6 25.2 38.4 37.0 89.5 21.8 82.5 138.5European Robin 34.7 3.1 117.7 40.8 149.1 34.8 109.7 70.0Great Spotted Woodpecker 26.4 92.2 105.9 57.4 100.0 7.2 124.9 81.9Coal Tit –3.6 4.7 264.5 93.5 152.9 7.8 151.8 71.4Wood Nuthatch 36.0 –66.5 289.6 47.7 98.0 10.5 450.7 229.1Green Woodpecker 55.1 252.0 301.6 34.0 300.0 –14.5 n/a n/aLong-tailed Tit 36.1 120.8 136.7 89.2 1500.0 –41.2 161.5 142.9Goldcrest 62.5 504.5 142.2 178.4 50.8 123.0 291.2 19.4Common Chiffchaff 73.3 178.8 238.3 32.2 105.3 75.8 175.8 726.3
*Marsh Tit: only two sites in WM and one site in NE; Redstart: Only one site in EE and one in NE.
24 C. M. Hewson et al.
© 2007 The Authors Journal compilation © 2007 British Ornithologists’ Union
Although there was considerable variation in thepopulation changes at the regional level, there weresome clear patterns. For some species, populationchange was more positive in the north than inthe south. These included Blackcap and CommonChiffchaff, both middle-distance migrants, andTree Pipit and Willow Warbler, both long-distancemigrants, as well as the largely resident CommonBlackbird. Wood Nuthatch also increased more in
the north, related to expansion of its range in northernEngland/southern Scotland. However, SpottedFlycatcher did not perform as well in the north assome regions, notably southwest England, whilstthe Green Woodpecker appeared to be doing bettertowards the south of its range.
The results show mixed changes for the six speciesthat are red-listed and the six that are amber-listed inBirds of Conservation Concern (BoCC) on the basis
Figure 3. Regional variation in population changes of the Spotted Flycatcher between the 1980s and 2003–04. Open circles show thenumber of sites at which the species was stable or increased and filled circles show the number of sites at which the species declinedin each region. Sites were assigned as either declining or stable/increasing based on changes in the maximum count (RSPB sites) ormaximum number of ‘territories’ (BTO sites) at each site in each survey episode.
© 2007 The AuthorsJournal compilation © 2007 British Ornithologists’ Union
Recent changes in British woodland bird populations 25
of declines in their breeding populations between1974 and 1999 (Gregory et al. 2002). Of these 12,no clear declines between the 1980s and 2003–04were detected for Common Bullfinch, Dunnock,Mistle Thrush or Song Thrush according to the BTOor RSPB results, or for Marsh Tit according to theRSPB results. However, the regional results showdeclines for Common Bullfinch, Dunnock and Mistle
Thrush in at least parts of the south and east in bothdata sets and thus the national decline detected forthese species by the national monitoring programmesmay have been biased by the regional distribution ofsites. The same is also apparent for Marsh Tit andSong Thrush according to the BTO results. However,as the roughly 20-year time interval considered herediffers from the 25 years between 1974 and 1999 on
Figure 4. Variation between regions in population changes of the Willow Warbler between the 1980s and 2003–04. Open circles showthe number of sites at which the species was stable or increased and filled circles show the number of sites at which the species declinedin each region. Sites were assigned as either declining or stable/increasing based on changes in the maximum count (RSPB sites) ormaximum number of ‘territories’ (BTO sites) at each site in each survey episode.
26 C. M. Hewson et al.
© 2007 The Authors Journal compilation © 2007 British Ornithologists’ Union
which the BoCC has been based, the comparisonsshould be viewed with caution. Note also that theanalyses for BoCC are based on trends across allhabitats rather than solely woodland. This may beimportant in the case of species such as CommonBullfinch, Dunnock and Song Thrush for which asubstantial proportion of the national populationsare in farmland and other non-woodland habitats(Newson et al. 2005). However, overall there isconsiderable evidence that the national declinesdetected for these species may have been regionalphenomena whose importance was amplified bybiases in the distribution of CBC sites towards thesouth and east.
Increases detected for several species had not beenanticipated on the basis of previously determinedtrends (e.g. for Eurasian Treecreeper in particular;also Common Blackbird, Blue Tit, Coal Tit andGoldcrest). With the exception of Goldcrest in bothsets of results (and Eurasian Treecreeper and Coal Titin the RSPB results), these increases were generallygreatest away from the south and east, suggestingthat the regional distribution of sites in the CBC mayhave prevented their detection. This is supported bythe fact that the more recent BBS trends for thesespecies do show substantial increases.
There is generally a close agreement between thechanges detected by the RSPB and BTO data sets
Table 5. National percentage population changes between 1960s and 1980s and 2003–04 derived from the BTO data set. Changesare derived from models incorporating BTO data from all survey episodes. The combined CBC/BBS trend for all habitats is shown forcomparison. Changes shown in bold type were significant at P < 0.05 and changes in italics were significant at P < 0.1 (BTO RWBSresults) or were very close to being significant at P < 0.05 (CBC/BBS).
Species
1960s to 2003–04 1970s to 2003–04
RWBS CBC/BBS RWBS CBC/BBS
Common Blackbird –1.4 –18.2 –0.1 –10.2Blackcap 124.7 128.2 88.8 135.4Blue Tit 70.4 34.8 51.6 18.1Common Bullfinch –22.6 –47.2 –27.4 –49.7Chaffinch 33.8 29.6 44.2 23.0Common Chiffchaff 88.6 45.5 154.7 178.9Coal Tit 104.3 31.7 84.4 –10.5Dunnock –39.4 –34.5 –31.2 –30.9Garden Warbler –38.4 –11.6 22.0 35.8Goldcrest 244.0 12.4 50.7 –34.9Great Tit 91.3 77.9 83.5 50.6Green Woodpecker 5.3 169.5 –5.5 90.1Great Spotted Woodpecker 264.6 260.3 122.3 87.5Hawfinch –60.0 n/a –56.1 n/aEurasian Jackdaw 614.0 80.9 193.4 84.9Eurasian Jay 17.7 2.4 3.5 –1.5Lesser Spotted Woodpecker 12.8 n/a –36.5 n/aLong-tailed Tit 195.8 73.9 127.9 34.1Marsh Tit –35.9 –60.4 –28.5 –35.5Mistle Thrush 1.6 –38.6 –23.5 –39.0Wood Nuthatch 71.1 146.4 124.8 116.2Pied Flycatcher 29.5 n/a 90.3 n/aLesser Redpoll –90.3 –94.9 –92.7 –97.3Common Redstart –48.6 –6.0 –9.4 111.3European Robin 57.6 40.9 49.3 35.6Song Thrush –17.1 –51.5 –7.3 –35.2Spotted Flycatcher –66.4 –84.8 –53.9 –81.6Eurasian Treecreeper 123.2 –9.0 96.4 –21.1Tree Pipit –79.6 –81.0 –71.9 –80.9Willow Tit –61.1 –84.1 –77.9 –83.5Willow Warbler –81.4 –62.4 –72.5 –56.9Wood Warbler –38.5 n/a –31.7 n/aWinter Wren 87.3 70.3 53.1 16.9
© 2007 The AuthorsJournal compilation © 2007 British Ornithologists’ Union
Recent changes in British woodland bird populations 27
between the 1980s and 2003–04. Given the differencesin the types and distributions of sites covered andthe survey techniques employed to produce the twodata sets, this strongly suggests that the findings arerobust. The agreement is particularly good for thestrongly increasing or decreasing species. In generalthe RSPB results have wider confidence intervalsthan those from the BTO survey. This is becausebetween-year fluctuations in bird populations arebetter accounted for in the BTO models, as tworandomly chosen years of data from each site wereused to estimate populations in each historical timeperiod and most sites were surveyed again in both2003 and 2004. The effect of fluctuations betweenspecific years cannot be accounted for so accuratelyin the RSPB models as each site was only visited inone year during the 1980s and (in most cases) oneyear in the RWBS (so the effect of site and year areconfounded) and all sites within a region tended tobe visited within a single year (so the effects ofregion and year are largely confounded).
The possible causes of the population changesoutlined here were examined using habitat datacollected during the RWBS. The results of theseanalyses will be reported elsewhere (Amar et al. inprep.). However, Fuller et al. (2005) outlined theseven most likely potential causes of populationdeclines, namely: (1) pressures on migrants duringmigration or in winter; (2) climate change on thebreeding grounds; (3) reduction in invertebrates; (4)impacts of agriculture on woodland edges and onhabitats outide woodland; (5) reduced managementof woodland; (6) intensified grazing pressure from deer;and (7) changing predation pressure (due to increasesin squirrels, corvids and Great Spotted Woodpecker).It is likely that these factors operate in differentcombinations on different species, although some, suchas those relating to predation pressure or changes inwoodland structure, could impact a variety of species.
In conclusion, the results show that there havebeen more recent increases than declines in theabundance of woodland birds. However, the speciesthat have showed contrasting trends are not randomsubsets of the species considered. In particular, long-distance migrants and woodland specialists have faredless well than residents, middle-distance migrantsand woodland generalists. Also, uncommon species,such as Willow Tit and Lesser Spotted Woodpecker,have fared less well than common species, such asBlue Tits and Great Spotted Woodpecker. Althoughthe ability to repeat historical fieldwork is a powerfultool in conservation biology, it relies on the availability
of historical data such as the two data sets uponwhich this paper is based. As neither of these datasets was collected at randomly selected sites somecaution is needed in extrapolating our results, althoughthe size and geographical scope of the data sets usedin the RWBS are very large.
The Repeat Woodland Bird Survey was funded by Defra,the Forestry Commission, English Nature, RSPB, BTO and theWoodland Trust. We also thank the following who con-tributed to the project: the members of the steering group(including Richard Brand-Hardy, Fred Currie, Phil Grice,Keith Kirby, Chris Quine and Richard Smithers) andDavid Noble and Richard Gregory for discussion at variousstages; Chas Holt, Michael MacDonald and especiallyGreg Conway for help with data preparation and projectplanning; the BTO and RSPB fieldworkers (David Anning,Loyd Berry, Gareth Bonello, Steve Coney, Gary Cole, PaulDaw, Alasdair Dawes, John Day, John Dyda, Robin Eddle-ston, Allan Goddard, Matthew Harding, Richard Hibbert,Paul James, Paul Jacques, Graeme Lyons, Paul Medforth,David Morris, Daniel Piec, Mike Pilsworth, AlanSalter, Rosemary Setchfield, Hilary Swift, Chris Thaxter,Nick Unwin, Howard Vaughan, Graham Weedon, RobertWheeldon) for collecting data during the RWBS; the BTOCBC volunteers; Professor David Elston and Dr StijnBierman from Biostatistics Scotland (BIOSS) for statisticaladvice; Colin Campbell from the RSPB Data ManagementUnit for producing the maps; and finally the land owners,managers and agents for permission to work on their sitesand for their helpful cooperation which enabled theproject to go ahead.
REFERENCES
Amar, A., Hewson, C.M., Thewlis, R.M., Smith, K.W., Fuller, R.J.,Lindsell, J.A., Conway, G., Butler, S. & MacDonald, M.A.2006. What’s Happening to Our Woodland Birds? Long-TermChanges in the Populations of Woodland Birds. BTO ResearchReport 169 & RSPB Research Report 19. Thetford: BTO andSandy: RSPB.
Crick, H.Q.P., Dudley, C., Glue, D.E. & Thompson, D.L. 1997.UK birds are laying eggs earlier. Nature 388: 525–527.
Crick, H.Q.P. & Sparks, T.H. 1999. Climate change related toegg-laying trends. Nature 399: 423–434.
Defra. 2005. Sustainable Development – The Government’sApproach. http://www.sustainabledevelopment.gov.uk/performance/progress/indicators/20.htm
Forestry Commission. 2003. National Inventory of Woodlandand Trees. Edinburgh: Forestry Commission.
Freeman, S.N., Noble, D.G., Newson, S.E. & Baillie, S.R.2007. Modelling population changes using data from differentsurveys: the Common Bird Census and Breeding BirdSurvey. Bird Study 54: 61–72.
Fuller, R.J., Noble, D.G., Smith, K.W. & Vanhinsbergh, D.2005. Recent declines in populations of woodland birds inBritain: a review of possible causes. Br. Birds 98: 116–143.
Gregory, R.D., Wilkinson, N.I., Noble, D.G., Robinson, J.A.,Brown, A.F., Hughes, J., Proctor, D., Gibbons, D.W. &

28 C. M. Hewson et al.
© 2007 The Authors Journal compilation © 2007 British Ornithologists’ Union
Galbraith, C.A. 2002. The population status of birds in theUnited Kingdom, Channel Islands and Isle of Man: an analysisof conservation concern. Br. Birds 95: 410–450.
Littell, R.C., Milliken, G.A., Stroup, W.W. & Wolfinger, R.D.1996. SAS System for Mixed Models. Cary, NC: SAS InstituteInc.
Marchant, J.H. 1983. BTO Common Birds Census Instructions.Tring: British Trust for Ornithology.
Marchant, J.H., Hudson, R., Carter, S.P. & Whittington, P.1990. Population Trends in British Breeding Birds. Tring:British Trust for Ornithology.
Newson, S.E., Woodburn, R.J.W., Noble, D.G., Baillie, S.R. &Gregory, R.D. 2005. Evaluating the Breeding Bird Survey for
producing national population size and density estimates.Bird Study 52: 42–54.
SAS Institute Inc. 1999. SAS/STAT Users’ Guide, Version 8.Cary, NC: SAS Institute Inc.
Spencer, J.W. & Kirby, K.J. 1992. An inventory of ancientwoodland for England and Wales. Biol. Conserv. 62: 77–93.
Thewlis, R.M., Noble, D.J. & Fuller, R.J. 2003. Scoping Studyof Woodland Common Birds Census Plots to Assess Suitabilityfor a Planned Resurvey of Woodland Plots. Thetford: BritishTrust for Ornithology.
Received 14 August 2006; revision accepted 7 June 2007.
Appendix. Number of sites that each species was recorded in during the 1980s and 2003–04 according to the RSPB and BTO datasets. Species are shown in ascending order of the percentage national change according to the RSPB data. For each data set, thenumber of sites at which each species was recorded in the 1980s is followed by the number of sites at which each was recorded during2003–04. For the BTO data set, the second figure excludes sites for which there was no historical data from the 1980s (giving a total of92 sites).
Species RSPB BTO
Tree Pipit Anthus trivialis 177, 107 27, 8Hawfinch Coccothraustes coccothraustes 30, 11 6, 5Willow Tit Poecile montanus 26, 7 23, 8Willow Warbler Phylloscopus trochilus 248, 203 88, 54Lesser Spotted Woodpecker Dendrocopos minor 18, 10 19, 9Lesser Redpoll Carduelis cabaret 97, 71 14, 4Wood Warbler Phylloscopus sibilatrix 186, 147 22, 12Common Redstart Phoenicurus phoenicurus 177, 143 15, 10Garden Warbler Sylvia borin 145, 128 65, 52Spotted Flycatcher Muscicapa striata 145, 119 34, 21Eurasian Jay Garrulus glandarius 157, 154 71, 70Pied Flycatcher Ficedula hypoleuca 98, 89 8, 7Eurasian Jackdaw Corvus monedula 59, 51 35, 43Chaffinch Fringilla coelebs 252, 252 90, 92Common Bullfinch Pyrrhula pyrrhula 52, 60 91, 63Mistle Thrush Turdus viscivorus 200, 194 67, 66Wood Nuthatch Sitta europaea 156, 172 58, 69Long-tailed Tit Aegithalos caudatus 170, 158 67, 80Dunnock Prunella modularis 88, 87 79, 77Marsh Tit Poecile palustris 135, 127 53, 46Eurasian Siskin Carduelis spinus 55, 53 4, 8Great Tit Parus major 250, 250 91, 91Blue Tit Cyanistes caeruleus 251, 251 91, 92Coal Tit Periparus ater 232, 239 73, 83Song Thrush Turdus philomelos 241, 245 85, 85Common Blackbird Turdus merula 221, 234 92, 92European Robin Erithacus rubecula 248, 252 92, 92Blackcap Sylvia atricapilla 175, 201 82, 90Goldcrest Regulus regulus 178, 220 63, 76Woodpigeon Columba palumbus 123, 128 n/aWinter Wren Troglodytes troglodytes 252, 252 92, 92Eurasian Treecreeper Certhia familiaris 210, 240 68, 79Great Spotted Woodpecker Dendrocopos major 60, 90 68, 86Common Chiffchaff Phylloscopus collybita 136, 179 73, 88Green Woodpecker Picus viridis 41, 46 52, 66