
Contents - amar finance & leasing company
44
-
Upload
khangminh22 -
Category
Documents
-
view
0 -
download
0
Transcript of Contents - amar finance & leasing company
Real Estate Newsletter - GCC RegionAMARFinance & Leasing
1st Semester 2013
Contents
Executive Summary ...................................................................................................... 1
Economic Overview ....................................................................................................................................... 1
Real Estate Sector ............................................................................................................................................ 2
Residential Sector ............................................................................................................................................. 2
Commercial Sector .......................................................................................................................................... 3
Major Projects .................................................................................................................................................. 5
Kuwait ........................................................................................................................... 6
Economic Overview ....................................................................................................................................... 6
Real Estate Sector ............................................................................................................................................ 7
Residential Sector ............................................................................................................................................. 8
Commercial Sector ........................................................................................................................................ 10
Major Projects ................................................................................................................................................ 11
The UAE ..................................................................................................................... 12
Economic Overview ..................................................................................................................................... 12
Real Estate Sector .......................................................................................................................................... 13
Residential Sector ........................................................................................................................................... 15
Commercial Sector ........................................................................................................................................ 16
Major Projects ................................................................................................................................................ 19
Kingdom of Saudi Arabia (KSA) ................................................................................ 20
Economic Overview ..................................................................................................................................... 20
Real Estate Sector .......................................................................................................................................... 21
Residential Sector ........................................................................................................................................... 23
Commercial Sector ........................................................................................................................................ 25
Major Projects ................................................................................................................................................ 27
Kingdom of Bahrain ................................................................................................... 28
Economic Overview ..................................................................................................................................... 28
Real Estate Sector .......................................................................................................................................... 29
Residential Sector ........................................................................................................................................... 29
Commercial Sector ........................................................................................................................................ 30
Major Projects ................................................................................................................................................ 31
Oman .......................................................................................................................... 32
Economic Overview ..................................................................................................................................... 32
Real Estate Sector .......................................................................................................................................... 33
Residential Sector ........................................................................................................................................... 34
Commercial Sector ........................................................................................................................................ 35
Major Projects ................................................................................................................................................ 35
Qatar ........................................................................................................................... 36
Economic Overview ..................................................................................................................................... 36
Real Estate Sector .......................................................................................................................................... 37
Residential Sector ........................................................................................................................................... 38
Commercial Sector ........................................................................................................................................ 39
Major Projects ................................................................................................................................................ 41

1
GCC Real Estate Newsletter
Executive Summary
To minimize their reliance on the oil industry, the GCC
countries are making efforts to develop non-oil sectors,
including tourism, retail, real estate and construction,
transport, logistics, manufacturing, and professional
services. This, in turn, is resulting in the growth of real
estate activities in the GCC region. Real estate
transactions and enquiries in the region have increased,
making realty a favored investment medium. This is
supported by the fact that the real estate indices of GCC
region have picked up since 2012, after a major property
slump between 2008 and 2011 (Fig 01).
The rise in demand in the residential sector from both
expatriates and citizens has increased the pressure on
prices. This trend is likely to support residential
development in the GCC, as developers will construct
projects suitable for the growing expatriate population,
thereby creating a balance between demand and supply.
Figure 01: Real Estate Indices
Source: Zawya
Economic Overview
Non-oil sector to support economic growth
GCC countries continued to benefit from high oil
revenues that have resulted in expansionary fiscal policies.
The economies of the GCC region benefited from high
crude oil production in Saudi Arabia and Kuwait and
increased liquefied natural gas (LNG) production in Qatar
on capacity expansion. According to International
Monetary Fund (IMF), both crude oil and natural gas
production in the GCC countries witnessed double-digit
growth in 2011 to 11.7% and 13.1%, respectively.
Production rose further in 2012, increasing 5.3% for
crude oil and 4.7% for natural gas, leading to a 4.8%
growth in the oil sector in 2012.
Figure 02: Real GDP Growth (%) of GCC
Source: IMF, April 2013
However, the IMF estimates that the non-oil sector will
see stronger growth rates in the coming years. In 2012,
the non-oil sector is estimated to have increased 5.9% in
2012 in the GCC countries, stronger than the oil sector,
following increased public expenditure and private sector
growth as a result of an expansionary monetary policy.
The non-oil sector is expected to continue supporting
economic growth, as GCC countries register 5.5% growth
in the non-oil sector vis-à-vis a stagnant oil sector in 2013.
Figure 03: Real GDP Growth (%)
Source: IMF, April 2013
According to the IMF, the real gross domestic product
(GDP) growth in the GCC is expected to slow to 3.7% in
2013 from 5.2% in 2012, as a result of a reduction in
hydrocarbon production. This growth is dependent on
several factors, including stable oil prices and anticipated
progress in the social and political scenarios of the region.
Interest rates reflect mixed pattern in GCC
Interbank interest rates in GCC countries are judged
according to movements in the US federal rates as all the
currencies in the region (except Kuwait) are pegged to the
US dollar. As GCC countries continued to take measures
to stimulate demand, the average interest rates in H1 2013
reflected a downward trend. EIBOR witnessed a sharp
decline of ~40 basis points (bps) from H1 2012 levels,
followed by KIBOR, which declined by 26 bps. On the
other hand, SAIBOR improved by 11 bps, while QIBOR
remained flat. On the global front, LIBOR too declined
by 21 bps. The GCC countries are trying to manage the
interest rates in order to maintain liquidity levels, as well
as to push the real estate and infrastructural developments.
Figure 04: 3M Interbank Interest Rate (%)
Source: Bloomberg, June 2013
Inflation likely to remain low
Historically, GCC countries have largely remained
immune to the rising global prices until rising oil prices
pushed the inflation higher. Consumer price index (CPI)
in the GCC has accelerated since mid-2012. In May 2013,
30
60
90
120
150
180
Jan-11 Apr-11 Jul-11 Oct-11 Feb-12 May-12 Aug-12 Dec-12 Mar-13 Jun-13
Reb
ased
Rea
l Est
ate
Ind
ices
Abu Dhabi Real Estate Index Dubai Real Estate and Construction Index
Tawadul Real Esate Index Kuwait Real Estate Index
-8%
-3%
2%
7%
12%
2007 2008 2009 2010 2011 2012 E 2013 F
% G
row
th Y
-o-Y
Oil GDP Non-Oil GDP Real GDP
0%
3%
6%
9%
12%
15%
Qatar Saudi Arabia
Kuwait Oman UAE Bahrain GCC
Rea
l GD
P g
row
th r
ate
(%)
2011 2012 E 2013 F
0.0%
0.6%
1.2%
1.8%
EIBOR SAIBOR KIBOR QIBOR LIBOR
3M
In
terb
ank
rat
es (
%)
Jun-12 Jun-13

it stood at 2.9%. According to QNB Group, housing
costs (mainly rents) account for 27% of the CPI basket in
the GCC and food prices for 20%. Overall, rent inflation
has averaged 2.9% from January 2013 to May 2013. It has
reached high levels in some countries (Qatar and Bahrain),
while in others (UAE) it continues to remain relatively
low. The steady rise in rentals in Qatar is expected to lead
inflation to 3% in 2013 from 1.9% in 2012. Inflation in
the UAE is expected to be muted due to supply overhang
and depressed housing rentals. Meanwhile, QNB Group
reported that except for Saudi Arabia, all the other
countries in the GCC witnessed low food inflation in line
with global food price indices as the GCC imports most
of its food needs.
According to QNB, GCC inflation is likely to stabilize at
moderate levels of ~3% in the near term, as higher
increases in housing costs are offset by lower food price
rises. Global inflation will average 3.8% and that in
MENA will 9.3% in 2013-14, as reported by QNB. With
the growth in the non-hydrocarbon sector and the
expanding population and prices, especially rents are
expected to rise. However, this will be offset by the falling
global food prices, as anticipated by QNB. Additionally,
QNB foresees oil prices to fall slightly in 2014, which will
help contain inflationary pressures in the GCC.
Real Estate Sector
Project market remains strong; realty to strengthen ahead
Since the global financial crisis in 2008-09, growth in
GCC countries has been primarily driven by the rising
public sector spending, especially on physical and social
infrastructure, and buoyant private sector activity.
According to MEED, the GCC projects market is
expected to have another impressive year in 2013, as the
value of contracts planned or underway stood at USD 1.9
trillion as on February 2013, significantly higher than the
USD 730 billion in 2012. Data from MEED shows that
Saudi Arabia leads the region with close to USD 732
billion worth of projects planned or underway followed
by the UAE’s USD 549 billion contracts. In the first half
of 2013, construction and transport sector contracts
worth USD 39 billion have been awarded for projects in
the GCC, with Qatar Rail Project (USD 8.4 billion) the
top ranking project in terms of value of the project.
Further, the latest data revealed by MEED in May 2013
stated that the value of contracts to be awarded in the
GCC region is expected to reach USD 1.35 trillion by
end-2013. Saudi Arabia leads the region with close to
USD 600 billion projects to be awarded, followed by the
UAE, with more than USD 350 billion contracts and
Kuwait with a little over USD 150 billion. Between Qatar,
Oman, and Bahrain, approximately USD 250 billion are
expected to be awarded this year.
Figure 05: GCC Projects Planned or Underway (%)
Source: MEED, February 2013
Meanwhile, the real estate market continues to experience
varied degrees of recovery because of mixed economic
performances by the six countries and significant
variances in demand and supply levels. The markets of
the UAE and Saudi Arabia continued to lead the recovery
in GCC’s real estate sector, while Kuwait improved
steadily in Q1 2013, backed by government support and
improving consumer sentiment. In Qatar, the real estate
market is still constrained by weak occupier demand and a
lack of investment appetite. The future of its real estate
market is promising on expected increase in demand on
the back of increasing oil revenues and a successful bid of
the FIFA world Cup 2022. In Saudi Arabia, the new
mortgage law is expected to drive the demand for Saudi
residential properties, as it is expected to facilitate the
entry of lenders, property developers, and middle-class
Saudi homebuyers in the real estate sector. Further,
increased interest from foreign investors in the UAE and
Qatari markets following their recent MSCI upgrade is
also expected to contribute to the strengthening of the
realty sector of the GCC region.
Residential Sector
Performance remains mixed; affordable housing still a concern in some places
The housing sector in the GCC countries mostly reflects
sturdy performance, owing to a rising demand backed by
strong economies and increased number of expats. The
sector continued to be one of the most vulnerable in the
GCC real estate industry.
UAE: H1 2013 saw mixed performance in the Abu Dhabi
residential market, with decline in some areas offset by
growth in others. The residential market is now
witnessing increased tenant activity arising from the
government’s decision to extend a housing allowance to
employees staying in Abu Dhabi. Prime development
areas have experienced steady rental growth of 10% y-o-y,
fuelled by strong demand and lack of availability. JLL
anticipates that the deflationary rental situation in
secondary and tertiary locations is set to change. Lease
rates across the capital are expected to increase from the
second half of the year.
Saudi
Arabia
39%
UAE
30%
Qatar
12%
Kuwait
10%
Oman
6%
Bahrain
3%

Meanwhile, the residential market in Dubai is now
experiencing a broad-based recovery, with a few
secondary locations outperforming prime areas in H1
2013. Further, recent announcements of large-scale
projects in the Dubai property market conforms the
investor’s confidence, in spite of the mortgage cap law
that is expected to come in place in the near future.
Saudi Arabia: The residential market witnessed solid
growth in H1 2013, as the demand for housing rose due
to increased lending activities, supportive policies and
initiatives by the government, and improved investor
confidence. With a large of share of young population,
and a high single expat population, there is a large
demand for small and affordable residential
accommodation, particularly in the regions of Makkah,
Riyadh, and the Eastern Province. The supply of housing
units has not been able to keep up with demand due to
affordability limitations. However, the newly passed
mortgage law is expected to help the banking sector
expand lending for home purchases and narrow down the
demand-supply gap.
Kuwait: Kuwait’s residential segment is driven by its fast-
rising population, coupled with shortage of adequate
housing. The IMF predicts the population to reach 4.5
million by 2018, at a CAGR of 2.8% for 2012–2018. On
the supply side, there has been severe housing shortage.
Currently, the waiting list for government-subsidized
housing stands past the 100,000 mark and, 2013 onwards,
it is expected to increase at a rate of 8,000 applications
every year. With the combined effect of rising population
and growing shortage, we expect the sector to witness
higher activity, mainly driven by government initiatives.
Consumer sentiment has also improved significantly over
the last few months, which is expected to translate into
higher demand for the residential segment. As a result,
prices and rental rates are expected to trend higher.
Qatar: Qatar’s residential real estate market, especially
Doha, is represented by high housing shortage. Qatar’s
residential real estate market, especially Doha, is
represented by high housing shortage resulting from the
influx in expatriate population. As more and more foreign
workers arrive in the country to engage in development
projects being launched in preparation for the 2022 FIFA
World Cup, it has mounted the pressure on the housing,
sending the rents spiraling.
Oman: The rapidly rising population, especially the
expatriate population, and an increase in the minimum
wage in the private sector by ~48% resulted in a huge
boost to the residential real estate sector. There is an
increased demand for better quality properties within the
lower income housing segment. On the other hand, there
is a strong demand from the traditional Omanis for
already constructed better designed houses as people do
not want to buy land and construct their houses. Within
the rental market, a two-tier market has emerged, which
has increased rental gaps between the prime developed
and poorly designed areas.
Bahrain: Bahrain’s residential market witnessed an
increased level of activity, with a number of new
developments being announced in the Q2 2013. As part
of the surge in housing and infrastructure projects
initiated by the government during Q2 2013, the Housing
Minister announced that around USD 8 billion will be
spent on housing projects by 2017. Further, Bahrain’s
Shura Council approved a reduction in registry charges of
newly purchased properties from 3% to 2% with the aim
of further stimulating real estate growth. Meanwhile,
rental gaps have widened as some pockets of the country
continue to suffer from domestic unrests. The market has
also witnessed development of a niche market, which
comprises expatriates from Saudi Arabia who prefer to
reside in Bahrain and commute to work.
Table 01: Annual Residential Rents in GCC – H1 2013
Location Type Price
Kuwait (‘000KWD) 1KWD=3.500 USD
Jabriya 2 BR Apt 5-7
Salmiya 2 BR Apt 4.5-6.5
Hawalli 2 BR Apt 4-5
UAE (‘000 AED) 1AED=0.272 USD
Palm Jumeirah 2 BR Apt 150-155
Dubai Marina 2 BR Apt 100-110
Abu Dhabi Corniche 2 BR Apt 75-190
Saudi Arabia (‘000 SAR) 1SAR=0.267 USD
Riyadh Central 2 BR Apt 36-40
Riyadh East 2 BR Apt 24-26
South Jeddah 2 BR Apt 25-30
Qatar (‘000 QAR) 1QAR=0.274 USD
West Bay 2 BR FF Apt 100-140
Pearl Qatar 2 BR FF Apt 140-190
Al Sadd 2 BR FF Apt 60-90
*Exchange rates as on June 30, 2013
Source: Amar Finance Research
Commercial Sector
Office space performance sluggish
Most GCC countries are witnessing increased supply of
office space, as compared with demand. As a result,
vacancy rates are mounting and putting a downward
pressure on rental rates.
UAE: Abu Dhabi’s increasing supply and demand
imbalance is extending the tenant-led market, forcing the
property owners to be more flexible with their terms and
generous in their incentive packages, particularly for long-
term lease agreements. There has been improved demand
for Grade A office premises, while Grade B and C
continue to witness deflationary situations.
On similar lines, Dubai’s office market remains
fragmented with traditional submarkets still struggling to
attract tenants. On one hand, prime locations have been

led by landlords while in other locations, tenants continue
to benefit from flexibilities offered by landlords such as
rent-free periods. Further, landlords are splitting space
into smaller floor-plates and fitting out space in an
attempt to attract potential tenants. Overall, the office
market continues to improve, even though growth is seen
primarily in top quality buildings and prime and newer
locations.
Saudi Arabia: The office market in Riyadh is facing an
oversupply situation, and the trend is likely to worsen in
the coming quarters. To tackle the oversupply situation to
some extent, the government has decided to move its
offices to northern Riyadh.
The office space market in Jeddah continues to see strong
demand from both government and private sector tenants,
and this has resulted in a reduction in vacancy levels, from
16% at the end of 2012 to just 12% at the end of Q1, as
reported by JLL in its Q1 2013 report. The vacancies are
expected to decline further in the short term, until more
of supply in the pipeline becomes ready for lease. Despite
low vacancy, rents have remained relatively stable across
the market and are unlikely to increase in the current year,
given the significant levels of potential new supply.
Kuwait: Kuwait’s oversupplied office market is showing
distinct signs of stress, dragged down initially by the
global financial crisis and continuous political protests.
This has hampered the approval of many large
infrastructure projects. However, with the formation of
the new government and the latest government incentives,
this scenario is expected to change soon. The new
regulations are expected to attract more FDI and
businesses into the country, thereby leading to increased
demand for office spaces. Markaz estimates the rental
prices to remain stable in 2013 and 2014 and start
growing thereon because of increased demand from the
private sector and government.
Qatar: Qatar’s commercial market continues to suffer
from a mismatch between occupier requirements and
supply. Prime/Grade A space in smaller sizes remains
scarce, which has pushed rents in the prime area of the
West Bay up to levels of QAR 200-250/sqm per month.
Grade B office space, with rents of 110-150/sqm per
month and the office space of less than 500 sqm,
continues to dominate the Doha market in terms demand.
As a result, its availability is low and estimated at around
15%. In the short term, activity in the office market is
likely to increase as preparations for the FIFA World Cup
2022 (Siemens plans to set up office to display its
technologies for major sporting events to attract business
from incoming tourists) and strong economic growth
might attract more foreign investors and tenants, creating
additional demand for office space in Doha.
Oman: Oman’s commercial market has two very distinct
commercial tiers – spaces with adequate car parking and
spaces without it. According to Savills, the market
remains under acute rental pressure, as about 45% of all
office space completed in the last 36 months is still vacant.
However, there is consistent demand for quality office
space with adequate car parking facilities. According to
Savills, smaller units, particularly those fitted out and
ready to move into are still in high demand, primarily
from new startup companies.
Bahrain: The office segment in the Kingdom remains
oversupplied. Demand has been concentrated from the
existing businesses for expansion rather than new entrants
due to the ongoing political unrests. As a result, landlords
remain under pressure to remain flexible on the lengths of
rent free and fit-out periods given the oversupply in the
office market. Areas with better parking facilities and easy
access remained the top priorities for business houses.
According to CBRE, properties with existing, quality
tenants on long leases, with good management and in
prime locations are witnessing high preference resulting in
huge gaps in vacancy rates. We anticipate rental gaps to
widen further because of this preference.
Table 02: Annual Office Rentals in GCC in H1 2013
Location Rent
Kuwait (KWD per sq m) 1KWD=3.500 USD
Kuwait City 45-85
Salmiya 80-100
Hawalli 80-100
UAE ( AED per sq m) 1AED=0.272 USD
Dubai International Financial Center 2,400-2,500
Dubai Business Bay 550-900
Abu Dhabi Corniche 1,350-1,550
Al Reem Island 1,150-1,450
Saudi Arabia (SAR per sq m) 1SAR=0.267 USD
King Fahad Road, Riyadh 850-1,150
Tahlia Road, Riyadh 700-950
King Abdullah Street, Jeddah 850-1,200
Qatar ( QAR per sq m) 1QAR=0.274 USD
West Bay 2,400-3,000
Airport Road 1,650-1,750
C Ring Road 1,600–1,700
*Exchange rates as on June 30, 2013
Source: Amar Finance Research
GCC countries’ attractiveness to retailers to boost retail sector development
Most of the GCC countries are characterized by a strong
and growing retail sector and 2013 has not been any
exception. Strong demographics, with young local and
expatriate population, as well as improving spending
capacity are the primary drivers of the growing demand
for the segment. It is further supplemented by demand
from the growing tourism and hospitality industry that
has benefitted from the governments’ development plans
and increase in private sector contribution.

According to Markaz, the GCC retail market is set to
become a USD 221 billion industry by 2015, growing
remarkably at an annualized growth of 7.9% for the
period 2012-15. This growth is further reflected in the
2013 Global Retail Development Index by A. T.
Kearney’s, where four major GCC countries–the UAE
(5th rank), Kuwait (9th), and Saudi Arabia (16th), and
Oman (17th)–retain their positions in the top 20 global
retail performers list. In the UAE, especially Dubai, new
malls as well as extensions to the existing malls are
underway or are being planned. Some of the examples are
extensions to Dubai Mall, Ibn Battuta Mall, and Dragon
Mart, new malls at JBR’s The Walk and Palm Jumeirah.
The Mall of the World at Mohammed Bin Rashid City,
when complete, will be the largest retail space in the
world. Meanwhile, in Kuwait, retail mall space increased
to ~550,500 sqm in end-2012, and Markaz forecasts
aggregate supply to grow by 8.7% over 2013-14. Saudi
Arabia’s retail mall space, in particular, remains
undersupplied and JLL anticipates that with the upcoming
retail projects, mall-based retail space is expected to reach
1.8 million sqm in Riyadh and 1.04 million sqm in Jeddah
by the end of 2016.
GCC tourism demand remains strong
The GCC region continued to attract tourists across the
globe by promoting niche tourism segments such as
religious tourism, events and sports-based tourism as well
as MICE (Meetings, Incentives, Conferencing, and
Exhibition) tourism. This has resulted in the development
of a large number of luxury hotels across the region. The
improving economic condition, government's support to
the private sector, and strategic location of the GCC as an
ideal transit point with better reach from the airline
industry, fosters well for the hospitality sector. As per
Markaz, the estimated room revenue in the GCC hotel
sector for 2011 stood at USD 17.8 billion and is likely to
see a CAGR of 6.9%, reaching USD 24.9 billion by 2016.
The GCC hospitality market is dominated by luxury
hotels, and its current pipeline also reveals a similar
scenario. According to STR Global, as of June 2013, the
Middle East and Africa hotel development pipeline
comprises 491 hotels, with a total of 120,795 rooms. With
10,391 rooms under construction, Dubai leads the pack.
Other key regions in the GCC include Riyadh with 5,598
rooms under construction, Qatar with 4,427 rooms, Abu
Dhabi with 3,727 rooms, Jeddah with 2,213 rooms, and
Kuwait with 2,065 rooms. Some of the international hotel
chains are increasingly showing the willingness to tie up
with local players. Service apartments have also grown in
the GCC region with the rise of business travelers and
expatriates who look for longer stays at reasonable prices.
The sector also faces a series of challenges. One major
worry is that the global economic slowdown could reduce
travel, leading to oversupply of hotel rooms. The industry
suffers from lack of skilled labor, and any domestic
instability could impact the tourism business of the region.
Overall, the outlook for the hospitality sector is promising,
and GCC governments and private stakeholders are
committed to addressing the challenges through various
measures.
Major Projects
Table 03 illustrates major ongoing projects in the GCC.
Table 03: Major Projects in the GCC
Project Name Type Value (USD billion)
Location
Saudi Arabia Ministry of Housing - 500,000 Houses Program
Residential 67.0 Saudi Arabia
Modon - Sudair Industrial City
Industrial Zones 40.0 Saudi Arabia
ALDAR - Yas Island Development
Community Development
40.0 UAE
Dubai World Central (DWC)
Free Zones/Economic Zones
37.3 UAE
Kuwait PAHW - Khairan Residential City
Residential 27.0 Kuwait
Kuwait PAHW - Sabah Al Ahmad Future City
Community Development
27.0 Kuwait
SAGIA - Jazan Economic City
Free Zones/Economic Zones
27.0 Saudi Arabia
SAGIA - King Abdullah Economic City (KAEC)
Free Zones/Economic Zones
27.0 Saudi Arabia
ADFEC - Masdar Carbon Free City
Community Development
22.0 UAE
Oman Ministry of Finance - Duqm New Downtown
Community Development
20.0 Oman
Chemaweyaat - Chemicals Industrial City
Industrial 20.0 UAE
Modon - Jazan Industrial City
Industrial Zones 17.0 Saudi Arabia
ALDAR - Yas Island Development - Yas Mall
Retail 12.8 UAE
ADFEC - Masdar Carbon Free City - Phase 1
Mixed Development 10.0 UAE
Albilad - Water Garden City
Mixed Development 9.8 Bahrain
Al-Mozaini Real Estate Investment Company - Riyadh East Sub Center
Mixed Development 8.0 Saudi Arabia
KEC - Madinah Knowledge Economic City
Free Zones/Economic Zones
7.0 Saudi Arabia
MOPM - Waad El Shammal Mining City
Industrial Zones 6.9 Saudi Arabia
Kuwait MPW - Bubiyan Island
Mixed Development 6.0 Kuwait
LREDC - Lusail City Community Development
5.5 Qatar
Msheireb Properties - Msheireb
Community Development
5.5 Qatar
JODC - Jabal Omar Development
Mixed Development 5.5 Saudi Arabia
Source: Zawya

Kuwait
In 2012, Kuwait continued to witness the positive
economic trends that had begun in 2011. KFH Research
estimates that the country registered GDP growth of
5.2% in 2012, supported by record oil production, which
increased exports; higher FDI; and escalating government
expenditure. The country’s government has registered its
highest-ever budget surplus for the first 10 months of FY
2012−13.
Figure 06: Real GDP
Source: IMF for Actual and KFH for Estimate and Forecast
The KFH estimates that real GDP growth in the country
will remain resilient at 4.5% in 2013, and 5% in 2014,
amidst sustained oil production and exports. Growth will
also continue to be driven by expanding government
expenditure and private consumption, coupled with
increase in FDI on the back of improved business
conditions. A KWD 1 billion SME Fund, which was
recently approved with the objective of providing
financing for small businesses, is also expected to improve
the overall business environment, as SMEs form 85% of
Kuwait’s total private businesses.
Additionally, in Q2 2013, the government announced the
allocation of USD 5.4 billion towards development
spending under the Kuwait Development Plan 2013−14.
The FY 2013−14 allocation, representing ~11% of GDP,
will focus on infrastructure development. This will
provide a boost to the infrastructure sector, given the
rising demand for infrastructure development in Kuwait,
in line with rapid population growth, as seen in Fig 07. As
the population growth is expected to continue, demand
for infrastructure is likely to carry on fuelling robust
activity in the infrastructure and construction industry as
well as the realty sector.
Figure 07: Population
Source: EIU Country Report, August 2013
In view of the positive measures mentioned above, the
perception of Kuwait as the least business-friendly
country in the GCC is likely to change.
Economic Overview
Credit growth remains strong
Consumer lending in Kuwait has been climbing at a very
fast pace for more than four years, since the state agreed
to buy citizens’ personal loans, write-off interest worth
USD 2.6 billion, and reschedule repayments in April 2013.
The Central Bank of Kuwait (CBK), in its July publication,
revealed that bank loans to individuals grew 13.4% y-o-y
in H1 2013, outstripping corporate lending, which rose
2.2% during the same period.
The total bank credit rose by a strong KWD 1.2 billion in
H1 2013 to KWD 28.0 billion, with y-o-y credit growth
accelerating to 6.2%, the fastest pace since late 2009.
Banks continued to enjoy high levels of liquidity. Money
supply remained strong during the period, with M1 and
M2 growing 11.2% y-o-y and 18.3% y-o-y, respectively.
Figure 08: Credit facilities to Residents and M2 Supply
Source: Central Bank of Kuwait, June 2013
Year to date consumer loans went up 15.2% y-o-y from
KWD 1.1 billion, while installment loans (loan for non-
commercial purposes, particularly for restoring or
purchasing private residence) went up 18.8% y-o-y from
KWD 6.5 billion. Solid y-o-y gains were also witnessed in
real estate (5.5%) and construction lending (10.9%),
indicating that the newly formed government will bring
the stability required to accelerate the launch of new
projects to fulfill the growing demand in the realty sector.
Figure 09: Total Credit Facilities
Source: Central Bank of Kuwait, June 2013
Although YTD credit growth improved in 2013, it is too
soon to declare a recovery. With the on-boarding of the
new government in July 2013, outlook for credit growth is
likely to improve in the near future, following the
unveiling of new projects and restarting of stalled ones.
Government boosts non-oil economy through lower interest rates
Interest rates in Kuwait normally follow the interest rates
set by the US Federal Reserve (US central bank) as it has
the maximum weight in the undisclosed trade-weighted
4.2%
(7.8%)
11.4%
8.2%
5.2% 4.5% 5.0%
-10.0%
-5.0%
0.0%
5.0%
10.0%
15.0%
2008 A 2009 A 2010 A 2011 A 2012 E 2013 F 2014 F
GD
P G
row
th R
ate
(%)
3.53.6
3.73.8
3.9
4.1
3.2
3.4
3.6
3.8
4.0
4.2
2009A 2010A 2011A 2012E 2013F 2014F
Po
pula
tio
n (
in m
illio
n)
22
24
26
28
30
32
Q1 11 Q2 11 Q3 11 Q4 11 Q1 12 Q2 12 Q3 12 Q4 12 Q1 13 Q2 13
In K
WD
bn
Credit Facilities to Residents Money Supply (M2)
8.0
8.2
8.4
8.6
8.8
9.0
9.2
9.4
22
23
24
25
26
27
28
29
30
Q1 11 Q2 11 Q3 11 Q4 11 Q1 12 Q2 12 Q3 12 Q4 12 Q1 13 Q2 13 Cre
dit
to
Co
nst
ruct
ion
an
d R
eal
Est
ate
(KW
D b
n)
To
tal C
red
it F
acili
ties
to
R
esid
ents
(K
WD
bn
)
Total Credit Facilities to Residents Credit to Construction and Real Estate

basket of currencies. However, In October 2012, the
CBK had reduced the discount rate from 2.5% to 2.0% as
inflation fell significantly. This decision was aimed at
boosting growth in the non-oil economy. The central
bank further has hinted that the rates shall now remain
largely unchanged until 2015, when the US Fed is
expected to tighten its policies.
Meanwhile, delays in development projects and poor
performance of financial sector, especially investment
companies, have resulted in a sluggish lending scenario
for the private sector. The loan demand and supply in the
housing sector is likely to be stimulated if there is any
sudden rate cut by the CBK.
Figure 10: Interest Rates
Source: Central Bank of Kuwait, August 2013
Inflation to remain at manageable levels
According to the National Bank of Kuwait (NBK), the
country’s inflation went up 3% y-o-y in June and averaged
2.6% in H1 2013, due to a jump in the price of non-food
components and housing services. The core CPI went up
by 2.4% y-o-y in June, from 2.1% in May. Inflation related
to the food components, which makes up 18.3% of the
CPI, slowed in June to 5.8% from 6.3% in May, and
stood at an average of 4.1% in H1 2013. However, this
slowdown was compensated by an increase in inflation in
housing services and household maintenance.
Figure 11: Consumer Price Index
Source: EIU Country Report, August 2013
Looking ahead, EIU suggests that Kuwait’s inflation rate
is likely to remain manageable at 3−4% in 2013−2014, as
food prices are expected to remain modest and prices in
the housing segment relatively stable. Meanwhile,
decreasing international food prices has resulted in a
distinct deceleration in Kuwait’s food inflation, which had
been the source of the overall high inflation in Kuwait
over the last couple of years. Extensive subsidy by the
government in fuel and food items is likely to check a
strong rise in inflation. In contrast, recent inflation data
reveals a significant rise in rental rates which could result
in a rise in inflation rates in the future.
Real Estate Sector
Government support and policy measures to provide additional boost
The Kuwaiti government has been playing an important
role in the recovery of its real estate sector. Earlier, the
regulatory framework of Kuwait had acted as an obstacle
to attracting investments in the real estate sector.
However, the government has come out with new policies
that will not only attract fresh investment but also
generate demand from within the country. In addition,
the robust spending plans of the government are expected
to provide an additional boost.
As a part of its USD 110 billion State Development Plan,
Kuwait revealed its plan to spend USD 15.8−17.5 million
(KWD 4.5−5.0 million) on infrastructure in 2013−2014.
This comes as a welcome move for the industry, given the
delay in project execution in the recent past. The banking
sector is expected to further facilitate project execution
with its surplus liquidity position. The IMF has also urged
the Kuwaiti government to consider tapping the debt
market to fund its development plan, as borrowing costs
in the Middle East have dropped substantially. This would
make the government less reliant on oil revenue, which
makes up close to 90% of its public revenues.
Over the past few years, FDI inflows into Kuwait have
been low due to an unfavorable regulatory framework.
With the aim of bolstering FDI in the country, the
government recently introduced a new Companies Law
that offers a one-stop-shop for both company
incorporation and the licensing of businesses. Further,
single shareholders shall be allowed to set up first time
businesses and permit transfer of shares in companies.
Furthermore, the Kuwait National Assembly has been
deliberating over setting up a separate authority that
would solely work towards bringing in fresh investments
into the country. With the aforesaid initiatives, the
investor sentiments for Kuwait will improve significantly
leading to increased FDI inflows.
Positive trend to continue in 2013
Kuwait’s real estate sector recovered strongly in 2012,
after witnessing a slowdown in the past few quarters. The
sector has been well–supported by various government
measures, as discussed earlier. This has significantly
improved the outlook of end users and has resulted in
increased transaction volume. At the same time, it has
resulted in preventing a price fall. In Q2 2013, the overall
value of transactions grew 28.1% q-o-q to KWD 1 billion,
while the total volume of transactions rose 4.9% q-o-q.
Solid growth in sales was seen across the three major
market segments, namely residential, investment, and
commercial. On similar lines, H1 2013 sales stood at
KWD 1.8 billion, up 4.2% over the same period last year.
The increase in H1 2013 came on the back of an
0.5%
0.6%
0.7%
0.8%
0.9%
1.0%
Jun-11 Sep-11 Dec-11 Mar-12 Jun-12 Sep-12 Dec-12 Mar-13 Jun-13
Inte
rest
Rat
e
1-Month Deposit Rate 1-Month KIBOR
2.9%
4.1%
3.7%3.5%
4.1%
4.6%
2.5%
3.0%
3.5%
4.0%
4.5%
5.0%
2012 A 2013 F 2014 F 2015 F 2016 F 2017 F
Co
nsu
mer
Pri
ce In
flat
ion
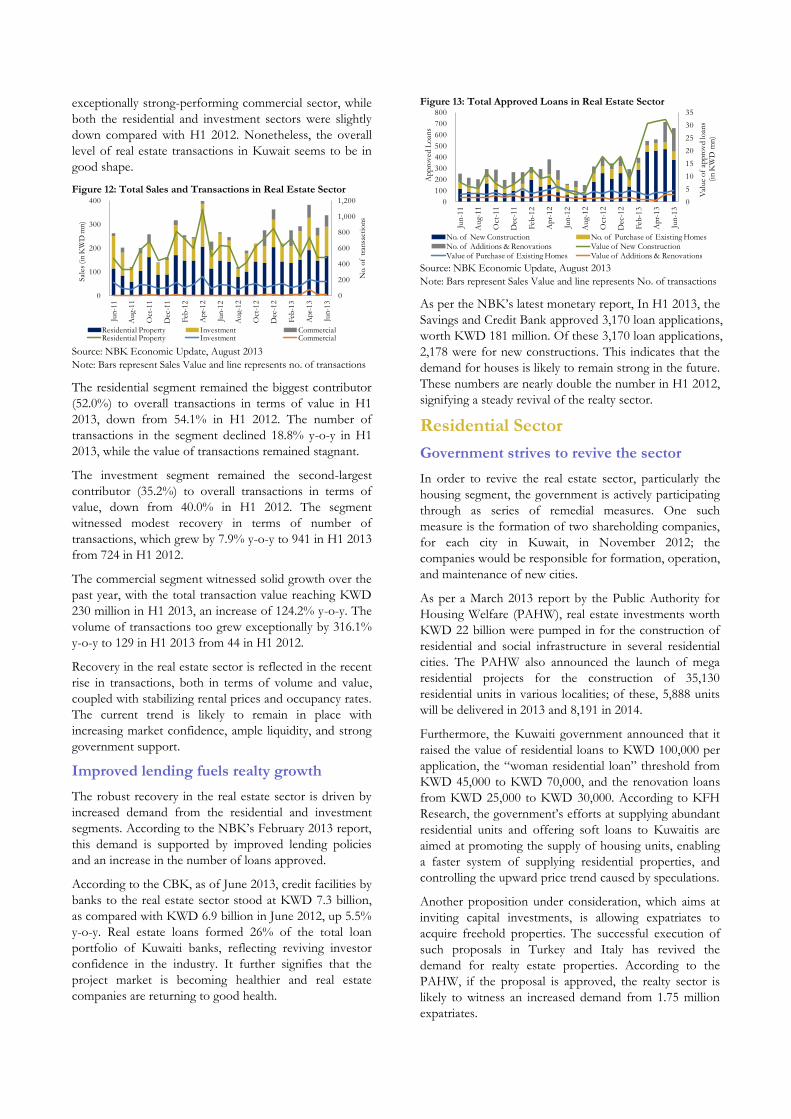
exceptionally strong-performing commercial sector, while
both the residential and investment sectors were slightly
down compared with H1 2012. Nonetheless, the overall
level of real estate transactions in Kuwait seems to be in
good shape.
Figure 12: Total Sales and Transactions in Real Estate Sector
Source: NBK Economic Update, August 2013
Note: Bars represent Sales Value and line represents no. of transactions
The residential segment remained the biggest contributor
(52.0%) to overall transactions in terms of value in H1
2013, down from 54.1% in H1 2012. The number of
transactions in the segment declined 18.8% y-o-y in H1
2013, while the value of transactions remained stagnant.
The investment segment remained the second-largest
contributor (35.2%) to overall transactions in terms of
value, down from 40.0% in H1 2012. The segment
witnessed modest recovery in terms of number of
transactions, which grew by 7.9% y-o-y to 941 in H1 2013
from 724 in H1 2012.
The commercial segment witnessed solid growth over the
past year, with the total transaction value reaching KWD
230 million in H1 2013, an increase of 124.2% y-o-y. The
volume of transactions too grew exceptionally by 316.1%
y-o-y to 129 in H1 2013 from 44 in H1 2012.
Recovery in the real estate sector is reflected in the recent
rise in transactions, both in terms of volume and value,
coupled with stabilizing rental prices and occupancy rates.
The current trend is likely to remain in place with
increasing market confidence, ample liquidity, and strong
government support.
Improved lending fuels realty growth
The robust recovery in the real estate sector is driven by
increased demand from the residential and investment
segments. According to the NBK’s February 2013 report,
this demand is supported by improved lending policies
and an increase in the number of loans approved.
According to the CBK, as of June 2013, credit facilities by
banks to the real estate sector stood at KWD 7.3 billion,
as compared with KWD 6.9 billion in June 2012, up 5.5%
y-o-y. Real estate loans formed 26% of the total loan
portfolio of Kuwaiti banks, reflecting reviving investor
confidence in the industry. It further signifies that the
project market is becoming healthier and real estate
companies are returning to good health.
Figure 13: Total Approved Loans in Real Estate Sector
Source: NBK Economic Update, August 2013
Note: Bars represent Sales Value and line represents No. of transactions
As per the NBK’s latest monetary report, In H1 2013, the
Savings and Credit Bank approved 3,170 loan applications,
worth KWD 181 million. Of these 3,170 loan applications,
2,178 were for new constructions. This indicates that the
demand for houses is likely to remain strong in the future.
These numbers are nearly double the number in H1 2012,
signifying a steady revival of the realty sector.
Residential Sector
Government strives to revive the sector
In order to revive the real estate sector, particularly the
housing segment, the government is actively participating
through as series of remedial measures. One such
measure is the formation of two shareholding companies,
for each city in Kuwait, in November 2012; the
companies would be responsible for formation, operation,
and maintenance of new cities.
As per a March 2013 report by the Public Authority for
Housing Welfare (PAHW), real estate investments worth
KWD 22 billion were pumped in for the construction of
residential and social infrastructure in several residential
cities. The PAHW also announced the launch of mega
residential projects for the construction of 35,130
residential units in various localities; of these, 5,888 units
will be delivered in 2013 and 8,191 in 2014.
Furthermore, the Kuwaiti government announced that it
raised the value of residential loans to KWD 100,000 per
application, the “woman residential loan” threshold from
KWD 45,000 to KWD 70,000, and the renovation loans
from KWD 25,000 to KWD 30,000. According to KFH
Research, the government’s efforts at supplying abundant
residential units and offering soft loans to Kuwaitis are
aimed at promoting the supply of housing units, enabling
a faster system of supplying residential properties, and
controlling the upward price trend caused by speculations.
Another proposition under consideration, which aims at
inviting capital investments, is allowing expatriates to
acquire freehold properties. The successful execution of
such proposals in Turkey and Italy has revived the
demand for realty estate properties. According to the
PAHW, if the proposal is approved, the realty sector is
likely to witness an increased demand from 1.75 million
expatriates.
0
200
400
600
800
1,000
1,200
0
100
200
300
400
Jun
-11
Au
g-1
1
Oct
-11
Dec
-11
Feb
-12
Ap
r-1
2
Jun
-12
Au
g-1
2
Oct
-12
Dec
-12
Feb
-13
Ap
r-1
3
Jun
-13
No.
of
tran
sact
ions
Sal
es (in
KW
D m
n)
Residential Property Investment CommercialResidential Property Investment Commercial
0
5
10
15
20
25
30
35
0
100
200
300
400
500
600
700
800
Jun-1
1
Au
g-1
1
Oct
-11
Dec
-11
Feb
-12
Apr-
12
Jun-1
2
Au
g-1
2
Oct
-12
Dec
-12
Feb
-13
Apr-
13
Jun
-13
Val
ue
of
app
rov
d lo
ans
(in
KW
D m
n)
Ap
pro
ved
Lo
ans
No. of New Construction No. of Purchase of Existing HomesNo. of Additions & Renovations Value of New ConstructionValue of Purchase of Existing Homes Value of Additions & Renovations

Figure 14: Population by Nationality
Source: Public Authority for Civil Information (PACE)
A draft law has been presented for the setting up of the
Public Authority of Real Estate (PARE), supervised by
the Minister of Commerce and Industry. It will maintain
coordination between the state’s authorities in connection
with real estate affairs, regulate real estate transactions,
and draw up the state’s real estate policy. In addition, the
CBK has resolved to incorporate a real estate valuation
company with a capital less than KWD 1 million. With
such initiatives, the residential sector is anticipated to see
strong revival in the near future.
Residential property segment to pick up in the medium term
The residential segment, unlike the rest of the realty
sector, has largely remained unaffected by the
disagreements between the government and the
parliament. Nevertheless, the residential property segment
accounts for the largest part of the total real estate pie in
Kuwait; it contributed around 52% in H1 2013.
According to the NBK, total transaction values for the
residential property segment remained almost flat
compared to H1 2012, at KWD 934.6 million. However,
the sector witnessed a sizeable drop of 18.8% in the total
number of transactions for the aforementioned period,
offset by an increase in average transaction size for both
homes and plots of land that constitutes a majority of the
transactions. The average transaction size was KWD
274,400 as of H1 2013.
Figure 15: Residential Property (self use) Sales and Transaction
Source: NBK Economic Update, August 2013
The recovery in Kuwait’s residential real estate segment is
expected to be driven by its fast-rising population,
coupled with a shortage of adequate housing. PACE
reveals that Kuwait’s population has grown at a CAGR of
4.6%, from 2.3 million in 2001 to 3.8 million in 2012.
Going forward, the IMF predicts that the population will
further grow at a CAGR of 2.8% to reach 4.5 million in
2018, which in turn will increase the demand for housing
units.
Figure 16: Population
Source: IMF
Under Kuwaiti law, its nationals are allowed to apply for
government housing after marriage. However, the
government has been unable to meet this local demand.
Currently, the waiting list for government-subsidized
housing stands past the 100,000 mark; it is expected to
increase at a rate of 8000 applications every year.
Furthermore, the situation has been aggravated by a
shortage of land. As per recent estimates, approximately
8% of the country’s land has been developed so far, while
95% is still owned by the government and controlled by
oil and gas sector companies.
Figure 17: Total Sales and Transactions in the Residential Sector
Source: NBK Economic Update, August 2013
The improved investment appetite over last few months
indicates that demand is likely to improve in the
residential segment, and prices and rental rates are
expected to go up.
Investment segment to remain marginally undersupplied
Expat employment opportunities as well as growth in the
expat population are primary drivers for the investment
segment. The segment, which comprises apartments and
buildings intended for rental use, weakened in the first
half of 2013 compared with the same period last year.
According to the NBK, the sector saw sales worth KWD
631.9 million in H1 2013, an 8.4% y-o-y decline, while the
number of transactions increased 7.9% y-o-y in H1 2013.
Even as the sector witnessed a rise in transaction volume,
the decline in sales was due to a slide in average
transaction size. The NBK states that this was because of
increased apartment sales, while the number of whole
buildings sold declined in H1 2013.
1.09 1.12 1.15 1.18 1.21 1.23
2.35 2.37 2.43 2.51 2.61 2.67
0.0
1.0
2.0
3.0
4.0
2008 2009 2010 2011 2012 H1 2013
in M
illio
ns
Kuwaiti Non-Kuwaiti
0
200
400
600
800
1,000
1,200
0
75
150
225
Jun
-11
Aug-
11
Oct
-11
Dec
-11
Feb
-12
Ap
r-1
2
Jun
-12
Aug-
12
Oct
-12
Dec
-12
Feb
-13
Ap
r-1
3
Jun
-13
No.
of
tran
sact
ions
Sal
es (
KW
D M
illio
n)
Residential Property Sales Value Number of Transactions
0%
1%
2%
3%
4%
5%
3.3
3.6
3.9
4.2
4.5
4.8
2009 2010 2011 2012 2013E 2014E 2015E 2016E 2017E 2018E
Population (mm) (LHS) Growth rate % (RHS)
0
200
400
600
800
1,000
1,200
1,400
0
75
150
225
300
375
450
Jun
-11
Au
g-1
1
Oct
-11
Dec
-11
Feb
-12
Apr-
12
Jun-1
2
Au
g-1
2
Oct
-12
Dec
-12
Feb
-13
Apr-
13
Jun-1
3
No.
of
tran
sact
ion
s
Sal
es (K
WD
Million)
Residential Sales Values Number of Transactions
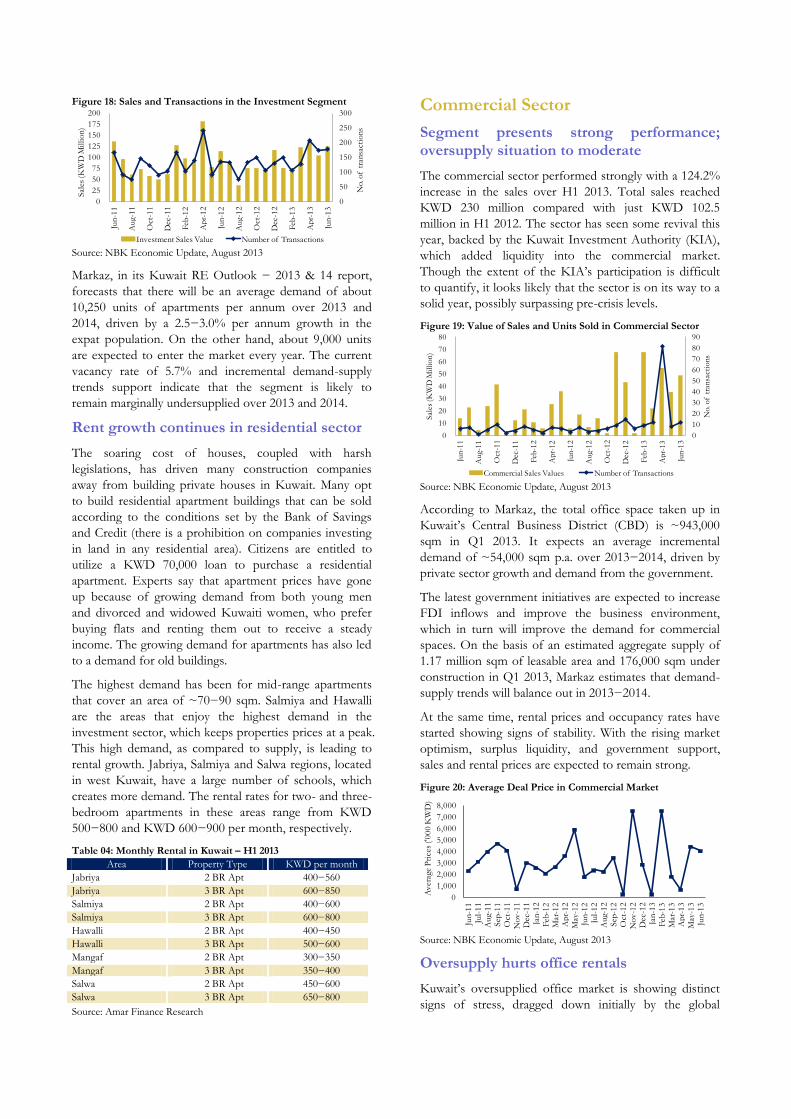
Figure 18: Sales and Transactions in the Investment Segment
Source: NBK Economic Update, August 2013
Markaz, in its Kuwait RE Outlook − 2013 & 14 report,
forecasts that there will be an average demand of about
10,250 units of apartments per annum over 2013 and
2014, driven by a 2.5−3.0% per annum growth in the
expat population. On the other hand, about 9,000 units
are expected to enter the market every year. The current
vacancy rate of 5.7% and incremental demand-supply
trends support indicate that the segment is likely to
remain marginally undersupplied over 2013 and 2014.
Rent growth continues in residential sector
The soaring cost of houses, coupled with harsh
legislations, has driven many construction companies
away from building private houses in Kuwait. Many opt
to build residential apartment buildings that can be sold
according to the conditions set by the Bank of Savings
and Credit (there is a prohibition on companies investing
in land in any residential area). Citizens are entitled to
utilize a KWD 70,000 loan to purchase a residential
apartment. Experts say that apartment prices have gone
up because of growing demand from both young men
and divorced and widowed Kuwaiti women, who prefer
buying flats and renting them out to receive a steady
income. The growing demand for apartments has also led
to a demand for old buildings.
The highest demand has been for mid-range apartments
that cover an area of ~70−90 sqm. Salmiya and Hawalli
are the areas that enjoy the highest demand in the
investment sector, which keeps properties prices at a peak.
This high demand, as compared to supply, is leading to
rental growth. Jabriya, Salmiya and Salwa regions, located
in west Kuwait, have a large number of schools, which
creates more demand. The rental rates for two- and three-
bedroom apartments in these areas range from KWD
500−800 and KWD 600−900 per month, respectively.
Table 04: Monthly Rental in Kuwait – H1 2013
Area Property Type KWD per month
Jabriya 2 BR Apt 400−560
Jabriya 3 BR Apt 600−850
Salmiya 2 BR Apt 400−600
Salmiya 3 BR Apt 600−800
Hawalli 2 BR Apt 400−450
Hawalli 3 BR Apt 500−600
Mangaf 2 BR Apt 300−350
Mangaf 3 BR Apt 350−400
Salwa 2 BR Apt 450−600
Salwa 3 BR Apt 650−800
Source: Amar Finance Research
Commercial Sector
Segment presents strong performance; oversupply situation to moderate
The commercial sector performed strongly with a 124.2%
increase in the sales over H1 2013. Total sales reached
KWD 230 million compared with just KWD 102.5
million in H1 2012. The sector has seen some revival this
year, backed by the Kuwait Investment Authority (KIA),
which added liquidity into the commercial market.
Though the extent of the KIA’s participation is difficult
to quantify, it looks likely that the sector is on its way to a
solid year, possibly surpassing pre-crisis levels.
Figure 19: Value of Sales and Units Sold in Commercial Sector
Source: NBK Economic Update, August 2013
According to Markaz, the total office space taken up in
Kuwait’s Central Business District (CBD) is ~943,000
sqm in Q1 2013. It expects an average incremental
demand of ~54,000 sqm p.a. over 2013−2014, driven by
private sector growth and demand from the government.
The latest government initiatives are expected to increase
FDI inflows and improve the business environment,
which in turn will improve the demand for commercial
spaces. On the basis of an estimated aggregate supply of
1.17 million sqm of leasable area and 176,000 sqm under
construction in Q1 2013, Markaz estimates that demand-
supply trends will balance out in 2013−2014.
At the same time, rental prices and occupancy rates have
started showing signs of stability. With the rising market
optimism, surplus liquidity, and government support,
sales and rental prices are expected to remain strong.
Figure 20: Average Deal Price in Commercial Market
Source: NBK Economic Update, August 2013
Oversupply hurts office rentals
Kuwait’s oversupplied office market is showing distinct
signs of stress, dragged down initially by the global
0
50
100
150
200
250
300
0
25
50
75
100
125
150
175
200 Ju
n-1
1
Au
g-1
1
Oct
-11
Dec
-11
Feb
-12
Ap
r-1
2
Jun
-12
Au
g-1
2
Oct
-12
Dec
-12
Feb
-13
Ap
r-1
3
Jun
-13
No.
of
tran
sact
ion
s
Sal
es (K
WD
Millio
n)
Investment Sales Value Number of Transactions
0
10
20
30
40
50
60
70
80
90
0
10
20
30
40
50
60
70
80
Jun
-11
Au
g-1
1
Oct
-11
Dec
-11
Feb
-12
Ap
r-1
2
Jun
-12
Au
g-1
2
Oct
-12
Dec
-12
Feb
-13
Ap
r-1
3
Jun
-13
No.
of
tran
sact
ion
s
Sal
es (K
WD
Millio
n)
Commercial Sales Values Number of Transactions
0
1,000
2,000
3,000
4,000
5,000
6,000
7,000
8,000
Jun
-11
Jul-
11
Au
g-1
1S
ep-1
1O
ct-1
1N
ov
-11
Dec
-11
Jan
-12
Feb
-12
Mar
-12
Ap
r-1
2M
ay-1
2Ju
n-1
2Ju
l-1
2A
ug-
12
Sep
-12
Oct
-12
No
v-1
2D
ec-1
2Ja
n-1
3F
eb-1
3M
ar-1
3A
pr-
13
May
-13
Jun-1
3
Av
erag
e P
rice
s ('0
00
KW
D)

financial crisis. In the past, an unfriendly regulatory
framework for incoming businesses and the low key
infrastructural progress have deterred the hope of new
businesses flooding the country.
Kuwait’s commercial landscape is clouded further by
political protests, which have led elected politicians and
the ruling family to be at loggerheads, hampering the
approval of many large infrastructure projects. However,
this is likely to change following the latest incentives of
the new government. The new regulations are expected to
attract more FDI and businesses into the country, thereby
leading to increased demand for office space. This will
help in absorbing the extra supply in the market.
Markaz estimates that the rental prices will remain stable
in 2013 and 2014, and start growing thereon because of
increased demand from private sector and the
government. The average monthly rental rate is now
KWD 5−8 per sqm, which, in an ideal situation, should
be KWD 13−14. The downturn has hit real estate
companies hard; several have closed down or have had
their shares halted from trading on the stock exchange.
Table 05: Office Space Rentals – H1 2013
Area KWD / sq. m/ per month
Kuwait City 4−7
Salmiya 7−8
Hawalli 7−8
Farwaniya 4−6
Khaitan 3.5−6
Fahaheel 6.5−8
Source: Amar Finance Research
Retail realty market remains optimistic
In the 2013 Global Retail Development Index by AT
Kearney, Kuwait climbed up three notches to reach the
ninth position globally, as its economy grows steadily and
outlook remains favorable amid increasing consumer
spending and greater presence of international retailers.
Consumer spending is the core driver for the retail sector
and, consequently, retail space demand. Trends in
consumer spending can be inferred from the trends in
Point of Sale (POS) transactions, which are transactions
registered for the purchase of a product or service. Fig 21
clearly shows that POS transactions continue to grow.
They improved to an average of 19% from Q1 2009 to
Q2 2013, pointing towards a recovery in consumer
spending growth and, in turn, the retail sector.
Figure 21: Average Deal Price in Commercial Market
Source: NBK, June 2013
The retail sector is expanding, and so is the demand for
retail space, despite their high cost. This can be inferred
from the huge supply that is on the way. The Avenues,
the country’s largest mall, opened its phase-three
extension in 2012, while the Gate Mall will open this year.
As Kuwaitis have high disposable income, they are more
drawn towards luxury products and high-end concepts.
The new extension at Avenues includes high-end
standalone shops to cater to this demand.
According to Real Estate Association, retail mall space in
Kuwait increased to 550,500 sqm as of 2012. Markaz
forecasts the aggregate supply to grow by 8.7% over 2013
and 2014 to 650,400 sqm. However, it trimmed its supply
forecasts, mainly due to the postponement of the
completion date of Phase –IV of Avenues mall, and the
low visibility on the construction of the Mall of Kuwait.
Retail mall space per capita in Kuwait continues to be the
lowest in the GCC region at 0.16 sqm, indicating potential
for growth. Markaz predicts that in 2014, the per capita
mall space in Kuwait will be 59% lower than in its GCC
peers (ex-UAE), indicating that the sector is not likely to
face an oversupply scenario.
Figure 22: Retail Mall Space
Source: REA, MEED, Markaz
Major Projects
Table 06 lists several major construction projects that are
underway in Kuwait
Table 06: Average Deal Price in Commercial Market
Project Name Type Value (USD
billion)
Status
Kuwait PAHW − Khairan Residential City
Residential 27.0 Ongoing
Kuwait PAHW − Sabah Al Ahmad Future City
Community Development 27.0 Ongoing
Kuwait MPW − Bubiyan Island
Mixed Development 6.0 Ongoing
Kuwait MPW − Failaka Island Development
Mixed Development 3.3 Ongoing
KU − Kuwait University City
Education 3.0 Ongoing
Kuwait MPW − Jaber Ahmed Al Jaber Al Sabah Hospital
Healthcare 1.6 Ongoing
KIA/ MoH − Kuwait Health Assurance Company (KHAC) Hospitals Project
Healthcare 1.2 Ongoing
Source: Zawya
0%
5%
10%
15%
20%
25%
30%
0
5
10
15
20
25
Q1 2
009
Q2 2
009
Q3
20
09
Q4 2
009
Q1 2
010
Q2
20
10
Q3 2
010
Q4 2
010
Q1 2
011
Q2
20
11
Q3 2
011
Q4 2
011
Q1
20
12
Q2 2
012
Q3 2
012
Q4
20
12
Q1 2
013
Q2 2
013
Mal
l sp
ace
per
cap
ita
(sqm
)
PO
S T
ran
sact
ion
s (i
n K
WD
bn
)
POS Transactions POS Transaction Growth
0.00
0.02
0.04
0.06
0.08
0.10
0.12
0.14
0.16
0.18
0
100
200
300
400
500
600
700
2010 2011 2012 2013 E 2014 E
Mal
l sp
ace
per
cap
ita
(sqm
)
Ret
ail m
all s
pac
e (s
qm
'00
0s)
Retail mall space (sqm) Mall space per capita
The UAE
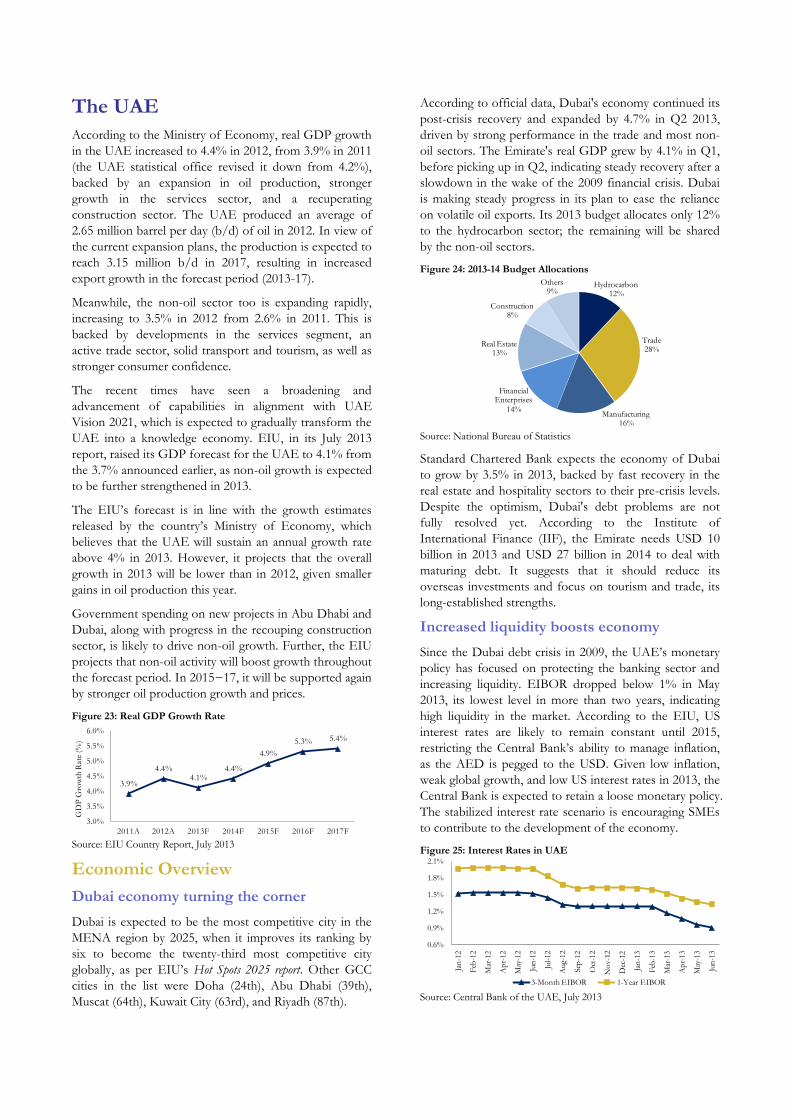
According to the Ministry of Economy, real GDP growth
in the UAE increased to 4.4% in 2012, from 3.9% in 2011
(the UAE statistical office revised it down from 4.2%),
backed by an expansion in oil production, stronger
growth in the services sector, and a recuperating
construction sector. The UAE produced an average of
2.65 million barrel per day (b/d) of oil in 2012. In view of
the current expansion plans, the production is expected to
reach 3.15 million b/d in 2017, resulting in increased
export growth in the forecast period (2013-17).
Meanwhile, the non-oil sector too is expanding rapidly,
increasing to 3.5% in 2012 from 2.6% in 2011. This is
backed by developments in the services segment, an
active trade sector, solid transport and tourism, as well as
stronger consumer confidence.
The recent times have seen a broadening and
advancement of capabilities in alignment with UAE
Vision 2021, which is expected to gradually transform the
UAE into a knowledge economy. EIU, in its July 2013
report, raised its GDP forecast for the UAE to 4.1% from
the 3.7% announced earlier, as non-oil growth is expected
to be further strengthened in 2013.
The EIU’s forecast is in line with the growth estimates
released by the country’s Ministry of Economy, which
believes that the UAE will sustain an annual growth rate
above 4% in 2013. However, it projects that the overall
growth in 2013 will be lower than in 2012, given smaller
gains in oil production this year.
Government spending on new projects in Abu Dhabi and
Dubai, along with progress in the recouping construction
sector, is likely to drive non-oil growth. Further, the EIU
projects that non-oil activity will boost growth throughout
the forecast period. In 2015−17, it will be supported again
by stronger oil production growth and prices.
Figure 23: Real GDP Growth Rate
Source: EIU Country Report, July 2013
Economic Overview
Dubai economy turning the corner
Dubai is expected to be the most competitive city in the
MENA region by 2025, when it improves its ranking by
six to become the twenty-third most competitive city
globally, as per EIU’s Hot Spots 2025 report. Other GCC
cities in the list were Doha (24th), Abu Dhabi (39th),
Muscat (64th), Kuwait City (63rd), and Riyadh (87th).
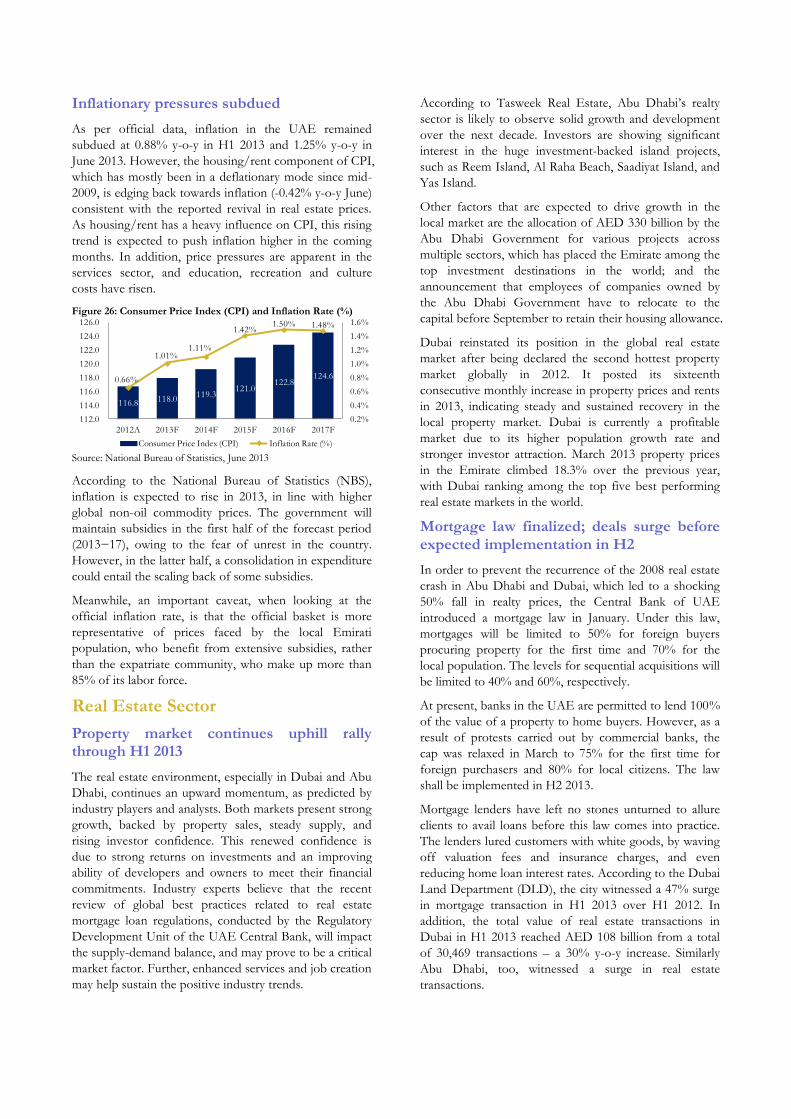
According to official data, Dubai's economy continued its
post-crisis recovery and expanded by 4.7% in Q2 2013,
driven by strong performance in the trade and most non-
oil sectors. The Emirate's real GDP grew by 4.1% in Q1,
before picking up in Q2, indicating steady recovery after a
slowdown in the wake of the 2009 financial crisis. Dubai
is making steady progress in its plan to ease the reliance
on volatile oil exports. Its 2013 budget allocates only 12%
to the hydrocarbon sector; the remaining will be shared
by the non-oil sectors.
Figure 24: 2013-14 Budget Allocations
Source: National Bureau of Statistics
Standard Chartered Bank expects the economy of Dubai
to grow by 3.5% in 2013, backed by fast recovery in the
real estate and hospitality sectors to their pre-crisis levels.
Despite the optimism, Dubai's debt problems are not
fully resolved yet. According to the Institute of
International Finance (IIF), the Emirate needs USD 10
billion in 2013 and USD 27 billion in 2014 to deal with
maturing debt. It suggests that it should reduce its
overseas investments and focus on tourism and trade, its
long-established strengths.
Increased liquidity boosts economy
Since the Dubai debt crisis in 2009, the UAE’s monetary
policy has focused on protecting the banking sector and
increasing liquidity. EIBOR dropped below 1% in May
2013, its lowest level in more than two years, indicating
high liquidity in the market. According to the EIU, US
interest rates are likely to remain constant until 2015,
restricting the Central Bank’s ability to manage inflation,
as the AED is pegged to the USD. Given low inflation,
weak global growth, and low US interest rates in 2013, the
Central Bank is expected to retain a loose monetary policy.
The stabilized interest rate scenario is encouraging SMEs
to contribute to the development of the economy.
Figure 25: Interest Rates in UAE
Source: Central Bank of the UAE, July 2013
3.9%
4.4% 4.1%
4.4%
4.9%
5.3% 5.4%
3.0%
3.5%
4.0%
4.5%
5.0%
5.5%
6.0%
2011A 2012A 2013F 2014F 2015F 2016F 2017F
GD
P G
row
th R
ate
(%)
Hydrocarbon12%
Trade28%
Manufacturing16%
Financial Enterprises
14%
Real Estate13%
Construction8%
Others9%
0.6%
0.9%
1.2%
1.5%
1.8%
2.1%
Jan
-12
Feb
-12
Mar
-12
Ap
r-12
May
-12
Jun
-12
Jul-
12
Aug-1
2
Sep
-12
Oct
-12
No
v-1
2
Dec
-12
Jan
-13
Feb
-13
Mar
-13
Ap
r-13
May
-13
Jun
-13
3-Month EIBOR 1-Year EIBOR
Inflationary pressures subdued
As per official data, inflation in the UAE remained
subdued at 0.88% y-o-y in H1 2013 and 1.25% y-o-y in
June 2013. However, the housing/rent component of CPI,
which has mostly been in a deflationary mode since mid-
2009, is edging back towards inflation (-0.42% y-o-y June)
consistent with the reported revival in real estate prices.
As housing/rent has a heavy influence on CPI, this rising
trend is expected to push inflation higher in the coming
months. In addition, price pressures are apparent in the
services sector, and education, recreation and culture
costs have risen.
Figure 26: Consumer Price Index (CPI) and Inflation Rate (%)
Source: National Bureau of Statistics, June 2013
According to the National Bureau of Statistics (NBS),
inflation is expected to rise in 2013, in line with higher
global non-oil commodity prices. The government will
maintain subsidies in the first half of the forecast period
(2013−17), owing to the fear of unrest in the country.
However, in the latter half, a consolidation in expenditure
could entail the scaling back of some subsidies.
Meanwhile, an important caveat, when looking at the
official inflation rate, is that the official basket is more
representative of prices faced by the local Emirati
population, who benefit from extensive subsidies, rather
than the expatriate community, who make up more than
85% of its labor force.
Real Estate Sector
Property market continues uphill rally through H1 2013
The real estate environment, especially in Dubai and Abu
Dhabi, continues an upward momentum, as predicted by
industry players and analysts. Both markets present strong
growth, backed by property sales, steady supply, and
rising investor confidence. This renewed confidence is
due to strong returns on investments and an improving
ability of developers and owners to meet their financial
commitments. Industry experts believe that the recent
review of global best practices related to real estate
mortgage loan regulations, conducted by the Regulatory
Development Unit of the UAE Central Bank, will impact
the supply-demand balance, and may prove to be a critical
market factor. Further, enhanced services and job creation
may help sustain the positive industry trends.
According to Tasweek Real Estate, Abu Dhabi’s realty
sector is likely to observe solid growth and development
over the next decade. Investors are showing significant
interest in the huge investment-backed island projects,
such as Reem Island, Al Raha Beach, Saadiyat Island, and
Yas Island.
Other factors that are expected to drive growth in the
local market are the allocation of AED 330 billion by the
Abu Dhabi Government for various projects across
multiple sectors, which has placed the Emirate among the
top investment destinations in the world; and the
announcement that employees of companies owned by
the Abu Dhabi Government have to relocate to the
capital before September to retain their housing allowance.
Dubai reinstated its position in the global real estate
market after being declared the second hottest property
market globally in 2012. It posted its sixteenth
consecutive monthly increase in property prices and rents
in 2013, indicating steady and sustained recovery in the
local property market. Dubai is currently a profitable
market due to its higher population growth rate and
stronger investor attraction. March 2013 property prices
in the Emirate climbed 18.3% over the previous year,
with Dubai ranking among the top five best performing
real estate markets in the world.
Mortgage law finalized; deals surge before expected implementation in H2
In order to prevent the recurrence of the 2008 real estate
crash in Abu Dhabi and Dubai, which led to a shocking
50% fall in realty prices, the Central Bank of UAE
introduced a mortgage law in January. Under this law,
mortgages will be limited to 50% for foreign buyers
procuring property for the first time and 70% for the
local population. The levels for sequential acquisitions will
be limited to 40% and 60%, respectively.
At present, banks in the UAE are permitted to lend 100%
of the value of a property to home buyers. However, as a
result of protests carried out by commercial banks, the
cap was relaxed in March to 75% for the first time for
foreign purchasers and 80% for local citizens. The law
shall be implemented in H2 2013.
Mortgage lenders have left no stones unturned to allure
clients to avail loans before this law comes into practice.
The lenders lured customers with white goods, by waving
off valuation fees and insurance charges, and even
reducing home loan interest rates. According to the Dubai
Land Department (DLD), the city witnessed a 47% surge
in mortgage transaction in H1 2013 over H1 2012. In
addition, the total value of real estate transactions in
Dubai in H1 2013 reached AED 108 billion from a total
of 30,469 transactions – a 30% y-o-y increase. Similarly
Abu Dhabi, too, witnessed a surge in real estate
transactions.
116.8 118.0119.3
121.0122.8
124.60.66%
1.01%1.11%
1.42%1.50% 1.48%
0.2%
0.4%
0.6%
0.8%
1.0%
1.2%
1.4%
1.6%
112.0
114.0
116.0
118.0
120.0
122.0
124.0
126.0
2012A 2013F 2014F 2015F 2016F 2017F
Consumer Price Index (CPI) Inflation Rate (%)

Meanwhile, analysts believe that banks may come up with
ingenious ways to partially sidestep the new regulation by
inflating property value in their books. Only vigorous
fiscal policing will help avoid this.
Abu Dhabi realty market oversupplied; H1 remains encouraging
The first half of 2013 was encouraging for Abu Dhabi’s
real estate markets, according the JLL. The market is
revealing optimistic signs, with price stabilization and
recovery in select areas. Q2 2013 witnessed improved
performances of the retail and hospitality sectors and
increase in the price of the prime residential properties.
Prime residential rents remained stable in Q2, after an 8%
growth in the Q1. Asteco has opined that its sales prices,
which is increasingly lower than in Dubai, coupled with
the launch of several lifestyle communities, will make Abu
Dhabi a very attractive alternative for both investors and
owner-occupiers. Meanwhile, the office market remained
oversupplied, with additional new supply still in pipeline.
Over the short to medium term, the JLL sees positive
growth in the hospitality sector, backed by government’s
commitment to build a highly attractive visitor destination.
It projects that the residential sector may also improve
with wide-ranging economic and social development as
well as infrastructure investment initiatives, leading to job
growth. Growth among the residential population as well
as tourism will further increase retail spending, thereby
creating demand for retail space.
Dubai realty market gaining momentum
Dubai’s realty market continues to improve, with all the
sectors in a recovery phase. The market saw a spectacular
H1 2013, with 30,469 deals worth AED 108 billion being
sealed, a 30% y-o-y increase. DLD revealed that sales
transactions in H1 2013 reached 22,748, or a total value
of AED 52.8 billion, representing a 49% growth.
Mortgages accounted for AED 51.3 billion, representing a
47% growth with 6,050 transactions in H1 2013.
Table 07: H1 2013 RE Transaction Value Break-up by Type
(in AED billion) Sales Mortgage Other transactions
Total
Land/Plot 27.1 45.4 2.5 75.0
Units/Apartments 23.2 4.7 0.8 28.7
Villas 2.4 1.2 1.0 4.6
Total 52.7 51.3 4.3 108.3
Source: Dubai Land Department, July 2013
Figure 27: H1 2013 Dubai Total RE Transactions (30,469)
Source: Dubai Land Department, July 2013
The real estate investment market remained active in 2013,
with increased levels of commercial and residential
transactions, as investors showed interest to invest in
Dubai. In its H1 2013 report, the JLL observed that on
one hand, the office property segment’s strong
performance remained concentrated on quality projects in
prime locations while on the other hand, the residential
and retail markets are witnessing a more broad-based
recovery. The hotel sector has maintained its strong
growth, while the industrial segment continues to expand.
Dubai’s rental sector topped the list of best performing
rental markets globally in 2012. While Knight Frank
reported a 10.1% rise in rental values in H1 2013, the
National Bank of Abu Dhabi (NBAD) revealed that
average rents in the city rose by 3% in June alone to AED
74.2 per sq. ft., taking the annual increase to 16.4%. The
overall performance of the market, including the realty,
retail, and hospitality businesses, indicates that Dubai is
set to become the investors’ paradise again.
However, a surge in new property development has
prompted concerns about the sustainability of sector
recovery (recall the bubble in 2008). The International
Monetary Fund (IMF) had released a statement warning
Dubai that its property market is on a path to a dangerous
boom-and-bust cycle, which could bring it close to default.
IMF urged that the speed with which the realty market is
progressing must be regulated.
Foreign investors continue to be active
Dubai’s realty market is a profitable investment channel
because of its stability, diversity, and high returns. This is
reflected by the increase in transactions and investments,
which in turn signify that Dubai has largely recovered
from the crisis. According to DLD’s semi-annual report,
the Emirate’s realty market attracted investments worth
AED 52.8 billion in H1 2013, a 49% y-o-y increase. A
AED 53 billion break-down in investments shows that
Arab investors contributed roughly AED 5 billion – a
111% y-o-y increase in spending, GCC nationals
contributed over AED 16 billion – a 57% increase in
spending, and foreign investors contributed over AED32
billion – a 73% increase.
Figure 28: Dubai Realty Investments in H1 2013 – AED 53 billion
By Nationality By Region
Source: Dubai Land Department, July 2013
0
5,000
10,000
15,000
20,000
25,000
Sales Mortgage Other Transactions
Units/Apartments (21,357)Land / Plot (7,277)Villas (1,835)
22,748
6,050
1,671
UAE
23%
India
15%
Britain
7%Pakistan
6%
KSA
4%
Jordan
2%
Other Foreign
32%
Other Arab
7%
Other GCC
4%
ForeignersAED32bn
GCCAED16bn
ArabAED5bn
0%
10%
20%
30%
40%
50%
60%
70%
80%
90%
100%

Among GCC investors, the largest chunk is made up of
UAE investors as 2,765 investors affected transactions
worth AED 12 billion in 2012. The next largest investor
communities belonged to the KSA (605 investors with
AED 2 billion) and Kuwait (141 investors with AED 360
million). Among expatriate investors, Indians ranked first,
purchasing property worth AED 8 billion against a total
investment of AED 9 billion in 2012. They were followed
by British and Pakistani investors, who transacted AED 4
billion and AED 3 billion, respectively.
The Q1 2013 Prime Global Cities Index by Knight Frank
also revealed that real estate prices in Dubai grew 5.4%
between January and March – the highest among major
global cities, with the Emirate continuing to maintain its
position among the top five best performing real estate
markets. The index ranked Dubai in the fourth position
among the 29 global cities. An increase in the number of
investors globally signals the accomplishment of various
policies and initiatives launched by the government to
portray Dubai as a safe and a rewarding place to invest in.
Residential Sector
Abu Dhabi on recovery trajectory
The first half of 2013 has been a relatively mixed period
for Abu Dhabi’s residential market, with decline in some
areas offset by growth in others. The residential market is
now witnessing increased tenant activity following the
government’s decision to extend housing allowance only
to employees staying in Abu Dhabi. The completion of a
significant number of new residential units from master-
planned locations is also encouraging relocation, as
tenants look to capitalize on prevailing affordability as
they search for new and better quality housing options.
A number of significantly delayed projects, such as Hydra
Village, have now been completed, while other stalled
projects have seen construction work restart, as
confidence returns to the market. Such trends are being
positively received by the market, raising confidence
amongst investors and signaling the start of a new growth
phase in the capital. The JLL, in its latest report, revealed
that approximately 4,300 residential units were delivered
in Abu Dhabi in H1 2013, bringing its total residential
stock to approximately 211,000 at the end of H1 2013. An
additional 10,000 units are scheduled to be delivered in
2013; by 2015, the aggregate supply could reach 254,000.
Figure 29: Abu Dhabi Future Visible Residential Stock
Source: JLL Abu Dhabi Real Estate Market Overview, Q2 2013
The residential sector is expected to return to positive
growth territory by 2013-end, with occupier and investor
activity intensifying. As the recovery intensifies, increased
demand is expected, specifically for quality properties
within established well planned communities and
desirable locations on the prime areas. Secondary
residential locations and inferior units without access to
good transportation or the benefit of a master-plan are
expected to see further deflationary trends in the short
term before the recovery becomes more broad-based.
Rental gap widens as quality rules; strong prospects ahead for Abu Dhabi
Despite a noticeable rise in leasing activity during H1
2013, and record sales transactions, average rents
continue to fall. The CBRE reported that rental rates have
dropped a further 4% during Q2 and are now down
around 10% y-o-y. However, prime development areas
have experienced steady rental growth of 10% y-o-y,
fuelled by strong demand and limited availability.
Table 08: Average Villa Rentals in Abu Dhabi in H1 2013
(in AED ‘000 p.a.) 3-BR Apt 4-BR Apt 5-BR Apt
Khalidiya / Bateen 160-195 200-230 250-300
Al Nahyan Camp / Muroor 160-180 185-200 210-260
Mushrif / Karama / Manaseer 160-180 180-190 190-300
MBZ / Mussafah 100-110 130-140 150-170
Khalifa A & B 100-125 135-150 150-190
Sas Al Nakhl 160-180 180-210 220-280
Al Raha Gardens 150-190 160-240 250-320
Golf Gardens 190-230 240-280 320-350
Al Reef 110-120 140-150 160-170
Saadiyat Beach 275-300 290-330 500-800
Al Raha Beach 265-290 280-300 310-330
Source: Amar Finance Research
According to the CBRE, the high-end sector, which
includes areas such as Al Raha Beach and Al Reem Island,
has recorded significant rent fluctuation over the last year-
and-a-half. Rental rates initially declined, reflecting the
large volume of available stock, but then recovered as
supply was absorbed and availability declined.
Unlike the prime and high-end sectors, the mid-end
sector has seen rental decline in the past year. This trend
is being driven by a various factors, including residents
choosing to relocate to better quality, and optimally priced
new developments. In addition, a large number of these
properties were historically overpriced and have a larger
margin to adjust in order to reach its current market level.
Further, the growth in demand driven by government
spending and regulations has been partially offset by a
continued increase in supply. At the low-end of the
market on the main Abu Dhabi Island, rental rates appear
to have bottomed out in Q4 2012, following a sustained
period of decline. This stabilization has been supported
by robust demand and lack of availability.
206 211 221 240
10 1914
-
50
100
150
200
250
300
2012 2013 E 2014 E 2015 E
Num
ber
of
Un
its
('0
00
s)
Completed Stock Future Supply

Table 09: Average Apartment Rentals in Abu Dhabi in H1 2013
(in AED ‘000 p.a.) 1-BR Apt 2-BR Apt 3-BR Apt
Saadiyat Beach 95-135 125-190 175-245
Al Raha Beach 95-120 140-180 170-275
Khalidiya/Bateen 90-145 75-180 100-320
Marina Square 75-95 95-145 150-225
Corniche 60-130 75-190 100-280
Shams Abu Dhabi 65-115 90-160 140-190
Tourist Club Area 60-75 65-145 80-180
Reef Downtown 60-65 70-75 85-95
Central Abu Dhabi 55-90 75-150 70-190
Al Nahyan Camp 50-90 65-130 90-150
Khalifa A 40-90 50-130 60-160
MBZ/Mussafah 40-65 50-85 60-90
Source: Amar Finance Research
Newly delivered residential units, such as Marasy Abu
Dhabi and Nation Towers, are commanding relatively
high rental rates, due to their superior finish, waterfront
views, and facilities and amenities. This trend reflects a
sustained demand for high-end residential properties that
offer a real point of difference against existing inventory.
The JLL anticipates that the modest rent deflation seen in
secondary and tertiary locations are about to change.
Lease rates across the capital are expected to increase
from the second half of the year.
Dubai residential market buoyant; rents firm up
The housing sector in Dubai is experiencing huge growth,
with few non-prime locations surpassing prime areas in
H1 2013. The city’s residential real estate market currently
comprises 417,900 apartments and 62,000 villas.
Assuming construction schedules are adhered, Asteco
believes that another 19,400 apartments and 3,400 villas
will be delivered to the market by the end of 2013.
Despite expectations of the implementation of the
mortgage cap law, confidence in Dubai’s property market
continues to grow, as huge numbers of large-scale
developments being announced recently.
Figure 30: Residential Stock (H1 2013) and Upcoming Supply
Source: Asteco Dubai H1 2013 Report
Dubai experienced the fourth consecutive yearly increase
in residential rentals and sales prices in Q2. A recent
Asteco report states that apartment sales increased 12% in
Q2 2013 over Q1 2013 (38% on a yearly basis) and villa
sales by 8% q-o-q (growth over the last 12 months stood
at around 24%). Renewed confidence in the economy has
also resulted in a spike in rents − the cost of leasing an
apartment and villa has increased by 7% and 6%
respectively, compared to the last quarter. The year-on-
year asking rent for apartments and villas are up 20% and
17%, respectively.
Table 10: Average Apartment Rentals in Dubai in H1 2013
(in AED ‘000 p.a.) 1-BR Apt 2-BR Apt 3-BR Apt
Discovery Gardens 45-50 70-75 n/a-n/a
Downtown Dubai 85-90 125-130 190-200
Dubai Marina 70-75 100-110 135-150
International City 26-30 40-45 n/a-n/a
Jumeirah Beach Residence 80-85 100-110 140-140
Jumeirah Lakes Towers 55-60 75-80 100-110
Palm Jumeirah 100-105 150-155 190-200
Sheikh Zayed Road 80-85 120-130 140-150
Source: Amar Finance Research
The JLL believes that the residential market is currently
undergoing broad-based recovery. While both property
and rental prices are escalating in the secondary and more
affordable locations, primary areas such as Downtown
Burj, Business Bay. and Dubai Marina, are still enduring a
slower pace of growth. This is due to increased migration
to cheaper locations, which are offering a fresh supply of
villas and apartments. Locations such as International
Media Production Zone (IMPZ), Dubai Sports City, and
Jumeirah Village have all seen very strong rental growth
during the first half of 2013, driven by infrastructure
improvement and the completion of complementary
facilities and retail malls in the area.
Table 11: Average Villa Rentals in Dubai in H1 2013
(in AED ‘000 p.a.) 3-BR Apt 4-BR Apt 5-BR Apt
Arabian Ranches 170-165 230-225 290-290
Green Community 215-200 230-230 265-260
Jumeirah 170-160 210-190 250-230
Jumeirah Islands n/a-n/a 325-300 375-350
Meadows 240-220 265-240 280-265
Mirdif 110-100 130-120 160-150
Palm Jumeirah 330-325 425-400 575-550
Springs 160-145 n/a-n/a n/a-n/a
Source: Amar Finance Research
The residential sector is showing unusual optimism, with
lease and sale rates rising far too quickly to be justified by
the current economic atmosphere, as rental growth
significantly outpaces growth in wage levels. If the current
levels are sustained for a long time, the rising cost of
living could adversely impact Dubai’s competitiveness.
Commercial Sector
Abu Dhabi office space remains oversupplied despite increased demand; rental gap widens
The commercial market in Abu Dhabi showed early signs
of revival, backed by an increase in leasing transactions
and rising interest from occupiers. The supply of office
space within Abu Dhabi has increased over the past six
months, with further developments set to be delivered in
the second half of 2013. The demand for large office
space remains limited to government bodies and affiliates;
480 480
503
23
15
460
470
480
490
500
510
520
Completed 2013 2014
To
tal U
nits
('000s)
Current Upcoming Supply

a majority of such demand is intended for standalone
office buildings intended to be used as the headquarter of
various government departments.
According to the JLL, in H1 2013, the supply of office
stock in Abu Dhabi stood at 2.95 million sqm, with an
average vacancy rate of 38%. A majority of the vacancy is
related to Grade B and Grade C property. The market
expects a total supply of 960,000 sqm of office stock by
2015, increasing the total office stock to 3.9 million sqm.
Figure 31: Abu Dhabi Office GLA (2012 – 2015)
Source: JLL Abu Dhabi Real Estate Market Overview, Q2 2013
The demand for Grade A office space has been relatively
stable over the past six months, with Nation Tower, Aldar
HQ, and Etihad Towers all reporting occupancy levels of
over 70%. This is demonstrated by the fact that Nation
Tower leased space even before the construction began.
Meanwhile, the annual decline in non-prime office rentals
is ~10%, widening the spread between prime and non-
prime properties, and reflecting a sustained trend of flight
to quality. Increased supply in the market is expected to
put more pressure on rents over the next 6−12 months.
Table 12: Average Office Rentals in Abu Dhabi in H1 2013
Area (AED per sq m)
Corniche 1,350-1,550
Tourist Club Area 1,000-1,400
Al Bateen / Khalidiya 1,150-1,300
Muroor / Mushrif 1,100-1,300
Abu Dhabi South / Grand Mosque District 1,350-1,650
Al Reem Island 1,150-1,450
Source: Amar Finance Research
The increasing supply-demand imbalance in Abu Dhabi is
prolonging the market conditions that are favorable for
tenants, encouraging city landlords to be more flexible
with their terms and more generous in the incentives
offered, especially for long-term lease agreements. As a
result, office rental rates are likely to see a further decline,
led by the weak performance of the secondary market.
Dubai office market improves but submarkets continue to struggle
Dubai’s office market is highly fragmented, with several
traditional submarkets still struggling to attract tenants.
However, with improving market confidence, the demand
for office space is picking up. Asteco reported that at the
end of H1 2013, total office space in Dubai stood at 9.6
million sqm; another 600,000 sqm is projected to enter
the market in H2 2013. By the end of 2014, the total
office stock is expected to reach 10.7 million sqm. A
majority of the office space is expected to be delivered in
the Business Bay and Sheikh Zayed Road.
Figure 32: Office Stock (H1 2013) and Upcoming Supply
Source: Asteco Dubai H1 2013 Report
As confidence in the market keeps increasing, office
leasing activity in Dubai has been flourishing, even
though it is more noticeable in the best quality buildings
and prime locations. Increased demand for commercial
space has driven up office rents in prime locations by
10−15% over the past six months, although other
“submarkets” continue to struggle. Business Bay has been
a prime beneficiary of the demand upturn, as has been
Dubai Silicon Oasis. As stated by CBRE, locations in the
Dubai International Financial Centre continue to
command a premium, as Dubai has reasserted its status as
the most expensive office space in the region.
Landlords have become stricter on rental agreements in
most prime locations but are adaptable in other locations,
offering rent-free periods to attract tenants. Prime Grade
A markets is still observing cutthroat pricing of office
space, as landlords now complementing demands of the
market more closely. Landlords are splitting space into
smaller floor-plates and fitting out space in an attempt to
attract potential tenants.
Also, in some cases, an oversupply of office space is
prompting developers to change the use of incomplete
buildings from commercial offices to residential and
hospitality purposes, especially in the Business Bay area,
which has high office vacancy rates because of over-
development of strata buildings (multiple tenants).
Overall, the office market continues to improve, even
though the growth remains limited to top quality
buildings and the prime and newer locations.
Table 13: Average Annual Office Rentals in Dubai in H1 2013
Area (AED per sq m)
Bur Dubai 850-1,050
Business Bay 550-900
DIFC 2,400-2,500
Dubai Internet City 1,400-1,700
Dubai Investment Park 450-650
Jumeirah Lakes Towers 650-1,000
Sheikh Zayed Road 1,300-1,600
Tecom C 550-1,100
Source: Amar Finance Research
2,877 2,952 3,126 3,600
174 474
315
-500
1,000 1,500 2,000 2,500 3,000 3,500 4,000 4,500
2012 2013 E 2014 E 2015 E
GL
A (in
'00
0s)
Completed Stock Future Supply
9.6 9.6
10.2
0.6
0.5
9.0
9.5
10.0
10.5
11.0
Completed 2013 2014
To
tal O
ffic
e Sp
ace
(mill
ion
sqm
)
Current Upcoming Supply
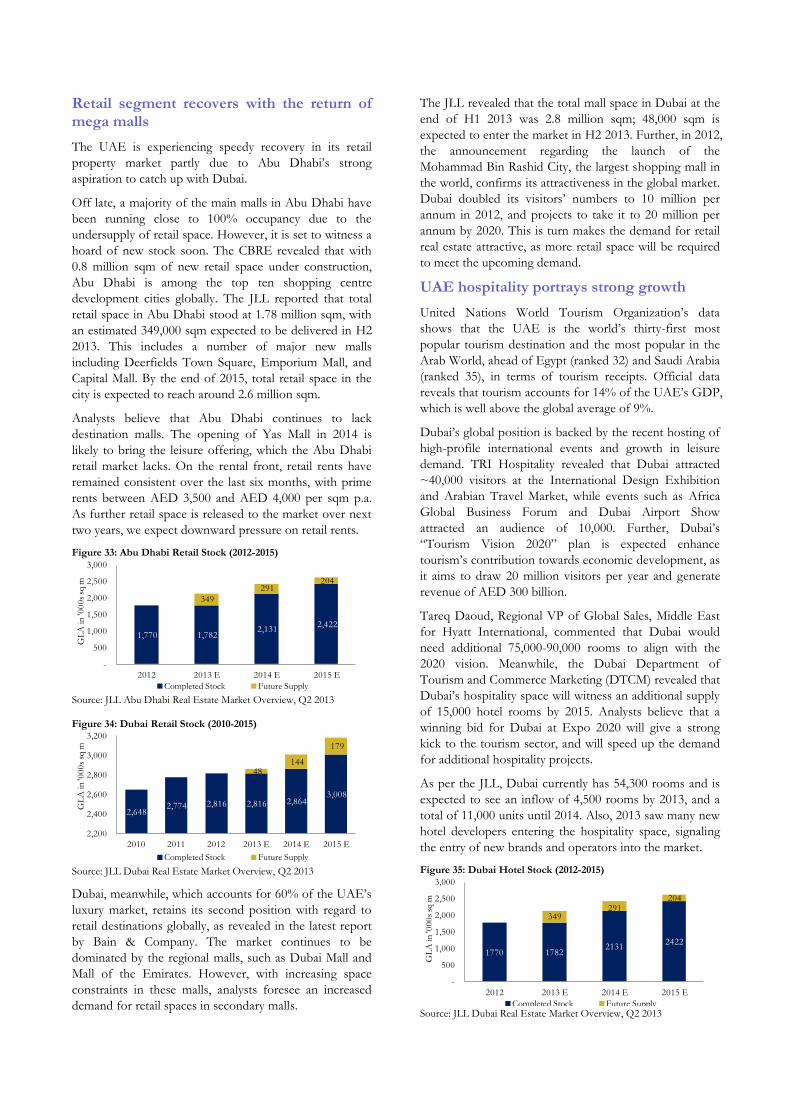
Retail segment recovers with the return of mega malls
The UAE is experiencing speedy recovery in its retail
property market partly due to Abu Dhabi’s strong
aspiration to catch up with Dubai.
Off late, a majority of the main malls in Abu Dhabi have
been running close to 100% occupancy due to the
undersupply of retail space. However, it is set to witness a
hoard of new stock soon. The CBRE revealed that with
0.8 million sqm of new retail space under construction,
Abu Dhabi is among the top ten shopping centre
development cities globally. The JLL reported that total
retail space in Abu Dhabi stood at 1.78 million sqm, with
an estimated 349,000 sqm expected to be delivered in H2
2013. This includes a number of major new malls
including Deerfields Town Square, Emporium Mall, and
Capital Mall. By the end of 2015, total retail space in the
city is expected to reach around 2.6 million sqm.
Analysts believe that Abu Dhabi continues to lack
destination malls. The opening of Yas Mall in 2014 is
likely to bring the leisure offering, which the Abu Dhabi
retail market lacks. On the rental front, retail rents have
remained consistent over the last six months, with prime
rents between AED 3,500 and AED 4,000 per sqm p.a.
As further retail space is released to the market over next
two years, we expect downward pressure on retail rents.
Figure 33: Abu Dhabi Retail Stock (2012-2015)
Source: JLL Abu Dhabi Real Estate Market Overview, Q2 2013
Figure 34: Dubai Retail Stock (2010-2015)
Source: JLL Dubai Real Estate Market Overview, Q2 2013
Dubai, meanwhile, which accounts for 60% of the UAE’s
luxury market, retains its second position with regard to
retail destinations globally, as revealed in the latest report
by Bain & Company. The market continues to be
dominated by the regional malls, such as Dubai Mall and
Mall of the Emirates. However, with increasing space
constraints in these malls, analysts foresee an increased
demand for retail spaces in secondary malls.
The JLL revealed that the total mall space in Dubai at the
end of H1 2013 was 2.8 million sqm; 48,000 sqm is
expected to enter the market in H2 2013. Further, in 2012,
the announcement regarding the launch of the
Mohammad Bin Rashid City, the largest shopping mall in
the world, confirms its attractiveness in the global market.
Dubai doubled its visitors’ numbers to 10 million per
annum in 2012, and projects to take it to 20 million per
annum by 2020. This is turn makes the demand for retail
real estate attractive, as more retail space will be required
to meet the upcoming demand.
UAE hospitality portrays strong growth
United Nations World Tourism Organization’s data
shows that the UAE is the world’s thirty-first most
popular tourism destination and the most popular in the
Arab World, ahead of Egypt (ranked 32) and Saudi Arabia
(ranked 35), in terms of tourism receipts. Official data
reveals that tourism accounts for 14% of the UAE’s GDP,
which is well above the global average of 9%.
Dubai’s global position is backed by the recent hosting of
high-profile international events and growth in leisure
demand. TRI Hospitality revealed that Dubai attracted
~40,000 visitors at the International Design Exhibition
and Arabian Travel Market, while events such as Africa
Global Business Forum and Dubai Airport Show
attracted an audience of 10,000. Further, Dubai’s
“Tourism Vision 2020” plan is expected enhance
tourism’s contribution towards economic development, as
it aims to draw 20 million visitors per year and generate
revenue of AED 300 billion.
Tareq Daoud, Regional VP of Global Sales, Middle East
for Hyatt International, commented that Dubai would
need additional 75,000-90,000 rooms to align with the
2020 vision. Meanwhile, the Dubai Department of
Tourism and Commerce Marketing (DTCM) revealed that
Dubai’s hospitality space will witness an additional supply
of 15,000 hotel rooms by 2015. Analysts believe that a
winning bid for Dubai at Expo 2020 will give a strong
kick to the tourism sector, and will speed up the demand
for additional hospitality projects.
As per the JLL, Dubai currently has 54,300 rooms and is
expected to see an inflow of 4,500 rooms by 2013, and a
total of 11,000 units until 2014. Also, 2013 saw many new
hotel developers entering the hospitality space, signaling
the entry of new brands and operators into the market.
Figure 35: Dubai Hotel Stock (2012-2015)
Source: JLL Dubai Real Estate Market Overview, Q2 2013
1,770 1,782 2,131
2,422
349
291 204
-
500
1,000
1,500
2,000
2,500
3,000
2012 2013 E 2014 E 2015 E
GL
A in
'00
0s
sq m
Completed Stock Future Supply
2,648 2,774 2,816 2,816 2,864
3,008
48 144
179
2,200
2,400
2,600
2,800
3,000
3,200
2010 2011 2012 2013 E 2014 E 2015 E
GL
A in
'00
0s
sq m
Completed Stock Future Supply
1770 17822131
2422
349291
204
-
500
1,000
1,500
2,000
2,500
3,000
2012 2013 E 2014 E 2015 E
GL
A in
'00
0s
sq m
Completed Stock Future Supply

Meanwhile, Abu Dhabi’s hospitality market noted a
13.4% rise in demand in the first half of 2013. HotStats
attributed this growth to an increase in visitors to the
capital by 25% and a 12.6% rise in transit passengers at
the Abu Dhabi International Airport. However, the
impact of the increase in visitor arrivals has been offset by
a significant increase in supply. The JLL revealed that
~1,400 hotel rooms were added during H1 2013, and
about 4,500 additional rooms are expected to enter the
market by the end of 2015. Overall supply is expected to
reach 21,500 rooms by the end of 2015 representing a
CAGR of 8%.
While the hospitality space in Abu Dhabi continues to be
driven by the corporate and MICE (Meetings, Incentives,
Conferencing, Exhibitions) segments, efforts are being
made to diversify the demand base by focusing on the
leisure segment.
Figure 36: Abu Dhabi Hotel Stock (2012-2015)
Source: JLL Abu Dhabi Real Estate Market Overview, Q2 2013
Another upcoming emirate in the hospitality space is Ras
Al Khaima, which is among the oldest of the seven
emirates that comprise the UAE. It aims to increase its
tourism contribution to the UAE from 2% to 9% this
year. As tourist arrivals are expected to increase
significantly during the year, the demand for hospitality
space is set to rise. According to Ras Al Khaima's
Tourism Development Authority, Ras Al Khaima had
2,934 rooms in 2012, and aims to add another 1000
rooms by 2013-end. By the end of 2016, the projected
hotel room supply will be close to 10,000.
Major Projects
Table 14 lists several major ongoing construction projects
in the UAE.
Table 14: Major Real Estate Projects in UAE
Project Name Type Value (USD billion)
Status
ALDAR - Yas Island Development
Community Development
40.0 Ongoing
DWC - Dubai World Central
Free Zones/Economic
Zones 37.3
Ongoing
ADFEC - Masdar Carbon Free City
Community Development
22.0 Ongoing
Chemaweyaat - Chemicals Industrial City
Industrial 20.0 Ongoing
ALDAR - Yas Island Development - Yas Mall
Retail 12.8 Ongoing
ADFEC - Masdar Carbon Free City - Phase 1
Mixed Development
10.0 Ongoing
SEHA - Sheikh Khalifa Medical City
Healthcare 4.0 Ongoing
Waha Land - Almarkaz Mixed
Development 3.3 Ongoing
Al Barari - Al Barari - Phase 2
Mixed Development
3.2 Ongoing
ALDAR Properties - Motor World
Mixed Development
3.0 Ongoing
ALDAR Properties - Al Falah
Residential 2.6 Ongoing
Damac Properties - Akoya Hotels 2.5 Ongoing
ADNEC - Capital Centre Community
Development 2.2 Ongoing
Musanada - North Wathba Development
Residential 2.1 Ongoing
Meraas - Bluewaters Island Development
Mixed Development
1.6 Ongoing
Tamouh - Jebel Hafeet Glacier
Leisure & Entertainment
1.4 Ongoing
DWC - Dubai World Central - Aviation City
Free Zones/Economic
Zones 1.4 Ongoing
Al Qudra Holding - Ain Al Fayda - Phase 1
Residential 1.4
Ongoing
Mubadala - Sowwah Island - Phase 1 - Cleveland Clinic Abu Dhabi (CCAD)
Healthcare 1.3 Ongoing
ALDAR - Central Market Mixed
Development 1.1 Ongoing
Source: Zawya
15,700 17,069 18,119 19,919
1,050 1,800
1,650
-
5,000
10,000
15,000
20,000
25,000
2012 2013 E 2014 E 2015 E
No
. of
Ro
om
s
Completed Stock Future Supply
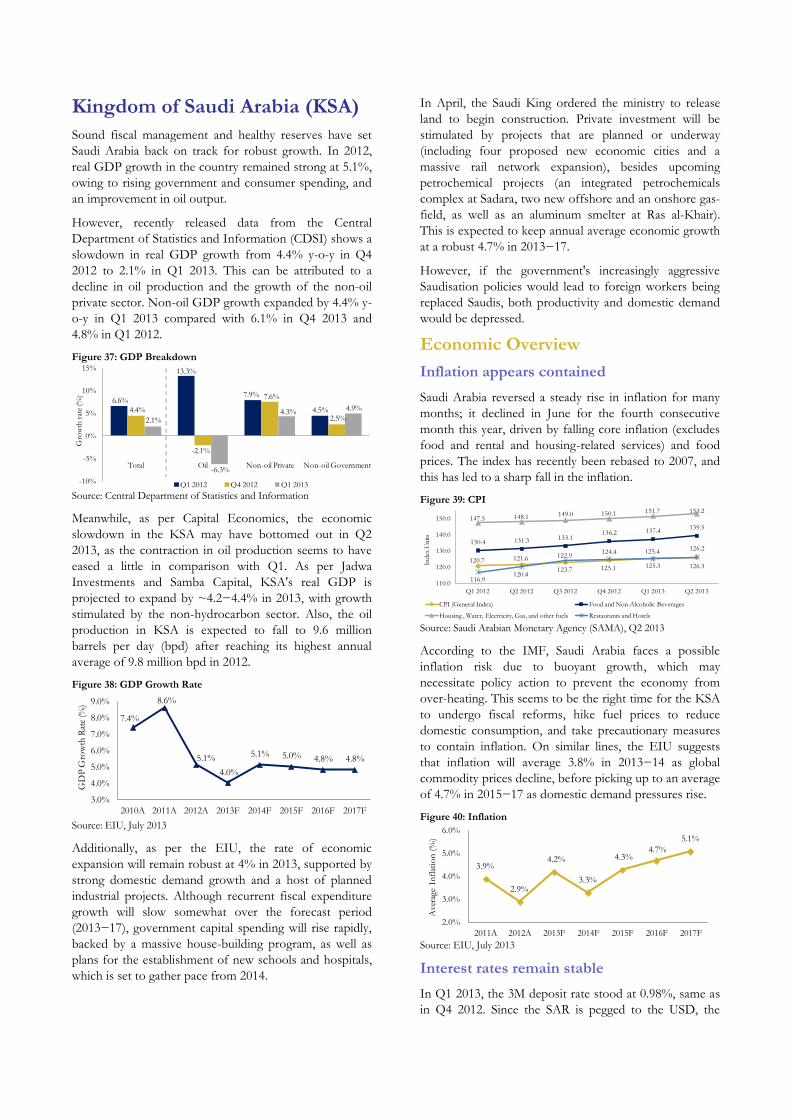
Kingdom of Saudi Arabia (KSA)
Sound fiscal management and healthy reserves have set
Saudi Arabia back on track for robust growth. In 2012,
real GDP growth in the country remained strong at 5.1%,
owing to rising government and consumer spending, and
an improvement in oil output.
However, recently released data from the Central
Department of Statistics and Information (CDSI) shows a
slowdown in real GDP growth from 4.4% y-o-y in Q4
2012 to 2.1% in Q1 2013. This can be attributed to a
decline in oil production and the growth of the non-oil
private sector. Non-oil GDP growth expanded by 4.4% y-
o-y in Q1 2013 compared with 6.1% in Q4 2013 and
4.8% in Q1 2012.
Figure 37: GDP Breakdown
Source: Central Department of Statistics and Information
Meanwhile, as per Capital Economics, the economic
slowdown in the KSA may have bottomed out in Q2
2013, as the contraction in oil production seems to have
eased a little in comparison with Q1. As per Jadwa
Investments and Samba Capital, KSA's real GDP is
projected to expand by ~4.2−4.4% in 2013, with growth
stimulated by the non-hydrocarbon sector. Also, the oil
production in KSA is expected to fall to 9.6 million
barrels per day (bpd) after reaching its highest annual
average of 9.8 million bpd in 2012.
Figure 38: GDP Growth Rate
Source: EIU, July 2013
Additionally, as per the EIU, the rate of economic
expansion will remain robust at 4% in 2013, supported by
strong domestic demand growth and a host of planned
industrial projects. Although recurrent fiscal expenditure
growth will slow somewhat over the forecast period
(2013−17), government capital spending will rise rapidly,
backed by a massive house-building program, as well as
plans for the establishment of new schools and hospitals,
which is set to gather pace from 2014.
In April, the Saudi King ordered the ministry to release
land to begin construction. Private investment will be
stimulated by projects that are planned or underway
(including four proposed new economic cities and a
massive rail network expansion), besides upcoming
petrochemical projects (an integrated petrochemicals
complex at Sadara, two new offshore and an onshore gas-
field, as well as an aluminum smelter at Ras al-Khair).
This is expected to keep annual average economic growth
at a robust 4.7% in 2013−17.
However, if the government's increasingly aggressive
Saudisation policies would lead to foreign workers being
replaced Saudis, both productivity and domestic demand
would be depressed.
Economic Overview
Inflation appears contained
Saudi Arabia reversed a steady rise in inflation for many
months; it declined in June for the fourth consecutive
month this year, driven by falling core inflation (excludes
food and rental and housing-related services) and food
prices. The index has recently been rebased to 2007, and
this has led to a sharp fall in the inflation.
Figure 39: CPI
Source: Saudi Arabian Monetary Agency (SAMA), Q2 2013
According to the IMF, Saudi Arabia faces a possible
inflation risk due to buoyant growth, which may
necessitate policy action to prevent the economy from
over-heating. This seems to be the right time for the KSA
to undergo fiscal reforms, hike fuel prices to reduce
domestic consumption, and take precautionary measures
to contain inflation. On similar lines, the EIU suggests
that inflation will average 3.8% in 2013−14 as global
commodity prices decline, before picking up to an average
of 4.7% in 2015−17 as domestic demand pressures rise.
Figure 40: Inflation
Source: EIU, July 2013
Interest rates remain stable
In Q1 2013, the 3M deposit rate stood at 0.98%, same as
in Q4 2012. Since the SAR is pegged to the USD, the
6.6%
13.3%
7.9%
4.5%4.4%
-2.1%
7.6%
2.5%2.1%
-6.3%
4.3% 4.9%
-10%
-5%
0%
5%
10%
15%
Total Oil Non-oil Private Non-oil Government
Gro
wth
rat
e (%
)
Q1 2012 Q4 2012 Q1 2013
7.4%
8.6%
5.1%
4.0%
5.1% 5.0% 4.8% 4.8%
3.0%
4.0%
5.0%
6.0%
7.0%
8.0%
9.0%
2010A 2011A 2012A 2013F 2014F 2015F 2016F 2017F
GD
P G
row
th R
ate
(%)
120.7 121.6 122.9124.4 125.4
126.2130.4 131.3 133.1
136.2 137.4139.5
147.5 148.1 149.0 150.1 151.7 153.2
116.9120.4
123.7 125.1 125.3 126.3
110.0
120.0
130.0
140.0
150.0
Q1 2012 Q2 2012 Q3 2012 Q4 2012 Q1 2013 Q2 2013
Index
Un
its
CPI (General Index) Food and Non-Alcoholic Beverages
Housing , Water, Electricity, Gas, and other fuels Restaurants and Hotels
3.9%
2.9%
4.2%
3.3%
4.3%4.7%
5.1%
2.0%
3.0%
4.0%
5.0%
6.0%
2011A 2012A 2013F 2014F 2015F 2016F 2017F
Aver
age
Infl
atio
n (
%)

main policy rate must roughly track movements in US
interest rates, although this can lead to economic
distortion. The current combination of low interest rate
and persistent fiscal stimulus has increased concerns of
potential asset bubbles, especially in view of the ongoing
boom in the commercial property segment.
Nevertheless, Saudi rates are unlikely to rise until 2015
(when the Federal Reserve is expected to begin
tightening). Despite this, to promote entrepreneurship,
the government seeks to target more lending towards
small and medium-sized enterprises. Also, the five-state
backed specialized credit institutions, to be introduced in
the later part of 2013, will aim at increasing lending to the
private sector.
Figure 41: Interest Rates
Source: Saudi Arabian Monetary Agency (SAMA), Q2 2013
Bank lending to construction sector slows but mortgage lending picks up
Quarterly data from SAMA shows a gradual increase in
loan disbursement by banks over the last two years, at a
CAGR of 3.5%, in the Kingdom. Total bank credit stood
at SAR 1,083 billion in Q2 2013. The striking feature is
the 5% q-o-q contraction in lending to the construction
sector in Q1 2013, which suggests that non-oil investment
has slowed significantly in 2013, supported by a fairly
stagnant projects market. This slowdown is evident from
the fact that banks are refocusing on retail lending, where
margins are much more lucrative, and the deceleration in
project flow. The projects delayed in 2012 were expected
to be released in H1 2013, but that has not happened.
According to Samba, the lower oil price environment
might have begun to crimp investment activity.
Figure 42: Total Bank Credit
Source: Saudi Arabia Monetary Agency, Q2 2013
Subtle bank lending to the construction sector is in sharp
contrast to the strong pace of consumer lending. Though
mortgage is a vital aspect of consumer lending, the
passage of the mortgage law in July last year has not
sparked a surge in lending as final the elements of the
accompanying legislation are still awaited. Nevertheless,
there has still been a notable uptick in consumer loans for
real estate, with a q-o-q gain of nearly 9% in Q4 2012.
However, real estate lending remained almost flat in Q1
2013 q-o-q. For the moment, banks are continuing to
focus on lending to upper- and upper-middle income
Saudis. Affordability remains an issue for the middle- and
lower-income segments, particularly as the new mortgage
legislation is understood to cap bank lending to
individuals at 70% loan-to-value.
Figure 43: Bank Credit Classified by Economic Activity
Source: Saudi Arabia Monetary Agency, Q2 2013
Kingdom changes its weekend
Saudi Arabia changed its weekend, starting June 28, 2013,
to Friday and Saturday from Thursday and Friday. This
change had been under discussion since 2007, but had
faced hostile responses from the religious conservatives,
who felt that sharing a weekend with Western countries
would result in a dilution of the Kingdom's religious
character. However, in the end, it appears that business
pressure and momentum worked against religious
objections. KSA is now at par with other GCC countries
and Saudi businesses share four working days with the
Western world. The shift in the weekend reinforces the
belief that the government will continue strengthening the
business environment.
Real Estate Sector
KSA may face the next property bubble
The modest growth in the Saudi economy is backed by an
expansionary fiscal position and a continued loose
monetary policy. Despite fast-rising retail sales, and
surging wages, inflation in the country has remained
subdued, averaging just 4% in 2012.
There is increasing fear that a combination of rapid
liquidity growth and scarcity of investment opportunities
could result in the creation of asset bubbles, with the
ongoing boom in office construction becoming one of
the most likely cause. The sudden increase in construction
in the capital, Riyadh, and elsewhere is changing the face
of the realty sector of the Kingdom. The most striking
example is the 1km high, mixed-use Kingdom Tower in
Jeddah, the construction of which began early this year.
Meanwhile, in Riyadh, building sites, ranging from offices,
residential blocks, hospitals, and universities, have been
0.83%0.91% 0.95% 0.98% 0.98% 0.96%
0.46%0.39%
0.33% 0.28% 0.29% 0.27%
0.0%
0.3%
0.5%
0.8%
1.0%
1.3%
Q1 2012 Q2 2012 Q3 2012 Q4 2012 Q1 2013 Q2 2013
Inte
rest
Rat
e
3M deposit rate in SAR 3M deposit rate in USD
793814
838857
898
937973
1,000
1,040
1,083
700
800
900
1,000
1,100
Q1 11 Q2 11 Q3 11 Q4 11 Q1 12 Q2 12 Q3 12 Q4 12 Q1 13 Q2 13
To
tal B
ank C
red
it (
SA
R b
n)
20
24
28
32
36
40
40
45
50
55
60
65
70
75
80
Q1 11 Q2 11 Q3 11 Q4 11 Q1 12 Q2 12 Q3 12 Q4 12 Q1 13
(in
SA
R b
n)
(in
SA
R b
n)
Bank credit to building & construction (LHS) Consumer loans for real estate (RHS)

rapidly springing up on the King Fahd and Makkah roads.
The National Commercial Bank (NCB) has stated that
construction projects worth USD 71.6 billion are
currently ongoing. This is set to accelerate, as MEED
estimates that construction projects worth USD 600
billion will be signed in the KSA this year. In addition, the
SAR 250 billion program to build 500,000 affordable
homes, announced in March 2011, is yet to begin.
Figure 44: Credit to Real Estate & Construction – 2007−2012
Source: Saudi Arabian Monetary Agency (SAMA), Q2 2013
Regardless of the huge infrastructure outlay, the existing
infrastructure opportunities are insufficient to absorb the
excess liquidity arising from high oil earnings and a
relaxed fiscal and monetary policy. This has led to the free
funds being channelized into construction leading to a
property bubble. Simultaneously, lending from state credit
institutions, including the Real Estate Development Fund
(REDF), has also increased.
Figure 45: REDF Loans and Loan Growth – 2007 – Q3 2012
Source: Saudi Arabian Monetary Agency (SAMA), Q2 2013
While the strong economic atmosphere supports some of
the growth in the realty segment, the King Abdullah
Financial District (KAFD), which comprises 42 buildings
and 900,000 sqm of office space, provides cause for
concern. According to The Economist, only 10% of the
office space in the KAFD had been leased in May, despite
the fact that its first phase is set for completion in 2013.
There are rumors that a number of government
departments are now being earmarked to move to the site,
in order to fill some of the space.
The oversupply of office space is not limited to the
KAFD. Adding to the scenario is the 3.8-sq km business
district, King Abdullah Economic City, which includes
another financial services hub. The increasing surplus
makes it extremely important that tackle the growth of
office space. As the government continues with its
expansionary fiscal policies, SAMA is expected to take
preventive action against any possible bubbles. However,
as SAR is pegged to the USD, the central bank cannot
increase the interest rates, the most obvious step in the
current low–inflation environment.
Sector growth supported by improved policy framework and robust government budget
In line with the upturn in the Saudi economy in the first
half of 2013, the Kingdom’s real estate market is set to
witness a sustained increase in demand and strong growth.
This will be in line with the boom in other key sectors
such as retail, manufacturing, and construction.
According to Business Monitor International, the Saudi
construction sector grew by 9.3% in 2012, and will
continue boosting confidence in the real estate sector,
even as the annual growth rate remains stable at 5.9%
until 2017. Injaz Development Co. has estimated that the
Saudi construction and building sector will grow by 7.5%
in 2013.
The government of Saudi Arabia realizes the importance
of favorable policies, not only in attracting new
investment but also meeting local demand. The
government has allocated a budget spending of USD 219
billion for 2013, up 18.8% y-o-y. About USD 76 billion
has been allocated for capital expenditures.
Real estate demand is primarily driven by the housing
market. Given the current housing shortage, the Saudi
government has released a SAR 250 billon construction
program, under which 500,000 new housing units will be
built across the KSA. It has also come up with measures,
such as the new mortgage law and the “Additional Loan
Program”, and continues to address the housing shortage
problem through public-private partnerships. The new
mortgage law is expected to boost residential lending to
the tune of USD 30−32 billion in the coming 4−5 years.
Furthermore, as per the recently set up Additional Loan
Program, all nationals who get an approved loan from
REDF will be eligible for additional loans from other
partnering financial institutions and banks.
All these discussed initiatives and laws above will go a
long way in strengthening the reputation of KSA as a
leading investment destination.
Mortgage law to usher a new era of realty market
The KSA is currently plagued by the unavailability of
affordable housing. As per Al Rajhi’s analysis, a majority
of the low- and middle-income population can manage to
buy only apartments, the least preferred housing unit.
People earning above SAR 25,000 are the only ones who
can afford a villa or high-end housing. Further, lending is
limited, as banks prefer to offer housing finance to people
in the 30−45 age group, having stable and high-paying
jobs, as salary is taken as collateral instead of property.
Moreover, the introduction of the mortgage law ushers in
a new era for the real estate market in the Kingdom. As
levying interest is prohibited under the Shariah principles,
7.3% 6.1% 7.2% 8.1% 7.5%
25.2%
(17.7%)
24.4% 25.4%
8.0%
-20%
-10%
0%
10%
20%
30%
2008 2009 2010 2011 2012
% of Total Credit Growth rate (%)
0%
5%
10%
15%
20%
25%
50.0
60.0
70.0
80.0
90.0
100.0
2007 2008 2009 2010 2011 Q3 2012
Gro
wth
(%
)
RE
DF
Lo
ans
(SA
R b
n)
REDF Loans Growth
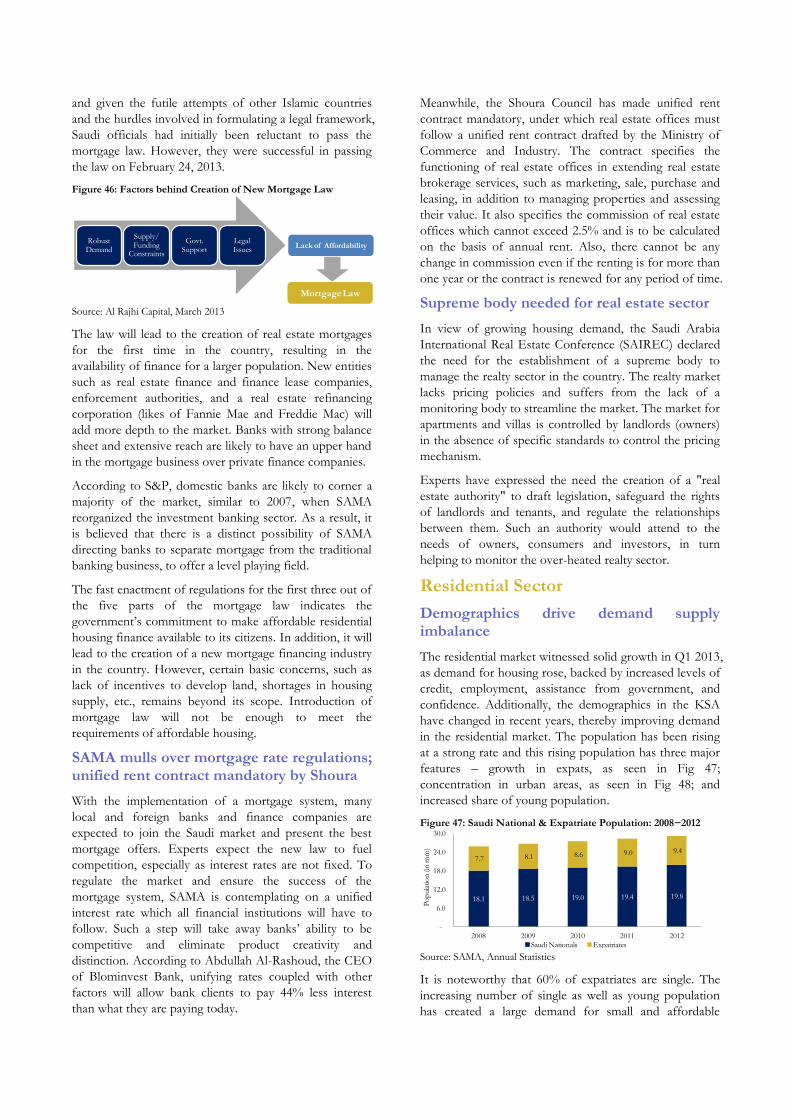
and given the futile attempts of other Islamic countries
and the hurdles involved in formulating a legal framework,
Saudi officials had initially been reluctant to pass the
mortgage law. However, they were successful in passing
the law on February 24, 2013.
Figure 46: Factors behind Creation of New Mortgage Law
Source: Al Rajhi Capital, March 2013
The law will lead to the creation of real estate mortgages
for the first time in the country, resulting in the
availability of finance for a larger population. New entities
such as real estate finance and finance lease companies,
enforcement authorities, and a real estate refinancing
corporation (likes of Fannie Mae and Freddie Mac) will
add more depth to the market. Banks with strong balance
sheet and extensive reach are likely to have an upper hand
in the mortgage business over private finance companies.
According to S&P, domestic banks are likely to corner a
majority of the market, similar to 2007, when SAMA
reorganized the investment banking sector. As a result, it
is believed that there is a distinct possibility of SAMA
directing banks to separate mortgage from the traditional
banking business, to offer a level playing field.
The fast enactment of regulations for the first three out of
the five parts of the mortgage law indicates the
government’s commitment to make affordable residential
housing finance available to its citizens. In addition, it will
lead to the creation of a new mortgage financing industry
in the country. However, certain basic concerns, such as
lack of incentives to develop land, shortages in housing
supply, etc., remains beyond its scope. Introduction of
mortgage law will not be enough to meet the
requirements of affordable housing.
SAMA mulls over mortgage rate regulations; unified rent contract mandatory by Shoura
With the implementation of a mortgage system, many
local and foreign banks and finance companies are
expected to join the Saudi market and present the best
mortgage offers. Experts expect the new law to fuel
competition, especially as interest rates are not fixed. To
regulate the market and ensure the success of the
mortgage system, SAMA is contemplating on a unified
interest rate which all financial institutions will have to
follow. Such a step will take away banks’ ability to be
competitive and eliminate product creativity and
distinction. According to Abdullah Al-Rashoud, the CEO
of Blominvest Bank, unifying rates coupled with other
factors will allow bank clients to pay 44% less interest
than what they are paying today.
Meanwhile, the Shoura Council has made unified rent
contract mandatory, under which real estate offices must
follow a unified rent contract drafted by the Ministry of
Commerce and Industry. The contract specifies the
functioning of real estate offices in extending real estate
brokerage services, such as marketing, sale, purchase and
leasing, in addition to managing properties and assessing
their value. It also specifies the commission of real estate
offices which cannot exceed 2.5% and is to be calculated
on the basis of annual rent. Also, there cannot be any
change in commission even if the renting is for more than
one year or the contract is renewed for any period of time.
Supreme body needed for real estate sector
In view of growing housing demand, the Saudi Arabia
International Real Estate Conference (SAIREC) declared
the need for the establishment of a supreme body to
manage the realty sector in the country. The realty market
lacks pricing policies and suffers from the lack of a
monitoring body to streamline the market. The market for
apartments and villas is controlled by landlords (owners)
in the absence of specific standards to control the pricing
mechanism.
Experts have expressed the need the creation of a "real
estate authority" to draft legislation, safeguard the rights
of landlords and tenants, and regulate the relationships
between them. Such an authority would attend to the
needs of owners, consumers and investors, in turn
helping to monitor the over-heated realty sector.
Residential Sector
Demographics drive demand supply imbalance
The residential market witnessed solid growth in Q1 2013,
as demand for housing rose, backed by increased levels of
credit, employment, assistance from government, and
confidence. Additionally, the demographics in the KSA
have changed in recent years, thereby improving demand
in the residential market. The population has been rising
at a strong rate and this rising population has three major
features – growth in expats, as seen in Fig 47;
concentration in urban areas, as seen in Fig 48; and
increased share of young population.
Figure 47: Saudi National & Expatriate Population: 2008−2012
Source: SAMA, Annual Statistics
It is noteworthy that 60% of expatriates are single. The
increasing number of single as well as young population
has created a large demand for small and affordable
Robust Demand
Supply/ Funding
Constraints
Govt. Support
Legal Issues
Lack of Affordability
MortgageLaw
18.1 18.5 19.0 19.4 19.8
7.7 8.1 8.6 9.0 9.4
-
6.0
12.0
18.0
24.0
30.0
2008 2009 2010 2011 2012
Po
pula
tio
n (in
mm
)
Saudi Nationals Expatriates
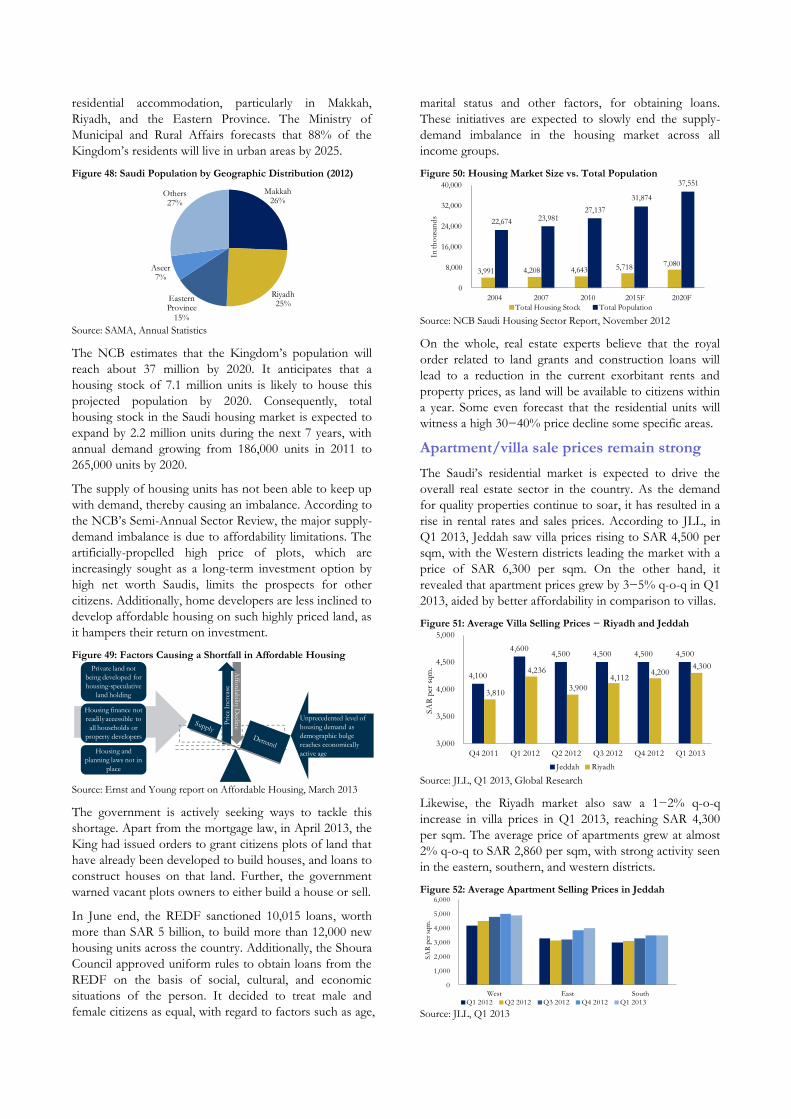
residential accommodation, particularly in Makkah,
Riyadh, and the Eastern Province. The Ministry of
Municipal and Rural Affairs forecasts that 88% of the
Kingdom’s residents will live in urban areas by 2025.
Figure 48: Saudi Population by Geographic Distribution (2012)
Source: SAMA, Annual Statistics
The NCB estimates that the Kingdom’s population will
reach about 37 million by 2020. It anticipates that a
housing stock of 7.1 million units is likely to house this
projected population by 2020. Consequently, total
housing stock in the Saudi housing market is expected to
expand by 2.2 million units during the next 7 years, with
annual demand growing from 186,000 units in 2011 to
265,000 units by 2020.
The supply of housing units has not been able to keep up
with demand, thereby causing an imbalance. According to
the NCB’s Semi-Annual Sector Review, the major supply-
demand imbalance is due to affordability limitations. The
artificially-propelled high price of plots, which are
increasingly sought as a long-term investment option by
high net worth Saudis, limits the prospects for other
citizens. Additionally, home developers are less inclined to
develop affordable housing on such highly priced land, as
it hampers their return on investment.
Figure 49: Factors Causing a Shortfall in Affordable Housing
Source: Ernst and Young report on Affordable Housing, March 2013
The government is actively seeking ways to tackle this
shortage. Apart from the mortgage law, in April 2013, the
King had issued orders to grant citizens plots of land that
have already been developed to build houses, and loans to
construct houses on that land. Further, the government
warned vacant plots owners to either build a house or sell.
In June end, the REDF sanctioned 10,015 loans, worth
more than SAR 5 billion, to build more than 12,000 new
housing units across the country. Additionally, the Shoura
Council approved uniform rules to obtain loans from the
REDF on the basis of social, cultural, and economic
situations of the person. It decided to treat male and
female citizens as equal, with regard to factors such as age,
marital status and other factors, for obtaining loans.
These initiatives are expected to slowly end the supply-
demand imbalance in the housing market across all
income groups.
Figure 50: Housing Market Size vs. Total Population
Source: NCB Saudi Housing Sector Report, November 2012
On the whole, real estate experts believe that the royal
order related to land grants and construction loans will
lead to a reduction in the current exorbitant rents and
property prices, as land will be available to citizens within
a year. Some even forecast that the residential units will
witness a high 30−40% price decline some specific areas.
Apartment/villa sale prices remain strong
The Saudi’s residential market is expected to drive the
overall real estate sector in the country. As the demand
for quality properties continue to soar, it has resulted in a
rise in rental rates and sales prices. According to JLL, in
Q1 2013, Jeddah saw villa prices rising to SAR 4,500 per
sqm, with the Western districts leading the market with a
price of SAR 6,300 per sqm. On the other hand, it
revealed that apartment prices grew by 3−5% q-o-q in Q1
2013, aided by better affordability in comparison to villas.
Figure 51: Average Villa Selling Prices − Riyadh and Jeddah
Source: JLL, Q1 2013, Global Research
Likewise, the Riyadh market also saw a 1−2% q-o-q
increase in villa prices in Q1 2013, reaching SAR 4,300
per sqm. The average price of apartments grew at almost
2% q-o-q to SAR 2,860 per sqm, with strong activity seen
in the eastern, southern, and western districts.
Figure 52: Average Apartment Selling Prices in Jeddah
Source: JLL, Q1 2013
Makkah26%
Riyadh25%
Eastern Province
15%
Aseer7%
Others27%
Private land not
being developed for
housing-speculative
land holding
Housing finance not
readily accessible to
all households or
property developers
Housing and
planning laws not in
place
Affo
rdab
ility Declin
ePri
ce I
ncr
ease
Unprecedented level of
housing demand as
demographic bulge
reaches economically
active age
3,991 4,208 4,643 5,718 7,080
22,674 23,981 27,137
31,874
37,551
0
8,000
16,000
24,000
32,000
40,000
2004 2007 2010 2015F 2020F
In th
ousa
nd
s
Total Housing Stock Total Population
4,100
4,600 4,500 4,500 4,500 4,500
3,810
4,236
3,900
4,112 4,200
4,300
3,000
3,500
4,000
4,500
5,000
Q4 2011 Q1 2012 Q2 2012 Q3 2012 Q4 2012 Q1 2013
SA
R p
er s
qm
.
Jeddah Riyadh
0
1,000
2,000
3,000
4,000
5,000
6,000
West East South
SA
R p
er s
qm
.
Q1 2012 Q2 2012 Q3 2012 Q4 2012 Q1 2013
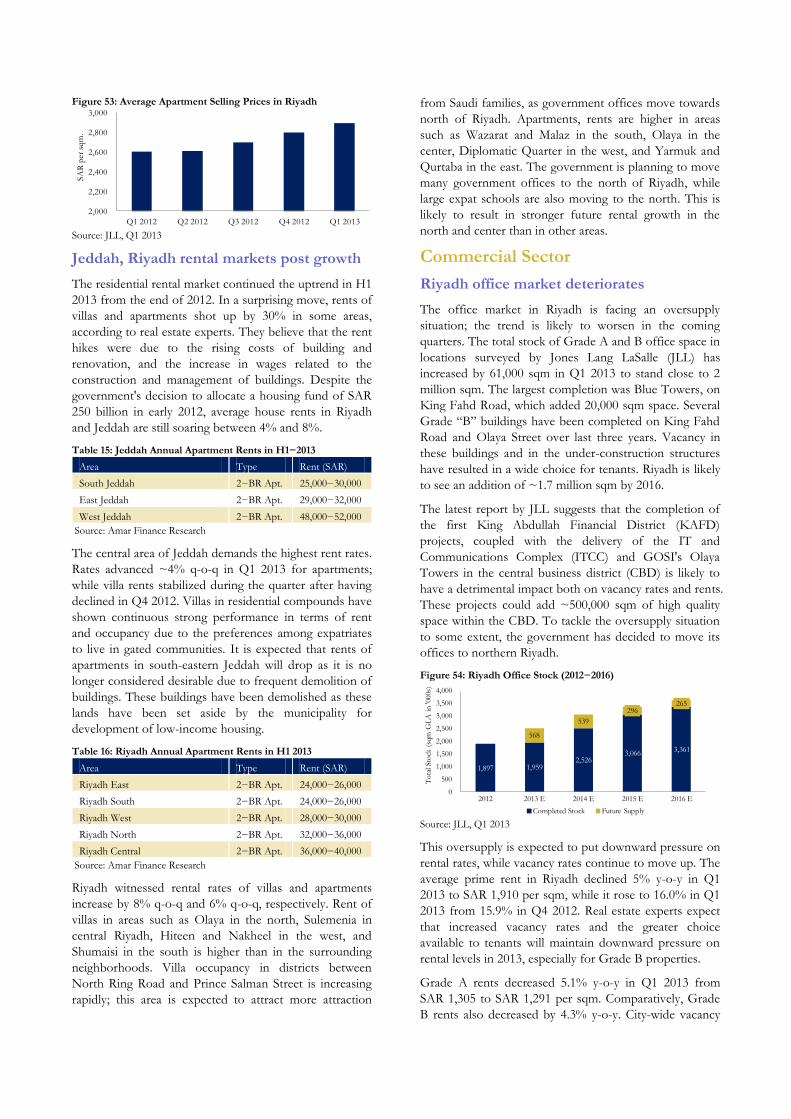
Figure 53: Average Apartment Selling Prices in Riyadh
Source: JLL, Q1 2013
Jeddah, Riyadh rental markets post growth
The residential rental market continued the uptrend in H1
2013 from the end of 2012. In a surprising move, rents of
villas and apartments shot up by 30% in some areas,
according to real estate experts. They believe that the rent
hikes were due to the rising costs of building and
renovation, and the increase in wages related to the
construction and management of buildings. Despite the
government's decision to allocate a housing fund of SAR
250 billion in early 2012, average house rents in Riyadh
and Jeddah are still soaring between 4% and 8%.
Table 15: Jeddah Annual Apartment Rents in H1−2013
Area Type Rent (SAR)
South Jeddah 2−BR Apt. 25,000−30,000
East Jeddah 2−BR Apt. 29,000−32,000
West Jeddah 2−BR Apt. 48,000−52,000
Source: Amar Finance Research
The central area of Jeddah demands the highest rent rates.
Rates advanced ~4% q-o-q in Q1 2013 for apartments;
while villa rents stabilized during the quarter after having
declined in Q4 2012. Villas in residential compounds have
shown continuous strong performance in terms of rent
and occupancy due to the preferences among expatriates
to live in gated communities. It is expected that rents of
apartments in south-eastern Jeddah will drop as it is no
longer considered desirable due to frequent demolition of
buildings. These buildings have been demolished as these
lands have been set aside by the municipality for
development of low-income housing.
Table 16: Riyadh Annual Apartment Rents in H1 2013
Area Type Rent (SAR)
Riyadh East 2−BR Apt. 24,000−26,000
Riyadh South 2−BR Apt. 24,000−26,000
Riyadh West 2−BR Apt. 28,000−30,000
Riyadh North 2−BR Apt. 32,000−36,000
Riyadh Central 2−BR Apt. 36,000−40,000
Source: Amar Finance Research
Riyadh witnessed rental rates of villas and apartments
increase by 8% q-o-q and 6% q-o-q, respectively. Rent of
villas in areas such as Olaya in the north, Sulemenia in
central Riyadh, Hiteen and Nakheel in the west, and
Shumaisi in the south is higher than in the surrounding
neighborhoods. Villa occupancy in districts between
North Ring Road and Prince Salman Street is increasing
rapidly; this area is expected to attract more attraction
from Saudi families, as government offices move towards
north of Riyadh. Apartments, rents are higher in areas
such as Wazarat and Malaz in the south, Olaya in the
center, Diplomatic Quarter in the west, and Yarmuk and
Qurtaba in the east. The government is planning to move
many government offices to the north of Riyadh, while
large expat schools are also moving to the north. This is
likely to result in stronger future rental growth in the
north and center than in other areas.
Commercial Sector
Riyadh office market deteriorates
The office market in Riyadh is facing an oversupply
situation; the trend is likely to worsen in the coming
quarters. The total stock of Grade A and B office space in
locations surveyed by Jones Lang LaSalle (JLL) has
increased by 61,000 sqm in Q1 2013 to stand close to 2
million sqm. The largest completion was Blue Towers, on
King Fahd Road, which added 20,000 sqm space. Several
Grade “B” buildings have been completed on King Fahd
Road and Olaya Street over last three years. Vacancy in
these buildings and in the under-construction structures
have resulted in a wide choice for tenants. Riyadh is likely
to see an addition of ~1.7 million sqm by 2016.
The latest report by JLL suggests that the completion of
the first King Abdullah Financial District (KAFD)
projects, coupled with the delivery of the IT and
Communications Complex (ITCC) and GOSI's Olaya
Towers in the central business district (CBD) is likely to
have a detrimental impact both on vacancy rates and rents.
These projects could add ~500,000 sqm of high quality
space within the CBD. To tackle the oversupply situation
to some extent, the government has decided to move its
offices to northern Riyadh.
Figure 54: Riyadh Office Stock (2012−2016)
Source: JLL, Q1 2013
This oversupply is expected to put downward pressure on
rental rates, while vacancy rates continue to move up. The
average prime rent in Riyadh declined 5% y-o-y in Q1
2013 to SAR 1,910 per sqm, while it rose to 16.0% in Q1
2013 from 15.9% in Q4 2012. Real estate experts expect
that increased vacancy rates and the greater choice
available to tenants will maintain downward pressure on
rental levels in 2013, especially for Grade B properties.
Grade A rents decreased 5.1% y-o-y in Q1 2013 from
SAR 1,305 to SAR 1,291 per sqm. Comparatively, Grade
B rents also decreased by 4.3% y-o-y. City-wide vacancy
2,000
2,200
2,400
2,600
2,800
3,000
Q1 2012 Q2 2012 Q3 2012 Q4 2012 Q1 2013
SA
R p
er s
qm
.
1,897 1,9592,526
3,0663,361
568
539
296265
0
500
1,000
1,500
2,000
2,500
3,000
3,500
4,000
2012 2013 E 2014 E 2015 E 2016 E
To
tal Sto
ck (
sqm
GL
A i
n '0
00s)
Completed Stock Future Supply

increased from 16% to 18% whereas CBD vacancy
increased from 18% to 19%. Going forward, the major
concern, for both the markets, is the addition of new
stock, which might hurt rental prices significantly.
Table 17: Annual Office Rentals in Saudi Arabia – H1 2013
Location Rent (SAR per sq m)
King Fahd Road, Riyadh 850−1,150
Tahlia Road, Riyadh 700−950
Olaya Road, Riyadh 700−800
Khurais Road, Riyadh 700−800
King Abdulaziz Road, Riyadh 650−750
Source: Amar Finance Research
Jeddah office market improves
The office space market in Jeddah continues to see strong
demand from both government and private sector tenants.
This has resulted in a reduction in vacancy levels from
16% at the end of 2012 to just 12% at the end of Q1, as
reported by JLL in its Q1 2013 report. The vacancies are
expected to decline further in the short term, until more
office space is ready for lease. The strongest demand is
for 500–800 sqm offices, which are being consumed at a
higher rate than in 2012.
Figure 55: Riyadh Office Stock (2012−2016)
Source: JLL, Q1 2013, Global Research
Government expenditure is a major demand driver in
sectors like infrastructure, transportation, and healthcare.
The government’s initiatives to improve the regulatory
environment, such as Sawaed and Nitaqat, will further
boost the demand for office space in Jeddah. The stock
reached 661,000 sqm at the end of Q1 2013 with 38,000
sqm being delivered in Q1 2013. The key additions
include private offices covering 14,400 sqm on Prince
Sultan St., Diwan Najia on Tahlia St (with 14,700 sqm);
and Al-Sohaily 2 on Andalus St. A significant increase in
supply (103,000 sqm) is expected in 2013, of which
75,000 sqm will be delivered in the Headquarters Building.
Table 18: Annual Office Rentals in Saudi Arabia – H1 2013
Location Rent (SAR per sq m)
King Abdullah Street, Jeddah 850−1,200
Al Madina Street, Jeddah 650−750
Al Tahlia Street, Jeddah 900−1,350
Sultan Street, Jeddah 700−1,150
Source: Amar Finance Research
Rents have remained relatively stable across the market
and are unlikely to increase during the remainder of 2013,
given the significant potential new supply. Average office
rents remained unchanged since the previous quarter but
were up 3% y-o-y. Grade A office rents showed a
minimal increase of 1% since last year, in contrast to
Grade B rents, which grew by 8%. At 12%, CBD vacancy
remained unchanged since Q4 12.
Hotel rooms in Riyadh, Jeddah to rise
The Kingdom’s tourism market was one of the world's
fastest growing in 2012, despite a 5% y-o-y decline in the
number of visitors to the Middle East. The Saudi
Commission for Tourism and Antiquities (SCTA) has
proposed a SAR 5 billion fund to promote tourism in the
Kingdom. The SCTA is currently developing a number of
tourist destinations, including Al-Aqeer beach at a cost of
SAR 17 billion; the first phase of the project will provide
1,364 rooms. The proposed fund can finance tourism
projects with interest-free loans that are paid in annual
installments, to encourage higher private sector
participation in the sector.
Meanwhile, sources in the industry said that the value of
hotel investments in the KSA is set to increase to SAR
144 billon by 2020. As per STR Global's June 2013 report,
the number of hotel rooms in Riyadh is expected to soar
once all projects in its active pipeline are finished. It
added that in June, the Saudi capital's total active pipeline
comprised 5,598 hotel rooms; with 2,213 rooms in the
pipeline the hotel market in Jeddah is also expected to
surge. SCTA states that in the next two years, 214 new
hotels will be built in the Kingdom.
SAMA revealed that the tourism sector is expected to
create 841,000 direct jobs and 421,000 indirect jobs by
2015, which will increase to 1.2 million direct jobs and
591,000 indirect jobs by 2020. It said that the tourism
sector provided 670,000 jobs in 2011 against 633,000 in
2010, an increase of 5.9%. Such massive employment
opportunities will lead to better purchasing power and
may lend a natural feel good factor to the real estate
sector overall.
Makkah–Madinah require huge investments
With the number of hotels and tower buildings under
construction in Makkah, local realty dealers foresee hotel
investments to reach SAR 500 billion (USD 133 billion).
According to the Makkah–Madinah Chamber of
Commerce and Industry (MCCI), the investments on 450
categorized hotels in Makkah stands at nearly USD 500
million per annum. Over 100 towers currently underway
in Makkah will add more than 24,480 rooms in the region.
Meanwhile, authorities in Madinah are faced with the
pressing issue of constructing 500 hotels within the span
of five years to avoid a hospitality crisis. According to
MCCI, Madinah is expected to attract 1 million visitors
per month upon the completion of the expansion work at
1,897 1,9592,526
3,0663,361
568
539
296265
0
500
1,000
1,500
2,000
2,500
3,000
3,500
4,000
2012 2013 E 2014 E 2015 E 2016 E
To
tal Sto
ck (
sqm
GL
A i
n '0
00s)
Completed Stock Future Supply
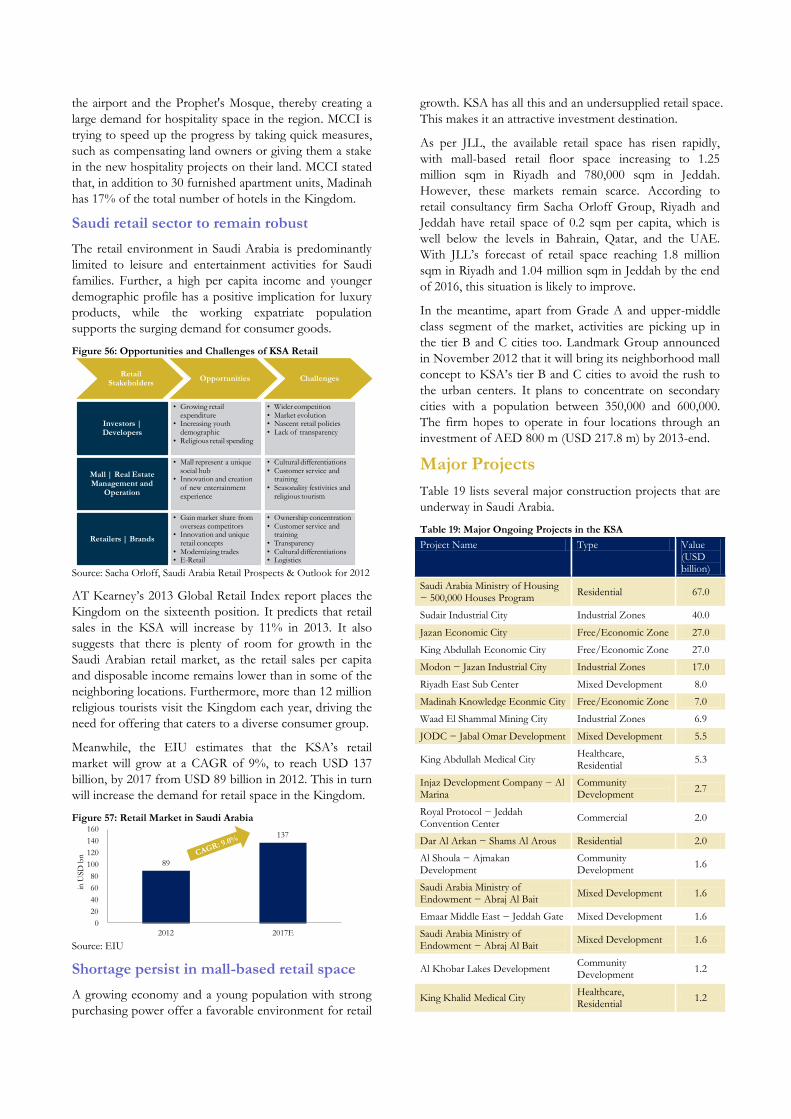
the airport and the Prophet's Mosque, thereby creating a
large demand for hospitality space in the region. MCCI is
trying to speed up the progress by taking quick measures,
such as compensating land owners or giving them a stake
in the new hospitality projects on their land. MCCI stated
that, in addition to 30 furnished apartment units, Madinah
has 17% of the total number of hotels in the Kingdom.
Saudi retail sector to remain robust
The retail environment in Saudi Arabia is predominantly
limited to leisure and entertainment activities for Saudi
families. Further, a high per capita income and younger
demographic profile has a positive implication for luxury
products, while the working expatriate population
supports the surging demand for consumer goods.
Figure 56: Opportunities and Challenges of KSA Retail
Source: Sacha Orloff, Saudi Arabia Retail Prospects & Outlook for 2012
AT Kearney’s 2013 Global Retail Index report places the
Kingdom on the sixteenth position. It predicts that retail
sales in the KSA will increase by 11% in 2013. It also
suggests that there is plenty of room for growth in the
Saudi Arabian retail market, as the retail sales per capita
and disposable income remains lower than in some of the
neighboring locations. Furthermore, more than 12 million
religious tourists visit the Kingdom each year, driving the
need for offering that caters to a diverse consumer group.
Meanwhile, the EIU estimates that the KSA’s retail
market will grow at a CAGR of 9%, to reach USD 137
billion, by 2017 from USD 89 billion in 2012. This in turn
will increase the demand for retail space in the Kingdom.
Figure 57: Retail Market in Saudi Arabia
Source: EIU
Shortage persist in mall-based retail space
A growing economy and a young population with strong
purchasing power offer a favorable environment for retail
growth. KSA has all this and an undersupplied retail space.
This makes it an attractive investment destination.
As per JLL, the available retail space has risen rapidly,
with mall-based retail floor space increasing to 1.25
million sqm in Riyadh and 780,000 sqm in Jeddah.
However, these markets remain scarce. According to
retail consultancy firm Sacha Orloff Group, Riyadh and
Jeddah have retail space of 0.2 sqm per capita, which is
well below the levels in Bahrain, Qatar, and the UAE.
With JLL’s forecast of retail space reaching 1.8 million
sqm in Riyadh and 1.04 million sqm in Jeddah by the end
of 2016, this situation is likely to improve.
In the meantime, apart from Grade A and upper-middle
class segment of the market, activities are picking up in
the tier B and C cities too. Landmark Group announced
in November 2012 that it will bring its neighborhood mall
concept to KSA’s tier B and C cities to avoid the rush to
the urban centers. It plans to concentrate on secondary
cities with a population between 350,000 and 600,000.
The firm hopes to operate in four locations through an
investment of AED 800 m (USD 217.8 m) by 2013-end.
Major Projects
Table 19 lists several major construction projects that are
underway in Saudi Arabia.
Table 19: Major Ongoing Projects in the KSA
Project Name Type Value (USD billion)
Saudi Arabia Ministry of Housing − 500,000 Houses Program
Residential 67.0
Sudair Industrial City Industrial Zones 40.0
Jazan Economic City Free/Economic Zone 27.0
King Abdullah Economic City Free/Economic Zone 27.0
Modon − Jazan Industrial City Industrial Zones 17.0
Riyadh East Sub Center Mixed Development 8.0
Madinah Knowledge Econmic City Free/Economic Zone 7.0
Waad El Shammal Mining City Industrial Zones 6.9
JODC − Jabal Omar Development Mixed Development 5.5
King Abdullah Medical City Healthcare, Residential
5.3
Injaz Development Company − Al Marina
Community Development
2.7
Royal Protocol − Jeddah Convention Center
Commercial 2.0
Dar Al Arkan − Shams Al Arous Residential 2.0
Al Shoula − Ajmakan Development
Community Development
1.6
Saudi Arabia Ministry of Endowment − Abraj Al Bait
Mixed Development 1.6
Emaar Middle East − Jeddah Gate Mixed Development 1.6
Saudi Arabia Ministry of Endowment − Abraj Al Bait
Mixed Development 1.6
Al Khobar Lakes Development Community Development
1.2
King Khalid Medical City Healthcare, Residential
1.2
Investors | Developers
• Growing retail expenditure
• Increasing youth demographic
• Religious retail spending
Mall | Real Estate Management and
Operation
• Mall represent a unique social hub
• Innovation and creation of new entertainment experience
Retailers | Brands
• Gain market share from overseas competitors
• Innovation and unique retail concepts
• Modernizing trades• E-Retail
• Wider competition• Market evolution• Nascent retail policies• Lack of transparency
• Cultural differentiations• Customer service and
training• Seasonality festivities and
religious tourism
• Ownership concentration• Customer service and
training• Transparency• Cultural differentiations• Logistics
Retail Stakeholders
Opportunities Challenges
89
137
0
20
40
60
80
100
120
140
160
2012 2017E
in U
SD
bn

Kingdom of Bahrain
Bahrain’s economy grew steadily in 2013, despite an
uncertain global economic scenario and continued
domestic unrest (concentrated in certain pockets of the
country). According to data from the Bahrain Economic
Development Board, real GDP grew 3.4% in 2012, up
from 1.9% in 2011. The non-oil sector expanded 6.7%,
backed by the tourism sector, which grew by 26% y-o-y in
2012. On the other hand, the oil sector contracted
because of a temporary technical disruption at the
country’s main Abu Sa’afa oilfield; the oilfield has now
returned to its normal capacity. Backed by an increase in
oil output, the Kingdom’s GDP expanded at an annual
rate of 4.3% y-o-y during Q1 2013. The board expects
real GDP to grow at 5.6% and 4.0% in 2013 and 2014,
respectively.
Figure 58: Real GDP Growth Rate
Source: Bahrain Economic Development Board, May 2013
Meanwhile, the EIU has pegged the Kingdom’s real GDP
growth estimate at 3.9% in 2013 and 3.7% in 2014–15,
supported by the ongoing recovery in the services sector,
strengthening of the tourism sector, and recovery in
production at the Abu Sa’afa oilfield. The economy is
then expected to rise to an average of 4.7% in 2016–17, as
Aluminum Bahrain (Alba), the state-owned aluminum
company, is adding a new plotline. Meanwhile, the non-
hydrocarbon sector is expected to grow modestly, backed
by the government’s 2013–14 budget proposal, under
which its spending priorities continue to be infrastructure,
housing, and social development. Hydrocarbons are
expected to remain a major contributor to growth,
although the country has relatively low reserves. However,
foreign businesses may be less interested in investing in
Bahrain, given the small size of the market, regulatory
progress in other GCC nations, and an insecure domestic
political scene.
Figure 59: Real GDP Growth Rate
Source: EIU, August 2013
Economic Overview
Government maintains affordable credit to stimulate economy
Central Bank of Bahrain (CBB) maintained its policy rate
at 0.5% in 2012. As the BHD is pegged to the USD, CBB
has maintained its policy rate, as well as the one-week
deposit rate, in line with US rates. Bank lending in the
country has also slowed down. In such a scenario, the
central bank is unlikely to increase its policy rate unless
the Federal Reserve does the same; this is expected to
occur only in 2015. In 2011–12, the central bank kept
rates low to stimulate the economy, which was affected by
the global recession. This led to a decline in the market
interest rates, signifying a better credit atmosphere.
Average lending rates on business loans remained flat, in
the range of 4.9–5.0%, between 2011 and 2012; however,
it decreased to ~4.2% in H1 2013. Meanwhile, the
average lending rate on personal loans in Q2 2013 was
6.1%, up from 5.8% in Q2 2012.
Figure 60: Interest Rates
Source: Central Bank of Bahrain, June 2012
Inflation to remain at moderate levels
According to official data, in H1 2013, inflation in
Bahrain increased to 3.2% y-o-y, driven by a sharp
increase in housing costs. In June itself, housing costs
increased by 10% over that in May. However, the EIU
expects inflation to average out to 2.9% in 2013, due to
the impact of a stronger USD on import costs. The EIU
expects the ongoing recovery in the property market,
which slumped in 2011–12, to push up inflation to an
average of 3.2% in 2014–17. Inflation is expected to
remain in the range of 2.9–3.1% in 2013–14, supported
by easing commodities prices, particularly food items.
Thereafter, it is expected to rise, as subsidies may not be
sufficient to meet the price rise in global industrial raw
materials.
Figure 61: Inflation
Source: EIU Country Report, January 2013
3.6%
(8.5%)
10.5%
4.4%1.4% 6.7% 4.4% 3.9%
1.9% 3.4%
5.6%4.0%
(9%)
(6%)
(3%)
0%
3%
6%
9%
12%
2011 A 2012 A 2013 E 2014 E
Hydrocarbons sector Non-hydrocarbon sectors Real GDP
3.4%
3.9%3.7% 3.7%
5.2%
4.3%
2%
3%
4%
5%
6%
2012 A 2013 F 2014 F 2015 F 2016 F 2017 F
Aver
age
Infl
atio
n (
%)
1.00% 0.95%1.01%
1.11% 1.09% 1.11% 1.09%1.00% 1.00% 1.03%
0.25% 0.25% 0.25% 0.25%
0.52% 0.47% 0.44%0.32% 0.29% 0.28%
0.0%
0.3%
0.5%
0.8%
1.0%
1.3%
Q1 11 Q2 11 Q3 11 Q4 11 Q1 12 Q2 12 Q3 12 Q4 12 Q1 13 Q2 13
Inte
rest
Rat
e
Average Interest Rate on Deposits (3-12 months)Average Interbank Interest Rate (3 Months)
2.8%2.9%
3.1%3.0%
3.3%
3.5%
2.5%
3.0%
3.5%
4.0%
2012 A 2013 F 2014 F 2015 F 2016 F 2017 F
Ave
rage
In
flat
ion
(%
)
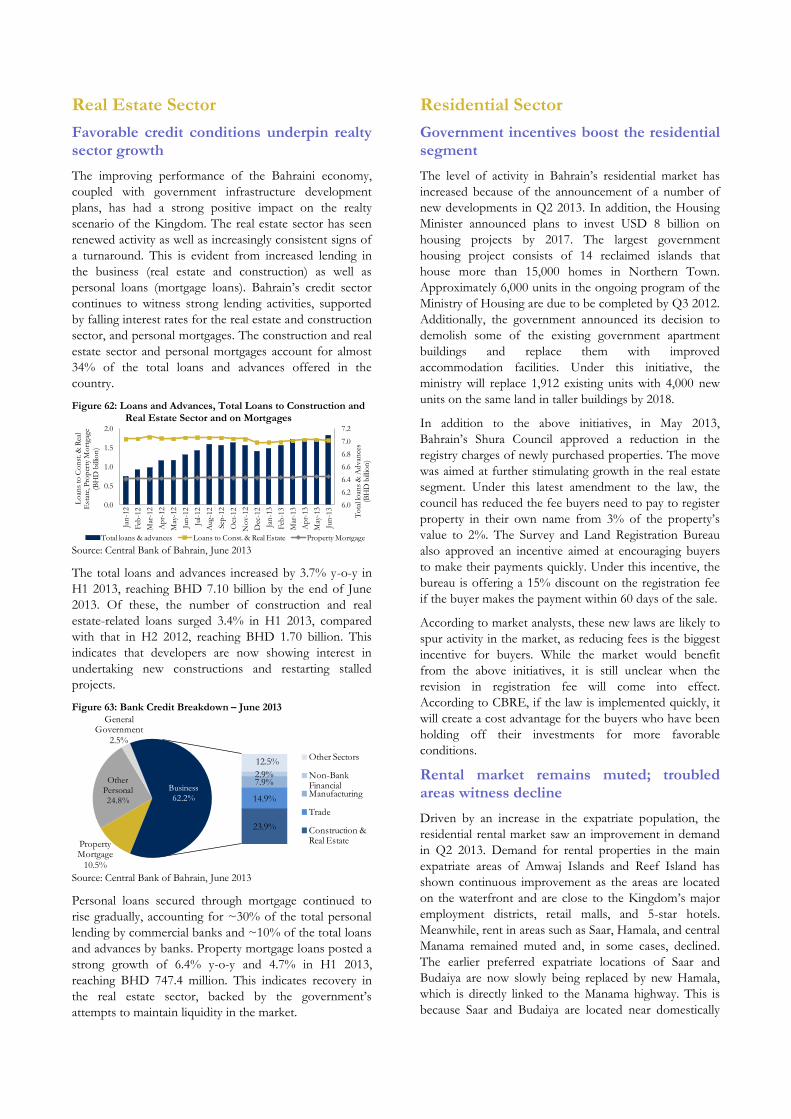
Real Estate Sector
Favorable credit conditions underpin realty sector growth
The improving performance of the Bahraini economy,
coupled with government infrastructure development
plans, has had a strong positive impact on the realty
scenario of the Kingdom. The real estate sector has seen
renewed activity as well as increasingly consistent signs of
a turnaround. This is evident from increased lending in
the business (real estate and construction) as well as
personal loans (mortgage loans). Bahrain’s credit sector
continues to witness strong lending activities, supported
by falling interest rates for the real estate and construction
sector, and personal mortgages. The construction and real
estate sector and personal mortgages account for almost
34% of the total loans and advances offered in the
country.
Figure 62: Loans and Advances, Total Loans to Construction and Real Estate Sector and on Mortgages
Source: Central Bank of Bahrain, June 2013
The total loans and advances increased by 3.7% y-o-y in
H1 2013, reaching BHD 7.10 billion by the end of June
2013. Of these, the number of construction and real
estate-related loans surged 3.4% in H1 2013, compared
with that in H2 2012, reaching BHD 1.70 billion. This
indicates that developers are now showing interest in
undertaking new constructions and restarting stalled
projects.
Figure 63: Bank Credit Breakdown – June 2013
Source: Central Bank of Bahrain, June 2013
Personal loans secured through mortgage continued to
rise gradually, accounting for ~30% of the total personal
lending by commercial banks and ~10% of the total loans
and advances by banks. Property mortgage loans posted a
strong growth of 6.4% y-o-y and 4.7% in H1 2013,
reaching BHD 747.4 million. This indicates recovery in
the real estate sector, backed by the government’s
attempts to maintain liquidity in the market.
Residential Sector
Government incentives boost the residential segment
The level of activity in Bahrain’s residential market has
increased because of the announcement of a number of
new developments in Q2 2013. In addition, the Housing
Minister announced plans to invest USD 8 billion on
housing projects by 2017. The largest government
housing project consists of 14 reclaimed islands that
house more than 15,000 homes in Northern Town.
Approximately 6,000 units in the ongoing program of the
Ministry of Housing are due to be completed by Q3 2012.
Additionally, the government announced its decision to
demolish some of the existing government apartment
buildings and replace them with improved
accommodation facilities. Under this initiative, the
ministry will replace 1,912 existing units with 4,000 new
units on the same land in taller buildings by 2018.
In addition to the above initiatives, in May 2013,
Bahrain’s Shura Council approved a reduction in the
registry charges of newly purchased properties. The move
was aimed at further stimulating growth in the real estate
segment. Under this latest amendment to the law, the
council has reduced the fee buyers need to pay to register
property in their own name from 3% of the property’s
value to 2%. The Survey and Land Registration Bureau
also approved an incentive aimed at encouraging buyers
to make their payments quickly. Under this incentive, the
bureau is offering a 15% discount on the registration fee
if the buyer makes the payment within 60 days of the sale.
According to market analysts, these new laws are likely to
spur activity in the market, as reducing fees is the biggest
incentive for buyers. While the market would benefit
from the above initiatives, it is still unclear when the
revision in registration fee will come into effect.
According to CBRE, if the law is implemented quickly, it
will create a cost advantage for the buyers who have been
holding off their investments for more favorable
conditions.
Rental market remains muted; troubled areas witness decline
Driven by an increase in the expatriate population, the
residential rental market saw an improvement in demand
in Q2 2013. Demand for rental properties in the main
expatriate areas of Amwaj Islands and Reef Island has
shown continuous improvement as the areas are located
on the waterfront and are close to the Kingdom’s major
employment districts, retail malls, and 5-star hotels.
Meanwhile, rent in areas such as Saar, Hamala, and central
Manama remained muted and, in some cases, declined.
The earlier preferred expatriate locations of Saar and
Budaiya are now slowly being replaced by new Hamala,
which is directly linked to the Manama highway. This is
because Saar and Budaiya are located near domestically
6.0
6.2
6.4
6.6
6.8
7.0
7.2
0.0
0.5
1.0
1.5
2.0
Jan
-12
Feb
-12
Mar
-12
Ap
r-12
May
-12
Jun
-12
Jul-
12
Aug-1
2
Sep
-12
Oct
-12
No
v-1
2
Dec
-12
Jan
-13
Feb
-13
Mar
-13
Ap
r-13
May
-13
Jun
-13
To
tal l
oan
s &
Ad
van
ces
(BH
D b
illio
n)
Lo
ans
to C
on
st. &
Rea
l E
stat
e, P
rop
erty
Mo
rtgag
e (B
HD
bill
ion
)
Total loans & advances Loans to Const. & Real Estate Property Mortgage
Property Mortgage
10.5%
OtherPersonal24.8%
General Government
2.5%
12.5%
2.9%7.9%
14.9%
23.9%
Business62.2%
Other Sectors
Non-Bank FinancialManufacturing
Trade
Construction & Real Estate

troubled areas. Real estate consultants estimate that in
areas facing domestic unrest, such as the Northern
Governorate, rents have declined by 40–60%.
Table 20: Monthly Villa Rental Rates in Bahrain in H1 2013
Location Type Rent (BHD)
Reef Island 2 BR FF 600–800
Amwaj Island 2 BR FF 650–800
Juffair 2 BR FF 500–700
Adliya 2 BR FF 350–550
Source: Amar Finance Research
A new niche market has developed, owing to the influx of
expatriates from Saudi Arabia. Many companies have
relocated to the Eastern Province in the KSA, while their
employees choose to live in Bahrain and commute to
work. According to Cluttons, this has led to increased
interest in the areas such as Hamala and Jasra that
provides easy access to the King Fahad Causeway. In
addition, several self-contained developments have been
made, or are being developed, to cater to this new
demand.
Commercial Sector
Modest outlook for commercial real estate
Although Bahrain’s real estate market has shown signs of
improvement in Q2 2013, the office segment continues to
remain oversupplied. There was a minimal increase in
rents owing to improvement in the economic outlook and
a slowdown in the number of new occupiers in the
market. Demand came from existing businesses looking at
expansion, rather than from new entrants, due to ongoing
domestic unrests. Additionally, landlords remain under
pressure to be flexible on the lengths of rent-free, fit-out
periods, given the oversupply in the office market.
Meanwhile, vacancy rates witnessed huge gaps across the
market. Areas offering better parking facilities and easy
access remained the top choices for business houses. As a
result, Diplomatic Area performed poorly, as compared
with Seef Area. In addition, a new trend has emerged in
which tenants are showing a preference for international
property management; properties with such facilities
generated investor interest during Q2 2013.
Table 21: Office Space Rental in Bahrain in H1 2013
Location Rent (BHD per sqm/Month)
Bahrain Financial Harbour 8–10
Seef Area 4.5–8
Diplomatic Area 3.5–4.5
Source: Amar Finance Research
Properties in prime locations with quality tenants on long
leases and good management are now being actively
considered. We anticipate rental gaps to widen further
because of this preference.
Business tourism strengthens hospitality market in the Kingdom
Business tourism plays an important role in the Kingdom.
The Bahrain Exhibition and Convention Authority
(BECA) host a number of industry events and exhibitions.
The major events include the annual Bahrain Boat Show
and the bi-annual Bahrain Air Show, which is the island’s
largest exhibition. In recent years, Bahrain has become an
important location for organizing exhibitions and
conferences. Therefore, the BECA plans to expand its
exhibition and conference space through the construction
of the Bahrain Expo City in Manama City. This would
increase the net available exhibition space to 145,000 sq m
from the current 16,000 sq m. The project is scheduled to
be completed by 2015. With the growing importance of
business tourism, demand for hospitality space is also
bound to increase. There has been increased supply of 3-
and 4-star hotels, as seen below, to meet the requirements
of business travelers.
Figure 64: Hotels by Tier – 2012
Source: Central Informatics Organization
According to the World Travel and Tourism Council, the
tourism sector contributed BHD 538 million to Bahrain’s
GDP in 2012, up 8.5% from that in 2011 (BHD 496
million). This growing trend has resulted in improvements
in the hospitality space in Bahrain over the last two years.
The number of hotels increased at a CAGR of 8.1%
between 2008 and 2012. In 2012, the hospitality space
grew by 15% y-o-y. In Q2 2013, the number of hotel
projects in Bahrain increased on the back of a strong
hospitality sector, coupled with the change in Saudi
Arabia’s working days (Saudi Arabia’s weekend is now the
same as that of other GCC countries), which will increase
the inflow of weekend-getaway tourists.
Kuwait Finance House announced the financing of the
stalled Banader Rotana Hotel project, a 28-storey, 5-star
hotel and furnished-apartments property offering 251
rooms. Hilton Worldwide also announced its intention to
open a 350-room, 5-star DoubleTree Suites in Juffair in
late 2015. Other projects on board include Nama
International’s 4-star hotel with about 175 rooms on
Bahrain Bay and a further phase two development of 240
5-star rooms, and Swiss-Belhotel International’s 4-star
project offering 149 rooms in Seef District; the hotel is
slated to open in Q1 2014.
5 Star11%
4 Star38%
3 Star34%
2 Star15%
1 Star2%
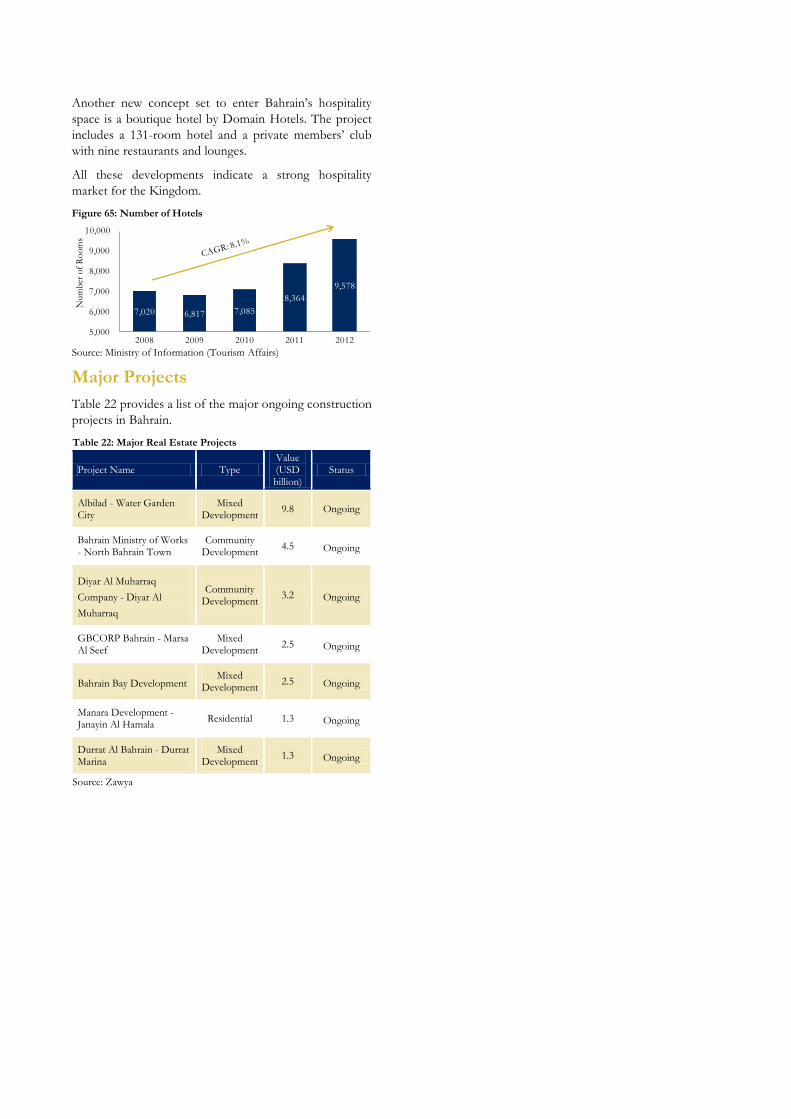
Another new concept set to enter Bahrain’s hospitality
space is a boutique hotel by Domain Hotels. The project
includes a 131-room hotel and a private members’ club
with nine restaurants and lounges.
All these developments indicate a strong hospitality
market for the Kingdom.
Figure 65: Number of Hotels
Source: Ministry of Information (Tourism Affairs)
Major Projects
Table 22 provides a list of the major ongoing construction
projects in Bahrain.
Table 22: Major Real Estate Projects
Project Name Type Value (USD billion)
Status
Albilad - Water Garden City
Mixed Development
9.8 Ongoing
Bahrain Ministry of Works - North Bahrain Town
Community Development
4.5 Ongoing
Diyar Al Muharraq
Company - Diyar Al
Muharraq
Community Development
3.2 Ongoing
GBCORP Bahrain - Marsa Al Seef
Mixed Development
2.5 Ongoing
Bahrain Bay Development Mixed
Development 2.5 Ongoing
Manara Development - Janayin Al Hamala
Residential 1.3 Ongoing
Durrat Al Bahrain - Durrat Marina
Mixed Development
1.3 Ongoing
Source: Zawya
7,020 6,817 7,085
8,364
9,578
5,000
6,000
7,000
8,000
9,000
10,000
2008 2009 2010 2011 2012
Num
ber
of
Ro
om
s

Oman
High oil prices and increased public spending led to an
11.5% rise in Oman's GDP (at current prices) in 2012.
According to the National Centre for Statistics and
Information (NSCI), the oil sector grew by around 10.9%
and the non-hydrocarbon GDP by nearly 12%, mainly
because of a surge in public expenditure. Preliminary
fiscal data reveals that the government's expansionary
fiscal policy will be crucial for maintaining the strength of
domestic demand. This is because the fiscal policy plays a
vital role in the economy as government expenditures
(~OMR 13 billion) amounted to 43% of the GDP in
2012. The government is not keen to pull back spending,
as evident by the size of the eighth Five-Year Plan (2011–
15), which amounts to more than OMR 16 billion.
Figure 66: Real GDP Breakdown
Source: EIU, August 2013
According to the EIU, the non-oil sector will continue to
dominate the country’s growth. However, it will slow
down when the benefits of superior recovery techniques
at ageing oil wells tapers. As depicted in Fig 66, the
services and industry sector, which is likely to continue
growing at a brisk pace, will compensate for the decline in
the non-oil sector. The industrial sector will suffer from a
weaker-than-expected external economic environment,
particularly due to slow growth in China and India, which
will dampen the growth of non-oil exports. India emerged
as the largest importer of non-oil goods in 2012, while
China ranked fourth. The EIU estimates that high
domestic demand, a still expansionary fiscal policy and
gains in the non-oil economy will ensure that economic
growth is robust, averaging 4.6% in 2013-17.
Figure 67: Real GDP Growth Estimates
Source: EIU Country Report Oman, August 2013
On the contrary, in its first financial stability report, the
Central Bank of Oman (CBO) estimated Oman’s real
GDP at 4.2% and 3.5% in 2013 and 2014, respectively.
These forecasts were based on the assumptions of global
growth rate of 3.3% in 2013 and 4.0% in 2014 and world
oil prices (per barrel) of USD 102.6 in 2013 and USD 97.6
in 2014. However, the CBO believes that these baseline
projections for Oman’s growth would undergo downward
revisions to some extent under adverse scenario of oil
prices causing Oman’s real GDP growth to decrease 3.2-
3.5% in 2014. This reflects Oman’s dependence on the oil
prices and global growth.
Despite the challenges faced in sustaining high growth
rates, containing inflation, reducing debts, and monitoring
volatility in oil prices, Oman continues to be in line with
the 'Oman 2020’ vision of diversifying its economy. In the
2013 budget, the government focused on increasing
employment opportunities through the provision of
56,000 jobs in 2013 as well as focused on the education
and healthcare sectors. To expand the SME sector and set
up new industrial zones, the government has invited local
and foreign capital in the private sector. These initiatives
are likely to have a strong impact on the realty sector.
Economic Overview
Interest rates continue to head downwards
To boost lending to SME and other non-hydrocarbon
sectors, the central bank held the interest rates steady
despite the global uncertainty. The CBO announced that
by the end of 2014, a minimum of 5% of total loans must
be allocated to the SME sector. Meanwhile, the EIU
forecasts interest rates to trend up from 2015, in line with
movements by the Federal Reserve (the US central bank).
It forecasts that the lending rate in Oman will average at
6.0% during 2013−17.
Figure 68: Oman Interest Rates
Source: Central Bank of Oman, June 2013
The Sultanate showcased confidence in the Omani Riyal's
peg to the USD, by deciding not to join the proposed
GCC single currency. The CBO insists that the peg will
remain in place for the foreseeable future. However, in
June, for the first time, Oman hinted that economic
trends might eventually push Qatar into allowing its
currency to fluctuate.
Figure 69: Lending Rate Forecasts
Source: EIU Country Report, January 2013
0%
2%
4%
6%
8%
10%
2012 E 2013 F 2014 F 2015 F 2016 F 2017 F
Agriculture Industry Services Real GDP
3.3%
5.6%
0.3%
8.3%
4.7% 4.6% 4.9% 4.5% 4.2%
0%
2%
4%
6%
8%
10%
2009 A 2010 A 2011 A 2012 E 2013 F 2014 F 2015 F 2016 F 2017 F
GD
P G
row
th R
ate
5.0%
5.3%
5.6%
5.9%
6.2%
6.5%
6.8%
1.0%
1.1%
1.2%
1.3%
1.4%
1.5%
Jun-11 Oct-11 Feb-12 Jun-12 Oct-12 Feb-13 Jun-13
Average C
redit R
ate
Aver
age
Dep
osi
t R
ate
Average Deposit Rate Average Credit Rate
5.7%
5.8%
5.9%
6.1%
6.2% 6.2%
5.6%
5.7%
5.8%
5.9%
6.0%
6.1%
6.2%
6.3%
2012 A 2013 F 2014 F 2015 F 2016 F 2017 F
Len
din
g R
ate
(%)

Inflation drops to lowest level since 2009
Inflation in the Sultanate is primarily affected by the
prices of products that it imports, including food grains.
However, the government uses an extensive subsidy
system to contain global fluctuations in the prices of core
goods and services.
Figure 70: Consumer Price Inflation
Source: EIU, August 2013
According to a monthly statistical bulletin released by the
National Centre for Statistics and Information (NCSI),
the country's inflation fell to 0.98% in June, the lowest
level since December 2009. The fall is attributed to stable
housing and utility costs and decline in the prices of
certain imported items due to the strengthening of the
USD against major Asian currencies. Average inflation for
H1 2013 eased considerably to 1.8% on the back of
softening of commodity prices, especially agricultural
products, as well as a slowdown in awarding of major
projects by the government. The EIU estimates the
country’s inflation to average at just 1.6% for 2013.
However, in the medium term, inflation is expected to
rise owing to robust domestic demand, rising wages and
higher electricity and gas prices for businesses. Average
inflation between 2014 and 2017 is estimated at 3.6%.
Real Estate Sector
Strong government spending boosts growth
Oman’s real estate sector is driven by increased
government spending on development and infrastructure
projects. Under the eighth Five Year Plan (2011–2015),
budget allocation for development and infrastructure
projects has been revised to OMR 16 billion, up from the
initial projection of OMR 12.1 billion. The housing
budget for 2013 has been increased by 45%, from OMR
323 million in 2012 to OMR 469 million.
Sustained by optimistic oil prices and expanding non-oil
output, the economy of Oman remains positive. As a
result, real estate sector is witnessing increased investor
confidence which is evident from the developments of
Integrated Tourism Complexes (ITCs), sophisticated
residential projects, mixed-use tourism, and residential
schemes, and a glut of stand-alone office and residential
projects.
Retail loans and housing loans drop due to regulatory restrictions
Lending by commercial banks grew by 7.7% y-o-y in H1
2013, a marked slowdown from the 19.4% expansion in
the same period in 2012. There have been concerns on
the huge amount of personal loan that was used for
luxury cars, mobile phones, leisure travel, etc. To address
this issue, the CBO in 2012 capped 50% of the monthly
income for EMI on personal loans with a maximum
repayment period of 10 years. This led to a fall in private
sector growth, from 19.6% in H2 2012 to 7.2% in H2
2013 (see Fig 71). It also capped 60% of the monthly
income for EMI on housing loans with a maximum
repayment period of 25 years. As a result, personal loan
(that included housing loans) growth reduced to 3.9% in
H2 2013 from 22.1% in H2 2012. Further, housing loan,
as a percentage of total credit, fell to 39.6% in H2 2013
from 41.0% in H2 2012 (see Fig 72).
Figure 71: Growth in Total and Private Sector Lending by Banks
Source: Central Bank of Oman, Quarterly Bulletin June 2013
The CBO announced further curbs on personal lending in
March 2013, lowering the maximum share of personal
loans in a bank's total loans from 40% to 35%.
Simultaneously, it raised the cap on mortgage advances
from 10% to 15% to sustain the revival of the housing
market. However, this decision has been postponed until
June 2014.
Figure 72: Credit Breakdown by Bank (in OMR ‘000s)
Source: Central Bank of Oman, Quarterly Bulletin June 2013
According to market analysts, growth in bank credit is
expected to slow to 8–10% this year from ~15% in 2012,
as the CBO’s restrictions on personal loans continue to
hinder the growth of banks' retail portfolio. However, the
demand for credit from the corporate sector is expected
to improve in H2 2013 due to improved business
confidence in the industrial sector.
3.6%
3.2%
4.0%
2.9%
1.6%
2.8%
3.6%
4.0%3.8%
1.0%
1.5%
2.0%
2.5%
3.0%
3.5%
4.0%
4.5%
2009 A 2010 A 2011 A 2012 E 2013 F 2014 F 2015 F 2016 F 2017 F
Infl
atio
n R
ate
(%)
0%
5%
10%
15%
20%
25%
30%
35%
Q1 0
9
Q2 0
9
Q3 0
9
Q4 0
9
Q1 1
0
Q2 1
0
Q3 1
0
Q4 1
0
Q1 1
1
Q2 1
1
Q3 1
1
Q4 1
1
Q1 1
2
Q2 1
2
Q3 1
2
Q4 1
2
Q1 1
3
Q2 1
3
Y-o
-Y G
row
th
Y-o-Y Private Sector Lending Growth Y-o-Y Total Lending Growth
38%
39%
40%
41%
42%
0
3,000
6,000
9,000
12,000
15,000
2Q
20
10
3Q
20
10
4Q
20
10
1Q
20
11
2Q
20
11
3Q
20
11
4Q
20
11
1Q
20
12
2Q
20
12
Q3
20
12
Q4
20
12
Q1
20
13
Q2
20
13
Per
son
al L
oan
as
a %
of
To
tal C
red
it
In O
MR
'00
0s
Trade ConstructionManufacturing Services Financial Institutions Personal/ Housing LoansMining & Quarrying OthersPersonal Loan as a % of Total Credit

Residential Sector
Strong demographics and better wages back demand for quality residential space
Rapidly rising population, especially the expatriates, and
an increase in the minimum wage in the private sector by
~48% resulted in a big boost to the residential real estate
sector. The expatriate workforce has grown rapidly in
recent years. According to NCSI, overall population grew
by an estimated 14% in 2012 to 3.8 million, with
expatriates accounting for 75% of the rise. The country’s
population is expected to rise to 8.3 million by 2050.
Figure 73: Population by Nationality
Source: Central Bank of Oman, Quarterly Bulletin June 2013
The rising expatriate population has led to an increased
demand for residential units, which is expected to remain
strong in the foreseeable period. In Q1 2013, the value of
traded property surged 36.1% y-o-y to OMR 707.4
million. The demand for residential units is also expected
to be fuelled by the increase in the minimum wage rate of
Omanis working in the private sector. The minimum
wage has been revised from OMR 220 per month to
OMR 325 per month. This will lead to demand for better
quality properties within the lower income housing
segment. Meanwhile, demand for the already constructed
well-designed houses is picking up among traditional
Omanis, as they do not want to purchase land and then
construct their houses. Additionally, under the Eighth
Five-Year Plan, the government has emphasised human
resource development, with spending on education and
health to increase 55% and 88%, respectively. The plan
includes creation of 200,000–275,000 jobs at an average
rate of 40,000–45,000 jobs per year. These measures are
expected to add to the demand for residential units.
Meanwhile, good quality apartments in prime locations
have retained or even increased their value due to strong
demand. According to the Ministry of Housing, real estate
prices have seen a notable increase of 10–20% during the
first half of this year, reflecting economic growth and
return of investment activities. The launch of various
projects, such as the Phase 2 of Muscat Hills and The
Wave Marsa 2, clearly reflects strong demand.
The uptrend in the volume of transactions and rental rates
continued during the quarter. Further, cheaper mortgage
options and access to Islamic finance for buying
properties continue to drive growth in the segment.
Despite the significant developments in the residential
segment in recent years, the rental market suffers from
the lack of high-quality and well designed stocks to meet
the lessee’s expectations. The residential leasing market in
Muscat is extremely active as the number of expatriates in
Oman continues to increase. Interest from purchasers in
the secondary market at ITCs such as The Wave, has
shown a significant increase this year, but the majority of
properties available are priced above buyer’s expectations,
leading to fewer transactions being completed.
Housing rental to remain competitive
The demand for high-quality residential accommodation
is increasing owing to an increase in disposable incomes
of the Omanis and the steady inflow of expatriates. In its
2013 budget, the government announced a housing
assistance program, which includes construction of 4,000
houses at a cost of OMR 80 million, 250 houses in the
wilayat of al Mazyonah at a cost of OMR 8 million, and
1,390 housing loans worth OMR 28 million under the
framework of the housing loans program.
The two-tier market within the residential segment has
increased rental gaps between prime developed and
poorly designed areas. For example, there has been strong
interest in residential apartments in the Tilal Complex—
its rental values range from OMR 550–650 per month for
a one-bedroom apartment; OMR 750–900 for a two-
bedroom apartment; and OMR 1,000–1,300 for a three -
bedroom apartment. These values are significantly higher
than the average rental value in the Al Khuwair area.
Table 23: Monthly Residential Rentals of Apartments – H1 2013
Area Type (in OMR)
The Muscat Hills 2 BR FF Apt 950-1,250
The Wave 2 BR FF Apt 1,000-1,300
Shatti Al Qurum 2 BR FF Apt 700-900
Azaiba 2 BR FF Apt 450-550
Al Khuwair 2 BR FF Apt 400-600
Source: Amar Finance Research
A similar trend is seen in the case of villas that offer top
quality construction and amenities. Good quality villas in
the OMR 1,200–2,000 per month range are in shortage in
central and western areas; modern apartments with
facilities are also lacking. The trend is likely to continue in
the near term, putting an upward pressure on rentals and
making the market more competitive.
Table 24: Monthly Rentals of Villas in Oman –H1 2013
Area Type (in OMR)
The Muscat Hills 4 BR FF 1,750-2,200
Shatti Al Qurm 4 BR FF 2,000-2,200
The Wave 4 BR FF 1,750-2,300
Madinat Qaboos 4 BR FF 1,600-1,900
Azaiba 4 BR FF 900-1,000
Source: Amar Finance Research
2.02 1.96 2.01 2.09 2.17
1.16 0.82
1.28 1.53 1.68
1.0
1.5
2.0
2.5
3.0
3.5
4.0
2009 2010 2011 2012 H1 2013
in m
illio
ns
Omani Non-Omani
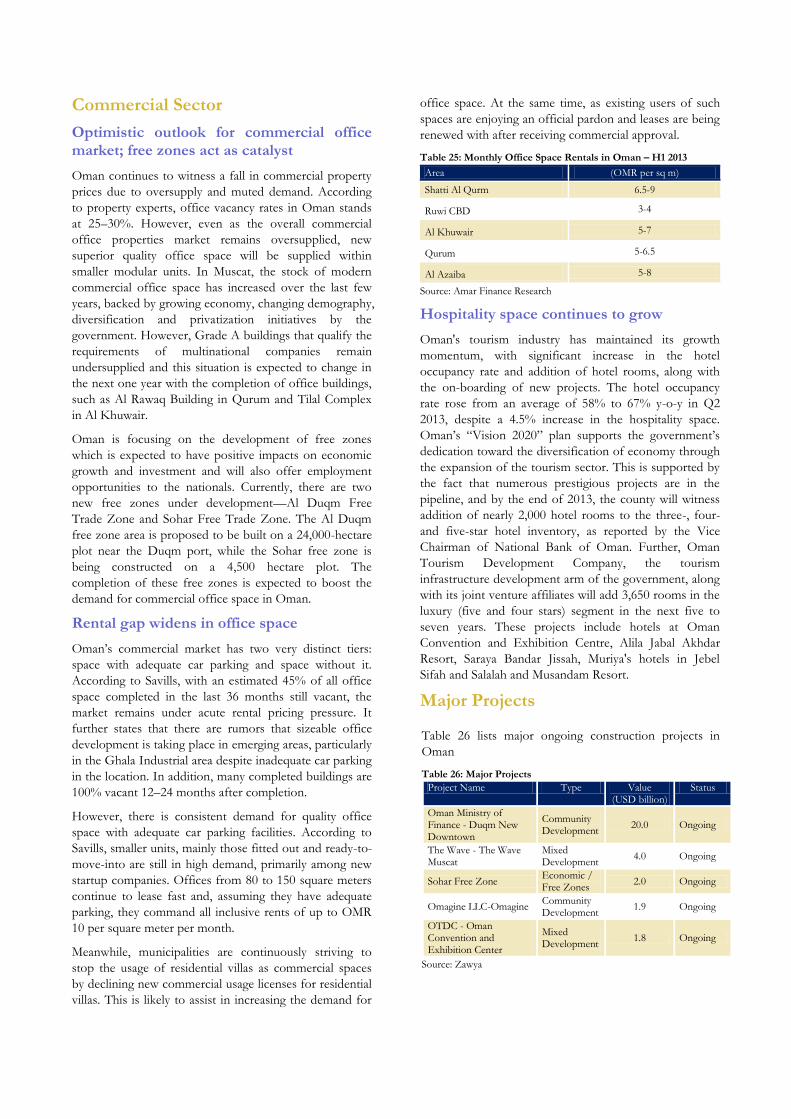
Commercial Sector
Optimistic outlook for commercial office market; free zones act as catalyst
Oman continues to witness a fall in commercial property
prices due to oversupply and muted demand. According
to property experts, office vacancy rates in Oman stands
at 25–30%. However, even as the overall commercial
office properties market remains oversupplied, new
superior quality office space will be supplied within
smaller modular units. In Muscat, the stock of modern
commercial office space has increased over the last few
years, backed by growing economy, changing demography,
diversification and privatization initiatives by the
government. However, Grade A buildings that qualify the
requirements of multinational companies remain
undersupplied and this situation is expected to change in
the next one year with the completion of office buildings,
such as Al Rawaq Building in Qurum and Tilal Complex
in Al Khuwair.
Oman is focusing on the development of free zones
which is expected to have positive impacts on economic
growth and investment and will also offer employment
opportunities to the nationals. Currently, there are two
new free zones under development—Al Duqm Free
Trade Zone and Sohar Free Trade Zone. The Al Duqm
free zone area is proposed to be built on a 24,000-hectare
plot near the Duqm port, while the Sohar free zone is
being constructed on a 4,500 hectare plot. The
completion of these free zones is expected to boost the
demand for commercial office space in Oman.
Rental gap widens in office space
Oman’s commercial market has two very distinct tiers:
space with adequate car parking and space without it.
According to Savills, with an estimated 45% of all office
space completed in the last 36 months still vacant, the
market remains under acute rental pricing pressure. It
further states that there are rumors that sizeable office
development is taking place in emerging areas, particularly
in the Ghala Industrial area despite inadequate car parking
in the location. In addition, many completed buildings are
100% vacant 12–24 months after completion.
However, there is consistent demand for quality office
space with adequate car parking facilities. According to
Savills, smaller units, mainly those fitted out and ready-to-
move-into are still in high demand, primarily among new
startup companies. Offices from 80 to 150 square meters
continue to lease fast and, assuming they have adequate
parking, they command all inclusive rents of up to OMR
10 per square meter per month.
Meanwhile, municipalities are continuously striving to
stop the usage of residential villas as commercial spaces
by declining new commercial usage licenses for residential
villas. This is likely to assist in increasing the demand for
office space. At the same time, as existing users of such
spaces are enjoying an official pardon and leases are being
renewed with after receiving commercial approval.
Table 25: Monthly Office Space Rentals in Oman – H1 2013
Area (OMR per sq m)
Shatti Al Qurm 6.5-9
Ruwi CBD 3-4
Al Khuwair 5-7
Qurum 5-6.5
Al Azaiba 5-8
Source: Amar Finance Research
Hospitality space continues to grow
Oman's tourism industry has maintained its growth
momentum, with significant increase in the hotel
occupancy rate and addition of hotel rooms, along with
the on-boarding of new projects. The hotel occupancy
rate rose from an average of 58% to 67% y-o-y in Q2
2013, despite a 4.5% increase in the hospitality space.
Oman’s “Vision 2020” plan supports the government’s
dedication toward the diversification of economy through
the expansion of the tourism sector. This is supported by
the fact that numerous prestigious projects are in the
pipeline, and by the end of 2013, the county will witness
addition of nearly 2,000 hotel rooms to the three-, four-
and five-star hotel inventory, as reported by the Vice
Chairman of National Bank of Oman. Further, Oman
Tourism Development Company, the tourism
infrastructure development arm of the government, along
with its joint venture affiliates will add 3,650 rooms in the
luxury (five and four stars) segment in the next five to
seven years. These projects include hotels at Oman
Convention and Exhibition Centre, Alila Jabal Akhdar
Resort, Saraya Bandar Jissah, Muriya's hotels in Jebel
Sifah and Salalah and Musandam Resort.
Major Projects
Table 26 lists major ongoing construction projects in
Oman
Table 26: Major Projects
Project Name Type Value (USD billion)
Status
Oman Ministry of Finance - Duqm New Downtown
Community Development
20.0 Ongoing
The Wave - The Wave Muscat
Mixed Development
4.0 Ongoing
Sohar Free Zone Economic / Free Zones
2.0 Ongoing
Omagine LLC-Omagine Community Development
1.9 Ongoing
OTDC - Oman Convention and Exhibition Center
Mixed Development
1.8 Ongoing
Source: Zawya

Qatar
According to Qatar Statistics Authority (QSA), Qatar’s
witnessed economic growth at an average of 15% per
annum in 2010-11 on the back of huge LNG output and
gas-to-liquids production. The growth was further
supported by expansionary monetary policy by the
government and rising global hydrocarbon prices. In 2012
growth subsided considerably to 6.2%, with oil sector
contributing 1.7% to the growth and the non-oil sector
10%. However, in Q1 2013, Qatar’s real GDP increased
swiftly to 6.2% y-o-y. EIU believes that since the country
has completed the expansion of LNG output, the real
GDP growth rate will slow down to 5.2% in 2013 and will
increase thereafter maintaining an average of 5.5% over
2013-17. This growth will mainly be driven by non-oil
sectors which are expected to grow at an average of 9%
per annum. Further, growth is expected to be stimulated
from the increased infrastructure investments on projects
related to Football World Cup 2022.
Figure 74: Economic growth forecasts
Source: EIU Country Report, July 2013
Meanwhile, Qatar witnessed a transition of power in June
from the retiring emir Sheikh Hamad to his son, Sheikh
Tamim, in a rare hand over by a hereditary Gulf Arab
ruler for smooth transition. Experts and economists
believe that Qatar is unlikely to see a change in
macroeconomic policy despite having a new leader. In
addition, there is likely to be any change in the country's
aggressive international investment strategy in the short
term. However, there could be a longer term shift toward
domestic spending, for example, more money towards
agriculture development at home rather than just land
purchases abroad.
Economic Overview
Non-hydrocarbon sectors drive growth
According to Qatar's Economic Outlook 2013-2014 by
the General Secretariat for Development Planning
(GSDP), Qatar's real GDP growth in 2013 is estimated to
increase to 5.3% from the earlier estimated 4.8%, and will
drop to 4.5% in 2014, citing changes to its expected
output of oil and gas. The country’s pipeline gas
production is expected to rise in 2013 and unscheduled
shutdowns, which limited the output in 2012, are unlikely
to be repeated. Also, in 2014, upstream oil and gas is
likely to reduce as output from maturing oil fields tapers
off and gas production hits installed-capacity limits.
Figure 75: Contributions to Real GDP Growth
Source: Qatar Statistics Authority
With a projected 9.8% growth in the non-oil sector for
2013 and 10.3% in 2014, Qatar is already ranked as the
country with the highest growth rate in the non-oil sector
in the region. Further, Qatar's policy to diversify its
economy toward the non-hydrocarbon sector is expected
to get a huge boost with the opening of three economic
zones in 2016-2017. These economic zones will be mainly
dedicated to start-ups, innovations, and SMEs in the non-
hydrocarbon sectors.
Figure 76: Growth in real GDP growth (percentage points)
Source: GSDP estimates based on QSA release dated 29 April 2013
As seen in Fig 77, the services sector, the largest
contributor to growth in 2013 and 2014, is expected to
expand by 10.0% in 2013 and 10.1% in 2014. Further,
construction activity will also be an important driver of
real growth in the non-hydrocarbon economy, and is
forecast to expand by 10.5% in 2013, accelerating to
12.1% in 2014. Private construction activity, which is
centered on residential and commercial buildings,
including new malls, hotels and labor accommodation
throughout Qatar, will also fuel growth. GSDP estimates
total investment spending on infrastructure from 2013 to
2018 at USD 158.9 billion.
Figure 77: Sectoral growth in the economy, constant 2010 prices
Source: GSDP estimates based on QSA release dated 29 April 2013
Domestic credit growth slows amid real estate exposure
As the QAR is pegged to the USD, the central bank
cannot keep a large gap with US rates without inviting
capital inflows. In August 2011, QCB cut its lending rate
by 50 bps to boost private sector credit. This led to a 30-
6.2%
5.2% 5.2%5.5%
5.8% 5.8%
4.0%
4.5%
5.0%
5.5%
6.0%
6.5%
2012 A 2013 F 2014 F 2015 F 2016 F 2017 F
GD
P G
row
th R
ate
(%)
0.0%
5.0%
10.0%
15.0%
20.0%
25.0%
30.0%
2009 2010 2011 2012 Q1-13
Hydrocarbon Non-Hydrocarbon Real GDP
(5.0)
-
5.0
10.0
15.0
20.0
2009 2010 2011 2012 2013 E 2014 E
in P
erce
nta
ge
Po
ints
Hydrocarbons Services Construction Others
-4.0%
0.0%
4.0%
8.0%
12.0%
16.0%
Agriculture Oil and Gas Construction Other industries
Services
2013 E 2014 E

month high of 22% y-o-y private sector credit growth in
November 2011, before averaging to 16% in 2012 and
15% y-o-y in H1 2013. Meanwhile, credit growth to the
public sector slowed to 18% y-o-y in June, after averaging
58% y-o-y in 2012.
Figure 78: Credit distribution in the economy, June 2013
Source: Qatar Central Bank, Quarterly Statistical Bulletin, June 2013
While real estate accounted for 40% of the total private
lending in 2012, in H1 2013, it already accounts for ~36%.
Although this is not a cause for immediate concern, given
the rising demand due to population and income growth,
it might lead to a property bubble in the coming years.
Further, real estate loans will be increasingly directed to
infrastructure developments for the World Cup in 2022.
Nevertheless, the banking system is well capitalized, with
the lowest non-performing loan ratio in the region. Qatar
will maintain its support for the banking system, retaining
substantial equity stakes in domestic banks.
Real estate recovery fuels inflation
Qatar’s average inflation in Q2 2013 increased to 3.5% y-
o-y, partly due to increasing residential prices. EIU
forecasts an average inflation of 3.5% in 2013 and expects
it to increase further to an average of 4.8% in 2014-17 on
the back of improved liquidity, increasing population, a
pickup in projects market ahead of the World Cup, and
strengthening of the housing market.
Figure 79: Consumer Price Inflation Index
Source: Central Bank of Qatar, June 2013
Real Estate Sector
Realty lending slows in H1 2013
The Qatari banking sector, initially hesitant about funding
the realty segment, gradually improved its exposure
because of the government’s capital expenditure plans to
improve infrastructure for the 2022 FIFA World Cup. As
per QCB, total lending to the sector picked up in 2010,
with Qatar winning the World Cup bid. Since then,
lending activities have increased, with total banking
exposure to the sector reaching QAR 102.1 billion in
2012, a ~23% CAGR over 2007–2012. However, in 2013,
credit growth declined, reporting a 4.6% fall in H1 2013
from 2012 end to reach QAR 97.5 billion at end-June.
Also, real estate credit (REC) to total domestic credit
(TDC) declined to 19.6% from 21.4% in end-2012. This
is partly due to the slowdown in credit facilities to the
public sector. Further, realty lending volumes declined in
H1 2013 as there were fewer projects awarded and due to
delays in tendering of few infrastructure-linked projects.
Standard & Poor’s estimated that the loan growth will
decelerate to about 15% this year and onwards, as Qatari
banks face risks from exposure to real estate.
Figure 80: Credit Facilities by Qatar Banks
Source: Central Bank of Qatar, June 2013
Mega projects pipeline boosts realty sector
The realty sector, after a prolonged lull between 2009 and
2011, is witnessing a boom. Transaction value reached
QAR 41.3 billon in 2012, a 57% y-o-y increase and land
prices near the existing/planned projects observed a sharp
rise. Despite this, 2013 recorded a sluggish start with
lower transaction values compared to 2012 averages. The
total transaction value during H1 2013 was QAR 21.6
billion, down 8% from QAR 23.5 billion in H1 2012.
Figure 81: Value of Transactions
Source: Ministry of Justice (MOJ)
However, leading market players have expressed hope
that Qatar’s property market is set to rebound in the
second half of 2013, when some of the key World Cup-
related projects, such as Barwa’s USD 5.5 billion worth
island project off the coast of Doha that would include
luxury villas and a water park, are expected to be launched.
As per Zawya, the construction market in Qatar is valued
at around USD 240 billion, of which 41% of the projects
(in terms of number of projects) pertain to realty.
Public Sector42%
Real Estate15%Consumption
14%
Services9%
General Trade6%
Contractors3%
Industy & others3%
Outside Qatar8%
108.5 108.9 108.9 109.5 109.8 110.2 111.4 112.4 113.5 114.1
128.3 129.4 128.8 131.0 132.5 134.2 135.2 134.9 136.0 137.4
89.5 88.6 86.7 84.8 84.2 83.6 84.1 86.3 88.3 89.0
80
90
100
110
120
130
140
150
Q1
2011
Q2
2011
Q3
2011
Q4
2011
Q1
2012
Q2
2012
Q3
2012
Q4
2012
Q1
2013
Q2
2013
Co
nsu
mer
Pri
ceIn
dex
CPI Food, beverages & Tobacco Rent, utilities & housing service
20.3%21.2%
23.6%24.5%
21.4%
19.6%
15%
17%
19%
21%
23%
25%
27%
0
100
200
300
400
500
600
2008 2009 2010 2011 2012 H1 2013
(in
QA
R b
n)
REC (LHS) Non REC (LHS) REC to TDC (RHS)
5.3
8.4
5.1
7.6
13.3
10.2
7.8
10.0 8.9
12.7
0
2
4
6
8
10
12
14
Q1 2011
Q2 2011
Q3 2011
Q4 2011
Q1 2012
Q2 2012
Q3 2012
Q4 2012
Q1 2013
Q2 2013
Tra
nsa
ctio
n V
alue
(QA
R b
n)

Figure 82: Sector Share of Ongoing RE and Infrastructure Projects
(% of total number) (% of USD value)
Source: Ministry of Justice (MOJ)
The onset of the boom promises prosperity for the
country, but experts warn that it could lead to increase in
house rents, which are already showing signs of an
upswing. Land prices increased by 50% in 2012, while the
asking price (property price before any negotiation), a key
indicator of the real estate market, increased by 5–10% in
Doha and its suburbs. The prices are likely to shoot up
further by end-2013 or 2014 when Qatar's flagship
projects, such as Lusail City, Oryx Island, Gulf Resort, are
likely to begin construction, leading to a heavy influx of
foreign workers and their families. With this, the demand
for housing is likely to go up as the population would
increase beyond 2 million from the current 1.9 million.
Currently, the housing market is undersupplied, but the
situation might reverse by the year-end, which may push
up the rents. Meanwhile, QSA commented that the
chances of a repeat of the home rentals peaking (as
witnessed during 2006-08) are remote.
Figure 83: Completed Real Estate & Infrastructure Projects/Year
Source: Zawya
Realty sector may be oversupplied post World Cup 2022
Qatar is investing heavily in its infrastructure to prepare
itself for one of the world’s grandest sporting events. The
strong growth in public spending is expected to help the
country create new jobs and diversify the economy. In
addition, it will push up realty sector growth, especially in
Doha, as the expected increase in tourist inflow will help
improve demand for hospitality space as well as the retail
space. However, some sections of the industry are
questioning the long-term viability of these investments.
The real estate market in Doha is growing rapidly, with
massive developments to be delivered over the next 10
years. According to CBRE, in the next five years, Doha’s
residential stock levels will rise by 25%, total office
inventory will grow by 50%, and hotel and hotel
apartment supply will double. From a current stock of
one million sqm of GLA, Doha’s retail space will also
double by 2017. However, this development is focused
only on the upcoming one big sport event rather than
long-term goals and requirements. The feasibility of some
projects is already under question due to construction
delays (due to material shortages and escalating
construction costs) and anticipated oversupply situations.
There are concerns that after the World Cup event, the
country may face a sharp fall in the demand of these
properties and lead to a significant oversupply situation.
These concerns underscore a high need to look at
alternate ways to increase demand after the event.
Residential Sector
Qatar residential property demand on rise
Qatar’s residential real estate market, especially Doha, is
going through acute housing shortages. This is mainly due
to the increasing arrivals of expatriate population. Data
released by the Qatar Statistics Authority reflect that in
H1 2013 alone, ~130,000 new recruits arrived in Qatar,
taking the population to 1.92 million from 1.83 million by
end-2012. As more and more foreign workers arrive in
the country to engage in development projects being
launched for the 2022 FIFA World Cup, this unplanned
population growth is expected to cross the two million-
mark by the end of 2013. This in turn will result in
pressure on housing and send the rents spiraling up.
Figure 84: Cumulative Residential Supply Estimates in Doha
Source: Colliers International
According to the 2010 census, Doha’s residential market
comprised 23,185 villas and 74,370 apartments. As per
government projections, additional 60,000 units will be
completed by 2020. The increase in population is likely to
be followed by a similar growth rate in demand for
accommodation facilities. As Doha is the business capital
of the country, its population is likely to grow at a higher
rate than that across Qatar. Collier estimates that the
demand will be stronger than the supply. It estimates the
residential demand in Qatar to reach 242,000 units by
2017, against the supply of 1,38,235 units by 2017 (fig 84).
Doha’s residential real estate market is expected to
experience strong demand over the short to medium term
as the economic and population growth continues.
Population rise to push up rent and sale price
In the last six months, sales prices remained relatively
stable with a few localities recording an appreciation of 3-
5%. According to Al Asmakh, the Pearl continues to be a
preferable location for external retail investors. It stated
Infrastructure59%
Real estate41%
Infrastructure71%
Real estate29%
29.5
11.5
41.0
24.5
47.0
9.1 7.3
43.0
-
25
50
75
100
125
0
10
20
30
40
50
2013 2014 2015 2016 2017 2018 2019 2020
in U
SD
bn
Value of Completed Infrastructure Projects/Year (LHS)Value of Completed Real Estate Projects/Year (LHS)Number of Completed Real Estate & Infrastructure Projects/Year (RHS)
-
20,000
40,000
60,000
80,000
1,00,000
1,20,000
1,40,000
1,60,000
2010 2011 2012 2013E 2014E 2015E 2016E 2017E
No
. of
Un
its

that areas such as Al Sadd, Bin Mahmoud, and Al Nasr
may fetch equal demand due to accessibility and usufruct
status (right in a property owned by another, normally for
a limited time or until death).
Table 27: Monthly Residential Rents in Qatar – H1 2013
Area 1 BR FF Apt 2 BR FF Apt 3 BR FF Apt
Al Muntazah 3,000-4,250 4,250-6,500 6,250-7,000
Najma 3,000-4,250 4,250-6,000 6,000-7,000
Bin Mahmoud 3,750-4,750 4,750-7,000 6,500-8,500
Al Maamoura 4,250-4,750 5,250-6,250 6,250-7,000
Bin Omran 4,250-4,750 5,000-6,500 6,250-7,000
Al Sadd 4,250-6,000 5,250-7,750 6,500-8,750
Old Airport 4,500-5,000 6,250-7,000 6,250-7,250
West Bay / Dafna 6,500-8,500 8,500-11,500 12,000-15,000
Pearl Qatar 9,000-11,000 12,000-16,000 15,000-19,000
Source: Amar Finance Research
In the meantime, rental prices have surged in the last six
months. This rise was observed in both apartment and
villa segments across Doha and in secondary areas. Many
companies have been relocating their employees to nearby
areas such as Al Wakra, Al Aziziyah, and Umm Salal
because of increasing rentals in Doha. Additionally, these
locations are favorable because of its better connectivity
to the city center areas and growth of local shopping
complexes. The overall outlook for the residential market
within Doha city limits looks stable. However, with the
expected rise in population, there may be an upward
pressure on the outright sales and rentals.
Table 28: Monthly Rents of Villas in Qatar – H1 2013
Area 3 BR FF Apt
Al Dafna 14,500-20,750
Al Waab 12000-17,000
Al Hilal 10,750-13,750
Abu Hamour 11,000-14,000
Ain Khaled 10,250-13,750
West Bay 22,000-24,000
West Bay Lagoon 19,000-31,000
Al Gharrafa 9,500-13,250
Al Khraytiyat 8500-11,000
Source: Amar Finance Research
Commercial Sector
Strong prospects for office space
The office sector of Qatar underwent spectacular changes
in the last ten years. This change was backed by the
growing importance of West Bay which started gaining
importance after government moved public departments
to this area. Apart from the public sector, financial and
professional services companies are also seeking new
office spaces. The recent decision by the government to
relocate commercial units from residential localities has
resulted in increased demand for office spaces. As stated
by Colliers, in 2012, Doha’s Grade A office space reached
2.2 million sqm net leasable area, with West Bay
comprising majority of the space. It is expected to grow at
a CAGR of 9% and reach 2.6 million sqm by 2017 (Fig
85).
The Doha office market, with current vacancy levels of
29%, remains largely in favor of occupiers due to the
oversupply of office space and the on-going completion
of space. However, there is a mismatch between occupier
requirements in the market and supply. Prime and Grade
A space in smaller sizes remains scarce, which has pushed
rents in the prime area of the West Bay up to QAR 200-
250/sqm per month. Office space available within the
Diplomatic District is usually limited to large floor plates
and, as a result, most occupiers in this area are large
corporate offices of the oil and gas sector. Nevertheless,
availability is still as high as 60%. Grade B office space,
with rents of 110-150/sqm per month and the office
space of less than 500 sqm, continues to dominate the
Doha market in terms of provision and demand. As a
result, its availability is low and estimated at around 15%.
In the short term, activity in the office market is likely to
increase as preparations for the FIFA World Cup 2022
and strong economic growth might attract more foreign
investors and tenants, creating additional demand for
office space in Doha.
Table 29: Average Monthly Rents for Office Space – H1 2013
Area QAR per sq m per month
West Bay 200-250
A Ring Road 110-125
C Ring Road 135-140
D Ring Road 115-130
Old Doha 105-125
Airport Road 140-145
Salwa Road 80-100
Source: Amar Finance Research
According to Colliers estimates, the demand for Grade A
office space in Doha is likely to reach 1.9 million sqm by
the end of 2013. The demand for office space is expected
to rise with the increase in white collar workers.
Considering the growth numbers projected by various
analysts, Colliers estimated cumulative office demand to
reach 2.7 million sqm by 2017. Given the demographic
characteristics, with the majority of the labor force in the
age bracket of 20-30, there will be a major focus on
flexibility in design and more open/social office spaces.
Figure 85: Cumulative Grade A Office Supply Estimates
Source: Colliers International
-
5,00,000
10,00,000
15,00,000
20,00,000
25,00,000
30,00,000
35,00,000
40,00,000
2010 2011 2012 2013E 2014E 2015E 2016E 2017E
sqm
/ N
et L
easa
ble
Are
a

Retail space to witness high growth potential in the short to medium term
The global economic downturn has certainly had negative
effects to the spending power and consumer confidence,
however, Qatar has been less severely affected for two
reasons. First, the retail market in Qatar is less dependent
on tourists, and is supported by the strong spending
power of Qatari nationals. Secondly, Qatar has always
maintained a high GDP per capita income. Globally, it
had the highest GDP per capita in 2010 and in 2011 it
secured the second position. The IMF anticipates that the
country will continue to occupy its second ranking until
2016, and this directly supports the retail demand. Further,
61% of the Qatari residents are under the age of 35, and
this set of population has a higher propensity to consume.
They are the main contributors to demand.
Figure 86: Retail Demand Drivers
Source: Colliers International
Due to higher demand for organized retail, construction
activities of several malls have been restarted. Ezdan Mall,
with 40,000 sqm of GLA, was initially scheduled to open
in 2012 but was delayed until 2013. Also, Gulf Mall with
80,000 sqm GLA, was initially scheduled for 2012, but
delayed to 2013. Meanwhile, in its Q2 2013 report,
Colliers revealed that organized retail space in Doha
reached 504,000 sqm of GLA by end-2012. Doha City
Centre, Villagio, and Porto Arabia alone accounted for
65% of total retail supply. Provided construction plans are
completed, an additional supply of 1.48 million sqm of
GLA is likely to enter the market between 2013 and 2020,
indicating an increase of 294% from the current supply.
Figure 87: Estimated Demand for Organized Retail Space
Source: Colliers International
The International Council of Shopping Centers (ICSC)
has issued a guideline suggesting that developed nations
can absorb a supply of 1.1 sqm GLA per head of
population for organized retail space. In line with this
international benchmark, Colliers estimates the demand
for organized retail space to reach ~986,000 sqm /GLA
in 2013 and 1.1 million sqm /GLA in 2017. Qatar’s
relatively high demand for retail space is currently
sustained by its high per capita income. Tanween’s Q1
2013 report projected the asking rental rates in some
upcoming malls in Qatar to increase by 20-30% in the
coming year compared with the existing rates, indicating a
bullish market outlook.
Figure 88: Cumulative Total (organized and unorganized) Retail
Supply Estimates
Source: Colliers International
Qatar continues to lead in hospitality growth
Qatar continues to be one of the fastest growing tourism
destinations in the GCC, resulting in a sharp rise in the
hospitality space. Last year, according to media reports,
Qatar topped the GCC region with 110 new hotels under
construction. The number of hotel rooms in the country
has already crossed the 10,000-mark, standing at 13,407 in
2012. While it has already gained popularity as a local hub
for business tourism, the country also strives to establish
itself as a leisure destination, backed by massive spending
plans in the context of preparations for hosting the World
Cup in 2022. Qatar Tourism Authority (QTA) revealed
that the hotel occupancy rate was 58% in 2012, a slight
fall of 3% against 2011. Occupancy levels reached 67% in
H1 2013, indicating a rebound.
As per the World Travel and Tourism Council, the direct
contribution of travel and tourism to Qatar’s GDP
reached QAR 12.4 billion (1.8% of total GDP) in 2012. It
is forecast to rise by 7.1% in 2013 and at a CAGR of 4%
from 2012 to 2023, one year after the World Cup. Qatar
had earlier stated that it aimed to attract high-income
tourists focusing on business travel and high-end luxury
vacations. However, a new strategy of “diversification”
seems to be underway, which aims to entertain a range of
tourism facilities and activities as well as hotel
accommodation. In addition, the government intends to
involve the private sector in the process, especially when
it comes to developing leisure tourism, where the
government would be the strategy designer without
necessarily owning, or being the developer itself.
Retail Demand
Residents
Tourists
Disposable Income Levels
Consumer Confidence
Population
Benchmark Retail Space per capita
Cumulative demand
estimated at 1.1 mm sqm (2017)
-
2,00,000
4,00,000
6,00,000
8,00,000
10,00,000
12,00,000
14,00,000
2010 2011 2012 2013E 2014E 2015E 2016E 2017E
sqm
/ N
et L
easa
ble
Are
a

The QTA targets to achieve a growth rate of 20% over
the next five years. Along with the awaited USD 15.5
billion new Doha International Airport, an expansion in
hotel capacity is on track. After completion, the airport
will have an estimated capacity to handle 50 million
passengers and 320,000 planes per year. Its prospective
opening will bring more transit passengers to Qatar,
encouraging transit travelers to enjoy the country’s tourist
attractions. To meet FIFA’s projected requirements of
60,000 hotel rooms, Qatar has 21 new upcoming hotels in
the next five years that will add 45,000 additional rooms
to its existing capacity.
With a large pipeline of new projects to be delivered in
the coming years, Qatar’s hotel sector will continue to
experience challenging conditions in the near future.
Major Projects
Table 30 lists the major ongoing construction projects in
Qatar.
Table 30: Major Projects
Project Name Type Value (USD billion)
Status
LREDC - Lusail City Community Development
5.5 Ongoing
Msheireb Properties – Msheireb
Community Development
5.5 Ongoing
Qatar CAA - Space City Establishment Education
3.3 Ongoing
QFA - 2022 Stadiums Leisure & Entertainment
3.1 Ongoing
ADIH - Qatar Entertainment City
Community Development
3.0 Ongoing
GFH - Energy City Qatar - Phase 1
Commercial 2.6 Ongoing
Qatar Foundation - Sidra Medical and Research Center Healthcare
2.3 Ongoing
Barwa Real Estate Company - Ain Khalid Commercial Avenue
Mixed Development
1.7 Ongoing
Bawabat Al Shamal - Doha Festival City
Retail, Leisure & Entertainment
1.7 Ongoing
Msheireb Properties - Msheireb - Phase 1
Mixed Development
1.6 Ongoing
Bawabat Al Shamal - Doha Festival City - Phase 2
Retail, Leisure & Entertainment
1.6 Ongoing
ADIH - Qatar Entertainment City - Downtown
Mixed Development
1.5 Ongoing
Barwa Real Estate Company - Barwa City
Residential 1.4 Ongoing
Barwa Real Estate Company - Barwa Financial District
Commercial 1.4 Ongoing
Barwa Real Estate Company - Barwa Al Baraha
Residential 1.1 Ongoing
Source: Zawya

Sharq Area, Ahmed Al-Jaber St., Al-Bodour Tower P.O. Box: 28776 Safat, 13148 Kuwait
Tel: +965 1826050 - Fax: +965 22473507 www.amarfinance.com