Herniation pits and cystic-appearing lesions at the anterior femoral neck: an anatomical study by...
10
SCIENTIFIC ARTICLE Herniation pits and cystic-appearing lesions at the anterior femoral neck: an anatomical study by MSCT and μCT Stephanie Panzer & Ulrich Esch & Ahmed Nabil Abdulazim & Peter Augat Received: 14 June 2009 / Revised: 2 August 2009 / Accepted: 20 August 2009 # ISS 2009 Abstract Objective To determine distinguishing features between herniation pits (HPs) and other cystic-appearing lesions at the anterior femoral neck in multi-slice computed tomography (MSCT) and micro-computed tomography (microCT) examinations. Materials and methods Institutional review board approval was obtained to examine 37 proximal femora of 23 cadaveric specimens (mean age available in 19 cadavers, 83 years; range 68–100 years; 9 female, 8 male, 6 unknown). All 37 femora were investigated by MSCT. 23 femora, which revealed cystic-appearing lesions at the anterior femoral neck in MSCT examinations, were additionally examined by microCT. Cystic-appearing lesions were categorized by their location, sclerotic margin, demarcation and shape in MSCT with assessment of inter- observer agreement. Detailed cortical and trabecular properties were evaluated in microCT examinations. Results There were seven HPs in three femora. There were a number of abnormalities potentially imitating HPs, including focal osteoporosis (13 in 13 femora), degenera- tive changes (5 in 4 femora) and trabecular restructuring (5 in 4 femora) at the anterior femoral neck. HPs were differentiated on the basis of their subchondral/subcortical location, completely surrounding sclerosis, clear demarca- tion and round-to-oval shape in MSCT. Because of their location and their microscopic appearance, HPs seem to resemble intra-osseous ganglia at the anterior femoral neck. Conclusion HPs have to be differentiated from other cystic appearing lesions at the anterior femoral neck to avoid overestimation of their incidence in the context of diagnosis of femoroacetabular impingement. Keywords Spiral computed tomography . Bone cysts . Ganglion cyst . Femur neck . Hip joint Introduction Herniation pits (HPs) of the femoral neck were first described by Pitt et al. in 1982 [1]. He described them as well delineated, round-to-oval radiolucencies in the proxi- mal superior quadrant of the femoral neck, just beneath the anterior cortex. He further suggested that these cavities are formed by herniation of soft tissues through erosions or perforations [2], created by abrasive action of the overlying hip capsule. In contrast to earlier publications, in which HPs were generally recognized as an incidental finding [1, 3], in current literature they are mentioned in the context of femoro-acetabular impingement (FAI) [4–9] and are dis- cussed as a possible radiographic indicator for FAI [4, 9]. Because FAI leads to premature osteoarthritis of the hip S. Panzer (*) : U. Esch Department of Radiology, Trauma Center Murnau, Prof.-Küntscher-Strasse 8, 82418 Murnau, Germany e-mail: [email protected] U. Esch e-mail: [email protected] A. N. Abdulazim : P. Augat Biomechanics Laboratory, Paracelsus University Salzburg and Trauma Center Murnau, Prof.-Küntscher-Strasse 8, 82418 Murnau, Germany A. N. Abdulazim e-mail: [email protected] P. Augat e-mail: [email protected] Skeletal Radiol DOI 10.1007/s00256-009-0792-9
-
Upload
independent -
Category
Documents
-
view
0 -
download
0
Transcript of Herniation pits and cystic-appearing lesions at the anterior femoral neck: an anatomical study by...

SCIENTIFIC ARTICLE
Herniation pits and cystic-appearing lesions at the anteriorfemoral neck: an anatomical study by MSCT and µCT
Stephanie Panzer & Ulrich Esch &
Ahmed Nabil Abdulazim & Peter Augat
Received: 14 June 2009 /Revised: 2 August 2009 /Accepted: 20 August 2009# ISS 2009
AbstractObjective To determine distinguishing features betweenherniation pits (HPs) and other cystic-appearing lesions atthe anterior femoral neck in multi-slice computed tomography(MSCT) and micro-computed tomography (microCT)examinations.Materials and methods Institutional review board approvalwas obtained to examine 37 proximal femora of 23cadaveric specimens (mean age available in 19 cadavers,83 years; range 68–100 years; 9 female, 8 male, 6unknown). All 37 femora were investigated by MSCT. 23femora, which revealed cystic-appearing lesions at theanterior femoral neck in MSCT examinations, wereadditionally examined by microCT. Cystic-appearinglesions were categorized by their location, sclerotic margin,demarcation and shape in MSCT with assessment of inter-observer agreement. Detailed cortical and trabecularproperties were evaluated in microCT examinations.
Results There were seven HPs in three femora. There werea number of abnormalities potentially imitating HPs,including focal osteoporosis (13 in 13 femora), degenera-tive changes (5 in 4 femora) and trabecular restructuring(5 in 4 femora) at the anterior femoral neck. HPs weredifferentiated on the basis of their subchondral/subcorticallocation, completely surrounding sclerosis, clear demarca-tion and round-to-oval shape in MSCT. Because of theirlocation and their microscopic appearance, HPs seem toresemble intra-osseous ganglia at the anterior femoral neck.Conclusion HPs have to be differentiated from other cysticappearing lesions at the anterior femoral neck to avoidoverestimation of their incidence in the context of diagnosisof femoroacetabular impingement.
Keywords Spiral computed tomography . Bone cysts .
Ganglion cyst . Femur neck . Hip joint
Introduction
Herniation pits (HPs) of the femoral neck were firstdescribed by Pitt et al. in 1982 [1]. He described them aswell delineated, round-to-oval radiolucencies in the proxi-mal superior quadrant of the femoral neck, just beneath theanterior cortex. He further suggested that these cavities areformed by herniation of soft tissues through erosions orperforations [2], created by abrasive action of the overlyinghip capsule.
In contrast to earlier publications, in which HPs weregenerally recognized as an incidental finding [1, 3], incurrent literature they are mentioned in the context offemoro-acetabular impingement (FAI) [4–9] and are dis-cussed as a possible radiographic indicator for FAI [4, 9].Because FAI leads to premature osteoarthritis of the hip
S. Panzer (*) :U. EschDepartment of Radiology, Trauma Center Murnau,Prof.-Küntscher-Strasse 8,82418 Murnau, Germanye-mail: [email protected]
U. Esche-mail: [email protected]
A. N. Abdulazim : P. AugatBiomechanics Laboratory,Paracelsus University Salzburg and Trauma Center Murnau,Prof.-Küntscher-Strasse 8,82418 Murnau, Germany
A. N. Abdulazime-mail: [email protected]
P. Augate-mail: [email protected]
Skeletal RadiolDOI 10.1007/s00256-009-0792-9

[9–11], recognition and consideration of HPs are gainingincreasing clinical relevance.
Advanced high spatial resolution of multi-slice computedtomography (MSCT) in routine skeletal diagnostic imagingincreasingly depicts osseous lesions and disturbances oftrabecular architecture in the anterior part of the femoral neck.However, not all of these lesions are necessarily HPs. Theymay also result from focal osteoporosis, degenerative changesor subchondral cysts [12–18]. Because of their potentialclinical relevance, it is essential to differentiate HPs fromother cystic-appearing lesions in MSCT.
Micro-computed tomography (microCT) is a non-invasive method to study bone architecture at a microscopiclevel providing three dimensional (3D) images, which canbe easily explored in various planes [19]. Since its firstdescription as a tool for the direct analysis of 3D trabecularbone structure in 1989 [19], continuing improvements inscan resolution allows 3D analysis with quantifying aspectsin trabecular and cortical bone [20, 21].
The aim of our study was to identify and classify allosseous lesions at the anterior femoral neck with MSCT asa clinically relevant diagnostic tool. The MSCT basedclassification was then verified using high resolutionmicroCT imaging of each individual lesion.
Material and methods
Institutional review board approval was obtained to investi-gate proximal femora of cadavers from the anatomicaldissecting room. Thirty-seven proximal femora withoutfracture or prosthesis from 23 cadavers were used. Informa-tion about age was available in 19 cadavers (mean age83 years; range 68–100 years). Nine of these specimens wereknown to be male and eight were known to be female.
MSCT (LightSpeed VCT (64 detector rows), GeneralElectrics, Milwaukee) was performed on all 37 femora witha slice thickness of 0.625 mm, interval of 0.625 mm, pitchof 0.984, 120 kV and 100 mA in bone algorithm, similar toa clinical set of scan parameters. Those femora thatrevealed any osseous lesions were further analyzed bymicroCT imaging. MicroCT (µCT 80 ScancoMedicalBassersdorf, Switzerland) scans of the head and femoralneck were performed with a slice thickness of 50 μm, sliceincrement of 50 μm, 70 kV, 114 μA and integration time of200 ms in cone-beam mode.
MSCT data sets were analyzed on the PACS-basedinterface (J-Vision, Tiani PACS Software, Vienna, Austria)of the CT workstation. Multi-planar reconstructions withslice thickness of 0.625 mm were created in a paraxialplane (parallel to the axis of the femoral neck), a para-coronal plane (perpendicular to the paraxial plane, parallelto the axis of the femoral neck) and a parasagittal plane
(perpendicular to the paraxial plane through the axis of thefemoral neck). All femora were examined for the occur-rence of any osseous lesions. Each individual lesion wasclassified using the scheme in Fig. 1 according to well-known descriptions from the literature.
In order to characterize the osseous lesions, the followingcriteria were applied:
– Existence and degree of marginating sclerosis (complete,partial, none)
– Demarcation (clear, not clear) in all three reconstructionplanes
– Shape (round/oval, long, wedge-shaped)– Cortical breaks
The location of each lesion was classified in theparasagittal plane, in which the anterior, almost semicir-cular half of the femoral neck was subdivided into sixequal portions between superior and inferior (inferiordefined as 6 o’clock, anterior as 9 o’clock, superior as12 o’clock).
MicroCT examinations were evaluated on the work-station (Image Processing Language, ScancoMedical AG,Switzerland) using the parasagittal slices. Additional 3Dmodels with sectional planes through each lesion weregenerated. Each individual osseous lesion was analyzedfor their trabecular and cortical features. The maximalantero-posterior, medio-lateral, and cranio-caudal diame-ter of the lesion, the maximal thickness of the margin-
Osseouslesion
Femoral neck Femoral head
Subchondra/subcortical
Inside newbone formation
Herniationpit
Focalosteoporosis
Trabecularrestructuring
Degenerativechanges
Subchondralcyst
Subchondral
Completelysurrounding
sclerosis
Cleardemarcation
None/partiallysurrounding
sclerosis
None/partialdemarcation
Partiallysurrounding
sclerosis
Partialdemarcation
Fig. 1 Diagram illustrating steps of categorization of osseous lesionsin MSCT scans. Subchondral cysts were defined by their localizationat the femoral head [12–18]. Degenerative lesions were differentiatedby their location within new bone formation [12–15]. HPs werecharacterized by their completely surrounding sclerosis and cleardemarcation [1, 22, 23], while focal osteoporosis was characterized bynone or partial surrounding sclerosis and predominantly missingdemarcation [12]
Skeletal Radiol

ating sclerosis, the minimal and maximal thickness of theoverlying cortex, and the maximal contact length of thelumina of the cystic lesion and the overlying cortical linewere measured
The following characterization criteria were applied:
– Existence and degree of marginating sclerosis (complete,partial, none)
– Demarcation of the lesion in the three orientations(clear, not clear)
– Communication of the lesion’s lumen with adjacentvoids (yes, no)
– Communication between neighbouring lumina (yes, no)– Content (trabeculae, bony fragments)– Porosity of the cortical structures overlying the lesion
(yes, no)– Cortical breaks in the overlying cortex (number,
maximal width)
MSCT and microCT examinations were analyzed byone senior radiologist with 10 years of experience andemphasis on musculoskeletal radiology. Independentreading of MSCT examinations was performed by thechief radiologist of the department with emphasis on
Table 1 MSCT characteristics of cystic-appearing lesions at the anterior femoral neck. Data presented as percentages
Osseous lesions
Femoral neck Femoral head
Herniation pits Focal osteoporosis Trabecular restructuring Degenerative changes Subchondral cystsn=7 n=13 n=5 n=5 n=3
Location
Subchondral/subcortical 100% 100% 100% 100%
Inside new bone formation 100%
7–8a 14% 20%
8–9a 29% 55% 20% 33%
9–10a 57% 38% 20% 40%
10–11a 8% 40% 40%
11–12a 20% 67%
Sclerosis
Complete 100% 100% 100%
Partial 62% 100%
None 38%
Demarcation
Paraaxial 100% 31% 40% 60% 100%
Parasagittal 100% 31% 20% 20% 100%
Paracoronal 100% 0% 20% 20% 100%
Shape
Paraaxial
Round/oval 100% 70% 100% 20% 100%
Long 80%
Wedge-shaped 30%
Parasagittal
Round/oval 100% 30% 40% 20% 100%
Long 40% 80%
Wedge-shaped 70% 20%
Paracoronal
Round/oval 100% 39% 80% 40% 100%
Long 15% 20% 60%
Wedge-shaped 46%
Cortical breaks 57% 38% 20% 60% 100%
a Sectors of the anterior half of the femoral neck respectively head, 12 = superior, 9 = anterior, 6 = inferior
Skeletal Radiol

musculoskeletal radiology for 22 years. Inter-observervariability was determined by calculating the percentageagreement for each classification.
Results
The MSCT scans revealed 30 osseous lesions at the anteriorfemoral neck and three osseous lesions at the femoral headin 23 femora (12 right femora, 11 left femora). Five femorashowed multiple lesions with varying characteristics. Themost profound features distinguishing between the differentcategories of osseous lesions were the location with respectto the subchondral interface, the degree of sclerosis and thedemarcation (Table 1). None of the femora showed anyevidence of malignant or benign bone tumors, metastases ortumor-like lesions. No signs of destruction or post-mortemdegeneration were observed resulting from the formalinfixation.
A total of seven lesions were categorized as HPs in threefemora, one femur containing two, one containing four
lesions. All HPs showed a completely surrounding scleroticmargin, round-to-oval in shape and clear demarcation in allreconstruction planes (Fig. 2a–c). A total of 13 subchon-dral/subcortical lesions were assigned as focal osteoporosis(Fig. 3a–c). They had none or only partially marginatingsclerosis which changed shape in different reconstructionplanes, and was predominantly missing demarcation. Fivesubchondral/subcortical lesions in four femora with partialsclerotic margin, partially changing shape in differentplanes and only partially clear demarcation could not beassigned as HPs or focal osteoporosis and were considerednonspecific trabecular restructuring (Fig. 4a–c). Lesionswhich resulted from a sclerotic double line or were locatedwithin appositional bone formation were assigned asdegenerative changes. They showed a surrounding scleroticmargin and round or oval-to-long shape and only partiallyclear demarcation (Fig. 5a–c). We found five of theselesions in four femora.
Apart from the lesions at the anterior femoral neck, wefound three subchondral cysts at the femoral head in twofemora. These lesions were characterized by a surrounding
Fig. 2 Multi-planar reconstructions of MSCT scans in the a paraxial,b parasagittal and c paracoronal direction show a HP subchondral/subcortical at the anterior femoral neck with round-to-oval shape,completely surrounding sclerosis and clear demarcation in all
reconstruction planes; more detailed illustration in the d parasagittalmicroCT scan and the e 3D reconstruction of the microCTexamination (arrow) with broad cortical defect and marginatingreactive bone formation
Skeletal Radiol

sclerotic margin, round-to-oval shape and clear demarcationin all reconstruction planes (Fig. 6a–c).
Evaluating the MSCT scans of all 37 femora indepen-dently, the second reader found no additional osseouslesions. Inter-observer reproducibility was 87.8%concerning the description of the sclerotic margin anddiffered between 78.8% (parasagittal), 93.9% (paracoro-nal) and 97.0% (paraxial) concerning the description ofshape in the three reconstruction planes. Inter-observerreproducibility was 100.0% in describing the demarca-tion and the presence of cortical breaks as well as indefining the lesions’ location. The assignment to the fivedifferent categories showed complete agreement betweenboth readers.
MicroCT examinations revealed more detailed andsometimes additional morphological information of cor-tical and spongy bone properties of the different lesions(Table 2). The HPs (Fig. 2d,e) were confirmed by theirappearance with clear demarcation of all lesions andcomplete surrounding sclerotic margin including thecortical and the subchondral lamella, respectively. In six
lesions a cortical break was present. All HPs revealedsmall bony fragments inside the lumen. Three lesionscontained trabeculae, predominantly in the periphery.MicroCT examinations did not reveal additional lesionswith characteristics of HPs.
Lesions categorized as focal osteoporosis in MSCT scansdiffered in their appearance in the microCT scans. All ofthem showed complete sclerosis, which was not apparenton the MSCT scans. Most of the lesions had cortical breaksand all lesions contained trabeculae.
Lesions in the category of trabecular restructuring(Fig. 4d,e) confirmed partial surrounding sclerosis in allcases. Clear demarcation was present in only one to threecases in different planes. Cortical breaks were not found inany lesion. Four lesions contained trabeculae and twolesions contained bony fragments.
Lesions categorized as degenerative changes (Fig. 5d,e)showed partial sclerosis in four cases, while one caseshowed no sclerosis at all, in contrast to the MSCTfindings. Clear demarcation in the three different planesvaried between three and four cases in the different planes.
Fig. 3 Multi-planar reconstructions of MSCT scans in the a paraxial,b parasagittal and c paracoronal direction show subchondral/subcortical focal osteoporosis at the anterior femoral neck withround-to-oval shape, only partial to no sclerotic margin and lack of
clear demarcation in the paraxial plane; more detailed illustration inthe d parasagittal microCT scan and the e 3D reconstruction of themicroCT examination (arrow) as area created by sparse or absenttrabeculae
Skeletal Radiol

Cortical breaks were found in all cases, ranging from one tofive in number. Three lesions contained trabeculae; how-ever, bony fragments were never found.
The subchondral cysts (Fig. 6d,e) only showed partialsclerosis in microCT examinations and demarcation was notclear in all planes. Cortical breaks existed in all cases,ranging from one to three in number. Subchondral cystscontained neither trabeculae nor any bony fragments.
All lesions demonstrated a connection of the lumina withthe voids of the adjacent spongy structures. Corticalporosity was observed in 79% of all lesions. The extent ofthe lesions’ contact to the cortical interface or thesubchondral lamella could not be used as a distinguishingfeature between categories.
Comparison of MSCT and microCT evaluationsrevealed that sclerosis was more prominent in MSCTthan in microCT. More than half of the completelysclerotic lesions in MSCT emerged as only partiallysclerotic lesion in the microCT investigations. Allpartially sclerotic focal osteoporosis lesions showed nosclerosis in microCT scans. Moreover, lesions represent-
ing focal osteoporosis, which were conspicuous inMSCT, were detectable in microCT, but not necessarilyconspicuous. Both phenomena were most likely relatedto partial volume effects in MSCT examinations despitehigh spatial resolution.
Discussion
In this study, we determined distinguishing featuresbetween herniation pits (HP) and other cystic lesions atthe anterior femoral neck utilizing multi-slice CT andmicroCT. Cystic lesions were divided into four differentcategories. Only seven out of a total of 30 cysticlesions demonstrated unambiguous signs of HPs whilethe majority of lesions were more likely to be asso-ciated with focal osteoporosis or degenerative changes.In the context of FAI diagnosis, in which HPs arediscussed as possible anatomical markers, their differ-entiation is important to avoid overestimation of theirincidence.
Fig. 4 Multi-planar reconstructions of MSCT scans in the a paraxial,b parasagittal and c paracoronal direction show subchondral/subcortical trabecular restructuring at the anterior femoral neck withoval-to-long shape, partially marginating sclerosis and lack of clear
demarcation in the paraxial and parasagittal plane; more detailedillustration in the d parasagittal microCT scan and the e 3Dreconstruction of the microCT examination (arrow) with incompletedemarcation and partial new bone formation
Skeletal Radiol
Lesions, which we classified as HPs in MSCT examina-tions, showed the typical characteristics of HPs as definedby Pitt et al. [1] and described in case reports [22, 23].These characteristics are a round-to-oval subcortical/subchondral radiolucency at the anterior femoral neckwith a sclerotic rim and sometimes cortical breaks. Theusual location is the superior quadrant of the anteriorfemoral neck, and a less frequent location the inferiorquadrant [23, 24].
To our knowledge, this is the first study using microCTfor the investigation of HPs. MicroCT evaluation depicteddetailed cortical and trabecular characteristics of HPs thatare normally restricted to histological examinations.Osseous characteristics of HPs have been previouslydescribed by histological examination [1, 4, 22, 23]. Thevarying presence and size of cortical breaks in the overlyingcortex of HPs [1, 23] is in accordance with our results.Increased cortical thickness in our specimens correspondsto reactive new bone formation in the cortex [1]. Reactivebone changes in the periphery [1] were observed as
surrounding sclerosis in all lesions defined as HPs. AllHPs in our specimens contained fragments of bone inside,as observed by Crabbe [22].
The size of HPs in our specimens was in accordancewith the definition of Pitt et al. [1], describing HPs ashaving less than 1 cm in maximum diameter. The minimumsize of HPs has been identified by Leunig et al. [4] withgreater than 3 mm in AP radiographs and Panzer et al. [24]with at least 2 mm in MSCT. The smallest diameter in ourcollective was 2.0 mm.
Based on their osseous characteristics, HPs could beclearly differentiated from focal osteoporosis withoutdiscrete margins and without reactive changes in theperiphery. Similar findings of focal osteoporosis deepwithin the femoral head were already observed by Resnicket al. [12]. In our study, focal osteoporosis was associatedwith the largest lesion size. However, the size of the lesionsdid not turn out to be a distinguishing feature. HPs alsocould be clearly distinguished from degenerative changescreated by osteophytic rims [12–15]. As described by
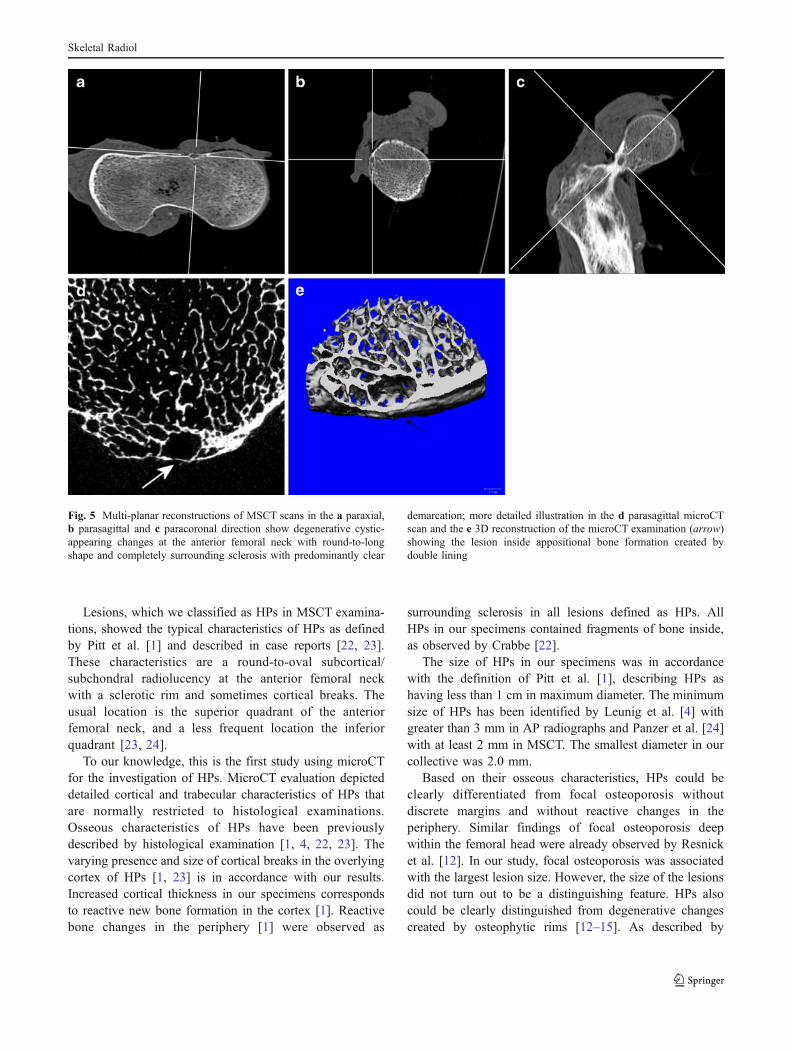
Fig. 5 Multi-planar reconstructions of MSCT scans in the a paraxial,b parasagittal and c paracoronal direction show degenerative cystic-appearing changes at the anterior femoral neck with round-to-longshape and completely surrounding sclerosis with predominantly clear
demarcation; more detailed illustration in the d parasagittal microCTscan and the e 3D reconstruction of the microCT examination (arrow)showing the lesion inside appositional bone formation created bydouble lining
Skeletal Radiol

Resnick et al. [12], these lesions often are spindle-shapedwith orientation along the paraxial plane.
The five lesions, which we termed trabecular restructur-ing, did not fulfil the criteria of HPs and did not correspondto focal osteoporosis or degenerative changes. We do notknow exactly what kind of trabecular disturbance theyrepresent. Possibly they constitute an early stage or anatypical feature of HPs.
Cortical porosity, defined by the presence of canalsinside the cortex, was observed in 79% of all lesions. Thesecanals consist of Haversian and Volkmann’s canals with adiameter in the order of 50 μm [25]. Therefore cleardifferentiation from cortical breaks was possible in ourmicroCT examinations.
Articular or juxta-articular cysts are in principledivided into two entities in the literature. One entityrepresents subchondral cysts, which we found in threecases. They occur within the pressure zone [12, 13, 16],are associated with osteoarthritis of the involved joint [12,14, 15, 17, 18], commonly show communication with the
articular cavity [12, 14, 18, 26] and reveal scleroticmargins [12]. The other entity corresponds to cysticdefects of bone not related to joint lesions and predominantlylabelled as intra-osseous ganglion [16]. Intra-osseousganglia appear in non-weight-bearing portions of the joint[18, 26], are located in close relationship to the articularcartilage [18, 27] and are not associated with degenerativechanges [18, 26, 27]. Histologically, the osseous tissueadjacent to intra-osseous ganglia was found to be scleroticwith thickened trabeculae as a consequence of activeremodelling [26].
Our categorization criteria (Fig. 1) allowed clear differ-entiation between HPs at the anterior femoral neck andsubchondral cysts at the weight-bearing zone of the femoralhead, despite showing very similar morphological criteria.However, it seems reasonable to suggest, that HPs representintra-osseous ganglia because of their location subcortically/subchondrally in the non-weight-bearing area and their cleardemarcation with sclerotic border and sometimes corticalbreaks. This assumption would also support the statement of
Fig. 6 Multi-planar reconstructions of MSCT scans in the a paraxial,b parasagittal and c paracoronal direction show a subchondral cyst atthe femoral head with round-to-oval shape, surrounding sclerosis andclear demarcation; more detailed illustration in the d parasagittal
microCT scan and the e 3D reconstruction of the microCTexamination (arrow) with cortical defect and marginating reactivebone formation
Skeletal Radiol

Leunig et al. [4]. In contrast to publications where intra-osseous ganglia have been reported to occur usually as singlelesions [18, 27], we found HPs with multiplicity.
There are study limitations to be considered. The numberof investigated femora was small. Four out of the sevenHPs that were found, occurred in one femur. The femora ofcadavers from the anatomical dissecting room represented apopulation with above-average age, which accounts for thefrequent osteoporotic changes. The study was based onosseous characteristics and did not provide information onadjacent soft tissue structures. The evaluation was nothypothesis based and therefore did not allow statisticalanalysis. In our study, MSCT was the clinically relevantmethod used to categorize of lesions, and microCT imagingwas performed for corroboration. For the evaluation ofosseous changes, which was the main topic of our study,
microCT seems to be comparable with histological exami-nations because of its high spatial resolution.
In conclusion, HPs have to be differentiated from othercystic-appearing lesions at the anterior femoral neck toavoid overestimation of their incidence in context with thediagnostic of FAI. The rule for how to identify a HP in MSCTis to search for a round-to-oval subcortical/subchondral lesionat the anterior femoral neck, which is clearly demarcated in allreconstruction planes by a completely surrounding scleroticmargin.
Acknowledgements The authors thank Prof. Dr. Reinhard Putz andProf. Dr. Magdalena Müller-Gerbl, Department of Anatomy, LMUMunich, Germany, for providing the anatomical specimens and JuliaKörber, Institute of Biomechanics, Trauma Center Murnau forproofreading of the manuscript.
Table 2 Micro-CT characteristics of cystic-appearing lesions at the anterior femoral neck. Data presented as percentages and mean values (range)in mm
Ossous lesions
Femoral neck Femoral head
Herniation pits Focal osteoporosis Trabecular restructuring Degenerative changes Subchondral cystsn=7 n=13 n=5 n=5 n=3
Sclerosis
Complete 86%
Partial 14% 100% 80% 100%
None 100% 20% (1/5)
Max. thickness in mm 0.60 (0.45–0.83) 0.73 (0.43–1.03) 0.42 (0.35–0.50) 0.41 (0.39–0.43)
Demarcation
Antero-posterior 100% 38% 60% 80% 33%
Medio-lateral 100% 23% 100% 60% 100%
Cranio-caudal 100% 15% 20% 60% 0%
Size in mm
Antero-posterior 3.73 (2.38–5.13) 4.84 (3.08–5.86) 4.92 (3.57–5.67) 3.13 (2.67–4.25) 2.40 (2.31–2.48)
Medio-lateral 3.66 (2.00–5.20) 4.79 (2.60–6.63) 3.58 (2.26–5.52) 3.54 (1.84–4.79) 2.32 (1.87–2.78)
Cranio-caudal 4.91 (3.25–7.35) 5.07 (2.60–6.05) 3.37 (2.10–5.45) 8.08 (4.35–1.10) 3.08 (2.65–3.50)
Cortical thickness in mm
Minimal 0.42 (0.21–0.63) 0.21 (0.11–0.36) 0.34 (0.20–0.67) 0.17 (0.11–0.25) 0.19 (0.11–0.25)
Maximal 0.74 (0.53–1.00) 0.55 (0.20–0.99) 0.75 (0.51–1.12) 0.43 (0.35–0.60) 0.42 (0.25–0.65)
Cortical breaks 86% 92% 0% 100% 100%
Number 0.86 (0–1) 3.15 (0–14) 2.00 (1–5) 1.67 (1–3)
Maximal width in mm 0.90 (0.10–1.47) 0.37 (0.07–2.00) 0.42 (0.07–1.20) 1.22 (1.08–1.42)
Cortical contact
Maximal in mm 2.85 (1.90–4.01) 3.12 (1.19–4.77) 2.18 (0.97–3.37) 2.84 (2.00–4.16) 2.08 (1.85–2.5)
Trabeculae 43% 100% 80% 60% 0%
Bony fragments 100% 15% 40% 0% 0%
Maximal length in mm 0.32 (0.10–0.65) 0.38 (0.10–0.65) 0.36 (0.36–0.36)
Maximal width in mm 0.25 (0.10–0.40) 0.13 (0.10–0.16) 0.11 (0.11–0.11)
Skeletal Radiol

References
1. Pitt MJ, Graham AR, Shipman JH, Birkby W. Herniation pit ofthe femoral neck. AJR. 1982;38:1115–21.
2. Angel JL. The reaction area of the femoral neck. Clin Orthop.1964;32:130–42.
3. Nokes SR, Vogler JB, Spritzer CE, Martinez S, Herfkens RJ.Herniation pits of the femoral neck: appearance at MR imaging.Radiology. 1989;172:231–4.
4. Leunig M, Beck M, Kalhor M, Kim YJ, Werlen S, Ganz R.Fibrocystic changes at anterosuperior femoral neck: prevalence inhips with femoroacetabular impingement. Radiology. 2005;236:237–46.
5. Pfirrmann CWA, Mengiardi B, Dora C, Kalberer F, Zanetti M,Hodler J. Cam and pincer femoroacetabular impingement: charac-teristic MR arthrographic findings in 50 patients. Radiology.2006;240(3):778–85.
6. Kassarjian A, Yoon LS, Belzile E, Connolly SA, Millis MB, PalmerWE. Triad of MR arthrographic findings in patients with cam-typefemoroacetabular impingement. Radiology. 2005;236:588–92.
7. Sundberg TP, Toomayan GA, Major NM. Evaluation of theacetabular labrum at 3.0-T MR imaging compared with 1.5-T MRarthrography: preliminary experience. Radiology. 2006;238(2):706–11.
8. Bredella MA, Stoller DW. MR imaging of femoroacetabularimpingement. Magn Reson Imaging Clin N Am. 2005;13:653–64.
9. Ganz R, Parvizi J, Beck M, Leunig M, Nötzli H, Siebenrock KA.Femoroacetabular impingement: a cause for osteoarthritis of thehip. Clin Othop Relat Res. 2003;417:112–20.
10. Wagner S, Hofstetter W, Chiquet M, et al. Early osteoarthriticchanges of human femoral head cartilage subsequent to femoro-acetabular impingement. Osteoarthritis Cartilage. 2003;11:508–18.
11. Tanzer M, Noiseux N. Osseous abnormalities and early osteoar-thritis: the role of hip impingement. Clin Orthop Relat Res.2004;429:170–7.
12. Resnick D, Niwayama G, Coutts RD. Subchondral cysts (geodes)in arthritic disorders: pathologic and radiographic appearance ofthe hip joint. AJR Am J Roentgenol. 1977;128:799–806.
13. Ondrouch AS. Cyst formation in osteoarthritis. J Bone Joint Surg.1963;45:755–60.
14. Milgram JW. Morphologic alterations of the subchondral bone inadvanced degenerative arthritis. Clin Orthop Relat Res.1983;173:293–312.
15. Ferguson AB. The pathological changes in degenerative arthritisof the hip and treatment by rotational osteotomy. J Bone JointSurg. 1964;46:1337–52.
16. Schajowicz F, Sainz MC, Slullitel JA. Juxta-articular bone cysts(intra-osseous ganglia): a clinicopathological study of eighty-eightcases. J Bone Joint Surg. 1979;61:107–16.
17. Landells JW. The bone cysts of osteoarthritis. J Bone Joint Surg.1953;35:643–9.
18. Feldman F, Johnston A. Intraosseous ganglion. AJR Am JRoentgenol. 1973;18:328–43.
19. Feldkamp LA, Goldstein SA, Parfitt AM, Jesion G, KleerekoperM. The direct examination of three-dimensional bone architecturein vitro by computed tomography. J Bone Miner Res.1989;4:3–11.
20. Chappard D, Retailleau-Gaborit N, Legrand E, Baslé MF, AudranM. Comparison insight bone measurements by histomorphometryand µCT. J Bone Miner Res. 2005;20:1177–84.
21. Augat P, Eckstein F. Quantitative imaging of musculoskeletaltissue. Annu Rev Biomed Eng. 2008;10:369–90.
22. Crabbe JP, Martel W, Matthews LS. Rapid growth of femoralherniation pit. AJR Am J Roentgenol. 1992;159:1038–40.
23. Daenen B, Preidler KW, Padmanabhan S, et al. Symptomaticherniation pits of the femoral neck: anatomic and clinical study.AJR Am J Roentgenol. 1997;168:149–53.
24. Panzer S, Augat P, Esch U. CT assessment of herniation pits:prevalence, characteristics, and potential association with mor-phological predictors of femoroacetabular impingement. EurRadiol. 2008;18:1869–75.
25. Martin RB. Porosity and specific surface of bone. Crit RevBiomed Eng. 1984;3:179–222.
26. Kambolis C, Bullough PG, Jaffe HL. Ganglionic cystic defects ofbone. J Bone Joint Surg. 1973;55:496–505.
27. Mainzer F, Minagi H. Intraosseous ganglion: a solitary subchondrallesion of bone. Radiology. 1970;94:387–9.
Skeletal Radiol