Help Groups on women empowerment- Evidence from JEEViKA
26
Comparative study of effects of Self- Help Groups on women empowerment- Evidence from JEEViKA* Naveen Kumar 1 , Atul Kumar 2 Abstract Self-help groups (SHGs) were originally formed to provide savings and loans, but their function has evolved to include strengthening governance, and tackling social concerns such as gender and caste discrimination. Low cost credit to the poor through SHGs has been hailed as a significant poverty reduction tool in developing nations, although there is no evidence of its effectiveness. This paper, using primary survey data, compares the changes in different socio-economic factors of SHG women and non-SHG women. Three main dimensions have been assessed in this paper i.e. loan size, savings pattern, and women empowerment. We found that SHG women have higher scores in the average women empowerment index than women with no exposure to SHGs. SHG women on average use more loans for business purposes than non-SHG women. 1NTRODUCTION Bihar, according to Hora and Tiwari (2007), is one of India's poorest and most patriarchal states, with serious ramifications for women's personal and socioeconomic advancement in the state. This difference can be observed in the 2011 Census survey in the comparison of women with their male counterparts. According to the 2011 survey, the female to male sex ratio stood at 935 and women’s literacy rate stood at 51.5%. Women involvement in formal economic activities was reported at just 9% which is the lowest in the country. On the contrary, the male literacy rate and 1 PhD Student at Delhi school of economics and Former TRIP Fellow at Jindal school of government and public policy, Corresponding email id – [email protected] 2 Risk analyst, Standard chartered * We would like to thank Prof Anirban Kar of Delhi School of Economics and Centre of Development Economics for their support. Sameeksha Trust has funded this project under Krishna raj summer travel fellowship. We would also like to thank BRLPS(JEEViKA) for assistance during fieldwork. The authors would like to thank Chandan Thapa for constant help and support during the project. Usual disclaimers apply.
-
Upload
khangminh22 -
Category
Documents
-
view
0 -
download
0
Transcript of Help Groups on women empowerment- Evidence from JEEViKA
Comparative study of effects of Self-Help Groups on women empowerment- Evidence from JEEViKA*
Naveen Kumar1 , Atul Kumar2
Abstract Self-help groups (SHGs) were originally formed to provide savings and loans, but their function has evolved to include strengthening governance, and tackling social concerns such as gender and caste discrimination. Low cost credit to the poor through SHGs has been hailed as a significant poverty reduction tool in developing nations, although there is no evidence of its effectiveness. This paper, using primary survey data, compares the changes in different socio-economic factors of SHG women and non-SHG women. Three main dimensions have been assessed in this paper i.e. loan size, savings pattern, and women empowerment. We found that SHG women have higher scores in the average women empowerment index than women with no exposure to SHGs. SHG women on average use more loans for business purposes than non-SHG women.
1NTRODUCTION Bihar, according to Hora and Tiwari (2007), is one of India's poorest and most patriarchal states, with serious ramifications for women's personal and socioeconomic advancement in the state. This difference can be observed in the 2011 Census survey in the comparison of women with their male counterparts. According to the 2011 survey, the female to male sex ratio stood at 935 and women’s literacy rate stood at 51.5%. Women involvement in formal economic activities was reported at just 9% which is the lowest in the country. On the contrary, the male literacy rate and
1 PhD Student at Delhi school of economics and Former TRIP Fellow at Jindal school of government and public policy, Corresponding email id – [email protected] 2
Risk analyst, Standard chartered * We would like to thank Prof Anirban Kar of Delhi School of Economics and Centre of Development Economics for their support. Sameeksha Trust has funded this project under Krishna raj summer travel fellowship. We would also like to thank BRLPS(JEEViKA) for assistance during fieldwork. The authors would like to thank Chandan Thapa for constant help and support during the project. Usual disclaimers apply.

involvement in formal economic activity were reported to be 71.2% and 79% respectively. Women’s health conditions are a matter of concern as the National Family Health Survey IV reports that 53.1% women are anaemic and 22.9% are underweight in the region (Hora and Tiwari, 2007).
Self-Help Group (SHG) as a program has been widely applauded and accepted across India. It is considered as a vehicle for women empowerment and poverty reduction. The Planning Commission of India considers SHG as a self-governed program where members of disadvantaged homogeneous backgrounds come together to utilize their pooled savings for income-generating activities as well as for other empowerment activities. As the group dictates, members meet weekly or monthly to keep track of each activity, to discuss problems encountered by individuals and to solve problems so that members do not feel alone in their uphill battles. What is interesting is that SHGs first started as a pilot program but has now become a ray of hope and transformation in changing the lives of the rural disadvantaged women. The popularity and success of this program has drawn the government’s attention and as a result, SHGs are now included in the government’s annual plan. Along with this, various studies are being conducted to assess and evaluate the impact of SHGs on women empowerment.
The Bihar Rural Livelihoods Promotion Society, also popularly called JEEViKA, was started in 2006 focusing on 42 blocks in the six poorest districts of Bihar. The core strategy of the programme is to build vibrant community institutions of women, which through member savings, internal loaning, regular repayment and economic activities, become self-managed institutions. They aim to do so by establishing a self-sufficient community where members can create savings among each other which is then utilized to loan, create savings, provide insurance and create transfers among members to carry out various economic activities. The criteria to grant loans to the members is done based on three broad objectives of JEEViKA SHGs: to empower the poorest households, to provide economic empowerment, and to reduce poverty. Each SHG receives an initial grant from JEEViKA. JEEViKA (promoter agency) also integrates members in the formal banking channels through the self-help bank linkage programme to create future entrepreneurs; and extends this social service program to the larger society and reaches the most vulnerable communities. If the SHG program is properly implemented and regulated, it can be a powerful tool to eradicate poverty and empower disadvantaged communities.

As the severity of poverty varies across India, we have chosen two districts of Bihar in which to analyse the impact of SHGs. Bihar is majorly composed of rural areas which are deprived of basic facilities. The chosen districts have an average intervention of 50 months under the JEEViKA Programme. Our research is aimed at comparing women who are associated with SHGs and with women who are not part of SHGs. As Bihar ranks the lowest in the gender equality index as mandated by Sustainable Development Goal No. 5 (SDG 5), women and girls in the state experience inequalities in every aspect of life. We used the analysis of covariance (ANCOVA) specification to analyse the impact of SHG membership on savings , women empowerment and loan size.
Empowerment of women is a multi-faceted concept and has been variously defined by different authors. The main essence of empowerment is the ability of women to strengthen their capacities, their participation in the decision-making process, and most importantly, their self-reliance. This idea has been reinforced in the paper by VeneKlasen and Miller (2002) where they define women empowerment as the process of transforming women with limited power into women with voices and decision-making powers in the household.
The Oxfam GB framework for constructing the Average Women Empowerment Index (AWEI) takes into account changes at three levels: personal, relational and environmental (Lombardini, Bowman, and Garwood, 2017). A change at the personal level implies that there is a change in the perception of oneself from within. In this process, a woman redefines her role as an individual, her place in the society, her decision-making ability in the household (both economic and social), and her ability to take action and have her voice heard. Change at the relational level implies a woman translating and exercising her redefined change at the personal level with other women in the community. Here, the community includes all the decision-making bodies in the community ranging from the household to the marketplace to other local-level decision making bodies. A change in the environment encompasses changes (both formal and informal) in the broader context such as changes in the attitude to and perception of social traditions, beliefs, norms, and the legislative (or governing) framework. When these changes are conceptualized and practised, this can transform our society into a new generation filled with empowered men and women.
This study helps us discover many underlying impediments, and the actual outreach and performance of SHGs as well as the perceptions held by women about the program. It is important to note that the poor and
disadvantaged groups are distant from the formal sector (financial system) due to illiteracy, poverty, and a high degree of risk which systematically prevents them from availing these services from the formal sector. Therefore, most of them rely on the informal sector which usually charges higher rates for the services, which traps people in a vicious cycle of poverty. In this paper, we have conducted a loan-use analysis and a savings analysis of SHG members and non-SHG members to evaluate the contemporary scenario against the backdrop of the SHG program.
In our analysis, for comparability of the control and treatment groups, we used a balance table and compared the difference in means. We found no significant difference between SHG and non-SHG women based on different socioeconomic characteristics. Using the ANCOVA specification, we found that SHG memberships have no effect on loan size and savings. Women associated with SHGs have a higher average in the women empowerment index than non-SHG members. We also found that women above 35 have positive effects in the Average Women Empowerment Index (AWEI). Women belonging to nuclear families have a greater average on the Average Women Empowerment Index (AWEI).
2.LITERATURE REVIEW Self-help groups (SHGs) and their impact on members has been a widely-researched subject in the recent past. Various papers have been published regarding effectiveness of SHGs in promoting empowerment, employment and social development in its members. The concept and definition of the term empowerment has been defined and redefined based on different grounds and circumstances. Kabeer (2005) defined empowerment as an ultimate power to decide, while he defined disempowerment as when a person is denied his/her ability to decide although the person is capable of doing so. These two terms are equally important and relevant in India’s context, especially in rural India where due to patriarchal constructs and socio-economic dynamics, women have been either suppressed or are in denial and have been easily and readily accepting their role in the hierarchy. In order to break this chain of fixed roles which has denied or obstructed women’s involvement and presence in decision making, this societal construct needs to be broken. Men and women need to be given similar exposure and voice. In a broader context, Alsop and Heinsohn (2005) defined empowerment as being able to make functional choices. They stated that one must be able to transform their choice into their desirable outcome through an independent course of action. However, to describe empowerment in the Indian context, especially in the context of rural women, we can borrow the definition from Kishor et al. (2008). They
described empowerment as giving decision-making ability to powerless people so that they can make choices to change their circumstances. Here, the idea of empowerment is not to create dominant people, which can cause a vicious cycle of suppression, but to uplift people who are and were oppressed or silenced due to social constructs, economic factors and/or cultural norms (Upadhyay and Prata, 2014). Kabeer (2005) suggested in his paper that empowerment can be measured in terms of three dimensions: agency, resources, and achievements. He defined agency as an ability to make choices which are then translated into actions. Kabeer (2005) uses resources as a person’s ability and reach to utilize resources for their respective utility maximization and defines achievements as recognition of a person’s work and effort. The idea of agency has been reinforced in the paper by Rowland (1997) as well in the paper by Samman and Santos (2009) where they have also emphasized on the role of agency and associated it with empowerment. Rowland goes further and extends empowerment as an ability to resist manipulation, create attainable possibilities, and as an ability to be recognized and gain respect for one’s efforts and contributions. The idea of empowerment and recognition of capabilities has been studied and highlighted by Alsop and Heinsohn (2005). They highlight empowerment as a person’s ability to contribute meaningfully and purposefully in the decision-making process. This process helps a person realize and access their importance in the broader context and their presence in the institutional and societal frameworks. Along these lines, Samman and Santos (2009) highlight that empowerment occurs at different dimensions: household level (micro), society (meso), and the state or the country (macro). This acts as a measuring gauge of where an individual stands in terms of empowerment. Various techniques and methodologies have been used in the surveyed literature to measure the levels of empowerment. However, empowerment in essence is a broad concept that touches a wide spectrum of rights and issues. To generalize a method of measurement can give inconsistent results. Nevertheless, context-specific measurements can be carried out keeping in mind the geography and culture-specific characteristics and the respective weights they carry as well as their impact on disadvantaged individuals. In this regard, the Women’s Empowerment in Agriculture Index (WEAI) has been designed to assess the level of empowerment, agency and women inclusion in the agricultural sector. This survey-based index has been aggregated at different levels (country, regional, and individual) to decompose and identify where work needs to be done, and of course to recognize where work has been successful. The speciality about this index is that it captures the raw nature of things as the data is collected at the micro level by interviewing both men and women of the

same household. Then, the data is indexed into two sub-indices: 1) the first measures the degree of women empowerment based on five domains; and 2) the second is a measurement of the Gender Parity Index (GPI). In WEAI, to measure the degree of women empowerment, it takes into account the following five domains: i) decision in agro production; ii) access and decision-making power and resource utilization; iii) control and use of income; iv) leadership presence in the community; v) time allocation. The WEAI captures the percentage of women who are empowered and have had achievements at least as much as their male counterparts. Likewise, the GPI measures gender parity and highlights the empowerment gap between men and women (Alkire et al., 2013). Similar to WEAI, the Hunger Project measured the Women Employment Index (WEI) using five domains: agency, income, leadership, resources, and time. In the composition of the index, the domains were equally weighted. In order to capture the domain effect as much as possible, each domain was further composed of two to three other proxy variables. For example: to capture leadership, two other proxy variables were used: i) percentage of women in community organizations or groups ii) percentage of women who were comfortable voicing their views in public. After the composition of empowerment indices, the impact of SHGs have been evaluated across different literatures. Aloysius (2007) notes that the impact of SHGs goes beyond the empowerment of marginalized communities and has also been successful in fighting oppression in the household and community at large. Another study by Painoli (2011) observed that SHGs have been successful in instilling entrepreneurial skills in women. This movement of rising entrepreneurs and new entrants to the labour force will definitely be a positive force and a stimulus to the economy. Additionally, the study by Sudipta and Debnarayan (2011) in support of SHGs suggested that extending microcredit and SHG programmes for longer periods of time can be beneficial and reinforcing for beneficiaries of the program. The study further reports that the extension of these programs will trigger higher levels of empowerment among the program beneficiaries. The study also confirms that women were earning more from access to savings and credit as the earning variable was found to be significant. MinakshiRamji (2009) showed through his survey that SHG books show enhanced savings patterns. It was found that SHG members save 1 USD per month. The compulsory nature of saving rules has resulted in regular savings and financial discipline in SHG members. The impact of SHGs on financial inclusion can also be found in literature. In the study by Supravat and Maniklal (2010), the financial inclusion of rural women prompted by SHGs was assessed. For this study, primary data was collected from the Bankura district of West Bengal. The sample was

composed of 541 women who were beneficiaries of SHGs. For the study, access to formal financial services (specifically institutional savings and credit) were used as a proxy for the intensity of financial inclusion. The study found that SHG-promoted inclusion among the sample was significant. There was strong evidence that women participating in SHGs showed increased frequency of savings and borrowing. Literature also suggests that SHGs have had a significant impact in fighting social evils. In the paper by Minimol and Makesh (2012), the impact of SHGs on fighting domestic violence against women, women and child abuse, alcoholism, discrimination, exclusion, and exploitation has been highlighted. These social evils have not only affected women but have also threatened the lives and livelihoods of families involved. Minimol reports that SHG programs not only focus on empowerment but also work on women development in their environment. The study discusses how the SHGs discuss common immediate problems faced by the members and together, propose solutions to solve them. The literature is well established highlighting the impact and influence of SHGs on women of different socioeconomic backgrounds. It is evident that SHGs have successfully ignited a sense of empowerment, belonging, and drive to make a difference in its members. But the important questions still remain — how long can these programs be sustained? What happens when these programs end and/or the groups are disbanded? Can women break the cycle of poverty and launch themselves into lives more prosperous than before? To answer some of these questions, this paper studies the composition of women participating in SHGs, analyses their saving patterns and will also conduct an analysis of their loans. 3 METHODOLOGY 3.1 Sampling A survey was conducted in two districts of Bihar, namely Samastipur and Paschim Champaran, during May-July 2019. Six villages were selected randomly in these districts. The units of study were rural women. We had two sets of samples: a set for women who were associated with SHGs which was the treatment group and a set of women who were not (non-SHG women) were the control group. After Focused Group Discussions with the women, a detailed questionnaire was prepared for both sample sets. A rough draft of the questionnaire was constructed and put to test in a pilot survey that we conducted in Kankar village of the Samastipur area. We refined our questionnaire by removing questions which were similar in nature. Six SHG groups were a part of the survey. We also interacted with women living in the same localities with no membership in SHGs. A total of 82 respondents agreed to interact with us voluntarily. 45 women were
associated with SHGs and were provided with training and funds by JEEViKA. The remaining 37 were not associated with SHGs and had no experience or training given by JEEViKA. 3.2 QUESTIONNAIRE We prepared a questionnaire for study in two parts. Part one consisted of questions on different socioeconomic factors which included information on caste, frequency of loans and their uses, savings patterns, and age. We also had questions on the respondents’ possession of a bank account, frequency of visiting banks, sources of loans and income-generating activities taken up by them. The second part of the questionnaire was framed to capture empowerment in the respondents for both sets of samples. For this study, we have taken a similar approach as that of Oxfam India in its impact evaluation work. The framework suggests that women empowerment is a multifaceted idea and encompasses dimensions at personal and relational levels. The personal level has three dimensions which are self-confidence, opinion on economic rule, and personal autonomy. The three relational level dimensions are group participation and degree of influence, household decision making, and mobility-communication level. The domain of self-confidence had questions for the respondents related to equality to their peers and self-worth. Opinion on economic rule had questions about basic financial understanding. The domain personal autonomy contained questions about decisions about meal choices, questions about decisions to travel outside the respondents’ villages of residence, and questions about decisions in general and to what extent the female respondent could influence that decision The sub domain of household decision making had a set of questions on the womens’ degree of influence on the major decision-making process in house whereas in the domain of group participation and decision making, questions on the womens’ degree of influence of major decision-making process in the group. Non-SHG members were associated with small, localised, religious groups and microfinance groups other than JEEViKA. In the sub domain of mobility and communication, we asked questions that pertained to the levels of personal mobility that respondents would experience such as ‘in the past 30 days, how many times have you gone outside your village ?’, ‘In these visits, to what extent has a male member accompanied you?’, ‘To what extent can you communicate with an outsider without a veil?’ 3.3 CONSTRUCTION OF AVERAGE WOMEN EMPOWERMENT INDEX (AWEI)

All the responses to the questions asked were recorded on the Likert scale as ‘To large extent’ , ‘To some extent’ and ‘not at all’ and were replaced by numbers one (1), two (2) and three (3) respectively. The six dimensions of self-confidence, opinion of economic rule, personal autonomy, group participation and decision making, household decision making and mobility and communication level have a different number of questions that map the personal and relational levels of women empowerment. The average score of each respondent is calculated for each dimension. For calculating AWEI, the average of the averages is calculated for all six dimensions and the specific number that is obtained will be the Average Women Empowerment Index. AWEI = ((a.SC + b.OER + c.PA + d.GPD + e.HDM + f.MCL)/6) a, b, c, d, e and f are different weights that can be assigned to different dimensions capturing personal and relational levels of women empowerment. ‘n’ indicates the number of units in the sample.
● SC-Self-confidence SC=((a+b+c+d)/4), ● OER-Opinion of Economic Rule OER=((e+f+g)/3), ● PA-Personal autonomy PA=((h+i+j+k)/4), ● HDM-Household decision making HDM=((l+m+n+o+p+q)/6), ● GPD-Group participation and decision making GPD=((r+s)/2), ● MCL-Mobility and communication level MCL=((t+u+v+w)/4)
We have twenty-three questions from the six dimensions. All the questions were coded as the English alphabet starting from a to w. While calculating AWEI, we had taken weight one for all the dimensions. Weight to all dimensions was given as one as all six dimensions are equally important for calculating the empowerment of women. Vast literature is available to give reasons for equally weighting each dimension while calculating the empowerment index (R, Liebman, and Katz, 2007). 3.4 Data The source of data was a primary survey done under the Krishna Raj Summer Travel Fellowship at the Centre for Development Economics, Delhi School of Economics. 3.5 Empirical strategy Association with SHGs can potentially lead to increased savings and increased sizes of loans taken. SHGs also increase member participation in groups, self-confidence, and participation in household decision making. SHGs also empower women . In our analysis, we test the impact of SHG memberships on savings, loan size, AWEI, and its different dimensions. We use the ANCOVA specification where

𝑦! = β" + β#. (𝐴𝑠𝑠𝑜𝑐𝑖𝑎𝑡𝑖𝑜𝑛𝑤𝑖𝑡ℎ𝑆𝐻𝐺𝑠) + ∑ β!$!%# 𝑋! + ϵ! (1)
Where yi is the outcome of interest for women 'i'. Association with SHGs is members associated with SHGs. Xi is the vector of pre- specified controls used in primary specification, epsilon is a random individual level error. 𝑦! = β" + β#. (Association with SHGs) +β&. (Association with SHGs) × 𝐴ge + ∑ β!$
!%# 𝑋! + ϵ! (2) In specification (2), we add an interaction term ‘age’ which is a binary variable taking value ‘0’ for women less than 35 years of age and 1 for women above 35. Specification (2) is a mirror of Specification (1) with ‘age’ as an interaction term. Many empowerment measures in the surveyed women increase with age such as mobility and communication levels, participation in household decision making, group participation and decision making powers. In a field survey, it was also discovered that older women were more confident and communicated more effectively. In general, women in nuclear families have greater freedom and decision-making powers than women in mixed families. We also look into how age and being from a nuclear family affect women's empowerment if they have SHG membership. In specification (3), we use the ANCOVA specification to show the impact of age and family type on women empowerment. 𝑦! = β" + β#. Age + ∑ β!$
!%# 𝑋! + ϵ! (3) In the next specification we introduce family type as an interaction term. 𝑦! = β" + β#. Age + β&. Age × Family type + ∑ β!$
!%# 𝑋! + ϵ! (4) We add village level fixed effects in the above specification to control for village level characteristics. JEEViKA was targeted at the ultra-poor in a phased manner. Members were selected initially on socioeconomic parameters, and later memberships were done by community mobilisers (CM) randomly in the village panchayat. This reduces the issue of self-selection in our analysis. We also did a balance control difference in the mean analysis for our sample and noted no significant difference in both the control and the treatment groups.

4. DESCRIPTIVE STATISTICS 4.1 SAMPLE PROFILE AND BACKGROUND Our research site was based in Samastipur and West Champaran districts. The main occupation of the people here is agriculture and livestock. According to the Census 2011, literacy rates are 55.99 % in Champaran and 61.86 % in Samastipur. Both the districts have access to government hospitals. This is an aggregate picture of the districts but our field survey was mainly focused on the ultra-poor women of these districts. In our field survey, we encountered many facts and instances which could be regional and cultural specific aspects which we have nonetheless included here as a sample profile. We can see in Table 1 that the SC Table 1: Sample profile
Indicators SHG members Non-SHG members
Average age 39 36 Max. age 60 64 Min. age 22 18 Married 93% 95 % Widow 7 % 5 %
Primary education 23 % 13.5 % Secondary education 6 % 10.8 %
Illiterate 71 % 75.6 % Hindu religion 88 % 73 % Muslim religion 12 % 27 %
Other Backward Caste 41 % 40.5 % Schedule Caste 59 % 59.5 %
Agricultural occupation 17 % 10.81 % Non-agricultural occupation 62 % 59.45 %
Self employed 21 % 29.74 % Average annual income 92046 80756.56
Max. income 250000 200000 Min. income 10000 10000
category is 18% more than the OBC category. We observed that in a group, most of the people are from the same caste. This is because the village structures in most parts of Bihar are based on caste. We found that villages were divided into tolas (streets/avenues) which were based on the

caste and religion of the people living there, so the SHGs which were formed mostly have their members from the same caste. When we asked the reason for this, official staff said that as SHGs had to organize meetings every week, members would find it cumbersome to visit another tola to attend SHG meetings weekly. The average age of the respondents of SHGs is 39 whereas the average age of non-SHG respondents is 36 years. The maximum age to join self-help groups is 60 years. Due to typos in their Aadhaar cards, a few women were not permitted to join SHGs. The marital statuses of women in our sample for SHG and non-SHG members were similar, 95% of the sample consisted of married women. Generally, daughters-in-law are allowed to be members of SHGs so that they can participate in the events of SHGs regularly; this is why we interviewed non-SHG members of the same marital status as SHG members. The education level was extremely poor in the area but with the advent of SHGs, women have become signature literate i.e. those who have never received formal education and were able to write their names. 65% of non-SHG women interviewed were a part of joint families whereas 51% of the SHG women interviewed had joint families. Usually, women in joint families have restrictions which is more evident in the scores on the AWEI. Most of the young women less than 30 years of age said that most of their decisions are taken with the permission of their mothers-in-law. Women in our sample are mostly housewives who spend most of their time in household work. Since we collected data for household income, we also gained knowledge of the occupational structure of the male members in the family. Most of the people are daily wage labourers, and a large chunk of people have migrated to the cities for work as the districts we were basing our survey in had very limited employment opportunities. Table 2: Balance table- Characteristics of respondents
Variable Non SHG Women
SHG Women Difference
Age 36.78 39.33 2.542 (2.01) [1.23] [2.284]
Education (in years)
1.95 2.05 0.101
[0.65] [0.47] [0.784]
Marital status 0.89 0.93 0.038 [0.05] [0.04] [0.064]
Type of family 0.41 0.49 0.083

[0.08] [0.08] [0.113]
Family size 0.38 0.51 0.133 [0.08] [0.08] [0.112]
Total landholding 0.54 0.56 0.018 [0.20] [0.19] [0.278]
Landholding-rented
0.62 0.60 -0.017
[0.22] [0.22] [0.314]
Milch cattle 0.59 0.56 -0.036 [0.11] [0.07] [0.128]
Farming assets 0.05 0.05 -0.008 [0.05] [0.03] [0.061]
Annual income 80027.03 93000.00 12972.973 [9392.63] [9626.64] [13551.622]
N 37 43 80 The average income of SHG members is higher than non-SHG members. While interacting with them, we learnt that a few people in one of the villages were cheated by fraudsters who impersonated agents. On account of this, people were hesitant to interact with us at first, so we had to devote extra time in convincing them. This is one of the reasons for our small sample size. We encountered a few cases in which both the mother-in-law and the daughter-in-law were the respondents in our sample so their responses were related to some extent. However, we also got to know from such cases the significance of age, which plays a vital role in determining the decision-making power of a woman in a household. The major source of loans in both types of samples was from moneylenders. Moreover, the purposes of loans were also seemingly related for both the groups. This provides data for further study that in spite of financial inclusion, people are not actually reaping the benefit of it, which indicates a dearth of financial literacy. Thus, emphasis should be given to financial literacy. From Table 2, no significant difference between SHG women and non-SHG women can be observed. We find no difference in total landholding, rented landholding, farming assets, and milch cattle. No difference in
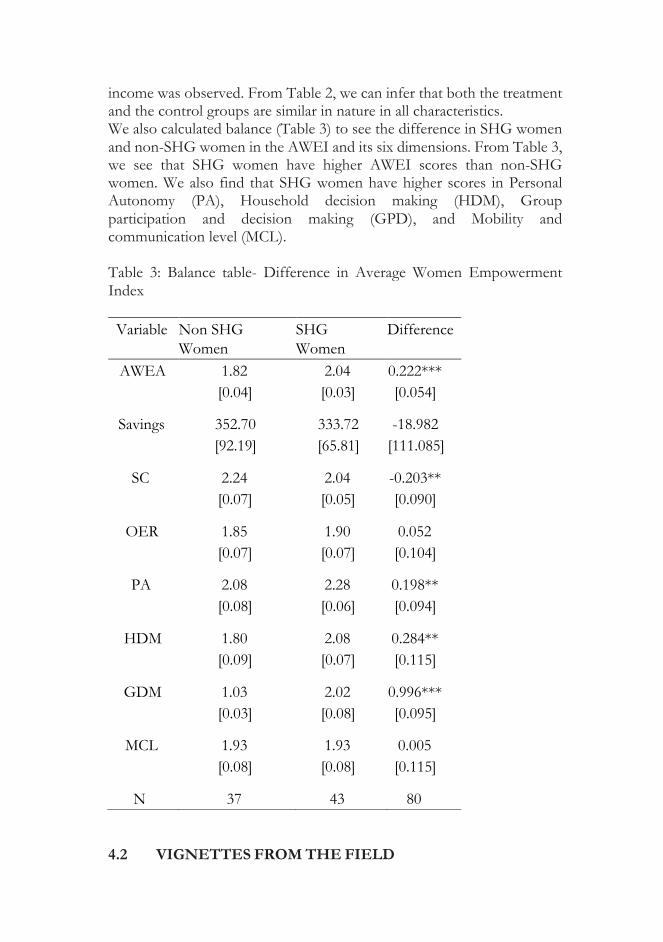
income was observed. From Table 2, we can infer that both the treatment and the control groups are similar in nature in all characteristics. We also calculated balance (Table 3) to see the difference in SHG women and non-SHG women in the AWEI and its six dimensions. From Table 3, we see that SHG women have higher AWEI scores than non-SHG women. We also find that SHG women have higher scores in Personal Autonomy (PA), Household decision making (HDM), Group participation and decision making (GPD), and Mobility and communication level (MCL). Table 3: Balance table- Difference in Average Women Empowerment Index Variable Non SHG
Women SHG Women
Difference
AWEA 1.82 2.04 0.222*** [0.04] [0.03] [0.054]
Savings 352.70 333.72 -18.982 [92.19] [65.81] [111.085]
SC 2.24 2.04 -0.203** [0.07] [0.05] [0.090]
OER 1.85 1.90 0.052 [0.07] [0.07] [0.104]
PA 2.08 2.28 0.198** [0.08] [0.06] [0.094]
HDM 1.80 2.08 0.284** [0.09] [0.07] [0.115]
GDM 1.03 2.02 0.996*** [0.03] [0.08] [0.095]
MCL 1.93 1.93 0.005 [0.08] [0.08] [0.115]
N 37 43 80 4.2 VIGNETTES FROM THE FIELD

During our fieldwork, we encountered non-SHG members who intended to join SHGs but due to some family responsibilities, they were unable to join. The woman’s husband’s occupation and income (or lack of both) are important factors in spurring women to join SHG. This reply from one of the respondents explains the scenario: “Bhaiya I am illiterate and I was married at the age of 18 now I am 27 and I have three children. My husband is a cobbler and I don’t know how much he earns daily, exactly. Usually, he gives me some money (50 or 100) to bring groceries every day. Many times he doesn’t get any work so I use to purchase groceries in credit. We don’t have savings, most of the time when money comes we use to repay the debt of shopkeeper so that he continues to give us necessary grocery when we don’t have any money. I have tried to join SHG but my husband asked me not to join SHG and take care of children and the house.” Among SHG members, those who have productively used the loans in income-generating activities have managed to ensure an income source for their family. After strengthening their financial condition to some extent, they can take out loans for their children’s education, which they can confidently repay. This reply from one of the respondents explains the scenario: “I have joined SHG in 2012. My age is 35, I have two children and I cook food in Anganwadi, where I get around Rs. 2000 per month. I and my husband work as harvesting labourers in agricultural season. My husband used to work as daily labourer earlier and sometimes he found it very difficult to get work. He was planning to purchase a tempo for quite some time but due to the high interest rate charged by moneylender he could not purchase. I have taken 80,000 loan from SHG and on EMI he has purchased a tempo. Now he does not need to go in search of work. My son is studying polytechnic in the city. He was in need of a laptop for his studies. I have loaned Rs. 30000 (INR) from SHG recently to purchase him a laptop. These days my husband also helps me in repaying the loan and I also try to save more and deposit it in the SHG for the future use.” Interactions with SHG members who have quit the group shows that there is no rotation of leadership positions in the SHGs. There is a lack of grievance-redressal mechanisms at the ground level. This reply from one of the respondents explains the scenario: “I was a member of SHG but our group has broken. Everyone in our group felt that our CM (community mobilisers, who are JEEViKA representatives at the village level) is biased so we walked out. Now each of us have around 1000 rupees saved in our SHG accounts but she (the CM) is not helping us to withdraw it back. I have personally gone three to four times to bank but I could not withdraw back my money. Now I have stopped going to bank also because of transportation cost. I don’t trust

any of the SHG members and I will not join back. Every CM supports the group of their village. No one is there to listen to our problems.” 5 MAIN RESULTS 5.1 IMPACT OF ASSOCIATION WITH SHGS ON SAVINGS In our sample, all the members have bank accounts, which shows better accessibility and availability of financial services. However, when we look at the regular visits of the members (minimum once in a month) to the bank, then we found 62% of the women from SHG groups and 48% of SHG members visit the bank regularly, which is comparatively low. This lowers the overall financial inclusion of women as the usage of financial services is quite low. Most of the savings are used for non-productive work. Women invest their savings in maintenance, which includes spending for festivals and for consumption purposes. Only a few women used to deposit their savings in savings accounts in banks. Six members from the SHG sample and one from the non-SHG sample deposit their savings in banks. This meagre number is due to their lack of involvement in income-generating activities. This can also explain the high incidence of lack of savings in the SHG sample. As per the rule of the group, every member has to deposit a minimum amount of Rs. 10 per week which is used for intra-lending among the group. This organized setting infuses a sense of importance of savings in the members. They also help each other by intra-lending whenever someone is in need. Despite this, from Table 4 we found a negative relationship between the association of women with SHGs and savings. Savings and annual income have a significant positive relation. This phenomenon of less savings in SHG women than in non-SHG women can be explained by the fact that the main source of loans for SHG members are moneylenders, for which they do not have to visit the bank often. The high interest rate charged by moneylenders is an extra burden on their expenditure due to which they save less. We further disaggregated our data on members according to their age distribution. We found that SHG members below the age of 40 are more likely to visit the bank than members older than 40. We infer from Table 4 that women associated with SHGs and who are above 35 years of age tend to save more than non-SHG women.
Table 4: Impact of association with SHGs on savings and loan size
1.Association with SHGs -62.61 -37.87 -77.66 -8758.1 -23038.8 36110.6
(-0.62) (-0.38) (-0.41) (-0.47) (-1.24) (1.07)
Annual income (Rs) 0.00346*** 0.00376*** 0.00377*** 0.490** 0.402* 0.429*
(1) (2) (3) (4) (5) (6) Savings Savings Savings Loan size Loan size Loan size
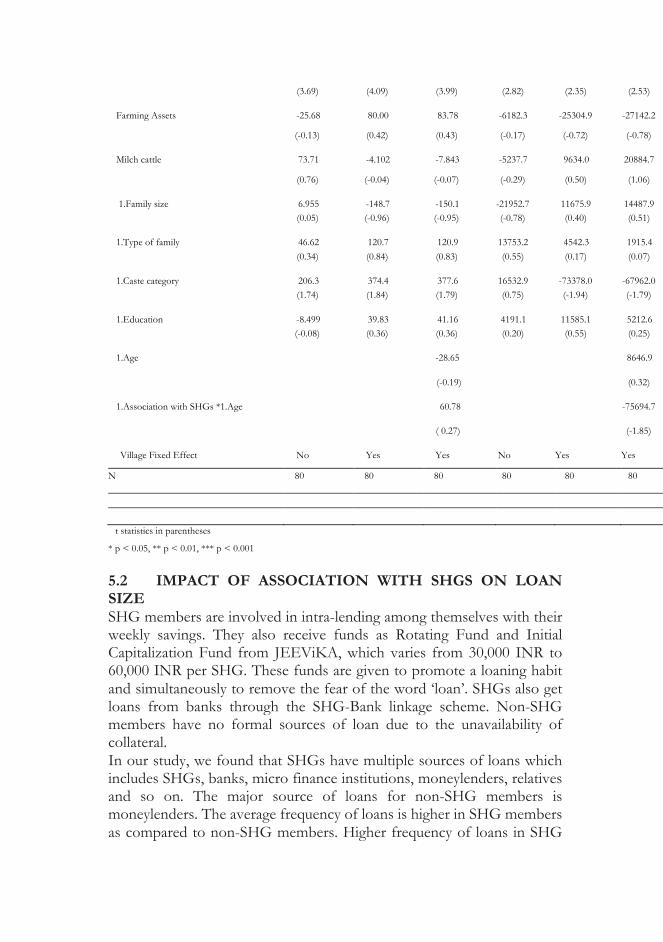
(3.69) (4.09) (3.99) (2.82) (2.35) (2.53)
Farming Assets -25.68 80.00 83.78 -6182.3 -25304.9 -27142.2
(-0.13) (0.42) (0.43) (-0.17) (-0.72) (-0.78)
Milch cattle 73.71 -4.102 -7.843 -5237.7 9634.0 20884.7
(0.76) (-0.04) (-0.07) (-0.29) (0.50) (1.06)
1.Family size 6.955 -148.7 -150.1 -21952.7 11675.9 14487.9 (0.05) (-0.96) (-0.95) (-0.78) (0.40) (0.51)
1.Type of family 46.62 120.7 120.9 13753.2 4542.3 1915.4 (0.34) (0.84) (0.83) (0.55) (0.17) (0.07)
1.Caste category 206.3 374.4 377.6 16532.9 -73378.0 -67962.0 (1.74) (1.84) (1.79) (0.75) (-1.94) (-1.79)
1.Education -8.499 39.83 41.16 4191.1 11585.1 5212.6 (-0.08) (0.36) (0.36) (0.20) (0.55) (0.25)
1.Age -28.65 8646.9
(-0.19) (0.32)
1.Association with SHGs *1.Age 60.78 -75694.7
( 0.27) (-1.85)
Village Fixed Effect No Yes Yes No Yes Yes
N 80 80 80 80 80 80
t statistics in parentheses
* p < 0.05, ** p < 0.01, *** p < 0.001
5.2 IMPACT OF ASSOCIATION WITH SHGS ON LOAN SIZE SHG members are involved in intra-lending among themselves with their weekly savings. They also receive funds as Rotating Fund and Initial Capitalization Fund from JEEViKA, which varies from 30,000 INR to 60,000 INR per SHG. These funds are given to promote a loaning habit and simultaneously to remove the fear of the word ‘loan’. SHGs also get loans from banks through the SHG-Bank linkage scheme. Non-SHG members have no formal sources of loan due to the unavailability of collateral. In our study, we found that SHGs have multiple sources of loans which includes SHGs, banks, micro finance institutions, moneylenders, relatives and so on. The major source of loans for non-SHG members is moneylenders. The average frequency of loans is higher in SHG members as compared to non-SHG members. Higher frequency of loans in SHG

members can be explained by the small size of the loans and the timely repayment of the loans. Despite the high interest charged by moneylenders, we noted a high percentage of SHG members going to moneylenders for loans. Removal of women from the hands of moneylenders was one of the reasons to form SHGs. The need for women to approach moneylenders can be explained by the small amount of funds available with SHGs. Households tend to ask for large amounts of loans for building houses, marrying their daughters, and so on. Big loans are easily available and accessible with high interest from moneylenders. Both SHG and non-SHG members have used a major portion of their loans on consumptive purposes which includes marriage, building houses, medication, and education. These trends highlight the poor infrastructure of health and education, prevalent dowry system, and corruption. Table 4 suggests that women with SHG memberships take less loans than non-SHG women. Our results remain consistent with the village fixed effect in Model 5. This can be explained by the availability of less funds from SHGs and the Village Organisation (VO) as well as easy access to loans from moneylenders with high rates of interest. In Model 6, we saw that women above the age of 35 tend to take loans that are 8649.5 rupees greater than women less than 35 years of age. 5.3 IMPACT OF ASSOCIATION WITH SHGS ON AVERAGE WOMEN EMPOWERMENT INDEX (AWEI) Empowering women and supporting gender equality are the stated aims of many development projects; this is an area of focus that is also expressed in the Sustainable Development Goals (SDGs). Different understandings and definitions of ‘empowerment’ abound and the contested nature of the concept makes it challenging both to define and to measure, with the added complexity that different measurement approaches can themselves serve to strengthen or undermine empowerment. This study follows an approach similar to the one followed by the Oxfam India impact evaluation study. The Average Women Empowerment Index is the weighted average of six dimensions namely, self-confidence, opinion of economic rule, personal autonomy, household decision making, group participation and decision making, and mobility and communication level. These indicators broadly measure empowerment at personal and relational levels.
Table 5: Impact of association with SHGs on Average Women Empowerment Index
(7) (8) (9) AWEA AWEA AWEA

1.Association with SHGs 0.192*** 0.176*** 0.279*** (3.88) (3.79) (3.49)
Annual income (Rs) 0.00000157** 0.00000195*** 0.00000179*** (3.41) (4.55) (4.45)
Farming assets -0.108 -0.119 -0.146 (-1.12) (-1.35) (-1.78)
Milch cattle 0.126** 0.175*** 0.159** (2.65) (3.65) (3.40)
1.Family size 0.224** 0.191* 0.192** (3.01) (2.65) (2.86)
1.Type of family -0.125 -0.0471 -0.0365 (-1.88) (-0.71) (-0.59)
1.Caste category -0.0819 -0.271** -0.326*** (-1.41) (-2.87) (-3.64)
1.Education -0.0685 -0.00558 0.0108 (-1.24) (-0.11) (0.22)
1.Age 0.227*** (3.54)
1.Association with SHGs * 1.Age
-0.223* (-2.31)
Village Fixed Effect No Yes Yes N 80 80 80
t statistics in parentheses * p < 0.05, ** p < 0.01, *** p < 0.001
From Table 5, we infer that SHG membership has a positive impact on the Average Women Empowerment Index (AWEI). We added village fixed effects in Model 8, and found that the positive impact of association with SHGs on AWEI, rather than non-SHG women, remains valid. In Model 9, SHG women above 35 years of age had negative AWEI than non-SHG women above 35 years of age. From Table 5, we saw that SHG membership has a significant positive impact on income, milch cattle, and

family size. Since its inception, JEEViKA has been providing training and resources for the development of women in rural Bihar. The Average Women Empowerment Index (AWEI) score for SHG members is significantly higher than the scores of non-SHG members, which can be attributed to the training and facilities provided to SHGs members. 5.4 IMPACT OF ASSOCIATION WITH SHGS ON DIFFERENT DIMENSIONS OF AVERAGE WOMEN EMPOWERMENT INDEX Personal autonomy and opinion on economic rule of women has been increased with the association of women with SHGs. SHGs hold weekly meetings to discuss their agenda on savings and loan decisions. This enables the members to put forth their ideas and suggestions on concerned matters, which increases their confidence.
Table 6: Impact of association with SHGs on six dimensions of AWEI
(10) (11) (12) (13) (14) (15)
SC OER PA HDM GDM MCL
1.Association with SHGs -0.0577 0.0614 0.319 0.260 1.144*** -0.0551 (-0.35) (0.31) (1.96) (1.21) (6.12) (-0.28)
1.Age 0.173 0.0799 0.170 0.299 0.141 0.498** (1.30) (0.51) (1.30) (1.73) (0.94) (3.13)
1.Association with SHGs* 1.Age -0.332 -0.0598 -0.263 -0.165 -0.285 -0.230 (-1.65) (-0.25) (-1.34) (-0.63) (-1.26) (-0.96)
Annual income(Rs) 0.00000212* 0.00000169 0.00000257** 0.00000163 0.000000738 0.00000197 (2.54) (1.71) (3.13) (1.51) (0.79) (1.98)
Farming assets -0.155 -0.0715 -0.138 -0.149 0.0178 -0.377 (-0.91) (-0.35) (-0.83) (-0.67) (0.09) (-1.85)
Milch cattle 0.142 0.199 0.104 0.271* 0.0200 0.219 (1.45) (1.73) (1.09) (2.14) (0.18) (1.89)
1.Family size -0.132 0.291 0.277* 0.331 0.00402 0.380* (-0.94) (1.76) (2.02) (1.82) (0.03) (2.28)
1.Type of family 0.178 -0.256 -0.165 -0.0774 0.141 -0.0388 (1.38) (-1.68) (-1.31) (-0.46) (0.97) (-0.25)
1.Caste category -0.317 -0.494* -0.344 -0.0992 -0.143 -0.556* (-1.70) (-2.24) (-1.88) (-0.41) (-0.68) (-2.50)
1.Education 0.195 -0.357** 0.0918 0.0711 0.0873 -0.0240

(1.90) (-2.94) (0.91) (0.53) (0.76) (-0.20)
Cons 2.042*** 1.940*** 1.865*** 1.319*** 0.894*** 1.633*** (12.52) (10.08) (11.68) (6.25) (4.88) (8.40)
Village Fixed Effects Yes Yes Yes Yes Yes Yes N 80 80 80 80 80 80
t statistics in parentheses * p < 0.05, ** p < 0.01, *** p < 0.001
During our interviews, SHG women stated that prior to joining SHGs, they used to veil their faces while talking but now they could talk without any veil. Women from non-SHGs were not associated with any formal savings group which can be observed in the difference between the GDM coefficient of SHG and non-SHG women. There is not much difference between Indicator MCL in Table 6, which can be attributed to decreased restriction for movement of women in society. Around 80% of the respondents who were less than 30 years of age stated that to a large extent, one male member of their families accompanied them during travel outside of the village. Household decision making had improved in SHG women than in non-SHG women. Participation in SHGs had given them exposure and awareness. Most of the decisions about sales and the usage of that money is being undertaken by both the respondents and their husbands in both groups. Respondents were free to make choices in the decisions such as the education of their children and the kind of food to cook for the family. Table 7: Impact of association with SHGs on six dimensions of AWEI (16) (17) (18) (19)
AWEA AWEA AWEA AWEA
1.Age 0.202** 0.241*** 0.305*** 0.352*** (3.28) (4.21) (3.70) (4.59)
1.Caste category -0.0693 -0.350** -0.0678 -0.377** (-0.98) (-3.09) (-0.97) (-3.42)
Years of education 0.00478 0.00738 0.00119 0.00476
(0.57) (0.95) (0.14) (0.61)
Family size 0.139 0.143* 0.188* 0.174* (1.94) (2.12) (2.19) (2.14)

Loan size 0.000000251 4.73e-08 0.000000181 -7.48e-08
(0.73) (0.14) (0.54) (-0.22)
Landholding -0.0375 0.0226 -0.0328 0.0219
(-1.42) (0.78) (-1.25) (0.78)
Rented-landholding 0.0116 0.00784 0.0122 0.00615
(0.49) (0.35) (0.53) (0.28)
Do you have Milch cattle 0.0815 0.120 0.0564 0.101
(1.40) (1.99) (0.98) (1.70)
Do you own other farming assets
-0.140 -0.150 -0.0811 -0.103
(-1.29) (-1.49) (-0.75) (-1.02)
1.Type of family 0.0399 0.0835
(0.37) (0.81)
1.Age *.Type of family -0.222 -0.238*
(-1.93) (-2.27)
Cons 1.730*** 1.827*** 1.705*** 1.809***
(18.74) (18.95) (18.32) (18.51)
Village Fixed Effects Yes Yes Yes Yes N 80 80 80 80 t statistics in parentheses * p < 0.05, ** p < 0.01, *** p < 0.001
5.5 RELATIONSHIP OF EMPOWERMENT WITH AGE AND TYPE OF FAMILY During our interactions with the members during the survey, we observed that members who were above 35 years of age and who belonged to nuclear families were more confident and had a greater say in decision making. Our hypothesis was that these women above 35 and in nuclear families have a greater higher score in the Average Women Empowerment Index than women less than 30 who live in nuclear families. From Table 7, we can see that women above 35 have a 0.202 greater score in the Average Women Empowerment Index (AWEI) than women less than 35. This result holds in all the models, including village fixed effect models. This can be explained by women above 35 having greater freedom and more of a say in household decision making. We controlled for village
characteristics in Model 17 and Model 18 and found that scheduled caste women scored less on the Average Women Empowerment Index (AWEI) than non-scheduled caste women. Women belonging to a nuclear family had greater scores in AWEI than joint family women. Nuclear family females above 35 years of age had lower AWEI scores than their joint family counterparts. 5.6 OTHER RESULTS We enquired the reasons for women to join SHGs. We found that 40% of the women joined to increase their savings, followed by ‘for accessing government schemes (10%),’ and for accessing loans (10%). Few women also cited reasons such as pressure from relatives, to repay old debts, and to become involved in income-generating activities. We also enquired ‘why women in non-SHGs didn’t join JEEViKA?’. Women replied that previously, an organisation had duped them of their money by purporting to provide insurances and loans. Trust was the major factor missing which led them to not join SHGs. Women also cited that ten rupees of weekly savings would not have a huge impact. We also found that most SHGs have no rotation of leadership. Due to the lack of rotation of leadership, a SHG is governed by the same set of people. Rotation of leadership can help in increasing confidence and imparting leadership qualities. 6 CONCLUSION Bihar has allocated 8.7 % of its expenditure on rural development. This is higher than the average (5.6 %) of the 18 other states. Under the JEEViKA scheme, 10 lakh self-help groups (SHGs) and 15,000 village organisations will be set up. Further, 2.25 lakh SHGs will be provided with 3,500 crore INR from banks (Bihar budget 2018). These statistics highlight the seriousness of the Bihar government towards alleviating poverty and improving growth in rural areas with the help of the JEEViKA Scheme. In our study, we have seen that SHG women are comparatively more empowered than non-SHG women. Our sample had approximately 48 month old SHGs. With SHGs gaining more experience, it will ensure a more organised and systematic framework for the empowerment of women. JEEViKA emerged as the force which had led to the alcohol ban in Bihar. SHG women save less than non-SHG women. They visit banks more often than non-SHG women. Women who are members of SHGs have a higher score on the Average Women Empowerment Index than women who are not members of SHGs. We also discovered that women over the age of 35 have a favourable impact on the overall Average Women

Empowerment Index (AWEI). The Average Women Empowerment Index for women in nuclear families is higher. SHGs have become a major driving force for rural development, poverty alleviation and empowerment of women. Many women have turned into entrepreneurs by their association with SHGs. To further encourage women entrepreneurship, the current Minister of Finance and Corporate Affairs, Nirmala Sitharaman, recently gave a speech that drew praise from lawmakers on account of the positive changes in the budget related to women, including expanding the interest subvention scheme for women self-help groups (SHG) to all districts and allowing loans of up to 1 lakh INR for one woman in each self -help group (SHG) across the country. This paper aims to highlight the importance of SHGs in rural development with women at the centre. We had seen significant differences in different socio-economic factors by using methods such as the AWEI, loan analysis and savings patterns. Since our study was limited to six villages in rural Bihar for policy implication purposes, impact evaluation must be done with a larger data set to ensure a more in-depth understanding of the factors that enable women empowerment in order to create more meaningful and effective policy. REFERENCES: Alkire, S., Meinzen-Dick, R., Peterman, A., Quisumbing, A., Seymour, G.,
and Vaz, A. (2013). The women’s empowerment in agriculture index. World Development, 52, 71-91. Retrieved from https://www.sciencedirect.com/science/article/pii/S0305750X13001629 DOI: https://doi.org/10.1016/j.worlddev.2013.06.007

Aloysius P. Fernandez, “History and spread of the self-help affinity group movement in India-The role played by IFAD”,OccasionalPapers, Knowledge for development effectiveness, © 2006 by the IFAD.
Alsop, Ruth and Heinsohn, Nina. (2005). Measuring Empowerment in Practice: Structuring Analysis and Framing Indicators. 10.1596/1813-9450-3510.
Bagli, Supravat and Adhikary, Maniklal. (2012). Self-Help Groups and Borrowing Cost: An Empirical Study Addressing Endogeneity Problem. the Microfinance Review 2229-3329.
Hora, G., and Tiwari, A. (2007). Gender Equity and Women’s Empowerment Outcomes, Strategies and Lessons from Bihar Rural Livelihoods Project,” The World Bank, JEEViKA Learning Note Series No. 3 (2017).
Kabeer, N. (2005) Gender Equality and Women’s Empowerment: A Critical Analysis of the Third Millennium Development Goal. Gender and Development, 13, 13-24.https://doi.org/10.1080/13552070512331332273
Lombardini, S., Bowman, K., and Garwood, R. (2017). A ‘how to’ guide to measuring women’s empowerment: Sharing experience from Oxfam’s impact evaluations. Oxfam GB. Retrieved from http://hdl.handle.net/10546/620271 DOI: 10.21201/2017.9750
Minakshi Ramji (2009), Financial Inclusion in Gulbarga: Finding Usage in Access, Institute for Financial Management and Research Centre for Micro Finance, Working Paper Series No. 26 .
Minimal, M. C., and Makesh, K. G. (Nov 2012). Empowering Rural Women in Kerala: A Study on the role of SHG's. International Journal of Sociology and Anthropology , 270-280.
R, K. J., Liebman, J. B., and Katz, L. F. (2007). Experimental analysis of neighbourhood effects. Econometrica, 75(1), 83-119. DOI: https://doi.org/10.1111/j.1468-0262.2007.00733.x
Rowlands, J. (1997). Questioning empowerment. Working women in Honduras. Oxfam, Dublin.
Samman, E., and Santos, M. E. (2009). Agency and empowerment : a review of concepts, indicators and empirical evidence. Oxford Poverty & Human Development Initiative (OPHI).
Sudipta, D., and Debnarayan, S. (2011). Women's Empowerment through Self-Help Groups and ItsImpact on Health Issues: Empirical Evidence. Journal of Global Analysis 2.1: 49-82.

Supravat, B., and Maniklal, A. (2010). Impact of SHGs on Financial Inclusion – A Case Study in the District of Bankura” Journal of Management and Information Technology, Vol. 02, No. 1, December2010. pp-16-32.
Ushma D. Upadhyay, Jessica D. Gipson, Mellissa Withers, Shayna Lewis, Erica J. Ciaraldi, Ashley Fraser, Megan J. Huchko, Ndola Prata, Women's empowerment and fertility: A review of the literature, Social Science & Medicine,Volume 115,2014,Pages 111-120,ISSN 0277-9536, https://doi.org/10.1016/j.socscimed.2014.06.014
https://www.indiatvnews.com/business/news-collateral-free-loans-self-help-women-groups-doubled-to-20-lakh-nirmala-sitharaman-601681