Vol. 2015, 8(11) - Yearbook of Antitrust and Regulatory Studies
Upload
khangminh22Category
view
4download
0
HEALTHLINE
A National Journal of Indian Association of Preventive and Social Medicine
VOLUME : 8 ISSUE: 2 JULY-DECEMBER - 2017
plSSN 2220-337X eISSN 2320-1525

HEALTHLINE JOURNAL
A National Journal of
Indian Association of Preventive and Social Medicine managed by IAPSM-GC
Volume 8 Issue 2 (July-December 2017)
Editorial Board Editor in Chief, Managing Editor and Publisher :
Executive Editor :
Joint Editor :
Dr. K. N. Sonaliya
Dr. Viral R. Dave
Dr. Bhavik M. Rana
Editorial Board Members
Overseas MembersDr. Samir Shah, Oman Dr. Kush Sachdeva, USA
CorrespondenceEditor in Chief, Healthline Journal, Community Medicine Department, GCS Medical College, Hospital and Research Center, Opp. DRM Office, Nr. Chamunda Bridge, Naroda Road, Ahmedabad-380025, Gujarat. Telephone: 07966048000 Ext. No. 8351, Email: [email protected].
DisclaimerViews expressed by the authors do not reflect those of the Indian Association of Preventive and Social Medicine-Gujarat Chapter. All the opinions and statements given in the articles are those of the authors and not of the editor (s) or publishers. The editor (s) and publishers disclaim any responsibility for such expressions. The editor (s) and publishers also do not warrant, endorse or guarantee any service advertised in the journal.
Healthline journal is indexed with
Index Copernicus, DOAJ, OPENJGATE, CABI, Index Medicus-SEAR
Dr. A. Bhagyalaxmi, Ahmedabad
Dr. A. M. Kadri, Rajkot
Dr. Abhiruchi Galhotra, Raipur
Dr. Amit Kumar Singh, Srinagar
Dr. Amita Kashyap, Jaipur
Dr. Anurag Srivastava, Moradabad
Dr. Atul Trivedi, Bhavnagar
Dr. B. M. Vashisht, Rohtak
Dr. Bhavesh Modi, Gandhinagar
Dr. C. M. Singh, Patana
Dr. D. S. Martolia, Kannauj
Dr. Damodar Bachani, New Delhi
Dr. Dilip Kumar Das, Kolkata
Dr. Dinesh Kumar Pal, Bhopal
Dr. Dipesh Parmar, Jamnagar
Dr. Harivansh Chopra, Meerut
Dr. Jitendra Bhawalkar, Pune
Dr. K. C. Premarajan, Puducherry
Dr. Meenu Kalia, Chandigarh
Dr. Paresh Dave, Gandhinagar
Dr. Prakash Patel, Surat
Dr. Prakash Vaghela, Gandhinagar
Dr. Rakesh Kakkar, Dehradun
Dr. Rashmi Sharma, Ahmedabad
Dr. Renu Agarwal, Agra
Dr. S. K. Bhasin, New Delhi
Dr. Shalabh Sharma, Udaipur
Dr. Shalini Nooyi, Banglore
Dr. Sheetal Vyas, Ahmedabad
Dr. Sonal Parikh, Ahmedabad
Dr. Sunil Nayak, Himmatnagar
Dr. V. S. Mazumdar, Baroda
:: 01 ::
HEALTHLINE JOURNALA National Journal of
Indian Association of Preventive and Social Medicine managed by IAPSM-GC
Volume 8 Issue 2 (July-December 2017)
INDEXPage No.
Editorial
Management of Non-Communicable Diseases - Prevention Vs. Intervention
Original Articles
A Cross-Sectional Study on Intranatal and Postnatal Healthcare Usage among Mothers in
Fishermen Community of Kovalam Area in Kanchipuram District, Tamil Nadu
Raja Danasekaran, Pavithra Raja, Karnaboopathy Ranganathan, Jegadeesh Ramasamy
A Cross Sectional Study to Assess and Impart the Knowledge about Life Skills Education
Related to Physical and Emotional Changes in Adolescent Girls Residing in Orphanages of
Ahmedabad City
Rajshree Bhatt, Navin Raja Sekar, Ketan Garasiya, Yamini Gurjar, Jaydip Vidja , Raja Rajeshwari Devi
Assessment of Knowledge and Contributing Factors of Accredited Social Health Activist (ASHA)
Workers Regarding Antenatal Care in Bhojipura Block, District Bareilly
Sumit Saxena, Anurag Srivastava, Sonam Maheshwari, Anju Saxena
A Study on Prevalence of Initial Defaulters among Sputum Smear Positive TB Patients and Their
Reasons Under RNTCP in Jamnagar District, Gujarat, India
Pradeep R. Pithadia, Kishor M. Dhaduk, Meet M. Chauhan, Dipesh V. Parmar, Firoz D. Ghanchi,
Bharti B. Dholakiya
Utilization of Supplementary Nutrition Food Packets by Pregnant and Lactating Mothers in Urban
Areas of Valsad, Gujarat
Bhavesh Bariya, Neha A. Patel, Sunil Nayak
D. S. Martolia, Tanu Midha . . . . . . . . . . . . . . . . . . . . . . . . . . . . . . . . . . . . . . . . . . . . . . . . . . . . . . . . . . . . . . . . . . . . . . . . . . . . . . . . . . . . . . . . 03
NINAD Oration
My Journey through the Preventive Medicine: Lessons Learnt and Messages Received
Pradeep Kumar . . . . . . . . . . . . . . . . . . . . . . . . . . . . . . . . . . . . . . . . . . . . . . . . . . . . . . . . . . . . . . . . . . . . . . . . . . . . . . . . . . . . . . . . . . . . . . . . . . . . 08
. . . . . . . . . . . . . . . . . . 15
. . . . 22
. . . . . . . . . . . . . . . . . . . . . . . . . . . . . . . . . . . . . . . . . 27
. . . . . . . . . . . . . . . . . . . . . . . . . . . . . . . . . . . . . . . . . . . . . . . . . . . . . . . . . . . . . . . . . . . . . . . . . . . . . . . . . . . . . . . . . . . . . . . 36
. . . . . . . . . . . . . . . . . . . . . . . . . . . . . . . . . . . . . . . . . . . . . . . . . . . . . . . . . . . . . . . . . . . . . 42
INDEX
:: 02 ::
Content Page No.
A Study on Hypertension and Prehypertensive Status and Their Key Determinants among School
Going Adolescents in Surendranagar City
Shashwat Nagar, Ebbie Thomas, Darshan Mahyavanshi, Hiren Patel,
Noopur Nagar, S. S. Nagar
A Cross-Sectional Study of Assessment of Quality of Life among Adolescents with Type-1 Diabetes
Mellitus in Bhavnagar, Gujarat
Antara Banik, Atul Trivedi, Mihir Rupani
An Epidemiological Investigation of Acute Diarrhoeal Disease Outbreak in Sojitra Village of Anand
District by Rapid Response Team of B. J. Medical College, Ahmedabad
Nirav Patel, Akash Patel, Rahul Patel, Lakshmi N., Navin Raja Sekar, Rajshree Bhatt
Letter to Editor
Baal Doctor: A Health Change Agent in School
Shailesh Sutariya
Join Hands and Kill AIDS
Amrin Kharawala
. . . . . . . . . . . . . . . . . . . . . . . . . . . . . . . . . . . . . . . . . . . . . . . . . . . . . . . . . . . . . . . . . . . . . . . . . . . . . . . . . . . . . . . . 47
. . . . . . . . . . . . . . . . . . . . . . . . . . . . . . . . . . . . . . . . . . . . . . . . . . . . . . . . . . . . . . . . . . . . . . . . 54
. . . . . . . . . . . . . . . . . . . . . . . 60
. . . . . . . . . . . . . . . . . . . . . . . . . . . . . . . . . . . . . . . . . . . . . . . . . . . . . . . . . . . . . . . . . . . . . . . . . . . . . . . . . . . . . . . . . . . . . . . . . . 65
. . . . . . . . . . . . . . . . . . . . . . . . . . . . . . . . . . . . . . . . . . . . . . . . . . . . . . . . . . . . . . . . . . . . . . . . . . . . . . . . . . . . . . . . . . . . . . . . . 66
HEALTHLINE JOURNALA National Journal of
Indian Association of Preventive and Social Medicine managed by IAPSM-GC
Volume 8 Issue 2 (July-December 2017)

:: 03 ::
Management of Non-communicable Diseases - Prevention Vs. Intervention
Editorial Healthline Journal Volume 8 Issue 2 (July-December 2017)
1 2D. S. Martolia , Tanu Midha1 2Professor and Head, Associate Professor, Department of Community Medicine, Government Medical College,
Kannauj, Uttar Pradesh, India.
Correspondence: Dr. D. S. Martolia, E mail: [email protected]
"Medicine is not health care; medicine is sick care.
Good food, vigorous exercise, great friends, sound
sleep and mental stimulation - that's health care."
Community medicine or preventive and social
medicine, being a sidelined branch in India, is actually
the backbone of health care. Around 90% of all
morbidity in the world can be dealt with using basic
preventive approach to disease. Only 10% morbidity
warrants specialized care or emergency health care.
But unfortunately, the governments believe in trying
to increase expenditure on heath care in terms of
specialized care rather than emphasizing on
preventive measures to preserve health. In fact,
preventive medicine is the most cost-effective
strategy to improve the health status of the country.
Noncommunicable diseases (NCDs), like diabetes,
heart disease, and cancer, account for around 70% of [1]
all deaths globally. Almost three fourths of all NCD
deaths and 82% of the 16 million people who suffered
premature death or died before the age of 70 years, [2]occur in low- and middle-income countries. The
increasing magnitude of NCDs has been primarily
because of four major risk factors: tobacco use,
physical inactivity, the harmful use of alcohol and
unhealthy diets.
The epidemic of NCDs imposes dire health
consequences on individuals, families and
communities and threatens to overburden health
systems. The socioeconomic costs associated with
treatment of NCDs make the prevention and control
of these diseases, a major development imperative for
the 21st century. Urgent government action is needed
to meet global targets to reduce the burden of NCDs
especially by surveillance, prevention and control of
NCDs.
Prevention of NCDs involves a wide range of
activities specially tailored to the reduction of
risk factors:
1. Tobacoo control
The tobacco control is concerned with three core
areas: tobacco control economics, national capacity
building and surveillance and information systems
for tobacco control. The “tobacco control economics”
team aim to demonstrate that tobacco control
policies, in particular tobacco taxation, make good
economic sense. They work with countries to
strengthen their tobacco tax systems, carry out
research and develop tools and manuals to support
research and policy development, and survey tobacco
taxation in countries. The national capacity building
team provides assistance to countries to enhance
their ability to resist the epidemic of tobacco and to
reduce the demand for tobacco, in line with the WHO
Framework Convention on Tobacco Control (WHO
FCTC).The comprehensive information systems team
seeks to improve the availability of surveillance data
on tobacco use, exposure and related health
outcomes.
2. Health Promotion
The Health Promotion team promotes action
across sectors for health and health equity, the
reduction of health risks and the promotion of
healthy lifestyles. Oral Health and School Health are
two key work programmes of the team. The former
aims to integrate oral health into NCD prevention and
control and the later to intensify action for achieving
NCD related health and education outcomes at the
population level, in collaboration with key
stakeholders within and beyond WHO.
3. Surveillance and Population-based Prevention
Surveillance and population-based prevention are
fundamental to the mission to prevent deaths from
NCDs. Population-based prevention focuses on broad
policy, program and environmental interventions
targeted at the general population more than just the
:: 04 ::
high-risk individuals. The Global School-based
Student Health Survey (GSHS) is a collaborative
surveillance project designed to help countries
measure and assess the behavioral risk factors and
protective factors in 10 key areas among young
people aged 13 to 17 years. The GSHS is a relatively
low-cost school-based survey which uses a self-
administered questionnaire to obtain data on young
people's health behaviour and protective factors
related to the leading causes of morbidity and
mortality among children and adults worldwide. The
key topics addressed by the survey are: Alcohol use,
Dietary behaviors, Drug use, Hygiene, Mental health,
Physical activity and Tobacco use.
Non-communicable diseases: Cost effectiveness
of Prevention vs. Intervention
Diabetes
Diabetes is a chronic, metabolic disease
characterized by elevated levels of blood glucose (or
blood sugar), which leads over time to serious
damage to the heart, blood vessels, eyes, kidneys, and [3]nerves. The most common is type 2 diabetes,
usually in adults, which occurs when the body
becomes resistant to insulin or doesn't make enough
insulin. In the past three decades the prevalence of
type 2 diabetes has raised dramatically in countries of
all income levels. Type 1 diabetes, once known as
juvenile diabetes or insulin-dependent diabetes, is a
chronic condition in which the pancreas produces
little or no insulin by itself. For people living with
diabetes, access to affordable treatment, including
insulin, is critical to their survival.
The major long-term complications relate to
damage to blood vessels. Diabetes doubles the risk of
cardiovascular disease and about 75% of deaths in
diabetics are due to coronary artery disease. Other
"macrovascular" diseases are stroke and peripheral
artery disease. The primary complications of
diabetes due to damage in small blood vessels include
damage to the eyes, kidneys and nerves. Damage to
the eyes, known as diabetic retinopathy, is caused by
damage to the blood vessels in the retina of the eye
and can result in gradual vision loss and blindness.
Damage to the kidneys, known as diabetic
nephropathy, can lead to tissue scarring, urinary
protein loss and eventually chronic kidney disease,
s o m e t i m e s re q u i r i n g d i a lys i s o r k i d n ey
transplantation. Damage to the nerves of the body,
known as diabetic neuropathy, is the most common
complication of diabetes. The symptoms can include
numbness, tingling, pain, and altered pain sensation,
which can lead to damage to the skin. Diabetes-
related foot problems (such as diabetic foot ulcers)
may occur, and can be difficult to treat, occasionally
requiring amputation. Additionally, proximal diabetic
neuropathy causes painful muscle atrophy and
weakness.
The first WHO Global report on diabetes
demonstrates that the number of adults living with
diabetes has almost quadrupled since 1980 to 422 [4]million adults. Factors driving this dramatic rise,
which is largely on account of type 2 diabetes, include
overweight and obesity. The new report calls upon
governments to ensure that people are able to make
healthy choices and health systems are able to
diagnose, treat and care for people with diabetes.
Around 8% of women – or 205 million women – live
with diabetes worldwide, over half in South-East Asia
and the Western Pacific. During pregnancy high blood
glucose substantially increases the risk to health for
both mother and child as well as the risk of diabetes
for the child in the future. Almost half of women who
die in low-income countries due to high blood glucose
die prematurely, before the age of 70 years. According
to WHO, around 422 Million adults had diabetes in
2016.Around 1.6 million deaths are directly
attributed to diabetes each year. About 1 in 3 adults
aged over 18 years is overweight and 1 in 10 is obese.
Prevention :
Prevention of type 2 diabetes, which accounts for
85–90% of all cases, involves measures to minimize
complications and maximize quality of life for all
people with diabetes. Our core functions are to set
norms and standards, promote surveillance,
encourage prevention, raise awareness and
strengthen prevention and control.
Martolia D. S. Management of Non Communicable Diseases...

Main recommendations for individuals are :
• Cessation of tobacco consumption and smoking
Increase consumption of fruit and vegetables, as
well as legumes, whole grains and nuts;
Limit energy intake from total fats and shift fat
consumption away from saturated fats to
unsaturated fats;
Limit the intake of sugars;
Be physically active - accumulate at least 60
minutes of regular, moderate to vigorous intensity
activity each day that is developmentally
appropriate.
Societal recommendations :
Curbing the childhood obesity epidemic requires
sustained political commitment and the
collaboration of many public and private
stakeholders.
Governments, International Partners, Civil Society,
NGO's and the Private Sector have vital roles to
play in shaping healthy environments and making
healthier diet options for children and adolescents
affordable and easily accessible. It is therefore
WHO's objective to mobilize these partners and
engage them in implementing the Global Strategy
on Diet, Physical Activity and Health.
Intervention:
Lifelong prescription of oral hypoglycemic drugs,
some of the newer ones like sitagliptin cost as
much as Rs.50 per tablet;
Insulin(eg.Actrapid) injections which cost Rs.2880
for 5 injections
A pancreas transplant is occasionally considered
for people with type 1 diabetes who have severe
complications of their disease, including end stage
kidney disease requiring kidney transplantation.
Complication of type 2 diabetes - nephropathy may
require kidney transplant, the costs of which are as
follows:
•
•
•
•
•
•
•
•
•
•
:: 05 ::
Countries Average price
U.S.A $65,000
U.K. $76,500
India $19,000 (Rs.12,00,000 approx.)
Cardiovascular diseases
Cardiovascular diseases (CVDs) are disorders of
the heart and blood vessels and include coronary
heart disease, cerebrovascular diseases, rheumatic
heart disease and other conditions. Four out of five
CVD deaths are due to heart attacks and strokes.
Cardiovascular diseases (CVDs) take the lives of 17.7 [5]
million people every year, 31% of all global deaths.
Triggering these diseases are tobacco smoking,
unhealthy diet, physical inactivity and the harmful
use of alcohol. These in turn show up in people as
raised blood pressure, elevated blood glucose and
overweight and obesity. Around 17.7 million people
die each year from CVDs, an estimated 31% of all
deaths worldwide. More than 75% of CVD deaths
occur in low-income and middle-income countries.
Around 80% of all CVD deaths are due to heart
attacks and strokes.
Prevention measures include the following :
Tobacco use, unhealthy diet and physical
inactivity increase the risk of heart attacks and
strokes.
Engaging in physical activity for at least 30
minutes every day of the week will help to prevent
heart attacks and strokes.
Eating at least five servings of fruit and vegetables
a day and limiting your salt intake to less than one
teaspoon a day, also helps to prevent heart attacks
and strokes.
Intervention measures include :
Angioplasty which costs somewhere between Rs.
1.2 Lakhs to 1.6 Lakhs (USD $1850 to 2600). This
will include one stent cost, surgeon fees, 2 to 3 day
stay at the hospital, food for the patient, drugs and
other consumables. If more than one stent is
required, then the cost will be additional.
•
•
•
•
Healthline Journal Volume 8 Issue 2 (July-December 2017)
:: 06 ::
• Heart bypass which costs more than Rs. 1 lakh plus
cost of hospital stay.
Cancer
Around 8.8 million people worldwide died from
cancer in 2015. That is nearly 1 in 6 of all global
deaths. US$1.16 trillion was the estimated total
annual economic cost of cancer in 2010.Around 30-[6]50% of cancers could be prevented.
Cancer is a generic term for a large group of
diseases characterized by the growth of abnormal
cells beyond their usual boundaries that can then
invade adjoining parts of the body and/or spread to
other organs. Other common terms used are
malignant tumors and neoplasm. Cancer can affect
almost any part of the body and has many anatomic
and molecular subtypes that each requires specific
management strategies. Cancer is the second leading
cause of death globally and accounted for 8.8 million
deaths in 2015. Lung, prostate, colorectal, stomach
and liver cancer are the most common types of cancer
in men, while breast, colorectal, lung, cervix and
stomach cancer are the most common among
women.
Prevention :
According to current evidence, between 30% and
50% of cancer deaths could be prevented by
modifying or avoiding key risk factors, including
avoiding tobacco products, reducing alcohol
consumption, maintaining a healthy body weight,
exercising regularly and addressing infection-related
risk factors. National policies and programmes
should be implemented to raise awareness, to reduce
exposure to cancer risk factors and to ensure that
people are provided with the information and
support they need to adopt healthy lifestyles.
Worldwide, tobacco use is the single greatest
avoidable risk factor for cancer mortality and kills
approximately 6 million people each year, from
cancer and other diseases. Tobacco smoke has more
than 7000 chemicals, at least 250 are known to be
harmful and more than 50 are known to cause cancer.
Tobacco smoking causes many types of cancer,
including cancers of the lung, oesophagus, larynx
(voice box), mouth, throat, kidney, bladder, pancreas,
stomach and cervix. Second-hand smoke, also known
as environmental tobacco smoke, has been proven to
cause lung cancer in non-smoking adults. Smokeless
tobacco (also called oral tobacco, chewing tobacco or
snuff) causes oral, oesophageal and pancreatic
cancer. Nearly 80% of the 1 billion smokers in the
world live in low- and middle-income countries.
Prevention of Tobacco smoking: which causes
cancers of the lung, oesophagus, larynx (voice
box), mouth, throat, kidney, bladder, pancreas,
stomach and cervix;
Prevention of Second-hand smoke (also known as
environmental tobacco smoke): which causes
lung cancer in non-smoking adults; and
Prevention of Smokeless tobacco (also called oral
tobacco, chewing tobacco or snuff): causes oral,
oesophageal and pancreatic cancer.
Dietary modification is another important
approach to cancer control. There is a link
between overweight and obesity to many types of
cancer such as oesophagus, colorectum, breast,
endometrium and kidney. Diets high in fruits and
vegetables may have an independent protective
effect against many cancers. Regular physical
activity and the maintenance of a healthy body
weight, along with a healthy diet, considerably
reduce cancer risk. In addition, healthy eating
habits that prevent the development of diet-
associated cancers will also lower the risk of other
noncommunicable diseases.
Intervention :
The average cost of treatment for breast cancer
through a private practitioner would be Rs 5-6
lakh, including investigations, surgery and
radiotherapy. However, with targeted therapy, six
cycles of chemotherapy can cost up to Rs 20 lakh
In conclusion, as the age old saying goes
"Prevention is better that cure". If we can only
reinforce healthy behaviors, we can prevent a great
•
•
•
•
•
Martolia D. S. Management of Non Communicable Diseases...

:: 07 ::
Healthline Journal Volume 8 Issue 2 (July-December 2017)
deal of morbidity and mortality due to non-
communicable diseases and also save millions that
are being spent on the treatment of the diseases and
their complications.
References :
1. Global Health Observatory Data [Internet]. World Health
Organization. 2018 [cited 06 January 2018]. Available from:
http:// www.who.int /gho/ncd/en/
2. Global status report on noncommunicable diseases 2014
[Internet]. World Health Organization. 2018 [cited 6 January
2 0 1 8 ] . A v a i l a b l e f r o m : h t t p : / / w w w. w h o . i n t /
nmh/publications/ ncd-status-report-2014/en/
3. Diabetes programme [Internet]. World Health Organization.
2 0 1 8 [ c i te d 0 6 J a n u a r y 2 0 1 8 ] . Ava i l a b l e f ro m :
http://www.who.int/ diabetes/en/
4. Global Report on Diabetes [Internet]. World Health
Organization; 2016. Available from: http://apps.who.int/
iris/bitstream/ 10665/204871/1/9789241565257_eng.pdf
5. Cardiovascular diseases (CVDs) [Internet]. World Health
Organization. 2018 [cited 06 January 2018]. Available from:
http://www.who.int/ cardiovascular_diseases/en/
6. WHO Cancer Control Programme [Internet]. World Health
Organization. 2018 [cited 6 January 2018]. Available from:
http://www.who.int/cancer/en/
:: 08 ::
Healthline Journal Volume 8 Issue 2 (July-December 2017)
My journey through the Preventive Medicine: Lessons learnt and Messages Received
Pradeep Kumar, MD, FIAPSM
Dear All,
First of all, with utmost humbleness, I sincerely
and profusely thank IAPSM GC and the organizing
committee of this conference for conferring the
prestigious NINAD oration upon me. Of all honours
and recognitions, peer recognition is the sweetest, so
right now I am enjoying the sweetest fruit of my
academic life.
Dear friends when for the first time I was informed
by Dr Dipak Solanki, President of state chapter about
the oration, my first reaction was a NO. I always
thought that this oration is something like life time
achievement award conferred to a person when he
has crossed the zenith of his carrier. But then looking
to the names of two illustrious orators of earlier years
whom I respect a lot and owe everything that I have
learned in Community Medicine in Gujarat, my chest
filled with the pride and I said yes in all capital letters.
After saying yes, next issue came was that what
shall be the topic of my oration. Unlike my many
colleagues who have specialized in certain sub areas
of Community Medicine and have made significant
contribution in those areas, my work has been
scattered. JO MIL GAYA USI KO MUQUADDAR SAMAJH
LIYA, (whatever I received, I took it as my destiny).
Here,I will recall a book “My world of Preventive
Medicine” by Dr CG Pandit , recipient of
PADMABHUSHAN and OBE. This book is available in
the library of this department. Dr Pandit a medical
graduate of Bombay University did diploma in
Microbiology & went to UK for higher studies. He was
founder DG ICMR and wrote the autobiography,
which was not an ordinary biography but an honest
attempt to recreate the history and evolution of
Public health in new independent India.
Finally, I decided to present my biography in a way
that it does not become boring and where I can share
few lessons and messages. I have been in this subject
since 1981. This period of more than 36 years has
been very eventful in the sense that I could put my
hands on the data of 4 census. When I began my
journey - in India, the IMR was 110 per 1000 live
births, MMR was around 6 per 1000 live births.
Population thanks to uncontrolled fertility, has more
than doubled since then. Smallpox was just
eradicated, paralytic polio was rampant, Malaria was
at its worst and HIV was yet to appear in the map of
the world. Leprosy was hyper endemic and being
treated with MDT – mono drug therapy with
Dapsone, Immunization schedule was just being
strengthened with inclusion of measles. There was
no talk of NCD or of mental illnesses as we were
preoccupied enough with communicable diseases.
So, this is how I commenced my journey in 1981 in
SPM or PSM or what we call now Community
Medicine. In fact, the journey began much before
when I joined MBBS in 1975 through a state level
entrance test. Let me first confess that right from
Correspondence : Dr. Pradeep Kumar, E mail: [email protected]
(Text of the speech delivered by Dr Pradeep Kumar for NINAD Oration during the Joint Annual State conference of
Indian Association of Preventive & Social Medicine, Gujarat Chapter (XXV) & Indian Public Health Association Gujarat thChapter (VII) on 7 Dec 2017 at Surat)
NINAD Oration
Chief Editor, Indian Journal of Community Medicine,
Professor, Community Medicine Dept., Dr MK Shah Medical College, Ahmedabad
Ex Professor & HOD, Depts. Of Community Medicine at GMERS Medical College, Sola, Ahmedabad &
BJ Medical College, Ahmedabad,
Ex Additional Project Director (APD), Gujarat State AIDS Control Society (GSACS), Ahmedabad & Director
Gujarat State Council of Blood Transfusion (GSCBT), Ahmedabad
:: 09 ::
beginning I have been a very ordinary student.
Blessed with a very good DNA from my parents, I
lacked focus, concentration and efforts and as a result
unlike most of you selected in first attempt, I got th
selected in 4 attempt from my marks of third
attempt in the second lowest ranking medical college
of UP - my alma mater MLB Medical College, Jhansi - a
new college with all its UG and PG degrees
unrecognized.
In MBBS, I could just scrape through all
examinations in first attempt and ranked 26 in the
batch of 100 students. I was reasonably good in
acquiring and transferring knowledge but poor in
skill acquiring and even poorer in skill transfer, hence
I opted for the most non-medical branch in the
medical college the SPM or present-day Community
Medicine. Premonition always works, my
performance in all internal and external
examinations during the MBBS was mediocre but
somehow only once in entire MBBS in the first
internal examination of 2nd MBBS I topped the entire
batch in theory of only one Subject and it was the
Community Medicine so the God was directing me in
this direction. Thanks to My PG guide & HOD, Dr RN
Srivastava, during my 3 years of MD, I had more
exposure of field work than of reading. You all will
agree that you are maximally influenced by your PG
teacher as you observe and follow him keenly. God
forbid if two share genders as well, candidate may
come out as full replica of him or her. I also tried to
imbibe his many habits. He believed in networking
and documentation and from that time I also started
believing the same. Let me tell you that these two
things helped me a lot in my later carrier.
Before going further, let me acknowledge, few
persons who played important role in my journey of
learning. Apart from my teacher Dr RN Srivastava
mentioned earlier, my real learning began after MD
when I joined in Medical Education in Gujarat. Post
MD learning is free flowing, purely voluntary, without
any fear of being assessed. It is largely through
reading, observing and participating with colleagues
and senior teachers. Here I will acknowledge two
teachers and two beaurocrats who influenced me a
lot and facilitated my learning.
Late Dr CK Purohit and Dr Vikas Desai under
whom I worked for 9 and 15 years respectively
shaped my academic personality a lot. While former
helped me in academic reading and scientific writing,
later helped me in understanding the public health
administration especially the HR and finance related
issues. The two are giants in their own capacity but
then are as different as chalk and cheese. Point is you
can learn a lot from people who are so diverse and
different. Two beaurocrats namely Dr Amarjit Singh
and Mrs. VL Joshi both senior IAS officers with whom
I worked for brief periods of 1 – 2 years each. Even in
this brief tenure not only I got their faith and
affection, I learned a lot about the administration.
The innovative approach coupled with boldness,
honesty and integrity are the essence of good
governance. What is required is the judicious and fair
use of the narrow window of discretion to get the best
out of the plan. Same window can ensure optimum
use of human resources by incentivising and dis-
incentivising the staff within the legal frame work. I
also learnt from them that how effective delegation
can reduce your stress/ work load and can ensure
better results.
Let me revert back to my journey of PSM. In 1984
I joined at BJ Medical College. At that time, it was only
university in India where PSM was not a regular
subject and was a matter of chuckle and ridicule in all
national conferences. We hardly had any UG teaching
but as a result, I got lot of time to join in PG teaching
and assisting PG students in their dissertations as Co
guide. Needless to say, that while working as Co guide
with as diverse teachers as Dr Purohit, Dr Seetalvad
and Dr AU Shah, I had extensive learning of working
with different types of teachers. Further I received lot
of respect and affection from these PGs which in most
of the cases is existing even today. Here the message
is that never look for immediate gains. Sometimes the
small efforts help you in a big way later as long-term
gains. Thanks to plenty of time available, I also read
the book of Maxcy and Oxford Book of Public health
Kumar Pradeep My journey through Preventive Medicine...

:: 10 ::
which I did not read during my MD days. I also tried
Occupational Health by Donald Hunter but could
read only 10 – 15% of it. Department at BJ for last 10
years at least had no research publications but then
due to the constant motivation and guidance of Dr
Purohit and a healthy competition among all young
APs, we had several publications all in the IJCM
within a period of 2 years. First one was by Dr Lala,
followed by Dr Kartha, Dr Talsania and myself. It
created an atmosphere of promoting research work
in the department and amongst us we had 8 – 10
publications in a brief period of 3 – 4 years. Dr Purohit
became Medical Superintendent for a brief period
when Ahmedabad had an epidemic of AGE & Cholera.
Daily OPD and IPD reports used to come to him which
he always shared and discussed with me. This
resulted in my first research paper, published in IJCM
in 1990. Take home message is that every study need
not to be a planned one. Availability of hospital based
secondary data and intelligent analysis under the
guidance of Dr Purohit made it an oral presentation
short listed for best paper in Gwalior national
conference; however it missed the target narrowly.
Another paper which has given me international
recognition with more than 200 citations is about
modified social classification. It was also conceived
here. Dept. was using this type of multiplication
factor to rationalize the social classes but it had
neither a reference nor documentation. I linked it
with CPI and got it published.
My second inning began at Surat with joining as
Associate Professor on ad-hoc promotion. Most
people discouraged me while a few handful
encouraged rather pushed me to go for it. This
decision I never repented thereafter and itturned out
to be the wisest decision ever taken by me. Take home
message is that fortune may not knock at your door
second time so go for it when it knocks for the first
time. My stay at Surat for 14 years from 1993 to 2007
has been most eventful and contributory in my
carrier. I would say that if you have not worked in
Surat your public health training in Gujarat is
incomplete. Surat is a city full of surprises and
paradoxes. It is referred as vertical slum, extension of
Mumbai, city of migrants (original residents of Surat
< 10%) or city of opportunities and STD. From Public
health point of view, it offers all sorts of illnesses –
both lifestyle related and sanitation and hygiene
associated characteristically seen in upper or lower
social class or migrants. All disasters manmade or
otherwise strike Surat frequently. SMC was first
Municipal Corporation in state with all MD (PSM) at
its top positions. With best possible coordination, we
tried innovative models in urban health care
especially in post plague period after 1994. During
this tenure I saw and participated in innumerable
conferences, workshops and trainings including
management of events like Plague, Bird Flu, recurring
outbreaks of Leptospirosis, Famous flood which
struck twice. Each one episode enriched me in terms
of knowledge, skill, ability to work in team and in
coordination with other departments. I also learned
during this period that how an event can be
organized at the shortest notice with minimum or nil
resources. When I joined Surat, Dr DM Saxena left for
state AIDS cell and his 5 – 6 orphaned PGs were taken
by Vikas madam under her wings. I asked her that can
I assist these PGs in their thesis work. She readily and
kindly agreed so again I became so called Co guide in
all these dissertations. Initially I joined at Surat alone
and my family joined later after few months. So, I had
the luxury of assisting 4 – 5 thesis works on daily
basis. This is also a period when I got few of the life
time finest friends and also few very bright and
laborious students. I would recall the name of Dr HG
Thakor who was a GP and the first PG student
registered under me in Surat. Very senior and
younger to me only by few months, he has been very
modest but very meticulous and hard working. Out of
his dissertation, he produced 4 original and 3 review
articles; all published in reputed journals like Indian
Journal of Paediatrics, Indian Journal of
Hypertension and IJCM. He also got the best paper
award in state conferences twice in succession which
I think is a sort of record. Finally, after serving with
several organizations, based on his technical
Healthline Journal Volume 8 Issue 2 (July-December 2017)
:: 11 ::
achievements, he has recently moved to USA on E11
visa. Point I want to make here is that such students
once in a while come to all of us and they are pure
delight to work with as they bring laurels to you with
minimum to nil efforts from your side. Secondly
between intelligence and the perseverance, later is
more contributory to the success.
We also had journal club in our department those
days where papers published in IJCM were to be
discussed, such was the enthusiasm and
preparedness of PGs, that every paper discussed was
dissected so harshly and extensively that the authors
would have withdrawn the paper if they get any
access to our discussion. I started sending these
comments to the Journal editor after thorough
editing and this I did 8-10 times in two years. At the
end Dr Sunder Lal, editor IJCM wrote to me that if you
are so good in criticizing the work of others, why
don't you join the editorial board? Thus, I became
reviewer in IJCM in 1999. I was the only Associate
professor who was also the member of editorial
board. Apparently, it was a thankless job rather
money was to be spent on postage etc. I did it
diligently and with honesty and till date, I am the one,
who has reviewed more than 100 articles with
around 60% rejection rate. This appointment as
reviewer 18 years ago was also a premonition for the
future event?
I owe a lot to Surat as it gave me a recognition
whereby I was handpicked to work at GSACS as APD
and by default also the Director of GSCBT later being
far more important post not known to me before the
joining. In both cases I was to report directly to the
Commissioner Health and Secretary Public Health
respectively. I was there during NACP phase 3 of 2007
– 11. It was the time when there were more funds,
more manpower, mandate for scaling up and lastly
excellent supervision from GOI where Ms. Sujatha
Rao was our DG NACO. It was success all over the
country and more so in Gujarat thanks to the
exc e l l e n t s u p e r v i s i o n a n d s u p p o r t f ro m
Commissioner health and equally good coordination
among Additional Directors of health, medical
Services & Medical Education. As a result, I received
undeservingly the credit of its success. It is here for
the first time I heard certain terms like PIP, AAP, SOE,
UC or UTC either unaudited or audited. Here I also
realized that in teaching line whatever you learn
visualize or dream all can be achieved if you become
part of the implementing system. I used to say that
GSACS and its team of CST has done much more in 4
years for AIDS patients than all clinicians of state put
together in the same period. In 2007 there were only
2 ARTCs catering to less than4000 patients and by
end of 2011, there were 24 ARTC with 36 link ARTC
catering to around 24000 patients on ART another
30000 on pre-ART registration. Incidentally the
concept of Link ART was developed by GSACS during
NACP phase 2 and India's first Link ART was started
in Himmatnagar during phase 3. So many patients
didn't come overnight and were brought for the
treatment thanks to the escalation of testing facilities.
Testing centres in the state increased from 380 to
1167 with testing of 2.5 lakhs per annum to 11.72
lakhs per annum in 2011. Though the sero
prevalence in all be it the general population or
voluntary blood donors or pregnant women or HRB,
or STI cases decreased but the enhanced detection
resulted in the increase in absolute number of
positives who were put on the ART. Similarly,
impressive achievements were there in other areas
too such as TI, Blood safety, STI clinics, IEC etc. While
some states were not able to utilize the approved
budget, we were able to demand and get the
additional allocation from the NACO out of the
savings from the unutilized funds of other states. I am
most contented and satisfied with this tenure. It will
be most stupid to say that I did all this. It was because
of the excellent team with me at GSACs and at
periphery – some of the faces I can see in the audience
as well, and equally excellent support and
supervision from the office of PD or the
Commissioner Health. Here I also realized that
people crib unnecessarily about lack of authority or
power. If you are correct and honest in your
intentions, you can use your power innovatively
Kumar Pradeep My journey through Preventive Medicine...
:: 12 ::
judiciously and achieve a lot in the same system. I also
learnt some important lessons of HR management
how to recruit and retain best people as far as
possible. Thanks to my boss Dr Amarjit Singh, in this
tenure only I also got opportunity to work in Modasa
outbreak of B hepatitis and illicit liquor tragedy in
Ahmedabad. It was indeed an honour when I
presented the response of state for Modasa outbreak
before the DGHS and team.
Excellent coordination which exists between
health medical service & medical education in
Gujarat is unique and unparalleled. While other
states have separate ministers for Health services
and Medical education, Gujarat has single ministry
and a post of single Commissioner where all directors
report. This convergence at Commissionerate level is
the secret of coordination.
I learnt two messages here
1. You are as good as your team members are and
your superiors support you or allow you.
2. Higher in the hierarchy you should have broader
vison.
This tenure though very satisfying no doubt was
full of stress of meeting deadlines, extensive travel
and extended and irregular working hours.
Moreover, I started missing the teaching. I decided to
quit and came back to the teaching which has been
my first and last extra marital affair. Here I was
entrusted the department at a new medical college.
So far, I worked at old and established medical
colleges which have their advantages and few
disadvantages. It was a new department to be
established with a very young bright and enthusiastic
team. Second senior person in the department was
also at least 16 – 17 years younger to me which in
academic terms mean almost two generations.
Except for Dr Rashmi and Dr Manish all were the
fresh postgraduates or just graduates. Paramedic and
support staff was also oven fresh. They came from
different colleges and so brought with them different
phi losophies . We used to have frequent
brainstorming to pick up the best of all colleges.
Advantage of a new college is that you don't have the
baggage of history and traditions and can try lot of
new things. My tenure at state government helped
me to get lot of trainings and projects in the
department which were implemented by the staff
with little or no grudge and wholehearted active
participation. Thanks to the support of everyone in
the department, we could make it one of the active
department more active than some old established
departments that too when we had no post-
graduation and minimum staff.
Another thing that happened at this time was the
chief editorship of Indian Journal of Community
Medicine. Again, to be honest there are many persons
in India and for that matter in Gujarat as well who are
more competent and deserving this job, but I was
asked to contest for it. I will ever be thankful to the
Gujarat fraternity for choosing me for this honour.
The selection rather election for this post was very
smooth thanks to the whole-hearted support of
everyone in Gujarat and strategic mobilization of
members to vote. Here I will mention the fact that we
don't have any rivalry among colleagues. The way all
HODs and their staff members supported my election
is un-parallel and can happen only in Gujarat. Once
the euphoria was over, I realized that this job has
more problems than privileges. There was a huge
outstanding financial liability. A high rejection rate of
80 – 90 percent is sure to make me enemy number 1
in the country. In addition to this there are other
responsibilities such as regular communication with
indexing agencies, correspondence with publishers,
RNI etc. With support from my colleagues in
IAPSMGC and health department, I could bring the
journal from red to black back in less than 2 years.
Two of my colleagues who are helping me in journal
work deserve a special mention namely Dr Rashmi
Sharma and Dr Harsh Baxi. By and large it is a
thankless job for them as the credits for that matter
discredits go to Chief Editor alone. Though their roles
are overlapping, Dr Rashmi while helps me in moving
the article up and down in the cycle, Dr Baxi deals
with financial matters and correspondence on behalf
Healthline Journal Volume 8 Issue 2 (July-December 2017)

:: 13 ::
of chief editor. Many times, the mail you see on my
behalf are totally written by him of course with my
concurrence. He also has a copy of my signature
which he pastes wherever deems fit. My one
achievement where I genuinely take pride is that I
have made these two guys fully competent, capable
and empowered to run a journal independently. Most
of the times I agree with the decision taken by Dr
Rashmi for an article, I also accept verbatim a letter
drafted by Dr Harsh. To be very blunt it would not
have been possible for me to run this journal for a day
without the support of these two persons.
Now in October 2017 I got retired from the
government job after a brief stay of 3 and half months
at BJ Medical College. What a prophetic way the
journey ended in 2017 at the same place precisely
where it started in 1984. Now I have joined a new
college. I hardly know anything other than PSM so
cannot do anything else. I will remain active and do
whatever I can in my full capacity. Basically, it is a
journey where this retirement from government job
was a brief stopover. After taking a break and
recuperating, journey goes on till I am there.
Retired professors and senior citizens have a habit
of offering unsolicited advises to the youngsters. I am
both so my few advice are as below.
1. Retain your minimum clinical skills because these
only make you superior than the MPH guys. Also
pick up the additional skills especially computer
related while doing post-graduation
2. In this subject, there is no substitute of field work.
It will teach you which many text books cannot.
Liaise with health departments be it ZP, MC or the
state team work with them or for them as much as
possible because they are the implementers of
what we learn or teach.
3. These guys in health department are sitting on the
mountains of data and at times don't know what to
do with these mountains except its upward
transmission. Work on this data with them
generate the evidence read paper which not only
improve your CV but also help the planners and
administrators in the policy, planning and action.
4. Fortune may not knock twice so grab it when it
knocks for the first time.
5. No efforts go wasted in long run though may look
wasted at that point of time. Focus on long term
gains only.
6. Networking and documentation of what you do is
crucial
7. Develop a speciality of your own within the
Community Medicine. Try to work in that area and
generate a body of work so overtime you become
truly an expert of that area at least within state if
not in India.
Before concluding, few words about the research
publications. MCI mandate is to get total 4
publications in entire carrier for promotions. To fulfil
this do that much as per the whims of MCI. But
thereafter do as you want. Selection of topic of
research work is utmost important. Mostly our
papers are reinvention of wheel and are inspired by
someone else work. Research work is noticed only
when it is different. I am registered at research gate.
My total 70 publications have 380 citations. While
most papers have nil to 1 or 2 citations, only 8 – 10
papers have more citations. All these papers are very
simple in terms of study design, sample size etc but
looked at the research problem from a different
angle. Please also note that barring one or two none
had any financial support
At the end, I cannot forget that originally, I am from
UP and don't belong to this place but the way I have
been adopted by everyone here – MAI TO BHUL
CHALI BABUL KA DESH PIYA KA GHAR PYARA LAGE.
Out of thousands of events, barring a few which can
be counted on the fingers of one hand only, I received
unconditional love affection and respect from each
one of you.
Finally, thanks giving to the most important
person. Whatever I have done in academic world, has
Kumar Pradeep My journey through Preventive Medicine...

:: 14 ::
been possible due to the one-person - wife in my life.
She is Dr Pushpa Gupta. All men are commitment
phobic and run away from marriage or at least from
domestic responsibilities. I have no hesitation in
saying that I am also a man. I can't say that she is the
best wife due to limited sample size but what I can say
there could not have been anything better for me.
Importantly, she is a very good mother of my two
children who have made me proud father and also a
rare commodity these days she is a very good
daughter in law.This all when she is professionally
equally qualified and working woman with more job
responsibilities. She bore my idiosyncrasies, tolerated
my mood swings and provided me a stress-free
environment where I could contribute in the area of
my interest.
Big thank you once again to IAPSM GC its office
bearers and members, organizing team of
Government Medical College, Surat especially Dr.
Kosambiya and Dr. Moitra.
Thank you all.
Healthline Journal Volume 8 Issue 2 (July-December 2017)

:: 15 ::
Healthline Journal Volume 8 Issue 2 (July-December 2017)
A Cross-Sectional Study on Intranatal and Postnatal Healthcare Usage among
Mothers in Fishermen Community of Kovalam Area in Kanchipuram District,
Tamil Nadu1 2 3 4
Raja Danasekaran , Pavithra Raja , Karnaboopathy Ranganathan , Jegadeesh Ramasamy1 3 4 Associate Professor, Bio-Statistician, Professor, Department of Community Medicine, Shri Sathya Sai Medical
College and Research Institute, Kancheepuram, Tamil Nadu, India2 Final MBBS student, Shri Sathya Sai Medical College and Research Institute, Kancheepuram, Tamil Nadu, India
Correspondence: Dr. Raja Danasekaran, E mail: [email protected]
Abstract :
Introduction: Globally, most of the maternal deaths are occurring in the developing countries. Both
intranatal and postnatal healthcare services play a major role in improving the maternal health as well as
reducing the maternal mortality. Aims & Objectives : To assess the utilization of intranatal and postnatal
health services and to identify the factors influencing their utilization among women of fishermen
population in Kanchipuram district, Tamil Nadu. Method : The cross-sectional study was done among the
mothers in Kovalam area of Kancheepuram district. Details were collected using a pre-tested questionnaire
and analyzed using statistical software. Results : The study included 284 mothers of which 35% were
illiterates. Delivery was conducted by skilled personnel in 80.28% of pregnancies. During the postnatal
period 35.91% of the mothers had more than one postnatal visit, 54.58% mothers had only one visit and
9.51% had no postnatal visit. 48.24% of the mothers were beneficiaries of Janani Suraksha Yojana scheme
and also only 45.77% had received cash benefits from Dr. Muthulakshmi Reddy scheme. Better levels of
education and socio economic class were found to be significantly associated with better utilization of
intranatal and postnatal services. Conclusion : This study reveals the fact that maternal health service
schemes were not fully utilized by the community and improving the literacy status & socio-economic status
will have a better impact on utilization.
Key words : Fishermen, Intranatal care, Maternal health, Postnatal care, Utilization.
Original Article
Introduction :
According to World Health Organization (WHO)
reports 830 women are dying every day from
pregnancy or childbirth related complications
worldwide. The maternal mortality ratio in
developed countries is 12 per lakh live births in
contrast to 239 per lakh live births in developing [1]
countries. India alone accounts for 45,000
maternal deaths in 2015 and the Maternal Mortality
Ratio (MMR) in our country is 167 per lakh live births [2]during 2011-13. It is of utmost importance to have
proper intranatal care by skilled health personnel
and postnatal care in the weeks after child birth, as
timely management can save the lives of both mother
and child.
In India, the total fishermen population was about
4 million living in 8.64 lakh families. 61% of the
fishermen population was living below the poverty
line. Sex ratio among them was 928 females per 1000 [3]males and the family size on an average was 4.63.
The fishermen population is being considered as a
marginalized and special group owing to their varied
socio-cultural practices, low socio-economic status,
low literacy levels and possibly less awareness about
the healthcare services being provided. Taking into
account of the above details, this study has been
planned to identify the usage of intranatal and
postnatal health care services and the factors
influencing the usage among fishermen population in
Tamil Nadu.

:: 16 ::
Danasekaran et al Intranatal and Postnatal Healthcare Services Usage...
Method :
This study was a community based cross-sectional
study to assess the utilization of maternal health
services among women of fishermen population and
it was conducted among women residing in Kovalam
(fishermen area) village in Thiruporur taluka of
Kanchipuram district. The study was done between
April 2015-September 2015 (6 months). The study
was done among married women who have delivered
a child in the past 5 years, who were a resident of the
study area. Unmarried women, those women who
were not residents of the study area and those who
were not willing to participate in the study were
excluded from the study.
The sample size was calculated on the basis of
49.6% of pregnant women having received postnatal
care in rural areas of Kancheepuram, district as per 2 2DLHS- 4 data, using the formula, N=Z p×q/d , α
[4]sample size comes to 265. Assuming 10% non
responsiveness, the sample size is taken as 290. For
the study purpose Kovalam village in Thiruporur
taluka of Kanchipuram district was chosen, since the
area is highly inhabited by fishermen population.
With the help of the local health authorities and the
maternal-child health registers available with them, a
complete list of mothers from the fishermen families,
who have delivered in last 5 years was prepared and
the study subjects were selected by simple random
technique using computer generated random
numbers.
The study was done by using a pre- tested, semi-
structured questionnaire to collect data from the
participants. The study questionnaire was divided
into three parts as follows: Part I- Socio Demographic
details- Basic details such as age at child birth,
education, occupation, income, etc. Part II-Details
regarding delivery by skilled personnel (doctors/
trained nurse/trained dais/etc.) or unskilled
personnel (untrained dais/quacks/etc.), mode of
delivery, place of delivery and details of any
intranatal complications; Part III- Details about the
number of post natal visits, any complications during
the period, intake of iron and folic acid tablets and
about family planning methods adopted were
enquired. Whether received benefits under Dr.
Muthulakshmi Reddy scheme (cash benefit scheme
in Tamil Nadu)/ Janani Suraksha Yojana (JSY) was
also asked. Socio-economic classification was done
using Modified BG Prasad (2015) classification
based on Tamil Nadu Consumer Price Index of [5]August 2015 value of 124.5.
Initially permission to conduct the study was
obtained from Institutional ethical committee. With
the help of the local health worker, the eligible
mothers were identified. Informed and written
consent was obtained from the participants.
Confidentiality was guaranteed to each participant.
Details about the basic socio-demographic profile
and utilization of health services were obtained as
per the questionnaire. Data collected was entered
into MS Excel and then analyzed using SPSS 16.0
software. Categorical data were represented by
percentages and proportions. To test the association
Chi square test was used for categorical variables
and P value < 0.05 was taken as statistically
significant.
Results :
The study included 284 mothers from Kovalam
area of Kancheepuram district. Among them, 57%
(162) were in the age group of 21-25 years, 22% (63)
were <20 years, 19% (54) were of 26-30 years and
only 2% (5) were >30 years at the time of child birth.
Among the study participants 35.21% (100) were
illiterates, 34.51% (98) have studied till primary
education, 19.37% (55) have done secondary
education, 9.86% (28) have done some under
graduation and remaining 1.06% (3) have studied
till post graduation. With regards to their
occupation, 37.68% (107) of the mothers were
homemakers, 45.42% (129) were unskilled workers,
6.69% (19) were having semi skilled job and
remaining 10.21% were doing skilled work. Among
the mothers enquired 61.27% (174) were having
their first child, 27.11% (77) having second child,
8.45% (24) were having their third and remaining
3.17% (9) were having their fourth child. According
to modified B.G.Prasad classification 45.07% (128)
of the study subjects belong to socio-economic class

VARIABLE SUB CATEGORY FREQUENCY (N=284) PERCENTAGE (%)
No. of post natal 1 155 54.58
visits 2 88 30.98
3 8 2.82
>3 6 2.11
No visit 27 9.51
No. of Iron and folic <50 122 42.96
acid tablets taken 50-100 45 15.85
100-200 15 5.28
Not taken 102 35.92
Any complications Yes 89 31.34
during post natal No 195 68.66
period
Advised about family Yes 251 88.38
planning methods No 33 11.62
Type of contraception OCP 23 8.10
adopted IUD 120 42.25
Condom 9 3.17
Permanent 66 23.24
Not used 66 23.34
Beneficiary of JSY Yes 137 48.24
scheme No 147 51.76
Beneficiary of Yes 130 45.77
Dr. Muthulakshmi
Reddy Scheme No 154 54.23
Table 2 : Utilization of Postnatal Healthcare services
Healthline Journal Volume 8 Issue 2 (July-December 2017)
Table 1: Utilization of Intranatal Healthcare services
VARIABLE SUB CATEGORY FREQUENCY (N=284) PERCENTAGE (%)
Skilled attendance at Skilled 228 80.28
delivery Unskilled 56 19.72
Mode of delivery Normal 157 55.28
Caesarean 127 44.72
Any complications Yes 118 41.55
during delivery No 166 58.45
Type of complication Bleeding 31 26.27
Fits 14 11.86
Diabetes mellitus/ 37 31.36
Hypertension
Fever 16 13.56
Others* 20 16.95
:: 17 ::
*-prolonged/obstructed labour, placenta related complications, uterine complications, etc.

Table 3 : Factors in utilization of Intranatal health services
Variable Percentage (n) Skilled Chi square df P value
attendance value
at delivery
Age at child birth (in completed years)
<20 63 85.7
21-25 162 77.8 3.059 3 0.383
26-30 54 79.6
>30 5 100
Education
Illiterate 100 82
Primary 98 84.7 16.683 3 0.001*
Secondary 55 61.8
Graduate & above 31 93.5
Occupation
Home maker 107 78.5
Unskilled work 129 79.1 3.366 3 0.339
Semi skilled work 19 78.9
Skilled work 29 93.1
Birth order of child
1 174 79.9
2 77 83.13 0.835 2 0.659
3 33 75.8
Socio Economic Class
I 30 100
II 128 74.2 13.345 3 0.004*
III 119 83.2
IV 75 7.1
II, 41.9% (119) belong to class III, 10.56% (30)
belong to class I and only 2.46% (7) belong to class IV.
Delivery was conducted by skilled personnel in
80.28% (228) of pregnancies, of which 37.72%
deliveries happened in primary health centres,
47.81% delivered in government hospitals and
18.86% delivered in private hospitals. 19.72% (56) of
deliveries were conducted by untrained personnel.
55.28% of the mothers had normal delivery and
44.72% had caesarian delivery. Also 41.55% have got
some complications during delivery, which includes
severe bleeding, epilepsy, diabetes/hypertension,
fever and others. (Table 1)
In the postnatal period, 54.58% (155) mothers
had only one postnatal visit, 30.98% had two visits,
4.93% of mothers had three or more visits and 9.51%
of the mothers had no visits. Also, 35.92% of the
mothers did not take any iron and folic acid tablets
and 88.38% of the mothers were advised regarding
family planning in the postnatal period. Various
family planning methods adopted were intra uterine
devices (42.25%), oral contraceptives (8.1%),
condoms (3.17%), permanent sterilization (23.24%)
and the other 23.34% were not practicing any
method.
*- statistically significant :: 18 ::
Danasekaran et al Intranatal and Postnatal Healthcare Services Usage...
Healthline Journal Volume 8 Issue 2 (July-December 2017)
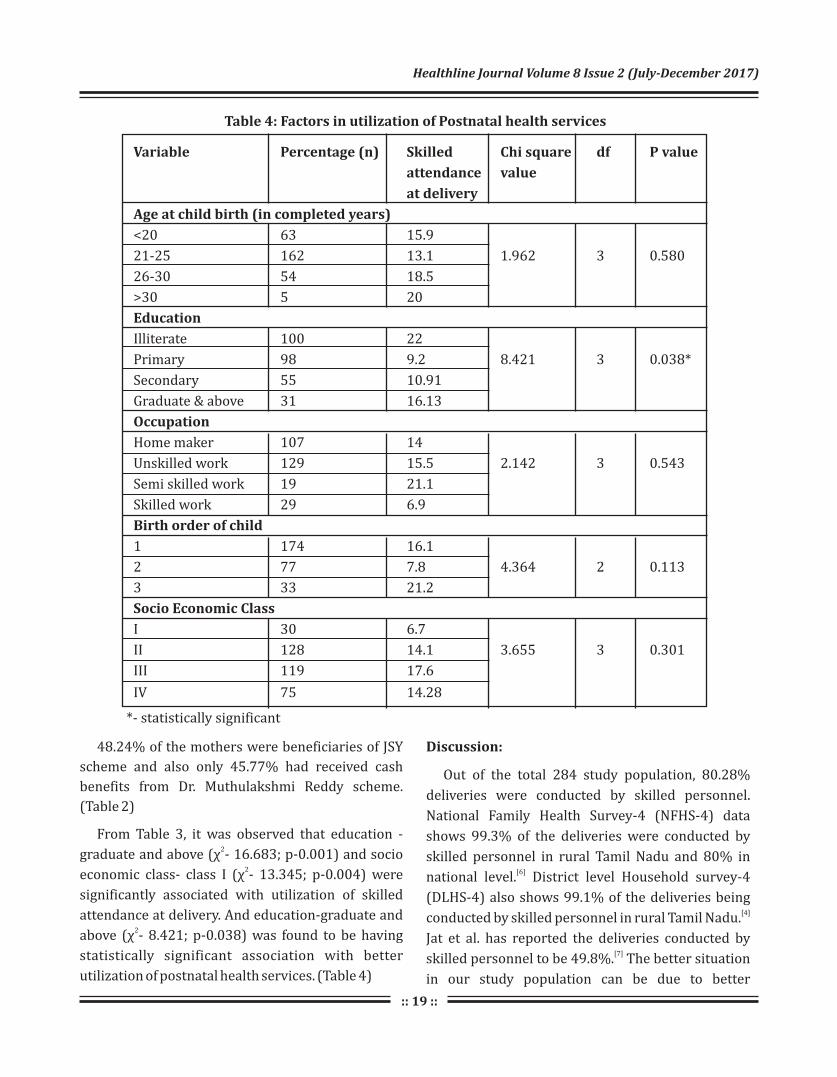
Table 4: Factors in utilization of Postnatal health services
48.24% of the mothers were beneficiaries of JSY
scheme and also only 45.77% had received cash
benefits from Dr. Muthulakshmi Reddy scheme.
(Table 2)
From Table 3, it was observed that education -2
graduate and above (χ - 16.683; p-0.001) and socio 2
economic class- class I (χ - 13.345; p-0.004) were
significantly associated with utilization of skilled
attendance at delivery. And education-graduate and 2above (χ - 8.421; p-0.038) was found to be having
statistically significant association with better
utilization of postnatal health services. (Table 4)
Discussion:
Out of the total 284 study population, 80.28%
deliveries were conducted by skilled personnel.
National Family Health Survey-4 (NFHS-4) data
shows 99.3% of the deliveries were conducted by
skilled personnel in rural Tamil Nadu and 80% in [6]
national level. District level Household survey-4
(DLHS-4) also shows 99.1% of the deliveries being [4]conducted by skilled personnel in rural Tamil Nadu.
Jat et al. has reported the deliveries conducted by [7]
skilled personnel to be 49.8%. The better situation
in our study population can be due to better
Variable Percentage (n) Skilled Chi square df P value
attendance value
at delivery
Age at child birth (in completed years)
<20 63 15.9
21-25 162 13.1 1.962 3 0.580
26-30 54 18.5
>30 5 20
Education
Illiterate 100 22
Primary 98 9.2 8.421 3 0.038*
Secondary 55 10.91
Graduate & above 31 16.13
Occupation
Home maker 107 14
Unskilled work 129 15.5 2.142 3 0.543
Semi skilled work 19 21.1
Skilled work 29 6.9
Birth order of child
1 174 16.1
2 77 7.8 4.364 2 0.113
3 33 21.2
Socio Economic Class
I 30 6.7
II 128 14.1 3.655 3 0.301
III 119 17.6
IV 75 14.28
*- statistically significant
:: 19 ::
Kebede et al. has also reported that distance from the
health facility was a major factor leading to better [19]health service utilization. Jacobs et al. has reported
that utilization of antenatal services also serve as a
determinant of intranatal and postnatal care [20]utilization. Exposure to media and women with
low parity were identified as factors influencing their [21]
utilization, according to a study by Regassa N. Huq
NL et al. has advised an integrated maternal
healthcare intervention by deploying more skilled
birth attendants in remote areas for promotion of [22]
skilled care during childbirth.
Conclusion:
The study which was done among the fishermen
community found out the percentage of deliveries
conducted by skilled personnel were less than the
average in the state and also more than half of the
mothers were not covered under both the
state/central cash benefit schemes. More than 90%
of the mothers had atleast one postnatal visit. Better
socio-economic status and higher levels of education
were identified to be associated with better
utilization of intranatal and postnatal services. The
study proves the need for improving awareness and
utilization of maternal healthcare services among the
mothers in the community, especially among those
residing in the underserved areas like fisherman
community.
Recommendations:
The study has reported the fact that intranatal &
postnatal healthcare services were not utilized fully
by the community and fishermen population being a
special group has to given the needed attention from
the healthcare delivery system. Apart from
improving the level of awareness about the services,
more impetus on literacy and socio-economic
development of the community has to be given.
Declaration:
Funding: Nil
Conflict of Interest: Nil
:: 20::
Danasekaran et al Intranatal and Postnatal Healthcare Services Usage...
availability of healthcare facilities and personnel in
the study area. Lancet Maternal Survival Steering
Group report by Campbell OM et al. has also reported
that effective intrapartum care is needed in order to [8]
reduce maternal mortality.
During the postnatal period 90.49% of the mothers
had atleast one postnatal visit. According to DLHS-4
data only 63% of the mothers had postnatal visits in [4]
rural Tamil Nadu within two weeks of delivery.
48.24% of the mothers were beneficiaries of JSY
scheme and also only 45.77% had received cash
benefits from Dr. Muthulakshmi Reddy scheme. As
per NFHS-4 data, only 43.8% of mothers received [5]cash benefits from JSY scheme. More than half of the
mothers have to be covered under the scheme in the
future.
Higher levels of education (graduates & above)
and socio economic class I were found to be
significantly associated with better utilization of
intranatal services. Kesterton AJ et al. in their study
also found that economic status was a major factor in
institutional care seeking for child birth in rural [9]
India. And only higher education (graduate and
above) was found to have statistically significant
association with better utilization of postnatal health
services. In other studies too, socio economic status
and mother's education were found to have
association with better utilization of either intranatal [10-15]
or postnatal services. In a study done by Van Eijk
AM et al. in Kenya, accessibility to health facility was
also found to be a significant determinant of [16]
institutional care for delivery. Apart from
education and economic status, maternal health
knowledge, birth interval and number of household
members were also identified as determinants
of facility based care for childbirth by Kawakatsu [17]
Y et al.
A study done in a special community in
Bangladesh by Islam M R et al. has reported a very
low level of postnatal service usage (6.2%) and the
reasons were level of education, distance to the [18]service centers and exposure to any mass media.

21
Healthline Journal Volume 8 Issue 2 (July-December 2017)
13. Chakraborty N, Islam MA, Chowdhury RI, Bari W, Akhter HH.
Determinants of the use of maternal health services in rural
Bangladesh. Health Promotion International 2003; 18: 327-37.
14. Babalola S, Fatusi A. Determinants of use of maternal health
services in Nigeria: looking beyond individual and household
factors. BMC Pregnancy and Child Birth 2009, 9:43
15. Jolly SP, Rahman M, Afsana K, Yunus FM, Chowdhury AMR.
Evaluation of Maternal Health Service Indicators in Urban Slum
of Bangladesh. PLoS ONE. 2016;11(10):e0162825.
doi:10.1371/journal.pone.0162825. [PubMed]
16. Anna M van Eijk, Hanneke M Bles,Frank Odhiambo, John G Ayisi,
Ilse E Blokland, Daniel H Rosen, Kubaje Adazu, Laurence Slutsker
and Kim A Lindblade. Use of antenatal services and delivery care
among women in rural western Kenya: a community based
survey. Reproductive Health. 2006;3:2. doi:10.1186/1742-4755-
3-2. [PubMed]
17. Kawakatsu Y, Sugishita T, Oruenjo K, Wakhule S, Kibosia K, Were
E, Honda S. Determinants of health facility utilization for
childbirth in rural western Kenya: cross-sectional study. BMC
Pregnancy Childbirth 2014; 14(1):265. [PubMed].
18. Islam M R, Odland J O. Determinants of antenatal and postnatal
care visits among Indigenous people in Bangladesh: a study of the
Mru Community. Rural and Remote Health 2011; 11: 1672.
19. Kebede A, Hassen K, Nigussie Teklehaymanot A. Factors
associated with institutional delivery service utilization in
Ethiopia. International Journal of Women's Health. 2016;8:463-
475. doi:10.2147/IJWH.S109498. [PubMed].
20. Jacobs C, Moshabela M, Maswenyeho S, Lambo N, Michelo C.
Predictors of Antenatal Care, Skilled Birth Attendance, and
Postnatal Care Utilization among the Remote and Poorest Rural Communities of Zambia: A Multilevel Analysis. Frontiers in Public
Health 2017;5:11. doi:10.3389/fpubh.2017.00011. [PubMed]
21. Regassa N. Antenatal and postnatal care service utilization in
southern Ethiopia: a population-based study. African Health
Sciences. 2011;11(3):390-397. [PubMed].
22. Huq NL, Ahmed A, Haque N al, Hossain M, Uddin J, Ahmed F,
Quaiyum MA. Effect of an integrated maternal health
intervention on skilled provider's care for maternal health in
remote rural areas of Bangladesh: a pre and post study. BMC
Pregnancy and Childbirth. 2015;15:104. [PubMed]]
References :
1. World Health Organization, UNFPA and the World Bank: Trends
in maternal mortality: 1990 to 2015 estimates developed by
WHO, UNICEF, UNFPA and the World Bank Geneva. World Health
Organisation 2015. Available from: http://apps.who.int/iris/
bitstream/10665/194254/1/9789241565141_eng.pdf?ua=1
[Last accessed on 2016 December 21]. 2
2. Registrar General of India: Sample registration system-special
bulletin on maternal mortality in India 2007-2009. Office of
Registrar General of India New Delhi 2011. Available from:
censusindia.gov.in/Vital...Bulletins/Final-MMR%20Bulletin-
2007-09_070711.pdf [Last accessed on 2016 Dec 28].
3. Fisheries and fishing communities in India. Available from:
http://indianfisheries.icsf.net/ [Last accessed on 2016 March
12].
4. District Level Household and Facility survey -4. (2012-13)
Ministry of Health and Family Welfare. Government of India.
International institute for population sciences. Available from:
https://nrhmmis.nic.in/DLHS4/Tamilnadu/District%20Factsh
eets/Khancheepuram.pdf [Last accessed on 2016 March 20].
5. Consumer Price Index Numbers on Base 2012=100 for Rural,
Urban and Combined for the month of August, September 2015.
Press Information Bureau, Ministry of Statistics & Programme
Implementation, Government of India. Available from: http://
pib.nic.in /newsite /PrintRelease.aspx?relid=128646 [Last
accessed on 2016 March 21]
6. National Family Health Survey-4, (2015-16). Ministry of Health
and Family Welfare, Government of India, International Institute
fo r Po p u l a t i o n S c i e n c e s . Ava i l a b l e f ro m : h t t p : / /
www.rchiips.org/nfhs/FCTS/TN/Kancheepuram.pdf. [Last
accessed on 2016 Jan 20].
7. Jat TR, Ng N, San Sebastian M. Factors affecting the use of
maternal health services in Madhya Pradesh state of India: a
multilevel analysis. International Journal for Equity in Health.
2011;10:59. doi:10.1186/1475-9276-10-59. [PubMed].
8. Campbell OM, Graham WJ. Strategies for reducing maternal
mortality: getting on with what works. Lancet 2006;
;368(9543):1284-99. [PubMed].
9. Kesterton AJ, Cleland J, Slogett A, Ronsmans C. Institutional
delivery in rural India: the relative importance of accessibility
and economic status. BMC Pregnancy and Childbirth 2010, 10:30.
10. Adogu PO, Egenti BN, Ubajaka C, Onwasigwe C, Nnebue CC.
Utilization of maternal health services in urban and rural
communities of Anambra State, Nigeria. Nig J Med 2014;
23(1):61–9. [PubMed]
11. Alam N, Hajizadeh M, Dumont A, Fournier P. Inequalities in
Maternal Health Care Utilization in Sub-Saharan African
Countries: A Multiyear and Multi-Country Analysis. PLoS ONE
2015;10: 1-16.
12. Tura G. Antenatal care service utilization and associated factors
in Metekel zone, Northwest Ethiopia 2009; 19: 111-118.
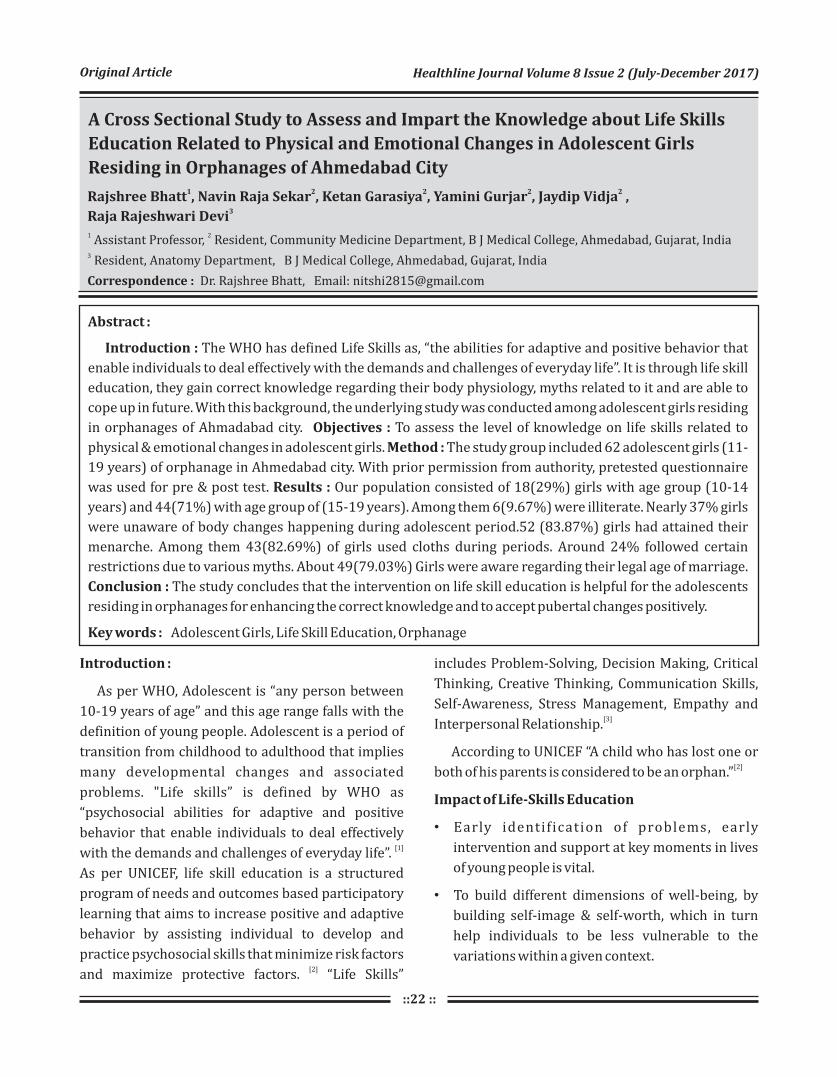
::22 ::
Healthline Journal Volume 8 Issue 2 (July-December 2017)
A Cross Sectional Study to Assess and Impart the Knowledge about Life Skills
Education Related to Physical and Emotional Changes in Adolescent Girls
Residing in Orphanages of Ahmedabad City1 2 2 2 2
Rajshree Bhatt , Navin Raja Sekar , Ketan Garasiya , Yamini Gurjar , Jaydip Vidja , 3
Raja Rajeshwari Devi1 2 Assistant Professor, Resident, Community Medicine Department, B J Medical College, Ahmedabad, Gujarat, India3 Resident, Anatomy Department, B J Medical College, Ahmedabad, Gujarat, India
Correspondence : Dr. Rajshree Bhatt, Email: [email protected]
Original Article
Abstract :
Introduction : The WHO has defined Life Skills as, “the abilities for adaptive and positive behavior that
enable individuals to deal effectively with the demands and challenges of everyday life”. It is through life skill
education, they gain correct knowledge regarding their body physiology, myths related to it and are able to
cope up in future. With this background, the underlying study was conducted among adolescent girls residing
in orphanages of Ahmadabad city. Objectives : To assess the level of knowledge on life skills related to
physical & emotional changes in adolescent girls. Method : The study group included 62 adolescent girls (11-
19 years) of orphanage in Ahmedabad city. With prior permission from authority, pretested questionnaire
was used for pre & post test. Results : Our population consisted of 18(29%) girls with age group (10-14
years) and 44(71%) with age group of (15-19 years). Among them 6(9.67%) were illiterate. Nearly 37% girls
were unaware of body changes happening during adolescent period.52 (83.87%) girls had attained their
menarche. Among them 43(82.69%) of girls used cloths during periods. Around 24% followed certain
restrictions due to various myths. About 49(79.03%) Girls were aware regarding their legal age of marriage.
Conclusion : The study concludes that the intervention on life skill education is helpful for the adolescents
residing in orphanages for enhancing the correct knowledge and to accept pubertal changes positively.
Key words : Adolescent Girls, Life Skill Education, Orphanage
Introduction :
As per WHO, Adolescent is “any person between
10-19 years of age” and this age range falls with the
definition of young people. Adolescent is a period of
transition from childhood to adulthood that implies
many developmental changes and associated
problems. "Life skills” is defined by WHO as
“psychosocial abilities for adaptive and positive
behavior that enable individuals to deal effectively [1]with the demands and challenges of everyday life”.
As per UNICEF, life skill education is a structured
program of needs and outcomes based participatory
learning that aims to increase positive and adaptive
behavior by assisting individual to develop and
practice psychosocial skills that minimize risk factors [2]and maximize protective factors. “Life Skills”
includes Problem-Solving, Decision Making, Critical
Thinking, Creative Thinking, Communication Skills,
Self-Awareness, Stress Management, Empathy and [3]Interpersonal Relationship.
According to UNICEF “A child who has lost one or [2]
both of his parents is considered to be an orphan.”
Impact of Life-Skills Education
• Early identification of problems, early
intervention and support at key moments in lives
of young people is vital.
To build different dimensions of well-being, by
building self-image & self-worth, which in turn
help individuals to be less vulnerable to the
variations within a given context.
•

It is through life skill education, they gain correct
knowledge regarding their body physiology, myths [4]related to it and are able to cope up in future.
In orphan adolescents this transition becomes
more vulnerable and important in many contexts.
They may be deprived of this crucial information and
knowledge due to lack of personal attention towards
them.
An international children's charity has found that
among 20 million of child population in India 4% are [4]
orphans.
So, by assessing and imparting life skill education
to orphan adolescent girls related to physical and
emotional changes in adulthood will help them to
cope up in future. 'Life Skills' provide primordial
prevention against health problems, by reinforcing
positive behavior and preventing health problems.
Method :
This was a cross sectional study carried out in two
randomly selected orphanage (Mahipatram Ashram
and Vikas Gruh) in Ahmedabad city which had a
higher adolescent girls enrollment. All the 62
adolescent girls of 10-19 years of age present during
our visit were included in the study. Prior permission
from the concerned authority of Mahipatram Ashram
and Vikas gruh was obtained. The questioner was a
self administered checklist. Same format was used
for pre test & post test. In between two test life
education session was conducted by surveyors. And
post test was conducted the next day.
The data were analyzed in excel using appropriate
tests.
Results & Discussion :
Population of Adolescent (10-19 years) in India is
more than 236.5 million (19.9%), which is very high
compare to China (191 million, 2.14%) & USA (43 [5]
million, 13.8%).
Adolescent girls in India constitute almost 47
percentage of the adolescent population. Adolescent
period is the formative period when maximum
amount of changes take place and pubertal change is [6]one of them.
Our study population consist of 62 orphan
adolescent girls among which 18(29%) belong to
10-14 years age group and 44(71%) belong to
15-19 years age group. As per census 2011 sex ratio
among adolescent age group between 10-19 years is
898 and literacy status in adolescent age group of [5]
same is 88.2 %.
In this orphanage, Maximum girls 29 (46.78%)
were studying in secondary level of education
followed by 11(17.75%) in higher secondary .There
were 6 (9.67%) girls who were illiterate. (Table 1)
Table 1: Educational Status of the Study Population
Educational Status Frequency Percentage
Illiterate 6 9.67
Primary education 11 17.75
Secondary education 29 46.78
Higher secondary
education or college 16 25.8
Total 62 100
*Illiterate were guided and explain by faculty members.
Only 39 (62.90%) girls were aware of various body changes happening during adolescent period. (Table 2)
As per R B Jain out of 320, 212 (66.3%) studied,
were aware of at least one adolescent change(s)
whereas, when probed and further asked to
enumerate the changes taking place in them,
272/320 (85%) adolescents could narrate at least [7]
one such change.
Table 2: Awareness among Orphanage Girls Regarding Body
Changes Happening During Adolescent Period
Awareness about body changes Pre test Post testhappening during adolescent period
Aware 39(62.90%) 52(83.87%)
Not aware 23(37.10%) 10(16.17%)
Chi Square value 6.98, p < 0.05 .
:: 23 ::
Bhatt et al Knowledge about Life Skill Education...

:: 24 ::
In a quantitative survey by Kotecha et al, results
showed that 69.8% male and 52.3% female
adolescents perceived physical changes whereas,
5.5% males and 66.1% female adolescents were [8]
aware of sexual changes.
There was a significant change between pre test
and post test knowledge regarding awareness of
body changes happening during adolescent period
with chi square value 6.98, p < 0.05.
When asked about various body changes
occurring in boys and girls of adolescent age group
differently, nearly 27 (43.55%) girls were able to
enumerate them all correctly for female changes but
only 6(9.68%) were able to tell about changes
happening in boys during this period. (Table 3)
Table 3 : Awareness among Orphanage Girls Regarding
Body Changes in Males And Females
Awareness about
body changes Pre test Post test
Aware only about
male changes 6(9.68%) 38(61.29%)
Aware only about
female changes 27(43.55%) 47(75.80%)
Chi Square value 7.151, p < 0.05
In a community-based door-to-door survey by
Nair, et al in village-Gazipur in East Delhi Almost all
the girls were aware of the weight and height gain
that occurred with puberty; 59.7% and 33.8% of the
adolescent girls were aware of the breast
enlargement and growth of axillary/pubic hair
respectively that accompanied puberty. Two-thirds
of the study subjects had knowledge of [9]
menstruation.
There was a significant change between pre test
and post test knowledge regarding awareness of
male and female body changes respectively
happening during adolescent period with chi square
value 7.151, p < 0.05
Menstruation is a physiological phenomenon
which is unique to females that begins in
adolescence. It is monthly uterine bleeding for 4-5
days coming regularly every 28 days. Normally
females get 13 menses in a year and around 400
menses in her reproductive life. The first
menstruation is termed as “menarche”. The age of [10]menarche is between 10- 16 years in India. In
those orphan girls, 52(83.87%) girls had attained
their menarche. Among them only 9 (17.31%) girls
used sanitary pads and 43 (82.69%) used cloths
during menstruation.(Table 4)
Table 4 : Practices Followed during Menstruation
Used during menses Frequency Percentage (%)
Sanitary Pad 9 17.31
Cloth piece 43 82.69
Total 52 100
Incidence of reproductive tract infection is 70%
more common among these women. Moreover,
hygiene is neglected by girls especially in rural areas,
due to lack of availability and inability to afford [11]sanitary napkins. A study conducted in
Aurangabad, India reported that 60% of urban girls
used market available sanitary napkins whereas; this [12]was limited to 6% of rural girls.
A survey by A Das Gupta Depicting the practices
during menstruation shows that 18 (11.25%) girls
used sanitary pads during menstruation, 68 (42.5%)
girls used old cloth pieces and 10 (6.25%) girls used
new cloth pieces. 64 (40%) girls used both cloth [13]
pieces and sanitary pads during menstruation.
Though menstruation is a natural and normal
physiological process for all healthy adult women as
ever, it has been surrounded by secrecy, negativity
and myths in much society. It is still clouded by socio-
cultural restriction and taboos and associated with [14]various myth and misconception.
There were few restriction followed by girls in
orphanage during menses like not entering temple,
going to store room containing grains etc.
A study conducted in Ranchi, India reported that
45.5% of the girls face social restrictions, majority of
them were restricted in religious practices, wearing [15]
new clothes, cooking food, etc.
Healthline Journal Volume 8 Issue 2 (July-December 2017)

:: 25 ::
The United Nations International Children's
Emergency Fund (UNICEF) statistics (2003-2008)
found that only 20% of the adolescent females are
aware about the comprehensive knowledge on
HIV/AIDS, while the percentage in male counterpart
is about 36%.
In a slum surveyed by Henmanta et al out of the
400 adolescent girls, 63 (15.75%) said that HIV/AIDS
transmits through unsafe sex, 94 (23.5%) through
contaminated blood transfusion, 19 (4.75%) through
mother to child during pregnancy and child birth, 48
(12%) through breast feeding, 24 (6%) by sharing
contaminated needles/syringes, and 217 (54.25%)
were not aware exactly how HIV/AIDS transmits [16]from one person to another.
Legal age of marriage in India for girls is more than
18 years and for boys it is more than 21 years. About
30(48.38%) girls knew about the legal of marriage
for boys and girls.
Aarthi Gopal found that one fifth (21%) and one
third (31%) of the study subjects knew the legal age
for marriage to be 21 years for boys and 18 years for
girls respectively. One third of the subjects felt that
the desirable age for marriage in boys and girls [17]
should be between 21-25 years.
Conclusion:
The result of present study revealed a strong
association of increase in awareness and knowledge
of adolescent girls after life skill education session.
Declaration:
Funding: Nil
Conflict of Interest: Nil
References :
1. Family Health International, India Country Office. Life skill
education toolkit guided form orphan and vulnerable children in
India,2007. part 2 page no. 35
2. Definition of Terms [Internet]. UNICEF. 2018 [cited 05 June
2017]. Available from: https://www.unicef.org /lifeskills/
index_7308.html
3. Clare Hanbury. Life Skill: An active learning Handbook from
working with street children. 2002. Page no. 7.
4. SOS Children's Villages, Canada. India now home to 20 million
orphan. https://www.sos childrensvillage.ca>india. (last access
date 01/06/2017)
As per A Das Gupta regarding different types of
restrictions practiced during menstruation, only 24
(15%) girls did not practice any restriction. 136
(85%) girls practiced different restrictions during
menstruation. Among them, 96 (70.59%) girls did
not attend any religious occasions, 68 (50%) girls did
not eat certain foods such as sour foods, banana,
radish and palm. Fifty-eight (42.65%) girls did not
play, 46 (33.82%) girls did not perform any
household work, 22 (16.18%) girls did not attend
school and 14 (10.29%) girls did not attend any [13]marriage ceremony during the menstrual period.
(Table 5)
Table 5: Misconceptions regarding restrictions (Social/
Followed During Menstrual Period
Yes 15(24.19%) 3(4.84%)
No 47(75.81%) 59(95.16%)
Chi square value 9.358 , p < 0.05
There was a significant change between pre test
and post test knowledge regarding myths and
restriction followed during menstrual period with
chi square value 9.358, p < 0.05. At least 21 (33.8%)
respondents were aware of a disease named AIDS.
But only 10(16.12%) were able to write full form of
AIDS and only 6(28.57%) were able to enumerate at
least two way of HIV transmission. (Table 6)
Table 6 : Knowledge about AIDS
Knowing the Pre Test Post Test
word “AIDS”
Yes 21(33.87%) 53(85.48%)
No 41(66.12%) 9(14.51%)
Chi Square 34.3178 p< 0.05
Full form of “AIDS” Pre Test Post Test
Know 10(16.12%) 36(58.06%)
Don't Know 52(83.87%) 26(41.93%)
Chi Square 23.36 p < 0.05
Misconceptions
about restrictions
Before education
(Pretest)
After education
(post test)
Bhatt et al Knowledge about Life Skill Education...
:: 26 ::
5. United Nations, New York. World population prospects. The 2012
Revision UN 2013. Page no. 27.
6. Dawn CS. Textbook of obstetrics, neonatology and reproductive
and child health education. Revised. 2004.
7. Jain RB, Kumar A, Khanna P. Assessment of self-awareness among
rural adolescents: A cross-sectional study. Indian J Endocr Metab
Year : 2013, Volume : 17 : 7, Page : 367-372
8. Kotecha PV, Patel S, Baxi RK, Mazumdar VS, Misra S, Modi E,
Reproductive health awareness among rural school going
adolescents of Vadodara district. Indian J Sex Transm Dis
2009;30:94-9. [PUBMED]
9. Nair P, Grover VL, Kannan AT. Awareness and practices of
menstruation and pubertal changes amongst unmarried female
adolescents in a rural area of East Delhi. Indian J Community Med
2007;32:156-7.
10. Jacob A. A Comprehensive Textbook of Midwifery (New Delhi:
Jaypee Publications, 2008
11. Grandi GF, Ferrari S, Cannoletta M. Prevelance of menstrual pain
in young women: What is dysmenorrheal. Journal of pain
research. 5(3), 2012 Jun, 169-174.
12. Salve SB, Dase RK, Mahajan SM. Assessment of knowledge and
practices about menstrual hygiene amongst rural and urban
adolescent girls. Int J of recent trends in science and technology.
3(3), 2012, 65-70.
13. Menstrual Hygiene: How Hygienic is the Adolescent Girl? A
Dasgupta and M Sarkar IJCM2008 april33(2) 77-80)
14. Kumar A, Srivastava K. Cultural and social practices regarding
menstruation among adolescent girls. Jornal of Social work in
public health. 26(6), 2011 Sep, 594-604.
15. Rembeck G.I, Moller. M. Attitudes and feelings towards
menstruation and womanhood in girls at menarche. Journal of
pediatrics. 8 (95), 2006, 222-228.
16. Wadgave HV. Knowledge of HIV/AIDS transmission among the
adolescent girls in slum areas. Indian journal of sexually
transmitted diseases. 2011 Jul;32(2):139.
17. Aarthi G, Premarajan KC, Subitha L. Knowledge and Attitude
Regarding Reproductive Health Issues and Family Formation
Among Adolescent Girls of Puducherry. Online J Health Allied Scs.
2014;13(4):1.
Healthline Journal Volume 8 Issue 2 (July-December 2017)
:: 27 ::
Healthline Journal Volume 8 Issue 2 (July-December 2017)
Assessment of Knowledge & Contributing Factors of Accredited Social Health
Activist (ASHA) Workers Regarding Antenatal Care in Bhojipura Block, District Bareilly1 2 3 4Sumit Saxena , Anurag Srivastava , Sonam Maheshwari , Anju Saxena
1 Assistant Professor, Department of Community Medicine, T. S. Misra Medical College & Hospital, Lucknow,
Uttar Pradesh, India2 Professor & Head, Department of Community Medicine, Teerthanker Mahaveer Medical College & Research Centre,
Moradabad, Uttar Pradesh, India3 Assistant Professor cum Statistician, Department of Community Medicine, Government Medical College, Dehradun,
Uttarakhand, India4 Assistant Professor, Department of Pharmacology, T.S.Misra Medical College &Hospital, Lucknow,
Uttar Pradesh, India
Correspondence: Dr. Anurag Srivastava, E mail : [email protected]
Original Article
Abstract :
thIntroduction: The Government of India launched the National Rural Health Mission (NRHM) on 12 April
2005, to provide accessible, accountable, affordable, effective and reliable primary health care, especially to
the poor and vulnerable sections of the population. One of the main tenets of the mission is to identify one
ASHA (Accredited Social Health Activist) per 1000 population in the rural areas with the purpose of
supporting the community to access public health services. Objectives: Assessment of the knowledge of ASHA
workers regarding Ante Natal Care (ANC) and to study the factors contributing the working of ASHA for
Antenatal services. Method: The present cross sectional study was carried out in the rural field practice area of
the department of Community Medicine, Shri Ram Murti Samarak Institute of Medical Sciences, Bhojipura
(District Bareilly) during the period from May 2014 to September 2014. Total of 48 villages were included in
the study. Total 64 ASHA were interviewed. Results: Out of 64 ASHA, 30 (46.9%) ASHA knew that 23 days
training provided after selection. All 64 (100%) ASHA knew that two doses of Tetanus Toxoid (TT)
immunization were given to pregnant women. 54 (84.4%) ASHA knew the correct doses of giving TT
immunization to pregnant women. Conclusion: According to the study findings, the knowledge level of ASHA
regarding Antenatal care is satisfactory but time to time monitoring and appraisal is needed to enhance the
quality of services provided by ASHA to pregnant mother.
Keywords : ASHA, KnowledgeANC,
Introduction :
The Government of India launched the National
Rural Health Mission (NRHM) on 12th April 2005, to
provide accessible, accountable, affordable, effective
and reliable primary health care, especially to the [1]
poor and vulnerable sections of the population.
One of the main tenets of the mission is to identify
one ASHA (Accredited Social Health Activist) per
1000 population in the rural areas with the purpose
of supporting the community to access public health [2]
services. ASHA must be primarily a woman
resident of the village, Married/ Widowed/Divorced
and preferably in the age group of 25 to 45 yrs, should
be a literate woman with formal education up to
eighth class.
The Ministry of Health & Family Welfare (MOHFW)
has developed a 23-day basic training schedule to
provide the necessary knowledge and skills to
women identified as ASHA and there is also regular
re-orientation trainings organized at the district
levels. Separate curriculum and the modules are
made available in providing training to the ASHAs.

:: 28 ::
The discourse on the ASHA's role centers around
three typologies - ASHA as an activist, ASHA as a link
worker or facilitator and ASHA as a community level
health care provider. ASHA is expected to ensure the
antenatal, natal and postnatal services to women,
counseling on family planning and nutrition, safe
abortion, escort or accompany the pregnant female
to hospital for institutional delivery, to create
awareness on institutional delivery, potential danger
signs and complications during pregnancy, delivery
and postpartum period and to mobilize the
community toward increase utilization of the [3]existing health services.
Ante Natal Care (ANC) is the care a woman
receives throughout her pregnancy in order to
ensure that both, the mother and child remain
healthy. Basic components of ANC include to ensure
early registration and see to it that the first check-up
is conducted within 12 weeks (first three months of
pregnancy), track every pregnancy for conducting at
least four antenatal check-ups (including the first
visit for registration), administer two doses of TT
injection and provide at least 100 tablets of Iron and [4]
Folic acid.
ASHA is the first helping hand for pregnant
mother. ASHAs form the backbone of the NRHM and
are meant to be selected by and be accountable to the
village. Since ASHA workers are grass root level
workers, the success of NRHM in India depends on
how well ASHAs are trained and perform. Hence, it is
essential to study are they have adequate knowledge
for delivering the maternal health care services to
community. At the same time, it is important to
address the factors affecting the working of ASHA in
the community to deliver maternal health care
services. With this rationale, the present study was
carried out with an objective to evaluate the
knowledge and factors affecting maternal health
care delivery by ASHAs in Bhojipura Block district
Bareilly, India.
Objectives :
• Assessment of the knowledge of ASHA workers
regarding antenatal care.
• To study the factors contributing the working of
ASHA for Antenatal services.
Method :
The present cross sectional study was carried out
in the rural field practice area of the department of
Community Medicine, Shri Ram Murti Samarak
Institute of Medical Sciences, Bhojipura (District
Bareilly) during May 2014 to Sept 2014. The
geographical area covered by this block is spread over
311.88 sq.km consisting 100 villages and 24 Sub-
centres. Bhojipura block has a population of 1,91,181
(population of Town area: 20784, Rural population:
1,70,397) according to census 2011. The study was
examined and cleared by ethical committee of the
Institution.
Figure 1: Map of the selected Villages
Saxena et al Knowledge & contributing factors of ASHA...

:: 29 ::
Sampling Technique for selection of villages:
Out of 100 villages, all twenty-four villages having
sub centre were selected randomly for the study. Sub
centre is the most peripheral unit for providing
Reproductive and Child Health (RCH) services. Thus
all Sub centre were taken for the study. List of villages,
situated at the distance of 3-5 km of their respective
sub-centre, was obtained from block health office
and 24 villages selected randomly for the study. Thus
total of 48 villages were included in the study.
(Figure I)
Table 1 : Distribution of ASHA according to their biosocial characteristics (n=64)
Bio-social characteristics Number (%)
Age (years)
21-30 24(37.5)
31-40 27(42.2)
41-50 11(17.2)
50+ 2(3.1)
Religion
Hindu 56(87.5)
Muslim 8(12.5)
Caste
General 10(15.6)
Other Backward Class (OBC) 36(56.3)
Scheduled Caste (SC) 18(28.1)
Marital status
Married 57(89.1)
Widow 7(10.9)
Education
Primary 10(15.6)
Middle 45(70.3)
High School 5(7.8)
Intermediate 4(6.3)
Type of Family
Nuclear 22(34.4)
Joint 42(65.6)
Socio economic status (modified B.G Prasad Classification)*
Class II (upper middle) 33(51.6)
Class III (middle) 28(43.7)
Class IV (upper lower) 3(4.7)
* All India Consumer Price Index (AICPI)=1120 (April 2014)
Sample size for ASHA: All ASHA who were posted
by Government of Uttar Pradesh, of the selected 48
villages of Bhojipura Block, were included in the
study. Thus total 64 ASHA were interviewed.
Inclusion Criteria for ASHA:
1. All ASHA working under the selected villages of
block Bhojipura.
2. Living within premises of allotted village.
3. ASHA who were willing to participate and ready to
give consent.
Healthline Journal Volume 8 Issue 2 (July-December 2017)
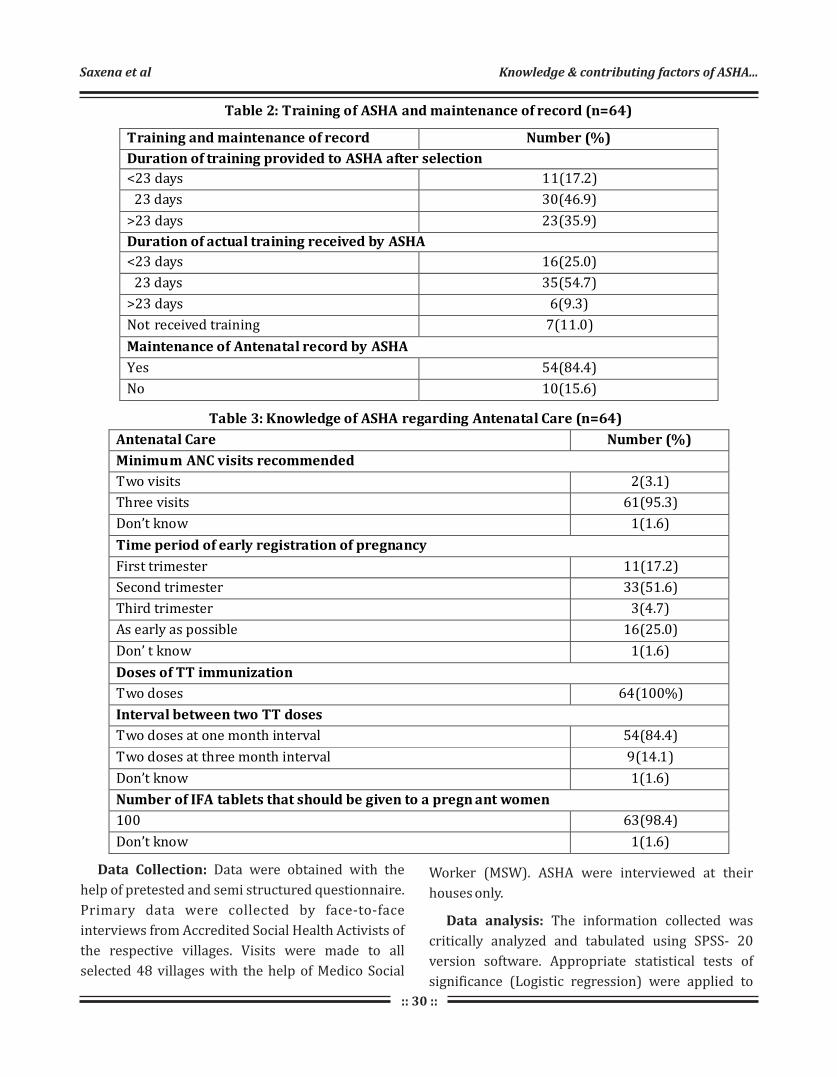
:: 30 ::
Table 2: Training of ASHA and maintenance of record (n=64)
Training and maintenance of record Number (%)
Duration of training provided to ASHA after selection
<23 days 11(17.2)
23 days 30(46.9)
>23 days 23(35.9)
Duration of actual training received by ASHA
<23 days 16(25.0)
23 days 35(54.7)
>23 days 6(9.3)
Not received training 7(11.0)
Maintenance of Antenatal record by ASHA
Yes 54(84.4)
No 10(15.6)
Table 3: Knowledge of ASHA regarding Antenatal Care (n=64)
Antenatal Care Number (%)
Minimum ANC visits recommended
Two visits 2(3.1)
Three visits 61(95.3)
Don’t know 1(1.6)
Time period of early registration of pregnancy
First trimester 11(17.2)
Second trimester 33(51.6)
Third trimester 3(4.7)
As early as possible 16(25.0)
Don’ t know 1(1.6)
Doses of TT immunization
Two doses 64(100%)
Interval between two TT doses
Two doses at one month interval 54(84.4)
Two doses at three month interval 9(14.1)
Don’t know 1(1.6)
Number of IFA tablets that should be given to a pregn ant women
100 63(98.4)
Don’t know 1(1.6)
Data Collection: Data were obtained with the
help of pretested and semi structured questionnaire.
Primary data were collected by face-to-face
interviews from Accredited Social Health Activists of
the respective villages. Visits were made to all
selected 48 villages with the help of Medico Social
Worker (MSW). ASHA were interviewed at their
houses only.
Data analysis: The information collected was
critically analyzed and tabulated using SPSS- 20
version software. Appropriate statistical tests of
significance (Logistic regression) were applied to
Saxena et al Knowledge & contributing factors of ASHA...

:: 31 ::
test and validate the findings of the study.
Result :
Predominantly 27 (42.2%) ASHA belonged to age
group of 31-40 years, 56 (87.5%) were Hindu by
religion, 36 (56.3%) belonged to OBC caste, 57
(89.1%) were married, 45 (70.3%) were educated
up to middle class, 42 (65.6%) lived in a joint family
and 33 (51.6%) ASHA from social class II (Upper
middle). (Table 1)
Out of 64 ASHA, 30 (46.9%) ASHA knew that 23
days training is provided after selection. But when
ASHA were asked about how many days they
received training after selection, 35 (54.7%) received
training for 23 days and only 7 (11.0%) ASHA did not
receive training. Maintenance of records by ASHA
were found to be very high. Out of 64 ASHA, 54
(84.4%) maintained the Antenatal record. (Table 2)
When ASHA were asked about the services
provided to pregnant women, 61 (95.3%) ASHA
responded that minimum three ANC visits were
recommended to pregnant women. Out of 64 ASHA,
33 (51.6%) said that the time period for early
registration was second trimester. All 64 (100%)
Table 4: Logistic regression on factors affecting knowledge of ASHA regarding time period for early registration
Biosocial
Variables
Frequency
Beta
(β) p value Exp(β)
95% C onfidence
Interval for Exp(β)
Lower Upper
Age(years) 21-30* 24 31-40 27 0.365 0.571 1.441 0.407 5.102 >40 13 0.317 0.691 1.373 0.288 6.544 Religion Muslim* 8 Hindu 56 1.920 0.017 6.818 1.410 32.966 Caste General* 10
OBC 36 -0.565 0.516 0.568 0.103 3.123 SC 18 0.223 0.826 1.250 0.172 9.093 Marital Status Widow 7 Married*
57
1.609
0.052
5.000
0.983
25.437
Education
Primary*
10
Middle
45
0.981
0.188
1.667
0.619
11.493
High -school
& above
9
0.288
0.764
2.333
0.204
8.708
Type of Family
Joint*
42
Nuclear
22
1.043
0.139
2.839
0.713
11.311
Socioeconomic Status
Upper
Middle*
33
Middle
31
0.594
0.315
1.812
0.568
5.778
Healthline Journal Volume 8 Issue 2 (July-December 2017)

:: 32 ::
Table 5: Logistic regression on factors affecting knowledge of ASHA regarding interval between two TT doses
Biosocial
Variables
Frequency
Beta
(β) p value Exp(β)
95% C onfidence
Interval for Exp(β)
Lower Upper
Age(years)
>40* 13
21-30 24 0.848 0.265 2.381 0.519 10.932
31-40 27 0.859 0.279 2.492 0.511 10.284
Religion
Muslim* 8
Hindu 56 0.293 0.795 1.340 0.147 12.260
Caste
SC* 18
General 10 0.636 0.666 1.889 0.105 33.891
OBC 36 1.580 0.152 4.857 0.558 42.304
Marital Status
Married* 57
Widow 7 0.631 0.486 1.880 0.318 11.106
Education
Primary* 10
Middle 45 0.118 0.919 1.125 0.117 10.841
High -school 9 1.974 0.114 7.200 0.622 83.342
Type of Family
Nuclear* 22
Joint 42 0.856 0.308 2.353 0.454 12.19
Socioeconomic Status
Middle* 31
Upper Middle 33 0.405 0.563 1.500 0.380 5.921
ASHA knew that two doses of TT immunization
has to be given to pregnant women. 54 (84.4%) ASHA
knew the correct doses of giving TT immunization to
pregnant women. Regarding IFA tablets, 63 (98.4%)
ASHA had correct knowledge that at least 100 IFA
should be given to a pregnant women. (Table 3)
Out of 64 ASHA, 16(25.0%) ASHA replied that as
early as possible women should register for
pregnancy. Applying the logistic regression on
factors affecting knowledge of ASHA regarding time
period of registration, age group 31-40 years, Hindu
religion, SC category, Married ASHA, High-school
educated ASHA, nuclear family, ASHA belonging to
Class III (middle) socioeconomic status were the
prime factors associated with knowledge regarding
time period for early registration. (Table 4)
Among 64 ASHA, 54(84.4%) ASHA knew the correct
interval between two TT doses. Applying the logistic
regression on factors affecting knowledge of A S H A
regarding interval between two TT doses, age group
31-40 years, Hindu religion, OBC category, widow
ASHA, High-school educated ASHA, joint family , class
II (upper middle) ASHA, were more likely to have
knowledge regarding interval between two doses of
TT. (Table 5)
Saxena et al Knowledge & contributing factors of ASHA...

:: 33 ::
Discussion :
Bio-Social Characteristics of ASHA: Majority i.e.
27 (42.2%) of ASHA were from age group 31-40
years. Although in the selection criteria of ASHA
(according to Training Module of ASHA Workers-
NRHM 2005-2012), the minimum age of selection is
25years but in our study, the ASHA in age group of
21-30 years were 24 (37.5%). Our study findings are [5]similar to the findings of Singh et al where most of
the ASHA 61 (45.2%) were in the age group of 30-35
years and only 11 (8.1%) ASHA were in the age group
of 25-30 years. But contrary to this in the study done [6]by Shashank K.J. where majority 71 (53.8%) ASHA
were in the age group of 26 to 30 years.
In the present study out of 64 ASHA, 57 (89.1%)
ASHA were married, 45 (70.3%) completed
education up to middle class, 56 (87.5%) were Hindu
by religion, 36 (56.3%) belonged to OBC by caste, 42
(65.6%) were from joint family. The above findings is [7]
similar to the findings of Garg et al where out of 105
ASHA, 93 (88.57%) were married, 101 (96.19%) th
ASHA worker completed 8 standard of the schooling
and 89 (84.76%) of ASHA worker were Hindus. [8]
Whereas Umrao Singh Rao also found in their study
that majority (80%) of ASHAs were 8th class pass.
This can be explained by the fact that selection
criteria are 8 Class and at some places it has been
reduced to 5 Class. Similar finding were also noted [9]by Sarawati Swain et al in Cuttack and study
[10]conducted by SIHFW Lucknow. Whereas study [11]
done by Kansal et al who found that out of 135
ASHA, 59 (43.7%) were from OBC caste and 42
(31.1%) were educated up to eighth standard.
In the present study, 33 (51.6%) ASHA belonged to
class II (upper middle) socioeconomic status
according to modified B.G Prasad classification. On [5]the contrary study done by Singh et al where out of
135 ASHA, most of the ASHA, 93 (68.9%) belong to
class IV (upper lower) socioeconomic status
according to modified B.G Prasad Classification. On [12]
the other hand study done by Swapan Mazumdar
in Bihar showed that 58% of the ASHA had poor
economic background and rests were from middle
th
th
and higher economic background also. In the study [13]conducted by Darshan et al at Surendranagar,
Gujarat found that 94.62% ASHA belonged to socio-
economical class IV and only 5.38% belonged to
class III.
Training & Maintenance of Antenatal record by
ASHA: In the present study out of 64 ASHA, 35
(54.7%) received training after selection for 23 days
and 7 (10.9%) ASHA did not receive any training.
[7]On the contrary, Garg et al in their study revealed
that out of 105 ASHA workers, 102 (97.14%) ASHA
workers completed training before working as ASHA.
ASHA envisage a total period of 23 days training in
five episodes. It is said that ASHA training is
continuous and that she develops the necessary skills [14]& expertise through continuous on the job training.
In the present study, out of 64 ASHA, 54 (84.4%)
maintained the Antenatal record.
[15]Similar findings were reported by Charu Kohli
where 51 (92.7%) ASHAs reported that they used to
maintain antenatal register.
Knowledge of ASHA regarding services
provided to pregnant women : The finding of the
present study was similar with that of Waskel et al [16]where 136 (66.02%) ASHA had average knowledge
[17]for ANC. On the other hand, study done by SIFPSA
reported that 460 (100%) ASHA had knowledge
regarding ANC registration, care during pregnancy
and institutional delivery. Similar to this Shashank [18]
KJ, Mahabaleshwar and Mahantappa Angadi
reported that all 132 ASHA workers were aware that
Tetanus injection is to be given for all antenatal
mothers and 105 (79.5%) ASHA knew that minimum
of 4 ANC visits should be made by every pregnant
mother.
[15]Whereas in Charu Kohli study, 41 (74.5%) ASHA
reported that minimum number of antenatal visits
are 4 while 4(7.3%) said minimum visits to be 6.
Awareness of their role in distribution and intake of
tablet iron and folic acid was known to 47 (85.5%)
ASHAs. 87% of ASHAs knew that iron tablets have to
be taken for minimum 100 days during pregnancy.
Healthline Journal Volume 8 Issue 2 (July-December 2017)
:: 34 ::
This is higher than reported by study conducted by [19]
Lodhiya et al . in Gujarat in which only 47% health
workers were aware of iron and folic acid tablets
schedule in pregnancy.
Almost all ASHA workers were aware about their
roles and responsibilities regarding maternal and
child health services. Similar results were shown by a [20]
study conducted by Gosavi et al. in Wardha where
all ASHAs knew about their role in TT immunization th
and antenatal services. About 3/4 ASHAs were
aware that minimum numbers of antenatal visits
were 4 as compared to that stated by a study carried [21]
out by Rashmi et al. where 81% community health
workers were aware of recommended minimum
number of ANC visits.
[6]On the contrary, study done by Shashank K.J. who
reported that out of 132 ASHA, 53 (40.2%) ASHA said
that they do four ANC visits and another 53 (40.2%)
of ASHA did three ANC visits and only 6 (4.5%) ASHA
do two visits for every registered ANC cases with
them.
Conclusion :
According to the study findings the knowledge
level of ASHA regarding antenatal care is satisfactory
but time to time monitoring and appraisal is needed
to enhance the quality of services provided by ASHA
to pregnant mother. Biosocial factors like age,
religion, caste, education, type of family and socio-
economic status were the prime factors which affect
the knowledge of ASHA regarding antenatal care. So
monitoring should be made as an integral part of
ASHA working in the field to ensure that knowledge is
converted into practices as well. Trainings during job
of ASHAs should be done in process to develop
necessary knowledge and skills with recent updates.
The Block level meetings should be utilized for the
feedback, enhancing knowledge & solving the
problem faced by the ASHAs.
Declaration :
Funding: Nil
Conflict of Interest: Nil
Reference :
1. Kishore J. National Health Programs of India: National Policies
and Legislations Related to Health. New Delhi: Century
Publications; 2014
2. Nirupam Bajpai, Ravindra H. Dholakia. Improving The
Performance Of Accredited Social Health Activists In India:
Working Papers Series Columbia Global Centers | South Asia,
Columbia University. Working Paper No. 1, May 2011.
3. Government of India. National Rural Health Mission
(2005-2012) Mission Document. New Delhi: Ministry of Health
and Family Welfare; 2005. Available from:http://
www.nrhm.gov.in /images/pdf/about-nrhm/ -framework-
implementation/nrhm-framework-latest. pdf. [Last accessed on
2014 Oct 26].
4. Maternal Health Division, Department of Family Welfare,
Ministry of Health & Family Welfare, Government of India: April
2010, Guidelines for Antenatal Care and Skilled Attendance at
Birth by ANMs/LHVs/SN available at: http://www.nhp.gov.in/
sites/default/files/anm_guidelines.pdf downloaded on 20th
Dec 2014.
5. Singh A, Saxena SC, Srivastava VK, Martolia DS, Varma P, Sharma
RP, et al. A Study of behavioural attitude of ASHAs in primary
health centres of a community development block of Kanpur
nagar. Indian Journal of Community Health 2009 July-2010 June;
22(1): 71-4.
6. Shashank KJ, Angadi MM, Masali KA, Wajantri P, Bhat S, Jose AP.
Study to evaluate working profile of Accredited Social Health
Activist (ASHA) and to assess their knowledge about infant
health care. International Journal of Current Research and
Review 2013 June; 05(12): 97-103.
7. Garg PK, Bhardwaj A, Singh A, Ahluwalia SK. An evaluation of
ASHA worker's awareness and practice of their responsibilities
in rural Haryana. National Journal of Community Medicine 2013;
4(1); 76-80.
8. Umrao Singh Rao. Role of ASHA in Promoting Safe Delivery In
Rajasthan. Population Research Centre, Mohan Lal Sukhadia
University, Udaipur, 2007-2008.
9. Sarawati Swain, Pushpanjali Swain, K. S. Nair, NeeraDhar, Sanjay
Gupta, Prof. DeokiNandan. A Rapid Appraisal of Functioning of
ASHA Under NRHM In Orrisa. Health and population:
perspectives and issues [incorporating nihae bulletin (estd.
1968) and the journal of population research (estd. 1974)]
2008;31(2):73-9.
10. Neera Jain, N K Srivastava, Prof. Deoki Nandan. Assessment of
The Functioning of ASHAs UnderNRHM In Uttar Pradesh.
Lucknow, U.P. State Institute of Health& Family Welfare, 2007-
2008.Health and population: perspectives and issues
[incorporating nihae bulletin (estd. 1968) and the journal of
population research (estd. 1974)] 2008;31(2):132-40.
11. Kansal S, Kumar S, Kumar A. Is educational level of ASHA matters
for their effective functioning? A cross- sectional study in Eastern
Uttar Pradesh. Indian Journal of Community Health 2012 Jan-
March; 24(1): 41-4.
12. Swapan Mazumdar. NRHM in Bihar: A Social Audit. Page no 28-
30. available at: http://www. chsj .org/uploads/1/
0/2/1/10215849/takingstock.pdf. Accessed on may 9th 2015.
Saxena et al Knowledge & contributing factors of ASHA...
:: 35 ::
13. Darshan K. Mahyavanshi, Mitali G. Patil, Girija Kartha, Shyamal K.
Purani, Sunita S. Nagar. A Cross Sectional Study of the Knowledge,
Attitude and Practice of ASHA Workers Regarding Child Health
(Under Five Years Of Age) In Surendranagar District. Health Line
2011;2(2):50-3.
14. Training of ASHA. Available at: http://www.mohfw.nic.in/
NRHM/asha.htm. Accessed on November 28th, 2012.
15. Charu Kohli, Jugal Kishore, Shantanu Sharma, Harsavsardhan
Nayak. Knowledge and practice of Accredited Social Health
Activists for maternal healthcare delivery in Delhi. Journal of
Family Medicine and Primary Care July 2015: Volume 4: Issue 3
359-363.
16. Waskel B, Dixit S, Singodia R, Pal DK, Toppo M, Tiwari SC, et al.
Evaluation of ASHA Programme in selected block of Raisen
district of Madhya Pradesh under the National Rural Health
Mission. Journal of Evolution of Medical and Dental Sciences
2014 Jan 20; 3(03): 689-94.
17. Evaluation of ASHA Scheme under NRHM in Uttar Pradesh.
Lucknow: SIFPSA; 2013 Sept. 161p
18. Shashank KJ, Mahabaleshwar Mahantappa Angadi. A study to
evaluate the knowledge of ASHA workers on antenatal and
postnatal care in Bijapur district. International Journal of
Research in Medical Sciences 2015 Sep;3(9):2299-2302.
19. Lodhiya KK, Pithadiya PR, Damor RD, Unadkat SV, Yadav SB. A
study on knowledge and skills of female health workers regarding
maternal care under RCH programme. Natl J Community Med
2012;3:35-9.
20. Gosavi SV, Raut AV, Deshmukh PR, Mehendale AM, Garg BS. ASHAs'
awareness and perceptions about their roles and responsibilities:
A study from rural Wardha. J Mahatma Gandhi Inst Med
Sci2011;16:1-8.
21. Rashmi A, Udaya Kiran R, Udaya Kiran N. Knowledge regarding
RCH services among health workers, pregnant mothers and
adolescents in rural field practice area. Nitte Univ J Health
Sci2013;3:46-50.
Healthline Journal Volume 8 Issue 2 (July-December 2017)
:: 36 ::
Original Article
A Study on Prevalence of Initial Defaulters among Sputum Smear Positive TB
Patients and Their Reasons under RNTCP in Jamnagar District, Gujarat, India1 1 2 3 4Pradeep R. Pithadia , Kishor M. Dhaduk , Meet M. Chauhan , Dipesh V. Parmar , Firoz D. Ghanchi ,
5Bharti B. Dholakiya
1 3 Assistant Professor, Professor & Head, Department of PSM, M P Shah Government Medical College, Jamnagar, Gujarat, India 2 Assistant Professor, Department of PSM, Pacific Institute of Medical Science, Udaipur, Rajasthan, India4 Professor & Head, Department of Pulmonary Medicine, M P Shah Government Medical College, Jamnagar, Gujarat, India5 District TB Officer, District TB Centre, Jamnagar, Gujarat, India
Correspondence : Dr. Kishor M. Dhaduk, E mail: [email protected]
Abstract :
Introduction: The smear positive TB patients who aren't put on treatment after diagnosis are called
'Initial defaulters'. Annually, many patients are diagnosed with TB under RNTCP, but many of them don't
return to the program after diagnosis. This study is an attempt to identify reasons of such initial defaulting.
The objective of the study is to measure prevalence of initial defaulters, its reasons and its association with
socio-demographic factors. Method : It's a cross-sectional study covering all TB Units of Jamnagar district, stand all TB patients diagnosed between 1 January, 2012 and 31 December, 2013. They were screened for
stinitial defaulting. Data collected and field visits planned between 1 January 2016 and 31 September 1016.
Results: Reported initial default rate was 5.12%, but actual default rate was only 2.39%. Initial defaulting
rate was higher in Jamnagar TU compared to other TUs and in males compared to females. About 74.36%
patients started anti-TB treatment from private institute. Conclusion: There was a discrepancy between
reported ID patients and actual ID patients, as many were put on later in subsequent quarters. Majority
TB patients started private treatment. Defaulting rate was higher in middle aged patients.
Keywords : Initial Default, RNTCP, Sputum Positive Cases, TB, TB Units
st
st
Introduction :
India is the highest TB burdened country in the
world in terms of absolute number of incident cases
occurring every year. It accounted for one-fourth of [1]
estimated global incidence of TB cases in 2013. To
overcome this enormous burden of TB, the DOTS
strategy was introduced in the country in 1997 under
Revised National TB Control Program (RNTCP).
The program is accountable for the outcome of
every patient put on treatment and uses a
standardized recording and reporting system. The
key indicators of the program are monitored at every [2]level of health system. Patients diagnosed with
smear-positive tuberculosis who do not initiate
treatment (pre-treatment loss to follow-up or initial
default) represent an important failing in the
[3]provision of care. Bringing these patients into care
[4]could reduce tuberculosis transmission to others.
While several studies have reported on initial
default, there is little information about the extent of [5]this problem globally. The present study tries to
identify reasons of such initial defaulting among
newly diagnosed sputum smear positive TB patients
under RNTCP.
Aims and Objectives:
1. To find out prevalence of initial defaulters among
newly diagnosed sputum smear positive TB
patients of Jamnagar district.
2. To find out the possible reasons of initial default
among TB patients under RNTCP in the district.
Healthline Journal Volume 8 Issue 2 (July-December 2017)

:: 37 ::
Method :
This was an analytical cross-sectional
retrospective study covering all TB patients of all
TB units of Jamnagar district, diagnosed at all
Designated Microscopic Centres (DMCs) between st1 January, 2012 and 31 December, 2013.
Initial defaulters or diagnostic defaulters are
defined as TB patients diagnosed as sputum smear
positive tuberculosis at accredited Designated
Microscopic Centres (DMCs) by Revised National TB
Control Program (RNTCP) but not registered under
the program and not put on standard anti-
tuberculosis treatment.
TB registers and Laboratory registers of all TB
Units of Jamnagar districts of both calendar years
(2012 and 2013) were cross-checked to find out
whether they were registered and put on treatment
or not. If a TB patient was diagnosed, but not
registered then we inquired whether he/she was
initial default or not, by tracing contact details and
address of the patient. Such TB patients were visited
at their residences and asked whether any TB official
contacted the patient, home visit paid etc. Then TU
wise line- listing of such patients was carried out. stDuration of data collection was from 1 January 2016
stto 31 September 2016.
Inclusion Criteria:
All newly diagnosed sputum smear positive TB
patients diagnosed at all DMCs of all TB Units (TUs) of st
Jamnagar district, registered from January 1 , 2012 stto December 31 2013. (Including all TB patients
transferred from one TU to another TU within
district).
Exclusion Criteria:
i. All sputum smear negative and MDR TB patients
diagnosed at all DMCs and TUs of Jamnagar
district.
ii. Patients died after diagnosis before he/she was
put on treatment.
iii. Patients reported as ID initially in one quarter, but
put on treatment later.
st
iv. Patients moved out of district /state (Transferred
out) after diagnosis.
Data collection Techniques and Tools :
Cases were interviewed by a proforma containing
pre-tested semi-structured questionnaires which
included questions about socio-demographic profile,
past history of treatment with tuberculosis, reasons
for not starting prescribed treatment etc. Training of
field investigators included instructions and
orientation about how to collect data using pre-
tested proforma, importance of the study and
orientation about the formats used.
Data Analysis: Data were entered and analysed
using Microsoft Excel sheet, 2007. Descriptive
statistics such as frequency, mean, standard
deviation, median, minimum and maximum, etc were
calculated as appropriate. Comparisons between
groups were made using the Chi-square test or
Fischer's exact test as appropriate for qualitative
variables. Level of significance was set at 95%.
Ethical Considerations :
We obtained ethical clearance certificate from the
Institutional Ethics Committee of M.P. Shah Govt.
Medical College, Jamnagar after sanctioning the
research project. The purpose for seeking
information was explained in detail to every eligible
patient and TB officials and TB workers and informed
consent was obtained prior to interview. The data
collected was presented as an aggregate and was not
linked to any individual patient in the study. The data
obtained during the study was securely held and
confidentiality was maintained at every level.
Results :
Out of 167 patients identified and reported as
Initial defaulters in their respective or subsequent
quarters in years 2012 and 2013, we observed that
89 patients were either actually put on treatment in
the subsequent quarter of the year or had died.
Remaining 78 patients were those that had not been
put on anti-TB treatment. Out of these 78 patients,
We could trace only 39 patients In our study, thus 50
% patients could not be traced. (Figure 1)
Pithadia et al Prevalence of Initial Defaulters...

:: 38 ::
Out of total 39 traced patients, majority of them
(69.23%) belonged to Jamnagar TU. (Table 1)
Out of total 39 traced patients 53.85% patients
were from urban area and 58.97% patients were
above 45 year age.(Table 2)
The mean age of the interviewed ID patients was
47.68 years with Standard Deviation 14.71 years.
Past history of treatment with anti-tuberculosis
drugs has not been found to be associated with initial
defaulting, as about 58.33% patients had not
revealed any treatment with tuberculosis drugs in
the past. Regarding the literacy status of the patients,
more than one-forth (28.20%) of patients had their
study up to primary schoolings, 23% were illiterate,
whereas same proportion of patients had studied
either higher secondary or more. When we inquired
whether any TB worker visited their homes, about
72% patients replied that a TB worker visited their
homes. (Table 3)
Out of total 39 traced patients, when asked about
reasons for non-initiation of treatment, about 29 %
patient said they started AKT (anti-tuberculosis
therapy) from private providers, and 28% not started
treatment because they felt the treatment course too
lengthy(Figure 2).
Figure 1: Flow chart showing proportion
of initial defaulters
Table 1: TU wise distribution of ID patients interviewed.
Name of TU Total no. of ID patients interviewed No. (%)
Jamnagar 27 (69.23)
Dhrol 5 (12.82)
Khambhaliya 7 (17.95)
Lalpur 0 (0.00)
Total 39 (100.00)
Table 2: Age distribution of cases among rural and urban communities
Age
distribution
Urban
No. (%)
Rural
No. (%)
Total
No. (%)
Statistics
15-45 years 8 (50.00) 8 (50.00) 16 (41.03) OR=0.77
(0.18-0.34)
χ2=0.16
P= 0.69
>45 years 13 (56.52) 10 (43.38) 23 (58.97)
Total 21 (53.85) 18 (46.15) 39 (100.00)
Healthline Journal Volume 8 Issue 2 (July-December 2017)
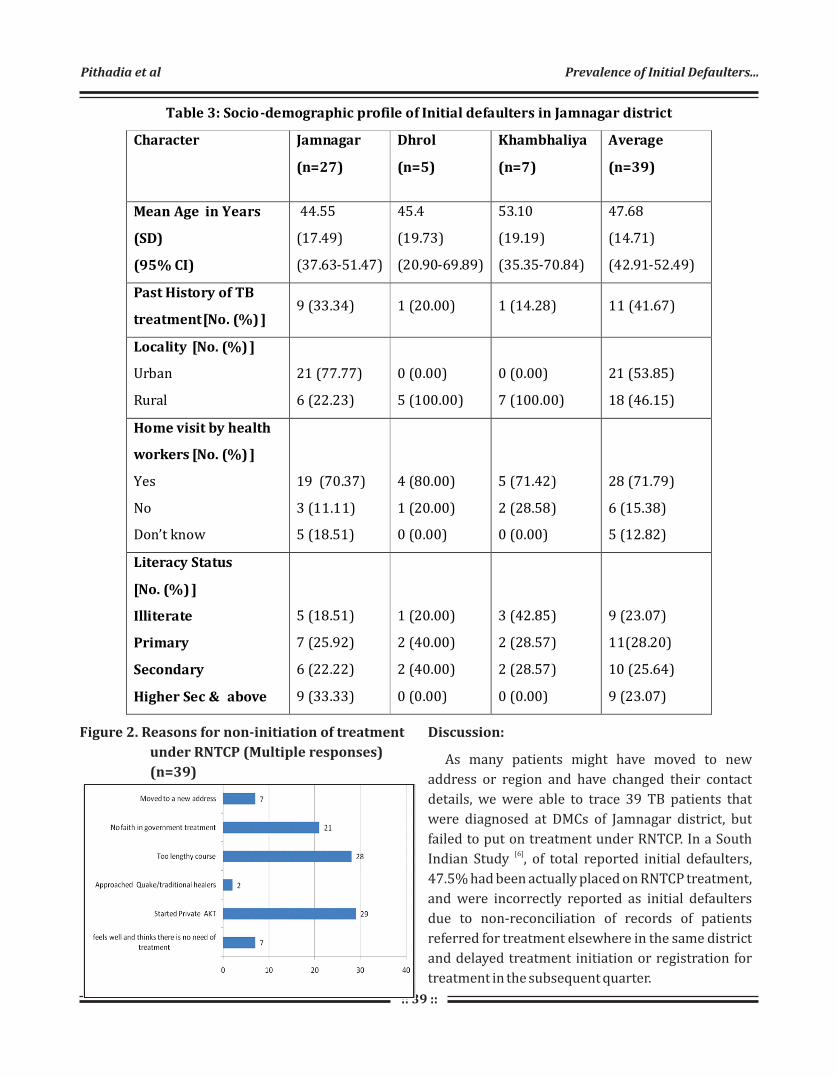
:: 39 ::
Figure 2. Reasons for non-initiation of treatment
under RNTCP (Multiple responses)
(n=39)
Table 3: Socio-demographic profile of Initial defaulters in Jamnagar district
Character Jamnagar
(n=27)
Dhrol
(n=5)
Khambhaliya
(n=7)
Average
(n=39)
Mean Age in Years
(SD)
(95% CI)
44.55
(17.49)
(37.63-51.47)
45.4
(19.73)
(20.90-69.89)
53.10
(19.19)
(35.35-70.84)
47.68
(14.71)
(42.91-52.49)
Past History of TB
treatment [No. (%) ] 9 (33.34) 1 (20.00) 1 (14.28) 11 (41.67)
Locality [No. (%) ]
Urban
Rural
21 (77.77)
6 (22.23)
0 (0.00)
5 (100.00)
0 (0.00)
7 (100.00)
21 (53.85)
18 (46.15)
Home visit by health
workers [No. (%) ]
Yes
No
Don’t know
19 (70.37)
3 (11.11)
5 (18.51)
4 (80.00)
1 (20.00)
0 (0.00)
5 (71.42)
2 (28.58)
0 (0.00)
28 (71.79)
6 (15.38)
5 (12.82)
Literacy Status
[No. (%) ]
Illiterate
Primary
Secondary
Higher Sec & above
5 (18.51)
7 (25.92)
6 (22.22)
9 (33.33)
1 (20.00)
2 (40.00)
2 (40.00)
0 (0.00)
3 (42.85)
2 (28.57)
2 (28.57)
0 (0.00)
9 (23.07)
11(28.20)
10 (25.64)
9 (23.07)
Discussion:
As many patients might have moved to new
address or region and have changed their contact
details, we were able to trace 39 TB patients that
were diagnosed at DMCs of Jamnagar district, but
failed to put on treatment under RNTCP. In a South [6]
Indian Study , of total reported initial defaulters,
47.5% had been actually placed on RNTCP treatment,
and were incorrectly reported as initial defaulters
due to non-reconciliation of records of patients
referred for treatment elsewhere in the same district
and delayed treatment initiation or registration for
treatment in the subsequent quarter.
Pithadia et al Prevalence of Initial Defaulters...
:: 40 ::
Nisar Ahmed Rao et al in his study in Pakistan in
year 2007-08 reported an alarmingly high initial
default rate which was as high as 27.67%. The most
common reason being dissatisfaction with services [7]rendered at the clinic (33.33%). Another study by
Gopi PG et al in South India reported about 14.9%
initial default rate, and major reasons for defaulting
were loss of wages, dissatisfaction with services of
health care providers and disease related issues like [6]
feeling well or too ill.
A study by Buu TN et al in Vietnam reported 8.3%
initial default rate, with 79.5% defaulting due to [8]issues related to health care provider. A most recent
study from South Africa reported initial default rate [9]of 17%.
We found many patients' incomplete addresses in
address column of TB Laboratory registers of TU. And
phone numbers were also missing or incorrect for [7]
many patients. In a study in Pakistan, 11.29%
patients could not be traced. Sai Babu et al in Andhra
Pradesh reported a high rate (51%) of untraceable [10]defaulters in his study. In our study, about 74.36 %
patients were taking treatment from private service
providers. In a study by Sai Babu et al, initial default
rate was higher in urban areas compared to rural [10]
areas. Moreover, they observed that about 5.5% of
ID patients were taking treatment outside the
program including private practitioners.
[11]In a study by R.Balasubramanian in South India,
rate of initial defaulters was equal among both males
and females, and among smear positive patients
diagnosed, rate of initial default did not differ by age
or sex.
In our study, almost four-fifth of interviewed
patients were males. Thus, we can say that males may
undergo initial defaulting more than females. It may
be due to sampling error as more male patients might
have been traced and interviewed. We did not
calculate sex specific default rate as we did not have
denominator in terms of total number of male and
female patients enrolled during the study period. In a
study in Pakistan in 2009, observers found
proportion of initial default among males more than [12]
females.
Past history of treatment with anti-tuberculosis
drugs has not been found to be associated with initial
defaulting, as about 58.33% patients had not
revealed any treatment with tuberculosis drugs in
the past. Recently in year 2016, Government of India
has declared TB a notifiable disease, which is an
appreciable step and will help supplement missing
data about TB detection and cure rate. Dewan et al
has proved that Public-private joint activities were
associated with improved case notification, while [13]
maintaining acceptable treatment outcomes .
Conclusion:
The initial default (ID) rate as reported by the
program was 5.12% but actual ID rate was 2.39% as
many patients were put on treatment later in the
subsequent quarter, so they were erroneously
reported as ID patients. Thus, there was a gap
between reported ID patients and actual ID patients.
The majority of patients interviewed belonged to
Jamnagar urban TB Unit.
The major reason for initial defaulting was
initiation of treatment from private institutes or
clinics, followed by lengthy duration of treatment.
Incomplete address and contact details taken by
Senior Treatment Supervisor (STS) and Senior
TB Laboratory Supervisor (STLS) led to loss of many
patients, who could have been traced and
interviewed.
Recommendations:
Initial default or diagnostic default is a vital issue
for better control of TB in the Revised National TB
Control Program. Medical Officer (MO) or STS should
regularly match laboratory registers with TB
registers to identify and trace ID patients as early as
possible, before they become untraceable. Reasons
behind this behaviour should be sought and all
attempts should be focused to bring these patients
back in the program.
MO/ District TB Officer (DTO) should instruct
STS/STLS to note correct and complete contact
details of all TB patients, so that they can be easily
traceable anytime if went missing from the system.
Healthline Journal Volume 8 Issue 2 (July-December 2017)
:: 41 ::
Significance of initial defaulting in the program
should be given due importance in the training of STS
and STLS before their recruitment and even during
their refresher training. MO/DTO should ask for any
ID case to the STS/STLS and if present, all attempts
should be made to put him on treatment as early as
possible.
Acknowledgement:
This operational research project was technically
and financially supported by State Task Force,
Gujarat State, Revised National Tuberculosis Control
Programme, District Tuberculosis Centre and
Department of Tuberculosis and Chest diseases, M.P.
Shah Government Medical College, Jamnagar,
Gujarat, and could not have been completed without
their support.
Declaration :
Funding : State TB Division, Government of Gujarat
Conflict of Interest : Nil
References :
1. K. Park. Parks's Text Book of Preventive and Social Medicine,
23rd ed. Jabalpur. Bhanot Publishers;2016. P 183.
2. TB Statistics for India-National and State Statistic, available at
www.tbfacts.org/tb-statisticsindia/, accessed September
19,2016.
3. Peter MacPherson, Rein MGJ Houben, Judith RG , Elizabeth LC,
Katharina Kranzer. Pretreatment loss to follow-up in TB
patients in low and lower middle income countries and high
burden countries: A systematic review and meta analysis. Bull
World Health Organ. 2014;92:126-138.
4. Dowdy DW, Chainsson RE The persistence of tuberculosis in the
age of DOTS: reassessing the effect of case detection. Bull World
Health Organ.2009; 87: 296-304.
5. Harries AD, Rusen ID, Chiang CY, Hinderaker SG, Enarson DA.
Registering initial defaulters and reporting on their treatment
outcomes. Int J Tuberc Lung Dis 2009;13(7):801– 803.
6. Gopi PG, Chandrasekaran V, Subramani R, Narayanan PR.
Failure to initiate treatment for tuberculosis patients diagnosed
in a community survey and at health facilities under a DOTS
programme in a district of South India. Indian J Tuberc 2005;
52:153-6.
7. Nisar Ahmed Rao, TehzeebAnwer, Muhammad Saleem.
Magnitude of initial default in pulmonary tuberculosis. J Pak
Med Assoc. 2009;59(4):223-5.
8. Buu TN, Lonnroth K, Quy HT. Initial defaulting in the National
Tuberculosis Programme in Ho Chi Minh City, Vietnam: a survey
of extent, reasons and alternative actions taken following
default. Int J Tuberc Lung Dis 2003; 7: 735-41.
9. Botha E, den Boon SD, Lawrence K A, Reuter H, Verver S,
Lombard CJ, Dye C, Enarson DA, Beyers N. From suspect to
patient: tuberculosis diagnosis and treatment initiation in
health facilities in South Africa. . Int J Tuberc Lung Dis 2008; 12:
936-41.
10. Sai Babu B., Satyanarayan AV, Ventateshwaralu G., Ramakrishna
U., Vikram P. Sahu S., Wares F, Dewan PK, Santosha K, Jyoti J,
Srinath S, Chethana R, Neelima T, Vinod P, Yogesh M, Chauhan LS.
Initial default among diagnosed sputum smear positive
pulmonary tuberculosis patients in Andhra Pradesh, India. Int J
Tuberc Lung Dis 2008; 12(9):1055-58.
11. R. Balasubramanian et al. Gender disparities in tuberculosis:
report from a rural DOTS programme in south India. Int J Tuberc
Lung Dis 2004; 8(3): 323–32.
12. Khan Mishal S., Khan Shoaib, Godfrey-Fousett Peter. Default
during TB diagnosis. Quantifying the problem. Tropical
Medicine and International Health.2009;14(12), :1437-41.
13. Dewan PK, Lal S S, Lonnroth K, Wares F, Uplekar M, Sahu S,
Granich R, Chauhan LS. al. Improving tuberculosis control
through public-private collaboration in India: literature review.
BMJ 2006; 332: 574-8
Pithadia et al Prevalence of Initial Defaulters...

:: 42 ::
Original Article
Utilization of Supplementary Nutrition Food Packets by Pregnant and Lactating
Mothers in Urban Areas of Valsad, Gujarat1 1 2
Bhavesh Bariya , Neha A. Patel , Sunil Nayak1 2Tutor, Professor & Head, Department of Community Medicine, GMERS Medical College, Valsad, Gujarat, India
Correspondence : Dr. Neha A. Patel, E mail: [email protected]
Abstract :
Introduction : Supplementary Nutrition is provided under Integrated Child Development Scheme (ICDS)
to pregnant and lactating mothers. Still the prevalence of malnutrition is high. The study conducted to find out
reasons behind it. Objectives: 1. To study utilization of supplementary food packets by pregnant and lactating
mothers. 2. To study perception of beneficiaries regarding quality of food packets. Method : A Cross sectional
study was conducted from June 2017 to August 2017 in urban area of Valsad Municipal Corporation. 22
Anganwadi centers were selected from the service area of Urban Health Training Center (UHTC). Total 132
women, 3 pregnant and 3 lactating mothers from each Anganwadi, were selected by Purposive/ Convenient
sampling. Verbal consent was taken. Data was entered in Microsoft office excel and were analyzed using
Microsoft Office Excel and Epi Info. Ethical approval was taken from the institutional Ethics Committee.
Results: 86% of beneficiaries utilized the food packets, amongst which 35.2% used it alternate day or twice a
week, 24.3% of them used once a week.14% of them were not supplied/received the food packets. 29.7% of the
total participants were using the food packets alone and 70.3% were sharing it with their family members.
Majority of the study participants reported the taste of food packet good (56.80%) and 32.4% of them
perceived it edible. Conclusions: Majority (85.6%) of the study subjects utilized the food packets and
perceived it as good in taste and eatable. Food packets were shared by other family members of the beneficiary.
Keywords : ICDS, Pregnant Women, Quality of Food Packets, Supplementary Nutrition
Introduction :
Nutrition during pregnancy and lactation is one of
the key for healthy outcome of pregnancy. Research
studies in India and elsewhere have shown that if we
identify pregnant women having reduction in
habitual dietary intake or excess energy expenditure
or whose body weight is less than 40 kg and give them
adequate continuous food supplementation and
antenatal care; there is substantial improvement in
outcome of pregnancy, birth weight and neonatal
mortality. Encouraged by such data, India has
included food supplementation for pregnant and
lactating women under the Integrated Child [1]Development Services (ICDS) programme.
In pregnancy there is additional 350 kcal
requirement and in first 6 month of lactation there is
additional 600 kcal requirement and in 6-12 month
there is 520 kcal extra required. High calorie diet [2]
during pregnancy is helpful in providing good
maternal health and preventing Low Birth Weight
(LBW) and prematurity. Supplementary nutrition
provided through Anganwadi centers is very helpful
to fight against malnutrition and its complication.
The “Supplementary Nutrition” is one of the six
services provided under the ICDS Scheme which is
primarily designed to bridge the gap between the
Recommended Dietary Allowance (RDA) and the
Average Daily Intake (ADI). Supplementary Nutrition
is given to the children (6 months – 6 years) and
pregnant and lactating mothers under the ICDS [3]
Scheme.
The Government of India, on 24.2.2009, has issued
revised guidelines on nutritional and feeding norms.
States/Union Territories have been requested to
provide supplementary nutrition to children below
six years of age and pregnant and lactating mothers,
Healthline Journal Volume 8 Issue 2 (July-December 2017)

:: 43 ::
in accordance with the guidelines which have been
endorsed by the Hon'ble Supreme Court vide its [3]Order dated 22.4.2009.
Under ICDS programme supplementary nutrition
is being provided, but its utilization has raised
questions. With this background in mind, the current
study was planned to find out utilization status of
supplementary nutrition by pregnant and lactating
mothers.
Aim :
To know the utilization status of supplementary
nutrition by pregnant and lactating mothers in
Valsad Municipal Corporation Area, Gujarat.
Objectives:
1. To study utilization of supplementary food
packets by pregnant and lactating mothers.
2. To study perception of beneficiaries regarding
quality of food packets.
Method :
It was a cross sectional study conducted at
Anganwadi centres under Valsad Municipal
Corporation Area, Gujarat during the time period of
June 2017 to August 2017. With the permission of
Child Development Project Officer (CDPO), 22
Anganwadi Centres (AWC) were visited from the
service area of UHTC. From each Anganwadi, 3
pregnant and 3 lactating mothers were selected
using the convenience sampling method and thus
132 beneficiaries were interviewed. Informed verbal
consent was taken prior to data collection. The
beneficiaries were questioned individually by
visiting their home. Various information including
bio data, registration at AWC, supply of nutritional
food packets and frequency of its usage, amount used,
side effects if any was taken. Then various aspects of
nutritional supplement packets like storage
condition, used/unused, hygiene, expiry date etc
were observed. Ehical approval was taken from the
institutional Ethics Committee. Data entry was done
using Microsoft office excels and were analyzed using
Microsoft Office Excel and Epi Info.
Results :
The mean age of the pregnant/Lactating women
included in this study was 25.70 years (Standard
Deviation (S.D.) =4.40). Majority of the beneficiaries
were educated up to primary level (58.30%)
followed by secondary level (23.50%) and higher
secondary level (12.12%). However out of 132 study
subject, 2 (1.5%) of them were illiterate. The mean of
the number of family members in the participant's
family was 5.48 (S.D. =2.68). (Table 1)
Table 1: Sociodemographic Profile of Study Participants: (n=132)
Variable Frequency (%)
Education
Primary 77 (58.30)
Secondary 31 (23.50)
Higher Secondary 16 (12.12)
Graduate 6 (4.55)
Illiterate 2 (1.51)
Religion
Hindu 109 (82.58)
Muslim 23 (17.42)
Family members
< 5 81 (61.36)
6-10 45 (34.09)
>10 6 (4.54)
TOTAL 132 (100)
The mean of registered month of Pregnant/
Lactating mothers at Anganwadi centers was
7.77(S.D. =3.12).The mean of total number of packets
received till now by participants was 27.02
(S.D. =15.44).The mean of total months of usage of
food packets by beneficiaries was 6.65(S.D. =3.87).
The food packets were found with only 100 out of
132 beneficiaries at the time of visit, but it was used
by 111 beneficiaries (Table 2). With 88%
Bariya et al Utilization of Supplementary Nutrition Food Packets...
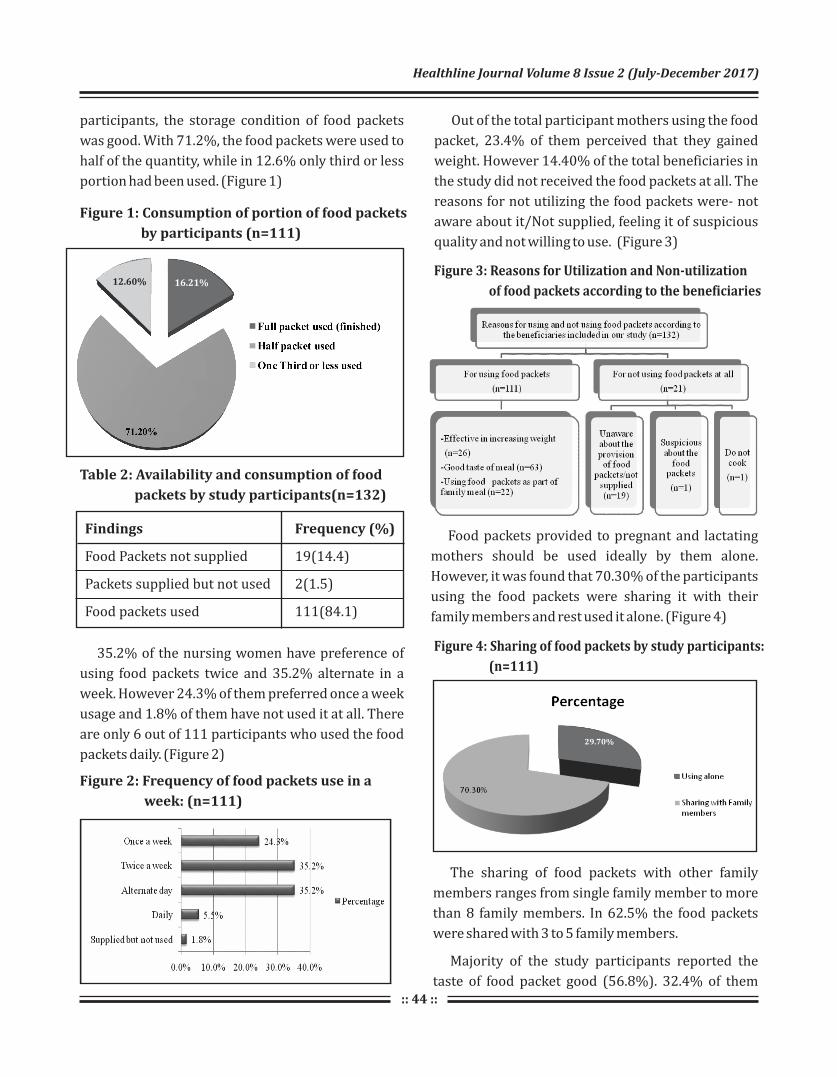
:: 44 ::
participants, the storage condition of food packets
was good. With 71.2%, the food packets were used to
half of the quantity, while in 12.6% only third or less
portion had been used. (Figure 1)
Figure 1: Consumption of portion of food packets
by participants (n=111)
Figure 2: Frequency of food packets use in a
week: (n=111)
Figure 3: Reasons for Utilization and Non-utilization
of food packets according to the beneficiaries
Figure 4: Sharing of food packets by study participants:
(n=111)
Table 2: Availability and consumption of food
packets by study participants(n=132)
Findings Frequency (%)
Food Packets not supplied 19(14.4)
Packets supplied but not used 2(1.5)
Food packets used 111(84.1)
35.2% of the nursing women have preference of
using food packets twice and 35.2% alternate in a
week. However 24.3% of them preferred once a week
usage and 1.8% of them have not used it at all. There
are only 6 out of 111 participants who used the food
packets daily. (Figure 2)
Out of the total participant mothers using the food
packet, 23.4% of them perceived that they gained
weight. However 14.40% of the total beneficiaries in
the study did not received the food packets at all. The
reasons for not utilizing the food packets were- not
aware about it/Not supplied, feeling it of suspicious
quality and not willing to use. (Figure 3)
Food packets provided to pregnant and lactating
mothers should be used ideally by them alone.
However, it was found that 70.30% of the participants
using the food packets were sharing it with their
family members and rest used it alone. (Figure 4)
The sharing of food packets with other family
members ranges from single family member to more
than 8 family members. In 62.5% the food packets
were shared with 3 to 5 family members.
Majority of the study participants reported the
taste of food packet good (56.8%). 32.4% of them
16.21%12.60%
29.70%
Healthline Journal Volume 8 Issue 2 (July-December 2017)
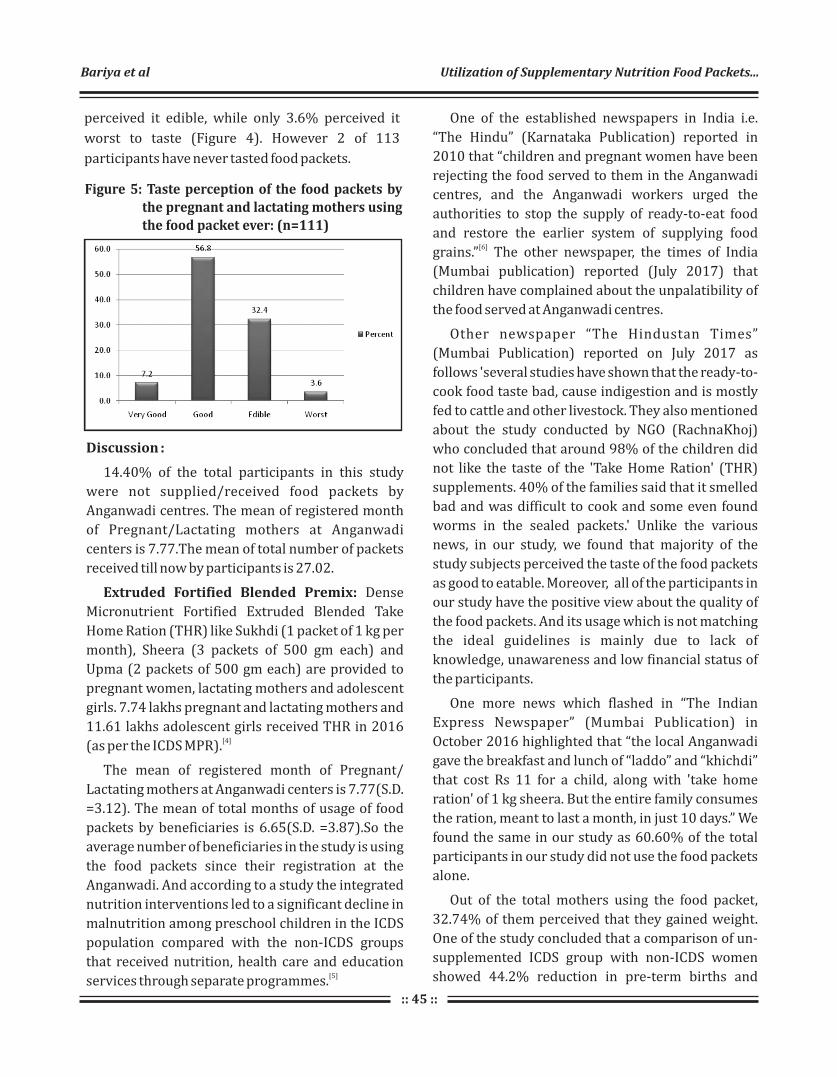
:: 45 ::
Figure 5: Taste perception of the food packets by the pregnant and lactating mothers using the food packet ever: (n=111)
perceived it edible, while only 3.6% perceived it
worst to taste (Figure 4). However 2 of 113
participants have never tasted food packets.
Discussion :
14.40% of the total participants in this study
were not supplied/received food packets by
Anganwadi centres. The mean of registered month
of Pregnant/Lactating mothers at Anganwadi
centers is 7.77.The mean of total number of packets
received till now by participants is 27.02.
Extruded Fortified Blended Premix: Dense
Micronutrient Fortified Extruded Blended Take
Home Ration (THR) like Sukhdi (1 packet of 1 kg per
month), Sheera (3 packets of 500 gm each) and
Upma (2 packets of 500 gm each) are provided to
pregnant women, lactating mothers and adolescent
girls. 7.74 lakhs pregnant and lactating mothers and
11.61 lakhs adolescent girls received THR in 2016 [4](as per the ICDS MPR).
The mean of registered month of Pregnant/
Lactating mothers at Anganwadi centers is 7.77(S.D.
=3.12). The mean of total months of usage of food
packets by beneficiaries is 6.65(S.D. =3.87).So the
average number of beneficiaries in the study is using
the food packets since their registration at the
Anganwadi. And according to a study the integrated
nutrition interventions led to a significant decline in
malnutrition among preschool children in the ICDS
population compared with the non-ICDS groups
that received nutrition, health care and education [5]
services through separate programmes.
One of the established newspapers in India i.e.
“The Hindu” (Karnataka Publication) reported in
2010 that “children and pregnant women have been
rejecting the food served to them in the Anganwadi
centres, and the Anganwadi workers urged the
authorities to stop the supply of ready-to-eat food
and restore the earlier system of supplying food [6]
grains.” The other newspaper, the times of India
(Mumbai publication) reported (July 2017) that
children have complained about the unpalatibility of
the food served at Anganwadi centres.
Other newspaper “The Hindustan Times”
(Mumbai Publication) reported on July 2017 as
follows 'several studies have shown that the ready-to-
cook food taste bad, cause indigestion and is mostly
fed to cattle and other livestock. They also mentioned
about the study conducted by NGO (RachnaKhoj)
who concluded that around 98% of the children did
not like the taste of the 'Take Home Ration' (THR)
supplements. 40% of the families said that it smelled
bad and was difficult to cook and some even found
worms in the sealed packets.' Unlike the various
news, in our study, we found that majority of the
study subjects perceived the taste of the food packets
as good to eatable. Moreover, all of the participants in
our study have the positive view about the quality of
the food packets. And its usage which is not matching
the ideal guidelines is mainly due to lack of
knowledge, unawareness and low financial status of
the participants.
One more news which flashed in “The Indian
Express Newspaper” (Mumbai Publication) in
October 2016 highlighted that “the local Anganwadi
gave the breakfast and lunch of “laddo” and “khichdi”
that cost Rs 11 for a child, along with 'take home
ration' of 1 kg sheera. But the entire family consumes
the ration, meant to last a month, in just 10 days.” We
found the same in our study as 60.60% of the total
participants in our study did not use the food packets
alone.
Out of the total mothers using the food packet,
32.74% of them perceived that they gained weight.
One of the study concluded that a comparison of un-
supplemented ICDS group with non-ICDS women
showed 44.2% reduction in pre-term births and
Bariya et al Utilization of Supplementary Nutrition Food Packets...

:: 46 ::
23.1% reduction in low birth weights, which were
due to other inputs provided under ICDS. Increased
weight gain in pregnancy, length of gestation, caloric
intake and hemoglobin level were significantly
associated with birth weight. Nutrition supplement
given to pregnant women in ICDS area improved
weight gain of women during pregnancy and birth
weight of babies, with reduction in pre-term [7]
deliveries and incidence of low birth weight.
The findings of one of the other study showed that
complete utilization of all services resulted in
significant improvement in nutritional status as
assessed through anthropometric indices viz
height/age, weight/age, and weight/height. Data on
morbidity among children showed that the
frequency and duration of illness were significantly
lower when the services were utilized fully, than
when utilized partially or not utilized at all.
Thus major efforts should go into the convergence
of services and their full utilization by the [8]community.
During our informal conversation with the
Anganwadi centres worker, we came to know about
the loop-holes of the take home ration scheme
implemented under ICDS. Anganwadi worker gave us
the ideal data on distribution of the food packets and
its regularity and also said that all the beneficiaries
registered under the Anganwadi centres are made
aware and counseled properly according to the
guidelines for the use of take-home rations. However
during our door to door visit to the beneficiary, we
found that the amount of food packets was
inadequate and they were lacking the knowledge
about the proper use of food packets.
Conclusion :
85.60% of the pregnant and lactating mothers
utilized the food packets and most of them have
received the last food packets just 1 month ago. None
of the study subjects have ever got the food packets
which are not edible. Only one out 20 women used
the food packets on daily basis. Most of the
participants found the contents of food packets good
to average in taste but prefer using it less frequently
in a week. Moreover, many of the participants used
the food packets as their family meal and share the
food packets with other family members. None of the
participants had any side effects by using food
packets. On observation all the packets were found
within the expiry date.
Recommendation :
Taste of the food packets should be improved
at manufacture level. The women should be
educated about different nutritious recipes from the
food packets to avoid monotonous taste. The
supplementary nutrition should be provided in a
form which can be used on daily basis.
Limitations :
Because of time constrains, the sample size is small
and the study will be expanded in future.
Declaration :
Funding: Nil
Conflict of Interest: Nil
References :
1. C. Gopalan and Suminder Kaur. Women and Nutrition in India;
Nutrition Foundation of India, special publication series 5.
2. Jain V. Review of Preventive and Social Medicine. 9th edition.
New Delhi: Jaypee Publishers; 2017. 906 p.
3. Supplementary Nutrition Programme [Internet]. Press
Information Bureau Government of India Ministry of Women
and Child Development. [cited 2017 Jul 24]. Available from:
http://pib.nic.in/newsite/PrintRelease.aspx?relid=104046
4. ICDS - Supplementary Nutrition Programme [Internet].
Directorate of ICDS, Women and Child Development
Department, Government of Gujarat. [cited 2017 Jul 24].
Ava i l a b l e f r o m : h t t p : / / w w w. w c d . g u j a ra t . g o v. i n /
Directorate_of_Social_Defence.html
5. Tandon BN. Nutritional interventions through primary health
care: impact of the ICDS projects in India. Bull World Health
Organ. 1989;67:77–80.
6. Anganwadi workers make DC taste “substandard” food
[Internet]. KARNATAKA - The Hindu. 2017 [cited 2017 Jul 24]. p.
1–5. Available from: http://www.thehindu.com/todays-
paper/tp-national/tp-karnataka/Anganwadi-workers-make-
DC-taste-lsquosubstandard-food/article16031396.ece
7. Pandey D. Integrated Child Development Services Scheme:
Presenting Innovative Panaroma. Res Abstr ICDS , Natl Inst
Public Coop Child Dev [Internet]. 2004;33–4. Available from:
http://nipccd.nic.in/reports/raicds.pdf
8. Impact of the integrated package of nutrition and health
services. The Indian Journal of Pediatrics, 2000, Volume 67,
Number 5, Page 322 F. Saiyed, S. Seshadri. :17–88.
Healthline Journal Volume 8 Issue 2 (July-December 2017)
:: 47 ::
Original Article
A Study on Hypertension and Prehypertensive Status and Their Key
Determinants among School Going Adolescents in Surendranagar City1 2 3 1 4 5
Shashwat Nagar , Ebbie Thomas , Darshan Mahyavanshi , Hiren Patel , Noopur Nagar , S. S. Nagar1 2Assistant Professor, Tutor, Department of Community Medicine, Parul Institute of Medical Sciences and Research,
Vadodara, Gujarat, India3Assistant Professor, Department of Community Medicine, GMERS Medical College, Valsad, Gujarat, India4Senior Resident, Department of Obstetrics and Gynecology, Parul Institute of Medical Sciences and Research,
Vadodara, Gujarat, India5Ex- Professor and Head, Department of Community Medicine, C U Shah Medical College, Surendranagar,
Gujarat, India
Correspondence : Mr. Ebbie Thomas, Email: [email protected]
Abstract :
Introduction: “Primary Hypertension” is detectable in children and adolescents as in adults; it is
associated with positive family history of hypertension, obesity, and life-style factors.There is plenty of
evidence to suggest that hypertension begins in childhood and adolescence.The present study was
undertaken to determine the prevalence of hypertension and pre-hypertension and the associated risk
factors among school going adolescents in Surendranagar city. Objectives : To estimate the prevalence of
hypertension and pre-hypertension among school going adolescents. Method : The study carried out was
cross sectional and for categorization of hypertension for adolescents, the JNC 7 classification was used. All
the students from 2 schools of Surendranagar city selected randomly aged 10-19 years were included as
subjects in the study. This came down to 374 students from government schools and 404 students from
private schools. Results : It was seen that nearly 28% of children from Government schools and 32.4% of
children from Private Schools were in category of pre-hypertensive and about 2% of students from
Government schools and 6% of students from Private schools were found to be hypertensives. Family
History of Hypertension, BMI status, frequency of junk food consumption outside home, type and regularity
of physical activity and influence of gender were found to be predictors and contributors to elevated blood
pressure using logistic regression analysis. Conclusion : It is recommended that the interventions for
prevention of life style disorders among adolescents to be started at young age at schools by inclusion in
curriculums and promotion of healthy lifestyle and healthy diet in schools.
Keywords : Adolescence, Hypertension, Junk Food, Physical Activity
Introduction :
India is undergoing an epidemiological transition
where non-communicable diseases (NCDs) are on
rise. According to World Health Report 2002,
cardiovascular diseases (CVDs) will be the largest [1]
cause of death and disability by 2020 in India. The
growing burden of Cardio Vascular Diseases is being
contributed largely due to multitude of risk factors
which are with hypertension being one of them.
Primary Hypertension is detectable in children
and adolescents and as in adults it is associated with
positive family history of hypertension, obesity and [2]life-style factors. Hypertension is a disease
following rule of halves making it largely an under-[3]diagnosed problem. There is plenty of evidence to
suggest that hypertension begins in childhood and
adolescence. In an attempt to study and prevent the
development of hypertension, there is a growing
interest in measuring blood pressure in children. The
aim of this is to detect and monitor those with a [4]
relatively high level of blood pressure.
The causes for increase in blood pressure are
attributed to obesity, change in dietary habits,
Healthline Journal Volume 8 Issue 2 (July-December 2017)
:: 48 ::
decreased physical activity and increasing stress.
Elevated blood pressure, systolic or diastolic at any
age, in either sex is a contributor for all forms of
cardiovascular disease. Identifying and modifying
risk factors reduces the incidence and complications
in adolescents and adult. Prevalence of hypertension
varies across countries and states. It is multifactorial
disease, influenced by genetic, racial, geographic, [5]
cultural and dietary patterns. The asymptomatic
nature of hypertension in early phases of its onset
during adolescence increases the chances of [6]developing complications during adulthood.
Several studies in India have reported the
prevalence of hypertension to be ranging between
0.46% and 11.7% amongst children and adolescents. [7]
Considering the detection of hypertension in
adolescence as the best possible preventive
intervention to avoid complication later in life, the
present study was undertaken to determine the
prevalence of hypertension and pre-hypertension
and the associated risk factors among school going
adolescents in Surendranagar city.
Aims & Objectives :
1. To estimate the prevalence of hypertension and
p re - hy p e r te n s i o n a m o n g s c h o o l g o i n g
adolescents.
2. To study the difference between the prevalence
among students of Private and Government
schools of the city.
3. To study the potential determinants and risk
factors among the students for elevated blood
pressure.
Method :
Out of the total 12 government and 8 private
schools in Surendranagar city, one school each from
government and private schools were selected using
simple random sampling after enumerating them
alphabetically. All the students of these schools who
consented to be a part of the study were enrolled as
participants and included in the study. Only those
students who fell in the age group of 10 to 19 years
were included in the study. This came down to 404
students from private schools and 374 students from
government schools.
A written and oral consent was sought (for
children below 18 years of age, consent of their
parents was sought) before the start of the study.The
study carried out was cross sectional and for
assessment of obesity the WHO classification of BMI
was used. For categorization of hypertension for [8]adolescents, the Joint National Committee (JNC) 7
classification was used.
An ethical clearance from the institutional ethics
committee was taken before the commencement of
the study.
The data were collected by examining the students
for their physical parameters and directly questioned
for collecting data for their dietary and exercise
patterns and practices. The blood pressure of the
students was recorded by taking an average of three
readings while they were seated comfortably for 10
minutes.
The data obtained was analyzed using MS Excel
and SPSS v24 (free trial version).
Results :
The Socio-Demographic graph of figure 1 shows
the different characteristics of the adolescents under
the study. We can see that the age group from 12-14
years and 14-16 years had the maximum
representation among the Government schools in the
study which comprised of 10 to 19-year olds;
whereas among the Private schools it was age group
10-12 yrs. Majority of the respondents in both
Government and Private schools were boys (83% and
77%) as compared to girls (17% and 23%).
The parents' occupation and education from both
the Government schools and Private schools were
also assessed; it showed that in Government schools
almost 43% fathers were laborers, while 72%
mothers were housewives. In Private schools, fathers
were mostly in Service and Business industries with
35% and 30% respectively while 92% mothers were
housewives.
Nagar et al A Study on Hypertension and Prehypertension...

:: 49 ::
Healthline Journal Volume 8 Issue 2 (July-December 2017)
Table 1 Prevalent Risk factors of hypertension among the adolescents (Government schools n=374; Private schools n=404)
Prevalent Risk
Factors for
Hypertension
School Type Total Percent
Government
schools
Percent
Private
schools
Percent
Frequency of junk food consumption *
Not consuming junk
food
89
23.80%
112
27.70%
201
25.80%
Once a week
163
43.60%
117
29.00%
280
36.00%
Twice a week
91
24.30%
108
26.70%
199
25.60%
Thrice a week
19
5.10%
23
5.70%
42
5.40%
> Thrice a week
12
3.20%
3
0.70%
15
1.90%
Everyday
0
0.00%
41
10.10%
41
5.30%
Total
374
100.00%
404
100.00%
778
100.00%
Frequency of physical activity**
Everyday
179
47.90%
38
9.40%
217
27.90%
Alternate day
48
12.80%
47
11.60%
95
12.20%
Twice a week
62
16.60%
169
41.80%
231
29.70%
Once a week
45
12.00%
77
19.10%
122
15.70%
No physical activity
40
10.70%
73
18.10%
113
14.50%
Total
374
100.00%
404
100.00%
778
100.00%
Family history of Hypertension
No family history of
hypertension
305
81.60%
327
80.90%
632
81.20%
Father
10
2.70%
18
4.50%
28
3.60%
Mother
16
4.30%
16
4.00%
32
4.10%
Siblings
1
0.30%
1
0.20%
2
0.30%
Paternal relatives
35
9.40%
38
9.40%
73
9.40%
Maternal relatives
7
1.90%
4
1.00%
11
1.40%
Total 374 100.00% 404 100.00% 778 100.00%
*Junk food consumption included: PavBhaji, Pizza, Pasta, Maggi noodles, Soft drinks, sandwich and burger.
** Data of Frequency of Physical Activity was collected for the last month.
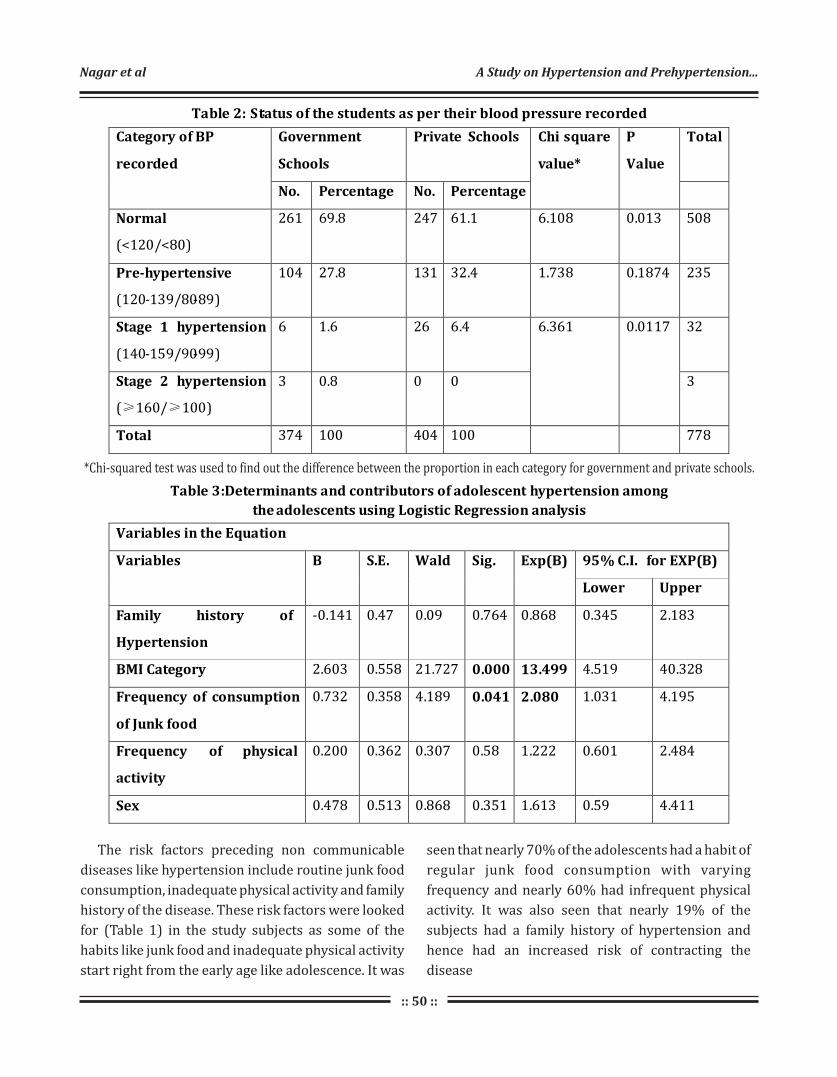
:: 50 ::
:
Nagar et al A Study on Hypertension and Prehypertension...
Table 2: Status of the students as per their blood pressure recorded
Category of BP
recorded
Government
Schools
Private Schools Chi square
value*
P
Value
Total
No. Percentage No. Percentage
Normal
(<120/<80)
261 69.8 247 61.1 6.108 0.013 508
Pre-hypertensive
(120-139/80-89)
104 27.8 131 32.4 1.738 0.1874 235
Stage 1 hypertension
(140-159/90-99)
6 1.6 26 6.4 6.361 0.0117 32
Stage 2 hypertension
(≥160/≥100)
3 0.8 0 0 3
Total 374 100 404 100 778
Table 3:Determinants and contributors of adolescent hypertension among
the adolescents using Logistic Regression analysis
Variables in the Equation
Variables B S.E. Wald Sig. Exp(B) 95% C.I. for EXP(B)
Lower Upper
Family history of
Hypertension
-0.141 0.47 0.09 0.764 0.868 0.345 2.183
BMI Category 2.603 0.558 21.727 0.000 13.499 4.519 40.328
Frequency of consumption
of Junk food
0.732 0.358 4.189 0.041 2.080 1.031 4.195
Frequency of physical
activity
0.200 0.362 0.307 0.58 1.222 0.601 2.484
Sex 0.478 0.513 0.868 0.351 1.613 0.59 4.411
*Chi-squared test was used to find out the difference between the proportion in each category for government and private schools.
The risk factors preceding non communicable
diseases like hypertension include routine junk food
consumption, inadequate physical activity and family
history of the disease. These risk factors were looked
for (Table 1) in the study subjects as some of the
habits like junk food and inadequate physical activity
start right from the early age like adolescence. It was
seen that nearly 70% of the adolescents had a habit of
regular junk food consumption with varying
frequency and nearly 60% had infrequent physical
activity. It was also seen that nearly 19% of the
subjects had a family history of hypertension and
hence had an increased risk of contracting the
disease

Figure 1 : Socio-Demographic characteristics of the adolescents (Government schools n=374; Private schools n=404)
:: 51 ::
When the education of the parents in both school
types were considered, about 55% of the fathers and
58% of the mothers were educated only till Primary
or Secondary level and about 23% of mothers were
illiterate among Government school going
adolescents. In Private school goers too, maximum
percentage of education that the fathers and the
mothers had was Secondary level with 34% and 30%.
Thus there wasn't much difference in Government
and Private schools in this regard.
It can be seen from Table 2 that nearly 28% of
children from Government schools and 32.4% of
children from Private schools were in category of pre-
hypertensive. Nearly 2% of students from
Government schools and 6% of students from Private
schools were found to have high blood pressure and
in stage 1. Only 3 students from Government schools
were found to be in stage 2 hypertensive.
The difference between two proportions was not
found to be significant except for the normotensives.
However, even though the numbers are statistically
not significant, the numbers have a significant impact
on the public health aspects of the disease at such an
early age.The difference between two proportions
for hypertensive showed that the prevalence in
Private schools was much higher than the 2
Government schools. (χ =6.361, p=0.011)
(Table 3)The determinants and contributors of
hypertension among the adolescents were analyzed
using Logistic Regression analysis, in which the
determinants were chosen as per the table
mentioned above which included their Family
History of Hypertension, BMI status, frequency of
junk food consumption outside home, type and
regularity of physical activity and influence of gender.
The P value and the beta exponential values were
recorded and looked for. It was seen that the BMI
status and frequency of junk food consumption were
good predictors of hypertensive status whereas
other variables even though were not having strong
beta exponential values, but still could predict the
outcome to an extent. As compared to normal BMI,
those with elevated BMI had 13.5 times increased
risk of developing hypertensive status and those
having frequent consumption of junk food ( more
than twice a week) as compared to infrequent
consumption of junk food (once a week) had 2 times
higher risk of developing hypertensive status at such
young age. Other variables even though not having
significant P values are still known risk factors in
development of hypertension.
Discussion :
Present study shows nearly 80% of subjects were
males and 20% females, a study conducted by
TanuAnand et al also showed similar results in urban [7]Delhi. The overall hypertension in the present
study was nearly 5% (4.5%). This was almost similar
to the prevalence found in Tanu Anand et al in urban
Delhi (7%).When the statistics of Government and
Private schools were compared, it was seen that the
prevalence in Government schools was 2.4% and that
in Private schools was 6.4%. This difference in the
two was statistically significant. This showed that the
prevailing risk factors of hypertension like Family
History, BMI Status, Frequency of Junk Food
Consumption, Frequency of Physical Activity, etc.
were found more among the Private schools as
compared to the Government schools. This difference
could be as the students in the Private schools are
usually from a higher socio-economic class, are
better off and thus involved in lesser physical
activities and tend to have a more gadget friendly life
as compared to the Government schools
Healthline Journal Volume 8 Issue 2 (July-December 2017)
:: 52 ::
counterparts who are more involved in games
involving routine physical activities like cricket, [7]
kabaddi, soccer etc.
Surveys which are small scale of similar types in
India have suggested prevalence of 2 to 5% in school
children. Study conducted by Buch et al in Surat
suggested a prevalence of 6.48% in school going [5]
children. These results are quite similar to the
results found in the present study showing that the
prevalence ranges from about 2 to 6% in school going
children from different parts of the country.
Hypertension is a disease which shows an
increase with the advancing age and shows a direct [9]relationship with the variable. The present study
showed that there was no significant association
between age and hypertension. However, even
though not significant, the prevalence among the
different age groups ranged from 3.1 to 7.6% which is
quite high; the overall average being 4.5%. Further
analysis revealed that the prevalence doubled after
the age of 16yrs. This shows the increased prevalence
with advanced age. Study conducted by Buch et al
showed similar findings of increased prevalence with [5]advancing age.
The present study showed that the prevalence of
hypertension was more in boys (4.8%) as compared
to girls (3.2%) which is a little different from Banker
et al which showed that the prevalence was similar in [10]both the sexes.
Logistic regression analysis of the predictors
revealed that the BMI status of the students and
frequency of outside junk food consumption were
strong predictors whereas the others even though
were not that significant (statistically) but still had
some contribution to the regression model and
explained the variability in the model and hence were
important factors for development of hypertension
in adolescence. Thus, it is imperative that if the
hypertension among the adolescents is to be
reduced, the predictors are needed to be modified or
controlled at the earliest. Further studies would be
needed in the same area of research to develop better
models of regression so that the predictors can be
better identified and associated with the final
outcome.
Conclusion & Recommendations :
It can therefore be concluded from the study that
the prevalence of adolescent hypertension is a
growing concern on account of the changing life style
which includes change in diet and marked reduction
in physical activities. The prevalence in the present
study which is nearly 5% could be even more in other
larger districts which are more developed and
populous. It is therefore needed that studies of
similar type be replicated in other districts and states
so that the overall problem can be estimated.
After estimation, it is much imperative that the
results must be shared with the relevant authorities
so that either the specific interventions are
amalgamated with the NCD programme or with
school health in a way that necessary results are
achieved in a phased manner.
A very important method of achieving the results
especially in educational institutions is inclusion of
these topics in the curriculum at an early age so that
the students are aware of the life style disorders and
their complications in adulthood and old age.
Health education sessions should be planned
regularly in addition to training the students by
inculcating the advantages of regular physical
activities and promotion of healthy diet .
Interventions planned early in the life of an
individual will go a long way in reducing the impact of
the lifestyle disorders in our country.
Declaration :
Funding : Nil
Conflict of Interest : Nil
References :
1. MoHFW, WHO. National Cardiovascular Disease Database. 2012.
2. Bonita Falkner. Hypertension in children and adolescents:
epidemiology and natural history. PediatrNephrol (2010)
25:1219–1224.
3. Park K. Textbook of Preventive and Social Medicine. 21st ed.
Jabalpur: M S BanarsidasBhanot; 2011. Chapter 6: Epidemiology
of Chronic Non-Communicable Diseases and Conditions; p. 345.
Nagar et al A Study on Hypertension and Prehypertension...

:: 53 ::
4. De Man SA, André JL, Bachmann H, Grobbee DE, Ibsen KK, Laaser
U, et al. Blood pressure in childhood: Pooled findings of six
European studies. J Hypertens. 1991;9:109–14. [PubMed:
1849524]
5. Buch N, Goyal J, Kumar N, Parmar I, Shah V, Charan J. 8/1/2017
Prevalence of hypertension in school going children of Surat city,
Western India. Journal of Cardiovascular Disease Research Vol.2
/ No 4 (page 228-232)
6. Uhari M, Nuutinen EM, Turtinen J, Pokka T, Kuusela V, Akerblom
HK, et al. Blood pressure in children, adolescents and young
adults. Ann Med. 1991;23:47–51. [PubMed: 2036205]
7. Anand T, Ingle G, Meena G, Kishore J, Kumar R. Hypertension and
its correlates among the school adolescents in Delhi.
International Journal of Preventive Medicine. 2014 March; 5
(Suppl 1): 65-70.
8. Mohan B, Kumar N, Aslam N, Rangbulla A, Kumbkarni S, Sood NK,
Wander GS. Prevalence of sustained hypertension and obesity in
urban and rural school going children in Ludhiana. Indian Heart J
2004; 56:310-4.
9. Chobanian AV1, Bakris GL, Black HR, Cushman WC, Green LA,
Izzo JL Jr, Jones DW, Materson BJ, Oparil S, Wright JT Jr, Roccella EJ.
A study on prevalence of hypertension in school children. Gujarat
Medical Journal, December 2013; 2: 79-81.
10. Bander Chirag A. Jitesh Chavda, Khyati M Kakad, Panchsilla
Damor. A study of prevalence of hypertension in school children.
Gujarat Medical Journal, December 2013 Vol.68 No.2
(page 79-81)
Healthline Journal Volume 8 Issue 2 (July-December 2017)
Abstract :
Introduction : Diabetes mellitus is on the rise and is a prevalent chronic disease in middle and low income
countries. Type-1 diabetes mellitus usually develops during infancy and adolescents and as a chronic
condition has a hard impact on aspect of life of adolescents. Objectives : To assess the quality of life (QOL) of
adolescents with type-1 diabetes mellitus in Bhavnagar.. Method : A cross-sectional study was conducted
among a convenient sample of 57 adolescents with type-1 diabetes mellitus who were registered in Juvenile
Diabetes Association, from August-October 2016 with a self-administered questionnaire on Diabetes Quality
of Life. Results : Among 57 adolescents, 54.3% were males and 45.7% were females. The mean age of the
participants was 16.19+3.29 years. The mean duration of diabetes was 91.8+63.3 months. The mean
glycosylated hemoglobin (HbA1c) was 9.21+2.02 %, among which 71.9% were in the range of 6-10% and
28.1% were in the range of 10-15% of HbA1c. Out of 57 adolescents, 94.7% were literate and 5.3% were
illiterate. 91.2% adolescents reported having a poor quality of life. The median scores for each domain are as
follows: Satisfaction 26, Impact 80, and Worries 22. No significant difference was found between the domains
and age and glycemic control except between HbA1c and quality of life in worries domain. No association was
found between the domains and gender and education. Conclusion : Most of the adolescents (91.2%)
with type-1 diabetes were having poor quality of life. In worries domain, HbA1c had a significant effect on
quality of life.
Key words : Adolescents, Quality of life, Type-1 Diabetes Mellitus.
:: 54 ::
A Cross-Sectional Study of Assessment of Quality of Life among Adolescents
with Type-1 Diabetes Mellitus in Bhavnagar, Gujarat1 2 3
Antara Banik , Atul Trivedi , Mihir Rupani1 2 3PG Resident, Associate Professor, Assistant Professor, Department of Community Medicine, Government Medical College,
Bhavnagar, Gujarat, India
Correspondence : Dr. Atul Trivedi, E mail: [email protected]
Introduction :
Diabetes mellitus is a demanding disease and its
prevalence is steadily increasing in low and middle
income countries. Currently, an estimated 422
million people have diabetes worldwide, and this
number is predicted to rise to 592 million by the year [1]
2035. Rapid lifestyle changes, aging of the
population, and environmental changes have
contributed to a significant increase.
India accounts for most of the children with type-1
diabetes mellitus (T1DM) in South-East Asia. Type-1
diabetes is also on the increase as Type-2 diabetes,
but not in the same proportion.Type-1 diabetes
mellitus is caused by insulin deficiency which may be
autoimmune or idiopathic in nature and cannot be
prevented. It usually occurs during infancy and
adolescence. The prevalence of diabetes (Type - 1) in
India is variable, and three sets of data show 17.93 [ 2 ]
cases/100,000 children in Karnataka, 3.2 [3]
cases/100,000 children in Chennai , and10.2 [4]cases/100,000 children in Karnal (Haryana).
Intensive treatment is required to prevent or delay
acute and chronic complications of T1DM, which
involves multiple daily injections of insulin (or
insulin infusion), monitoring daily blood glucose,
carbohydrate consumption and involving in regular
physical activity. For this, diabetes in children and
adolescents poses serious physical, mental and
emotional challenges. In general, T1DM and its
complications may affect adolescents' living
conditions over the years and may also influence
their quality of life (QOL) as adolescents are more
resistant to accepting the disease, because they no
Healthline Journal Volume 8 Issue 2 (July-December 2017)Original Article
:: 55 ::
longer depend on their parents or guardians for their
care and are responsible for their own health. Quality
of life among adolescents with T1DM has not been
studied in Gujarat. Hence, the present study attempts
to assess the Quality of Life among adolescents with
Type-1 Diabetes mellitus in Bhavnagar city, Gujarat.
Method :
Study setting: This study was conducted at
Government Medical College, Bhavnagar in
collaboration with Juvenile Diabetes Association.
Study design : It was a cross-sectional study
conducted among adolescents with type-1 diabetes
mellitus.
Study duration: The study was conducted for a
period of 3 months from August– October 2016.
Sample size: All 57 adolescents who were registered
under Juvenile Diabetes Association and have
participated were included in the study.
Sampling Method: Convenience sampling method
was used in this study.
Data Collection: The purpose of the study was
explained to the participants. A written informed
consent was taken from the willing participants. The
willing participants gave data via the completion of a
structured questionnaire, which consisted of [5]questions regarding Diabetes Quality of life.
The Questionnaire was divided into three sections:
Satisfaction, Impact and Worries consisting of a total
of 32 questions. The socio-demographic profiles of
the participants were also elicited. Satisfaction
section consists of two domains including treatment
and diet using a scale of 1-5 (1-very dissatisfied, 2-
moderately dissatisfied, 3-neither dissatisfied, 4-
moderately satisfied, 5-very satisfied). Impact
section consists of three domains including impact
on physical health, general health and emotional
health using a scale of 1-5 (1-always, 2-frequently, 3-
often, 4-sometimes, 5-never). Worries section
consists of two domains including symptom suffering
and financial worries using a scale of 1-4 (1-alot, 2-
highly little, 3-very little, 4-not at all). The total score
is the sum of the domain scores. There was no cutoff [5]
score for this questionnaire . Thus the median score
of each section has been taken, and the value more
than the median value corresponds to good quality of
life.
1. Total Quality of Life: A score of >239 indicates a
good quality of life.
2. Satisfaction: A score of >26 indicates a good quality
of life.
3. Impact: A score of >80 indicates a good quality of
life.
4. Worries: A score of >22 indicates a good quality of
life.
Inclusion criteria: The adolescents aged 10-19
years who were registered in Juvenile Diabetic
Association in Bhavnagar and were willing to
participate.
Ethical issue: The study was conducted after due
ethical and institutional permission. A written
informed consent was taken from their parents.
Statistical Analysis: Data entry was done in
Microsoft Excel and data analysis was done in SPSS
version 21. Frequencies, Percentages, Means and
Standard Deviation were calculated. Chi square test
and Student's t-test were applied. The value of
p<0.05 were considered statistically significant.
Results :
The present study is based upon responses
received from the 57 adolescents who were
registered in Juvenile Diabetes Association and has
given consent. The mean age of the participants was
16.19+3.29 years.The socio-demographic profiles of
the adolescents have been elucidated in Table 1. As
shown in the table, 54.3% were males and 45.7%
were females. The mean duration of diabetes was
91.8+63.3 months. The mean glycated hemoglobin
(HbA1c) was 9.21+2.02 %, among which 71.9% were
in the range of 6-10% and 28.1% were in the range of
10-15% of HbA1c. Among the participants, 94.7%
were literate and 5.3% were illiterate.
Banik et al Assessment of Quality of Life among Adolescents...

:: 56 ::
Table 1: Socio-Demographic profile of the adolescents (n=57)
Characteristics Category Frequency (%)
Age 10-14 years 17(29.8)
15-19 years 40(70.1)
Gender Male 31(54.3)
Female 26(45.6)
Education Literate 54(94.7)
Illiterate 03(5.2)
Duration of Diabetes
1-5 years 25(43.8)
5-10 years 15(26.3)
10-15 years 11(19.3)
15-19 years 06 (10.5)
HbA1c (%) 6-10 41 (71.9)
10-15 16(28.1)
Domains Frequency (%) 2x1 Chi
square value
p-value
Total Quality of
life
Poor QOL 52(91.2)
38.754
<0.001 Good QOL 05(8.8)
Satisfaction Poor QOL 31 (54.4)
0.439
0.508 Good QOL 26 (45.6)
Impact Poor QOL 29 (50.9)
0.018
0.895 Good QOL 28 (49.1)
Worries Poor QOL 31 (54.4)
0.439
0.508 Good QOL 26 (45.6)
(Table 2) 91.2% adolescents with T1DM had poor
quality of life and 8.8% had good quality of life, which
is statistically highly significant (p<0.001). For
satisfaction domain, 54.4%have opined that they had
poor quality of life as compared to 45.6% who replied
that they had good quality of life.Observation depicts
that regarding impact domain, 50.9% of adolescent
had poor quality of life in contrast to 49.1% who had
good quality of life. It was noticed in the study that for
worries domain, 54.4% of adolescent had poor
quality of life, while 45.6% had good quality of life.
Table 3 shows Domains of quality of life
(Satisfaction, impact, worries and total quality of life)
versus age and HbA1c. As demonstrated in the table,
Table 2: Frequency distribution table of Total Quality Of Life (QOL), Satisfaction, Impact and Worries domains.
Healthline Journal Volume 8 Issue 2 (July-December 2017)

:: 57 ::
those adolescents who had poor quality of life had a
mean age of 16.06 (+3.40) years. By comparison,
those adolescents who had good quality of life had a
higher mean age of 17.60 (+1.34) years. To test the
hypothesis that those with a poor quality of life were
associated with a statistically significantly different
mean age, an independent sample t-test was
performed. The assumption of homogeneity of
variances was tested and was satisfied via Levene's F
test.
The independent samples t-test was associated
with a statistically insignificant effect, p=0.070. The
independent t-test has also been performed for the
domains (satisfaction, impact and worries), so as to
test the hypothesis that those adolescents with a
poor quality of life were associated with a statistically
significantly different mean age. It was also
associated with statistically insignificant effect. Thus
there was no association between the domains of
quality of life of the adolescents and their age.
Similarly, on applying independent sample t-test,
there was no statistically significant difference
Table 3: Independent sample t-test between QOL domains and variables (Age & HbA1c)
1. Quality Of
Life(QOL)
Poor QOL
Mean(+SD)
Good QOL
+Mean( SD)
p-value
Age 16.06(+3.40) 0.070†
HbA1c 9.34(+2.033) 0.102*
2. Satisfaction
Age 15.45(+3.623) 0.057†
HbA1c 9.32(+1.984) 0.640*
3 Impact
Age 15.72(+3.442) 0.279*
HbA1c 9.41(+2.162) 0.436*
4. Worries
Age 15.48(+3.604) 0.069†
HbA1c 9.84(+2.323)
17.60(+1.34)
7.79(+1.372)
17.08(+2.667)
9.067(+2.10)
16.68(+3.151)
8.99(+1.884)
17.04(+2.720)
8.44(+1.262) 0.006†
.
# Independent sample t-test; *Equality of variances assumed as Levene’s test p -value >0.05;
†Equality of variances not assumed as Levene’s test p-value<0.05
between HbA1c and total quality of life, satisfaction
and impact domains. However, there is a statistically
significant difference between those adolescents
with a poor quality of life and worries, p=0.006.
Table 4 shows Domains of quality of life
(satisfaction, impact, worries and total quality of life)
versus gender and education. The association
between these variables was statistically
insignificant, shows that there was no association
between the domains of quality of life of adolescents
and gender and education.
Discussion :
The research focused on the assessment of quality
of life of the adolescents with type-1 diabetes
mellitus who were registered in Juvenile Diabetic
Association in Bhavnagar. The current study found
that most of the adolescents (91.2%) had poor
quality of life. This was in contradiction with what the [6]study by Costa LM, et al.(2015) found that the
adolescents consistently reported having a good
quality of life. The present study found that there was
Banik et al Assessment of Quality of Life among Adolescents...

:: 58 ::
Table 4: Association by Chi square test between the QOL domains and variables
QOL
Variables
Poor QOL
n (%)
Good QOL
n (%)
Chi
Square
value
p- value
Gender Male 29(93.6) 2(6.5)
0.457
0.651 Female 23(88.5) 3(11.5)
Education
Literate 49(90.7) 5(9.3) -
-
-
0.7553
(Mid-P Exact) Illiterate 03(100) 0
Satisfaction
Gender Male 18(58.1) 13(41.9) 0.371 0.600
Female 13(50) 13(50)
Education Literate 28(51.9) 26(48.1) 0.1536
(Mid-P Exact) Illiterate 03(100) 0
Impact
Gender Male 15(48.4) 16(51.6) 0.169 0.792
Female 14(53.8) 12(46.2)
Education Literate 26(48.1) 28(51.9) 0.1249
(Mid-P Exact)
(Mid-P Exact)
Illiterate 03(100) 0
Worries
Gender Male 18(58.1) 13(41.9) 0.371 0.600
Female 13(50) 13(50)
Education Literate 29(53.7) 25(46.3) 0.193 1.000
Illiterate 02(66.7) 01(33.3)
no association between the gender and quality of life.
This was again in contradiction with what the study [6]
by Costa LM et al. (2015) which found that there
wasan association between quality of life and female [7]gender. The study by Abolfotouh et al. in Alexandria
found that there was an association between male
gender and quality of life. Some other studies also
demonstrated that diabetes had more impact on girls [9-12]
. The present research found that there was no
statistically significant difference between age and
the domains of quality of life. This was supported by a [8]study conducted by Eman M.M. Monazea, et al.
(2012) which revealed no significant association
between age and total quality of life, but study [7]
conducted in Alexandria by Abolfotouh et al. (2011)
found that there is a significant association between
age and QOL.The current study found that there is no
association between HbA1c and quality of life, except
the finding of worries domain, which revealed that
there is an association between HbA1c and poor [13]
quality of life. Al-Akour et al. found that higher
HbA1c values were associated with lower scores of [14]
QOL. Hoey et al. reported a significant positive
association exists between improved glycemic
control, even over a short time period and improved
QOL in patients with diabetes. Other researchers
Healthline Journal Volume 8 Issue 2 (July-December 2017)

:: 59 ::
found no association between QOL and metabolic [15-17] control. It would be expected that the quality of
life would be positively correlated with age, gender,
glycemic control and education but the current
research could not establish any such association.
Conclusion :
We conclude from the study that majority of the
adolescents with type-1 diabetes mellitus was having
poor quality of life. We also concluded that HbA1c
was correlated with poor quality of life in worries
domain. The study also highlighted that the quality of
life was not associated with age, gender, education
and glycemic control. Regular visit to health centers
and counseling intervention might improve the
quality of life.
Declaration :
Funding : Nil
Conflict of Interest: Nil
References :
1. World Health Organization (2016). WHO Global Report on
Diabetes. Available at: http:// www.who.int/diabetes/en/.
(Accessed on July 20, 2017).
2. Kumar P, Krishna P, Reddy SC, Gurappa M, Aravind SR,
Munichoodappa C. Incidence of type 1 diabetes mellitus and
associated complications among children and young adults:
Resultsfrom Karnataka Diabetes Registry 1995-2008. J Indian
Med Assoc 2008; 106:708-11.
3. Ramachandran A, Snehalatha C, Krishnaswamy CV. Incidence of
IDDM in children in urban population in southern India. Madras
IDDM Registry Group Madras, South India. Diabetes. Res. Clin.
Pract, 1996;34:79-82.
4. Kalra S, Kalra B, Sharma A. Prevalence of type 1 diabetes mellitus
in Karnal district, Haryana state, India. DiabetolMetabSyndr
2010; 2:14.
5. JitenderNagpal, Arvind Kumar, Sonia Kakar, AbhishekBhartia.
The Development of 'Quality of Life Instrument for Indian
Diabetes Patients (QOLID) : A Validation and Reliability Study in
Middle and Higher Income Groups. 2010 May;58
6. Luce Marina F. C. da Costa,Sandra E. Vieira. Quality of life of
adolescents with type 1 diabetes. Clinics, 2012;70(3):173-9.
7. Abolfotouh MA, Mofida MK, Mohamed DE, Sherine GM: Quality of
life and glycemic control in adolescents with type 1 diabetes and
the impact of an education intervention. Int. J. Gen. Med.
2011Feb;(4):141-152.
8. Eman M.M. Monazea, Sahar H. Talha, Etemad A. El-shereef,
Hosnia S. Abd el-Megeed, Lobna f. Eltony.Quality of Life Among
Adolescents with Type I Diabetes Mellitus in Assiut. Med. J. Cairo
Univ.,2012 Jun; 80(1):261-270.
9. Skinner TC, Hoy H, Mcgee HM, Skovlund SE. A short form of the
Diabetes Quality of Life for Youth questionnaire: exploratory and
confirmatory analysis in a sample of 2,077 young people with
type I diabetes mellitus. Diabetologia 2006; 49: 621-28.
10. Herrmann C.International experiences with the Hospital Anxiety
and Depression Scale:A Review of validation data and clinical
results-J. Psychosom Res., 1997; (42): 17-41.
11. Vingilis ER, Wade TJ, Seeley JS. Predictors of adolescent self-rated
health: Analysis of the National Population Health Survey. Can J
Public Health. 2002 May-Jun;93(3):193-7.
12. Naughton MJ, Ruggiero AM, Lawrence JM, Imperatore G,
Klingensmith GJ, Wait-zfelder B, et al.: Health-related quality of
life of children and adolescents with type 1 or type 2 diabetes
mellitus. Arch. Pediatr. Adolesc. Med. 2008,Jul.;162 (7): 649- 657.
13. Al-akour N, KhaderYS,Shatnawi NJ. Quality of life and associated
factors among Jordanian adolescents with type I diabetes
mellitus. J. Diabetes Complication. 2010,Jan-Feb; 24 (1): 43-7.
14. Hoey H, Anstoot HJ, Chiarelli F , Damme-man D, Danne T , Dorchy
H, et al.: Good metabolic control is associated with better QOL in
2101 adolescents with type I diabetes. Dia. Care. 2001;240:
1923-8.
15. Cameron FJ, Clarke C, Hesketh K, White EL, Boyce DF, Dalton VL ,
et al. Regional and urban Victorian diabetic Youth: clinical and
quality of life outcomes. J. Pediatr Child. Health.2002; 38: 593-6.
16. Laffel LM, Connell A, Vangsness L, Goebel-fabbri A, Mansfield A,
Anderson BJ: General quality of life in youth with type I diabetes:
relationship to patient management and diabetes-specific family
conflict. Dia. care. 2003; (26): 3067-3073.
17. Ingersoll GM, Golden MP, Vandagriff J, Marrero DG, Fineberg NS:
Parents of children with diabetes: What are they worried about?.
Dia. Educator. 1992; (18): 299-302.
Banik et al Assessment of Quality of Life among Adolescents...
:: 60 ::
Original Article
An Epidemiological Investigation of Acute Diarrhoeal Disease Outbreak in
Sojitra Village of Anand District by Rapid Response Team of B. J. Medical College,
Ahmedabad1 1 1 1 1 2Nirav Patel , Akash Patel , Rahul Patel , Lakshmi N. , Navin Raja Sekar , Rajshree Bhatt
1 2Resident Doctor, Assistant professor, Community Medicine Department, B.J.Medical College, Ahmedabad, Gujarat, India
Correspondence : Dr. Aakash Patel, E mail: [email protected]
Abstract :
Introduction : Acute Diarrhoeal Disease (ADD) affects millions of people around the world especially in
second world nations. Most of the pathogenic organisms that cause diarrhoea, are transmitted primarily or
exclusively through feco-oral route. We have investigated an outbreak of Acute Diarrheal Disease in Sojitra
Village of Anand District-Gujarat, to identify the etiological agent, mode of transmission and various control
measures taken by the authority. Objectives : 1. To confirm the existence of an outbreak, 2. To know the
magnitude and distribution of the outbreak with reference to time, place and person, 3. To identify the source
of infection, mode of transmission and implement control and preventive measures. Method : A Cross
Sectional Epidemiological study was carried out to investigate the outbreak of acute diarrhoeal disease cases
in Sojitra Village. We obtained required information from the CHC, conducted house to house survey and also
inspected the sanitation and water supply of the affected area. Results : There were 57 cases of acute
diarrhoeal disease. The overall Attack Rate was 1.51%, with higher attack rate among Muslims. The
Attributable risk was found to be 40% among the Muslims who consumed non vegetarian feast post
Ramadan Eid from 24th to 26th week of 2017. Majority of the affected population used non-chlorinated
water for drinking. Conclusion : The underlying cause for the outbreak of acute diarrhoeal disease may be
due contaminated water and food.
Keywords : Acute Diarrhoeal Disease, Epidemic Investigation, Ramadan, Rapid Response Team, Sojitra
Introduction :
Diarrhoea is an important cause of morbidity and
mortality in developing nations. In spite of many
advances in health technology, improved
management and increased use of Oral Rehydration
therapy in the past decade, morbidity due to
diarrhoea has not shown a parallel decline in [1]comparison to mortality trends in India. There are
multiple reasons for this, but mainly it is due to
environmental and sanitation issues. Unfortunately,
Indian data in morbidity and mortality from
Diarrhoeal Disease is deficit in many ways. Most of
the diarrhoeal disease is caused by 20-25 pathogenic
organisms that are transmitted primarily or
exclusively through feco-oral route (water borne, [2]
food borne, fomites).
Chlorine persist in water as residual chlorine after
dosing and this helps to minimize the effect of
recontamination by inactivating microbes which may [3]
enter the water supply after chlorination. Effective
management of Diarrhoea is by prompt rehydration
of patients. Mild and moderate cases can be [4] successfully treated with ORS.
An Outbreak is defined as the unusual occurrence
in a community or region of disease, specific health
related behaviour or health related events clearly in [2]
excess of “expected occurrence”. The prime purpose
of an outbreak investigation is to control, limit its
spread and plan preventive strategies to reduce or
eliminate the risk of such outbreaks in future.
Epidemiological description of the affected area:
Healthline Journal Volume 8 Issue 2 (July-December 2017)
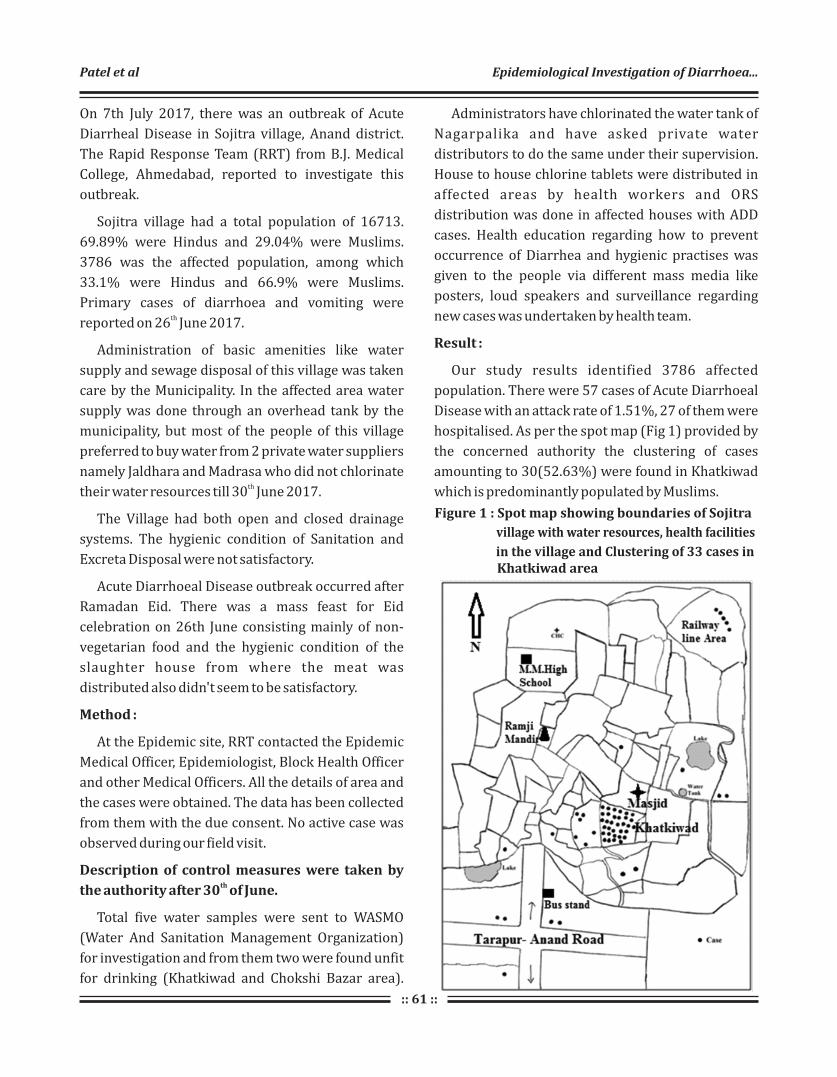
:: 61 ::
On 7th July 2017, there was an outbreak of Acute
Diarrheal Disease in Sojitra village, Anand district.
The Rapid Response Team (RRT) from B.J. Medical
College, Ahmedabad, reported to investigate this
outbreak.
Sojitra village had a total population of 16713.
69.89% were Hindus and 29.04% were Muslims.
3786 was the affected population, among which
33.1% were Hindus and 66.9% were Muslims.
Primary cases of diarrhoea and vomiting were threported on 26 June 2017.
Administration of basic amenities like water
supply and sewage disposal of this village was taken
care by the Municipality. In the affected area water
supply was done through an overhead tank by the
municipality, but most of the people of this village
preferred to buy water from 2 private water suppliers
namely Jaldhara and Madrasa who did not chlorinate th
their water resources till 30 June 2017.
The Village had both open and closed drainage
systems. The hygienic condition of Sanitation and
Excreta Disposal were not satisfactory.
Acute Diarrhoeal Disease outbreak occurred after
Ramadan Eid. There was a mass feast for Eid
celebration on 26th June consisting mainly of non-
vegetarian food and the hygienic condition of the
slaughter house from where the meat was
distributed also didn't seem to be satisfactory.
Method :
At the Epidemic site, RRT contacted the Epidemic
Medical Officer, Epidemiologist, Block Health Officer
and other Medical Officers. All the details of area and
the cases were obtained. The data has been collected
from them with the due consent. No active case was
observed during our field visit.
Description of control measures were taken by ththe authority after 30 of June.
Total five water samples were sent to WASMO
(Water And Sanitation Management Organization)
for investigation and from them two were found unfit
for drinking (Khatkiwad and Chokshi Bazar area).
Administrators have chlorinated the water tank of
Nagarpalika and have asked private water
distributors to do the same under their supervision.
House to house chlorine tablets were distributed in
affected areas by health workers and ORS
distribution was done in affected houses with ADD
cases. Health education regarding how to prevent
occurrence of Diarrhea and hygienic practises was
given to the people via different mass media like
posters, loud speakers and surveillance regarding
new cases was undertaken by health team.
Result :
Our study results identified 3786 affected
population. There were 57 cases of Acute Diarrhoeal
Disease with an attack rate of 1.51%, 27 of them were
hospitalised. As per the spot map (Fig 1) provided by
the concerned authority the clustering of cases
amounting to 30(52.63%) were found in Khatkiwad
which is predominantly populated by Muslims.
Figure 1 : Spot map showing boundaries of Sojitra
village with water resources, health facilities
in the village and Clustering of 33 cases in Khatkiwad area
Patel et al Epidemiological Investigation of Diarrhoea...

:: 62 ::
Table 1: Age group wise comparison of Diseased and Non-diseased among total population
Age group in
years
Diseased Non –diseased Total
χ2
=87.05
df=3
p value <0.05
0-5 7(0.38%) 1816 1823
6-14 3(0.12%) 2498 2501
15-49 36(1.24%) 2863 2899
>50 11(0.11%) 9479 9490
Total 57 16656 16713
(Table 1)Majority of cases were found between 15
to 49 years of age group. (n=36; 63.15%). Among
total cases 27(47.37%) were male and 30(52.63%
were female, but the difference is not statistically
significant. Attack rate in male and female was found
to be 1.29 and 1.76 respectively.
Affected population had high proportion of
Muslims (2534; 66.9%). Attack rate among the
Muslims and Hindus was 1.7% and 1.03%.
respectively. As per the figure 3 we found that, there
was a sudden rise of acute diarrhoeal disease cases [5] from 24 to 26 weeks of 2017 as compared to 2016.
Figure 2: Age wise distribution of cases. (N=57)
Table 2: Preventive measures taken by the authority in affected area of Sojitra village
Date Residual Chlorine test Chlorine tablet
distribution
ORS distribution
Positive Negative
30/06/2017 56 42 1500 52
1/07/2017 68 11 800 20
2/07/2017 97 11 600 35
3/07/2017 129 50 800 43
4/07/2017 110 35 800 46
5/07/2017 51 9 350 19
6/07/2017 117 33 180 19
7/07/2017 106 13 350 31
Total 734 204 5380 265
Cases ranged widely from 6 months to 85 years of age (As per Fig 2)with mean age group of 33 (SD ± 19.22).
Healthline Journal Volume 8 Issue 2 (July-December 2017)
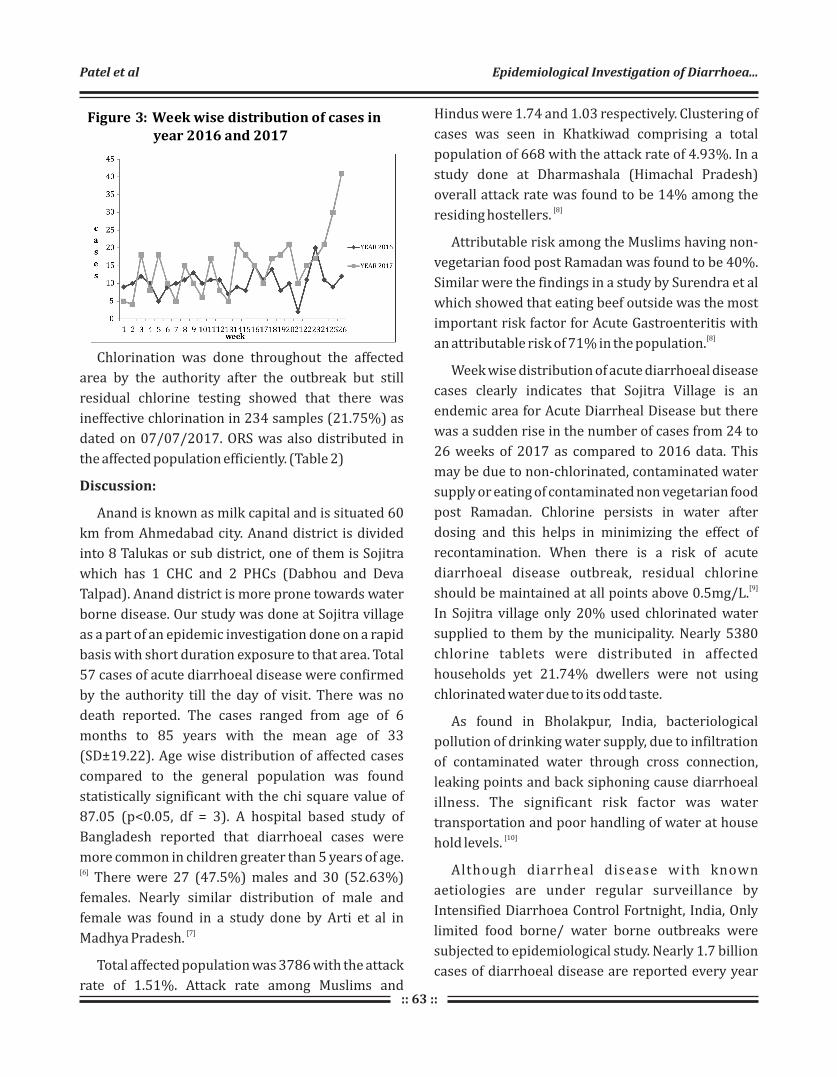
:: 63 ::
Hindus were 1.74 and 1.03 respectively. Clustering of
cases was seen in Khatkiwad comprising a total
population of 668 with the attack rate of 4.93%. In a
study done at Dharmashala (Himachal Pradesh)
overall attack rate was found to be 14% among the [8]residing hostellers.
Attributable risk among the Muslims having non-
vegetarian food post Ramadan was found to be 40%.
Similar were the findings in a study by Surendra et al
which showed that eating beef outside was the most
important risk factor for Acute Gastroenteritis with [8]
an attributable risk of 71% in the population.
Week wise distribution of acute diarrhoeal disease
cases clearly indicates that Sojitra Village is an
endemic area for Acute Diarrheal Disease but there
was a sudden rise in the number of cases from 24 to
26 weeks of 2017 as compared to 2016 data. This
may be due to non-chlorinated, contaminated water
supply or eating of contaminated non vegetarian food
post Ramadan. Chlorine persists in water after
dosing and this helps in minimizing the effect of
recontamination. When there is a risk of acute
diarrhoeal disease outbreak, residual chlorine [9]should be maintained at all points above 0.5mg/L.
In Sojitra village only 20% used chlorinated water
supplied to them by the municipality. Nearly 5380
chlorine tablets were distributed in affected
households yet 21.74% dwellers were not using
chlorinated water due to its odd taste.
As found in Bholakpur, India, bacteriological
pollution of drinking water supply, due to infiltration
of contaminated water through cross connection,
leaking points and back siphoning cause diarrhoeal
illness. The significant risk factor was water
transportation and poor handling of water at house [10]
hold levels.
Although diarrheal disease with known
aetiologies are under regular surveillance by
Intensified Diarrhoea Control Fortnight, India, Only
limited food borne/ water borne outbreaks were
subjected to epidemiological study. Nearly 1.7 billion
cases of diarrhoeal disease are reported every year
Figure 3: Week wise distribution of cases in year 2016 and 2017
Chlorination was done throughout the affected
area by the authority after the outbreak but still
residual chlorine testing showed that there was
ineffective chlorination in 234 samples (21.75%) as
dated on 07/07/2017. ORS was also distributed in
the affected population efficiently. (Table 2)
Discussion:
Anand is known as milk capital and is situated 60
km from Ahmedabad city. Anand district is divided
into 8 Talukas or sub district, one of them is Sojitra
which has 1 CHC and 2 PHCs (Dabhou and Deva
Talpad). Anand district is more prone towards water
borne disease. Our study was done at Sojitra village
as a part of an epidemic investigation done on a rapid
basis with short duration exposure to that area. Total
57 cases of acute diarrhoeal disease were confirmed
by the authority till the day of visit. There was no
death reported. The cases ranged from age of 6
months to 85 years with the mean age of 33
(SD±19.22). Age wise distribution of affected cases
compared to the general population was found
statistically significant with the chi square value of
87.05 (p<0.05, df = 3). A hospital based study of
Bangladesh reported that diarrhoeal cases were
more common in children greater than 5 years of age. [6]
There were 27 (47.5%) males and 30 (52.63%)
females. Nearly similar distribution of male and
female was found in a study done by Arti et al in [7]
Madhya Pradesh.
Total affected population was 3786 with the attack
rate of 1.51%. Attack rate among Muslims and
Patel et al Epidemiological Investigation of Diarrhoea...

:: 64 ::
References :
1. Kumar SG, Subita L , Diarrhoeal Diseases in Developing
Countries: A Situational Analysis, Katmandu uni med journal.
2012;38:83-88
2. Park K., The Textbook Of Prevention And Social Medicine,
24th, Jabalpur: Banarasidas Bhanot Publishers, 2017. p 236-
240 and 98.
3. Disinfection session objectives-world health organization,
www.whoint>dwq page 4. [last accessed on 2017 July 16]
4. WHO. Prevention and control of cholera outbreaks: WHO
policy and recommendations http://www.who.int/
cholera/technical/en.[last accessed on 2017 July 16].
5. IDSP,weekly reporting, http://idsp.nic.in/index4.php?
lang=1&level=0&linkid=406&lid=3689 [last accessed on
2017 July 16]
6. Fahima Chowdhury, Iqbal Ansary Khan, Sweta Patel, Ashraf
Uddin Siddiq, Nirod Chandra Saha, Ashraful I. Khan, Amit
Saha, Alejandro Cravioto,John Clemens,Firdausi Qadri,
Mohammad Ali. Diarrheal Illness and Healthcare Seeking
Behavior among a Population at High Risk for Diarrhea in
Dhaka, Bangladesh. PLOS one: 2015;10:1-14
7. Arti Gupta, B. Venkatashiva Reddy, Surya Bali, and Arun M.
Kokane, J Nat. Outbreak of gastroenteritis among medical
students, Madhya Pradesh, Central India. Sci Biol Med.
2015;6:25–28.
8. Surender Nikhil Gupta, Naveen Gupta, Department of Health
and Family Welfare, Regional Health and Family Welfare
Training Centre (RHFWTC), Chheb, Kangra, Himachal
Pradesh, Indian Journal Of Community Medicine.
2009;34:97-101
9. WHO seminar pack for drinking water quality.WHO. [last
accessed on 2017 July 16]
10. Abdul R M , matnuri L, dattatreya PJ , Mohan D A. Assessment
of drinking water quality using ICP-MS and microbiological
methods in the Bholakpur area, Hyderabad, India. Environ
monil assess 2011;1841:1581-9
11. IDCF 2014 Intensified Diarrhoea Control Fortnight 28
July–8August 2014 operational plan for states, uts and
districts Ministry of Health & Family Welfare, Government of
India.
12. WHO. Estimation of burden of diarrheal disease in India
available from http.//www.who.india.org /commission. [last
accessed on 2017 July 16]
which are significantly clustered in summer and [11]
monsoon months. In India the proportionate
mortality rate of diarrhoea was 9.1% and estimated
projection of year of life lost (YLL) due to diarrhoeal [12]diseases will increase to 1,95,046 in 2016.
The results of our study suggest that non
chlorinated drinking water might be the source of
infection in this village, but they were drinking the
same water since long time. If water was the only
source of outbreak then cases would have been
distributed uniformly in the entire area and all the
age groups would be equally affected. On the
contrary, the cases were clustered in a particular
small area called Khatkiwad where majority of the
population were Muslims. Secondly, children were
less affected here. Third, the outbreak happened just
after Ramadan Eid. This signifies that cases might
have occurred due to consumption of contaminated
food.
Conclusion:
The most probable cause of acute diarrhoeal
disease could be consumption of contaminated food
post Ramadan Eid celebration. This outbreak affects
substantially Muslims, clustered in Khatkiwad area of
Sojitra Village but could not be confirmed due to lack
of laboratory evidence during epidemic.
Recommendations:
Effective chlorination of all the water sources is
plays a crucial role to prevent outbreaks. Distributing
chlorine tablets in affected and unaffected
households can reduce the incidence of cases. Proper
surveillance and prompt treatment can reduce the
mortality and disease burden. Periodic inspection of
all slaughter houses for proper hygiene by concerned
authority should be done to maintain hygienic
slaughtering practices. Relevant health education
and continuous surveillance in the area is pivotal.
Declaration :
Funding : Nil
Conflict of Interest : Nil
Healthline Journal Volume 8 Issue 2 (July-December 2017)
:: 65 ::
Letter to Editor
Baal Doctor: A Health Change Agent in SchoolShailesh Sutariya
Program Officer, School Health Services, Government of Gujarat, Gandhinagar, Gujarat
Secretary, Indian Association of Preventive and Social Medicine-Gujarat Chapter
Secretary, Indian Public Health Association-Gujarat Chapter
Correspondence : Dr. Shailesh Sutariya, E mail: [email protected]
Every child is different and carrying tremendous
capabilities within him. To increase and flourish his
talent, the overall health of child is the most important
determinant. Being health care personnel, it is our
moral responsibility to enhance the healthy life styles
among children and keep them updated with new
fruitful initiatives. Although, a lot of health services
and screening amenities are being provided to
children, there was a need to add something new in
order to increase the interest for health and the
awareness about health among children. The concept
of “Baal Doctor” is one of these efforts of health care
services. Under this concept, every Primary school
(Government) is supposed to create one “Baal Doctor”
in every class. Departments of Health and Education
of Government will jointly work on this concept.
School is another important world for a child,
outside his home, where friends play a major role, just
like family members. It is the second place after home
where every child spends a lot of time and interacts
with peers. Every child feels more comfortable and
affected with children of same age group and can
easily share the problems which he may not do with
teachers or his parents. “Baal Doctor” is a “health guide
and monitor” from same class and of same age who
will facilitate the free interactions and sharing of
health related issues with peers. He is trained to
screen ailments under guidance of teacher and able to
link such children with medical doctors for early
treatment of health conditions.
Following actions will be carried out by “Baal Doctor”:
1) To develop healthy habits in all students.
2) To educate all students regarding importance of
hand washes and makes them to practice it in “Mid-
Day Meal” on daily basis.
3) To make all students aware regarding importance
of IFA tablets being distributed under Weekly Iron
Folate Supplements (WIFS) on every Wednesday.
4) To work on de-addiction in affected child.
5) To provide primary information regarding
Seasonal diseases and its prevention.
6) Send the child to school teacher if he/she is
suffering from common illness.
Every Baal Doctor will be given an apron to create
credibility and image of health care providers and
well acceptance of health educational messages in
peers. “Baal Doctors” will teach their peers to develop
good practices of hygiene on daily basis like cutting
nails, taking bath, brushing the teeth, washing hands
before having meal, staying away from addiction etc.
They will also share the information regarding proper
way of cooking, importance of hygiene, use of
nutritious food substance in routine meals etc.
Addit ional ly, Information , Educat ion and
Communication (IEC) materials will be provided to
them for effective health education. They will not be
provided any medicines or drugs to distribute. The
main role of a “Baal Doctor” is as a peer health
educator. Also they are bridge between child and
teacher as well as Medical Doctor. They will also
facilitate the prompt interventions in case of any
ailments. By this initiative, every child will develop
the understanding to occurrence of diseases and skills
to prevent them. Apart from this, this concept will also
facilitate establishment of the “Doctor” as a role
model in a child's mind, instead of any Celebrity which
usually children carry in their fantasies.
Thus, if these children are brought up with good
health education to inculcate healthy habits and
develop morals to build good character, it will go a
long way in building healthy citizens and prosperous
country. When the child himself gets involved in
health related matters, it can certainly result in
fruitful outcomes. So this initiative will indeed come
out with positives and very prompt results in near
future.
Healthline Journal Volume 8 Issue 2 (July-December 2017)

:: 66 ::
Letter to Editor
Join Hands and Kill AIDSAmrin Kharawala
Final Year MBBS Student, Government Medical College, Baroda, Gujarat, India
Correspondence : Amrin Kharawala, E mail: [email protected]
(Current article had won the award at the Essay Competition on HIV/AIDS Day-2016 celebration,
organized by IAPSM & IAPSM-GC)
“Stay away from that boy”, advised her mother
while bidding goodbye to her only daughter on the
first day of school. A small sentence that carried the
baggage of destroying a human life. The boy, a mere
child of eight years, was a decent lad, just as sane, just
as innocent as any other soul. Yet when he stepped
into the outer world, everyone knew better than to be
friends with him- reason being he was HIV positive.
What was the boy's fault? That he was born in a family
that was unaware of the transmission of HIV from
parents to children? That his father had met with an
accident and was transfused blood having HIV virus in
the window period, when they could not be detected?
That his parents unaware of this had unprotected
intercourse rather than opt for other means of
fertilization?
“AIDS doesn't kill a person, society does.” There are
plenty of such cases, all arising due to the backward
mindset of this supposedly small caring family of ours
– 'society'! A person down with malaria or a heart
attack or even an infectious and contagious disease
like chickenpox are treated with love and respect,
nurtured with overflowing attention to help them
combat their illness, but the moment a person is
tagged as PLHA, his death sentence is fixed, at the
hands of this society. My question is, does AIDS spread
by touching a person? Or sharing food with them? Or
working with them? Or being a decent human being
and treating them with the respect they deserve?
Everyone, educated or not, would know the answer to
these questions- It is a big NO. Despite knowing this,
we still shun people with AIDS cause we follow the
herd and don't think for ourselves.
“Live life, before we leave life” is the motto of any
human on this planet. Sadly, people living with HIV-
AIDS aren't even given a fair chance at life. Be it a
woman in the US, who was looked down upon and
called a prostitute for being HIV positive to a man in
kerala, the most educated state in India, who was
thrown out from his teaching job for being a HIV
carrier. Till date, women in rural India are blamed for
transmitting HIV to their kids by those in laws who
deny her the antenatal visits at a hospital that could
have prevented the cycle and counseled accordingly.
The probability of the child from harboring HIV
would have fallen directly to a mere 1% from 30% if
the expecting mother had been given what she truly
deserved. As of September 2015, 11 countries still
have laws that restrict the entry, stay and residence of [1]people living with HIV.
Slowly and steadily, as the light of development stengulfs this 21 century, and awareness carves its
path, people have started seeing the scenario with
open minds. With the combined perseverance of the
World Health Organization and the governments of
different countries, a ray of hope for a better future is
shining upon us. People who were earlier cast into
depression, after being out casted by the society, now
have the government to go to. From free medicines to
one on one counseling overflowing with
understanding, compassion and knowledge, people
are learning to fight this illness, which they earlier
succumbed to. Today, a man living with HIV in China
stood up for himself and filed a lawsuit in 2012 after
he was denied a job as a primary school teacher when
the employer found out he was HIV-positive. In
January 2013, he won the case and received [ 2 ]compensation. Various Non-Government
Organizations have been founded who hold their
hands and walk with them every step of the way.
Programs like National AIDS Control Program,
started by the Government of India in 1992, have
established blood banks, STD (Sexually Transmitted
Healthline Journal Volume 8 Issue 2 (July-December 2017)
:: 67 ::
Disease) clinics, and flagged off its largest national
campaign to date, in the form of a seven-coach train
the Red Ribbon Express (RRE) that travelled across
24 states reaching around 6.2 million people with [3]
HIV/AIDS education and awareness. Yet a lot still
has to be done and the government alone can't
accomplish this cumbersome task without
community participation.
It is aptly said that “Prevention is better than cure”.
We cannot just sit idle and wait to fight AIDS when we
are down with it. It is an active effort on our part to
cease the high risk behavior- use condoms while
having intercourse, to not reuse a used syringe, make
use of better blood screening methods like detecting
of p24 antigen of the HIV virus instead of waiting for
the antibodies to be captured via ELISA, and above all,
spread this knowledge to as many people as we can.
Another dimension to this is of post exposure
prophylaxis, which aims at preventing the replication
of HIV virus if the person exposed to it takes anti-[4]
retroviral treatment within 72 hours. However the
bottom line is still awareness without which none of
this is possible, because HIV-AIDS doesn't
discriminate between people, it attacks those who
are not cautious enough.
Today, more funds are being allotted to the
research for a cure for AIDS as a result of which
promising advances have taken place. We have also
witnessed a miraculous cure of AIDS in a person
known to us as the infamous 'Berlin patient' who was
diagnosed with HIV in 1995. He had been taking Anti
Retroviral Therapy (ART) for 11 years to control his
infection before learning that he had developed
leukemia. He was given chemotherapy but it failed, so
physicians decided to proceed with a bone marrow
transplant. The treatment successfully cured his
cancer, but interestingly the virus dropped to
undetectable levels in his blood and never bounced
back, despite ditching ART. Scientists believe that he
was given a transplant from an individual with rare a
mutation that altered one of the receptors HIV uses to
get inside white blood cells. Also his own immune
system was destroyed by chemotherapy and
radiation to prepare him for the transplant. This
process could have killed all the HIV infected cells in
his body. Finally, the transplanted cells could have
attacked Brown's own cells, which is known as graft
versus host disease, and hence destroyed any [5]remaining HIV reservoirs. This case gave birth to a
whole new research project, adding another
direction for obtaining cure, another ray of hope for
the future.
Our researchers are leaving no stone unturned in
trying to uproot this disease from its roots. Another
bold venture has led the scientists to develop
vaccines for preventing this disease-Cytotoxic t-
lymphocyte inducing vaccine, recombinant adeno [6]associated virus vaccine, AIDSVAX. It has not
emerged victorious but it is a live proof that nothing
is impossible if we put our mind to it. All we have to do
is to try and try till we succeed because god helps
those who help themselves and good things don't
come easy.
A hundred years ago, going around the world was
a just a theory, a never to come true dream until the
Wright brothers came up with the airplane. Moon
was the only source of light in the blanket of night's
darkness, until Thomas Alva Edison invented the
bulb. The virtual world of internet was a mere
thought which turned into reality in the blink of an
eye. The menace of small pox, a horror story until
Edward Jenner came up with its vaccine and then
hundred years later, the disease was eradicated from
the face of the earth by sheer perseverance. When the
world was rejoicing the death of smallpox in 1980, a
deadly disease was born, wiping the smiles from
people's faces. 1981- the first case of AIDS came up in
USA, slowly spreading its vast roots in the vulnerable
population of the planet. It only grew stronger by the
day, feeding off of people's happiness and engulfing
the sky in its dark cloud. In no time, it reached its peak
in 1996 that engulfed the lives of 2.5 million people in [7]1997. This created mayhem amongst the innocent
sufferers and called for international level
precautions to curtail this menace. Since then, there
has been a gradual improvement and progress
Kharawala Amrin Join Hands and Kill AIDS...

:: 68 ::
towards a better future. At the advent of small pox, a
highly contagious and deadly disease, people feared
their doom, but through sheer determination, it was
overcome. Similarly polio, a crippling communicable
disease created its share of fear among people before
succumbing to an inevitable death by the hands of the
oral and injectable polio vaccines, in the near future.
This gives us a ray of hope that someday HIV-AIDS
will meet the same fate, provided we join our hands
and work in union because United we stand, divided
we fall!
“Don't harm yourself with, but arm yourself against
AIDS.”
Acknowledgement :
The author wish to acknowledge Dr. V.S.
Mazumdar, Head of Department, Dr. Shobha Misra,
Associate Professor, DrKalpita Shringarpure and Dr.
Niyati Parmar, Tutors, Department of Preventive and
Social Medicine, Medical College Baroda for their
guidance and encouragement in participating in the
World AIDS Day Essay writing competition.
References :
1. Trust T. Entry restrictions for travellers with HIV | Terrence
Higgins Trust [Internet]. Tht.org.uk. 2018 [cited 31 January
2018]. Available from: http://www.tht.org.uk/myhiv/your-
rights/travel/entry-restrictions
2. Kaiman J. Teacher wins China milestone claim for HIV-related
job discrimination [Internet]. the Guardian. 2018 [cited 31
January 2018]. Available from: https://www.theguardian.com/
world/2013/jan/31/china-teacher-compensation-hiv-job-
discrimination
3. Red Ribbon Express: HIV/AIDS awareness on wheels | UNICEF
[Internet]. Unicef.in. 2018 [cited 31 January 2018]. Available
from: http://unicef.in/Story/236/Red-Ribbon-Express-HIV-
AIDS-awareness-on-wheels
4. K. Park. Textbook of preventive and social medicine. 23rd
edition. Jabalpur: M/s Banarsidas Bhanot; January 2015.
Chapter 5, epidemiology of communicable diseases, page 353
5. The Berlin Patient [Internet]. En.wikipedia.org. 2018 [cited 31
January 2018]. Available from: https://en.wikipedia.org
/wiki/The_Berlin_Patient
6. AIDSVAX [Internet]. En.wikipedia.org. 2018 [cited 31 January
2018]. Available from: https://en.wikipedia.org/wiki/AIDSVAX
7. A Textbook of Immunology & Immuno Technology [Internet].
Google Books. 2018 [cited 31 January 2018]. Available from:
https:// books. google. co.in/books
Healthline Journal Volume 8 Issue 2 (July-December 2017)
The editorial team is highly obliged to the following reviewers for
their kind co-operation in the review of manuscripts published in
Volume 8 (Issues 1 & 2) of “Healthline” journal.
Dr K. N. Sonaliya
Editor In Chief
Healthline Journal
Healthline Journal Volume 8 Issue 2 (July-December 2017)
A. Bhagyalaxmi
Alpesh Patel
Arpit Prajapati
Bhavna Puwar
Deepak Sharma
Dipesh Parmar
Ghanshyam Ahir
Hitesh Shah
Ilesh Kotecha
Kedar Mehta
Kishor Sochaliya
Kush Sachdeva
Meenu Kalia
Navneet Padhiyar
Nitin Solanki
Rahul Parmar
Raman Damor
Rashmi Sharma
Samir Shah
Sangeeta Patel
Shalini Nooyi
Shobha Misra
Sonal Shah
Sumit Unadkat
Umed Patel
Vaibhav Ramanuj
Copyright © 2022 FDOKUMEN