EPAA Vol. 8 No. 23 Bolon: School-based Standard Testing
43
1 of 43 Education Policy Analysis Archives Volume 8 Number 23 May 12, 2000 ISSN 1068-2341 A peer-reviewed scholarly electronic journal Editor: Gene V Glass, College of Education Arizona State University Copyright 2000, the EDUCATION POLICY ANALYSIS ARCHIVES. Permission is hereby granted to copy any article if EPAA is credited and copies are not sold. Articles appearing in EPAA are abstracted in the Current Index to Journals in Education by the ERIC Clearinghouse on Assessment and Evaluation and are permanently archived in Resources in Education. School-based Standard Testing Craig Bolon Planwright Systems Corporation Brookline, MA (USA) Abstract School-based standard testing continues to evolve, yet in some ways it remains surprisingly close to its roots in the first two decades of the twentieth century. After use for many years as a diagnostic and as a filter for access to education, in the closing years of the century it has been pressed into service for state-run political accountability programs. In this role, it is generating vehement controversy that recalls protests over intelligence testing in the early 1920s. This background article explores primary characteristics and issues in the development of school-based standard testing, reviews its typical lack of qualification for political accountability programs, and suggests remedies to address major problems. In general, the attitude toward new techniques of assessment is skeptical, in light of the side-effects and unexpected problems that developed during the evolution of current techniques. Survival of the Fittest School-based standard testing began a dream decade in the early 1950s, driven by
-
Upload
khangminh22 -
Category
Documents
-
view
2 -
download
0
Transcript of EPAA Vol. 8 No. 23 Bolon: School-based Standard Testing
1 of 43
Education Policy Analysis Archives
Volume 8 Number 23 May 12, 2000 ISSN 1068-2341
A peer-reviewed scholarly electronic journalEditor: Gene V Glass, College of Education
Arizona State University
Copyright 2000, the EDUCATION POLICY ANALYSIS ARCHIVES.Permission is hereby granted to copy any article
if EPAA is credited and copies are not sold.
Articles appearing in EPAA are abstracted in the Current
Index to Journals in Education by the ERIC Clearinghouse
on Assessment and Evaluation and are permanently archived in Resources in Education.
School-based Standard Testing
Craig BolonPlanwright Systems Corporation
Brookline, MA (USA)
AbstractSchool-based standard testing continues to evolve, yet in some ways itremains surprisingly close to its roots in the first two decades of the
twentieth century. After use for many years as a diagnostic and as a filterfor access to education, in the closing years of the century it has beenpressed into service for state-run political accountability programs. In
this role, it is generating vehement controversy that recalls protests overintelligence testing in the early 1920s. This background article exploresprimary characteristics and issues in the development of school-based
standard testing, reviews its typical lack of qualification for politicalaccountability programs, and suggests remedies to address majorproblems. In general, the attitude toward new techniques of assessment is
skeptical, in light of the side-effects and unexpected problems thatdeveloped during the evolution of current techniques.
Survival of the Fittest
School-based standard testing began a dream decade in the early 1950s, driven by
2 of 43
waves of public anxiety over Soviet "dominos," nuclear weapons, Sputnik and the"missile gap." Now, so many years later, it can be hard to imagine the intensity of fears
that the Russians were ahead of everybody else not just in the size of their standing
army but in scientific knowledge, inventions and industry. There was widespreadagreement that the U. S. needed to identify talented people and train them for criticaloccupations. (Note 1)
Of course we know more of the dreary facts today a Russia of gray poverty andworkplace spies, burdened with heavy but narrow investment to produce arms, rocketsand nuclear bombs. But in those times, who knew? We saw North Korea fortified with
MiG-15s, the Hungarian revolt crushed with Russian tanks, and then the Berlin wallbuilt. Russia had been four years behind the U. S. in testing an atomic bomb but onlyone year behind with its first thermonuclear blast. And although the U. S. employed the
Nazi rocket designers from World War II, Soviet Russia had a space satellite firstwinking at us and mocking "the American century." And so it was, into the breach against Godless communism, (Note 2) that we
launched our homespun Scholastic Aptitude and Iowa tests. Few questioned the methodsor values. In the climate of those days, school-based standard testing was an engine ofprogress. (Note 3) It would promote technical expertise and fairly chosen leadership to
right the balance and put America first again.
Background School-based standard testing (Note 4) aims to provide uniform, rapid
measurement of some kind of mental capability that is related to education. There aremany other assessments related to responsibilities or occupations rather than schools.These include, for example, tests for motor vehicle drivers, aircraft pilots, divers,
plumbers and power plant operators. Historical precedents for competence testing can betraced to the ancient civilizations of China (Note 5) and Rome. However, until relativelyrecently education operated mainly as a craft. Teachers and schools tested their students
and applicants, sometimes intensely, but there was rarely interest in tests that would beapplied uniformly and rapidly to large groups of students in diverse situations. Keyeducational credentials were instead the evaluations of students by individual teachers
and schools. It may have been public education, more than any other factor, that inspired interestin school-based standard testing. (Note 6) The U. S., with the strongest history of public
schools, also had the strongest early interest in standard testing. Perhaps it should not besurprising that the country which implemented the concepts of standard machine partsand mass production should also be the country that most eagerly adopted standard
testing in its rapidly growing education enterprises (see Cremin, 1962, pp. 185-192). TheYankee attitude can be perceived in the pursuit of uniformity and efficiency.
Standard Tests The distinguishing features of a standard test are uniform administration and some
form of calibration. Before routine use, standard tests or component items will be triedout with groups intended to represent populations of test- takers. These trials are used tomeasure distributions of scores and other properties of a test (Rogers, 1995, pp. 256-257
and 734-741). After calibration, test scores are typically reported by using a formuladerived from the calibration (to percentile ranks, for example). Beginning in the 1910s,statistical metrics were developed to characterize test items and report scores (Rogers,
1995, pp. 197-208, 317-325 and 382-388). The IQ score and the SAT scaled score
3 of 43
ranging from 200 to 800 are among the well-known metrics. A quantitative approach helped give standard tests the appearance of objectivity
and encouraged a test format that is easily adapted to numerical scoring. Multiple choiceand short answer questions quickly became the conventional format. Such questions arescored only as right or wrong. While in principle there is nothing to prevent a standard
test from using essays, extended reasoning and scales of partial credit, reliable scoring ofextended answers and essays requires careful training and monitoring of test evaluatorsand substantially more effort. Rushed and inept evaluation of extended answers can be at
least as troublesome as restricting testing to multiple choice and short answer formats. Standard tests have long been distinguished as having "speed" or "power" formats,meaning that they are strictly timed or that they are loosely timed or untimed (Rogers,
1995, p. 256, and Goslin, 1963, pp. 148-149). The distribution of scores is deliberatelywidened by strict timing. Many common school-based standard tests, including theStanford, California and Iowa achievement tests, claim to measure knowledge and skill
but are in fact "speed" tests. More recent distinctions are proposed between so-called"norm-referenced" and "criterion-referenced" tests (Rogers, 1995, pp. 653-666).Supposedly a "norm-referenced" test has a calibration relative to a population, while a
"criterion-referenced" test has an absolute standard (for example, basic competence todrive a motor vehicle). However, for practical purposes nearly all school-based standardtests are "norm-referenced," because critical decisions about how to use the scores are
made after score distributions have been measured. We used to call this "grading on thecurve." In fact, wild attempts to produce "criterion-referenced" tests, without knowinghow many people can actually pass them, generate some of the horror stories of testing.
Another recent and somewhat misleading distinction is so-called "high- stakestesting," meaning the use of test scores to make decisions that critically affect people.Supposedly this is a new practice. Actually it is quite old; parts of the Chinese civil
service were closed to applicants who could not pass required examinations more thantwenty centuries ago (Reischauer and Fairbank, 1958, p. 106). Beginning in thenineteenth century, standard tests were developed to place students in French schools
according to ability. During World War I, U. S. Army recruits were assigned to combator support missions on the basis of IQ scores. According to current psychometric standards, it is improper to use a test for some
purpose for which it was not "designed." Ninety years ago, however, intelligence testswere quickly appropriated to identify "morons," "imbeciles" and "idiots," who were thento be sexually restricted. Claims were advanced that experienced testers could readily
identify "feeble-minded" people by observation (Gould, 1981, p. 165). We are not as faraway from those days as some would like to think. Recent applicants who failed a new,uncalibrated teacher certification test were denounced as "idiots" by a prominent
Massachusetts politician. (Note 7) Although some strong advocates of standard testingwere once inspired by egalitarian views (such as Conant, 1940), standard tests have longbeen instruments for social manipulation and control. In an irony of the late twentieth
century, tests like the former Scholastic Aptitude series, once praised as breaking thestranglehold of social elites on access to higher education, became barricades tending toisolate a new, test-conscious elite which, as we will see, largely tracks the social
advantages of the old elite.
Aptitude, Achievement and Ability School-based standard testing is largely a phenomenon of the twentieth century. Anearly product, the "intelligence scale" published by Alfred Binet and Théodore Simon in
4 of 43
1905, was intended to identify slow learners. By the 1920s, the testing movement hadsplit into two camps which remain distinct today (see Goslin, 1963, pp. 24-33). The
Binet-Simon scale and its offspring such as the IQ test produced by Lewis M. Terman
in 1916, the Army Alpha and Beta tests organized by Robert M. Yerkes during World
War I, and the Scholastic Aptitude Test designed by Carl C. Brigham in 1925 all claimed to measure "aptitude." The essay exams of the College Entrance Examination
Board, founded in 1900, the Stanford Achievement tests, first published in 1923, andEverett F. Lindquist's Iowa Every-Pupil tests, developed in the late 1920s and early1930s, claimed instead to measure "achievement."
Tests of "aptitude" try to measure capacity for learning, while tests of"achievement" aim only to measure developed knowledge and skills. From their earliestdays, standard aptitude tests have been clouded in controversy. It has never been clearly
shown that "aptitude" can be measured separately from knowledge and skills acquiredthrough experience (see Ceci, 1991; also see Neisser, 1998, and Holloway, 1999, onchanges over time). Standard achievement tests, while nominally free of these snares,
share assumptions about language and cultural proficiency. Performance on almost anytest is strongly influenced by language skills. Likewise, all tests rely to some degree ontrained and culturally influenced associations and styles of thinking. Despite
longstanding claims of distinct purposes, standard aptitude and standard achievementtests may have more similarities than differences. Standard achievement test scores tend to correlate with standard aptitude test
scores, as shown by Cole (1995) and others. To some observers, such as Hunt (1995),this simply shows that bright people learn well, and vice-versa. To others, it suggeststhat much of what is being tested might be called test- taking ability (see Hayman, 1997,
and Culbertson, 1995). Most content of the widely used school-based standard tests canbe viewed as collections of small puzzles to be solved rapidly by choosing options orwriting brief statements. Such a pattern of tasks is rarely encountered by most adults in
everyday life. By design, the times allowed to complete standard tests are typically too short for asizeable fraction of test-takers, putting great stress on rapid work and leaving little
opportunity for reflection. For some strictly timed tests favoring men it has been shownthat the same tests conducted without time limits favor women (see Kessel and Linn,1996). Standard test designers may assign high scoring weights to test items written to
be ambiguous, so that they will encourage wrong answers (see Owen and Doerr, 1999,pp. 70-72). Right answers are guided in part by trained or culturally acquired
associations intuitions about a test designer's unstated viewpoint. When ambiguous
questions are removed, differences in scores between ethnic groups may be reduced.Test designers sometimes say that ambiguous questions "stretch the scale,"differentiating the more skilled from the less skilled. Owen and Doerr (1999, pp. 45 ff.)
suggest instead that they raise the scores of test-takers who have the favored patterns ofassociations and thinking. The stressful properties of a typical standard test make test-taking into a sort of
mental gymnastics, an ability that may well have its uses but does not necessarily predictperformance in other situations (see Sacks, 1999, pp. 60- 61). We recognize manyspecial skills, such as remembering complex patterns in card games, multiplying
numbers in one's head, or solving crossword puzzles. People who do these things deftlymay also perform well in other pursuits, or they may not.
Predictive Strengths
5 of 43
Standard tests are promoted on the basis of claims to predict future performance.Their predictive strengths are measured by how well they do this. Despite heavy use ofstandard tests in circumstances that may critically affect people's lives, there have been
remarkably few evaluations of these tests by organizations independent of the testvendors. The underlying substance of predictive evaluations is sometimes shallow. Forexample, it may be claimed that a standard test required for acceptance to a school
program helps to predict the likelihood of graduation, when a key criterion forgraduation is the score on a similarly organized standard test. For a standard test to be useful, it cannot merely predict performance to some
degree. It must significantly improve the accuracy of prediction over readily obtainedinformation. Unless it does so, the effort of testing is wasted. (Note 8) During the lastforty years, predictive strengths of the SAT, ACT, GRE and similar aptitude tests have
been independently evaluated. Scores from these tests improve predictions of first yeargrades by at most a few percent of the statistical variance over predictions based solelyon previous grades, family income and other personal factors. (Notye 9) For later and
broader measures of performance, the predictive strengths of these tests evaporate.
Sometimes negative correlations have been found lower performance associated withhigher scores. (Note 10) In response to the low predictive strengths of standard aptitude
tests, growing numbers of colleges have stopped requiring them as part of applications.(Note 11) Predictive strengths of standard tests are falsely enhanced when they are used to
"track" or group students in schools, providing extra opportunities to some whiledenying them to others. The favored students stand to gain not only skills andknowledge but also self-esteem, which has been shown to correlate with higher test
scores. (Note 12) Ability grouping based on standard tests is a form of "high-stakestesting" which has been practiced for at least 80 years in U. S. public schools. We canclearly distinguish between the selection procedures of public schools, which have a
legal duty to treat every student fairly, and those of taxpaying private institutions, whichmay not. Of the public schools, we can surely ask, "Why not provide opportunity toeveryone?"
Beyond the schoolhouse door, school-based standard tests show hardly anypredictive strength for creativity, professional expertise, management ability or financialsuccess. (Note 13) However, these tests stress either generalized test-taking abilities or
subjects that are only occasionally relevant to adult life. Tests for competence in specificskills have been used successfully to predict whether workers can perform tasks thatrequire those skills. For example, some temporary employment agencies now administer
technical skills tests to new job-seekers before sending them out to interview withpotential employers. This practice has increased employer satisfaction with jobperformance.
Errors of Testing All measurements are subject to potential error. Compared with physical
measurements, the errors in standard test scores are enormous. There are many sourcesof error. These include:
Mechanical errors in transcribing short answers or multiple choice answers
Consistency errors in scoring essays or extended answersComputer errors when calculating or reporting resultsSystematic errors from varying difficulty of different test versions
Random errors arising from the physical or mental states of test-takers
6 of 43
Bias errors: test designs that favor some groups of test-takers over othersContent errors: test items that do not accurately cover the intended material
Vendors and promoters of standard tests do not often discuss errors of testing.When they do, they usually bury information in opaque language, tables and formulasfound in "technical reports" that may be hard to obtain. Careful reading of such
information often reveals defects in the error evaluation as well as large errors. Test vendors typically present themselves as diligent in reducing or eliminatingmechanical, consistency, computer and systematic errors. There are well developed
methods for controlling these gross errors. However, such errors do occur. AdvancedSystems, a company used by the Massachusetts Board of Education since 1986, wasembarrassed by errors in score reporting in Kentucky and lost its Kentucky contract in
1997 (see Szechenyi, 1998, and "Problems," 1998). Gross errors seem to be morecommon with smaller and newer test vendors than with larger and longer establishedones.
The most common error measurement for a standard test is its "reliability." Byconvention, this describes the range of scores which a test-taker would receive in takingrepeated, comparable versions of a test (Rogers, 1995, pp. 61-62, 368-378 and 741-743).
A narrow range means high reliability: a test-taker would be likely to receive about thesame score on repeated tests. Because training effects occur when tests of a particulartype are actually repeated, indirect methods must be used to estimate reliability, such as
mathematical models. Details of these methods can be adjusted to change estimates ofreliability. When mechanical, consistency, computer and systematic errors have been well
controlled, reliability mainly measures random errors arising from unpredictable,individual circumstances of test-takers. Such errors are often larger than is generallyknown. As cited by Owen and Doerr (1999, p. 72), the Educational Testing Service has
estimated that, on average, individual differences of less than 70 points for its SATVerbal scores and 80 points for its SAT Math scores are not significant. These marginsincrease for high scores. Massachusetts (1999a, p. 86, Table 14-4) has estimated there is
only about a 56 percent chance that a fourth-grader who is advanced in English languagearts, according to its standards, will receive an "advanced" rating on its MCASfourth-grade English language arts test.
People who are unfamiliar with the large random errors of standard test scores oftenassume that the scores can be used reliably to rank-order test-takers according to ability.In fact, random errors of testing are so great that scores can be used at most to classify
individuals in a few levels. Using only four levels to classify MCAS scores,Massachusetts (1999a, p. 86, Table 14-4) has estimated substantial likelihoods, rangingfrom 8 to 46 percent, that an MCAS test-taker will be misclassified.
Many types of bias errors have been discovered in standard tests. For example, ifthe format of a test is changed from multiple choice to essay, different groups oftest-takers are favored. A study performed by the Educational Testing Service found that
multiple choice questions on its advanced placement tests favored men andEuropean-Americans, while essay questions favored women and African-Americans(cited by Sacks, 1999, p. 205). Grouping test-takers with high essay and low multiple
choice scores and those with the reverse pattern, the study showed comparable collegegrades for the two groups but a sixty point difference in their average EducationalTesting Service SAT scores, in favor of the group with high multiple choice scores
(Sacks, 1999, p. 206).
7 of 43
People tested using a language in which they are not fluent are likely to do muchworse than native speakers of the language. Tests that require reading, in the formats
used for most standard testing, assume reading proficiency. Individuals with poorreading proficiency, whatever the cause, are at major disadvantage with respect to otherswho do not have such limitations. Bias caused by test timing and ambiguous questions
has been previously mentioned. Most attempts to compensate for bias involveidentifying substantially impaired individuals and providing them extra test time. Thereis little evidence that test bias is actually corrected with this approach (see Heubert and
Hauser, 1999, p. 199). Perhaps the greatest source of bias and content error in school-based standardtesting is the conventional process of standard testing itself, as contrasted with rating
actual performance. When an educational assessment should measure success atsignificant tasks, such as writing a research report or investigating a technical theory, itmay be impossible to design a standard test with much accuracy or predictive strength.
In the U. S., there has been a movement toward replacing standard testing withcriterion-based "performance assessment" (see Appendix 6). A goal of this movement,also called "authentic assessment," is eventually to integrate educational testing with the
ordinary processes of teaching and learning. There have been attempts to useperformance assessment as part of state testing programs in Kentucky (1990-1997) andCalifornia (1991-1995), reviewed by McDonnell (1997, pp. 5-8 and 62-65).
School Accountability The performance of public schools became an issue in the U. S. almost soon as
support for public education began. In 1845 the Massachusetts Board of Educationprinted a voluntary written examination to measure eighth-grade achievement. Moststudents could not pass the test. Schoolmasters complained that knowledge tested did
not match their curricula. After a few years the test was abandoned (see Appendix 2). In1874 the Portland, Oregon, school superintendent distributed a curriculum for each ofeight school grades. At the end of the school year, he administered written tests on the
curriculum. Test scores were published in a newspaper. Based on test scores, less thanhalf the students were promoted that year and the following year. An uprising by parentsand teachers then led to dismissal of the superintendent and an end to the practices of
publishing scores and denying promotion on the basis of a test score alone. (Note 14)Since those days similar initiatives and reactions have often occurred throughout the U.S..
The U. S. has sponsored a continuing expansion of public education for 350 years.Most people did not expect to graduate from eighth grade until late in the nineteenthcentury. High-school graduation became a normal expectation only in the 1930s. Today,
we are still struggling with rising expectations that include college. At each stage of thisgrowth, critics have condemned the lowering of educational standards and demandedaccountability. However, each of these stages can also be seen as intrusion into a
formerly elite province of education by large numbers of students who would previouslyhave been excluded. For several years, levels of performance go down as the systemadapts to less prepared students. Over a longer period, curricula change, often
abandoning cultural traditions for more practical approaches. School accountability became a public demand during the first two decades of thetwentieth century. (Note 15) Over the ten years from 1905 through 1914 the U. S.
accepted the largest flow of immigrants in its history, averaging more than a million peryear. Immigration, coupled with stronger school attendance laws, raised schoolenrollments and increased the fraction of students for whom English was not a native
8 of 43
language. Declines in student achievement were noticed and became an object of publicconcern. At first standard tests were used to document declining student achievement, but
they did not provide a method to improve it. By 1920 many urban school systems hadstarted to use the newly available intelligence tests to measure student aptitude; they
grouped students in classes by IQ. (Note 16) Educators hoped to improve performance
by providing instruction that was adjusted to student aptitudes. In 1925 a U. S. Bureau ofEducation survey (cited by Feuer et al., 1992, p. 122, footnote 91) showed that 90percent of urban elementary schools and 65 percent of urban high schools had adopted
this approach. As immigration declined and school attendance became more uniform,student achievement tended to stabilize, and public concern relaxed. Despite warningsfrom progressives such as John Dewey and Walter Lippmann about a
"mechanical…civilization" run by "pseudo- aristocrats" (Dewey, 1922), IQ testing andthe multiple choice test format had acquired prestige as techniques to improve publicschools.
Strong U. S. demand for school accountability arose again in the 1970s through the1990s. This time aptitude testing and finances played significant roles. Acceptance ofScholastic Aptitude Test scores as a measure of merit by highly selective colleges was
regarded by many people as sanctioning a measure of merit for public schools. AverageSAT scores for schools and communities began to circulate as tokens of prestige orshame. During the period from 1963 through 1982, the Educational Testing Service
reported a continued decline in its national average SAT scores, followed by a slowerrecovery, as shown by the scores in Table 1.
Table 1SAT National Average Scores
Test / Year 1963 1980 1995
SAT Verbal 478 424 431
SAT Math 502 466 482
Source of data: Ravitch, 1996.
These scores, scrutinized year after year, were used by the press, broadcast media
and opportunist politicians to stir up a new sense of crisis. Once again, the publicschools must be failing. The charges were false. Accurate tracking of changes over time requires
painstaking steps to assure that both the measurements and the groups being measuredare comparable at each point. As shown by Crouse and Trusheim (1988, pp. 133-134)and by Feuer et al. (1992, pp. 185 ff.), the groups being measured by SAT scores
changed drastically. Increases in scholarships and loans, affirmative action programs,and awareness of long-term financial rewards produced more applications to selectivecolleges. The number of colleges requiring SAT scores more than doubled. As a result,
the number of students taking the SAT series for college applications grew from 560thousand in 1960 to 1.4 million in 1980, an increase of 150 percent over a period inwhich public school enrollment grew only 16 percent. Students with lower high-school
grades were taking these tests who would not have taken them in previous years.Spreads in scores increased significantly, reflecting more diversity in test-takers.Berliner (1993) shows that SAT scores of students with similar characteristics were
9 of 43
actually increasing. Other school-based standard tests do show changes over this period, but they arenot parallel trends. Beginning in 1969, reading, writing, science and mathematics skills
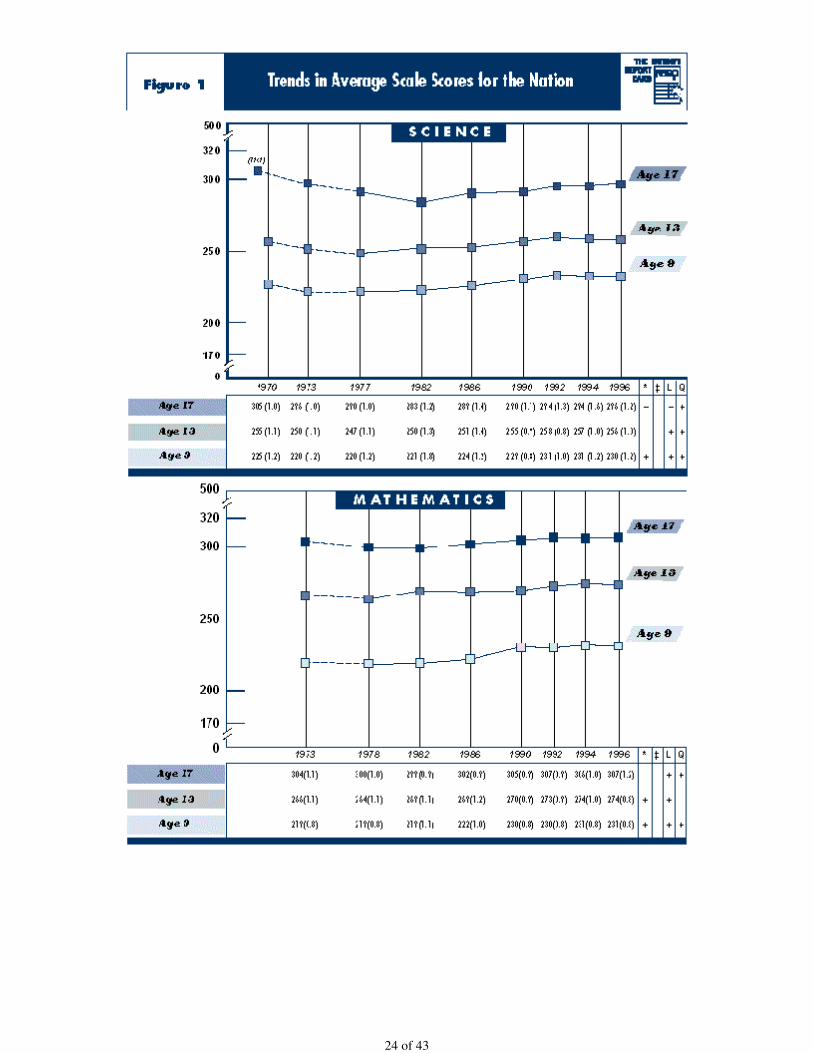
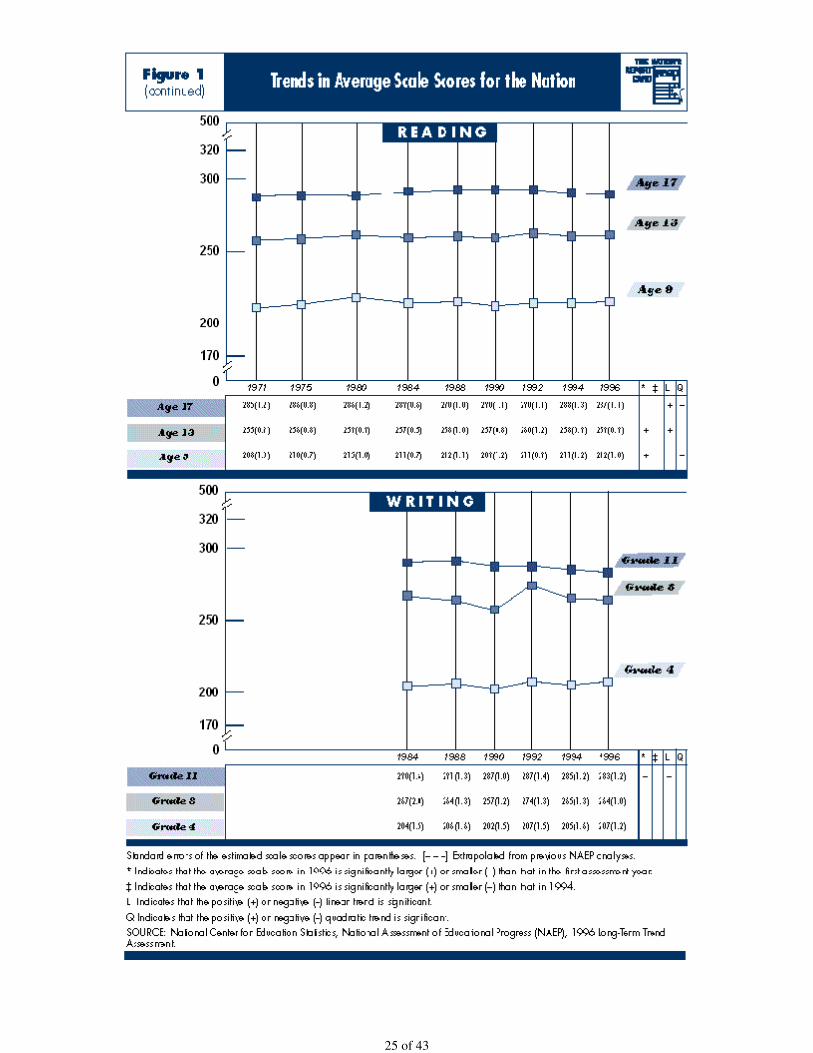
have been measured by the National Assessment of Educational Progress (NAEP), afederal research program. Scores remained roughly steady through 1996, with typicalaverage scores of 280-300 points at the high-school level and typical changes across this
period of less than 10 points (see Appendix 1). NAEP reading comprehension scoreswould probably have fallen and then risen along with SAT Verbal scores if the SATscores reflected real changes in education. Actually NAEP high-school reading scores
were flat within a band of ± 1% over the entire 1971-1996 period. There may have beendeclines in science during the 1970s, but changes in NAEP procedures make themuncertain. During the past 20 years, at the high-school level there appear to have been
modest gains in science and math and a slow but persistent decline in writing skills(while SAT Verbal scores were rising). Overall patterns of NAEP scores indicate littlechange in educational achievement. However, these research results do not generate
flashy headlines or sound bites, and they are usually ignored. The other major cause of concern during the last three decades of the twentiethcentury has been the increasing cost of public schools (see Appendix 1). Proportionately
spending rose even faster from 1950 to 1970, but that was also a period of rapid growthin school enrollment, the "baby boom" generation, and a period of anxiety over thepossibility of nuclear war. Annual, inflation-adjusted public school spending grew from
about $1,570 per student in 1950 to $3,720 in 1970 and $7,140 projected for 2000 (all in1998 dollars). Total public school spending climbed even during the 11 percentenrollment drop from 1970 to 1980. By demanding accountability the public has in part
been seeking value in return for its reasonably generous support.
"School Reform"Accountability is a political concept, not an educational one. The public figures who talkabout it loudest today want "school reform," a familiar war cry in U. S. politics. (Note17) The measures many current "school reformers" promote are:
Frequent school-based standard testing with "high goals"
Publication of scores for individual schools or districtsDenial of school activities and diplomas to students with low scores
Removal of principals and teachers in schools with low scores
Some politicians go further. (Note 18) In 1983, the Reagan administration
embraced a system that would circulate test scores to colleges and employers,maintaining permanent national dossiers of people's test records. The Bushadministration proposed legislation in 1991 including these concepts, but it was defeated
in Congress. Just what such a program might do to people never seems to have been aconcern for the "school reform" promoters. In the name of "school reform," without any federal mandate, state legislatures and
politically controlled state education boards have been increasing the use of standardtests in public schools and the punishments for low test scores. Typical of the state-run"school reform" programs are the following measures:
Statewide standard achievement tests in several or all school gradesStatewide standard tests for course credit, promotion and graduation
10 of 43
"Curriculum frameworks," or required curricula, "aligned" to standard testsAccess to advanced courses and special programs based on standard test scoresAthletic team participation and student privileges based on standard test scores
Special diplomas, honor programs and scholarships based on standard test scoresClassification of school performance based on standard test scoresPublication of test scores or classifications by school or by district
Publicity about school testing requirements, changes and schedulesFinancial support for "test preparation" consultants and materialsFinancial incentives for administrators and teachers to achieve high test scores
Removal of administrators and teachers in schools with low test scoresState seizure or closure of schools with low test scores
Also associated with "school reform" are movements to support religious schoolsvia "school choice" and financial "vouchers" and initiatives to create privately run"charter schools."
In 1980 eleven states required minimum scores on their standard tests to receive ahigh-school diploma. By 1997 seventeen states enforced such a requirement (NationalCenter for Education Statistics, 1999, Table 155). During the years 2000-2005 several
states, including Alaska, California, Delaware, Massachusetts, New York and Texas, areplanning one or more of the following "school reform" initiatives:
Add standard tests for course credit, promotion or graduation.
Raise or begin enforcing required scores.Dismiss principals of low scoring schools.Place low scoring schools in receivership.
About two-thirds of the current states with high-school graduation tests aresouthern or southwestern states; they tend to have larger fractions of poverty and
low-income households than the national averages. The students who are deniedhigh-school diplomas typically come from the most disadvantaged households in thosestates.
Texas has a program often pointed to by "school reform" advocates as a model (seeAppendix 4). The program is politically controlled by the governor and state legislature.It has changed several times since its inception in 1984. The key feature for the last ten
years is a test system called TAAS, which includes high school graduation requirements.Under this system, there have been reports of weeks spent on test cramming and "TAASrallies." School ratings are raised by "exempting" students. Schools are allowed to
contract for "test preparation" consultants and materials, and some have spent tens ofthousands of dollars. There have been reports of falsifying results. In April, 1999, thedeputy superintendent of the Austin school district, which had shown dramatic score
improvements, was indicted for tampering with government records. In Houston threeteachers and a principal were dismissed for prompting students during test sessions("TAAS scandal," 1999). Official Texas statistics claim reductions in school dropouts,
but independent studies consistent with U. S. government data show persistent increases,with 42 percent of all students failing to receive a high school diploma as of 1998("Longitudinal Attrition Rates," 1999). Students identified by Texas as black or Hispanic
are disproportionately affected. In some schools 100 percent of students with limitedEnglish proficiency drop out (IDRA, 1998). Illiteracy remains a major problem in Texas,
11 of 43
and it appears to be worsening. New York has recently released part of the initial results from its new high- school
graduation tests. Based on currently required scores, they show that diplomas are likelyto be denied at about twice the statewide rate to students in New York City whocomplete high school (see Appendix 3). The city has the largest concentrations of
poverty in the state. In five years New York will increase the required scores byabolishing so-called "local" diplomas. The probable result will be an even more severeimpact on students from poverty and low-income households.
State-run "school reform" has operated largely on the basis of beliefs, not evidence.There is little evidence that these programs actually work as intended. Feuer et al.(1992), show that claims for improved achievement, as measured by test scores, are
often hollow. They are commonly a result of training students to take the standard tests(also see Sacks, 1999, pp. 117-151). When a new series of tests is substituted, scorestypically return to levels, measured against national norms, that are similar to scores
when the previous series of tests began. If "school reform" has caused substantial improvement in student achievements,measurements performed by the National Assessment of Educational Progress (NAEP)
ought to reveal it. This longstanding federal research program has taken care to providebroad coverage of educational content, to maintain consistency in its testing over time,and to avoid test formats with sources of bias such as hectic pacing and heavy
dependence on reading proficiency in tests other than reading (see Feuer et al., 1992, pp.90-94). Test formats use multiple choice, short answer, extended answer and essayquestions, with scales of partial credit. Since participating schools change, there is little
opportunity or incentive for students to be taught the tests. From about 11,000 to 44,000students participated in each of the test series given from 1982 through 1996. Most of the geographically segmented data published for the NAEP are grouped by
regions rather than by states. The Northeast region includes Connecticut, Delaware,District of Columbia, Maine, Maryland, Massachusetts, New Hampshire, New Jersey,New York, Pennsylvania, Rhode Island and Vermont. From 1982 through 1996 none
had a major "school reform" program; only one of the twelve had a high-schoolgraduation test (only New York; see National Center for Education Statistics, 1999,Table 155). The Southeast region includes Alabama, Arkansas, Florida, Georgia,
Kentucky, Louisiana, Mississippi, North Carolina, South Carolina, Tennessee, Virginiaand West Virginia. From 1982 through 1996 all had major "school reform" programsand eleven of these twelve had high-school graduation tests (all except Kentucky; see
National Center for Education Statistics, 1999, Table 155). Average NAEP scoresreported for these two regions from 1982 through 1996 are shown in Table 2.
Table 2NAEP Regional Average Scores, 1984 and 1996
Reading Scores Northeast Southeast
1984 1996 Change 1984 1996 Change
Grade 11 292 291 -1 285 279 -6
Grade 8 260 261 +1 256 252 -4
Grade 4 216 220 +4 204 206 +2
Writing Scores Northeast Southeast

12 of 43
1984 1996 Change 1984 1996 Change
Grade 11 291 290 -1 287 273 -14
Grade 8 273 264 -9 267 260 -7
Grade 4 212 213 +1 204 200 -4
Math Scores Northeast Southeast
1982 1996 Change 1982 1996 Change
Age 17 304 309 +5 292 303 +11
Age 13 277 275 -2 258 270 +12
Age 9 226 236 +10 210 227 +17
Science Scores Northeast Southeast
1982 1996 Change 1982 1996 Change
Age 17 284 296 +12 276 288 +12
Age 13 254 255 +1 239 251 +12
Age 9 222 234 +12 214 224 +10
Source of data: National Center for Education Statistics, 1997.
If a case can be made for improvement that may have been caused by "schoolreform" it is in math and science, where both regions had score improvements but thoseof "school reform" states were better. However, "school reform" states had worse
changes in reading and writing scores. The Northeast, without major "school reform,"improved scores an average of 2.8 points, while the Southeast, under major "schoolreform," improved scores an average of 3.4 points. With the random errors in scores
estimated for NAEP, the difference in these results has no statistical significance(National Center for Education Statistics, 1997, pp. iii-vi). At the high-school level, thechanges measured in "school reform" states were somewhat better in math, the same in
science, somewhat worse in reading and substantially worse in writing. Despite greathopes for "school reform," there is no general evidence of benefit. "School reform" is strongly associated with high dropout rates and low rates of
high-school graduation. Nationally about 32 percent of public school students aged 15through 17 are enrolled below normal grade levels, a figure that climbed steadily duringthe years 1979 through 1992. (Note 19) Statistics on school dropout cannot be evaluated
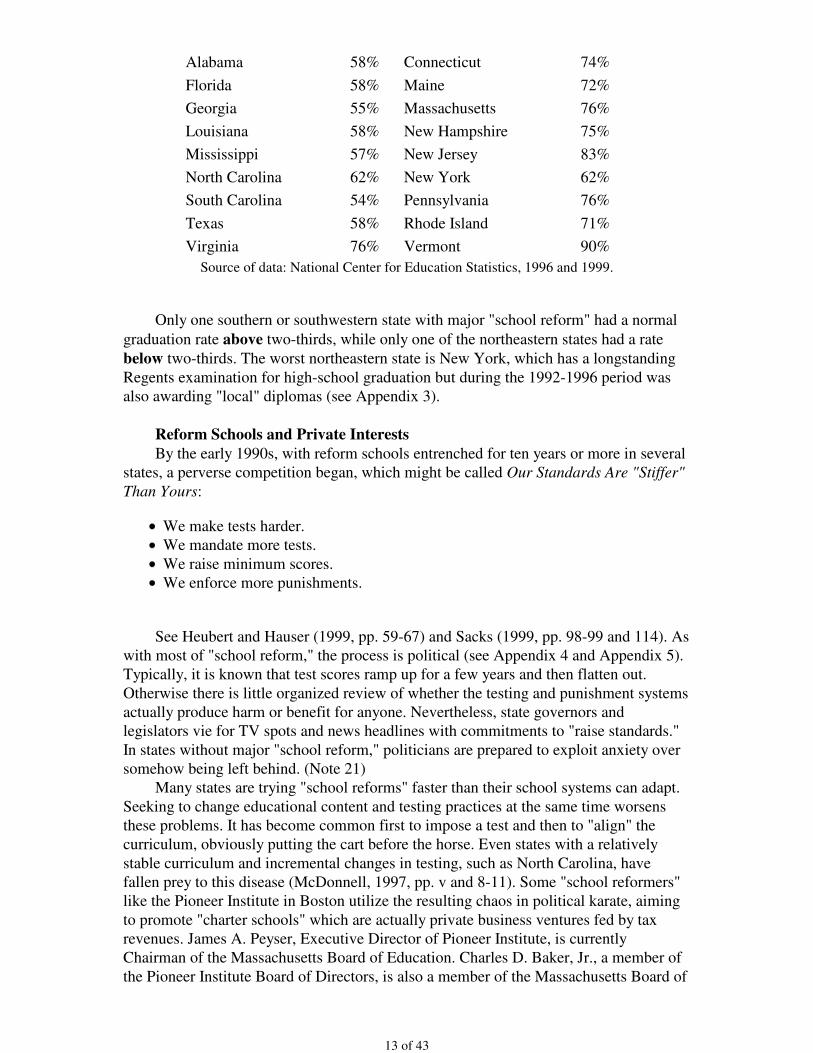
readily, since government reporting procedures have been changing, possibly to concealunfavorable trends (see Appendix 4). Table 3 estimates normal high-school graduationrates for the class of 1996 as percentages of ninth-grade enrollments in the fall of 1992.
(Note 20) It compares nine southern and southwestern states under major "schoolreform," requiring minimum scores on standard tests for graduation, with ninenortheastern states that did not have major "school reform" programs:
Table 3High-school graduation rates by state, 1996
(Percentage normal high-school graduation, class of 1996)
States under "school reform" States without "school reform"
13 of 43
Alabama 58% Connecticut 74%
Florida 58% Maine 72%
Georgia 55% Massachusetts 76%
Louisiana 58% New Hampshire 75%
Mississippi 57% New Jersey 83%
North Carolina 62% New York 62%
South Carolina 54% Pennsylvania 76%
Texas 58% Rhode Island 71%
Virginia 76% Vermont 90%
Source of data: National Center for Education Statistics, 1996 and 1999.
Only one southern or southwestern state with major "school reform" had a normal
graduation rate above two-thirds, while only one of the northeastern states had a rate
below two-thirds. The worst northeastern state is New York, which has a longstanding
Regents examination for high-school graduation but during the 1992-1996 period wasalso awarding "local" diplomas (see Appendix 3).
Reform Schools and Private Interests
By the early 1990s, with reform schools entrenched for ten years or more in severalstates, a perverse competition began, which might be called Our Standards Are "Stiffer"
Than Yours:
We make tests harder.We mandate more tests.
We raise minimum scores.We enforce more punishments.
See Heubert and Hauser (1999, pp. 59-67) and Sacks (1999, pp. 98-99 and 114). Aswith most of "school reform," the process is political (see Appendix 4 and Appendix 5).Typically, it is known that test scores ramp up for a few years and then flatten out.
Otherwise there is little organized review of whether the testing and punishment systemsactually produce harm or benefit for anyone. Nevertheless, state governors andlegislators vie for TV spots and news headlines with commitments to "raise standards."
In states without major "school reform," politicians are prepared to exploit anxiety oversomehow being left behind. (Note 21) Many states are trying "school reforms" faster than their school systems can adapt.
Seeking to change educational content and testing practices at the same time worsensthese problems. It has become common first to impose a test and then to "align" thecurriculum, obviously putting the cart before the horse. Even states with a relatively
stable curriculum and incremental changes in testing, such as North Carolina, havefallen prey to this disease (McDonnell, 1997, pp. v and 8-11). Some "school reformers"like the Pioneer Institute in Boston utilize the resulting chaos in political karate, aiming
to promote "charter schools" which are actually private business ventures fed by taxrevenues. James A. Peyser, Executive Director of Pioneer Institute, is currentlyChairman of the Massachusetts Board of Education. Charles D. Baker, Jr., a member of
the Pioneer Institute Board of Directors, is also a member of the Massachusetts Board of
14 of 43
Education. Former and current directors of the Pioneer Institute founded AdvantageSchools, Inc., of Boston, a for-profit business that has opened two Massachusetts charter
schools and fourteen charter schools in other states. These cross-interests and educational mistakes need to be made familiar to thepublic. They are usually ignored by the large newspapers and broadcast media unless a
tragedy occurs. (Note 22) In contrast to the strong interest over test scores, our press,broadcast media and politicians show only sporadic interest in the education process.Effective innovations such as team teaching, "looping" and open classrooms are being
neglected or forgotten (see Tyack and Cuban, 1995, pp. 86-107). Science and math havebeen emphasized, but long-term surveys of achievement suggest that progress in theseareas has occurred partly at the expense of writing skills. Only computer technology gets
much attention, but its limits are becoming apparent. While classroom computers areconvenient for exploring the Internet and organizing assignments, they have otherwisetaught students few skills.
By conventional standards of psychological testing, (Note 23) major test vendorshave been earning revenue from highly questionable uses of their products. Whiletechnical manuals may advise that their achievement tests are not "validated" for uses
such as school rating or promotion tests, they sell large volumes of these tests tojurisdictions using them for purposes other than individual counseling. For example, theStanford Achievement Test series, published by Harcourt Brace Educational
Measurement, is being used by the state of California to rate and compare schooldistricts (see Appendix 5). The Iowa test series, from the Riverside Publishing divisionof Houghton Mifflin, is being used by the city of Chicago as promotion tests (see
Roderick et al., 1999). When so used, these tests effectively set the curriculum and thestandards of performance for public schools, without meaningful public input or control.Parents and taxpayers are poorly informed about test validation and about strong effects
these tests have in setting educational standards. Taking a cue from Horace Mann, who fought for school standards and then movedto Congress a century and a half ago (see Appendix 2), many modern politicians have
sought to use "school reform" as a platform for advancement. The "school reform"movement has enough momentum that few state officeholders and candidates openlyoppose it. Candidates for state offices often use "school reform" backgrounds to support
their campaigns. In 1996 Governor Wilson of California attempted to mount a campaignfor President; Governor Bush of Texas is doing the same this year. Wilson left officeafter the defeat of his 1998 plan (proposition 8) to create state-appointed "governing
councils" for all California public schools, in charge of budgets. Taking a moderateapproach, such as supporting smaller class sizes and improved facilities, has sometimeswon out over "back to basics" appeals, as it did in the victory of Tom Vilsack over Jim
Ross Lightfoot in the 1998 election for governor of Iowa.
The Social Context School-based standard testing does not occur in a social vacuum. It hasconsequences, and the techniques it uses reflect interests and values. Insight and candor
about these consequences, interests and values are rare today; they must often beinferred from behaviors. In previous times, the advocates of standard testing were lessguarded about their intents.
It has become well known that early promoters of standard aptitude tests wereprofoundly racist and sexist. Goddard, Terman, Thorndike, Burt, Yerkes and Brigham allbelieved that these tests identified African-Americans, native Americans, immigrants
from southern and eastern Europe, or women as typically less able than white men
15 of 43
whose ancestors came from northern and western Europe. (Note 24) Goddard, Termanand Brigham were advocates of the "eugenics" movement, (Note 25) favoring IQ testsfollowed by sexual restriction of the "feeble-minded." An echo of their attitudes can be
heard in the enthusiasms for standard tests sometimes expressed in the U. S. today,reducing access by African-Americans and Hispanic-Americans to universities andprofessional schools. Few of the modern promoters of standard tests flaunt prejudices
that were once openly displayed. Relative success on these tests by Jews and by theoffspring of Asian immigrants has greatly tempered hubris over "Nordic superiority." The myth of measuring innate talent has been exposed. Multifactor studies link
high scores on aptitude tests with advantages in family income, language and culturalexposure, motivation, self-confidence and training (see, for example, Goslin, 1963, pp.137-147, Duncan and Brooks-Gunn, 1997, pp. 132-189, and Brooks-Gunn et al., 1996).
Key research on the inheritance of intelligence, once widely cited, has been probed andfound to have been scientific fraud (Gould, 1981, pp. 234-239). After accounting formeasurable influences of environment, studies of multiple factors do leave unexplained
residues that might be called aptitudes, but they can only be inferred from comparisonsacross groups. There are no reliable techniques for measuring aptitudes in an individualwhich are independent of experience, nor has it been shown how many such aptitudes
there might be. Despite exposures of motive and mythology, use of standard testing continues togrow. A century after their origins, school-based standard testing and its scavenger, test
preparation, have become industries sustained by powerful institutions and deeply feltpersonal interests. Their supporters are now often driven by secondary motives thatresult from widespread testing programs. At least two generations have been able to
profit from test-taking success, entering professions and making connections during theircollege years that might otherwise have been closed to them. They know how to crackthe tests; they make sure their children learn; and they can be angered to think that this
useful wedge into income and influence might be removed. Today's standard test enthusiasts range from right-wing extremists to hard-nosedbusiness people to ambitious young professionals to church schools and home schoolers
who are looking for validation of their work in other words, some of our neighbors.Parents who want to keep young children out of the testing game are now beset withlegal mandates in many states and with social pressure almost everywhere. Far too few
people are asking whether the public schools are really broken and in need of this kindof a fix (see Berliner, 1993, and Berliner and Biddle, 1995). Among the right-wing, there is a Libertarian perspective from which conventional
standard tests are an intrinsic evil because they interfere with local control of schools.Also, it is worth noting that a number of the business enthusiasts for standard testingactually send their own children to private schools where such testing is not emphasized.
Berliner and Biddle (1995) have extended such observations into an argument that sometesting promoters have a different agenda: using the embarrassment of low test scores inpublic schools as a weapon to force governments toward corporate schools, which they
will operate at a profit. Much as in the 1920s, its first great decade, school-based standard testing is stillsold as a key to discovering talent and measuring ability objectively. When possible its
critics are ignored, or they are dismissed as extremists, dreamers or losers. Testdevelopment and scoring procedures are wrapped in mystification. "Validation" of testsis widely touted, but it usually means only that people who do well on one test do well
on another. Public enlightenment has made progress, but it struggles upstream against aflow of laundry soap, liver pills and snake oil.
16 of 43
What have all the years of more than 100 million school-based standard tests a year(Note 26) brought us? The "one minute" people, perhaps, who judge anything that takeslonger as not worth the bother. Try to make life into a rush of standard questions. The
idiot-genius computer programmers, fast as lightning. The ones who saddled us withabout $200 billion worth of "year 2000" problems, because they didn't think about aslightly bigger picture. The test prep industry, a scrounger that otherwise has no purpose.
The product support staff who don't know what to do when they run to the end of theircheat sheets. The cutback from education to test cramming in the states with standardpunishment systems. Don't take chances; teach and learn the test.
Remedies
School-based standard testing has seen more than a century of development in the
U. S. (see Appendix 7). No quick or simple remedy can cure the many problems it hascaused. Any remedy will require resolute public action. The following priorities areessential:
Stop using standard test scores to deny promotion or graduation.Stop using standard test scores to create financial incentives or penalties.
These are the key weapons of the state punishment systems. The significance andaccuracy of standard test scores do not justify these measures. They are viruses thattransform schools from education to test cramming. They are all harm and no benefit. If
we do not stop the damage being wrecked by these mistaken "school reforms," no otherremedies will matter much. If the catastrophes from "school reform" can be curtailed, we can tackle the worst
problems of current school-based standard testing:
Conflict of purpose. We are trying to use the same tests to measure basic
competence as to measure high levels of skills and knowledge.
Conflict of method. We say that we want to measure meaningful skills andknowledge, but our test methods stress empty tasks and fast answers.
The root of these conflicts is the same: choosing speed and price over effectiveness.If we want accurate and meaningful results, we must reverse these priorities. Good tests
will not be quick or cheap. A test to measure basic competence in a skill or subject mustcover a broad range of what we believe basic competence should mean. A test tomeasure high levels of skills and knowledge must include open-ended tasks that can be
performed with many different strategies. We will need to weigh costs and benefitscarefully. Even when they do not corrupt education, meaningful tests will take time andresources that could have been spent otherwise.
The "authentic assessment" and "performance assessment" movements seek tocombine educational assessments with the learning process. Classic models are the"course project" and the "term paper." While the intents of these movements are
understandable, Kentucky and California experiences in the 1990s suggested that suchtechniques were not mature enough to provide reliable comparisons among schools orschool districts, much less to create promotion or graduation tests (Sanders and Horn,
1995). Moreover, we have no school-based achievement tests at all that have beenproven to predict meaningful accomplishments by students in the world beyond the
17 of 43
schoolhouse door. Schools probably test too much, yet at the same time they may fail to use tests whentests can help. A key example is poor and late diagnosis of reading disorders. A great
fraction of adult activities require proficient reading; most school activities and standardtests do also. We know that some young students have much more difficulty readingthan others, although they may otherwise have strong skills. Schools need to identify
reading disorders as early as possible and help to remedy them before they becomedeeply ingrained. Limited and conflict-ridden as it is, current standard testing shows systematic
deficits for students from low-income and minority households. Better testing will give abetter picture of how serious these problems are, but it will not cure them. We needplans and resources to address the problems which are already clearly understood:
Language. We should teach standard spoken English as a second language tostudents from households where it not spoken. We should not disparage dialectsor other languages, but we must equip students early with this essential skill.
Motivation. Other than language, the key barrier for students from low-incomeand minority households is weak motivation. Home and school partnerships haveshown how this problem can be overcome. We must create and strengthen them.
We do not understand all the problems. We do not know how to solve all theproblems that we do understand. But we know enough to begin. If not now, then when?
Validity and Relevance School-based aptitude testing is known to have low predictive strength. Studieshave shown that it heavily reflects the income and education levels of students'households and that most of what it can predict is associated with social advantages and
disadvantages. If tax-supported or tax-exempt schools use scores on intelligence or otheraptitude tests to deny opportunities to some students while providing them to others,they violate the public trust.
For school-based achievement testing, we have few studies of predictive strength(as one example, see Allen, 1996, section IV-B, pp. 118-120). In most circumstances, wesimply do not know whether these tests measure anything apart from social privilege
that is useful outside a school setting. After adjustment for social factors, can theirscores accurately predict future success in occupations, creative achievements, earninglevels, family stability, civic responsibility or any of the other outcomes we mean to
encourage with public education? Are there alternative assessments that can accomplishthese goals? Given the heavy engagement in "school reforms" and the energy spent ontheir testing programs, it is amazing to see how little attention these matters receive (see
related observations by Broadfoot, 1996, pp. 14-15). Academic andfoundation-supported scholars specializing in psychometrics have the greatestopportunities to answer these questions, but they have largely ignored them.
Journalists, broadcasters, bureaucrats, politicians, educators and their critics like
most of the public usually assume that a mathematics test, for example, actuallymeasures some genuinely useful knowledge and skill. Who has shown this to be true,and for which tests? Is there actually a strong and consistent relation, for example,
between top scores on a particular high school math achievement test and a successfulcareer as a civil engineer? If there were not, then what does that test measure? Is there astrong and consistent relation between acceptable scores on a social studies test and
18 of 43
adult voting participation? If there were not, then how is such a test of use? Unfortunately, it is far from proven that any method of assessment can escape the
biases, the other errors, and the low or unknown predictive strengths outside the schoolswhich plague the current tests. We should take this not as a signal of defeat but as aninvitation to humility. The complexities of human behavior are immense, and our
current approaches measure them poorly. Rather than try to stretch each student onto aProcrustean bed of so-called "achievement," taking pride in lengthening the beam a bitevery few years, we need to promote core competence and recognize the diversity of
other skills. If standard tests were to have any useful role, it would most likely be as anaid to help insure that students can exercise skills which have been clearly provenessential for ordinary occupations. Even such a limited objective as this requires both
education and test validation well beyond current educational and psychometricpractices. As we question the validity of testing, we may also question the relevance of the
education supposedly being tested. Are we using the irreplaceable years of youth toconvey significant skills and knowledge, or are we cultivating fetishes and harping onhide-bound answers to yesterday's questions? Somehow, despite decades of claims that
our schools are inferior, we in the U. S. have achieved a stronger economy than mostother industrial countries. Yet we also have more crime than most of these countries. Isour education responsible for these situations? We have many such issues to address.
They present truly difficult questions. None of them will be found on school-basedstandard tests.
Notes
Comments and suggestions from several reviewers are gratefully acknowledged.
Mistakes or omissions remain, of course, the fault of the author.
For a viewpoint characteristic of the era, see Rickover, 1959.1.Pope Pius XI, as spoken in "...the defenders of order against the spread of Godless
communism," Christmas Allocution, The Holy See, Rome, 1936. "Godlesscommunism" became a popular phrase among cold-war patriots of the era.
2.
Lemann, 1995, recounts the history of draft-deferment testing.3.
Commonly called "standardized testing." The underlying purpose of such tests isto set a standard that is calibrated for a population.
4.
Reischauer and Fairbank, 1958, pp. 106-107, describe Chinese origins in the
Western (Earlier) Han Dynasty, c. 120 BCE.
5.
Schultz, 1973, reviews the industrial model for public schooling.6.Massachusetts House Speaker Thomas Finneran. See Lehigh, 1998.7.
Goslin, 1963, p. 82 (footnote 2), indicates that the relatively low predictivestrengths of aptitude tests for college grades were well known by around 1960.
8.
Crouse and Trusheim, 1988, pp. 124-127, review predictive strength for the SAT
vs. family incomes and high school grades. Nairn and Associates, 1980, show thatSAT scores tend to act as proxies for family income. Tyack, 1974, pp. 214-215,cites an equivalent claim for IQ scores made by the Chicago Federation of Labor
in 1924.
9.
Sacks, 1999, p. 183 (note 23), cites a negative correlation between GRE aptitudetest scores and publishing records for academic historians.
10.
Owen and Doerr, 1999, Appendix C, list 284 U. S. colleges and universities whereSAT and ACT scores are optional for admission into bachelor's programs.
11.
Merton, 1957, pp. 421-436, calls such a phenomenon a "self-fulfilling prophecy."12.
19 of 43
Sacks, 1999, pp. 182-185, cites and summarizes several relevant studies.13.Tyack, 1974, pp. 35-36 and 47-48, recounts the two examples cited ofnineteenth-century school testing.
14.
Tyack, 1974, pp. 126-147, shows how demands for accountability were used tocement control of public schools by business leaders and school supervisors.
15.
Tyack, 1974, pp. 194 and 206-216, recounts the rapid spread of standard testing in
the 1920s.
16.
Tyack, 1974, pp. 41-46, recounts the first major U. S. school reform, the system ofgraded classrooms, inspired by Prussian schools and introduced to the U. S. in the
1840s and 1850s. Tyack and Cuban, 1995, explore the history of twentieth-centuryschool reform movements in the U. S.
17.
A Nation at Risk, published by the National Commission on Excellence in
Education, U. S. Department of Education, in April, 1983, is cited as inspiringmany of these initiatives.
18.
See Appendix 1. Precedents from the past are worse. In 1922, New York City
reported that nearly half of all students were "above normal age for their schoolgrade," as cited by Feuer, et al., 1992, p. 118.
19.
Data from National Center for Education Statistics, 1996, and National Center for
Education Statistics, 1999. See 1995 Table 41 for ninth-grade enrollments and1998 Table 102 for high school graduates. No attempt is made to adjust forimmigration, emigration, mortality or population movement between states.
20.
An egregious example of these effects can be seen in California from 1994through 1997, during the Wilson administration. See Appendix 5.
21.
Albert L. Powers, "Questionable reform," Carlisle Mosquito, Carlisle, MA,
October 29, 1999. Paul Dunphy, "Charter schools fail promises," Daily HampshireGazette, Amherst, MA, February 7, 2000. Beth Daley and Doreen I. Vigue, "Firmpulls out of school where boy died," Boston Globe, February 10, 2000.
22.
Standards 6.12, 8.7 and 8.12 in Committee to Develop Standards for Educationaland Psychological Testing, 1985, pp. 43 and 53-54. These standards, jointlydeveloped by the American Psychological Association, American Educational
Research Association and National Council on Measurement in Education, werealso updated in 1999.
23.
Brigham, 1923, pp. 87 ff., says "...the foreign born are intellectually inferior," then
analyzes inferiority by races and origins.
24.
For the proposition that "no feeble-minded person should ever be allowed tomarry or to become a parent," Goddard, 1914, p. 561. On "curtailing the
reproduction of feeble-mindedness," Terman, 1916, p. 7. On "prevention of thecontinued propagation of defective strains," Brigham, 1923, p. 210. All three menmodified their views in later years.
25.
Since at least 1961. See Goslin, 1963, pp. 53-54.26.
References
Allen, W. B., Project Director (1996). A New Framework for Public Education in
Michigan. East Lansing, MI: James Madison College, Michigan State University.
Associated Press (1999, June 3). Blacks nearly four times more likely to be exempt from
20 of 43
TAAS than whites. Capitol Times, Austin, TX.
Berliner, D. C. (1993). Educational reform in an era of disinformation. Educational
Policy Analysis Archives 1(2), available at http://epaa.asu.edu/epaa/v1n2.html.
Berliner, D. C., & Biddle, B. J. (1995). The Manufactured Crisis: Myths, Fraud, and the
Attack on America's Public Schools. Reading, MA: Addison- Wesley.
Brigham, C. C. (1923). A Study of American Intelligence. Princeton, NJ: Princeton
University Press.
Broadfoot, P. M. (1996). Education, Assessment and Society: A Sociological Analysis.
Philadelphia, PA: Open University Press.
Brooks-Gunn, J., et al. (1996). Ethnic differences in children's intelligence test scores.Child Development 67(2), 396-408.
California Department of Education (2000). Academic Performance Index School
Rankings, 1999. Sacramento, CA: Department of Education, Delaine Eastin, StateSuperintendent.
Ceci, S. J. (1991). How much does schooling influence general intelligence and its
cognitive components? A reassessment of the evidence. Developmental Psychology
27(5), 703-722.
Census Bureau (1992). Census of 1990. Washington, DC: U. S. Department of
Commerce.
Cole, P. G. (1995). The bell curve: Should intelligence be used as the pivotalexplanatory concept of student achievement? Issues In Educational Research 5(1),
11-22.
Committee to Develop Standards for Educational and Psychological Testing, Melvin R.Novick, Chair (1985). Standards for Educational and Psychological Testing.
Washington, DC: American Psychological Association.
Conant, J. B. (1940, May). Education for a classless society. Atlantic Monthly 165(5), 593-602.
Cremin, L. A. (1962). The Transformation of the School: Progressivism in American
Education, 1876-1957. New York: Alfred A. Knopf.
Crouse, J., & Trusheim, D. (1988). The Case Against the SAT. Chicago: University of
Chicago Press.
Culbertson, J. (1995). Race, intelligence and ideology. Educational Policy Analysis
Archives 3(2), available at http://epaa.asu.edu/epaa/v3n2.html.
Daley, B., & Zernike, K. (2000, January 26). State may change MCAS contractor.Boston Globe.
Dewey, J. (1922, December 13). Individuality, equality and superiority. The New
21 of 43
Republic 33(419), pp. 61-63.
Duncan, G. J., & Brooks-Gunn, J., Eds. (1997). Consequences of Growing Up Poor.
New York: Russell Sage Foundation.
Feuer M. L., et al., Eds. (1992). Testing in American Schools: Asking the Right
Questions (Publication OTA-SET-519). Washington, DC: U. S. Congress, Office ofTechnology Assessment.
Goddard, H. H. (1914). Feeble-mindedness; Its Causes and Consequences. New York: Macmillan.
Goslin, D. A. (1963). The Search for Ability. New York: Russell Sage Foundation.
Gould, S. J. (1981). The Mismeasure of Man. New York: W. W. Norton and Co.
Haney, W. M. (1999). Supplementary Report on the Texas Assessment of Academic
Skills Exit Test (TAAS-X). Boston: Center for the Study of Testing, Evaluation and
Educational Policy, Boston College School of Education.
Hayman, R. L., Jr. (1997). The Smart Culture: Society, Intelligence, and Law. New York: New York University Press.
Heubert, J. P., & Hauser, R. M., Eds. (1999). High Stakes Testing for Tracking,
Promotion and Graduation. Washington, DC: National Academy Press.
Holloway M. (1995, January). Flynn's effect. Scientific American 280(1), 37-38.
Hunt, E. (1995). The role of intelligence in modern society. American Scientist 83(4), 356-369.
IDRA Newsletter (1998, January). Intercultural Development Research Association, San
Antonio, TX.
Kessel, C., & Linn, M. C. (1996). Grades or scores: Predicting future collegemathematics performance. Educational Measurement: Issues and Practice 15(4), 10-14.
Lehigh, S. (1998, June 28). For teachers, criticisms from many quarters. Boston Globe.
Lemann, N. (1995, September). The great sorting. Atlantic Monthly 276(3), 84-100.
Longitudinal Attrition Rates in Texas Public High Schools, 1985-1986 to 1997- 1998
(1999). Intercultural Development Research Association, San Antonio, TX.
Massachusetts Department of Education (1999a). Massachusetts Comprehensive
Assessment System 1998 Technical Report. Malden, MA: Department of Education,
David P. Driscoll, Commissioner.
Massachusetts Department of Education (1999b). Massachusetts Comprehensive
Assessment System, Report of 1999 State Results. Malden, MA: Department of
Education, David P. Driscoll, Commissioner.
McDonnell, L. M. (1997). The Politics of State Testing: Implementing New Student
22 of 43
Assessments (Publication CSE-424). Los Angeles: National Center for Research onEvaluation, Standards and Student Testing, University of California.
McDonnell, L. M., & Weatherford, M. S. (1999). State Standards-Setting and Public
Deliberation: The Case of California (Publication CSE-506). Los Angeles: NationalCenter for Research on Evaluation, Standards and Student Testing, University ofCalifornia.
Merton, R. K. (1957). Social Theory and Social Structures. Glencoe, IL: Free Press.
Nairn, A., & Associates (1980). The Reign of the ETS: The Corporation that Makes Up
Minds. Washington, DC: Center for the Study of Responsive Law.
National Center for Education Statistics (1996). Digest of Education Statistics, 1995.
Washington, DC: U. S. Department of Education.
National Center for Education Statistics (1997). NAEP 1996 Trends in Academic
Progress (Publication NCES 97-985). Washington, DC: U. S. Department of Education.
National Center for Education Statistics (1999). Digest of Education Statistics, 1998.
Washington, DC: U. S. Department of Education.
Neisser, U., Ed. (1998). The Rising Curve: Long-Term Gains in IQ and Related
Measures. Washington, DC: American Psychological Association.
New York State Education Department (1998). New York State School Report Card for
the School Year 1996-1997. Albany, NY: Education Department, Richard P. Mills,Commissioner.
New York State Education Department (1999). New York State School Report Card for
the School Year 1997-1998. Albany, NY: Education Department, Richard P. Mills,Commissioner.
Owen, D., & Doerr, M. (1999). None of the Above (Revised ed.). Lanham, MD:
Rowman and Littlefield Publishers.
Problems with KIRIS test erode public's support for reforms (1998, February 2).Lexington Herald-Leader, Lexington, KY.
Ravitch, D. (1996, August 28). Defining literacy downward. New York Times.
Regional Profile, Juarez and Chihuahua (1999). Texas Centers for Border EducationalDevelopment, El Paso, TX.
Reischauer, E. O., & Fairbank, J. K. (1958). East Asia: The Great Tradition. Boston: Houghton Mifflin.
Rickover, H. G. (1959). Education and Freedom. New York: E. P. Dutton and Co.
Roderick, M., et al. (1999). Rejoinder to Ending Social Promotion: Results from the
First Two Years. Chicago: Consortium on Chicago School Research, Designs forChange.
23 of 43
Rogers, T. B. (1995). The Psychological Testing Enterprise. Pacific Grove, CA:Brooks/Cole Publishing Co.
Sacks, P. (1999). Standardized Minds. Cambridge, MA: Perseus Books.
Sanders, W. L., & Horn, S. P. (1995). Educational assessment reassessed: Theusefulness of standardized and alternative measures of student achievement as indicators
for the assessment of educational outcomes. Education Policy Analysis Archives 3(6), available at http://epaa.asu.edu/epaa/v3n6.html.
Schultz, S. K. (1973). The Culture Factory: Boston Public Schools, 1789-1860. New York: Oxford University Press.
Szechenyi, C. (1998, March 8). Failing grade? Firm with state's assessment contract hastroubled past. Middlesex News, Framingham, MA.
TAAS scandal widens (1999, April 9). Lone Star Report, Austin, TX.
Terman, L. M. (1916). The Measurement of Intelligence. Boston: Houghton Mifflin.
Texas Education Agency (1998). 1998 Comprehensive Biennial Report on Texas Public
Schools. Austin, TX: Education Agency, Jim Nelson, Commissioner.
Tyack, D. B. (1974). The One Best System. Cambridge, MA: Harvard University Press.
Tyack, D. B. & Cuban, L. (1995). Tinkering toward Utopia: A Century of Public School
Reform. Cambridge, MA: Harvard University Press.
About the Author
Craig BolonPlanwright Systems Corporation, Inc.
Email: [email protected]
Craig Bolon is President of Planwright Systems Corp., a software development firm located inBrookline, Massachusetts, USA. After several years in high energy physics research and then in
biomedical instrument development at M.I.T., he has been an industrial software developer forthe past twenty years. He is author of the textbook Mastering C (Sybex, 1986) and of several technical publications. He is an elected Town Meeting Member and has served as member and
Chair of the Finance Committee in Brookline, Massachusetts.
Appendix 1Information: U. S. Public Education
Figure 1 (on two pages, U. S. Dept. of Education, 1997) shows NAEP national average scores
from program inception through 1996.
24 of 43
25 of 43
26 of 43
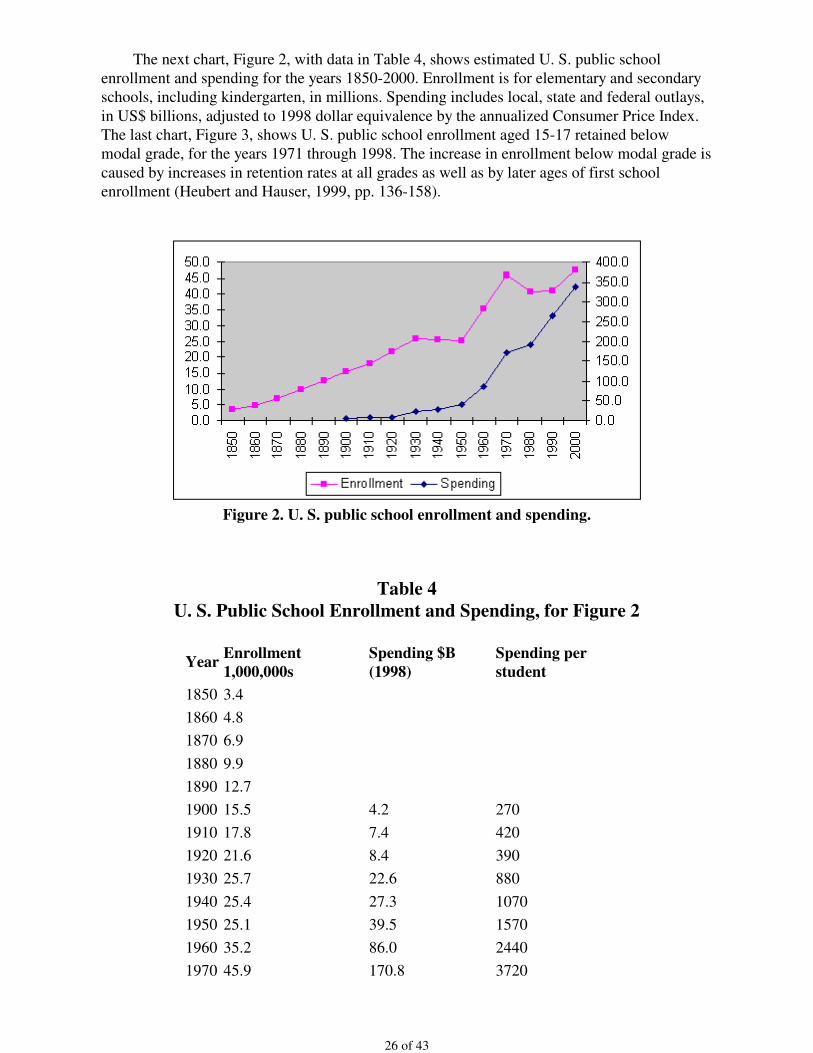
The next chart, Figure 2, with data in Table 4, shows estimated U. S. public schoolenrollment and spending for the years 1850-2000. Enrollment is for elementary and secondaryschools, including kindergarten, in millions. Spending includes local, state and federal outlays,
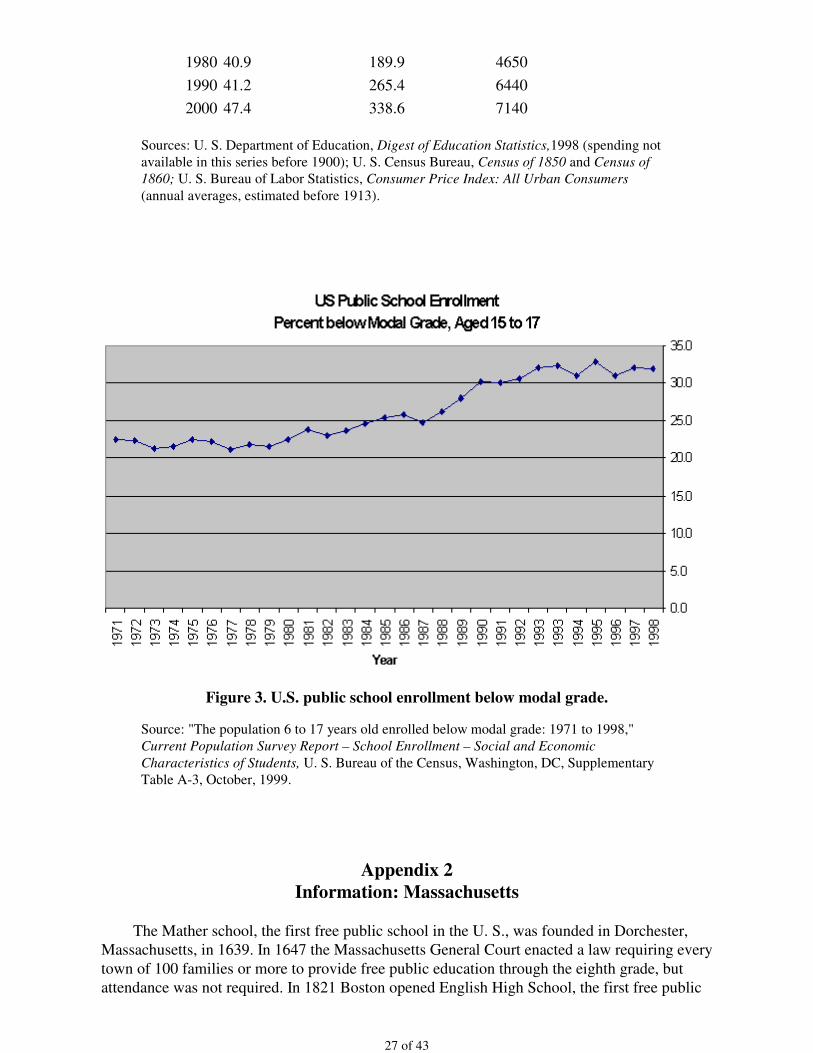
in US$ billions, adjusted to 1998 dollar equivalence by the annualized Consumer Price Index.The last chart, Figure 3, shows U. S. public school enrollment aged 15-17 retained belowmodal grade, for the years 1971 through 1998. The increase in enrollment below modal grade is
caused by increases in retention rates at all grades as well as by later ages of first schoolenrollment (Heubert and Hauser, 1999, pp. 136-158).
Figure 2. U. S. public school enrollment and spending.
Table 4U. S. Public School Enrollment and Spending, for Figure 2
YearEnrollment 1,000,000s
Spending $B (1998)
Spending per student
1850 3.4
1860 4.8
1870 6.9
1880 9.9
1890 12.7
1900 15.5 4.2 270
1910 17.8 7.4 420
1920 21.6 8.4 390
1930 25.7 22.6 880
1940 25.4 27.3 1070
1950 25.1 39.5 1570
1960 35.2 86.0 2440
1970 45.9 170.8 3720
27 of 43
1980 40.9 189.9 4650
1990 41.2 265.4 6440
2000 47.4 338.6 7140
Sources: U. S. Department of Education, Digest of Education Statistics,1998 (spending not available in this series before 1900); U. S. Census Bureau, Census of 1850 and Census of
1860; U. S. Bureau of Labor Statistics, Consumer Price Index: All Urban Consumers
(annual averages, estimated before 1913).
Figure 3. U.S. public school enrollment below modal grade.
Source: "The population 6 to 17 years old enrolled below modal grade: 1971 to 1998,"Current Population Survey Report – School Enrollment – Social and Economic
Characteristics of Students, U. S. Bureau of the Census, Washington, DC, SupplementaryTable A-3, October, 1999.
Appendix 2Information: Massachusetts
The Mather school, the first free public school in the U. S., was founded in Dorchester,Massachusetts, in 1639. In 1647 the Massachusetts General Court enacted a law requiring every
town of 100 families or more to provide free public education through the eighth grade, butattendance was not required. In 1821 Boston opened English High School, the first free public
28 of 43
high school in the U. S.. It taught English, history, logic, mathematics and science but did notoffer the traditional Latin curriculum. An 1827 Massachusetts law required every town with500 or more families to support a free public high school, and an 1852 law required school
attendance to the age of 14, the first such laws in the U. S.. Massachusetts took over 30 years toreach compliance with each. Massachusetts created a state Board of Education in 1837 to set standards for public
schools, then in disarray. Horace Mann, a state senator from Boston and former staterepresentative from Dedham, became the first Secretary to the Board. In 1839, at Mann'surging, Massachusetts created its first state- supported teacher's college, located in Lexington
(now in Framingham). In 1845, following disputes over the quality of instruction, the Board ofEducation issued a voluntary written examination for public school eighth-graders, consistingof 30 short-answer questions. In its first year, the average score was less than one-third correct
answers. Scores were soon used to compare schools in the press. Schoolmasters complainedthat knowledge tested did not correspond to their curricula. After Mann entered Congress in1848 the examination was discontinued. During the following 138 years the Board of
Education did not require testing of students. In 1986 the Board of Education began statewide student testing called the MassachusettsEducational Assessment Program (MEAP). Among its purposes was to provide comparisons
between student achievements in the state and student achievements being measured since 1969through NAEP, the National Assessment of Educational Progress. Fourth-grade andeighth-grade tests of reading, mathematics and science were given every two years from 1986
through 1996. These tests were designed and administered by Advanced Systems inMeasurement and Evaluation, Inc., of Dover, NH. Questions were in multiple choice, shortanswer and extended answer formats. Only aggregate scores for the state were publicly
reported. Scores for individual schools were not disclosed. While Massachusetts average scoreswere above national averages, from 26 to 32 percent of the 1992- 1996 scores were "belowbasic," the lowest of four classification levels.
The Massachusetts Education Reform Act of 1993 required revised educational standardsand procedures. In January, 1998, the Board of Education began using a new MassachusettsTeacher Test as a part of teacher certification. A communication and literacy skills test and a
subject test in one of 41 areas must be passed. These tests, recently renamed the MassachusettsEducator Certification Tests, are being prepared and administered by National EvaluationSystems, Inc., of Amherst, MA, designer of the California Basic Educational Skills tests and
the Texas Academic Skills Program tests. They are strictly timed and include multiple choicereading comprehension questions, short answer vocabulary and grammar questions, and awritten composition. Testing was initiated without a tryout period for the test and with
relatively little advance notice about test content or consequences. In the first group ofcandidates, less than half passed both parts of the test. As one result, only white candidateswere certified to teach in Massachusetts.
In 1995, the Board of Education released "curriculum frameworks," or required curricula,for mathematics and for science and technology. It later issued frameworks for Englishlanguage arts and for history and social science. In the spring of 1998, after a tryout period in
1997, the Board began a new student testing program in the fourth, eighth and tenth gradescalled the Massachusetts Comprehensive Assessment System (MCAS). It includes tests inEnglish language arts, mathematics, science and technology, and history and social science.
They are loosely timed and include questions in multiple choice, short answer and extendedanswer formats. Through 1999, the test for history and social science has been administeredonly to eighth-grade students. Total testing time is about ten to fifteen hours, depending on the
year and number of tests, with about half typically spent on English language arts. Scores arereported in a 200-280 point range; they are classified in four levels, equally spaced in the score
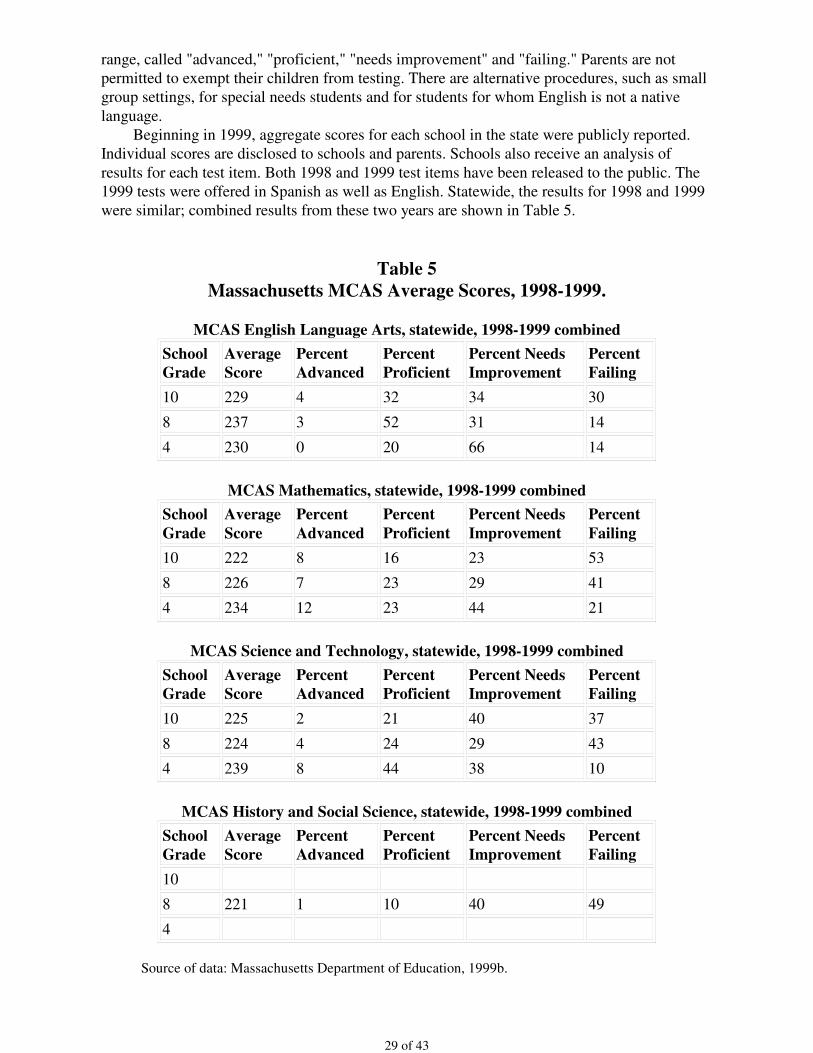
29 of 43
range, called "advanced," "proficient," "needs improvement" and "failing." Parents are notpermitted to exempt their children from testing. There are alternative procedures, such as smallgroup settings, for special needs students and for students for whom English is not a native
language. Beginning in 1999, aggregate scores for each school in the state were publicly reported.Individual scores are disclosed to schools and parents. Schools also receive an analysis of
results for each test item. Both 1998 and 1999 test items have been released to the public. The1999 tests were offered in Spanish as well as English. Statewide, the results for 1998 and 1999were similar; combined results from these two years are shown in Table 5.
Table 5Massachusetts MCAS Average Scores, 1998-1999.
MCAS English Language Arts, statewide, 1998-1999 combined
School Grade
Average Score
Percent Advanced
Percent Proficient
Percent Needs Improvement
Percent Failing
10 229 4 32 34 30
8 237 3 52 31 14
4 230 0 20 66 14
MCAS Mathematics, statewide, 1998-1999 combined
School Grade
Average Score
Percent Advanced
Percent Proficient
Percent Needs Improvement
Percent Failing
10 222 8 16 23 53
8 226 7 23 29 41
4 234 12 23 44 21
MCAS Science and Technology, statewide, 1998-1999 combined
School Grade
Average Score
Percent Advanced
Percent Proficient
Percent Needs Improvement
Percent Failing
10 225 2 21 40 37
8 224 4 24 29 43
4 239 8 44 38 10
MCAS History and Social Science, statewide, 1998-1999 combined
School Grade
Average Score
Percent Advanced
Percent Proficient
Percent Needs Improvement
Percent Failing
10
8 221 1 10 40 49
4
Source of data: Massachusetts Department of Education, 1999b.
30 of 43
The Board of Education has released a technical analysis of the 1998 MCAS whichincludes estimates that its classification levels are consistent (Massachusetts Department of
Education, 1999a). These are phrased in terms of the probability that a student who mightreceive a particular classification level after many repeated tests of some type would beclassified at the same level by any one of those tests. Estimated probabilities range from 56 to
92 percent; they are highest for the "failing" level, averaging 85 percent, and lowest for the"advanced" level, averaging 70 percent. This technical analysis considers "validity" only in thenarrow sense of comparison with other test results. Strong correlations, from .6 to .8, were
found with components of the Stanford Achievement Test series. Significant MCAS scoredifferences between male and female students and large score differences between students ofdifferent ethnic backgrounds were found, a pattern that is commonly duplicated by aptitude
tests. Neither the methodology for computing the reported scaled scores nor the basis forclassifying scores into passing and failing levels has been disclosed to the public. In 2003, passing scores on tenth-grade tests will be required for a high-school diploma.
The Board of Education has also announced plans to remove principals of schools whichreceive low scores and do not improve. The Board has not reported the fraction of studentsfailing at least one of the tenth-grade tests, but statewide it is obviously more than half. By
2003, Massachusetts may be denying a diploma to a majority of students who complete highschool, based on their failure to achieve passing scores on its standard tests. Like the MEAP tests, the 1998 and 1999 MCAS tests were designed and administered by
Advanced Systems in Measurement and Evaluation, Inc., of Dover, NH. Advanced Systemswon a 1995 contract estimated at $25 million over competitors Riverside Publishing, publisherof the Iowa Tests of Educational Development, and Harcourt Brace Educational Measurement,
publisher of the Stanford Achievement Tests. Advanced Systems has been a target of stateinvestigations for its work in Maine and New Hampshire. In 1997, it lost a contract inKentucky after being accused of gross errors in test scoring ("Problems," 1998). Scoring errors
by the firm have also been reported in Maine. Tests that use extended answer questions, asthose in Massachusetts do, must be scored by individual test evaluators. There have beenreports of hasty scoring by Advanced Systems test evaluators working under time pressures and
of computer programming errors by the company (Szechenyi, 1998). In the summer of 1999, the Board of Education opened competitive bidding for the MCASprogram of 2000-2004. Bids were received from the same companies as in 1995. In January,
2000, Commissioner of Education David P. Driscoll announced that Harcourt BraceEducational Measurement had received preliminary selection, with final negotiations inprogress (Daley and Zernike, 2000). Problems with this change in vendors can be expected. A
new vendor lacks the time to repeat the review and tryout process of the first MCAS seriesbefore testing starts in April, 2000.
Appendix 3Information: New York
The state of New York began to appropriate funds for support of public schools in 1795.In 1814, all New York municipalities were required to participate in a statewide system ofpublic school districts. At the time, these schools charged tuition to cover differences between
operating costs and state funding. In 1867, free public schooling became a requirement of law.The current school year of 180 days was set in 1913, and the current school-leaving age of 16was set in 1936.
The New York Board of Regents, originally responsible for supervising higher education,
31 of 43
began high-school entrance examinations in 1865, later called "preliminary" examinations. In1878 it began examinations for graduation from high schools. In the 1880s the Board beganinspection visits to public schools. A 1904 reorganization put the Board of Regents in charge of
standards for all public education. One response was gradual strengthening of secondary schoolattendance. Another was development of detailed curricula aimed at preparing students forhigher education. Throughout the nineteenth and twentieth centuries, high-school students in
New York have been able to obtain a "local" high-school diploma without meeting Regentsexamination requirements. In the 1930s the New York City schools began administering the Metropolitan
Achievement Test series, designed by The Psychological Corporation, for diagnosis andguidance. In the 1970s the New York Education Department began using this test series, nowprovided by Harcourt Brace Educational Measurement, for its statewide Pupil Evaluation
Program. This program administered tests of reading and mathematics in grades 3 and 6, testsof writing in grade 5, and tests of social studies in grades 6 and 8. During the years 1993 to1996, the Department gradually changed to the California Achievement Tests, provided by
CTB/McGraw-Hill. Throughout these years, the Department also administered the RegentsPreliminary Competency Tests of reading and writing in grades 8 and 9. Beginning in 1999 the Education Department is replacing its elementary and secondary
school tests with new Program Evaluation Tests, planned since 1994 and piloted during 1995through 1998. These tests, developed by CTB/McGraw-Hill, are strictly timed and includequestions in multiple choice, short answer, extended answer, essay and laboratory performance
formats. Tests for English language arts, mathematics and science are to be administered ingrades 4 and 8. Social studies tests are to be administered in grades 5 and 8. Test items aredisclosed to the public. Only English language arts and mathematics tests are being given in
1999 and 2000. Tests are currently offered only in English. The New York Regents high-school graduation examinations are by subject. Beginningwith a few subjects, the examination catalog reached a peak of 68 subjects in 1925. After years
of consolidation, by the 1960s the catalog was reduced to English, mathematics, science, socialstudies and certain foreign languages. Subsequent revisions introduced technical educationsubjects. In 1998 the Education Department announced a new series of statewide tests in
English, mathematics, science, global history and geography, and U. S. history and government,starting in 1999. The new Regents examinations have been developed by CTB/McGraw-Hill.They are strictly timed and include questions in multiple choice, short answer, extended
answer, essay and laboratory performance formats. Most tests are offered in English only; somehave also been offered in Chinese, Hatian Creole, Korean, Russian and Spanish. Scores of 65on all tests are now required for a Regents diploma, and scores of 55 are required for a "local"
diploma. Beginning in 2005, there will be no more "local" diplomas. A 1987 New York law requires an annual report from the Education Department coveringenrollment, student achievement, graduation and dropout rates, and other topics. This is known
as the School Report Card. Data tables accompanying these reports show numbers orpercentages of students statewide and by school district receiving certain score levels on tests.School Report Card data tables are being released about 9 months after the end of a school
year. Statewide percentages of grade enrollment receiving Regents examination scores inspecified ranges are shown in Table 6.
Table 6New York Regents Examination Scores, 1997 and 1998
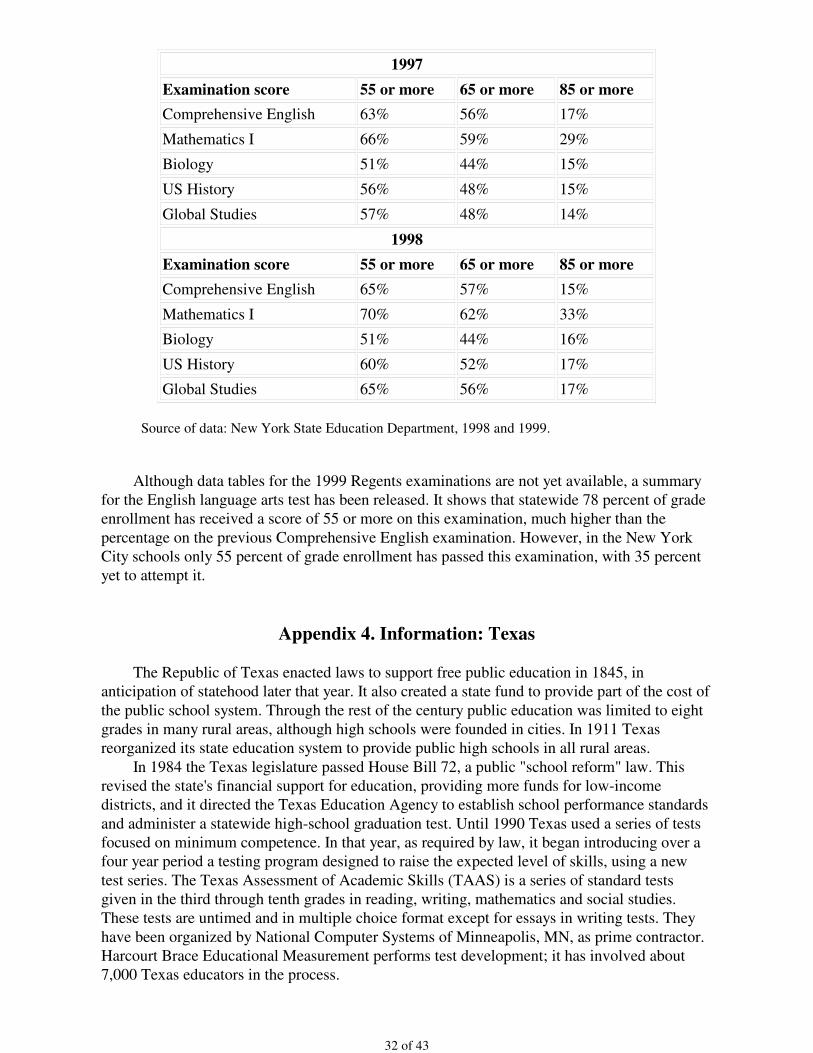
32 of 43
1997
Examination score 55 or more 65 or more 85 or more
Comprehensive English 63% 56% 17%
Mathematics I 66% 59% 29%
Biology 51% 44% 15%
US History 56% 48% 15%
Global Studies 57% 48% 14%
1998
Examination score 55 or more 65 or more 85 or more
Comprehensive English 65% 57% 15%
Mathematics I 70% 62% 33%
Biology 51% 44% 16%
US History 60% 52% 17%
Global Studies 65% 56% 17%
Source of data: New York State Education Department, 1998 and 1999.
Although data tables for the 1999 Regents examinations are not yet available, a summaryfor the English language arts test has been released. It shows that statewide 78 percent of gradeenrollment has received a score of 55 or more on this examination, much higher than the
percentage on the previous Comprehensive English examination. However, in the New YorkCity schools only 55 percent of grade enrollment has passed this examination, with 35 percentyet to attempt it.
Appendix 4. Information: Texas
The Republic of Texas enacted laws to support free public education in 1845, inanticipation of statehood later that year. It also created a state fund to provide part of the cost of
the public school system. Through the rest of the century public education was limited to eightgrades in many rural areas, although high schools were founded in cities. In 1911 Texasreorganized its state education system to provide public high schools in all rural areas.
In 1984 the Texas legislature passed House Bill 72, a public "school reform" law. Thisrevised the state's financial support for education, providing more funds for low-incomedistricts, and it directed the Texas Education Agency to establish school performance standards
and administer a statewide high-school graduation test. Until 1990 Texas used a series of testsfocused on minimum competence. In that year, as required by law, it began introducing over afour year period a testing program designed to raise the expected level of skills, using a new
test series. The Texas Assessment of Academic Skills (TAAS) is a series of standard testsgiven in the third through tenth grades in reading, writing, mathematics and social studies.These tests are untimed and in multiple choice format except for essays in writing tests. They
have been organized by National Computer Systems of Minneapolis, MN, as prime contractor.Harcourt Brace Educational Measurement performs test development; it has involved about7,000 Texas educators in the process.
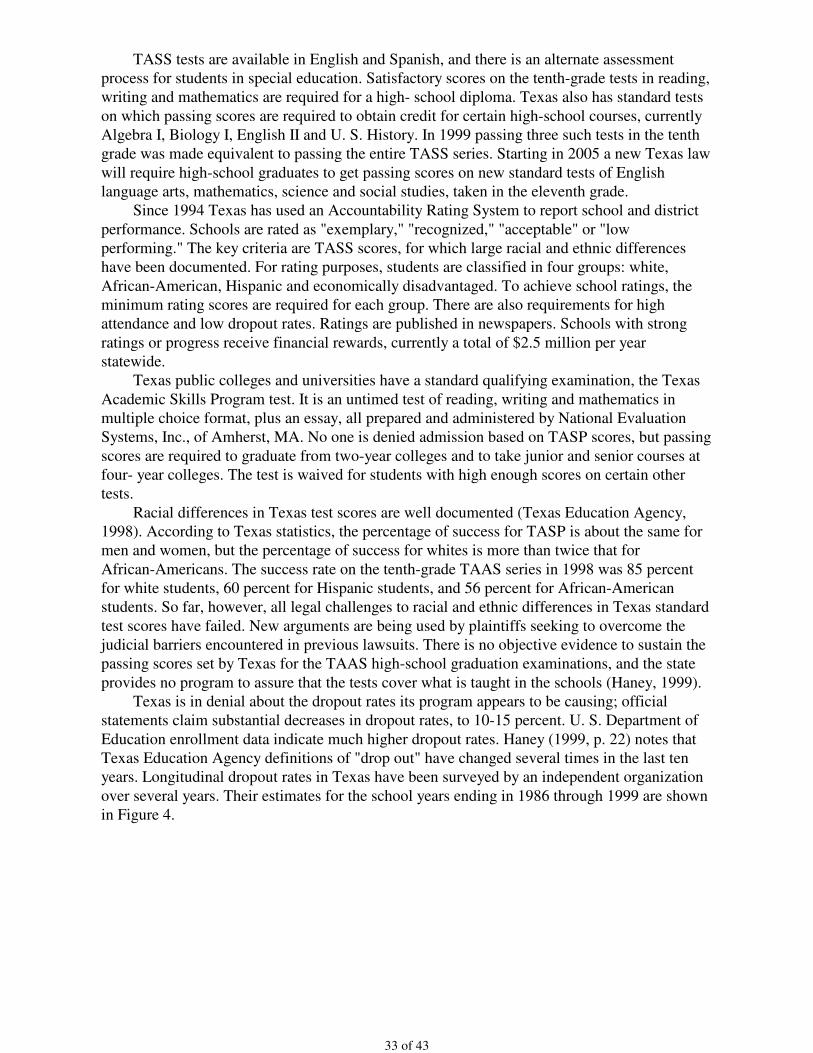
33 of 43
TASS tests are available in English and Spanish, and there is an alternate assessmentprocess for students in special education. Satisfactory scores on the tenth-grade tests in reading,writing and mathematics are required for a high- school diploma. Texas also has standard tests
on which passing scores are required to obtain credit for certain high-school courses, currentlyAlgebra I, Biology I, English II and U. S. History. In 1999 passing three such tests in the tenthgrade was made equivalent to passing the entire TASS series. Starting in 2005 a new Texas law
will require high-school graduates to get passing scores on new standard tests of Englishlanguage arts, mathematics, science and social studies, taken in the eleventh grade. Since 1994 Texas has used an Accountability Rating System to report school and district
performance. Schools are rated as "exemplary," "recognized," "acceptable" or "lowperforming." The key criteria are TASS scores, for which large racial and ethnic differenceshave been documented. For rating purposes, students are classified in four groups: white,
African-American, Hispanic and economically disadvantaged. To achieve school ratings, theminimum rating scores are required for each group. There are also requirements for highattendance and low dropout rates. Ratings are published in newspapers. Schools with strong
ratings or progress receive financial rewards, currently a total of $2.5 million per yearstatewide. Texas public colleges and universities have a standard qualifying examination, the Texas
Academic Skills Program test. It is an untimed test of reading, writing and mathematics inmultiple choice format, plus an essay, all prepared and administered by National EvaluationSystems, Inc., of Amherst, MA. No one is denied admission based on TASP scores, but passing
scores are required to graduate from two-year colleges and to take junior and senior courses atfour- year colleges. The test is waived for students with high enough scores on certain othertests.
Racial differences in Texas test scores are well documented (Texas Education Agency,1998). According to Texas statistics, the percentage of success for TASP is about the same formen and women, but the percentage of success for whites is more than twice that for
African-Americans. The success rate on the tenth-grade TAAS series in 1998 was 85 percentfor white students, 60 percent for Hispanic students, and 56 percent for African-Americanstudents. So far, however, all legal challenges to racial and ethnic differences in Texas standard
test scores have failed. New arguments are being used by plaintiffs seeking to overcome thejudicial barriers encountered in previous lawsuits. There is no objective evidence to sustain thepassing scores set by Texas for the TAAS high-school graduation examinations, and the state
provides no program to assure that the tests cover what is taught in the schools (Haney, 1999). Texas is in denial about the dropout rates its program appears to be causing; officialstatements claim substantial decreases in dropout rates, to 10-15 percent. U. S. Department of
Education enrollment data indicate much higher dropout rates. Haney (1999, p. 22) notes thatTexas Education Agency definitions of "drop out" have changed several times in the last tenyears. Longitudinal dropout rates in Texas have been surveyed by an independent organization
over several years. Their estimates for the school years ending in 1986 through 1999 are shownin Figure 4.
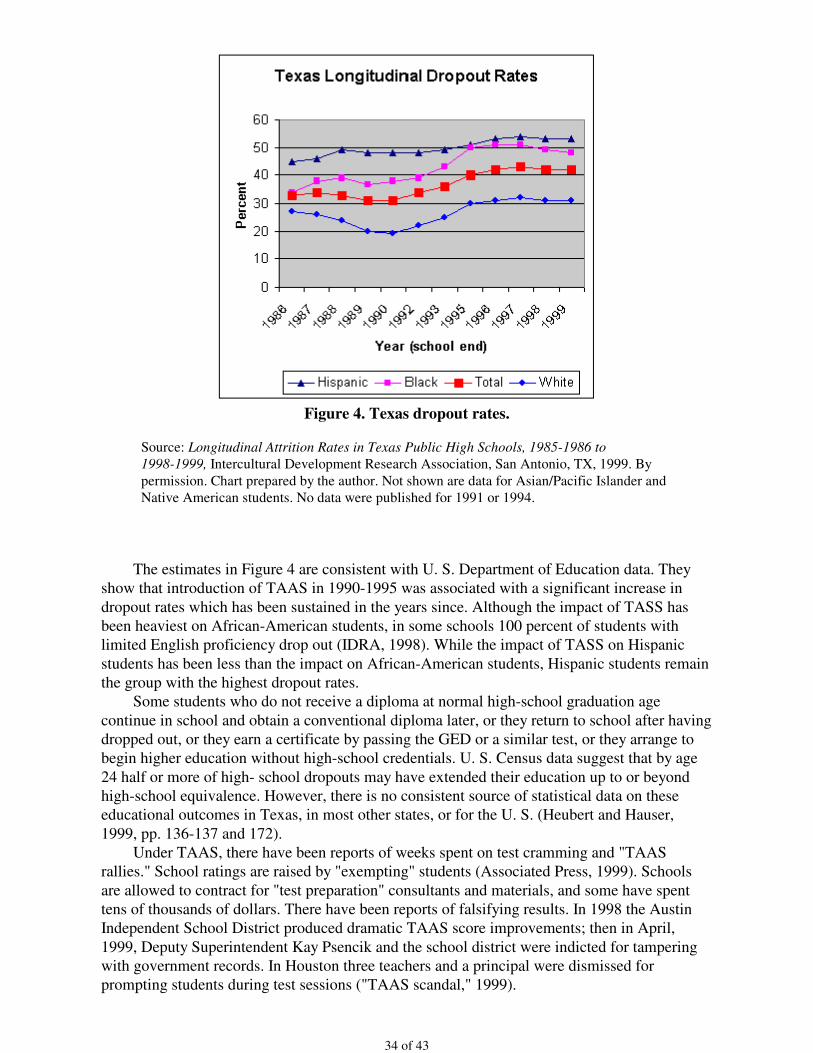
34 of 43
Figure 4. Texas dropout rates.
Source: Longitudinal Attrition Rates in Texas Public High Schools, 1985-1986 to
1998-1999, Intercultural Development Research Association, San Antonio, TX, 1999. By
permission. Chart prepared by the author. Not shown are data for Asian/Pacific Islander andNative American students. No data were published for 1991 or 1994.
The estimates in Figure 4 are consistent with U. S. Department of Education data. Theyshow that introduction of TAAS in 1990-1995 was associated with a significant increase in
dropout rates which has been sustained in the years since. Although the impact of TASS hasbeen heaviest on African-American students, in some schools 100 percent of students withlimited English proficiency drop out (IDRA, 1998). While the impact of TASS on Hispanic
students has been less than the impact on African-American students, Hispanic students remainthe group with the highest dropout rates. Some students who do not receive a diploma at normal high-school graduation age
continue in school and obtain a conventional diploma later, or they return to school after havingdropped out, or they earn a certificate by passing the GED or a similar test, or they arrange tobegin higher education without high-school credentials. U. S. Census data suggest that by age
24 half or more of high- school dropouts may have extended their education up to or beyondhigh-school equivalence. However, there is no consistent source of statistical data on theseeducational outcomes in Texas, in most other states, or for the U. S. (Heubert and Hauser,
1999, pp. 136-137 and 172). Under TAAS, there have been reports of weeks spent on test cramming and "TAASrallies." School ratings are raised by "exempting" students (Associated Press, 1999). Schools
are allowed to contract for "test preparation" consultants and materials, and some have spenttens of thousands of dollars. There have been reports of falsifying results. In 1998 the AustinIndependent School District produced dramatic TAAS score improvements; then in April,
1999, Deputy Superintendent Kay Psencik and the school district were indicted for tamperingwith government records. In Houston three teachers and a principal were dismissed forprompting students during test sessions ("TAAS scandal," 1999).
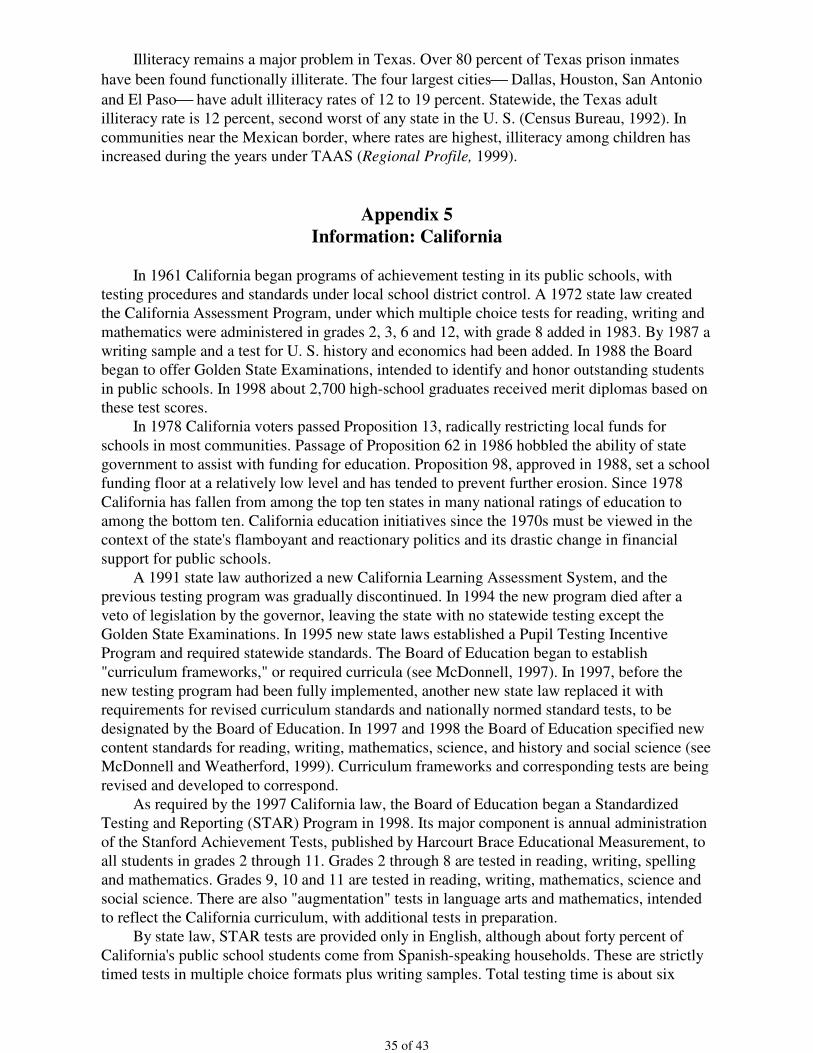
35 of 43
Illiteracy remains a major problem in Texas. Over 80 percent of Texas prison inmates
have been found functionally illiterate. The four largest cities Dallas, Houston, San Antonio
and El Paso have adult illiteracy rates of 12 to 19 percent. Statewide, the Texas adultilliteracy rate is 12 percent, second worst of any state in the U. S. (Census Bureau, 1992). In
communities near the Mexican border, where rates are highest, illiteracy among children hasincreased during the years under TAAS (Regional Profile, 1999).
Appendix 5Information: California
In 1961 California began programs of achievement testing in its public schools, withtesting procedures and standards under local school district control. A 1972 state law createdthe California Assessment Program, under which multiple choice tests for reading, writing and
mathematics were administered in grades 2, 3, 6 and 12, with grade 8 added in 1983. By 1987 awriting sample and a test for U. S. history and economics had been added. In 1988 the Boardbegan to offer Golden State Examinations, intended to identify and honor outstanding students
in public schools. In 1998 about 2,700 high-school graduates received merit diplomas based onthese test scores. In 1978 California voters passed Proposition 13, radically restricting local funds for
schools in most communities. Passage of Proposition 62 in 1986 hobbled the ability of stategovernment to assist with funding for education. Proposition 98, approved in 1988, set a schoolfunding floor at a relatively low level and has tended to prevent further erosion. Since 1978
California has fallen from among the top ten states in many national ratings of education toamong the bottom ten. California education initiatives since the 1970s must be viewed in thecontext of the state's flamboyant and reactionary politics and its drastic change in financial
support for public schools. A 1991 state law authorized a new California Learning Assessment System, and theprevious testing program was gradually discontinued. In 1994 the new program died after a
veto of legislation by the governor, leaving the state with no statewide testing except theGolden State Examinations. In 1995 new state laws established a Pupil Testing IncentiveProgram and required statewide standards. The Board of Education began to establish
"curriculum frameworks," or required curricula (see McDonnell, 1997). In 1997, before thenew testing program had been fully implemented, another new state law replaced it withrequirements for revised curriculum standards and nationally normed standard tests, to be
designated by the Board of Education. In 1997 and 1998 the Board of Education specified newcontent standards for reading, writing, mathematics, science, and history and social science (seeMcDonnell and Weatherford, 1999). Curriculum frameworks and corresponding tests are being
revised and developed to correspond. As required by the 1997 California law, the Board of Education began a StandardizedTesting and Reporting (STAR) Program in 1998. Its major component is annual administration
of the Stanford Achievement Tests, published by Harcourt Brace Educational Measurement, toall students in grades 2 through 11. Grades 2 through 8 are tested in reading, writing, spellingand mathematics. Grades 9, 10 and 11 are tested in reading, writing, mathematics, science and
social science. There are also "augmentation" tests in language arts and mathematics, intendedto reflect the California curriculum, with additional tests in preparation. By state law, STAR tests are provided only in English, although about forty percent of
California's public school students come from Spanish-speaking households. These are strictlytimed tests in multiple choice formats plus writing samples. Total testing time is about six
36 of 43
hours. Parents may exempt their children from testing. Test items are not being disclosed to thepublic. California public schools are forbidden by law to use test preparation materialsspecifically designed for these tests. Their use by parents who can afford them is not restricted.
In April, 1999, the California legislature passed and its governor signed a law called thePublic Schools Accountability Act. It requires the state to publish an Academic PerformanceIndex (API) annually for each public school. It also provides extra funding for low performing
schools and a system of awards for high performing schools. A total of $100 million wasappropriated for awards in 1999. The 1999 law also requires the Board of Education to developand administer promotion and graduation tests, starting in 2001. After three years, passing
scores will be required to enter high school and to obtain a high-school diploma. For 1999 the Board of Education defined the API on the basis of Stanford AchievementTest scores (California, 1999). It reflects student score ranks, weighted by subject content.
Weights for grades 2 through 8 are reading 30 percent, writing 15 percent, spelling 15 percent,and mathematics 40 percent. Weights for grades 9 through 11 are 20 percent each for reading,writing, mathematics, science and social science. A school with all students ranking in the top
20 percent of the distribution of scores will have an API of 1,000, while a school with allstudents ranking in the bottom 20 percent will have an API of 200. The 1999 API ratings forCalifornia public schools are summarized in the Figure 5:
Figure 5. California school ratings.
Source: Academic Performance Index School Rankings, 1999, California Department ofEducation, Sacramento, CA, January, 2000. Chart prepared by the author. Data were
grouped into the API ranges shown. Four schools were unrated.
The official goal is to raise all schools to an API of 800. Since the API is essentially
comparing scores with averages, this is a "Lake Wobegon" goal, to make "all the kids aboveaverage."
Appendix 6Performance Assessment
37 of 43
"Performance assessment is a broad term. It covers many different types of testingmethods that require students to demonstrate their competencies or knowledge by creating ananswer or product. It is best understood as a continuum of formats that range from the simplest
student-constructed responses to comprehensive demonstrations or collections of large bodiesof work over time. This [section] describes some common forms of performance assessment.
"Constructed-response questions require students to produce an answer to a question
rather than to select from an array of possible answers (as multiple-choice items do). Inconstructed-response items, questions may have just one correct answer or may be more openended, allowing a range of responses. The form can also vary: examples include answers
supplied by filling in a blank; solving a mathematics problem; writing short answers;completing figural responses (drawing on a figure like a graph, illustration, or diagram); orwriting out all the steps in a geometry proof.
"Essays have long been used to assess a student's understanding of a subject by having thestudent write a description, analysis, explanation, or summary in one or more paragraphs.Essays are used to demonstrate how well a student can use facts in context and structure a
coherent discussion. Answering essay questions effectively requires analysis, synthesis, andcritical thinking. Grading can be systematized by having subject matter specialists developguidelines for responses and set quality standards. Scorers can then compare each student's
essays against models that represent various levels of quality.
"Writing is the most common subject tested by performance assessment methods.
Although multiple-choice tests can assess some of the components necessary for good writing(spelling, grammar, and word usage), having students write is considered a morecomprehensive method of assessing composition skills. Writing enables students to
demonstrate composition skills-inventing, revising, and clearly stating one's ideas to fit thepurpose and the audience--as well as their knowledge of language, syntax, and grammar. Therehas been considerable research on the standardized and objective scoring of writing
assessments.
"Oral discourse was the earliest form of performance assessment. Before paper andpencil, chalk, and slate became affordable, school children rehearsed their lessons, recited their
sums, and rendered their poems and prose aloud. At the university level, rhetoric wasinterdisciplinary: reading, writing, and speaking were the media of public affairs. Todaygraduate students are tested at the master's and Ph.D. levels with an oral defense of
dissertations. But oral interviews can also be used in assessments of young children, wherewritten testing is inappropriate. An obvious example of oral assessment is in foreign languages:fluency can only be assessed by hearing the student speak. As video and audio make it possible
to record performance, the use of oral presentations is likely to expand.
"Exhibitions are designed as comprehensive demonstrations of skills or competence.They often require students to produce a demonstration or live performance in class or before
other audiences. Teachers or trained judges score performance against standards of excellenceknown to all participants ahead of time. Exhibitions require a broad range of competencies, areoften interdisciplinary in focus, and require student initiative and creativity. They can take the
form of competitions between individual students or groups, or may be collaborative projectsthat students work on over time.
"Experiments are used to test how well a student understands scientific concepts and can
carry out scientific processes. As educators emphasize increased hands-on laboratory work inthe science curriculum, they have advocated the development of assessments to test those skillsmore directly than conventional paper-and-pencil tests. A few states are developing
standardized scientific tasks or experiments that all students must conduct to demonstrateunderstanding and skills. Developing hypotheses, planning and carrying out experiments,writing up findings, using the skills of measurement and estimation, and applying knowledge of
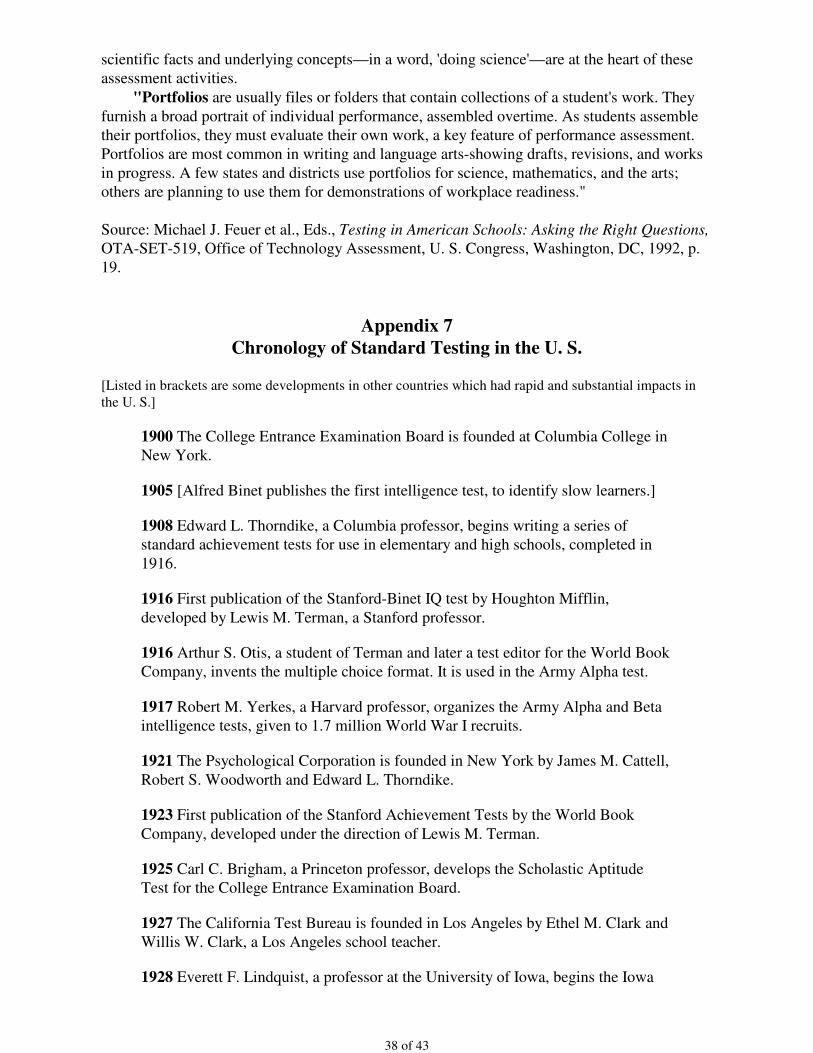
38 of 43
scientific facts and underlying concepts—in a word, 'doing science'—are at the heart of theseassessment activities.
"Portfolios are usually files or folders that contain collections of a student's work. They
furnish a broad portrait of individual performance, assembled overtime. As students assembletheir portfolios, they must evaluate their own work, a key feature of performance assessment.Portfolios are most common in writing and language arts-showing drafts, revisions, and works
in progress. A few states and districts use portfolios for science, mathematics, and the arts;others are planning to use them for demonstrations of workplace readiness."
Source: Michael J. Feuer et al., Eds., Testing in American Schools: Asking the Right Questions,
OTA-SET-519, Office of Technology Assessment, U. S. Congress, Washington, DC, 1992, p.19.
Appendix 7Chronology of Standard Testing in the U. S.
[Listed in brackets are some developments in other countries which had rapid and substantial impacts inthe U. S.]
1900 The College Entrance Examination Board is founded at Columbia College inNew York.
1905 [Alfred Binet publishes the first intelligence test, to identify slow learners.]
1908 Edward L. Thorndike, a Columbia professor, begins writing a series ofstandard achievement tests for use in elementary and high schools, completed in
1916.
1916 First publication of the Stanford-Binet IQ test by Houghton Mifflin,
developed by Lewis M. Terman, a Stanford professor.
1916 Arthur S. Otis, a student of Terman and later a test editor for the World BookCompany, invents the multiple choice format. It is used in the Army Alpha test.
1917 Robert M. Yerkes, a Harvard professor, organizes the Army Alpha and Betaintelligence tests, given to 1.7 million World War I recruits.
1921 The Psychological Corporation is founded in New York by James M. Cattell,
Robert S. Woodworth and Edward L. Thorndike.
1923 First publication of the Stanford Achievement Tests by the World Book
Company, developed under the direction of Lewis M. Terman.
1925 Carl C. Brigham, a Princeton professor, develops the Scholastic AptitudeTest for the College Entrance Examination Board.
1927 The California Test Bureau is founded in Los Angeles by Ethel M. Clark andWillis W. Clark, a Los Angeles school teacher.
1928 Everett F. Lindquist, a professor at the University of Iowa, begins the Iowa
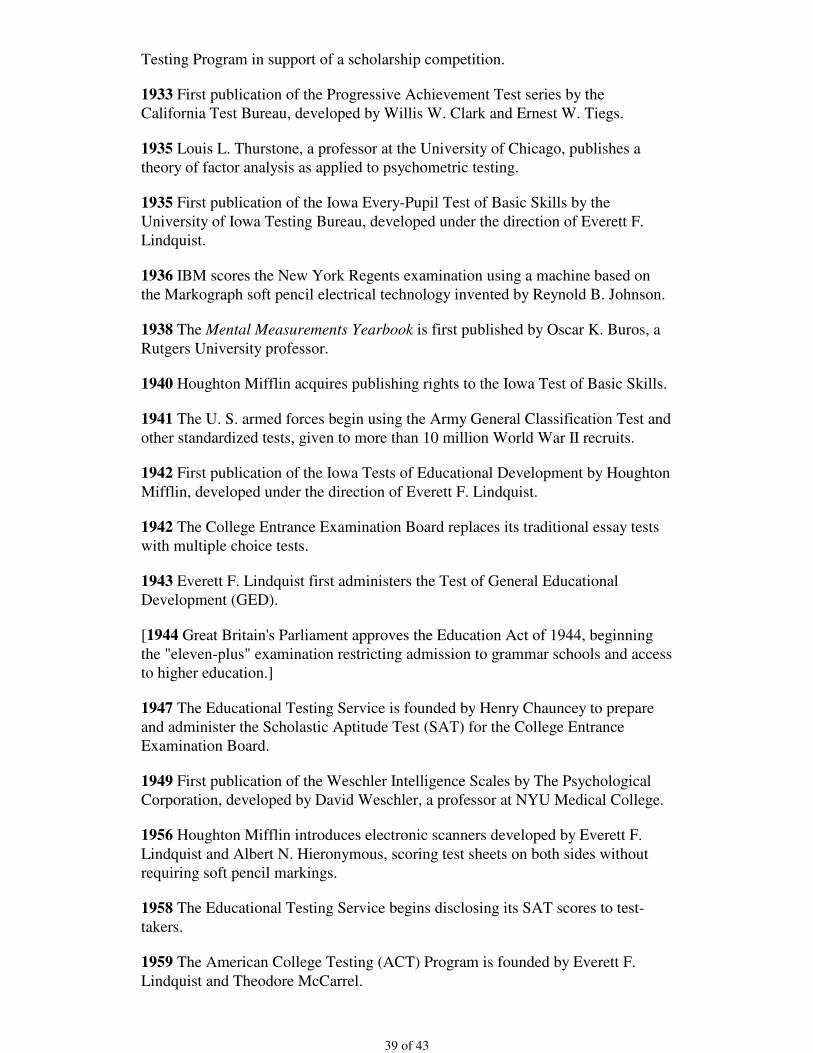
39 of 43
Testing Program in support of a scholarship competition.
1933 First publication of the Progressive Achievement Test series by theCalifornia Test Bureau, developed by Willis W. Clark and Ernest W. Tiegs.
1935 Louis L. Thurstone, a professor at the University of Chicago, publishes atheory of factor analysis as applied to psychometric testing.
1935 First publication of the Iowa Every-Pupil Test of Basic Skills by the
University of Iowa Testing Bureau, developed under the direction of Everett F.Lindquist.
1936 IBM scores the New York Regents examination using a machine based on the Markograph soft pencil electrical technology invented by Reynold B. Johnson.
1938 The Mental Measurements Yearbook is first published by Oscar K. Buros, a
Rutgers University professor.
1940 Houghton Mifflin acquires publishing rights to the Iowa Test of Basic Skills.
1941 The U. S. armed forces begin using the Army General Classification Test andother standardized tests, given to more than 10 million World War II recruits.
1942 First publication of the Iowa Tests of Educational Development by Houghton
Mifflin, developed under the direction of Everett F. Lindquist.
1942 The College Entrance Examination Board replaces its traditional essay testswith multiple choice tests.
1943 Everett F. Lindquist first administers the Test of General EducationalDevelopment (GED).
[1944 Great Britain's Parliament approves the Education Act of 1944, beginningthe "eleven-plus" examination restricting admission to grammar schools and accessto higher education.]
1947 The Educational Testing Service is founded by Henry Chauncey to prepare and administer the Scholastic Aptitude Test (SAT) for the College EntranceExamination Board.
1949 First publication of the Weschler Intelligence Scales by The PsychologicalCorporation, developed by David Weschler, a professor at NYU Medical College.
1956 Houghton Mifflin introduces electronic scanners developed by Everett F.
Lindquist and Albert N. Hieronymous, scoring test sheets on both sides withoutrequiring soft pencil markings.
1958 The Educational Testing Service begins disclosing its SAT scores to test-
takers.
1959 The American College Testing (ACT) Program is founded by Everett F.
Lindquist and Theodore McCarrel.
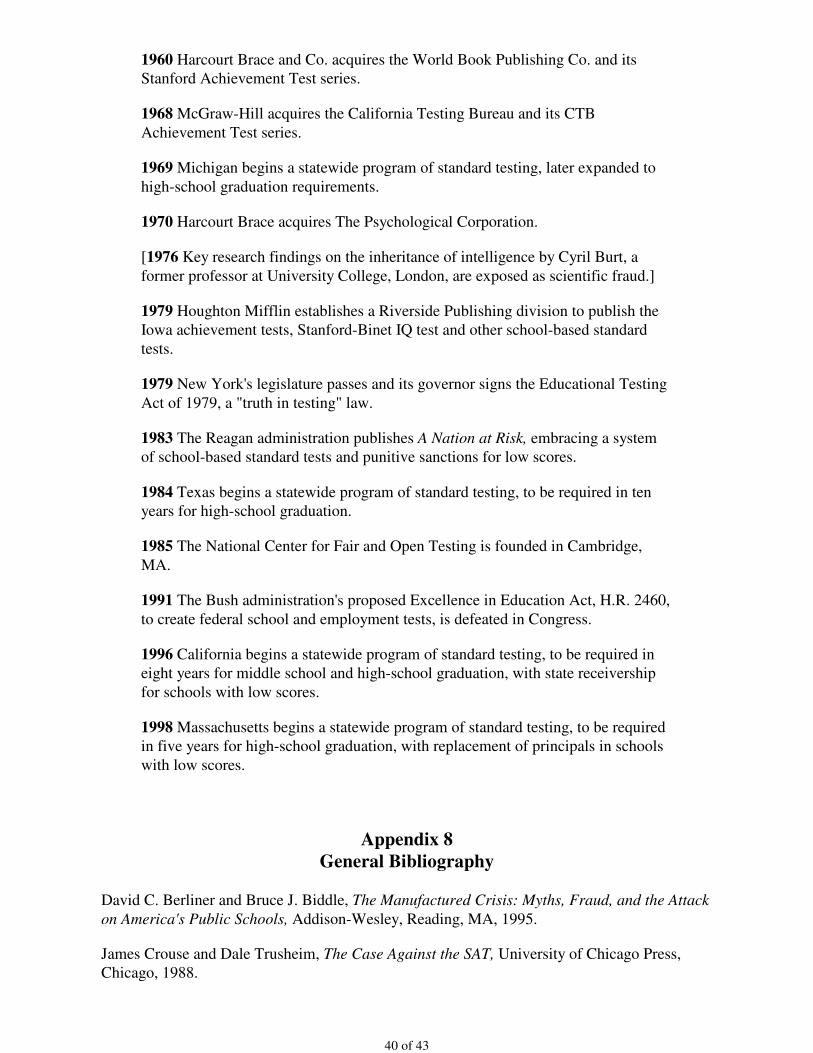
40 of 43
1960 Harcourt Brace and Co. acquires the World Book Publishing Co. and itsStanford Achievement Test series.
1968 McGraw-Hill acquires the California Testing Bureau and its CTB
Achievement Test series.
1969 Michigan begins a statewide program of standard testing, later expanded to
high-school graduation requirements.
1970 Harcourt Brace acquires The Psychological Corporation.
[1976 Key research findings on the inheritance of intelligence by Cyril Burt, a
former professor at University College, London, are exposed as scientific fraud.]
1979 Houghton Mifflin establishes a Riverside Publishing division to publish theIowa achievement tests, Stanford-Binet IQ test and other school-based standard
tests.
1979 New York's legislature passes and its governor signs the Educational Testing
Act of 1979, a "truth in testing" law.
1983 The Reagan administration publishes A Nation at Risk, embracing a systemof school-based standard tests and punitive sanctions for low scores.
1984 Texas begins a statewide program of standard testing, to be required in tenyears for high-school graduation.
1985 The National Center for Fair and Open Testing is founded in Cambridge,
MA.
1991 The Bush administration's proposed Excellence in Education Act, H.R. 2460,
to create federal school and employment tests, is defeated in Congress.
1996 California begins a statewide program of standard testing, to be required ineight years for middle school and high-school graduation, with state receivership
for schools with low scores.
1998 Massachusetts begins a statewide program of standard testing, to be requiredin five years for high-school graduation, with replacement of principals in schools
with low scores.
Appendix 8General Bibliography
David C. Berliner and Bruce J. Biddle, The Manufactured Crisis: Myths, Fraud, and the Attack
on America's Public Schools, Addison-Wesley, Reading, MA, 1995.
James Crouse and Dale Trusheim, The Case Against the SAT, University of Chicago Press,Chicago, 1988.
41 of 43
David A. Goslin, The Search for Ability: Standardized Testing in Social Perspective, Russell Sage Foundation, New York, 1963.
Stephen J. Gould, The Mismeasure of Man, W. W. Norton and Co., New York, 1981.
Robert L. Hayman, Jr., The Smart Culture: Society, Intelligence, and Law, New York University Press, New York, 1997.
Jay P. Heubert and Robert M. Hauser, Eds., High Stakes Testing for Tracking, Promotion and
Graduation, National Academy Press, Washington, DC, 1999.Banesh Hoffmann, The Tyranny of Testing, Crowell-Collier Publishing Co., New York, 1962.
National Center for Education Statistics (Jay R. Campbell, Kristin E. Voelkl and Patricia L.Donahue, Eds.), NAEP 1996 Trends in Academic Progress, NCES 97-985, U. S. Department ofEducation, Washington, DC, 1997.
Nicholas Lemann, The Big Test: The Secret History of the American Meritocracy, Farrar,
Straus and Giroux, New York, 1999.
Office of Technology Assessment (Michael J. Feuer et al., Eds.), Testing in American Schools:
Asking the Right Questions, OTA-SET-519, U. S. Congress, Washington, DC, 1992.
David Owen, None of the Above: Behind the Myth of Scholastic Aptitude, Houghton Mifflin, Boston, 1985. David Owen and Marilyn Doerr, None of the Above: Behind the Myth of
Scholastic Aptitude, Rowman and Littlefield Publishers, Lanham, MD, Revised and UpdatedEdition, 1999.
Tim B. Rogers, The Psychological Testing Enterprise: An Introduction, Brooks/Cole
Publishing Co., Pacific Grove, CA, 1995.
Peter Sacks, Standardized Minds: The High Price of America's Testing Culture and What We
Can Do to Change It, Perseus Books, Cambridge, MA, 1999.
David B. Tyack, The One Best System: A History of American Urban Education, Harvard University Press, Cambridge, MA, 1974.
Copyright 2000 by the Education Policy Analysis Archives
The World Wide Web address for the Education Policy Analysis Archives is epaa.asu.edu
General questions about appropriateness of topics or particular articles may beaddressed to the Editor, Gene V Glass, [email protected] or reach him at College
of Education, Arizona State University, Tempe, AZ 85287-0211.(602-965-9644). The Commentary Editor is Casey D. Cobb:[email protected] .
EPAA Editorial Board
42 of 43
Michael W. AppleUniversity of Wisconsin
Greg CamilliRutgers University
John CovaleskieNorthern Michigan University
Alan Davis University of Colorado, Denver
Sherman DornUniversity of South Florida
Mark E. FetlerCalifornia Commission on Teacher Credentialing
Richard [email protected]
Thomas F. GreenSyracuse University
Alison I. GriffithYork University
Arlen GullicksonWestern Michigan University
Ernest R. HouseUniversity of Colorado
Aimee HowleyOhio University
Craig B. HowleyAppalachia Educational Laboratory
William HunterUniversity of Calgary
Daniel KallósUmeå University
Benjamin LevinUniversity of Manitoba
Thomas Mauhs-PughGreen Mountain College
Dewayne MatthewsWestern Interstate Commission for HigherEducation
William McInerneyPurdue University
Mary McKeown-MoakMGT of America (Austin, TX)
Les McLeanUniversity of Toronto
Susan Bobbitt NolenUniversity of Washington
Anne L. [email protected]
Hugh G. PetrieSUNY Buffalo
Richard C. RichardsonNew York University
Anthony G. Rud Jr.Purdue University
Dennis SayersAnn Leavenworth Center
for Accelerated Learning
Jay D. ScribnerUniversity of Texas at Austin
Michael [email protected]
Robert E. Stake University of Illinois—UC
Robert StonehillU.S. Department of Education
David D. WilliamsBrigham Young University
EPAA Spanish Language Editorial Board
Associate Editor for Spanish LanguageRoberto Rodríguez Gómez
Universidad Nacional Autónoma de México
Adrián Acosta (México)Universidad de [email protected]
J. Félix Angulo Rasco (Spain)Universidad de Cá[email protected]
43 of 43
Teresa Bracho (México)Centro de Investigación y DocenciaEconómica-CIDE
bracho dis1.cide.mx
Alejandro Canales (México) Universidad Nacional Autónoma deMéxico
Ursula Casanova (U.S.A.)Arizona State [email protected]
José Contreras DomingoUniversitat de Barcelona [email protected]
Erwin Epstein (U.S.A.)Loyola University of Chicago
Josué González (U.S.A.)Arizona State University
Rollin Kent (México)Departamento de Investigación
Educativa-DIE/[email protected] [email protected]
María Beatriz Luce (Brazil)Universidad Federal de Rio Grande do
Javier Mendoza Rojas (México)Universidad Nacional Autónoma deMéxico
Marcela Mollis (Argentina)Universidad de Buenos [email protected]
Humberto Muñoz García (México)Universidad Nacional Autónoma deMéxico
Angel Ignacio Pérez Gómez (Spain)Universidad de Má[email protected]
Daniel Schugurensky(Argentina-Canadá)OISE/UT, Canada
Simon Schwartzman (Brazil)Fundação Instituto Brasileiro e Geografia
e Estatística [email protected]
Jurjo Torres Santomé (Spain)Universidad de A Coruña
Carlos Alberto Torres (U.S.A.)University of California, Los Angeles