Healthcare Cost and Impact of Persistent Orofacial Pain
55
Northumbria Research Link Citation: Durham, Justin, Shen, Jing, Breckons, Matthew, Steele, Jimmy, Araújo-Soares, Vera, Exley, Catherine and Vale, Luke (2016) Healthcare Cost and Impact of Persistent Orofacial Pain. Journal of Dental Research, 95 (10). pp. 1147-1154. ISSN 0022-0345 Published by: SAGE URL: http://dx.doi.org/10.1177/0022034516648088 <http://dx.doi.org/10.1177/0022034516648088> This version was downloaded from Northumbria Research Link: http://nrl.northumbria.ac.uk/id/eprint/29828/ Northumbria University has developed Northumbria Research Link (NRL) to enable users to access the University’s research output. Copyright © and moral rights for items on NRL are retained by the individual author(s) and/or other copyright owners. Single copies of full items can be reproduced, displayed or performed, and given to third parties in any format or medium for personal research or study, educational, or not-for-profit purposes without prior permission or charge, provided the authors, title and full bibliographic details are given, as well as a hyperlink and/or URL to the original metadata page. The content must not be changed in any way. Full items must not be sold commercially in any format or medium without formal permission of the copyright holder. The full policy is available online: http://nrl.northumbria.ac.uk/policies.html This document may differ from the final, published version of the research and has been made available online in accordance with publisher policies. To read and/or cite from the published version of the research, please visit the publisher’s website (a subscription may be required.)
-
Upload
khangminh22 -
Category
Documents
-
view
4 -
download
0
Transcript of Healthcare Cost and Impact of Persistent Orofacial Pain

Northumbria Research Link
Citation: Durham, Justin, Shen, Jing, Breckons, Matthew, Steele, Jimmy, Araújo-Soares,Vera, Exley, Catherine and Vale, Luke (2016) Healthcare Cost and Impact of PersistentOrofacial Pain. Journal of Dental Research, 95 (10). pp. 1147-1154. ISSN 0022-0345
Published by: SAGE
URL: http://dx.doi.org/10.1177/0022034516648088<http://dx.doi.org/10.1177/0022034516648088>
This version was downloaded from Northumbria Research Link:http://nrl.northumbria.ac.uk/id/eprint/29828/
Northumbria University has developed Northumbria Research Link (NRL) to enable usersto access the University’s research output. Copyright © and moral rights for items onNRL are retained by the individual author(s) and/or other copyright owners. Single copiesof full items can be reproduced, displayed or performed, and given to third parties in anyformat or medium for personal research or study, educational, or not-for-profit purposeswithout prior permission or charge, provided the authors, title and full bibliographicdetails are given, as well as a hyperlink and/or URL to the original metadata page. Thecontent must not be changed in any way. Full items must not be sold commercially in anyformat or medium without formal permission of the copyright holder. The full policy isavailable online: http://nrl.northumbria.ac.uk/policies.html
This document may differ from the final, published version of the research and has beenmade available online in accordance with publisher policies. To read and/or cite from thepublished version of the research, please visit the publisher’s website (a subscriptionmay be required.)
1
Healthcare cost & impact of persistent orofacial pain: DEEP Study’s cohort J.Durham1,2, NIHR Clinician Scientist & Senior Lecturer in Oral Surgery and Orofacial Pain J. Shen2, Senior Research Associate in Health Economics M. Breckons2, Research Associate JG Steele1,3, Professor of Oral Health Services Research V Araujo-Soares3, Senior Lecturer in Health Psychology C Exley3, Professor of Qualitative Health Research L Vale2, Health Foundation Chair in Health Economics
1Centre for Oral Health Research & Institute of Health & Society School of Dental Sciences Framlington Place Newcastle University NE2 4BW UK [email protected] Tel: +44 (0)191 208 6000 Fax: +44 (0)191 208 6137 2Health Economics Group Institute of Health & Society The Baddiley-Clark Building Richardson Road Newcastle upon Tyne NE2 4AX 3Institute of Health & Society The Baddiley-Clark Building Richardson Road Newcastle upon Tyne NE2 4AX Keywords: Chronic pain, Facial pain, Orofacial pain, Healthcare utilization, Cost analysis, Graded Chronic Pain Scale Word count: 3338 References: 40 Figures: 1 Tables: 4 E-appendix with supplemental data and tables.
Funding: This study and JD are funded by a NIHR Clinician Scientist award (NIHR-CS-011-003). The views expressed in this publication are those of the author (s) and not necessarily those of the NHS, the National Institute for Health Research, or the Department of Health in the United Kingdom. The authors have no conflicts of interest to declare.
Conflicts of interest All authors have completed the Unified Competing Interest form at www.icmje.org/coi_disclosure.pdf (available on request from the corresponding author) and declare that (1) All authors have support from no commercial companies for the submitted work; (2) No authors have relationships with companies that might have an interest in the submitted work in the previous 3 years; (3) their spouses, partners, or children have no financial relationships that may be relevant to the submitted work; and (4) All authors have no non-financial interests that may be relevant to the submitted work

2
3
Abstract
Few data are available on the healthcare costs of those suffering from
persistent orofacial pain (POFP). This cohort and cost analysis study
examined the direct costs of POFP from the perspective of the health care
provider (specifically, the UK NHS) in 2012 pounds sterling and sought to
identify if dichotomised (high [IV-IIb]; low [IIa-0]) graded chronic pain scale
(GCPS) status is predictive of the total cost of healthcare over the last six
months. The healthcare utilisation of 198 patients with POFP were collected
using a structured interview and validated “use of services and productivity”
questionnaire. Unit costs were used with these utilisation data to calculate
direct healthcare costs in three categories: consultation; medication;
appliances and interventions. Consultation costs were a significant proportion
of cumulative healthcare cost (p<0.001). Dichotomised GCPS status was
predictive of increased healthcare cost over the last six months accounting for
an average increase of £366 (95%CI: 135 - 598. p<0.01) when moving from a
low GCPS status to a high GCPS status. Given dichotomised GCPS status’
predictive capability and the success of stratified models of care for other
persistent pain conditions dichotomised GCPS status may offer an opportunity
to help determine stratification of care for patients with POFP.
Perspective:
This study identifies the high demand on healthcare services from POFP
patients mediated by the large number of consultations undergone and that
dichotomised GCPS might help screen patients in a stratified care model and

4
thereby focus care and allocate healthcare resources more efficiently,
irrespective of who pays the healthcare provider’s costs.
5
Introduction
Persistent orofacial pain (POFP) is used to describe a group of
heterogeneous illnesses including: Temporomandibular disorders, Burning
Mouth Syndrome, Persistent Dentoalveolar Pain, Trigeminal Neuralgia,
Atypical Facial pain (Persistent idiopathic facial pain) (Macfarlane et al. 2001;
De Leeuw and Klasser 2013). Given POFP’s nature and range of symptoms it
can present to either medicine or dentistry and may need management from
both (Madland and Feinmann 2001). POFP frequently becomes a chronic
illness and can be difficult to manage exerting major impacts on health and
quality of life (Shueb et al. 2015).
Management of chronic illnesses is subject to long-term use of healthcare
services, but there are always only finite amounts of resources available to
provide these services. The use of resources in one particular manner
precludes their use in other desirable ways. The benefits forgone represent
the opportunity cost, or economic cost, of using resources (Drummond et al.
2005). Opportunity costs can be estimated by valuing the use of services in
monetary terms. Costs themselves can be directly (e.g. medication costs) or
indirectly incurred (e.g. travel costs) related to healthcare. Knowledge of the
costs incurred provides a baseline to consider whether changing the manner
in which resources are used will be worth the benefits that might be provided;
for example, changing the way POFP patients access or receive healthcare to

6
improve the effectiveness and efficiency of the services used and perhaps
even recommend different levels of use of services (and hence cost) on the
basis of predicted need. A good example of how predicted need might be
established is through the use of the graded chronic pain scale (GCPS). The
GCPS status and its dichotomisation has been shown to help inform the type,
and extent, of therapeutic intervention required for persistent pain (Von Korff
et al. 1992; Dworkin et al. 2002; Von Korff and Dunn 2008; Manfredini et al.
2013; Kotiranta et al. 2015). The dichotomisation of the GCPS may offer a
screening instrument to help determine care pathways, or resource allocation,
for patients.
Currently, few and limited data are available on POFP patients’ healthcare
costs (Glaros et al. 1995; Shimshak et al. 1997; White et al. 2001) and/or
GCPS status, making it hard to predict whether potential changes in the
provision of care (and hence costs) are worthwhile. As part of a larger
programme of research addressing this need (DEEP study
http://research.ncl.ac.uk/deepstudy (Durham et al. 2014)), this paper
examines the direct costs of POFP using UK healthcare utilisation data. The
study aims to identify the major components of healthcare cost and if
dichotomised GCPS status (Von Korff et al. 1992; Dworkin et al. 2002) is
predictive of total cost of healthcare in the last six months.
7
Methods
The DEEP study received ethical approval (NRES Reference: 12/YH/0338)
and its methods are summarised below. An online open access protocol is
also available (Durham et al. 2014).
Sample
An a priori sample size of 200 was determined (α=0.05) in order to detect,
with 80% power, a moderate effect size of 0.4 (Cohen 1988) between groups
using two-tailed inferential statistics. This sample size allows the use of
regression analyses in order to examine up to thirty predictors of costs of
managing POFP at a moderate effect size (α=0.05; β=0.8) (Green 1991). The
a priori predictor of interest derived from the literature was dichotomised
graded chronic pain status, given its prognostic validity and role in helping
determine appropriate treatment regimens (Von Korff et al. 1992; Von Korff
and Dunn 2008; Manfredini et al. 2013; Kotiranta et al. 2015).
To allow for a 20% attrition rate through loss to follow-up and non-response,
the target was to recruit 240 individuals from primary (community) and
secondary (hospital/specialist) based settings across the North-East of
England (Durham et al. 2014).
To be eligible for the study individuals must:
• Have orofacial pain for three months or more
• Screen positive as having a musculoskeletal, and or
neuropathic/vascular origin to their pain (Hapak et al. 1994; Gonzalez
et al. 2011)

8
• Be over 18 years of age
• Be able to give informed consent in English.
Exclusion criteria were that an individual:
• Screened as only suffering from Dentoalveolar pain
• Had insufficient knowledge of English to be able to complete reliable
consent or data collection.
Measures and instruments
Six instruments completed by participants are reported here: EQ-5D-5L for
generic quality of life (Herdman et al. 2011); Graded Chronic Pain Scale
(GCPS (Von Korff et al. 1992)); Multidimensional Pain inventory (MPI Version
3 (Kerns et al. 1985)); Patient Health Questionnaire 4 (PHQ-4 (Kroenke et al.
2009)); Use of services and productivity questionnaire (USPQ (Wordsworth
and Thompson 2001)); Illness Perceptions Questionnaire (IPQ-R (Moss-
Morris et al. 2002)). Full descriptions, scoring instructions, and interpretation
guides for each instrument are provided in the e-appendix.
Dichotomised GCPS status was generated by calculating the standard five
point ordinal GCPS rating (0 to IV in order of ascending disability) and
applying the algorithm provided by Dworkin et al (Dworkin et al. 2002) to
subdivide Grade II into II “high disability” (IIb) or II “low disability” (IIa). This
algorithm converts the five point standard GCPS rating into six points and
allows dichotomisation into low GCPS (grades 0-IIa) and high GCPS (grades
IIb-IV) states.
9
Procedures and data collection
Primary care recruitment occurred from 10 dental practices and 25 medical
practices, representative of all deciles of the index of multiple deprivation
index (UK multifactorial deprivation measure). Secondary care recruitment
occurred at specialist clinics in neurology, oral and maxillofacial surgery,
dental emergency clinics, oral medicine and restorative dentistry. All recruiting
centres used a standardised proforma to refer individuals to the study whom
they felt would fit the appropriate inclusion criteria. Upon receipt of the
proforma the research team undertook a standardised approach to screening
and then recruitment (Durham et al. 2014).
Eligibility screening used validated self-complete screening questionnaires
(Hapak et al. 1994; Gonzalez et al. 2011) to identify the origin of the
participants’ pain complaint as either musculoskeletal (sensitivity 63.1%;
specificity 85.9%), neuropathic/vascular (sensitivity 66.3%; specificity 96.8%),
or a combined origin if the instruments used could not definitively distinguish
between origins. Individuals screening positive were invited to participate in
the study, informed written consent taken, and their screening group was then
used as their pain origin for the analyses. Those screening negative were
thanked for their interest and took no further part in the study unless a clinical
diagnosis was available from a specialist clinician that suggested this was a
false negative in which case they were included and assigned a grouping in
accordance with their specialist’s clinical diagnosis.
10
Initial data collection was by trained interviewers who conducted baseline,
structured interviews with questions relating to the individual’s: employment;
education level; duration of pain; gross monthly income; numbers and details
of healthcare contacts and treatments received. The reference period for
these questions was the duration of the pain complaint up to the interview.
Interviewers systematically examined the individual’s account of events over
the duration of their complaint and recorded the data on a standardised
proforma. These interview data allowed the estimation of healthcare utilisation
and, in combination with healthcare unit costs, the per annum cost of the
POFP condition over the duration of the complaint.
In contrast, the healthcare utilisation of the patient over the last six months
were specifically examined using the USPQ and these data in combination
with the healthcare unit costs allowed the calculation of the healthcare costs
over the last six months. The USPQ was issued along with all other study
instruments following the interview.
Data analyses
Estimation of costs
Costs of POFP to healthcare providers were grouped into three broad
categories: consultation costs (visits to healthcare professional for
discussion); medication costs; appliance (dental/surgical) and intervention
(dental/medical/surgical) costs. All costs are at 2012 prices in pounds Sterling;
the year the DEEP study started. Unit costs and sources used are detailed in
11
the supplemental e-appendix (Table S1, supplemental appendix), briefly
described below.
All unit costs were multiplied against appropriate healthcare utilisation data
either from the USPQ, to calculate the last six months costs, or data gathered
in the structured interview, to calculate the total cost up to entry into the study.
Per annum costs were then calculated by dividing the total cost up to entry
into the study by the participant’s duration of pain.
Dental primary care consultation unit costs were based on the average
consultation time in primary care, the British Dental Association’s standard
contract for primary care and the 2012/13 dental earnings national report
(HSCIC 2014). Other medical and allied health professionals’ consultation unit
costs in primary care were calculated using the Personal Social Services
Research Unit’s (PSSRU) unit costs for healthcare (2012). Secondary care
consultation unit costs were identified from the NHS reference costs for the
financial year 2011-2012 (DoH 2012).
Non-proprietary medication dosing regimens were multiplied against price
data from the British National Formulary (Joint Formulary Committee 2012)
and do not include pharmacy charges to the patient.
12
Primary dental care appliance and intervention unit costs were calculated
using the number of units of dental activity (UDA) specified in the dental
contract (NHS 2005) for the item of treatment reported multiplied by the
average UDA cost (£25.61) for England and Wales in 2012 (personal
communication from the British Dental Association via freedom of information
request from the U.K. Department of Health in 2012). All participants paid a
proportion of the burden of the total cost of the dental care with the state.
Other medical and allied health professionals’ appliance and intervention unit
costs were calculated using the PSSRU unit costs for healthcare (2012).
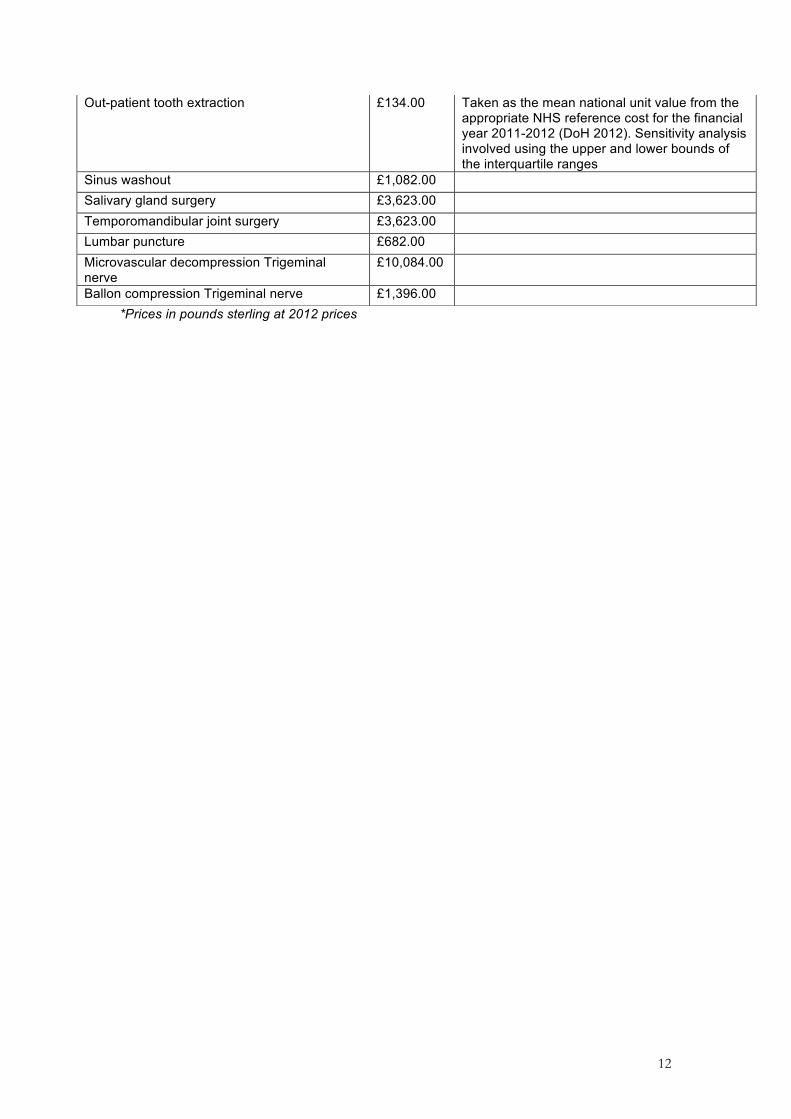
Secondary care treatment unit costs were taken as the mean unit value from
the appropriate NHS reference cost for the financial year 2011-2012 (DoH
2012). Secondary care dental costs for hard stabilisation and soft splints were
not available in the reference costs and were obtained from a local hospital.
Statistical procedures
STATA version 13 was used for all analyses (Stata Statistical Software.
StataCorp LP, College Station, TX, USA). Standard descriptive statistics were
calculated. Parametric inferential statistical tests were used to examine
differences in impact of pain between the dichotomised high and low GCPS
groups and also in the analysis of drop-out from the study. Bootstrapping
using the bias corrected accelerated method with 1000 repetitions was
conducted to produce confidence intervals around the point estimate of the
mean total cost and three cumulative cost categories: consultations,
medication, and appliance and intervention costs. A bootstrapped one-way
ANOVA was then used to examine differences between costs in the three
13
cumulative cost categories in line with recommended practice for cost data
(Barber and Thompson 2004).
Scatter plots were used to examine outliers and crosscheck validity of data
entry. Different functional forms of regression were tested (linear and log-
linear), but the best performing model, as would be expected and
recommended as best practice by the literature (Mihaylova et al. 2011), was a
generalised gamma linear model (GLM) using an identify link function. This
GLM model was used to examine the relationship between total cost over the
last six months and the dichotomised GCPS status, controlling for
demographic and socioeconomic factors. A modified park test was used to
confirm the family for the generalised linear model.
Deterministic sensitivity analyses (DSA) were conducted on variables where
there could be uncertainty over the unit costs: primary dental care
consultation costs, and secondary care consultation and treatment costs. DSA
used alternate higher and lower values for the unit costs in order to
recalculate the total cost at its highest and lowest plausible values. In the case
of those variables calculated from healthcare reference costs, the upper and
lower quartile values were used as the basis for the DSA (DoH 2012). For all
other variables one standard deviation, as given by the source used (e-
appendix – table S1), was used to explore the range of cost for the DSA.
In the instruments used in the study there were no missing data in the GCPS
or the MPI. EQ-5D-5L had five singular missing data points (0.5%) and these
were imputed. PHQ-4 had missing data in 10 individuals and therefore the
14
summary score was incalculable. IPQ-R had 3% of data missing across all
domains after imputation per domain there were five to seven participants per
domain where domain scores could not be calculated (>1 missing item).
Imputation procedures are explained in the e-appendix.
The present report follows the STROBE statement regarding cohort studies
(von Elm et al. 2007).

15
Results
From a total of 387 individuals referred for eligibility screening by the
participating centres (Durham et al. 2014), 279 (72%) agreed to be screened.
There was no significant difference in age (t(366)=1.24; p=0.215; 95%CI
difference -1.52, 6.73years) or gender (X2(1, n=386)=0.66; p=0.261) between
those declining the invitation to be screened and those who accepted the
invitation.
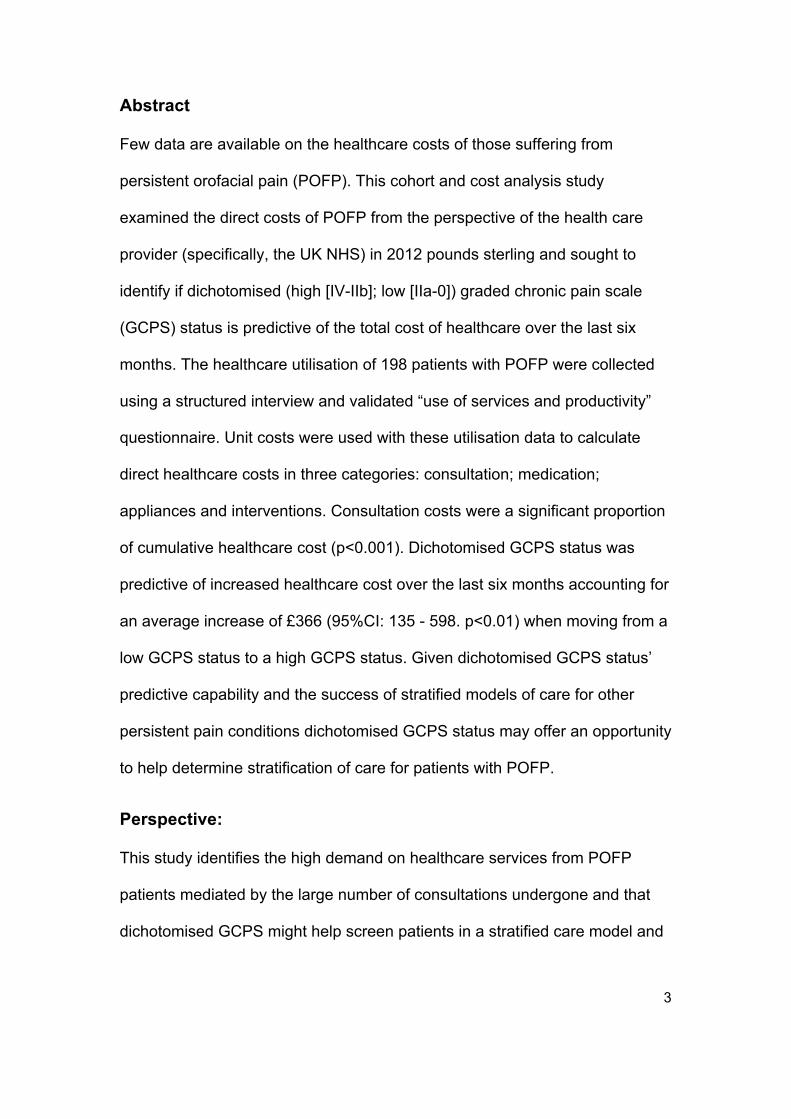
Figure 1 demonstrates the flow of participants and dropout rates through the
study following screening. The final 198 participants used for this study did not
differ significantly in gender (X2(1, n=239)=0.20; p=0.658), ethnicity
(F(6,232)=0.16; p=0.988), duration (t(237)=1.43; p=0.154; 95%CI difference -
12.12,76.65months) or origin of pain (F(2,236)=2.13; p=0.122) from those
who dropped out. Those participating were, however, older than those who
dropped out (t(237)=3.78; p<0.01; 95%CI difference 5.28,16.87years).
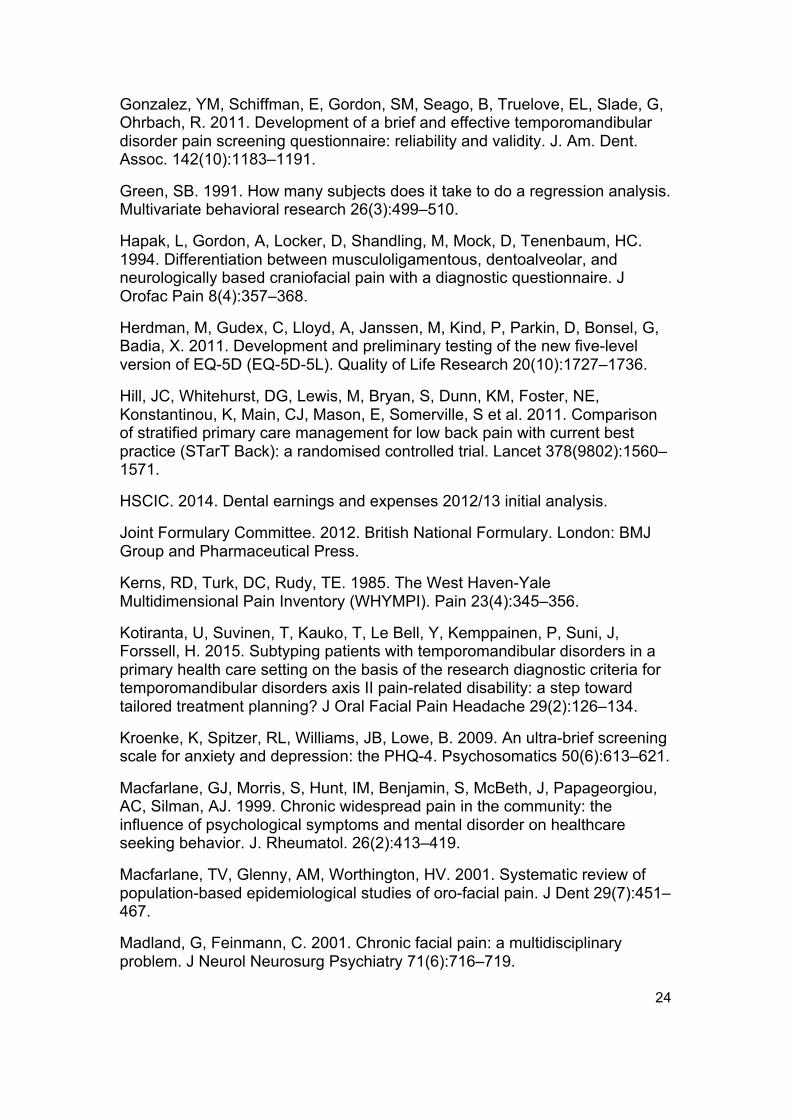
Females made up the majority of those recruited (81%) and the most frequent
screening result for the pain’s origin was musculoskeletal (43%, Table 1). The
majority of the sample were in employment (59%, Table 1) with the mean
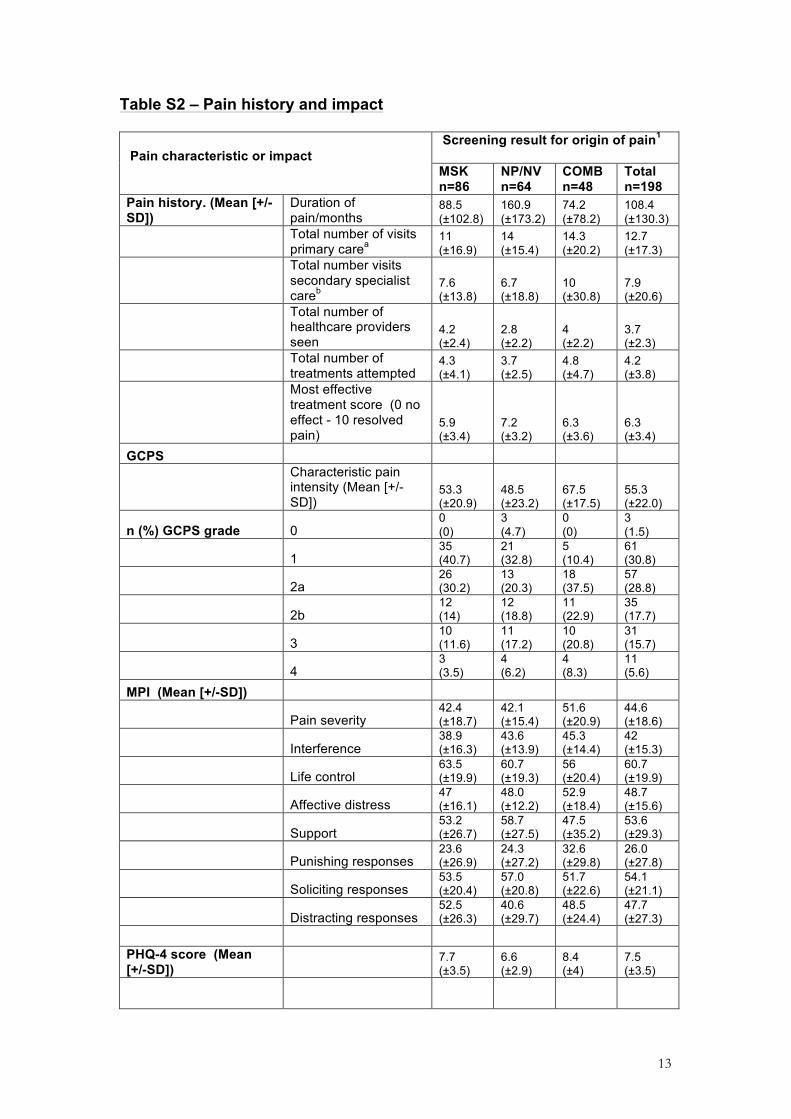
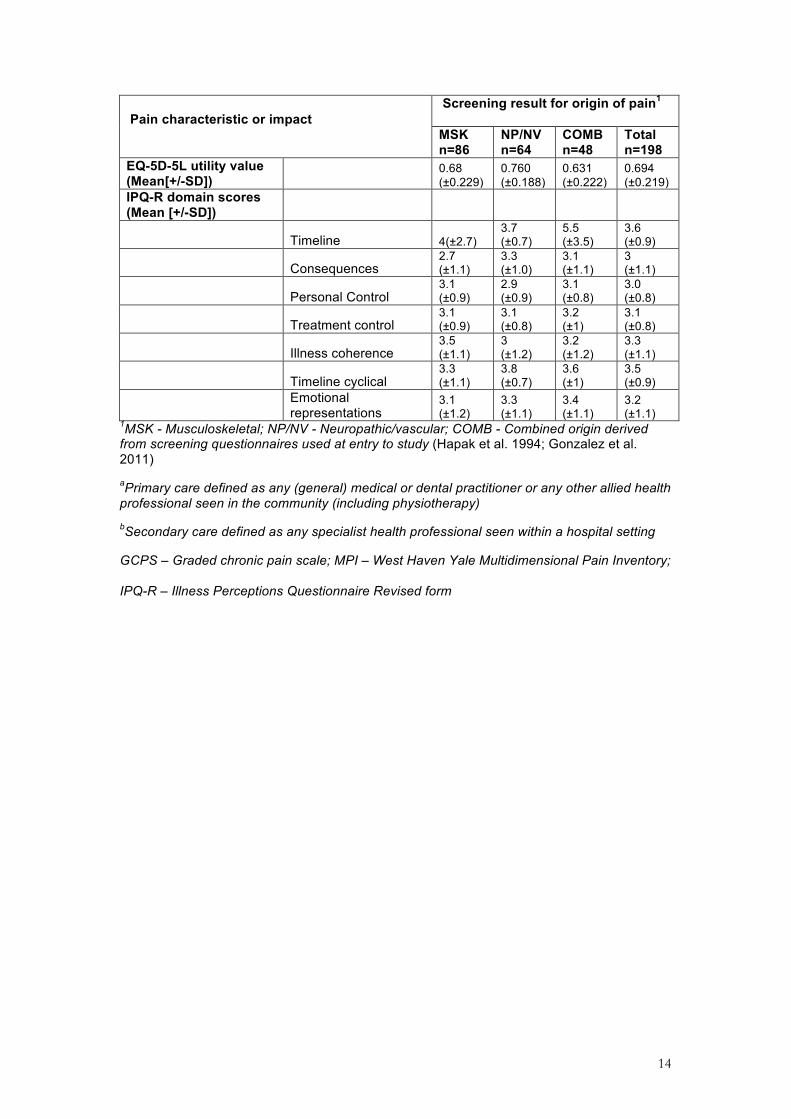
monthly gross salary being £940 (±1018 s.d.). Table S2 details the pain’s
history and impact demonstrating that the participants had a variable duration
of pain with a mean duration of 108.4 (±130.3 s.d.) months and over this
period they had consulted on average 4 healthcare professionals (±2 s.d.) in
16
relation to their complaint with most (93%) having experienced at least one
treatment for their pain.
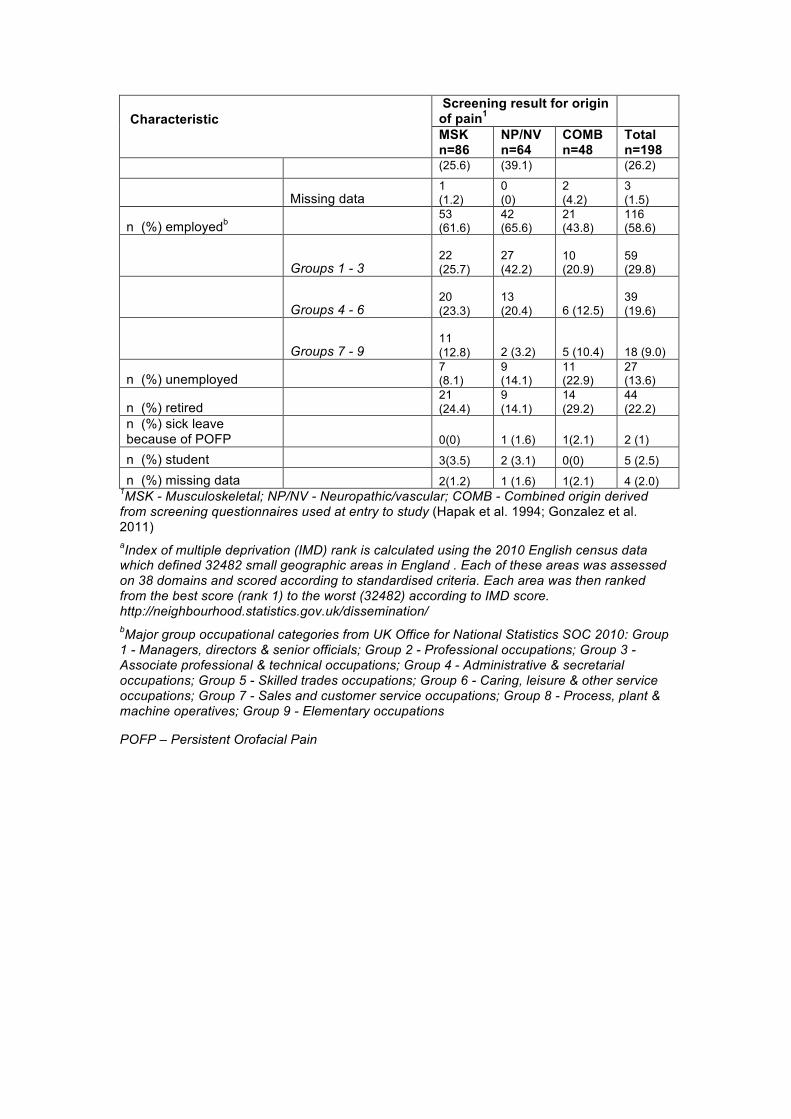
Table 2 demonstrates healthcare costs since the complaint began with a
significant difference evident between consultation, medication, and appliance
and intervention costs. Consultation costs were significantly higher than both
of the other two cost categories in both the per annum (F(2,591)=71.08
P<0.001) and last six month’s (F(2,591)=70.30; P<0.001) costs and therefore
accounted for the largest proportion of the cumulative healthcare cost.
The deterministic sensitivity analyses, which varied the unit costs to account
for uncertainties over the costs of some variables, suggests that the lowest
plausible total mean cost per annum is £292 (95%CI: 239 - 345) and the
highest is £473 (95%CI: 383 - 563). Similarly the lowest plausible total mean
cost over the last six months is £544 (95%CI: 455 - 634) and the highest is
£766 (95%CI: 607 - 925).
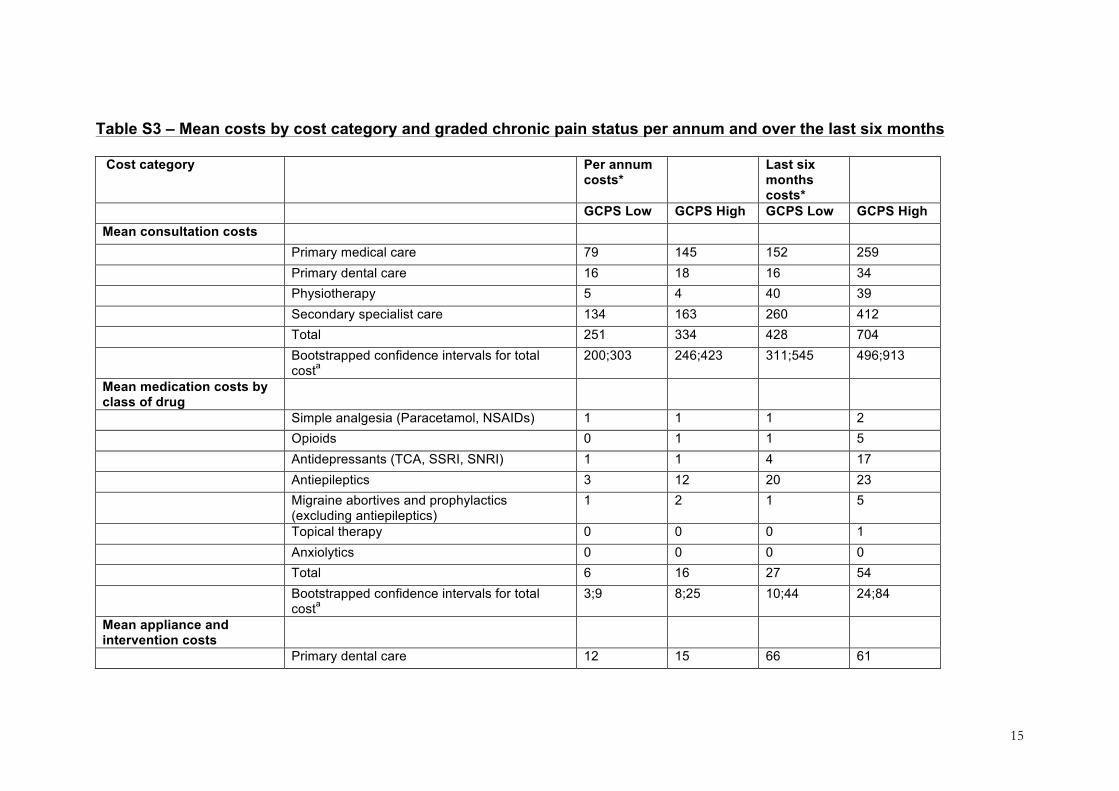
Due to missing data in some of the sociodemographic variables, the sample
size used in the GLM regression model was 175. The model’s results, (Table
3), demonstrate that dichotomised GCPS is a statistically significant predictor
of the total pain management costs over the last 6 months, controlling for age,
gender, origin of pain, duration of pain, employment status, level of education,
17
and index of multiple deprivation. Moving from a low to a high GCPS status
increased cost by £366 (95%CI: 135 - 598. p<0.01). Costs in each cost
category along with sociodemographic and economic status are also broken
down by dichotomised GCPS status in the e-appendix (Tables S3 & S4).
The high GCPS state (IIb-IV) produces significantly more biopsychosocial
impact than the low state as measured by the MPI, PHQ-4 and EQ-5D-5L
(Table 4). There were few differences in illness perceptions between those in
the two states.
18
Discussion
Consultation costs were identified as the major driver of total healthcare
utilisation costs in POFP and therefore also represent the main use of health
services. The dichotomised GCPS state was identified as a good predictor of
the total cost of healthcare utilisation and the high GCPS state was
associated with significantly more biopsychosocial impact than the low GCPS
state. Taking these two facts into consideration the dichotomised GCPS
status may be used as a tool to better allocate resources. As the GCPS is
applicable and valid to all healthcare communities around the world this
finding is applicable to any healthcare system, state-funded or private. In all
healthcare systems resources are finite and there is a desire to see resource
used to the patient’s best advantage. The dichotomised GCPS may help
determine stratified care pathways similar to those employed with great
success in other persistent pain conditions (Hill et al. 2011), which would
address the call for such a system recently issued by a qualitative
examination of POFP care (Peters et al. 2015).
There are several ways such a stratified model might work but one worth
investigating might use a hub (specialist care centre) and spoke (community
non-specialist screening and treatment centre) model and be initiated at the
spoke by establishing dichotomised GCPS at first presentation. High GCPS
status at first presentation would result in immediate expedited care from the
hub as opposed to low GCPS, which would result in immediate care from the
spoke. This putative system would offer the opportunity to rationalise
19
healthcare use, by focusing care on where it can be most useful. This may
also help decrease the chances of further significant biopsychosocial impacts,
and neuroplastic changes, especially in patients with higher-levels of pain
related-disability, given that the optimisation of resources and the use of a full
range of allied-health care professionals is likely to decrease waiting times.
The use of this type of system might also help reduce the monetary and time
costs in healthcare systems where large travelling distances exist between
community and specialist settings.
There are limitations to this study. Despite the wide sociodemographic range
of the sample the cohort examined may not be representative of other
populations. Dropout may have resulted in selection biases of differing types.
Data may be subject to recall bias due to the time period of recall for
individual’s use of healthcare. Recall bias and the differing modes of
identifying healthcare use (interview versus questionnaire) may account for
the higher healthcare costs over the last six months when compared to the
per annum costs; for the former, some individuals were recalling utilisation
over several years. Uncertainty around the ‘true’ unit costs of care also may
mean that final total cost figures are subject to variation. Nevertheless we
explored this in extensive sensitivity analyses and the conclusions from these
analyses remain the same as the main analysis.
20
This study provides quantitative corroboration of previous qualitative research
data that suggest the healthcare pathway for POFP is complex and potentially
‘consultation heavy’ (Durham et al. 2011; Durham and Nixdorf 2014; Peters et
al. 2015). The data presented can be interpreted as either that people with
POFP may have a protracted search themselves to find a cure, better pain
management, or a diagnosis (Aggarwal et al. 2008; Durham et al. 2011;
Peters et al. 2015). Or, that people with POFP have been given a diagnosis
and management, but continue to exhibit further demand for treatment due to
psychosocial co-morbidities and hence to continue to receive consultations
(Barsky et al. 2001; Aggarwal et al. 2006). Whilst generic evidence exists that
levels of somatization help predict healthcare use (Barsky et al. 2001) the
evidence base for this in POFP is equivocal (Macfarlane et al. 1999). Given
the qualitative data from published studies in the literature (Aggarwal et al.
2008; Durham et al. 2011; Peters et al. 2015) and from the DEEP study itself
(unpublished as yet) it is potentially more likely that some of the disparity
between cost categories may be due to a lack of “ownership” of these
patients; with patients falling between the two silos of dentistry and medicine.
This leaves those affected without a defined care pathway and without a
defined point of entry for more tailored and specific diagnosis and
management. One way of preventing this would be to create a defined point
of entry for anyone with orofacial pain persisting over three months at the
spokes of the hub and spoke model. Using the dichotomised GCPS status to
stratify care at first presentation to the spokes would help decrease the
number of consultations which were the major driver of cost in this study, but
21
the question of whether allocation of more resource to one particular group of
patients would be beneficial still remains to be answered. Answers to this
question may be identified in the economic modelling of longitudinal data from
the ongoing DEEP study.
22
Statements
Acknowledgements
We would like to thank the patients and health professionals who participated
in this study and made it possible. Finally, we would like to thank the steering
group members who have given very valuable advice at differing stages of the
ongoing study. The authors declare no conflict of interest.
Details of contribution
JD - Performed the primary analysis of data and had substantial contributions to the conception and design of the work, interpretation of the data, drafting and revising the work and final approval of the work.
JS – Substantial contributions to the analysis and interpretation of the data, drafting and revising the work, and final approval of the work.
MB - Substantial contributions to the acquisition, analysis and, interpretation of the data, drafting and revising the work, and final approval of the work.
VAS, JGS, CE - substantial contributions to the conception and design of the work, interpretation of the data, drafting and revising the work, and final approval of the work.
LV - substantial contributions to the conception and design of the work, analysis and interpretation of the data, drafting and revising the work and final approval of the work.
23
References
Aggarwal, VR, McBeth, J, Zakrzewska, JM, Lunt, M, Macfarlane, GJ. 2006. The epidemiology of chronic syndromes that are frequently unexplained: do they have common associated factors? Int. J. Epidemiol. 35(2):468–476.
Aggarwal, VR, McBeth, J, Zakrzewska, JM, Macfarlane, GJ. 2008. Unexplained orofacial pain - is an early diagnosis possible? Br Dent J 205(3):E6; discussion 140–1.
Barber, J, Thompson, S. 2004. Multiple regression of cost data: use of generalised linear models. J Health Serv Res Policy 9(4):197–204.
Barsky, AJ, Ettner, SL, Horsky, J, Bates, DW. 2001. Resource utilization of patients with hypochondriacal health anxiety and somatization. Med. Care 39(7):705–715.
Cohen, J. 1988. Statistical power analysis for the behavioral sciences (2nd ed.). New Jersey: Lawrence Erlbaum.
De Leeuw, R, Klasser, GD. 2013. Orofacial pain: guidelines for assessment, diagnosis, and management. Hanover Park, IL: Quintessence.
DoH. 2012. NHS reference costs: financial year 2011 to 2012.
Drummond, MF, Sculpher, MJ, Torrance, GW, O’Brien, BJ, Stoddart, GL. 2005. Methods for the economic evaluation of health care programmes. New York, USA: Oxford University Press.
Durham, J, Breckons, M, Araujo-Soares, V, Exley, C, Steele, J, Vale, L. 2014. Developing Effective and Efficient care pathways in chronic Pain: DEEP study protocol. BMC Oral Health 146.
Durham, J, Nixdorf, DR. 2014. Healthcare pathway and biopsychosocial impact of persistent dentoalveolar pain disorder: a qualitative study. Int Endod J 47(12):1151–1159.
Durham, J, Steele, J, Moufti, MA, Wassell, R, Robinson, P, Exley, C. 2011. Temporomandibular disorder patients’ journey through care. Community Dent Oral Epidemiol 39(6):532–541.
Dworkin, SF, Huggins, KH, Wilson, L, Mancl, L, Turner, J, Massoth, D, LeResche, L, Truelove, E. 2002. A randomized clinical trial using research diagnostic criteria for temporomandibular disorders-axis II to target clinic cases for a tailored self-care TMD treatment program. J Orofac Pain 16(1):48–63.
Glaros, AG, Glass, EG, Hayden, WJ. 1995. History of treatment received by patients with TMD: a preliminary investigation. J Orofac Pain 9(2):147–151.
24
Gonzalez, YM, Schiffman, E, Gordon, SM, Seago, B, Truelove, EL, Slade, G, Ohrbach, R. 2011. Development of a brief and effective temporomandibular disorder pain screening questionnaire: reliability and validity. J. Am. Dent. Assoc. 142(10):1183–1191.
Green, SB. 1991. How many subjects does it take to do a regression analysis. Multivariate behavioral research 26(3):499–510.
Hapak, L, Gordon, A, Locker, D, Shandling, M, Mock, D, Tenenbaum, HC. 1994. Differentiation between musculoligamentous, dentoalveolar, and neurologically based craniofacial pain with a diagnostic questionnaire. J Orofac Pain 8(4):357–368.
Herdman, M, Gudex, C, Lloyd, A, Janssen, M, Kind, P, Parkin, D, Bonsel, G, Badia, X. 2011. Development and preliminary testing of the new five-level version of EQ-5D (EQ-5D-5L). Quality of Life Research 20(10):1727–1736.
Hill, JC, Whitehurst, DG, Lewis, M, Bryan, S, Dunn, KM, Foster, NE, Konstantinou, K, Main, CJ, Mason, E, Somerville, S et al. 2011. Comparison of stratified primary care management for low back pain with current best practice (STarT Back): a randomised controlled trial. Lancet 378(9802):1560–1571.
HSCIC. 2014. Dental earnings and expenses 2012/13 initial analysis.
Joint Formulary Committee. 2012. British National Formulary. London: BMJ Group and Pharmaceutical Press.
Kerns, RD, Turk, DC, Rudy, TE. 1985. The West Haven-Yale Multidimensional Pain Inventory (WHYMPI). Pain 23(4):345–356.
Kotiranta, U, Suvinen, T, Kauko, T, Le Bell, Y, Kemppainen, P, Suni, J, Forssell, H. 2015. Subtyping patients with temporomandibular disorders in a primary health care setting on the basis of the research diagnostic criteria for temporomandibular disorders axis II pain-related disability: a step toward tailored treatment planning? J Oral Facial Pain Headache 29(2):126–134.
Kroenke, K, Spitzer, RL, Williams, JB, Lowe, B. 2009. An ultra-brief screening scale for anxiety and depression: the PHQ-4. Psychosomatics 50(6):613–621.
Macfarlane, GJ, Morris, S, Hunt, IM, Benjamin, S, McBeth, J, Papageorgiou, AC, Silman, AJ. 1999. Chronic widespread pain in the community: the influence of psychological symptoms and mental disorder on healthcare seeking behavior. J. Rheumatol. 26(2):413–419.
Macfarlane, TV, Glenny, AM, Worthington, HV. 2001. Systematic review of population-based epidemiological studies of oro-facial pain. J Dent 29(7):451–467.
Madland, G, Feinmann, C. 2001. Chronic facial pain: a multidisciplinary problem. J Neurol Neurosurg Psychiatry 71(6):716–719.

25
Manfredini, D, Favero, L, Gregorini, G, Cocilovo, F, Guarda-Nardini, L. 2013. Natural course of temporomandibular disorders with low pain-related impairment: a 2-to-3-year follow-up study. J Oral Rehabil 40(6):436–442.
Mihaylova, B, Briggs, A, O’Hagan, A, Thompson, SG. 2011. Review of statistical methods for analysing healthcare resources and costs. Health Econ 20(8):897–916.
Moss-Morris, R, Weinman, J, Petrie, KJ, Horne, R, Cameron, LD, Buick, D. 2002. The revised illness perception questionnaire (IPQ-R). Psychology & Health 17(1):1–16.
NHS. 2005. National Health Service (General Dental Services Contracts) Regulations.
Peters, S, Goldthorpe, J, McElroy, C, King, E, Javidi, H, Tickle, M, Aggarwal, VR. 2015. Managing chronic orofacial pain: A qualitative study of patients’, doctors’, and dentists’ experiences. Br J Health Psychol 20(4):777–791.
Shemilt, I, Thomas, J, Morciano, M. 2010. A web-based tool for adjusting costs to a specific target currency and price year. p. 51–59.
Shimshak, DG, Kent, RL, DeFuria, M. 1997. Medical claims profiles of subjects with temporomandibular joint disorders. Cranio 15(2):150–158.
Shueb, SS, Nixdorf, DR, John, MT, Alonso, BF, Durham, J. 2015. What is the impact of acute and chronic orofacial pain on quality of life. J Dent 43(10):1203–1210.
von Elm, E, Altman, DG, Egger, M, Pocock, SJ, Gotzsche, PC, Vandenbroucke, JP. 2007. The Strengthening the Reporting of Observational Studies in Epidemiology (STROBE) statement: guidelines for reporting observational studies. Ann. Intern. Med. 147(8):573–577.
Von Korff, M, Dunn, KM. 2008. Chronic pain reconsidered. Pain 138(2):267–276.
Von Korff, M, Ormel, J, Keefe, FJ, Dworkin, SF. 1992. Grading the severity of chronic pain. Pain 50(2):133–149.
White, BA, Williams, LA, Leben, JR. 2001. Health care utilization and cost among health maintenance organization members with temporomandibular disorders. J Orofac Pain 15(2):158–169.
Wordsworth, S, Thompson, S. 2001. An annotated cost questionnaire for patients: results of piloting. HERU Dicussion Paper 03/01
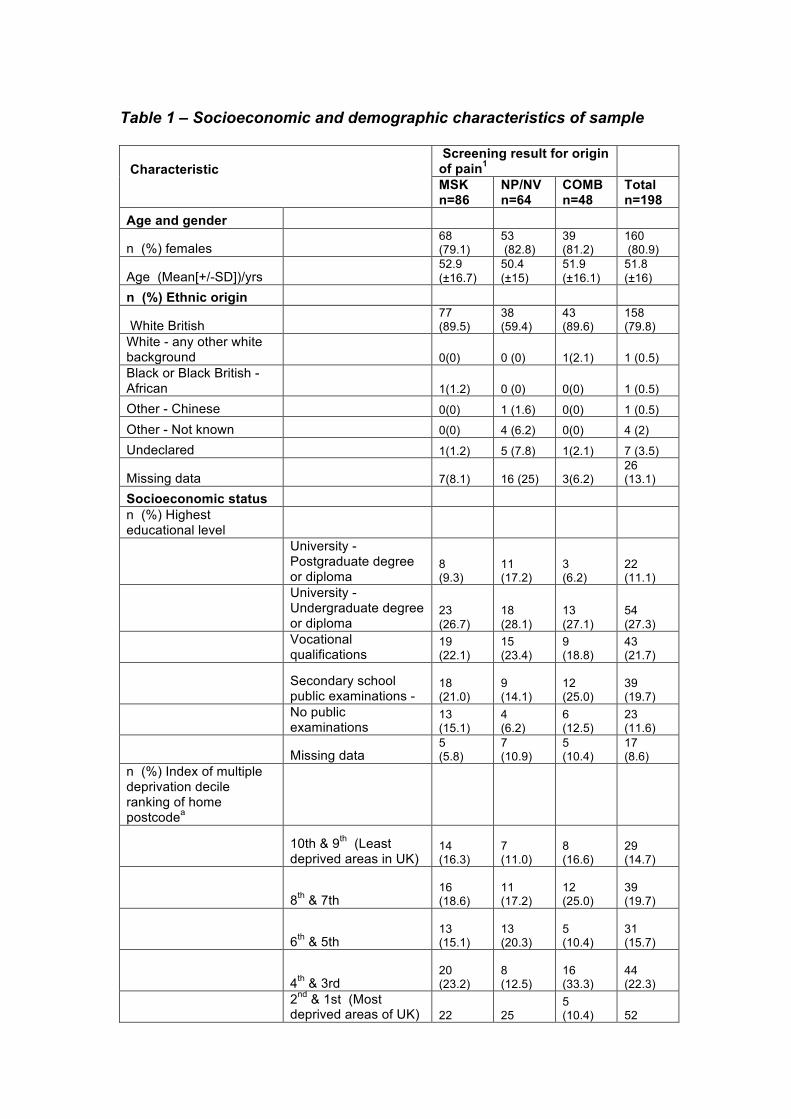
Table 1 – Socioeconomic and demographic characteristics of sample
Characteristic
Screening result for origin of pain1 MSK n=86
NP/NV n=64
COMB n=48
Total n=198
Age and gender
n (%) females !!68 (79.1)
53 (82.8)
39 (81.2)
160 (80.9)
Age (Mean[+/-SD])/yrs !!52.9 (±16.7)
50.4 (±15)
51.9 (±16.1)
51.8 (±16)
n (%) Ethnic origin
White British !!77 (89.5)
38 (59.4)
43 (89.6)
158 (79.8)
White - any other white background !! 0(0) 0 (0) 1(2.1) 1 (0.5) Black or Black British - African !! 1(1.2) 0 (0) 0(0) 1 (0.5)
Other - Chinese !! 0(0) 1 (1.6) 0(0) 1 (0.5)
Other - Not known !! 0(0) 4 (6.2) 0(0) 4 (2)
Undeclared !! 1(1.2) 5 (7.8) 1(2.1) 7 (3.5)
Missing data !! 7(8.1) 16 (25) 3(6.2) 26 (13.1)
Socioeconomic status n (%) Highest educational level
University - Postgraduate degree or diploma
8 (9.3)
11 (17.2)
3 (6.2)
22 (11.1)
University - Undergraduate degree or diploma
23 (26.7)
18 (28.1)
13 (27.1)
54 (27.3)
Vocational qualifications
19 (22.1)
15 (23.4)
9 (18.8)
43 (21.7)
Secondary school public examinations -
18 (21.0)
9 (14.1)
12 (25.0)
39 (19.7)
No public examinations
13 (15.1)
4 (6.2)
6 (12.5)
23 (11.6)
Missing data 5 (5.8)
7 (10.9)
5 (10.4)
17 (8.6)
n (%) Index of multiple deprivation decile ranking of home postcodea
10th & 9th (Least deprived areas in UK)
14 (16.3)
7 (11.0)
8 (16.6)
29 (14.7)
8th & 7th 16 (18.6)
11 (17.2)
12 (25.0)
39 (19.7)
6th & 5th 13 (15.1)
13 (20.3)
5 (10.4)
31 (15.7)
4th & 3rd 20 (23.2)
8 (12.5)
16 (33.3)
44 (22.3)
2nd & 1st (Most deprived areas of UK) 22 25
5 (10.4) 52
Characteristic
Screening result for origin of pain1 MSK n=86
NP/NV n=64
COMB n=48
Total n=198
(25.6) (39.1) (26.2)
Missing data 1 (1.2)
0 (0)
2 (4.2)
3 (1.5)
n (%) employedb 53 (61.6)
42 (65.6)
21 (43.8)
116 (58.6)
Groups 1 - 3
22 (25.7)
27 (42.2)
10 (20.9)
59 (29.8)
Groups 4 - 6 20 (23.3)
13 (20.4) 6 (12.5)
39 (19.6)
Groups 7 - 9 11 (12.8) 2 (3.2) 5 (10.4) 18 (9.0)
n (%) unemployed 7 (8.1)
9 (14.1)
11 (22.9)
27 (13.6)
n (%) retired 21 (24.4)
9 (14.1)
14 (29.2)
44 (22.2)
n (%) sick leave because of POFP 0(0) 1 (1.6) 1(2.1) 2 (1)
n (%) student 3(3.5) 2 (3.1) 0(0) 5 (2.5)
n (%) missing data 2(1.2) 1 (1.6) 1(2.1) 4 (2.0) 1MSK - Musculoskeletal; NP/NV - Neuropathic/vascular; COMB - Combined origin derived from screening questionnaires used at entry to study (Hapak et al. 1994; Gonzalez et al. 2011) aIndex of multiple deprivation (IMD) rank is calculated using the 2010 English census data which defined 32482 small geographic areas in England . Each of these areas was assessed on 38 domains and scored according to standardised criteria. Each area was then ranked from the best score (rank 1) to the worst (32482) according to IMD score. http://neighbourhood.statistics.gov.uk/dissemination/ bMajor group occupational categories from UK Office for National Statistics SOC 2010: Group 1 - Managers, directors & senior officials; Group 2 - Professional occupations; Group 3 -Associate professional & technical occupations; Group 4 - Administrative & secretarial occupations; Group 5 - Skilled trades occupations; Group 6 - Caring, leisure & other service occupations; Group 7 - Sales and customer service occupations; Group 8 - Process, plant & machine operatives; Group 9 - Elementary occupations
POFP – Persistent Orofacial Pain
Table 2 – Healthcare utilisation costs since complaint began
Cost category
Total cost since complaint began/£*
Per annum cost over duration complaint/£*
Most recent 6 months costs/£*
Mean consultation costs Primary medical care 444 106 194 Primary dental care 70 17 23 Physiotherapy 8 5 40 Secondary specialist care 732 147 321
Total (Bootstrapped confidence intervala)
1318 (1034;1601)
285 (237;333)
538 (424;653)
Mean medication costs by class of drug
Simple analgesia (Paracetamol, NSAIDs) 2 1 2
Opioids 3 1 2
Antidepressants (TCA, SSRI, SNRI) 5 1 9
Antiepileptics 22 7 21
Migraine abortives and prophylactics (excluding antiepileptics) 9 1 3
Topical therapy 0 0 0 Anxiolytics 0 0 0
Total (Bootstrapped confidence interval a)
41 (31; 51)
10 (6;14)
38 (21;54)
Mean appliance and intervention costs Primary dental care 29 13 64 Secondary specialist care 321 54 2
Total (Bootstrapped confidence interval a)
428 (213;642)
80 (41;118)
66 (50;82)
Overall total mean cost (Bootstrapped confidence interval a)
1751 (1314;2189)
362 (291;433)
642 (525;758)
aBootstrapped confidence intervals of the total cost using a bias corrected accelerated technique and 1000 repetitions *Currency is pounds sterling at 2012 prices, but can be converted to other national currencies using the validated Campbell and Cochrane Economics Methods Group (CCEMG) and Evidence for Policy and Practice Information and Coordinating Centre’s (EPPI-centre) Cost Converter (Shemilt et al. 2010) available at http://eppi.ioe.ac.uk/costconversion/ (last accessed 8th March 2016)

NSAIDS – Non Steroidal Anti-Inflammatory Drugs; TCA – Tricyclic antidepressants; SSRI – Selective Serotonin Reuptake Inhibitors; SNRI – Serotonin and Noradrenaline Reuptake Inhibitor
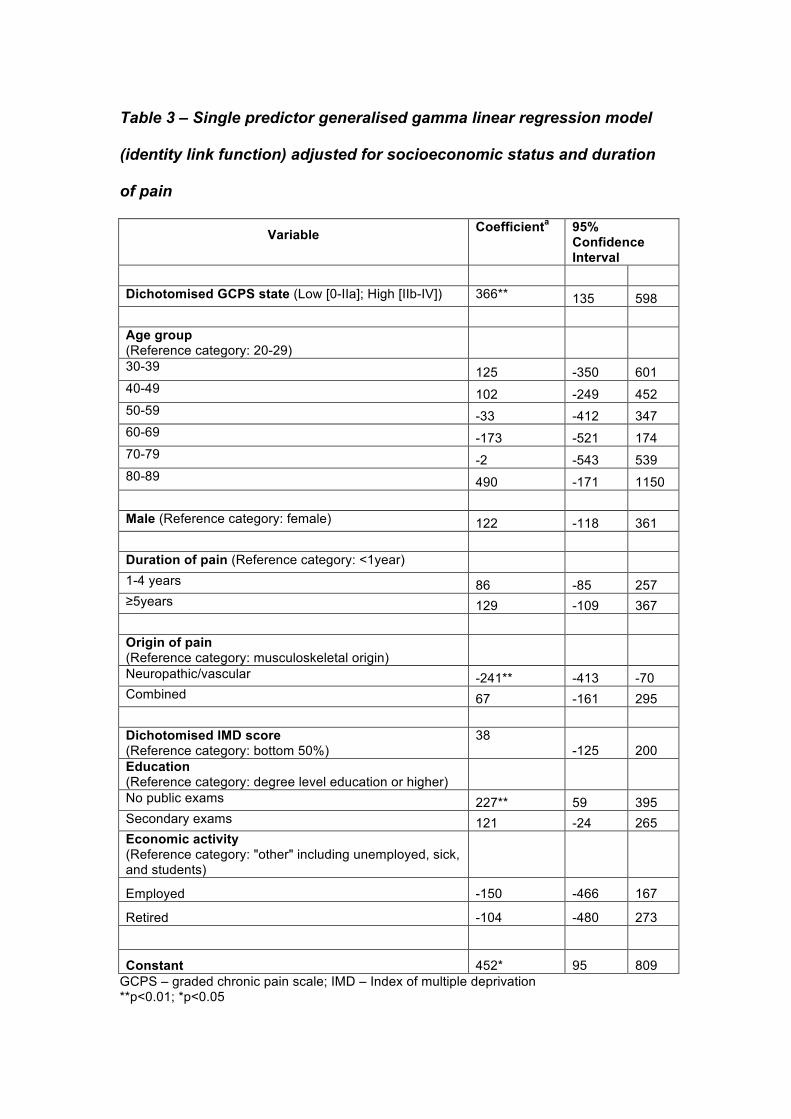
Table 3 – Single predictor generalised gamma linear regression model
(identity link function) adjusted for socioeconomic status and duration
of pain
Variable Coefficienta 95% Confidence Interval
Dichotomised GCPS state (Low [0-IIa]; High [IIb-IV]) 366** 135 598
Age group (Reference category: 20-29)
30-39 125 -350 601 40-49 102 -249 452 50-59 -33 -412 347 60-69 -173 -521 174 70-79 -2 -543 539 80-89 490 -171 1150
Male (Reference category: female) 122 -118 361
Duration of pain (Reference category: <1year) 1-4 years 86 -85 257 ≥5years 129 -109 367
Origin of pain (Reference category: musculoskeletal origin)
Neuropathic/vascular -241** -413 -70 Combined 67 -161 295
Dichotomised IMD score (Reference category: bottom 50%)
38 -125 200
Education (Reference category: degree level education or higher)
No public exams 227** 59 395 Secondary exams 121 -24 265 Economic activity (Reference category: "other" including unemployed, sick, and students)
Employed -150 -466 167
Retired -104 -480 273
Constant 452* 95 809 GCPS – graded chronic pain scale; IMD – Index of multiple deprivation **p<0.01; *p<0.05

a – Coefficient is pounds sterling at 2012 prices. Interpretation example: those with no public exams compared to those with a degree level education cost, on average, £227 more for their health utilisation holding all other variables constant. Prices can be converted to other national currencies using the validated Campbell and Cochrane Economics Methods Group (CCEMG) and Evidence for Policy and Practice Information and Coordinating Centre’s (EPPI-centre) Cost Converter (Shemilt et al. 2010) available at http://eppi.ioe.ac.uk/costconversion/ (last accessed 8th March 2016)
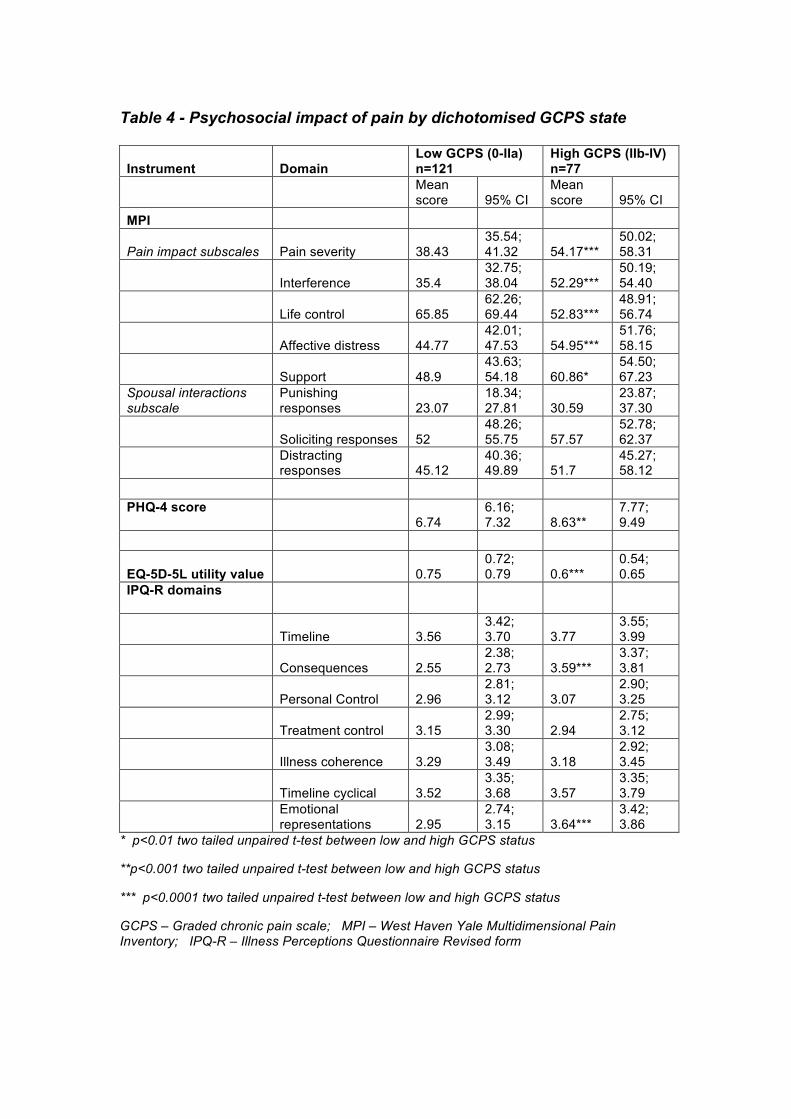
Table 4 - Psychosocial impact of pain by dichotomised GCPS state
Instrument Domain Low GCPS (0-IIa) n=121
High GCPS (IIb-IV) n=77
Mean score 95% CI
Mean score 95% CI
MPI
Pain impact subscales Pain severity 38.43 35.54; 41.32 54.17***
50.02; 58.31
Interference 35.4 32.75; 38.04 52.29***
50.19; 54.40
Life control 65.85 62.26; 69.44 52.83***
48.91; 56.74
Affective distress 44.77 42.01; 47.53 54.95***
51.76; 58.15
Support 48.9 43.63; 54.18 60.86*
54.50; 67.23
Spousal interactions subscale
Punishing responses 23.07
18.34; 27.81 30.59
23.87; 37.30
Soliciting responses 52 48.26; 55.75 57.57
52.78; 62.37
Distracting responses 45.12
40.36; 49.89 51.7
45.27; 58.12
PHQ-4 score 6.74
6.16; 7.32 8.63**
7.77; 9.49
EQ-5D-5L utility value 0.75 0.72; 0.79 0.6***
0.54; 0.65
IPQ-R domains
Timeline 3.56 3.42; 3.70 3.77
3.55; 3.99
Consequences 2.55 2.38; 2.73 3.59***
3.37; 3.81
Personal Control 2.96 2.81; 3.12 3.07
2.90; 3.25
Treatment control 3.15 2.99; 3.30 2.94
2.75; 3.12
Illness coherence 3.29 3.08; 3.49 3.18
2.92; 3.45
Timeline cyclical 3.52 3.35; 3.68 3.57
3.35; 3.79
Emotional representations 2.95
2.74; 3.15 3.64***
3.42; 3.86
* p<0.01 two tailed unpaired t-test between low and high GCPS status
**p<0.001 two tailed unpaired t-test between low and high GCPS status
*** p<0.0001 two tailed unpaired t-test between low and high GCPS status
GCPS – Graded chronic pain scale; MPI – West Haven Yale Multidimensional Pain Inventory; IPQ-R – Illness Perceptions Questionnaire Revised form
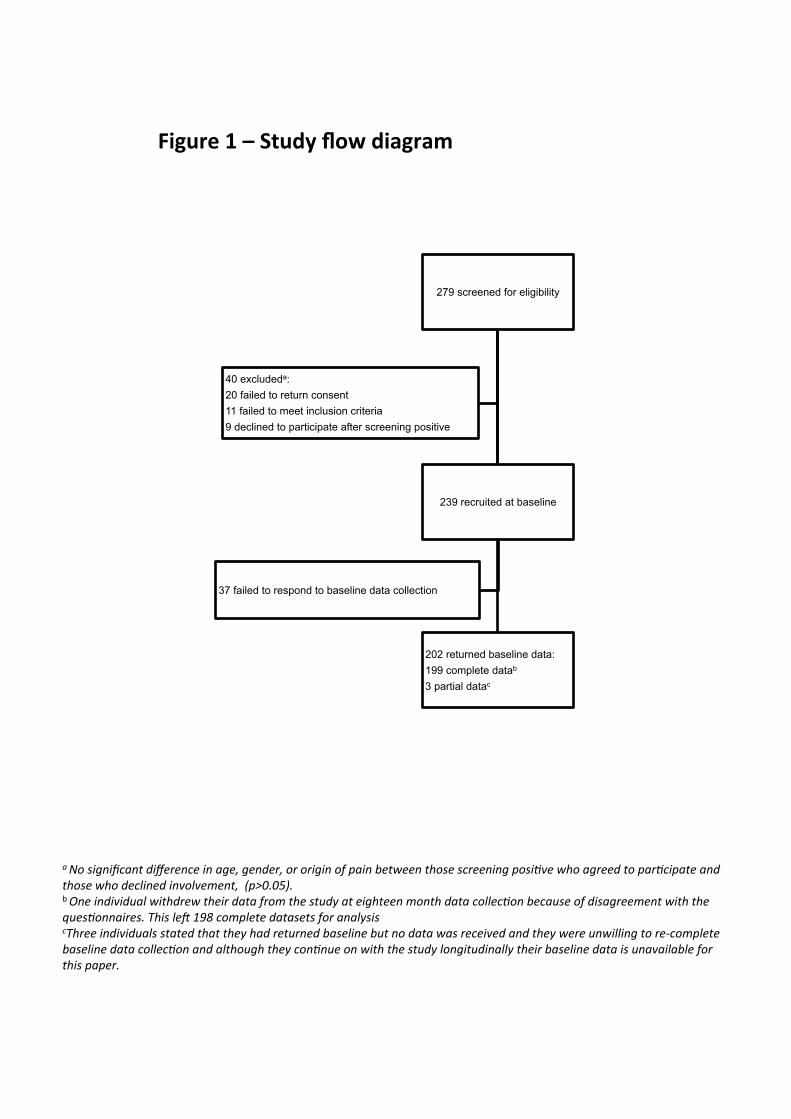
279 screened for eligibility
239 recruited at baseline
37 failed to respond to baseline data collection
202 returned baseline data: 199 complete datab 3 partial datac
40 excludeda: 20 failed to return consent 11 failed to meet inclusion criteria 9 declined to participate after screening positive
a"No"significant"difference"in"age,"gender,"or"origin"of"pain"between"those"screening"posi6ve"who"agreed"to"par6cipate"and"those"who"declined"involvement,""(p>0.05)."!b!One"individual"withdrew"their"data"from"the"study"at"eighteen"month"data"collec6on"because"of"disagreement"with"the"ques6onnaires."This"leE"198"complete"datasets"for"analysis!cThree"individuals"stated"that"they"had"returned"baseline"but"no"data"was"received"and"they"were"unwilling"to"reIcomplete"baseline"data"collec6on"and"although"they"con6nue"on"with"the"study"longitudinally"their"baseline"data"is"unavailable"for"this"paper.!!
Figure'1'–'Study'flow'diagram'!

1
Supplemental appendix
2
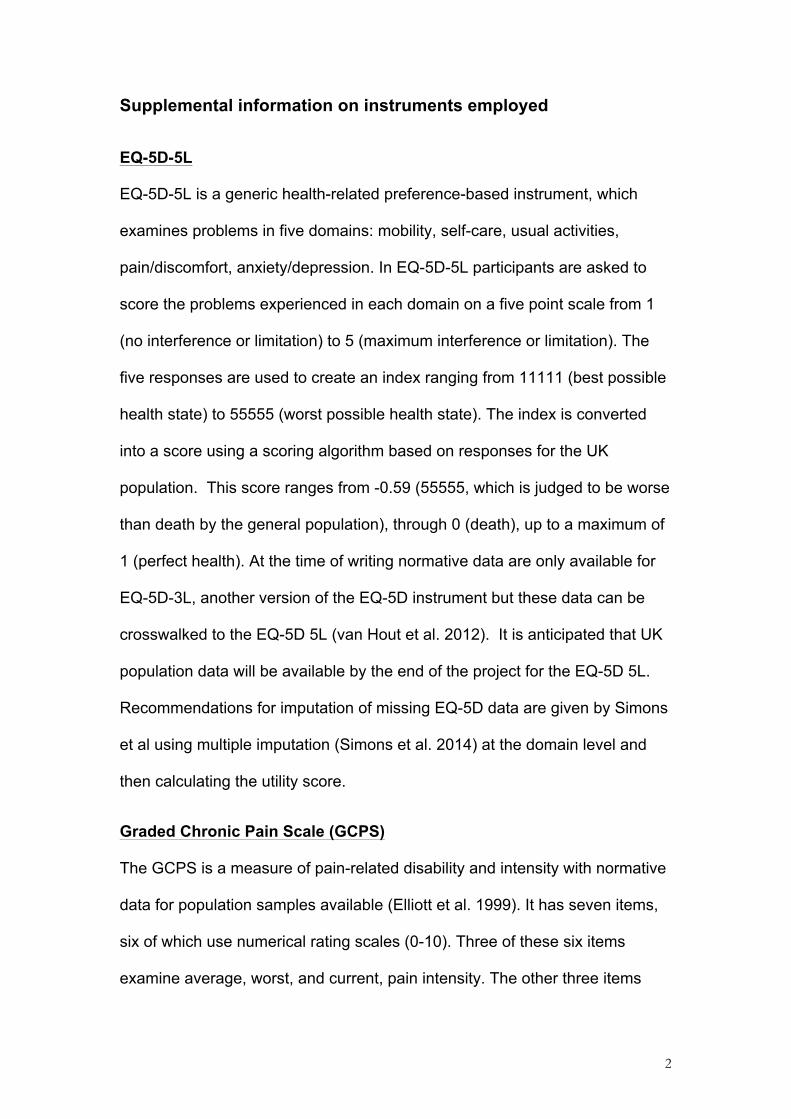
Supplemental information on instruments employed
EQ-5D-5L
EQ-5D-5L is a generic health-related preference-based instrument, which
examines problems in five domains: mobility, self-care, usual activities,
pain/discomfort, anxiety/depression. In EQ-5D-5L participants are asked to
score the problems experienced in each domain on a five point scale from 1
(no interference or limitation) to 5 (maximum interference or limitation). The
five responses are used to create an index ranging from 11111 (best possible
health state) to 55555 (worst possible health state). The index is converted
into a score using a scoring algorithm based on responses for the UK
population. This score ranges from -0.59 (55555, which is judged to be worse
than death by the general population), through 0 (death), up to a maximum of
1 (perfect health). At the time of writing normative data are only available for
EQ-5D-3L, another version of the EQ-5D instrument but these data can be
crosswalked to the EQ-5D 5L (van Hout et al. 2012). It is anticipated that UK
population data will be available by the end of the project for the EQ-5D 5L.
Recommendations for imputation of missing EQ-5D data are given by Simons
et al using multiple imputation (Simons et al. 2014) at the domain level and
then calculating the utility score.
Graded Chronic Pain Scale (GCPS)
The GCPS is a measure of pain-related disability and intensity with normative
data for population samples available (Elliott et al. 1999). It has seven items,
six of which use numerical rating scales (0-10). Three of these six items
examine average, worst, and current, pain intensity. The other three items
3
examine the individual’s level of disability in usual, daily, and
recreational/social activities. These two groups of three items are both
summed in their groups, then a mean taken of the individual’s scores and this
mean multiplied by ten to generate a characteristic pain intensity (CPI) and a
disability score respectively with higher scores indicating more pain or
disability.
The seventh item in the GCPS examines the number of days individuals have
been prevented from their work, school or household activities in the last six
months offering four predefined ranges for the respondent to chose from
(“disability days”). An algorithm is provided to convert disability days, disability
score, into disability points and then combine this with CPI to give a five point
GCPS rating ranging from 0 to IV in order of ascending disability: 0 – no pain
in past six months, to IV – High disability severely limiting. It is not possible to
impute missing data on the GCPS individuals with missing data were
therefore excluded from any analysis involving GCPS.
Multidimensional Pain Inventory (MPI)
The MPI is a multidimensional pain measure. Version 3 of the MPI was used
as it generates scores using a Rasch modelling approach which is arguably
the most robust of the three versions. Only two of the three subscales of MPI
are employed in this study, the pain impact and spousal interaction subscales.
The third subscale examining interference in daily activity was omitted to
decrease respondent burden in line with IMMPACT recommendations
(Dworkin et al. 2005) as it covered similar constructs to those provided by
GCPS and the EQ-5D-5L. The internal consistency (Cronbach alpha) of the
subscales in this study were comparable to, or better than, those in previous
4
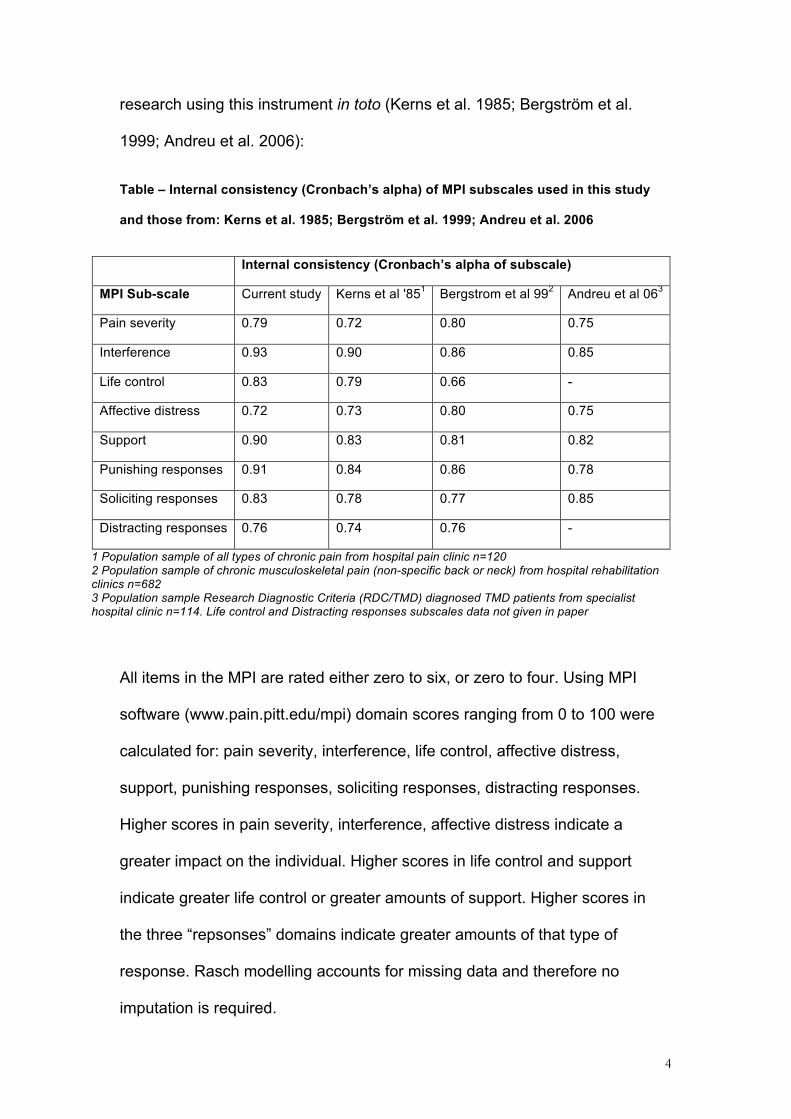
research using this instrument in toto (Kerns et al. 1985; Bergström et al.
1999; Andreu et al. 2006):
Table – Internal consistency (Cronbach’s alpha) of MPI subscales used in this study
and those from: Kerns et al. 1985; Bergström et al. 1999; Andreu et al. 2006
Internal consistency (Cronbach’s alpha of subscale)
MPI Sub-scale Current study Kerns et al '851 Bergstrom et al 992 Andreu et al 063
Pain severity 0.79 0.72 0.80 0.75
Interference 0.93 0.90 0.86 0.85
Life control 0.83 0.79 0.66 -
Affective distress 0.72 0.73 0.80 0.75
Support 0.90 0.83 0.81 0.82
Punishing responses 0.91 0.84 0.86 0.78
Soliciting responses 0.83 0.78 0.77 0.85
Distracting responses 0.76 0.74 0.76 -
1 Population sample of all types of chronic pain from hospital pain clinic n=120 2 Population sample of chronic musculoskeletal pain (non-specific back or neck) from hospital rehabilitation clinics n=682 3 Population sample Research Diagnostic Criteria (RDC/TMD) diagnosed TMD patients from specialist hospital clinic n=114. Life control and Distracting responses subscales data not given in paper
All items in the MPI are rated either zero to six, or zero to four. Using MPI
software (www.pain.pitt.edu/mpi) domain scores ranging from 0 to 100 were
calculated for: pain severity, interference, life control, affective distress,
support, punishing responses, soliciting responses, distracting responses.
Higher scores in pain severity, interference, affective distress indicate a
greater impact on the individual. Higher scores in life control and support
indicate greater life control or greater amounts of support. Higher scores in
the three “repsonses” domains indicate greater amounts of that type of
response. Rasch modelling accounts for missing data and therefore no
imputation is required.
5
Use of services and productivity questionnaire
The use of services and productivity questionnaire (USPQ) used in this study
was adapted from that proposed by Wordsworth and Thompson as a generic
template for use of services and productivity questionnaires ((Wordsworth and
Thompson 2001) available at http://www.dirum.org/instruments/details/28).
The self-complete USPQ used in this study contained three sections that
specifically examined costs encountered in the preceding six month period in
relation to: consultations, medication and treatment, and productivity losses.
Although indirect costs incurred by the patient were examined in the
questionnaire the focus for this study is on the health care provider
perspective and examples of the types of questions identifying healthcare
utilisation from the perspective of the healthcare provider in the two sections
relevant to this study (consultations, medication and treatment) are provided
in brief below so that readers can comprehend how data were obtained on
healthcare utilisation. The full version of the original USPQ is freely available
at the website above.
Consultations’ section
The consultations’ section contained several questions in the form as below
with X substituted for a range of healthcare providers (general medical
practitioner, general dental practitioner, dental hospital specialist or consultant,
medical hospital specialist or consultant, physiotherapist, psychologist, and
other healthcare professional) to identify whether participants had seen
particular healthcare professionals in the last six months in relation to their
POFP and if so how many times they had seen them:

6
Have you seen X?
Yes No (move to question Y.Y)
If yes, did you see them as an NHS patient? Yes No
How many times did you see the X?
If you had to pay anything for your appointments, how much have you paid in total over the
last six months? £ - p
7
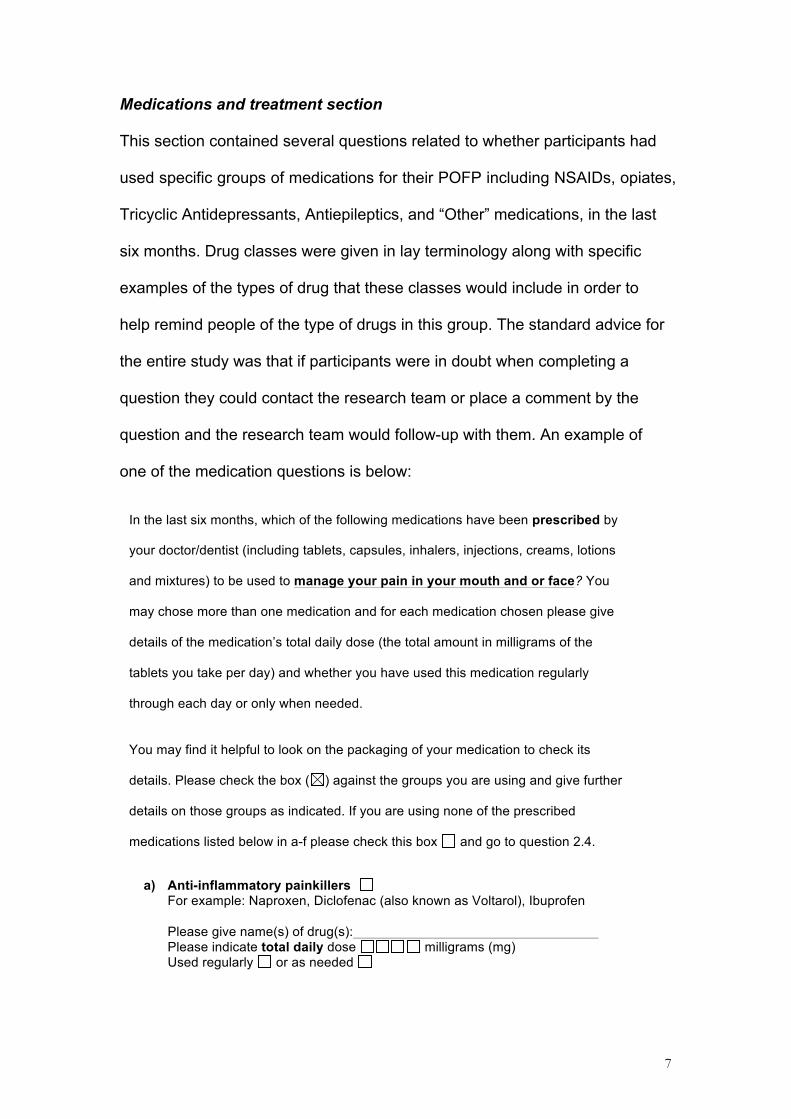
Medications and treatment section
This section contained several questions related to whether participants had
used specific groups of medications for their POFP including NSAIDs, opiates,
Tricyclic Antidepressants, Antiepileptics, and “Other” medications, in the last
six months. Drug classes were given in lay terminology along with specific
examples of the types of drug that these classes would include in order to
help remind people of the type of drugs in this group. The standard advice for
the entire study was that if participants were in doubt when completing a
question they could contact the research team or place a comment by the
question and the research team would follow-up with them. An example of
one of the medication questions is below:
In the last six months, which of the following medications have been prescribed by
your doctor/dentist (including tablets, capsules, inhalers, injections, creams, lotions
and mixtures) to be used to manage your pain in your mouth and or face? You
may chose more than one medication and for each medication chosen please give
details of the medication’s total daily dose (the total amount in milligrams of the
tablets you take per day) and whether you have used this medication regularly
through each day or only when needed.
You may find it helpful to look on the packaging of your medication to check its
details. Please check the box ( ) against the groups you are using and give further
details on those groups as indicated. If you are using none of the prescribed
medications listed below in a-f please check this box and go to question 2.4.
a) Anti-inflammatory painkillers For example: Naproxen, Diclofenac (also known as Voltarol), Ibuprofen !Please give name(s) of drug(s): Please indicate total daily dose milligrams (mg) Used regularly or as needed
8
Following the questions on medications participants were asked about any
dental, medical, or surgical interventions they had experienced in the last six
months in an attempt to address their POFP. Again a number of common
interventions were specified along with an “other” category. Patients were
asked to indicate if they had undergone the specified intervention and if it was
provided by the NHS or by a private healthcare provider and if the latter how
much they paid for it.
There was also a final section in the questionnaire where participants could
add in free-text any additional items they felt hadn’t been covered by the
structured questions previously. The research team followed up any
comments placed in this section that suggested costs that hadn’t been
accounted for in the earlier sections of the questionnaire with the participant
by telephone.
Illness perceptions questionnaire (IPQ-R)
The shortened version of the IPQ-R (http://www.uib.no/ipq/index.html) (Moss-
Morris et al. 2002), validated by Sniehotta et al (Sniehotta et al. 2010) , was
used. This version consists of twenty-one items, which employ a five-point
response scale: strongly disagree (1) to strongly agree (5). Appropriate items
are summed in order to calculate seven domain scores: timeline;
consequences; personal control; treatment control; illness coherence; timeline
cyclical; emotional representations. With the exception of the personal and
treatment control domains, higher domain scores represent less adaptive
illness perceptions. Higher scores in the personal and treatment control
9
domains represent more adaptive illness perceptions. Imputation guidelines
(http://www.uib.no/ipq/index.html) state that up to one item missing per
domain can be imputed using mean imputation based on responses for the
other items in that domain. More than one item with missing data in each
domain renders that domain’s score incalculable. There is no cumulative
score for the questionnaire.
Patient Health Questionnaire 4 (PHQ-4)
The PHQ-4 is an ultra-brief screening instrument for anxiety and depression
(Kroenke et al. 2009). It consists of two items from GAD-7 instrument (Spitzer
et al. 2006) that screen for anxiety and two items from PHQ-9 instrument
(Kroenke and Spitzer 2002) that screen for depression. All four items in PHQ-
4 are problem-based and use a four-point response scale ranging from: not all
(0) to nearly every day (3).
The item response codes are summed in their pairs in order to examine
anxiety and depression: ≥3 is a “yellow flag” and ≥5 is a “red flag” for the
relevant construct being examined (Kroenke et al. 2003; Lowe et al. 2005;
Kroenke et al. 2007; Lowe et al. 2010). A cumulative score is then generated
by summing all items’ response codes. Guidance for the thresholds of the
cumulative score are that ≥6 is a ”yellow flag” and ≥9 is a “red flag” for anxiety
or depression (Lowe et al. 2010). Given the small number of items in the
instrument imputation is not possible and therefore if missing data were
present in one domain both that domain and the cumulative score were
incalculable.
10
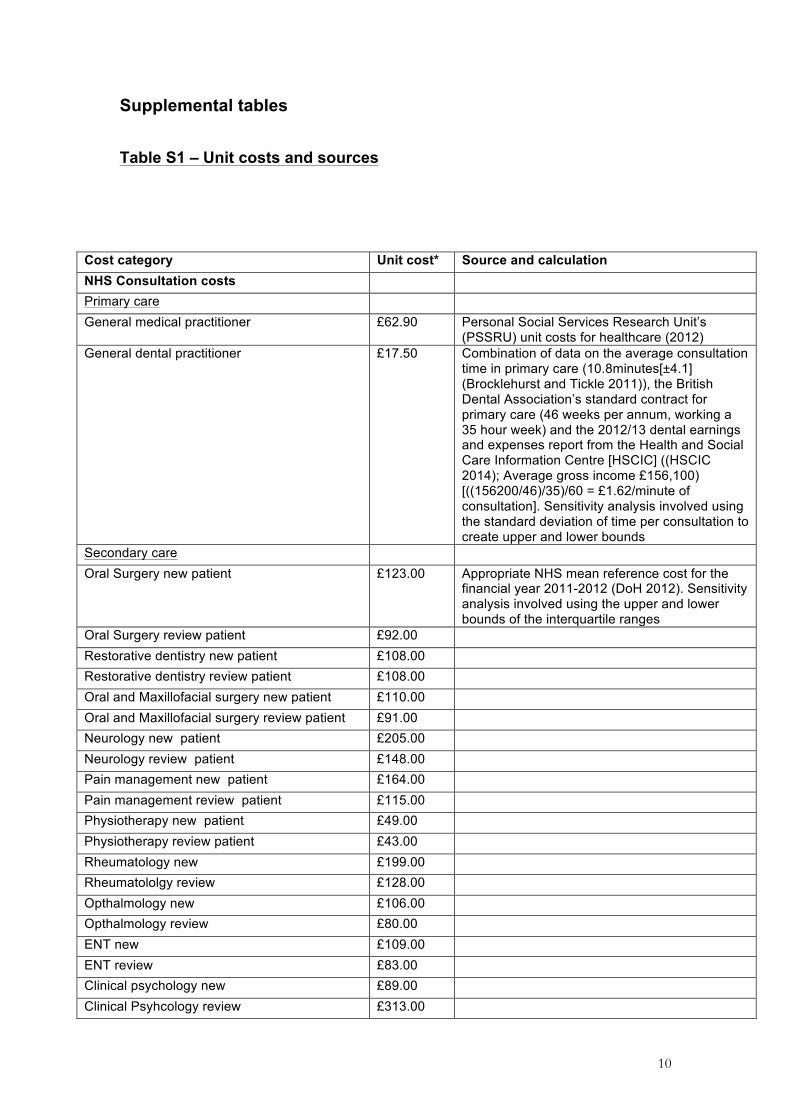
Supplemental tables
Table S1 – Unit costs and sources
Cost category Unit cost* Source and calculation NHS Consultation costs Primary care General medical practitioner £62.90 Personal Social Services Research Unit’s
(PSSRU) unit costs for healthcare (2012) General dental practitioner £17.50 Combination of data on the average consultation
time in primary care (10.8minutes[±4.1] (Brocklehurst and Tickle 2011)), the British Dental Association’s standard contract for primary care (46 weeks per annum, working a 35 hour week) and the 2012/13 dental earnings and expenses report from the Health and Social Care Information Centre [HSCIC] ((HSCIC 2014); Average gross income £156,100) [((156200/46)/35)/60 = £1.62/minute of consultation]. Sensitivity analysis involved using the standard deviation of time per consultation to create upper and lower bounds
Secondary care Oral Surgery new patient £123.00 Appropriate NHS mean reference cost for the
financial year 2011-2012 (DoH 2012). Sensitivity analysis involved using the upper and lower bounds of the interquartile ranges
Oral Surgery review patient £92.00 Restorative dentistry new patient £108.00 Restorative dentistry review patient £108.00 Oral and Maxillofacial surgery new patient £110.00 Oral and Maxillofacial surgery review patient £91.00 Neurology new patient £205.00 Neurology review patient £148.00 Pain management new patient £164.00 Pain management review patient £115.00 Physiotherapy new patient £49.00 Physiotherapy review patient £43.00 Rheumatology new £199.00 Rheumatololgy review £128.00 Opthalmology new £106.00 Opthalmology review £80.00 ENT new £109.00 ENT review £83.00 Clinical psychology new £89.00 Clinical Psyhcology review £313.00
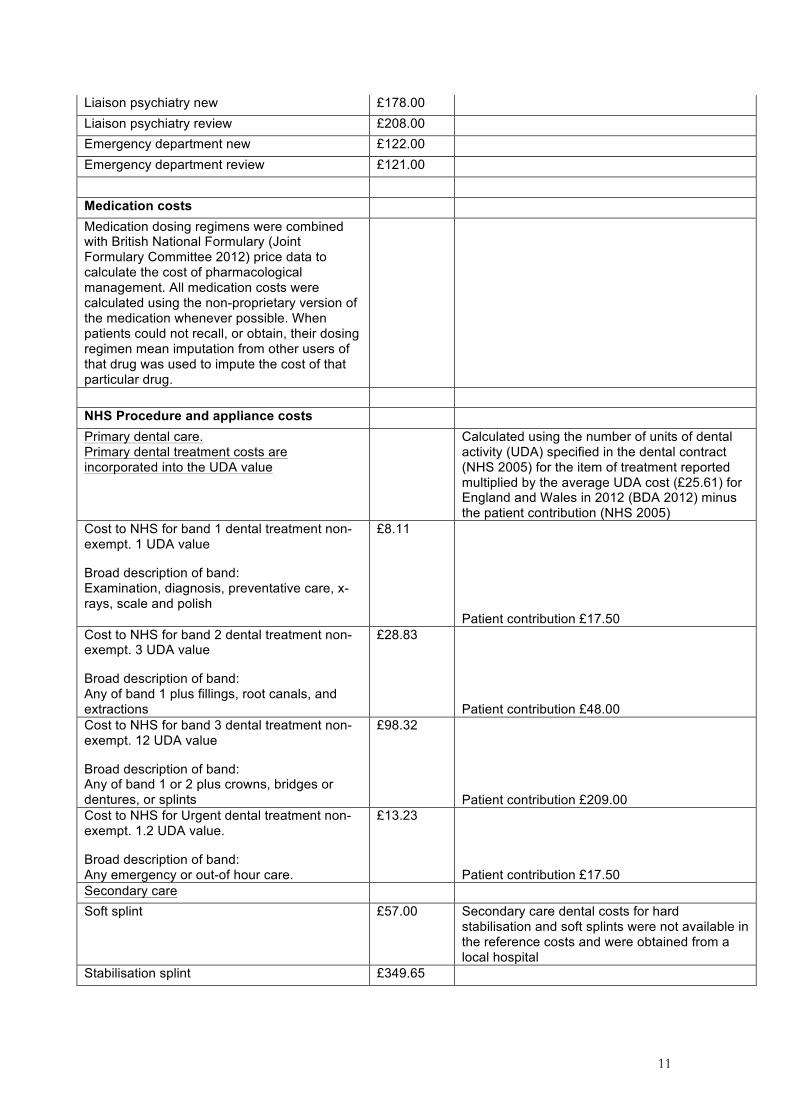
11
Liaison psychiatry new £178.00 Liaison psychiatry review £208.00 Emergency department new £122.00 Emergency department review £121.00 Medication costs Medication dosing regimens were combined with British National Formulary (Joint Formulary Committee 2012) price data to calculate the cost of pharmacological management. All medication costs were calculated using the non-proprietary version of the medication whenever possible. When patients could not recall, or obtain, their dosing regimen mean imputation from other users of that drug was used to impute the cost of that particular drug.
NHS Procedure and appliance costs Primary dental care. Primary dental treatment costs are incorporated into the UDA value
Calculated using the number of units of dental activity (UDA) specified in the dental contract (NHS 2005) for the item of treatment reported multiplied by the average UDA cost (£25.61) for England and Wales in 2012 (BDA 2012) minus the patient contribution (NHS 2005)
Cost to NHS for band 1 dental treatment non-exempt. 1 UDA value
Broad description of band: Examination, diagnosis, preventative care, x- rays, scale and polish
£8.11
Patient contribution £17.50 Cost to NHS for band 2 dental treatment non-exempt. 3 UDA value
Broad description of band: Any of band 1 plus fillings, root canals, and extractions
£28.83
Patient contribution £48.00 Cost to NHS for band 3 dental treatment non-exempt. 12 UDA value
Broad description of band: Any of band 1 or 2 plus crowns, bridges or dentures, or splints
£98.32
Patient contribution £209.00 Cost to NHS for Urgent dental treatment non-exempt. 1.2 UDA value.
Broad description of band: Any emergency or out-of hour care.
£13.23
Patient contribution £17.50 Secondary care Soft splint £57.00 Secondary care dental costs for hard
stabilisation and soft splints were not available in the reference costs and were obtained from a local hospital
Stabilisation splint £349.65
12
*Prices in pounds sterling at 2012 prices
Out-patient tooth extraction £134.00 Taken as the mean national unit value from the appropriate NHS reference cost for the financial year 2011-2012 (DoH 2012). Sensitivity analysis involved using the upper and lower bounds of the interquartile ranges
Sinus washout £1,082.00 Salivary gland surgery £3,623.00 Temporomandibular joint surgery £3,623.00 Lumbar puncture £682.00 Microvascular decompression Trigeminal nerve
£10,084.00
Ballon compression Trigeminal nerve £1,396.00
13
Table S2 – Pain history and impact
Pain characteristic or impact
Screening result for origin of pain1 MSK n=86
NP/NV n=64
COMB n=48
Total n=198
Pain history. (Mean [+/-SD])
Duration of pain/months
88.5 (±102.8)
160.9 (±173.2)
74.2 (±78.2)
108.4 (±130.3)
Total number of visits primary carea
11 (±16.9)
14 (±15.4)
14.3 (±20.2)
12.7 (±17.3)
Total number visits secondary specialist careb
7.6 (±13.8)
6.7 (±18.8)
10 (±30.8)
7.9 (±20.6)
Total number of healthcare providers seen
4.2 (±2.4)
2.8 (±2.2)
4 (±2.2)
3.7 (±2.3)
Total number of treatments attempted
4.3 (±4.1)
3.7 (±2.5)
4.8 (±4.7)
4.2 (±3.8)
Most effective treatment score (0 no effect - 10 resolved pain)
5.9 (±3.4)
7.2 (±3.2)
6.3 (±3.6)
6.3 (±3.4)
GCPS
Characteristic pain intensity (Mean [+/-SD])
53.3 (±20.9)
48.5 (±23.2)
67.5 (±17.5)
55.3 (±22.0)
n (%) GCPS grade 0 0 (0)
3 (4.7)
0 (0)
3 (1.5)
1 35 (40.7)
21 (32.8)
5 (10.4)
61 (30.8)
2a 26 (30.2)
13 (20.3)
18 (37.5)
57 (28.8)
2b 12 (14)
12 (18.8)
11 (22.9)
35 (17.7)
3 10 (11.6)
11 (17.2)
10 (20.8)
31 (15.7)
4 3 (3.5)
4 (6.2)
4 (8.3)
11 (5.6)
MPI (Mean [+/-SD])
Pain severity 42.4 (±18.7)
42.1 (±15.4)
51.6 (±20.9)
44.6 (±18.6)
Interference 38.9 (±16.3)
43.6 (±13.9)
45.3 (±14.4)
42 (±15.3)
Life control 63.5 (±19.9)
60.7 (±19.3)
56 (±20.4)
60.7 (±19.9)
Affective distress 47 (±16.1)
48.0 (±12.2)
52.9 (±18.4)
48.7 (±15.6)
Support 53.2 (±26.7)
58.7 (±27.5)
47.5 (±35.2)
53.6 (±29.3)
Punishing responses 23.6 (±26.9)
24.3 (±27.2)
32.6 (±29.8)
26.0 (±27.8)
Soliciting responses 53.5 (±20.4)
57.0 (±20.8)
51.7 (±22.6)
54.1 (±21.1)
Distracting responses 52.5 (±26.3)
40.6 (±29.7)
48.5 (±24.4)
47.7 (±27.3)
PHQ-4 score (Mean [+/-SD])
7.7 (±3.5)
6.6 (±2.9)
8.4 (±4)
7.5 (±3.5)
14
Pain characteristic or impact
Screening result for origin of pain1 MSK n=86
NP/NV n=64
COMB n=48
Total n=198
EQ-5D-5L utility value (Mean[+/-SD])
0.68 (±0.229)
0.760 (±0.188)
0.631 (±0.222)
0.694 (±0.219)
IPQ-R domain scores (Mean [+/-SD])
Timeline 4(±2.7) 3.7 (±0.7)
5.5 (±3.5)
3.6 (±0.9)
Consequences 2.7 (±1.1)
3.3 (±1.0)
3.1 (±1.1)
3 (±1.1)
Personal Control 3.1 (±0.9)
2.9 (±0.9)
3.1 (±0.8)
3.0 (±0.8)
Treatment control 3.1 (±0.9)
3.1 (±0.8)
3.2 (±1)
3.1 (±0.8)
Illness coherence 3.5 (±1.1)
3 (±1.2)
3.2 (±1.2)
3.3 (±1.1)
Timeline cyclical 3.3 (±1.1)
3.8 (±0.7)
3.6 (±1)
3.5 (±0.9)
Emotional representations
3.1 (±1.2)
3.3 (±1.1)
3.4 (±1.1)
3.2 (±1.1)
1MSK - Musculoskeletal; NP/NV - Neuropathic/vascular; COMB - Combined origin derived from screening questionnaires used at entry to study (Hapak et al. 1994; Gonzalez et al. 2011)
aPrimary care defined as any (general) medical or dental practitioner or any other allied health professional seen in the community (including physiotherapy)
bSecondary care defined as any specialist health professional seen within a hospital setting
GCPS – Graded chronic pain scale; MPI – West Haven Yale Multidimensional Pain Inventory;
IPQ-R – Illness Perceptions Questionnaire Revised form
15
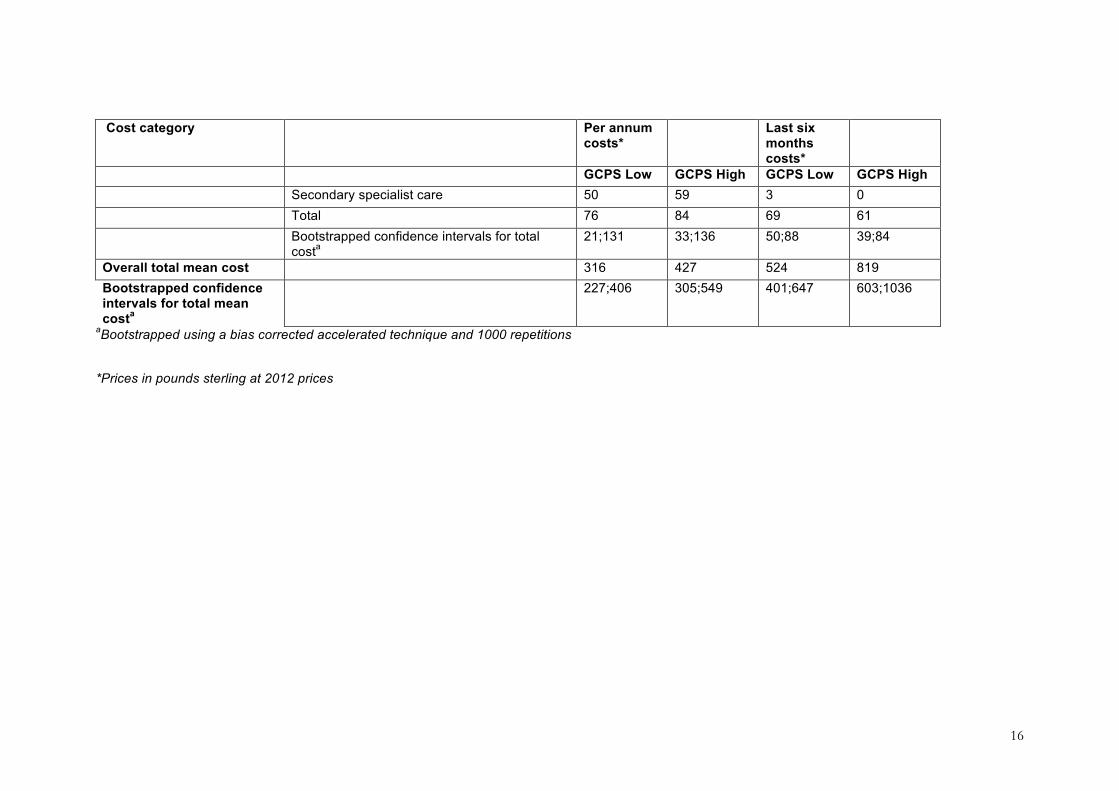
Table S3 – Mean costs by cost category and graded chronic pain status per annum and over the last six months
Cost category Per annum costs*
Last six months costs*
GCPS Low GCPS High GCPS Low GCPS High Mean consultation costs Primary medical care 79 145 152 259 Primary dental care 16 18 16 34 Physiotherapy 5 4 40 39 Secondary specialist care 134 163 260 412 Total 251 334 428 704 Bootstrapped confidence intervals for total
costa 200;303 246;423 311;545 496;913
Mean medication costs by class of drug
Simple analgesia (Paracetamol, NSAIDs) 1 1 1 2 Opioids 0 1 1 5 Antidepressants (TCA, SSRI, SNRI) 1 1 4 17 Antiepileptics 3 12 20 23 Migraine abortives and prophylactics
(excluding antiepileptics) 1 2 1 5
Topical therapy 0 0 0 1 Anxiolytics 0 0 0 0 Total 6 16 27 54 Bootstrapped confidence intervals for total
costa 3;9 8;25 10;44 24;84
Mean appliance and intervention costs
Primary dental care 12 15 66 61
16
Cost category Per annum costs*
Last six months costs*
GCPS Low GCPS High GCPS Low GCPS High Secondary specialist care 50 59 3 0 Total 76 84 69 61 Bootstrapped confidence intervals for total
costa 21;131 33;136 50;88 39;84
Overall total mean cost 316 427 524 819 Bootstrapped confidence intervals for total mean costa
227;406 305;549 401;647 603;1036
aBootstrapped using a bias corrected accelerated technique and 1000 repetitions
*Prices in pounds sterling at 2012 prices
17
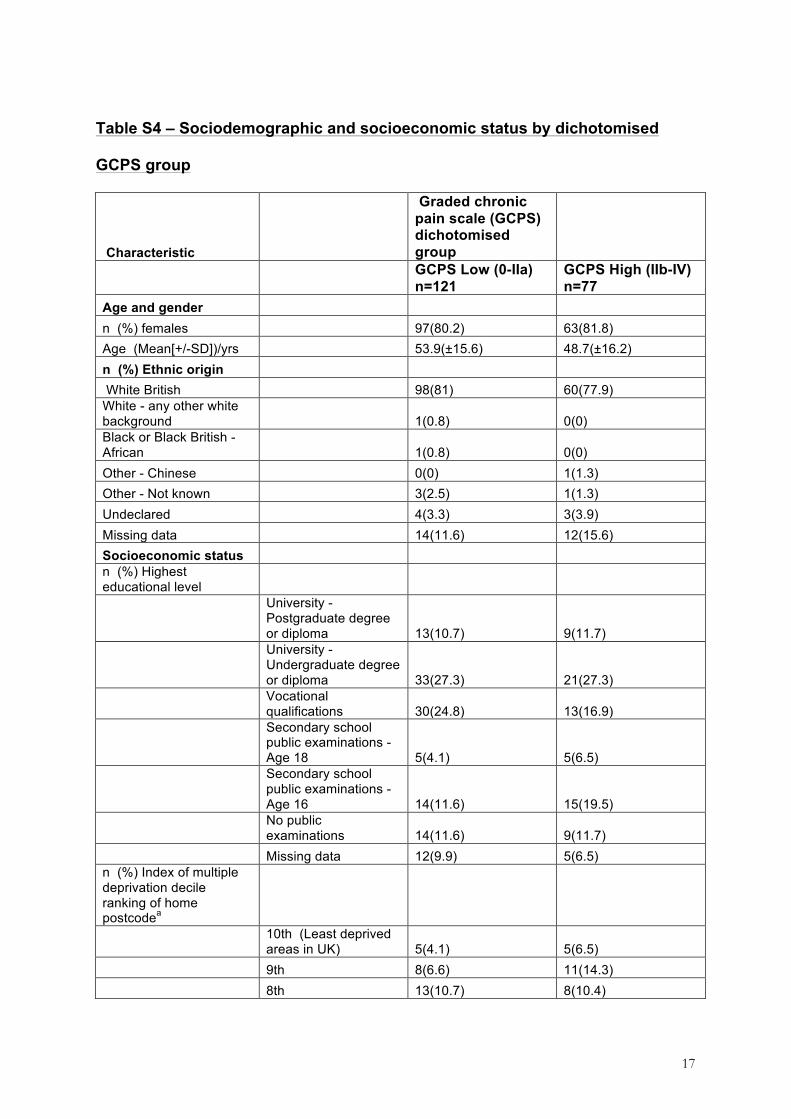
Table S4 – Sociodemographic and socioeconomic status by dichotomised
GCPS group
Characteristic
Graded chronic pain scale (GCPS) dichotomised group
GCPS Low (0-IIa) n=121
GCPS High (IIb-IV) n=77
Age and gender
n (%) females !! 97(80.2) 63(81.8) Age (Mean[+/-SD])/yrs !! 53.9(±15.6) 48.7(±16.2) n (%) Ethnic origin White British !! 98(81) 60(77.9) White - any other white background !! 1(0.8) 0(0) Black or Black British - African !! 1(0.8) 0(0) Other - Chinese !! 0(0) 1(1.3) Other - Not known !! 3(2.5) 1(1.3) Undeclared !! 4(3.3) 3(3.9) Missing data !! 14(11.6) 12(15.6) Socioeconomic status n (%) Highest educational level
University - Postgraduate degree or diploma 13(10.7) 9(11.7)
University - Undergraduate degree or diploma 33(27.3) 21(27.3)
Vocational qualifications 30(24.8) 13(16.9)
Secondary school public examinations - Age 18 5(4.1) 5(6.5)
Secondary school public examinations - Age 16 14(11.6) 15(19.5)
No public examinations 14(11.6) 9(11.7)
Missing data 12(9.9) 5(6.5) n (%) Index of multiple deprivation decile ranking of home postcodea
10th (Least deprived areas in UK) 5(4.1) 5(6.5)
9th 8(6.6) 11(14.3) 8th 13(10.7) 8(10.4)
18
Characteristic
Graded chronic pain scale (GCPS) dichotomised group
GCPS Low (0-IIa) n=121
GCPS High (IIb-IV) n=77
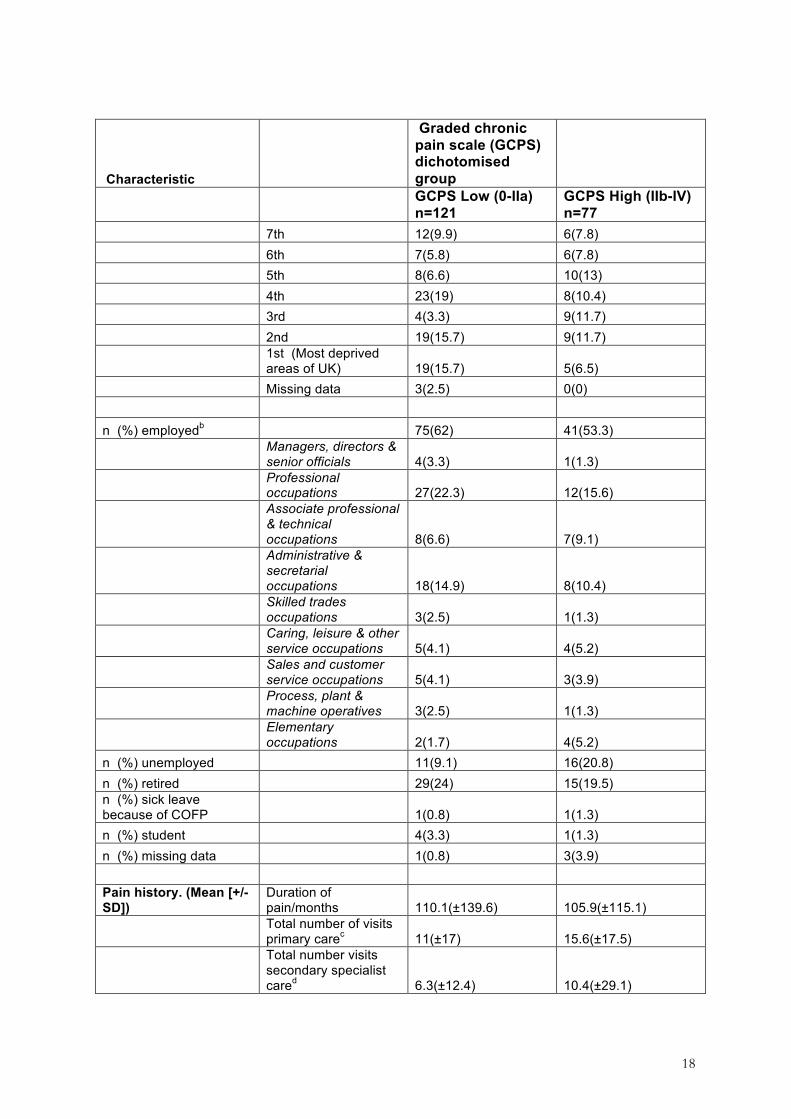
7th 12(9.9) 6(7.8) 6th 7(5.8) 6(7.8) 5th 8(6.6) 10(13) 4th 23(19) 8(10.4) 3rd 4(3.3) 9(11.7) 2nd 19(15.7) 9(11.7)
1st (Most deprived areas of UK) 19(15.7) 5(6.5)
Missing data 3(2.5) 0(0) n (%) employedb 75(62) 41(53.3)
Managers, directors & senior officials 4(3.3) 1(1.3)
Professional occupations 27(22.3) 12(15.6)
Associate professional & technical occupations 8(6.6) 7(9.1)
Administrative & secretarial occupations 18(14.9) 8(10.4)
Skilled trades occupations 3(2.5) 1(1.3)
Caring, leisure & other service occupations 5(4.1) 4(5.2)
Sales and customer service occupations 5(4.1) 3(3.9)
Process, plant & machine operatives 3(2.5) 1(1.3)
Elementary occupations 2(1.7) 4(5.2)
n (%) unemployed 11(9.1) 16(20.8) n (%) retired 29(24) 15(19.5) n (%) sick leave because of COFP 1(0.8) 1(1.3) n (%) student 4(3.3) 1(1.3) n (%) missing data 1(0.8) 3(3.9) Pain history. (Mean [+/-SD])
Duration of pain/months 110.1(±139.6) 105.9(±115.1)
Total number of visits primary carec 11(±17) 15.6(±17.5)
Total number visits secondary specialist cared 6.3(±12.4) 10.4(±29.1)
19
Characteristic
Graded chronic pain scale (GCPS) dichotomised group
GCPS Low (0-IIa) n=121
GCPS High (IIb-IV) n=77
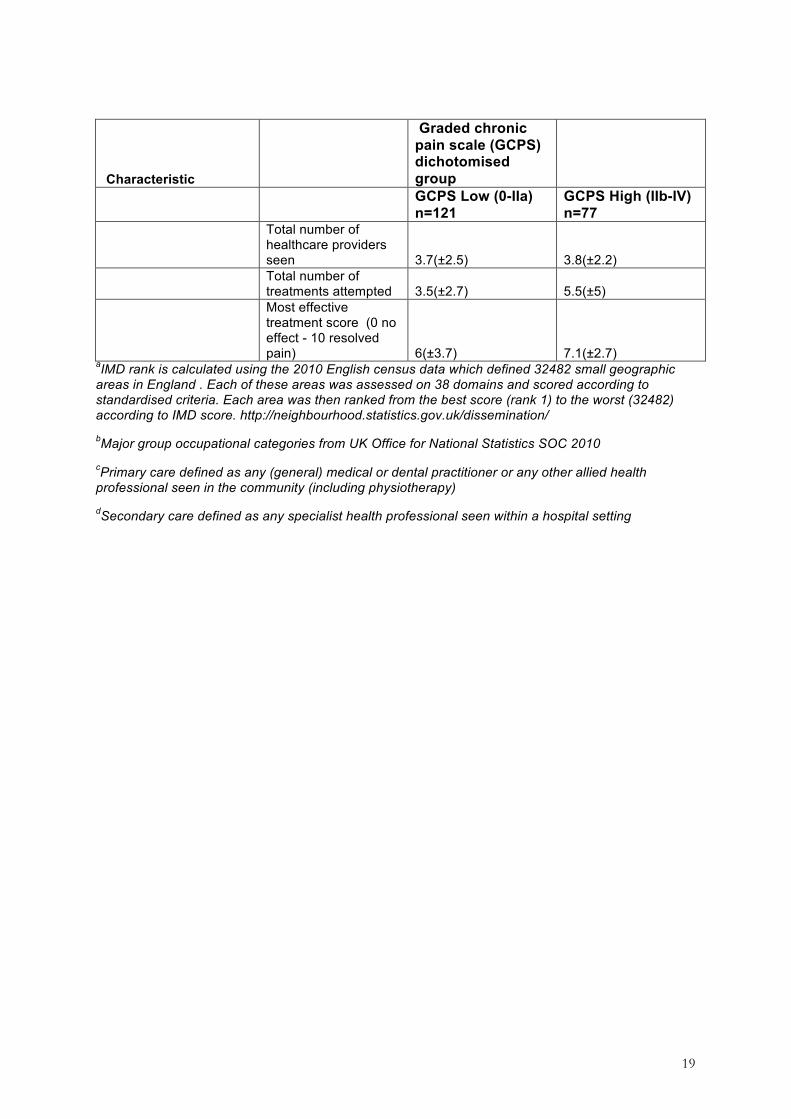
Total number of healthcare providers seen 3.7(±2.5) 3.8(±2.2)
Total number of treatments attempted 3.5(±2.7) 5.5(±5)
Most effective treatment score (0 no effect - 10 resolved pain) 6(±3.7) 7.1(±2.7)
aIMD rank is calculated using the 2010 English census data which defined 32482 small geographic areas in England . Each of these areas was assessed on 38 domains and scored according to standardised criteria. Each area was then ranked from the best score (rank 1) to the worst (32482) according to IMD score. http://neighbourhood.statistics.gov.uk/dissemination/
bMajor group occupational categories from UK Office for National Statistics SOC 2010
cPrimary care defined as any (general) medical or dental practitioner or any other allied health professional seen in the community (including physiotherapy)
dSecondary care defined as any specialist health professional seen within a hospital setting

20
References
Andreu, Y, Galdon, MJ, Durá, E, Ferrando, M, Pascual, J, Turk, DC, Jiménez, Y, Poveda, R. 2006. An examination of the psychometric structure of the Multidimensional Pain Inventory in temporomandibular disorder patients: a confirmatory factor analysis. Head Face Med 248.
BDA. 2012. Freedom of information request from Department of Health 2012 - average UDA value for England and Wales.
Bergström, KG, Jensen, IB, Linton, SJ, Nygren, AL. 1999. A psychometric evaluation of the Swedish version of the Multidimensional Pain Inventory (MPI-S): a gender differentiated evaluation. Eur J Pain 3(3):261–273.
Brocklehurst, PR, Tickle, M. 2011. Is skill mix profitable in the current NHS dental contract in England? Br Dent J 210(7):303–308.
DoH. 2012. NHS reference costs: financial year 2011 to 2012.
Dworkin, RH, Turk, DC, Farrar, JT, Haythornthwaite, JA, Jensen, MP, Katz, NP, Kerns, RD, Stucki, G, Allen, RR, Bellamy, N. 2005. Core outcome measures for chronic pain clinical trials: IMMPACT recommendations. Pain 113(1-2):9–19.
Elliott, AM, Smith, BH, Penny, KI, Smith, WC, Chambers, WA. 1999. The epidemiology of chronic pain in the community. Lancet 354(9186):1248–1252.
Gonzalez, YM, Schiffman, E, Gordon, SM, Seago, B, Truelove, EL, Slade, G, Ohrbach, R. 2011. Development of a brief and effective temporomandibular disorder pain screening questionnaire: reliability and validity. J. Am. Dent. Assoc. 142(10):1183–1191.
Hapak, L, Gordon, A, Locker, D, Shandling, M, Mock, D, Tenenbaum, HC. 1994. Differentiation between musculoligamentous, dentoalveolar, and neurologically based craniofacial pain with a diagnostic questionnaire. J Orofac Pain 8(4):357–368.
HSCIC. 2014. Dental earnings and expenses 2012/13 initial analysis.
Joint Formulary Committee. 2012. British National Formulary. London: BMJ Group and Pharmaceutical Press.
Kerns, RD, Turk, DC, Rudy, TE. 1985. The West Haven-Yale Multidimensional Pain Inventory (WHYMPI). Pain 23(4):345–356.
Kroenke, K, Spitzer, RL, Williams, JB. 2003. The Patient Health Questionnaire-2: validity of a two-item depression screener. Med. Care 41(11):1284–1292.
Kroenke, K, Spitzer, RL, Williams, JB, Lowe, B. 2009. An ultra-brief screening scale for anxiety and depression: the PHQ-4. Psychosomatics 50(6):613–621.
Kroenke, K, Spitzer, RL, Williams, JB, Monahan, PO, Lowe, B. 2007. Anxiety disorders in primary care: prevalence, impairment, comorbidity, and detection. Ann. Intern. Med. 146(5):317–325.
Kroenke, K, Spitzer, RL. 2002. The PHQ-9: a new depression diagnostic and severity measure. Psychiatr Ann 32(9):1–7.
Lowe, B, Kroenke, K, Grafe, K. 2005. Detecting and monitoring depression with a two-item questionnaire (PHQ-2). J Psychosom Res 58(2):163–171.
Lowe, B, Wahl, I, Rose, M, Spitzer, C, Glaesmer, H, Wingenfeld, K, Schneider, A, Brahler, E. 2010. A 4-item measure of depression and anxiety: validation and standardization of the Patient Health Questionnaire-4 (PHQ-4) in the general population. J Affect Disord 122(1-2):86–95.
21
Moss-Morris, R, Weinman, J, Petrie, KJ, Horne, R, Cameron, LD, Buick, D. 2002. The revised illness perception questionnaire (IPQ-R). Psychology & Health 17(1):1–16.
NHS. 2005. National Health Service (General Dental Services Contracts) Regulations.
Simons, CL, Rivero-Arias, O, Yu, L-M, Simon, J. 2014. Multiple imputation to deal with missing EQ-5D-3L data: Should we impute individual domains or the actual index? Quality of Life Research 1–11.
Sniehotta, FF, Gorski, C, Araujo-Soares, V. 2010. Adoption of community-based cardiac rehabilitation programs and physical activity following phase III cardiac rehabilitation in Scotland: a prospective and predictive study. Psychol Health 25(7):839–854.
Spitzer, RL, Kroenke, K, Williams, JBW, L?we, B. 2006. A brief measure for assessing generalized anxiety disorder: the GAD-7. Archives of internal medicine 166(10):1092–1097.
van Hout, B, Janssen, MF, Feng, YS, Kohlmann, T, Busschbach, J, Golicki, D, Lloyd, A, Scalone, L, Kind, P, Pickard, AS. 2012. Interim scoring for the EQ-5D-5L: mapping the EQ-5D-5L to EQ-5D-3L value sets. Value Health 15(5):708–715.
Wordsworth, S, Thompson, S. 2001. An annotated cost questionnaire for patients: results of piloting. HERU Dicussion Paper 03/01