Residents' Satisfaction with Residential Property Management ...
Upload
dukemedschoolCategory
view
0download
0
Health Services Access and Useamong Older Adults in North Carolina:Urban vs Rural Residents
Dan G. Blazer, MD, PhD, Lawrence R. Landerman, PhD,Gerda Fillenbaum, PhD, and Ronnie Homer, PhD
IntroductionDelivery of health services to persons
experiencing barriers to access has beencentral to discussions of health carereform.'-3 Older persons in rural areashave been hypothesized to be at especiallyhigh risk of inadequate health care.Nevertheless, national surveys reveal thatuse of health services is unrelated toeither urban or rural residence. Whilesuch surveys comparing urban and ruralresidents may indicate the national situa-tion accurately, they do not take intoaccount the diversity that exists withineach setting.' Region-specific compari-sons of urban vs rural use of andsatisfaction with health services by olderadults will help us assess the impact ofresidence on these individuals, who havevirtually universal health insurance cover-age but may be especially handicapped interms of access to services located at somedistance from their homes.
The South has the highest numberand highest percentage of rural residentsof the four major regions of the UnitedStates. Older persons in the rural Southmay be at particular risk for poor accessbecause of the larger number of Blacksand persons of lower socioeconomic sta-tus.2'4'5 Transportation to health careservices may be a barrier to servicedelivery in rural areas. The rural South,however, is more densely populated thanother rural regions, so residents are morelikely to be within reasonable drivingdistance of comprehensive health services(30 to 90 minutes), including majormedical centers.2'5'6 This may offset sparse,substandard, and noncomprehensive ser-
vices.2 Most older persons are covered byMedicare, and their access to servicesshould therefore be less limited than that
of persons in middle age who are morelikely to lack health insurance.
Considerable literature has emergeddescribing poorer health and lower use ofhealth services in the rural United States.Rural residents are characterized by lowmortality but relatively high rates ofchronic disease.3'7'8 Physician use amongrural elderly people continues to lagbehind use among urban elderly people,even though there is almost universalhealth coverage.3 Rural elderly peoplereport more hospital discharges butshorter lengths of stay than do their urbancounterparts.3 Possibly, older persons liv-ing in rural areas tend to postpone healthcare visits until their symptoms are moresevere. In addition, health care profession-als may be more likely to admit olderpersons from rural areas to hospitals,given concem about these patients' accessto emergency services if they remain athome.
In this study, we compared healthservice use and barriers to health care ofolder adults living in urban as compared
Dan G. Blazer, Lawrence R. Landerman, andGerda Fillenbaum are with the Department ofPsychiatry and the Center for the Study ofAging and Human Development, Duke Univer-sity Medical Center, Durham, NC. RonnieHorner is with the Center for the Study ofAging and Human Development, Duke Univer-sity Medical Center, and the Health ServicesResearch Center, Veterans AdministrationHospital, Durham.
Requests for reprints should be sent toDan G. Blazer, MD, PhD, Box 3005, DukeUniversity School of Medicine, Durham, NC27710.
This paper was accepted May 24, 1995.Note. The views expressed here are the
authors' and do not necessarily reflect those ofthe US Department of Health and HumanServices, nor does mention of trade names,commercial products, or organizations implyendorsement by the US government.
October 1995, Vol. 85, No. 10

Barriers to Services
with rural counties of the North CarolinaPiedmont. North Carolina has the secondlargest rural population in the UnitedStates.3 Forty-five percent of the popula-tion lived in nonmetropolitan areas in1987 (as compared with 23% of the USpopulation). In a representative sample ofnearly 4200 older adults in the Piedmontarea of North Carolina, we examinedextent of use of health services, perceivedbarriers to such use, continuity of healthcare, and satisfaction with health care.
The Andersen model of access to healthcare was followed as a conceptual frame-work for these analyses.2 Predisposingfactors (age, sex, race, education), en-
abling factors (income, insurance cover-
age, residence), and need factors (self-rated health and general health status)were included in multivariate modeling.
MethodsData from the baseline (1986/87)
cross-sectional survey of the Duke Estab-lished Populations for Epidemiologic Stud-ies of the Elderly cohort were analyzed.The sample, stratified by race and resi-dence, yielded 4162 respondents (80%response rate). The sample was represen-
tative of more than 28 000 persons 65years of age and older who, at the time ofthe survey, resided in five adjacent coun-
ties (Durham, Granville, Vance, Warren,and Franklin) in the northeastern Pied-mont of North Carolina.9'10 DurhamCounty is primarily urban, with a richarray of medical services; the other fourcounties are rural and medically under-served. The sample was fairly evenlydivided between the one urban and thefour rural counties and between Blacksand non-Blacks (non-Blacks almost exclu-sively consisting of White individuals),and all socioeconomic levels were repre-
sented. As a result of lack of informationon some measures of interest, 161 proxyinterviews were excluded, leaving 4001respondents available for analysis. Rel-evant characteristics of the urban andrural populations are given in Table 1. Allpersons residing in these four counties are
within a 1.5-hour driving distance of majormedical centers.
Urban/rural residence was coded bycounty and, alternatively, by the census
definition of rural residence (place ofresidence with fewer than 2500 inhabit-ants). The two methods of analysis pro-duced similar results for most variables,except as noted later. Therefore, resultsare presented by county of residencebecause this is the more meaningful
planning unit. Sex, race, education, in-come, marital status, employment status,and current insurance coverage were
assessed by self-report. Subjects were alsoasked to rate their health as excellent,good, fair, or poor (on a scale of one tofour, with one indicating excellent health).In addition, reports of chronic illness andother related information were used toconstruct a scale indicating status ofhealth, with lower scale scores indicatingbetter health status.1' Family income was
represented by two dummy variablescomparing residents at middle ($4500 to$8500) and high (more than $8500)income levels with those reporting lessthan $4500 per year.
As a means of identifying barriers tohealth care, subjects were first asked, "Doyou put off or neglect going to the doctorwhen you feel you really should go?"Those who put off care were askedwhether they did so because they were
"concerned about cost," because of "dis-tance or transportation," or because theywere "unsure where to go for help."Dummy variables were coded for each ofthese categories. A four-level respondentrating of satisfaction with "medical care
that you receive" was also used (onerepresenting "very dissatisfied" and fourrepresenting "very satisfied").
Continuity of care was determined bywhether the subject reported usuallyseeing the same provider. Providers weredistinguished as either hospital based or
not hospital based. Health care use was
determined by an outpatient medical visit
or a night in the hospital during the year
preceding the survey. Using squared terms,we tested whether our continuous mea-
sures (age, education, health status, andself-rated health) were linear in theirassociation with each outcome. Nonlinearassociations were present between healthstatus and any medical visit and any
hospitalization and between self-ratedhealth and site of care, number of medicalvisits, and number of nights in a hospital.To model these nonlinearities, we useddummy variables (coded 1 for poor healthstatus or poor self-rated health in relevantequations).
Ordinary least squares and logisticregression analyses were used to modelthe effects of predictors on continuousand dichotomous outcomes, respectively.In multivariate regression models, demo-graphic, socioeconomic, and then otherpotential covariates were added hierarchi-cally to an initial model containing onlycounty of residence. An examination ofrelevant diagnostics (tolerances) for countyof residence, in addition to all covariatestaken together, indicated that multicol-linearity was not a problem with theseregression models. Because the DukeEstablished Populations for Epidemio-logic Studies of the Elderly data were
based on a complex stratified samplingdesign, we retested the significance of all
results using specialized software devel-
oped by Holt12 (for ordinary least squares)and Shah et al.13 (for logistic regression).This specialized software was used to
estimate F values and confidence intervals
American Journal of Public Health 1385October 1995, Vol. 85, No. 10
TABLE 1 -Demographic and Heafth Care Characteristics of the Study's Urban(Durham) and Rural Counties, North Carolina
County
Durham Vance Granville Franklin Warren
Populationa 161 625 38320 36663 32777 16399Rural population, %b 19.8 63.2 65.2 89.2 100.0Average per capita 12 471 9 157 8 592 8 604 8 347
income, $aWhite, %a 59.6 54.9 54.6 58.3 34.9Population per active 149 1 198 705 2049 1 640
physicianaPopulation per active 471 2555 1 358 2521 2 733
primary care physi-ciana
Population per active 50 435 133 585 683registered nursea
General hospital 1 569 76 132 100 37beds, no.
aDerived from North Carolina Health Manpower Databook.'6bA rural area, according to the US Bureau of the Census definition, is a location with fewer than 2500
inhabitants. The figures indicate the proportion of a county's residents living in a rural area.

Blazer et al.
reported in the tables. Measures of ruralresidence involved no missing data; how-ever, several covariates had missing val-ues. For items with fewer than 1%missing, we imputed the mean prior toanalyzing the data. For items involving1% or more missing data (income hadalmost 18% missing), we used stochasticregression imputation techniques.'4,15 Withthese techniques, the imputed value con-
sists of the regression estimate plusrandom error. Error is added in order toestimate the variance as well as the meanof the imputed variable and, thus, tominimize bias in significance testing. Tocheck for potential bias associated withimputation, we reestimated our regres-
sion models using only complete cases.
The results were essentially the same as
those reported in Tables 4 and 5.
ResultsCounty of residence was related to
several demographic and social character-istics (see Table 2). Durham is primarilyan urban county, with 16% of olderresidents living in census-defined ruralareas; the other four counties are primar-ily rural. Elderly residents of the ruralcounties were more likely to be Black andto lack Medicare coverage (but they weremore likely to have Medicaid), and theywere less likely to have private healthinsurance. Education and income tended
to be lower in these counties, and self-rated health status tended to be poorer.
Table 3 presents bivariate associa-tions between county of residence and theoutcome measures. In comparison withthose in Durham County, rural residentswere less likely to obtain outpatient care
at a hospital-based setting and more likelyto obtain care at a nonhospital setting.They were more likely, in the previousyear, to have had at least one ambulatoryvisit (and to have had more such visits)and to have spent at least one night in a
hospital. Rural residents were also more
likely to have put off care as a result ofcost or transportation difficulties. Therewere differences among the counties (butnot reflecting the urban or rural nature ofthe county) with respect to having a usualprovider and satisfaction with care re-
ceived. Those residents who reportedhaving a usual provider tended to indicatethat that provider resided in the same
county in which they did (among non-
Blacks and Blacks, the respective percent-ages were 96% and 93% in Durham, 78%and 76% in Franklin, 74% and 78% inGranville, 89% and 80% in Vance, and41% and 46% in Warren). We do not
know whether that provider was officebased or hospital based; however, Warrenis the only county without a major healthcare center.
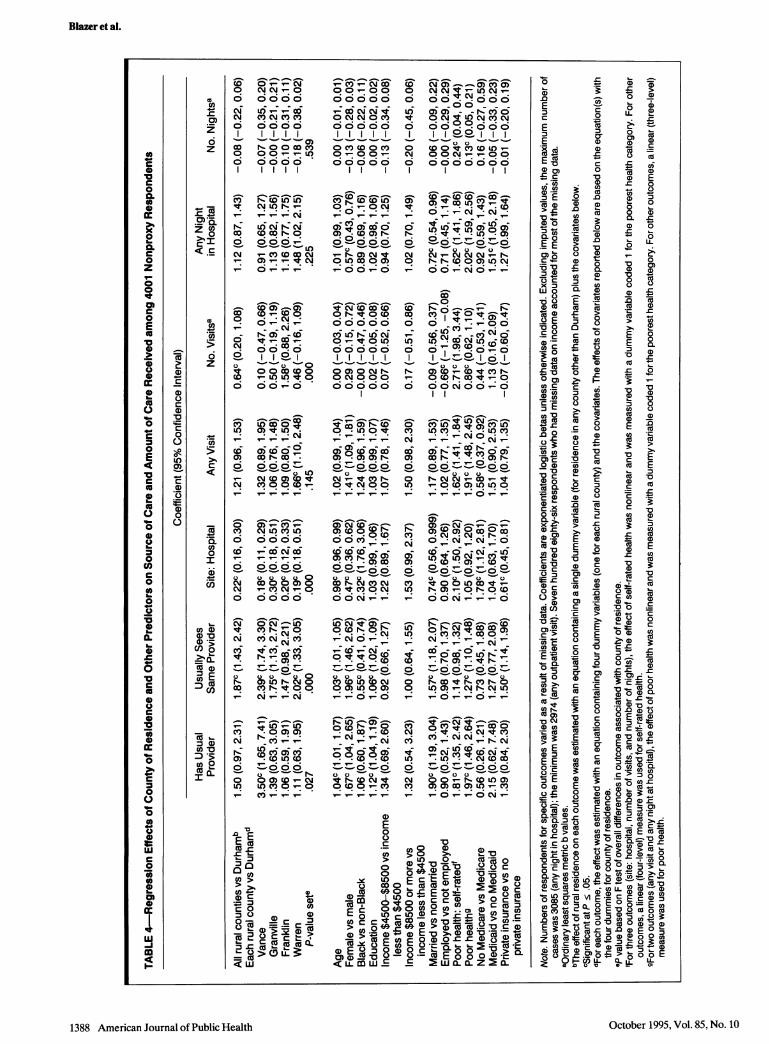
Table 4 presents regression effects ofcounty of residence on seven measures of
health care use after adjustment forrelevant control variables. Exponentiatedlogistic betas indicating the change in therelative odds of an event associated with a
predictor are given for five outcomes.Residents of rural counties were less
likely to obtain health care at a hospital.Reports of having a usual provider (ameasure of continuity of care) appearedto vary by county rather than by specificurban vs rural residence. However, ruralresidents were more likely to reportseeing the same provider. Contrary to ourexpectation, rural residents had, on aver-
age, a higher rather than a lower numberof ambulatory care visits. In addition,persons in Warren County (the most ruralcounty) were more likely to have spent a
night in the hospital.The effects of the covariates are also
provided in Table 4. Need for care (asmeasured by self-rated health and thehealth index) had substantial and signifi-cant effects on virtually all of the serviceuse variables. Predisposing factors (age,gender, education, marital status) hadweaker and less consistent effects. Olderrespondents, women, and married respon-dents were all more likely to have a usualprovider and less likely to receive outpa-tient treatment at a hospital setting.Blacks, on the other hand, were more
likely to receive outpatient services at a
hospital. Women were more likely to
report an outpatient visit but less likely to
October 1995, Vol. 85, No. 101386 American Journal of Public Health
TABLE 2-Demographic, Health, and Health Care Characteristics of Sample, by County
Rural CountiesDurham All RuralCounty Countiesa Vance Granville Franklin Warren Total
Rural, % 16.3 73.5 53.1 67.4 86.5 100.0 43.3Female, % 62.8 61.8 59.5 62.4 61.9 64.6 62.3Black, % 31.3 39.8 37.6 39.9 31.7 56.4 35.3Married, % 51.8 50.6 49.5 51.2 49.1 54.0 51.2Currently employed, % 12.4 11.6 9.0 11.7 14.2 11.7 12.0Without Medicare, %b 3.5 5.4 3.9 7.9 3.9 6.1 4.4On Medicaid, %C 4.6 7.5 7.4 4.7 10.3 8.0 5.9Private insurance, %d 70.2 52.9 51.3 57.0 58.1 40.3 59.5Age, y, mean 73.5 73.3 73.0 72.9 73.8 73.5 73.4Education, y, mean 9.8 8.5 8.5 8.7 8.0 8.8 9.2Income, $, mean 14 899 9981 10 758 9904 9820 8985 12 582Poor health (self-rated), mean 2.3 2.5 2.6 2.5 2.5 2.6 2.4Poor health (index), mean 0.9 0.9 0.9 1.0 1.1 0.9 0.9
Total no. 2 010 2152 655 543 540 414 4 162% of sample 52.9 47.1 13.8 13.3 12.3 7.7 100
Note. Percentages and means were weighted.aAverage percentage or mean for the four rural counties combined.bThis dummy variable compared those without Medicare coverage with all others.cThis dummy variable compared those on Medicaid with all others.cThis dummy variable compared those with private insurance with all others. Note that this and the other two insurance dummies are not exclusive and thusdo not sum to 100%.

Barriers to Services
report an overnight stay at a hospital.Employed respondents were less likely toreport an outpatient visit. Absence ofMedicare coverage reduced the odds of a
visit for medical care but increased theodds of receiving outpatient care in a
hospital setting. Medicaid coverage in-creased the odds of spending at least onenight in the hospital. Private insurancereduced the odds of receiving outpatientcare at a hospital rather than at a privateor clinic setting. More than 95% ofrespondents reported Medicare coverage,
and this presumably accounted for theabsence of income effects on use. Beingfemale and White, better educated, and inpoorer health and having private healthinsurance were associated with seeing thesame provider.
Table 5 presents the effects of ruralresidence on perception of problems inaccessing care, satisfaction with care, andself-rated health. In comparison withpersons in Durham County, rural resi-dents were about 1.5 times more likely to
put off care because of cost; with covari-ates controlled, however, transportationwas not an issue.
Regardless of where people lived,they knew where to go for medical care.
Satisfaction with care was associated with
specific county of residence but not
necessarily with the urban or rural natureof the county. Rural residents reportedpoorer self-rated health after adjustmentfor socioeconomic and demographic con-
trols, while the health index was unrelatedto county of residence.
Those reporting poor self-ratedhealth were more likely to put off care andwere less satisfied with the care theyreceived. Older respondents were lesslikely to put off care because of cost andless likely to report poor self-rated health.Women were more likely to put off care
and were in poorer health according tothe health index. Blacks were less likely toput off care because of cost. The more
educated were less likely to put off care,
more satisfied with the care received, andin better health (by self-rated measures).High-income respondents were less likelyto put off care because of cost and were inbetter health. Married respondents were
less likely to put off care because oftransportation problems, as were em-
ployed respondents. The latter were morelikely to put off care because they did notknow where to go, and they were in betterhealth. Medicaid coverage reduced theodds of putting off care because of costs,while private insurance was associatedwith higher self-rated health. We testedfor interactions of county residence withrace, income, and health. The results ofthese interaction tests were all negative.
Because our 13 dependent variablesrequired us to perform multiple tests foreach predictor, some significant effects inTables 4 and 5 may be due to an inflated
type I error rate. The following significant(P = .05) county-of-residence effects be-
came nonsignificant when a Bonferroni-adjusted significance level (.05/13 = .0038)was used: satisfaction with care (VanceCounty), poor self-rated health (Vance
County and residence in a rural county),usually sees same provider (GranvilleCounty), put off care because of cost(Granville and Warren counties), poor
health (Franklin County), any health care
visit (Warren County), and any night inthe hospital (Warren County). Treatingthese effects as nonsignificant would notsubstantially alter the basic conclusionspresented below.
DiscussionAmong elderly people in urban and
rural counties in North Carolina, inpa-tient and ambulatory health service use
did not vary by urban vs rural residence incontrolled analyses, except for one ruralcounty; this finding was contrary to theexpectation that outpatient service use
would be lower among rural-dwellingelderly individuals. The site from whichmedical service was received did differ:rural residents were distinctly less likely toobtain care in a hospital setting unlessthey were Black. We were unable todetermine the specific site of care
(whether, for instance, a rural elderlyresident received ambulatory care in an
urban area). Poor health, whether subjec-tively or objectively determined, was a
significant predictor of service use, as was
female gender. Regarding barriers to
care, cost remained a reason for delaying'care in the rural counties, althoughMedicare was widespread. Problems with
transportation were not significantlygreater in rural counties, although the
American Journal of Public Health 1387October 1995, Vol. 85, No. 10
TABLE 3-Elderly Residents' Health Care Use, by County
Rural CountiesDurham All RuralCounty Countiesa Vance Granville Franklin Warren Total
Has usual provider, % 95.0 96.4 98.3 96.0 95.2 95.2 95.7Usually sees same provider, % 82.2 87.6 90.1 86.8 85.9 87.1 84.8Hospital-based site, % 22.3 7.4 6.3 9.6 6.1 7.9 15.2Non-hospital-based site, % 72.8 88.9 92.0 86.4 89.1 87.3 80.4Any health care visit, % 79.6 82.6 83.5 80.7 81.3 87.0 81.1Any night in hospital, % 16.0 18.7 15.8 18.5 20.0 22.0 17.3Put off care due to cost, % 14.3 24.9 27.6 24.2 22.3 25.5 19.4Put off care due to transportation 5.8 9.8 8.5 10.5 10.4 10.3 7.7
difficulties, %Put off care due to not knowing 4.5 4.8 3.4 5.6 4.7 6.0 4.6where to go, %
No. health care visits,b mean 4.8 5.8 5.0 5.5 7.0 5.7 5.3No. nights in hospital,c mean 1.4 1.4 1.5 1.5 1.4 1.3 1.4Satisfaction with health care, mean 3.3 3.2 3.1 3.3 3.5 3.0 3.3
Note. Percentages and means were weighted.aAverage percentage or mean for the four rural counties combined.bAmong respondents with at least one visit.cAmong respondents with at least one overnight stay.
NN'-0
U)iCY _DCN C CY C CO66oci66c
o 00ico0()0 0 0 Ch-
6i 6 66cc
CO r- c U)L),t CM LO rl _r_- _: _: _ CM
L c r ciCDCDr-00
CM - C)CO C CN- O) -- C
-ClD a) CDc OC CD O
_CY
Oi-0-000o01- LO U' 14 0
ct O) 00 0 coO
0D) lr- LOO000-
N6 cVi c
ur) co F. co
0) c O)I-
CJ) 0N) C
O CM LO OV Lo
6666CYl SO 6 6 CO _
C2 6-6CO
0000L
cm-0C
C 1-
i- .C
oo m 0 0tg 8
C\iv_: CM
O LO0 L0
LO O M-U)
C1) 0)>
2- -- 0O
o 00iC-
>)L
-cci
co
Co L- co Ot
5 L"
Ou oc oQ
-0 N N
0 Cm CD 0 Cf)0 -0 0 -r-
0 *i-O-
0i ) d*c6-
i-I"~ co0 ,
0 000C0
_, _ _ _c c
C'iL6RNo P-lq 0 coa
0 N tS 0 tDOi ci C O C5
'It I0 Il CD
00000N
0 L U)0 N
Oi c6 60) 0) 1-
0 N COO
cl iF0 ) co@
cei oi
*)lt V *0 cm
LO N Ve CD
. _ . .
0^
C~) CD CD
O-O
0 LO 0 0)
c6ioOCLO -CD
C? c o co
lot - co cm0 CON0 VN4w -CDON~O O N--
a)
E0
C.)C
0 NNa- 0)N6 66~-
o) o o CNo o o
OC
0 oo°°ooo
O0 CV U) _N OONi_-_-00
00 *00
o- i -ULO CY)
N N_NCNN N-
-00'-NO_ _-
~~0
0D 0-i---CV)
-I C'N)O **0 _ OO
LO LO co Cm Lo _o
C_ _)C?--.U___
a)co _-CD-0)C-CO O NO -
06 -N CDU) Co 0 a)
0
0) -
0 -N h
_6 co __CL
U) _q co 0) u u oN-___--i-
C2., cC; ci C;C,
P- 0--0 I-0
N ,-t -0
N ° _ N rN LO
-U)t -NCN
0- ---
o°4o _o _o
cl rl. CF O(
NM 0 0i-r-CD)COLO0)
LO 0N00 0
E >V00
!C) 0 >0 Cort
o~ N 0 c co :E N U)
>0
-X N >N
E _ -=_
~0 >~x a0 )0 0c. .E .
C _IO__% ON
1388 American Journal of Public Health
Blazer et al.
(3
co0)
wt
4-
w3
c)
U-
cm
amw
00QL
-c
0
C
*0
U0
-
o
0
0
OD
w
a)
w
0C.
C
-C
c
a)
C
0
0
0
6z
Q>% 0c I< .C
co
0
.e
en
6Z
Q
0
I
CD)
Ci)00._
CD
= a.
cno
-s
=n E_3 c#
a)
en
D.I
I2
coca)
C
a)
ur
O.-
C
*0C.0"I
LU)0)
C
a)
a)
0
w
o
U.
~0
a)
42
o
~0
IL
co
E
c
a)
w
c
2oo
a)0
-c
8
a)-0
*3w
0t
0
o
0
la
0
CL
E
0
0
E0
0
I-
0
-o
0
E
:t
0
0
0
00
0
0
0
c
0
0
C
0
LU0i
-o
ECEE
E
> D
E E0
wo ,
.0 c-00
0.-c00)
~0
c0
0) 0
-c
a) c
0
.C
0'D a)*e
a)0
0o
cO0xu
x
Qa)0. - E0C
OD w
t c .c0 D co0>
.0
.ecUMWCE~ 0
0 :C:
0 C-0
O CY0
a) 3 a)
E E00c
0 E
0
0n
O
0
0
000oCu
Oww
°D CD
C7c
a) o*
c
.cX w1
0IOctober 1995, Vol. 85, No. 10

Barmers to Services
0_) _~
r-
LO
o I
V-ciCV C C 0
m0
0 66
_C6 C6)N.000)
ol o II
0- 00U)
_ o _ o
i-0), O6i cic66
0,-0 0)C
O 000.
CMo- co0c_) LO-_ _L0
_) w_ co C\ P-
ONCC _
cO CM LO CO U)
CD I- It) I)c
1- cm00) (D
c 00-----a6u
O-O-V0O
(D-0 CM
_ CM CM
0 0-000
C_ --N--O
CM C N)NC0) _CO))CO(0___O
_~
. . .
oh 0-0U*0
_~ ___N_O
o oo-LO -0C)C4 0) N4
_C, _ _s.
oc
ci_
C c
*o _i Co 0 i
-00
-0 00-LO -
o co co o cmoo
I. . .
a) U) CM U)o o o o o
6ui -i 6000 0 -r-
oi o; o °. o
00000
6 666ici6o
oCV) CV)
_ c
0) c(oU) 0c(
0 0)NCY oDC) 0) -
. . T. CY)
0 q
o coa
o 0) a)~ 26
CD _ LO O--
00r P-C)
O 0
0)o _
0a
t- LO 0) CV) 0)
o) cV) u1 0) 0)i .-
0 V.--o LO °i f-o@ 806 . .oooI) 9i c orr.9%CV)
Ci I I . . N0 ci C) a; _ _iN- CI) LO 0)'--
0 0 000o
o o o o
CM co LOCM ___-o
U' co
i-..i--7
~ 0 0Lo) O 0c cm
cl
. .
6o oo ooo
0
CMM \ @N0
6i 66 06666O- , O-
CT) o )Cm) _ cmoCm
0 0000000
O V000 0
I l \
0 I-*CN -o N0NV 5, CV54
CV) (CD o0 Y) C 0c6Z--O
N N 0 0 N- Vt0_0 _-'-C- ON_
~ ~ ~ C
CV) _C)_, O O N N__CV - - LO U O
c)00 *(0aw
00__00_ ^ o _ ^ CD10
V) 1^o U)0 ^ C
o~~~~~~~~~L c no
N Nco LO co0CM CM w 0O oo~~
E
-C]
0
0 c ~0 0o >
ee3, Co ( E E-> 0>mw ~~<LL
0)C
American Journal of Public Health 1389October 1995, Vol. 85, No. 10
Eo
oE
E c?E 3w 'aE aCME) E
._
'coE 0
0
-
c
0)C
a)
C
0
LO0
C
0
-C
00I
a-
oa:
00
a .'
030
co
cn
0a--
C0
00
0co .4
0~
O 7CL
00T
00
40
0
E
0
_
CA)
C
C
0)
C
e
0.a
C
o
r0
I
w
CL
6c
so
'U-Io
Ul-
I
Blazer et al.
overall pattern was in the expected direc-tion. Satisfaction with health care did varyby county, but there was no clear differ-ence between the urban and the ruralcounties. Contrary to expectations, resi-dents of rural areas did not differ fromthose in the urban county in knowingwhere to go for care; continuity of careamong rural elderly people appeared tohave been better, since they were morelikely to report seeing the same provideron each visit.
Black elderly people were less likelythan non-Blacks to delay seeking healthcare, and they did not obtain their carefrom the same source. These Blackelderly individuals were more likely toreceive their ambulatory care at a hospi-tal, a provider that, in this area, does notdiscriminate against the poor. Neverthe-less, universal coverage may reduce urban/rural differences in source of care whendistance to care is not excessive, becauseambulatory visits to primary care physi-cians' offices would be covered under sucha health insurance plan.
A major contributor to differences inaccess to health services by urban ascompared with rural residents may be thecost of obtaining health care. While costas a barrier to health care diminishes inlater life as a result of the almost universalcoverage of older persons by a combina-tion of Medicare and Medicaid, substan-tial out-of-pocket expenses neverthelessmean that health care is not equallyaccessible to all. In the South, this burdenappears to fall more heavily on those inrural areas, possibly because they mayneed to rely more heavily on familymembers to help them reach medical careand these family members may experi-ence financial burdens, such as loss ofwork, in providing access to such care.The availability of Medicare or Medicaid,therefore, does not appear to eliminate allcosts as a barrier to care, especially in therural South. If Medicare, in its currentform, becomes a model of universalhealth insurance, cost may persist as abarrier to care.
These results should not be general-ized to rural areas throughout the UnitedStates. Although the Duke Established-Populations for Epidemiologic Studies of
the Elderly is representative of the ruralSouth, it is not representative of one ofthe major barriers to health care in ruralareas in other regions: excessive distancefrom health care services. Most ruralresidents in the South (especially theSoutheast) are within a 1.5-hour drive of amajor medical center along well-main-tained roads. These findings also demon-strate that proximity to major medicalcenters does not increase continuity ofcare. They do not demonstrate, however,that increased availability of primary careis associated with increased continuity ofcare.
The reader must also take caution ingeneralizing these findings to younger agegroups, especially children. Most of thesubjects in this study reported that trans-portation was not a major factor limitingtheir access to timely care, presumablybecause they could drive themselves orbecause friends or family members coulddrive them. Working parents in ruralareas may not have the flexibility of time,as do older persons, to seek health caresome distance from their homes, and theymay not have insurance coverage.
Yet it is the cost of health care, aboveall, that remains an issue for elderlypeople in these southern rural counties.Even with Medicare and Medicaid cover-age, and after demographic status andhealth condition have been controlled,cost is a significant and constant barrierfor rural elderly people in comparisonwith their urban counterparts. The avail-ability of easily accessible primary careservices may not overcome this barrier ifcost is not reduced. With current threatsto Medicare, which may require moreout-of-pocket contributions to health care,rural elderly people in the South may beespecially at risk for decreased healthcare. [
AcknowledgmentThis research was supported by NationalInstitute on Aging contract NO1 AG 1 2102.
References1. The Rural Health Care Challenge: Staff
Report ofthe Special Committee on Aging of
the United States Senate. Washington, DC:US Senate; 1988:47-49.
2. Andersen R, Newman J. Societal andindividual determinants of medical careutilization. Milbank Q. 1973;51:95-107.
3. Health Care in RuralAmenca. Washington,DC: US Congress, Office of TechnologyAssessment; 1990:5-7. Publication OTA-H-434.
4. Cordes SM, Wright JS. Rural health careconcerns for present and future. In: Ham-burg J, ed. Review ofAllied Health Educa-tion #5. Lexington, Ky: University ofKentucky Press; 1989.
5. Patrick DL, Stein J, Portia M, Porter CQ,Ricketts TC. Poverty, health services, andhealth status in rural America. Milbank Q.1988;66:105-136.
6. Lucas CA, Rosenthal TC. Access to healthcare in rural western New York State. NYStateJMed. 1993;92:465-469.
7. Parkinson L. Improving the delivery ofhealth services to the rural elderly: a policyperspective. In: Kim PKH, Wilson CP, eds.Toward Mental Health of the Rural Elderly.Washington, DC: University Press ofAmerica; 1981:223-239.
8. Special Report on Access to Medical Care,#2. Princeton, NJ: Robert Wood JohnsonFoundation; 1987.
9. Cornoni-Huntley J, Blazer DG, LaffertyME, Everett DF, Brock DB, Farmer ME.Established Populations for EpidemiologicStudies of the Elderly (Volume 2): ResourceData Book Washington, DC: NationalInstitute of Aging; 1990. NIH publication90-495.
10. Blazer DB, Burchett B, Service C, GeorgeLK. The association of age and depressionamong the elderly: an epidemiologic explo-ration. J Gerontol Med Sci 1991;46:M210-M215.
11. Fillenbaum G, Leiss JK, Cohen HJ. Devel-oping a summary measure of medicalstatus. Durham, NC: Duke UniversityMedical Center; 1992. Unpublished manu-script.
12. Holt MM. SURREGR Standard Errors ofRegression Coefficients from Sample SurveyData. Research Triangle Park, NC: Re-search Triangle Institute; 1977.
13. Shah BV, Folsom RE, Harrell F.RTILOGIT: Procedure for Logistic Regres-sion of Survey Data. Research TrianglePark, NC: Research Triangle Institute;1987.
14. David M, Little RJA, Samuhel ME, TriestRK Alternative methods for CPS incomeimputation. J Am Stat Assoc. 1986;81:29-41.
15. Kalton G, Kasprzyk D. The treatment ofmissing survey data. Survey Methodology.1986;12:1-16.
16. North Carolina Health Manpower Data-book Chapel Hill, NC: Health ServicesResearch Center, University of NorthCarolina; 1986.
1390 American Journal of Public Health October 1995, Vol. 85, No. 10
Copyright © 2022 FDOKUMEN